Jacqueline Vivienne PICH BN (Hons I), BSc PhD Thesis - NOVA
484
Title page Title: The VENT Study: Violence in Emergency Nursing and Triage. Name: Jacqueline Vivienne PICH BN (Hons I), BSc PhD Thesis: Nursing. Submitted: June 2014 Page 1
-
Upload
khangminh22 -
Category
Documents
-
view
1 -
download
0
Transcript of Jacqueline Vivienne PICH BN (Hons I), BSc PhD Thesis - NOVA

Title page
Title: The VENT Study: Violence in Emergency Nursing and Triage.
Name: Jacqueline Vivienne PICH BN (Hons I), BSc
PhD Thesis: Nursing.
Submitted: June 2014
Page 1

Statement of Originality
The thesis contains no material which has been accepted for the award of any other
degree or diploma in any university or other tertiary institution and, to the best of
my knowledge and belief, contains no material previously published or written by
another person, except where due reference has been made in the text. I give consent
to the final version of my thesis being made available worldwide when deposited in
the University’s Digital Repository**, subject to the provisions of the Copyright Act
1968.
**Unless an Embargo has been approved for a determined period.
Page 2
Publication List
Pich J., Hazelton M., & Kable A. (2013). Violent behaviour from young adults and the
parents of paediatric patients in the emergency department. International Emergency
Nursing, 21 157-162.
In addition the systematic review included in the thesis has been accepted for
publication by the Joanna Briggs Institute.
Page 3

Acknowledgements
I would like to acknowledge the help of my supervisors, Associate Professor Ashley
Kable and Professor Michael Hazelton whose patience and attention to detail has
been invaluable and who always found time in their busy schedules to help me.
I would like to thank Christopher Oldmeadow from The Hunter Medical Research
Institute for his assistance (and patience) with my statistical analysis. I would also
like to thank Deborah Sundin for her help in the early stages of my study.
On a personal note I would like to dedicate my thesis to the two mothers in my life –
who are now gone but never forgotten: Hilary Dockrill and Elizabeth Pich. Their
dignity and courage in living with chronic illness their whole lives was an inspiration
and always enabled me to keep things in perspective.
To my husband Dave and children Hollie, Ellie, Meg and Tom: I finished!
Page 4

Table of contents
Title page ................................................................................................................................... 1
Statement of Originality ......................................................................................................... 2
Publication List ........................................................................................................................ 3
Acknowledgements ................................................................................................................. 4
Table of contents ...................................................................................................................... 5
Synopsis .................................................................................................................................. 16
Chapter 1 Background and identification of the problem ......................................... 18 1.1 Overview of chapter ..............................................................................................................18 1.2 Introduction ............................................................................................................................18 1.3 Definition of violence .............................................................................................................20 1.4 Types of violence ....................................................................................................................21 1.4.1 Verbal ..................................................................................................................................................... 21 1.4.2 Non-verbal hostility ............................................................................................................................. 21 1.4.3 Physical .................................................................................................................................................. 22 1.5 Workplace culture ..................................................................................................................23 1.6 Perpetrators of violence .........................................................................................................24 1.7 Antecedents and precipitants ...............................................................................................24 1.7.1 History of violence ............................................................................................................................... 24 1.7.2 Alcohol and substance abuse .............................................................................................................. 25 1.7.3 Clinical diagnoses ................................................................................................................................ 25 1.7.4 Waiting times ........................................................................................................................................ 26 1.7.5 Nurse behaviour ................................................................................................................................... 27 1.7.6 ED specific factors ................................................................................................................................ 27 1.8 Consequences of violence .....................................................................................................30 1.8.1 Physical .................................................................................................................................................. 30 1.8.2 Psychological ........................................................................................................................................ 30 1.8.3 Professional ........................................................................................................................................... 31 1.8.4 Organisational ...................................................................................................................................... 32 1.9 Reporting .................................................................................................................................32 1.10 Risk management strategies .................................................................................................33 1.10.1 De-escalation techniques ................................................................................................................ 34 1.10.2 Security ............................................................................................................................................. 35 1.10.3 Environmental measures ................................................................................................................ 36 1.10.4 Debriefing ......................................................................................................................................... 36 1.11 Zero tolerance .........................................................................................................................37 1.12 Legal issues .............................................................................................................................38 1.13 Conclusion ...............................................................................................................................40
Chapter 2 Systematic review .......................................................................................... 51 2.1 Executive summary ................................................................................................................51 2.2 Background .............................................................................................................................54 2.3 Definitions ...............................................................................................................................57
Page 5
2.4 Objectives ................................................................................................................................ 58 2.5 Search strategy ....................................................................................................................... 59 2.6 Method of the review ............................................................................................................ 60 2.6.1 Data collection ....................................................................................................................................... 60 2.6.2 Data synthesis ....................................................................................................................................... 61 2.7 Results ..................................................................................................................................... 61 2.7.1 Description of included studies .......................................................................................................... 63 2.8 Results of the reviews ........................................................................................................... 65 2.8.1 Quantitative studies on violence in the Emergency Department .................................................. 65 2.8.2 Mixed-methods studies about violence in the Emergency Department ....................................... 82 2.8.3 Qualitative papers on violence in the Emergency Department ..................................................... 87 2.9 Synthesis of results ................................................................................................................ 93 2.10 Discussion ............................................................................................................................. 113 2.10.1 Limitations of the review .............................................................................................................. 114 2.10.2 Conclusion ...................................................................................................................................... 116 2.10.3 Implications for practice ............................................................................................................... 116 2.10.4 Implications for research .............................................................................................................. 117 2.10.5 Justification of study...................................................................................................................... 117
Chapter 3 Research Design .......................................................................................... 119 3.1 Introduction .......................................................................................................................... 119 3.2 Study aims ............................................................................................................................ 119 3.3 Study design ......................................................................................................................... 120 3.4 Part I: National survey of ED nurses ................................................................................ 123 3.4.1 Study design, sample and setting ..................................................................................................... 123 3.4.2 Development of the survey tool ....................................................................................................... 124 3.4.3 Sample size calculation ...................................................................................................................... 132 3.4.4 Recruitment ......................................................................................................................................... 132 3.4.5 Methods employed to maximise the response rate ....................................................................... 133 3.4.6 Data entry ............................................................................................................................................ 135 3.4.7 Data analysis ....................................................................................................................................... 136 3.5 Part II: Interviews with ED nurses .................................................................................... 138 3.5.1 Study design ........................................................................................................................................ 139 3.5.2 Recruitment of the sample ................................................................................................................ 140 3.5.3 Inclusion criteria ................................................................................................................................. 141 3.5.4 The sample........................................................................................................................................... 141 3.5.5 Demographic profile .......................................................................................................................... 142 3.5.6 Interview schedule ............................................................................................................................. 142 3.5.7 Data collection ..................................................................................................................................... 144 3.5.8 Transcription of recorded information ............................................................................................ 145 3.5.9 Member checking ............................................................................................................................... 146 3.5.10 Data analysis................................................................................................................................... 146 3.5.11 Rigour and trustworthiness .......................................................................................................... 150 3.6 Ethical considerations ......................................................................................................... 152 3.6.1 Potential distress for participants ..................................................................................................... 152 3.6.2 Information sheets .............................................................................................................................. 152 3.6.3 Consent ................................................................................................................................................ 153 3.6.4 Confidentiality .................................................................................................................................... 153 3.6.5 Data storage ......................................................................................................................................... 154
Page 6

3.7 Conclusion .............................................................................................................................155
Chapter 4 Results from survey data: Part I ................................................................ 156 4.1 Definitions .............................................................................................................................157 4.2 Response rate ........................................................................................................................158 4.3 Characteristics of participants ............................................................................................158 4.3.1 Age distribution of sample ............................................................................................................... 163 4.3.2 Nursing experience ............................................................................................................................ 163 4.3.3 Work fraction and hours of patient care ......................................................................................... 165 4.3.4 Geographic characteristics of sample .............................................................................................. 167 4.4 Frequency of exposure to patient-related violence .........................................................169 4.4.1 Point prevalence: nurse involvement in episodes of patient-related violence .......................... 169 4.4.2 Number of episodes ........................................................................................................................... 171 4.4.3 Types of episodes ............................................................................................................................... 171 4.4.4 Inevitability and frequency of episodes of violence ...................................................................... 172 4.5 The types of violent behaviours experienced by emergency nurses ............................174 4.5.1 Verbal abuse and non-physical behaviours .................................................................................... 174 4.5.2 Physical behaviours ........................................................................................................................... 179 4.5.3 Consequences of patient-related violence....................................................................................... 183 4.6 Risk prevention and risk management strategies ...........................................................191 4.6.1 Reporting of episodes of patient-related violence at work ........................................................... 191 4.6.2 Management response ....................................................................................................................... 201 4.6.3 Management of episodes ................................................................................................................... 204 4.6.4 Employer response ............................................................................................................................. 210 4.6.5 Risk prevention strategies ................................................................................................................. 216 4.6.6 Policies and procedures ..................................................................................................................... 223 4.6.7 Aggression minimisation training ................................................................................................... 226 4.6.8 Feeling safe at work ........................................................................................................................... 229 4.7 Precipitants and antecedents ..............................................................................................233 4.7.1 Nurse characteristics .......................................................................................................................... 234 4.7.2 Nursing-related factors...................................................................................................................... 239 4.7.3 Patient-related factors ........................................................................................................................ 242 4.7.4 Environmental factors ....................................................................................................................... 260 4.7.5 Nursing activities ............................................................................................................................... 262 4.7.6 Staffing issues ..................................................................................................................................... 267 4.7.7 ED-specific issues ............................................................................................................................... 271 4.7.8 Escalation of episodes ........................................................................................................................ 278 4.7.9 Logistic regression to identify most significant risk factors ......................................................... 279 4.8 Violence from the parents of paediatric patients .............................................................280 4.9 Recommendations to minimise/prevent the occurrence of patient-related violence .281
Chapter 5 Results from interview data: Part II .......................................................... 287 5.1 Introduction ..........................................................................................................................287 5.2 Background/Literature ........................................................................................................287 5.3 Methods .................................................................................................................................288 5.3.1 Aim ....................................................................................................................................................... 288 5.3.2 Design .................................................................................................................................................. 289 5.3.3 Participants/Sample ........................................................................................................................... 289 5.3.4 Inclusion criteria ................................................................................................................................. 289 5.3.5 Data collection .................................................................................................................................... 290
Page 7

5.3.6 Ethical considerations ........................................................................................................................ 290 5.3.7 Data analysis ....................................................................................................................................... 290 5.3.8 Validity/Reliability/Rigour ................................................................................................................ 291 5.4 Results ................................................................................................................................... 291 5.4.1 Behaviours: “Performing” and attention-seeking behaviours by patients ................................. 292 5.4.2 Episodes of violence: Verbal abuse and physical violence ........................................................... 293 5.4.3 Antecedents: Alcohol and substance abuse .................................................................................... 294 5.4.4 Parental emotions: fear, anxiety, impatience and lack of understanding/knowledge .............. 295 5.4.5 Feeling unsafe at work ....................................................................................................................... 296 5.5 Discussion ............................................................................................................................. 297 5.6 Limitations ............................................................................................................................ 301 5.7 Conclusion ............................................................................................................................ 302
Chapter 6 Discussion .................................................................................................... 304 6.1 Representativeness of the sample ..................................................................................... 304 6.2 Frequency of exposure to patient-related violence ......................................................... 307 6.2.1 Point prevalence: nurse involvement in episodes of patient-related violence ........................... 307 6.2.2 Inevitability and frequency of episodes of violence ...................................................................... 309 6.3 The types of violent behaviours experienced by emergency nurses ............................ 309 6.3.1 Verbal abuse and non-physical behaviours .................................................................................... 309 6.3.2 Physical behaviours............................................................................................................................ 313 6.3.3 “Performing” and attention-seeking behaviours ........................................................................... 314 6.3.4 Consequences of patient-related violence ....................................................................................... 317 6.4 Risk prevention and risk management strategies ........................................................... 322 6.4.1 Risk Management following episodes of aggression and violence ............................................. 322 6.4.2 Risk prevention strategies ................................................................................................................. 330 6.4.3 Policies and procedures ..................................................................................................................... 332 6.4.4 Aggression minimisation training ................................................................................................... 333 6.4.5 Safety at work ..................................................................................................................................... 335 6.5 Precipitants and antecedents ............................................................................................. 337 6.5.1 Nurse characteristics .......................................................................................................................... 337 6.5.2 Nursing-related factors ...................................................................................................................... 339 6.5.3 Patient-related factors ........................................................................................................................ 341 6.5.4 Patient-specific factors ....................................................................................................................... 347 6.5.5 Patient-specific behaviours ............................................................................................................... 348 6.5.6 Environmental factors ........................................................................................................................ 350 6.5.7 Nursing activities................................................................................................................................ 351 6.5.8 Staffing issues ...................................................................................................................................... 352 6.5.9 ED specific issues ................................................................................................................................ 353 6.6 Violence from the parents of paediatric patients ............................................................ 357 6.6.1 Parental emotions ............................................................................................................................... 358 6.7 Participants recommendations to minimise/prevent the occurrence of patient-related violence .............................................................................................................................................. 360 6.8 Similarities and difference between regions .................................................................... 361 6.8.1 Similarities ........................................................................................................................................... 361 6.8.2 Differences ........................................................................................................................................... 362 6.9 Similarities between Part I and Part II of the study ........................................................ 363 6.10 Study limitations .................................................................................................................. 363
Conclusion ............................................................................................................................ 365
Page 8

Recommendations ............................................................................................................... 367
Reference list ........................................................................................................................ 371
Appendices ........................................................................................................................... 392
Appendix A: Search Strategy ............................................................................................. 393
Appendix B - Appraisal instruments ................................................................................ 398
Appendix C: Excluded papers and reasons for exclusion ............................................. 401
Appendix D: Summary table of qualitative studies (included in review) .................. 402
Appendix E: Summary table of quantitative studies (included in review) ................ 404
Appendix F: Summary table of mixed methods studies (included in review) .......... 407
Appendix G: Ethical approval ........................................................................................... 409
Appendix H: Survey............................................................................................................ 413
Appendix I: Information Sheet .......................................................................................... 435
Appendix J: Envelope ......................................................................................................... 437
Appendix K: Pen .................................................................................................................. 438
Appendix L: Reminder postcard ....................................................................................... 439
Appendix M: Logo............................................................................................................... 440
Appendix N: Statistical analysis plan ............................................................................... 441
Appendix O: Expression of Interest .................................................................................. 451
Appendix P: Demographic profile .................................................................................... 452
Appendix Q: Interview schedule: Violence from young adults ................................... 454
Appendix R: Interview schedule: Violence from the parents of paediatric patients . 456
Appendix S: Consent Form ................................................................................................ 458
Appendix T: Field Notes ..................................................................................................... 460
Appendix U: Audit Trail .................................................................................................... 469
Appendix V: IENJ article .................................................................................................... 479
Page 9

Table of Tables
Table 1: Overview of key literature .................................................................................... 41
Table 2: Country of origin of included studies ................................................................. 63
Table 3: Definition of violence provided in included studies......................................... 99
Table 4: Sample sizes and response rates for included studies .................................... 100
Table 5: Instrument validation and rigour of included studies ................................... 101
Table 6: Summary of factors and outcomes measured by study ................................. 112
Table 7: Study aims addressed in questionnaire ............................................................ 126
Table 8: Triage categories ................................................................................................... 128
Table 9: Expert panel recommendations ......................................................................... 131
Table 10: Final participation responses ............................................................................ 158
Table 11: Characteristics of participants § ....................................................................... 160
Table 12: Characteristics of participants (continuous data) § ....................................... 162
Table 13: Age groups by geographic region § ................................................................ 163
Table 14: Worked hours by region (n = 463).................................................................... 166
Table 15: Geographic location of study sample .............................................................. 168
Table 16: Episodes of patient-related violence ................................................................ 170
Table 17: Episodes of patient related violence: metropolitan and regional areas ..... 170
Table 18: Number of episodes in the previous 6 months (n = 452) .............................. 171
Table 19: Episodes of patient-related violence in past 6 months (n = 448) ................. 172
Table 20: Perceived inevitability and frequency of violence by region ....................... 173
Table 21: Types of verbal abuse (n = 511) ........................................................................ 175
Table 22: Violent episode experienced and type of verbal abuse ................................ 176
Table 23: Types of verbal abuse (n = 452) § Ω ¥ .............................................................. 178
Table 24: Physical behaviours (n = 468) ........................................................................... 180
Table 25: Chi-squared results for physical behaviours and episodes of violence ..... 181
Table 26: Physical behaviours by region (n = 421) § ¥ .................................................... 182
Page 10

Table 27: Location of injury (n = 118) ................................................................................ 184
Table 28: Type of injury (n = 78) ........................................................................................ 185
Table 29: Emotional Reponses (n = 387) ........................................................................... 186
Table 30: Emotion experienced by participants by region (n = 353) § Ω ¥ .................. 187
Table 31: Professional effects (n = 361) ............................................................................. 189
Table 32: Professional effects by region (n = 353) § ¥ ...................................................... 190
Table 33: Reporting of episodes of violence .................................................................... 193
Table 34: Reasons for reporting episodes of patient-related violence (n = 311) ......... 195
Table 35: Barriers to reporting (n = 297) ........................................................................... 197
Table 36: Barriers to reporting by region (n = 271) § Ω ¥ ............................................... 198
Table 37: Reporting methods (n -= 337) ............................................................................ 199
Table 38: Reporting method by region (n = 307) § Ω ¥ ................................................... 200
Table 39: Employer response to reported violence (n = 407) ......................................... 201
Table 40: Employer response to reported violence by region (n = 407) § Ω ¥ ............. 203
Table 41: Actions effective in dealing with consequences of patient-related violence ........................................................................................................................................ 205
Table 42: Actions effective in dealing with consequences of patient-related violence by region (n = 421) § Ω ¥ ............................................................................................. 206
Table 43: Access to counselling and adequate follow up by region ............................. 208
Table 44: Support following an episode of patient-related violence (n = 277) ............ 210
Table 45: Barriers to change (n = 335) ............................................................................... 212
Table 46: Changes implemented following an episode of patient-related violence (n = 89) ................................................................................................................................... 214
Table 47: Management support by region ....................................................................... 215
Table 48: Risk prevention/minimisation measures (n = 515) ......................................... 217
Table 49: Risk prevention/minimisation measures by region (n = 463) § Ω ¥ ............. 219
Table 50: Risk management follow-up strategies (n = 432) ........................................... 220
Table 51: Risk management strategies by region (n = 404) § Ω ¥ .................................. 222
Page 11

Table 52: Effectiveness of policy according to region (n = 448) § ................................. 224
Table 53: Policies and procedures: factors impacting on their effectiveness (n = 124) Ω ........................................................................................................................................ 226
Table 54: Aggression minimisation training ¥ ................................................................ 226
Table 55: Aggression minimisation training by geographic location .......................... 228
Table 56: Years since Aggression Minimisation Training completed (n = 299) ......... 229
Table 57: Feeling safe at work (n = 469) ........................................................................... 230
Table 58: Levels of safety by region (n = 418) § ............................................................... 232
Table 59: Logistic regression for levels of safety ............................................................ 233
Table 60: Number of episodes by age group ................................................................... 235
Table 61: Logistic regression results Age and Years’ experience in the ED ............... 236
Table 62: Number of episodes reported by work-fraction) ........................................... 237
Table 63: Hours of work and number of episodes (n = 442) ......................................... 238
Table 64: Logistic regression: Violent episodes experienced by region (n = 403) ...... 239
Table 65: Nursing approach/manner as a contributing factor by region .................... 240
Table 66: Nursing practice (n = 236) ................................................................................. 242
Table 67: Groups of patients more likely to exhibit violent behaviour (n = 460) ....... 244
Table 68: Patient Age Groups (n = 507) ............................................................................ 244
Table 69: Age grouping of perpetrators of violence by region ..................................... 246
Table 70: Triage category (n = 491) ................................................................................... 247
Table 71: Triage category of perpetrators of violence .................................................... 248
Table 72: Diagnoses or clinical signs/symptoms of patients who displayed violent behaviour (n = 491) ...................................................................................................... 249
Table 73: Chi-squared analysis results clinical diagnoses and episodes of violence 250
Table 74: Diagnoses or clinical signs and symptoms according to geographic location (n = 445) § ¥ ................................................................................................................... 252
Table 75: Patient-specific factors (n = 512) ....................................................................... 253
Page 12

Table 76: Chi-squared analysis results for patient-specific factors and episodes of violence ......................................................................................................................... 254
Table 77: Patient specific factors according to geographic location (n = 456) § Ω ¥ ... 256
Table 78: Patient-specific behaviours (n = 512) ................................................................ 257
Table 79: Chi-squared analysis results for patient-specific behaviours and episodes of violence ......................................................................................................................... 258
Table 80: Patient specific factors according to geographic location (n = 457) § Ω ¥ ... 259
Table 81: Time of day (n = 497) .......................................................................................... 260
Table 82: Time of year (n = 196) ......................................................................................... 262
Table 83: Nursing activities (n = 496) ................................................................................ 263
Table 84:Chi-squared analysis results for nursing activity and episode of violence . 264
Table 85: Nursing activities according to geographic location (n = 446) § ¥ ............... 265
Table 86: High Risk Activities in the Emergency Department ..................................... 267
Table 87: Staffing issues (n = 506) ...................................................................................... 268
Table 88: Chi-squared analysis results for staffing issues and episodes of violence . 269
Table 89: Staffing issues according to geographic location (n = 457) § Ω ¥ ................. 270
Table 90: Area of Department (n = 499) ............................................................................ 271
Table 91: Chi-squared analysis results for area of the department and violence episodes ......................................................................................................................... 272
Table 92: Area of the department by geographic location (n = 454) § Ω ¥ ................... 273
Table 93: Factors specific to the Emergency Department (n = 508) .............................. 275
Table 94: Chi-squared analysis for ED specific factors and episodes of violence ...... 276
Table 95: Factors specific to the Emergency Department by geographic location (n = 472) § ¥ ........................................................................................................................... 277
Table 96: Factors contributing to escalation of episodes (n = 457) ................................ 279
Table 97: Logistic regression for main risk factors and episode of violence ............... 280
Table 98: Ages of parents of paediatric patients (n = 212) ............................................. 281
Table 99: Relationship to the paediatric patient (n= 203) ............................................... 281
Page 13

Table 100: Recommendations to prevent/minimise episodes of violence (n = 444) .. 282
Table 101: Measures to more effectively manage violent patients/episodes (n = 433) ........................................................................................................................................ 286
Page 14

Table of Figures
Figure 1: Study selection flow diagram .............................................................................. 62
Figure 2: Flowchart of data analysis of interview data .................................................. 147
Figure 3: Years of nursing experience ............................................................................... 164
Figure 4: Years of ED nursing experience ........................................................................ 164
Figure 5: Geographic location of study sample (n = 472) ............................................... 168
Figure 6: Work fraction and episodes of violence ........................................................... 237
Figure 7: Hours of work and number of episodes of violence ...................................... 238
Figure 8: Audit Trail Flowchart ......................................................................................... 477
Figure 9: Flowchart of identification of themes .............................................................. 478
Page 15

Synopsis
Violence in healthcare is a significant issue globally and the Emergency Department
(ED) is one of the highest risk clinical areas for such violence. Nurses have been
identified as the profession most vulnerable to violence, and within this context ED
nurses are the speciality at greatest risk of being exposed to violence.
The VENT Study, Violence in Emergency Nursing and Triage, was a national study
of Australian ED nurses’ experiences with one type of violence: patient-related
violence. This was a mixed methods study comprising of two parts. Part I of the
study was quantitative in nature, with data collected using a national survey that
was distributed to all members of The College of Emergency Nursing Australasia.
Part II of the study was qualitative in nature and involved the use of semi-structured
interviews with two sub-groups of interest: young adults (16-25 years of age) and the
parents of paediatric patients.
The results of this study were consistent with the extant evidence on the topic and
the results from each part of the study complemented each other. The results of Part I
of the study included the identification of antecedents and precipitants for violence.
Triaging was identified as a significantly high risk nursing activity, with nurses
almost three times more likely to experience violence when performing this role. In
addition the triage area was identified as high risk location in the ED; with the odds
of experiencing an episode of violence almost four times greater for nurses working
there. Patients under the influence of alcohol and illicit substances also posed a
significantly greater risk to ED nurses. These findings were supported by those in
Part II of the study, with young people aged 16-25 years of age identified as a high
risk group for violence precipitated by alcohol intoxication.
Geographic similarities and differences between ED nurses working in metropolitan
and regional areas were identified. In particular regional nurses reported
Page 16
significantly less access to risk prevention and management strategies and were more
likely to feel “not safe” at work.
Page 17

Chapter 1 Background and identification of the
problem
1.1 Overview of chapter
Patient-related violence has been reported in the literature to be a serious problem in
contemporary nursing. An overview of the literature on the topic of patient-related
violence was undertaken for several reasons. It was necessary to provide a context
for this study in terms of the current research on the topic and to identify any gaps in
the literature as a basis for conducting further research. This chapter provides a
general literature review on the topic. Table 1 at the end of the chapter provides an
overview of the key papers discussed.
1.2 Introduction
Workplace violence is one of the most significant and hazardous issues faced by
nurses globally and in response the International Council of Nurses issued a position
statement in 2006 condemning “all forms of abuse and violence against nursing
personnel” (International Council of Nurses, 2006). It is a potentially life-threatening
and life-affecting workplace hazard often downplayed as just “part of the job” for
nurses (Jones & Lyneham, 2000). There are four types of workplace violence defined
in the literature, criminal intent, customer/client initiated, horizontal and personal
(McPhaul & Lipscomb, 2004), however this review will focus exclusively on the
second type and specifically patient-related violence.
Workplace violence is reported to be increasing in both frequency and severity and
within this context the health industry has been identified as one of the most violent
industries to work in (Perrone, 1999). Healthcare workers are more likely to be
attacked at work than prison guards and police officers (International Council of
Page 18
Nurses, 2009) with those working in healthcare and the social service industry
accounting for 48% of all non-fatal injuries from acts of violence and workplace
assaults in 2000 (ASIS Healthcare Security Council, 2011).
The occurrence of patient-related violence varies substantially between clinical
environments, with the specialities of emergency, aged care and mental health
reporting the highest rates of violence (Estryn-Behar et al., 2008). The ED has been
consistently identified as one the highest risk areas for nurses to work in (Shields &
Wilkins, 2009).
Within this context nurses have been identified as the professional group most likely
to experience patient-related violence (Ogundipe et al., 2010). The National Crime
Victimization Survey (1993-1999) in the US found that the average annual rate for
non-fatal violent crime was 21.9 per 1000 workers for nurses, compared with 12.6 per
1000 workers for all other occupations (Emergency Nurses' Association, 2012). In
2010, 43% (n = 21,530) of non-fatal assaults and violent acts against healthcare
practitioners that involved days off work were committed against Registered Nurses
(Bureau of Labor Statistics, 2010). Australian statistics reveal that Registered Nurses
rate second highest in terms of Workers’ Compensation claims as a result of violence
(Kennedy, 2005), with Enrolled Nurses fourth, and both of these rate higher than
police and prison officers (Jones & Lyneham, 2000). Enrolled nurses in Australia are
equivalent to licenced practical nurses (LPNs) in North America. In the United
Kingdom a similar picture has emerged with HealthCare workers ranked as one of
the highest risk groups for assault with an estimated 5% of nurses assaulted each
year (Ryan & Maguire, 2006).
In addition, violence in the ED is reported to be increasing, for example The Joint
Commission reported significant increases in assault, rape and homicide in US
hospital settings from 2006 to 2009 (Kelen, Catlett, Kubit, & Hsieh, 2012). Annual
rates of physical and non-physical assaults per 100 nurses were reported to be 13.2
Page 19

and 38.8 respectively in a study of American ED nurses (Nachreiner, Gerberich,
Ryan, & McGovern, 2007).
1.3 Definition of violence
There is a lack of consensus in the literature about what constitutes violence and also
a lack of a standardised tool to record and measure rates of violence (Taylor & Rew,
2011) that makes comparison between studies difficult.
Violence includes a continuum of behaviours from verbal abuse to overt acts of
physical violence. The World Health Organization defines violence as “the
intentional use of physical force or power, threatened or actual, against oneself,
another person, or against a group or community, that either results in or has a high
likelihood of resulting in injury, death, psychological harm, maldevelopment or
deprivation (World Health Organization, 2002).
NSW Health (2003) defines violence as any incident in which an individual is abused,
threatened or assaulted. This includes verbal, physical or psychological abuse,
threats or other intimidating behaviours, intentional physical attacks, aggravated
assault, threats with an offensive weapon, sexual harassment and sexual assault
(NSW Health, 2003).
Occupational violence is defined as any incident in which employees are abused,
threatened or assaulted in circumstances arising out of, or in the course of their
employment (NSW Health, 2003). Saines (1999) specifically defined workplace
violence against nurses as any incident where a nurse is put at risk, including verbal
abuse, threatening behaviours or assault (Saines, 1999).
Page 20
1.4 Types of violence
1.4.1 Verbal
Verbal abuse has been identified as the most common form of violence experienced
by ED nurses with up to 100% of nurses affected in some locations (Gacki-Smith et
al., 2009; Lau, Magarey, & Wiechula, 2012a). This refers to the language used as well
as the tone and way in which it is delivered, such as yelling or screaming (Gacki-
Smith et al., 2009).
Swearing has been identified as the most common form of verbal abuse (Pich,
Hazelton, Sundin, & Kable, 2011) and demeaning swearing has been identified as the
most offensive form of verbal aggression, particularly for female nurses (Stone,
McMillan, Hazelton, & Clayton, 2011). This included gendered and sexualised
insults, judgements, threats or suggestions and demeaning statements often made in
public spaces in front of others in an attempt to draw negative attention to those
nurses’ targeted (Jackson, Hutchinson, Luck, & Wilkes, 2013).
Other types of verbal abuse include questioning professional skills and capabilities;
and threats: including threats of complaint or legal action (Jackson et al., 2013), and
threats of violence such as shooting, killing, blowing up, punching and stabbing with
a needle (Jackson et al., 2013). Such abuse can occur face-to-face and over the phone,
(Lyneham, 2000) and is not confined to the ED with nurses reporting that it can occur
outside the department and after working hours (Gacki-Smith et al., 2009).
1.4.2 Non-verbal hostility
Non-verbal hostility refers to overt behaviours by patients designed to intimidate or
threaten nurses or gain their attention, for example crossing arms, glaring at staff,
throwing their arms up in the air, pacing, and rolling eyes and shaking their heads
while talking to staff (Jackson et al., 2013). Other examples include acts of symbolic
Page 21
violence such as punching a wall or throwing furniture (Winstanley & Whittington,
2004), and there have been recent reports of patients photographing or videoing staff
on their mobile phones and threatening to “send it to the media” (Jackson et al.,
2013).
1.4.3 Physical
Physical violence refers to physical contact that is intended to injure or harm another
party (Nachreiner et al., 2007). It includes any intentional physical contact, actual or
threatened, and does not have to result in an injury to the victim (Victorian
Government, 2005). Examples of physical violence include being hit, slapped, kicked,
pushed, choked, grabbed and sexually assaulted (Nachreiner et al., 2007); spat on,
shoved, scratched (Gacki-Smith et al., 2009); stalked and being held hostage (Ferns,
Cork, & Rew, 2005).
The behaviours typical of physical violence range from mild to severe in terms of the
potential for injury to the victim. The majority of physical violence occurs
concurrently with verbal abuse, and this correlation may indicate that verbal violence
can act as a predictor for potential physical violence (Lau, Magarey, & Wiechula,
2012b; Luck, Jackson, & Usher, 2007; Mayhew & Chappell, 2005).
The use of weapons, both traditional and opportunistic, is reported in the literature,
though the prevalence and experiences differ widely internationally (Ferns, 2005b).
For example studies from the US report the use of firearms which has resulted in the
introduction of metal detectors in some EDs (Kansagra et al., 2008). A study by Kelen
et al (2012) analysed hospital-based shootings in the US between 2000 and 2011. The
authors reported that while such events were relatively rare compared with other
forms of workplace violence; there were 154 hospital shootings in this period. The ED
was identified as the most common location and nurses were the victims in 5% of
cases (Kelen et al., 2012).
Page 22
Opportunistic weapons refer to items readily available and used to threaten or harm
nurses. Examples reported in the literature include intravenous equipment, poles,
syringes (sometimes blood-filled), furniture (Lyneham, 2000), scalpels, oxygen flow
metres, ophthalmoscopes, stethoscopes and scissors (Doody, 1995) and a fire
extinguisher that was used to spray staff (Arthur & Bain, 2002).
1.5 Workplace culture
A level of management resistance has been reported in acknowledging that health
care workers are at risk of patient-related violence despite the fact that nurses
consistently report high expectations of assault as a consequence of their job
(Nachreiner et al., 2007). At the same time there is a workplace culture perpetuated
by a degree of complacency on the part of staff where violence is viewed as just “part
of the job” (Jones & Lyneham, 2000; McPhaul & Lipscomb, 2004).
Nurses are also reported to consider the question of intent to classify episodes of
violence and respond accordingly. A study by Luck et al (2008) found that that ED
nurses make judgements about the meaning of violent events and use these to guide
their responses to these events (Luck, Jackson, & Usher, 2008). A distinction was
made between intentional and unintentional violence and patients who were judged
to be of diminished capacity were not assigned blame for their actions and so these
episodes were not reported (Luck et al., 2008). This is a different behavioural
construct where the aggression is regarded as being defensive in nature rather than
overt and offensive and is referred to as “resistance to care” in the literature (Gibson,
1997; Kable, Guest, & McLeod, 2012a; Mahoney, 1999). This included acts where the
patients were not considered responsible for their actions, for example those with a
cognitive impairment like dementia, or if the nurse involved in the violent incident
thought that they were not the target of the episode of violence (Lau et al., 2012b).
Page 23

1.6 Perpetrators of violence
Patients are consistently identified as the main perpetrators of violence against
nursing staff (Farrell, Bobrowski, & Bobrowski, 2006). This includes paediatric
patients (Gillespie, Gates, Miller, & Howard, 2010) and the parents/carers of
paediatric patients (Gillespie et al., 2010; Pich et al., 2011).
Relatives and those accompanying patients also were identified as being responsible
for episodes of violence (Jackson et al., 2013) and this was particularly evident in
research originating from non-western countries (Hasani et al., 2010; Senuzun Ergun
& Karadakovan, 2005). This violence was reported to be mostly verbal in nature, for
example a study by Gates et al (2006) reported that 100% of nurses had experienced
verbal abuse from patients and 98% from visitors (n = 242) (Gates, Ross, & McQueen,
2006).
The idea of the “recreational fighter” is also discussed in the literature. This describes
a person who initiates violent acts and who seeks out perceived provocation (Ferns,
2005a). While alcohol and waiting times may act as triggers they do not cause
violence, it is the reaction of patients to these triggers that determines whether
violence is involved (Ferns, 2005b). Aggressive behaviour by such patients can be
viewed as a deliberate tactic to demonstrate power or to experience the rewards of
feeling strong, masculine and dominant (Ferns, 2005a)
1.7 Antecedents and precipitants
1.7.1 History of violence
The greatest risk factor in predicting future violent or threatening behaviour from an
individual is reported to be a past history of violence (Ferns, 2005b), and the greater
the magnitude of violence, the greater the likelihood of future violence (Holleran,
2006). This includes any violence the person has experienced, for example domestic
Page 24

abuse, assault, and any convictions for violent crime (Holleran, 2006). Other
emotional stressors, for example death, grief, divorce, retrenchment as well as being
the victim of violence have been identified as increasing the risk of potential violence
in patients by adding to a sense of “being out of control” that can be exacerbated by
the stressful environment of an ED (Keely, 2002; Rippon, 2000). It has also been
proposed that some socioeconomic factors are correlated to increased intolerance to
frustration and therefore an increased risk of violence, for example homelessness,
financial burdens, criminal activities, anxiety and domestic disputes (Keely, 2002).
1.7.2 Alcohol and substance abuse
Alcohol and illicit drugs, especially sedative or hypnotic drugs, stimulants and
hallucinogens, have the potential to disinhibit controls that normally suppress
violence, and thus contribute to the potential for violence in patients under their
influence (Tyrell, 1999). Alcohol or substance dependence, intoxication and
withdrawal have all been identified as increasing the risk of violence from patients
(Fernandes et al., 1999; Schnieden & Marren-Bell, 1995).
Substance abuse has been associated with an increased risk of violent behaviour by
patients (Catlette, 2005), and has been implicated in 79% of all violent episodes (n =
210) in one Australian study (Lyneham, 2000). Alcohol intoxication is also
consistently referred to as a risk factor in the literature with figures of between 25%
(Crilly, Chaboyer, & Creedy, 2004) and 98% (Ferns, 2005b) of all violent episodes
being attributable in some part to alcohol use.
1.7.3 Clinical diagnoses
Clinical diagnoses that affect cognition are linked to an increased risk for violence.
These include temporary organic causes, for example intracranial trauma, delirium,
hypoxia, encephalopathy, endocrinopathy, septicaemia, hypoglycaemia,
disorientation due to mediation or recovery from surgery, decreased level of
Page 25

consciousness and depression and (Chapman & Styles, 2006; Keely, 2002; Liu &
Wuerker, 2005; McPhaul & Lipscomb, 2004) and those that are permanent in nature,
for example dementia (Presley & Robinson, 2002). In addition, the emotional impact
and subsequent stress of admission to the ED and of injury or illness can lower an
individual’s threshold for aggression (Tyrell, 1999) and pain has also been identified
as being a significant factor (Hodge & Marshall, 2007).
Psychiatric diagnoses that may lead to an increased risk of violent behaviour include
acute psychoses, schizophrenia, mania, paranoid states and personality disorders
(Presley & Robinson, 2002). There is strong evidence that the potential for violence in
such patients markedly increases in the presence of drug and/or alcohol abuse
(Gillies & O'Brien, 2006). In addition mental health patients who have engaged in
self-harm are noted to be at increased risk of violent behaviour (Gillies & O'Brien,
2006). Many ED nurses lack mental health nursing experience and skills which has
the potential to exacerbate potentially violent situations (Jones & Lyneham, 2000). In
addition the realities of the modern ED are often counter-productive from a mental
health standpoint, creating an environment that is not conducive for effectively
treating such patients (Jones & Lyneham, 2000).
1.7.4 Waiting times
The Garling Report, a Special Commission of Inquiry into Acute Care Services in
NSW Public Hospitals, found that the number of people who utilised the health
service, and in particular EDs had increased substantially since 2006 (Garling, 2008).
There were over 6.5 million presentations reported by Australian public hospital EDs
for the year 2011–12, an average increase of 4.3% each year between 2007–08 and
2011–12. ED presentations increased in most states and territories for the period
2010–11 and 2011–12, especially in Western Australia and South Australia
(Australian Institute of Health and Welfare, 2012). This trend was also reported in the
US, where the number of ED presentations increased by 23%, from 89.8 million to
Page 26

110.2 million visits annually for the period 1992-2002. At the same time the number
of hospital EDs in the US decreased by 15% (Robinson, Jagim, & Ray, 2004).
Dissatisfaction with waiting times is perceived as a crucial trigger for episodes of
violence; however patients’ negative responses were not exclusively dependent on
the actual duration of waiting (Lau et al., 2012b). Perceptions of waiting times are
more likely to influence patient reactions than actual waiting times (Lau et al., 2012b),
with researchers reporting in one study that more than half of violent incidents occur
within the first hour of a patient’s presentation to the ED (Lavoie, Carter, Danzl, &
Berg, 1988).
Issues with waiting times are not restricted to admission to the ED from the waiting
room. Delays are also reported with processes such as pathology (being done and
reports made available), referrals to specialists, and patient transport from the
hospital, and transfers to an inpatient bed (Robinson et al., 2004).
1.7.5 Nurse behaviour
The attitudes, behaviour and skill levels of individual nurses have also been
identified as contributing to episodes of violence in some studies (Lyneham, 2000;
Pich et al., 2011; Quintal, 2002). The way in which individual nurses react to
aggression and tension can serve to escalate or de-escalate the situation (Jones &
Lyneham, 2000). This can relate to their body language and attitude, for example
aggressiveness on the part of nurses is more likely to incite violence (Quintal, 2002)
as can being overly authoritative, being judgemental and confrontational (Lau et al.,
2012a).
1.7.6 ED specific factors
Other antecedents reported in the literature include factors specific to waiting in the
ED such as boredom, heat, excessive or constant noise, lack of choice and
Page 27

overcrowding (Hodge & Marshall, 2007). This environment can lead to increased
levels of anxiety in certain types of patients, and increase their potential for violent
behaviour, for example those with mental health diagnoses and dementia patients
(Kable et al., 2012a). Environmental factors such as the presence of a bank-like
counter at triage can provoke anger by reinforcing lack of access and
disempowerment (Lau, Magarey, & McCutcheon, 2004). Low or poor lighting has
also been proposed as a risk factor for patients suffering cognitive impairment
(Whittington, Shuttleworth, & Hill, 1996).
Patients’ unrealistic expectations and perceptions regarding the care they should
receive in the ED (Lau et al., 2004), including a lack of understanding of the triage
scale have also been proposed as risk factors, with many patients not accepting that
others may require more urgent attention than them (Lyneham, 2000). Researchers
have reported that many patients and their visitors hold unrealistically high
expectations of nurses, and when these expectations are not met the resultant anger
is usually directed towards nurses (Jackson, Clare, & Mannix, 2002; Lyneham, 2000;
Pich et al., 2011; Tyrell, 1999).
Environmental aspects of the ED can contribute to the potential for violence from
some types of patients. The modern ED is noisy, busy, open and not conducive to
privacy and can be challenging for the management of mental health patients who
need a quiet, non-stimulating environment with subdued levels of activity and
privacy to create an environment where they feel secure (Crowley, 2000). This noisy
environment, combined with frustration over waiting times, can often spark
aggression (Morphet et al., 2012). In addition this environment can have a negative
effect on elderly patients, adding to disorientation and confusion and creating the
potential for “resistance to care” behaviours that can include violence (Kable, Guest,
& McLeod, 2012b).
Page 28
Control of access to the ED has been consistently identified as an area of concern for
nurses (Catlette, 2005) due to the largely unrestricted movement of the public
(Phillips, 2007). Measures to address this including restricted access utilising swipe
cards , safety glass at triage, policies restricting the number of visitors, lockdown of
departments after hours, the use of quiet areas or seclusion rooms to house patients
at risk of violence, security cameras and metal detectors are reported in the literature
(Gates, Gillespie, & Succop, 2011b; Kansagra et al., 2008; May & Grubbs, 2002).
However some researchers argue that such measures can be counter-productive and
instead create a confrontational situation (Phillips, 2007); for example the use of
seclusion rooms can be viewed as contentious as they can be used as a form of
restraint with few studies into their efficacy in terms of their use as a patient
management strategy (van der Zwan, Davies, Andrews, & Brooks, 2011).
A history of violence has been identified as one of the biggest risk factors for future
violence, therefore the use of patient management plans that identify or flag “at-risk”
patients has been advocated as a preventative strategy (Gates et al., 2011a). A
systematic review on the effectiveness of interventions found that a patient
management strategy was associated with decreased levels of patient-related
violence (Wassall, 2009). However some authors argue that there can be negative
consequences for patients labelled as violent, in terms of increased delays and use of
restraints and it can also lead to misdiagnosis (Ferns, 2005b).
Research suggests that the certainty of sanction is a greater deterrent of unacceptable
behaviour than the severity of punishment. Examples of sanctions against violent
patients include the “card system” used in the National Health Service in the UK.
This involves a system of sanctions where clients who behave inappropriately are
issued with yellow and red warning cards, with the ultimate sanction being refusal
of treatment (mental health clients are exempted from the system) (NHS Foundation
Trust, 2012). Some Victorian hospitals use a similar system, issuing written warnings,
Page 29
followed by the imposition of “contracts of acceptable behaviour”. This hierarchy of
responses ranges from managed visits to refusal of service (except for treatment of
life threatening conditions) for serious repeat offenders (Victorian Government, 2005)
and constitutes another form of restricted access.
1.8 Consequences of violence
1.8.1 Physical
Physical violence has been defined as any intentional physical contact, actual or
threatened, and may not necessarily result in an injury to the victim (Victorian
Government, 2005). The consequences of physical violence on nurses involved in
these episodes are physical and psychological in nature. Physical injuries sustained
by overt acts of violence, range from minor, for example scratches, cuts, bruising and
abrasions to major including fractures and loss of consciousness (McKinnon & Cross,
2008). There are also reports of ED nurses being sexually harassed and abused by
patients (Gerberich et al., 2004; Ryan & Maguire, 2006) and extreme cases where
nurses have been murdered by patients in the course of their work (Lynch,
Appelboam, & McQuillan, 2003).
Witnessing suicide attempts and self-harm by patients are also included in this
category (Ryan & Maguire, 2006), as are episodes that involve being urinated or
defecated on (Jackson et al., 2002), and being stalked or held hostage by patients
(McKinnon & Cross, 2008). These types of episodes have a psychological impact on
nurses that can be long-lasting in nature (Gerberich et al., 2004).
1.8.2 Psychological
Even in the absence of physical injury, nurses have been found to experience
moderate to severe psychological reactions for up to 12 months (Gerberich et al.,
2004). Exposure to violence is linked to long-term psychological effects, including
Page 30

Post-traumatic Stress Disorder and burnout (Camerino, Estryn-Behar, Conway, van
Der Heijden, & Hasselhorn, 2008), and even seemingly minor acts of violence can
have a negative emotional impact (Farrell et al., 2006).
Research has consistently reported that nurses are concerned about violence and
aggression in the ED and often feel vulnerable (Catlette, 2005) and unsafe at work
(Gacki-Smith et al., 2009). Emotional effects reported in the literature include feelings
of guilt, self-doubt, feelings of professional incompetence (Arnetz & Arnetz, 2001);
anger, powerlessness, unhappiness, degradation, shame, fear, astonishment,
antipathy towards the perpetrator (Astrom et al., 2004); and sleeplessness (Jackson et
al., 2002). Nurses have reported feeling more cautious and deriving less satisfaction
from their patient-related care as well as being afraid to be at work. This fear and
caution can result in decreased morale and lead to a situation where patients are
avoided (Arnetz & Arnetz, 2001).
1.8.3 Professional
Patient-related violence can have significant implications for the quality of care
afforded to patients by nurses (Arnetz & Arnetz, 2001), with diminished work
performance being one of the consequences noted in the literature (Jackson et al.,
2002). Studies have identified a negative correlation between violence experienced by
health care staff and quality of care (Arnetz & Arnetz, 2001) and this may indirectly
result in a deterioration in the quality of care, not just for the patient involved but for
all patients cared for by the affected nurse (Lau et al., 2004). For example a Swedish
study found that exposure to violent incidents led to negative consequences for the
perpetrators in terms of increased medication, seclusion and the use of restraints
(Astrom et al., 2004).
Page 31

1.8.4 Organisational
The consequences of patient-related violence on nurses have a flow on effect to the
health care system in terms of increased costs. These costs are reflected in loss of
experienced staff (Chapman & Styles, 2006); sick leave, decreased productivity, staff
turnover and attrition, and workers’ compensation pay outs (Jackson et al., 2002).
Quantifying the cost of patient violence is difficult as it includes intangible items
such as loss of morale, difficulties with retention and recruitment of staff, impact on
patient care and therapeutic relationships and negative public relations which are
difficult to assign a dollar value to (Hunter & Carmel, 1992).
1.9 Reporting
Reporting is an integral component of clinical governance and its primary purpose is
to increase the safety of patients, visitors and staff, and ultimately to improve the
quality of care. However in the case of episodes of violence, the incidence remains
difficult to quantify and is grossly underestimated due to a lack of reporting (Jones &
Lyneham, 2000). Estimations of under-reporting range from 20% (Lyneham, 2000) to
90% (Mayhew & Chappell, 2005) and this is referred to as the “dark figure” of
workplace violence (Farrell et al., 2006), making it difficult for accurate incidence and
prevalence of violence to be calculated (Ryan & Maguire, 2006). This is postulated to
be related to the high levels of violence endemic in these areas (Holleran, 2006).
Nurses often perceive the response of hospital management and the legal system to
reports of violence to be inadequate, yet the evidence shows that the majority of
episodes of violence are not reported (Rose, 1997). This has led to a situation where
much of the evidence regarding patient-related violence is anecdotal in nature and
there is a disparity between the reality faced by nurses and the official records and
data about the phenomenon.
Page 32

Barriers to reporting episodes of patient-related violence include: - the perception
that reporting might have a negative effect on customer service scores, or would be
seen as a sign of weakness or incompetence, ambiguous ED reporting policies and
fear of retaliation (Gacki-Smith et al., 2009). Other barriers reported in the literature
include: -confusion as to what events to report, lack of time and lack of feedback
from management and administration after the reported event (Gates et al., 2011a).
A study by Gacki-Smith et al (2009) found that nurses who felt there were no barriers
to reporting were less likely to have experienced frequent ED physical violence than
other nurses (Gacki-Smith et al., 2009). A relationship has also been identified
between prior experience of violence and the likelihood of not reporting future
episodes, with nurses exposed to violence becoming numb after repeated exposure
(Pinar & Ucmak, 2011). This correlation between the number of prior assaults and the
likelihood to report future assaults (Erickson & Williams-Evans, 2000), means that
the more violence a nurse is exposed to, the less likely they are to report such
incidents. In addition studies have found that nurses often make judgements about
whether or not to report based on a number of factors the degree of personalisation
of the violence, the presence of mitigating factors and the reason for the ED
presentation. (Luck et al., 2008).
1.10 Risk management strategies
The best strategy for managing aggression and violence is prevention; however in
clinical environments such as the ED this is not always possible. Violence should be
dealt with promptly and positively by management, and staff should be supported
and followed up with understanding (Winterbottom, 1979). Canadian researchers in
one study reported that nurses who reported low supervisor support were more
likely to report abuse from patients, compared with those reporting more positive
relationships. The researchers hypothesised that this could lead to increased levels of
Page 33

distress in those nurses and in turn have a negative impact on their patient care
(Shields & Wilkins, 2009).
1.10.1 De-escalation techniques
De-escalation has been defined as a set of practice skills, including verbal and non-
verbal responses which when used correctly, may reduce the level of a person’s
hostility and in turn their predisposition towards violence (Saines, 1999). As the first
point of contact in the ED, triage nurses are especially vulnerable to episodes of
violence (Pich et al., 2011). Therefore they are ideally placed to identify patients at
risk of exhibiting violent behaviour (Keep & Gilbert, 1997; Sands, 2007). Minimisation
of violence requires early recognition of signs or cues and timely de-escalation
(Presley & Robinson, 2002). Researchers have described a “turning point”, where
nurses have the opportunity to act and contain or prevent violence (Lau et al., 2012b).
Researchers have recognised cues displayed by patients who may subsequently
display violent behaviours (Chapman & Styles, 2006). These warning signs have been
incorporated into training programs and models to help nursing staff identify at-risk
patients and manage them appropriately to prevent violence from occurring. For
example the ABC approach to assessing risk of violence at triage is a three-step
violence risk assessment guide tailored specifically for triage nurses (Sands, 2007).
Empathetic communication is crucial and should occur early in the process, for
example alerting patients to waiting times (Lau et al., 2012a).
Behaviours identified as warning signs for potential violence include demanding and
attention-seeking behaviours (Crilly et al., 2004) and are related to appearance, voice,
movements and behaviour (Tyrell, 1999). These behaviours were labelled STAMP by
Luck et al (2007). The authors discuss five elements of observable behaviour
indicating potential for violence in patients, their friends and family. These passive
behaviours: Staring and eye contact, Tone and volume of voice, Anxiety, Mumbling,
Page 34

and Pacing have the potential to escalate into overt physical violence (Luck et al.,
2007). This work was subsequently expanded to include four other precursors to
episodes of violence and was re-labelled STAMPEDAR (Chapman, Perry, Styles, &
Combs, 2009). The additional components identified were: Emotions, Disease
process, Assertive/non-assertive behaviour and Resources. Cues associated with
emotions included frustration, fear, unhappiness and dissatisfaction. Confusion,
intoxication with alcohol or illicit drugs, organic disorders and patients who
presented at the ED on a “regular” basis were identified as risk factors under the
disease process label. Long waiting times and staff-related issues such as
inexperience, lack of knowledge and skills and inappropriate communication styles
were listed as risk factors for violence under the resources heading; while
assertive/non-assertive behaviours were related to confrontational, disrespectful and
over-assertive patients (Chapman et al., 2009).
According to the literature the amount and type of training provided to staff varies
widely and as a result many staff report that they do not feel that they have the
necessary skills to effectively manage episodes of violence (Lee, 2001; Pich et al.,
2011). Training is consistently identified as important by nurses (Gates et al., 2011a),
however it is reported to be largely sporadic and fragmented in nature with a lack of
consistency between trainers and programs (Lee, 2001). The incorporation of de-
escalation training into undergraduate nursing curricula has been suggested as a
means of preparing student nurses for the realities of the workplace (Ross, 2002).
1.10.2 Security
The use of visible on-site security services is frequently cited as a measure to aid in
the management of episodes of violence; however their effectiveness is dependent on
their ability to respond in a timely fashion (Gates et al., 2006). This is also true of
personal duress alarms worn by nurses (Lyneham, 2001). The presence of security is
described as both a preventative strategy, by acting as a deterrent, and a reactive
Page 35
strategy to manage episodes of violence (Gates et al., 2011a). The type of security
reported in the literature varied widely and ranged from unarmed security guards
based outside the ED to security personnel in the ED armed with firearms and tasers
(Gates et al., 2011a). A study of hospital-based shootings in the US found that 23% (n
= 10) of ED shootings involved a security guard’s gun being taken and used by the
perpetrator (Kelen et al., 2012).
1.10.3 Environmental measures
Environmental controls such as restricted access to the department (Early & Hubbert,
2006) and the use of security screens at triage can reduce the risk of violence from
outside the department; however they do not prevent violence once patients have
been admitted into the department (Jones & Lyneham, 2000). In fact it is not possible
to have impenetrable hospital security and zero risk in the context of an ED because
it is designed to be accessible to the public (Kelen et al., 2012).
Isolation or seclusion of violent patients or those identified as being at risk of
violence has also been identified as an important strategy in their management
(Gates et al., 2011a). The use of metal detectors has been recommended by the
American Medical Association and American Psychiatric Association, and adopted,
in some US hospitals in response to the potential for gun crime in particular
(Anderson, FitzGerald, & Luck, 2009). Some researchers argue that such measures
can be counter-productive and instead create a confrontational situation (Phillips,
2007).
1.10.4 Debriefing
The use of debriefing after episodes of violence is supported in the literature;
however informal debriefing is reported to be the most common method employed
in the workplace (Gates et al., 2011a). Barriers to formal debriefing cited lack of time
Page 36

and a workplace culture that tolerates violence as part of the job (Farrell et al., 2006;
Gates et al., 2011a)
The National Institute for Health and Clinical Excellence guidelines for the
prevention and management of violence recommend that a review should take place
within 72 hours for all parties involved, however they provide little guidance on how
this should take place (Bonner & McLaughlin, 2007). A lack of attention to the
emotional effects of violence can contribute to Post Traumatic Stress Disorder (Gates
et al., 2011b). This is supported by other studies that show that counselling is most
effective at the early stages of post-traumatic stress and should be offered to all those
affected (Lange, Lange, & Cabaltica, 2000; Schnieden & Marren-Bell, 1995). Failure to
acknowledge this can lead to increased costs in terms of workers compensation
claims, job dissatisfaction and decreased morale (Gates et al., 2011b).
1.11 Zero tolerance
The presence of a definitive policy on the management of violent patients may serve
to mitigate the risk of violence and aggression (Anderson et al., 2009). One such
policy incorporates the concept of Zero Tolerance, which originated in the United
States and refers to specific actions that will not be tolerated or accepted (Wand &
Coulson, 2006).
This concept has been adopted by a number of health departments, for example New
South Wales Health, in an attempt to create a safe working environment as required
by the Workplace Health and Safety legislation. NSW Health state that a Zero
Tolerance Response means that appropriate action will be taken to protect
employees, patients and visitors from the effects of violent behaviour (NSW Health,
2003). The intent of this policy is to maintain effective risk management strategies
and to avoid inappropriate action where violent behaviour is the result of an
underlying medical condition (Hodge & Marshall, 2007). However it has been
Page 37

argued that zero tolerance is an ineffective response to violence in health settings,
one that impinges on the rights of patients and the ability of clinicians to develop a
therapeutic relationship due to its inflexible nature (Holmes, 2006).
However a Zero Tolerance approach to aggression and violence in healthcare is seen
to be largely impractical for clinicians in the ED because it has the potential to
impinge on their ability to develop therapeutic relationships with patients.
Therapeutic engagement and the establishment of rapport are essential components
of nursing practice and this is especially important in the stressful environment of
the ED (Wand & Coulson, 2006).
1.12 Legal issues
The first case of criminal prosecution for an inpatient assault occurred in 1978;
however it is only recently that legislation regarding workplace violence has come to
prominence (Quanbeck, 2006). California was the first US state to enact legislation:
California Hospital and Security Act Assembly Bill 508, which required acute care
and psychiatric facilities to implement comprehensive violence prevention programs
(Peek-Asa et al., 2007). Twenty-eight states in the US have enacted felony legislation
for assault and/or battery against health care providers, including ED nurses,
however it is not readily apparent if these penalties are being enforced (Goldstein,
2013). Penalties for assaulting a healthcare worker include a $5000USD fine for
assault and possible imprisonment (Emergency Nurses' Association, 2012).
Staff should be made aware of their legal rights and how these can be enforced
against the perpetrators of violence (Dimond, 1994). Employers who do not take
reasonable precautions to protect the safety of their staff could be in breach of Work
Health and Safety requirements.
Despite evidence that violence against ED nurses is a common occurrence, legal
action against perpetrators is rarely taken due to the failure of nurses to assert their
Page 38
legal rights after they become the victim of a violent episode (Forrester, 2002). The
majority of perpetrators of violence and aggression experience no negative
consequences following their inappropriate behaviour, with minimal prosecutions
reported (Mayhew & Chappell, 2005). For those perpetrators who receive a sanction,
it is usually in the form of a verbal warning from a nurse unit manager or security
officer (Victorian Government, 2005).
In some countries the reluctance of nurses to instigate legal proceedings against
violent offenders has been linked to fear of retaliation by perpetrators, and shame
and fear of stigmatisation in the community and workplaces, as well as shortcomings
in the legal system (Pinar & Ucmak, 2011). Turkish researchers reported that in
instances where charges were laid, cases were often closed if the perpetrator denied
the charges and punishments were weak or non-existent in those cases that were
successful (Pinar & Ucmak, 2011).
In January 2013 the South Australian Government announced that maximum jail
sentences for people convicted of assaulting hospital staff would be increased to 25
years in recognition of the high levels of exposure to violence experienced by health
care workers relative to other professionals (ABC News, 2013). It is also critical that
nurses have confidence in the justice system and in their own employers to support
them to report attempted or actual assaults to police and, where appropriate, to
request that charges be laid. In NSW, a written Memorandum of Understanding
between NSW Health and NSW Police underpins police response and support for
health care workers when reporting violent incidents, including laying charges and
pursuing prosecutions where appropriate (NSW Department of Health, 2002).
Nurses should be supported by their organisation to report violent assaults or threats
to the police whether a prosecution is likely to succeed or not (Victorian Government,
2005).
Page 39

1.13 Conclusion
Violence initiated by patients is a reality of the modern ED work environment for
nurses. The nature of the ED and the patients who present there mean that the threat
of violence cannot be totally eliminated. Nurses need to be supported in the
aftermath of a violent incident, with medical and psychological services, to prevent
long-lasting negative effects and an associated decline in the quality of patient care.
Nurses need to be encouraged to report incidents of violence to facilitate a change in
the workplace culture where violence is seen as an inevitable part of the job. Thus the
realities facing ED nurses in terms of violence in the workplace may be translated
into an action plan that management and policy makers understand and must
respond to, to provide a safe working environment for ED nurses.
Page 40

Table 1: Overview of key literature
AUTHORS & YEAR
COUNTRY & type of participant
STUDY TYPE Data collection tool
SAMPLE SIZE/ Response rate
FINDINGS
(Arnetz & Arnetz, 2001)
Sweden Healthcare
Questionnaires – staff and patients
3 time periods 1. 1994 n=3500 RR=76% 2. 1995 n=2617 RR=61% 3. 1997 n=2414 RR=71%
Implications for quality of care provided – association between violence experienced by health staff and patient-related quality of care. Long-term psychological effects even when physical injury is not present.
(Astrom et al., 2004)
Sweden Aged care
Telephone interviews of staff exposed to violent episodes
n=97 More than half occurred while helping with Activities of Daily Living. Emotional reactions included antipathy, powerlessness, insulted, resignation, indifference, guilt. 87% reported informal discussion with colleagues the most common strategy after violent episode.
(Atawneh, Zahid, Al-Sahlawi, Shahid, & Al-Farrah, 2003)
Kuwait ED nurses
Quantitative questionnaire
n = 81 RR = 94%
70/81 nurses had experienced verbal abuse; 13/81 had been physically assaulted. Nurses suffer more from the after-effects of violence at work than doctors. Effects of violence included: - flashbacks, depression, sleep disturbances, fear and time off work. Males statistically more likely to experience violence & more fearful at work than females. 63/81 worried about violence at work. Training – 15/81 had received aggression minimisation training.
(Badger & Mullan, 2004)
UK Healthcare
Cross-sectional – questionnaire
n=96/287 RR=34%
36% of staff identified outstanding training or support needs. Some incidents provoked by staff.
(Benveniste, Hibbert, & Runciman, 2005)
Australia Healthcare
Review of data on incidents involving violence collected using AIMS
ED highest prevalence. 5% of incidents led to injury. Mental health patients. Preventive strategies including de-escalation training, violence management plans, building design and fast-tracking of mental health patients as well as improved waiting times.
Page 41
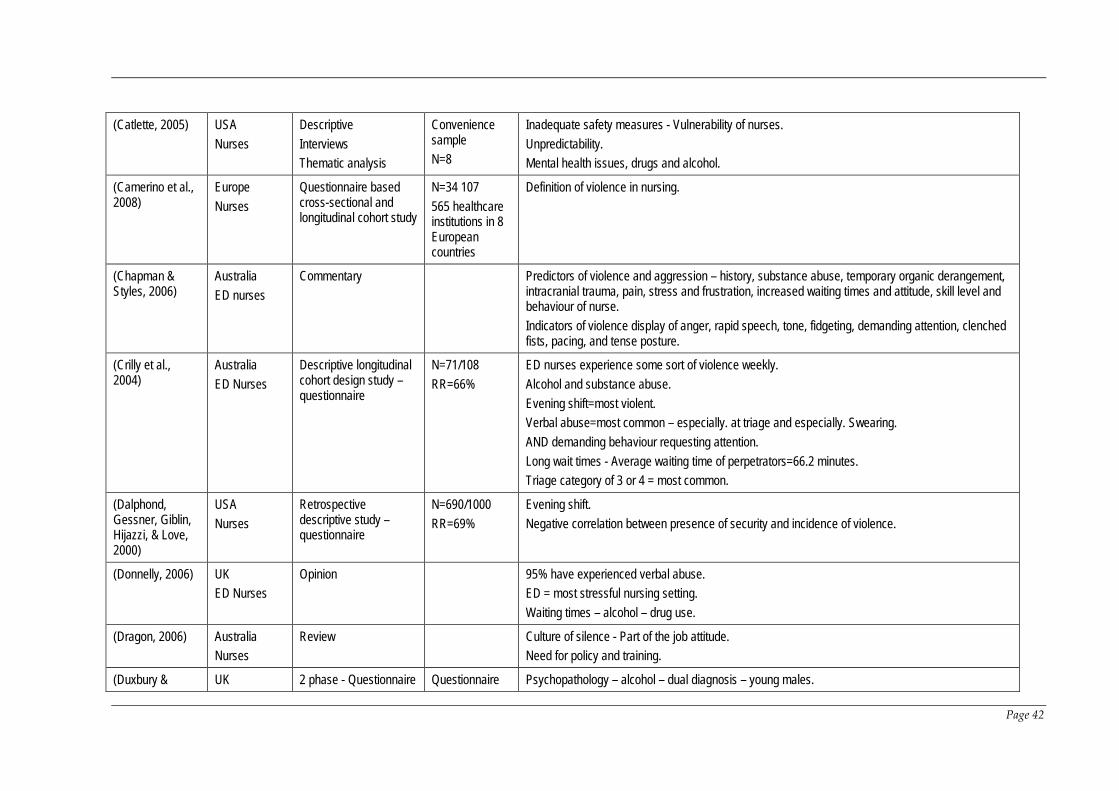
(Catlette, 2005) USA Nurses
Descriptive Interviews Thematic analysis
Convenience sample N=8
Inadequate safety measures - Vulnerability of nurses. Unpredictability. Mental health issues, drugs and alcohol.
(Camerino et al., 2008)
Europe Nurses
Questionnaire based cross-sectional and longitudinal cohort study
N=34 107 565 healthcare institutions in 8 European countries
Definition of violence in nursing.
(Chapman & Styles, 2006)
Australia ED nurses
Commentary Predictors of violence and aggression – history, substance abuse, temporary organic derangement, intracranial trauma, pain, stress and frustration, increased waiting times and attitude, skill level and behaviour of nurse. Indicators of violence display of anger, rapid speech, tone, fidgeting, demanding attention, clenched fists, pacing, and tense posture.
(Crilly et al., 2004)
Australia ED Nurses
Descriptive longitudinal cohort design study – questionnaire
N=71/108 RR=66%
ED nurses experience some sort of violence weekly. Alcohol and substance abuse. Evening shift=most violent. Verbal abuse=most common – especially. at triage and especially. Swearing. AND demanding behaviour requesting attention. Long wait times - Average waiting time of perpetrators=66.2 minutes. Triage category of 3 or 4 = most common.
(Dalphond, Gessner, Giblin, Hijazzi, & Love, 2000)
USA Nurses
Retrospective descriptive study – questionnaire
N=690/1000 RR=69%
Evening shift. Negative correlation between presence of security and incidence of violence.
(Donnelly, 2006) UK ED Nurses
Opinion 95% have experienced verbal abuse. ED = most stressful nursing setting. Waiting times – alcohol – drug use.
(Dragon, 2006) Australia Nurses
Review Culture of silence - Part of the job attitude. Need for policy and training.
(Duxbury & UK 2 phase - Questionnaire Questionnaire Psychopathology – alcohol – dual diagnosis – young males.
Page 42

Whittington, 2005)
Nurses & patients
& interviews n=80 patients n= 82 nurses Interviews n=5 patients n=5 nurses
Environmental factors e.g. provisions for privacy. Negative staff and patient relationship leads to patient aggression.
Early & Hubbert, (2006)
USA ED Nurses
Phenomenological Semi-structured interviews Thematic analysis
n = 12 ED environment not supportive to nurses or patients and may contribute to emergence of violent behaviour.
(Erickson & Williams-Evans, 2000)
USA Nurses
Questionnaire Convenience sample N=55
Attitudes of ED nurses re. patient assaults. Habituation – more assaults – less likely to report – attitude that assaults are part of the job.
(Estryn-Behar et al., 2008)
Europe – 10 countries Nurses
Questionnaire and 1 year follow up assessment
N=39 894 RR=51%
Workplace violence – verbal abuse – aggression – harassment – bullying – physical violence. 22% reported exposure to frequent violent episodes. Highest prevalence in mental health, geriatric and ED. Leads to higher levels of burnout.
(Farrell et al., 2006)
Australia Nurses
Questionnaire N=2407/6326 RR=38%
Types of abusive behaviour. Male and females equally culpable for verbal abuse BUT males more likely re physical abuse. ED 3rd area of practice for verbal abuse and 1st for physical. Verbal abuse most frequent type of abuse.
(Fernandes et al., 1999)
Canada ED
Questionnaire N=106/163 RR=65%
68% reported increased frequency of violence over time and 60% increased severity. Informal debriefing with colleagues High risk patients – drug abusers, alcoholics, mentally ill and gang members. ED factors – long wait times, high-stress illness, noisy environment & 24 hour access
(Ferns, 2005a) UK Nurses
Literature review Precursors: - History of violence; Mental health patients. Intentional VS unintentional violence. Verbal abuse. Under-reporting.
(Ferns, 2005b) UK Literature review Excessive verbal abuse.
Page 43

Nursing Violence against nurses remains poorly researched and understood. Physical pain, Alcohol, distress and mental health issues. Nurses often do not report due to lack of perceived intent. Use of hospital equipment as weapons.
(Ferns, Stacey, & Cork, 2006)
UK ED nurses
Literature review Importance of nurses in researching phenomena of violence.
(Fisher & Gunnison, 2001)
USA Workplace violence
Literature review Greatest number of non-fatal victimisations occurred between patients and nurses
(Friedman, 2006) USA Mental health sector
Literature review Presence of schizophrenia, major depression or bipolar disorder significantly associated with increased risk of violence.
(Gates et al., 2006)
USA ED staff
Action Research Questionnaire
N=242/600 RR=40.3%
Violence in the Emergency Department is increasing - 65% non-reporting rate. Thematic analysis results supported the relevance, feasibility, and saliency of the planned intervention strategies. Contributing factors for physical assault. 64% had not had violence prevention training in previous 12 months. Increased police presence sought – did not feel safe.
(Gerberich et al., 2004)
USA Nurses
Questionnaire N=4918/6300 RR=78%
Definition of violence. Reasons for non-reporting:-Accepted as part of the job; Considered it minor or isolated; Unnecessary to report; Non-supportive environment; Too busy. Even in absence of injury some assaulted staff experienced moderate to severe reaction for 6 months to 1 year.
(Gillies & O'Brien, 2006)
Australia Mental health nurses
Literature review Risk factors for violence in psychiatric patients: - Delusions and hallucinations; Drug and alcohol abuse; Personality disorder; Previous violent behaviour; Younger age; Self-harm. Nursing staff are most frequent targets of violent behaviours from psychiatric patients.
(Greene, 2008) Canada ED
Commentary ED staff accustomed to violent behaviour - US ED doctors taking guns to work for protection (38%). Inconsistent response by management.
(Hegney, Eley, Australia Questionnaire N=1349/3000 Nurses 4-times higher risk of assault than general workforce.
Page 44
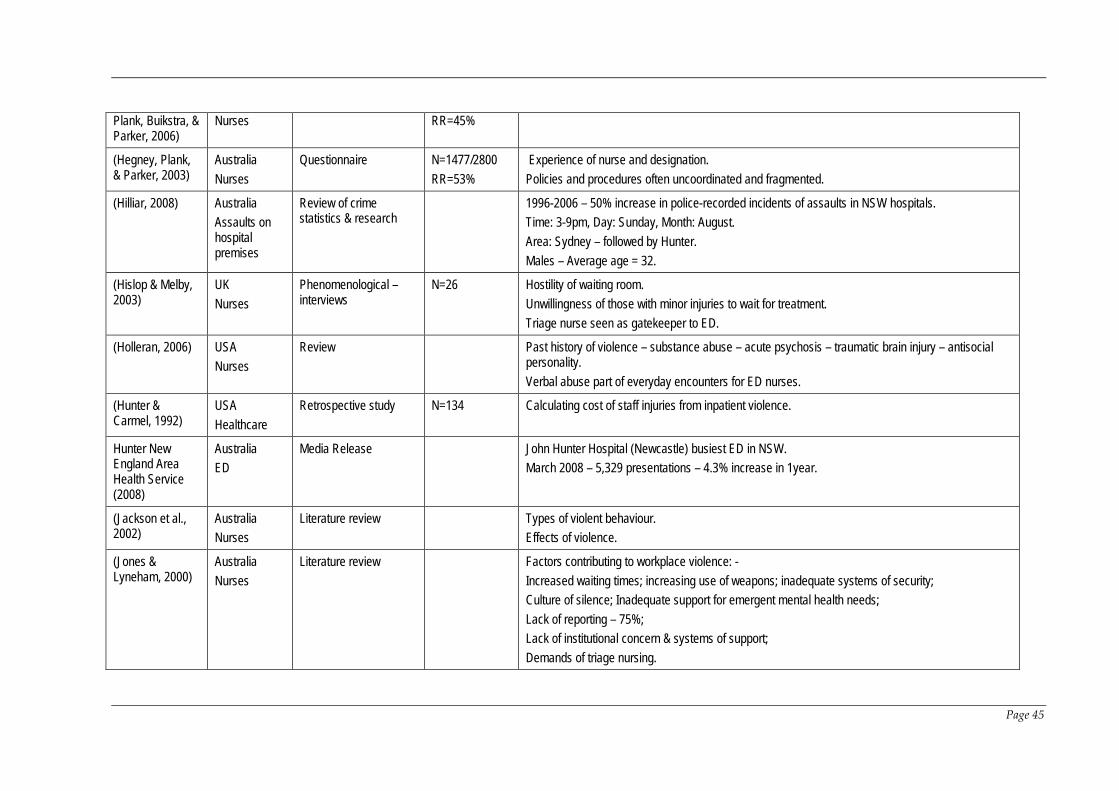
Plank, Buikstra, & Parker, 2006)
Nurses RR=45%
(Hegney, Plank, & Parker, 2003)
Australia Nurses
Questionnaire N=1477/2800 RR=53%
Experience of nurse and designation. Policies and procedures often uncoordinated and fragmented.
(Hilliar, 2008) Australia Assaults on hospital premises
Review of crime statistics & research
1996-2006 – 50% increase in police-recorded incidents of assaults in NSW hospitals. Time: 3-9pm, Day: Sunday, Month: August. Area: Sydney – followed by Hunter. Males – Average age = 32.
(Hislop & Melby, 2003)
UK Nurses
Phenomenological – interviews
N=26 Hostility of waiting room. Unwillingness of those with minor injuries to wait for treatment. Triage nurse seen as gatekeeper to ED.
(Holleran, 2006) USA Nurses
Review Past history of violence – substance abuse – acute psychosis – traumatic brain injury – antisocial personality. Verbal abuse part of everyday encounters for ED nurses.
(Hunter & Carmel, 1992)
USA Healthcare
Retrospective study N=134 Calculating cost of staff injuries from inpatient violence.
Hunter New England Area Health Service (2008)
Australia ED
Media Release John Hunter Hospital (Newcastle) busiest ED in NSW. March 2008 – 5,329 presentations – 4.3% increase in 1year.
(Jackson et al., 2002)
Australia Nurses
Literature review Types of violent behaviour. Effects of violence.
(Jones & Lyneham, 2000)
Australia Nurses
Literature review Factors contributing to workplace violence: - Increased waiting times; increasing use of weapons; inadequate systems of security; Culture of silence; Inadequate support for emergent mental health needs; Lack of reporting – 75%; Lack of institutional concern & systems of support; Demands of triage nursing.
Page 45

(Jenkins, Rocke, McNicholl, & Hughes, 1998)
UK ED - doctors
Questionnaire N=233/310 RR=75%
Alcohol, waiting times drug use and patient expectations perceived as chief causes.
(Kennedy, 2005) Australia ED
Australian RN’s rate 2nd highest among employee groups for workers comp claims as a result of violence. ED among highest risk setting for violence in healthcare.
(Keough, Schlomer, & Bollenberg, 2003)
USA ED Nurses
Cross-sectional – questionnaire
N=266/900 RR=30% (approx.)
Nurses identified increasing violence in the ED as area of greatest concern. Mental health – alcohol – drug abuse.
(Kisa, 2008) Turkey Nurses
Questionnaire N=339/410 RR=82.7%
Psychological and physical impact of violence. Under-reporting. Costs.
(Kwok et al., 2006)
Hong Kong Nurses
Questionnaire N=420/1650 RR=25%
Verbal abuse most prevalent form of violence. ED highest risk area.
(Lanza, 1983) USA Nurses
Questionnaire of staff previously identified as being assaulted
N=40/67 Reactions to physical assault by patients. Cues predictive of assault – deviations in patient’s speech, behaviour and emotions. Environment – inadequate staffing – lack of male staff – turmoil on ward – overcrowding. Reactions to assault can last much longer than time victim is away from work.
(Lau et al., 2004) Australia Health professionals
Literature review Gap in literature – potential for identifying the indicators of violence at triage. Over-reliance on reactive and coercive traditional violence management strategies. Young, inexperienced, of small physical size and female are more prone to violent attacks.
(Lavoie et al., 1988)
USA ED
Survey of hospitals N=127/170 RR=74.7%
Only 51/127 study hospitals provide ED nurses with formal training re. recognition and management of aggression and violence. 78% of violent incidents occur within 1 hour of presentation.
(Levin, Hewitt, & Misner, 1998)
USA ED Nurses
Qualitative 4 Focus groups
N=22 Long wait times. Mental health and dementia patients; Alcohol. Many threats related to unmet needs. Nurses experienced short and long-term effects. Weapons prevalent.
Page 46

(Luck, Jackson, & Usher, 2006)
Australia Literature review Violence is a multi-faceted problem; Steeped in a discourse that protects the agents of violence and perpetuates the use of current strategies despite their lack of success; New strategies required and new discourses to discuss the problem.
(Luck et al., 2007)
Australia ED nurses
Mixed method case study
13 informal field interviews 16 semi-structured interviews 290 hours of participant observation
STAMP behaviours identified as predictors of potential violence in patients Staring, Tone, Anxiety, Mumbling, Pacing
(Luck et al., 2008)
Australia ED nurses
Mixed method case study
13 informal field interviews 16 semi-structured interviews 290 hours of participant observation
ED nurses made judgements about meanings of violent events according to 3 factors: Perceived personalisation of violence; Presence of mitigating factors; Reason for presentation.
(Lynch et al., 2003)
UK ICU nurses
Questionnaire N=176/188 RR=93.6%
Types of physical injuries. Illness, distress, alcohol and sociopathic behaviour.
(Lyneham, 2000) Australia Nurses
Descriptive exploratory survey study 2 stages 9 interviews and Questionnaire
N=266/650 RR=41%
Non-reporting an issue. Drugs, alcohol and ED waiting times.
(Maguire & Ryan, 2007)
Ireland Mental health nurses
Questionnaire N=87/280 RR=31%
Experience of nurse. Disparity between official and self-reporting.
(May & Grubbs, USA Survey N=86/125 ED nurses at higher risk.
Page 47

2002) Nurses RR=68.8% Under-reporting 50%. Cognitive dysfunction, substance abuse, anger related to long wait times and health care system.
(Mayhew & Chappell, 2005)
Australia Healthcare
Definition of violence. Healthcare rated 2nd for verbal abuse and physical assault in survey of workplaces. Under-reporting 90%. Best predictor of violence is past aggression.
(McKinnon & Cross, 2008)
Australia Mental health nurses
Descriptive Survey N=63/90 RR=70%
Unqualified and junior staff at greater risk. Dual diagnosis. Environmental factors can increase levels of violence. Under-reporting.
(Moser, 2008) USA Commentary US nurse shot and killed by man unhappy with mother’s treatment.
(Nijman, Bowers, Oud, & Jansen, 2005)
UK Mental health nurses
Questionnaire using POPAS
N=154/395 RR=39%
Use of “Perceptions of Prevalence of Aggression Scale” (POPAS) – rates 15 types of aggressive behaviour. Female staff less likely to be victim of severe physical violence.
NSW Health (2005)
Australia
Policy directive Aggression minimisation training mandatory and to be repeated at a minimum of every 2 years. All staff at risk of violence must be provided with appropriate info, instruction & training in how to prevent and manage violence in the workplace.
(NSW Health, 2003)
Australia Healthcare
Policy and framework guidelines
Zero tolerance – response to violence in NSW Health workplace.
(Oster, Bernbaum, & Patten, 2001)
Canada Psychiatric emergency service
Retrospective review of patients identified as being violent
N=758 Predictors of violence. Frequency of violence among females and males similar – reflecting changing patterns of violent behaviour in relation to patient gender.
(Pawlin, 2008) UK ED
Questionnaire N=33/80 UK figures – staff physically assaulted every 7 minutes. Under-reporting due to:-Intent; Accustomed to violence; Excessive and lengthy reporting procedures; Nothing will come of it; Uncertainty about what constitutes a violent act. Use of abuse data recording tool.
(Phillips, 2007) USA Workplace Violence Under-reporting 80%.
Page 48
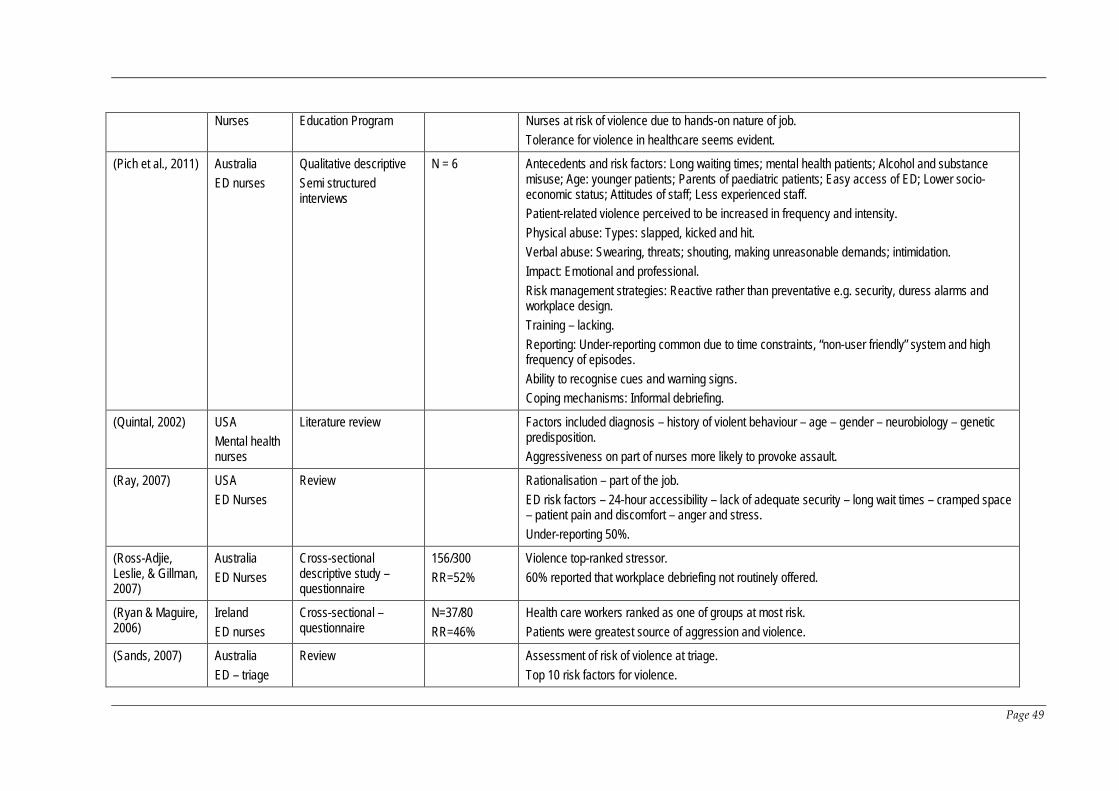
Nurses Education Program Nurses at risk of violence due to hands-on nature of job. Tolerance for violence in healthcare seems evident.
(Pich et al., 2011) Australia ED nurses
Qualitative descriptive Semi structured interviews
N = 6 Antecedents and risk factors: Long waiting times; mental health patients; Alcohol and substance misuse; Age: younger patients; Parents of paediatric patients; Easy access of ED; Lower socio-economic status; Attitudes of staff; Less experienced staff. Patient-related violence perceived to be increased in frequency and intensity. Physical abuse: Types: slapped, kicked and hit. Verbal abuse: Swearing, threats; shouting, making unreasonable demands; intimidation. Impact: Emotional and professional. Risk management strategies: Reactive rather than preventative e.g. security, duress alarms and workplace design. Training – lacking. Reporting: Under-reporting common due to time constraints, “non-user friendly” system and high frequency of episodes. Ability to recognise cues and warning signs. Coping mechanisms: Informal debriefing.
(Quintal, 2002) USA Mental health nurses
Literature review Factors included diagnosis – history of violent behaviour – age – gender – neurobiology – genetic predisposition. Aggressiveness on part of nurses more likely to provoke assault.
(Ray, 2007) USA ED Nurses
Review Rationalisation – part of the job. ED risk factors – 24-hour accessibility – lack of adequate security – long wait times – cramped space – patient pain and discomfort – anger and stress. Under-reporting 50%.
(Ross-Adjie, Leslie, & Gillman, 2007)
Australia ED Nurses
Cross-sectional descriptive study – questionnaire
156/300 RR=52%
Violence top-ranked stressor. 60% reported that workplace debriefing not routinely offered.
(Ryan & Maguire, 2006)
Ireland ED nurses
Cross-sectional – questionnaire
N=37/80 RR=46%
Health care workers ranked as one of groups at most risk. Patients were greatest source of aggression and violence.
(Sands, 2007) Australia ED – triage
Review Assessment of risk of violence at triage. Top 10 risk factors for violence.
Page 49

Tool- triage violence risk assessment chart.
(Secker et al., 2004)
UK Mental health nurses
Qualitative interviews N=15 Zero tolerance unlikely to succeed without understanding why aggressive incidents occur. Three steps should follow an aggressive incident: - 1. Emotional support; 2. Critical reflection; 3. Accountability.
(Wand & Coulson, 2006)
Australia ED
Patients more aggressive to nurses than doctors. Aggressive and violent episodes daily occurrence in ED. Concept of Zero Tolerance originated in US and refers to specific actions or behaviours that will not be tolerated. Early recognition and use of de-escalation strategies preferable.
(Wells & Bowers, 2002)
UK Nurses
Literature review Younger and less experienced nurses at greater risk
(Whelan, 2008) Canada Nurses
Review Increasing trends. Workers compensation claims in Alberta detailed. Characteristics of abuser. Definitions and types of abuse.
(Whittington & Winstanley, 2008)
UK ED Nurses
Commentary Meaning assigned to acts of violence –psychology of reporting how personalised attack was – mitigating circumstances.
(Winstanley & Whittington, 2004)
UK Healthcare
Questionnaire 375/1141 RR=33%
Particular staff were experiencing repeated victimisation while others were experiencing none. High levels of verbal abuse and threatening behaviour in ED.
(Wright, Dixon, & Tompkins, 2003)
UK Primary care
Review Risk factors vary according to time, place, situation and support networks. Perpetrators likely to be male, mean age 36, long wait times, alcohol and drug issues, mental health issues.
Page 50

Chapter 2 Systematic review
In view of the issues identified in this literature review a systematic review of the
literature was undertaken to focus in on the issue of patient-related violence against
nursing staff working in the ED.
2.1 Executive summary
Background
Objectives The purpose of this review was to identify, appraise and synthesise the
best available evidence on the impact of patient-related violence against nurses
working in Emergency Departments.
Inclusion criteria
Types of participants
This review included nurses working in Emergency Departments regardless of
gender, age, classification or level of experience.
Types of intervention(s)/phenomena of interest
The review considered studies that evaluated Emergency Nurses’ experiences with
patient-related violence.
Types of studies
The review included primary quantitative, qualitative studies and mixed method
studies.
Types of factors and outcomes
The review included studies that reported factors and outcomes associated with
patient-related violence including: -
Page 51
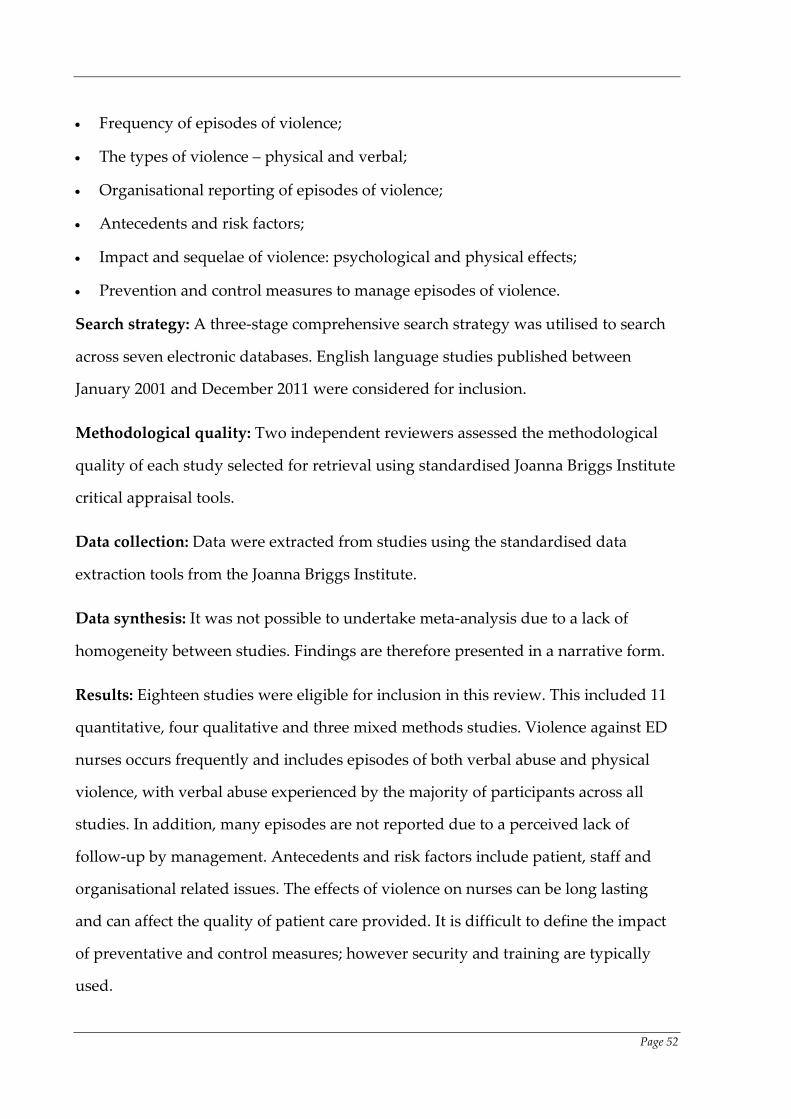
• Frequency of episodes of violence;
• The types of violence – physical and verbal;
• Organisational reporting of episodes of violence;
• Antecedents and risk factors;
• Impact and sequelae of violence: psychological and physical effects;
• Prevention and control measures to manage episodes of violence.
Search strategy: A three-stage comprehensive search strategy was utilised to search
across seven electronic databases. English language studies published between
January 2001 and December 2011 were considered for inclusion.
Methodological quality: Two independent reviewers assessed the methodological
quality of each study selected for retrieval using standardised Joanna Briggs Institute
critical appraisal tools.
Data collection: Data were extracted from studies using the standardised data
extraction tools from the Joanna Briggs Institute.
Data synthesis: It was not possible to undertake meta-analysis due to a lack of
homogeneity between studies. Findings are therefore presented in a narrative form.
Results: Eighteen studies were eligible for inclusion in this review. This included 11
quantitative, four qualitative and three mixed methods studies. Violence against ED
nurses occurs frequently and includes episodes of both verbal abuse and physical
violence, with verbal abuse experienced by the majority of participants across all
studies. In addition, many episodes are not reported due to a perceived lack of
follow-up by management. Antecedents and risk factors include patient, staff and
organisational related issues. The effects of violence on nurses can be long lasting
and can affect the quality of patient care provided. It is difficult to define the impact
of preventative and control measures; however security and training are typically
used.
Page 52

Conclusions: Due to limitations in the studies the results of this systematic review do
not support the development of best practice guidelines on the topic; due to the
strength (grading) of the evidence. However the results of this review should be
considered as an information source in the development of healthcare organisational
policies and practices. These results call into question the effectiveness of policies
such as Zero Tolerance and the ability of hospitals to provide as safe working
environment as required under Workplace Health and Safety legislation. Employers
should ensure that prevention strategies are adequate and given that the impact of
patient-related violence on ED nurses can be long-lasting in nature, provide support
and follow up for those affected. ED nurses report being fearful and feeling unsafe at
work and with patient-related violence perceived to be increasing in frequency and
intensity, and ongoing research in this area is essential. The use of prospective
studies with large sample sizes will help to provide a more accurate understanding
of the phenomenon and provide an impetus for change in attitude from healthcare
employers and government.
Keywords: emergency department; violence; nurse, patients.
Page 53

2.2 Background
The healthcare industry has been identified as one of the most violent workplace
sectors (Perrone, 1999), with EDs ranked as one of the highest-risk areas for such
violence (Lau et al., 2004). Patient related aggression and violence have been
identified as common behaviours in the modern ED (Ryan & Maguire, 2006). Within
this context, nurses have been identified as the occupation at most risk of patient-
related violence, with between 60 and 90% of nurses reporting exposure to verbal
and physical violence (Lau et al., 2004). ED nurses have been identified as having the
most stressful workplace setting of all nurses (Donnelly, 2006) and are exposed to a
disproportionate amount of violence (Holleran, 2006). High levels of verbal abuse
and threatening behaviour are reported (Winstanley & Whittington, 2004), with up to
90% of ED nurses having experienced physical violence at some point in their careers
and all have reported experiencing verbal abuse (Kennedy, 2005).
The term violence encompasses a wide range of behaviours (Lyneham, 2000), from
physical assault or direct violence to non-physical forms of violence such as verbal
abuse and sexual harassment (Gerberich et al., 2004). Studies have reported that up
to 20% of nurses have experienced intimidation, harassment or assault of a sexual
nature (Ryan & Maguire, 2006). Evidence suggests that the term “violence “is
frequently used by nurses as a broad term to describe everything from witnessing
verbal abuse through to being a victim of physical assault (Ferns, 2005a).
Patients are consistently identified in the literature as being the most common source
of violence against nurses (Lyneham, 2000), responsible for up to 89% of cases
(McKinnon & Cross, 2008). Other sources of violence include friends and relatives
accompanying patients and horizontal violence from other staff members (Ryan &
Maguire, 2006).
Page 54

Verbal abuse has been identified as the most common form of abuse experienced by
nurses (Farrell et al., 2006) and has been labelled a global phenomenon (Ferns,
2005b). It includes rudeness, shouting, sarcasm, swearing, unjustified criticism,
ridicule in front of others, threat of personal harm to the person, their family or
property, rumour mongering (Farrell et al., 2006) as well as sexual innuendo (Crilly
et al., 2004). Of these behaviours, swearing has been identified as the most common
form of verbal abuse (Crilly et al., 2004), and includes both face-to-face and telephone
abuse (Jackson et al., 2002).
Physical violence is frequently preceded by verbal violence, and it may constitute a
warning sign for potential or impending physical violence (Lau et al., 2004). It has
been defined as any intentional physical contact, actual or threatened, and may or
may not result in an injury to the victim (Jones & Lyneham, 2000). It can also include
overt behaviour designed to intimidate or threaten, for example punching a wall or
throwing furniture (Winstanley & Whittington, 2004),. The ready availability of, and
easy access to hospital equipment has resulted in objects such as scissors, syringes,
needles and stretcher poles being used as weapons against nurses (Ferns, 2005b).
Violence and assault against nurses is reported to be on the increase (Jackson et al.,
2002) however it is widely acknowledged that the true level is unknown due to
chronic under-reporting of violent incidents (Pich et al., 2011) in Australia and
internationally (Ryan & Maguire, 2006). Estimations of under-reporting range from
20% up to 90% (Lyneham, 2000) (Jones & Lyneham, 2000) (Phillips, 2007) (Mayhew &
Chappell, 2005), and are referred to as the “dark figure” of workplace violence
(Farrell et al., 2006). A culture of silence is said to exist (Lyneham, 2000), meaning
that accurate statistical analysis of the incidence and prevalence of violence has
become impossible (Ryan & Maguire, 2006). Reasons cited for failure to report a
violent incident include insufficient time; a feeling of resignation that no benefit will
come from the process, lack of appropriate support and feedback, the belief that such
Page 55

violence is part of the job (Lyneham, 2000); fear of reprimand and lack of knowledge
about reporting procedures (Crilly et al., 2004). The overall findings indicate that
nurses feel unsupported by management in relation to workplace violence (Jackson
et al., 2002).
Nurses in EDs in particular have been identified as significantly under-reporting
violent incidents, a fact thought to be related to the high levels of violence endemic in
these areas (Holleran, 2006). These high levels of violence have resulted in a
desensitization on the part of many nurses to the point where violence has become
an expected and accepted part of their job (Benveniste et al., 2005). Verbal and
physical abuse are regarded as occupational hazards (McKinnon & Cross, 2008) and
there is a rationalisation on the part of many nurses that such violence is unavoidable
(Ray, 2007).
The types of injuries sustained by nurses as a direct consequence of violent
behaviour from patients range from minor, for example scratches, to major including
fractures and loss of consciousness (McKinnon & Cross, 2008), up to extreme cases
where nurses have been stabbed and even killed (Lynch et al., 2003). Australian
figures for the period 2000 to 2002 reported 3,621 incidents involving patients and
physical violence or violent verbal exchanges against health care staff, and in 5% of
these incidents staff were injured (Benveniste et al., 2005).
Even in the absence of physical injury, nurses have been found to experience
moderate to severe psychological reactions for up to 12 months following an episode
of violence (Gerberich et al., 2004). Exposure to violence has been linked to long-term
psychological effects, including Post-traumatic Stress Disorder and burnout
(Camerino et al., 2008). Despite the seriousness of the consequences, informal
discussion or debriefing with colleagues was the most common coping mechanism
referred to in the literature (Astrom et al., 2004).
Page 56

Emotional effects reported in the literature include feelings of guilt, self-doubt,
feelings of professional incompetence (Arnetz & Arnetz, 2001); anger, powerlessness,
unhappiness, degradation, shame, fear, astonishment, antipathy towards the
perpetrator (Astrom et al., 2004); and sleeplessness (Jackson et al., 2002). Nurses have
reported feeling more cautious and deriving less satisfaction from their patient-
related care as well as being fearful at work. This fear and caution can result in low
morale and lead to a situation where patients are avoided (Arnetz & Arnetz, 2001).
Studies have identified a negative correlation between violence experienced by
health care staff and patient-related quality of care (Arnetz & Arnetz, 2001).
The health system is faced with increased costs in terms of sick leave, decreased
productivity and staff turnover and attrition, and workers compensation payments
due to injuries resulting from patient-related violence (Jackson et al., 2002).
Quantifying the cost of patient-related violence is difficult as it includes intangible
outcomes such as loss of morale, difficulties with retention and recruitment of staff,
impact on patient care and therapeutic relationships and negative public relations
which are difficult to measure in monetary terms (Hunter & Carmel, 1992).
2.3 Definitions
For the purpose of this review, the following definitions of terms were used:-
Violence: includes a range of behaviours from non-physical behaviours and verbal
abuse through to overt acts of physical violence.
Patient-related: patients presenting to the ED, including the parents of paediatric
patients. Whilst groups other than patients were not the focus of the review, for
example relatives, some incidental results have been included.
Nurses: all classifications of nurses were considered in this review.
Page 57
Emergency Department: refers to the department in a hospital that is staffed and
equipped to provide rapid and varied emergency care, especially for those who are
have suffered trauma or sudden and acute illness. For the purposes of this review the
term Emergency Department was used, however it can be used interchangeably with
Accident and Emergency, and Emergency Service.
2.4 Objectives
The objectives of this review were to identify, appraise and synthesise the best
available evidence on the impact of patient-related violence against nurses working
in EDs.
Inclusion criteria:-
Types of participants
The quantitative and qualitative components of this review considered studies that
included ED nurses of all classifications.
Types of intervention(s)/phenomena of interest
The quantitative and qualitative components of this review considered studies that
evaluated ED nurses’ experiences with patient-related violence.
Types of studies
The qualitative component of the review considered studies that focused on
qualitative data including, but not limited to, designs such as phenomenology,
grounded theory, ethnography, action research and feminist research.
Only primary research was included for the purpose of this review. In the absence of
research studies, other texts such as opinion papers and reports were not considered.
Page 58

Types of outcomes
The review considered studies that included the following outcome measures: -
• Frequency of episodes of violence;
• The types of violence – physical and verbal;
• Organisational reporting of episodes of violence;
• Antecedents and risk factors;
• Impact and sequelae of violence: psychological and physical effects;
• Prevention and control measures to manage episodes of violence.
2.5 Search strategy
The search strategy aims to find both published and unpublished studies. A three-
step search strategy will be utilised in this review. An initial limited search of
MEDLINE and CINAHL will be undertaken followed by analysis of the text words
contained in the title and abstract, and of the index terms used to describe article. A
second search using all identified keywords and index terms will then be undertaken
across all included databases. Thirdly, the reference list of all identified reports and
articles will be searched for additional studies. Studies published in English will be
considered for inclusion in this review. Studies published between January 2001 and
December 2011 will be considered for inclusion in this review.
The databases to be searched include:
• CINAHL
• MEDLINE
• Mosby’s Index
• Scopus
• Cochrane Central Register of Controlled Trials (CENTRAL).
• Google Scholar
• MedNar.
Page 59

The following keywords will be used in the search strategy:
• Emergency Department or ED or Emergency Service;
• Accident and Emergency or A & E or Triage;
• Violence or Aggression or Assault or Abuse;
• Patient or Patient-Related or Client;
• Nurs*.
Please see Appendix A for full details of the search strategy.
2.6 Method of the review
Quantitative papers selected for retrieval will be assessed by two independent
reviewers for methodological validity prior to inclusion in the review using
standardised critical appraisal instruments from the Joanna Briggs Institute
MetaAnalysis of Statistics Assessment and Review Instrument (JBI-MAStARI)
(Appendix B). Any disagreements that arise between the reviewers will be resolved
through discussion, or with a third reviewer.
Qualitative papers selected for retrieval will be assessed by two independent
reviewers for methodological validity prior to inclusion in the review using
standardised critical appraisal instruments from the Joanna Briggs Institute
Qualitative Assessment and Review Instrument (JBI-QARI) (Appendix B). Any
disagreements that arise between the reviewers will be resolved through discussion,
or with a third reviewer.
2.6.1 Data collection
Quantitative data will be extracted from papers included in the review using the
standardised data extraction tool from JBI-MAStARI. The data extracted will include
specific details about the interventions, populations, study methods and outcomes of
significance to the review question and specific objectives.
Page 60

Qualitative data will be extracted from papers included in the review using the
standardised data extraction tool from JBI-QARI. The data extracted will include
specific details about the interventions, populations, study methods and outcomes of
significance to the review question and specific objectives.
2.6.2 Data synthesis
Qualitative research findings will, where possible be pooled using JBI-QARI. This
will involve the aggregation or synthesis of findings to generate a set of statements
that represent that aggregation, through assembling the findings rated according to
their quality, and categorising these findings on the basis of similarity in meaning.
These categories are then subjected to a meta-synthesis in order to produce a single
comprehensive set of synthesised findings that can be used as a basis for evidence-
based practice. Where textual pooling is not possible the findings will be presented in
narrative form.
2.7 Results
The initial search strategy identified 10,297 papers, of which 55 were deemed
potentially relevant to this review, based on the assessment of title and abstracts.
After removal of duplicates and detailed examination, full text papers were retrieved
for the remaining 33 studies. One paper was identified through hand searching of
reference lists of these papers. After analysis of methodological quality 20 papers
were included for data extraction and analysis of results. Details of the studies
excluded from the review following methodological assessment with reasons for
exclusion are provided in Appendix C. The details of the selection process are
presented in Figure 1. There were 18 papers remaining that were included in this
review.
Page 61

Figure 1: Study selection flow diagram
(n=)
Papers excluded after review of full paper
(n=14)
Papers included in systematic review
(n= 18)
Papers excluded after evaluation of abstract
(n= 22)
Paper assessed for methodological quality
(n= 20)
Papers retrieved for detailed examination
(n = 33)
Abstracts retrieved for examination
(n= 55)
Potentially relevant papers identified by literature search
(n= 10,297)
Papers retrieved from hand searching of reference lists
(n = 1)
Paper excluded following methodological assessment
(n = 2)
Page 62

2.7.1 Description of included studies
Appendices D, E and F provide tables of the included studies that reported the
impact of patient-related violence on nurses working in EDs. A total of 18 papers
were included in the review, consisting of 11 quantitative, 4 qualitative and 3 mixed
method studies as detailed below.
The quantitative papers included in the study were: -
(Atawneh et al., 2003; Ayranci, 2005; Crilly et al., 2004; Esmaeilpour, Salsali, &
Ahmadi, 2011; Gacki-Smith et al., 2009; Gates et al., 2011b; Gates et al., 2006;
Kansagra et al., 2008; Lee, 2001; Pinar & Ucmak, 2011; Senuzun Ergun &
Karadakovan, 2005).
The four qualitative papers included were: -
(Catlette, 2005; Early & Hubbert, 2006; Gates et al., 2011a; Pich et al., 2011)
The three studies that utilised a mixed –methods approach were: -
(Gillespie et al., 2010; Luck et al., 2007, 2008).
The studies were drawn from six countries as detailed in Table 2 below.
Table 2: Country of origin of included studies
Country of origin Number of included studies
United States 8
Australia 4
Turkey 3
Iran 1
Kuwait 1
New Zealand 1
Page 63

2.7.1.2 Methodological quality of included studies
Of the 11 quantitative studies that utilised a questionnaire, five provided details of
the validity and reliability of their instruments, such as Cronbach’s alpha or test–re-
test scores (Atawneh et al., 2003; Crilly et al., 2004; Esmaeilpour et al., 2011; Kansagra
et al., 2008; Pinar & Ucmak, 2011). The remaining papers provided such details on
some aspects of their survey tool (Gacki-Smith et al., 2009; Gates et al., 2011b) or did
not provide any details (Ayranci, 2005; Gates et al., 2006; Lee, 2001; Senuzun Ergun &
Karadakovan, 2005).
2.7.1.3 Factors and Outcomes reported
The main measures reported in the quantitative studies included: -
• Frequency of episodes of violence;
• The types of violence – physical and verbal;
• Antecedents and risk factors – including perpetrators of violence;
• Impact and sequelae of violence: including personal and professional effects of
violence on ED nurses such as flashbacks, sleeplessness, nightmares, depression,
fearfulness, time taken off work and severity of violence.
The qualitative papers reported measures such as: -
• Impact and sequelae of violence : including injuries and lost workdays due to
physical assaults;
• Antecedents and risk factors;
• Prevention and control measures to manage episodes of violence, including
coping mechanisms;
• Organisational reporting of episodes of violence.
The mixed-methods studies reported their data using the following measures: -
Page 64

• Antecedents and risk factors – including perpetrators of violence and predictive
behaviours;
• The types of violence – physical and verbal;
• Impact and sequelae of violence, including personal and professional effects.
2.8 Results of the reviews
Due to the range of methods employed by the studies and the wide variation in the
evaluation of the factors and outcomes of interest the results in this review are
organised by study design.
2.8.1 Quantitative studies on violence in the Emergency Department
2.8.1.1 Violence against nurses in hospitals: prevalence and effects (Atawneh et
al., 2003).
The authors conducted a cross-sectional study to determine the degree and effects of
violence among ED nurses (n = 81) at a Kuwaiti hospital. Factors and outcomes
related to violence were evaluated using three questionnaires developed by the
researchers. The author’s used a 12-item frequency-weighted questionnaire that they
had developed and validated in an earlier study to measure rates, frequency, and
severity of violence. The researchers used data from the Income Data Services Study
(Income Data Services, 1990) to develop a five-item, duration-weighted questionnaire
that was used to measure the effects of violence at work. The items in the instrument
measured: reliving the experience (flashbacks), sleeplessness, depression, fearfulness
and time taken off work. The last instrument assessed the views of nurses on
violence including training, hospital policies regarding reporting and management of
offenders following aggressive incidents. The reliability of the questionnaire was
tested using Cronbach’s alpha, which yielded reliability coefficients, based on six
items, of alpha = 0.8730 and standardised item alpha = 0.8728.
Page 65

A total of 81 of the targeted 86 ED nurses completed the questionnaire, a response
rate of 94%; however the authors do not provide any demographic details of their
sample. Of these, 70 (86%) reported having experienced some form of violent episode
with 719 incidents noted, with a mean of 3.3 (standard deviation 1.2); of these 679
were classified as mild and 40 as moderate. The authors used a list of 12 responses
which were subsequently categorised as mild, moderate or severe violence. It should
be noted that this was not a conclusive list and opened up the possibility of types of
episodes being missed, for example “threatened to hit” and “threatened with a
knife/gun” are included but no mention is made of other types of threats such as
threats to career, to harm family, to destroy property, or to rape nurses. All nurses
surveyed reported experiencing verbal abuse and 13 (19%) reported moderate acts of
violence, defined by the authors as single acts of physical violence unlikely to result
in serious injury. None of the nurses reported severe levels of violence, defined by
the authors as being attacked with a weapon that was likely to have resulted in a
serious or fatal injury.
The majority of the participants (n = 71, 96%) reported that they had suffered from
after-effects lasting for up to 4 weeks after experiencing violence, with three nurses
experiencing fearfulness for more than 28 days. A statistically significant number of
male nurses experienced more incidents of violence than females and reported that
they suffered from fearfulness, (p < 0.01 and p <0.05 respectively), however it should
be noted that only a small number of males, (n = 16) were included in the sample of
81.
Although only 19% of the nurses had received training to deal with potentially
violent patients, 44% believed that training to deal with potentially violent incidents
in the ED would have been useful. Of the 40 episodes of moderate violence involving
physical attacks only five of the offenders were charged by the police.
Page 66

2.8.1.2 Violence towards health care workers in emergency departments in west
Turkey (Ayranci, 2005)
The author employed a cross sectional design and used a survey to collect data about
episodes of workplace violence with ED staff. The authors claim that a random
sample was selected however they do not provide any details of how this process
took place. A total of 195 staff out of a potential population of 242, from 18 private,
university or public health institutions in Turkey responded to the survey, a response
rate of 81%. The ED staff included nurses (n = 73) and other health care professionals
such as physicians, ward aides and admitting clerks. No details of the survey were
provided and no exact numbers of specific professional groups or demographic
information were reported.
For the purpose of analysis the researchers defined and divided types of violence
into three categories: verbal/emotional abuse, specific threats and physical action
which included overt acts such as slapping and kicking. Participants were asked to
recall experiences of such violence directed at them during the course of work over
the previous year.
Statistical differences were analysed using the Pearson’s chi-squared statistical test
where appropriate, with the level of significance set at 5%. Results were reported as
means and standard deviations for continuous data.
Of the 195 respondents who completed the survey, 72% (n = 141) had experienced
some form of violence in the preceding 12 months. Of these, 70% (n = 98) had
experienced verbal/emotional abuse; 53% (n = 75) specific threats and 9% (n = 12)
physical action. Participants reported that the perpetrators of violence included
patient’s family members or relatives (n = 125, 89%) and patients themselves (n = 73,
52%). Analysis by age groups revealed that participants in the 30–39-year age group
experienced the highest proportion of any type of violence (82.1%, p < 0.05). Nurses
experienced the highest proportion of the different forms of violence (81%) followed
Page 67

by physicians (78%), and almost 56% of nurses reported experiencing specific threats.
Analysis by profession indicated that a higher proportion of nurses (42.4%) and those
suturing/dressing wounds (46%) reported violence from patients (p < 0.05). Although
none of the participants reported major injuries such as lacerations or fractures, half
of those who experienced physical violence received support such as attending the
emergency service and taking days off. Although a higher proportion of women than
men reported experiencing some form of violence, with the exception of specific
threats, differences in the gender and status of emergency health staff were not
statistically significant (p>0.05). This result has cultural significance with the authors
postulating that this may be because violence towards women is more prevalent due
to male dominance in this society.
2.8.1.3 Violence towards emergency department nurses by patients (Crilly et al.,
2004)
The authors used a descriptive, longitudinal cohort study design to determine the
incidence of patient-related violence towards nurses in two EDs in Australia. A
sample of 71 nurses was recruited from a population of 108: a response rate of 66%.
Four instruments were developed to collect data and included a demographic details
form, a brief violence record, data extraction form and a violence questionnaire. All
instruments were tested in a pilot study to ascertain their reliability and face validity.
The demographic details form and Violence Questionnaire were adapted from an
earlier study by Murray and Snyder (Murray & Snyder, 1991). Face validity of the
Violence Questionnaire was assessed by a pilot study with 10 ED nurses and test-
retest reliability was established by determining stability over time and the
percentage of agreement between the testers with a result of 91% indicating good
consistency. Inter-rater reliability was established for the Data Extraction Form by
using Pearson’s correlation (r = 0.96) which was statistically significant p<0.001. For
the patient’s triage category inter-rater reliability of nursing triage was established
using Kendall’s tau-b (0.86) which was statistically significant (p = 0.01).
Page 68
A brief violence record was completed by participants after each episode of violence
and these forms were collected weekly by the researchers. Those nurses who had
been subjected to violence were then issued with a detailed violence questionnaire.
Hospital records were used to determine the total number of presentations to the ED
in the five months of the study.
Fifty nurses (70%) reported 110 episodes of violence in a five-month period,
approximately five per week, or two per 1000 presentations. Patients were identified
as the perpetrators in all of these episodes. Patient specific factors identified included
alcohol intoxication (n = 30, 27%) and substance abuse (n = 27, 25%) and behaviours
associated with mental illness (n = 42, 38%). In addition the nurses reported that
patients often displayed demanding behaviours and requested attention prior to
exhibiting violent behaviour (n = 48, 44%).
Verbal violence was the most common type of violence experienced with a total of 58
(53%) episodes of verbal violence and 29 (26%) of both verbal and physical violence
reported. The most common types of verbal violence experienced were swearing (n =
57, 61%) and yelling (n = 40, 36%), while pushing (n = 11, 10%), hitting (n = 3, 3%),
and kicking (n = 6, 3%) were the most commonly experienced physical behaviours.
Triage was the highest risk area for all types of violence and this violence occurred
most often on evening shifts (n = 41, 37%).
2.8.1.4 Workplace violence against Iranian nurses working in emergency
departments (Esmaeilpour et al., 2011).
The authors used a cross sectional study to sample 196 nurses from 11 Emergency
Departments in teaching hospitals in Tehran, Iran, to determine the frequency and
nature of physical and verbal workplace violence against these nurses using a recall
period of one year. The authors reported a response rate of 95% (n = 186). They
adapted a self-administered questionnaire, previously developed by the
International Council of Nurses, World Health Organization and the Public Services
Page 69

International. This survey was previously validated by the Joint Programme on
Workplace Violence in the Health Sector (Joint Programme on Workplace Violence in
the Health Sector, 2003). While no definition of violence was mentioned in the article,
a review of the original tool does contain a definition from the World Health
Organisation; however it is unclear whether the authors adopted this. This survey
tool was translated into Persian and content and construct validity assessed by five
nursing faculty members before being piloted for clarity, ease of administration and
applicability with 20 nurses. The authors decided to omit questions regarding sexual
and racial harassment due to the scarcity of their occurrence in Iranian EDs; however
no evidence is given to support this decision
Data were analysed using only descriptive and inferential statistics. The chi-squared
test was used to determine the association between nurses’ gender and violent
incidents. While the authors report a statistically significant p-value of <0.05, it
should be noted that only a small number of male nurses participated in the study
with the majority of the sample (89%) identified as female.
Specific demographic details were not provided however the sample was described
as being largely young female nurses with less than five years nursing experience.
Thus the characteristics of the sample may limit the generalisability of the results.
The authors reported the majority of nurses (92%) had experienced verbal abuse in
the preceding year while 20% had experienced physical abuse. Patients’ relatives
were the most common source of such violence. The under-reporting of episodes of
violence was identified, with 85% (n = 152) of participants reporting that no reporting
procedures were available.
2.8.1.5 Violence against nurses working in US emergency departments (Gacki-
Smith et al., 2009).
The authors conducted a cross-sectional study to investigate ED nurses’ experiences
and perceptions of violence from patients and visitors in EDs in the United States. A
Page 70

convenience sample of 3,465 was recruited from a population of approximately
31,905 members of the US Emergency Nurses’ Association (ENA), which
corresponded to a response rate of approximately 11%. The researchers developed a
69-item online survey that collected data about nurses’ personal experiences with
physical violence and verbal abuse in the ED in the preceding three years, and the
policies and procedures of the respondent’s hospital and Emergency Department for
addressing workplace violence. The survey also included items about the
respondent’s beliefs about the precipitating factors of violence and barriers to
reporting violence in the ED. The online survey was developed using Survey Select
Expert (version 5.6) by an ENA work team and the authors’ state that the survey was
evaluated by experts for content validity however they do not provide details of this.
It was then pilot tested on a sample of 15 Emergency Department nurses.
The chi-squared test of association and Fisher exact test were used to compare
independent groups with respect to percentages and the Kruskal-Wallis and Mann-
Whitney U tests were used to compare independent groups with respect to non-
categorical variables. For all statistical analyses a significance level of 0.05 was used
and data presented as a mean with standard deviation.
Results indicated more than 50% of respondents had experienced physical violence
which included being spat on, hit, pushed/shoved, scratched and kicked. Verbal
abuse such as being yelled/cursed at, intimidated and harassed with sexual
language/innuendo was reported by 70% of the respondents. One third of
participants reported having considered leaving their Emergency Department or
emergency nursing because of violence.
Twenty-three per cent (23%, n = 811) of respondents had experienced a high
frequency of physical violence (> 20 times) from patients/visitors in the Emergency
Department during the past three years. About 20% (n = 604) of respondents reported
experiencing a high frequency of verbal abuse (> 200 times) from patients/visitors
during the same period. Nurses who worked night shift and weekends were more
Page 71
likely to experience frequent physical and verbal violence. Participants identified a
number of barriers to reporting violent episodes which included; the perception that
reporting episodes might have a negative effect on customer service; ambiguous
reporting policies; fear of retaliation from management, hospital administration,
nursing staff, or physicians; the perception that reporting episodes of violence was a
sign of incompetence or weakness; lack of physical injury to staff; the attitude that
violence comes with the job; and a lack of support from administration/
management. These barriers were associated with an increased risk of experiencing
violence in the ED. Nurses who felt that there were no barriers to reporting ED
violent incidents were much less likely to have experienced frequent ED physical
violence than were other nurses: 15.4% versus 28.5% (p<0.001).
The main factors reported as precipitants of ED violence included: alcohol
intoxication; substance misuse; care of psychiatric patients in the ED; crowding/high
patient volume and prolonged wait times.
2.8.1.6 Violence against nurses and its impact on stress and productivity (Gates et
al., 2011b).
The authors undertook a cross-sectional study to collect data on workplace violence
experienced by ED nurses in the United States. A survey was sent to a randomly
selected sample of 3,000 members of the Emergency Nurses’ Association and 230
participants returned the survey: a response rate of only 9%. The survey was
composed of four separate sections. The first section asked the participants to
describe in narrative a single recent episode of workplace violence that caused them
the most stress. The second section consisted of 22 Likert-type items based on the
Impact of Events Scale-Revised (Weiss & Marmar, 1997). This set of items evaluated
the presence and magnitude of post-traumatic stress symptoms during the seven
days after a traumatic event, however it should be noted that in this study no limit
was set on when this event initially occurred which creates the potential for recall
Page 72

bias and inconsistencies between results due to variations in time elapsed since the
event occurred. The authors reported that the Impact of Events Scale-Revised has
high internal consistency ratings (0.79-0.91) and strong sensitivity (74.5) and
specificity (63.1).
The third section consisted of a 29-item Healthcare Productivity Survey. The
instrument was developed and validated by the researchers in a previous study
(Gillespie et al., 2010) to measure the perceived change in work productivity after
exposure to a stressful event. Internal consistency reliability and test-retest reliability
of the scale was reported as (0.871 - 0.945) and (r = 0.801, p < 0.001) respectively with a
sample of emergency nurses (Gillespie et al., 2010). The last section included
demographic questions regarding their age, gender, race, education, care population,
the geographic location of their ED, and whether their employer provides violence
prevention training or critical incident stress debriefing.
The results confirmed that workplace violence was a significant problem for those
ED nurses who participated in the study and was associated with experiences of
distress, decreased work productivity, and reduced quality of nursing practice.
Thirty seven per cent (n=82) of the respondents had a negative total productivity
score on the Healthcare Productivity Survey demonstrating decreased performance
after a violent event. The mean score on the Impact of Event Scale-Revised group was
18.67, (range 0-83) indicating presence of at least one stress symptom after a violent
event. There was a correlation reported between the total Healthcare Productivity
Survey and Impact of Event Scale- Revised scores, however this was not statistically
significant (p = 0.07).
The prevalence of study participants with post-traumatic stress symptoms during the
seven days was considered clinically significant, with 17% of participants having
scores high enough for a probable diagnosis of Post-Traumatic Stress Disorder and
15% with scores associated with suppressed immune system functioning.
Page 73

2.8.1.7 Violence against emergency department workers (Gates et al., 2006).
The authors used a cross sectional design to measure the violence experienced by ED
workers from patients and visitors in five hospitals in the United States. A recall
period of six months was used in an attempt to reduce the potential for recall bias. A
sample of 242 ED workers was recruited from a target population of approximately
600 workers, which resulted in a response rate of 40%. Nurses comprised the largest
professional group with 95 participants (39%) followed by physicians (n = 49, 20%),
patient care assistants (n = 27, 11%), and another six from professional and ancillary
groups of staff. A survey consisting of a combination of multiple choice, open-ended,
and Likert-type items was developed by the authors to collect data from participants;
however the survey tool was not validated.
The term “violence” was defined by the authors and for the purposes of the survey,
classified as: verbal harassment, sexual harassment, verbal threats or physical
assaults. Data about demographics, previous violence prevention education; and
frequency of physical and non-physical violent acts in the preceding six months were
collected. Other survey items measured injuries and lost workdays due to physical
assaults, frequency of reporting assaults, and variables related to the assaults. Likert-
type items were used to measure participants’ feelings of safety and levels of
satisfaction with their job, the ED, the hospital, and security.
Data were analysed using descriptive statistics. Verbal harassment by patients was
reported by 98% of the nurses surveyed (n = 93) which was the highest result for
hospital staff. Incidents of verbal threats from patients were highest for physicians (n
= 41, 83%) followed by nurses (n = 74, 78%), though nurses experienced the greatest
percentage of verbal threats from visitors (67%). Forty Four percent of nurses
reported experiencing at least one incident of sexual harassment from patients (n =
42).
Page 74

During the study period there were 319 episodes of physical violence initiated by
patients and at least 10 by visitors. Nurses were the professional group most
frequently targeted, experiencing 67% of the 319 episodes of physical violence. Those
who worked in the psychiatric ED reported the highest frequency of being assaulted:
seven or more times by a patient (11%). Nurses (8%) were also recipients of the most
episodes of physical violence by visitors. Thirty-two injuries were reported during
the study period including bruises, bites, abrasions, and scratches. Of the 115
participants who reported experiencing at least one assault by a patient, 65% had
never reported the incident in their organisation.
Antecedents reported included patient and visitor factors, such as alcohol and drug
use, psychiatric diseases, dementia and an inability to deal with a crisis situation.
Staff factors included lack of adequate staff, lack of knowledge about a patient’s
previous history of violence and lack of violence prevention training. Hospital and
environmental factors perceived to be significant included long waiting times for
patients, lack of security or police presence and environmental design of the
department.
The authors suggested that it was imperative to increase efforts aimed at decreasing
the incidence of violence and to ensure that any form of violence is neither accepted
nor tolerated in any healthcare setting. The study was based on self-reported data;
however the authors surveyed the previous six month period to reduce the risk of
recall bias associated with this type of data collection. In addition the anonymous
nature of the survey meant that there was no way to compare the characteristics of
respondents with those of non-respondents.
2.8.1.8 A survey of workplace violence across 65 U.S. emergency departments
(Kansagra et al., 2008).
The authors analysed data from a nationwide survey across 65 sites in the USA. Data
were obtained from the National Emergency Department Safety Study (NEDSS)
Page 75
which examined clinical processes and systemic factors contributing to patient safety
in hospital EDs across a five year time period. A sample of 3,518 health professionals
was recruited from a population of 5,695: resulting in a response rate of 62%. Of these
1,837 were nurses (52% of respondents), 1,395 medical officers, 88 physician’s
assistants and 169 participants were classified as “other” staff. To develop the survey
the researchers revised a previously developed instrument. To further refine the
survey data were obtained from in-depth personal interviews with key informants
and focus groups conducted across three EDs, including cognitive testing.
Psychometric testing was then conducted at 10 EDs and data from these sites were
used to determine the final set of questions prior to its distribution to participants
(Sullivan et al., 2007).
Outcome measures identified included the number of physical attacks against staff;
the frequency of guns and knives in the ED and staff perceptions of safety.
Multivariate analyses were conducted to determine which respondent and ED
characteristics were associated with the perception of safety and which ED
characteristics were associated with increased frequency of attacks and weapons.
Linear and logistic regression modelling was also employed to assess relationships
between outcome measures and independent variables from the survey.
A total of 3,461 physical attacks were reported over the five year period with a mean
of 11 attacks per ED. Nurses were five times less likely to feel safe “most of the time”
or “always” compared to the other professional groups (odds ratio OR = 0.21; 95%,
CI = (0.16) to (0.28), p<0.0001). Nurses who had worked for more than five years felt
less safe than those who had worked shorter periods of time. The authors report that
the frequency of weapons, number of attacks, presence of metal detectors and
violence training were not statistically significant predictors of staff feeling safe most
of the time or always.
Less than 15% of the EDs had metal detectors and EDs with metal detectors reported
a higher number of physical attacks and were more likely to have weapons brought
Page 76

to the ED on a daily basis (odds ratio = 26.3, 95%, CI = (2.0) to (339), p=0.001).
However this could be attributed to the fact that more weapons were detectable due
to the presence of the metal detectors rather than the fact that more weapons were
present. Less than half of the EDs had some type of training program for staff and
staff who worked in EDs where such training was available, reported a higher
perception of safety than those without it, however this finding was of borderline
statistical significance (p<0.06).
The authors report that the majority of EDs that participated in the study were in
large, academic hospitals that may have different violence rates than other EDs. In
addition the authors’ state that their sample may not be representative of the United
States, with one-third of EDs withdrawing from the study and EDs in the Northwest
of the country over-represented. The presence of confounding factors was
acknowledged, for example the definition of what constituted an attack against staff
was not standardised and therefore different interpretations may have occurred.
Similarly reporting mechanisms were not standardised and the presence of metal
detectors was not uniform and may have caused the number of weapons found or
recovered to vary. The perceptions of feeling safe at work may have been a reflection
of factors not controlled for in the study, for example staffing levels and
organisational response after episodes of violence.
2.8.1.9 Violence in A&E: the role of training and self-efficacy (Lee, 2001).
Lee (2001) employed a cross sectional design using a questionnaire to survey a
sample of 76 ED nurses from a population of 130 at two study sites: a response rate of
58% about their experiences in the preceding three months. No details were included
about validation of the survey instrument. In addition the study employed The
Difficult Behaviour Self-Efficacy Scale (DBSES) and respondents were asked to rate
their self-efficacy in dealing with aggression (Hastings & Brown, 2002). This scale
was previously validated by the authors and confirmed in testing by the researchers;
Page 77

Cronbach’s alpha yielded an internal consistency measure of 0.88, indicating good
internal consistency of scale items.
Factors and outcomes measured were types of violence; the frequency of violent
episodes and the type and amount of aggression management training. No definition
of the term “violence” was provided to participants, however verbal and physical
violence were differentiated in the results. Self-efficacy was defined as an
individual’s belief that they can succeed at a given task or behaviour.
Ninety six percent of the nurses (n = 73) had experienced verbal abuse and 79% (n =
60) physical violence in the preceding three months. The mean level of self-efficacy
perceived by the participants was average; however there is no definition of this
score provided to explain this. The relationships between categorical and interval
demographic variables and self-efficacy in managing violent behaviour were
analysed using independent t-tests. Higher levels of self-efficacy were associated
with having experienced higher levels of verbal aggression in the study period (t =
2.77, df = 74, p<0.01) and being a manager (t = 3.08, df = 69, p<0.01).
The authors described aggression management training regimes as sporadic and
fragmented with a lack of consistency between trainers, and an absence of any type
of refresher programs: this was in spite of the mandatory nature of the training. Only
two nurses specifically described being taught verbal de-escalation techniques.
2.8.1.10 Verbal and physical violence in emergency departments: a survey of
nurses in Istanbul, Turkey (Pinar & Ucmak, 2011).
This cross-sectional Turkish study used a questionnaire to survey ED nurses about
their experiences with violence in the previous 12 months. Two hundred and fifty
five nurses were recruited out of a population of 262: a response rate of 97%. The
survey tool was developed by the researchers and tested on an expert panel of nurses
and their suggestions incorporated into the final version to facilitate face validity. In
addition to this survey the authors used the Attitudes Towards Patient Physical
Page 78

Assaults Questionnaire devised by Poster and Ryan (1989), and previously validated
by them(Poster & Ryan, 1989).
Outcome measures for the study included the frequency of episodes; the source of
violence and days of sick leave taken as a consequence of violence. Descriptive
results were reported including percentages and raw values. Ninety one percent of
nurses surveyed (n = 233) had experienced verbal abuse and 75 % (n = 191) physical
violence with a range of one to five episodes in the preceding year. The perpetrators
were most commonly patients’ relatives and friends, responsible for 32% (n = 74) of
verbal violence and 62% (n = 119) of physical violence. Patients’ relatives and friends
and patients acting together were responsible for 63% (n = 146) of verbal violence and
23% (n = 44) of physical violence. Patients acting alone were identified as the
perpetrators in 6% (n = 13) of episodes of verbal violence and 15% (n = 28) of physical
violence. Family and friends involved in episodes of violence were typically males,
responsible for 77% (n = 57) of verbal abuse and 79% (n = 94) of physical abuse and
this was postulated by the authors to be related to the dominant role played by males
in Turkish society.
Under-reporting was common with 80% of respondents overall choosing not to
report episodes of verbal and physical violence. Reasons cited included
dissatisfaction with responses given by administration to episodes of violence, such
as no noticeable follow-up conducted; apathy; fear of losing their job; fear of being
blamed and fear of legal procedures that would follow such a report. Those nurses
who did report were dissatisfied with the handling of the episode and in 36% of
cases of verbal abuse and 42% of physical violence no response was given to the
nurse.
The authors report that while over half of nurses who had been exposed to violence
felt anxiety about being the subject of another violence incident, the rate of those
taking sick leave was only 3%. The authors postulate that this could be because of
traditional attitudes and cultural values. The authors reported that In Turkey
Page 79

unequal gender-power relations associated with discrimination mean that women
are especially vulnerable to violence. In Turkey nursing is a profession traditionally
practiced by women and this was reflected by the participants in this study who
were all female. Violence against women, whether nurses or not, is generally treated
as a private matter. Thus, violence of all types against women remains largely
unreported. The legal system is another obstacle for the victims of violence.
According to Turkish law for legal proceedings to commence a report must be made
to hospital police and then to the local police centre. The nurses must then submit to
a full body examination and blood sampling to determine if there are any alcohol or
drug abuse issues. The brief is then delivered to a public prosecutor who attempts to
mediate the dispute prior to going to court. The case is often closed if a perpetrator
denies the charges and even where cases are successful punishment is weak or non-
existent. Only one case of physical violence resulted in legal proceedings being
initiated against the perpetrator.
Support was received from physicians (33%) and colleagues (40%) in the ED rather
than through more formal mechanisms such as administration. Only three percent of
nurses took sick leave as a result of an episode of violence, this was consistent for
verbal (n = 7) and physical abuse (n = 6). Once a nurse takes sick leave legal
proceedings are initiated and so the authors report that many nurses do not take sick
leave for this reason. The majority of nurses (n = 211, 83%) had not undertaken any
training to assist them in prevention and management of episodes of violence. Only
19 nurses (7.5%) felt safe most of the time while working in the ED. Sixty five percent
of respondents (n = 166) stated that they never felt safe in the ED while 28% (n = 70)
felt safe only some of the time. Ninety percent of nurses expected patients and their
relatives to exhibit violence towards staff.
Page 80

2.8.1.11 Violence towards nursing staff in emergency departments in one Turkish
city (Senuzun Ergun & Karadakovan, 2005).
The authors used a descriptive cross sectional study to determine the incidence and
attitudes towards violence faced by nurses in EDs in four major hospitals in Turkey.
Data were collected using a 34-item questionnaire developed by the authors that
collected socio-demographic data and information about their experiences of
violence from patients. No details on the validity of the survey were provided by the
authors. The recall period used was not defined and results were discussed in terms
of “violence experienced throughout the career in the ED”, which creates issues in
terms of recall bias and the ability to compare individual results. A definition for the
term “violence’ was not provided, however results were discussed in terms of verbal
and physical violence.
A sample of 66 was recruited from a population of 92 ED nurses: a response rate of
72%. Analyses were conducted using ANOVA, Post Hoc Tukey and Student’s t-tests
where appropriate. Findings were accepted as statistically significant where the p-
value was <0.05. Statistical analysis of the results indicated that nearly all of the
respondents had experienced verbal violence (n = 65, 99%). Over half of the
participants reported experiencing episodes of verbal violence more than 15 times in
their professional careers (n = 35, 54%). Most of these episodes were reported to have
occurred in the last three months (n = 52, 80%), and the authors go on to say this
“probably meant that this kind of violence occurred frequently in the ED setting”
(p156), however they provide no justification for this statement. Physical violence was
experienced by 20% of the respondents (n = 13).
Most episodes of violence occurred during the night shift, and patients’ relatives or
friends were the most common perpetrators of both verbal (n = 42, 65%) and physical
violence (n = 11, 85%) rather than the patients themselves. There was a significant
relationship between the age and years of experience of nurses and the frequency of
violence. A Post Hoc Tukey test revealed that as age and years of experience
Page 81
increased the relative number of episodes of verbal and physical violence also
increased.
Continuing education concerning the prevention and management of violent
behaviour in the ED setting was considered to be necessary by 91% of the nurses.
Taking legal action after experiencing episodes of violence was considered to be
ethical by 91% of the participants.
2.8.2 Mixed-methods studies about violence in the Emergency
Department
2.8.2.1 Violence against healthcare workers in a pediatric Emergency Department
(Gillespie et al., 2010)
The authors utilised a multiple case study approach to describe work place violence
perpetrated by patients and visitors against nurses, physicians and allied health
workers in a large urban paediatric teaching hospital in the United States. A
purposeful sample of 31 ED workers was recruited from a population of nearly 200
healthcare workers, a response rate of approximately 16%. Of these 12 (39%) were
nurses, eight (26%) physicians and 11 (35%) other allied health personnel. Data were
collected using a combination of semi structured interviews, non-participant
observation, digital photographs and archival records. The latter included policy
documents and guidelines as well as educational material provided by the hospital.
The interviews focused on participants’ worst experiences with violence in the
preceding six months. Forty hours of non-participant observations were conducted
on workers, patients and visitors in the ED, in four, 10 hour blocks. Digital
photographs were taken of physical artefacts during these observation periods and
included the physical environment where episodes of violence occurred; as well as
objects identified as important during the observation by researchers and during the
interviews by participants. The outcome measures of interest were the perpetrators
Page 82

of violence; types of violence, precipitants and the personal and professional effects
on ED staff.
Transcripts were analysed using a modified version of the constant comparison
method as described by Lincoln and Guba, (Lincoln & Guba, 1985). This involved a
three stage approach that was conducted independently by two of the authors. Data
were categorised and any disagreements between the researchers resolved by
discussion. Finally method triangulation of the data was conducted with comparison
to the field notes and archival data. In addition debriefing and an audit trail were
performed to enhance rigour in the study.
The authors reported that in cases of verbal abuse, family members were the most
likely source (82%) whilst episodes of physical violence were more likely to be
perpetrated by paediatric patients (76%). A mental health diagnosis was reported in
14 of the 16 episodes of patient-initiated violence reported. Verbal abuse included
yelling, cursing and threatening workers with physical harm as well as invading a
worker’s personal space and the use of symbolic violence, for example pointing a
finger at a worker or blocking their exit.
Precipitants or antecedents included factors specific to workers, patients and the ED
itself. Less experienced workers were thought to be at an increased risk of
experiencing episodes of violence while patients with a mental health diagnosis were
identified as significant, especially scheduled patients not permitted to leave the
department. High risk family members were identified as those with a lack of respect
for women or persons in positions of authority; those under the influence of alcohol
or illicit substances and those who perceived that the needs of the patient were not
being sufficiently addressed. Issues of significance specific to the ED included access
to the department, the presence of multiple visitors per patient and issues related to
volume in the department, for example long waiting times, overcrowding in the
waiting room, noise levels and perpetrators being stared at in public. Overall the
Page 83
belief was expressed that violence in the community was increasing leading to a
greater acceptance of violence as a normal way to express anger.
The effects of this violence on workers included emotions such as fear, anger, and
frustration. Workers reported avoidance of perpetrators and a decrease in
productivity and the ability to focus on work. They were also concerned with a
perceived poor image of the hospital by patients and visitors.
2.8.2.2 Innocent or culpable? Meanings that emergency department nurses ascribe
to individual acts of violence (Luck et al., 2008).
Luck, Jackson, and Usher (2008) explored the meanings that ED nurses ascribe to acts
of violence from patients, their family and friends and what impact these meanings
have on how they respond to such acts. The study was conducted in a regional
Australian ED on a convenience sample of 20 ED nurses which represented a
response rate of 37%. This was a two-phase sequential mixed method study. Phase 1
involved 50 hours of unstructured participant observation, unstructured open-ended
interviews with three nurses and researcher journaling. These data were thematically
analysed and the results used to inform development of Phase II of the study. Phase
II involved 290 hours of participant observation, 16 semi-structured open-ended
interviews, 13 unstructured interviews, organisational documents and a researcher
journal. Quantitative data of violent events were generated using a structured
observational guide. The authors report that textual data were analysed thematically
and numeric data were analysed using frequency counts. Rigour was established by
the use of an audit trail by the researchers and member checking of emergent themes
and ideas was undertaken in the field interviews.
Sixteen episodes of violence were observed in the 290 hours of participant
observation and included in the analysis; however none of these episodes were
reported by the nurses involved. The authors assert that the nurses made judgements
Page 84

about specific episodes and these informed and guided their verbal and behavioural
response; their decision to report and their short and long-term emotional response.
The study findings were that episodes perceived to be “within normal limits” on a
continuum of violence were not reported by nurses. ED presentations were perceived
by the participants to be appropriate or inappropriate and so-called legitimate
presentations were afforded greater empathy and tolerance in terms of their
behaviour. These judgements were based on the degree of personalisation of the
violence, the presence of mitigating factors and the reason for the ED presentation.
Mitigating factors were identified as co-morbid or presenting health problems,
including mental health issues, alcohol intoxication, withdrawal, delirium, dementia
and head injuries; and psycho-social issues that decreased a perpetrator’s ability to
react in a rational and informed manner. These could lead to anxiety, confusion and
disorientation and/or a lack of appreciation or understanding regarding resources
and the processes of an ED any of which could precipitate acts of violence.
2.8.2.3 STAMP: components of observable behaviour that indicate potential for
patient violence in emergency departments (Luck et al., 2007).
In another study Luck et al (2007) utilised the data from their earlier study involving
16 observed violent events to identify components of observable behaviour that
could indicate a person’s potential for violence. Five behaviours were grouped
together under the acronym STAMP: staring, tone, agitation, mumbling and pacing,
and a cumulative relationship was noted between them. The authors noted that
where nurses were able to recognise these signs they were able to utilise de-
escalation techniques.
Staring was identified as an important early indicator and includes both glaring,
staring and looking intently as a means of intimidation or the lack of or absence of
eye contact. The avoidance of eye contact was associated with a passive form of
resistance that could escalate in to actual physical violence. This was noted in nine of
Page 85

the 16 encounters. The tone and volume of voice was identified in 13 of the 16
episodes and emerged as an important cue both independently and in conjunction
with other cues. It included yelling or raising of the voice, urgency in speech,
sarcastic or caustic comments, sharp retorts and dismissing or demeaning the nurse
through vocal inflections.
Anxiety was observed in patients and recognised by physical symptoms such as
looking flushed, hyperventilating and speaking rapidly. It was attributed by the
authors to one or more of three broad factors and as anxiety escalated nurses were
seen to intervene. Psycho-social, situational and contextual stressors included a loss
of a sense of control of patients and elements specific to the Ed such as noise and
over-crowding. Patients’ diagnoses and co-morbidities were identified as
exacerbating feelings of anxiety compounding the stressors described previously and
included those that led to symptoms of confusion and disorientation, for example
head injuries, mental health issues, delirium, dementia, intoxication and withdrawal
from alcohol and hyper or hypoglycaemia. Thirteen of the 16 episodes involved
disorientated patients who were not able to be nursed in seclusion. Anxiety was also
associated with a lack of understanding of the ED process and distribution of ED
resources, for example the triage scale.
Mumbling was noted in 11 of the 16 episodes and included comments made just
loudly enough to be heard. It also included slurring and incoherent speech however
this was difficult to distinguish from alcohol intoxication in some cases. It was
perceived by the authors to be a sign of mounting frustration and involved the
asking of repetitive questions and negative and aggressive statements about the
service being received, especially with regards to waiting times. Agitation was most
frequently manifested in pacing, and also included staggering, flailing or swinging of
the arms, resisting interventions by pulling away from the nurse or rejecting
therapeutic interventions.
Page 86
2.8.3 Qualitative papers on violence in the Emergency Department
2.8.3.1 A descriptive study of the perceptions of workplace violence and safety
strategies of nurses working in level I trauma centers (Catlette, 2005).
Catlette (2005) conducted a descriptive study looking at the phenomenon of
workplace violence. A convenience sample of eight nurses who had experienced
violence while on duty was recruited from two level one trauma centres in the
United States and semi-structured interviews used to collect data. For the purposes
of the study violence was defined as “the victimization of an RN practicing in a
hospital setting by another person or persons characterized by fear, physiological or
psychological hardship, or loss” (Catlette, 2005) (p.520). A demographic profile form
and an interview guide designed by the author were used to collect data during the
interviews, and had been developed during a pilot project with five nurses; however
these tools had not been validated. The approach to analysis was based on four main
components namely: bracketing or ethical enquiry, analysing (empirical
examination), intuiting (personal insight) and describing (aesthetics). Verbatim
transcripts of the interviews were used to identify themes emanating from the
collected data. The researcher also kept a journal to minimise bias during the data
collection phase. No other methods to enhance rigour were discussed by the author
and analysis was not verified by an independent researcher. Member checking was
not used and the small sample size means that the results may not be transferable. As
with all self-reported data there is a risk of bias and a possibility that some nurses
may have been reluctant to share all aspects of their experiences and outside factors
may have affected the interview process.
Two major themes emerged from the data: insufficient safety measures and
vulnerability. Issues related to safety measures that were raised by the participants
included easy access to the ED with weapons, despite the presence of metal
detectors, and the lack of training on managing violent situations in the ED. Nurses
Page 87
reported feeling unsafe and vulnerable to violent episodes at work and the strongest
expressions of vulnerability were in relation to psychiatric patients. The participants
reported that episodes of verbal aggression were mostly experienced from family
members whilst patients with psychiatric disorders or under the influence of alcohol
were most likely to display physical violence.
2.8.3.2 Violence in the Emergency Department: A culture care perspective (Early
& Hubbert, 2006).
The authors utilised a phenomenological approach to explore nurses’ perceptions
regarding workplace violence in the ED. Purposeful sampling was used to recruit a
sample of 12 ED nurses, four male and eight female who had experienced some form
of workplace violence from a metropolitan trauma centre in Midwest US. Semi-
structured interviews were used to gather data and data saturation is reported to
have occurred after 12 interviews.
Transcripts were analysed using Leininger’s (1990) four phases of analysis for
qualitative data. However there is incongruence between the use of phenomenology
and the incorporation of findings into an analysis framework, (culture care) and the
methodology appears to be more qualitative and descriptive in nature. There is
minimal description of the process of data analysis and a definition of violence was
not provided to participants. After the analysis member checking was conducted
with key participants for their input and clarification, however no changes were
required as a result of this process. The authors do not specify how many
participants were involved in this process.
The authors identified four subcultures involved with the phenomenon of workplace
violence, namely: ED nurses; administration; clients with violent behaviours, and
clients without violent behaviours.
Three themes were identified: hospital policies were not conducive to supporting a
safe ED environment; ED staff were not valued as being as important to the hospital
Page 88
administration as the hospital’s public image; and anxiety, fear, and negative
emotions due to violence in their work environment have an impact on the quality of
the participants’ nursing practice. A lack of trust of the administration culture was
evident, with participants perceiving that there was a lack of follow-up following
reported episodes of violence. Under-reporting was acknowledged with most of the
episodes of violence described during the interviews not being documented,
especially in the case of verbal abuse. Barriers cited included negative attitudes and
little or no follow up action from the administration.
The nurses perceived violence to be a daily occurrence. A distinction was made
between verbal abuse, for example being sworn at, called names, and threatened; and
physical assault, although the terms were not defined. Violent behaviour was
perceived to be related to cognitive and physical conditions, for example from
patients who were under the influence of drugs and/or alcohol or those with
psychiatric conditions. Socio-economic factors such as geographic origin were also
perceived to be significant.
Most of the participants perceived that hospital policies were not conducive to
supporting a safe ED environment. Factors specific to the ED perceived to contribute
to episodes of violence included long waiting times, easy access to the department,
slow response times from security and a lack of metal detectors. As a protective
response nurses reported becoming increasingly vigilant around patients and
visitors, and discussed concerns regarding the quality of nursing practice offered as a
result of anxiety, fear, and negative emotions associated with violence. This
behaviour may provide evidence of defensive clinical practice.
2.8.3.3 Using action research to plan a violence prevention program for
emergency departments (Gates et al., 2011a).
Gates et al (2011a) employed action research to investigate employees and managers
perceptions and experiences regarding violence prevention strategies. This was the
Page 89
first stage in a program designed to plan, implement, and evaluate a violence
prevention and management intervention. Twelve focus groups (four per study site),
were conducted with a total of 96 participants which corresponded to a response rate
of 31%. Two focus groups were made up of ED employees and one each for
managers and patients. The ED employees were allocated to the groups by stratified
random sampling from nurses, physicians, patient care technicians, paramedics,
security personnel, and radiology technicians. Patients were approached at 15-
minute intervals in the ED and asked to participate in a focus group the following
weekend. In total, 24 management participants, 47 employees and 25 patients took
part in the focus groups which were conducted over a three-month period and
ranged in duration from 60 to 75 minutes.
The researchers used the Haddon matrix (1980) to develop focus group questions
aimed at gathering data about the pre-assault, assault, and post-assault time frames
and to compare these findings to planned strategies. This matrix is widely used in
public health to understand and identify measures to prevent injury (Haddon, 1980).
The audio recordings from the focus groups were transcribed and then verified by a
research team member. Thematic analysis following Wolcott’s method (1994) was
undertaken by two researchers independently to identify ideas, patterns, and then
used to contextualise these patterns into an existing framework, in this case the
Haddon matrix. The results were then compared for congruency and inconsistencies
resolved by returning to the original transcript. Finally a third researcher conducted
a final review of the transcripts and analysis. The results were presented as before,
during and after an assault.
Employees and managers from the different occupational groups agreed that
multiple interventions such as examining hospital policies, improving staff education
and training, and increasing communication with patients and among ED staff were
required to prevent and manage violence against ED workers. All groups supported
the need for improved communication as a strategy to prevent violence. Employees
Page 90

and managers were also of the view that security and/or police presence in the
emergency department should be increased and that zero tolerance policies needed
to be enforced. All participants supported limiting access to the ED as a way to
prevent violence.
Employees indicated that existing policies and education about conflict resolution
and aggression management techniques were inadequate. They identified the need
for frequent educational opportunities aimed at specific strategies to de-escalate
situations with patients and resolve conflicts. Additional workplace violence
education and training was perceived to be important and participants stated that
this should be conducted in an interdisciplinary manner involving all Emergency
Department employees, security personnel, and management. Patients highlighted
the need for improved staff communication and comfort measures.
Management and employee participants supported the use of debriefing following
episodes of violence however they reported that this was rarely done. Barriers cited
included time constraints, a lack of administrative support and a workplace culture
that tolerates violence as part of the job. While reporting mechanisms were
acknowledged, barriers to reporting were reported including confusion about which
episodes to report, time constraints and a lack of feedback from management and
administration about the reported event. Employees stated that reporting should be
easy to access and quick to complete and requested that a staff liaison role be created
to address any ongoing concerns of the victims of violence.
2.8.3.4 Patient-related violence at triage: A qualitative descriptive study (Pich et
al., 2011)
The authors used a qualitative descriptive methodology to uncover the experiences
of a group of Australian triage nurses with patient-related violence. A recall period
of one month was chosen to limit the possibility of recall bias. A convenience sample
of six triage nurses was recruited and the small size and the fact that only one study
Page 91

site was chosen mean that the findings of this study have limited generalisability.
Data were collected through semi-structured interviews.
Data were analysed using qualitative content analysis (Sandelowski, 2000b). This
involved data re-presentation where a descriptive summary of the main points were
organised in a way that best fit the data. Member-checking was used to enhance
rigour in the study. The study’s outcome measures included antecedents and risk
factors; types of abuse; the impact of patient-related violence on nurses; risk
management strategies, reporting and coping mechanisms utilised by nurses in
dealing with the consequences of such episodes. A definition of violence was
provided to participants that included both verbal and physical behaviours.
The authors identified antecedents including patient-specific risk factors such as
those with a mental health diagnosis; those under the influence of alcohol and/or
illicit substances; younger adults, aged between 16 and 25 years; the parents of
paediatric patients and patients from a lower socio-economic bracket. ED specific
factors included those secondary to patient volume in the department, for example
long waiting times and time of day: the afternoon shift, especially on the weekend
and during winter was identified as a high risk time. Factors specific to nurses
included less experienced staff being at high risk and staff attitudes, for example
those who employed a condescending attitude were thought to be at greater risk of
experiencing an episode of violence. The authors reported that some participants
were able to recognise cues and warning signs in potentially violent patients, and use
this knowledge to prevent escalation to violence.
Episodes of verbal and physical violence were reported. Swearing was the most
common form of verbal abuse reported by five of the six participants; with threats,
shouting, making unreasonable demands and intimidation also noted. Physical
abuse included nurses being slapped, kicked and hit as well as the use of
conventional weapons (knife) and the opportunistic use of hospital equipment as
weapons, for example the contents of a sharps bin.
Page 92
The impact of patient-related violence on nurses was often mitigated by nurses
making a judgement regarding the intent of the episode. For example unintentional
violence from patients judged not to have control over their actions, such as
dementia patients were viewed more favourably than intentional violence.
The impact on nurses included feelings of frustration, powerlessness and
degradation. Participants reported a diminished empathy for patients and were
fearful for their safety. Overall, a sense of the inevitability of patient-related violence
was noted and nurses perceived patient-related violence to be increasing in both
frequency and severity. Risk management strategies employed by the hospital were
perceived to be reactive in nature rather than preventative and included the use of
security and duress alarms and the design of the workplace, for example the use of
safety glass at triage. Training in aggression minimisation techniques was incomplete
in nature or totally absent. The under-reporting of episodes of violence was common
due to time constraints, the non-user friendly nature of the reporting system and
high frequency of episodes. The authors reported that informal debriefing with
colleagues was the main coping mechanism in dealing with the aftermath of violence
and whilst formal debriefing was desired it was not available in this workplace.
2.9 Synthesis of results
This systematic review was undertaken to investigate the best available evidence on
the impact of patient-related violence on nurses working in the Emergency
department and provides a summary of the included studies. A systematic search of
the literature resulted in 18 published studies that met the inclusion criteria of this
review. Of these 11 were cross-sectional studies that involved the use of a survey
tool, four were qualitative studies that employed semi-structured interviews or used
focus groups to collect their data and three were mixed-method studies that used
multiple data collection methods.
Page 93

The lack of homogeneity between the quantitative studies precluded the use of meta-
analysis, aspects of which are discussed below.
Context and perpetrators: as detailed in the inclusion criteria all studies reported on
ED nurses’ experiences with patient-related violence in their workplace. However
some studies also included details of violence from relatives or friends of patients
and limited reference to horizontal violence was included in one study (Esmaeilpour
et al., 2011).
Study sample and participants: The sample sizes for the 11 quantitative studies
ranged from 66 to 3518, with response rates from 11% to 97%, please refer to Table 3
for clarification. All quantitative studies recruited ED nurses, however three also
included other ED employees (Ayranci, 2005; Gates et al., 2006; Kansagra et al., 2008).
Two studies undertook a nationwide survey of ED nurses (Gacki-Smith et al., 2009;
Gates et al., 2011b). The other studies recruited participants through their place of
employment and the number of sites in each study ranged from one (Atawneh et al.,
2003) to 65 (Kansagra et al., 2008).
Study design: There was homogeneity in study designs. All quantitative studies
employed a cross-sectional approach and used a survey tool to collect data.
Methods/instruments: The quantitative studies all used a survey tool to collect data;
however the detail provided about survey items differed between the studies
resulting in a lack of homogeneity. For example some studies did not report the
length of their instrument (Ayranci, 2005; Gates et al., 2011b; Lee, 2001); others
reported the number of questions in their survey, for example Atawneh et al used a
two-part questionnaire which contained 18 questions (Atawneh et al., 2003), and
Gacki-Smith et al used a 69-item questionnaire (Gacki-Smith et al., 2009). Other
studies listed the number of sections on their survey which ranged from two (Pinar &
Ucmak, 2011) to four (Gates et al., 2011b). Some studies reported the types of
questions used, for example Likert-type, multiple choice and open-ended (Gates et
Page 94
al., 2006) however the majority did not provide such information. There was also a
difference between the design of questions, for example some studies favoured the
use of open-ended questions while others provided participants with a list of
responses to choose from.
Five studies reported that their survey instrument had been validated and a further
two studies reported that some sections of their questionnaire had been validated.
Four studies did not provide any details of validation; please see Table 5 for more
detail.
Recall periods: Recall periods in the quantitative studies ranged from three (Lee,
2001) and five months (Crilly et al., 2004) up to five years (Kansagra et al., 2008).
Three studies did not specifically define the recall period used or provided very
broad periods of time, for example “…experienced throughout the career in the
Emergency Department…” (Senuzun Ergun & Karadakovan, 2005). Please see
Appendices IV, V and VI for full details.
Definition: The lack of a standardised definition for the term “violence” has been
acknowledged in the literature as a limitation in comparing studies and only four of
the 11 quantitative studies provided a definition of the term “violence” to their study
participants; however six studies distinguished between verbal abuse and physical
violence in their results. Please see Table 3 for more detail.
Validation: Table 4 provides a summary of the level of rigour and validation
undertaken in the studies which varied widely. Some studies provided minimal
details of steps taken to ensure rigour (Gates et al., 2006) while others reported
significant measures taken to ensure the validity of the survey instrument used
(Kansagra et al., 2008).
Variation in study factors and outcomes measured: There was some variation
between studies in the study factors and outcomes measured. Please see Table 5 for
details.
Page 95

The lack of homogeneity between the qualitative studies is discussed below.
Context and sample: The sample sizes for the qualitative studies included in this
review ranged from six to 97 participants, working in the ED environment. Please see
Table 4 for clarification.
Study sites and participants: all qualitative studies recruited ED nurses, however
one study also included other ED employees (Gates et al., 2011a) The number of
study sites varied between the qualitative studies, from one (Early & Hubbert, 2006;
Pich et al., 2011) to three (Gates et al., 2011a).
Study design: There was some variation between the qualitative studies. Three study
designs were employed including Descriptive (Catlette, 2005; Pich et al., 2011),
Phenomenological (Early & Hubbert, 2006) and Action Research (Gates et al., 2011a).
Methods and instruments: Data collection varied across the qualitative studies: three
qualitative studies used semi-structured interviews to collect data , and one
conducted focus groups (Gates et al., 2011a).
Recall periods: A recall period was defined for one qualitative study as one month
(Pich et al., 2011). The other three studies did not provide a definition of the recall
period used.
Definition: Two studies provided a definition of the term violence as shown in Table
3.
Validation: There was a lack of detail provided regarding the trustworthiness of the
data analysis, in terms of dependability, confirmability, credibility and
transferability. One study did not provide any detail aside from a comment about
“journaling” by the author (Catlette, 2005). The other three qualitative studies
provided some detail of the process used to ensure trustworthiness including
member checking of thematic analysis and use of an audit trail (Pich et al., 2011); and
Page 96

the use of three independent researchers to analyse data (Gates et al., 2011a). Please
see Table 5 for more detail.
Variation in study factors and outcomes measured: There was some variation
between studies in the study factors and outcomes measured. Please refer to Table 5
for details.
The lack of homogeneity between the mixed method studies is discussed below.
Context and sample: The mixed-method studies had sample sizes ranging from 20 to
31 participants. Please see Table 4 for clarification.
Study sites and participants: All mixed method studies recruited ED nurses from
one study site, with one study also including other ED employees (Gillespie et al.,
2010).
Study design and method: All mixed method studies utilised interviews to collect
data, in addition to observation, and used digital photographs and archival records
as sources of data.
Instruments: The mixed method studies all used interview schedules and all
reported that these had been piloted to establish rigour (Gillespie et al., 2010; Luck et
al., 2007, 2008).
Recall periods: a recall period of six months was provided by one mixed-method
study, (Gillespie et al., 2010), the other two studies did not specify a recall period.
Definition: none of the mixed methods studies included in this review provided a
definition of the term “violence”, however one made the distinction between
physical and verbal aggression in their results section (Gillespie et al., 2010).
Validation: all the mixed method studies provided details of processes used to
ensure rigour as show in Table 5.
Page 97

Variation in study factors and outcomes measured: there was some variation
between studies in the study factors and outcomes measured. Please refer to Table 5
for details.
In view of this lack of homogeneity between these studies this synthesis of the
literature is presented in narrative form.
Page 98

Table 3: Definition of violence provided in included studies
Study Provided Definition
Quantitative studies
(Ayranci, 2005) Yes 3 forms of violence defined: verbal/emotional abuse; attempts at physical violence and threats; actual physical violence
(Atawneh et al., 2003) Yes A list of 12 examples provided for participants to choose from under three categories: mild, moderate and severe Mild involved insults or gestures implying imminent acts of violence; moderate involved single acts of physical violence unlikely to result in serious injury; severe entailed multiple acts of violence or the use of a knife or gun and likely to result in a serious or fatal injury.
(Crilly et al., 2004) No Distinction made between verbal and physical in results
(Esmaeilpour et al., 2011) No Distinction made between verbal abuse and physical violence in results
(Gacki-Smith et al., 2009) No Distinction made between verbal abuse and physical violence
(Gates et al., 2006) Yes Verbal harassment, sexual harassment verbal threats and physical threats each defined (p332)
(Gates et al., 2011b) No
(Kansagra et al., 2008) No
(Lee, 2001) No Distinction made between verbal & physical aggression.
(Pinar & Ucmak, 2011) Yes Physical violence: “being hit. Slapped, kicked, pushed, choked, grabbed, bitten, sexually assaulted or otherwise subjected to physical contact intending to injure or harm” (Gerberich et al., 2004) Verbal violence defined as “any use of language that aims at intimidating, frightening, or harming or persons yelling or swearing, engaging in name calling or using other words intended to control or hurt” (Uzun, 2003).
(Senuzun Ergun & Karadakovan, 2005)
No Distinction made between verbal & physical in results
Qualitative studies
(Catlette, 2005) Yes “…the victimization of an RN practicing in a hospital setting by another person or persons characterized by fear, physiological or psychological hardship, or loss” (p520)
(Early & Hubbert, 2006) No
(Gates et al., 2011a) No
(Pich et al., 2011) Yes “…any incidents where staff are abused, threatened or assaulted in circumstances relating to their work…involving an explicit or implicit challenge to their safety, well-being or health…” adapted from (Mayhew & Chappell, 2005) p346.
Mixed method studies
(Gillespie et al., 2010) No Distinction made between verbal, physical and non-verbal violence
(Luck et al., 2007) No
(Luck et al., 2008) No
Page 99

Table 4: Sample sizes and response rates for included studies
Study Sample size Response Rate
Quantitative studies
(Atawneh et al., 2003) 81 94%
(Ayranci, 2005) 195 81%
(Crilly et al., 2004) 71 66%
(Esmaeilpour et al., 2011) 186 95%
(Gacki-Smith et al., 2009) 3465 11%
(Gates et al., 2006) 242 NB: not specifically stated: “approximately 600 ED workers” RR estimated at 40%
(Gates et al., 2011b) 264 9%
(Kansagra et al., 2008) 3518 66%
(Lee, 2001) 76 58%
(Pinar & Ucmak, 2011) 255 97%
(Senuzun Ergun & Karadakovan, 2005)
66 72%
Qualitative studies
(Catlette, 2005) 8
(Early & Hubbert, 2006) 12
(Gates et al., 2011a) 97 31%
(Pich et al., 2011) 6
Mixed Methods studies
(Gillespie et al., 2010) 31
(Luck et al., 2007) 20 37%
(Luck et al., 2008) 20 37%
Table 5 provides a summary of the measures employed to ensure validity and
trustworthiness of the data.
Page 100

Table 5: Instrument validation and rigour of included studies
Study Data collection method Validation/rigour reported
Details
Quantitative studies
(Atawneh et al., 2003) Questionnaire Yes Reliability tested using Cronbach’s alpha which yielded reliability co-efficient based on 6 items of alpha = 0.8730 and standardised alpha = 0.8728 (12-item questionnaire) And alpha = 0.7547 and standardised alpha = 0.7731 (six-item)
(Ayranci, 2005) Questionnaire No No details of survey validation provided.
(Crilly et al., 2004) Questionnaire Yes Pilot study Test-re-test reliability = 91% (sample of 10 nurses) Inter-rater reliability for Data Extraction Form using Pearson’s correlation (r = 0.96); Inter-rater reliability of nursing triage using Kendall’s tau-b (0.86) p = 0.01.
(Esmaeilpour et al., 2011) Questionnaire Yes Expert panel; Initial pilot of survey; Test-re-test method.
(Gacki-Smith et al., 2009) Questionnaire Partial Evaluated by experts for content validity – details not provided.
(Gates et al., 2006) Questionnaire No Details not provided.
(Gates et al., 2011b) Questionnaire Partial Four-part survey with details of rigour provided for two parts. Internal consistency of Impact of Events Scale-Revised reported (0.79 – 0.91) and strong sensitivity (74.5) & specificity (63.1). Internal consistency reliability and test-retest reliability of Healthcare Productivity Survey (0.871 – 0.945); r = 0.801, p<0.001.
(Kansagra et al., 2008) Questionnaire Yes Interviews and focus groups conducted across three EDs including cognitive testing used to design and refine the survey tool. Psychometric testing was then conducted at 10 EDs.
(Lee, 2001) Questionnaire No Survey not validated. Internal validity of scale items on DBES using Cronbach’s Alpha = 0.88.
(Pinar & Ucmak, 2011) Questionnaire Yes Expert panel;
Page 101

Attitudes Towards Patient Physical Assaults Questionnaire previously validated.
(Senuzun Ergun & Karadakovan, 2005)
Questionnaire No No details of survey validation provided.
Qualitative studies
(Catlette, 2005) Interviews No Journaling.
(Early & Hubbert, 2006) Interviews Partial Member checking identified patterns were shared with key informants after analysis of interview transcripts in written report (no details of how many informants).
(Gates et al., 2011a) Focus groups Partial Two researchers – independent analysis and third did final review.
(Pich et al., 2011) Interviews Partial Member checking of thematic analyses. Audit trail.
Mixed Method studies
(Gillespie et al., 2010) Interviews Non-participant observation Digital photographs Archival records
Yes Data triangulation: interview data, field notes and archival data. Thematic analysis by two independent reviewers. Audit trail.
(Luck et al., 2007) Unstructured participant observation Interviews Documents
Yes Interview tool piloted. Member checking of emergent themes and ideas was undertaken as part of field interviews. Researcher journal.
(Luck et al., 2008) Unstructured participant observation Interviews Documents
Yes Interview tool piloted. Member checking of emergent themes and ideas was undertaken as part of field interviews. Researcher journal.
Page 102
Frequency of episodes of violence
Ten studies reported on the frequency of episodes of violence. Two of these were
qualitative studies and the detail provided was minimal, for example that violence
against nurses in the ED was a common experience, described as a daily occurrence
(Early & Hubbert, 2006). Gacki-Smith et al reported that approximately 25% of their
3,465 participants had experienced physical violence more than 20 times in the past
three years, and almost 20% (n = 604) reported experiencing verbal abuse more than
200 times in the three year study period (Gacki-Smith et al., 2009). Fifty nurses (70%)
reported 110 episodes of violence in a five-month period, approximately five per
week, or two per 1000 presentations (Crilly et al., 2004). These episodes are perceived
to be increasing in both frequency and intensity (Gates et al., 2011a; Pich et al., 2011).
Eight studies did not report on the frequency of episodes of violence.
In studies where nurses were only one of the professional groups studied, they
emerged as the professional group at most risk of violence (Ayranci, 2005; Gates et
al., 2006). For example, researchers in one study reported that nurses were the
professional group most frequently targeted, experiencing 67% of the 319 episodes of
physical violence in their study (Gates et al., 2006).
The types of violence: physical and verbal
Three studies did not report on the different types of violence experienced by ED
nurses (Ayranci, 2005; Gates et al., 2011a; Gates et al., 2011b).
Fifteen studies reported on types of violence with verbal abuse the most common
type of violence experienced, reported by between 53% (Crilly et al., 2004) and 99%
(Senuzun Ergun & Karadakovan, 2005) of those studied. Swearing was identified as
the most common form of verbal abuse (Crilly et al., 2004; Pich et al., 2011). Other
types reported included yelling or using a raised voice, threatening the personal
Page 103
safety of staff and invading personal space (Gillespie et al., 2010); being intimidated
and harassed with sexual language/innuendo (Gacki-Smith et al., 2009).
Physical violence was reported by between 9% (Ayranci, 2005) and 79% (Lee, 2001) of
those sampled. This included overt acts such as biting, hitting, pushing, kicking and
slapping (Crilly et al., 2004); being spat on, hit, pushed/shoved, scratched and kicked.
(Gacki-Smith et al., 2009). Episodes of sexual harassment were also reported by some
nurses, for example 44% (n = 42) of nurses in one study reported experiencing at least
one incident of sexual harassment from patients (Gates et al., 2006).
The presence of weapons was reported and this included, both conventional
weapons, for example knives and guns (Kansagra et al., 2008) and opportunistic
weapons, for example a cane (Early & Hubbert, 2006) or syringes (Pich et al., 2011).
Two studies reported specifically that there were no episodes of physical violence
with a weapon (Atawneh et al., 2003; Esmaeilpour et al., 2011).
Organisational reporting of episodes of violence
Eleven studies discussed the issue of reporting of episodes of violence with all
identifying under-reporting as a common occurrence, with up to 80% of incidents of
verbal and physical violence not reported (Pinar & Ucmak, 2011). While reporting
mechanisms were acknowledged, barriers to reporting were identified including
confusion about which episodes to report, time constraints and a lack of
administrative support, feedback and follow-up (Early & Hubbert, 2006; Gates et al.,
2011b; Pich et al., 2011). Reporting systems that were not user-friendly were also
cited as a reason for under-reporting (Pich et al., 2011) and in one study 85% of those
surveyed were unaware of the process involved in reporting an episode of violence
(Esmaeilpour et al., 2011).
Luck et al reported that nurses often made judgments about specific episodes of
violence which guided their decisions about whether or not to report (Luck et al.,
2008). The authors describe a continuum where those episodes perceived to be
Page 104

“within normal limits” were not reported. Mitigating patient-related factors such as
anxiety, confusion, and disorientation and/or a lack of appreciation or understanding
of the resources and processes of the ED were described. Presentations perceived to
be “appropriate” were afforded greater empathy than those deemed to be
inappropriate.
Nurses who did not perceive barriers to reporting episodes of violence were much
less likely to have experienced frequent ED verbal abuse than other nurses (9.78%
versus 21.5% p<0.001) (Gacki-Smith et al., 2009). Establishing a positive culture with
regards to reporting of episodes of violence is an important step in creating a safe
work environment (Gacki-Smith et al., 2009). Only 25% of participants were
encouraged to report episodes of violence in a study by (Esmaeilpour et al., 2011)
and the majority of these were encouraged by colleagues, not management.
Employees stated that reporting should be easy to access and quick to complete
(Gates et al., 2011a).
Seven studies did not report on organisational reporting of episodes of violence, as
shown in Table 5.
Antecedents and risk factors
Eleven studies reported antecedents and precipitating factors of episodes of patient-
related violence and for the purpose of this discussion these have been grouped into
three main areas: patient presentation, environmental and patient behaviours.
Patient-related antecedents and precipitants reported in the studies included lifestyle
factors such as alcohol intoxication (Catlette, 2005; Crilly et al., 2004; Pich et al., 2011)
and substance abuse (Crilly et al., 2004; Gillespie et al., 2010; Pich et al., 2011). Patient
diagnoses and co-morbidities such as cognitive impairment, for example dementia
(Gacki-Smith et al., 2009; Pich et al., 2011) and mental health issues were also
reported to be significant in a number of studies (Catlette, 2005; Crilly et al., 2004;
Gacki-Smith et al., 2009; Pich et al., 2011).
Page 105
Factors specific to the ED were also reported with the ED environment described as
unsupportive (Early & Hubbert, 2006) and potentially contributing to the emergence
of violent behaviour through over-crowding, long waiting times and staff shortages
(Gacki-Smith et al., 2009; Pich et al., 2011). The design of the ED was reported to be
contributory factor (Early & Hubbert, 2006; Pinar & Ucmak, 2011), with triage
identified as one the highest risk areas for potential violence (Crilly et al., 2004).
Some studies reported that patients often exhibited demanding behaviours and cues
and requested attention prior to exhibiting violence (Crilly et al., 2004) and these
could be recognised by some staff and used to defuse potentially violent situations .
Thus less experienced staff were identified as being at greater risk of potential
violence from patients (Gillespie et al., 2010). These behaviours were described in
detail by Luck et al (2007) using the mnemonic STAMP: staring, tone, anxiety,
mumbling and pacing (Luck et al., 2007).
Seven studies did not report on antecedents and risk factors as detailed in Table 5.
Perpetrators of violence
Fifteen studies identified the perpetrators of violence against ED nurses and patients
were identified as the most common source of violence in ten of these studies. For
example in one study 319 episodes of physical violence initiated by patients were
reported compared to 10 by visitors (Gates et al., 2006) while patients were identified
as the perpetrators in 78% of episodes (n =86) in another study (Crilly et al., 2004).
Family members were reported to be the most likely source of verbal abuse in
paediatric EDs (82%) while episodes of physical violence were more likely to
perpetrated by patients, especially those with mental health diagnoses (Gillespie et
al., 2010). High risk family members were identified as those with a lack of respect
for women or persons in positions of authority, those under the influence of alcohol
or illicit drugs and those who perceived the needs of their children were not being
addressed (Gillespie et al., 2010).
Page 106

Patients’ families and/or friends were more likely to be involved in episodes of
violence in non-Western studies (Ayranci, 2005; Esmaeilpour et al., 2011; Pinar &
Ucmak, 2011; Senuzun Ergun & Karadakovan, 2005). Typically this involved males
and the actions were against female nursing staff. This was thought to be related to
the roles played by males in these cultures and the fact that violence towards women
is more prevalent in countries such as Turkey and Iran due to male dominance in
these cultures (Ayranci, 2005).
A distinction was made in some studies between the intent of perpetrators or the
meanings behind their acts of violence (Luck et al., 2008) (Pich et al., 2011). Some
behaviours were classified as problem behaviours by nurses rather than acts of
violence, for example episodes involving patients with dementia were nor reported
or viewed as seriously as other episodes of violence (Gates et al., 2006).
Three studies did not report on the source of ED violence as detailed in Table 5.
Impact and sequelae of violence: psychological and physical effects
Twelve studies reported on the consequences of patient-related violence including
physical injuries and psychological side-effects which impacted on clinical practice.
These were reported to be long-lasting, for example the majority of participants in
one study (n = 71, 96%) reported that they suffered from after-effects lasting for up to
four weeks after experiencing violence and 93% (n =65 ) suffered from multiple
effects (Atawneh et al., 2003). Emotions reported included fear, anger and frustration
(Gillespie et al., 2010). Catlette (2005) and Pinar and Ucmak (2011) reported that
nurses felt unsafe and vulnerable at work (Catlette, 2005; Pinar & Ucmak, 2011)
reported that nurses felt unsafe and vulnerable at work. Kansagra et al (2008)
reported that nurses were five times less likely to feel safe “most of the time” or
“always” compared with other professional groups (Kansagra et al., 2008).
Researchers in one study reported that four participants had received medical care
Page 107

and one psychiatric care as a result of an episode of violence and that there were
three lost workdays due to injuries.(Gates et al., 2006).
An impact on practice was noted with nurses reporting that they avoided the
perpetrators of violence and were unable to focus at work (Gillespie et al., 2010). In
another study, 37% (n=82) of the respondents had a negative total productivity score
on the Healthcare Productivity Survey demonstrating decreased performance after a
violent event. (Gates et al., 2011b) One third of ED nurses surveyed by (Gacki-Smith
et al., 2009) reported having considered leaving their ED or emergency nursing
because of violence.
Six studies did not report on the psychological and physical effects and sequelae of
violence as shown in Table 5.
Prevention and control measures to manage episodes of violence
Twelve studies reported on prevention and control measures to manage episodes of
violence and approaches perceived to be effective included education and training,
provision of security and reporting. Nurses who reported that violence was an
unavoidable part of their job were more likely to have experienced frequent physical
violence (Gacki-Smith et al., 2009). Hospital policies were not perceived to support a
safe ED environment (Early & Hubbert, 2006) and existing policies about conflict
resolution and aggression management techniques were reported to be inadequate
(Gates & Gillespie, 2011). A workplace culture that tolerates violence as part of the
job was also noted by Gates et al (Gates et al., 2011b) and (Gacki-Smith et al., 2009)
reported that there was an acceptance of such violence as “part of the job”.
It is important to note that the effectiveness of strategies such as security,
environmental controls and violence prevention training and education are difficult
to extrapolate from cross-sectional data because such strategies are often initiated in
EDs after violence has become an issue. This can have a confounding effect on the
Page 108
results and create the appearance that such strategies increase ED violence (Gacki-
Smith et al., 2009).
Six studies did not report on prevention and control measures to manage episodes of
violence as shown in Table 5.
Education and training
One study recommended the integration of knowledge of the STAMP behaviours
into training programs to equip ED nurses with the skills to recognise and then
defuse potentially violent situations (Luck et al., 2007). This was reiterated by Gates
et al (2011b) who discussed the need for frequent educational opportunities aimed at
specific strategies to de-escalate violent situations with patients and to resolve
conflicts(Gates et al., 2011b). The consensus was that whilst specific training was
desired by nurses and perceived to be important (Gates et al., 2011a) it was often
sporadic and fragmented in nature with a lack of consistency between trainers and
programs (Lee, 2001). A lack of training was identified as a concern in some studies
(Catlette, 2005) and less than half of the EDs surveyed by (Kansagra et al., 2008) had
some type of training program for staff. Eighty-four percent of participants in the
study by (Pinar & Ucmak, 2011) had not received any training at all. Similarly there
was a lack of refresher programs reported (Lee, 2001) with 64% of those surveyed by
(Gates et al., 2006) receiving no training in the year prior to completing the survey.
Employees indicated that existing policies and education about conflict resolution
and aggression management techniques were inadequate. They identified the need
for frequent educational opportunities aimed at specific strategies to de-escalate
situations with patients and resolve conflicts. Additional workplace violence
education and training was perceived to be important and participants stated that
this should be conducted in an interdisciplinary manner (Gates et al., 2011a).
The use of patient management plans to identify and flag previously violent patients
was identified as preventative tool to alert staff in one study (Pich et al., 2011).
Page 109

Researchers in another study reported the value of patient management plans but
noted that there were no systems in place to facilitate this (Gates et al., 2011b)
Security
There was a perception among participants that a lack of security (Gates et al., 2006)
or a slow response time from security (Early & Hubbert, 2006) increased the risk of
violence in the department. Employees and managers were also of the view that
security and/or police presence in the emergency department should be increased
and that guards should be armed and that zero tolerance policies needed to be
enforced.(Gates et al., 2011a). Other increased security measures discussed included
the use of metal detectors to screen patients and visitors for weapons (Early &
Hubbert, 2006; Gates et al., 2006; Kansagra et al., 2008); the use of Tasers by security
guards (Gates et al., 2011a); the use of duress alarms (Pich et al., 2011) and one study
discussed the introduction of a policy to restrict the number of visitors per patient
(Gates et al., 2011b). Environmental measures such as restricted access and the use of
quiet areas or safe rooms to house patients at risk of violence were also reported
(Gates et al., 2011b).
Post episode follow up
Six studies reported on coping strategies and follow up after episodes of violence
with all discussing deficits in this regard. Management and employee participants
supported the use of debriefing following episodes of violence however they
reported that this was rarely done and that support systems provided were
inadequate. Barriers cited included time constraints, a lack of administrative support
and a workplace culture that tolerates violence as part of the job. (Gates et al., 2011a).
Gates et al reported that critical incident debriefing was rarely done (Gates et al.,
2011a), and whilst formal debriefing was desired it was not offered in the ED
(Esmaeilpour et al., 2011; Pich et al., 2011). Support was received from colleagues
(40%) in the ED rather than through more formal mechanisms such as administration
Page 110

(Pinar & Ucmak, 2011), and informal debriefing with colleagues was identified as the
main coping mechanism in dealing with the aftermath of violence. Participants in
one study requested that a staff liaison role be created to address any ongoing
concerns of the victims of violence and to ensure that their physical, emotional, and
psychological injuries have been addressed prior to them returning to work (Gates et
al., 2011a).
Twelve studies did not report on coping strategies and follow up after episodes of
violence.
Page 111
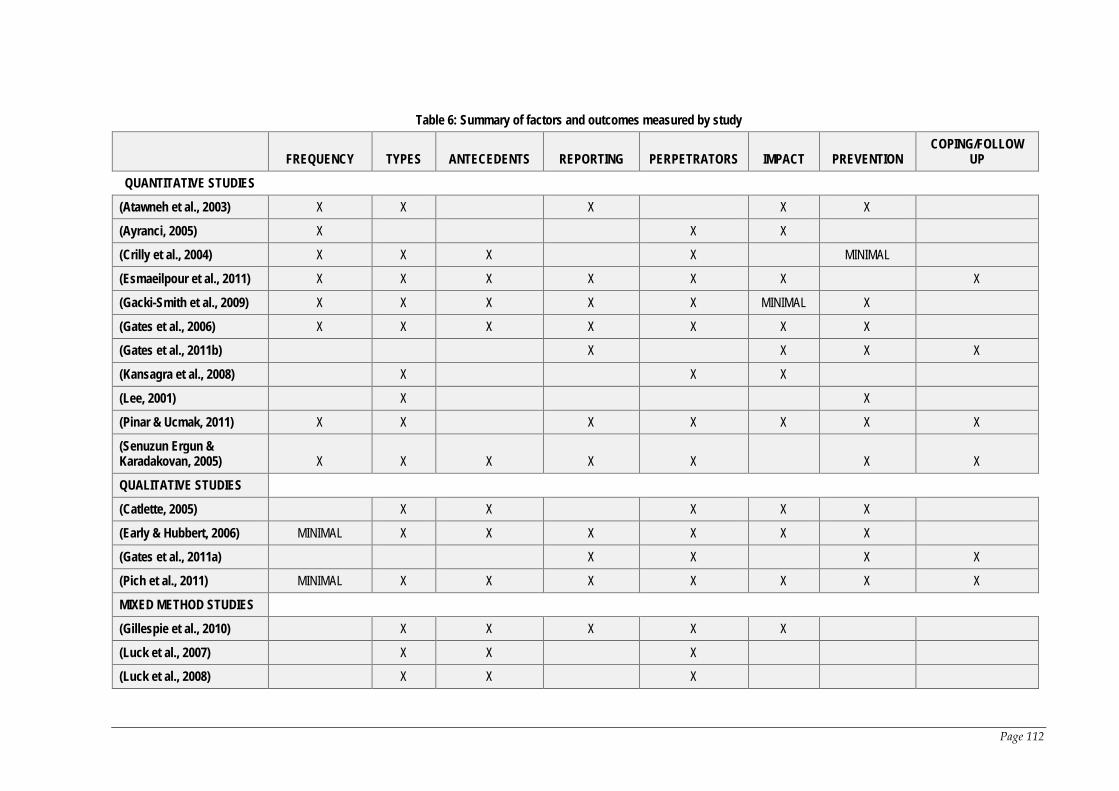
Table 6: Summary of factors and outcomes measured by study
FREQUENCY TYPES ANTECEDENTS REPORTING PERPETRATORS IMPACT PREVENTION COPING/FOLLOW
UP
QUANTITATIVE STUDIES (Atawneh et al., 2003) X X X X X
(Ayranci, 2005) X X X
(Crilly et al., 2004) X X X X MINIMAL
(Esmaeilpour et al., 2011) X X X X X X X
(Gacki-Smith et al., 2009) X X X X X MINIMAL X
(Gates et al., 2006) X X X X X X X
(Gates et al., 2011b) X X X X
(Kansagra et al., 2008) X X X
(Lee, 2001) X X
(Pinar & Ucmak, 2011) X X X X X X X
(Senuzun Ergun & Karadakovan, 2005) X X X X X X X
QUALITATIVE STUDIES (Catlette, 2005) X X X X X
(Early & Hubbert, 2006) MINIMAL X X X X X X
(Gates et al., 2011a) X X X X
(Pich et al., 2011) MINIMAL X X X X X X X
MIXED METHOD STUDIES (Gillespie et al., 2010) X X X X X
(Luck et al., 2007) X X X
(Luck et al., 2008) X X X
Page 112
2.10 Discussion
Summary of synthesis and significant issues
Analysis of the included papers identified violence in the ED against nurses as
occurring on a regular basis, in the form of verbal and physical aggression. The
majority of episodes were perpetrated by patients in the department; however
relatives were also identified as a risk group, particularly with regards to verbal
abuse and this was more frequent in non-western ED settings(Atawneh et al., 2003;
Ayranci, 2005; Esmaeilpour et al., 2011). The parents of paediatric patients were also
identified as a group that poses a high risk (Gillespie et al., 2010; Pich et al., 2011).
Antecedents and risk factors for violence included factors related to patient
presentation, for example alcohol intoxication, substance abuse and cognitive
impairment; environmental, for example long waiting times and overcrowding; and
patient behaviours, for example STAMP behaviours(Luck et al., 2007). Some
participants in these studies considered that a patient’s presentation was a mitigating
factor for their actions, for example patients with dementia. Behaviours reported to
be associated with these presentations are consistent with those described in the
literature as “resistance to care” behaviours (Gibson, 1997), and represent defensive
responses rather than offensive aggression and violence (Kable et al., 2012b).
Exposure to violence led to physical and psychological consequences for nurses and
these were often long-lasting in nature and affected the quality of care provided to
patients. Despite the frequency and severity of episodes of violence, reporting of
these events was not the norm and their subsequent management was perceived to
be largely inadequate (Gacki-Smith et al., 2009; Gates et al., 2006). Risk management
centred on training in de-escalation techniques and security measures such as
restricted access to the department and the presence of security guards (Gates et al.,
2011b; Lee, 2001). Violence against ED nurses was identified as an area of increasing
113
concern and one in need of more action in terms of management of the issue and
further research into the phenomenon.
2.10.1 Limitations of the review
All of the studies considered for this review contained methodological shortcomings.
Eleven of the included studies used a cross-sectional survey to collect data and of
these the majority used non-validated instruments. Four of these studies reported
sample sizes of less than 100 (Atawneh et al., 2003; Crilly et al., 2004; Lee, 2001;
Senuzun Ergun & Karadakovan, 2005) and some studies reported response rates of
as low as 9% which may compromise the external validity of the study, or the degree
to which the findings can be generalised to other populations or environments (Gates
et al, 2011).
All studies collected self-reported data, which is subject to recall bias. Such data is
subjective in nature and influenced by the participants’ perceptions of events and the
time period involved. There is the potential for inaccuracy in the data collected;
however self-reported data is necessary in this area of study due to the under-
reporting of episodes of violence (Buckley, 2013). While some studies attempted to
minimise this by limiting the period of recall, to between one and 12 months, others
included no such limitations. The difference in data collection periods between the
studies was a limitation making cross comparison difficult. In addition the
anonymous nature of the surveys in the quantitative studies meant that there was no
way to identify whether participants were similar to non-participants in relation to
their experiences with violence. Gordis reports that generally people who do not
participate in a research project differ from those who do in regard to many
characteristics (Gordis, 2004). This means that the results of these studies may have
been influenced by self-selection bias. The use of convenience sampling and the use
of only one study site in some studies may weaken the transferability of findings in
qualitative studies and generalisability of results in quantitative studies. There is also
114

the potential for bias because those interested in the topic or who had experienced
patient-related violence, may be more likely to participate in studies on the topic
which could result in a biased view of the topic (Gordis, 2004).
The lack of a consistent definition of the term “violence” by each study makes direct
comparison between the studies more difficult. Only five of the 18 included studies
defined “violence” while a further six studies distinguished between verbal abuse
and physical violence in their results; however they did not provide a definition of
either term. Many of the quantitative studies employed basic descriptive statistics
and results were only reported as raw numbers and percentages and did not report
statistically significant results.
Aspects of trustworthiness and rigour were addressed by some studies as shown in
Table 4; however other studies did not provide any details or provided minimal
information. Member checking was conducted by two of the four qualitative studies,
however in the case of Early and Hubbert it was unclear how many participants were
involved in this process (Early & Hubbert, 2006). Both mixed-methods studies by
Luck et al (Luck et al., 2007, 2008) also employed member checking which
demonstrates credibility and dependability. In addition they pilot tested the
interview schedule. Audit trails, which help to demonstrate confirmability, through
the documentation of the research process followed, and enable future researchers to
replicate the study, were used in one qualitative and one mixed method study.
Methods employed in the quantitative studies to ensure rigour ranged from the use
of expert panels and testing groups to statistical testing using the test-re-test method
to determine reliability and Cronbach’s Alpha for measurement of item constructs.
Four studies employed statistical methods on all or some aspects of their survey
tools, and three employed experts to either pilot test or review their survey tool. Four
studies did not provide any details of the survey development process. The lack of
consistency in the methods employed made comparison of the results more difficult.
115
2.10.2 Conclusion
Violence from patients and/or their friends and family has emerged as a significant
threat to the safety of ED nurses in their daily working lives. Nurses are exposed to
levels of physical and verbal violence that are so high they have become an expected
part of the job for many and are tolerated on a daily basis. However such episodes of
patient-related violence can have long-term physical and psychological consequences
for nurses and have resulted in the death of a number of nurses on the job. There is
also a flow on effect to their professional lives which can impact negatively on the
level of care afforded to future patients and potentially compromise patient safety.
Nurses feel unsupported by management in terms of the support and follow-up
offered to them following episodes of violence. This has led to chronic under-
reporting of episodes and a discrepancy between the actual incidence of violence
experienced by nurses in the ED and official figures. Healthcare employers are
obligated to provide a safe working environment for all who enter their facilities
under Work Health and Safety Legislation; however the current reality is that nurses
frequently feel unsafe at work and this has the potential to impact negatively on
patient safety. Whilst it is not possible to eliminate the threat of violence from high
risk environments like the ED, employers must act to provide a safer environment
where this threat is minimised and should support their staff in the event of an
episode occurring.
2.10.3 Implications for practice
Research should continue into violence against Emergency Department nurses to
provide the evidence needed to inform management and government and guide
policy development. Multi-site studies with large sample sizes could be conducted to
add support to the body of the evidence on the topic. Existing studies all have
limitations due to recall bias; however the use of archival records to measure
episodes of violence is likely to fail given the chronic under-reporting identified in
116
this review. There is a need for prospective studies to be conducted to collect data on
episodes of patient-related violence as they occur in real-time.
Conflict of interest
The authors declare no conflict of interest.
2.10.4 Implications for research
Research should continue into violence against Emergency Department nurses to
provide the evidence.
There is minimal evidence about the extent and frequency of episodes and resultant
injury of patient-related violence in the ED and of the experiences and perceptions of
ED nurses in Australia (Crilly et al., 2004; Lau et al., 2012a, 2012b; Luck et al., 2007,
2008; Pich et al., 2011). Urgent preventative measures and responses to patient-
related violence are required to address the phenomenon to ensure that ED nurses
are working in a safe environment.
2.10.5 Justification of study
The purpose of this chapter was to provide background and contextualise the
phenomena of patient-related violence against ED nurses. In addition we sought to
identify aspects of this phenomenon in the literature that had potential for further
study.
The frequency and severity of patient-related violence and associated under-
reporting is recognised as an endemic problem. Much of the work to date has been
completed by medical researchers, including studies on nurses; or focussed on ED
staff in general but few studies have focussed specifically on ED nurses. In addition
much of the research on the topic originates outside of Australia, especially from The
United States and United Kingdom and a large epidemiological study had not
previously been conducted in Australia.
117
The Australian research consists of a limited number of studies with small sample
sizes that are largely qualitative in nature, thus the extent and frequency of violence
against nurses has not been extensively studied in Australia. There is a lack of
knowledge surrounding frequency, associated injury and effects on nurses or
organisational strategies to prevent or follow up episodes of violence involving
nurses in the ED. Furthermore, there has not been a national survey of ED nurses
about this phenomenon in this high risk clinical area in Australia.
This mixed methods study will provide more comprehensive data about the topic
using a detailed survey form with questions developed from the literature on the
topic. Many previous surveys have been limited in nature or focussed on a specific
aspect of the phenomenon. There is a need for national studies that can report on the
issues of violence not routinely reported in acute hospitals and a large sample size
and response rate will increase the generalisability of the results.
The aims were developed to address these knowledge deficits and the study
instruments used were designed to measure the following outcome measures:
frequency; types of violence; ED nurses’ perceptions of risk prevention and
management strategies; and antecedents and precipitants. Ultimately the aim is to
develop recommendations for employers about patient-related workplace violence
and safety in the workplace for ED nurses.
118

Chapter 3 Research Design
3.1 Introduction
This chapter describes the research design used in the study, including the study
aims, study design and data collection and analysis methods. Design components
related to the study setting, study sample, participants and recruitment are
described. The development of the data collection instruments: the survey and
interview schedules are also detailed. The ethical implications of the study are also
outlined. The study was conducted in two sequential phases and the chapter has
been structured to describe this clearly.
NB: Abbreviations used in this chapter refer to the researchers: Jacqueline Pich (JP),
Michael Hazelton (MH), Ashley Kable (AK) and Deborah Sundin (DS).
3.2 Study aims
The study used a mixed methods approach to investigate ED nurses’ experiences
with patient-related violence in their workplace and to address the aims of the study
listed below: -
The six aims of the study were: -
1. To measure the frequency of individual emergency nurses’ reported exposure
to patient-related workplace violence and associated outcomes in the
preceding six months;
2. To identify the types of violent behaviours experienced by emergency nurses;
3. To identify emergency nurses’ perceptions of risk prevention measures and
risk management strategies adopted by their employers;
4. To identify factors associated with patient-related workplace violence that
precipitate, escalate or de-escalate episodes of violence;
119

5. To investigate the issue of violence with respect to young adults (16-25 years
of age) and the parents of paediatric patients;
6. To develop recommendations for employers about patient-related workplace
violence and safety in the workplace for emergency nurses.
The study was conducted in two distinct phases. Part I used a cross-sectional study
design to survey the members of the College of Emergency Nursing Australasia
(CENA). This was a national survey including all states and territories in Australia.
This part of the study addressed the first four aims of the study and resultant data
were used to address the sixth study aim. Part II of the study involved the use of a
qualitative descriptive approach and semi-structured interviews of ED nurses to
achieve the fifth aim of the study. Resultant data also were used to address the sixth
study aim.
3.3 Study design
A mixed methods approach, combining both quantitative and qualitative strategies
was employed. The mixed method design is based on the tenet that a researcher
should use the approach or mixture of approaches that is best suited to answering
their research question (Evans, Coon, & Ume, 2011; Johnson & Onwuegbuzie, 2004).
Mixed methods research is defined as research where a combination of quantitative
and qualitative methods, approaches, concepts or language are utilised and
incorporated into a single study (Johnson & Onwuegbuzie, 2004). It juxtaposes
different method types to facilitate a deeper understanding of the phenomenon of
interest and to gain greater confidence in the conclusions generated by the study
(Johnson, Onwuegbuzie, & Turner, 2007). Despite its name, mixed method research
is not so much a mixing together of research types but rather a collaboration of them
(Alaf & Sheppard, 2007). As Sandelowski argues, we cannot blend different methods
together in a single study, as they are distinct entities, but we can link or combine
120
them into our results (Sandelowski, 2003), and Bryman proposes that the term multi-
methods may be a more accurate descriptor (Bryman, 2004).
Mixed methods research is referred to in the literature as one of the three major
research paradigms, along with qualitative and quantitative research (Alaf &
Sheppard, 2007; Johnson et al., 2007) and is a research method of choice in the health
professions, including nursing (Alaf & Sheppard, 2007). It is utilised where there are
multiple facets of a research question that need exploring, and one method will not
be sufficient to address all the issues (Alaf & Sheppard, 2007). The strengths of this
method are threefold: it can answer questions that the other methods cannot, by
broadening the scope of the research; it provides stronger inferences and allows
deeper insight; and it provides the opportunity for presenting a greater diversity of
views (Sandelowski, 2000a; Tashakkori & Teddlie, 1998).
The integration of quantitative and qualitative methods is “consonant with a
worldview of pragmatism” (Evans et al., 2011), p.277). Pragmatism, has been
proposed as the best paradigm for justifying the use of mixed methods research
(Tashakkori & Teddlie, 2003) and seeks to focus on “what works” as the truth
regarding the research question(s) under investigation and supports the use of both
quantitative and qualitative research methods in the same study (Tashakkori &
Teddlie, 1998). Pragmatism presents a very practical and applied research
philosophy and has been referred to as the best philosophical foundation for mixed
methods research (Creswell & Plano-Clark, 2007).
Research can often be better informed by the use of multiple methods, and the use of
more than one study method represents an expansive and creative form of research
that is inclusive, pluralistic and complementary in nature. It does not seek to limit or
constrain researchers by restricting them to one study method (Johnson &
Onwuegbuzie, 2004) and offers deeper insight and facilitates a broader
understanding of complex research topics than would be possible by using one
121
method in isolation (Halcomb & Andrew, 2009). The use of both qualitative and
quantitative data in a study can produce more complete knowledge needed to
inform clinical practice (Creswell & Plano-Clark, 2007).
Understanding the strengths and weaknesses of qualitative and quantitative research
allows researchers to mix or combine strategies using what is called the fundamental
principle of mixed research (Johnson & Turner, 2003). The principle asserts that
researchers should collect multiple data using complementary strategies and
approaches that overcome the weaknesses and draw on the strengths inherent in
each single method (Connelly, 2009; Johnson & Onwuegbuzie, 2004). It allows
researchers to answer a broader, more complete range of research questions as they
are not constrained by one approach (Johnson & Onwuegbuzie, 2004). In addition,
examining areas of convergence and divergence between the methods, can provide
insights that may otherwise have gone unrecognised (Halcomb & Andrew, 2009).
The research design for this study involved assigning priority to the quantitative
phase of the study, where a cross-sectional survey tool was the principal means of
data collection and the qualitative phase, where semi-structured interviews were
used to collect data, as the complementary method. This is recognised as an
important strategy in the literature surrounding mixed methods research (Morgan,
1998). The second design decision involved the sequencing of the two phases, with
the complementary qualitative phase conducted as a follow-up to the principal
method. This approach is described as the Priority-Sequence model and this design is
said to be increasingly common among survey researchers (Morgan, 1998). In this
case the qualitative follow-up interviews were used to expand on data from the
questionnaires, and allowed the researcher to focus on one particular area of interest.
A qualitative descriptive approach was used in this part of the study and is a suitable
method for use in mixed method studies (Neergaard, Olesen, Andersen, &
Sondergaard, 2009).
122
There are two basic models for incorporating the results of a mixed methods study
into a thesis: the segregated or integrated approach (Halcomb & Andrew, 2009). In
this study the segregated model was used and the qualitative and quantitative
components of the study are presented separately, and the findings integrated into
the discussion and conclusion chapters. The results of the quantitative and
qualitative analyses are combined at the interpretive level of research but each data
set remains analytically separate from each other (Sandelowski, 2000a).
3.3.1.1 Ethical approval
Ethical approval for the project was obtained from the University of Newcastle
Human Research Ethics Committee, approval number H – 2010 – 1013 (Appendix G).
3.4 Part I: National survey of ED nurses
3.4.1 Study design, sample and setting
This part of the study used a cross-sectional design to survey the membership of the
College of Emergency Nursing Australasia (CENA). It is the peak professional body
representing ED nurses in Australia and has a membership of approximately 1200
nurses. One of its aims is to initiate and support relevant nursing research. For these
reasons, the researcher made the decision to approach CENA to seek a provisional
letter of support for the study. This was made in September 2009 and was followed
up with a formal research proposal in March 2010 which was accepted later that
month.
This part of the study addressed study aims 1-4 and 6, as detailed in Table 7: Study
aims addressed in questionnaire.
123

3.4.2 Development of the survey tool
Data related to the experiences of ED nurses with patient-related violence were
collected using a 75-item questionnaire (Appendix H), divided into seven sections as
detailed below.
Section 1: Study eligibility;
Section 2: General information;
Section 3: Patient-related violence experienced by you;
Section 4: Factors associated with patient-related workplace violence;
Section 5: Types of violent behaviour;
Section 6: Management and prevention of episodes of patient-related violence;
Section 7: Expression of interest to participate in follow up interviews.
The development of the questionnaire was conducted in three stages and designed
using “survey monkey™” software. The survey was also printed in an A4 brochure
style with 24 double-sided pages (Appendix H).
3.4.2.1 Stage 1
In stage 1 survey items were designed to collect data to achieve study aims 1 to 4.
The aims of the study were the primary reference point for the development of the
questionnaire and the first stage involved development of questions for the purpose
of achieving the aims of the study. The key term violence was defined on the survey
form as a continuum of behaviours from verbal abuse and threats, sexual harassment
and physical assaults. It included both explicit and implicit challenges to the well-
being, safety and health of nurses at their place of work (Mayhew & Chappell, 2005).
The term “patients” was expanded to include parents or carers accompanying
paediatric patients.
124

Recall bias represents a major threat to the internal validity of studies that rely on
self-reported data (Hassan, 2006). Recall of information depends entirely on memory
that can often be imperfect and thereby unreliable (Hassan, 2006). Participants may
experience interference: that is as an individual experiences an increasing number of
events, the probability of recalling any one of those events specifically declines. If
information required by a question is not available, the respondent may use other
less relevant information to answer the question (Coughlin, 1990). Therefore an
optimal recall period is essential to reduce measurement errors and facilitate accurate
responses, and short recall periods are preferred (Norquist, Girman, Fehnel,
DeMuro-Mercon, & Santanello, 2012). After reviewing similar studies a decision was
made to use a six month recall period in an attempt to minimise recall bias in this
study, and to also include a question about episodes during the last week (Gates et
al., 2006; Gillespie et al., 2010).
125
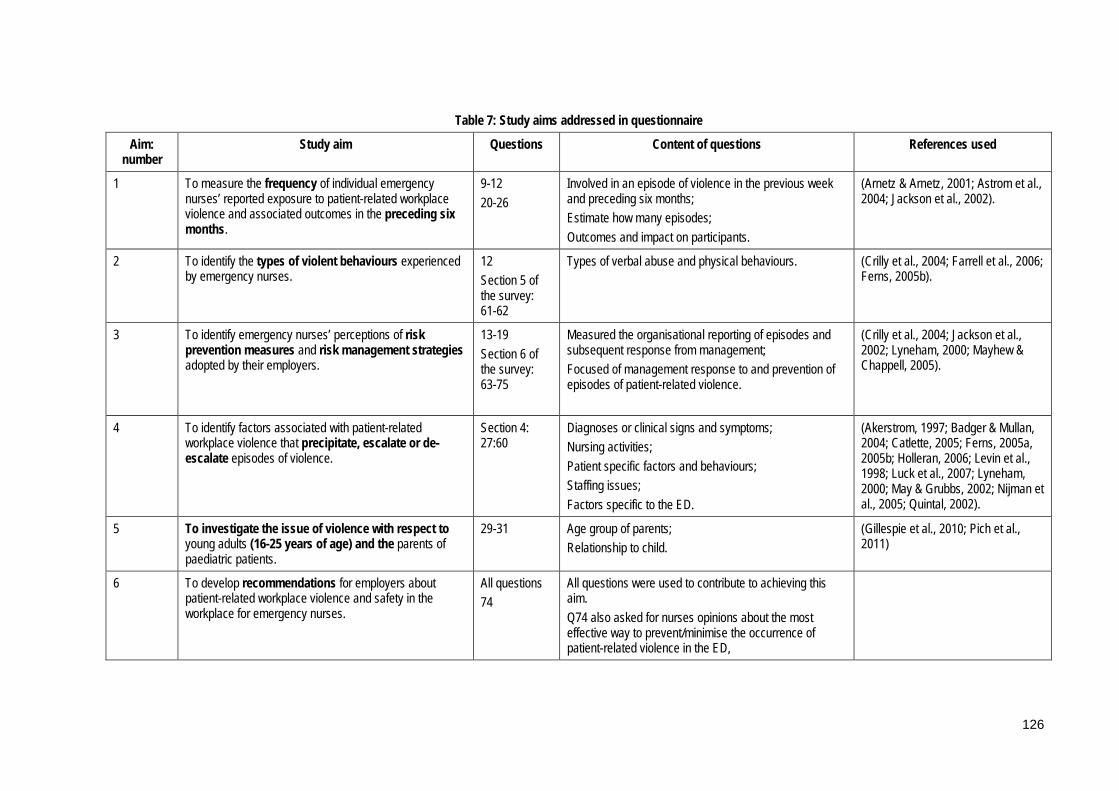
Table 7: Study aims addressed in questionnaire
Aim: number
Study aim Questions Content of questions References used
1 To measure the frequency of individual emergency nurses’ reported exposure to patient-related workplace violence and associated outcomes in the preceding six months.
9-12 20-26
Involved in an episode of violence in the previous week and preceding six months; Estimate how many episodes; Outcomes and impact on participants.
(Arnetz & Arnetz, 2001; Astrom et al., 2004; Jackson et al., 2002).
2 To identify the types of violent behaviours experienced by emergency nurses.
12 Section 5 of the survey: 61-62
Types of verbal abuse and physical behaviours. (Crilly et al., 2004; Farrell et al., 2006; Ferns, 2005b).
3 To identify emergency nurses’ perceptions of risk prevention measures and risk management strategies adopted by their employers.
13-19 Section 6 of the survey: 63-75
Measured the organisational reporting of episodes and subsequent response from management; Focused of management response to and prevention of episodes of patient-related violence.
(Crilly et al., 2004; Jackson et al., 2002; Lyneham, 2000; Mayhew & Chappell, 2005).
4 To identify factors associated with patient-related workplace violence that precipitate, escalate or de-escalate episodes of violence.
Section 4: 27:60
Diagnoses or clinical signs and symptoms; Nursing activities; Patient specific factors and behaviours; Staffing issues; Factors specific to the ED.
(Akerstrom, 1997; Badger & Mullan, 2004; Catlette, 2005; Ferns, 2005a, 2005b; Holleran, 2006; Levin et al., 1998; Luck et al., 2007; Lyneham, 2000; May & Grubbs, 2002; Nijman et al., 2005; Quintal, 2002).
5 To investigate the issue of violence with respect to young adults (16-25 years of age) and the parents of paediatric patients.
29-31 Age group of parents; Relationship to child.
(Gillespie et al., 2010; Pich et al., 2011)
6 To develop recommendations for employers about patient-related workplace violence and safety in the workplace for emergency nurses.
All questions 74
All questions were used to contribute to achieving this aim. Q74 also asked for nurses opinions about the most effective way to prevent/minimise the occurrence of patient-related violence in the ED,
126

3.4.2.2 Stage 2
Stage 2 assessed previous studies relevant to this survey. The second stage in the
development of the questionnaire included a search of the literature and
identification of previous studies relevant to the study. Relevant items were
identified and adopted or modified and then incorporated into the survey, please see
Table 7.
The literature was used to construct lists of emotional and professional responses
following episodes of patient-related violence. Effects reported in the literature
include feelings of guilt, self-doubt, feelings of professional incompetence (Arnetz &
Arnetz, 2001); anger, powerlessness, unhappiness, degradation, shame, fear,
astonishment, antipathy towards the perpetrator (Astrom et al., 2004) and
sleeplessness (Jackson et al., 2002). In addition nurses have reported feeling more
cautious as well as being afraid to be at work, leading to a situation where patients
are avoided (Arnetz & Arnetz, 2001).
In Section 4 of the questionnaire lists were provided of diagnoses or clinical
signs/symptoms of patients who displayed violent behaviour. The literature reports
that certain diagnoses or medical conditions may be a risk factor for episodes of
patient-initiated violence, particularly those associated with cognitive dysfunction
(May & Grubbs, 2002), for example hypoxia, confusion and disorientation (Ferns,
2005b); traumatic brain injury (Holleran, 2006); organic brain disorders and
developmental delay (Quintal, 2002) and dementia (Badger & Mullan, 2004). People
with mental health diagnoses have also been also been identified as a risk group for
potential violence, (Catlette, 2005), especially involuntary psychiatric patients
(Nijman et al., 2005).
A list was also constructed of nursing activities that were reported to be occurring at
the time of violent episodes and the location in the department where such episodes
127

occurred. Questions 45 to 48 measured contributing and precipitating factors for
patient-related violence and the literature was sourced to compile lists for patient
specific factors and behaviours; staffing issues and factors specific to the ED. For
example waiting times; (Akerstrom, 1997; Levin et al., 1998); unrealistic expectations
of the public (Lyneham, 2000); the busy and overcrowded nature of the ED
(Lyneham, 2000); alcohol and substance abuse (Ferns, 2005a) and the STAMP
behaviours in patients (Luck et al., 2008). The STAMP behaviours refer to five
distinct behaviours identified by the authors as predictors of potential violence:
Staring and eye contact, Tone and volume of voice, Anxiety, Menacing and Pacing
(Luck et al., 2007).
A question was added about triage categories of patients perceived to be at risk of
violence and these categories were adapted from those used in NSW Health. Please
see Table 8.
Table 8: Triage categories
Triage category Description Recommended wait time
1 Critically ill or injured patients with a life threatening condition
Immediately or within 2minutes
2 Critically ill or in severe pain with an imminently life threatening condition
10 minutes
3 Potentially life threatening conditions e.g. major fracture or severe blood loss
30 minutes
4 Potentially serious conditions e.g. sprained ankle & migraine
1 hour
5 Less urgent conditions e.g. minor aches & pains
2 hours
Adapted from (NSW Health, 2013).
Section 5 measured types of violent behaviour and lists of the types of verbal abuse
and physical behaviours were constructed from the literature. Verbal behaviours
identified in the literature include rudeness, shouting, sarcasm, swearing, unjustified
criticism, ridicule in front of others, threat of personal harm to the person, their
family or property, rumour mongering (Farrell et al., 2006) as well as sexual
128

innuendo (Crilly et al., 2004). Physical behaviours identified include a range of
behaviours, for example being pushed (Crilly et al., 2004); punched, kicked,
scratched, slapped, head butted, restrained, choked, bitten and strangled (Farrell et
al., 2006; Ferns, 2005b).
Section 6 of the questionnaire focussed on the management and prevention of
episodes of patient-related violence and lists of risk prevention/minimisation
measures and follow up strategies were compiled.
Young adults (16-25 years of age) and the parents of paediatric patients have
previously been identified as significant in the issue of violence against triage nurses
(Pich et al., 2011). These groups have not previously been discussed in the literature;
however The Garling Report (2008) reported that these age groups were over-
represented in terms of ED presentations in NSW (Garling, 2008). In addition, a
shortcoming in the provision of mandatory aggression minimisation training was
also revealed, which has implications for the safety of nurses (Garling, 2008). These
issues also were incorporated into the questionnaire.
The term “younger people”, was identified as being between the ages of 16 and 25
years of age, a grouping commonly used by government departments such as
Centrelink.
3.4.2.3 Stage 3
This stage involved testing and validation of the questionnaire and involved the use
of an expert panel. The panel was made up of eight ED nurse clinicians and
academics and was convened on March 18, 2010 at the University of Newcastle. The
questionnaire was circulated to all members of the expert panel for testing and to
provide advice about the draft questionnaire. The time taken to complete the survey
was recorded for each panel member by the researcher, and ranged from 24 to 37
minutes with an average of 31 minutes. Following this a discussion about the
129

questionnaire was facilitated by the researcher and the comments subsequently used
to make some minor changes to the form, see Table 9. This stage confirmed both the
face and content validity of the questionnaire.
130
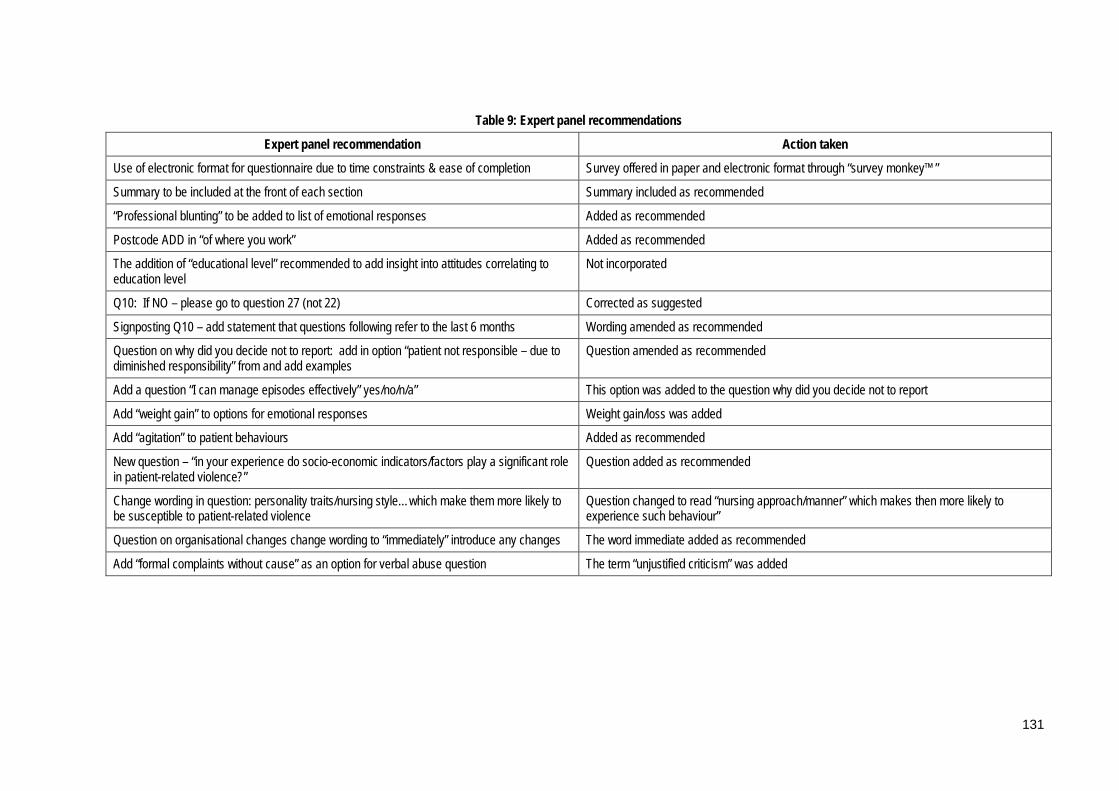
Table 9: Expert panel recommendations
Expert panel recommendation Action taken
Use of electronic format for questionnaire due to time constraints & ease of completion Survey offered in paper and electronic format through “survey monkey™”
Summary to be included at the front of each section Summary included as recommended
“Professional blunting” to be added to list of emotional responses Added as recommended
Postcode ADD in “of where you work” Added as recommended
The addition of “educational level” recommended to add insight into attitudes correlating to education level
Not incorporated
Q10: If NO – please go to question 27 (not 22) Corrected as suggested
Signposting Q10 – add statement that questions following refer to the last 6 months Wording amended as recommended
Question on why did you decide not to report: add in option “patient not responsible – due to diminished responsibility” from and add examples
Question amended as recommended
Add a question “I can manage episodes effectively” yes/no/n/a” This option was added to the question why did you decide not to report
Add “weight gain” to options for emotional responses Weight gain/loss was added
Add “agitation” to patient behaviours Added as recommended
New question – “in your experience do socio-economic indicators/factors play a significant role in patient-related violence?”
Question added as recommended
Change wording in question: personality traits/nursing style…which make them more likely to be susceptible to patient-related violence
Question changed to read “nursing approach/manner” which makes then more likely to experience such behaviour”
Question on organisational changes change wording to “immediately” introduce any changes The word immediate added as recommended
Add “formal complaints without cause” as an option for verbal abuse question The term “unjustified criticism” was added
131
3.4.3 Sample size calculation
Surveys were distributed to all members of CENA which in 2009 at the time of the
study totalled 1150. It was estimated that a 30% response rate, was necessary and
would result in a sample size of approximately 350 nurse participants. This would
allow the estimation of the point prevalence of ED nurses who had experienced
patient-related violence in their workplace with 95% confidence intervals within +/-
5.4%, assuming a prevalence of 50%.
3.4.4 Recruitment
A study package was mailed out to all members of CENA. The study packages were
assembled by the researcher and sealed.
3.4.4.1 Study package
The study package consisted of: -
• An invitation to participate in the form of an Information Statement for the
study (Appendix I);
• A paper copy of the questionnaire, which included the link to the electronic
version of the survey (Appendix H);
• A pre-addressed reply paid envelope to return the survey (Appendix J);
• A pen bearing the title and logo of the study (Appendix K).
These were forwarded to the head office of CENA, at their request, where address
labels were affixed and the packages mailed via Australia Post.
Participation was voluntary and anonymous and return of the questionnaire was
regarded as consent.
132
Recipients were given the option of returning the postal questionnaire or completing
the survey electronically through a unique link to the questionnaire on the “survey
monkey™” website included on the front page of the postal questionnaire. There
was a possibility that participants could complete both an electronic and paper
version of the survey form. A check was conducted on the free text results on the
excel spread sheet for any duplicate answers and none were located. Consequently
the researcher concluded that no duplicate surveys were returned.
3.4.4.2 Participant inclusion criteria
The target population for this study was ED nurses who met the following inclusion
criteria: -
1. Currently working clinically in an ED setting;
2. Interacting directly with patients and family/friends;
3. Willing and able to discuss their experiences with patient-related workplace
violence;
4. Financial members of CENA in 2010.
3.4.5 Methods employed to maximise the response rate
Postal questionnaires are an effective way to reach large and geographically
dispersed populations, however non-response reduces the effective sample size and
has the potential to introduce bias (Roberts, Wilson, Roalfe, & Bridge, 2004).
In an attempt to overcome this, and improve the response rate, the research team
adopted some measures identified as effective in the literature. A systematic review
by Roberts et al identified the use of financial, and to a lesser extent, non-monetary
incentives for completion of a survey (Roberts et al., 2004). This was also the case in a
systematic review of surveys of physicians (Vangeest, Johnson, & Welch, 2007).
While the use of monetary incentives was precluded in this study by ethical and
133

financial constraints, the researcher included an incentive in the form of a four-colour
pen bearing the name and logo of the study in each study package (Appendix K).
The choice of this type of pen was made as it was low cost and of practical use to
nurses in the course of their work.
The review also reported that the odds of participants responding were almost 50
percent higher when follow-up contact was used (Roberts et al., 2004). Therefore the
decision was made to send out a reminder postcard to all potential participants two
weeks after the initial distribution of the questionnaires (Appendix L). The postcards
were delivered to CENA headquarters where address labels were affixed and
distribution organised via Australia Post.
A study by Hure, Smith and Collins (2008) identified the following factors in
recruitment materials as having a negative impact on response rates: -
• Poor visual appeal;
• Extensive length of the information statement;
• Poor readability of the text;
• Appeal of the study name (Hure, Smith, & Collins, 2008).
The researcher contacted the authors for further information and their advice was
used in the design of the recruitment material. The use of images including a study
logo, colour and using a pamphlet format were recommended for the Information
Statement (Hure et al., 2008), therefore the research team made the decision to
condense the title of the study into a mnemonic that would readily identify the
study. The study title still included all the relevant information, “Violence in
Emergency Nursing and Triage”, and was abbreviated as The VENT Study. The use
of the word vent was also favoured due to its meaning as a verb: “to express a
negative emotion in a forceful and often unfair way” ("Concise Oxford English
Dictionary.," 2012). A logo was designed by an external person and the use of the
134

colour red chosen as this is often a colour associated with strong emotions (Appendix
M). This “branding” was included on all recruitment material including the pen sent
in the study package as an incentive to potential participants. It was hoped that the
pen would be used by nurses in their place of work and increase awareness about the
study.
The Information Statement was produced as a glossy colour pamphlet with all
information condensed into a double-sided A4 pamphlet to enhance readability
(Hure et al., 2008). Other methods to improve the readability included the use of
shorter sentences and paragraphs, simpler language (Hure et al., 2008) and the use of
a question and answer format with questions clearly laid out in larger red font to
attract the eye of the reader (Appendix I).
The nature of the questionnaire had some inherent advantages. For example, the
odds of response are increased when questionnaires originate from a university
rather than an alternative source, such as a government department and when the
topic is directly relevant to the potential participants (Roberts et al., 2004). The topic
of violence in the ED is one that is directly relevant to the membership of CENA.
In terms of design strategies the literature reports that postal and phone surveys are
typically more successful than fax or web based approaches, however a mixed-model
is also recommended (Vangeest et al., 2007). The decision to offer the questionnaire
in both a traditional postal and electronic web format was an attempt to improve the
response rate as some evidence suggests that the electronic method is favoured over
the traditional paper version (Bushnell, Martin, & Parasuraman, 2003; McFall &
Milke, 2007).
3.4.6 Data entry
All questionnaires returned by post were manually entered in to the “survey
monkey”™ site by the researcher. This was to ensure that all questionnaires were
135

stored in the same format for data analysis. The majority of surveys, n = 471, 89%,
were returned by post, with 66 submitted online using the “surveymonkey”™ link.
3.4.7 Data analysis
The survey data were entered onto an excel spread sheet, checked for accuracy and
completeness and preliminary analysis conducted using excel and descriptive
statistics. Analysis enabled the characteristics of the study population to be
summarised through measures of central tendency, including means, median and
mode.
A Statistical Analysis Plan was created and used to guide statistical analysis
(Appendix N). The statistical analysis program using Stata™ V11 (STATA Corp., TX,
USA) was used for the analysis of the survey data.
Categorical data were compared using Pearson’s chi-square analysis with p-values of
<0.05 considered significant. Fishers exact test was used for comparisons involving
cell counts that were was less than five. In particular we considered the associations
between any “violence experienced in the preceding six months” with “nursing
activities”; “location in the department”; “patient behaviours”; “clinical diagnoses”;
“work fraction”; “age”, and “years of ED nursing experience”. Uni- and
multivariable Logistic regression analysis was performed to estimate odds ratios for
these associations (both crude and adjusted). To estimate the odds ratios over a
greater period of time, the corresponding logit coefficient was multiplied by the
relevant number (for example by five to estimate the results over a five year period.
Data for postcodes were categorised according to geographic location: metropolitan,
regional and other, which included remote areas, using Australian Bureau of
Statistics classification (Pink, 2011). Chi-squared analysis was then used to compare
results of individual questions to geographic location where applicable. The “other”
group contained a small number of participants (n = 21), therefore sub-set analyses
136

were conducted where necessary to remove the effect of this group on the results for
metropolitan and regional locations.
The first aim of the study was to measure the frequency of individual emergency
nurses’ reported exposure to patient-related workplace violence and associated
outcomes in the preceding six months. Basic statistical analysis was performed
including mean, median, interquartile range, standard deviation and range. Data
were compared by geographical regions using Pearson’s chi-squared analysis and
Fisher’s exact test.
The second study aim addressed was to identify the types of violent behaviours
experienced by emergency nurses. Descriptive statistics were performed on the data
and Pearson’s chi-squared analysis and Fisher’s exact test were used to compare
these variables with “episode of violence experienced in the previous six months”.
Data also were compared by region using Pearson’s chi-squared analysis and
Fisher’s exact test.
The third aim of the study was to identify emergency nurses’ perceptions of risk
prevention measures and risk management strategies adopted by their employers.
Descriptive statistics were used to analyse the data and Pearson’s chi-squared
analysis and Fisher’s exact test were performed to compare these variables with
“episode of violence experienced in the previous six months”. Data also were
analysed by region using Pearson’s chi-squared analysis and Fisher’s exact test.
The fourth study aim was to identify factors associated with patient-related
workplace violence that precipitate, escalate or de-escalate episodes of violence.
Descriptive statistics were performed on the data and Pearson’s chi-squared analysis
and Fisher’s exact test were performed to compare these variables with “episode of
violence experienced in the previous six months”. Data also were analysed by region
using Pearson’s chi-squared analysis and Fisher’s exact test. In addition uni- and
137

multivariable Logistic regression analysis was performed to estimate odds ratios for
these associations (both crude and adjusted).
The final study aim addressed in this part of the study was to investigate the issue of
violence with respect to the parents of paediatric patients. Descriptive statistical
analysis was performed and the data compared by geographic region using
Pearson’s chi-squared analysis and Fisher’s exact test.
Free-text questions that required comments from respondents in the survey were
read independently and used to construct codes for the content of responses to each
item. Coding was done by the researcher and independently by two researchers
experienced with qualitative research. All coding was compared and any
discrepancies identified were discussed and codes agreed and allocated to the
response. These were reported as descriptive data only, in content categories. Some
of the data were coded to discrete categories and others were coded to other
categories dependent on the nature of the data.
3.5 Part II: Interviews with ED nurses
A qualitative descriptive methodology based on the work of Sandelowski was
chosen for Part II of the study (Sandelowski, 2000b). The first part of the study was a
national cross sectional survey that sought to report on ED nurses’ experiences with
patient-related violence. The aim of Part II was to describe the experiences of
Australian ED nurses with episodes of patient-related violence from young adults
(16-25 years of age) and episodes of parent-related violence from those
accompanying paediatric patients. The collection of more in-depth data on these two
sub-groups of interest was to achieve the fifth study aim of the study: To investigate
the issue of violence with respect to young adults (16-25 years of age) and the
parents of paediatric patients.
138

3.5.1 Study design
A qualitative descriptive approach was used. Qualitative descriptive studies have
been described as the least theoretical of all qualitative approaches and have been
criticised for being too simple and lacking rigour (Neergaard et al., 2009). They are
most closely aligned with naturalistic inquiry, which involves studying something in
as close to its natural state as possible (Sandelowski, 2000b), and seeks to investigate
phenomenon in their natural setting, free of manipulation (Streubert & Carpenter,
1995). This approach acknowledges that human behaviour is influenced by the
setting in which it occurs and therefore must be studied in that setting in order for a
true representation of the phenomenon to be uncovered (Polit, Beck, & Hungler,
2001).
Qualitative content analysis is the analytical style of choice in qualitative descriptive
studies (Sandelowski, 2000b), and was employed to analyse data from Part II of the
study and the free-text responses from Part I. Other authors refer to this as thematic
analysis, arguing that content analysis relies on pre-determined categories assigned
by the researcher (Braun & Clarke, 2006). However, Sandelowski (2000b) argues that
content analysis in qualitative research is distinct from its quantitative counterpart in
that it is data-driven and not subject to pre-existing codes or predetermined
categories (Sandelowski, 2000b).
A theme captures something important about the data in relation to the research
question, and represents some level of patterned response or meaning within the
data set (Braun & Clarke, 2006) and the identification of themes is central to all
qualitative research (Sandelowski & Leeman, 2012). Qualitative content analysis or
thematic analysis is a flexible method for identifying, analysing, and reporting
patterns or themes identified in data (Boyatzis, 1998) which can potentially provide a
rich and detailed, yet complex account of data (Braun & Clarke, 2006).
139

The researcher plays an active role in analysis by identifying patterns or themes, and
selecting which are of interest, to report on (Braun & Clarke, 2006). Themes do not
merely “emerge” from the data and “if themes ‘reside’ anywhere, they reside in our
heads from our thinking about our data and creating links as we understand them”
(Ely, Vinz, Downing, & Anzul, 2004) (p. 205-6). Such analysis should however be
low-inference in nature and thus more likely to result in consensus among
researchers and participants alike (Neergaard et al., 2009; Sandelowski, 2000b). The
researcher should also be mindful not to impose their own views or ideas about the
subject into the analysis and so potentially create a bias in the results (Sandelowski,
2000b). The presentation of qualitative findings as thematic sentences can enhance
their accessibility to readers and facilitate their transference into interventions able to
be implemented in practice (Sandelowski & Leeman, 2012)
3.5.2 Recruitment of the sample
An Expression of Interest for participating in Part II of the study was included at the
end of the questionnaire (Appendix O). This invited interested nurses to participate
in semi-structured interviews to discuss their experiences with patient-related
violence, specifically involving young adults (16-25 years of age) and/or the parents
or carers of paediatric patients. Interested parties were invited to e-mail the
researcher with their contact details and not to include any identifying information
when returning the questionnaire to maintain anonymity in the survey.
Participants were recruited to the study using purposeful sampling. Purposeful is
defined as “directed towards a purpose” ("Concise Oxford English Dictionary.,"
2012), and its logic and power lies in selecting information-rich cases for study in
depth (Coyne, 1997). This is a form of non-probability sampling in which participants
are chosen by the researcher based on a variety of criteria, including specialist
knowledge of the of the research topic, or capacity and willingness to participate in
the research (Oliver, 2006).The advantage of purposive sampling is that the
140

researcher can identify participants who are likely to provide data that are detailed
and relevant to the research question and study aims. The disadvantage lies in the
subjectivity of the researcher’s decision making in choosing participants (Oliver,
2006). The use of an Expression of Interest meant that participants were in effect
“self-selecting”, and this can have implications for the transferability of the results, as
the characteristics of non-participants are not able to be compared to participants
(Haber, 1994).
In this study purposive sampling was employed, however all participants were
chosen from the same population: members of CENA, which strengthens the
transferability of the sample. In addition participants were chosen from three
Australian states and were all working in the same position and job setting in the ED,
adding to the transferability of the findings.
3.5.3 Inclusion criteria
Participants were recruited if they met the following inclusion criteria:
• Registered Nurses;
• Had worked clinically in an Australian ED in the preceding six months;
• Members of CENA in 2010;
• Returned an Expression of Interest for participating in interviews.
3.5.4 The sample
Eleven Registered Nurses responded and accepted the invitation to participate in an
interview and were recruited as a result of this purposive recruitment strategy. This
is the recruitment strategy of choice in qualitative descriptive methodology, and the
goal was to obtain information to fulfil the fifth aim of the study (Sandelowski,
2000b). The participants included seven female and four male participants, with a
141
median age of 44 and an average of fifteen years clinical experience working in the
ED environment. The sample was drawn from metropolitan and regional locations
across the states of New South Wales, Queensland and Victoria, and the Australian
Capital Territory, in Australia.
3.5.5 Demographic profile
A demographic profile sheet was developed by the researcher to collect basic data
about the participants including gender, age and years of experience (See Appendix
P). Participants were asked to complete this prior to the interviews.
3.5.6 Interview schedule
Interviews are reported to be the most commonly used qualitative data collection
technique used in health care settings (Pope & Mays, 2006). Data collection in
qualitative descriptive studies usually involves minimally to moderately- structured
open-ended questions (Sandelowski, 2000b), to understand the participants’
experiences of the phenomenon of interest, therefore this part of the study utilised
semi-structured interviews. The interview aimed to discover the “who”, “what” and
“where” of events or experiences (Sandelowski, 2000b). Two interview schedules
were developed and designed to explore ED nurses’ individual experiences of
patient-related workplace violence with the two sub-groups of interest, young adults
and the parents of paediatric patients (Appendices Q and R). Participants were asked
to describe a typical encounter and the feelings such an encounter caused. They also
were asked about their ability to resolve a difficult situation and the level of support
received from their colleagues and management at their place of work.
A series of open-ended questions were developed based on a review of the current
literature pertaining to the topic (Estryn-Behar et al., 2008; Farrell et al., 2006; Ferns,
2005b; Lau et al., 2004; Pich et al., 2011). The literature states that effective questions
should be open-ended, neutral, sensitive and clear to the interviewee (Patton, 1987).
142

The researcher should ensure that the questions reflect the aims of the study and
progress in a logical sequence and should not be leading in nature. The researcher
should remain flexible and be able to diverge from the interview schedule to pursue
an interesting idea or response in more detail if required (Pope & Mays, 2006). The
interview process should be interactive and sensitive to the language and concepts
used by the participants (Pope & Mays, 2006).
Qualitative research findings are considered reliable when the descriptions are so
authentic that the participants recognise their experiences from the researcher’s
descriptions or others recognise the experience after having only read it in a study
(Norwood, 2000).
Qualitative descriptive research recognises the importance of the researcher in the
research process and in particular the importance of remaining objective (Norwood,
2000). Subjectivity and the researcher leading the participant are viewed as
significant threats to the internal validity of a study (Norwood, 2000). The researcher
must avoid imposing their assumptions on the interviewee’s account and remain
open to the possibility that the themes that emerge from the interview may be very
different from those that might have been predicted at the onset (Pope & Mays,
2006). A major threat to internal validity can occur when the researcher becomes so
involved with the participants ‘experiences that they lose objectivity (Norwood,
2000). Researchers can overcome this by monitoring their responses through
techniques including journaling or debriefing with a colleague (Norwood, 2000). To
this end the researcher took field notes during interviews and these were discussed
in regular meetings with the senior researchers on the study. A summary of these is
provided as Appendix T.
A definition was adapted from Mayhew and Chappell (2005) for the term violence
and provided to participants prior to interviews commencing to ensure consistency
of understanding among the participants (Mayhew & Chappell, 2005). The definition
143

referred to verbal abuse and threats, sexual harassment as well as physical assaults. It
also covered episodes that involved both an explicit and implicit challenge to the
wellbeing, safety or health of participants at work (Mayhew & Chappell, 2005). The
term “patients” included the parents/guardians or carers accompanying paediatric
patients.
To establish the validity of the interview schedules they were peer reviewed by a
senior researcher with clinical experience in the ED environment (DS). Slight
modifications were then incorporated into the final version of the interview
schedules.
3.5.7 Data collection
Interviews were conducted in-person or over the phone depending on the location of
the participant and recorded using a digital recorder. Face-to-face interviews were
conducted at the workplace of the participant at a time convenient to them.
At the beginning of the interview, any questions arising from the Information Sheet,
or Consent Form were addressed and the Demographic Profile Sheet was completed.
The definition of violence was provided to all participants on the Information Sheet
and also reiterated by the researcher prior to the interview commencing. The
importance of participants feeling relaxed and at ease in the interview is stressed in
the descriptive qualitative research process (Schneider, Elliott, Lo-Biondi-Wood, &
Haber, 2004). It can take time for participants to feel comfortable enough to speak
freely in front of a machine (Pope & Mays, 2006). To this end participants were made
to feel comfortable and relaxed through a brief informal discussion where the
researcher shared details of her experience and background. Thus by the time the
digital recorder was started and the interview began, the participants were more at
ease and comfortable with being recorded.
144

Data collection continued until no new categories were extracted from the data and
thus it was considered that saturation had been achieved. (Pope & Mays, 2006).
Saturation is defined as data adequacy and refers to the point of diminishing return
in qualitative studies where collecting more data does not necessarily lead to more
information being uncovered (Mason, 2010). In qualitative research there are no
published guidelines for determining saturation equivalent to those in quantitative
research, however failure to achieve saturation impedes the quality of the research
(Morse, 1995). Therefore it is important for the researcher to be able to estimate when
data saturation has been achieved in their study. One of the principles for achieving
saturation is to select a cohesive sample; the greater the cohesiveness of a sample the
faster saturation will be obtained (Morse, 1995). All participants in this study were
recruited using purposive sampling and were similar in that all satisfied the
inclusion criteria: they were all Australian ED nurses who had experienced episodes
of patient-related violence in the preceding six month period.
3.5.8 Transcription of recorded information
Digital recordings of the interviews were transcribed verbatim by an independent
transcriber, hired by the researcher through the university, who agreed to maintain
confidentiality of the data. Transcripts were checked for errors against recorded
versions by the researcher to ensure the accurate and authentic reproduction of
accounts. The aim of transcription is to overcome the limitations of language and to
reflect as closely as possible the experience of the conversation (Schneider et al.,
2004). Field notes taken at the time of the interviews were used to augment the
transcripts and detail the researcher’s experience and reflection on the interview
(Appendix T).
145

3.5.9 Member checking
Participants were provided with an opportunity to read transcripts of their
interviews and comment on their accuracy. When transcription had been completed,
copies of transcripts were returned to participants by mail with a reply paid
envelope and space provided to either confirm or reject the accuracy of the data as
presented.
3.5.10 Data analysis
Data from demographic profiles was used to provide basic data about the sample,
including age, gender and years of experience using summary statistics.
Transcripts of digital recordings were analysed using qualitative content analysis
(Sandelowski, 2000b) or thematic analysis (Braun & Clarke, 2006), and the aim was to
let the data speak for itself and limit the influence of the researcher on the results
(Sandelowski, 2000b). Thematic analysis was conducted on these data using a
structured approach described by Sandelowski and Neergard et al (Neergaard et al.,
2009; Sandelowski, 2000b) and based on the approach discussed by Miles and
Huberman (Miles & Huberman, 1994).
Participants were de-identified and coded using numbers from p1 to p11 to maintain
their confidentiality. After the initial categorisation of data using categories obtained
from the interview schedule, additional categories were identified. Independent
coding of data using descriptive labels was conducted to identify important
features/similar phrases and patterns in the data by the researchers that described the
experiences of the participants. Subsequently the results of independent coding were
discussed and compared by two researchers (JP and MH) to determine
commonalities and differences across the data, and themes and relationships
between them were agreed on. A summary of the process used is detailed in Figure
2.
146

Figure 2: Flowchart of data analysis of interview data
Transcription of digital recordings.
Validation of transcripts with participants: Participants were provided with a copy of their transcript and asked to comment on its
validity and the extent to which it represents an accurate record of their responses.
Initial categorisation: using categories based on semi-structured interview schedules.
Coding using descriptive labels related back to the qualitative aim of the study.
Results of coding discussed and compared to determine commonalities and differences with qualitative expert (MH).
Themes and relationships between descriptive labels were agreed upon with qualitative expert (MH).
147

Qualitative description is recommended as the method of choice where a description
of a phenomenon is sought and is especially relevant where the aim is to gain first-
hand knowledge of health professionals’ experience with a particular topic
(Neergaard et al., 2009).
The research team utilised qualitative content analysis or thematic analysis to analyse
the data obtained from semi-structured interviews of participants, and this is the
most common method used in health care (Pope & Mays, 2006) To facilitate a
stronger analysis the researchers sought to establish relationships between the
themes uncovered. In this way thematic analysis can be used to develop
classifications or models/diagrams to represent such connections (Pope & Mays,
2006).
The researchers employed inductive analysis to code the data, which is a data-driven
process that seeks to work from the data to identify themes, rather than trying to fit
them into a preconceived framework (Braun & Clarke, 2006). The process is
described as fluid and non-linear, with the researcher moving backwards and
forwards between the original data and emerging themes (Pope & Mays, 2006). Peer
review of emergent themes was conducted using an experienced qualitative
researcher and member of the research team (MH).
To illustrate the process used, an example of the identification of the over-arching
theme of “feeling unsafe at work” is detailed below. Four main themes emerged
from the data: “performing and attention seeking behaviours” by patients seeking to
gain entry to the ED; “parental emotions”; patients presenting with “alcohol and
substance abuse” and “issues and experiences around the types of verbal and
physical violence experienced or witnessed”.
Upon further examination of the transcripts, it became apparent that many
comments in all four categories described a workplace that was at times unsafe.
Comments included: “I’m scared not just for myself but I’m scared for the other
148

people around me” (p1), while discussing violence from a parent; “…three little old
ladies in tears terrified that they were going to be hurt…” (p3), while discussing a
patient exhibiting attention seeking behaviour; “…you don’t know if they are nuts
enough they could find you…”’; while discussing types of verbal abuse encountered
and “…nurses are going to be killed in the future…” (p3), while discussing violence
from a patient under the influence of alcohol. After consideration of the four main
themes overall, a decision was made in consultation with an experienced qualitative
researcher (MH) to create a final category: “feeling unsafe at work”. To illustrate the
inter-connectedness between all of the themes, it was labelled an over-arching theme.
149

3.5.11 Rigour and trustworthiness
In qualitative research, rigour is considered in terms of trustworthiness. The concept
of rigour speaks to the overall truth and validity of a study and how the methods
employed stand up to the scrutiny of other researchers (Milne & Oberle, 2005). Guba
proposed four criteria to establish the trustworthiness of qualitative research:
credibility, transferability, dependability and confirmability (Guba, 1981). Credibility
refers to the internal validity of a study or confidence in the truth of the findings, that
is that the study measures or tests what was actually intended (Shenton, 2004). It has
been argued that establishing credibility is one of the most important factors in
establishing trustworthiness of a study (Lincoln & Guba, 1985). This was addressed
in this study in a number of ways. Firstly through the use of member-checking,
which Lincoln and Guba regard as the single most important method of ensuring
credibility in a study (Lincoln & Guba, 1985).
Peer review of emergent themes was provided by an experienced qualitative
researcher (MH) to confirm consistency with the data and to reduce subjective
interpretation (Milne & Oberle, 2005). Frequent debriefing sessions between the
researcher and her supervisors also were conducted throughout the data analysis
process to enable the researcher to identify any biases or preferences in analysis and
to widen and strengthen the discussion (Shenton, 2004).
Transferability or fittingness refers to the probability that the findings of the study
have meaning to others in similar situations (Schneider et al., 2004). This relates to
the external validity of the study and the extent to which the findings of one study
can be applied to other situations (Shenton, 2004). In this study this was
demonstrated by comparison of the results to the body of evidence-based literature
on the topic (Streubert & Carpenter, 1995). While a small sample size has
implications for the rigour of a study, the fact that the participants in this study were
150

drawn from four Australian states and territories improves the transferability of the
findings.
Dependability refers to the ability to duplicate the findings of the study. That is if the
study were repeated with the same methods and participants in the same context,
similar results should be obtained (Shenton, 2004). It is closely aligned with the
concept of credibility and involves providing a detailed description of the processes
within the study to enable a future researcher to repeat the work (Shenton, 2004).
This level of detail has been provided in this chapter: by making the processes used
visible and acknowledging the strengths and limitations of the study (Milne &
Oberle, 2005).
Finally confirmability refers to the objectivity or neutrality of a study, or the degree
to which the findings are shaped by the participants and not researcher bias,
motivation or interest (Shenton, 2004). This was achieved through the use of an audit
trail (Schneider et al., 2004), where decisions made during analysis were documented
and reviewed by the peer reviewer (MH). Please see Appendix U.
Other concepts discussed in the literature include authenticity, or the ability to
remain true to the phenomenon under study and integrity, which refers to the
attention paid to research-related decisions (Milne & Oberle, 2005). The authenticity
of a qualitative descriptive study depends not only the ability to capture participants’
experiences but to accurately analyse and represent them (Milne & Oberle, 2005).
However the ultimate test of a study’s integrity is the usefulness of the findings and
how they resonate with the target population (Milne & Oberle, 2005).
151

3.6 Ethical considerations
3.6.1 Potential distress for participants
Ethical safeguards are important in research, especially where there is a risk to
participants. In this study there was a slight risk to participants that recalling an
event during completion of the survey form or participation in an interview could
result in distress. To minimise this risk, information was included in the Information
Statement advising participants where to seek help if this occurred.
Prior to the interviews taking place, participants were reminded of this information
and advised that they could stop the interview at any time if they became distressed
or were unable to continue for any reason. In addition, the researcher monitored
participants for signs of distress during interviews. The researcher was prepared to
discontinue interviews in the event that this occurred and to direct participants to
seek support as detailed above.
3.6.2 Information sheets
An Information Sheet about the study (Appendix I) for potential participants was
approved for inclusion in the study package and also provided to participants prior
to interviews being conducted. It included information to fully inform them of the
study including: -
• The voluntary nature of their participation;
• Their right to withdraw from the study at any time;
• Their right to confidentiality, anonymity and security with regards to all
information collected;
• The potential benefits and risks of the study;
152
• That some participants might find that recalling events during the completion of
the questionnaire distressing. Participants were asked to contact their Employees’
Assistance Program or the Nurses’ Association in their state or territory if this
occurred. In addition contact details for Lifeline were included. Lifeline is a
national charity that provides telephone access to 24-hour crisis support and
suicide prevention services.
3.6.3 Consent
Consent was deemed to be given through the completion and return of a
questionnaire to the researchers, or through submission of an electronic
questionnaire through the “survey monkey™” link. A statement to this effect was
included in the Information Sheet: “completion of the survey form will be taken as
your informed consent” (Appendix I). Anonymity of participants was ensured with
no individually identifiable data collected in the survey. The Expression of Interest to
participate in Part II of the study was returned separately and could not be linked
back to the survey submission (Appendix O).
Prior to commencement of interviews, and after reading the Information Sheet,
participants were asked to read and sign a consent form (See Appendix S). Thus they
consented to being interviewed, having the interview digitally recorded and to
completing the Demographic Profile Sheet (Appendix P). This was to ensure that
participation in the study was voluntary. Participants were assured of confidentiality
and advised that they could withdraw from the study at any time. In addition,
participants were given the option to request a summary of the results at the
conclusion of the project: however no participants made this request.
3.6.4 Confidentiality
The researchers did not have access to the CENA database containing the names and
addresses of the study population. All recruitment material was couriered to the
153

head office of CENA in Sydney, NSW where staff of that organisation affixed
address labels. The study packages were then posted directly to the study population
via Australia Post. All returned surveys and those completed electronically were
non-identifiable and this was outlined in the Information Sheet: “the survey form is
anonymous and it will not be possible to identify you from your answers”
(Appendix I).
No identifying information was included on digital recordings or transcripts and
participants were cautioned not to name any third parties during the interview or to
provide information that might reveal their identity. Individual participants were not
identifiable in data files or digital recordings, and no identifying information was
included in any publications, presentations or this thesis.
3.6.5 Data storage
The completed consent forms and demographic profiles were stored in a separate
location and interviewees were identified by a code rather than a name in the
transcripts and electronic files. All hard copies of questionnaires were stored in
locked filing cabinets in secure offices of the researcher and all electronic data were
stored on password protected computers and only accessible by the research team.
Material on the “survey monkey™” website was also password protected.
Data files and digital recordings were only accessible by the research team and were
password protected. Transcription was undertaken by an independent third party
and no identifying information was provided to that person.
All data and digital recordings were stored in a secure location in a locked filing
cabinet in a locked office of the researcher. On completion of the project all digital
recordings and transcripts have been stored at a secure location. They will be
disposed of 5 years after the conclusion of the project in accordance with the State
Records Act 1998 (NSW) and the Australian Code for the Responsible Conduct of
154

Research (2007). Electronic files will be erased and all paper files shredded or
disposed using secure document disposal.
3.7 Conclusion
This chapter has discussed the research design used in the study. It began with
elements used in the design, including the use of a mixed methods approach with
both quantitative and qualitative components used to expand the scope of the study.
The development of the data collection tools: questionnaire and interview schedules
were discussed and the process of recruitment and data collection reported. The
methods used to analyse the data collected in both the survey data and interview
transcripts were detailed as were the ethical requirements of the research. Finally the
components ensuring trustworthiness and rigour of the study were described.
155

Chapter 4 Results from survey data: Part I
This chapter reports the results from a survey of CENA members in 2010 about their
experiences with patient-related violence in the ED. This chapter has been structured
to address the study aims: -
1. To measure the frequency of individual emergency nurses’ reported exposure
to patient-related workplace violence and associated outcomes in the
preceding six months;
2. To identify the types of violent behaviours experienced by emergency nurses;
3. To identify emergency nurses’ perceptions of risk prevention measures and
risk management strategies adopted by their employers;
4. To identify factors associated with patient-related workplace violence that
precipitate, escalate or de-escalate episodes of violence;
5. To investigate the issue of violence with respect to young adults (16-25 years
of age) and the parents of paediatric patients;
6. To develop recommendations for employers about patient-related workplace
violence and safety in the workplace for emergency nurses.
NB: The abbreviation “p” refers to participant in this chapter.
Analyses of Survey Data
Categorical data were compared using Pearson’s chi-square analysis with p-values of
<0.05 considered significant. Fisher’s exact test was used for comparisons where cell
counts were less than five. In particular we considered the associations between any
“violence experienced in the preceding six months” with “nursing activities”,
“location in the department”, “patient behaviours”, “clinical diagnoses”, “work
fraction”, “age”, and “years of ED nursing experience”. Uni- and multivariable
Logistic regression analysis was performed to estimate odds ratios for these
associations (both crude and adjusted). Data for postcodes were categorised
156

according to geographic location: metropolitan, regional and other, which included
remote areas. Chi-squared analysis was then used to compare results of individual
questions to geographic location where applicable. The “other” group contained a
small number of participants (n = 21), therefore sub-set analyses were conducted
where necessary to remove the effect of this group on the results for metropolitan
and regional locations.
Cells in graphs that contain statistically significant results have been shaded to
facilitate their identification by the reader. Some questions in the survey provided
space for participants to provide comments. These are reported with the numeric
data for these questions. Other questions only required free-text comments and these
data have been analysed using descriptive statistics only.
NOTE: for data that were normally distributed, means and standard deviations are
reported and for data with a skewed distribution medians and inter-quartile ranges
are reported.
The results from Part I of the study, the survey data, are presented in this chapter.
The data from Part II of the study, published in the International Emergency Nursing
Journal are reported separately (see Chapter 5).
4.1 Definitions
The term “violence” was defined in the survey to include verbal abuse and threats,
sexual harassment as well as physical assaults. It included any episode that involved
either an explicit or implicit challenge to the well-being, safety or health of ED nurses
at their place of work (Mayhew & Chappell, 2005).
The term “patients” was broadened to include parents/guardians or carers who
accompanied paediatric patients to the ED.
157

4.2 Response rate
Questionnaires were distributed to all financial members of the College of
Emergency Nursing Australasia (CENA). The total membership of CENA at the time
of sampling in 2010 was 1150. The final figures for participation are shown in Table
10. The total number of eligible participants with a completed questionnaire was 537
which resulted in a response rate for this study of 51%. Surveys of nurses are an
important tool in nursing research, however they are often characterised by low
response rates (VanGeest & Johnson, 2011). A systematic review of studies designed
to improve response rates in nursing research analysed 22 publications reporting 30
experiments that compared recruitment strategies and found that the majority of
studies (n = 27) reported response rates below 50%, with some less than 10%
(VanGeest & Johnson, 2011).
Table 10: Final participation responses
Stage/Action Number of potential participants Number of actual participants at each stage
Study packages sent 1150
Returned to sender 26 1124
Non respondents 526
Responses 598
Returned, Question 1 = Ineligible 56
Returned Blank – non-consenting 5
Questionnaire returned – incomplete
6
Eligible participants – returned completed questionnaire
531*
*NOTE: some respondents did not answer every question in the survey and consequently not all tables report responses from the total of 531 participants.
4.3 Characteristics of participants
The characteristics of the participants are reported in Tables 11 and 12.
158

Most participants were Registered Nurses (n = 526, 99%), including Clinical Nurse
Consultants, Clinical Nurse Specialists, Clinical Nurse Educators and Nurse
Practitioners. Eleven percent (n = 60) had management responsibilities and there
were 36 (7%) Nurse Practitioners.
159

Table 11: Characteristics of participants §
Variable Category Metropolitan (n = 233)
(%)
Regional (n = 218)
(%)
Other (n = 21)
(%)
No postcode (n = 59)
(%)
Total (n = 531)
(%)
Nursing role (n = 531)
Enrolled Nurse 0 0 0 0 0
Endorsed Enrolled Nurse 4 (2) 1 (<1) 0 0 5 (1)
Registered Nurse 95 (41) 101 (46) 9 (43) 27 232 (44)
Clinical Nurse Consultant 9 (4) 9 (4) 0 4 22 (4)
Clinical Nurse Specialist 56 (24) 48 (22) 3 (14) 17 124 (23)
Clinical Nurse Educator 28 (12) 15 (7) 4 (19) 5 52 (10)
Nurse Unit Manager 28 (12) 27 (12) 3 (14) 2 60 (11)
Nurse Practitioner 13 (6) 17 (8) 2 (10) 4 36 (7)
Total 233 218 21 59 531
Category Metropolitan (n = 232)
(%)
Regional (n = 218)
(%)
Other (n = 21)
(%)
No postcode (n = 55)
(%)
Total (n = 526)
(%)
Age n = (526) ∞
20-29 29 (13) 21 (10) 1 (5) 10 61 (12)
30-39 64 (28) 59 (27) 8 (38) 16 147 (28)
40-49 82 (35) 75 (34) 6 (29) 14 177 (34)
50-59 49 (21) 53 (24) 6 (29) 15 123 (23)
60+ 8 (3) 10 (5) 0 0 18 (3)
Total 232 218 21 59 526
160
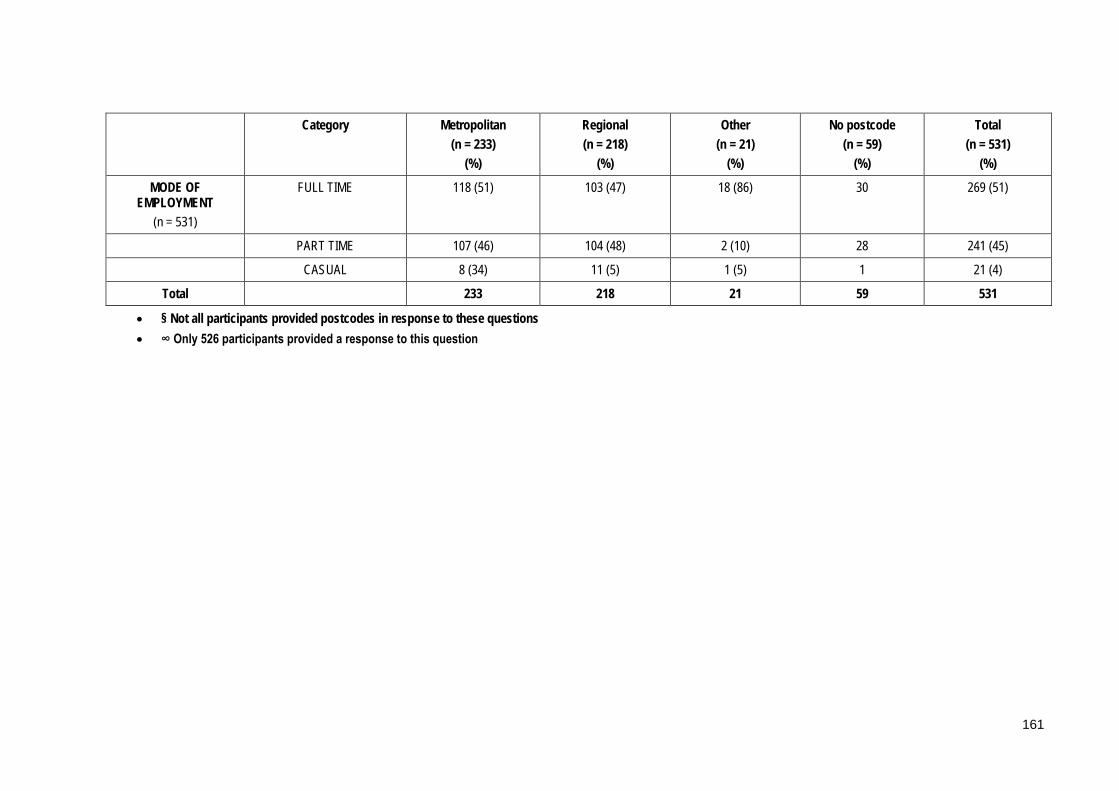
Category Metropolitan (n = 233)
(%)
Regional (n = 218)
(%)
Other (n = 21)
(%)
No postcode (n = 59)
(%)
Total (n = 531)
(%)
MODE OF EMPLOYMENT
(n = 531)
FULL TIME 118 (51) 103 (47) 18 (86) 30 269 (51)
PART TIME 107 (46) 104 (48) 2 (10) 28 241 (45)
CASUAL 8 (34) 11 (5) 1 (5) 1 21 (4)
Total 233 218 21 59 531
• § Not all participants provided postcodes in response to these questions • ∞ Only 526 participants provided a response to this question
161

Table 12: Characteristics of participants (continuous data) §
Variable Range Mean (Standard Deviation)
Metropolitan (n = 232)
Regional (n = 218)
Other (n = 21)
Age (n = 526)∞
23-65 years
42.4 (9.8) 42.0 (9.8) 42.9 (9.5) 24.4 (9.1)
Metropolitan (n = 233)
Regional (n = 218)
Other (n = 21)
Years of nursing experience
(n = 531)
2-40 years 19.2 (10.01) 19.8 (10.5) 20.7 (10.6) 21.4 (9.7)
Metropolitan (n = 233)
Regional (n = 218)
Other (n = 21)
Years of ED nursing experience
n = (531)
1 -40 years 12.6 (7.6) 12.3 (7.3) 13.3 (7.9) 11.9 (5.8)
Metropolitan (n = 233)
Regional (n = 218)
Other (n = 21)
HOURS OF PATIENT CARE
(per week) (n = 531)
0 – 70 hours
32 (14.1)
30.1 (13.1) 33.0 (15.1) 35.8 (14.9)
• § Not all participants provided a postcode in response to this question • ∞ Not all participants provided a response to this question
162

4.3.1 Age distribution of sample
Participants were aged between 23 and 65 years of age with a mean age of 42, and
60% of the sample (n = 318/526) were aged 40 and older. Data for age were analysed
for two groups as shown below: -
1) 23-39 years of age;
2) 40-65 years of age.
These data were analysed according to region and the results are shown in Table 13.
Table 13: Age groups by geographic region §
Age groups Metropolitan (n = 232)
(%)
Regional (n = 214)
(%)
Other (n = 21)
(%)
No postcode provided (n = 59)
Total (n = 526)
(%)
Chi-squared
p-value
23-39 93 (40) 80 (37) 9 (43) 26 208 (40) 0.71 0.870
40-65 139 (60) 134 (63) 12 (57) 33 318 (60) 1.05 0.790
§ Not all participants provided a postcode in response to this question
4.3.2 Nursing experience
The years of nursing experience overall in the sample ranged from two to more than
40 years with a mean of 20 years, and a mean of 13 years of ED specific nursing
experience was reported. Please see Figures 3 and 4.
163
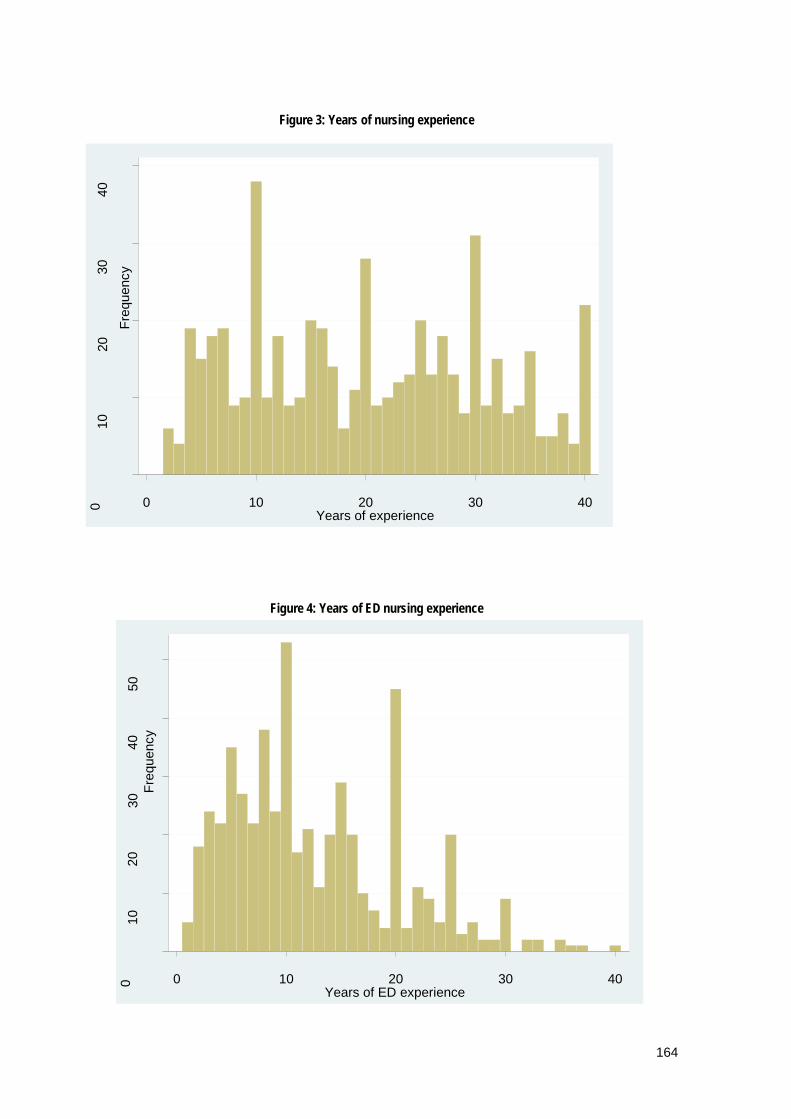
Figure 3: Years of nursing experience
Figure 4: Years of ED nursing experience
0 10
20
30
40
Fr
eque
ncy
0 10 20 30 40 Years of experience
0 10
20
30
40
50
Fr
eque
ncy
0 10 20 30 40 Years of ED experience
164
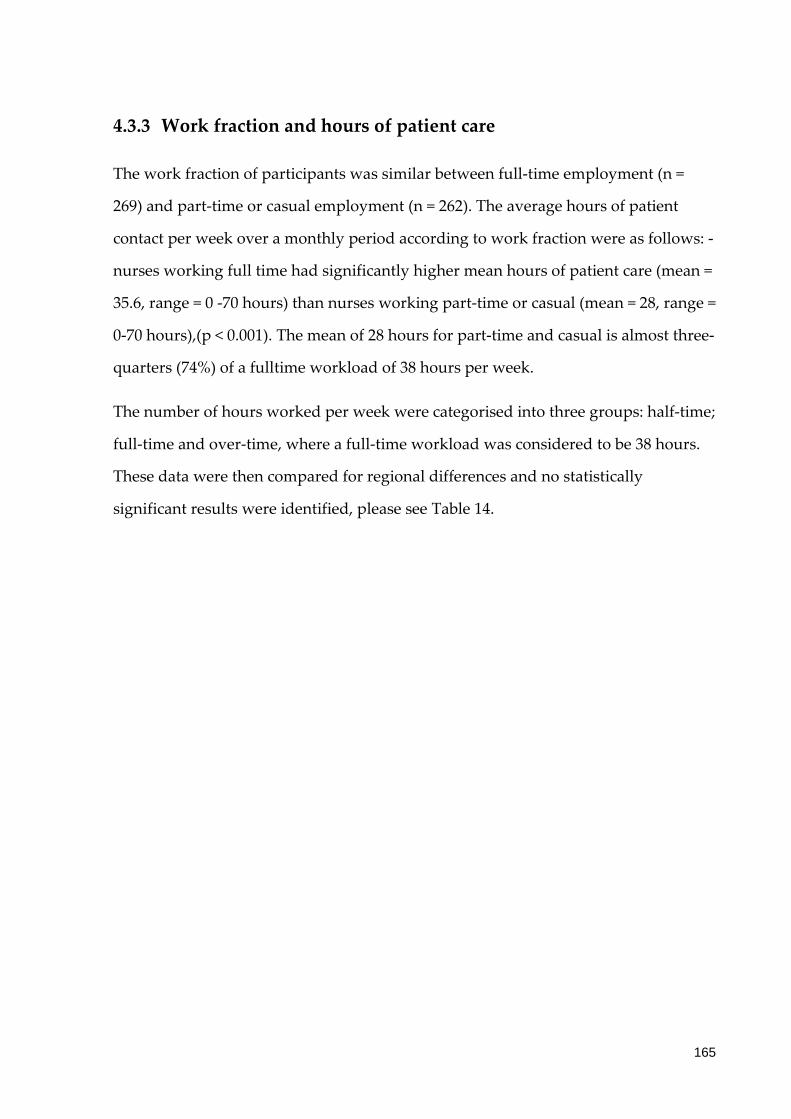
4.3.3 Work fraction and hours of patient care
The work fraction of participants was similar between full-time employment (n =
269) and part-time or casual employment (n = 262). The average hours of patient
contact per week over a monthly period according to work fraction were as follows: -
nurses working full time had significantly higher mean hours of patient care (mean =
35.6, range = 0 -70 hours) than nurses working part-time or casual (mean = 28, range =
0-70 hours),(p < 0.001). The mean of 28 hours for part-time and casual is almost three-
quarters (74%) of a fulltime workload of 38 hours per week.
The number of hours worked per week were categorised into three groups: half-time;
full-time and over-time, where a full-time workload was considered to be 38 hours.
These data were then compared for regional differences and no statistically
significant results were identified, please see Table 14.
165
Table 14: Worked hours by region (n = 463)
Worked hours Metropolitan (n = 229)
(%)
Regional (n = 213)
(%)
Other (n = 21)
(%)
Total (%)
d.f. chi-squared p-value
Half-time 42 (18) 27 (13) 1 (5) 70 (15) 2 4.60 0.100† 0.124‡
Full time 119 (52) 118 (55) 10 (48) 247 (53) 2 0.62 0.735
Over-time 68 (30) 68 (32) 10 48) 146 (32) 2 3.08 0.215
• § Only 463 participants provided postcodes in response to this question • † Pearson’s chi-squared • ‡ Fisher’s exact test
166

4.3.4 Geographic characteristics of sample
All states and territories in Australia were represented in the sample as shown below
in Table 15 and Figure 5. The data were further classified according to postcode (n =
472) in these states and territories, into either metropolitan or regional areas and the
results were evenly distributed between the two areas, (233 and 239 respectively). An
“other” category included postcodes from remote areas and data from respondents
who did not provide postcodes but indicated which state or territory they were from.
This resulted in the following distribution: metropolitan, 233; regional, 218 and other,
21.
167

Table 15: Geographic location of study sample
State or territory Metropolitan (n = 233)
(%)
Regional (n = 218)
(%)
Other (n = 21)
(%)
Total (n = 472)
(%)
New South Wales 47 (20) 85 (39) 1 (5) 133 (28)
Victoria 72 (31) 49 (22) 1 (5) 122 (26)
Queensland 50 (21) 47 (22) 4 (19) 101 (21)
Western Australia 24 (10) 13 (6) 7 (33) 44 (9)
South Australia 19 (8) 6 (3) 0 (0) 25 (5)
Australian Capital Territory
9 (4) 9 (4) 0 (0) 18 (4)
Tasmania 7 (3) 8 (4) 0 (0) 15 (3)
Northern Territory 5 (2) 1 (<1) 8 (38) 14 (3)
Figure 5: Geographic location of study sample (n = 472)
This section includes analyses by geographic location to determine whether there
were any significant differences in the data when these groups were compared.
There were 472 participants who answered this question.
0
20
40
60
80
100
120
140
NSW VIC QLD WA SA ACT TAS NT
Metropolitan Regional Other
168
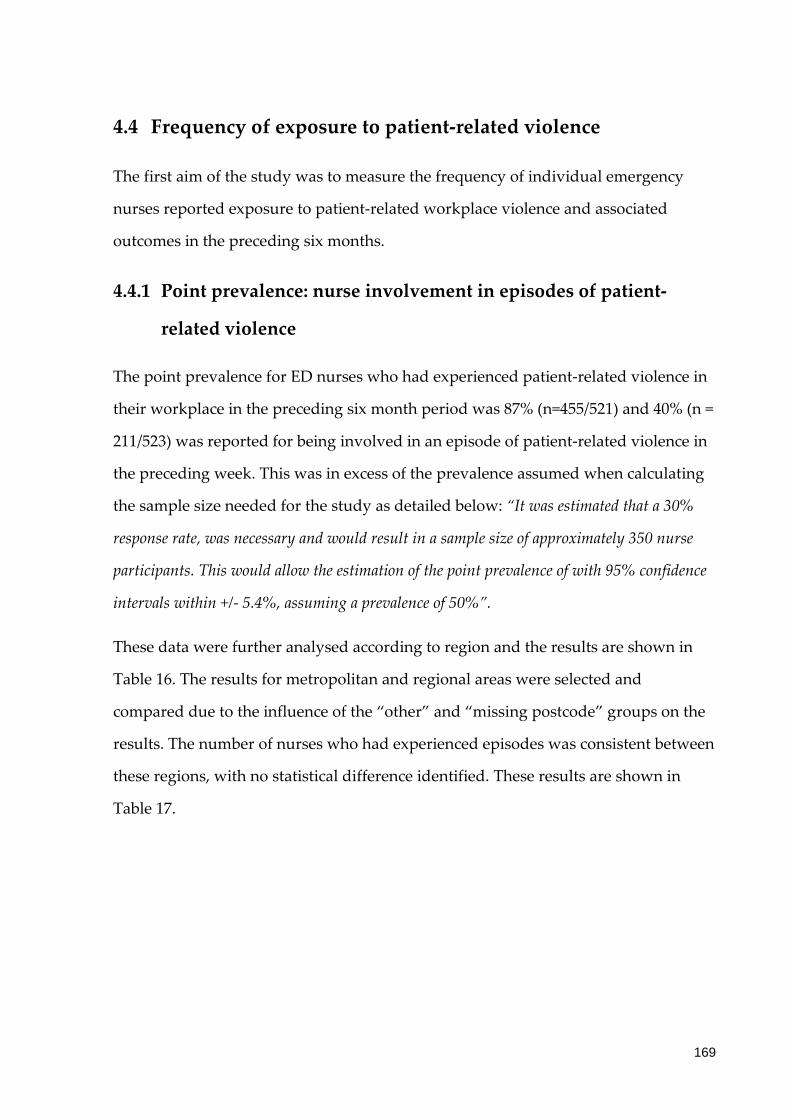
4.4 Frequency of exposure to patient-related violence
The first aim of the study was to measure the frequency of individual emergency
nurses reported exposure to patient-related workplace violence and associated
outcomes in the preceding six months.
4.4.1 Point prevalence: nurse involvement in episodes of patient-
related violence
The point prevalence for ED nurses who had experienced patient-related violence in
their workplace in the preceding six month period was 87% (n=455/521) and 40% (n =
211/523) was reported for being involved in an episode of patient-related violence in
the preceding week. This was in excess of the prevalence assumed when calculating
the sample size needed for the study as detailed below: “It was estimated that a 30%
response rate, was necessary and would result in a sample size of approximately 350 nurse
participants. This would allow the estimation of the point prevalence of with 95% confidence
intervals within +/- 5.4%, assuming a prevalence of 50%”.
These data were further analysed according to region and the results are shown in
Table 16. The results for metropolitan and regional areas were selected and
compared due to the influence of the “other” and “missing postcode” groups on the
results. The number of nurses who had experienced episodes was consistent between
these regions, with no statistical difference identified. These results are shown in
Table 17.
169
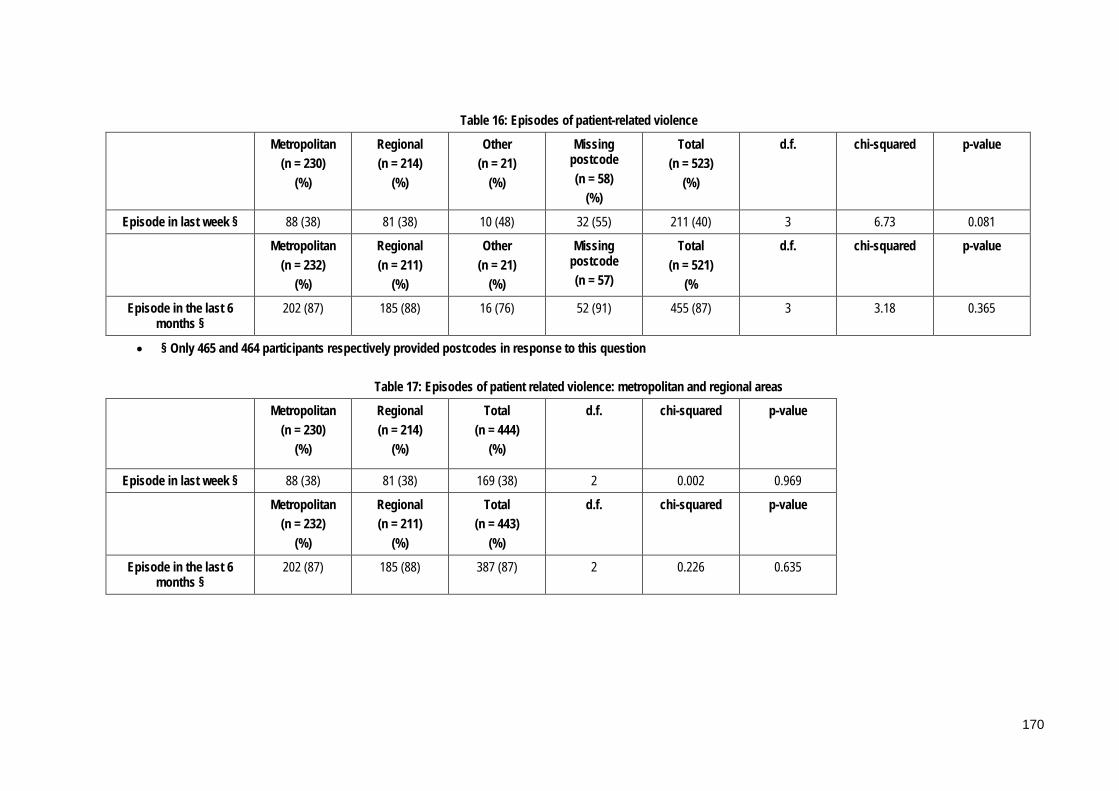
Table 16: Episodes of patient-related violence
Metropolitan (n = 230)
(%)
Regional (n = 214)
(%)
Other (n = 21)
(%)
Missing postcode (n = 58)
(%)
Total (n = 523)
(%)
d.f. chi-squared p-value
Episode in last week § 88 (38) 81 (38) 10 (48) 32 (55) 211 (40) 3 6.73 0.081
Metropolitan (n = 232)
(%)
Regional (n = 211)
(%)
Other (n = 21)
(%)
Missing postcode (n = 57)
Total (n = 521)
(%
d.f. chi-squared p-value
Episode in the last 6 months §
202 (87) 185 (88) 16 (76) 52 (91) 455 (87) 3 3.18 0.365
• § Only 465 and 464 participants respectively provided postcodes in response to this question
Table 17: Episodes of patient related violence: metropolitan and regional areas
Metropolitan (n = 230)
(%)
Regional (n = 214)
(%)
Total (n = 444)
(%)
d.f. chi-squared p-value
Episode in last week § 88 (38) 81 (38) 169 (38) 2 0.002 0.969
Metropolitan (n = 232)
(%)
Regional (n = 211)
(%)
Total (n = 443)
(%)
d.f. chi-squared p-value
Episode in the last 6 months §
202 (87) 185 (88) 387 (87) 2 0.226 0.635
170

The next section reports data from the 455 participants who reported being involved
in violent episodes in the previous six months in the survey.
4.4.2 Number of episodes
The number of episodes of patient-related violence reported by participants in the six
months prior to completing the survey ranged from 0 to 100 with a median of eight
(IQR = 16). For analysis, the number of episodes was categorised to four groups as
shown in Table 18. Most nurses reported experiencing between 0 and 10 episodes of
patient-related violence in the preceding six months; however 167 nurses (37%)
reported experiencing more than 10 episodes.
Table 18: Number of episodes in the previous 6 months (n = 452)
Episodes Metropolitan (n = 198)
(%)
Regional (n = 184)
(%)
Remote (n = 18)
(%)
Total regions
(n = 400)§
Totals overall
(%) (n = 452)
95% CI (relate to total percentages
in total column)
0-10 121 (61) 124 (67) 11 (61) 256 285 (63) 59.8 – 66.2
11-20 33 (17) 33 (18) 4 (22) 70 84 (19) 17.7 – 19.5
21-30 19 (10) 13 (7) 3 (17) 35 37 (8) 7.8 – 8.6
31-100 25 (13) 14 (8) 0 (0) 39 46 (10) 9.7 – 10.7
§Only 452 participants provided postcodes in response to this question
4.4.3 Types of episodes
Participants were asked about the types of violence they had encountered and these
results are summarised in Table 19. Verbal abuse was the most common form of
violence experienced with 12 episodes per nurse per six months reported and there
were five episodes per six months per nurse where verbal abuse progressed to
physical contact. There were three episodes per six months per nurse that involved
only physical contact against the nurse involved, and episodes that occurred while
patients were in police custody were estimated to be seven per six months per nurse.
171

Table 19: Episodes of patient-related violence in past 6 months (n = 448)
Type of episode
Total number of episodes Ω
Range Mean (SD) Median (IQR)
Verbal abuse & non-physical behaviours (n = 427)
5018 1-100 11.8 (17.2) 6 (11)
Verbal abuse & non-physical behaviours that progressed to physical contact (n = 189)
929 0-90 4.9 (8.7) 2 (4)
Only physical contact with people or objects (n = 92)
230 0-15 2.5 (2.7) 1 (2)
Episodes involving patients accompanied by police (n = 278)
1826 0-100 6.6 (6.6) 3 (5)
Ω Participants could respond to all of these items
4.4.4 Inevitability and frequency of episodes of violence
The majority of nurses (n = 473, 93%) of 511 respondents perceived patient-related
violence to be an inevitable or somewhat inevitable part of their job as an ED nurse.
Following analysis by region a statistically significant difference was identified
between areas about not viewing patient-related violence as inevitable, and was less
common in metropolitan areas (p = 0.026). However the result was based on a small
total (n = 34), therefore the results should be interpreted with caution.
Nearly all participants (n = 502/510, 98%) were of the perception that the frequency of
patient-related violence had increased or stayed the same over the course of their
careers. This result was found to be consistent across all regions with no significant
differences identified. See Table 20 for details.
172

Table 20: Perceived inevitability and frequency of violence by region
Inevitability Metropolitan (n = 226)
(%)
Regional (n = 207)
(%)
Other (n = 21)
(%)
Total (n = 454) §
(%)
d.f. Chi-squared p-value
YES 126 (56) 125 (60) 12 (57) 263 (58) 2 0.96 0.620
NO × 11 (5) 19 (9) 4 (19) 34 (7) 2 7.14 0.028† 0.026‡
SOMEWHAT 89 (39) 63 (30) 5 (24) 157 (35) 2 4.95 0.085
Frequency Metropolitan (n = 226)
(%)
Regional (n = 206)
(%)
Other (n = 21)
(%)
Total (n = 453) §
(%)
Decreasing 3 (1) 5 (2) 0 (0) 8 (2) 2 1.15 0.563† 0.650‡
Increasing 182 (81) 157 (76) 17 (81) 356 (79) 2 1.27 0.531
Staying the same 41 (18) 44 (21) 4 (19) 89 (20) 2 0.71 0.701† 0.708‡
† Pearson’s chi-squared ‡ Fisher’s exact test § Only 454 and 453 participants respectively provided postcodes in response to these questions × The responses for “no” were low therefore these results should be interpreted with caution
173

4.5 The types of violent behaviours experienced by emergency
nurses
The second aim of the study was to identify the types of violent behaviours
experienced by ED nurses.
This section reports data from all participants.
4.5.1 Verbal abuse and non-physical behaviours
There was a range of types of verbal abuse and non-physical behaviours reported
and swearing was the most common type; reported by nearly all ED nurses surveyed
(n = 504). Participants were able to choose multiple items from a list of types of verbal
abuse and on average participants reported 12 types each. For a list of the types of
verbal abuse please see Table 21. Other common behaviours included shouting;
anger, rudeness and making unreasonable demands.
ÆSome comments included personal and gender-based comments about individual
nurses from participants, for example: “personal names such as "fat bitch", "the ugly
one" (p90). Other comments included descriptions of symbolic violence and
aggression from participants, for example: “…videoing in department and waiting room,
photographing staff…” (p178); “…kicking trolleys, urinating in corridor…” (p219);
“…throwing chairs, spitting, urging patients in waiting room to become rowdy and
complaining, pacing hallways…” (p207); “…pushing past others in triage line and verbally
threatening staff...verbally threatening to kill staff and family…” (p332).
Æ These data were free-text responses that were subsequently categorised by two independent
researchers who achieved consensus about the final categories and content of these data items.
174

Table 21: Types of verbal abuse (n = 511)
Type Total responses Ω (%)
Swearing 504 (99)
Shouting 479 (94)
Anger 475 (93)
Rudeness 466 (91)
Making unreasonable demands 425 (83)
Name calling 398 (78)
Insulting/questioning professional ability e.g. incompetent, incapable
396 (77)
Sarcasm 382 (75)
Symbolic violence e.g. punching/hitting glass/desk at triage
346 (68)
Threatening comments - to self, family or property 342 (67)
Stepping into personal space 325 (64)
Staring 315 (62)
Gesturing 274 (54)
Ridicule in front of others 247 (48)
Unjustified criticism 227 (44)
Berating 165 (32)
Formal complaints without cause 149 (29)
Taunting 147 (29)
Sexual innuendo 144 (28)
Rumour mongering 45 (9)
Other 3 (1)
Total 6254
Ω Participants could choose more than 1 answer
A chi-square test was conducted on the data for two variables: “type of verbal abuse”
and “violent episode experienced in the last six months” with all categories except
one, rumour mongering, found to be statistically significant as shown in Table 22.
The results underscore the significance of the issue of verbal abuse for participants.
175

Table 22: Violent episode experienced and type of verbal abuse
Type of verbal abuse Chi-squared p-value
Swearing 89.72 <0.001
Name calling 49.02 <0.001
Making unreasonable demands 58.48 <0.001
Sarcasm 34.96 <0.001
Insulting/questioning professional ability e.g. incompetent, incapable
29.95 <0.001
Ridicule in front of others 26.96 <0.001
Anger 79.94 <0.001
Threatening comments to self, family, property 41.96 <0.001
Shouting 73.25 <0.001
Rudeness 46.04 <0.001
Rumour mongering 2.81 0.094
Sexual innuendo 14.35 <0.001
Taunting 21.46 <0.001
Staring 28.99 <0.001
Berating 13.38 <0.001
Gesturing 27.47 <0.001
Unjustified criticism 14.47 <0.001
Stepping into personal space 30.84 <0.001
Symbolic violence e.g. punching/hitting glass/desk at triage
33.57 <0.001
Formal complaints without cause 11.68 0.001
These data were further analysed according to geographic location and a summary
shown in Table 23. Statistically significant differences were identified for
“threatening comments – to self, family or property” (p = 0.003) which was more
common in metropolitan areas than regional areas (n = 160/292, 55%) and
“unjustified criticism” (p = 0.008) which was also more common in metropolitan
areas (n = 103/200, 52%). A sub-set analysis was conducted to remove the effect of the
“other group” and the results were subsequently found to not be statistically
significant: “threatening comments”, p = 0.095, chi-squared = 2.78; and “unjustified
criticism”, p = 0.443, chi-squared = 0.59. In addition while “gesturing” (p = 0.047) and
176

“sarcasm” (p = 0.044) revealed significant p-values the overall percentages were
similar for metropolitan and regional areas so these results should be interpreted
with caution.
177

Table 23: Types of verbal abuse (n = 452) § Ω ¥ Type of verbal abuse Metropolitan
(%) Regional
(%) Other (%)
Total (%)
d.f. chi-squared p-value
Swearing 220 (49) 205 (46) 21 (5) 446 (99) 2 3.9 0.519 Shouting 213 (50) 191 (45) 20 (5) 424 (93) 2 2.5 0.289 Anger 209 (50) 191 (45) 21 (5) 421 (93) 2 3.2 0.205 Rudeness 205 (50) 186 (45) 21 (5) 412 (91) 2 3.9 0.141 Making unreasonable demands 190 (51) 165 (44) 20 (5) 375 (83) 2 5.7 0.057 Name calling 174 (50) 161 (46) 14 (4) 349 (77) 2 0.7 0.886 Insulting/questioning professional ability e.g. incompetent, incapable 169 (49) 158 (46) 19 (5) 346 (76) 2 3.3 0.191 Sarcasm 157 (47) 161 (48) 19 (6) 337 (75) 2 6.2 0.044 Symbolic violence e.g. punching/hitting glass/desk at triage 150 (50) 136 (45) 16 (5) 302 (77) 2 1.6 0.446 Threatening comments to self, family, property 160 (55) 117 (40) 15 (5) 292 (64) 2 11.6 0.003 Stepping into personal space 143 (50) 128 (45) 16 (6) 287 (64) 2 2.5 0.284 Staring 131 (47) 129 (47) 17 (6) 277 (62) 2 4.9 0.086 Gesturing 112 (47) 110 (46) 16 (7) 238 (53) 2 6.1 0.047 Ridicule in front of others 104 (48) 97 (45) 15 (7) 216 (44) 2 5.8 0.054 Unjustified criticism 103 (52) 82 (41) 15 (8) 200 (44) 2 9.6 0.008 Berating 74 (50) 64 (43) 10 (7) 148 (32) 2 3.0 0.223 Formal complaints without cause 62 (49) 59 (46) 6 (5) 127 (28) 2 4.0 0.979 Taunting 60 (47) 58 (45) 10 (8) 128 (28) 2 4.7 0.095 Sexual innuendo 64 (52) 52 (42) 8 (6) 124 (28) 2 2.3 0.309 Rumour mongering 20 (51) 15 (38) 4 (10) 39 (9) 2 3.8 0.564†
0.551‡ • †Pearson’s chi-squared • ‡Fisher’s exact test • §Only 452 participants provided postcodes in response to this question • Ω Participants could respond to all of these items • ¥ Percentages have been calculated as row percentages
178

4.5.2 Physical behaviours
Destructive behaviour such as hitting or punching the safety glass at triage was
identified as the most common physical behaviour displayed by violent patients.
Other behaviours reported included spitting; kicking; hitting; punching and pushing.
Participants were able to choose from a range of physical behaviours and on average
each participant reported eight different types of physical violence. The use of
weapons was reported by 64% of participants (n = 302) and this included both
traditional and opportunistic weapons such as hospital equipment. Thirteen
participants (3%) stated that they had been sexually assaulted. A number of
categories had a high response rate as participants could choose more than one
response with one noting: “…most of this can be seen on any regular shift in our ED. Sad
isn't it?” (p332) and another: “…most of this is often seen in emergency...” (p95).
Additional comments from participants included: “…kicked in stomach, threatened with
blood filled syringe, threatened with Stanley knife, threatened with scissors…” (p394);
“…head butting walls…” (p362); “…throwing container of vomit at staff…” (p261); “…the
threat that radiates from a drug affected or psychotic person is difficult to describe. You FEEL
the threat but its source is difficult to quantify as the patient is not rational…” (p214).
Please see Table 24.
179

Table 24: Physical behaviours (n = 468)
Behaviour Total responses Ω (%)
Destructive behaviour e.g. punching safety glass/table 376 (80)
Spitting 335 (72)
Kicking 321 (69)
Hitting 300 (64)
Punching 286 (61)
Pushing 285 (61)
Grabbing 265 (57)
Scratching 216 (46)
Use of hospital equipment as weapons e.g. sharps, chairs
215 (46)
Biting 203 (43)
Throwing/struck with object 153 (33)
Grabbing & twisting a body part 150 (32)
Threat using body fluids 109 (23)
Inappropriate physical contact 108 (23)
Pulling hair/jewellery/clothing 99 (21)
Use of traditional weapon e.g. knife 87 (18)
Restraining/immobilising staff 51 (11)
Choking 41 (9)
Sexual assault 13 (3)
Other 11 (2)
Total 3624
Ω Participants could select more than 1 physical behaviour
A chi-squared analysis was conducted using type of physical behaviour and episode
of violence in the past six months and the following behaviours were found to be
highly significant with a p-value < 0.001: destructive behaviour, spitting, kicking,
hitting, pushing, punching, grabbing, scratching, use of hospital equipment as
weapons, biting and grabbing and twisting a body part. Please see Table 25 for
details.
180

Table 25: Chi-squared results for physical behaviours and episodes of violence
Behaviour Chi-squared p-value
Destructive behaviour e.g. punching safety glass/table 17.7 <0.001
Spitting 18.05 <0.001
Kicking 17.33 <0.001
Hitting 16.5 <0.001
Punching 18.06 <0.001
Pushing 7.6 0.006
Grabbing 15.61 <0.001
Scratching 15.29 <0.001
Use of hospital equipment as weapons e.g. sharps, chairs
15.02 <0.001
Biting 13.77 <0.001
Throwing/struck with object 7.59 0.006
Grabbing & twisting a body part 13.82 <0.001
Threat using body fluids 3.48 0.062
Inappropriate physical contact 3.78 0.052
Pulling hair/jewellery/clothing 1.62 0.203
Use of traditional weapon e.g. knife 1.83 0.176
Restraining/immobilising staff 2.4 0.121
Choking 2.17 0.141
Sexual assault 0.46 0.499
These data were further analysed according to geographic location and scratching
was found to be more common in metropolitan areas (n = 106/189, 56%), a difference
that approached statistical significance (p = 0.057). All other physical behaviours
were reported consistently between the different regions. Please see Table 26 for
details.
181

Table 26: Physical behaviours by region (n = 421) § ¥ Type of physical behaviour Metropolitan
(%) Regional
(%) Other (%)
Total (%)
d.f. chi-squared p-value
Destructive behaviour e.g. punching safety glass/tables etc.
160 (49) 153 (47) 16 (5) 329 (78) 2 0.5 0.776
Spitting 150 (51) 132 (45) 10 (3) 292 (69) 2 2.59 0.274 Kicking 148 (52) 128 (45) 9 (3) 285 (68) 2 3.91 0.142 Hitting 130 (49) 121 (46) 14 (5) 265 (63) 2 0.99 0.609 Punching 132 (52) 111 (44) 9 (4) 252 (60) 2 2.47 0.291 Pushing 134 (53) 112 (44) 9 (4) 255 (61) 2 2.8 0.245 Grabbing 125 (53) 102 (43) 10 (4) 237 (56) 2 2.18 0.336 Scratching 106 (56) 76 (40) 7 (4) 189 (45) 2 5.7 0.057 Use of hospital equipment as weapons e.g. sharps
97 (51) 80 (42) 12 (6) 189 (45) 2 3.8 0.148
Biting 97 (54) 74 (42) 7 (4) 178 (42) 2 3.01 0.222 Throwing/struck with object 72 (53) 58 (43) 5 (4) 135 (32) 2 1.26 0.531 Grabbing and twisting a body part 70 (52) 57 (43) 7 (5) 134 (32) 2 1.10 0.575 Threat using body fluids e.g. blood
52 (58) 34 (38) 3 (3) 89 (21) 2 3.63 0.163† 0.173‡
Inappropriate physical contact 53 (55) 41 (42) 3 (3) 97 (23) 2 1.60 0.450† 0.502‡
Pulling hair/jewellery/clothing 50 (56) 38 (42) 2 (2) 90 (21) 2 2.48 0.289† 0.323‡
Use of traditional weapon e.g. knife
44 (53) 35 (42) 4 (5) 83 (20) 2 0.65 0.176† 0.744‡
Restraining/immobilising staff 24 (50) 23 (48) 1 (2) 48 (11) 2 0.71 0.701† 0.806‡
Choking 17 (43) 21 (53) 2 (5) 40 (10) 2 0.82 0.662† 0.646‡
Sexual assault 8 (67) 4 (33) 0 (0) 12 (3) 2 1.74 0.420† 0.646‡
• † Pearson’s chi-squared • ‡ Fisher’s exact test • § Only 421 participants provided postcodes in response to this question • Ω Participants could respond to all of these items • ¥ Percentages have been calculated as row percentages
182
4.5.3 Consequences of patient-related violence
This section reports data from the 455 participants who reported being involved in
violent episodes in the previous six months in the survey.
4.5.3.1 Injuries
Ninety five of 449 participants (21%) reported that they had suffered a physical
and/or psychological injury as a consequence of an episode of patient-related
violence in the preceding six months. The category of psychological injuries was
included to allow participants to list long-lasting and significant psychological
diagnoses that had impacted on their well-being in the same way a physical injury
would. This category was distinct from “emotional response, that measured
participants’ emotions experienced in association with these violent episodes. These
data were analysed according to region with the following results: metropolitan (n =
43/198, 22%), regional (n = 38/182, 21%) and other/remote (n = 4/17, 24%) §1. No
statistically significant difference was identified between these regions (n = 397, chi-
squared = 0.22, p = 0.975).
More respondents (n = 118), proceeded to answer the next question about the
location of the most serious injury/illness that they had sustained as a consequence of
patient-related violence. There were an additional 13 nurses who did not report
actually sustaining an injury who answered this question and the researchers
surmised that this may represent people who had sustained an injury outside the six
month time period.
1 § Only 85 participants provided postcodes in response to this question
183
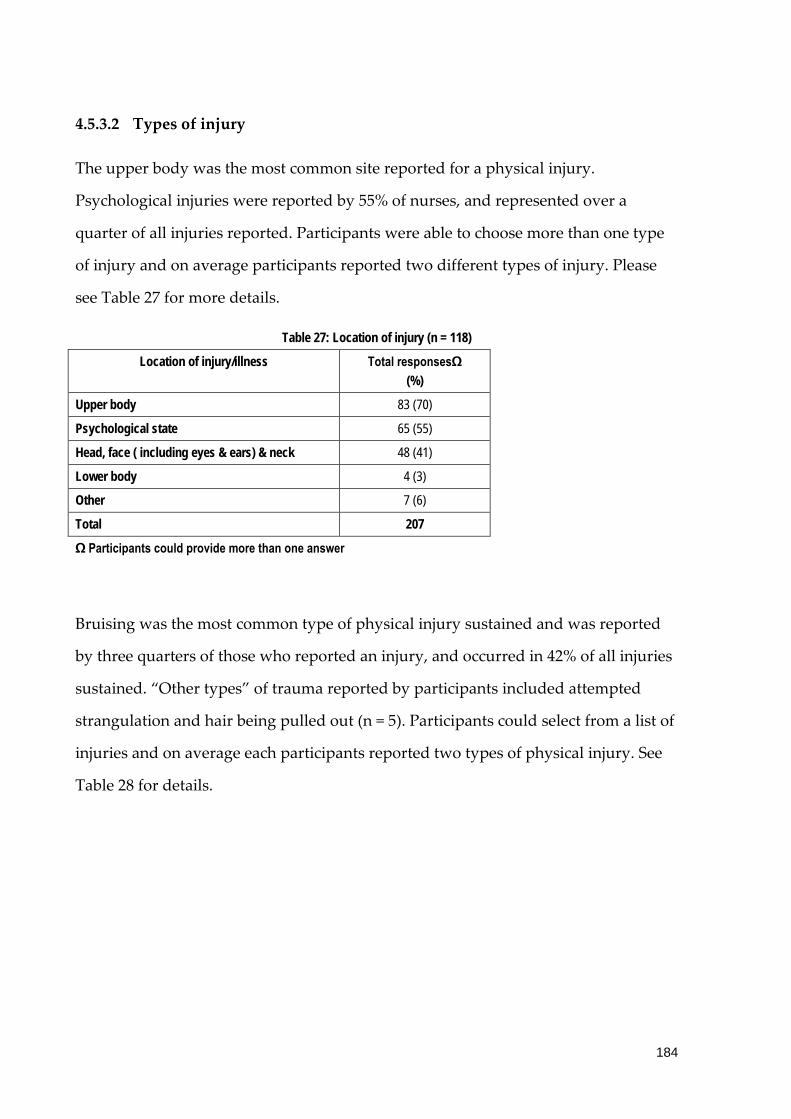
4.5.3.2 Types of injury
The upper body was the most common site reported for a physical injury.
Psychological injuries were reported by 55% of nurses, and represented over a
quarter of all injuries reported. Participants were able to choose more than one type
of injury and on average participants reported two different types of injury. Please
see Table 27 for more details.
Table 27: Location of injury (n = 118)
Location of injury/illness Total responsesΩ (%)
Upper body 83 (70)
Psychological state 65 (55)
Head, face ( including eyes & ears) & neck 48 (41)
Lower body 4 (3)
Other 7 (6)
Total 207
Ω Participants could provide more than one answer
Bruising was the most common type of physical injury sustained and was reported
by three quarters of those who reported an injury, and occurred in 42% of all injuries
sustained. “Other types” of trauma reported by participants included attempted
strangulation and hair being pulled out (n = 5). Participants could select from a list of
injuries and on average each participants reported two types of physical injury. See
Table 28 for details.
184

Table 28: Type of injury (n = 78)
Type of injury Total responses Ω (%)
Bruising 57 (73)
Exposure to hazardous/infectious substance 22 (28)
Abrasion/graze 18 (23)
Muscle damage 13 (17)
Fracture, burns, head injury or other trauma 12 (15)
Laceration/cut 10 (13)
Nerve or tendon damage 4 (5)
Other 6 (8)
Total 142
Ω Participants could choose more than one type of injury/illness
4.5.3.3 Emotional response
A range of emotional responses were reported as a consequence of exposure to an
episode of violence and these results are summarised in Table 29. Anger was the
most common emotion reported, acknowledged by 250 nurses (65%). On average at
least three emotional responses were reported for each participant who answered
this question. Nurses frequently reported negative emotions such as unhappiness; a
feeling of powerlessness, shock and surprise, anxiety and emotional blunting. Other
emotional responses reported included shame, relationship issues, chronic
pain/disability, panic attacks and Post Traumatic Stress Disorder (PTSD). Some of
these emotional responses constituted long-term issues including depression, chronic
pain or disability, altered sleep patterns, an increase in the use of alcohol and/or
other substances and PTSD.
185

Table 29: Emotional Reponses (n = 387)
Emotion experienced Total responsesΩ (%)
Anger 250 (65)
Unhappiness 150 (39)
Powerlessness 134 (35)
Shock/surprise 128 (33)
Fear/anxiety re future episodes 108 (28)
Anxiety 77 (20)
Emotional blunting 77 (20)
Altered sleep patterns 70 (18)
Irritability 58 (15)
Degradation 47 (12)
Withdrawal from people/situations 28 (7)
Guilt 28 (7)
Depression/low mood 27 (7)
Increase in use of alcohol or other substances/medications
24 (6)
Nightmares/flashbacks 19 (5)
Weight loss/gain 13 (3)
Other 22 (6)
Total 1260
Ω Participants could respond to all of these answers
Data were further analysed by region and no statistically significant differences were
identified between emotions experienced by nurses following an episode of patient-
related violence and region. Please see Table 30.
186

Table 30: Emotion experienced by participants by region (n = 353) § Ω ¥ Emotion Metropolitan
(%) Regional
(%) Other (%)
Total (%)
d.f. chi-squared p-value
Anger 108 (50) 99 (46) 9 (4) 216 (61) 2 0.11 0.944 Unhappiness 78 (58) 58 (43) 3 (2) 139 (39) 2 3.39 0.184†
0.195‡ Powerlessness 61 (51) 50 (42) 8 (7) 119 (34) 2 2.56 0.278 Shock/surprise 55 (48) 52 (45) 8 (7) 115 (33) 2 2.25 0.324 Fear/anxiety re future episodes 49 (47) 50 (48) 6 (6) 105 (30) 2 0.75 0.689 Anxiety 37 (51) 33 (46) 2 (3) 72 (21) 2 0.61 0.738†
0.880‡ Emotional blunting 38 (56) 29 (43) 1 (1) 68 (19) 2 2.48 0.289†
0.338‡ Altered sleep patterns 34 (52) 30 (46) 1 (2) 65 (18) 2 1.57 0.457†
0.542‡ Irritability 22 (44) 27 (54) 1 (2) 50 (14) 2 1.82 0.403†
0.489‡ Degradation 19 (49) 20 (51) 0 (0) 39 (11) 2 2.13 0.344†
0.419‡ Withdrawal from people/situations 11 (48) 12 (52) 0 (0) 23 (7) 2 1.28 0.529†
0.757‡ Guilt 14 (54) 11 (43) 1 (4) 26 (7) 2 0.22 0.894†
0.881‡ Depression/low mood 11 (50) 11 (50) 0 (0) 22 (6) 2 1.10 0.577†
0.869‡ Increase in use of alcohol or other substances/medications
11 (50) 10 (50) 0 (0) 21 (6) 2 1.03 0.598† 0.865‡
Nightmares/flashbacks 11 (61) 7 (39) 0 (0) 18 (5) 2 1.57 0.456† 0.569‡
Weight loss/gain 7 (64) 4 (36) 0 (0) 11 (3) 2 1.20 0.549† 0.727‡
• †Pearson’s chi-squared • ‡ Fisher’s exact test • §Only 353 participants provided postcodes in response to this question • Ω Participants could respond to all of these items • ¥ Percentages have been calculated as row percentages
187

4.5.3.4 Professional effects
Professional impacts also were reported by nurses who had experienced patient-
related violence, with a change in practice acknowledged. The majority of nurses (n =
276, 76%) provided responses that their experience with violence had directly
impacted on their interaction with patients. This included feeling less empathy
towards patients, a decline in the quality of care afforded patients and avoidance of
patients. Almost one-third of nurses had either left or considered leaving the ED (n =
147, 31%); 69 (19%) had left or had considered leaving nursing altogether while a
further 78 (22%) had left or considered relocating to clinical areas they perceived as
being at lower risk for violent episodes. Other responses indicated diminished
capacity to perform in a professional role (reduced morale, burnout/stress, and
conflict with co-workers); and a perceived loss of competence/coping ability
(diminishing/minimising the event, depersonalising the event and feelings of
professional incompetence and self-doubt). On average three emotional effects were
reported for each participant who answered this question. Please see Table 31.
188

Table 31: Professional effects (n = 361)
Professional effects Total responsesΩ (%)
Lack of empathy towards patients 162 (45)
Reduced morale 138 (38)
Diminishing/minimising the event 124 (34)
Depersonalising the event 89 (25)
Burnout/stress 84 (23)
Avoidance of patients 79 (22)
Considered leaving the ED – to transfer to a lower risk area 78 (22)
Feelings of professional incompetence and self-doubt 74 (21)
Considered leaving nursing altogether 69 (19)
Decline in quality of care afforded patients 35 (10)
Conflict with co-workers 18 (5)
Total 950
Ω Participants could respond to all of these answers
Data were further analysed according to region and the results are shown in Table 32
and no statistically significant differences were identified between the professional
responses experienced by nurses across regions.
189

Table 32: Professional effects by region (n = 353) § ¥ Professional effects Metropolitan Regional Other Total d.f. chi-squared p-value
Lack of empathy towards patients 75 (54) 62 (44) 3 (2) 140 (40) 2 2.45 0.197† 0.211‡
Reduced morale 62 (51) 55 (45) 5 (4) 121 (34) 2 0.24 0.888 Diminishing/minimising the event 55 (50) 47 (42) 9 (8) 111 (31) 2 4.83 0.089 Depersonalising the event 38 (48) 38 (48) 3 (4) 79 (22) 2 0.20 0.906†
0.953‡ Burnout/stress 37 (49) 34 (45) 4 (5) 75 (21) 2 0.17 0.918†
0.905‡ Avoidance of patients 38 (51) 35 (47) 1 (1) 74 (21) 2 1.99 0.370†
0.436‡ Considered leaving the ED – to transfer to a lower risk area
38 (54) 31 (44) 2 (3) 71 (20) 2 1.54 0.451† 0.528‡
Feelings of professional incompetence and self-doubt
37 (54) 30 (43) 2 (3) 69 (20) 2 0.86 0.650† 0.728‡
Considered leaving nursing altogether 31 (53) 28 (47) 0 (0) 59 (17) 2 3.16 0.206† 0.209‡
Decline in quality of care afforded patients
16 (47) 18 (53) 0 (0) 34 (10) 2 2.03 0.362† 0.449‡
Conflict with co-workers 8 (47) 8 (47) 1 (6) 17 (5) 2 0.10 0.950† 0.755‡
• †Pearson’s chi-squared • ‡Fisher’s exact test • §Only 353 participants provided postcodes in response to this question • Ω Participants could respond to all of these items • ¥ Percentages have been calculated as row percentages
190

4.5.3.5 Impact on ability to work
Despite the physical and psychological injuries reported by participants and the
personal and professional responses experienced following episodes of violence from
patients, only 18 nurses of the 422 who answered this question (4%) reported that
they had taken time off work as a consequence. Data were further analysed
according to region with the following results: metropolitan (n = 11/185, 6%),
regional (n = 5/173, 3%) and other/remote (n = 1/17, 6%) which was not statistically
significant (chi-squared = 2.7, p = 0.438) §2. Five out of 418 participants (1%) had
suffered a permanent disability necessitating a change in work duties or an inability
to work. This included three metropolitan participants (3/184, 2%) and one each from
regional (1/170, 1%) and other/remote (1/17, 6%) areas in a result that was not
statistically significant (chi-squared = 4.6, p = 0.208).
4.6 Risk prevention and risk management strategies
The third study aim was to uncover ED nurses’ perceptions of risk prevention and
risk management strategies adopted by their employer. This section reports data
from the 455 participants who reported being involved in violent episodes in the
previous six months in the survey.
4.6.1 Reporting of episodes of patient-related violence at work
Most nurses reported episodes of patient-related violence in their organisation (n =
319/453, 70%), however they did so selectively. More than three quarters reported
“some” episodes: 251/330 (76%), while only 79/330 (24%) reported all episodes.
2 § Only 17 participants provided postcodes in response to this question
191

Data were analysed according to geographic location and a statistically significant
difference was identified between reporting of “some episodes” which was
significantly more frequent in regional areas compared to metropolitan and remote
(p = 0.047). A sub-set analysis was performed to exclude the influence of the “other
group” and a statistically significant difference between metropolitan areas and
regional areas was confirmed: (p = 0.009; chi-squared = 6.74). These figures illustrate
that it was infrequent for nurses to report “all” episodes of patient-related violence,
however most reported “some” episodes. Please see Table 33.
192

Table 33: Reporting of episodes of violence
Region (Reported episodes %)
Metropolitan (n = 141)
(%)
Regional (n = 136)
(%)
Other (n = 15)
(%)
Missing postcode (n = 38)
Total (n = 330
(%)
d.f. chi-squared p-value
Reported ALL episodes
46 (33) 27 (20) 2 (13) 4 79 (24) 2 5.23 0.073† 0.082‡
Reported SOME episodes
95 (67) 109 (80) 13 (87) 34 251 (76) 2 6.11 0.047
• §Only 292 participants provided postcodes in response to this question • † Pearson’s chi-squared • ‡ Fisher’s exact test
193

4.6.1.1 Reasons for reporting
Participants who reported episodes of violence were asked to describe why they
decided to do so and these results are summarised in Table 34. Æ
The main reasons for reporting were that it was a mandatory requirement of the
organisation: “…hospital requirement…” (3p36); and to provide a record of the episode
to inform management and colleagues: “…to keep a record so managers aware of severity
of the problem…” (p20); “…standard procedures to track patients and identify re-
offenders/increasingly violent patients. Also to warn other staff of potentially violent
patients…” (p276); “…trying to get a case to have security at workplace and/or have Code
Grey initiated…” (p328).
A Code Grey is defined as a hospital-wide internal security response to actual
aggressive behaviour and a Code Black refers to a hospital-wide internal security
response to actual or potential aggression involving a weapon or serious threat to
personal safety (Victorian Government, 2005). Episodes also were reported if a Code
Black or Grey had been called or if security and/or police involvement was necessary:
“…code black called - RISKMAN must then be completed = reporting…” (p42);
“…mandatory with code black call…” (p227). Safety issues and the severity of the
episode also were cited as reasons for reporting: “…felt very unsafe and scared at times.
Patients - mental health issues and/or drug affected…” (p19); “…I only report severe abuse.
Most mental health/intoxicated people are abusive/uncooperative; depending on the shift you
Æ These data were free-text responses that were subsequently categorised by two independent
researchers who achieved consensus about the final categories and content of these data items.
3 “p” refers to participants
194

have 10 or more episodes...” (p94); “…because enough is enough. Nobody should have to be
scared at work…” (p153).
Some participants stated that they did not report episodes for various reasons: “…I
didn't report as I felt I handled the situations effectively myself - also verbal violence is so
common I consider it normal behaviour in the ED…” (p21); “…time constraints. IIMS
online reporting not user friendly…” (p83). Others discussed the need to report repeat
offenders: “…the patient was a repeat offender and became aggressive…” (p112);
“…patients - frequent offenders that nobody reports so I decided that someone had to
formalise a complaint about them…some patients have been "rewarded" with immediate
medical treatment after being abusive at triage…” (p476).
Table 34: Reasons for reporting episodes of patient-related violence (n = 311)
Category Responses (%)
Reporting is required by organisation 55 (18)
To have a record of the episode 54 (17)
Code Black/Grey called Duress/Security/Police involved
41 (13)
Safety issues/fearful 40 (13)
Abuse & escalation (severity) 32 (10)
Potential complaint/liability/charges (legal factors) 13 (4)
Injury or property damage resulted 13 (4)
Physical violence 10 (3)
Did not report (time, reporting process or not significant) 10 (3)
Repeat offender 9 (3)
Threats made 8 (3)
Psychological trauma/distressed 6 (2)
Other 16 (5)
Multiples of above codes 4 (2)
195

4.6.1.2 Barriers to reporting
When asked to elaborate on the reasons for reporting only “some” episodes of
patient-related violence, some participants answered that the episodes had
been 4reported verbally only to staff members or documented in the patient notes.
The barriers to reporting episodes are summarised in Table 35. On average each
participant reported more than three barriers each. The most frequent barriers cited
by participants included time constraints; the volume of episodes; a perception that
the patient had diminished responsibility due to their physical condition or cognitive
state; the belief that nothing would change as a consequence of reporting; the
perception that such episodes were an accepted and expected part of their day to day
job and perceived lack of follow-up or response from management. Other barriers
cited included: - fear of the consequences of reporting: “…having to go to court (maybe)
and face the perpetrator…” (p256) and a lack of support from colleagues in security:
“…contacted security when one episode occurred - got told "he always behaves like this!"
(p356). Æ
Over a third of participant responses about barriers to change referred to deficiencies
in the actions of management, either directly: “lack of follow up from management”
(n = 103, 35%); or indirectly: “don’t expect anything to change” (n = 137, 46%); and “it
is an accepted/expected part of the job” (n = 123, 41%).
4 Æ These data were free-text responses that were subsequently categorised by two independent
researchers who achieved consensus about the final categories and content of these data items.
4 “p” refers to participants
196

Table 35: Barriers to reporting (n = 297)
Barrier Total responses Ω (%)
Time constraints 168 (57)
Too many episodes/too busy to report 155 (52)
Diminished responsibility of patient e.g. cognitively impaired 140 (47)
Don’t expect anything to change in the long term 137 (46)
It is an accepted/expected part of the job 123 (41)
Lack of follow up/response from management 103 (35)
Process too complicated 85 (29)
Feel they can manage episodes effectively 84 (28)
Not sure how to report 12 (4)
Fear of being blamed for episode 11 (4)
Fear of lack of support from colleagues 6 (2)
Other 12 (4)
Total 1016
Ω Participants could respond to all of these items
Data were analysed according to region and no statistically significant difference was
identified as shown in Table 36.
197

Table 36: Barriers to reporting by region (n = 271) § Ω ¥ Barrier Metropolitan
(%) Regional
(%) Other (%)
Total (%)
d.f. chi-squared p-value
Time constraints 76 (52) 63 (43) 6 (4) 145 (54) 2 1.35 0.717† 0.678‡
Too many episodes/too busy to report 77 (57) 51 (38) 8 (6) 136 (50) 2 6.3 0.099 Diminished responsibility of patient e.g. cognitively impaired
62 (54) 45 (39) 7 (6) 114 (42) 2 3.20 0.202
Don’t expect anything to change in the long term 56 (47) 56 (47) 6 (5) 118 (44) 2 0.31 0.855 It is an accepted/expected part of the job 54 (50) 51 (47) 3 (3) 108 (40) 2 1.6 0.663†
0.714‡ Lack of follow up/response from management 40 (45) 41 (46) 8 (9) 89 (33) 2 5.5 0.137 Process too complicated 37 (52) 30 (42) 4 (6) 71 (26) 2 2.5 0.484†
0.641‡ Feel they can manage episodes effectively 40 (49) 37 (45) 5 (6) 82 (30) 2 1.2 0.764 Not sure how to report 4 (40) 6 (60) 0 (0) 10 (4) 2 1.25 0.742†
0.705‡ Fear of being blamed for episode 4 (40) 6 (60) 0 (0) 10 (4) 2 1.2 0.756†
0.465‡ Fear of lack of support from colleagues 1 (25) 3 (75) 0 (0) 4 (< 1) 2 1.6 0.668†
0.705‡ • † Pearson’s chi-squared • ‡ Fisher’s exact test • § Only 271 participants provided postcodes in response to this question • Ω Participants could respond to all of these items • ¥ Percentages have been calculated as row percentages
198
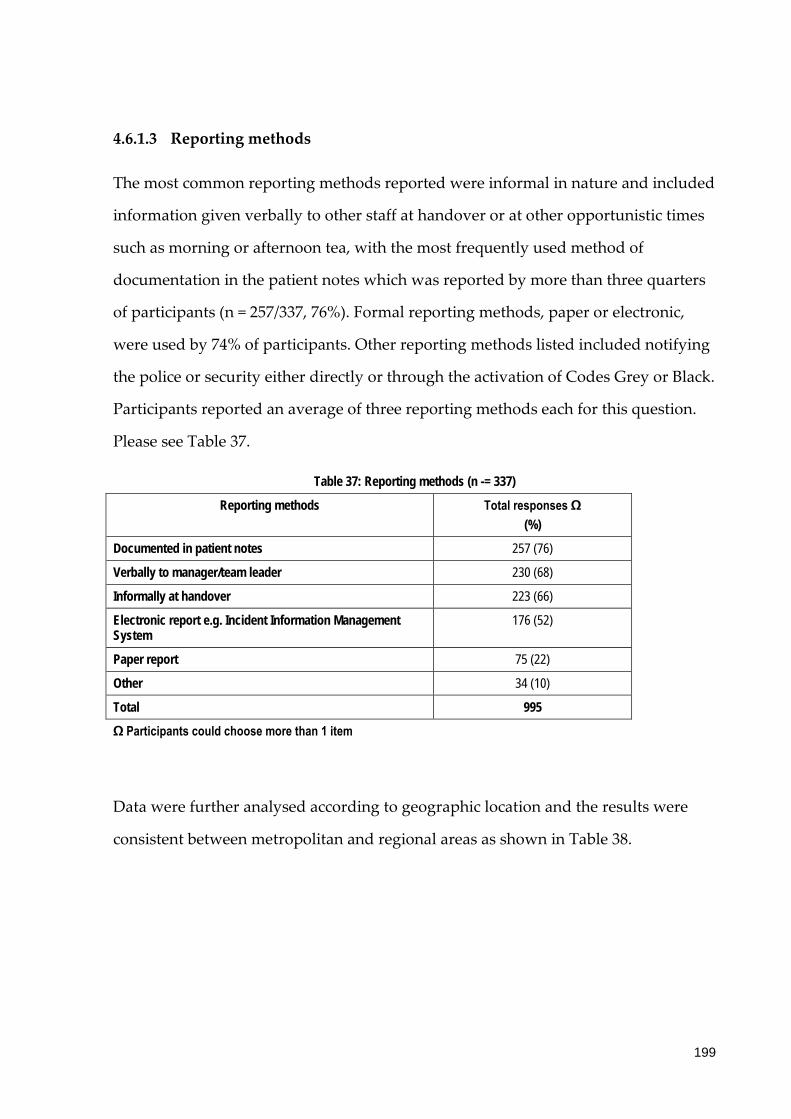
4.6.1.3 Reporting methods
The most common reporting methods reported were informal in nature and included
information given verbally to other staff at handover or at other opportunistic times
such as morning or afternoon tea, with the most frequently used method of
documentation in the patient notes which was reported by more than three quarters
of participants (n = 257/337, 76%). Formal reporting methods, paper or electronic,
were used by 74% of participants. Other reporting methods listed included notifying
the police or security either directly or through the activation of Codes Grey or Black.
Participants reported an average of three reporting methods each for this question.
Please see Table 37.
Table 37: Reporting methods (n -= 337)
Reporting methods Total responses Ω (%)
Documented in patient notes 257 (76)
Verbally to manager/team leader 230 (68)
Informally at handover 223 (66)
Electronic report e.g. Incident Information Management System
176 (52)
Paper report 75 (22)
Other 34 (10)
Total 995
Ω Participants could choose more than 1 item
Data were further analysed according to geographic location and the results were
consistent between metropolitan and regional areas as shown in Table 38.
199

Table 38: Reporting method by region (n = 307) § Ω ¥
Method Metropolitan (%)
Regional (%)
Other (%)
Total (%)
d.f. chi-squared p-value
Documented in patient notes 113 (50) 102 (45) 14 (6) 227 (74) 2 3.71 0.294
Verbally to manager/team leader 98 (48) 96 (47) 9 (4) 206 (67) 2 0.23 0.973
Informally at handover 100 (50) 87 (44) 11 (6) 199 (65) 2 1.69 0.639
Electronic report e.g. Incident Information Management System
71 (46) 80 (52) 4 (3) 155 (50) 2 3.89 0.274† 0.147‡
Paper report 28 (46) 30 (49) 3 (5) 61 (20) 2 0.68 0.712† 0.548‡
• † Pearson’s chi-squared • ‡ Fisher’s exact test • § Only 307 participants provided postcodes in response to this question • Ω Participants could choose more than 1 item • ¥ Percentages have been calculated as row percentages
200
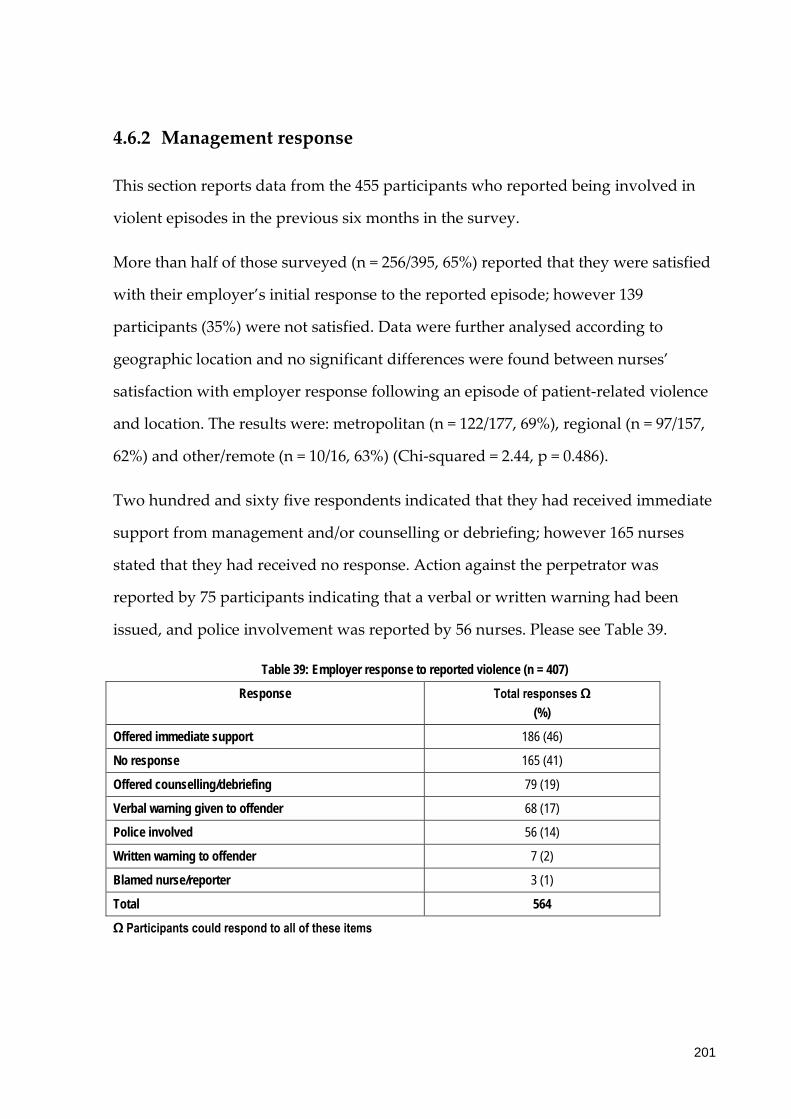
4.6.2 Management response
This section reports data from the 455 participants who reported being involved in
violent episodes in the previous six months in the survey.
More than half of those surveyed (n = 256/395, 65%) reported that they were satisfied
with their employer’s initial response to the reported episode; however 139
participants (35%) were not satisfied. Data were further analysed according to
geographic location and no significant differences were found between nurses’
satisfaction with employer response following an episode of patient-related violence
and location. The results were: metropolitan (n = 122/177, 69%), regional (n = 97/157,
62%) and other/remote (n = 10/16, 63%) (Chi-squared = 2.44, p = 0.486).
Two hundred and sixty five respondents indicated that they had received immediate
support from management and/or counselling or debriefing; however 165 nurses
stated that they had received no response. Action against the perpetrator was
reported by 75 participants indicating that a verbal or written warning had been
issued, and police involvement was reported by 56 nurses. Please see Table 39.
Table 39: Employer response to reported violence (n = 407)
Response Total responses Ω (%)
Offered immediate support 186 (46)
No response 165 (41)
Offered counselling/debriefing 79 (19)
Verbal warning given to offender 68 (17)
Police involved 56 (14)
Written warning to offender 7 (2)
Blamed nurse/reporter 3 (1)
Total 564
Ω Participants could respond to all of these items
201
Data for employer response to episodes of violence were further analysed according
to geographical location and a statistically significant difference identified for the
response “written warning to offender” and this was more common in regional and
remote areas compared to metropolitan. However the low number of responses for
this response means that the results should be treated with caution. By contrast,
more participants in metropolitan areas reported that a verbal warning had been
given to an offender (n = 39/62, 63%), however this was not found to be statistically
significant and the small number involved mean this result should be interpreted
with caution. Please see Table 40.
202

Table 40: Employer response to reported violence by region (n = 407) § Ω ¥
Response Metropolitan (%)
Regional (%)
Other (%)
Total (%)
d.f. chi-squared p-value
Offered immediate support 91 (55) 66 (40) 8 (5) 165 (41) 2 4.1 0.250
No response 69 (47) 71 (48) 8 (5) 148 (36) 2 1.6 0.646
Offered counselling/debriefing 41 (58) 28 (39) 2 (3) 71 (17) 2 2.9 0.407† 0.306‡
Verbal warning given to offender 39 (63) 22 (35) 1 (2) 62 (15) 2 6.7 0.083† 0.065‡
Police involved 20 (43) 24 (52) 2 (4) 46 (11) 2 2.7 0.448† 0.685‡
Written warning to offender 1 (14) 4 (57) 2 (29) 7 (2) 2 13.8 0.003† 0.021‡
Blamed nurse/reporter 1 (33) 1 (33) 1 (33) 3 (1) 2 7.2 0.067† 0.128‡
• † Pearson’s chi-squared • ‡ Fisher’s exact test • § Only 407 participants provided postcodes in response to this question • Ω Participants could respond to all of these items • ¥ Percentages have been calculated as row percentages
203

4.6.3 Management of episodes
This section reports data from all participants.
4.6.3.1 Actions following episodes of patient-related violence: Coping methods
and support
Nurses reported an average of two coping methods each and the majority of nurses
reported that informal debriefing was their preferred way of coping with the
aftermath of an episode of violence. Informal debriefing involved other staff
members or family and friends. Formal channels were accessed less frequently, and
included talking with management, formal debriefing, employer counselling services
and private counselling. Forty four nurses took no action following an episode and
16 stated that “nothing helped”. Other actions cited included exercise which was
reported by 14 nurses as being a positive way of coping with the after effects of an
episode of violence. Please refer to Table 41.
204

Table 41: Actions effective in dealing with consequences of patient-related violence (n = 507)
Action Total response Ω (%)
Informal debriefing with other staff 441 (87)
Talking with friends & family 261 (51)
Talking with Nurse Unit Manager/managers 210 (41)
Formal group debriefing 83 (16)
Took no action 44 (9)
Employer counselling services e.g. Employee Assistance Program 43 (9)
Private counselling services 19 (4)
Talking with Human Resource or Occupational Health & Safety representative
17 (3)
Talking with union or professional association 16 (3)
Nothing helped 16 (3)
Other 28 (6)
Total 1178
Ω Participants could respond to all of these responses
Data were further analysed according to region and no statistical differences were
identified as shown in Table 42.
205

Table 42: Actions effective in dealing with consequences of patient-related violence by region (n = 421) § Ω ¥
Actions Metropolitan (%)
Regional (%)
Other (%)
Total (%)
d.f. chi-squared p-value
Informal debriefing with other staff
194 (50) 178 (46) 18 (5) 390 (93) 2 3.49 0.840
Talking with friends & family 117 (49) 111 (47) 9 (4) 237 (56) 2 4.54 0.209
Talking with Nurse Unit Manager/managers
101 (54) 79 (42) 7 (4) 187 (44) 2 3.19 0.364
Formal group debriefing 39 (53) 33 (45) 2 (3) 74 (18) 2 1.37 0.654† 0.722‡
Took no action 17 (43) 20 (50) 3 (8) 40 (10) 2 3.89 0.480† 0.373‡
Employer counselling services e.g. Employee Assistance Program
25 (64) 12 (31) 2 (5) 39 (9) 2 4.10 0.129† 0.098‡
Private counselling services 7 (41) 9 (53) 1 (6) 17 (4) 2 0.50 0.781† 0.611‡
Talking with Human Resources or Occupational Health & Safety representative
11 (73) 4 (27) 0 (0) 15 (4) 2 3.79 0.152† 0.235‡
Talking with union or professional association
10 (67) 5 (33) 0 (0) 15 (4) 2 2.18 0.336† 0.440‡
Nothing helped 5 (38) 7 (54) 1 (8) 13 (3) 2 0.81 0.668† 0.447‡
• † Pearson’s chi-squared • ‡ Fisher’s exact test • § Only 421 participants provided postcodes in response to this question • Ω Participants could respond to all of these items • ¥ Percentages have been calculated as row percentages
206

4.6.3.2 Actions following episodes of patient-related violence: Support and
follow up
Participants were asked if they were offered access to recognised counselling services
following their most significant episode of patient-related violence in the preceding 6
months. Almost three quarters of the 505 nurses who answered this question
reported that they had not been offered access or that they felt this was not
applicable (n = 356, 70%). In addition 273/438 (62%) nurses stated that they had not
been provided with adequate information, support and follow up or that this was
not applicable in their situation.
These data were further analysed according to geographic location and no statistical
differences were found between regions as shown in Table 43.
207

Table 43: Access to counselling and adequate follow up by region
Access to counselling Metropolitan (n = 225)
(%)
Regional (n = 203 )
(%)
Other (n = 21)
(%)
Total (n = 449) §
(%)
d.f. chi-squared p-value
Yes 67 (30) 62 (31) 6 (29) 135 (30) 2 1.12 0.981
No 114 (51) 103 (51) 12 (57) 229 (51) 2 0.33 0.847
N/A 44 (20) 38 (19) 3 (14) 85 (19) 2 0.36 0.836† 0.895‡
Adequate follow up Metropolitan (n = 215)
(%)
Regional (n = 196)
(%)
Other (n = 19)
(%)
Total (n = 430) §
(%)
d.f. chi-squared p-value
Yes 98 (46) 80 (41) 8 (42) 186 (43) 2 5.64 0.465
No 78 (36) 88 (45) 10 (53) 176 (41) 2 4.28 0.118
Not involved in any episodes
39 (18) 28 (14) 1 (53) 68 (16) 2 2.81 0.246† 0.285‡
† Pearson’s chi-squared ‡ Fisher’s exact test § Only 449 and 430 participants respectively provided postcodes in response to these questions
208

Nurses were asked to elaborate about support and follow up and the main categories
that emerged are shown in Table 44. A lack of follow up or response from
management was the most common reason stated:”…incident form completed but no
follow-up from management as it was considered insignificant…” (p509); “… have never had
anyone follow-up a RISKMAN I have submitted regarding a violent or aggressive incident in
the ED…” (p456); “…nil support from management… tend to blame others rather than give
support to nursing staff…” (p406); “…My manager listened to my story and then proceeded
to give me her own examples of violence towards her in the past. I felt that my story was not
as significant as hers and therefore not worthy of even a complaint. I almost apologised for
bringing it to her attention…” (p388).
Nurses also reported that they felt that they did not require support following an
episode or had decided not to report the episode of violence: “…I would not want any
anyway. I deal with it myself…”(p457); “…I felt like I wasn't too concerned about it at the
time - and the support available I think would be embarrassing to attend…”(p416); “…after
many years on emergency nursing you become less affected emotionally or develop coping
mechanisms...” (p392); “…All were verbal abuse where security and police responded
promptly, no longer distresses me as I often have to deal with it…” (p71). Other nurses
stated that such violence was perceived by themselves and management as just part
of the job of ED nursing: “…violence has become an accepted part of my job…” (p526);
“…our ED does not wish to acknowledge that violence exists. We are NOT allowed to have
posters, material about violence. We do NOT have a policy as 'it doesn't happen here'…
(p507); “…just got used to it, it’s like a weekly event…” (p495); “…after 20 years’
experience in the ED, violence has become an unfortunately accepted part of my job…”
(p480).
Less than 20% of participants reported that support was offered or available in their
department: “…EAP is always there if I feel it’s needed. I am fully supported at work for
any incidents…” (p463); “…contacted by senior admin - offered EAP and reassured that
209

systems will continue to be looked at…” (426). Informal debriefing with colleagues was
also discussed:”… we talked about it among ourselves. I wasn't interested in any real follow
up…” (p512)”…; we just talked among ourselves… we were upset… it took some days for
me to sort it out in brain - I blame the patient...” (p342); “…After many years of nursing, I
find just talking things over with work colleagues is adequate - I have never felt the need for
recognised counselling…” (p292).Æ5
Table 44: Support following an episode of patient-related violence (n = 277)
Categories Total responses (%)
Lack of follow up/response 88 (32)
Support not required/not reported 60 (22)
Support available 51 (18)
Part of the job 31 (11)
Informal debriefing 31 (11)
Police involvement 5 (2)
Time constraints 3 (1)
Other 8 (3)
4.6.4 Employer response
4.6.4.1 Barriers to change
The majority of nurses (n = 406/498, 82%) reported that no changes were introduced
following their most significant episode of patient-related violence and these data
5 Æ These data were free-text responses that were subsequently categorised by two independent
researchers who achieved consensus about the final categories and content of these data items.
5 “p” refers to participants
210

were further analysed according to region. This included 174/217 metropolitan
nurses (80%), 168/205 regional nurses (82%) and 18/20 from the other/remote
category (90%). §6
Participants were then asked to suggest reasons for the lack of change, and analysis
of these responses is summarised in Table 45. Participants perceived that there was
no solution to the problem of patient-related violence due to the volume of episodes
and a workplace culture where violence was viewed as an expected part of ED
nursing: “…exposure to violence is accepted in the ED…” (p191); “…violent episodes rife
within the dept. Problem is all pervasive…” (p240); “…I think it’s assumed that it’s ‘part of
the job’…” (p247); “…because it (violence) has become so commonplace it goes unnoticed…”
(p313); “…A lot of the violence is verbal and subtle and not something you would be
complaining about otherwise you just couldn't go back to work. When you are full time as I
have been in the past these verbal abuses may happen every day - you can't take it
personally...” (p353); “…there are so many we have a saying "if you haven't been abused six
times in your shift you haven't had a good day…" (p101). Other participants adopted the
view that it was too hard or not possible to implement changes following an episode
of patient-related violence: “…no practical solution…” (p497); “…it is looked upon as
being too hard to address, a one-off situation that won't happen again therefore doesn't need
addressing…” (p97); “…Impossible to eliminate…” (p57); “…patient was intoxicated on
alcohol/drugs - when she strangled me. Security & CDA officers already there: what else
could be done - unfortunate result…” (p93).
Another barrier to change that emerged from the data was an unsupportive attitude
on the part of management and a tendency to therefore ignore episodes of violence:
“…apathy on the part of management…” (p518); “…managers excuse themselves from
6 § Only 442 participants provided postcodes in response to this question
211

situations…” (p486);”… we are supposed to be able to withstand such behaviour as
management thinks the patient is always right…” (p413); “…they didn't believe it was
significant for a nurse to get hurt…” (p364); “…incident not seen as being important
enough to introduce change…” (p283). There was also acknowledgement of the
financial cost of changes: “…no finances to introduce changes…” (p323); “…ED is
geographic nightmare and would take excessive funds to change the environment…” (p272);
“…Cost to implement real changes is too high…” (p255).
Some nurses did not feel that changes were necessary or warranted: “…protocols in
place already and followed…” (p446).Æ7
Table 45: Barriers to change (n = 335)
Categories Total responses (%)
No solution 119 (36)
Unsupportive management includes cost implications 107 (32)
Adequate measures already in place 47 (14)
Not necessary/not applicable/not reported 29 (9)
Unknown 23 (7)
Inadequate measures in place 5 (1)
Other 5 (1)
4.6.4.2 Changes implemented
7 Æ These data were free-text responses that were subsequently categorised by two independent
researchers who achieved consensus about the final categories and content of these data items.
7 “p” refers to participants
212

Immediate changes following an episode of violence were reported to be
implemented by 92/498 (18%) participants and these included 43/217 metropolitan
participants (20%), 37/205 regional nurses (18%) and 2/20 from the “other/remote”
regions (10%) §8. These changes included: increased security presence in the ED and
the introduction of duress alarms: “…security upgrade…” (p450); “…after a doctor was
assaulted - security officers were employed in ED. Often they are too busy with scheduled
psych patients and not able to patrol over very big and busy ED…” (p379). Modification of
the ED was also discussed with respect to the environment; access, the use of CCTV
and signage: “…installation of CCTV, security door…” (489);”… we now have security
guards on night duty for "schoolies week", Christmas and New Year and other peak
celebration times. Also for OSH requirements and to attain minimum standards we now have
a screened off triage area - a safe withdrawal room, video monitoring of waiting room and
entrance and hazard alarm bells…” (p273). Æ9 Please see Table 46.
8 § Only 442 participants provided postcodes in response to this question
9 Æ These data were free-text responses that were subsequently categorised by two independent
researchers who achieved consensus about the final categories and content of these data items.
9 “p” refers to participants
213
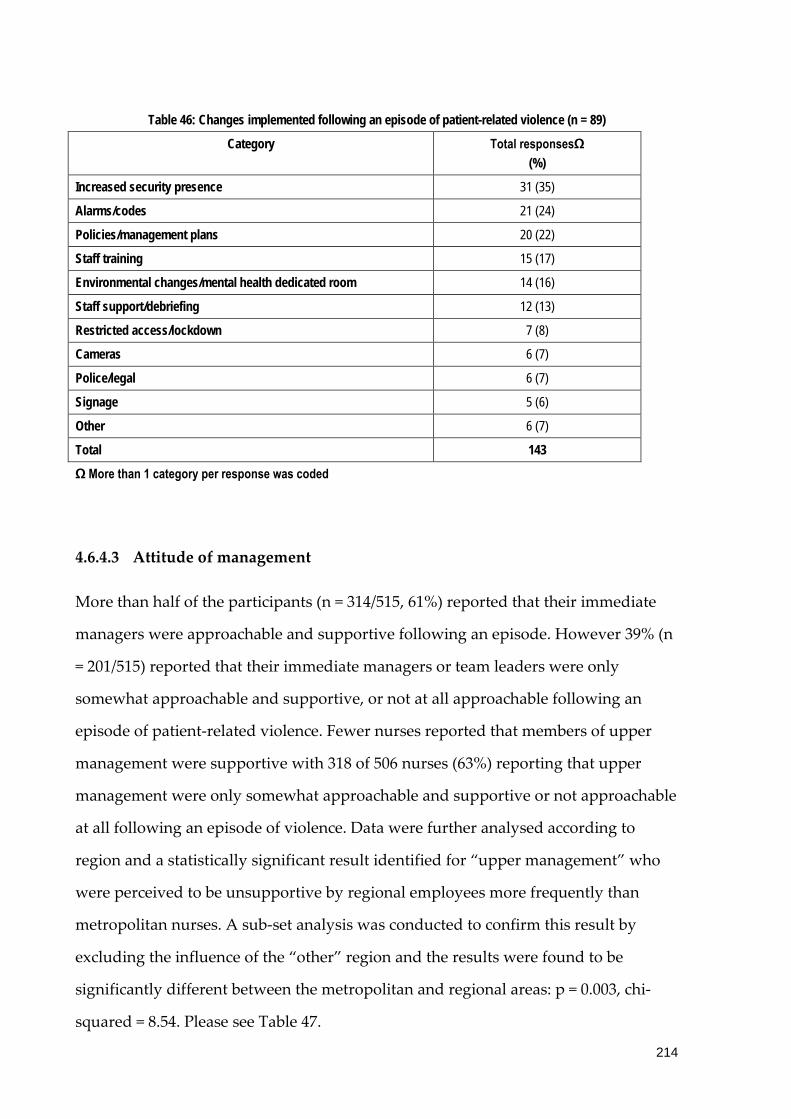
Table 46: Changes implemented following an episode of patient-related violence (n = 89)
Category Total responsesΩ (%)
Increased security presence 31 (35)
Alarms/codes 21 (24)
Policies/management plans 20 (22)
Staff training 15 (17)
Environmental changes/mental health dedicated room 14 (16)
Staff support/debriefing 12 (13)
Restricted access/lockdown 7 (8)
Cameras 6 (7)
Police/legal 6 (7)
Signage 5 (6)
Other 6 (7)
Total 143
Ω More than 1 category per response was coded
4.6.4.3 Attitude of management
More than half of the participants (n = 314/515, 61%) reported that their immediate
managers were approachable and supportive following an episode. However 39% (n
= 201/515) reported that their immediate managers or team leaders were only
somewhat approachable and supportive, or not at all approachable following an
episode of patient-related violence. Fewer nurses reported that members of upper
management were supportive with 318 of 506 nurses (63%) reporting that upper
management were only somewhat approachable and supportive or not approachable
at all following an episode of violence. Data were further analysed according to
region and a statistically significant result identified for “upper management” who
were perceived to be unsupportive by regional employees more frequently than
metropolitan nurses. A sub-set analysis was conducted to confirm this result by
excluding the influence of the “other” region and the results were found to be
significantly different between the metropolitan and regional areas: p = 0.003, chi-
squared = 8.54. Please see Table 47.
214

Table 47: Management support by region
Metropolitan (n = 229)
(%)
Regional (n = 208)
(%)
Other (n = 21)
(%)
Total (n = 458) §
(%)
Chi-squared p-value
Immediate management
YES 145 (63) 124 (60) 11 (52) 280 (61) 1.38 0.709
NO 9 (4) 13 (6) 0 (0) 22 (5) 2.82 0.423 † 0.462 ‡
SOMEWHAT 75 (33) 71 (34) 10 (48) 156 (34) 1.91 0.592
Metropolitan (n = 226)
(%)
Regional (n = 203)
(%)
Other (n = 21)
(%)
Total (n = 450) §
(%)
Upper management
YES 96 (42) 67 (33) 6 (29) 169 (38) 5.15 0.161
NO 46 (20) 65 (32) 4 (19) 115 (26) 8.15 0.043 † 0.044 ‡
SOMEWHAT 84 (37) 71 (35) 11 (52) 166 (37) 2.61 0.456
• § Only 458 and 450 participants respectively provided postcodes in response to these questions • † Pearson’s chi-squared • ‡ Fisher’s exact test
215

4.6.5 Risk prevention strategies
The most common risk prevention strategies identified by ED nurses were duress
alarms; restricted access to the department (for example the use of swipe cards);
access to training such as aggression minimisation training; referral to the police if a
situation deteriorated and the use of safety glass at triage. The use of security was
reported by the majority of participants (n = 479/515, 93%) with personnel either
based in or near the department. Increased security measures after hours were noted
by 33% of participants (n = 170). On average, participants reported eight strategies
each in response to this question. Twelve participants noted that the current
measures in their department were inadequate and eight reported a lack of a security
and/or police presence when requested. Please see Table 48.
216

Table 48: Risk prevention/minimisation measures (n = 515)
Strategy Total response Ω (%)
Duress alarms 461 (90)
Restricted access to the department e.g. key or card access
450 (87)
Access to training e.g. Aggression minimisation training 414 (80)
Police called if a situation deteriorates 399 (78)
Safety glass window at triage 377 (73)
Signage e.g. Zero Tolerance posters 352 (68)
Security personnel available but based elsewhere in department
287 (56)
Availability of restraints and policies for their use 286 (56)
Use of patient management plans 254 (49)
Security personnel based in department 192 (37)
Clear policies for management of aggression 179 (35)
Increased security measures after hours 170 (33)
Fixing of moveable objects that could be used as weapons e.g. chairs
101 (20)
Consultation with management about prevention 98 (19)
Other 25 (<1)
Total 4045
Ω Participants could respond to all of these responses
These data were categorised for region and significant results were identified for
“access to training, for example Aggression Minimisation”, “availability of restraints
and policies for their use” and “security personnel based in the department”, which
were all more frequently reported in metropolitan locations (p<0.001).
Significant results also were evident with regards to the “presence of safety glass at
triage” (p = 0.013) and “clear policies for the management of aggression” (p = 0.024)
which also were more frequently reported in metropolitan areas.
A sub-set analysis was conducted on these variables to exclude the influence of the
“other” region. The presence of a safety glass window at triage was found to not be
statistically significant: p = 0.424, chi-squared = 0.64.
217
However all other significant variables were confirmed to be statistically significant:
“access to training, for example Aggression Minimisation”, “availability of restraints
and policies for their use”, “security personnel based in the department” (p-values
<0.001); and “clear policies for the management of aggression” was also found to be
significant: (p = 0.005, chi-squared = 7.73). All measures were more commonly
reported in metropolitan areas. Please see Table 49 for details.
218
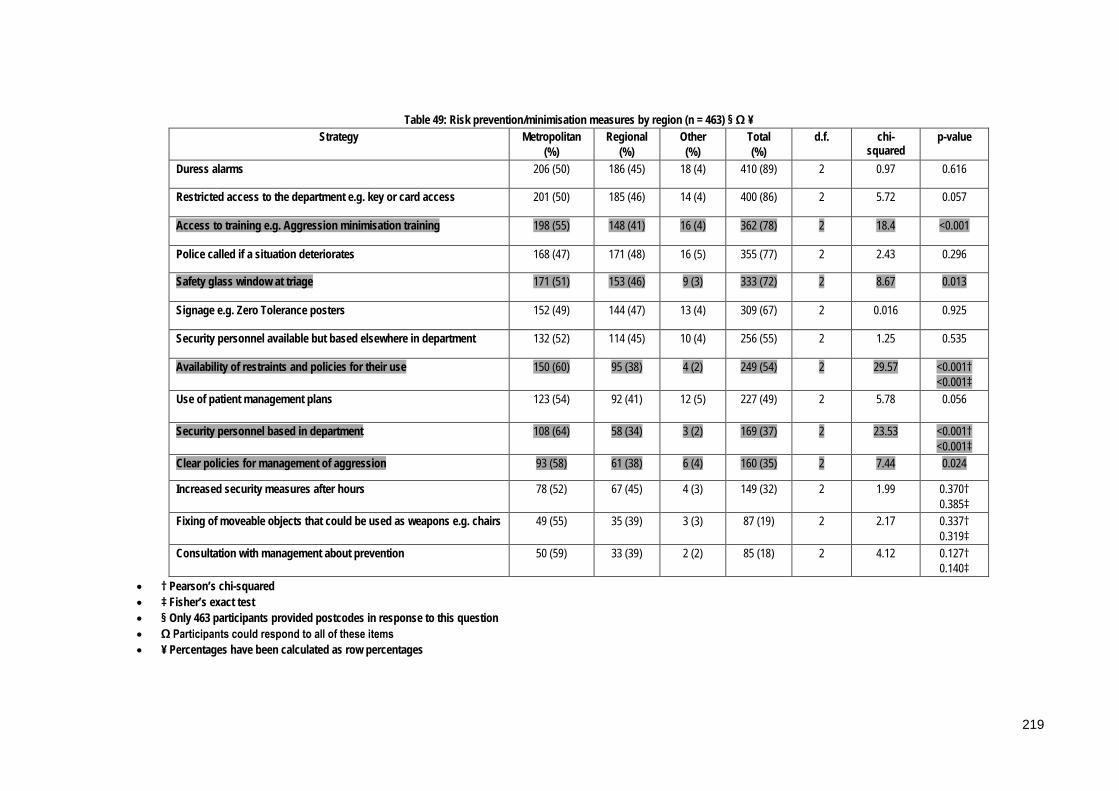
Table 49: Risk prevention/minimisation measures by region (n = 463) § Ω ¥ Strategy Metropolitan
(%) Regional
(%) Other (%)
Total (%)
d.f. chi-squared
p-value
Duress alarms 206 (50) 186 (45) 18 (4) 410 (89) 2 0.97 0.616
Restricted access to the department e.g. key or card access 201 (50) 185 (46) 14 (4) 400 (86) 2 5.72 0.057
Access to training e.g. Aggression minimisation training 198 (55) 148 (41) 16 (4) 362 (78) 2 18.4 <0.001
Police called if a situation deteriorates 168 (47) 171 (48) 16 (5) 355 (77) 2 2.43 0.296
Safety glass window at triage 171 (51) 153 (46) 9 (3) 333 (72) 2 8.67 0.013
Signage e.g. Zero Tolerance posters 152 (49) 144 (47) 13 (4) 309 (67) 2 0.016 0.925
Security personnel available but based elsewhere in department 132 (52) 114 (45) 10 (4) 256 (55) 2 1.25 0.535
Availability of restraints and policies for their use 150 (60) 95 (38) 4 (2) 249 (54) 2 29.57 <0.001† <0.001‡
Use of patient management plans 123 (54) 92 (41) 12 (5) 227 (49) 2 5.78 0.056
Security personnel based in department 108 (64) 58 (34) 3 (2) 169 (37) 2 23.53 <0.001† <0.001‡
Clear policies for management of aggression 93 (58) 61 (38) 6 (4) 160 (35) 2 7.44 0.024
Increased security measures after hours 78 (52) 67 (45) 4 (3) 149 (32) 2 1.99 0.370† 0.385‡
Fixing of moveable objects that could be used as weapons e.g. chairs 49 (55) 35 (39) 3 (3) 87 (19) 2 2.17 0.337† 0.319‡
Consultation with management about prevention 50 (59) 33 (39) 2 (2) 85 (18) 2 4.12 0.127† 0.140‡
• † Pearson’s chi-squared • ‡ Fisher’s exact test • § Only 463 participants provided postcodes in response to this question • Ω Participants could respond to all of these items • ¥ Percentages have been calculated as row percentages
219

4.6.5.1 Follow up strategies
Participants were asked which risk management strategies had been adopted by
their employer and 62% (n = 267/432) reported that episodes of patient-related
violence were investigated by management with prompt follow up and feedback
provided. On average each participant identified three follow up strategies that were
utilised at their place of employment. However 15 nurses reported that there were no
risk management follow up strategies available at their place of employment while
12 stated that whilst they existed there was a lack of feedback and action on the part
of their employer. “Other” risk management follow up strategies included debriefing
and counselling of both a formal and informal nature. Please see Table 50 for
clarification.
Table 50: Risk management follow-up strategies (n = 432)
Strategy Total responses Ω (%)
Investigating reported episodes – prompt follow-up & feedback 267 (62)
Staff counselling services 231 (54)
Informal debriefing at handover 210 (49)
Rotating staff in high risk areas e.g. triage 161 (37)
Consulting with staff about Occupational Health & Safety issues 154 (36)
Reporting episodes to police 128 (30)
Formal debriefing 110 (25
External counselling services 110 (25)
Other 31 (7)
Total 1402
Ω Participants could respond to all of these responses
Risk management follow-up strategies were analysed according to region and the
results are shown in Table 51. Except for “reporting episodes to police”, there were
more risk management strategies adopted in metropolitan areas and for three of
these responses there were significant differences between regions. These significant
strategies were: “investigating reported episodes – prompt follow-up and feedback”;
220
“staff counselling services” and “rotating staff in high risk areas, for example triage”
which were all found to be more common in metropolitan areas compared to
regional and other/remote areas. A sub-set analysis was performed to confirm these
results and exclude the influence of the smaller “other” region on results and all
results were found to be statistically significant. “Investigating reported episodes –
prompt follow-up and feedback”: (p = 0.002, chi-squared = 9.78); “staff counselling
services”: (p <0.001, chi-squared = 12.58) and “rotating staff in high risk areas, for
example triage”: (p = 0.001, chi-squared = 10.74).
221

Table 51: Risk management strategies by region (n = 404) § Ω ¥
Strategy Metropolitan (%)
Regional (%)
Other (%)
Total d.f. chi-squared p-value
Investigating reported episodes – prompt follow-up & feedback
137 (57) 94 (39) 8 (3) 239 (59) 2 12.46 0.002
Staff counselling services 120 (58) 78 (38) 9 (4) 207 (51) 2 12.49 0.006
Informal debriefing at handover 102 (55) 78 (42) 7 (4) 187 (46) 2 3.82 0.282
Rotating staff in high risk areas e.g. triage 89 (61) 54 (37) 2 (1) 145 (36) 2 15.39 0.002† 0.001‡
Consulting with staff about Occupational Health & Safety issues
77 (56) 55 (40) 5 (4) 137 (34) 2 3.89 0.274
Reporting episodes to police 50 (43) 61 (53) 5 (4) 116 (29) 2 3.82 0.281
Formal debriefing 59 (60) 35 (35) 5 (5) 99 (25) 2 7.19 0.066
External counselling services 51 (50) 43 (43) 7 (7) 101 (25) 2 4.25 0.236
• † Pearson’s chi-squared • ‡ Fisher’s exact test • § Only 404 participants provided postcodes in response to this question • Ω Participants could respond to all of these items • ¥ Percentages have been calculated as row percentages
222
4.6.6 Policies and procedures
Participants were asked if they believed that that their organisation’s policies and
procedures related to the prevention and management of patient-related violence
were effective. The majority perceived that the policies and procedures were
ineffective or only “somewhat” effective (n = 417/503, 83%). These data were further
analysed according to region and the results overall were found to be statistically
significant overall (p = 0.004). There were consistently higher results for the
perceived effectiveness of policies and procedures in metropolitan areas, which is
consistent with the results previously detailed for risk management strategies.
Policies were regarded as “effective” (p = 0.025) more often in metropolitan areas and
“not effective” (p = 0.004) more often in regional areas. A sub-set analysis was
performed on these results to exclude the influence of the “other” region and a
statistically significant result confirmed for “policies not perceived to be effective”,
which was more common in regional areas (p = 0.001, chi-squared = 10.24). The result
for policies regarded as “effective” more often in metropolitan areas was also found
to be statistically significant (p = 0.010, chi-squared 6.68). Please see Table 52.
223
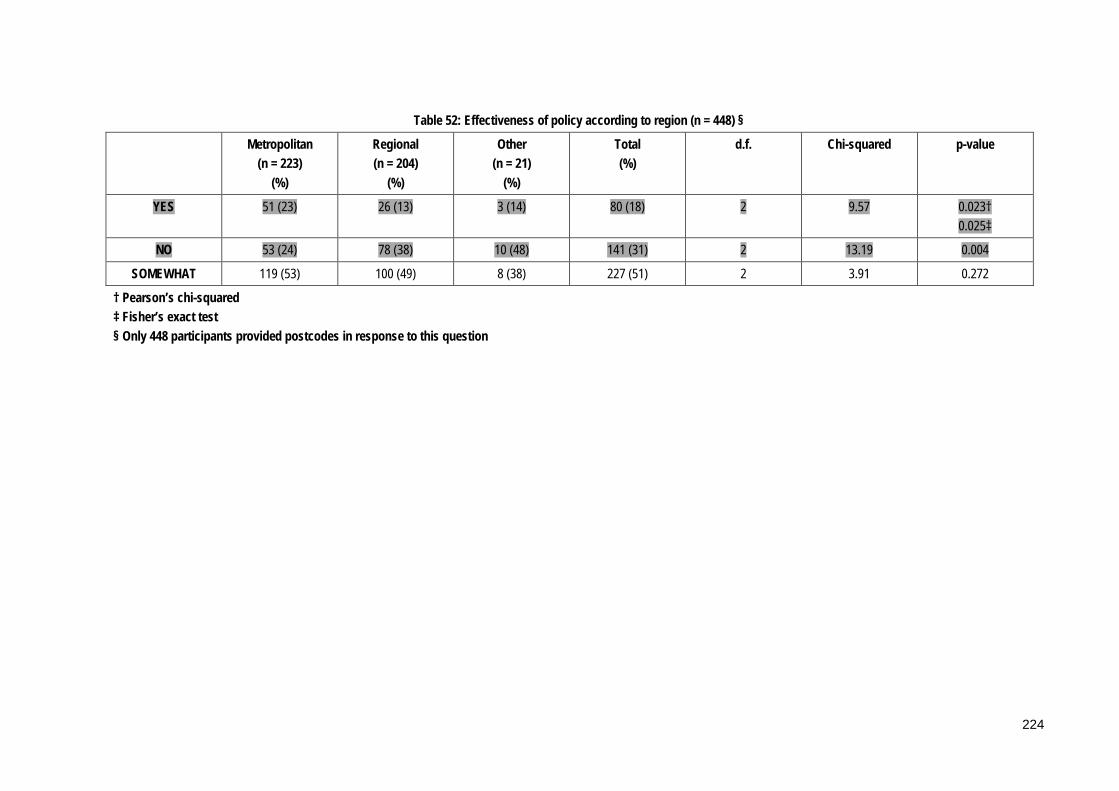
Table 52: Effectiveness of policy according to region (n = 448) §
Metropolitan (n = 223)
(%)
Regional (n = 204)
(%)
Other (n = 21)
(%)
Total (%)
d.f. Chi-squared p-value
YES 51 (23) 26 (13) 3 (14) 80 (18) 2 9.57 0.023† 0.025‡
NO 53 (24) 78 (38) 10 (48) 141 (31) 2 13.19 0.004
SOMEWHAT 119 (53) 100 (49) 8 (38) 227 (51) 2 3.91 0.272
† Pearson’s chi-squared ‡ Fisher’s exact test § Only 448 participants provided postcodes in response to this question
224

Participants were asked to elaborate on this question and the categories identified are
shown in Table 53 Æ10. The main reasons cited were that no clear policies existed or
they were ineffective and/or out-dated in nature: “...they are not practised. Staff is not
encouraged, or knows how to complete necessary forms...” (p433); “...perhaps if they were
strictly enforced they might be...” (p390); “...have not seen such a policy here...” (p432);
“...we try within our policies but they do not keep up with what is happening on the coal
front...” (p332). Lack of training opportunities and absence of adequate security also
were discussed: “...still talking about aggression minimisation course - but no progress...”
(p503); “...have never been educated in current workplace about managing aggression...”
(p419); “...No training has been made available for a number of years, and the training
available is inadequate...” (p87); “...lack of permanent security...” (p509).
Some nurses perceived that no policy would ever be effective in eliminating patient-
related violence: “...sometimes it is irrelevant what policies are available particularly if
patient is irrational due to mental illness, drug/alcohol affected or dementia...” (p412); “...it is
just expected that it’s going to happen so put up with it!”(p408); the policies exist but there is
a feeling that nothing really changes (p345). The lack of enforcement of the exiting Zero
Tolerance policy was also listed as a factor: “...while we have a zero tolerance policy it is
not always enforced...” (p309). Other factors discussed included a lack of support from
management; and the costs involved: “...budget restrictions and restricted support for
training...” (p64).
10 Æ These data were free-text responses that were subsequently categorised by two independent
researchers who achieved consensus about the final categories and content of these data items.
10 “p” refers to participants
225

Table 53: Policies and procedures: factors impacting on their effectiveness (n = 124) Ω
Categories Responses (%)
No clear policy/ineffective 24 (19)
Violence can’t be eliminated 22 (18)
No Zero Tolerance 16 (13)
Training 15 (12)
Policy not followed 12 (10)
Security 12 (10)
Lack of support 9 (7)
Other 21 (17)
Total 131
Ω More than 1 category could be assigned to each participant
4.6.7 Aggression minimisation training
Participants were asked a number of questions regarding aggression minimisation
training at their workplace and these answers are summarised in Table 54. This
training was reported to be available in most EDs, however 24% of those surveyed (n
= 114/467) had never completed any training and the majority (n = 334/454, 74%) had
not completed regular refresher programs. More than half of the nurses who had
completed the training felt that such training was an effective risk management
strategy.
Table 54: Aggression minimisation training ¥
Yes (%)
No (%)
Not sure (%)
Total
Available at workplace (n = 508)
429 (84) 79 (16) 508
Completed by participant (n = 467)
353 (76) 114 (24) 467
Perceived to be effective (n = 359)
202 (56) 68 (19) 89 (25) 359
Regular refresher program (n = 454)
120 (26) 334 (74) 454
¥ Percentages have been calculated as row percentages
226

Data were further analysed according to geographic area and a significant difference
was identified where aggression minimisation training was more common in
metropolitan locations compared to regional and other (p=0.003). A sub-set analysis
was performed on significant results to exclude the effect of the “other” region.
Training was confirmed to “not be available” in the workplace more often in regional
areas: p = 0.001, chi-squared = 11.69. This result is consistent with the result regarding
the effectiveness of such training, which was perceived not to be effective more often
in regional areas, (sub-set analysis: p = 0.016, chi-squared = 5.85). The results
illustrate that more training was available in metropolitan areas, however lack of
access to regular refresher programs was reported by 74% of participants overall.
Please see Table 55.
227
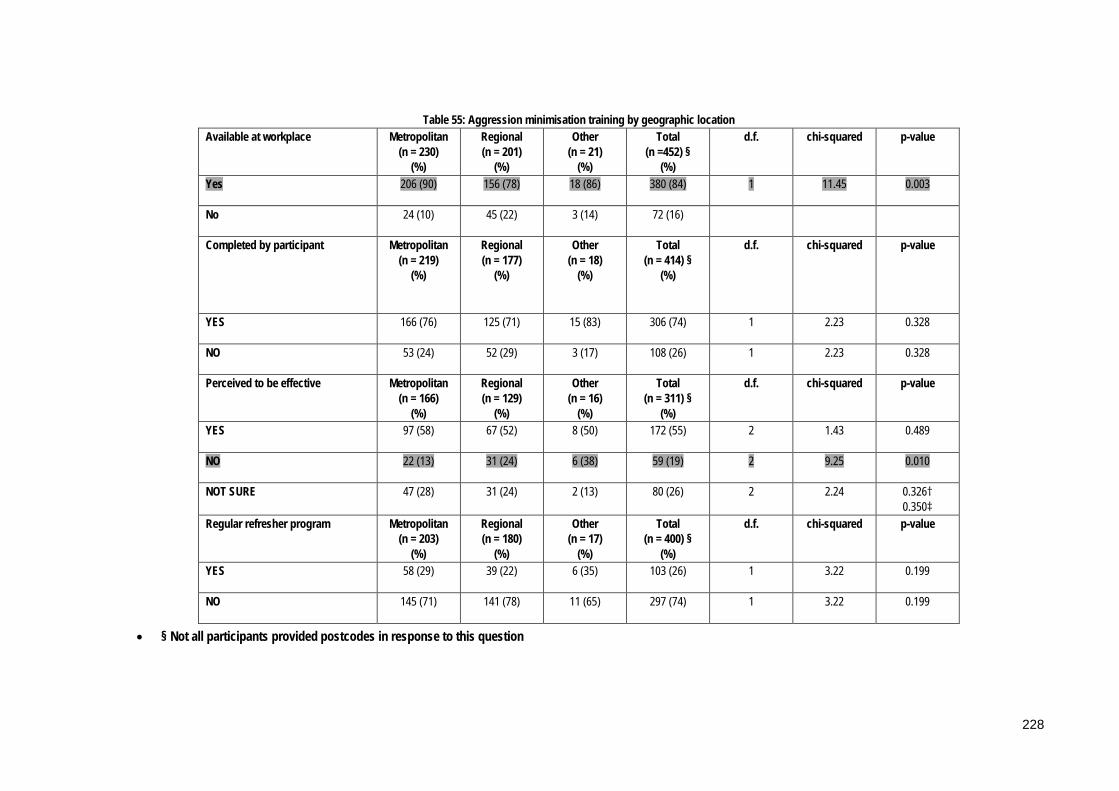
Table 55: Aggression minimisation training by geographic location Available at workplace Metropolitan
(n = 230) (%)
Regional (n = 201)
(%)
Other (n = 21)
(%)
Total (n =452) §
(%)
d.f. chi-squared p-value
Yes 206 (90) 156 (78) 18 (86) 380 (84) 1 11.45 0.003
No 24 (10) 45 (22) 3 (14) 72 (16)
Completed by participant Metropolitan (n = 219)
(%)
Regional (n = 177)
(%)
Other (n = 18)
(%)
Total (n = 414) §
(%)
d.f. chi-squared p-value
YES 166 (76) 125 (71) 15 (83) 306 (74) 1 2.23 0.328
NO 53 (24) 52 (29) 3 (17) 108 (26) 1 2.23 0.328
Perceived to be effective Metropolitan (n = 166)
(%)
Regional (n = 129)
(%)
Other (n = 16)
(%)
Total (n = 311) §
(%)
d.f. chi-squared p-value
YES 97 (58) 67 (52) 8 (50) 172 (55) 2 1.43 0.489
NO 22 (13) 31 (24) 6 (38) 59 (19) 2 9.25 0.010
NOT SURE 47 (28) 31 (24) 2 (13) 80 (26) 2 2.24 0.326† 0.350‡
Regular refresher program Metropolitan (n = 203)
(%)
Regional (n = 180)
(%)
Other (n = 17)
(%)
Total (n = 400) §
(%)
d.f. chi-squared p-value
YES 58 (29) 39 (22) 6 (35) 103 (26) 1 3.22 0.199
NO 145 (71) 141 (78) 11 (65) 297 (74) 1 3.22 0.199
• § Not all participants provided postcodes in response to this question
228

Participants were asked how long ago they had completed aggression minimisation
training and the results are shown in Table 56. More than half of those surveyed had
completed their last refresher two or more years ago (n = 161/299, 54%), and 13
nurses (4%) had not completed any training in the last 10 years. Less than half of
those surveyed had completed such training within the last year. Some participants
did not answer this question using a numerical response, for example “not sure” and
“a while ago”, therefore the responses in Table 56 do not equal the participant
responses.
Table 56: Years since Aggression Minimisation Training completed (n = 299)
Years since AGM training completed Total responses Ω (%)
</=1 135 (45)
2 65 (22)
3 28 (9)
4 19 (6)
5-9 36 (12)
>=10 13 (4)
Total 296
Ω Note some participants did not give a specific number as their answer
4.6.8 Feeling safe at work
Nurses were asked to describe how safe they felt at work and responses were coded
along a continuum from “Mostly safe” to “Moderately safe” to “Sometimes don’t feel
safe” and “Not safe”. Responses in the moderately safe category included verbal
abuse and participants here were noted to always be wary. These findings are
summarised in Table 57. Fifty four nurses reported feeling unsafe at work.
Comments include: “...very unsafe as staff numbers low at night and access to
department...often difficult to get police to attend and often security away and not available
for some time...”(p 76); “...felt safer in active service in the Australian Army!” (p 475) and
229
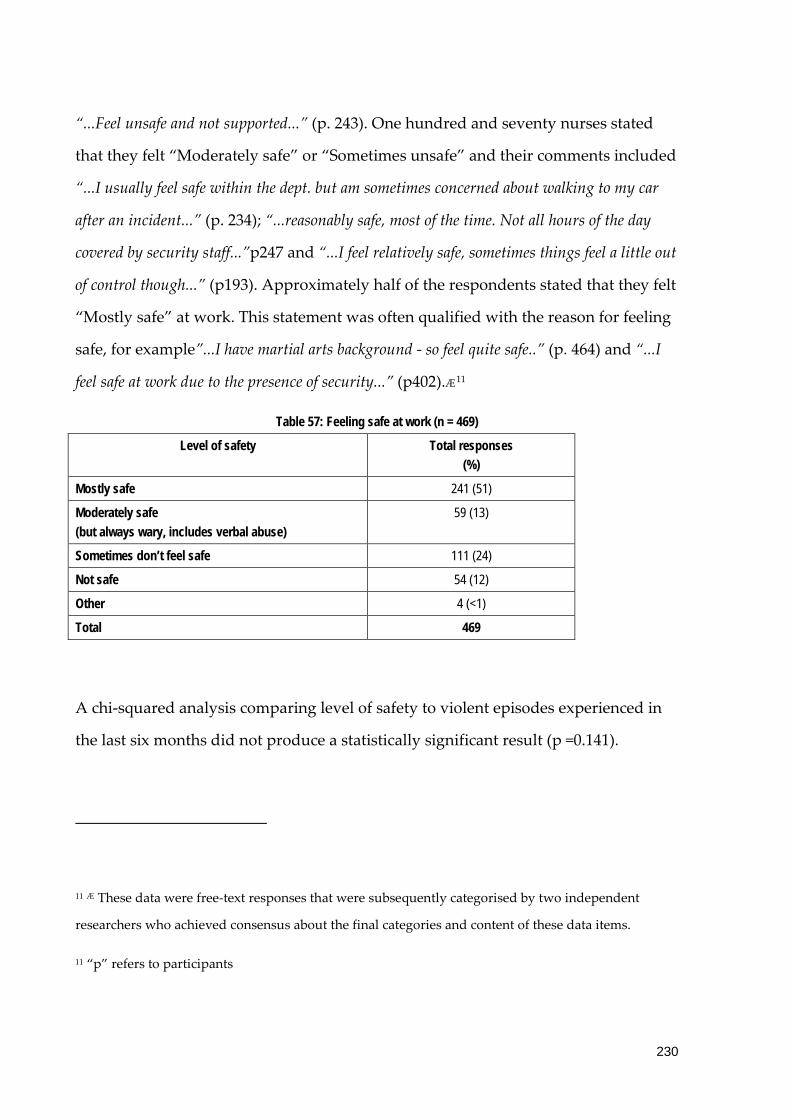
“...Feel unsafe and not supported...” (p. 243). One hundred and seventy nurses stated
that they felt “Moderately safe” or “Sometimes unsafe” and their comments included
“...I usually feel safe within the dept. but am sometimes concerned about walking to my car
after an incident...” (p. 234); “...reasonably safe, most of the time. Not all hours of the day
covered by security staff...”p247 and “...I feel relatively safe, sometimes things feel a little out
of control though...” (p193). Approximately half of the respondents stated that they felt
“Mostly safe” at work. This statement was often qualified with the reason for feeling
safe, for example”...I have martial arts background - so feel quite safe..” (p. 464) and “...I
feel safe at work due to the presence of security...” (p402).Æ11
Table 57: Feeling safe at work (n = 469)
Level of safety Total responses (%)
Mostly safe 241 (51)
Moderately safe (but always wary, includes verbal abuse)
59 (13)
Sometimes don’t feel safe 111 (24)
Not safe 54 (12)
Other 4 (<1)
Total 469
A chi-squared analysis comparing level of safety to violent episodes experienced in
the last six months did not produce a statistically significant result (p =0.141).
11 Æ These data were free-text responses that were subsequently categorised by two independent
researchers who achieved consensus about the final categories and content of these data items.
11 “p” refers to participants
230

These data were compared by region and the results are shown in Table 58 and were
found to be statistically significant overall (p = 0.036). Analysis of the specific
categories found that regional participants felt “not safe” more often than their
metropolitan counterparts (p = 0.054).
231
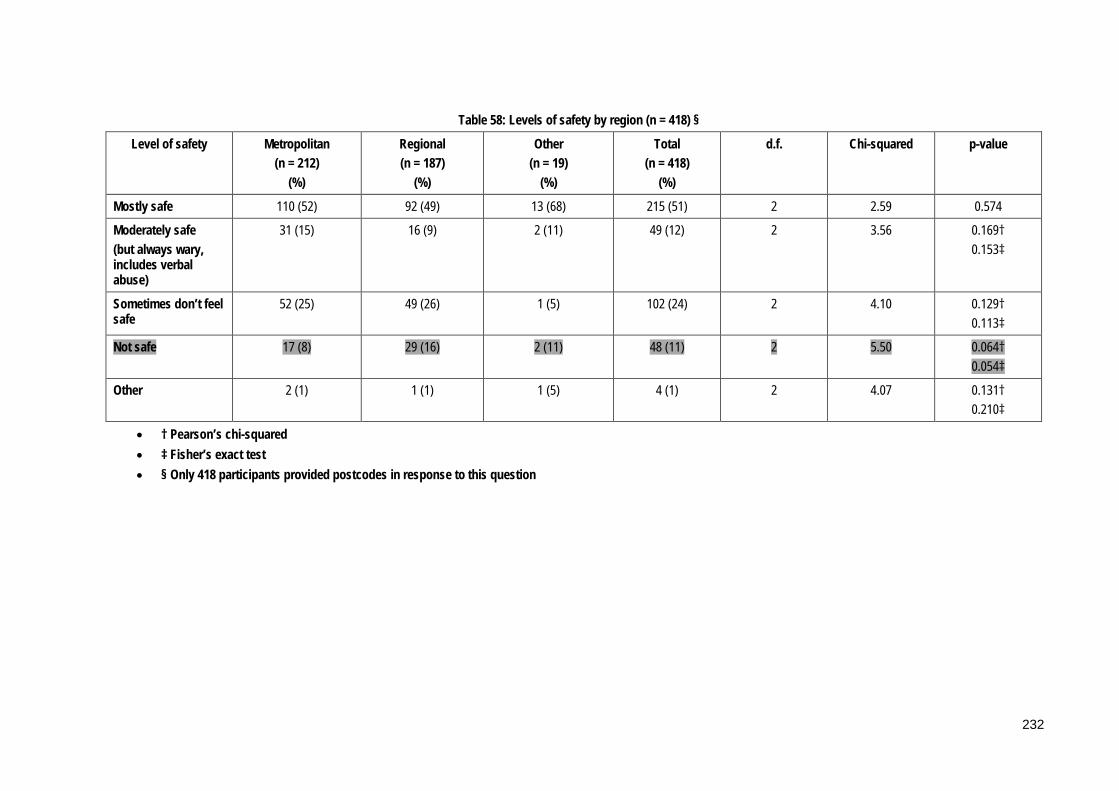
Table 58: Levels of safety by region (n = 418) §
Level of safety Metropolitan (n = 212)
(%)
Regional (n = 187)
(%)
Other (n = 19)
(%)
Total (n = 418)
(%)
d.f. Chi-squared p-value
Mostly safe 110 (52) 92 (49) 13 (68) 215 (51) 2 2.59 0.574
Moderately safe (but always wary, includes verbal abuse)
31 (15) 16 (9) 2 (11) 49 (12) 2 3.56 0.169† 0.153‡
Sometimes don’t feel safe
52 (25) 49 (26) 1 (5) 102 (24) 2 4.10 0.129† 0.113‡
Not safe 17 (8) 29 (16) 2 (11) 48 (11) 2 5.50 0.064† 0.054‡
Other 2 (1) 1 (1) 1 (5) 4 (1) 2 4.07 0.131† 0.210‡
• † Pearson’s chi-squared • ‡ Fisher’s exact test • § Only 418 participants provided postcodes in response to this question
232
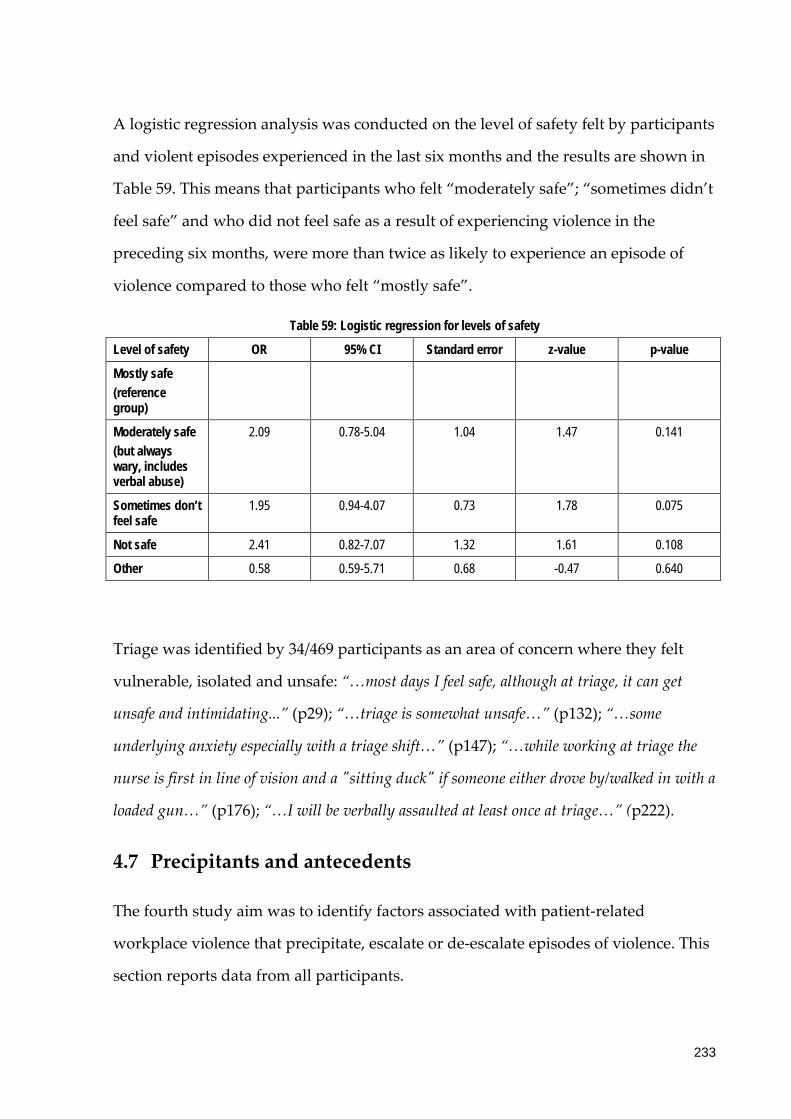
A logistic regression analysis was conducted on the level of safety felt by participants
and violent episodes experienced in the last six months and the results are shown in
Table 59. This means that participants who felt “moderately safe”; “sometimes didn’t
feel safe” and who did not feel safe as a result of experiencing violence in the
preceding six months, were more than twice as likely to experience an episode of
violence compared to those who felt “mostly safe”.
Table 59: Logistic regression for levels of safety
Level of safety OR 95% CI Standard error z-value p-value
Mostly safe (reference group)
Moderately safe (but always wary, includes verbal abuse)
2.09 0.78-5.04 1.04 1.47 0.141
Sometimes don’t feel safe
1.95 0.94-4.07 0.73 1.78 0.075
Not safe 2.41 0.82-7.07 1.32 1.61 0.108
Other 0.58 0.59-5.71 0.68 -0.47 0.640
Triage was identified by 34/469 participants as an area of concern where they felt
vulnerable, isolated and unsafe: “…most days I feel safe, although at triage, it can get
unsafe and intimidating...” (p29); “…triage is somewhat unsafe…” (p132); “…some
underlying anxiety especially with a triage shift…” (p147); “…while working at triage the
nurse is first in line of vision and a "sitting duck" if someone either drove by/walked in with a
loaded gun…” (p176); “…I will be verbally assaulted at least once at triage…” (p222).
4.7 Precipitants and antecedents
The fourth study aim was to identify factors associated with patient-related
workplace violence that precipitate, escalate or de-escalate episodes of violence. This
section reports data from all participants.
233
4.7.1 Nurse characteristics
4.7.1.1 Age
As previously stated the data for age were categorised into two groups and the
majority of participants in both age groups had experienced a violent episode (n =
455/521, 87%). This included 92% (n = 227) of those aged between 23 and 39 years of
age and 84% (n = 246) of those aged between 40 and 65 years of age.
A logistic regression was performed with “violent episodes experienced in the last
six months” as the dependent variable and “age group” as the predictor variable.
The odds of a violent episode in the past 6-months decreased by approximately 60%
for those in the 40 plus age-group (OR = 0.41, 95% CI 0.24, 0.69), (p = 0.001).
Data for age also were analysed as continuous variable. A logistic regression was
performed with “violent episode experienced in the last six months” as the
dependent variable and “age” as the predictor variable. The odds ratio for the “age”
coefficient was 0.96 with a 95% confidence interval of (0.94, 0.99); (p-value = 0.005).
This means that for every year increase in age the odds of experiencing an episode of
violence decreased by 4%. This was further analysed over a five year period using
the natural log of the odds ratio (0.82), and for every five years increase in age the
odds of experiencing an episode of violence decreased by 18%.
The results comparing “age groups” and categories of numbers of episodes
experienced are shown in Table 60. Nurses in the older age group reported higher
numbers across most categories compared to their younger counterparts, however
this was not statistically significant (chi-squared = 7.21, p = 0.065).
234

Table 60: Number of episodes by age group
Age group 23-39 years (n = 191)
(%)
40-65 years (n = 257)
(%)
Total (n = 448)
(%)
Number of episodes
1-10 115 (60) 167 (65) 282 (63)
11-20 39 (20) 44 (17) 83 (19)
21-30 22 (12) 15 (6) 37 (8)
31-100 15 (8) 31 (12) 46 10)
4.7.1.2 Years of experience
A logistic regression was performed with “violent episode experienced in the last six
months” as the dependent variable and “years’ of nursing experience” as the
predictor variable. The odds ratio was 0.97 with a 95% confidence interval of (0.95,
0.99) and a p-value of 0.0065. This means that for every year of nursing experience
there was a 3% reduction in the odds of experiencing an episode of patient-related
violence. For every five years of nursing experience this corresponded to a 14 percent
reduction (log = 0.86).
A logistic regression was performed with “violent episode experienced in the last six
months” as the dependent variable and “years’ experience working in the ED” as the
predictor variable (continuous data). The odds ratio for “years’ experience working
in the ED” was 0.96 with a 95% confidence interval of (0.93, 0.99) and a p-value =
0.006. This means that for every year increase in ED nursing experience the odds of
experiencing an episode of violence decreased by approximately four percent. For
every five years of ED experience the odds decreased by approximately 18% (log =
0.82).
A logistic regression comparing “age” and “years of experience in the ED” compared
to “violent episodes experienced in the last six months” was conducted and the
235

results are shown in Table 61. We were not able to determine the independent effects
of “age” and “years’ of experience in the ED”.
Table 61: Logistic regression results Age and Years’ experience in the ED Odds ratio 95% CI Standard
error
z-value p-value
Violent
episode in
the last 6
months
(reference
group)
Years ED 0.97 0.93-1.01 0.02 -1.37 0.172
Age 0.98 0.95-1.01 0.02 -1.21 0.226
4.7.1.3 Work fraction
A chi-square test was conducted on work fraction: “full-time and part-time/casual
positions” and “violent episodes experienced in the last six months”, and no
statistically significant difference was found between the groups (chi-square = 0.75,
p= 0.386). The number of episodes experienced was categorised into four groups and
compared to work fraction as shown in Table 62 and Figure 6. The number of
episodes experienced was greater for full-time employees across all groups except
one, however this was not found to be statistically significant (p = 0.582).
236
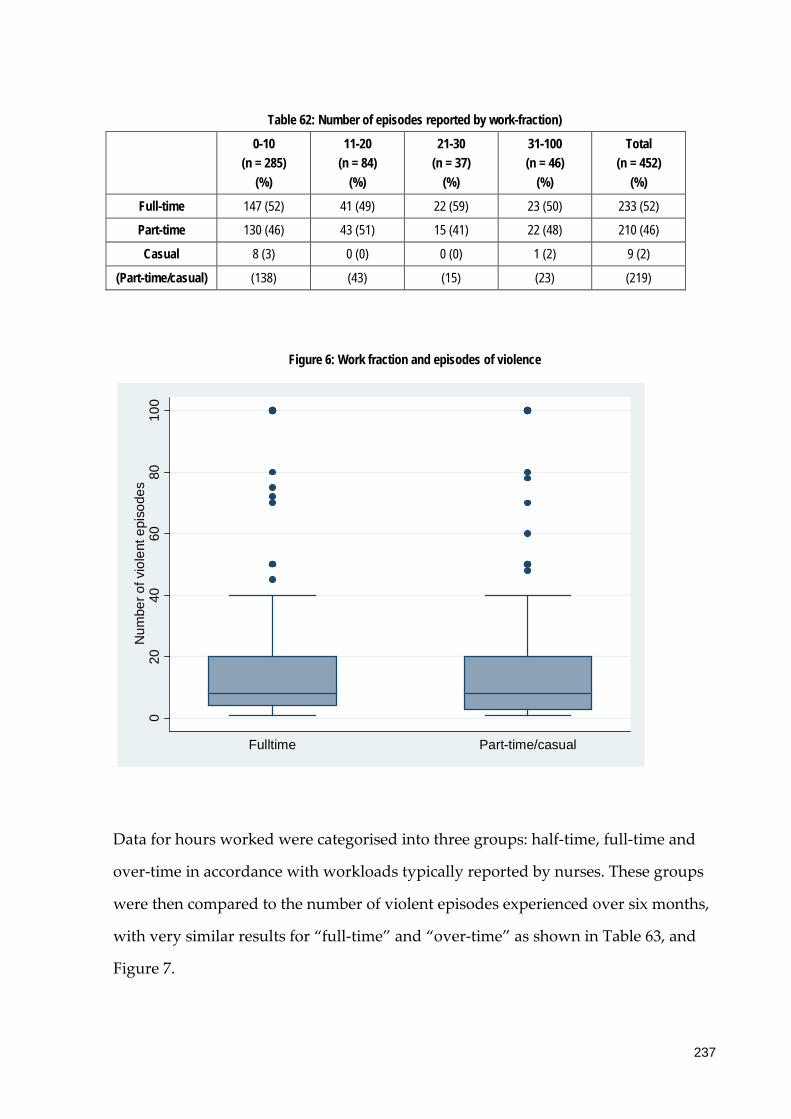
Table 62: Number of episodes reported by work-fraction)
0-10 (n = 285)
(%)
11-20 (n = 84)
(%)
21-30 (n = 37)
(%)
31-100 (n = 46)
(%)
Total (n = 452)
(%)
Full-time 147 (52) 41 (49) 22 (59) 23 (50) 233 (52)
Part-time 130 (46) 43 (51) 15 (41) 22 (48) 210 (46)
Casual 8 (3) 0 (0) 0 (0) 1 (2) 9 (2)
(Part-time/casual) (138) (43) (15) (23) (219)
Figure 6: Work fraction and episodes of violence
Data for hours worked were categorised into three groups: half-time, full-time and
over-time in accordance with workloads typically reported by nurses. These groups
were then compared to the number of violent episodes experienced over six months,
with very similar results for “full-time” and “over-time” as shown in Table 63, and
Figure 7.
020
4060
8010
0N
umbe
r of v
iole
nt e
piso
des
Fulltime Part-time/casual
237

Table 63: Hours of work and number of episodes (n = 442)
Total responses Mean number of episodes
(SD)
Median (IQR)
Half-time (1-19 hours)
69 10.6 (17.9) 5.5 (8)
Full-time (20-38 hours)
237 15.7 (21.0) 8 (16)
Over-time (>39 hours)
136 16.2 (21.3) 8 (16)
Figure 7: Hours of work and number of episodes of violence
A logistic regression was performed with “violent episode experienced in the last six
months” as the dependent variable and “average hours per week” as the predictor
variable. The odds ratio for average hours was 1.04 with a 95% confidence interval of
(1.02, 1.06) and a p-value = 0.63. This means that for every additional hour worked
there is approximately a four percent increase in the odds of experiencing an episode
of violence. This was further analysed over an eight hour period using the natural
020
4060
8010
0N
umbe
r of v
iole
nt e
piso
des
Half-time Full-time Over-time
238
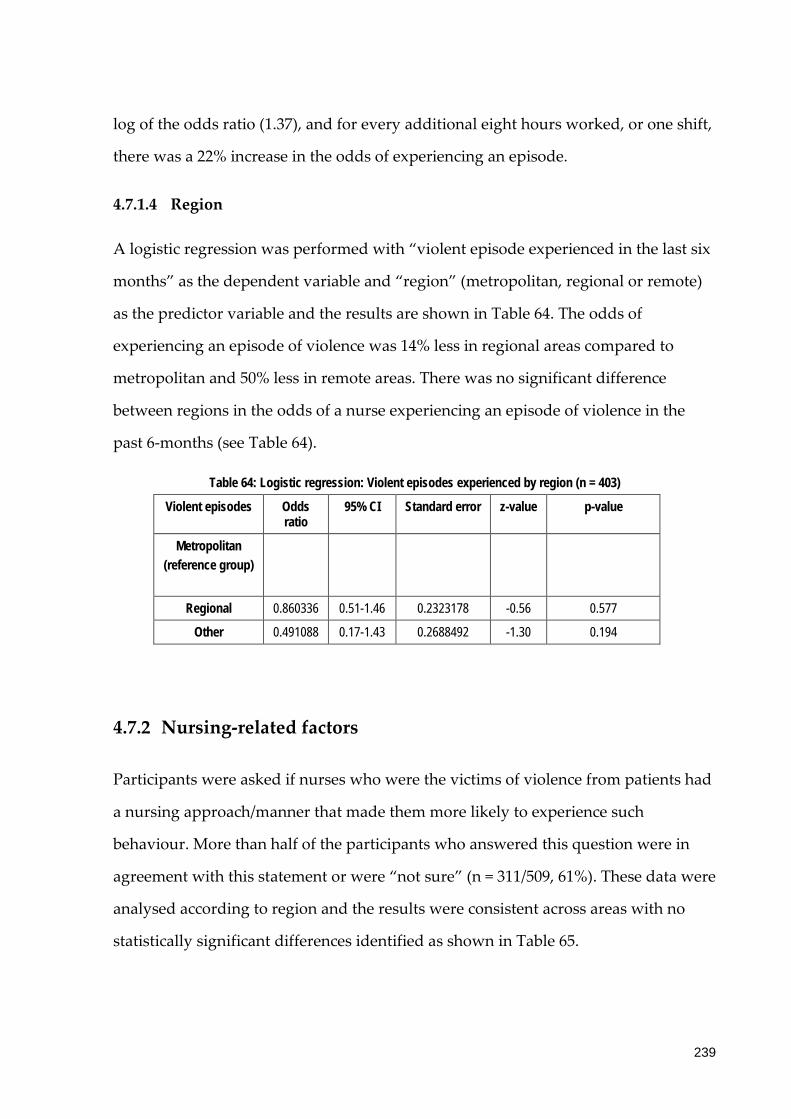
log of the odds ratio (1.37), and for every additional eight hours worked, or one shift,
there was a 22% increase in the odds of experiencing an episode.
4.7.1.4 Region
A logistic regression was performed with “violent episode experienced in the last six
months” as the dependent variable and “region” (metropolitan, regional or remote)
as the predictor variable and the results are shown in Table 64. The odds of
experiencing an episode of violence was 14% less in regional areas compared to
metropolitan and 50% less in remote areas. There was no significant difference
between regions in the odds of a nurse experiencing an episode of violence in the
past 6-months (see Table 64).
Table 64: Logistic regression: Violent episodes experienced by region (n = 403)
Violent episodes Odds ratio
95% CI Standard error z-value p-value
Metropolitan (reference group)
Regional 0.860336 0.51-1.46 0.2323178 -0.56 0.577
Other 0.491088 0.17-1.43 0.2688492 -1.30 0.194
4.7.2 Nursing-related factors
Participants were asked if nurses who were the victims of violence from patients had
a nursing approach/manner that made them more likely to experience such
behaviour. More than half of the participants who answered this question were in
agreement with this statement or were “not sure” (n = 311/509, 61%). These data were
analysed according to region and the results were consistent across areas with no
statistically significant differences identified as shown in Table 65.
239
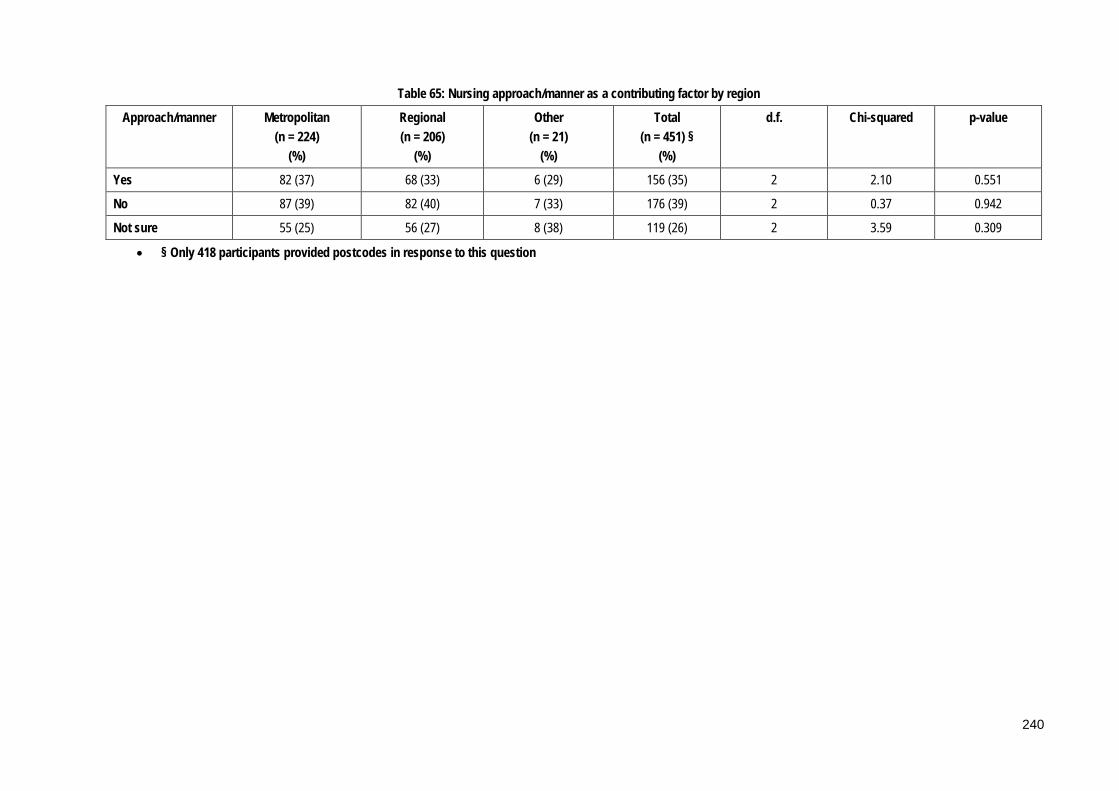
Table 65: Nursing approach/manner as a contributing factor by region
Approach/manner Metropolitan (n = 224)
(%)
Regional (n = 206)
(%)
Other (n = 21)
(%)
Total (n = 451) §
(%)
d.f. Chi-squared p-value
Yes 82 (37) 68 (33) 6 (29) 156 (35) 2 2.10 0.551
No 87 (39) 82 (40) 7 (33) 176 (39) 2 0.37 0.942
Not sure 55 (25) 56 (27) 8 (38) 119 (26) 2 3.59 0.309
• § Only 418 participants provided postcodes in response to this question
240
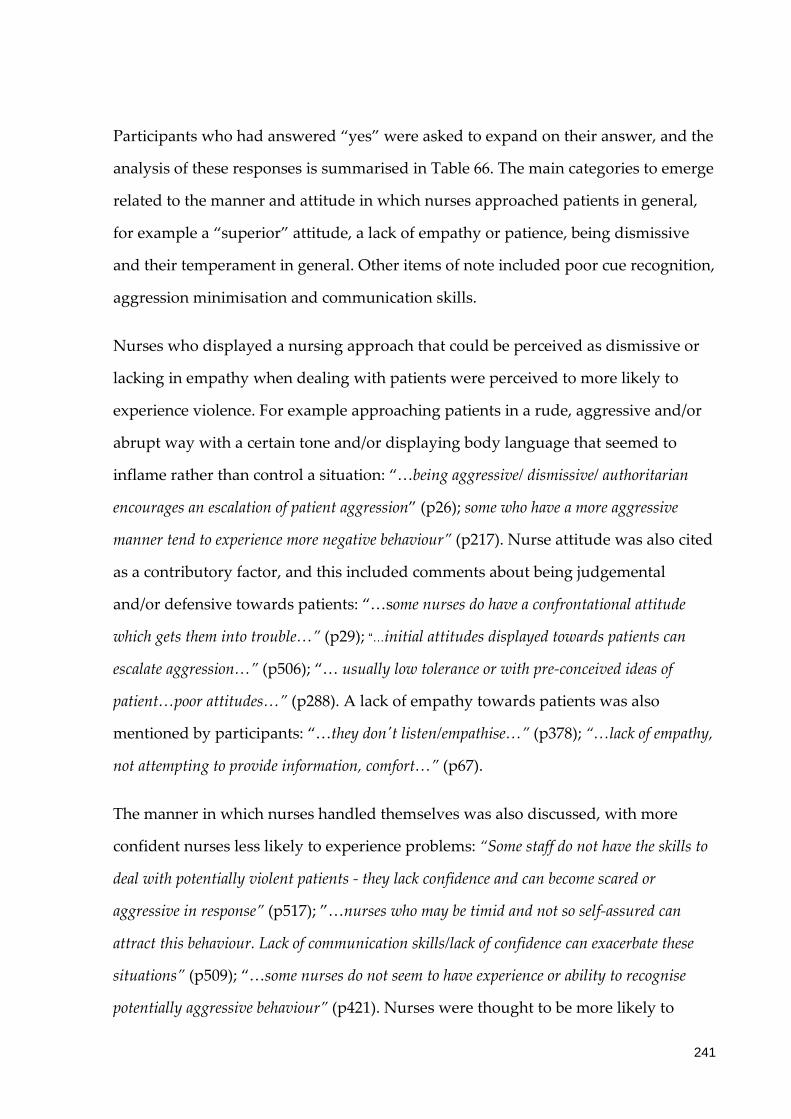
Participants who had answered “yes” were asked to expand on their answer, and the
analysis of these responses is summarised in Table 66. The main categories to emerge
related to the manner and attitude in which nurses approached patients in general,
for example a “superior” attitude, a lack of empathy or patience, being dismissive
and their temperament in general. Other items of note included poor cue recognition,
aggression minimisation and communication skills.
Nurses who displayed a nursing approach that could be perceived as dismissive or
lacking in empathy when dealing with patients were perceived to more likely to
experience violence. For example approaching patients in a rude, aggressive and/or
abrupt way with a certain tone and/or displaying body language that seemed to
inflame rather than control a situation: “…being aggressive/ dismissive/ authoritarian
encourages an escalation of patient aggression” (p26); some who have a more aggressive
manner tend to experience more negative behaviour” (p217). Nurse attitude was also cited
as a contributory factor, and this included comments about being judgemental
and/or defensive towards patients: “…some nurses do have a confrontational attitude
which gets them into trouble…” (p29); “…initial attitudes displayed towards patients can
escalate aggression…” (p506); “… usually low tolerance or with pre-conceived ideas of
patient…poor attitudes…” (p288). A lack of empathy towards patients was also
mentioned by participants: “…they don't listen/empathise…” (p378); “…lack of empathy,
not attempting to provide information, comfort…” (p67).
The manner in which nurses handled themselves was also discussed, with more
confident nurses less likely to experience problems: “Some staff do not have the skills to
deal with potentially violent patients - they lack confidence and can become scared or
aggressive in response” (p517); ”…nurses who may be timid and not so self-assured can
attract this behaviour. Lack of communication skills/lack of confidence can exacerbate these
situations” (p509); “…some nurses do not seem to have experience or ability to recognise
potentially aggressive behaviour” (p421). Nurses were thought to be more likely to
241

experience violence if they possessed poor communication skills: “…some nurses just
don't have a clue about the way they communicate with patients…” (p502); “…some nurses
with poor communication attract violence to some degree…” (p401). Æ12
Table 66: Nursing practice (n = 236)
Category Total responses (%)
Attitude 112 (47)
Inadequate cue recognition & aggression management skills
57 (24)
Front line staff 27 (11)
Overworked/time pressure/burnt out 11 (5)
Poor communication skills 9 (4)
Other 20 (8)
4.7.3 Patient-related factors
4.7.3.1 Groups of patients
The majority of nurses surveyed reported that there were specific groups of patients
who they perceived were more likely than others to display violent behaviour (n =
455/506, 90%). These data were further analysed according to region and no
statistically significant differences were identified (p = 0.265). Participants were asked
to elaborate and the analysis of these responses is outlined in Table 67. Patients
under the influence of drugs and alcohol were identified as the group at most risk of
12 Æ These data were free-text responses that were subsequently categorised by two independent
researchers who achieved consensus about the final categories and content of these data items.
12 “p” refers to participants
242

patient-related violence: “…amphetamine affected patients…” (p528); “…intoxicated and
substance abuse…” (p518) followed by those perceived to have mental health issues.
The age of patients was also discussed, specifically in regards to two main groups,
young patients, aged between 16 and 25 years of age, and elderly patients: “…16-25
year old age group…” (p518); “…16-25 year olds…especially if illicit substances are on
board…” (p517). Male patients and parents also were identified as being groups at
risk of displaying violent behaviour:”…frustrated parents of a young child…” (p483);
“…parents of young children who have to wait for treatment/nursing care…” (p436);
“…parents, they are their child's advocate, as I work in a paeds ED, parents are always there
and I realise that they are "doing it for their child" but still unacceptable…” (p340).
Other responses included Non-English speaking patients and Indigenous patients:
“…Indigenous population under influence of alcohol...” (p185). Patients from lower socio-
economic backgrounds also were identified: “…when they have a tattoo to teeth ratio of
3:1…” (p1). Participants also were asked a specific question about whether they
perceived that socio-economic indicators played a significant role in episodes of
patient-related violence. Two-thirds (n = 342/510) answered in the affirmative while
17% (n = 84/510) answered that they were “not sure”. The issue of Indigenous
patients, in particular with regards to alcohol and a propensity for violence, was not
further investigated. These data came from participant comments and not from
specific survey questions therefore no further analysis was conducted.
243

Table 67: Groups of patients more likely to exhibit violent behaviour (n = 460)
Category Total responses Ω
Drug & alcohol 375
Mental health 249
Age 113
Male gender 41
Parents 24
Other Indigenous 25
Non-English speakers 25
Previous history 9
Lower socio-economic status 3
Total 864
Ω More than 1 category could be assigned to each participant
4.7.3.2 Age of patients
Patients aged 35 years and younger were identified as the highest risk ages by over
three-quarters of those surveyed (n = 417/507, 82%). Participants identified the
highest risk age groups for violence as those between 26 and 35 years (n = 241/507,
48%) and 16 and 25 years (n = 164/507, 32%), as shown in Table 68.
Table 68: Patient Age Groups (n = 507)
Age Group (years) Total responses %
<16 12 (2)
16-25 164 (32)
26-35 241 (48)
36-45 67 (13)
46-55 7 (1)
56-65 8 (2)
66-75 3 (1)
>76 5 (1)
Data were further analysed according to geographic location and a significant
difference was found between regions for patients aged under 16 years of age (p=
244

0.014), and the risk was higher in metropolitan areas, however the small numbers
involved mean that this result should be interpreted with caution. In addition no
statistically significant differences were identified between age grouping of patients
and region overall (chi-squared = 11.366, p-value = 0.123). Please see Table 69 for
more detail.
245

Table 69: Age grouping of perpetrators of violence by region
Age group Metropolitan (n = 224)
(%)
Regional (n = 209)
(%)
Other (n = 14)
(%)
Total (n = 447) §
(%)
d.f. Chi-squared p-value
<16 11 (5) 1 (<1) 0 (0) 12 (3) 2 8.83 0.012† 0.014‡
16-25 68 (30) 72 (34) 8 (57) 148 (33) 2 1.24 0.539
26-35 108 (48) 98 (47) 3 (21) 209 (47) 2 0.67 0.706† 0.697‡
36-45 27 (12) 32 (15) 2 (14) 61 (14) 2 1.81 0.554† 0.628‡
46-55 3 (1) 2 (1) 0 (0) 5 (1) 2 0.38 0.826† 0.999‡
56-65 3 (1) 2 (1) 1 (7) 6 (1) 2 2.26 0.324† 0.325‡
66-75 2 (<1) 1 (<1) 0 (0) 3 (1) 2 0.43 0.808† 0.999‡
>75 2 (<1) 1 (<1) 0 (0) 3 (1) 2 0.43 0.808† 0.999‡
† Pearson’s chi-squared ‡ Fisher’s exact test § Only 448 participants provided postcodes in response to this question
246

4.7.3.3 Triage category
The most common triage categories of patients responsible for episodes of violence
were reported to be three and four as shown in Table 70. Please see Table 8: Triage
categories in the Research Design chapter for an explanation of the triage system
used in Australia.
Table 70: Triage category (n = 491)
Triage category Total response %
1 5 (1)
2 70 (14)
3 204 (42)
4 197 (40)
5 15 (3)
Data were further analysed according to region and a statistically significant
difference was identified for Triage category 2, with more perpetrators reported in
this category in metropolitan areas compared to regional and other/remote. Please
see Table 71.
247
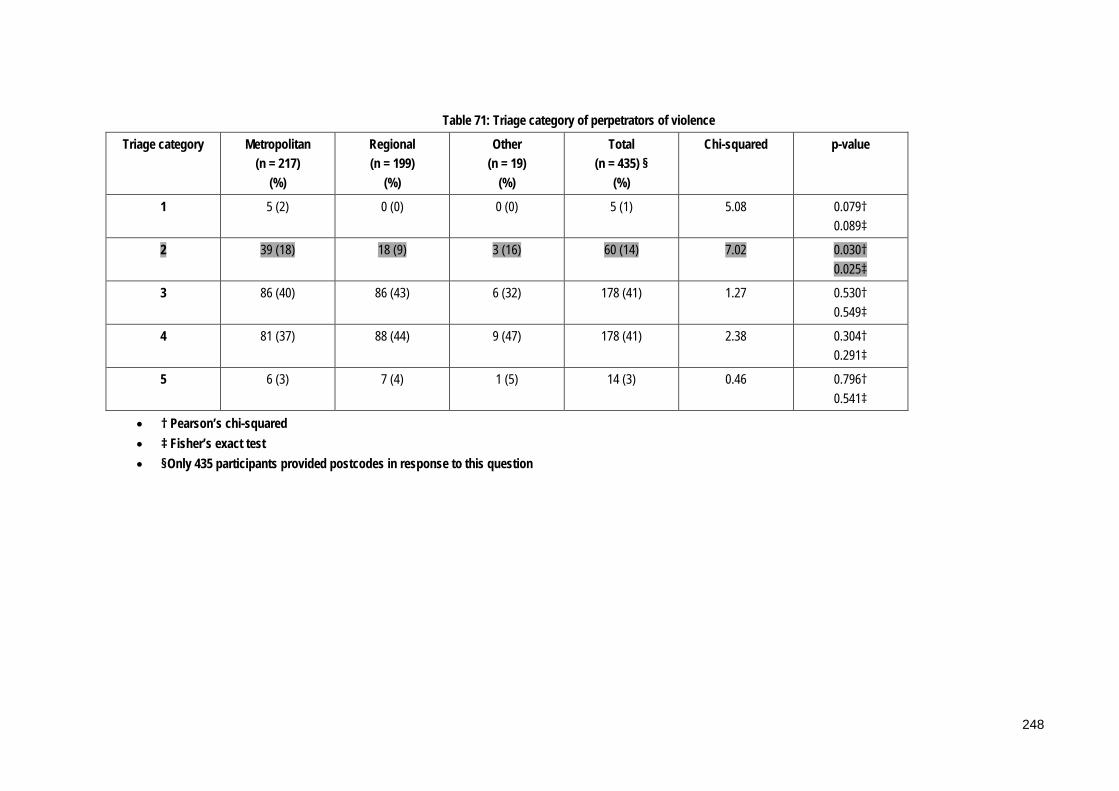
Table 71: Triage category of perpetrators of violence
Triage category Metropolitan (n = 217)
(%)
Regional (n = 199)
(%)
Other (n = 19)
(%)
Total (n = 435) §
(%)
Chi-squared p-value
1 5 (2) 0 (0) 0 (0) 5 (1) 5.08 0.079† 0.089‡
2 39 (18) 18 (9) 3 (16) 60 (14) 7.02 0.030† 0.025‡
3 86 (40) 86 (43) 6 (32) 178 (41) 1.27 0.530† 0.549‡
4 81 (37) 88 (44) 9 (47) 178 (41) 2.38 0.304† 0.291‡
5 6 (3) 7 (4) 1 (5) 14 (3) 0.46 0.796† 0.541‡
• † Pearson’s chi-squared • ‡ Fisher’s exact test • §Only 435 participants provided postcodes in response to this question
248

4.7.3.4 Clinical presentation
The most commonly reported clinical presentations of patients exhibiting violent
behaviour were alcohol intoxication; mental health issues; substance abuse; anxiety
and agitation; dementia and pain. On average each participant reported five types of
clinical presentation for this question. Other responses included references to parents
accompanying children to the ED: “…child was having a prolonged seizure mother
arrived and was verbally aggressive…” (p110); “…paediatric patients…so it always the
parents…” (p511); “…parents of patients…couldn't realise child was unwell…” (p321).
Please refer to Table 72 for more detail.
Table 72: Diagnoses or clinical signs/symptoms of patients who displayed violent behaviour (n = 491)
Diagnoses Total responses Ω %
Alcohol intoxication 411 (84)
Mental health issues 380 (77)
Substance misuse 373 (76)
Anxiety & agitation 217 (44)
Dementia 142 (29)
Pain 134 (27)
Disorientation/confusion 99 (20)
Head injury 91 (19)
Delirium 75 (15)
Trauma 73 (15)
Fear 65 (13)
Paediatric emergency 53 (11)
Cognitive dysfunction 47 (10)
Unknown 31 (6)
Other 38 (8)
Total 2229
Ω Participants could respond to all of these responses
A chi-squared analysis was performed on episodes of violence in the last six months
and the list of diagnoses or clinical signs and symptoms displayed by patients and
249
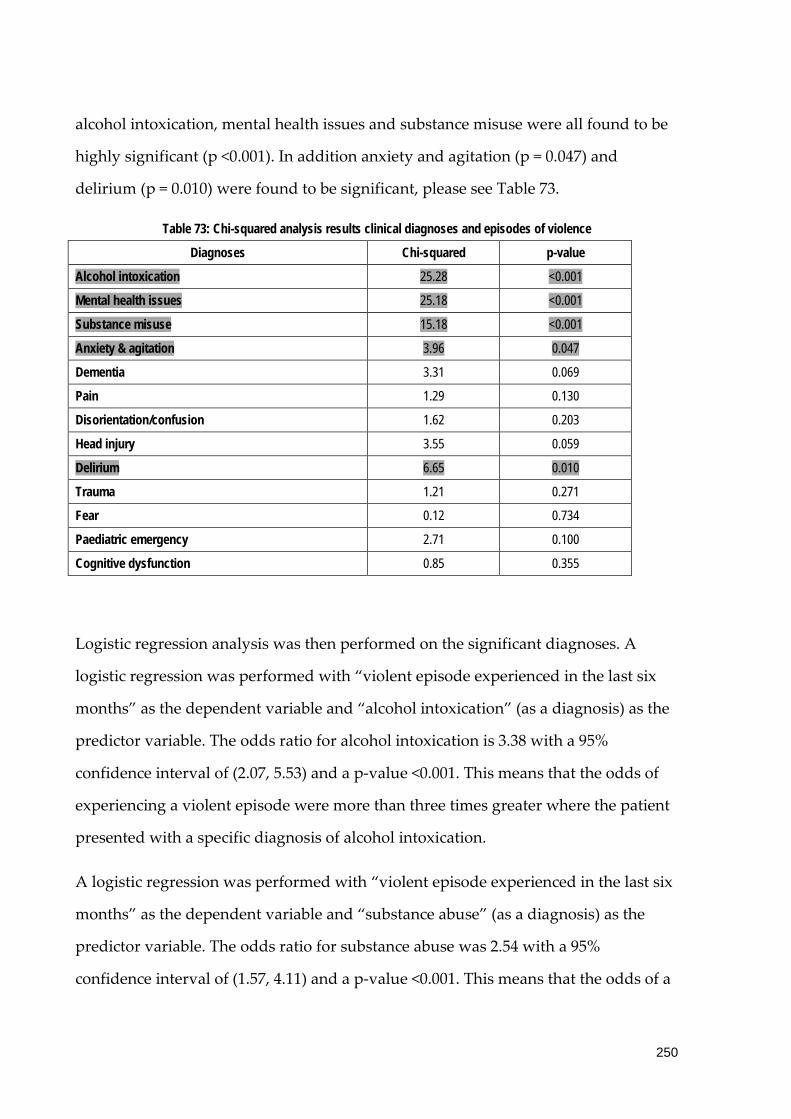
alcohol intoxication, mental health issues and substance misuse were all found to be
highly significant (p <0.001). In addition anxiety and agitation (p = 0.047) and
delirium (p = 0.010) were found to be significant, please see Table 73.
Table 73: Chi-squared analysis results clinical diagnoses and episodes of violence
Diagnoses Chi-squared p-value
Alcohol intoxication 25.28 <0.001
Mental health issues 25.18 <0.001
Substance misuse 15.18 <0.001
Anxiety & agitation 3.96 0.047
Dementia 3.31 0.069
Pain 1.29 0.130
Disorientation/confusion 1.62 0.203
Head injury 3.55 0.059
Delirium 6.65 0.010
Trauma 1.21 0.271
Fear 0.12 0.734
Paediatric emergency 2.71 0.100
Cognitive dysfunction 0.85 0.355
Logistic regression analysis was then performed on the significant diagnoses. A
logistic regression was performed with “violent episode experienced in the last six
months” as the dependent variable and “alcohol intoxication” (as a diagnosis) as the
predictor variable. The odds ratio for alcohol intoxication is 3.38 with a 95%
confidence interval of (2.07, 5.53) and a p-value <0.001. This means that the odds of
experiencing a violent episode were more than three times greater where the patient
presented with a specific diagnosis of alcohol intoxication.
A logistic regression was performed with “violent episode experienced in the last six
months” as the dependent variable and “substance abuse” (as a diagnosis) as the
predictor variable. The odds ratio for substance abuse was 2.54 with a 95%
confidence interval of (1.57, 4.11) and a p-value <0.001. This means that the odds of a
250

violent episode occurring were more than twice as high when patients present with a
specific diagnosis of substance abuse.
A logistic regression was performed with “violent episode experienced in the last six
months” as the dependent variable and “mental health issues” (as a diagnosis) as the
predictor variable. The odds ratio for mental health diagnosis was 3.30 with a 95%
confidence interval of (2.04, 5.34) and a p-value <0.001. This means that the odds of a
violent episode occurring were more than three times higher where a patient
presented with a mental health diagnosis.
A logistic regression was performed with “violent episode experienced in the last six
months” as the dependent variable and “disorientation/confusion” (as a diagnosis) as
the predictor variable. The odds ratio for “disorientation/confusion” was 1.55 with a
95% confidence interval of (0.79, 3.04) and a p-value = 0.206. A logistic regression was
performed with “violent episode experienced in the last six months” as the
dependent variable and “cognitive dysfunction” (as a diagnosis) as the predictor
variable. The odds ratio for “cognitive dysfunction” was 1.57 with a 95% confidence
interval of (0.60, 4.08) and a p-value = 0.359.
Data were further analysed according to region and statistically significant
differences identified for “delirium”, “cognitive dysfunction” and “paediatric
emergency” which were all more common in metropolitan areas. A sub-set analysis
was performed on these three variables and “paediatric emergency” was found to be
consistently statistically significant: p = 0.005, chi-squared = 7.81. The results for
delirium (p = 0.021, chi-squared = 5.35); cognitive dysfunction (p = 0.016, chi-squared
= 5.83) and “pain” (p = 0.041, chi-squared = 6.37) also were found to be significant.
Please see Table 74 for more detail.
251
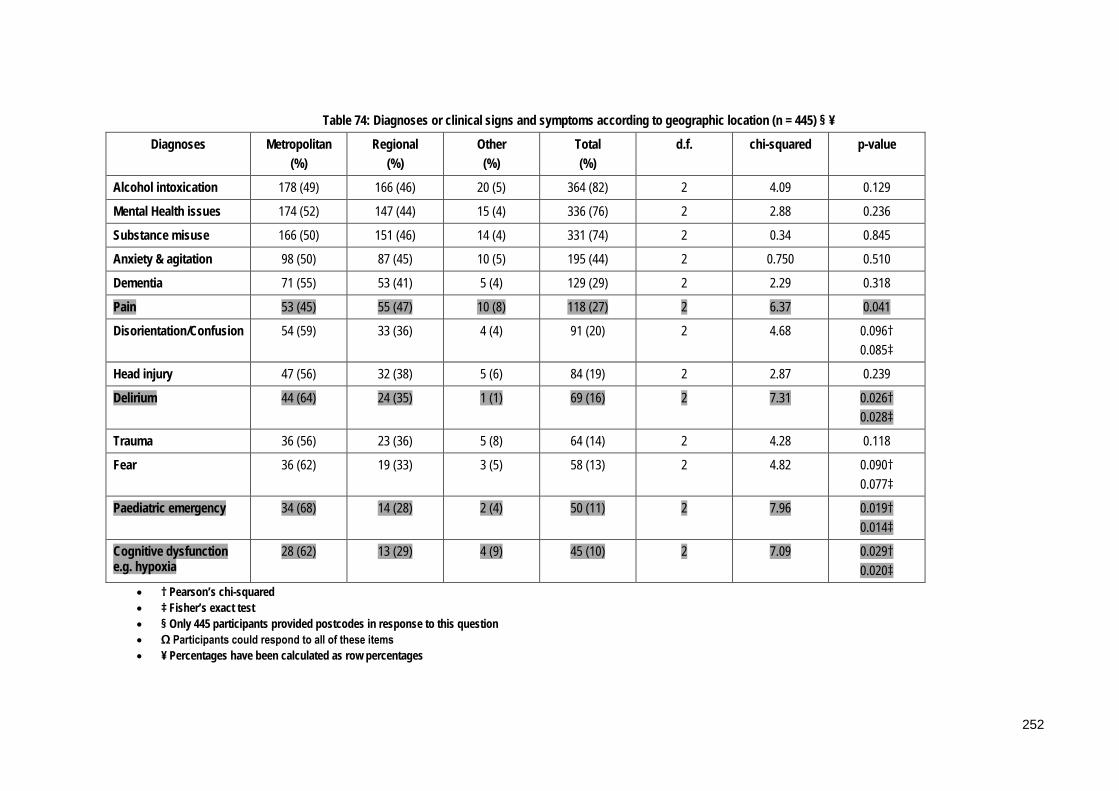
Table 74: Diagnoses or clinical signs and symptoms according to geographic location (n = 445) § ¥
Diagnoses Metropolitan (%)
Regional (%)
Other (%)
Total (%)
d.f. chi-squared p-value
Alcohol intoxication 178 (49) 166 (46) 20 (5) 364 (82) 2 4.09 0.129
Mental Health issues 174 (52) 147 (44) 15 (4) 336 (76) 2 2.88 0.236
Substance misuse 166 (50) 151 (46) 14 (4) 331 (74) 2 0.34 0.845
Anxiety & agitation 98 (50) 87 (45) 10 (5) 195 (44) 2 0.750 0.510
Dementia 71 (55) 53 (41) 5 (4) 129 (29) 2 2.29 0.318
Pain 53 (45) 55 (47) 10 (8) 118 (27) 2 6.37 0.041
Disorientation/Confusion 54 (59) 33 (36) 4 (4) 91 (20) 2 4.68 0.096† 0.085‡
Head injury 47 (56) 32 (38) 5 (6) 84 (19) 2 2.87 0.239
Delirium 44 (64) 24 (35) 1 (1) 69 (16) 2 7.31 0.026† 0.028‡
Trauma 36 (56) 23 (36) 5 (8) 64 (14) 2 4.28 0.118
Fear 36 (62) 19 (33) 3 (5) 58 (13) 2 4.82 0.090† 0.077‡
Paediatric emergency 34 (68) 14 (28) 2 (4) 50 (11) 2 7.96 0.019† 0.014‡
Cognitive dysfunction e.g. hypoxia
28 (62) 13 (29) 4 (9) 45 (10) 2 7.09 0.029† 0.020‡
• † Pearson’s chi-squared • ‡ Fisher’s exact test • § Only 445 participants provided postcodes in response to this question • Ω Participants could respond to all of these items • ¥ Percentages have been calculated as row percentages
252

4.7.3.5 Patient-specific precipitants/contributing factors
Participants were asked what patient-specific factors they perceived to be
precipitants or contributing factors to episodes of violence and these responses were
similar to those identified in responses about clinical presentation. The majority of
nurses reported that alcohol intoxication and substance abuse were the two main risk
factors. Other patient specific factors identified included mental health diagnoses;
unrealistic expectations of patients and a past history of violence. Please see Table 75.
Table 75: Patient-specific factors (n = 512)
Factor Total responses Ω %
Alcohol intoxication 489 (96)
Illicit substance abuse 477 (93)
Mental health diagnoses 429 (84)
Patients’ unrealistic expectations of staff & health system 417 (81)
Past history of violence 415 (81)
Dementia 262 (51)
Cultural issues 214 (42)
Acute pain 212 (41)
Cognitive dysfunction e.g. hypoxia 186 (36)
Other 7 (1)
Total 3108
Ω Participants could respond to all of these responses
Chi-squared analysis was conducted on patient-specific factors and episodes of
violence in the past six months and “alcohol intoxication”, “illicit substance abuse”,
“mental health diagnoses”, “patients’ unrealistic expectations of staff and health
system” and “past history of violence” were all found to be highly significant (p <
0.001). In addition “cultural issues” (p = 0.013), “acute pain” (p = 0.026) and
“cognitive dysfunction” (p = 0.037) were found to be significant as shown in Table 76.
253

Table 76: Chi-squared analysis results for patient-specific factors and episodes of violence
Factor Chi-squared p-value
Alcohol intoxication 38.06 <0.001
Illicit substance abuse 31.93 <0.001
Mental health diagnoses 17.33 <0.001
Patients’ unrealistic expectations of staff & health system
19.97 <0.001
Past history of violence 22.51 <0.001
Dementia 0.93 0.336
Cultural issues 6.13 0.013
Acute pain 4.97 0.026
Cognitive dysfunction e.g. hypoxia 4.34 0.037
A logistic regression was performed with “violent episode experienced in the last six
months” as the dependent variable and “alcohol intoxication” (patient-specific
factor) as the predictor variable. The odds ratio for alcohol intoxication was 6.05 with
a 95% confidence interval of (3.23, 11.35) and a p-value <0.001. This means that
nurses dealing with patients who were intoxicated by alcohol were six times more
likely to experience a violent episode.
A logistic regression was performed with “violent episode experienced in the last six
months” as the dependent variable and “substance abuse” (as a patient-specific
factor) as the predictor variable. The odds ratio for substance abuse was 4.82 with a
95% confidence interval of (2.68, 8.64) and a p-value <0.001. This means that there
was a five-fold increase in the likelihood of experiencing an episode of violence
where a patient presented with substance abuse.
A logistic regression was performed with “violent episode experienced in the last six
months” as the dependent variable and “mental health issues” (as a patient specific
factor) as the predictor variable. The odds ratio for mental health was 2.85 with a 95%
confidence interval of (1.72, 4.73) and a p-value <0.001. This means that the odds of a
254

violent episode occurring were almost three times greater where a patient presented
with mental health issues.
A logistic regression was performed with “violent episode experienced in the last six
months” as the dependent variable and “cognitive dysfunction” (as a patient-specific
factor) as the predictor variable. The odds ratio for “cognitive dysfunction” were 1.76
with a 95% confidence interval of (1.03, 3.02) and a p-value = 0.039. This means that
the odds of a violent episode in the past six-months occurring were more than one
and half times higher where a patient presented with cognitive dysfunction.
Data were further analysed according to geographical location and the results are
shown in Table 77. A statistically significant difference was identified for cultural
issues, which was greater in metropolitan areas (p = 0.002). This result was confirmed
with a sub-set analysis that excluded the “other” group: (p < 0.001, chi-squared =
13.1).
255

Table 77: Patient specific factors according to geographic location (n = 456) § Ω ¥
Metropolitan (%)
Regional (%)
Other (%)
Total (%)
d.f. chi-squared p-value
Alcohol intoxication 211 (49) 201 (46) 21 (5) 433 (95) 2 2.38 0.304
Illicit substance misuse 206 (49) 194 (46) 20 (5) 420 (92) 2 0.92 0.633
Mental Health diagnoses 186 (49) 174 (46) 16 (4) 376 (82) 2 0.16 0.922
Patients’ unrealistic expectations of staff & health system
181 (50) 166 (45) 18 (5) 365 (80) 2 1.03 0.597
Past history of violence 183 (50) 166 (45) 16 (4) 365 (80) 2 0.38 0.825
Dementia 120 (52) 107 (46) 6 (3) 233 (51) 2 4.07 0.131
Cultural issues 114 (59) 71 (37) 8 (4) 193 (42) 2 12.54 0.002
Acute pain 90 (47) 91 (47) 11 (6) 192 (42) 2 1.70 0.427
Cognitive dysfunction e.g. hypoxia
84 (51) 72 (44) 9 (5) 165 (36) 2 1.06 0.590
• § Only 456 participants provided postcodes in response to this question • Ω Participants could respond to all of these items • ¥ Percentages have been calculated as row percentages
256
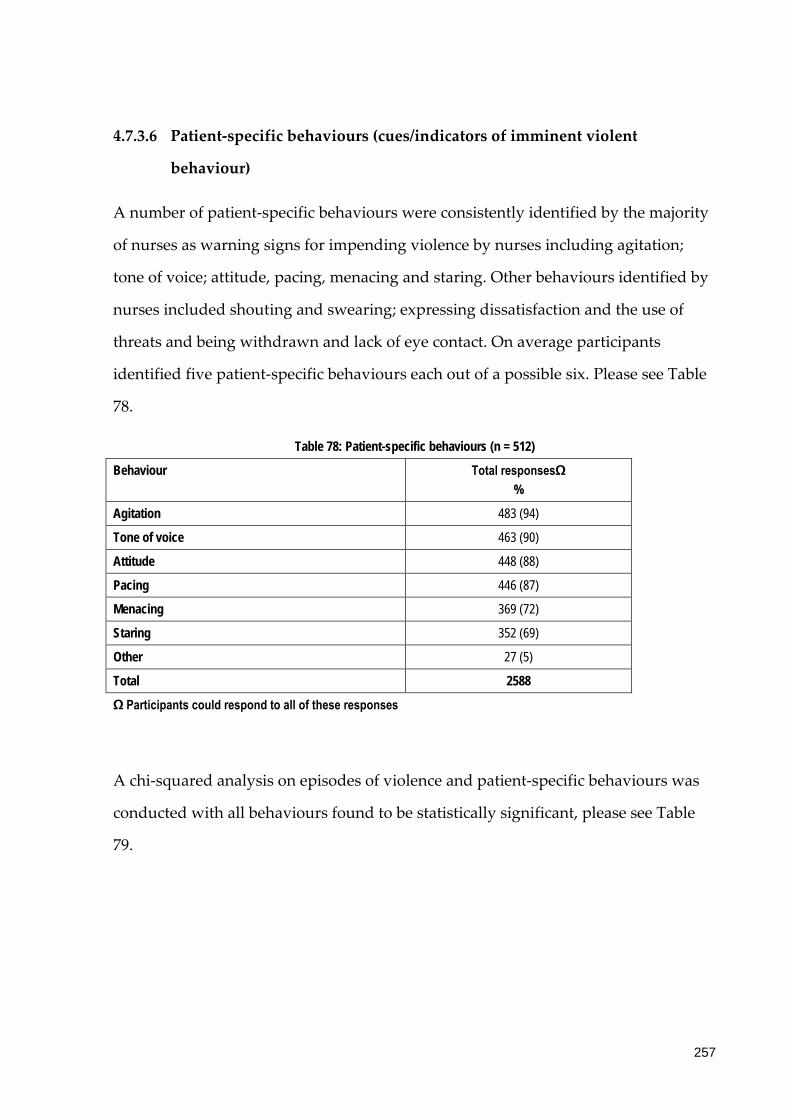
4.7.3.6 Patient-specific behaviours (cues/indicators of imminent violent
behaviour)
A number of patient-specific behaviours were consistently identified by the majority
of nurses as warning signs for impending violence by nurses including agitation;
tone of voice; attitude, pacing, menacing and staring. Other behaviours identified by
nurses included shouting and swearing; expressing dissatisfaction and the use of
threats and being withdrawn and lack of eye contact. On average participants
identified five patient-specific behaviours each out of a possible six. Please see Table
78.
Table 78: Patient-specific behaviours (n = 512)
Behaviour Total responsesΩ %
Agitation 483 (94)
Tone of voice 463 (90)
Attitude 448 (88)
Pacing 446 (87)
Menacing 369 (72)
Staring 352 (69)
Other 27 (5)
Total 2588
Ω Participants could respond to all of these responses
A chi-squared analysis on episodes of violence and patient-specific behaviours was
conducted with all behaviours found to be statistically significant, please see Table
79.
257

Table 79: Chi-squared analysis results for patient-specific behaviours and episodes of violence
Behaviour Chi-squared p-value
Agitation 49.61 <0.001
Tone of voice 21.98 <0.001
Attitude 12.61 <0.001
Pacing 14.48 <0.001
Menacing 8.82 0.003
Staring 8.31 0.004
Data were further analysed by geographical region and no statistically significant
differences were detected, please see Table 80.
258
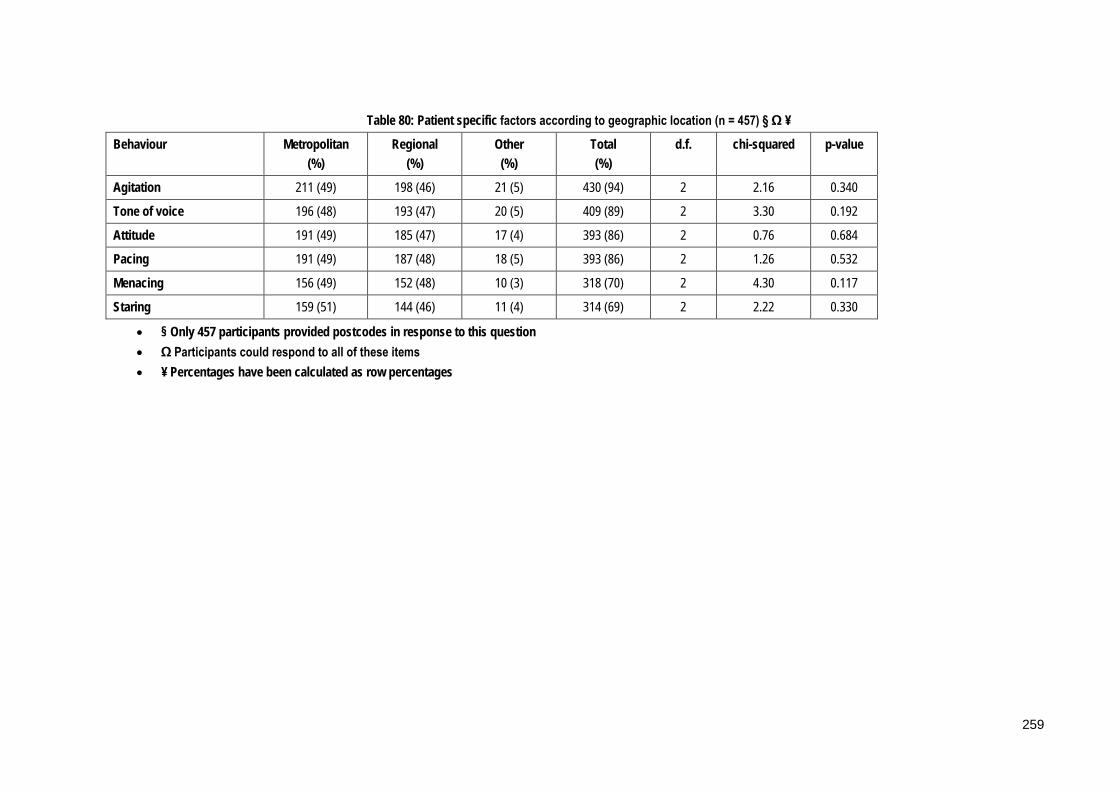
Table 80: Patient specific factors according to geographic location (n = 457) § Ω ¥
Behaviour Metropolitan (%)
Regional (%)
Other (%)
Total (%)
d.f. chi-squared p-value
Agitation 211 (49) 198 (46) 21 (5) 430 (94) 2 2.16 0.340
Tone of voice 196 (48) 193 (47) 20 (5) 409 (89) 2 3.30 0.192
Attitude 191 (49) 185 (47) 17 (4) 393 (86) 2 0.76 0.684
Pacing 191 (49) 187 (48) 18 (5) 393 (86) 2 1.26 0.532
Menacing 156 (49) 152 (48) 10 (3) 318 (70) 2 4.30 0.117
Staring 159 (51) 144 (46) 11 (4) 314 (69) 2 2.22 0.330
• § Only 457 participants provided postcodes in response to this question • Ω Participants could respond to all of these items • ¥ Percentages have been calculated as row percentages
259
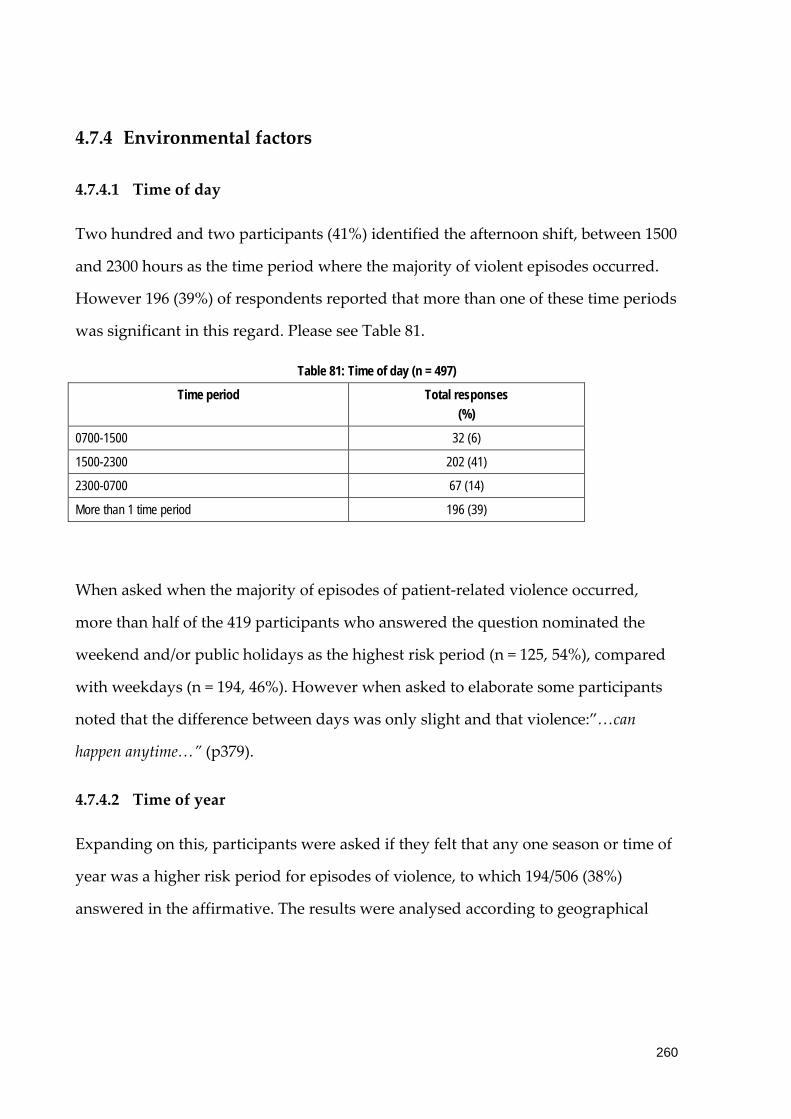
4.7.4 Environmental factors
4.7.4.1 Time of day
Two hundred and two participants (41%) identified the afternoon shift, between 1500
and 2300 hours as the time period where the majority of violent episodes occurred.
However 196 (39%) of respondents reported that more than one of these time periods
was significant in this regard. Please see Table 81.
Table 81: Time of day (n = 497)
Time period Total responses (%)
0700-1500 32 (6)
1500-2300 202 (41)
2300-0700 67 (14)
More than 1 time period 196 (39)
When asked when the majority of episodes of patient-related violence occurred,
more than half of the 419 participants who answered the question nominated the
weekend and/or public holidays as the highest risk period (n = 125, 54%), compared
with weekdays (n = 194, 46%). However when asked to elaborate some participants
noted that the difference between days was only slight and that violence:”…can
happen anytime…” (p379).
4.7.4.2 Time of year
Expanding on this, participants were asked if they felt that any one season or time of
year was a higher risk period for episodes of violence, to which 194/506 (38%)
answered in the affirmative. The results were analysed according to geographical
260
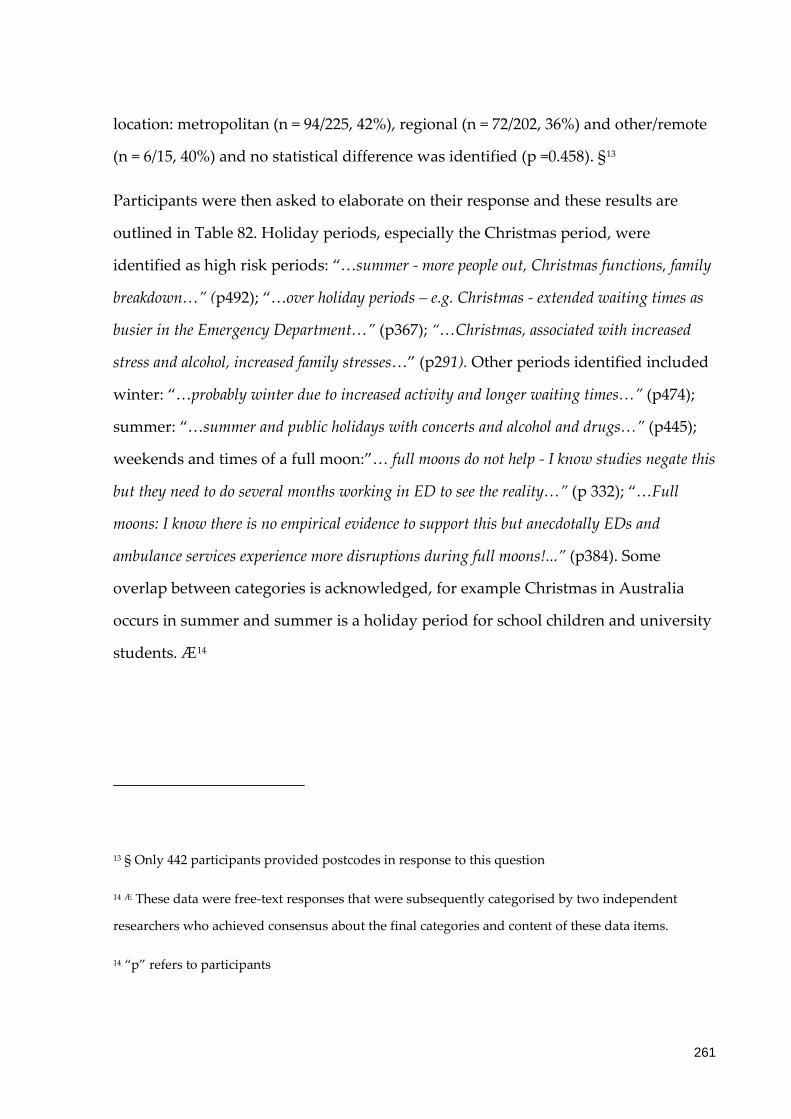
location: metropolitan (n = 94/225, 42%), regional (n = 72/202, 36%) and other/remote
(n = 6/15, 40%) and no statistical difference was identified (p =0.458). §13
Participants were then asked to elaborate on their response and these results are
outlined in Table 82. Holiday periods, especially the Christmas period, were
identified as high risk periods: “…summer - more people out, Christmas functions, family
breakdown…” (p492); “…over holiday periods – e.g. Christmas - extended waiting times as
busier in the Emergency Department…” (p367); “…Christmas, associated with increased
stress and alcohol, increased family stresses…” (p291). Other periods identified included
winter: “…probably winter due to increased activity and longer waiting times…” (p474);
summer: “…summer and public holidays with concerts and alcohol and drugs…” (p445);
weekends and times of a full moon:”… full moons do not help - I know studies negate this
but they need to do several months working in ED to see the reality…” (p 332); “…Full
moons: I know there is no empirical evidence to support this but anecdotally EDs and
ambulance services experience more disruptions during full moons!...” (p384). Some
overlap between categories is acknowledged, for example Christmas in Australia
occurs in summer and summer is a holiday period for school children and university
students. Æ14
13 § Only 442 participants provided postcodes in response to this question
14 Æ These data were free-text responses that were subsequently categorised by two independent
researchers who achieved consensus about the final categories and content of these data items.
14 “p” refers to participants
261

Table 82: Time of year (n = 196)
Time of year Total responses Ω (%)
Holiday periods 125 (64)
Winter 55 (28)
Summer 42 (21)
Full moon 22 (11)
Weekends 15 (8)
Total 259
Ω More than 1 category could be reported by each participant
4.7.5 Nursing activities
Participants perceived the highest risk nursing activities for patient-related violence
to be triaging; communicating with patients, managing reactions to delays and
taking patient histories. Please refer to Table 83 for more detail.
262
Table 83: Nursing activities (n = 496)
Nursing activity Total responses Ω (%)
Triaging 358 (72)
Communicating with patients 329 (66)
Managing patients’ reactions to delays 304 (61)
Taking patient history 217 (44)
Restraining patients 195 (39)
Assisting patients in waiting room 150 (30)
No activity 100 (20)
Performing invasive procedures 94 (19)
Giving injectable medications 61 (12)
Giving oral medications 50 (10)
Positioning patients 40 (8)
Mobilising or transferring patients 35 (7)
Assisting with Activities of Daily Living (ADLs) 27 (5)
Other 11 (2)
Total 1971
Ω Participants could respond to all of these responses
Nursing activities were compared against the variable “violent episode in the
previous 6 months” using a chi-squared analysis and the results are shown in Table
84. Triaging, managing patients’ reactions to delays and restraining patients were all
highly significant with p <0.001. In addition assisting patients in the waiting room
and communicating with patients also were found to be significant.
A logistic regression was performed with “violent episode experienced in the last six
months” as the dependent variable and “triaging” (nursing activity) as the predictor
variable. The odds ratio for triaging was 2.91 with a 95% confidence interval of (1.80,
4.71) and a p-value <0.001. This means that the odds of experiencing a violent
episode were almost three times higher for nurses engaged in triaging patients.
263

Table 84:Chi-squared analysis results for nursing activity and episode of violence
Nursing activity chi-squared p-value
Triaging 20.21 <0.001
Communicating with patients 8.84 0.003
Managing patients’ reactions to delays
15.19 <0.001
Taking patient history 3.04 0.081
Restraining patients 13.59 <0.001
Assisting patients in waiting room 11.91 0.001
No activity 3.59 0.166
Performing invasive procedures 1.45 0.229
Giving injectable medications 1.57 0.210
Giving oral medications 0.07 0.793
Positioning patients 3.52 0.061
Mobilising or transferring patients 1.30 0.254
Assisting with Activities of Daily Living (ADLs)
1.36 0.244
Data were further analysed according to geographic location and a sub-set analysis
was performed on two variables: “giving oral medications”: (p = 0.011, chi-squared =
6.48) and “restraining”: (p = 0.013, chi-squared = 6.2) and significant differences were
identified between regional and metropolitan areas. Please see Table 85.
264
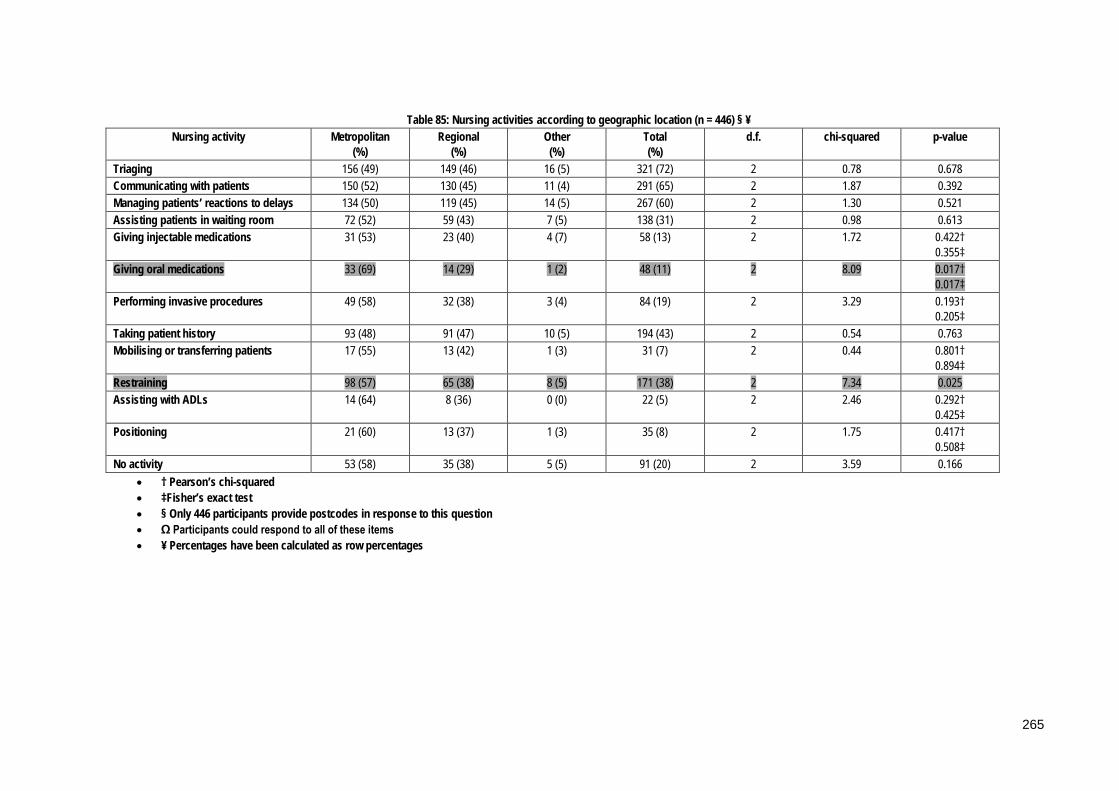
Table 85: Nursing activities according to geographic location (n = 446) § ¥ Nursing activity Metropolitan
(%) Regional
(%) Other (%)
Total (%)
d.f. chi-squared p-value
Triaging 156 (49) 149 (46) 16 (5) 321 (72) 2 0.78 0.678 Communicating with patients 150 (52) 130 (45) 11 (4) 291 (65) 2 1.87 0.392 Managing patients’ reactions to delays 134 (50) 119 (45) 14 (5) 267 (60) 2 1.30 0.521 Assisting patients in waiting room 72 (52) 59 (43) 7 (5) 138 (31) 2 0.98 0.613 Giving injectable medications 31 (53) 23 (40) 4 (7) 58 (13) 2 1.72 0.422†
0.355‡ Giving oral medications 33 (69) 14 (29) 1 (2) 48 (11) 2 8.09 0.017†
0.017‡ Performing invasive procedures 49 (58) 32 (38) 3 (4) 84 (19) 2 3.29 0.193†
0.205‡ Taking patient history 93 (48) 91 (47) 10 (5) 194 (43) 2 0.54 0.763 Mobilising or transferring patients 17 (55) 13 (42) 1 (3) 31 (7) 2 0.44 0.801†
0.894‡ Restraining 98 (57) 65 (38) 8 (5) 171 (38) 2 7.34 0.025 Assisting with ADLs 14 (64) 8 (36) 0 (0) 22 (5) 2 2.46 0.292†
0.425‡ Positioning 21 (60) 13 (37) 1 (3) 35 (8) 2 1.75 0.417†
0.508‡ No activity 53 (58) 35 (38) 5 (5) 91 (20) 2 3.59 0.166
• † Pearson’s chi-squared • ‡Fisher’s exact test • § Only 446 participants provide postcodes in response to this question • Ω Participants could respond to all of these items • ¥ Percentages have been calculated as row percentages
265
In addition, participants were asked to name three common activities performed
during their working day that they considered to be high risk activities for patient-
related violence in the ED. Analysis of these responses is summarised in Table 86.
Triage was identified as the highest risk activity, and participants noted that this was
especially so when the department was busy and waiting times were lengthy.
Managing reactions to these delays was also recognised as a high risk activity:
“…Excessive waiting times for treatment/transfer/registrar review of patient…” (p14);
“…Explaining reasons for delay in treatment/test results etc…” (p51). Dealing with
patients with a mental health diagnosis, including assessment and nursing care, was
cited as a high risk nursing activity: “…medicating mental health patients…” (p106);
“…Assessing mental health patients…” (p30). The nursing care and assessment of
patients under the influence of drugs and/or alcohol also were deemed to be high
risk activities: “…managing substance misuse and intoxication…” (p452); “…nursing
patients on evening/night duty while under the influence of alcohol and/or illicit
substances…” (p150); “…Dealing with drug &/or alcohol affected patients often from the
first instance of meeting when taking history…” (p108).
Patient assessment, general nursing care, for example assisting with patients with
activities of daily living, giving oral medications and assisting with positioning or
transferring and invasive procedures were all identified as activities at high risk of
leading to violence from patients. Other high risk activities identified included
dealing with patients in the waiting room, especially when the department was
experiencing high demand: “…entering the Waiting Room during periods of long
treatment delay…” (p486); “…Walking into waiting room full of patients & families who
have been waiting excessively on a busy shift…” (p60); “…checking patients in the waiting
room…” (p8); dealing with abusive relatives or friends of patients: “…dealing with
parents where child abuse is suspected…” (p11); “…resuscitating un-well child - parents
become violent…” (p198); and restraining patients: “…restraining intoxicated patients…”
(p31); “…restraining unsafe patients…” (p289). There was some overlap between
266

categories, for example discussion of restraint included patients with a mental health
and/or substance abuse intoxication and answers identifying patients with mental
health diagnoses also referred to dual diagnoses of substance abuse. Æ15
Table 86: High Risk Activities in the Emergency Department
Category 1 (n = 482)
(%)
2 (n = 467)
(%)
3 (n = 419)
(%)
Total (n = 1368)
(%)
Triage 252 (52) 34 (7) 28 (7) 314 (23)
Delays 61 (13) 70 (15) 73 (16) 204 (15)
Mental Health patients 41 (9) 79 (17) 55 (13) 175 (13)
Drug & Alcohol 29 (6) 61 (13) 66 (16) 156 (11)
Patient assessment 29 (6) 64 (14) 31 (7) 124 (9)
General nursing care 14 (3) 36 (8) 40 (10) 90 (7)
Waiting room 17 (4) 40 (9) 20 (5) 77 (6)
Invasive procedures e.g. cannulation
11 (2) 27 (6) 25 (6) 63 (5)
Abusive carers/support persons 6 (1) 13 (3) 26 (6) 45 (3)
Restraining patients 7 (1) 14 (3) 22 (5) 43 (3)
Other 15 (3) 29 (6) 33 (8) 77 (6)
4.7.6 Staffing issues
Staffing issues reported to be significant contributing or precipitating factors for
patient-related violence included workload and time management issues; inadequate
staffing; inadequate communication with patients, for example regarding waiting
15 Æ These data were free-text responses that were subsequently categorised by two independent
researchers who achieved consensus about the final categories and content of these data items.
15 “p” refers to participants
267

times and lack of skills to manage episodes (n = 332, 66%). “Other reasons” cited
included inadequate security (n = 10), lack of skills in managing mental health
patients (n = 6) and factors specific to the management of the ED (n = 12). Please see
Table 87.
Table 87: Staffing issues (n = 506)
Issue Total responsesΩ (%)
Workload & time management 397 (78)
Inadequate staffing 369 (73)
Inadequate communication with patients e.g. about waiting times 366 (72)
Lack of staff skills to manage episodes of patient-related violence 332 (66)
Nursing practice & attitudes of individual nurses 302 (60)
Poor skills mix 295 (58)
Time/day of shift 175 (35)
Professional communication issues e.g. handover/documentation 158 (31)
Other 33 (7)
Total 2427
Ω Participants could respond to all of these responses
A chi-squared analysis was conducted on staffing issues and episodes of violence
with the variables “poor skills mix” (p = 0.001); “workload and time management” (p
= 0.004) and “time/day of shift” (p = 0.026) were found to be statistically significant
factors. Please see Table 88 for details.
268

Table 88: Chi-squared analysis results for staffing issues and episodes of violence
Staffing issue Chi-squared p-value
Workload & time management 8.43 0.004
Inadequate staffing 3.15 0.076
Inadequate communication with patients e.g. about waiting times 2.48 0.116
Lack of staff skills to manage episodes of patient-related violence 0.93 0.334
Nursing practice & attitudes of individual nurses 0.38 0.828
Poor skills mix 11.21 0.001
Time/day of shift 4.98 0.026
Professional communication issues e.g. handover/documentation 0.089 0.767
The results of a logistic regression found that for the variable “poor skills mix” the
odds ratio was 2.25 (95% CI 1.07-3.27), p = 0.027 which means that for where a poor
skills mix exists nurses were more than twice as likely to experience patient-related
violence. For the variable: “workload and time management” the odds ratio was 2.06
(95& CI 1.26 – 3.27), p = 0.004 which means that where workload and time
management issues were reported, nurses were twice as likely to experience an
episode of violence.
Data were further analysed according to geographic location and no statistically
significant differences identified between metropolitan and regional areas. Please see
Table 89 for more detail.
269
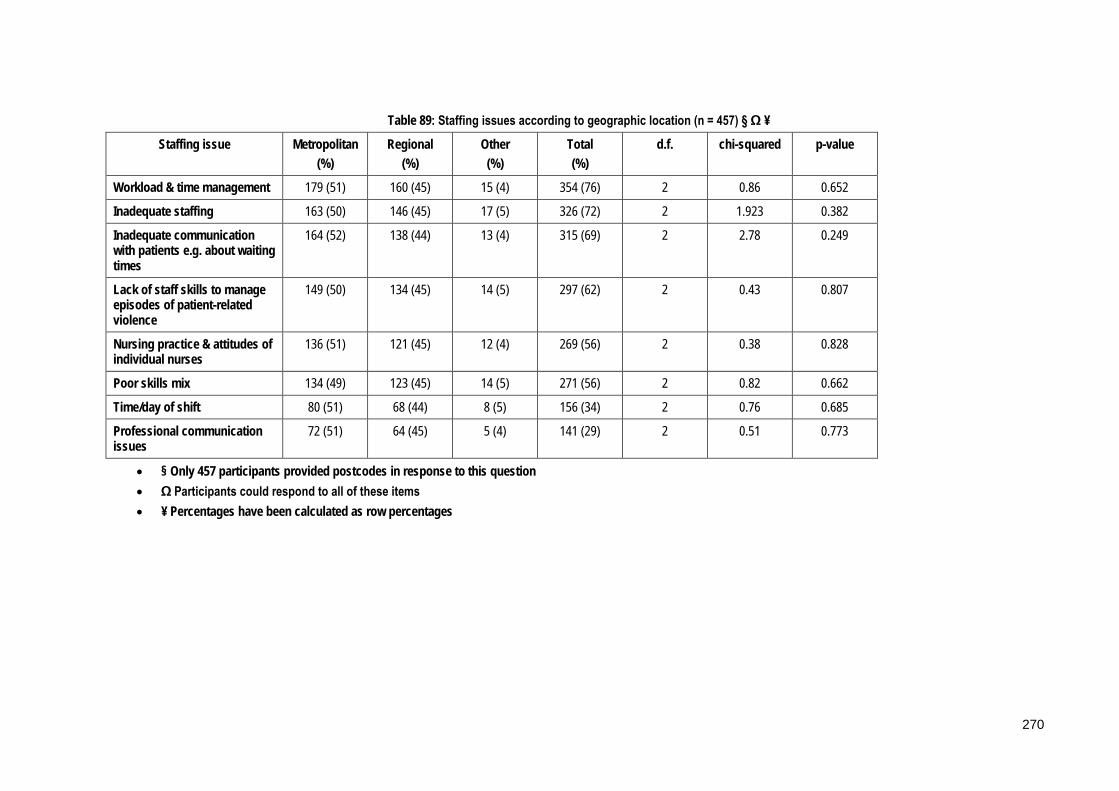
Table 89: Staffing issues according to geographic location (n = 457) § Ω ¥
Staffing issue Metropolitan (%)
Regional (%)
Other (%)
Total (%)
d.f. chi-squared p-value
Workload & time management 179 (51) 160 (45) 15 (4) 354 (76) 2 0.86 0.652
Inadequate staffing 163 (50) 146 (45) 17 (5) 326 (72) 2 1.923 0.382
Inadequate communication with patients e.g. about waiting times
164 (52) 138 (44) 13 (4) 315 (69) 2 2.78 0.249
Lack of staff skills to manage episodes of patient-related violence
149 (50) 134 (45) 14 (5) 297 (62) 2 0.43 0.807
Nursing practice & attitudes of individual nurses
136 (51) 121 (45) 12 (4) 269 (56) 2 0.38 0.828
Poor skills mix 134 (49) 123 (45) 14 (5) 271 (56) 2 0.82 0.662
Time/day of shift 80 (51) 68 (44) 8 (5) 156 (34) 2 0.76 0.685
Professional communication issues
72 (51) 64 (45) 5 (4) 141 (29) 2 0.51 0.773
• § Only 457 participants provided postcodes in response to this question • Ω Participants could respond to all of these items • ¥ Percentages have been calculated as row percentages
270

4.7.7 ED-specific issues
4.7.7.1 Area of department
The triage area was identified as the highest risk area in the ED for patient-related
violence, followed by patient cubicles and the waiting room. Areas reported in the
“other” category included not in the department, transferring to another department
and house doctor. Please refer to Table 90.
Table 90: Area of Department (n = 499)
Area Total responses Ω (%)
Triage 388 (78)
Patient cubicles 359 (72)
Waiting room 318 (64)
Resuscitation room 205 (41)
Corridors 181 (36)
Ambulance bay 119 (24)
Observation room 108 (22)
Other 79 (16)
Total 1757
Ω Participants could choose more than 1 response
A chi-squared analysis was performed comparing area of the department to episodes
of violence on the last six months and triage, patient cubicles and the ambulance bay
were all identified as being highly significant (p < 0.001). The resuscitation room (p =
0.002) and waiting room (p = 0.010) also were found to be statistically significant,
please see Table 91 for details.
271

Table 91: Chi-squared analysis results for area of the department and violence episodes
Area of the department Chi-squared p-value
Triage 29.43 <0.001
Patient cubicles 23.00 <0.001
Waiting room 6.64 0.010
Resuscitation room 9.23 0.002
Corridors 1.39 0.239
Ambulance bay 12.36 <0.001
Observation room 1.81 0.179
Data were further analysed according to region and the results are shown in Table
92. The variable “resuscitation room” was found to be highly significant (p<0.001)
with this location reported almost twice as often in metropolitan areas compared to
regional. “Corridors” also were reported more in metropolitan areas in a result that
was statistically significant (p = 0.046). A sub-set analysis was performed to exclude
the effect of the “other” region on the results, and both areas of the department were
still found to be statistically significant: “resuscitation room” (p < 0.001, chi-squared =
20.6) and “corridors” (p = 0.010, chi-squared = 6.57).
272

Table 92: Area of the department by geographic location (n = 454) § Ω ¥
Metropolitan (%)
Regional (%)
Other (%)
Total (%)
d.f. chi-squared p-value
Triage 173 (50) 154 (45) 16 (5) 343 (76) 2 1.20 0.752
Patient cubicles 158 (49) 151 (47) 14 (4) 323 (71) 2 4.53 0.210
Waiting room 143 (50) 128 (45) 15 (5) 286 (63) 2 4.45 0.217
Resuscitation room 111 (63) 56 (32) 9 (5) 176 (39) 2 24.58 <0.001
Corridors 93 (58) 60 (38) 6 (4) 159 (35) 2 7.80 0.046
Ambulance bay 60 (58) 41 (40) 2 (2) 103 (23) 2 5.33 0.077† 0.086‡
Observation room 46 (50) 40 (43) 6 (7) 92 (20) 2 2.20 0.532
• † Pearson’s chi-squared • ‡ Fisher’s exact test • § Only 454 participants provided postcodes in response to this question • Ω Participants could respond to all of these items • ¥ Percentages have been calculated as row percentages
273

Logistic regression analysis was performed on the three most significant areas
identified: triage, patient cubicles and the waiting room. The results for “violent
episode experienced in the last six months” as the dependent variable and “triage”
(area of the department) as the predictor variable were: an odds ratio for triage was
3.63 with a 95% confidence interval of (2.24, 5.9) and a p-value <0.001. This means
that the odds of a violent episode in the past 6-months occurring were almost four
times greater for nurses working in triage.
A logistic regression was performed with “violent episode experienced in the last six
months” as the dependent variable and “patient cubicles” (area of the department) as
the predictor variable. The odds ratio for patient cubicles was 3.13 (95% CI 1.93, 5.06),
p- <0.001. This means that the odds of a violent episode in the past 6-months
occurring were more than three times greater for nurses working in patient cubicles.
A logistic regression was performed with “violent episode experienced in the last six
months” as the dependent variable and “waiting room” (area of the department) as
the predictor variable. The odds ratio for the waiting room was 1.85 (95% CI 1.15,
2.97), p =0.011. This means that the odds of a violent episode in the past 6-months
occurring were almost two times greater for nurses working in the waiting room.
The results for “violent episode experienced in the last six months” as the dependent
variable and “ambulance bay” (area of the department) as the predictor variable
were an odds ratio of 4.16 (95% CI 1.77-9.89), p = 0.001. This means that the odds of a
violent episode are increased by more than four times for nurses working in the
ambulance bay.
The results for “violent episode experienced in the last six months” as the dependent
variable and “resuscitation room” (area of the department) as the predictor variable
were an odds ratio of 2.29 (95% CI 1.33 – 3.96), p = 0.003. This means that the odds of
a violent episode were more than double for nurses working in the resuscitation
room.
274

4.7.7.2 ED-specific precipitants
Ninety nine percent of nurses surveyed (n = 501) reported that waiting times and
delays were the main ED specific precipitant for patient-related violence. Over-
crowding; noise levels; lack of privacy and personal space issues also were
consistently identified by nurses as factors of concern. Other factors identified
included patient specific reactions to the environment including the ability to
manipulate the waiting system using past knowledge: “…violence often rewarded by
allowing them to queue jump…” (p507); “...visibility - i.e. playing to an audience...” (p144);
the negative impact of the environment on mental health patients: “...the ED is not the
ideal environment for caring for the acutely unwell psychiatric patient...” (p140); and
security concerns: “...lack of security presence/ perception of no consequences of patient-
related violence towards staff...” (p9). Please see Table 93.
Table 93: Factors specific to the Emergency Department (n = 508)
Factor Total responses Ω (%)
Long waiting times/delays 501 (99)
Over-crowding 318 (63)
Lack of privacy 262 (52)
Noise levels 257 (51)
Personal space issues 248 (49)
Environmental factors e.g. lighting & temperature 172 (34)
Other 41 (8)
Total 1799
Ω Participants could respond to all of these responses
A chi-squared analysis was performed on the factors specific to the ED and
experiencing a violent episode in the previous six months and the variable “long
waiting times and delays” was found to be highly significant (<0.001), with “lack of
privacy” also significant (p = 0.031). Please see Table 94.
275
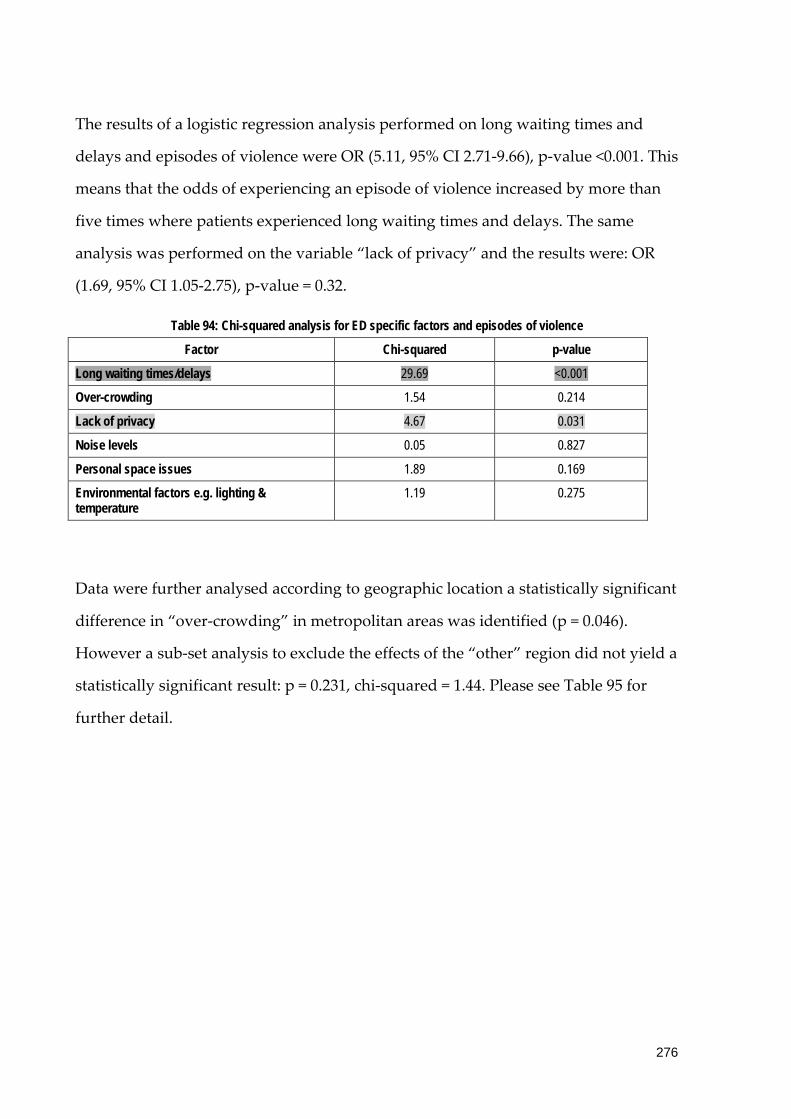
The results of a logistic regression analysis performed on long waiting times and
delays and episodes of violence were OR (5.11, 95% CI 2.71-9.66), p-value <0.001. This
means that the odds of experiencing an episode of violence increased by more than
five times where patients experienced long waiting times and delays. The same
analysis was performed on the variable “lack of privacy” and the results were: OR
(1.69, 95% CI 1.05-2.75), p-value = 0.32.
Table 94: Chi-squared analysis for ED specific factors and episodes of violence
Factor Chi-squared p-value
Long waiting times/delays 29.69 <0.001
Over-crowding 1.54 0.214
Lack of privacy 4.67 0.031
Noise levels 0.05 0.827
Personal space issues 1.89 0.169
Environmental factors e.g. lighting & temperature
1.19 0.275
Data were further analysed according to geographic location a statistically significant
difference in “over-crowding” in metropolitan areas was identified (p = 0.046).
However a sub-set analysis to exclude the effects of the “other” region did not yield a
statistically significant result: p = 0.231, chi-squared = 1.44. Please see Table 95 for
further detail.
276
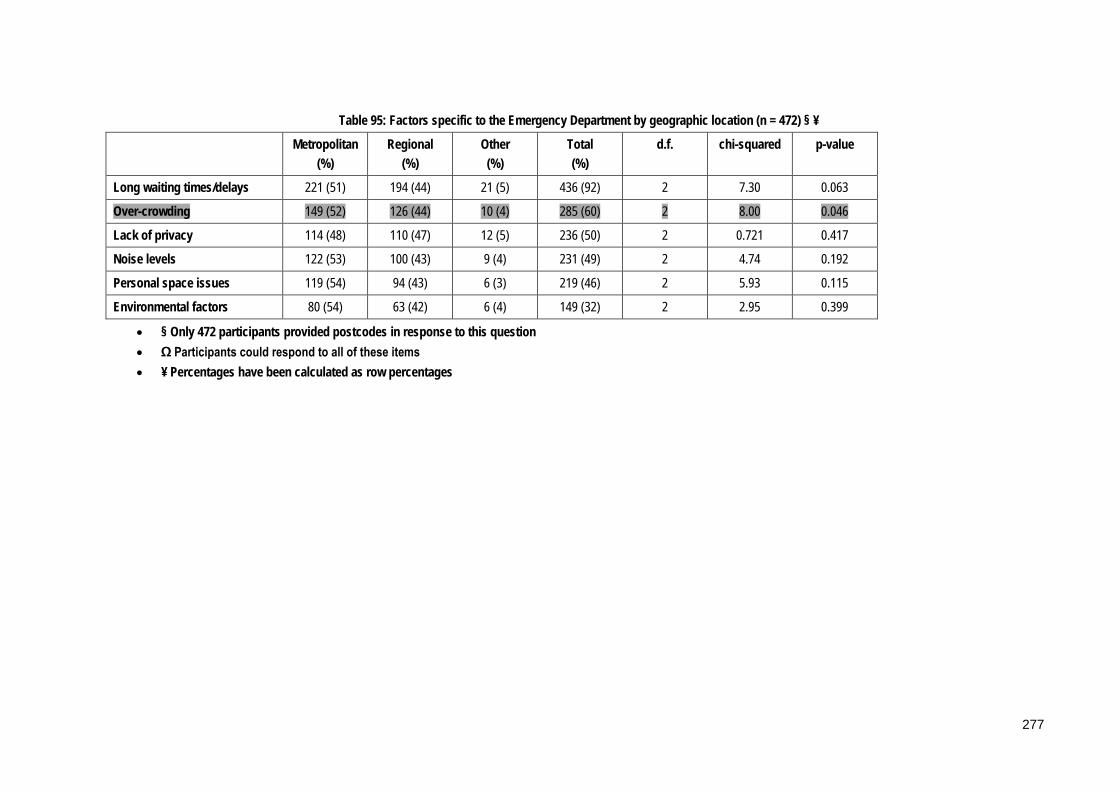
Table 95: Factors specific to the Emergency Department by geographic location (n = 472) § ¥
Metropolitan (%)
Regional (%)
Other (%)
Total (%)
d.f. chi-squared p-value
Long waiting times/delays 221 (51) 194 (44) 21 (5) 436 (92) 2 7.30 0.063
Over-crowding 149 (52) 126 (44) 10 (4) 285 (60) 2 8.00 0.046
Lack of privacy 114 (48) 110 (47) 12 (5) 236 (50) 2 0.721 0.417
Noise levels 122 (53) 100 (43) 9 (4) 231 (49) 2 4.74 0.192
Personal space issues 119 (54) 94 (43) 6 (3) 219 (46) 2 5.93 0.115
Environmental factors 80 (54) 63 (42) 6 (4) 149 (32) 2 2.95 0.399
• § Only 472 participants provided postcodes in response to this question • Ω Participants could respond to all of these items • ¥ Percentages have been calculated as row percentages
277
4.7.8 Escalation of episodes
Participants were asked what factors they believed contributed to episodes of
violence escalating from minor to major incidents. The analysis of these responses is
summarised in Table 96. ÆThree main categories were identified, professional factors,
patient-specific factors and factors specific to the ED. Professional factors included
poor communication skills: “…staff communication skills…” (p519); a lack of de-
escalation skills and/or an inability to recognise the warning signs of impending
violence by nurses: “…staff not recognising and reacting to signs of increasing
aggression…” (p524), “…lack of awareness of people's changing behaviour…” (p509); and
staff manner or attitude: “…staff being antagonistic with patients…” (p494), “…staff
aggression…” (p501).
Patient-specific factors discussed included the unrealistic expectations of patients
presenting to the ED: “…unrealistic expectations…” (p537); the presence of drug and
alcohol intoxication in patients:”…effects of drugs and alcohol…” (p525); and the
management of patients with mental health diagnoses: “…poor medical
control/communication with psych patients…” (p349), “…long periods of time spent by
mental health patients in the department waiting for beds…” (p296). The attitudes of
patients and their previous experiences with the system also were discussed by
participants: “…patients experience/learned behaviours which have worked for them in the
past…” (p486), "…learned behaviour…” (p488), “…attention seeking behaviour…” (p462),
“…a history of violence and the belief that nurses can do so much more…” (p439).
Æ These data were free-text responses that were subsequently categorised by two independent
researchers who achieved consensus about the final categories and content of these data items.
278

Factors specific to the ED included waiting times: “…long waiting periods…” (p535),
the environment: “…limited facilities to de-escalate noise/stimulation… overcrowding…”
(p445), “…overcrowding…no privacy…noise…” (p323), and staffing: “…staffing issues to
observe patients more frequently…” (p461).
Table 96: Factors contributing to escalation of episodes (n = 457)
Categories Sub-categories Totals Ω (%)
Professional Poor communication 162 (35)
Lack of de-escalation skills 133 (29)
Staff manner/attitude 62 (14)
357
Patient-specific Unrealistic expectations 69 (15)
Patient attitudes 49 (11)
Drug & alcohol 59 (13)
Mental health patients 17 (4)
Patients’ needs not met 12 (3)
206
ED specific Waiting times 110 (24)
Environment 35 (8)
Staffing 19 (4)
164
Ω More than 1 category could be assigned to each participant
4.7.9 Logistic regression to identify most significant risk factors
A logistic regression analysis was performed to identify the most significant risk
factors for patient related violence and the results are shown in Table 97. The three
main factors identified were triage, alcohol intoxication and substance misuse, in
order of statistical significance. Working at triage emerged as the most significant
risk factors with nurses working here almost three times more likely to experience an
episode of violence (p < 0.001).
279
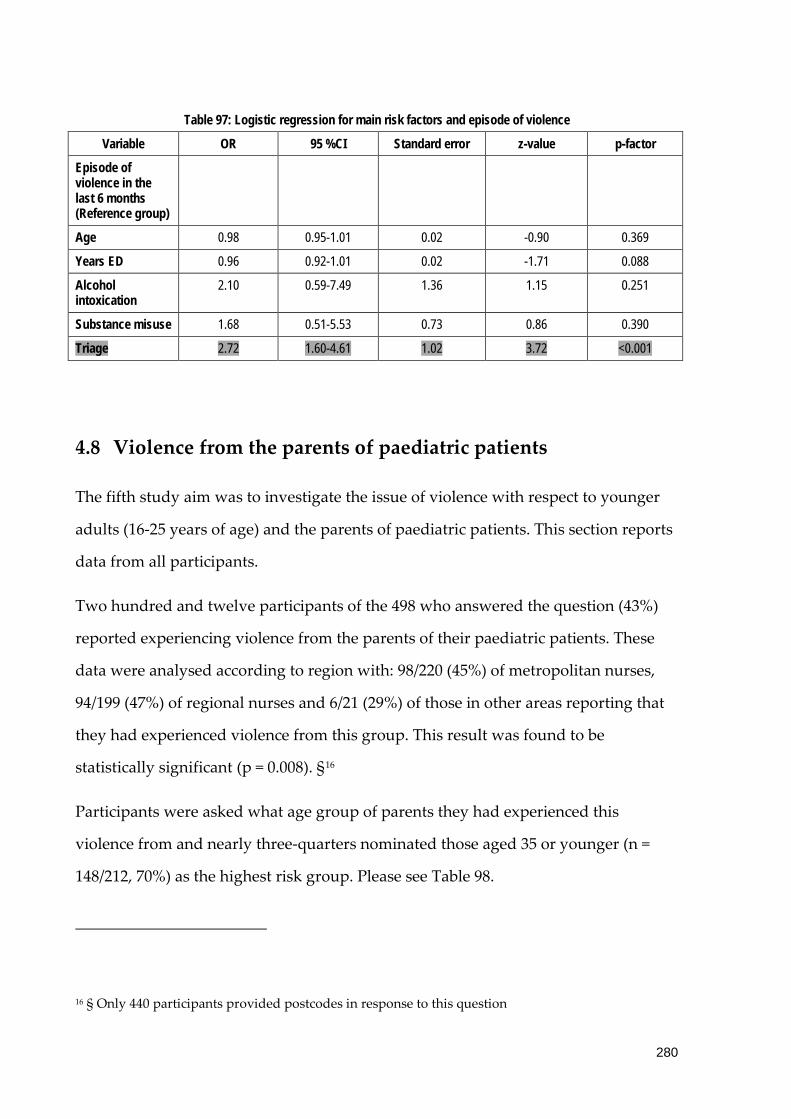
Table 97: Logistic regression for main risk factors and episode of violence
Variable OR 95 %CI Standard error z-value p-factor
Episode of violence in the last 6 months (Reference group)
Age 0.98 0.95-1.01 0.02 -0.90 0.369
Years ED 0.96 0.92-1.01 0.02 -1.71 0.088
Alcohol intoxication
2.10 0.59-7.49 1.36 1.15 0.251
Substance misuse 1.68 0.51-5.53 0.73 0.86 0.390
Triage 2.72 1.60-4.61 1.02 3.72 <0.001
4.8 Violence from the parents of paediatric patients
The fifth study aim was to investigate the issue of violence with respect to younger
adults (16-25 years of age) and the parents of paediatric patients. This section reports
data from all participants.
Two hundred and twelve participants of the 498 who answered the question (43%)
reported experiencing violence from the parents of their paediatric patients. These
data were analysed according to region with: 98/220 (45%) of metropolitan nurses,
94/199 (47%) of regional nurses and 6/21 (29%) of those in other areas reporting that
they had experienced violence from this group. This result was found to be
statistically significant (p = 0.008). §16
Participants were asked what age group of parents they had experienced this
violence from and nearly three-quarters nominated those aged 35 or younger (n =
148/212, 70%) as the highest risk group. Please see Table 98.
16 § Only 440 participants provided postcodes in response to this question
280

Table 98: Ages of parents of paediatric patients (n = 212)
Age group Total responses (%)
<16 12 (6)
16-25 28 (13)
26-35 108 (51)
36-45 52 (25)
>46 12 (6)
In the majority of cases the term “parent” did not distinguish whether it was the
mother or father of the child, or if both parents were involved. Individually both
mothers and fathers were identified as the perpetrators of episodes of violence in
equal numbers. A small number of participants mentioned other relatives including
step-parents and grandparents. Please see Table 99.
Table 99: Relationship to the paediatric patient (n= 203)
Relationship to child Total responses (%)
Parent 94 (46)
Mother 47 (23)
Father 47 (23)
Other 15 (7)
Total 203
4.9 Recommendations to minimise/prevent the occurrence of
patient-related violence
The final study aim was to develop recommendations for employers about patient-
related violence and safety in the workplace for ED nurses.
281

Participants were asked their opinion about the most effective way to prevent or
minimise the occurrence of patient-related violence in the ED. These answers were
coded into 10 categories as presented in Table 100.
Table 100: Recommendations to prevent/minimise episodes of violence (n = 444)
Category Total responsesΩ (%)
Zero Tolerance Policy 159 (36)
Improved security 151 (34)
Increased staffing & decreased waiting times 115 (26)
Training in aggression minimisation skills and cue recognition
78 (18)
Improved communication skills for nurses 67 (15)
Improved management of mental health patient 50 (11)
Improved management of drug & alcohol patients 33 (7)
The use of isolation rooms 26 (6)
Too hard to prevent 13 (3)
Other 24 (5)
Total 716
Ω Please note more than one category could be assigned to one answer.
The strict enforcement of Zero Tolerance policies was the most common
recommendation from participants and closely aligned with the need for improved
security: “…we need a strict zero tolerance policy state wide and some way to enforce this i.e.
police…” (p206). Participants recommended that hospital security guards be rostered
on to all shifts: “…have security guards located in the department 24 hours…” (p207) and
be based in the hospital or preferably in the ED at triage where they would serve as a
visible presence to the public, especially those in the waiting room. Their location
should be such that they are able to respond quickly to episodes of violence
“…security personnel on-site able to be seen by patients/relatives. WE WORK ALONE IN
OUR ED!” (p37). The use of security devices such as the use of duress alarms to
facilitate this response was also discussed: “…security in department at all times, duress
pendant at all times (own one not shared one)…” (p67). Some participants felt that this
282
did not go far enough and cited the need for police involvement, through a physical
presence in the ED: “…police ‘walk-throughs’ at intervals…” (p99); or through
mandatory reporting of all episodes of violence to the police to enable charges to be
laid against the perpetrators: “…the right to refuse care to those that are violent towards
staff…” (p170); “…arrest patients who are violent towards staff and lay criminal charges.
Zero tolerance seems to just be a catch phrase…” (p234).
The need to reduce waiting times and prevent bed block through the provision of
adequate staffing levels, and provision of resources and education of the public
about the realities of a modern ED were acknowledged by participants as necessary
to minimise levels of violence. “… Decrease patient waiting times and additional support
at triage…” (p75); “…minimising the long waiting times for admitted mental health patients
to find mental health beds, e.g. at times they can be admitted to the ED for 1-2 days before a
bed has become available…” (p432); “…I feel that the most common reason for patient related
violence is waiting times and patient's distress at not knowing when they will be seen. I feel
that an increase in staff so as to decrease waiting times. This would also necessitate the need
for opening more beds…” (p113).
However it was acknowledged that these waiting times were inevitable in the
present system therefore strategies were necessary to manage patients accordingly:
“…good communication about waiting times, delays and explain how triage works. Also to
provide pain relief in the waiting room/at triage…” (p469). Improved communication and
training were recommended to enable nurses to identify patients at risk of violent
behaviour and manage them accordingly to deescalate and contain the episodes. This
training should be regular and mandatory in nature: “…ongoing regular minimisation
training involving all staff, frequently enough to cover even staff on short rotations that are
unfamiliar with basic concepts…” (p247).
Two groups of patients were identified as being at risk of violent behaviour and
therefore in need of targeted management: mental health patients and those under
283
the influence of drugs and/or alcohol. The participants recommended that mental
health patients be processed quickly: “…prompt mental health review…” (p200);
“…allow MH patients prompt assessment and movement to inpatient unit…” (p274). Æ17
4.9.1.1 Measures to manage episodes
Participants were asked what measures they felt could be used more effectively to
manage violent patients/episodes and these responses are summarised in Table 101.
The main categories identified were staff, organisational, ED-specific factors and
patient-specific factors. The staff-specific factors identified included training in de-
escalation techniques: “… education for doctors and nurses such as Professional Assault
Response Training (P.A.R.T)…” (p460); “…staff education to awareness of precipitating
factors…” (p447); “…more effective teaching on de-escalation skills…” (p439) and
communication: “…more communication...” (p503).The main organisational specific
measure identified by nurses was the need for security services; this included an
increased presence in the ED and improved responses: “…have security present at all
times…” (p505); “… on-site security staff - we have none…” (p492) Other measures
included Zero Tolerance: “…real zero tolerance…” (525); “…clear expectations of Zero
Tolerance…” (p506);”… message of intolerance to violent behaviour (ZERO)…” (p481) and
staffing levels: “… more effective staffing at busy times…” (p441); “…more staff to
decrease patient anxiety/patient stress…” (p436).
ED specific measures nominated by nurses included ED design: “…Safer ED
departments - ability to isolate patient when escalating…” (p445); “…these patients need to
be in a low stimulus environment that enables them to have some privacy, but where they can
be medically cleared at the same time…” (p366) and decreasing waiting times: “…90% of
17 Æ These data were free-text responses that were subsequently categorised by two independent
researchers who achieved consensus about the final categories and content of these data items
284

incidents relate to prolonged waiting times!” (p463). Patient-specific factors were
discussed such as education of the public to ensure that they had realistic
expectations about the ED and its operation: “…community based education about the
purpose and use of the ED…” (p485); “…better education of the public i.e. appropriate use of
ED…” (p456); “…need TV promotion of what EDs are meant to be used for and acceptable
behaviour…” (p360). Patient management plans, specifically the management of
mental health patients were perceived to be a strategy that could be used more
effectively to manage the problem of patient-related violence: “…more Mental Health
professionals in the department and more resources for these mentally ill patients…” (p495);
“…mental health patients not staying for days in the ED…” (p476).
Police involvement was discussed by participants, with comments including a visible
police presence in the ED to act as a deterrent to potential offenders and the
punishment of violent patients: “…police involvement - charges being laid…” (p533);
“…charge violent incidents (including verbal threats)…” (p439).Æ18
18 Æ These data were free-text responses that were subsequently categorised by two independent
researchers who achieved consensus about the final categories and content of these data items.
18 “p” refers to participants
285

Table 101: Measures to more effectively manage violent patients/episodes (n = 433)
Category Total responses Ω (%)
Staff-specific
Training in de-escalation techniques 117 (27)
Communication 147 (34)
264 (61)
Organisation-specific
Security 103 (24)
Zero Tolerance 70 (16)
Staffing 43 (10)
Policies 7 (2)
223 (52)
ED specific
ED design 34 (8)
Decrease waiting times 32 (7)
66 (15)
Patient-specific
Education of public 40 (9)
Management of mental health patients 35 (8)
Patient management plans 16 (4)
Seclusion 15 (3)
Restraint 11 (3)
117 (27)
Police 46 (11)
Other 15 (3)
Total responses 731
Ω More than 1 category could be allocated to each participant
286

Chapter 5 Results from interview data: Part II
This chapter reports the results of Part II of the study, data that were collected
through semi-structured interviews. These results have been published in the
International Emergency Nursing Journal and a copy has been attached as Appendix
V.
NB: The abbreviation “p” refers to participant in this chapter.
5.1 Introduction
The issue of patient-related violence, both verbal and physical, has emerged as a
priority for the nursing profession internationally. A position statement from the
International Council of Nurses has condemned “all forms of abuse and violence
against nursing personnel” (International Council of Nurses, 2006). Emergency
Department (ED) nurses have been identified as especially vulnerable to patient-
related violence (Crilly et al., 2004), with rates up to four-times that of other
specialities (Gerberich et al., 2004). The literature reports that episodes of patient-
related violence are increasing in both prevalence and severity (Estryn-Behar et al.,
2008) and that aggression and violence are now regarded as common occurrences in
the modern ED (Ryan & Maguire, 2006).
5.2 Background/Literature
Violence in the health sector has emerged as a significant issue and one that is
reportedly increasing in both severity and prevalence (Wand, White, Patching, &
Dixon, 2010). Violence can be perpetrated by patients or clients, relatives or visitors
or can be horizontal in nature and be directed at health care workers by others in the
profession (Ryan & Maguire, 2006). Patient-related violence is the most common
source of violence (Ryan & Maguire, 2006), with patients responsible for up to 89% of
all cases (McKinnon & Cross, 2008) and recent evidence has identified
287

parent(s)/carer(s) of paediatric patients as a potentially significant group (Pich,
Hazelton, & Kable, 2013). This paper reports results from a study that focused
specifically on patient-initiated violence and other types are beyond the scope of this
paper.
The nature of nursing leaves those in the profession especially vulnerable to violence,
and the evidence confirms that nurses are the professional group at greatest risk of
such violence (Estryn-Behar et al., 2008), with their rates of exposure higher than any
occupational group in the health sector or indeed in any other work environment
(Perrone, 1999). The ED has been identified as one of the highest risk settings for
violence, and within this clinical environment (Taylor & Rew, 2011), the majority of
nurses, between 60 and 90%, report exposure to verbal and/or physical violence (Lau
et al., 2004). For some nurses such violence is a daily occurrence (Hegney et al., 2006;
Pich et al., 2011); which can lead to a dangerous and volatile clinical environment
(Taylor & Rew, 2011).
For the purpose of this study a definition of violence was provided to ensure
consistency of understanding and was modified from one used in Mayhew and
Chappell (2005). Violence was defined as any act, explicit or implicit, that is intended
to threaten or challenge the safety, well-being or health of another (Mayhew &
Chappell, 2005). This includes a spectrum of behaviours from overt acts of physical
violence to non-physical forms of violence such as verbal abuse and sexual
harassment (Gerberich et al., 2004).
5.3 Methods
5.3.1 Aim
The aim of this study was to describe the experiences of Australian (ED) nurses with
episodes of patient-related violence from young adults (16 - 25 years of age) and
episodes of parent-related violence from those accompanying paediatric patients.
288

This paper reports selective results of the qualitative part (Part II) of the Violence in
Emergency Nursing and Triage (VENT) Study.
5.3.2 Design
This was a qualitative descriptive study and data were collected by interviewing
participants using a semi-structured interview schedule.
5.3.3 Participants/Sample
In Part I of the VENT Study a survey was distributed to all members of the College of
Emergency Nursing Australasia (CENA) nationally (n = 1150) (these data will be
published separately). An Expression of Interest for participating in Part II of the
study was included at the end of the survey. This invited interested nurses to take
part in interviews to discuss their experiences with patient-related violence,
specifically involving parents of paediatric patients and young adults (16-25 years of
age).
Eleven Registered Nurses volunteered and were recruited as a result of this
purposive recruitment strategy. The participants included, seven female and four
male participants, with a median age of 44 and an average of fifteen years clinical
experience working in the ED environment. The sample was drawn from
metropolitan and regional locations across New South Wales, Queensland and
Victoria, Australia.
5.3.4 Inclusion criteria
All participants were Registered Nurses who had worked clinically in an Australian
ED in the preceding 6 months, and were members of CENA in 2010.
289

5.3.5 Data collection
Eleven participants took part in semi-structured interviews in 2010. These included
both face-to face and phone interviews and all were audio-taped and subsequently
transcribed. Two interview schedules were used tailored to the group of interest
being discussed (parents of paediatric patients or young adults) and participants
were asked to describe a typical encounter and the feelings such an encounter
caused. They also were asked about their ability to resolve a difficult situation and
the level of support received from their colleagues and management at their place of
work. These data were augmented with field notes taken by the researcher. Interview
transcripts were sent to participants to verify their accuracy.
5.3.6 Ethical considerations
Ethical approval was obtained from The University of Newcastle Human Research
Ethics Committee. Methods employed to ensure that the confidentiality of
participants was maintained included cautioning participants not to name any third
parties during data collection, de-identifying transcripts and coding of data.
5.3.7 Data analysis
Transcripts of digital recordings were analysed using a qualitative descriptive
framework utilising the strategy of content analysis (Neergaard et al., 2009). The aim
was to let the data speak for itself and limit the influence of the researcher on the
results (Sandelowski, 2000b). Qualitative description is recommended as the method
of choice where a description of a phenomenon is sought and is especially relevant
where the aim is to gain firsthand knowledge of health professionals’ experience
with a particular topic (Neergaard et al., 2009). Whilst it is true that no description or
analysis is free of interpretation, a qualitative descriptive methodology involves low-
inference interpretation that is likely to result in consensus of meaning amongst
researchers or peers (Sandelowski, 2000b). Consequently, data were analysed to
290
identify and extract relevant themes while maintaining an uncritical perspective to
produce a descriptive summary of the data (Neergaard et al., 2009).
5.3.8 Validity/Reliability/Rigour
Strategies to enhance rigour and credibility included those proposed by Milne and
Oberle (Milne & Oberle, 2005). Transcripts were verified with participants (member
checking) to ensure accuracy. Peer review of emergent themes was provided by an
experienced qualitative researcher (MH) to confirm consistency with the data and to
reduce subjective interpretation (Milne & Oberle, 2005). An audit trail of the
decisions made during analysis was documented and reviewed by the peer reviewer
(Appendix U).
5.4 Results
Data analysis led to the identification of antecedents to episodes of violence and
behaviours specific to the two groups of interest: parents of paediatric patients and
young adults aged 16 to 25 years of age. Although the behaviours and antecedents
differed for these two groups, participants perceived that they shared a common
goal: to be seen and treated by an ED doctor as quickly as possible.
The behaviours identified include:
• “Performing” and attention-seeking behaviours;
• Violent behaviours: Verbal Abuse and Physical Violence.
Antecedents discussed by participants included:
• Parental emotions;
• Alcohol and substance abuse.
Overall the results contribute to an overarching theme of feeling unsafe at work.
291

5.4.1 Behaviours: “Performing” and attention-seeking behaviours by
patients
Participants reported that patients from these groups of interest often displayed
attention-seeking behaviours such as being noisy, intimidating, disruptive, and
demanding. These behaviours were reported to be “performed” to friends of the
perpetrator who had accompanied them: “…there’s usually a group of them and
they continually yoo-haa and that out in the waiting room…” (p2). This extended to
patients waiting to be seen, with perpetrators using those in the waiting room as an
ad hoc audience: “…they…draw attention to themselves…” (p3). Comments about
the participants and other nurses were often made directly to the waiting room with
the perpetrators looking for a reaction, be it positive or negative: “...she’s a bitch...”
(p1). These behaviours were considered to be exacerbated by long waiting times,
both actual and perceived.
Participants perceived that such patients often displayed these behaviours as a direct
ploy to gain access to the department “…a lot of its attitude and expectation…so they
expect to be seen here and now…” (p7). This strategy appears to be effective with
participants reporting that these types of patients were usually “fast-tracked” to
maintain the safety of others in the waiting room: “…usually try to fast track
them…” (p7); “…they end up getting seen quicker just to get rid of them and stop the
ruckus going on…” (p2); “…they get the attention purely because it’s unsafe for
them to be out in the waiting room…” (p10).
This reaction by participants was acknowledged to be a type of positive
reinforcement that perpetuated a negative cycle, leading to a situation where such
patients present repeatedly with the expectation that nurses will reward their “poor”
behaviour. Participants expressed uneasiness about the unpredictability of
subsequent presentations and the potential for violence of these patients, many of
whom have a history of aggression: “...you’ll see different ones come and...here we
292

go, this is so and so...frequent flyers...” (p7); “...you just don’t know what’s going to
happen...” (p6).
In addition participants described a domino effect amongst those left in the waiting
room “…it’s like Chinese whispers… the domino effect…” (p7). Once the disruptive
patient has been removed, those remaining are left feeling frustrated that the
perpetrator has in effect jumped the queue and been seen before them: “...everyone
starts to get anxious and…usually become worse...” (p7).
5.4.2 Episodes of violence: Verbal abuse and physical violence
All participants had experienced verbal abuse including swearing and personal
threats, and reported that it was a regular occurrence: “...verbal...every shift...” (p9).
They noted that this abuse was more frequent than it had been in the past and that
the nature of threatening statements had become more sinister: “...the threats are
more serious now...” (p7); “...saying that they are going to rape me...” (p3); “...he was
threatening to kill me...” (p7); “...I’m going to kill you he said to me...” (p9); “…I’m
going to follow you to your car…find out where you live, I’m going to kill you. I’m
going to hurt your family…” (p3).
Physical abuse was reported by seven out of the eleven participants: “...’cos I’ve been
physically assaulted...I make sure I don’t get too close to get physically abused...”
(p3); “...people going to hurt you...having a go at you...at least every week to a couple
of times every week...” (p9).
The participants discussed the use of both traditional weapons and opportunistic
items as weapons to intimidate and threaten staff: “...chairs pushed across the
floor...” (p10); “...whipped out a knife and started slashing the air...” (p6); “…threat
of a gun a couple of weeks ago…” (p2); “...grabbed a pole and came back and
smashed the window down trying to kill her...” (p7); “...grabbed a bed...smashed the
doors open and broke all the locks and electronic system...” (p1).
293

Physical injuries sustained by participants included: -a broken nose: “...turned
around and just got a full smack in the nose...” (p3); wrist injury; ligament damage to
thumb: “...ended up almost breaking my thumb...” (p2); scratches; bruises; and injury
to finger (squashed between trolley and patient). In addition participants reported
psychological injuries and many expressed fears about the consequences of future
episodes which concerned them greatly: “...nurses are going to be killed in the
future...” (p7).
5.4.3 Antecedents: Alcohol and substance abuse
Many of the patients exhibiting the attention-seeking behaviours described above
were reported by participants to be under the influence of alcohol and/or illicit
drugs. Participants reported that such patients were more likely to be males aged 16
to 25 years of age: “...more young kids are coming into hospital when they’ve had
alcohol...” (p8), however females were increasingly presenting in this state: “...more
girls coming in with alcohol...there’s more aggression than in the past...” (p9).
Participants felt that the behaviours of this “generation y” group were linked to the
desire for instant gratification “…the internet age…they want it faster and they don’t
want to wait…and unfortunately our system at the moment is not designed around
rapid delivery…” (p7). They concluded that this decreased tolerance in terms of
waiting times exacerbated attention-seeking behaviours and again resulted in fast-
tracking through the department: “...with alcohol-related things, because of how they
act, they get seen straight away...are seen to...jump the queue...” (p2).
Participants also reported a lack of insight from young adults who often failed to
recognise that their substance abuse could have been the cause of their presenting
symptoms, and were aggressive when that possibility was raised: “…that wouldn’t
have anything to do with it...” (p9); “Cos they’re coming in ‘oh, someone’s put
something in their drink and inevitably, they’re got a high blood alcohol, no drugs...”
(p5).
294

5.4.4 Parental emotions: fear, anxiety, impatience and lack of
understanding/knowledge
Participants discussed their experiences of parent-initiated violence from those
accompanying paediatric patients to the ED. These episodes were typically preceded
by aggressive and demanding behaviours that went beyond what participants
considered reasonable. There were a number of emotions associated with these
behaviours including fear and anxiety over the condition of their child: “...why is my
child not being seen?” (p1); and frustration and impatience with the system, for
example with waiting times: “...It really has to do with the parent’s ability to cope
with this situation which they’re not used to...” (p3). This was especially evident
amongst young parents: “...kids having kids...” (p6) and what was referred to as
“professional males”. They were described as well-presented men who acted in a
condescending manner to the nurses, particularly the female nurses. There was a lack
of understanding of the triage scale: “...disconnect between parent’s
expectations...what’s possibly wrong with their child...low triage category...” (p1).
Conflict also developed where parents were unhappy with a medical course of action
and sometimes drew on their previous experiences with the system regarding their
expectations: for example “…the last doctor put her on a drip…” (p6). Participants
reported that these issues created the potential for conflict if parents perceived their
needs, or those of their child, were not being met: “...a father picked up a phone and
threw it on the desk...” (p8).
Participants reported that these episodes typically revolved around young children:
“...toddler to barely school age...” (p1). Paediatric patients at the centre of episodes of
parent-related violence varied in terms of their presenting problems varied, however
the triage category assigned was consistently reported as being of low priority:
“...quite often the child is not necessarily as sick as many others in the department
295
but the parent’s perception is really what you are managing... most of those children
in my memory, actually end up going home as opposed to being admitted” (p6).
Parents often used information gained from the media or the internet to pre-diagnose
their child, for example participants reported that some parents believed that any
rash was meningococcal and so “...every rash is deadly...” (p1). If this information
was at odds with that given by the triage nurse and their child was given a low
priority in terms of triage, there was a potential for conflict. “...4 or 5 year old
daughter to the window and virtually screamed in at me that the child needed an
ECG now! ...child was probably experiencing was some fever and tachycardia...”
(p3). Parents may react by refusing to accept the triage nurse’s directions and
demanding to see someone more senior in the department, usually a doctor who
they think will validate their concerns about their child: “...demanding...insistence on
the most senior person in the department seeing the child” (p6).
The nurses interviewed reported that following such episodes perpetrators would
often offer an apology for their behaviour: “I’m really sorry I was like that...It wasn’t
personal...I wouldn’t normally be like that...” (p3). Participants who identified
themselves as parents acknowledged that they accepted such apologies and
empathised with the perpetrators: “...having been a parent yourself... knowing that
there are times where you do lose the plot...you are sleep deprived...you are living on
a knife-edge...” (p6). However others believed that such apologies were not genuine
or were offered as asides after the perpetrator had got their own way:”...got a slight
apology from him later...” (p1).
5.4.5 Feeling unsafe at work
The central emergent theme from this analysis was that nurses frequently felt unsafe
at work: “...I just feel so unsafe...” (p2); “....I feel less safe here than I did in the
military...” (p9). This fear was not just for the individual nurse’s well-being but was
extended to others in the department, including other patients: “...concerns for our
296

safety...the safety of people in the waiting room” (p4). There was also concern at the
impact violent behaviour from parents had on the children accompanying them in
terms of acceptability: “...I’m scared not just for myself but for the other people
around me and I’m scared of the impression the child is getting...about what might
be normal...” (p6).
Underlying this sentiment was the issue of police involvement in dealing with
episodes of violence. While such episodes are not regular occurrences they cause
great concern for staff and can be very violent: “...in the last 12 months...two
incidents where I’ve had to call the police....genuine concern that it’s going to get
well and truly out of hand...” (p2); “...One guy actually assaulted a policeman in the
waiting room...” (p3). However this did not extend to actual charges being laid by
police punishment: “...they’re allowed to get away with it...I think that’s one of the
frustrations of where we work...” (p10); “...people can swear at us, spit at us, bite at
us...try to hurt us and nobody puts an incident report in...” (p11). Participants
appeared resigned to feeling this way: “…I think it’s a healthy fear most days when
you’re in triage…” with many expressing the view that it is something to be
expected: “…sadly I put it down as part of the job...” (p2).
5.5 Discussion
The levels of violence experienced by the participants in this study is reflective of
those experienced by ED nurses globally and this has created a culture where such
violence is expected and accepted as “part of the job” by many nurses who see
themselves as “legitimate targets” (International Council of Nurses, 2006). All
participants had experienced verbal abuse and threats, while seven out of the eleven
had been physically abused and as a result many felt unsafe at work, at least part of
the time. A review of the literature reveals that upwards of 50% of ED nurses have
experienced physical violence from patients on the job (Gacki-Smith et al., 2009),
while a majority has been verbally abused (Pinar & Ucmak, 2011). The International
297

Council of Nurses has reported that the majority of nurses (72%) globally do not feel
safe at work, while a survey of American nurses put this figure at upwards of 80%
(American Nurses’ Association, 2001; International Council of Nurses, 2009). An Irish
researcher found that 91% of nurses were worried about being physically assaulted
while at work (Rose, 1997). This is especially significant when considering that
Occupational Health and Safety legislation and guidelines exist in most countries to
protect the health, safety and welfare of workers.
While participants expressed concern and often distress at the levels of violence they
were exposed to, they felt that these were an expected part of their job, one that was
beyond their control to change. This resignation to violence is documented
throughout the literature (Erickson & Williams-Evans, 2000; Ray, 2007), and is
thought to be responsible in part for the endemic under-reporting of episodes of
violence (Gacki-Smith et al., 2009). In addition it is evident from participants that
these concerns have forced them to practice in a defensive way which has
implications for their ability to effectively engage with their patients.
The issues of alcohol and substance abuse were cited as significant antecedents for
episodes of violence, especially where the perpetrators were young adults
accompanied by a group. Haberkern et al (2010) found that rates of alcohol
intoxication in the 16-25 year old age group had increased over an eight-year period
(Haberkern, Exadaktylos, & Marty, 2010). Alcohol is known to provoke or increase
aggressive behaviour (National Committee on Violence, 1989) and this effect can be
magnified where a group is involved. The groups accompanying these patients were
often used as an ad hoc audience for them as they indulged in disruptive attention-
seeking behaviours in an attempt to “fast-track” their way through the department.
In addition to those people accompanying the perpetrator, those sitting in the
waiting room also were often drawn in to the “performance”, with negative
comments about nurses made directly to them. This phenomenon has previously
298
been reported in the literature, with ED nurses describing the waiting room as being
“thick with hatred” (Hislop & Melby, 2003).
Aggressive and disruptive patients were often “fast-tracked” through the
department by participants, in an attempt to manage their behaviour and safeguard
those in the waiting room. As a result many have come to associate their disruptive
behaviour with being seen more quickly and thus repeated these behaviours on
subsequent visits. Patients who presented frequently to the ED were referred to as
“frequent flyers” by participants, and they were repeatedly able to manipulate the
system. The term “frequent flyers” is a nuanced term with a variety of meanings. It is
typically used to refer to patients who present to the ED on multiple occasions
(Markham & Graudins, 2011). There was a strong perception amongst the
participants that while some of these patients were genuinely seeking care, others
were often seeking a confrontation, and their aggressive behaviours were offensive
with the intent to cause harm (Gibson, 1997). This notion of repeat offenders has been
discussed in the literature, and is linked to the fact that a previous history of violence
is an important predictor of future violence (Ferns, 2005b). These types of behaviours
are often found in the stereotypical “recreational fighter”, a term coined to describe
predominantly young males who enjoy physical confrontations (Graham & Wells,
2003).
Participants consistently linked these behaviours to young adults, specifically those
in “generation y”: the 16-25 year old age group. The broad definition of “generation
y” encompasses those born in the 1980s and 1990s ("Concise Oxford English
Dictionary.," 2012) Young males are identified in the literature as being the most
likely perpetrators of patient-related violence (Duxbury & Whittington, 2005).
According to the Garling Report into Acute Care Services in New South Wales,
Australia (Garling, 2008), this age group are over-represented in terms of ED
presentations and often has co-morbidities of drug and alcohol dependence. This has
299
been linked to a sense of entitlement and a reluctance to have to “wait” for any part
of their care in the ED (Pich et al., 2011).
The increased noise and activity of these demanding patients has an impact on other
patients in the department. It can lead to increased levels of anxiety in certain types
of patients, for example mental health patients and dementia patients (Kable et al.,
2012b). According to the literature, the environment of the ED can be counter-
productive in dealing with mental health patients (Ferns, 2005b), and the business,
noise and overcrowding that are commonplace can provoke aggression in these
patients (Jones & Lyneham, 2000). Recognition of this has prompted the exploration
of new models of care: for example dedicated mental health services located either in
the ED or as discrete units and consultant mental health nurses, nurse practitioners
and psychiatrists (Wand, White, Patching, Dixon, & Green, 2012). In addition many
universities, including the University of Newcastle, have implemented Mental
Health First Aid training in their undergraduate program to equip nurses with the
skills to deal with mental health patients (Kitchener, Jorm, & Kelly, 2010).
Similarly the ED can be a stressful place for the parents of paediatric patients and this
can lead to violent behaviour toward nurses. Parent-related violence was reported by
Gillespie et al (2010) who found that mothers and/or fathers typically became violent
during medical and trauma care situations (Gillespie et al., 2010). Similarly paediatric
residents are often exposed to verbal abuse and/or physical assaults from patients
and patients' families during the course of their training (Judy & Veselik, 2009).
Parents in these situations can experience a range of emotions, from fear and anxiety
over their child’s condition to impatience and frustration at the delays and waiting
times common in the ED. These emotions can increase the potential for aggressive
behaviour if the parent feels their child’s needs are not being met, and are often
associated with a lack of understanding and knowledge about the organisation of an
ED, something which is more evident in younger parents (Pich et al., 2011). These
300

factors are consistent with the literature on the topic with Gillespie et al (2010)
reporting that certain situations increase the likelihood for violence in a paediatric
ED. These included disagreement over a care plan, the denial of a service or request,
perceived long waiting times, perceived rudeness and uncaring attitude from a
healthcare worker and grief over the loss of a child (Gillespie et al., 2010).
The concern expressed by participants that someone may ultimately be killed sadly
became a reality in Australia in 2011, further underlining the seriousness of the issue.
Two mental health nurses were stabbed by a patient in regional Australia resulting in
the death of one (Smith, 2011), and this was followed later in the same year by the
stabbing of an ED nurse by a patient in a metropolitan Australian ED (Kwek, 2011).
These events confirm that the fear expressed by participants and the perception that
they are working in an unsafe environment are not misplaced.
The issues of lack of understanding of the operations and layout of the modern ED
have recently been addressed by the UK Design Council, which used a holistic
approach to tackling the issue of violence and aggression in this setting (Design
Council, 2011). The project identified four key areas of concern: the “arrival” and
“waiting” experiences, guidance and the people or stakeholders (Design Council,
2011). This approach offers potential solutions for other health care systems to adopt
these measures and improve the safety of the ED for both the people who work there
and those who seek to use its services.
5.6 Limitations
The approach used in this study reports data that may be affected by recall bias as
participants were asked about their past experiences with episodes of violence.
However an attempt was made to minimise this by asking participants to limit their
responses to episodes that had occurred in the preceding six months. Data were
collected from four different states and territories in Australia suggesting that the
301

issues are potentially transferable to other ED contexts in spread across Australian
EDs. However the results may not be transferable to nurses in other countries. The
authors acknowledge that the small sample size of eleven is a limitation; however
data saturation was achieved in this qualitative descriptive study.
5.7 Conclusion
The fast-tracking of aggressive patients who exhibit attention-seeking behaviours is a
practical strategy to manage the potential for escalation of violent behaviour and to
minimise the risk for other patients and staff, however it also rewards patients for
their “poor” behaviour. However this can lead to a situation where such patients are
able to use this knowledge to manipulate the system on future presentations. The
implications for nurses practicing in the ED are about decision-making to maintain
safety in their working environment. Communication with those remaining in the
waiting room about the necessity of moving such patients may be beneficial in terms
of reducing any lingering hostility or resentment.
The role played by distinct groups such as young adults (16-25 year olds) and the
parents of paediatric patients must be considered together with other known risk
factors to help identify patients at risk of potential violence. This knowledge should
be added to existing training programs on aggression minimisation to inform and
better equip nurses to deal with these groups.
The behaviours of these two groups are at times so distracting and time-consuming
for nurses that resources are diverted away from other patients leading to a situation
where care can be compromised. There is a bitter irony here for nurses, who are
motivated by a “helping” and empathetic ethic, to be exposed to aggression and
violence and often palpable hatred. The professional and personal impact that these
episodes of patient-related violence have on nurses can affect their subsequent
interactions with patients. If ED nurses are forced to practice in a defensive manner
302
due to feeling unsafe at work their ability to forge effective therapeutic relationships
and engage with their patients and other members of the ED team will be hampered
and patient care may be further compromised.
303

Chapter 6 Discussion
This chapter will discuss the results of Part I and II of the study with reference to the
body of literature on the topic. Similarities and differences between geographic
locations will be discussed and similarities between the two parts of the study
identified. The limitations of the study will be presented and finally conclusions and
recommendations for future research, policy, workplace management and workplace
education will be detailed.
This chapter is structured using the study aims and will demonstrate that the aims of
the study as detailed below have been achieved. The six aims of the study described
in Chapter 3, were: -
1. To measure the frequency of individual emergency nurses’ reported exposure
to patient-related workplace violence and associated outcomes in the
preceding six months;
2. To identify the types of violent behaviours experienced by emergency nurses;
3. To identify emergency nurses’ perceptions of risk prevention measures and
risk management strategies adopted by their employers;
4. To identify factors associated with patient-related workplace violence that
precipitate, escalate or de-escalate episodes of violence;
5. To investigate the issue of violence with respect to young adults (16-25 years
of age) and the parents of paediatric patients;
6. To develop recommendations for employers about patient-related workplace
violence and safety in the workplace for emergency nurses.
6.1 Representativeness of the sample
The demographic profile of sample is consistent with workforce statistics for nurses
in Australia with an average age of 44.2 years overall and 39.1 for the speciality of
critical and emergency nursing, compared to an average age of 42.4 years in Part I,
304

and a median age of 44 years in Part II of the study (Health Workforce Australia,
2013). More than half of the participants in Part I of the study were aged 40 and older
(n = 318, 60%), with three percent (n = 18) over the age of 60. The age distribution for
the nursing workforce in Australia has changed over the past decade and reflects an
ageing workforce. This ageing workforce is reflected in both the increasing average
age of nurses and the increasing percentage of those aged 55 and over. The average
age of all nurses increased by approximately one year from 43.1 in 2003 to 44.3 in
2009, and the percentage of RNs aged over 55 increased by 5% for the same period.
The median age of nurses, increased from 42 years in 2001 to 45 years in 2011, and
was 43 years in this study sample. Australian Bureau of Statistics figures for 2011
reported that nurses aged 50-54 years of age made up the largest age group, and that
nurses aged 55 and older had increased from 11% of the total nursing workforce in
2001 to 21% in 2011 (Australian Bureau of Statistics, 2013). The most current data
reported that employed registered nurses aged 55 make up 22% of the national
nursing workforce (Health Workforce Australia, 2013).
Data for gender were not collected in Part I of the study, however in Part II, the
majority of participants were female (n = 7/11). This is consistent with workforce
statistics which show that in 2013, 90% (n = 313,829/350,301) of practising nurses and
midwives registered in Australia were female (Nursing & Midwifery Board of
Australia, 2014).
The majority of participants in Part I of the study and all participants in Part II were
registered nurses, which is consistent with nursing workforce statistics. In 2001, 94%
(n = 7050/7532) of clinical nurses employed in Australian EDs were registered nurses
(Australian Health Workforce Advisory Committee, 2006). In 2013, 81% of all nurses
registered with the Nursing and Midwifery Board of Australia were Registered
Nurses (259 924/319 922) (Nursing & Midwifery Board of Australia, 2014).
305

The mean number of hours spent in patient care per week for participants in this
study was 32 hours. This is consistent with the average number of hours worked per
week for Registered Nurses in Australia which was reported at 33 hours in the week
in the last census (ABS, 2013). Participants in this study had a mean of 19.2 years of
nursing experience, compared to a national figure for 2011 of 17.3 years (Health
Workforce Australia, 2013).
The geographic distribution of the sample was consistent with population data for
Australia, with nurses from the most populated states of NSW (n =135, 28%), Victoria
(n = 123, 26%) and Queensland (n = 103, 22%) making up more than three quarters of
the survey sample. The majority of the 11 nurses who participated in Part II of the
study also were drawn from these three states, NSW (n = 6), Victoria (n = 2) and
Queensland (n = 2). This is consistent with the national distribution of nurses, with
almost three-quarters of nurses registered with the Nursing and Midwifery Board of
Australia coming from these three states: NSW (n = 97,824, 28%), Victoria (n = 94,438,
27%) and Queensland (n = 67,891, 19%) (Nursing & Midwifery Board of Australia,
2014). All classifications of RNs were represented in the study. For example Nurse
Practitioners took part in both parts of the study, with 36 in Part I and 2 in Part II of
the study, which is significant as Nursing and Midwifery Board of Australia figures
for the year ending 2013 report that there were 1,004 Nurse Practitioners registered in
the country (Nursing & Midwifery Board of Australia, 2014).
In this study the survey sample contained a similar number of participants from
metropolitan (n = 233) and regional areas (n = 218) with 21 participants from regions
labelled “other”, which included remote areas. Area data were not collected for the
interview participants. Results from the latest census reported that the per capita
ratio of nurses to population in remote areas (915.4 per 100, 000) was lower than in
metropolitan areas (1,175.8 per 100,000) and regional areas (1,272.9 per 100,000)
(Australian Bureau of Statistics, 2013).
306

6.2 Frequency of exposure to patient-related violence
The first aim of the study was to measure the frequency of individual emergency
nurses reported exposure to patient-related workplace violence and associated
outcomes in the preceding six months.
6.2.1 Point prevalence: nurse involvement in episodes of patient-
related violence
The majority of nurses (n = 455/521, 87%) in Part I of the study had experienced
violence in the six months prior to the study, and for many this had occurred as
recently as the week preceding the survey (n = 211/523, 40%). Participants reported
experiencing between one and 100 episodes in the six months prior to completing the
survey and while most nurses (n = 285/452, 63%) reported between one and 10
episodes, more than a third (n = 167, 37%) reported experiencing more than 10
episodes. These results were consistent across metropolitan and regional/remote
areas.
The types of episodes reported included both verbal and physical violence as per the
definition of violence provided to participants. Verbal abuse was the most common
form of violence experienced, reported by 95% of participants (n = 427/448) with an
average of 12 episodes per month per nurse reported. Rates of verbal abuse reported
were higher than physical violence in this study and this is consistent with previous
studies, which confirm that the majority of ED nurses have encountered high rates of
verbal abuse in the workplace (Gacki-Smith et al., 2009; Lau et al., 2012a). All
participants in Part II of the study had experienced verbal abuse, and they described
such abuse as a regular occurrence, experienced typically every shift.
These findings are consistent with the literature where reported rates for verbal
abuse against nurses as high as 98% (Gates et al., 2006) and 100% have been reported
(Catlette, 2005; May & Grubbs, 2002). These high levels of verbal abuse are not
307

isolated to the Australian context, but are consistently reported in studies from
around the world (Atawneh et al., 2003; Crilly et al., 2004; Fernandes et al., 1999;
Lyneham, 2000; Winstanley & Whittington, 2004).
There were on average eight episodes per month for physical violence reported by
participants in Part I of this study, either in conjunction with verbal abuse or on its
own. In addition physical abuse from young adults was reported by most
participants (n = 7/11) in Part II of the study. Seven episodes per month were
reported to involve patients in police custody in Part I of the study. Patients in police
custody have been identified as a group at risk for violence, with a US study
reporting that escape attempts from police custody were linked to 11% (n = 17) of
shooting events in hospitals for the period 2000-2011 (Kelen et al., 2012).
The Garling Report in NSW reported that more than one-third of nurses (39%) had
experienced recent emotional abuse and one in five nurses (21%) had reported
threats of physical harm during their last five shifts. In addition more than one in 10
(14%) reported actual physical abuse in the same time period (Garling, 2008). A US
study of 7,169 emergency nurses reported that 12% had experienced physical
violence and 43% verbal abuse, during a seven-day period (Emergency Nurses'
Association, 2011). A large study of 6,300 US nurses found that rates of violence were
a concern with over 13 per 100 nurses reporting at least one episode of physical
assault in the past year, and at least 38 per 100 nurses reporting at least one episode
of threat, sexual harassment or verbal abuse (Nachreiner et al., 2007). A study of
Tasmanian nurses reported that 64% (n = 1540) of respondents had experienced some
form of aggression at work in the preceding four weeks (Farrell et al., 2006).
Although these studies collected data over a variety of time periods, all of them repot
unacceptably high rates of episodes of violence towards nurses.
308

6.2.2 Inevitability and frequency of episodes of violence
The majority of nurses (n = 473/511, 93%) in Part I of the study perceived patient-
related violence to be an inevitable or a somewhat inevitable part of their job as an
ED nurse and reported that the frequency of patient-related violence had increased
over the course of their careers. This was consistent with the results from Part II of
the study and with the literature on the topic (Lau et al., 2012b). Violence was
contextual in its nature, for example what was tolerated and accepted as part of the
job in the ED was understood not to be acceptable in other work environments.
Participants perceived that such violence was increasing in frequency and becoming
more common: “…it’s getting very common now” (p1) and “…4 code greys in 1X6-
hour shift – including a police officer assaulted in waiting room…” The consensus in
the literature is that workplace violence is increasing in both severity and frequency
(Fernandes et al., 1999; Gates et al., 2011a; Pich et al., 2011). British research has found
a year-on-year increase in reported incidents of violence and aggression between
1998 to 1999, 2000 to 2001, and 2001 to 2002. The National Audit Office estimates that
violence and aggression have a direct cost to the National Health Service in England
of at least £69 million per year (Royal College of Nursing, 2006).
6.3 The types of violent behaviours experienced by emergency
nurses
The second aim of the study was to identify the types of violent behaviours
experienced by ED nurses.
6.3.1 Verbal abuse and non-physical behaviours
All categories of verbal abuse in Part I of the study, except “rumour mongering”,
were found to be highly significant, which confirms the prevalence of this type of
violence. Please see Table 22 for a list of all significant types of verbal abuse
309

identified. This included swearing, which was the common form of verbal abuse
reported by nearly all participants in Part I of the study (n = 504, 99%). It was also
reported by all participants in Part II of the study, in relation to both interactions
with young adults and the parents of paediatric patients. These results are consistent
with the body of literature on the topic with swearing or “being cursed at” typically
reported as the most common type of behaviour in verbal abuse (Crilly et al., 2004;
Emergency Nurses' Association, 2011). Swearing is an aspect of language used in
situations of intense emotions, as might be expected in an ED, and is thought by
some researchers to represent the most violent form of verbal aggression (Buss, 1961,
cited in (Stone & Hazelton, 2008). A defining feature of swearing is its capacity to
shock due to its association with tabooed subjects (Stone & Hazelton, 2008).
Negative comments about a nurse’s competence and appearance were reported in
both parts of the study. This type of abuse was typically conducted in front of others
in public spaces such as waiting rooms and triggered when nurses did not satisfy
patients’ demands. Nurses in Part II of the study reported that female patients
tended to exhibit passive aggressive behaviour, which included derogatory
comments about their appearance, for example the use of terms like “fat” and “ugly”
within earshot of female nurses, rather than exhibiting overtly aggressive behaviour
like males. This is consistent with the literature on the topic where males were
identified as more likely to commit physical violence than females (Farrell et al.,
2006). These types of behaviours are seen as an attempt to assert dominance or
control over a situation and erode the self-worth and self-confidence of the nurses
(Jackson et al., 2013). Statistically significant behaviours identified in Part I of the
study that correlated with these findings include “insulting/questioning professional
ability”, for example calling into question a nurse’s professional competence and
nursing capabilities; sexual innuendo; shouting and rudeness.
Significant differences were identified between metropolitan and regional/remote
areas for a number of types of verbal abuse including “threatening comments – to
310

self, family or property” and “unjustified criticism” which were more common in
metropolitan areas.
Jackson et al (2013) identified three categorises of verbal abuse: gendered abuse that
was largely sexual in nature; insults, ridicule and unreasonable demands and
hostility, threats and menacing language (Jackson et al., 2013). Gendered abuse
involves the use of sexualised insults, judgements, threats or suggestions that target
nurses through stereotypical gendered assumptions about females in general and
nurses in particular. This includes the use of words such as “bitch” and “slut” and
such insults may also seek to question the intelligence and professional competence
of nurses. The use of gendered swear words, for example “bitch” and “slut” was
reported by participants in Part II of this study. A study of 3,465 US ED nurses
reported that 70% had been harassed with sexual language and innuendo (Gacki-
Smith et al., 2009). Nursing is a female dominated profession with women
comprising approximately 90% of the nursing workforce overall in Australia, and
85% in the critical care and emergency specialty. This trend is likely to continue with
females also heavily represented in university enrolments for the Bachelor of
Nursing degree, making up almost 90% of all students (Health Workforce Australia,
2013).
Insults, ridicule and making unreasonable demands also were reported in this study
and Jackson et al (2013) reports that these behaviours are often conducted in front of
an audience to draw negative attention to those targeted. Long waiting times and the
issue of “bed block” meant that at times nurses were subject to abuse from a patient
over the course of many hours and even days. The repetition of such verbal abuse
has been reported to increase its menacing nature (Jackson et al., 2013). Participants
in this study reported that people in the waiting room were often engaged and
encouraged to “become rowdy” (p332) by perpetrators engaged in “attention seeking”
behaviours. The notion of the waiting room as an ad hoc audience for perpetrators
311

engaged in such behaviours has been reported in the literature (Pich et al., 2011;
Saines, 1999).
The final category espoused by Jackson et al (2013) of hostility, threats and menacing
language included non-verbal hostility expressed by patients such as crossing of
arms, glaring, pacing, eye rolling and shaking of heads and served to sustain the
hostility in a situation. Name calling, berating and gesturing were all found to be
statistically significant verbal behaviours in Part I of the study. Threatening
comments also were reported in both parts of the study and participants were of the
view that the comments made were becoming more sinister and violent in nature.
Threatening comments, including threats to self, family or property were found to be
statistically significant in Part I of the study and included having staff fired,
reporting them to the media (in one case by recording an episode on a mobile phone:
: “…videoing in department and waiting room, photographing staff…” (p178).). In addition
threats of a more personal nature were reported, with patients threatening violence
to the individual nurse and/or their family. This included threats to kill and rape
nurses and/or their families, for example quotes from interview participants
included: “...saying that they are going to rape me...”; “…he was threatening to kill me…”
and “…I’m going to kill you. I’m going to hurt your family…”
Threatening behaviours were found to be more common in metropolitan areas
compared to regional areas in a finding that was statistically significant. The
participants reported that such threats often lead to fear that extended outside of
working hours: “you don’t know...if they are nuts enough they could find you”.
Non-physical violence has been identified in the literature as a risk factor or
predictor for physical violence (Lanza, Zeiss, & Rierdan, 2006; Lau et al., 2012b). A
US study (n = 603) found that workers who had experienced non-physical violence
were 7.17 times more likely to experience physical violence than those who had not
(Lanza et al., 2006), and researchers in an Australian study reported that three
312

quarters of physical violence happened with concurrent verbal abuse (Lau et al.,
2012b). Therefore it is important to manage and reduce the incidence of non-physical
violence to protect workers from physical violence.
6.3.2 Physical behaviours
Highly significant types of physical behaviours identified in Part I of the study
included destructive behaviours, such as hitting or punching the safety glass at
triage; spitting; kicking; hitting; punching; pushing; grabbing; scratching; use of
hospital equipment as weapons; biting and grabbing and twisting a body part.
Physical violence was reported from young adults by participants in Part II of the
study; however physical violence from the parents of paediatric patients was not
reported. Scratching was found to be more common in metropolitan areas, however
all other physical behaviours were reported consistently between metropolitan and
regional/remote areas.
These findings are consistent with physical behaviours reported in the literature
which include being pushed/shoved, punched, kicked, scratched, slapped, hit, spat
on, head butted and having hair pulled (Cembrowicz & Shepherd, 1992; Crilly et al.,
2004; Ferns, 2005b; Gacki-Smith et al., 2009); being grabbed and pulled (Emergency
Nurses' Association, 2011). Thirteen participants (3%) in Part I of the study reported
that they had been sexually assaulted during the study period, while a significant
number also reported that they had been subjected to “sexual innuendo” (n = 144,
28%). No definition of sexual assault was provided in the survey however Irish
researchers reported that 20% of nursing staff had experienced intimidation,
harassment or assault of a sexual nature within the previous month (Ryan &
Maguire, 2006).
The use of traditional and opportunistic weapons was reported by participants in
both parts of the study. For example participants in Part II of the study reported the
use of a knife, and the opportunistic use of hospital equipment, for example chairs
313
thrown and a bed wheeled and smashed through closed doors. The use of weapons
is discussed in the literature, but varies across studies and countries. For example
Kuwaiti researchers reported no episodes of nurses being threatened with weapons
(Atawneh et al., 2003); researchers in Australian study reported 92 incidents
involving weapons (Lyneham, 2000); while a number of US researchers have
reported the use of automatic weapons, guns and knives (Doody, 1995; Erickson &
Williams-Evans, 2000; Lavoie et al., 1988). Researchers in one US study on hospital
shootings for the period 2000 to 2011 reported 154 shootings, across 40 states
resulting in 235 injured or deceased victims. The ED was the most common location
for shootings and 5% of victims were identified as nurses (Kelen et al., 2012). This
may be due in part to the risk of gang related violence being transferred into EDs as
injured gang members are brought in for treatment (McAdams, Russell, &
Walukewicz, 2004).
The opportunistic use of hospital equipment as weapons found to be significant in
Part I of the study and was more common than the use of traditional weapons. This
was consistent with the findings in Part II of the study where items reported
included scissors, a blood filled syringe, and a Stanley knife. This finding is reflected
in the literature and hospital equipment reported here included furniture and
fittings, scissors, needles and syringes, wheelchairs, stretcher poles, and a fire
extinguisher (Arthur & Bain, 2002; Cembrowicz & Shepherd, 1992; Ferns, 2005b;
Jones & Lyneham, 2000).
6.3.3 “Performing” and attention-seeking behaviours
As previously discussed, nurses in Part II of the study reported that young adults
aged 16-25 years of age engaged in “performing” and “attention-seeking”
behaviours, such as being noisy, intimidating, disruptive and demanding.
Demanding and attention-seeking behaviours have been identified in the literature
as high risk behaviours for potential violence (Crilly et al., 2004). These were
314

performed to an audience, including other young people who had accompanied the
patient and those waiting to be seen in the waiting room. Those accompanying
patients to the ED, in particular groups of intoxicated males, are reported to add to
the risk of violence in the literature (Cembrowicz & Shepherd, 1992; Kinkle, 1993).
Abuse conducted in front of others in public spaces such as waiting rooms can be
viewed as an attempt to assert dominance or control over a situation and erode the
self-worth and self-confidence of the nurses (Jackson et al., 2013). Such behaviour
could also be viewed as a reaction to the use of barriers at triage as previously
discussed. It may represent ill-considered attempts to redress power imbalances
and/or deliberate attempts to provoke or draw staff out from behind these protective
screens and barriers. Barriers have been reported to increase anxiety and levels of
frustration in patients as they feel isolated and reliant on triage nurses in particular
for access to the department and information (Lau et al., 2012a).
Such behaviour was exacerbated by long waiting times and was seen as a deliberate
ploy to gain access to the ED and be seen more quickly. Despite this many nurses
reported that they “fast-tracked” such patients, essentially giving them what they
wanted. A conflict was recognised between being seen to “reward” patients with fast
track access due to their behaviour and the desire to keep the waiting room safe and
provide the best care for all patients. Thus the strategy of “fast-tracking” was used to
manage such patients effectively and improve the safety and experience of other
patients, especially those in the waiting room. This strategy has been reported in the
literature, especially with regards to high risk groups of patients, for example those
with a mental health diagnosis (Benveniste et al., 2005). However it can have
negative consequences and lead to feelings of unpredictability for nurses on
subsequent presentations of such patients.
The behaviour of such patients was reported to increase levels of anxiety of those in
the waiting room. There was a domino effect as patients reacted to feeling threatened
and intimidated, and discussed the perpetrator amongst themselves: “...Chinese
315

whispers...everyone starts to get anxious...” (p1). Mental health patients were reported to
be especially vulnerable to the effects of this increased noise and some reported that
patients complained of physical symptoms as a result, for example the onset of chest
pain. Typically the environment of the ED is not conducive to the successful
management of mental health patients: it is open; busy; fast-paced and designed for
maximum observation of the greatest number of patients. The heightened
stimulation exacerbates the risk of violence from these patients (Jones & Lyneham,
2000).
The solution of fast-tracking such patients to remove this source of anxiety was not
without consequences however as others became frustrated at their fast passage
through the ED, leading to the risk of this type of behaviour being copied by other
patients. A number of participants (6%) in one US study (n = 7,169) reported that
patients who had engaged in verbal abuse were treated sooner than other patients
(Emergency Nurses' Association, 2011).
The Social Learning Theory proposed by Bandura (1973) differentiates aggression as
either instrumental or hostile, with the former described as a goal oriented
behaviour. With respect to healthcare the goal is to receive attention or treatment,
and immediacy or fast tracking can be perceived as a positive reward for attention
seeking behaviour (Bandura, 1977). The behaviours exhibited by patients during this
process however are not easily distinguishable from other forms of violence; it is the
outcome or end result that is theoretically differentiated. (Bandura, 1973).
Nurses spoke of “frequent fliers” a pejorative term used to describe patients with
multiple presentations who engaged in this negative behaviour repeatedly. It is
acknowledged that the use of terms such as “frequent flyer” might suggest an
attitudinal orientation on the part of staff that may “feed into” episodes of violent
behaviour in patients so labelled. While such patients may present in an aggressive
316
way, nurses with this attitude may unwittingly exacerbate such episodes in the way
that they regard, or disregard, and interact with them.
6.3.4 Consequences of patient-related violence
The consequences of patient-related violence are far reaching (Chapman & Styles,
2006) and include both physical and psychological harm to nurses as well as a
financial cost to the health care sector and a negative impact on the quality of patient
care (Howerton Child & Mentes, 2010).
6.3.4.1 Injuries
In the six months prior to the study 95/449 (21%) of nurses in Part I of the study had
suffered a physical or psychological injury as a result of patient-related violence, in a
finding that was consistent across geographic locations. A number of physical
injuries also were reported by nurses in Part II of the study, including a broken nose,
wrist injury, ligament damage, scratches and bruises. The injuries for one participant
were so severe that the perpetrator had been charged and a subsequent court case
had added to the stress and anxiety for the victim. This participant expressed
concern at the potential for greater harm in future episodes including their own
personal safety and that of their colleagues: “…nurses are going to be killed…” These
results are consistent with figures found in the literature, for example a US study of
7,169 emergency nurses reported that 12% had experienced physical violence during
a seven-day period (Emergency Nurses' Association, 2011). Researchers in a US
study reported that health care support occupations had an injury rate of 20.4 per
10,000 workers due to assaults, and health care practitioners had a rate of 6.1 per
10,000; compared with the general sector rate of only 2.1 per 10,000 (Gates et al.,
2011b).
The most common type of physical injury reported in this study was bruising. Other
injuries were reported less frequently and included exposure to hazardous or
317

infectious substances; abrasions and grazes; muscle damage; fractures and
lacerations. Researchers in the same US study identified bruises, contusions and
blunt trauma as the most common type of injuries sustained by ED nurses
(Emergency Nurses' Association, 2011). Similarly the British Crime Survey into
violence at work for the period 2011-2012 reported that minor bruising or a black eye
accounted for the majority of injuries recorded (Buckley, 2013).The majority of
physical injuries reported in the literature were superficial in nature and include
bruises, bites, abrasions, soft tissue injuries and lacerations however more serious
injuries also were recorded such as fractures, stab wounds and attempted
strangulations (Ferns, 2005b; Gates et al., 2006; Jenkins et al., 1998).
Death is an extreme consequence of patient-related violence: and each year one
Australian health worker is murdered at work (Mayhew & Chappell, 2005). For
example in 2011, an Australian ED nurse was stabbed several times by a patient with
a butter knife (Kwek, 2011), and a mental health nurse was stabbed to death by a
patient (Ralston, Prisk, & Cox, 2011). The National Crime Victimization Survey (1993-
1999) found that the average annual rate for non-fatal violent crime was 21.9 per 1000
workers for nurses compared with only 12.6 per 1000 workers for all other
occupations (Duhart, 2001). Sixty-nine homicides in healthcare were reported in the
US for the period from 1996 to 2000 (Phillips, 2007).
There were 18 nurses (4%) in Part I of the study who reported that they had taken
time off work as a consequence of an episode of violence, while five participants (1%)
had suffered a permanent disability necessitating a change in work duties or an
inability to work. These findings were consistent across geographic regions. The time
taken off work following an injury reported in the literature ranged from not
completing the shift to one month, with an average of 1-2 days reported (Ferns,
2005b). Researchers in a US study found that 4% of ED nurses had one or more sick
days per year due to an assault in the workplace (Jansen, Dassen, & Groot Jebbink,
2005).
318

6.3.4.2 Emotional response
Psychological injuries were reported by 55% of participants (65/118) in Part I of the
study who had suffered an injury at work. In Part I of the study “anger” was the
most common emotion reported, which is consistent with the findings in a large US
study (Emergency Nurses' Association, 2011). Other emotional responses reported by
participants in Part I of the study included unhappiness; a feeling of powerlessness,
shock and surprise, anxiety and emotional blunting. Some of the emotional responses
reported constituted long-term issues including depression, chronic pain or
disability, altered sleep patterns, an increase in the use of alcohol and/or other
substances and Post Traumatic Stress Disorder. On average participants reported
three emotions and there were no significant differences between geographic
regions.
These findings are consistent with other studies. Emotional reactions reported in the
literature included antipathy towards the perpetrators, shame, fear, astonishment,
powerlessness, unhappiness, degradation, a sense of resignation, indifference and
guilt (Astrom et al., 2004); anger, frustration and intrusive thoughts about the
episode (Gillespie et al., 2010); self-doubt, feelings of professional incompetence
(Arnetz & Arnetz, 2001); and sleeplessness (Jackson et al., 2002). Long-term effects
such as Post Traumatic Stress Disorder and burnout have also been reported (Bonner
& McLaughlin, 2007; Camerino et al., 2008).
Verbal abuse is reported to have more negative and longer lasting ramifications for
nurses, with both short and long term effects reported in the literature (Howerton
Child & Mentes, 2010). Even in the absence of physical injury, nurses have been
found to experience moderate to severe psychological reactions for up to 12 months
following an episode of patient-related violence (Gerberich et al., 2004).
319

6.3.4.3 Professional impact
The majority of participants in Part I of the study (n = 276, 76%) reported that their
experiences with patient-related violence had directly impacted on their interactions
with patients and led to changes in their nursing practice. This included feeling less
empathy towards patients, a decline in the quality of care afforded patients and
avoidance of patients. Other responses also indicated an impact on nursing practice,
for example diminished capacity to perform in a professional role (reduced morale,
burnout/stress, and conflict with co-workers); and a perceived loss of
competence/coping ability (diminishing/minimising the event, depersonalising the
event and feelings of professional incompetence and self-doubt). These findings were
consistent across geographic locations.
The long-term emotional effects reported above have the potential to impact on
nurses and consequently on their professional practice for up to 12 months after the
actual episode of violence (Gerberich et al., 2004). Furthermore if nurses are exposed
to more violence during this period the effects will be exacerbated.
Nurses who “burn out” suffer from emotional and physical symptoms, lose joy in
providing care, distance themselves from others and can go on to view their patients
as objects and spend less time with patients who they perceive as abusive (Gates et
al., 2006). Nurses have reported feelings of professional incompetence, feeling more
cautious and deriving less satisfaction from their patient-related care as well as being
fearful at work (Arnetz & Arnetz, 2001). This fear can lead to avoidance of patients
perceived as at high-risk of violence and this has a direct impact on professional
practice (Gillespie et al., 2010).
Turkish researchers in one study reported that 84% of nurses were of the perception
that nurses would be less productive after experiencing verbal and/or physical
violence (Senuzun Ergun & Karadakovan, 2005). Thus patient-related violence has
significant implications for patient safety, the quality of care that is provided and can
320

indirectly lead to a deterioration in the care provided, not just for the patient
involved but for all subsequent patients cared for by the affected nurse (Lau et al.,
2004). This can take the form of increased medication, and the use of seclusion and
restraints (Astrom et al., 2004). A link has also been proposed between abuse from
patients and care-giving errors, further suggesting that nurses’ role may be
compromised as a consequence of abuse (Shields & Wilkins, 2009). A link to patient
safety was reported in an Australian study, that found that over two-thirds of nurses
who had experienced aggression reported that it “frequently” or “occasionally”
contributed to their potential to make errors or affect their productivity (Farrell et al.,
2006).
Almost a third of nurses surveyed in Part I of the study had either left ED nursing or
considered doing so as a consequence of patient-related violence. This is consistent
with evidence on the topic: work-related violence has been cited as one reason nurses
choose to leave the profession (Nachreiner et al., 2007). Aggression was identified as
the second most stressful aspect of working in the ED in a British study of 103 ED
nurses and doctors (Healy & Tyrell, 2011), while an Australian study ranked violence
against staff as the top work stressor (Ross-Adjie et al., 2007). The effects of stress in
the workplace have been associated with the risk of burnout (Potter, 2006). Burnout
is a maladaptive response to stress, characterised by emotional exhaustion,
detachment and a reduced sense of accomplishment and can have negative
consequences for nurses and their subsequent practice, and can also lead to a desire
to leave the speciality of ED nursing or the nursing profession (MacKusick & Minick,
2010; Potter, 2006).
Thus the negative effects of patient-related violence extend to the workplace and can
lead to difficulties with the recruitment and retention of nurses, decreased
productivity and efficiency, increased absenteeism and fewer resources for nurses
(Howerton Child & Mentes, 2010). In addition these issues have a flow on effect to
increased costs related to the recruitment of additional nurses and through workers
321

compensation claims. A US study estimated that the monetary cost of non-fatal
assaults to employers in Minnesota was an estimated $31,643USD for registered
nurses and $17,585USD for licensed practical nurses. This included medical
expenditures, lost wages, legal fees, insurance administrative costs, lost fringe
benefits, and household production costs (McGovern et al., 2000).
6.4 Risk prevention and risk management strategies
The third study aim was to identify ED nurses’ perceptions of risk prevention and
risk management strategies adopted by their employer. The term risk prevention
refers to strategies designed to prevent episodes of aggression and violence, and risk
management is about strategies used to respond to episodes of aggression and
violence.
6.4.1 Risk Management following episodes of aggression and violence
6.4.1.1 Reporting of episodes of patient-related violence at work
Participants in part I of the study reported episodes of violence selectively to their
organisations, with more than three-quarters admitting that they only reported
“some” and not “all” episodes of patient-related violence. Significant differences
were identified between metropolitan and regional areas, with regional nurses more
likely to report “some” episodes. Selective reporting was also acknowledged by
participants in Part II of the study due to time management issues and the lack of
response from management after reports were lodged.
This is consistent with the literature on the topic where patient-related violence is
said to be inadequately documented, under-reported and poorly managed when it is
reported (Howerton Child & Mentes, 2010; Sato, Wakabayashi, Kiyoshi-Teo, &
Fukahori, 2013). Under-reporting of violent events occurs when an individual is
victimised and does not report the event to an employer, police or through other
322
means (Findorff, McGovern, Wall, & Gerberich, 2005). Under-reporting of episodes
of patient-related violence is acknowledged consistently in the literature to the point
where it is referred to as a “global phenomenon” (Ferns, 2005b). Estimations of
under-reporting range from 20% (Lyneham, 2000) to 90% (Mayhew & Chappell,
2005) and it has been referred to as the “dark figure” of workplace violence (Farrell et
al., 2006).
The consequences of under-reporting are far-reaching. Accurate and consistent
reporting is important to measure the true scope of the phenomenon and to inform
and facilitate the development of policies and programs to adequately address
violent behaviour. Voluntary incident reporting is an integral part of clinical
governance programs, designed to increase the safety of patients, visitors and staff
and consequently to improve the quality of care (Knight, 2004). In addition failure to
report can have a negative effect on victims, adding to stress and interfering with
successful workers’ compensation claims (Doherty, 2007).
The majority of participants who reported episodes of patient-related violence did so
due to mandatory reporting requirements in their facility, including the process
followed after a Code Black/Grey or to have a record of the incident. In addition
safety issues and feelings of fearfulness due to the severity of the abuse and/or
potential for escalation also caused participants to report.
6.4.1.2 Barriers to reporting
The most frequent barriers to reporting episodes of patient-related violence reported
in this study included time constraints and the volume of episodes/workload of the
nurses which caused them to be “too busy to report”. These findings were consistent
across metropolitan and regional/remote areas and are also consistent with the
literature on the topic. Barriers reported included time pressures, lack of actual injury
and fear of being blamed or the consequences of reporting (Ferns, 2005b). The
volume of episodes or cumulative nature of multiple episodes has been proposed as
323

a barrier as it has made it difficult for nurses to discern discrete episodes (Jackson et
al., 2013). This can lead to a phenomenon called habituation, where nurses become
numbed to the effects of violence after repeated exposure (Pinar & Ucmak, 2011).
More than one third of participants in this study reported that deficiencies in the
actions of management, both directly or indirectly, were barriers to reporting
episodes of violence and they also perceived that reports lodged were not followed
up adequately by management. This is consistent with the literature on the topic
where reporting is often seen as an empty gesture (Rose, 1997) due to the perceived
lack of action by those responsible (Chapman, Styles, Perry, & Combs, 2010; Gallant-
Roman, 2008; Gates et al., 2006; Mayhew & Chappell, 2005). Other barriers reported
included a perception that nothing would change and that violence was an accepted
and expected part of the job. This correlates with the existing research on the topic
where violence is viewed by some in the profession as “part of the job” and therefore
accepted and expected by nurses who consequently think it is not necessary to report
(Chapman et al., 2010; Jackson et al., 2002), especially if no injury occurred (Gallant-
Roman, 2008).
The hierarchy of the reporting process means that incident reports are often directed
to those outside the profession who are often unfamiliar with the experiences of front
line nurses (Ferns, 2006). The challenge for nurses is to alter the culture and attitudes
surrounding the reporting of violence and aggression so that it becomes the norm,
rather than the exception (Ferns, 2012). It is important for nurses to take a leadership
role amongst health professionals as it is nurses who are consistently identified as
being the most vulnerable to episodes of violence (Ferns, 2006).
It has been suggested that organisational norms about tolerable or acceptable levels
of violence or aggression have become ingrained via management attitudes and
practices (Perrone, 1999). By contextualising violence in this manner, and
normalising it as a permissible and systemic work-related risk, the true nature of this
324

behaviour as unnecessarily violent and harmful is overlooked. In addition, it can
have the effect of deflecting attention away from possibly negligent working
environments and practices (Perrone, 1999).
Jackson et al (2013) theorised that the sexualised gender component of violence
against female nurses may also play a role in under-reporting as many women view
sexual harassment and unwanted sexual advances as a fact of life (Jackson et al.,
2013). Some researchers suggest that females are expected to use more covert
measures to respond to violence, and not initiate violence or they may be seen as
“whistle blowers” (Ferns, 2006; Luck et al., 2007; Pawlin, 2008; Phillips, 2007). Ferns
(2006) surmised that gender and childhood socialisation may help to explain why
nurses do not report episodes of aggression and violence (Ferns, 2006). Personal
experiences may also play a key role in willingness to report episodes of violence
(Ferns, 2006). Violence against women is a global public health issue (World Health
Organization, 2012), therefore female nurses’ personal experiences with domestic
violence have the potential to impact on their professional lives and to influence their
decisions about reporting episodes of aggression and violence (Ferns, 2006). Nursing
is a female dominated profession and females are often socialised from birth to
manage aggression in a covert fashion, and so may be reluctant to report incidents,
preferring to deal with them informally themselves (Ferns, 2006). While the issue of
gender was not addressed in this study, Australian figures from 2011 show that 90%
of nurses were female, a slight decrease from 2001 (91%) (Australian Bureau of
Statistics, 2013).
Participants in the study also cited the diminished responsibility of some patients
due to their physical or cognitive state as a reason for not reporting episodes. Nurses
may be reluctant to pass judgement on some types of patients as this is seen as
counterintuitive to nursing (Howerton Child & Mentes, 2010; Sato et al., 2013).
According to one study, reporting of episodes of violence was found to be increased
if the victim was male, if the perpetrator was a non-patient and if the level of
325
violence experienced was significantly physical and violent (Findorff et al., 2005).
This finding is reflected in an audit of a West Australian hospital’s incident forms,
which found that 96% of reporting nurses had suffered one or more injuries as a
result of an episode of violence (Chapman et al., 2010).
Research has found that nurses are selective about the blame they attribute to
patients: the actions of patients with diminished capacity were perceived to be
unintentional and episodes of violence are typically not reported out of concern for
the perpetrator (Jones & Lyneham, 2000; van der Zwan et al., 2011). Nurses often
ascribe meanings and judgements to episodes of violence to inform their actions and
responses using three factors: perceived personalisation of the violence; the presence
of mitigating factors and the reason for the presentation (Luck et al., 2008). The
perceived degree of self-responsibility and capacity during violent episodes are
considered by nurses, and episodes of violence where nurses believe there is no
intent or where the patients involved have impaired cognition are classified as
resistance to care (Kable et al., 2012b). Thus under-reporting may reflect the nursing
ethic of putting patients first with nurses failing to recognise some incidents as
violence due to a perceived lack of intent. This reaction to aggression is influenced by
social construct, however regardless of the intent, nurses are still being injured
(Ferns, 2006).
6.4.1.3 Reporting methods
Informal reporting methods were favoured over formal reporting in the data from
Part I of study with documentation in patient notes the most common form used.
These findings were consistent between metropolitan and regional/remote areas.
Other informal methods included verbal reporting to managers and/or team leaders
or at handover. Formal reports of episodes were completed using electronic and
paper methods. Studies that have compared violence reported through formal
incident reports with other forms of reporting have identified vast under-reporting,
326

for example a cross sectional study in the US found that oral reports were the most
common reporting method used by participants (86%, n = 1506/1751) (Findorff et al.,
2005). A study of 4,738 Minnesota nurses reported that 69% of episodes of physical
violence and 71% of non-physical violence were reported orally to a supervisor or
other management personnel rather than through official means (Gerberich et al.,
2004).
A recent American study (n = 7,169) found that the majority of ED nurses who were
victims of workplace violence did not file a formal report for physical violence (66%)
or verbal abuse (86%) experienced. Most nurses who reported physical violence did
so to security personnel, an immediate supervisor and colleagues, with 8% not
reporting to anyone. The majority of nurses who had experienced verbal abuse
reported this to other nurses, while 17% did not report the incident to anyone
(Emergency Nurses' Association, 2011)
6.4.1.4 Actions following episodes of patient-related violence: Coping methods
and support
While 186 of the respondents indicated that they had received immediate support
from management and/or counselling or debriefing; a further 165 nurses stated that
they had received no response from management. This is consistent with the data on
barriers to reporting discussed earlier and with the literature on the topic. For
example a US study (n = 7,169) reported that 47% of nurses who were the victims of
physical violence reported that no action was taken with regards to the perpetrator
while 72% stated that they received no action or acknowledgment of having been a
victim of physical violence. Furthermore 11% of nurses were blamed for the incident
with three nurses receiving a punitive response (Emergency Nurses' Association,
2011). In this study 11 nurses cited fear of being blamed as a barrier to reporting
episodes of violence. Results were similar for episodes of verbal abuse with 81% of
nurses failing to receive a response from their hospital to their report. British
327

researchers found that in approximately half of the cases employers offered
immediate support, however in 91% of cases there was no outcome or any
intervention from the employer or the individual (Royal College of Nursing, 2006).
More than one-third of nurses reported that they had not been provided with
adequate information, support and follow up following a violent incident and more
than half had not been provided with access to recognised counselling services.
A lack of support following episodes of patient-related violence was identified in
regional areas. The reasons for this lack of support included a lack of follow up or
response from management; that no support was required by the nurses or that they
had decided not to report the episode of violence; or that violence was perceived by
themselves and management as just part of the job of ED nursing. Where support
was offered or available in the department, it included formal counselling, for
example through the Employee Assistance Program and informal debriefing with
colleagues. Informal debriefing was reported as the most common form of dealing
with the aftermath of violent episodes by nurses in Part II of the study: “…we all vent
at work…”
Statistically significant differences between regions were identified for risk
management follow-up strategies. Three strategies: “investigating reported episodes
– prompt follow-up and feedback”; “staff counselling services” and “rotating staff in
high risk areas, for example triage” were all found to be more common in
metropolitan areas. This suggests that nurses in regional locations are less supported
than their metropolitan counterparts following exposure to episodes of patient-
related violence.
A lack of attention to the emotional effects of violence can contribute to PTSD
symptoms which has a negative impact on the productivity of nurses. Immediate
intervention, during the first hours or days following exposure to a traumatic event,
can prevent such serious, long-term complications (Gates et al., 2011b; Schnieden &
328
Marren-Bell, 1995). National Institute for Health and Clinical Excellence guidelines in
the UK suggest a review should take place within 72 hours for all parties involved in
a violent incident (Bonner & McLaughlin, 2007). Immediate interventions, during the
first hours or days after a trauma, can prevent the more serious, long-term
complications associated with exposure to traumatic events (Flannery & Everly,
2000) and have a positive effect in terms of improved productivity (Gates et al.,
2011b).
Researchers in one US study reported that while management and employee
participants supported the use of debriefing after violent incidents, it was rarely
done, and when it did occur it was informal in nature. Barriers to debriefing included
lack of time and a workplace culture that tolerated violence as “part of the job”
(Gates et al., 2011a)
6.4.1.5 Management response
The majority of nurses in the study reported that no changes were introduced
following incidents of patient-related violence, in a finding that was consistent across
geographic locations. However the research recommends that violence be dealt with
promptly and positively (Winterbottom, 1979). Of those who reported that changes
had been implemented, these measures centred on risk prevention strategies such as
increased security presence, the use of duress alarms, restricted access to the
department and the use of Closed Circuit Television and signage.
More than half of the nurses surveyed reported that episodes of patient-related
violence were investigated by management with prompt follow up and feedback
provided. However 15 nurses reported that there were no risk management follow-
up strategies available at their place of employment while 12 stated that whilst they
existed there was a lack of feedback and action on the part of their employer.
329
Barriers to changes being implemented included the perception that there was no
solution to the problem of violence or that it was too hard or not possible to
implement changes due to the volume of episodes and/or costs involved, all set
within a workplace culture where violence was viewed as an expected part of ED
nursing. Another barrier to change was an unsupportive and apathetic attitude on
the part of management and a tendency to therefore ignore episodes of violence.
More than half those surveyed (63%) reported that upper management staff were
only “somewhat supportive” or “not at all supportive” following an episode of
patient-related violence, and more than a third reported the same for immediate
managers. American researchers found that nurses whose hospital administration
(OR = 0.81) and/or ED management (OR = 0.77) were committed to workplace
violence control were less likely to experience workplace violence (Emergency
Nurses' Association, 2011). A national survey of 3,465 ED nurses found violence
prevention was dependent on commitment from hospital administrators, ED
managers, and hospital security (Gacki-Smith et al., 2009).
6.4.2 Risk prevention strategies
The most common risk prevention strategies identified by ED nurses were security
guards, based in or near the department; duress alarms; restricted access to the
department, for example through the use of swipe cards; access to training such as
aggression minimisation training; referral to the police if a situation deteriorated; the
use of safety glass at triage and increased security measures after hours.
To be successful, risk prevention strategies must have a commitment from
administration and involvement of staff. Hospital administrators should collaborate
with employees, hospital managers, and risk managers for the adoption and use of
personal protective measures in the workplace (Gillespie & Fisher, 2014). The
organisation must promote a workplace culture that values their employee's well-
being and safety in the workplace (Forster, Petty, Schleiger, & Walters, 2005).
330

Security features recommended in the literature include duress alarms, separate
ambulatory and ambulance entrances, triage counter with sufficient height to
prevent being jumped/reached over; controlled access from waiting rooms, electronic
surveillance systems, electronic locks on external doors, surveillance systems
monitored, unobstructed view of the entire waiting room from triage and/or
reception, controlled access from the rest of the hospital, security officers based
within or adjacent to ED, reception level elevated to staff at eye level while seated
(Merfield, 2003). The Australasian College for Emergency Medicine issued
recommendations for Australian ED security and based on these recommendations,
an audit concluded that Australian EDs have inadequate levels of security with the
majority of ED directors unhappy with the security in their departments (Merfield,
2003).
Significant differences in the availability of risk prevention/minimisation measures
were found between metropolitan and regional/remote areas. Nurses in metropolitan
areas reported greater “access to training, for example Aggression Minimisation”;
“the availability of restraints and policies for their use”; “security personnel based in
the department” and “clear policies for the management of aggression. These
findings suggest that ED nurses in metropolitan areas may have better risk
prevention strategies provided in their organisations.
Security provisions in countries where gun crime is an issue such as the US cite the
use of metal detectors and Tasers in EDs (Kansagra et al., 2008; Keep & Gilbert, 1997;
Rankins & Hendey, 1999). A study in the US found that while the implementation of
an ED security system including metal detectors, cameras, limited access and a
manned security booth at the entrance to the ED, increased the number of weapons
confiscated from patients, it did not decrease the number of assaults on staff
(Rankins & Hendey, 1999).
331
6.4.3 Policies and procedures
The majority of nurses in Part I of the study perceived that their organisation’s
policies and procedures concerned with the management of patient-related violence
were either ineffective or only “somewhat” effective. In a result that was statistically
significant, nurses in regional areas were more likely to perceive policies as
ineffective compared to their colleagues in metropolitan areas.
Overall participants perceived that no clear policies existed and the policies and
procedures in place were outdated, ineffective or not enforced. For example the strict
enforcement of Zero Tolerance policies was identified as the most common
recommendation from participants in this study to reduce the incidence of patient-
related violence.
Policy and practice interventions may mitigate the risk of violence and aggression
while concomitantly addressing staff dissatisfaction with the status quo (Anderson et
al., 2009). The policy of Zero Tolerance towards violence has been adopted in health
services internationally including the United Kingdom and Australia. The origins of
the policy date back to the zero tolerance approach used in New York in the 1970s to
manage and reduce crime in the city (Bond, Paniagua, & Thompson, 2009). Many
participants in the study commented on an apparent disconnect between the policy
ideal and its implementation in the workplace. A study from the United States
reported that the presence of reporting policies (especially zero tolerance policies)
and a commitment from management to enforce them were associated with a
decreased risk of physical violence (Emergency Nurses' Association, 2011).
Much of the literature on the topic of zero tolerance in a health care setting speaks to
the feasibility and challenges of adopting the policy while establishing and
maintaining a therapeutic relationship with patients (Bond et al., 2009; Wand &
Coulson, 2006). Therapeutic engagement and the establishment of rapport are
essential components of nursing practice, and are crucial in the high pressure
332

environment of the ED (Wand & Coulson, 2006). Therefore policies should be
designed with the flexibility to deal with the variety of events encountered at triage
and in the ED (Keep & Gilbert, 1997).
6.4.4 Aggression minimisation training
Almost a quarter of participants in Part I of the study had never completed
aggression minimisation training (n = 114/467, 24%) and the majority had not
completed regular refresher programs (n = 334/454, 74%). Training was more
commonly available in metropolitan locations compared to regional/remote, in a
finding that was significant. In addition nurses in regional areas were more likely to
view such training an effective risk prevention strategy. The lack of refresher
programs was consistent across all regions. NSW Health policy states that it is a
mandatory requirement that such training be completed annually and management
are responsible for ensuring that a minimum of 90% staff compliance is maintained
at all times (NSW Health, 2012).
Aggression minimisation or de-escalation training involves the gradual resolution of
potentially violent situations through the use of communication techniques and skills
and the recognition of cues of potential violence and the stages of conflict (Rew &
Ferns, 2005). Violence prevention training for staff has been recognised as essential to
the prevention of violent incidents in the health care setting. Access to training has
been consistently identified in the literature as being an effective violence prevention
strategy and is regarded as important by nurses (Oostrom & van Mierlo, 2008).
Nurses at EDs with violence training programs have reported feeling safer than staff
in EDs without such programs (Kansagra et al., 2008). Training has been shown to
have many positive outcomes which enhance the ability of nurses to manage violent
and potentially violent situations and its effect has been estimated to reduce the
incidence of aggression in the workplace by 50% (Deans, 2004). Training should not
only include early recognition of the warning signs of potential violence, but also
333
guidance on documentation; legal rights and post-incident support for staff and
patients (Dimond, 1994; Wand & Coulson, 2006).
However the results of this study found that almost 20% of nurses did not have
access to training at their workplace and three-quarters had not completed regular
refresher programs as required. Forty nine nurses had not had access to training for
five years or more, this is despite the existence of mandatory training requirements
compelling employers to provide such training (NSW Health, 2012). This is
consistent with the literature on the topic: for example researchers in a US study
found that only 36% of respondents reported mandatory violence prevention
training for ED staff (Martindell, 2011); an Iranian study of ED nurses reported that
96% had received no training in managing episodes of violence (Hasani et al., 2010),
while a study of US ED nurses reported that 64% had not received any training in the
preceding 12 months (Gates et al., 2006). A US study of 69 EDs reported that less than
half had some type of violence training program for staff (Kansagra et al., 2008).
All public health facilities in NSW are legally obligated by NSW Health to ensure
that staff have appropriate access to training so that they can develop the necessary
skills and knowledge to prevent and respond to violence (NSW Health, 2012). This is
to ensure that they are able to recognise, respond to and report incidents of
aggressive, intimidating, threatening or violent behaviour (NSW Health, 2012). This
is not the case in other countries around the world. For example in the US violence
prevention programs are not mandated under federal law, and currently only nine
states have enacted laws requiring violence protection programs in health care
facilities (Martindell, 2012).
Despite the evidence on the effectiveness of training there appears to be a disconnect
between theory and practice: between the legal requirements and policy directives
and the reality for nurses working in the ED. Training should be extended to include
nursing students as they have been identified as a risk group amongst nurses for
334

patient-related violence and have been reported to experience threats to kill them,
racial abuse and sexually oriented verbal abuse (Ferns & Meerabeau, 2008). In
addition a US researcher reported that nurses were of the opinion that their
undergraduate training and subsequent orientation to the ED workplace left them ill-
equipped to deal with violence from patients (Catlette, 2005). There is an obligation
on the part of nurse educators to prepare students to deal with violence in the health
care setting (Whitley, Jacobson, & Gawrys, 1996). A European study into the
effectiveness of such a training program concluded that they resulted in increased
levels of confidence for students in managing aggressive incidents (Needham et al.,
2005).
6.4.5 Safety at work
The majority of nurses surveyed reported that they did not feel safe or felt safe only
some of the time: “…nobody should have to be scared at work…” (p. 153), often feeling
the need to qualify why they felt safe, for example”...I have martial arts background - so
feel quite safe..” (p. 464). Nurses in regional areas reported feeling “not safe” more
than their metropolitan counterparts, in a finding that was statistically significant.
The results of a logistic regression analysis found that participants who felt
“moderately safe”; “sometimes don’t feel safe” and “don’t feel safe” as a result of
experiencing an episode of violence in the preceding six months, were more than
twice as likely to experience an episode of violence compared to those who felt
“mostly safe”. This suggests that their fears were well founded.
Overall the results of the interview data contributed to an overarching theme of
feeling unsafe at work. This involved fear for the individual as well as fear for the
safety of others, staff and patients. The language used typified this: “…I just feel so
unsafe…”; “…I feel less safe than I did in the military…”; “…I think it’s a healthy fear most
days when you’re in triage…”; “...people can swear at us, spit at us, bite at us, and try to
335

hurt us...” This was accompanied by a sense of resignation that such violence was to
be expected: “…sadly I put it down as part of the job…”
Feelings of vulnerability and of feeling unsafe at work are reported in the literature
(Catlette, 2005). Researchers in one US study reported that 18% of nurses “never” or
“seldom felt safe”, and 21% “occasionally felt safe”, while only 7% reported that they
“always felt safe” (Gates et al., 2006). They identified a link between feelings of safety
and job satisfaction, with feeling unsafe much of the time linked to increased stress
and a desire to leave the profession (Gates et al., 2006). In one study 72% of nurses
reported they did not feel safe on the job and 19% indicated they were leaving the
emergency nursing profession because of violence (Tavernero, 2009).
Researchers in another US study reported that only 4% of nurses surveyed felt safe
from the possibility of patient assault at work (Erickson & Williams-Evans, 2000).
Nurses consistently reported fear when going about their working day, for example
an Irish study in 1997 reported that 91% of nurses indicated that they were worried
about being assaulted at work (Rose, 1997) while a study of Kuwaiti nurses found
that 78% of nurses were worried about violence (Atawneh et al., 2003). In an Iranian
study 87% of ED nurses reported a moderate or lower degree of security while
performing their jobs (Hasani et al., 2010). Researchers in an American study
reported that 26% of ED nurses never or seldom felt safe while working and that
only 1% felt safe (Gates et al., 2006). Researchers in a multi-disciplinary study
reported that nurses were five times less likely to feel safe “most of the time” or
“always” compared to attendings, residents, nurse practitioners and physician
assistants (Kansagra et al., 2008). These findings have also been reported in other
professional groups working in the ED. For example researchers in a study of ED
physicians in the US found that 81% of participants surveyed were occasionally
fearful of workplace violence (Kowalenko, Walters, Khare, & Compton, 2005).
336

Feelings of safety are directly related to job satisfaction and has implications for staff
retention: feeling unsafe is likely to increase stress and influence a nurse’s decision to
leave the workforce (Gates et al., 2006). The results of consistent and endemic
violence can lead to an overall destabilisation of the workplace and lead to a working
environment that is unstainable for many health professionals. (Whelan, 2008). In
response to this many Nurses’ Associations from around the world, including
Australia, Canada, the United Kingdom and the United States, have issued position
statements and campaigned about workplace violence and nurses’ safety. However,
the impact of these campaigns has to date failed to have a significant impact on the
problem.
6.5 Precipitants and antecedents
The fourth study aim was to identify factors associated with patient-related
workplace violence that precipitate, escalate or de-escalate episodes of violence.
Indicators of violence encompass a variety of indirect (for example long waiting
times), and direct factors (for example warning signs and antecedents) (Lau et al.,
2012b).
6.5.1 Nurse characteristics
6.5.1.1 Age and years of experience
Part I of the study identified a statistically significant relationship between the age of
nurses and the odds of having experienced a violent episode in the preceding six
months. The majority of participants in both age groups (23-39 and 40-65 years of
age) had experienced an episode of violence in the preceding year; however the odds
were decreased by approximately 60% for nurses aged 40 years and older. For every
additional year of age there was a four percent reduction in the odds of experiencing
a violent episode and this corresponded to an 18% reduction for every five years
337

increase in age. Similar results were identified with years of experience with a three
percent reduction in the odds of experiencing an episode of violence for every year of
nursing experience, and a four percent reduction where this experience was ED-
related. The independent effects of age and years of experience could not be
determined in this study.
Participants in Part II of the study discussed a difference in attitude between
experienced nurses and those new to the profession, and more experienced nurses
tended to put up with violent behaviours: “…that is the way it has always been and
nothing happens if you report and anyway it could be worse…” This attitude of
resignation to patient-related violence is also reflected in the literature on the topic.
Workplace violence is regarded by many in the nursing workforce as an occupational
hazard, and an unavoidable part of working life (Benveniste et al., 2005; McKinnon &
Cross, 2008; Ray, 2007). The fact that this was more apparent in nurses with greater
experience may reflect desensitisation to violence due to continued exposure over the
course of their careers. The result is that violence has become an expected and
accepted part of the job for these nurses (Benveniste et al., 2005).
These findings are consistent with the literature on the topic which consistently
reported that younger, less experienced nursing staff were at higher risk of verbal
and physical violence (Chapman & Styles, 2006; Emergency Nurses' Association,
2011; Gates et al., 2006; Gillespie et al., 2010; Rodriguez-Acosta et al., 2010; van der
Zwan et al., 2011).
Some researchers theorise that this may be due to the fact that older more
experienced nurses occupy management positions and so have less patient contact
(Gallant-Roman, 2008). However in this study only 11% of the sample (n = 60)
identified as managers and the inclusion criteria required all participants to have
worked clinically in the ED in the preceding 6 months. Lesser trained nursing
338
assistants and student nurses are also reported to be at a higher risk of violence than
more qualified members of staff (Ferns & Meerabeau, 2008; Tyrell, 1999).
Garling reported that the proportion of nurses on a ward with a bachelor’s degree or
higher decreased the perception of physical violence and the threat of violence. He
surmised that this may indicate that the better educated staff are, the better they
communicate with patients and families, and thus the greater the feeling of control
nurses have which in turn lowers their perception of violence (Garling, 2008). Similar
findings have been reported in other areas, for example the medical profession (Hills,
Joyce, & Humphreys, 2012).
6.5.1.2 Work fraction
Hours of work were categorised as part-time (1-19 hours), full-time (20-38) and over-
time (39 hours or more). The number of episodes of patient-related violence
experienced in the preceding six months were similar for full and over-time staff
with an average of 16 episodes in the last six months reported, however part-time
staff only reported an average of 11 episodes. For every additional shift worked
(eight hours) there was a 22% increase in the odds of experiencing an episode of
violence. It is interesting to note that the mean hours worked per week for part-time
employees was 28 hours, which is almost three-quarters of a fulltime workload of 38
hours, and some part-time and casual employees reported working up to 70 hours in
this period, therefore it is important to focus on hours worked rather than work
fraction when assessing risk.
6.5.2 Nursing-related factors
More than half (n = 311/509, 61%) of nurses surveyed in Part I of the study were of
the opinion that some nurses had a certain manner or approach that made them
more likely to experience episodes of patient-related violence, or were not sure. This
finding was consistent in all geographic locations. This included a lack of confidence
339

or experience of nurses as well as poor communication skills; a dismissive or hostile
demeanour or attitude and a lack of empathy. The inability to recognise the cues or
warning signs associated with a potential for violence or to be able to de-escalate
situations also were perceived to be significant by nurses in Part II of the study. The
communication skills of individual nurses were recognised as a vital tool in the
prevention of escalation of episodes of violence. Many episodes could be traced back
to a breakdown in communication and poor skills were linked to escalation of
episodes. The triage area was singled out as especially important in this regard: “the
failure to recognise ...amongst the triage and CIN nurses...how to help...deescalate that
scenario...that often makes the situation worse” (p2); “...enhancing communication with the
waiting room to help reduce incidences” (p2). Effective communication strategies
included the use of a calm tone and manner and not raising ones’ voice; walking
away from the situation if needed; being “engaged”: like you are interested and
doing something for the patient.
These findings are consistent with the body of literature on the topic. For example
Australian researchers reported that some nurses were able to recognise cues and
warning signs in potentially violent patients, and use this knowledge to prevent
escalation to violence by modifying their approach (Pich et al., 2011). The attitude
and behaviour of individual nurses, for example a condescending attitude, has been
recognised as a contributing factor to episodes of patient-related violence in the
literature on the topic (Chapman & Styles, 2006; Pich et al., 2011). Other negative
behaviours discussed included a rigid, controlling approach from staff; being overtly
authoritative, judgemental and confrontational (Hodge & Marshall, 2007). Such
behaviours can lead to a cycle of action and reaction and escalate potentially violent
patients (Lau et al., 2012b). Conversely empathetic behaviours or communication
such as acknowledging patients’ arrival or lengthy wait, using friendly body
language, using personal greetings and thanking patients for their cooperation result
340
in positive interpersonal relationships and have a constructive effect on the
subsequent behaviour of patients (Lau et al., 2012b).
A study from the United Kingdom found that patients identified poor
communication from nursing staff as a significant precursor to aggressive behaviour
(Duxbury & Whittington, 2005). This may be linked to a lack of training, inadequate
resources and/or the absence of clear policies. Negative staff-patient interactions
have been identified as an antecedent for failure to develop a therapeutic relationship
and this may be exacerbated in cases where staff distances themselves after violent
episodes. This can then have a negative effect, by increasing their risk of future
assaults (Duxbury & Whittington, 2005).
6.5.3 Patient-related factors
6.5.3.1 Age
While Part II of the study specifically focused on younger patients aged 16-25 years
of age, the majority of nurses in Part I of the study also identified younger patients as
a high risk group for violence. Patients aged 35 years and younger were reported to
be the highest risk group (n = 417, 82%) for potential violence, a finding that was
consistent with the free-text answers where participants identified the younger age
group as the one of particular concern. Violence from patients aged less than 16 years
of age was found to be more common in metropolitan areas, compared with regional
areas. This is likely to be related to population figures and to the increased presence
of paediatric hospitals in those areas.
Youth or younger patients, under the age of 30 have been identified as a risk group
for potential violent acts in the literature (Kinkle, 1993; Sands, 2007; van der Zwan et
al., 2011). A British study that investigated the characteristics of aggression and
violence towards staff in an urban UK ED, identified young males as being
predominantly responsible for such episodes (James, Madeley, & Dove, 2006). An
341

Australian study using two independent sources of information (ED presentations
and assaults reported to police) identified an association between alcohol
intoxication and assaults at the population level, and the strength of this association
increased for those aged 15–24 years (Descallar, Muscatello, Weatherburn, Chu, &
Moffatt, 2012). This link is discussed further in the section on alcohol intoxication as a
risk factor for violence.
6.5.3.2 Gender
Data from Part II of the study identified males to be the perpetrators of violence
more often than females; however the participants noted that there had been an
increase in female violence and aggression. This is consistent with the research where
traditionally male patients have been responsible for the majority of violent episodes,
however a shift has been reported with increasing numbers of females exhibiting
violent behaviour (Farrell et al., 2006; James et al., 2006; Oster et al., 2001). It has been
theorised that this reflects changing patterns of behaviour in society and an
acceptance of such behaviour (Oster et al., 2001).
6.5.3.3 Triage category
Patients in Australia are triaged according to the urgency with which they need to be
seen (NSW Health, 2013). In this study the most common triage categories of patients
responsible for episodes of violence in the study were reported to be three and four,
which is consistent with the results from another Australian study (Crilly et al.,
2004). A triage category of three refers to a potentially life threatening condition, for
example a major fracture or severe blood loss and the recommended wait time for
such patients is 30 minutes. Category four patients are described as having
potentially serious conditions, for example sprained ankles or migraines and should
be seen within one hour (NSW Health, 2013). A lack of understanding of the triage
system has been proposed as a possible precipitant for episodes of violence
(Lyneham, 2000).
342

Data were further analysed according to region and a statistically significant
difference was identified for Triage Category 2, with more perpetrators reported in
this category in metropolitan locations. A triage category 2 refers to patients who
require treatment within 10 minutes of arrival and who are classified as having an
imminently life-threatening condition, for example serious chest pain, difficulty
breathing and severe fractures (NSW Health, 2013) . This may be explained by the
fact that more tertiary hospitals are located in metropolitan areas and would be
expected to see more serious cases and population levels are higher in these areas
meaning there is an increased likelihood of patients presenting with serious
conditions.
6.5.3.4 Clinical presentation
Alcohol intoxication, mental health issues and substance misuse were identified as
the three most significant clinical diagnoses for patient-related violence. In addition
anxiety and agitation and delirium also were found to be significant. The clinical
diagnoses of delirium, cognitive dysfunction and paediatric emergency were found
to be more common in metropolitan areas, which may be linked to the increased
presentations overall of these types of patients.
i. Alcohol intoxication and illicit substance misuse
Alcohol intoxication and substance misuse were reported by the majority of nurses in
Part I of the study as risk factors for patient-related violence. This was true where the
patient presented with a specific diagnosis of alcohol intoxication and/or substance
misuse, and also where this was identified as a secondary patient-specific factor. In
both areas they were found to be statistically significant in relation to episodes of
violence. This is especially true in the case of alcohol intoxication, where the odds of
a violent episode were three times higher when patients presented with a specific
diagnosis of alcohol intoxication. In the case of substance abuse the risk increased by
2.5 times.
343

Alcohol and substance misuse also were consistently identified as antecedents for
episodes of violence, particularly with regards to young males aged 16-25 years of
age, in Part II of the study. The effects of alcohol in particular were linked to a
decreased tolerance of the ED environment, particularly with regards to waiting
times. This was thought to be exacerbated as the age group 16-25 (often referred to as
Generation Y) are often described in terms of a generation demanding instant
gratification and used to having their needs met quickly through the advent of the
internet age of technology. Alcohol and substance misuse were strongly linked to
patients exhibiting “attention seeking” behaviours. These factors have been
consistently reported as risk factors, for example a UK study of violent episodes in an
urban ED found that more than half (n = 114/218, 52%) of violent episodes reported
involved patients under the influence of alcohol (James et al., 2006).
These factors are consistently reported in the literature as being causative factors in
patient-related violence (Gates et al., 2006). Crime statistics for hospital assaults in
NSW for the year 2006 listed the top three antecedents as mental health related (32%
of incidents), alcohol-related incidents (31%) and drug-related (17%) (Hilliar, 2008).
In addition for the period 1996-2006 the proportion of assaults classified as mental
health-related increased significantly: from 19% to 32% (Hilliar, 2008). American
researchers reported a significant correlation between incidents of violence during
the past year and the number of perpetrators perceived to be under the influence of
alcohol (Mayer, Smith, & King, 1999). Alcohol is consistently referred to as a risk
factor in the literature, with 25% (Crilly et al., 2004) to 98% (Ferns, 2005a) of all
violent episodes being attributed in some way to alcohol misuse.
The consumption of alcohol is a generally accepted part of Australian culture
(Poynton, Donnelly, Fulde, & Scott, 2005) and expectations on how people should
behave in social settings (especially young people) often involve the consumption of
large quantities of alcohol (Lloyd, Matthews, Livingston, & Jayasekara, 2011).
Increasing media and public interest has focused on dangerous alcohol consumption,
344

particularly binge drinking and the link with violence, usually assaults (Lloyd et al.,
2011). A recent Australian report highlighted the magnitude of alcohol misuse in
Australia. According to the report one in five Australians consume alcohol at levels
that put them at risk of lifetime harm from injury or disease; two in five at levels that
put them at risk of short-term harm at least once a year and over one-third (36%) of
drinkers say their primary purpose when drinking is ‘to get drunk’ (Australian
Institute of Health and Welfare, 2011). The result is that up to 60% of all police
attendances, including 90% of late-night calls, involve alcohol-related disturbances
(Doherty & Roche, 2003).
Alcohol leads to impaired judgement and decreased tolerance levels in frustrating
situations (Lyneham, 2000). It has a disinhibiting effect on behaviour which may lead
to exaggerated or inappropriate responses such as violence (Crilly et al., 2004). A
recent trend reported is the use of amphetamine-type stimulants and alcoholic
energy drinks to mask the effects of alcohol and enable users to drink more for
longer periods exacerbating these effects (National Preventative Health Taskforce,
2010).
The problem of alcohol misuse and violence is especially significant with younger
people. The evidence shows that young people are more likely to consume alcohol at
dangerous levels, to drink specifically to become intoxicated; and to experience acute
alcohol-related harms which bring them into contact with EDs. For example up to
22% of hospitalisations are alcohol-attributable and 32% of alcohol-related hospital
admissions for injuries from violence involve patients aged 15–24 years old
(Anonymous, 2012; Chikritzhs & Pascal, 2004). A study of patient presentations to an
inner-city ED in Sydney, Australia reported that one-third of intoxicated patients
were aged less than 25 years of age and two-thirds were male with 65% of all
presentations occurring between 6pm on Friday and 6am on Monday (Poynton et al.,
2005).
345
ii. Mental health diagnoses/issues
Patients with mental health diagnoses also were identified as a high risk group for
patient-related violence, with the odds of a violent episode occurring more than three
times higher where a patient presented with a mental health diagnosis. This finding
is reflected in the literature however some researchers suggest that stereotyping of
such patients and the counter-productive environment of the ED can facilitate this
violent behaviour (Tyrell, 1999).
The ED environment can provide heightened stimulation to such patients as it is
noisy and fast-paced and is not conducive to quietness, safety and calmness
necessary for the effective management of patients with mental health issues (Jones
& Lyneham, 2000). In addition many ED nurses lack the skills and resources to
adequately manage such patients and prevent escalation of aggressive behaviours
(Jones & Lyneham, 2000; van der Zwan et al., 2011). The use of dedicated specialist
mental health nurses, fast-tracking and the use of isolation rooms to remove patients
from the negative stimuli in the ED were proposed as strategies to manage such
patient by participants in Part II of the study. The fast tracking of patients with a
mental health diagnosis has been recommended as a preventive strategy in
managing patient-related violence (Benveniste et al., 2005). In addition training of
nurses in Mental Health First Aid has been proposed so that all nurses possess the
knowledge to deal with patients with mental health diagnoses. This has been
implemented into the undergraduate curricula at the University of Newcastle in
Australia (Pich et al., 2011).
iii. Altered cognitive function
Other diagnoses reported as risk factors which were found to be statistically
significant for violence included those related to altered cognitive function, for
example delirium; disorientation/confusion; cognitive dysfunction and anxiety and
agitation. For example the odds of a violent episode occurring were more than one
346
and half times higher where a patient presented with a diagnosis of
disorientation/confusion, and more than one and half times higher where a patient
presented with a diagnosis of cognitive dysfunction. Significant differences were
found between geographic regions for delirium and cognitive dysfunction, which
were both more common in metropolitan locations.
This is consistent with the literature on the topic with temporary organic cognitive
disturbances such as hypoglycaemia and intracranial trauma reported as risk factors
for potential violence (Chapman & Styles, 2006; Gates et al., 2006; May & Grubbs,
2002). The literature on resistance to care reports on unintentional violence from
patients, with reference to the following significant clinical presentations: dementia,
agitation, anxiety, substance and mood disorders (Kable et al., 2012b). Anxiety and
agitation were reported by participants as being a significant factor along with pain,
and this is also reflected in the existing evidence (Chapman & Styles, 2006; Ferns,
2005b).
6.5.4 Patient-specific factors
Participants in Part I of the study identified a number of patient-specific factors as
contributing/precipitating factors for patient-related violence, and their answers
were consistent with data collected for clinical diagnoses. Significant factors
identified included alcohol intoxication, illicit substance misuse, patients with mental
health diagnoses and cognitive dysfunction. Please see section 6.5.3 for a discussion
of these findings.
6.5.4.1 Other patient-specific factors
A history of violence was identified by more than three-quarters of those surveyed as
a risk factor for patient-related violence in a result that was found to be statistically
significant. This is consistent with the literature on the topic and a history of violent
behaviour has been identified as one of the most reliable indicators of future
347

violence, however this fact is not always apparent to the treating nurses (Ferns,
2005a; Kinkle, 1993).
Other statistically significant factors included patients’ unrealistic expectations of
staff and the health system; acute pain and cultural issues. A statistically significant
difference was identified for “cultural issues” which was greater in metropolitan
areas compared to regional/remote. Unrealistic expectations of the public about
waiting times and the triage system can lead to frustration where instant gratification
is expected but not forthcoming (Tyrell, 1999). In some cases, cultural insensitivities
or racial tension can precipitate patient-related violence (May & Grubbs, 2002).
Stress, frustration and anxiety (Chapman & Styles, 2006) and the emotional impact of
admission (Tyrell, 1999) are also reported to be significant precipitants for patients.
Personal stressors such as feelings of vulnerability, fear, hopelessness, loss of control,
and lack of knowledge can add to feelings of frustration and increase the likelihood
of patient-related violence occurring (Luck et al., 2006).
More than two thirds of participants in this study believed that socio-economic
indicators played a significant role in episodes of patient-related violence. This is
consistent with the literature on the topic that reports that socioeconomic and
psychosocial factors such as homelessness, financial burdens, criminal background
and domestic violence are linked to increased intolerance to frustration and can put
such people at risk of potential violence in the ED health care setting (Luck et al.,
2006; Lyneham, 2000). Researchers in a British study found that patients responsible
for episodes of violence tended to live in areas ranked as more deprived when
compared with other patients (James et al., 2006).
6.5.5 Patient-specific behaviours
A number of patient-specific behaviours were found to be significant in Part I of the
study as warning signs for impending violence by nurses. These included agitation;
tone of voice; attitude; pacing; menacing and staring and no differences were found
348
between geographic regions. This was consistent with the findings in Part II of the
study with warning signs identified by participants as predictors of potential
violence. It was stressed however that sometimes episodes escalated without the
presence of such warning signs and therefore it was dangerous to rely on them as a
prevention strategy. Behavioural and verbal cues were discussed and included:
anxiety and agitation; pacing; patients acting in a distracted manner and
communicating with a frustrated tone interspersed with “tutting and sighing”.
The warning signs identified are consistent with those discussed in an Australian
study that proposed that five interconnected elements of observable behaviour were
suggestive of a potential for violence in patients. These were labelled the STAMP
behaviours and identified as: Staring and eye contact; Tone and volume of voice;
Anxiety, Menacing and Pacing (Luck et al., 2007). These were subsequently
expanded on to include another four elements: Emotions, Disease process,
Assertive/non-assertive behaviours and Resources (Chapman et al., 2009). Other
patient behaviours identified as indicators of impending violence in the literature
include verbal and physical cues associated with anger or agitation such as rapid
speech, angry tone of voice, fidgeting, demanding attention, paranoid delusional
comments, aggressive statements or threats, clenched fists, tense posture, tightened
jaw, increased activity such as pacing and a tense posture (Kinkle, 1993; Presley &
Robinson, 2002). Demanding behaviour and requesting attention also were listed as
high risk behaviours (Crilly et al., 2004).
This knowledge has been utilised by a number of researchers to develop violence
assessment tools to allow nurses to identify those at risk of potential violence (Luck
et al., 2007; Sands, 2007; Wilkes, Mohan, Luck, & Jackson, 2010). This information
needs to be incorporated into continuing training and education programs (Wand &
Coulson, 2006).
349

6.5.6 Environmental factors
6.5.6.1 Time
The afternoon shift, between 1500 and 2300 hours, was identified as the time period
where the majority of violent episodes occurred by 41% of participants (n = 202) in
Part I of the study. However a similar number, (n = 196, 39%) reported that more
than one time period was significant in this regard.
The afternoon/evening shift has been reported as having the highest risk for patient-
related violence in a number of studies, as opposed to the day shift which was
reported to be the lowest risk shift (Brookes & Dunn, 1997; Crilly et al., 2004;
Dalphond et al., 2000; Hilliar, 2008; Pich et al., 2011). The night shift has also been
reported in the literature to be a higher risk time period compared to the day shift
(Gacki-Smith et al., 2009; Senuzun Ergun & Karadakovan, 2005). However, the
definition of night shift varied between these studies and was defined in one as 1600-
0800, which encompasses both the evening and night shift (Senuzun Ergun &
Karadakovan, 2005).
The majority of participants in this study nominated the weekend or public holidays
as the highest risk period for violence. Weekends have been identified in some
studies as periods of higher risk for patient-related violence (Gacki-Smith et al.,
2009). Weekends and evenings tend to show a higher prevalence of alcohol-related
issues. An Australian study that looked at day-of-week trends with regards to
alcohol-related ED presentations identified Fridays and Saturdays as peak times for
presentations due to acute alcohol intoxication (Lloyd, Matthews, Livingston,
Jayasekara, & Smith, 2013). A study from an inner-city Sydney ED reported that 65%
of all alcohol-related presentations occurred between 6pm on Friday and 6am on
Monday (Poynton et al., 2005). Crime statistics on hospital assaults in NSW for the
year 2006 identified Sunday as the most common day of the week for violent
incidents (Hilliar, 2008).
350

Seasons perceived to be high-risk for potential violence included holiday periods, for
example Christmas and Easter. Summer was also reported to a high-risk period and
it is important to note that Christmas in Australia occurs in summer and summer is a
holiday period for university students. Alcohol-related ambulance attendances, ED
presentations and hospital admissions for male and female patients peaked in the
warmer months of the year, with February, November and December being the
months with the highest numbers of cases recorded (Lloyd et al., 2011). A time–series
analysis conducted in Melbourne, Australia between 2000 and 2009 to explore trends
in alcohol intoxication in the context of major events concluded that acute alcohol
intoxication cases requiring ambulance, ED and hospital in-patient treatment
increased substantially on the day preceding public holidays and specific public
holidays including, New Years’ Day and Anzac Day. In addition major sporting
events such as the AFL Grand Final, Melbourne Cup and Grand Prix were associated
with an increased number of alcohol intoxication presentations to the ED (Lloyd et
al., 2013).
6.5.7 Nursing activities
Participants in Part I of the study identified a number of nursing activities associated
with the first point of contact with patients that were found to be statistically
significant with regards to the frequency of episodes of patient-related violence. They
included: “triaging”; “communicating with patients”; “managing patients’ reactions
to delays”; “restraining patients” and “assisting patients in the waiting room”.
Statistically significant differences were identified between geographic locations for
two nursing activities: “giving oral medications” and “restraining patients”.
The results of a logistic regression analysis found that the odds of experiencing a
violent episode were almost three times higher for nurses engaged in triaging
patients. Triaging is consistently identified as a high risk nursing activity (Emergency
Nurses' Association, 2011). As the first point of contact and a visible presence to the
351
waiting room, the triage nurse often bears the brunt of patient frustrations over
waiting times and the triage priority system of care. As a result they are often
verbally abused both face-to-face and over the phone, in full view of a waiting room
full of people (Jones & Lyneham, 2000).
Participants in Part I of the study were asked to nominate three high risk nursing
activities and the results for this question closely align with information discussed
previously. More than half of those surveyed (n = 252/482, 52%) nominated triaging
as the highest risk nursing activity. Other activities reported included: managing
reactions to delays, managing patients in the waiting room; and dealing with patients
with a mental health diagnosis and those affected by alcohol and illicit substances.
The initial interaction between triage nurse and patient at triage can provide
important cues for the direction of the subsequent interaction. For example patients
who responded to a nurse’s greeting or who initiated the greeting appear to show a
lower propensity for violence (Lau et al., 2012b). Immediate and direct personal
verbal and not-verbal behaviours such as being unfriendly, inattentive and
uncooperative served as predictors of potential violence in the ED (Lau et al., 2012b).
6.5.8 Staffing issues
Staffing issues found to be statistically significant in this study as contributing or
precipitating factors for patient-related violence included “workload and time
management issues”; “poor skills mix” and “time/day of shift”. The results of a
logistic regression analysis found that if a “poor skills mix” or “workload and time
management issues” existed, nurses were more than twice as likely to experience
patient-related violence. These results were consistent between geographic locations.
A national Canadian study also identified a link between staffing and resource
adequacy, co-worker support and supervisor support and the incidence of patient-
related workplace violence (Shields & Wilkins, 2009).
352

Empathetic communication skills, for example acknowledging patients’
arrival/waiting or emotions/concerns, calling patients by their first name and
thanking patients after they answer questions have been identified as important in
the ED setting and can prevent episodes of potential violence from occurring (Lau et
al., 2012b). It can serve to mitigate known triggers for violence, for example the use of
empathetic communication can make long waiting times more tolerable (Lau et al.,
2012b).
6.5.9 ED specific issues
6.5.9.1 Area of the department
A number of departmental areas were found to be statistically significant with
regards to patient-related violence. These included the triage area; patient cubicles;
the waiting room, resuscitation rooms and ambulance bays. The odds of
experiencing an episode of patient-related violence was almost four times greater for
nurses working in the triage area; more than three times greater for those working in
patient cubicles; almost twice as high for those working in the waiting room; more
than four times greater in the ambulance bay and doubled for nurses working in
resuscitation rooms.
Statistically significant differences across geographic locations were found for
“resuscitation room” and “corridors” which were both more commonly reported by
nurses in metropolitan areas compared to those in regional areas. It seems reasonable
assume the presence of more tertiary hospitals in metropolitan areas and therefore a
greater number of resuscitation rooms, which explain this result.
The triage area was also identified in Part II of the study as a high risk area in the ED
for patient-related violence. In some cases the environmental design of the area was
perceived to exacerbate situations. For example the use of a barrier or screen at triage
created a power imbalance from the first interaction with patients, and this has been
353
shown to amplify frustration in patients who are already feeling vulnerable. It can be
viewed as harsh, alienating and divisive and may increase the risk of violent
behaviour from such patients (Design Council, 2014). Workplace design has been
identified as a major factor that could potentially promote the safety of ED nurses or
increase their risk of being victimised, particularly with regards to the triage area
(Gillespie, Gates, & Berry, 2013).
Triage has been consistently identified as a high risk area for patient-related violence
in the literature (Crilly et al., 2004; Jones & Lyneham, 2000; Keep & Gilbert, 1997). A
number of studies have reported that more than half of all violent incidents occur at
triage or within the first hour of the patient being in the ED (Brookes & Dunn, 1997;
Crilly et al., 2004; Lau et al., 2012b). Triage nurses can be consistently verbally
abused, both face-to-face and over the phone, in full view of a waiting room
throughout their shifts. As the first point of contact in the ED the triage nurse often
bears the brunt of frustration related to waiting times and the triage system of
prioritising care (Jones & Lyneham, 2000). Accurate information on waiting times is
often only available from triage nurses and this can lead to dissatisfaction from those
waiting and the perception that the triage nurse is the “gatekeeper” to the ED (Keep
& Gilbert, 1997; Lau et al., 2012b). A possible solution could be the use of signage in
the waiting room, however its effectiveness would be dependent on the ability of
triage nurses or ED clerks to update it regularly (Lau et al., 2012b).
6.5.9.2 ED-specific precipitants
Almost all nurses surveyed (n = 501, 99%) reported that long waiting times and
delays were the main ED specific precipitants for patient-related violence. This result
was found to be significant and logistic regression analysis found that the odds of
experiencing an episode of patient-related violence increased by more than five times
where long waiting times and delays were present. “Lack of Privacy” was also found
to be a significant ED-specific precipitant, which almost doubled the odds of
354
experiencing an episode of violence. Other factors such as over-crowding; noise
levels; and personal space issues also were consistently identified by nurses as
factors of concern. Patient specific reactions to the environment including the ability
to manipulate the waiting system using past knowledge, the negative impact of the
environment on mental health patients, and security concerns also were discussed. A
statistically significant difference was identified across regions with “over-crowding”
more common in metropolitan areas compared to regional/remote. This result is
likely to reflect the greater number of patient presentations to EDs in metropolitan
areas due to denser population figures.
Crowded waiting rooms, limited space for privacy, increased levels of noise and
activity have been identified in the literature as risk factors for violence (Bond et al.,
2009; Ogundipe et al., 2010). This environment is reported to be counter-productive
to the treatment of patients with a mental health diagnosis: it is open, busy and fast-
paced, which further increases the risk of violence from such patients (Jones &
Lyneham, 2000). Therefore the presence of staff trained in mental health is proposed
as a strategy to identify and defuse potentially violent situations (Pich et al., 2011).
Many ED nurses have only received minimal training in mental health, often dating
back to their university education (Jones & Lyneham, 2000), therefore the use of
Mental Health First Aid Training has been suggested as a means of keeping ED
nurses current in this regard (Pich et al., 2011). Other measures include staffing
strategies to address the needs of mental health patients by specifically rostering staff
trained in mental health, specific mental health assessment areas and mental health
EDs (Morphet et al., 2012).
Dissatisfaction with waiting times has been reported as a crucial trigger for violence
(Crilly et al., 2004; Gates et al., 2006; Jones & Lyneham, 2000; Lau et al., 2012b; Saines,
1999). Patients’ negative responses to waiting times are not exclusively dependent on
the actual duration of waiting, as individual tolerance levels are varied (Lau et al.,
2012b). For example Lau et al (2012) reported that some patients became frustrated
355

after waiting for less than five minutes, whilst others reached this level after three
hours (Lau et al., 2012b). Therefore it may be that the perception of waiting times are
more likely to influence patient satisfaction in the ED than actual waiting times (Lau
et al., 2012b).
Waiting times were not restricted to wait times to be admitted to the ED and seen by
a doctor. This was essentially the first in a series of “waiting times” that included
specialists, x-rays, and pathology results, a situation described as “handballing
around”. Diagnostic testing, pathology reports, specialist consultations, transfer to
the ward or to another facility can all add to the duration of time spent by patients in
the department and to their frustration levels (Robinson et al., 2004). In addition in
NSW hospitals “bed block” can lead to patients spending hours on ambulance
trolleys in a holding area before they are admitted to the ED. A lack of
communication on the part of nurses in the ED was reported to exacerbate the impact
of waiting times, and patients who were not informed were at increased risk of
violent behaviour.
One strategy suggested to mitigate this risk was to provide targeted treatment while
patients were still in the waiting room through the use of Clinical Initiatives Nurses
(CIN). This role was performed by two participants in Part II of the study. The CIN
role was originally introduced into major NSW EDs in 2002, with their primary
purpose to provide nursing care to patients in ED waiting rooms. The care delivered
is prioritised in the following way: maintenance of an ED nursing presence in the
waiting room to facilitate a safe clinical environment; communication regarding ED
processes, waiting times and provision of relevant education on their health issues;
and assessment of patients following triage with a view to:-
• Initiation of diagnostics or treatment;
• Escalation of care, where required;
• Appropriate referral of patients (Emergency Care Institute NSW, 2013).
356

Initiatives to improve waiting times in public hospital EDs using a clinical initiatives
nurse (whose priority would be ED patients waiting for care, and their
families/carers) has been recommended as a strategy to reduce patient-related
violence in the ED (Benveniste et al., 2005). The Garling Report into acute care
services in NSW recommended the use of CINs in EDs with an excess of 25,000
presentations. The report noted that the role of the CIN was critical in busy periods
where they were able to provide close observation of patients in the waiting room
and initiation of treatment where required (Garling, 2008).
Long waiting times are consistently referred to in the literature as being a primary
contributing factor in patient-related workplace violence (Ferns, 2005b). In fact over
half of all types of violence reported in one study involved patients who had
protracted waiting times in excess of those recommended (Crilly et al., 2004).
The unpredictable nature of the ED, both on quantity of patients and severity of
presenting problems, makes it impossible to eliminate waiting times and the
subsequent frustration to patients. However methods should be employed to keep
them to a minimum and to keep patients apprised of the situation at regular intervals
(Saines, 1999). The Garling Report noted that the number of people utilising the
public health system has surged since 2006, especially with regards to elderly
patients and young adults (Garling, 2008).
6.6 Violence from the parents of paediatric patients
The fifth study aim was to investigate the issue of violence with respect to younger
adults (16-25 years of age) and the parents of paediatric patients.
In Part I of the study, two hundred and twelve participants (43%) reported
experiencing violence from the parents of their paediatric patients, with the majority
of these parents aged between 26 and 35 years of age. Paediatric emergencies also
were listed as clinical diagnoses of concern and parents were identified as being a
357

group at risk of displaying violent behaviour in the free-text answers in Part I of the
study. This group has previously been recognised as a risk group for potential
violence (Gillespie et al., 2010; Pich et al., 2011).
6.6.1 Parental emotions
One of the themes identified in Part II of the study centred on parental emotions.
Parent-initiated violence was reported to be preceded by aggressive and demanding
behaviours that became increasingly unreasonable in nature. Fear and anxiety over
the condition of their child: “…why is my child not being seen?” was reported to be a
key stressor for parents often leading to a perception that their child’s needs were not
being met. This was often exacerbated by frustration and impatience with the health
system, particularly regarding waiting times. The coping mechanisms of parents
were tested with some not being able to cope with the stress of an unfamiliar
situation and responding with violence; “...It really has to do with the parent’s ability to
cope with this situation which they’re not used to...”(p.8). Other parents used prior
experiences and information gained from the internet and media to form a pre-
conceived idea of how their child’s care should unfold.
Heightened states of emotion in patients and/or their families has been identified as a
risk factor for violence (Fernandes et al., 1999; Luck et al., 2008) and was identified
with regards to the parents of paediatric patients in this study. A UK study of parent
satisfaction in the ED found that the most important factors were a clear explanation
of the child’s diagnosis and treatment plan; the ability of a parent to stay with their
child at all times; rapid and adequate pain relief and staff attitudes (Pagnamenta &
Benger, 2008).
The types of parents involved in these episodes varied, however participants
discussed two groups of concern: young parents and “well presented
men”/”business men”. The latter were reported to act in a condescending manner,
particularly towards female nurses. These parents typically refused to accept
358

directions and or the advice of nurses, who were often seen as an impediment to
seeing a doctor, which was the ultimate aim of the parents. The violent behaviour
was viewed as a means to this end with many parents apologising to the nurses after
the fact: “…it wasn’t personal...I wouldn’t normally be like that...” The nurses in the
study did not feel that the apology excused the behaviour and it did not ease their
negative feelings about the episode.
6.6.1.1 Paediatric patients
Paediatric emergency was reported as clinical diagnoses of concern for potential
violence in Part I of the study: the risk-group for potential violence identified were
the parents accompanying these patients to the ED. This information was reinforced
by free-text answers in the “other” category for this question: “…it’s always the
parents…” (p.510). These findings add to the data from Part II of the study that
focused on parents of paediatric patients as one of two groups of interest for
potential violence.
The age range of the children accompanied by these parents was described as being
“young”, from toddler to barely school aged by participants in Part II of the study.
The triage categories assigned to these paediatric patients were typically low, with
categories four and five the most common: “…most of those children…actually ended up
going home…” This illustrated a disconnect between the parents’ perceptions of the
severity of the presenting problem and the actual presentation.
There was a duality in the impact on the nurses as they sought to balance their
response to the abuse from the parents with their nursing care of the paediatric
patients. The personal and professional impact and risks to the nurse were often
secondary to their concern for the health needs of these patients. There was also
concern at the impact such behaviour was having on the child in terms of
normalising violence towards nurses for subsequent interactions: “bred into
them...that’s how you treat the staff...and get away with it”.
359

6.7 Participants recommendations to minimise/prevent the
occurrence of patient-related violence
The final study aim was to develop recommendations for employers about patient-
related violence and safety in the workplace for ED nurses.
The strict enforcement of Zero Tolerance policies was the most common
recommendation from participants and closely aligned with the need for improved
security. Participants recommended that hospital security guards be rostered on to
all shifts and be based in the hospital or preferably in the ED at triage where they
would serve as a visible presence to the public, especially those in the waiting room.
Some nurses felt that police should have a visible presence in the department and
that perpetrators should be charged.
The need to reduce waiting times and prevent bed block through the provision of
adequate staffing levels, resources and education of the public about the realities of a
modern ED also were reported. However since waiting times are inevitable in the
present system strategies were recommended to manage patients accordingly, for
example improved communication and training. One such strategy discussed was
the fast tracking of high risk groups of patients, for example those with a mental
health diagnosis (Benveniste et al., 2005).
360

6.8 Similarities and difference between regions
The comparison of findings from Part I of the study across geographic regions
identified similarities in the experiences of ED nurses with patient-related violence
between metropolitan and regional areas across many areas. At the same time
differences also were identified that demonstrated that while nurses in both
geographic locations had similar experiences in terms of the frequency and types of
violence encountered; the support mechanisms in place to deal with and/or prevent
such violence from occurring were often lacking.
6.8.1 Similarities
A number of similarities were identified in the experiences of regional and
metropolitan ED nurses with patient-related violence, as shown below.
• Point prevalence of violence; • Increasing frequency of episodes; • Types of violence encountered: verbal and physical; • Types of verbal abuse (with the exception of threatening comments
and unjustified criticism) • Types of physical violence (with the exception of scratching); • Sustained a physical and/or psychological injuries; • Time taken off work following an episode of violence; • Emotional impact; • Professional impact; • No changes implemented after an episode of violence; • Nursing manner/attitude as a contributing factor; • Types of barriers to reporting; • Informal reporting methods favoured; • Lack of refresher programs for AM training; • Types of significant patient-specific behaviours as antecedents; • Types of significant staffing issues as antecedents.
361

6.8.2 Differences
A number of differences were identified between metropolitan and regional areas,
and many related to the availability and perceived effectiveness of risk
prevention/management strategies to prevent episodes of patient-related violence
from occurring.
• Two types of verbal abuse more common in metropolitan areas, including o Threatening comments; o Unjustified criticism.
• One type of physical behaviour: scratching, more common in metropolitan areas. • The availability of risk prevention/minimisation measures: nurses in metropolitan
areas reported greater: - o Access to training; o Availability of restraints and policies for their use; o Security personnel based in the department; o Clear policies for the management of aggression.
• Nurses in regional areas were more likely to perceive policies as ineffective. • AM training was more commonly available in metropolitan locations. • Risk management follow-up strategies: three strategies more common in
metropolitan areas:- o Investigating reported episodes – prompt follow-up and feedback; o Staff counselling services; o Rotating staff in high risk areas, for example triage.
• Violence from patients aged less than 16 years of age was found to be more common in metropolitan areas.
• More perpetrators from Triage Category 2, in metropolitan areas. • The clinical diagnoses of delirium, cognitive dysfunction and paediatric emergency
as antecedents were found to be more common in metropolitan areas. • The patient-specific factor: “cultural issues” as an antecedent was more common in
metropolitan areas. • Two nursing activities more common in metropolitan areas as antecedents:
o Giving oral medications; o Restraining patients.
• Two areas of the ED more common in metropolitan areas as antecedents: o Resuscitation room; o Corridors.
• ED-specific precipitant: over-crowding more common in metropolitan. • Nurses in regional areas more likely to report feeling “not safe”.
362

These findings suggest that while ED nurses in regional areas experienced the same
levels of violence, they felt less supported than their metropolitan counterparts by
risk prevention/management strategies. As a result regional nurses were more likely
to report feeling unsafe at work compared to their colleagues in metropolitan areas.
6.9 Similarities between Part I and Part II of the study
There were a number of similarities identified between the two parts of the study
that serve to underscore the impact and importance of these findings.
No significant differences were identified between Part I and Part II of this study.
6.10 Study limitations
This study had a large sample size that was representative of ED nurses in Australia,
in terms of age, years of experience and work fraction. While the response rate of
51% was higher than for many similar studies, the results may not be generalisable to
the ED nursing profession in Australia. In addition there is a potential for non-
• High rates of verbal abuse experienced. • Types of violence: verbal abuse and physical violence. • Perception that patient-related violence was an inevitable or a
somewhat inevitable part of the job. • Perception that the frequency of patient-related violence had
increased over the course of their careers. • Antecedents of:
o Parental emotions; o Alcohol and substance abuse.
• Opportunistic use of hospital equipment as weapons - more common than the use of traditional weapons.
• Feeling unsafe at work. • Patient-specific behaviours as warning signs for impending
violence. • Parents of paediatric patients as a risk group for violence. • Performing and attention seeking behaviours. • Fast tracking of patients.
363
response bias and self-selection bias. Under-reporting may be an issue which is
consistent with previously reported studies, however is expected to be better than
the reporting rates based on routine monitoring and voluntary reporting of violent
episodes in healthcare organisations. A retrospective approach was utilised in the
study and involved respondents reporting data for a period of six months prior to
completing the questionnaire. This approach might be subject to recall bias and
associated under-reporting however it is considered to be unlikely to substantially
affect the results and is a limitation of many similar studies with which the current
study has been compared.
Due to the large number of statistical computations performed the study was at
significant risk of a type I error. A type I error occurs when an effect is detected
erroneously where one is not present. In this study a 95% confidence level was used,
which corresponds to an alpha value of 0.05. This means that there was a 5%
probability that an erroneous effect was detected. (Antonius, 2003).
364
Conclusion
Patient-related violence against ED nurses is a significant workplace hazard. Within
this context, this study has identified triaging as the highest risk activity and the
triage area itself as the highest risk location for patient-related violence. While a
number of antecedents have been discussed in the literature, alcohol intoxication and
substance misuse emerged as the most significant risk factors in this study. The
impact of patient-related violence on nurses was multi-factorial, and extended
beyond the nurses themselves, to their employers and the patients in their care.
There are similarities and differences evident in the experiences of nurses working in
metropolitan and regional EDs. While the experiences of ED nurses with violence
appear to be similar across geographic locations, these findings suggest that regional
nurses are less supported by both risk prevention and subsequent risk management
strategies. This was compounded by the fact that regional nurses were more likely to
feel unsafe at work compared to those working in metropolitan areas.
Training should be viewed as a valuable violence prevention strategy. However
despite the mandatory requirements in state-based policies for routine aggression
minimisation training, availability of and access to training was inconsistent. For
example almost a quarter of nurses had never completed training and the majority
had not completed regular refresher programs.
The findings of this study demonstrate that violence is a significant workplace
concern for Australian ED nurses that is being dealt with inadequately by existing
violence prevention and management strategies. In addition inequities that exist
between metropolitan and regional areas should be addressed to ensure that all ED
nurses are supported and protected against the impact of patient-related violence in
the workplace. Violence should no longer be shrugged off as either an expected or
365

accepted part of ED nursing, but recognised as the legitimate and very serious
workplace hazard that it is.
366
Recommendations
Future research
• Inequities have been identified between ED nurses working in metropolitan
and regional areas and strategies should be developed to rectify these;
• Research to evaluate the effectiveness of violence prevention strategies and
aggression minimisation training programs;
• Research to determine the impact of violence on other patients.
Policy
• Mandatory requirements embedded in policies should be enforced;
• Policies surrounding violence should be readily available and their contents
widely disseminated;
• Zero Tolerance policies should be re-visited to assess their feasibility in the ED
environment;
• There should be explicit consequences for those who perpetrate violence
against ED nurses and these should be enforced. For example staff should be
supported to pursue legal avenues where offenders would be charged with
assault/battery; and adoption of client management plans for frequent
offenders;
• Inequities between metropolitan and regional areas should be addressed.
Workplace management
• All layers of management should be available and accessible to ED nurses to
discuss issues associated with patient-related violence;
• ED nurses should be actively supported following exposure to episodes of
patient-related violence. For example support should include help completing
the report, quick and easy access to debriefing and counselling services,
367
treatment of any physical or psychological injury sustained and encouraged to
take time off work if it is considered desirable;
• Reporting of episodes of violence should be encouraged to enable an accurate
record of patient-related violence to emerge;
• Barriers to reporting should be removed to facilitate the reporting of all
episodes of violence. For example the reporting process should be streamlined
to be quicker and easier for staff to use and staff should be allocated time to
complete reports, and not be asked to do this on their own time;
• Priority should be given to reporting more serious/higher level episodes of
violence, for example where nurses perceive a threat or person to be
dangerous to themselves or others (including but not limited to persons using
weapons), or where an injury has been sustained;
• Feedback following episodes of violence should be prompt and exist in a no-
blame/non-punitive culture;
• ED nurses should be consulted about violence prevention and management
strategies;
• Fast-tracking should be viewed as a potential strategy in the management of
patients at risk of violence. While this is not an ideal situation and can be seen
as “rewarding” violent behaviour, it can be used in some situations to protect
patients and staff from potentially violent patients, where their presence in the
waiting room is likely to result in escalation of violent behaviours. This
approach should be considered for use in combination with other strategies
such as isolation and subsequent limited access to the ED;
• Limited access policies should be used for known perpetrators of aggression
and violence towards ED staff, for example refusal of care at the discretion of
triage nurse;
• Limits should be placed on the number of people accompanying patients to
the ED to prevent attention-seeking behaviours from high-risk patients. Two
368
visitors are recommended however this could be reduced to one, or even a
ban on visitors where violent behaviour is being exhibited and/or the
accompanying people are under the influence of alcohol or illicit drugs.
However for people presenting with associated dementia who may display
resistance to care behaviours, the presence of a carer can significantly relieve
their distress and confusion; and they can often contribute useful information
about the person’s behaviour and how to interpret it;
• Where possible the use of single or isolation rooms should be used to remove
at-risk patients, for example those with alcohol intoxication, from the busy
environment of the ED. This means not only removal from the waiting room
but also from the main area of the ED. Use of, and provision of, seclusion
rooms in ED is recommended for this purpose;
• Patients with mental health diagnoses should be prioritised and receive rapid
triage and transfer to a designated mental health area with specialist staff.
Workplace education
• Aggression minimisation training should be made accessible to all ED nurses
regardless of their geographic location;
• Training should be viewed as a valuable violence prevention strategy as
demonstrated by the evidence on the topic;
• Recognition of cues and warning signs of escalating violence should be
embedded in the training. For example patients exhibiting STAMPEDAR
behaviours should be allocated to more experienced staff and de-escalation
techniques employed to manage their behaviours, or use of fast-tracking or
seclusion rooms as described above;
• The ability to manage patients who present with alcohol intoxication and/or
substance misuse should be prioritised;
• The ability to manage patients who present with mental health issues should
be addressed through the provision of Mental Health First Aid Training;
369
• Mandatory requirements with regards to training should be enforced;
• Training programs should emphasise de-escalation strategies to prevent and
minimise episodes. This should be viewed as a proactive approach to avoid
the need for seclusion and restraint and physical or coercive responses to
aggression and violence. They should also emphasise safe egress and safety
for others, including patients and those accompanying them, in the ED
waiting room.
370
Reference list
ABC News. (2013, 14 January). New laws to crack down on hospital violence, ABC News.
Akerstrom, M. (1997). Waiting: A Source of Hostile Interaction in an Emergency Clinic. Qualitative Health Research, 7(4), 504-520.
Alaf, S., & Sheppard, L. A. (2007). Nixing research methods in health professional degrees: Thoughts for undergraduate students and supervisors. The Qualitative Report, 12(2), 184-192.
American Nurses’ Association. (2001). Nurses cite stress, overwork as top health, safety concern. The Online Journal of issues in Nursing, 33(5), 1.
Anderson, L., FitzGerald, M., & Luck, L. (2009). An integrative literature review of interventions to reduce violence against emergency department nurses. Journal of Clinical Nursing, 19, 2520-2530.
Anonymous. (2012). Sip carefully: editorial. Nature Neuroscience, 15(4), 497.
Antonius, R. (2003). Interpreting quantitative data with SPSS. London, England: SAGE Publications Ltd.
Arnetz, J. E., & Arnetz, B. B. (2001). Violence towards health care staff and possible effects on the quality of patient care. Social Science & Medicine, 52(3), 417-427.
Arthur, T., & Bain, E. I. (2002). Workplace violence and chemical exposure: a 73-year-old CVA patient assaults nurses with a fire extinguisher. Journal of Emergency Nursing, 28(6), 484-488.
ASIS Healthcare Security Council. (2011). Managing disruptive behavior and workplace violence in healthcare. Alexandria, VA.
Astrom, S., Karlsson, S., Sandvide, A., Bucht, G., Eisemann, M., Norberg, A., & Saveman, B. I. (2004). Staff's experience of and the management of violent incidents in elderly care. Scandinavian Journal of Caring Science, 18(4), 410-416.
Atawneh, F. A., Zahid, M. A., Al-Sahlawi, K. S., Shahid, A. A., & Al-Farrah, M. H. (2003). Violence against nurses in hospitals: prevalence and effects. British Journal of Nursing, 12(2), 102-107.
Australian Bureau of Statistics. (2013). Australian Social Trends. Canberra: Retrieved from http://www.abs.gov.au/AUSSTATS/[email protected]/Lookup/4102.0Main+Features20April+2013.
371
Australian Health Workforce Advisory Committee. (2006). Health workforce planning and emergency care model of care. Sydney: AHWAC.
Australian Institute of Health and Welfare. (2011). 2010 National Drug Strategy Household Survey Report. Canberra, Australia: AIHW.
Australian Institute of Health and Welfare. (2012). Australian hospital statistics 2011-2012: emergency department care Health Services Series (Vol. Number 45). Canberra, ACT: AIHW.
Ayranci, U. (2005). Violence toward health care workers in emergency departments in west Turkey. Journal of Emergency Medicine, 28(3), 361-365.
Badger, F., & Mullan, B. (2004). Aggressive and violent incidents: perceptions of training and support among staff caring for older people and people with head injury. Journal of Clinical Nursing, 13(4), 526-533.
Bandura, A. (1973). Aggression: A social learning analysis. New Jersey: Prentice-Hall Inc.
Bandura, A. (1977). Social Learning Theory. New Jersey: Prentice Hall Inc.
Benveniste, K. A., Hibbert, P. D., & Runciman, W. B. (2005). Violence in health care: the contribution of the Australian Patient Safety Foundation to incident monitoring and analysis. Medical Journal of Australia, 183(7), 348-351.
Bond, P., Paniagua, H., & Thompson, A. (2009). Zero tolerance of violent patients: policy in action. Practice Nursing, 20(2), 97-99.
Bonner, G., & McLaughlin, S. (2007). The psychological impact of aggression on nursing staff. British Journal of Nursing, 16(13), 810-814.
Boyatzis, R. E. (1998). Transforming qualitative information. Thousand Oaks, CA: Sage Publications Inc.
Braun, V., & Clarke, V. (2006). Using thematic analysis in psychology. Qualitative Research in Psychology, 3(2), 77-101.
Brookes, J. G., & Dunn, R. J. (1997). The incidence, severity and nature of violent incidents in the emergency department. Emergency Medicine, 9, 5-9.
Bryman, A. (2004). Mixed method studies: A foundation for primary care research. Annals of Family Medicine, 2(1), 4-6.
Buckley, P. (2013). Violence at work: Findings from the British Crime Survey 2011/12 (England and Wales).
Bureau of Labor Statistics. (2010). Cases and demograpic characteristics for work-related injuries and illnesses involving days away from work. Washington D.C.: U.S.
372

Bureau of Labor Statistics Retrieved from www.bls.gov/iif/oshwc/osh/case/ostb2833.pdf.
Bushnell, D. M., Martin, M. L., & Parasuraman, B. (2003). Electronic versus paper questionnaires: a further comparison in persons with asthma. Journal of Asthma, 40(7), 751-762.
Camerino, D., Estryn-Behar, M., Conway, P. M., van Der Heijden, B. I., & Hasselhorn, H. M. (2008). Work-related factors and violence among nursing staff in the European NEXT study: a longitudinal cohort study. International Journal of Nursing Studies, 45(1), 35-50.
Catlette, M. (2005). A descriptive study of the perceptions of workplace violence and safety strategies of nurses working in level I trauma centers. Journal of Emergency Nursing, 31(6), 519-525.
Cembrowicz, S. P., & Shepherd, J. P. (1992). Violence in the Accident and Emergency Department. Medicine, Science, Law, 32(2), 118-122.
Chapman, R., Perry, L., Styles, I., & Combs, S. (2009). Predicting patient aggression against nurses in all hospital areas. British Journal of Nursing, 18(8), 476, 478-483.
Chapman, R., & Styles, I. (2006). An epidemic of abuse and violence: nurse on the front line. Accident & Emergency Nursing, 14(4), 245-249.
Chapman, R., Styles, I., Perry, L., & Combs, S. (2010). Examining the characteristics of workplace violence in one non-tertiary hospital. Journal of Clinical Nursing, 19(3-4), 479-488.
Chikritzhs, T., & Pascal, R. (2004). Trends in Youth Alcohol Consumption and Related Harms in Australian Jurisdictions, 1990–2002. National Alcohol Indicators, Bulletin no. 6. Perth, Western Australia: Curtin University of Technology, National Drug Research Institute.
Concise Oxford English Dictionary. (2012) (12th ed.). Oxford, England.: Oxford University Press.
Connelly, L. M. (2009). Mixed method studies. MEDSURG Nursing, 18(1), 31-32.
Coughlin, S. S. (1990). Recall bias in epidemiologic studies. Journal of Clinical Epidemiology, 43(1), 87-91.
Coyne, I. T. (1997). Sampling in qualitative research. Purposeful and theoretical sampling; merging or clear boundaries? Journal of Advanced Nursing, 26, 623-630.
373

Creswell, J. W., & Plano-Clark, V. (2007). Designing and conducting mixed methods research. Thousand Oaks, CA: Sage.
Crilly, J., Chaboyer, W., & Creedy, D. (2004). Violence towards emergency department nurses by patients. Accident & Emergency Nursing, 12(2), 67-73.
Crowley, J. J. (2000). A clash of cultures: A&E and mental health. Accident & Emergency Nursing, 8(1), 2-8.
Dalphond, D., Gessner, M., Giblin, E., Hijazzi, K., & Love, C. (2000). Violence against emergency nurses. Journal of Emergency Nursing, 26(2), 105-111.
Deans, C. (2004). The effectiveness of a training program for emergency department nurses in managing violent situations. Australian Journal of Advanced Nursing, 21(4), 17-22.
Descallar, J., Muscatello, D. J., Weatherburn, D., Chu, M., & Moffatt, S. (2012). The association between the incidence of emergency department attendances for alcohol problems and assault incidents attended by police in New South Wales, Australia, 2003-2008: a time-series analysis. Addiction, 107(3), 549-556.
Design Council. (2011). Reducing Violence & Aggression in A & E: Through a Better Experience. London, UK: Design Council.
Design Council. (2014). Improving patient experience in A & E. London, UK: Design Council.
Dimond, B. (1994). Violence in the Accident and Emergency department. Accident & Emergency Nursing, 2, 174-176.
Doherty, L. (2007). Victims of violence told to call police immediately after incident. Nursing Standard, 21(49), 11-11.
Doherty, S., & Roche, A. M. (2003). Alcohol and Licensed Premises: best practice in policing. Payneham, South Australia: Australasian Centre for Policing Research.
Donnelly, C. (2006). Tackling violence head on. Emergency Nurse, 13(10), 5.
Doody, L. (1995). Risks of workplace violence for nurses. Chart, 92(4), 4-6.
Dragon, N. (2006). Pressure rising against violence. Australian Nursing Journal, 14(5), 21-24.
Duhart, D. T. (2001). Violence in the workplace, 1993-1999. Washingtom: US Department of Justice Retrieved from http://www.bjs.gov/content/pub/pdf/vw99.pdf.
374

Duxbury, J., & Whittington, R. (2005). Causes and management of patient aggression and violence: staff and patient perspectives. Journal of Advanced Nursing, 50(5), 469-478.
Early, M. R., & Hubbert, A. O. (2006). Violence in the Emergency Department: A culture care perspective. Theoria, Journal of Nursing Theory, 15(3), 3-10.
Ely, M., Vinz, R., Downing, M., & Anzul, M. (2004). On writing qualitative research. Philadelphia, PA: Routledge Falmer.
Emergency Care Institute NSW. (2013). Clinical Initiative Nurse. Retrieved 1 October, 2013, from http://www.ecinsw.com.au/CIN
Emergency Nurses' Association. (2011). Emergency Department Violence Surveillance Study (Vol. November 2011). Des Plaines, IL: Institute for Emergency Nursing Research.
Emergency Nurses' Association. (2012). House Bill 62.
Erickson, L., & Williams-Evans, S. A. (2000). Attitudes of emergency nurses regarding patient assaults. Journal of Emergency Nursing, 26(3), 210-215.
Esmaeilpour, M., Salsali, M., & Ahmadi, F. (2011). Workplace violence against Iranian nurses working in emergency departments. International Nursing Review, 58(1), 130-137.
Estryn-Behar, M., van der Heijden, B., Camerino, D., Fry, C., Le Nezet, O., Conway, P. M., & Hasselhorn, H. M. (2008). Violence risks in nursing--results from the European 'NEXT' Study. Occupational Medicine, 58(2), 107-114.
Evans, B. C., Coon, D. W., & Ume, E. (2011). Use of theoretical frameworks as a pragmatic guide for mixed method studies: A methodological necessity? Journal of Mixed Methods Research, 5(4), 276-292.
Farrell, G. A., Bobrowski, C., & Bobrowski, P. (2006). Scoping workplace aggression in nursing: findings from an Australian study. Journal of Advanced Nursing, 55(6), 778-787.
Fernandes, C. M., Bouthillette, F., Raboud, J. M., Bullock, L., Moore, C. F., Christenson, J. M., & al, e. (1999). Violence in the emergency department: a survey of health care workers. Canadian Medical Association Journal, 161(10), 1245-1248.
Ferns, T. (2005a). Terminology, stereotypes and aggressive dynamics in the accident and emergency department. Accident & Emergency Nursing, 13(4), 238-246.
Ferns, T. (2005b). Violence in the accident and emergency department--an international perspective. Accident & Emergency Nursing, 13(3), 180-185.
375

Ferns, T. (2006). Under-reporting of violent incidents against nursing staff. Nursing Standard, 20(40), 41-45.
Ferns, T. (2012). Recording violent incidents in the emergency department. Nursing Standard, 26(28), 40-48.
Ferns, T., Cork, A., & Rew, M. (2005). Personal safety in the accident and emergency department. Accident & Emergency Nursing, 14(13), 725-730.
Ferns, T., & Meerabeau, L. (2008). Verbal abuse experienced by nursing students. Journal of Advanced Nursing, 61(4), 436-444.
Ferns, T., Stacey, C., & Cork, A. (2006). Violence and aggression in the emergency department: factors impinging on nursing research. Accident & Emergency Nursing, 14(1), 49-55.
Findorff, M. J., McGovern, P. M., Wall, M. M., & Gerberich, S. G. (2005). Reporting violence to a health care employer: a cross-sectional study. AAOHN Journal, 53(9), 399-406.
Fisher, B. S., & Gunnison, E. (2001). Violence in the workplace: Gender similarities and differences. Journal of Criminal Justice, 29, 145-155.
Flannery, R. B., & Everly, G. S. (2000). Crisis intervention: A review. International Journal of Emergency Mental Health, 2(2), 119-125.
Forrester, K. (2002). Aggression and assault against nurses in the workplace: practice and legal issues. Journal of Law & Medicine, 9(4), 386-391.
Forster, J. A., Petty, M. T., Schleiger, C., & Walters, H. C. (2005). kNOw workplace violence: developing programs for managing the risk of aggression in the health care setting. Medical Journal of Australia, 183, 357-361.
Friedman, R. A. (2006). Violence and mental illness--how strong is the link? New England Journal of Medicine, 355(20), 2064-2066.
Gacki-Smith, J., Juarez, A. M., Boyett, L., Homeyer, C., Robinson, L., & MacLean, S. L. (2009). Violence against nurses working in US emergency departments. Journal of Nursing Administration, 39(7-8), 340-349.
Gallant-Roman, M. A. (2008). Strategies and tools to reduce workplace violence. AAOHN Journal, 56(11), 449-454.
Garling, P. (2008). Final report of the Special Commission of Inquiry: Acute care services in NSW Public Hospitals. Sydney, NSW Australia: NSW Government.
376
Gates, D., Gillespie, G., Smith, C., Rode, J., Kowalenko, T., & Smith, B. (2011a). Using action research to plan a violence prevention program for emergency departments. Journal of Emergency Nursing, 37(1), 32-39.
Gates, D., Gillespie, G. L., & Succop, P. (2011b). Violence against nurses and its impact on stress and productivity. Nursing Economics, 29(2), 59-66.
Gates, D. M., Ross, C. S., & McQueen, L. (2006). Violence against emergency department workers. Journal of Emergency Medicine, 31(3), 331-337.
Gerberich, S. G., Church, T. R., McGovern, P. M., Hansen, H. E., Nachreiner, N. M., Geisser, M. S., . . . Watt, G. D. (2004). An epidemiological study of the magnitude and consequences of work related violence: the Minnesota Nurses' Study. Occupational and Environmental Medicine, 61(6), 495-503.
Gibson, M. (1997). Differntiating aggressive and resistive behaviors in long-term care. Journal of Gerontological Nursing, 23(4), 21-28.
Gillespie, G. L., & Fisher, B. S. (2014). Healthcare employees work-related victimization and use of preventative measures. Journal of Hospital Administration, 3(5), 170-181.
Gillespie, G. L., Gates, D. M., & Berry, P. (2013). Stressful incidents of physical violence against emergency nurses. Online Journal of Issues in Nursing, 18(1), 2.
Gillespie, G. L., Gates, D. M., Miller, M., & Howard, P. K. (2010). Violence against healthcare workers in a pediatric Emergency Department. Advanced Emergency Nursing Journal, 32(1), 68-82.
Gillies, D., & O'Brien, L. (2006). Interpersonal violence and mental illness: a literature review. Contemporary Nurse, 21(2), 277-286.
Goldstein, M. K. (2013). Proponent testimony. In E. N. A. M. S. Council (Ed.): Michigan Judiciary Committee on Criminal Justice.
Gordis, L. (2004). Epidemiology (3rd ed.). Philadelphia: Elsevier Saunders.
Graham, K., & Wells, S. (2003). Somebody’s gonna get their head kicked in tonight! Aggression among young males in bars – a question of values? . British Journal of Criminology, 43(3), 546-566.
Greene, J. (2008). Violence in the ED: No quick fixes for pervasive threat. Annals of Emergency Medicine, 52(1), 17-19.
Guba, E. G. (1981). Criteria for addressing the trustworthiness of naturalistic inquiries. Educational Communication and Technology Journal, 29, 75-91.
377

Haber, J. (1994). Sampling. In G. LoBiondo-Wood & J. Haber (Eds.), Nursing Research (3rd ed., pp. 286-312). St Louis, Missouri: Mosby.
Haberkern, M., Exadaktylos, A. K., & Marty, H. (2010). Alcohol intoxication at a university hospital acute medicine unit—with special consideration of young adults: an 8-year observational study from Switzerland. Emergency Medical Journal, 27(3), 199-202.
Haddon, W. (1980). Advances in the epidemiology of injuries as a basis for public policy. Public Health Rep, 95(5), 411-421.
Halcomb, E. J., & Andrew, S. (2009). Practical considerations for higher degree research students undertaking mixed methods projects. International Journal Of Multiple Research Approaches, 3(2), 153-162.
Hasani, A., Zaheri, M. M., Abbasi, M., ASaeedi, H., Hosseini, M., & Fathi, M. (2010). Incidence rate of phsyical and verbal violence inflicted by patients and their companions on the emergency department staff of Hazrate-e-Rasoul Hospital in the fourth trimester of the year 1385 [Farsi]. Journal of Iran University Medical Sciences, 16(67), 51.
Hassan, E. (2006). Recall Bias can be a Threat to Retrospective and Prospective Research Designs. The Internet Journal of Epidemiology, 3(2). doi:10.5580/2732
Hastings, R. P., & Brown, T. (2002). Behavioural knowledge, causal beliefs and self-efficacy as predictors of special educators' emotional reactions to challenging behaviours. Journal of Intellectual Disability Research, 46(Pt 2), 144-150.
Health Workforce Australia. (2013). Australia's Health Workforce Series: Nurses in focus. Adelaide: HWA.
Healy, S., & Tyrell, M. P. (2011). Stress in emergency department: experiences of nurses and doctors. Emergency Nurse, 19(4), 31-42.
Hegney, D., Eley, R., Plank, A., Buikstra, E., & Parker, V. (2006). Workplace violence in Queensland, Australia: the results of a comparative study. International Journal of Nursing Practice, 12(4), 220-231.
Hegney, D., Plank, A., & Parker, V. (2003). Workplace violence in nursing in Queensland, Australia: a self-reported study. International Journal of Nursing Practice, 9(4), 261-268.
Hilliar, K. (2008). Police-recorded assaults on hospital premises in New South Wales: 1996-2006. Crime and Justice Bulletin, 116, 1-12.
Hills, D., Joyce, C. M., & Humphreys, J. S. (2012). A narional study of workplace aggression in Australian clinical medical practice. Medical Journal of Australia, 197(6), 336-340.
378
Hislop, E., & Melby, V. (2003). The lived experience of violence in accident and emergency. Accident and Emergency Nursing, 11(1), 5-11.
Hodge, A. N., & Marshall, A. P. (2007). Violence and aggression in the emergency department: A critical care perspective. Australian Critical Care, 20, 61-67.
Holleran, R. S. (2006). Preventing staff injuries from violence. Journal of Emergency Nursing, 32(6), 523-524.
Holmes, C. A. (2006). Violence, zero tolerance and the subversion of professional practice. Contemporary Nurse, 21(2), 212-227. doi: 10.5555/conu.2006.21.2.212
Howerton Child, R. J., & Mentes, J. C. (2010). Violence against women: the phenomenon of workplace violence against nurses. Issues in Mental Health Nursing, 31(2), 89-95.
Hunter, M., & Carmel, H. (1992). The cost of staff injuries from inpatient violence. Hospital & Community Psychiatry, 43(6), 586-588.
Hure, A. J., Smith, R., & Collins, C. E. (2008). A recruiting failure turned success. BMC Health Services Research, 8(64), 1472-6963.
Income Data Services. (1990). Violence Against Staff. London: Income Data Services.
International Council of Nurses. (2006). Position Statement: Abuse and violence against nursing personnel. Retrieved from http://www.icn.ch/images/stories/documents/publications/position_statements/C01_Abuse_Violence_Nsg_Personnel.pdf.
International Council of Nurses. (2009). Violence: a worldwide epidemic. Nursing Matters.
Jackson, D., Clare, J., & Mannix, J. (2002). Who would want to be a nurse? Violence in the workplace--a factor in recruitment and retention. Journal of Nursing Management, 10(1), 13-20.
Jackson, D., Hutchinson, M., Luck, L., & Wilkes, L. (2013). Mosaic of verbal abuse experiences by nurses in their everyday work. Journal of Advanced Nursing. doi:10.1111/jan.12074
James, A., Madeley, R., & Dove, A. (2006). Violence and aggression in the emergency department. Emergency Medicine Journal, 23(6), 431-434.
Jansen, G. J., Dassen, T. W., & Groot Jebbink, G. (2005). Staff attitudes towards aggression in health care: a review of the literature. Journal of Psychiatric and Mental Health Nursing, 12(1), 3-13.
379
Jenkins, M. G., Rocke, L. G., McNicholl, B. P., & Hughes, D. M. (1998). Violence and verbal abuse against staff in accident and emergency departments: a survey of consultants in the UK and the Republic of Ireland. Journal of Accident & Emergency Medicine, 15(4), 262-265.
Johnson, R. B., & Onwuegbuzie, A. J. (2004). Mixed Methods Research: A Research Paradigm Whose Time Has Come. Educational Researcher, 33(7), 14-26. doi: 10.3102/0013189x033007014
Johnson, R. B., Onwuegbuzie, A. J., & Turner, L. A. (2007). Toward a definition of mixed methods research. Journal of Mixed Methods Research, 1(2), 112-133.
Johnson, R. B., & Turner, L. A. (2003). Data collection strategies in mixed methods research. In A. Tashakkori & C. Teddlie (Eds.), Handbook of mixed methods in social and behavioral research (pp. 297-319). Thousand Oaks, CA: Sage.
Joint Programme on Workplace Violence in the Health Sector. (2003). Workplace violence in the health sector country case studies research instruments: Survey questionnaire english. Geneva.
Jones, J., & Lyneham, J. (2000). Violence: part of the job for Australian nurses? Australian Journal of Advanced Nursing, 18(2), 27-32.
Judy, K., & Veselik, J. (2009). Exposure to workplace violence: a survey of pediatric residents. Occupational Medicine, 59(7), 472-475.
Kable, A., Guest, M., & McLeod, M. (2012a). Organizational risk management of resistance to care episodes in health facilities. Journal of Advanced Nursing, 68(9), 1933-1943.
Kable, A., Guest, M., & McLeod, M. (2012b). Resistance to Care: contributing factors and associated behaviours in healthcare facilities. Journal of Advanced Nursing, 31(10), 12035.
Kansagra, S. M., Rao, S. R., Sullivan, A. F., Gordon, J. A., Magid, D. J., Kaushal, R., . . . Blumenthal, D. (2008). A survey of workplace violence across 65 U.S. emergency departments. Academic Emergency Medicine, 15(12), 1268-1274.
Keely, B. R. (2002). Recognition and prevention of hospital violence. Dimensions of Critical Care Nursing, 21(6), 236-241.
Keep, N. B., & Gilbert, C. P. (1997). Triage: Gateway to the Emergency Department and violence. Topics in Emergency Medicine, 19(2), 55-63.
Kelen, G. D., Catlett, C. L., Kubit, J. G., & Hsieh, Y. H. (2012). Hospital-based shootings in the United States: 2000 to 2011. Annals of Emergency Medicine, 60(6), 790-798.
380

Kennedy, M. P. (2005). Violence in emergency departments: under-reported, unconstrained, and unconscionable. Medical Journal of Australia, 183(7), 362-365.
Keough, V. A., Schlomer, R. S., & Bollenberg, B. W. (2003). Serendipitous findings from an Illinois ED nursing educational survey reflect a crisis in emergency nursing. Journal of Emergency Nursing, 29(1), 17-22.
Kinkle, S. L. (1993). Violence in the ED: How to stop it before it starts. The American Journal of Nursing, 93(7), 22-24.
Kisa, S. (2008). Turkish nurses' experiences of verbal abuse at work. Archives of Psychiatric Nursing, 22(4), 200-207.
Kitchener, B., Jorm, A., & Kelly, C. (2010). Mental Health First Aid Manual, 2nd ed. Melbourne, Australia: Orygen Youth Health Research Centre.
Knight, D. (2004). Incident reporting: Every nurse's responsibility. Paediatric Nursing, 16(1), 23-27.
Kowalenko, T., Walters, B. L., Khare, R. K., & Compton, S. (2005). Workplace violence: a survey of emergency physicians in the state of Michigan. Annals of Emergency Medicine, 46, 142-147.
Kwek, G. (2011). Nurse stabbed with butter knife: hospital security to be reviewed, Sydney Morning Herald.
Kwok, R. P., Law, Y. K., Li, K. E., Ng, Y. C., Cheung, M. H., Fung, V. K., . . . Leung, W. C. (2006). Prevalence of workplace violence against nurses in Hong Kong. Hong Kong Med J, 12(1), 6-9.
Lange, J. T., Lange, C. L., & Cabaltica, R. B. (2000). Primary care treatment of post-traumatic stress disorder. American Family Physician, 62(5), 1035-1040.
Lanza, M. L. (1983). The reactions of nursing staff to physical assault by a patient. Hospital and Community Psychiatry, 34(1), 44-47.
Lanza, M. L., Zeiss, R. A., & Rierdan, J. (2006). Non-physical violence: a risk factor for physical violence in health care settings. AAOHN Journal, 54(9), 397-402.
Lau, J., Magarey, J., & McCutcheon, H. (2004). Violence in the ED: A literature review. Australasian Emergency Nursing Journal, 7(2), 27-37.
Lau, J. B., Magarey, J., & Wiechula, R. (2012a). Violence in the emergency department: an ethnographic study (part I). International Emergency Nursing, 20(2), 69-75.
381

Lau, J. B., Magarey, J., & Wiechula, R. (2012b). Violence in the emergency department: an ethnographic study (part II). International Emergency Nursing, 20(3), 126-132.
Lavoie, F. W., Carter, G. L., Danzl, D. F., & Berg, R. L. (1988). Emergency department violence in United States teaching hospitals. Annals of Emergency Medicine, 17(11), 1227-1233.
Lee, F. (2001). Violence in A&E: the role of training and self-efficacy. Nursing Standard, 15(46), 33-38.
Leedy, P. D. (1993). Practical research: planning and design (5th ed.). New York, New York: Macmillan Publishing Company.
Leininger, M. M. (1990). Ethnomethods: The philosophic and epistemic basis to explicate transcultural nursing knowledge. Journal of Transcultural Nursing, 1(2), 40-51.
Levin, P. F., Hewitt, J. B., & Misner, S. T. (1998). Insights of nurses about assault in hospital-based emergency departments. Image Journal of Nursing Scholarship, 30(3), 249-254.
Lincoln, Y. S., & Guba, E. G. (1985). Naturalistic Inquiry. Newbury Park, CA: Sage Publications Inc.
Liu, J., & Wuerker, A. (2005). Biosocial bases of aggressive and violent behavior--implications for nursing studies. International Journal of Nursing Studies, 42(2), 229-241. doi: 10.1016/j.ijnurstu.2004.06.007
Lloyd, B., Matthews, S., Livingston, M., & Jayasekara, H. (2011). Drinking cultures and social occasions: Alcohol harms in the context of major sporting events. Fitzroy, Australia: Turning Point Alcohol and Drug Centre.
Lloyd, B., Matthews, S., Livingston, M., Jayasekara, H., & Smith, K. (2013). Alcohol intoxication in the context of major public holidays, sporting and social events: a time-series analysis in Melbourne, Australia, 2000-2009. Addiction, 108(4), 701-709.
Luck, L., Jackson, D., & Usher, K. (2006). Survival of the fittest, or socially constructed phenomena? Theoretical understanding of aggression and violence towards nurses. Contemporary Nurse, 21(2), 251-263.
Luck, L., Jackson, D., & Usher, K. (2007). STAMP: components of observable behaviour that indicate potential for patient violence in emergency departments. Journal of Advanced Nursing, 59(1), 11-19.
382

Luck, L., Jackson, D., & Usher, K. (2008). Innocent or culpable? Meanings that emergency department nurses ascribe to individual acts of violence. Journal of Clinical Nursing, 17(8), 1071-1078.
Lynch, J., Appelboam, R., & McQuillan, P. J. (2003). Survey of abuse and violence by patients and relatives towards intensive care staff. Anaesthesia, 58(9), 893-899.
Lyneham, J. (2000). Violence in New South Wales emergency departments. Australian Journal of Advanced Nursing, 18(2), 8-17.
Lyneham, J. (2001). Workplace violence in New South Wales Emergency Departments. Australasian Emergency Nursing Journal, 4(1), 5-9.
MacKusick, C. I., & Minick, P. (2010). Why are nurses leaving? Findings from an initial qualitative study on nursing attrition. MEDSURG Nursing, 19(6), 335-340.
Maguire, J., & Ryan, D. (2007). Aggression and violence in mental health services: categorizing the experiences of Irish nurses. Journal of Psychiatric and Mental Health Nursing, 14(2), 120-127.
Mahoney, B. S. (1999). The extent, nature and response to victimization of emergency nurses in Pennsylvania. Journal of Emergency Nursing, 17, 282-294.
Markham, D., & Graudins, A. (2011). Characteristics of frequent emergency-department presenters to an Australian emergency medicine network. BMC Emergency Medicine, 11(21), 1-5.
Martindell, D. (2011). Survey of emergency department practices in Pennsylvania hospitals to protect patients and staff. Pennsylvania: Pennsylvania Patient Safety Advisory.
Martindell, D. (2012). Violence prevention training for ED staff. American Journal of Nursing, 112(9), 65-68.
Mason, M. (2010). Sample size and saturation in PhD studies using qualitative interviews. Qualitative Social Research, 11(3). Retrieved from http://www.qualitative-research.net/index.php/fqs/article/view/1428/3027 website:
May, D. D., & Grubbs, L. M. (2002). The extent, nature, and precipitating factors of nurse assault among three groups of registered nurses in a regional medical center. Journal of Emergency Nursing, 28(1), 11-17.
Mayer, B. W., Smith, F. B., & King, C. A. (1999). Factors associated with victimization of personnel in emergency departments. Journal of Emergency Nursing, 25(5), 361-365.
383

Mayhew, C., & Chappell, D. (2005). Violence in the workplace. Medical Journal of Australia, 183(7), 346-347.
McAdams, K., Russell, H., & Walukewicz, C. (2004). Ganstas - not in my hospital! Nursing, 34(9), 1-4.
McFall, G. P., & Milke, D. L. (2007). Preference of continuing care staff for electronic surveys. Canadian Journal of Nursing Research, 39(3), 167-180.
McGovern, P. M., Kochevar, L., Lohman, W., Zaidman, B., Gerberich, S. G., Nyman, J., & Findorff-Dennis, M. (2000). The cost of work-related physical assaults in Minnesota. Health Services Research, 35(3), 663-686.
McKinnon, B., & Cross, W. (2008). Occupational violence and assault in mental health nursing: a scoping project for a Victorian Mental Health Service. International Journal of Mental Health Nursing, 17(1), 9-17.
McPhaul, K. M., & Lipscomb, J. A. (2004). Workplace violence in health care: recognized but not regulated. The Online Journal of Issues in Nursing, 9(3), 7.
Merfield, E. (2003). How secure are Australian emergency departments? Emergency Medicine, 15(5-6), 468-474.
Miles, M. B., & Huberman, A. M. (1994). Qualitative data analysis: An expanded sourcebook. (2nd ed.). Thousand Oaks, CA: Sage Publications.
Milne, J., & Oberle, K. (2005). Enhancing rigor in qualitative description: A case study. Journal of Wound, Ostomy and Continence Nurses, 32(6), 413-420.
Morgan, D. L. (1998). Practical strategies for combining qualitative and quantitative methods: Applications to health research. Qualitative Health Research, 8(3), 362-376.
Morphet, J., Innes, K., Munro, I., O’Brien, A., Gaskin, C. J., Reed, F., & Kudinoff, T. (2012). Managing people with mental health presentations in emergency departments—A service exploration of the issues surrounding responsiveness from a mental health care consumer and carer perspective. Australasian Emergency Nursing Journal, 15(3), 148-155.
Morse, J. M. (1995). The significance of saturation. Qualitative Health Research, 5(2), 147-149.
Moser, J. (2008). Georgia nurse shot and killed while on duty. American Journal of Nursing, 108(5).
Murray, G., & Snyder, J. (1991). When staff are assaulted: A nursing consultation support service. Journal of Psychosocial Nursing, 29(7), 24-29.
384

Nachreiner, N. M., Gerberich, S. G., Ryan, A. D., & McGovern, P. M. (2007). Minnesota nurses' study: perceptions of violence and the work environment. Industrial Health, 45(5), 672-678.
National Committee on Violence. (1989). Violence in Australia. Canberra, Australia.
National Preventative Health Taskforce. (2010). Taking Preventative Action: a response to Australia: The Healthiest Country by 2020. Canberra, Australia: National Preventative Health Taskforce.
Needham, I., Abderhalden, C., Zeller, A., Dassen, T., Haug, H. J., Fischer, J. E., & Halfens, R. J. (2005). The effect of a training course on nursing students' attitudes toward, perceptions of, and confidence in managing patient aggression. Journal of Nursing Education, 44(9), 415-420.
Neergaard, M. A., Olesen, F., Andersen, R. S., & Sondergaard, J. (2009). Qualitative description - the poor cousin of health research? BMC Med Res Methodol, 9(52), 1471-2288.
NHS Foundation Trust. (2012). Witholding Treatment Procedure (procedure for manageing patients/public who are violent and/or abusive) - "Yellow and Red card procedures".
.
Nijman, H., Bowers, L., Oud, N., & Jansen, G. (2005). Psychiatric nurses' experiences with inpatient aggression. Aggressive Behavior, 31(3), 217-227. doi: 10.1002/ab.20038
Norquist, J. M., Girman, C., Fehnel, S., DeMuro-Mercon, C., & Santanello, N. (2012). Choice of recall period for patient-reported outcome (PRO) measures: criteria for consideration. Quality of Life Research, 21(6), 1013-1020.
Norwood, S. (2000). Research strategies for advanced practice nurses. Upper Saddle River, NJ: Prentice-Hall.
NSW Department of Health, C. f. M. H. (2002). Memorandum of Understanding between NSW Police and NSW Health. Sydney: NSW.
NSW Health. (2003). Zero Tolerance: Response to violence in the NSW Health workplace. North Sydney, NSW Australia: NSW Department of Health.
NSW Health. (2012). Violence Prevention & Management Training Framework for the NSW Public Health System. North Sydney, New South Wales: NSW Health.
NSW Health. (2013). Hospital triage. North Sydney, New South Wales: NSW Health.
385

Nursing & Midwifery Board of Australia. (2014). Nurse and Midwife Registrant Data: March 2014 (pp. 1-7). Melbourne, Victoria: Nursing & Midwifery Board of Australia.
Ogundipe, O. K., Aladesanmi, T., Adigun, A. I., Taiwo, O., Etonyeaku, A. C., Ojo, O. E., & Obimakinde, S. O. (2010). VIolence in the emergency department: a multicentre survey of nurses' perceptions. Injury Prevention, 16(supp 1), A26.
Oliver, P. (2006). Purposive sampling. London, England.: SAGE Publications Ltd.
Oostrom, J. K., & van Mierlo, H. (2008). An evaluation of an aggression management training program to cope with workplace violence in the healthcare sector. Research in Nursing & Health, 31(4), 320-328.
Oster, A., Bernbaum, S., & Patten, S. (2001). Determinants of violence in the psychiatric emergency service. Canadian Medical Association Journal, 164(1), 32-33.
Pagnamenta, R., & Benger, J. R. (2008). Factors influencing parent satisfaction in a children's emergency department: prospective questionnaire-based study. Emergency Medicine Journal, 25(7), 417-419.
Patton, M. Q. (1987). How to use qualitative methods in evaluation. Newbury Park, CA: Sage Publications.
Pawlin, S. (2008). Reporting violence. Emergency Nurse, 16(4), 16-21.
Peek-Asa, C., Casteel, C., Allareddy, V., Nocera, M., Goldmacher, S., E, O. H., . . . Harrison, R. (2007). Workplace violence prevention programs in hospital emergency departments. Journal of Occupational and Environmental Medicine, 49(7), 756-763.
Perrone, S. (1999). Violence in the workplace. Research and public policy series (Vol. 22). Canberra: Australian Institute of Criminology.
Phillips, S. (2007). Countering workplace aggression: an urban tertiary care institutional exemplar. Nursing Administration Quarterly, 31(3), 209-218.
Pich, J., Hazelton, M., & Kable, A. (2013). Violent behaviour from young adults and the parents of paediatric patients in the emergency department. International Emergency Nursing, 21(3), 157-162.
Pich, J., Hazelton, M., Sundin, D., & Kable, A. (2011). Patient-related violence at triage: A qualitative descriptive study. International Emergency Nursing, 19(1), 12-19.
386

Pinar, R., & Ucmak, F. (2011). Verbal and physical violence in emergency departments: a survey of nurses in Istanbul, Turkey. Journal of Clinical Nursing, 20(3-4), 510-517.
Pink, B. (2011). Australian Standard Geographical Classification (ASGC). Belconnen, ACT: Australian Bureau of Statistics.
Polit, D. F., Beck, C., & Hungler, B. P. (2001). Essentials of nursing research: methods, appraisal, and utlilization (5th ed.). Philadelphia, PA: Lippincott.
Pope, C., & Mays, N. (2006). Qualitative research in health care (3rd ed.). Malden, Massachussets: Blackwell Publishing Ltd.
Poster, E. C., & Ryan, J. A. (1989). Nurses' attitudes toward physical assaults by patients. Archives of Psychiatric Nursing, 3(6), 315-322.
Potter, C. (2006). To what extent fo nurses and physicians working within the emergency department experience burnout: A review of the literature. Australasian Emergency Nursing Journal, 9(2), 57-64.
Poynton, S., Donnelly, N., Fulde, G., & Scott, L. (2005). The role of alcohol in injuries oresenting to St Vincent's Hospital Emergency Department and the associated short-term costs. Sydney.
Presley, D., & Robinson, G. (2002). Violence in the Emergency Department: nurses contend with prevention in the Health Care Arena. Emergency Nursing, 37(1), 161-169.
Quanbeck, C. (2006). Forensic psychiatric aspects of inpatient violence. Psychiatric Clinics of North America, 29(3), 743-760.
Quintal, S. A. (2002). Violence against psychiatric nurses. An untreated epidemic? Journal of Psychosocial Nursing and Mental Health Services, 40(1), 46-53.
Ralston, N., Prisk, T., & Cox, L. (2011). Three inquiries into fatal hospital stabbing, Sydney Morning Herald.
Rankins, R. C., & Hendey, G. W. (1999). Effect of a security system on violent incidents and hidden weapons in the emergency department. Annals of Emergency Medicine, 33(6), 676-679.
Ray, M. M. (2007). The dark side of the job: violence in the emergency department. Journal of Emergency Nursing, 33(3), 257-261.
Rew, M., & Ferns, T. (2005). A balanced approach to dealing with violence and aggression at work. British Journal of Nursing, 14(4), 227-232.
387

Rippon, T. J. (2000). Aggression and violence in health care professions. Journal of Advanced Nursing, 31(2), 452-460.
Roberts, L. M., Wilson, S., Roalfe, A., & Bridge, P. (2004). A randomised controlled trial to determine the effect on response of including a lottery incentive in health surveys [ISRCTN32203485]. BMC Health Serv Res, 4(1), 30.
Robinson, K. S., Jagim, M. M., & Ray, C. E. (2004). Nursing workforce issues and trends affecting Emergency Departments. Topics in Emergency Medicine, 26(4), 276-286.
Rodriguez-Acosta, R. L., Myers, D. J., Richardson, D. B., Lipscomb, H. J., Chen, J. C., & Dement, J. M. (2010). Physical assault among nursing staff employed in acute care. Work, 35(2), 191-200.
Rose, M. (1997). A survey of violence toward nursing staff in one large Irish Accident and Emergency Department. Journal of Emergency Nursing, 23(3), 214-219.
Ross-Adjie, G. M., Leslie, G., & Gillman, L. (2007). Occupational stressor in the ED: What matters to nurses? Australasian Emergency Nursing Journal, 10(3), 117-123.
Ross, M. M. (2002). Nurse education and violence prevention, detection and intervention.
Royal College of Nursing. (2006). At breaking point: a survey of the wellbeing and working lives of nurses in 2005 Working well iniative. London: Royal College of Nursing.
Ryan, D., & Maguire, J. (2006). Aggression and violence - a problem in Irish Accident and Emergency departments? Journal of Nursing Management, 14(2), 106-115.
Saines, J. C. (1999). Violence and aggression in A & E: recommendations for action. Accident & Emergency Nursing, 7(1), 8-12.
Sandelowski, M. (2000a). Combining qualitative and quantitative sampling, data collection, and analysis techniques in mixed-method studies. Research in Nursing & Health, 23, 246-255.
Sandelowski, M. (2000b). Whatever happened to qualitative description? Research in Nursing & Health, 23(4), 334-340.
Sandelowski, M. (2003). Tables or tableaux? The challenges of writing and reading mixed method studies. In A. Tashakkori & C. Teddlie (Eds.), Handbook of mixed methods is social and behavioral research (2nd ed., pp. 189-2013). Thousand Oaks, CA: Sage.
Sandelowski, M., & Leeman, J. (2012). Writing usable qualitative health research findings. Qualitative Health Research, 22(10), 1404-1413.
388
Sands, N. (2007). An ABC approach to assessing the risk of violence at triage. Australasian Emergency Nursing Journal, 10(5), 107-109.
Sato, K., Wakabayashi, T., Kiyoshi-Teo, H., & Fukahori, H. (2013). Factors associated with nurses' reporting of patients' aggressive behavior: a cross-sectional survey. International Journal of Nursing Studies, 50(10), 1368-1376. doi: 10.1016/j.ijnurstu.2012.12.011
Schneider, Z., Elliott, D., Lo-Biondi-Wood, G., & Haber, J. (2004). Nursing research: Methods, critical appraisal and utilisation 2nd ed. Marrickville, NSW: Elsevier (Australia) Pty Ltd.
Schnieden, V., & Marren-Bell, U. (1995). Violence in the accident and emergency department. Accident & Emergency Nursing, 3(2), 74-78.
Secker, J., Benson, A., Balfe, E., Lipsedge, M., Robinson, S., & Walker, J. (2004). Understanding the social context of violent and aggressive incidents on an inpatient unit. Journal of Psychiatric and Mental Health Nursing, 11(2), 172-178.
Senuzun Ergun, F., & Karadakovan, A. (2005). Violence towards nursing staff in emergency departments in one Turkish city. International Nursing Review, 52(2), 154-160.
Shenton, A. K. (2004). Strategies for ensuring trustworthiness in qualitative research projects. Education for Information, 22, 63-75.
Shields, M., & Wilkins, K. (2009). Factors related to on-the-job abuse of nurses by patients. Health Report, 20(2), 7-19.
Smith, B. (2011). Nurse Stabbed at Psychiatric Hospital in Orange Dies, Herald Sun. Retrieved from http://www.heraldsun.com.au/news/national/nurse-stabbed-atpsychiatric-hospital-in-orange-dies/story-e6frf7l6-1225982989655
Stone, T., McMillan, M., Hazelton, M., & Clayton, E. H. (2011). Wounding words: swearing and verbal aggression in an inpatient setting. Perspectives in Psychiatric Care, 47(4), 194-203.
Stone, T. E., & Hazelton, M. (2008). An overview of swearing and its impact on mental health nursing practice. International Journal of Mental Health Nursing, 17(3), 208-214.
Streubert, H. J., & Carpenter, D. R. (1995). Qualitative research in nursing. Philadelphia, PA: J. B. Lippincott Co.
Sullivan, A. F., Camargo, C. A., Cleary, P. D., Gordon, J. A., Guadagnoli, E., Kaushal, R., . . . Blumenthal, D. (2007). The National Emergency Department Safety Study: Study Rationale and Design. Academic Emergency Medicine, 14(12), 1182-1189. doi: 10.1197/j.aem.2007.07.014
389

Tashakkori, A., & Teddlie, C. (Eds.). (1998). Mixed methodology: Combining the qualitative and quantitative approaches. Thousand Oaks, CA: Sage.
Tashakkori, A., & Teddlie, C. (Eds.). (2003). Handbook of mixed methods in social & behavioral research. Thousand Oaks, CA: Sage.
Tavernero, T. (2009). Preventing violence in the emergency department. Patient Safety & Quality Healthcare, 6(1), 16-17.
Taylor, J. L., & Rew, L. (2011). A systematic review of the literature: workplace violence in the emergency department. Journal of Clinical Nursing, 20(7-8), 1072-1085.
Tyrell, M. P. (1999). The nature of aggression & violence in the Accident and Emergency Department. Nursing Review, 17(3), 71-75.
Uzun, O. (2003). Perceptions and experiences of nurses in Turkey about verbal abuse in clinical settings. Journal of Nursing Scholarship, 35(1), 81-85.
van der Zwan, R., Davies, L., Andrews, D., & Brooks, A. (2011). Aggression and violence in the ED: issues associated with the implementation of restraint and seclusion. Health Promotion Journal of Australia, 22(2), 124-127.
VanGeest, J., & Johnson, T. P. (2011). Surveying Nurses: Identifying Strategies to Improve Participation. Evaluation & the Health Professions, 34(4), 487-511. doi: 10.1177/0163278711399572
Vangeest, J. B., Johnson, T. P., & Welch, V. L. (2007). Methodologies for improving response rates in surveys of physicians: a systematic review. Evaluation & the Health Professions, 30(4), 303-321.
Victorian Government. (2005). Victorian taskforce of violence in nursing: Final report. Melbourne: Victorian Government.
Wand, T., White, K., Patching, J., & Dixon, J. (2010). Preventing Violence in the Health Care Setting. The Joint Commission, 45(45), 1-3.
Wand, T., White, K., Patching, J., Dixon, J., & Green, T. (2012). Outcomes for the evaluation of an emergency department-based mental health nurse practitioner outpatient service in Australia. Journal of American Academy of Nurse Practitioners, 34(3), 149-159.
Wand, T. C., & Coulson, K. (2006). Zero tolerance: A policy in conflict with current opinion on aggression and violence management in health care. Australasian Emergency Nursing Journal, 9(7), 163-170.
Wassall, J. T. (2009). Workplace violence interventions effectiveness: A systematic review. Safety Science, 47, 1049-1055.
390

Weiss, T., & Marmar, D. S. (1997). The Impact of Event Scale-Revised. In J. P. Wilson & T. M. Deane (Eds.), Assessing psychological trauma and PTSD (pp. 399 - 411). New York: Guilford Press.
Wells, J., & Bowers, L. (2002). How prevalent is violence towards nurses working in general hospitals in the UK? Journal of Advanced Nursing, 39(3), 230-240.
Whelan, T. (2008). The escalating trend of violence toward nurses. Journal of Emergency Nursing, 34(2), 130-133.
Whitley, G. G., Jacobson, G. A., & Gawrys, M. T. (1996). The impact of violence in the health care setting upon nursing education. Journal of Nursing Education, 35(5), 211-218.
Whittington, R., Shuttleworth, S., & Hill, L. (1996). Violence to staff in a general hospital setting. Journal of Advance Nursing, 24(2), 326-333.
Whittington, R., & Winstanley, S. (2008). Commentary on Luck L, Jackson D & Usher K (2008) Innocent or culpable? Meanings that emergency department nurses ascribe to individual acts of violence. Journal of Clinical Nursing 17, 1071-1078. Journal of Clinical Nursing, 17(16), 2235-2237.
Wilkes, L., Mohan, S., Luck, L., & Jackson, D. (2010). Development of a violence tool in the emergency hospital setting. Nurse Research, 17(4), 70-82.
Winstanley, S., & Whittington, R. (2004). Aggression towards health care staff in a UK general hospital: variation among professions and departments. Journal of Clinical Nursing, 13(1), 3-10.
Winterbottom, S. (1979). Coping with the violent patient in accident and emergency. Journal of Medical Ethics, 5, 124-127.
Wolcott, H. F. (1994). Transforming Qualitative Data: Description, Analysis, and Interpretation. Thousand Oaks, CA: Sage.
World Health Organization. (2002). World report on violence and health: summary. Geneva, Switzerland: World Health Organization.
World Health Organization. (2012). Violence against women. Geneva: World Health Organization Retrieved from http://www.who.int/mediacentre/factsheets/fs239/en/.
Wright, N. M., Dixon, C. A., & Tompkins, C. N. (2003). Managing violence in primary care: an evidence-based approach. British Journal of General Practice, 53(492), 557-562.
391

Appendices
392

Appendix A: Search Strategy
CINAHL
Search terms Number of articles retrieved
Emergency department or ED or emergency service 35335
Accident & emergency or A & E or triage 12038
S1 Or S2 43067
Violence or aggression or assault 29147
Abuse 53092
S4 or S5 74711
Patient or patient-related or client 411153
Nurs* 581827
S3 and S6 and S7 and S8 311
Retrieved for further analysis based on title and abstract 18
MEDLINE
Search terms Number of articles retrieved
Emergency department or ED or emergency service 80276
Accident & emergency or A & E or triage 14268
393

S1 OR S2 91063
Violence or aggression or assault 63806
Abuse 103991
S4 OR S5 156785
Patient or patient-related or client 1533172
Nurs* 497611
S3 AND S6 AND S7 AND S8 175
Retrieved for further analysis based on title and abstract 12
Mosby’s Index
Search terms Number of articles retrieved
‘Emergency department’ OR ‘ED’ OR ‘Emergency service’ 40485
‘Accident & emergency’ or ‘A & E’ or ‘Triage’ 28716
S1 or S2 41687
‘Violence’ OR ‘Aggression’ OR ‘Assault’ 68783
Abuse 92430
S4 or S5 135134
‘Patient’ OR ‘Patient-related’ or ‘Client’ 1134527
Nurs* 5058842
S3 AND S6 AND S7 AND S8 1157
Retrieved for further analysis based on title and abstract 4
394
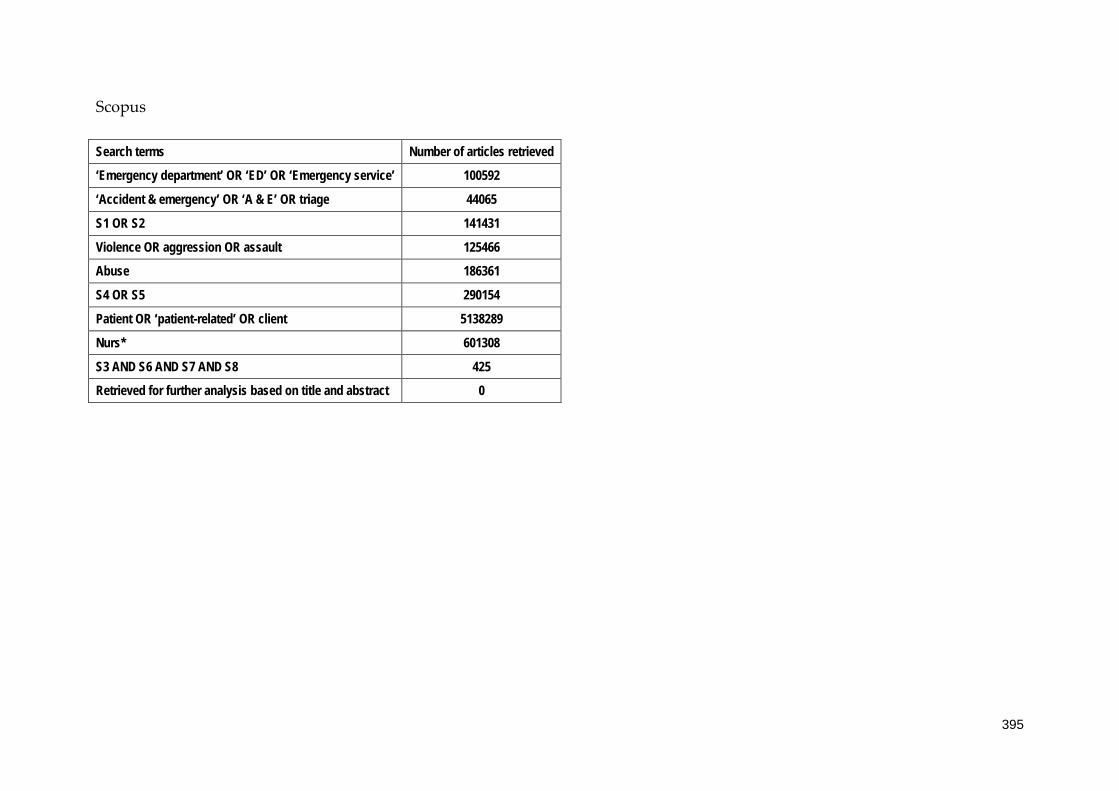
Scopus
Search terms Number of articles retrieved
‘Emergency department’ OR ‘ED’ OR ‘Emergency service’ 100592
‘Accident & emergency’ OR ‘A & E’ OR triage 44065
S1 OR S2 141431
Violence OR aggression OR assault 125466
Abuse 186361
S4 OR S5 290154
Patient OR ‘patient-related’ OR client 5138289
Nurs* 601308
S3 AND S6 AND S7 AND S8 425
Retrieved for further analysis based on title and abstract 0
395

Cochrane Central Register of Controlled Trials (CENTRAL)
Search terms Number of articles retrieved
‘Emergency department’ OR ‘ED’ OR ‘Emergency service’ 82
‘Accident & emergency’ OR ‘A & E’ OR triage 35
S1 OR S2 115
Violence OR aggression OR assault 47
Abuse 115
S4 OR S5 115
Patient OR ‘patient-related’ OR client 3345
Nurs* 195
S3 AND S6 AND S7 AND S8 1
Retrieved for further analysis based on title and abstract 0
Google Scholar
Search terms Number of articles retrieved
Emergency Department; Emergency Service; Accident and Emergency; Violence; Aggression; Assault; Abuse 334
Retrieved for further analysis based on title and abstract 9
396

Mednar
Search terms Number of articles retrieved
(‘Emergency Department’ OR ’Emergency Service’ OR ‘Accident and Emergency’) 1,291
(Violence OR aggression OR assault OR Abuse) 2,484
S1 AND S2 879
Retrieved for further analysis based on title and abstract 12
397

Appendix B - Appraisal instruments
QARI Appraisal instrument
398

MAStARI Appraisal Instruments
399

400

Appendix C: Excluded papers and reasons for exclusion
Excluded quantitative studies
Author, Year & country Type of study Sample size Reason for exclusion
(Erickson & Williams-Evans, 2000) United States
Questionnaire n = 55 Small sample size; potential for variation between sites; minimal descriptive statistics reported & instrument used not directly relevant to key outcomes of this review
Excluded qualitative studies Author, year & country Type of study Sample size Reason for exclusion
(Hislop & Melby, 2003) Northern Ireland
Phenomenological n = 5 Audit trail unclear, interview approach unknown, rigour including trustworthiness poorly addressed. Participants known to researcher – potential for bias.
401

Appendix D: Summary table of qualitative studies (included in review)
Author Year
Country
Design, data collection and analysis methods
Sample Recall period Purpose/Phenomenon of Interest
Location/setting Themes
1. Catlette (2005) United States
Descriptive Interviews Thematic analysis
n = 8 Not defined To study the phenomenon of workplace violence from the perspective of Emergency Department nurses who had experienced violence while on duty
Emergency Department 2 study sites
Inadequate safety measures and vulnerability at work.
2. Early & Hubbert,
(2006) United States
Phenomenological Semi-structured interviews Thematic analysis
n = 12 Not defined To explore nurses’ meanings and experiences with violence in the ED.
Emergency Department 1 study site
ED environment not supportive to nurses or patients and may contribute to emergence of violent behaviour
3. Gates, et al.,
(2011a) United States
Action research Focus groups Thematic analysis
n = 97 Not defined To gather information from Emergency Department employees to help plan, implement and evaluate a violence prevention and management intervention
Emergency Department 3 study sites
Violence in the Emergency Department is increasing Thematic analysis results supported the relevance, feasibility, and saliency of the planned intervention strategies.
4. (Pich et al., 2011) Australia
Qualitative descriptive methodology Semi-structured interviews Thematic analysis
n = 6 ED nurses
1 month Antecedents & risk factors Types of abuse Impact Risk management strategies Reporting Coping mechanisms
Tertiary level ED 1 study site
Antecedents & risk factors: Long waiting times; mental health patients; Alcohol & substance misuse; Age: younger patients; Parents of paediatric patients; Easy access of ED; Lower socio-economic status; Attitudes of staff; Less experienced staff Patient-related violence perceived to be increased in frequency & intensity Physical abuse: Types: slapped, kicked & hit Verbal abuse: Swearing, threats
402

shouting, making unreasonable demands; intimidation Impact: Emotional & professional Risk management strategies: Reactive rather than preventative e.g. security, duress alarms & workplace design Training – lacking Reporting: Under-reporting common due to time constraints, “non-user friendly” system & high frequency of episodes Ability to recognise cues & warning signs Coping mechanisms: Informal debriefing
403

Appendix E: Summary table of quantitative studies (included in review)
Design Author/year/country Recall period Sample Setting Findings
Questionnaire
1. (Atawneh et al., 2003) Kuwait
1 year n=81 ED nurses Response Rate = 94%
1 study site ED in a general hospital
70/81 nurses experienced verbal abuse 13/81 physically assaulted Nurses suffer more from the after-effects of violence at work than doctors Effects of violence included: - flashbacks, depression, sleep disturbances, fear & time off work Males statistically more likely to experience an episode of violence & more fearful at work than females 63/81 worried about violence at work Training – 15/81 had received aggression minimisation training
Questionnaire
2. (Ayranci, 2005) Turkey
1 year n=195 Response Rate = 81%
18 study sites in west Turkey (5 urban & 13 rural Emergency Departments)
53% verbally abused 70% physical threats Verbal/emotional most common form of violence
Descriptive longitudinal cohort study – incorporating a questionnaire
3. (Crilly et al., 2004) Australia
5 months n = 71 Response Rate = 66%
ED 2 study sites
Violence most common on evening shift Nurses’ perceived perpetrators were under influence of drugs & alcohol & displayed behaviours
404
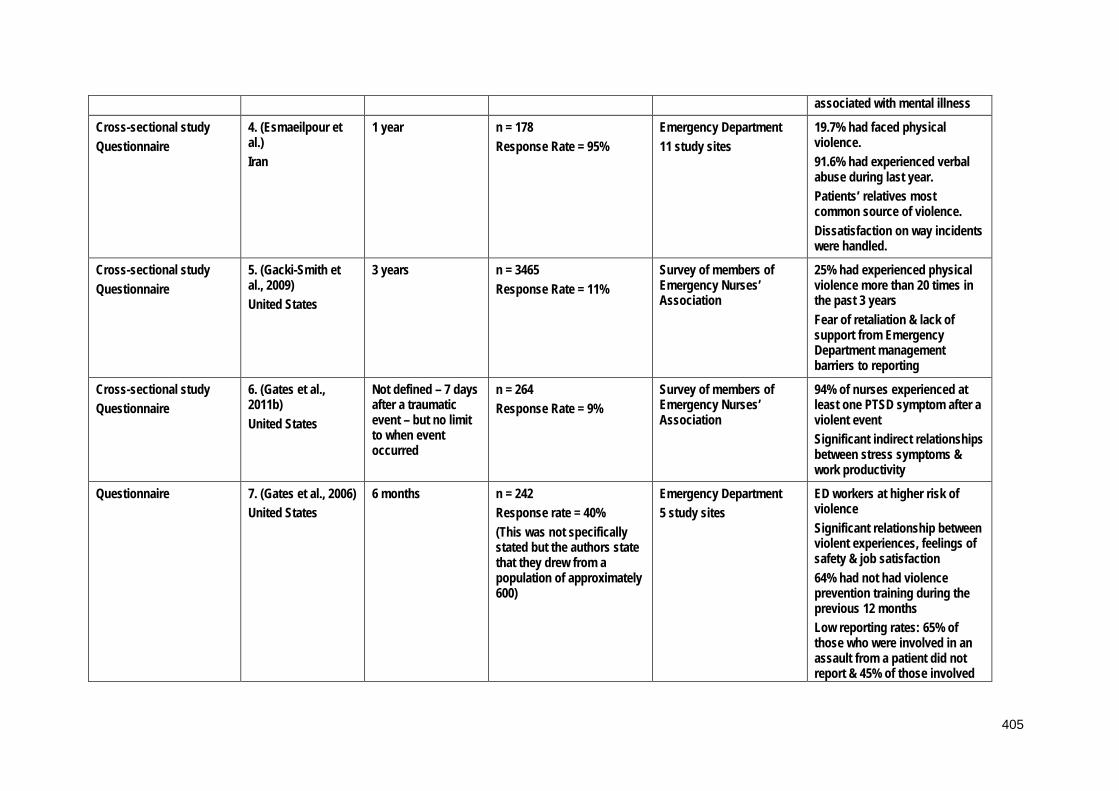
associated with mental illness
Cross-sectional study Questionnaire
4. (Esmaeilpour et al.) Iran
1 year n = 178 Response Rate = 95%
Emergency Department 11 study sites
19.7% had faced physical violence. 91.6% had experienced verbal abuse during last year. Patients’ relatives most common source of violence. Dissatisfaction on way incidents were handled.
Cross-sectional study Questionnaire
5. (Gacki-Smith et al., 2009) United States
3 years n = 3465 Response Rate = 11%
Survey of members of Emergency Nurses’ Association
25% had experienced physical violence more than 20 times in the past 3 years Fear of retaliation & lack of support from Emergency Department management barriers to reporting
Cross-sectional study Questionnaire
6. (Gates et al., 2011b) United States
Not defined – 7 days after a traumatic event – but no limit to when event occurred
n = 264 Response Rate = 9%
Survey of members of Emergency Nurses’ Association
94% of nurses experienced at least one PTSD symptom after a violent event Significant indirect relationships between stress symptoms & work productivity
Questionnaire
7. (Gates et al., 2006) United States
6 months n = 242 Response rate = 40% (This was not specifically stated but the authors state that they drew from a population of approximately 600)
Emergency Department 5 study sites
ED workers at higher risk of violence Significant relationship between violent experiences, feelings of safety & job satisfaction 64% had not had violence prevention training during the previous 12 months Low reporting rates: 65% of those who were involved in an assault from a patient did not report & 45% of those involved
405
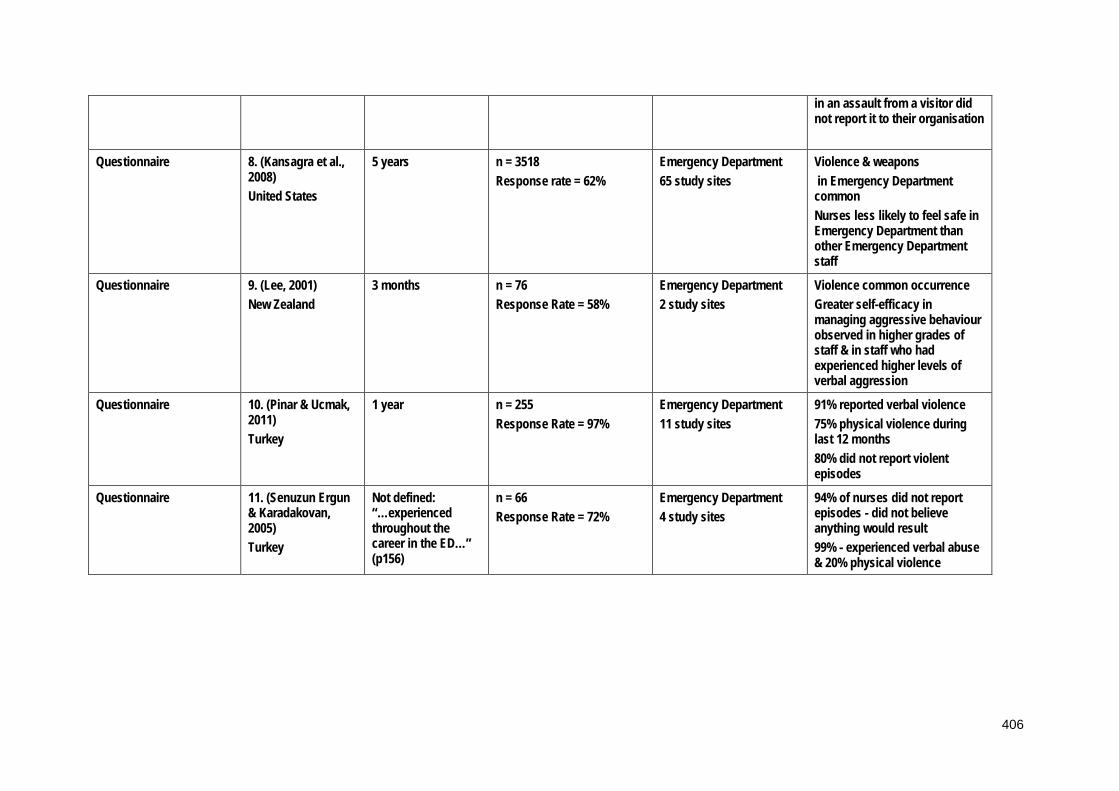
in an assault from a visitor did not report it to their organisation
Questionnaire 8. (Kansagra et al., 2008) United States
5 years n = 3518 Response rate = 62%
Emergency Department 65 study sites
Violence & weapons in Emergency Department common Nurses less likely to feel safe in Emergency Department than other Emergency Department staff
Questionnaire
9. (Lee, 2001) New Zealand
3 months n = 76 Response Rate = 58%
Emergency Department 2 study sites
Violence common occurrence Greater self-efficacy in managing aggressive behaviour observed in higher grades of staff & in staff who had experienced higher levels of verbal aggression
Questionnaire 10. (Pinar & Ucmak, 2011) Turkey
1 year n = 255 Response Rate = 97%
Emergency Department 11 study sites
91% reported verbal violence 75% physical violence during last 12 months 80% did not report violent episodes
Questionnaire 11. (Senuzun Ergun & Karadakovan, 2005) Turkey
Not defined: “…experienced throughout the career in the ED…” (p156)
n = 66 Response Rate = 72%
Emergency Department 4 study sites
94% of nurses did not report episodes - did not believe anything would result 99% - experienced verbal abuse & 20% physical violence
406
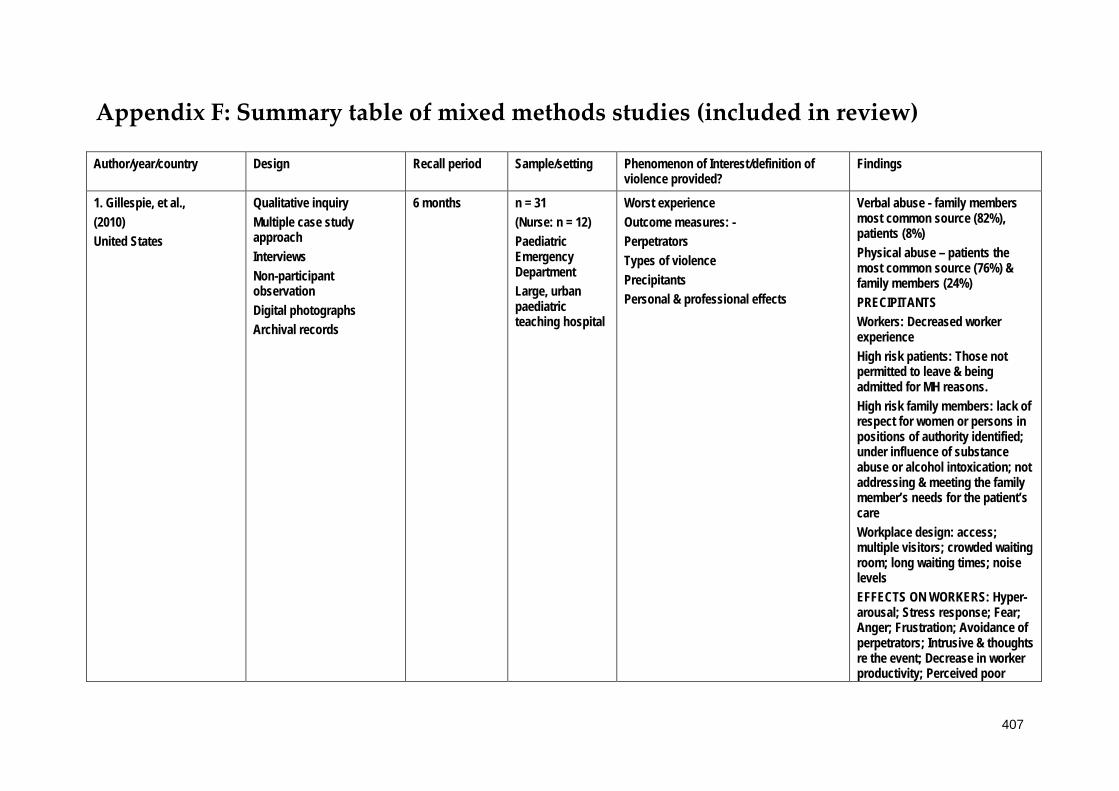
Appendix F: Summary table of mixed methods studies (included in review)
Author/year/country Design Recall period Sample/setting Phenomenon of Interest/definition of violence provided?
Findings
1. Gillespie, et al., (2010) United States
Qualitative inquiry Multiple case study approach Interviews Non-participant observation Digital photographs Archival records
6 months
n = 31 (Nurse: n = 12) Paediatric Emergency Department Large, urban paediatric teaching hospital
Worst experience Outcome measures: - Perpetrators Types of violence Precipitants Personal & professional effects
Verbal abuse - family members most common source (82%), patients (8%) Physical abuse – patients the most common source (76%) & family members (24%) PRECIPITANTS Workers: Decreased worker experience High risk patients: Those not permitted to leave & being admitted for MH reasons. High risk family members: lack of respect for women or persons in positions of authority identified; under influence of substance abuse or alcohol intoxication; not addressing & meeting the family member’s needs for the patient’s care Workplace design: access; multiple visitors; crowded waiting room; long waiting times; noise levels EFFECTS ON WORKERS: Hyper-arousal; Stress response; Fear; Anger; Frustration; Avoidance of perpetrators; Intrusive & thoughts re the event; Decrease in worker productivity; Perceived poor
407

image of hospital by patients & visitors; Decreased ability to focus
2. (Luck et al., 2007) Australia
Mixed method case study 13 informal field interviews 16 semi-structured interviews 290 hours of participant observation
Not defined n = 20 RR = 37%
1 Australian ED STAMP behaviours identified as predictors of potential violence in patients Staring, Tone, Anxiety, Mumbling, Pacing
3. (Luck et al., 2008) Australia
Mixed method case study 13 informal field interviews 16 semi-structured interviews 290 hours of participant observation
Not defined n = 20 RR = 37%
1 Australian ED ED nurses made judgements about meanings of violent events according to 3 factors: Perceived personalisation of violence; Presence of mitigating factors; Reason for presentation.
408

Appendix G: Ethical approval
HUMAN RESEARCH ETHICS COMMITTEE
Notification of Expedited Approval
To Chief Investigator or Project Supervisor: Professor Michael Hazelton
Cc Co-investigators / Research Students:
Doctor Ashley Kable Doctor Deborah Sundin Ms Jacqueline Pich
Re Protocol: The VENT study: Violence in Emergency Nursing and Triage
Date: 18-May-2010
Reference No: H-2010-1013
Date of Initial Approval: 18-May-2010
Thank you for your Response to Conditional Approval submission to the Human Research Ethics Committee (HREC) seeking approval in relation to the above protocol.
Your submission was considered under Expedited review by the Chair/Deputy Chair.
I am pleased to advise that the decision on your submission is Approved effective 18-May-2010.
For noting: The additional amendments to the protocol as detailed in your response letter are also approved
In approving this protocol, the Human Research Ethics Committee (HREC) is of the opinion that the project complies with the provisions contained in the National Statement on Ethical Conduct in Human Research, 2007, and the requirements
409

within this University relating to human research.
Approval will remain valid subject to the submission, and satisfactory assessment, of annual progress reports. If the approval of an External HREC has been "noted" the approval period is as determined by that HREC.
The full Committee will be asked to ratify this decision at its next scheduled meeting. A formal Certificate of Approval will be available upon request. Your approval number is H-2010-1013. If the research requires the use of an Information Statement, ensure this number is inserted at the relevant point in the Complaints paragraph prior to distribution to potential participants You may then proceed with the research.
Conditions of Approval
This approval has been granted subject to you complying with the requirements for Monitoring of Progress, Reporting of Adverse Events, and Variations to the Approved Protocol as detailed below. PLEASE NOTE: In the case where the HREC has "noted" the approval of an External HREC, progress reports and reports of adverse events are to be submitted to the External HREC only. In the case of Variations to the approved protocol, or a Renewal of approval, you will apply to the External HREC for approval in the first instance and then Register that approval with the University's HREC.
• Monitoring of Progress
Other than above, the University is obliged to monitor the progress of research projects involving human participants to ensure that they are conducted according to the protocol as approved by the HREC. A progress report is required on an annual basis. Continuation of your HREC approval for this project is conditional upon receipt, and satisfactory assessment, of annual progress reports. You will be advised when a report is due.
• Reporting of Adverse Events
1. It is the responsibility of the person first named on this Approval Advice to report adverse events.
2. Adverse events, however minor, must be recorded by the investigator as observed by the investigator or as volunteered by a participant in the research. Full details are to be documented, whether or not the investigator, or his/her deputies, consider the event to be related to the research substance or procedure.
410

3. Serious or unforeseen adverse events that occur during the research or within six (6) months of completion of the research, must be reported by the person first named on the Approval Advice to the (HREC) by way of the Adverse Event Report form within 72 hours of the occurrence of the event or the investigator receiving advice of the event.
4. Serious adverse events are defined as: o Causing death, life threatening or serious disability. o Causing or prolonging hospitalisation. o Overdoses, cancers, congenital abnormalities, tissue damage,
whether or not they are judged to be caused by the investigational agent or procedure.
o Causing psycho-social and/or financial harm. This covers everything from perceived invasion of privacy, breach of confidentiality, or the diminution of social reputation, to the creation of psychological fears and trauma.
o Any other event which might affect the continued ethical acceptability of the project.
5. Reports of adverse events must include: o Participant's study identification number; o date of birth; o date of entry into the study; o treatment arm (if applicable); o date of event; o details of event; o the investigator's opinion as to whether the event is related to the
research procedures; and o action taken in response to the event.
6. Adverse events which do not fall within the definition of serious or unexpected, including those reported from other sites involved in the research, are to be reported in detail at the time of the annual progress report to the HREC.
• Variations to approved protocol
If you wish to change, or deviate from, the approved protocol, you will need to submit an Application for Variation to Approved Human Research. Variations may include, but are not limited to, changes or additions to investigators, study design, study population, number of participants, methods of recruitment, or participant information/consent documentation. Variations must be approved by the (HREC) before they are implemented except when Registering an approval of a variation from an external HREC which has been designated the lead HREC,
411
in which case you may proceed as soon as you receive an acknowledgement of your Registration.
Linkage of ethics approval to a new Grant
HREC approvals cannot be assigned to a new grant or award (i.e. those that were not identified on the application for ethics approval) without confirmation of the approval from the Human Research Ethics Officer on behalf of the HREC.
Best wishes for a successful project.
Associate Professor Alison Ferguson
Chair, Human Research Ethics Committee
For communications and enquiries:
Human Research Ethics Administration
Research Services Research Office The University of Newcastle Callaghan NSW 2308 T +61 2 492 18999 F +61 2 492 17164 [email protected]
Linked University of Newcastle administered funding:
Funding body Funding project title First named investigator Grant Ref
412

Appendix H: Survey
413

414

415

416

417

418

419

420

421

422
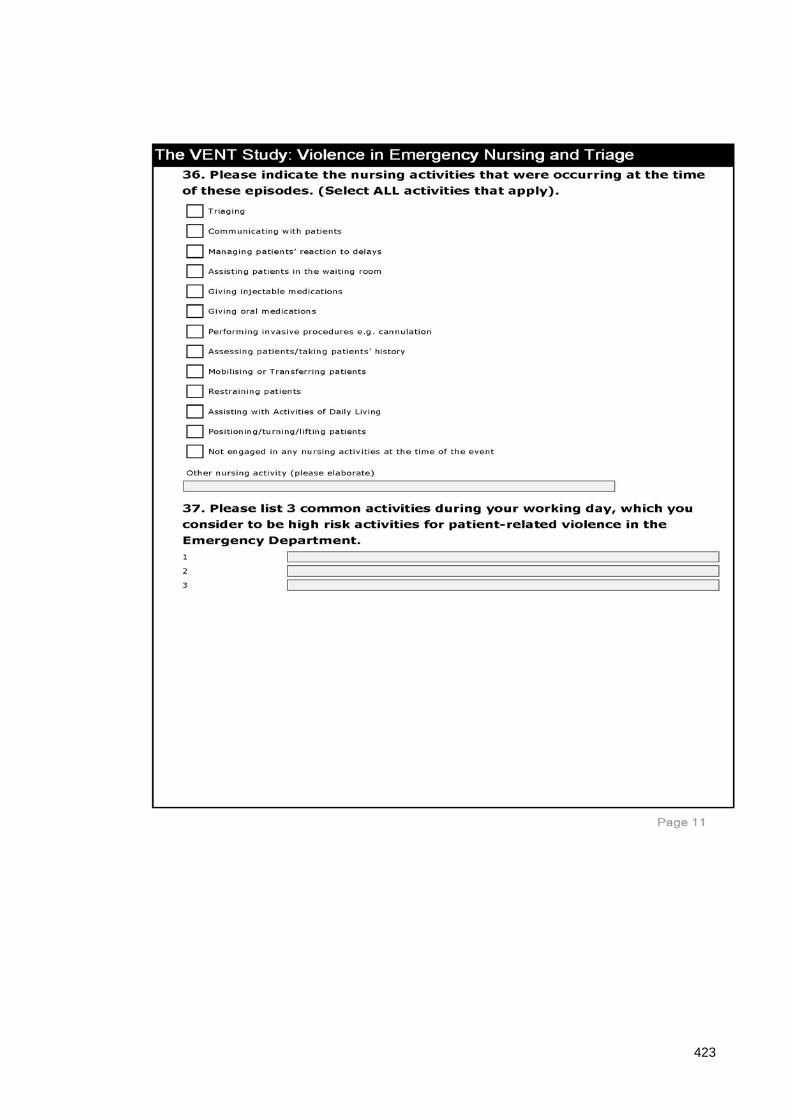
423

424

425

426

427

428
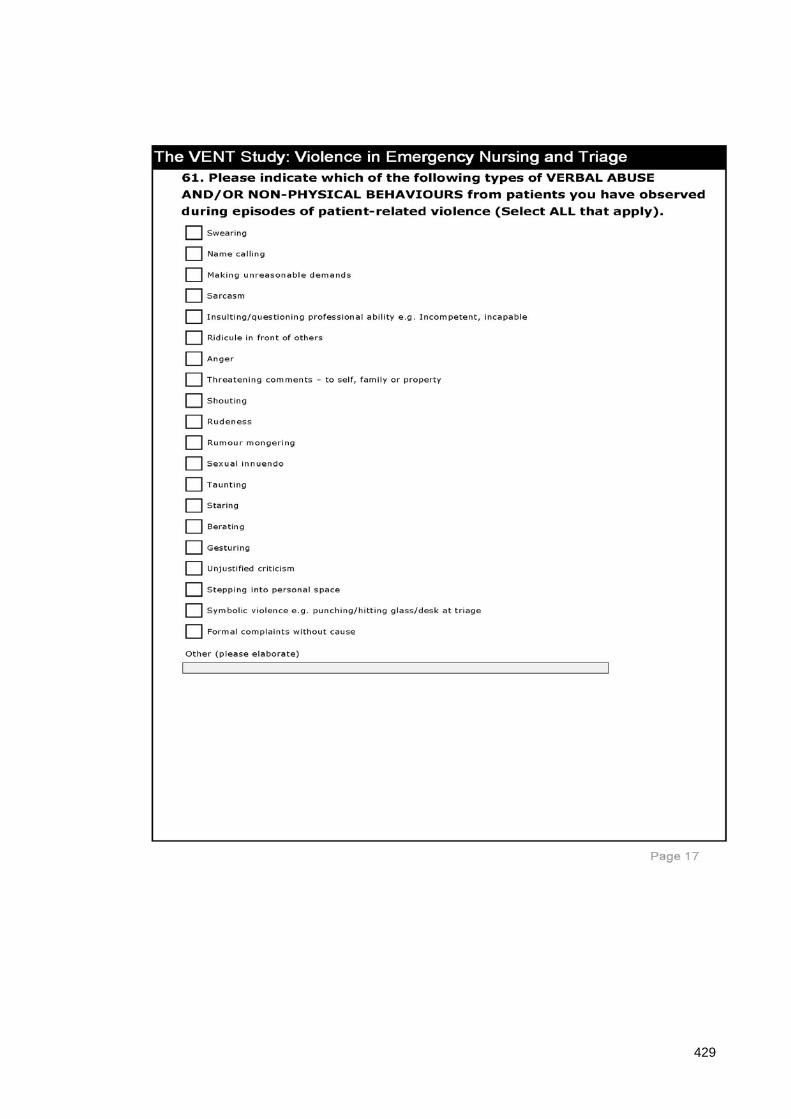
429

430

431
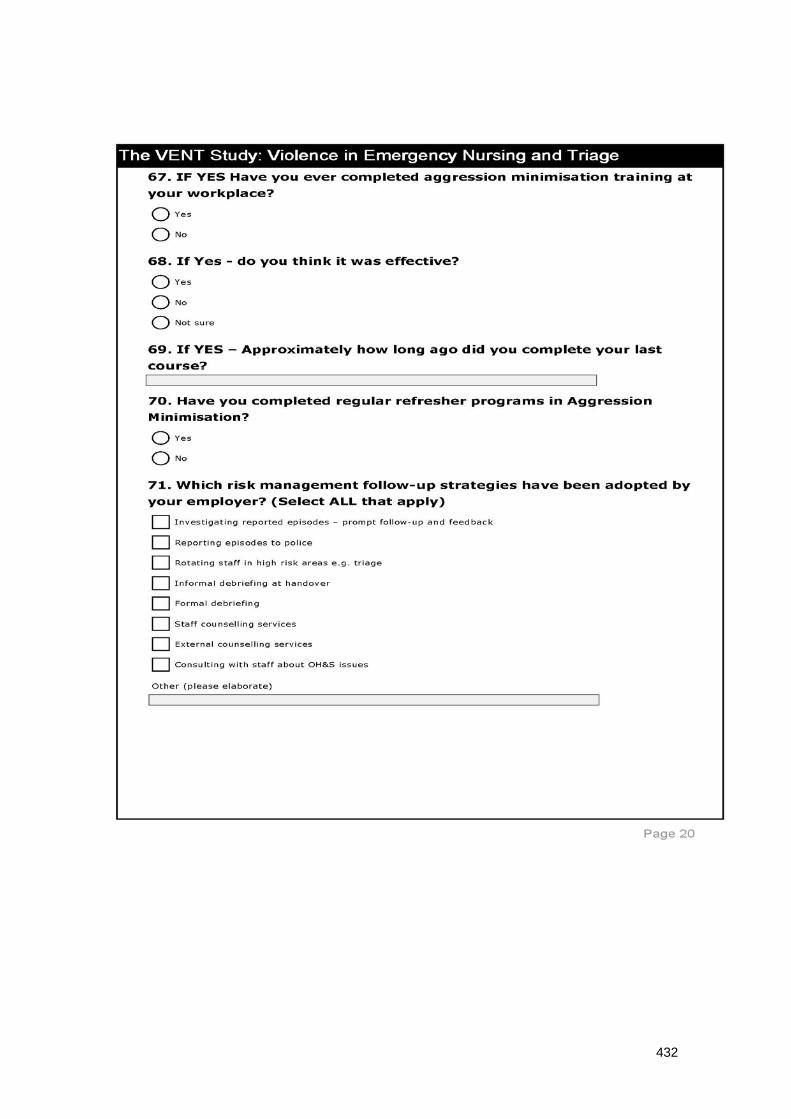
432
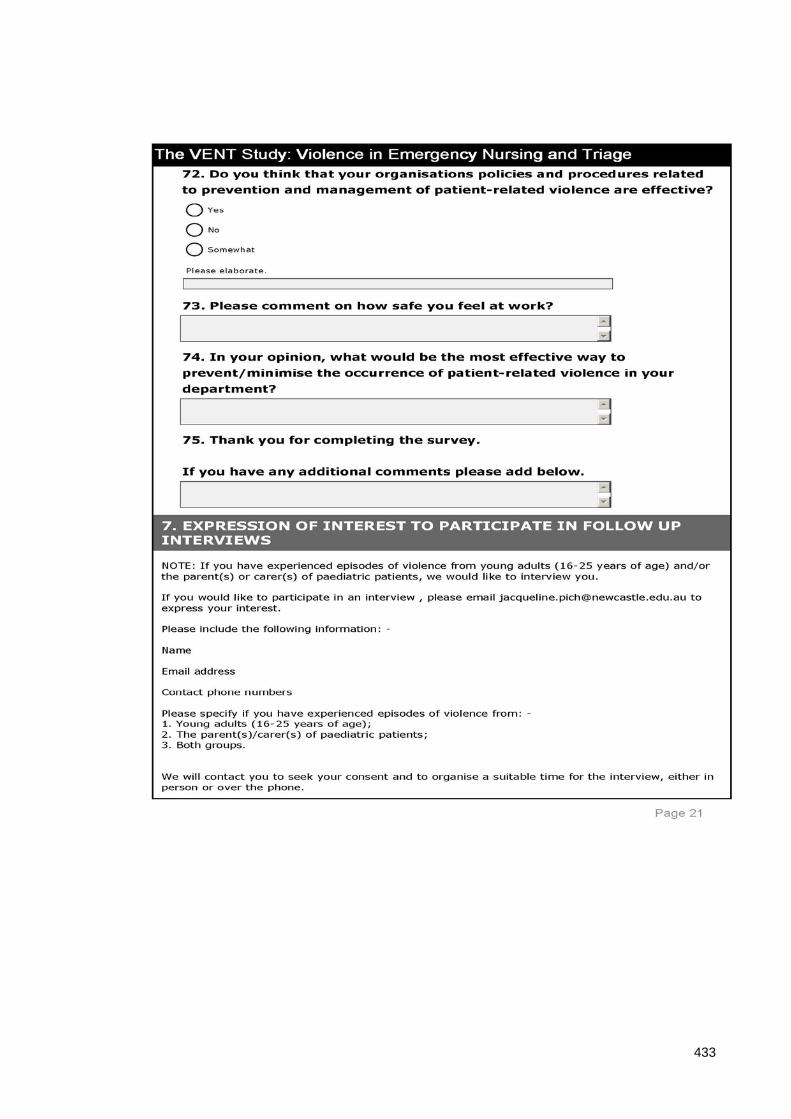
433

434

Appendix I: Information Sheet
435
436
Appendix J: Envelope
437

Appendix K: Pen
438

Appendix L: Reminder postcard
439

Appendix M: Logo
440

Appendix N: Statistical analysis plan
STATISTICAL ANALYSIS PLAN
THE VENT STUDY: VIOLENCE IN EMERGENCY NURSING & TRIAGE
ANALYSIS 1: Frequency of episodes of violence
AIM 1: To measure the frequency of individual emergency nurses reported exposure
to patient-related workplace violence and associated outcomes in the preceding six
months.
POPULATION OF INTEREST: Q1: Nurses who were eligible for the study and
completed the survey.
OUTCOME VARIABLE: Experienced at least 1 episode of patient-related violence in
the last 6 months (Q10)
PREDICTOR VARIABLES OF INTEREST:
Q9: Have you been involved in an episode in preceding week?
Q10: Have you been involved in an episode in preceding 6 months?
Q11: How many episodes
Q12: How many involved: -
a. Verbal abuse and non-physical behaviours;
b. Verbal abuse and non-physical behaviours that progressed to physical
contact;
c. Only physical contact with people or objects;
d. Patients accompanied by police.
Q39: Is patient-related violence an inevitable part of your job?
Q40: Do you think the frequency of patient-related violence is increasing...?
441

ANALYSIS: Basic statistical data on means, median, IQR, SD and range.
Data compared by geographical regions.
442

AIM 2: To identify the types of violent behaviours experienced by emergency nurses.
POPULATION OF INTEREST: Q1: Nurses who were eligible for the study and
completed the survey.
OUTCOME VARIABLE: Experienced at least 1 episode of patient-related violence in
the last 6 months (Q10)
PREDICTOR VARIABLES OF INTEREST:
Q12: How many involved: -
a. Verbal abuse and non-physical behaviours;
b. Verbal abuse and non-physical behaviours that progressed to physical
contact;
c. Only physical contact with people or objects;
d. Patients accompanied by police.
Q20: Did you sustain a physical or psychological injury?
Q21: Which body part was affected?
Q22: Type of injury sustained;
Q23: Emotional responses;
Q24: Professional responses;
Q25: Time off work required?
Q26: Permanent disability or change in work duties?
Q61: Types of verbal abuse;
Q62: Types of physical behaviours
443
ANALYSIS:
• Descriptive statistics;
• Pearson’s chi-squared analysis (Fisher’s exact test where cells <5) to compare
with episode experienced in the last 6 months;
• Data analysed according to region.
444
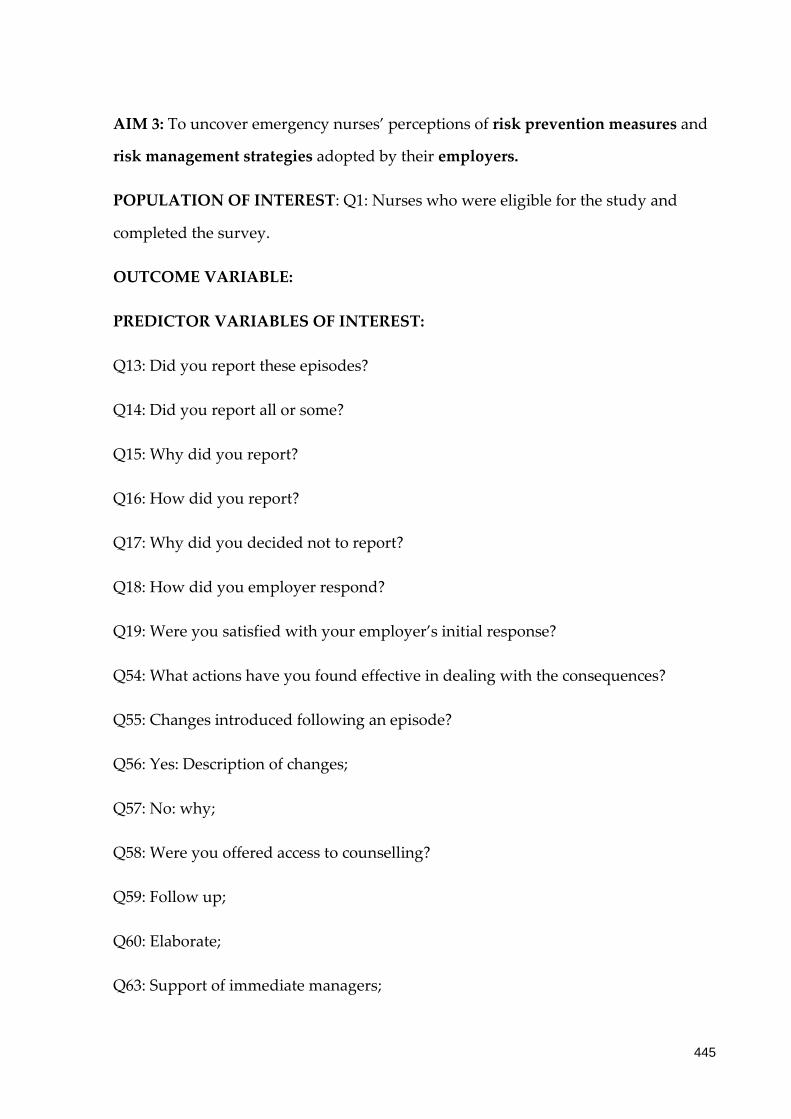
AIM 3: To uncover emergency nurses’ perceptions of risk prevention measures and
risk management strategies adopted by their employers.
POPULATION OF INTEREST: Q1: Nurses who were eligible for the study and
completed the survey.
OUTCOME VARIABLE:
PREDICTOR VARIABLES OF INTEREST:
Q13: Did you report these episodes?
Q14: Did you report all or some?
Q15: Why did you report?
Q16: How did you report?
Q17: Why did you decided not to report?
Q18: How did you employer respond?
Q19: Were you satisfied with your employer’s initial response?
Q54: What actions have you found effective in dealing with the consequences?
Q55: Changes introduced following an episode?
Q56: Yes: Description of changes;
Q57: No: why;
Q58: Were you offered access to counselling?
Q59: Follow up;
Q60: Elaborate;
Q63: Support of immediate managers;
445
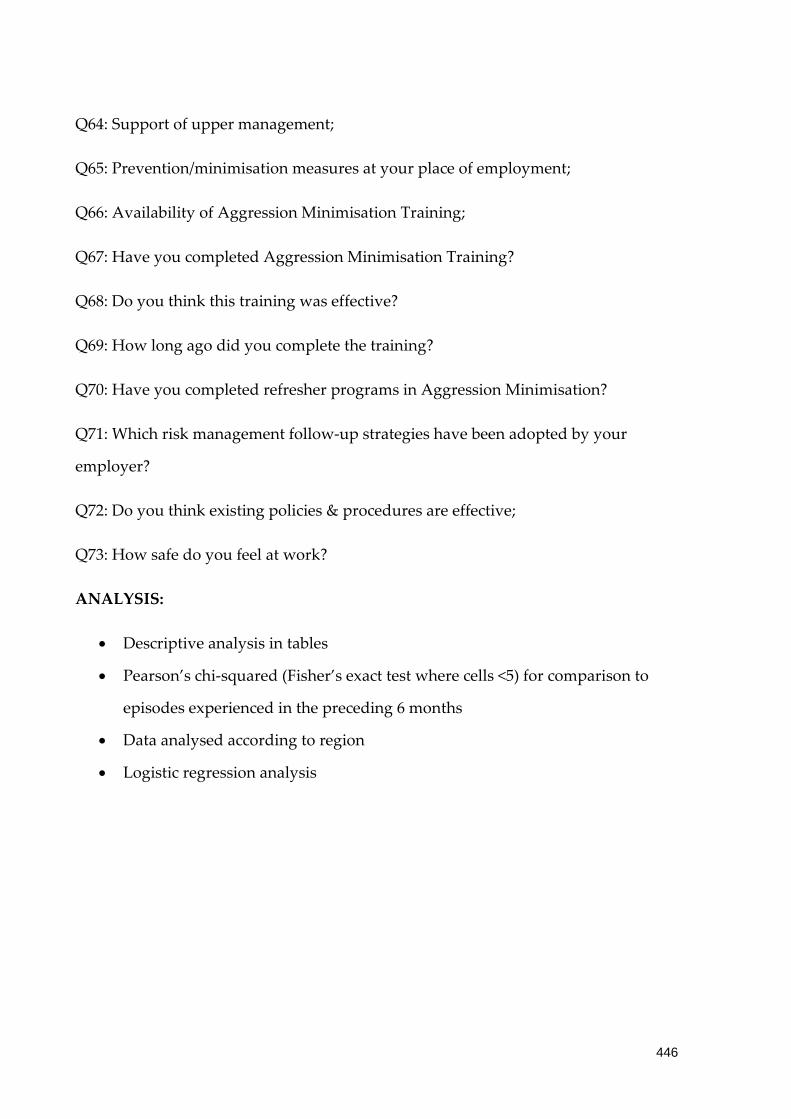
Q64: Support of upper management;
Q65: Prevention/minimisation measures at your place of employment;
Q66: Availability of Aggression Minimisation Training;
Q67: Have you completed Aggression Minimisation Training?
Q68: Do you think this training was effective?
Q69: How long ago did you complete the training?
Q70: Have you completed refresher programs in Aggression Minimisation?
Q71: Which risk management follow-up strategies have been adopted by your
employer?
Q72: Do you think existing policies & procedures are effective;
Q73: How safe do you feel at work?
ANALYSIS:
• Descriptive analysis in tables
• Pearson’s chi-squared (Fisher’s exact test where cells <5) for comparison to
episodes experienced in the preceding 6 months
• Data analysed according to region
• Logistic regression analysis
446

AIM 4: To identify factors associated with patient-related workplace violence that
precipitate, escalate or de-escalate episodes of violence.
POPULATION OF INTEREST: Q1: Nurses who were eligible for the study and
completed the survey.
OUTCOME VARIABLE: Precipitants and antecedents to episodes of violence.
PREDICTOR VARIABLES OF INTEREST:
Demographic value re sample Q2-8?
Q27: Gender;
Q28: Age grouping;
Q32: Triage category;
Q33: Clinical diagnoses/signs and symptoms;
Q34: Time of day;
Q35: Type of day;
Q36: Nursing activity:
Q37: High risk activities;
Q38: Location in ED;
Q41: types of patients;
Q42: Elaboration of Q41;
Q43: Time of year;
Q44: Elaboration of Q43;
Q45: Patient specific factors;
447
Q46: Patient behaviours;
Q47: Staffing issues;
Q48: ED specific factors;
Q49: Socio-economic factors;
Q50: What factors (free text);
Q51: Nurse behaviours;
Q52: Elaboration of Q51.
ANALYSIS:
• Descriptive analysis in tables
• Pearson’s chi-squared (Fisher’s exact test where cells <5) for comparison to
episodes experienced in the preceding 6 months
• Data analysed according to region
• Logistic regression analysis
448
AIM 5: To investigate the issue of violence with respect to younger adults (16-25
years of age) and the parents of paediatric patients.
POPULATION OF INTEREST: Q1: Nurses who were eligible for the study and
completed the survey.
OUTCOME VARIABLE: Episodes involving parent(s) or carer(s) of a child who was
a patient (Q29).
PREDICTOR VARIABLES OF INTEREST:
Q30: Age grouping;
Q31: Relationship to child.
ANALYSIS:
• Descriptive statistics
• Comparison by geographical region
449

AIM 6: To develop recommendations for employers about patient-related workplace
violence and safety in the workplace for emergency nurses.
POPULATION OF INTEREST: Q1: Nurses who were eligible for the study and
completed the survey.
PREDICTOR VARIABLES OF INTEREST:
Q53: What measures do you believe can be used to more effectively manage violent
patients/episodes?
Q74: In your opinion what would be the most effective way to prevent/minimise
patient-related violence?
Q75: Additional comments.
ANALYSIS:
• Descriptive statistics
450

Appendix O: Expression of Interest
451

Appendix P: Demographic profile
Participant Demographic Profile for the Research Project:
The VENT Study: Violence in Emergency Nursing and Triage.
1. How many years have you worked as a nurse? _______________ Years
2. What is the average number of hours per week in which you worked as an
emergency nurse during the last month?
___________ Hours per week
3. Is your principal employment (please mark ONE option)
1 Full time 2 Part time 3 Casual
4. Years of experience working in an Emergency Department? __________years
5. Are you (Please circle ONE option)
(1) Male (2) Female
6. What is your age? ______________ Years
452

7. What is you nursing classification? (Please circle ONE option)
• New Grad • RN • CNC • CNS • CNE • Nurse practitioner • NUM
What is the postcode of your primary employer? _________________________
453
Appendix Q: Interview schedule: Violence from young
adults
Draft Interview Schedule for the Research Project:
The VENT Study: Violence in Emergency Nursing and Triage.
DRAFT INTERVIEW QUESTIONS: Violence from young adult patients aged 16-
25 years of age.
I would like to begin the interview by thanking you for your participation in this
study.
As a requirement of The Ethics Committee I would like to remind you that your
participation in this interview is voluntary and that you may stop at any time. For
the purposes of confidentiality I would ask that you do not identify yourself or name
any third parties during the course of the interview. Do you consent to this interview
being audio-taped?
Recounting experiences involving violence can sometimes be distressing. If you
begin to feel distressed we can pause at any time, and you can cease the interview at
454

any stage.
I would like to explain that for the purpose of this study, the definition of violence
that we are using includes verbal abuse, physical threats and assault as well as
emotional abuse and involves both implicit and explicit challenges to your well-
being.
You indicated on your survey form that you have experienced episodes of violence
from young patients aged between 16-25 years of age.
1. From your personal experience do you feel that this group are increasingly
associated with episodes of patient-related violence?
2. If Yes, WHY do you think this is occurring?
3. Could you describe a typical encounter please?
4. Could you tell me about the patient involved, for example their age, and
presenting problem?
5. Did this/these episode(s) occur in front of any person(s) accompanying the
patient?
6. How did this make you feel?
7. Were you able to resolve this/these episode(s)? Could you elaborate?
8. Did you report this/these episode(s)?
9. How did your manager respond to this/these episode(s)?
10. How did your colleagues respond to this/these episode(s)?
Is there anything you would like to add?
455

Appendix R: Interview schedule: Violence from the
parents of paediatric patients
Draft Interview Schedule for the Research Project:
The VENT Study: Violence in Emergency Nursing and Triage.
DRAFT INTERVIEW QUESTIONS: Violence from the parents/carers of paediatric
patients.
I would like to begin the interview by thanking you for your participation in this
study.
As a requirement of The Ethics Committee I would like to remind you that your
participation in this interview is voluntary and that you may stop at any time. For
the purposes of confidentiality I would ask that you do not identify yourself or name
any third parties during the course of the interview. Do you consent to this interview
being audio-taped?
Recounting experiences involving violence can sometimes be distressing. If you
begin to feel distressed we can pause at any time, and you can cease the interview at
456

any stage.
I would like to explain that for the purpose of this study, the definition of violence
that we are using includes verbal abuse, physical threats and assault as well as
emotional abuse and involves both implicit and explicit challenges to your well-
being.
You indicated on your survey form that you have experienced episodes of violence
from the parent(s)/carer(s) of a paediatric patient.
1. From your personal experience do you feel that this group are increasingly
associated with episodes of patient-related violence?
2. If Yes, WHY do you think this is occurring?
3. Could you describe a typical encounter please?
4. Could you tell me about the child involved, for example their age, and
presenting problem?
5. How did this make you feel?
6. Did these episodes occur in front of the child or children? If YES, how did
the child respond?
7. Were you able to resolve this/these episode(s)? Could you elaborate?
8. Did you report this/these episode(s)?
9. How did your manager respond to this/these episode(s)?
10. How did you colleagues respond to this/these episode(s)?
11. Is there anything you would like to add?
457

Appendix S: Consent Form
Consent Form for the Research Project:
The VENT Study: Violence in Emergency Nursing and Triage
I agree to participate in the above research project and give my consent freely.
I understand that the project will be carried out as described in the Information
Brochure, a copy of which I have retained.
I understand my consent is voluntary and that I can withdraw from the project at any
time and do not have to give a reason for withdrawing.
I consent to participating in an interview and having it recorded and to completing a
brief participant demographic form.
I understand that my personal information will remain confidential to the researchers.
I have had the opportunity to have questions answered to my satisfaction.
PRINT NAME: _________________________________________________
SIGNATURE: __________________________________________________
I consent to my interview responses being quoted in the reporting of the research
and understand that all information will be de-identified to protect my privacy.
458

PRINT NAME: _________________________________________________
SIGNATURE: __________________________________________________
For the purposes of accuracy you will be provided with a transcription of the interview
after it has been transcribed to verify that the contents represent a true and valid
account of your responses during the interview. You will have the opportunity to edit
or amend the content of the transcript if you wish.
459

Appendix T: Field Notes
Field notes form VENT interviews
Participant 1
• Met at reception in ED
• ED waiting room is quite large but only a few people waiting in it (end of day
shift) – TVs on – triage & clerks behind screens – have to bend over/sit to talk
to them – issues of having to raise your voice to be heard obvious
• Interview in cafeteria of hospital
• Large, busy ED – regional
• Male – mid 40s – tall – confident - friendly
• Speaks of being fearful for colleagues more than himself
• Sense of frustration that people are abusing the system/have no manners/don’t
like to wait
• Frustrated at inability to be able to “defend” himself in violent encounters
• Episodes are very frequent – predictability – following times of alcohol
consumption in the community e.g. weekends & public holidays
• Frustration with parents of paediatric patients expressed - alludes to things he
saw while on active duty in the military and that people here don’t realise
how good they have it
• Sense that participant has demons around this that are at times difficult to
cope with
Participant 2
• Phone interview
• Very well spoken female
• High levels of empathy apparent when discussing incidents – reluctance to
apportion blame
460
• Becomes very tearful – offer to stop interview & wait a few minutes – she
continues – but I sense that raw emotion is very close to the surface
throughout – I feel empathy/sorry for what she is going through & have to be
mindful of this & try to keep the interview on track – but moving on if needed
& providing support too
• She empathises with parents due to her own status as a mother
• However while saying she empathises and not blaming them – it is obvious
that this abuse is taking a toll on her as whenever she discusses incidents there
is a lot of emotion evident
• Remind her to talk to someone/EAP if needed at conclusion of call as I
acknowledge this – she says it took her by surprise
• Works casually & as an academic
Participant 3
• Meet in ED & given a tour
• ED is very busy/close to full – small waiting room - waiting room contains
families – frustration in some evident – sick & well kids mixing as all brought
to the ED with parents – noisy – triage not always present – people having to
wait – time Saturday 8AM
• Very warm & friendly female – early 50s – very happy to help – competent -
professional
• Interview begins in cafeteria but cleaner comes in & we have to relocate to a
meeting room
• Acknowledges there is a problem of parental violence – but empathy &
understanding expressed for majority of offenders – not wanting to blame
• Feels there is a sexist element here – sense annoyance that she feels female
nurses are treated differently to males and to medical staff
• Sense that she feels it is part of the job – but at the same time there is an
annoyance that it takes up time & that she has to deal with it
461
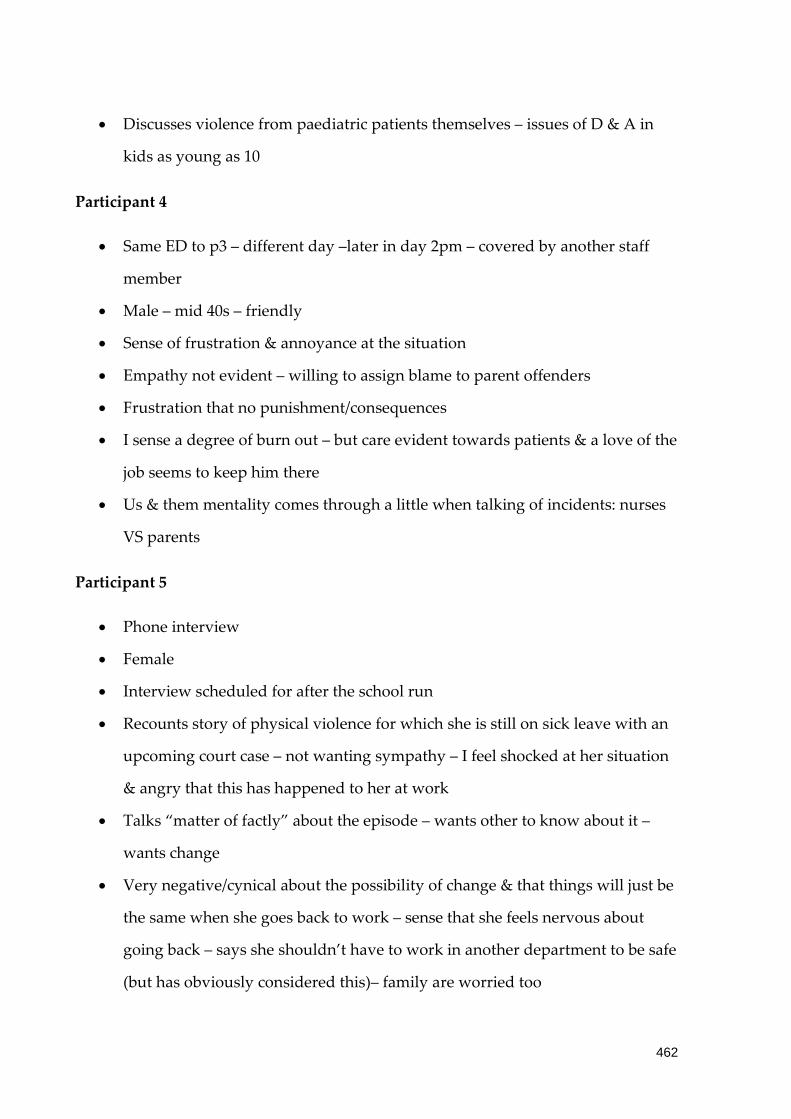
• Discusses violence from paediatric patients themselves – issues of D & A in
kids as young as 10
Participant 4
• Same ED to p3 – different day –later in day 2pm – covered by another staff
member
• Male – mid 40s – friendly
• Sense of frustration & annoyance at the situation
• Empathy not evident – willing to assign blame to parent offenders
• Frustration that no punishment/consequences
• I sense a degree of burn out – but care evident towards patients & a love of the
job seems to keep him there
• Us & them mentality comes through a little when talking of incidents: nurses
VS parents
Participant 5
• Phone interview
• Female
• Interview scheduled for after the school run
• Recounts story of physical violence for which she is still on sick leave with an
upcoming court case – not wanting sympathy – I feel shocked at her situation
& angry that this has happened to her at work
• Talks “matter of factly” about the episode – wants other to know about it –
wants change
• Very negative/cynical about the possibility of change & that things will just be
the same when she goes back to work – sense that she feels nervous about
going back – says she shouldn’t have to work in another department to be safe
(but has obviously considered this)– family are worried too
462
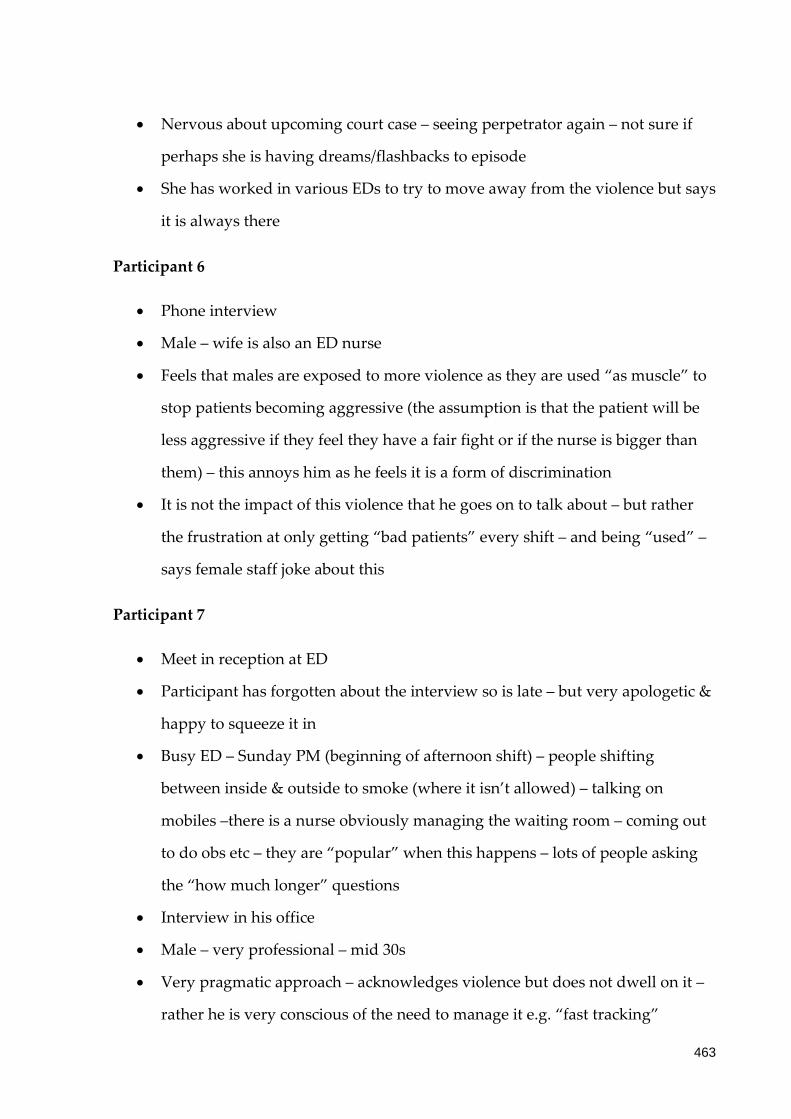
• Nervous about upcoming court case – seeing perpetrator again – not sure if
perhaps she is having dreams/flashbacks to episode
• She has worked in various EDs to try to move away from the violence but says
it is always there
Participant 6
• Phone interview
• Male – wife is also an ED nurse
• Feels that males are exposed to more violence as they are used “as muscle” to
stop patients becoming aggressive (the assumption is that the patient will be
less aggressive if they feel they have a fair fight or if the nurse is bigger than
them) – this annoys him as he feels it is a form of discrimination
• It is not the impact of this violence that he goes on to talk about – but rather
the frustration at only getting “bad patients” every shift – and being “used” –
says female staff joke about this
Participant 7
• Meet in reception at ED
• Participant has forgotten about the interview so is late – but very apologetic &
happy to squeeze it in
• Busy ED – Sunday PM (beginning of afternoon shift) – people shifting
between inside & outside to smoke (where it isn’t allowed) – talking on
mobiles –there is a nurse obviously managing the waiting room – coming out
to do obs etc – they are “popular” when this happens – lots of people asking
the “how much longer” questions
• Interview in his office
• Male – very professional – mid 30s
• Very pragmatic approach – acknowledges violence but does not dwell on it –
rather he is very conscious of the need to manage it e.g. “fast tracking”
463

• Communication key
• Protection of his staff also paramount
• Feels he has measures in place to manage the issue
• Some staff can exacerbate situation – he is frustrated at this as it is his job to
“clean up the mess”
Participant 8
• Female
• Seems to be saying that it is a problem – but not for her as she can
handle/manage it
• Belief that the problem will always exist and can’t be managed – nurses need
to be able to “hack it”
• Very matter of fact in her discussion – feeling that some things thrown in for
“shock” value – and that despite her assertions that she is fine with the issue –
she is actually feeling angry that things have to be this way and that she gets
sworn at every day at work by people she is trying to help (this does seem to
have an impact on her – she seems sad when discussing)
Participant 9
• Female
• Phone interview
• Patients can be “badly behaved” especially through use of alcohol
• Idea of females almost competing to behave more badly than males? Increased
alcohol use evident
• Feeling that the constant verbal abuse is “beating her down” – incremental
effect?
• Sensed a very real fear that she believed that a patient may at some stage try
to hurt – even try to kill her – which I found very disturbing…
464

Participant 10
• Female - mid 30’s – pleasant – easy to talk to
• Feeling that waiting room can actually be unsafe for people – due to actions of
a few
• Worried about potential of what could happen to others – patients, their
families, other nurses & staff
• Sensed anxiety surrounding going to work – unexpected
outcomes/possibilities – idea that she sometimes actually feels “unsafe” there?
Participant 11
• Female
• Met at venue outside hospital – coffee shop – some background noise but still
able to hear/be heard
• Sensed she almost feels a duty/obligation to the profession to pass on her
experiences – as she doesn’t report at work – too busy/not encouraged
• Violence – mainly verbal constant – every day – a day without is rare
• Wears down on her – makes her feel bad about herself & doubt her worth as a
nurse/even a person? – some anxiety evident around this perhaps
• Almost apologetic for feeling this way –w anting to appear strong? Or almost
a typical ED nurse - ?pressure from within to be able to manage violence
Additional notes – reflecting on main ideas expressed
Precipitating factors
Drugs
• Usually there is a medical reason at the core of the presentation e.g. assault
• Marijuana
• Prescription drugs
• Alcohol
465

• Psychosis side effects
Mental health: “mad” vs “bad” patients
Waiting times – lack of communication “handballing around”
• Not just waiting to get into ED – series of waits e.g. specialist, x-ray, pathology
etc
Pain – “anyone who is in pain is more likely to act irrationally or verbally escalate...”
Use of “early analgesia” in waiting room if needed
Triage category 4 or 5
• Parents & children – attitude “bred into them...that’s how you treat the
staff...and get away with it”
Gender – males over females
Females - passive aggressive behaviour e.g. making derogatory comments within
earshot e.g. she is a bitch
• Increase in female violence
Frequent flyers
Types of violence
Verbal
• Threats – kills, rape, family e.g. “you don’t know...if they are nuts enough
they could find you”
• Swearing
• Jabs at competence
• Abuse continuing over many hours/days – waiting on a bed
466

Physical
• Previous assaults – broken nose – court case - anxiety
• Weapons: Guns & knives in ED
• Chairs thrown
• Bed wheeled/smashed through closed doors
Frequency/Common – “it’s getting very common now” (p1): e.g. 4 code greys in 1X6-
hour shift – including a police officer assaulted in waiting room
Violence is contextual – what is accepted in ED is not outside
Different in attitude between experienced & newer RN’s – tend to put up with it
because that is the way it has always been & nothing happens if you report & could
be worse
Impact on other patients
o Increase in chest pain
o Patient struck after striking nurse
Cues
• Danger in relying on them as can be misinterpreted & sometimes there are no
warning signs
• Behavioural cues: anxious, pacing, distracted, agitated
• Verbal cues: tone (frustrated), tutting & sighing
Communication skills
o Calm
o Not raising voice
o Walking away if needed
o Be engaged – like you are doing something for them
467
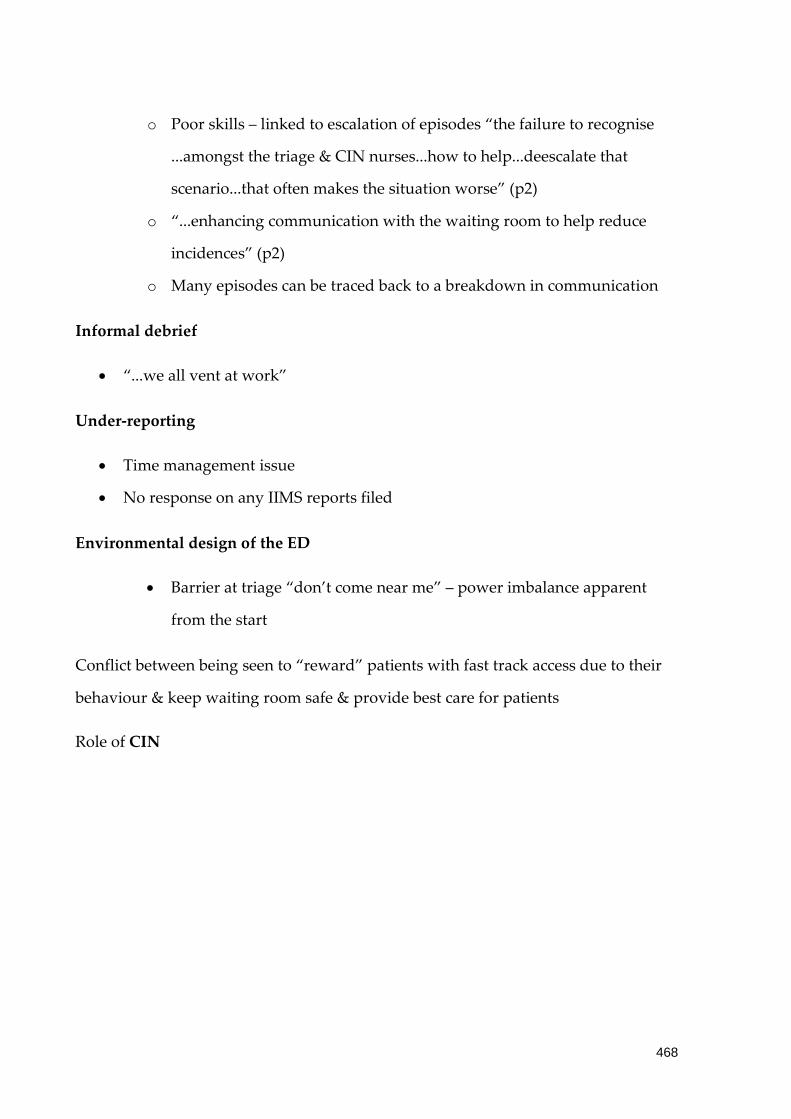
o Poor skills – linked to escalation of episodes “the failure to recognise
...amongst the triage & CIN nurses...how to help...deescalate that
scenario...that often makes the situation worse” (p2)
o “...enhancing communication with the waiting room to help reduce
incidences” (p2)
o Many episodes can be traced back to a breakdown in communication
Informal debrief
• “...we all vent at work”
Under-reporting
• Time management issue
• No response on any IIMS reports filed
Environmental design of the ED
• Barrier at triage “don’t come near me” – power imbalance apparent
from the start
Conflict between being seen to “reward” patients with fast track access due to their
behaviour & keep waiting room safe & provide best care for patients
Role of CIN
468
Appendix U: Audit Trail
RESEARCH AUDIT TRAIL: Part II of the study
Research Question/Study Aims:
The overall aim of the study was to investigate ED nurses’ experiences with patient-
related violence in their workplace. Part II of the study was undertaken to address
the fifth aim of the study: To investigate the issue of violence with respect to young
adults (16-25 years of age) and the parents of paediatric patients. The results would
also be used to achieve the final aim of the study: To develop recommendations for
employers about patient-related workplace violence and safety in the workplace for
emergency nurses.
Research process
Sampling method
Participants were recruited to the study using purposive sampling. An Expression of
Interest to participate in semi-structured interviews was included with the
Questionnaire used to collect data in Part I of the study.
In purposive sampling, the most readily accessible persons are chosen to participate
in a study, resulting in a sample that is both accessible and convenient to the
researcher (Haber, 1994; Leedy, 1993). The advantages of this method of sampling
relate to the convenience and accessibility of potential participants; however the risk
of bias is greater than with any other sampling type (Haber, 1994). This is due to the
fact that such samples are typically self-selecting, and the motivation for
participation is unknown. This can threaten the representativeness of the sample, as
the characteristics of non-participants are not able to be compared to participants
(Haber, 1994). In this study purposive sampling was employed, however all
469

participants were chosen from the same population: members of CENA, which
strengthens the representativeness of the sample.
Data collection
Interview schedule
Two interview schedules (Appendices R and S) were developed and designed to
explore ED nurses’ individual experiences of patient-related workplace violence with
the two sub-groups of interest, young adults and the parents of paediatric patients. A
series of open-ended questions were developed based on a review of the current
literature pertaining to the topic. To establish the validity of the interview schedules
they were peer reviewed by a senior researcher with clinical experience in the ED
environment (DS). Slight modifications were then incorporated into the final version
of the interview schedules.
A demographic profile sheet was developed by the researcher to collect basic data
about the participants including gender, age and years of experience. Participants
were asked to complete this prior to the interviews.
Expressions of Interest (EOI) were received from participants by e-mail and through
the use of the EOI form attached to the survey. Return contact by the researcher was
made initially using email to acknowledge receipt of the EOI and followed up with a
phone call to organise and time and place for the interview to take place.
After the completion of 11 interviews data saturation was deemed to have occurred
and no further participants were recruited to the study.
Place and time of interviews
Participants were given the option to have interviews conducted face-to-face, either
at their place of work or at a location of their choice, or over the phone, at a time
470
convenient to them. Eleven interviews were subsequently conducted over a four
week period, including four phone interviews and seven conducted face-to-face.
All face-to-face interviews were conducted at the participants’ place of work. The
time scheduled for the interviews included before and after shifts commenced; in a
scheduled break or at a time where cover for the staff member had been organised.
The locations of the interviews included: participants’ office; ward tea room and
hospital cafeteria. One interview had to be relocated after cleaning staff started to
vacuum the cafeteria.
Three phone interviews were conducted on the participants’ days off, while one was
conducted with a participant at her primary place of work (not a clinical setting).
One negative aspect was that phone coverage during one interview was less than
optimal and some data was not able to be transcribed as a result.
Interview data collection
Digital recordings of the interviews were professionally transcribed verbatim by an
independent transcriber. Transcripts were checked for errors against the recorded
versions by the researcher to ensure the accurate and authentic reproduction of
accounts. Field notes taken at the time of the interviews were used to augment the
transcripts and detail the researcher’s experience and reflection on the interview
(Appendix U).
Participants were provided with an opportunity to read transcripts of their
interviews and comment on their accuracy. When transcription had been completed,
copies of transcripts were returned to participants by mail with a reply paid
envelope and space provided to either confirm or reject the accuracy of the data as
presented. Eight participants responded and all confirmed the accuracy of the
transcripts.
471
Data analysis process
Data from demographic profiles was used to provide basic data about the study
sample, including age, gender and years of experience using summary statistics.
Transcripts of digital recordings were analysed using qualitative analysis
(Sandelowski, 2000b) , and the aim was to let the data speak for itself and limit the
influence of the researcher on the results (Sandelowski, 2000b). Thematic analysis
was conducted on these data using a structured approach described by Sandelowski
and Neergard et al (Neergaard et al., 2009; Sandelowski, 2000b) and based on the
approach discussed by Miles and Huberman (Miles & Huberman, 1994).
A four stage process of data analysis was employed.
Stage one: Initial categorisation: using categories based on semi-structured
interview schedules.
The transcripts were initially reviewed separately for the two groups of interest:
young adults (16-25 years of age) and the parents of paediatric patients. Initial
categorisation was made using these group names as headings. Questions were
asked on both interview schedules about the following issues:
• A typical encounter;
• Types of violence;
• Impact of violence;
• Management of patients/parents.
Stage two: Coding using descriptive labels related back to the qualitative aim of
the study.
Coding was related back to the qualitative study aim: To investigate the issue of
violence with respect to young adults (16-25 years of age) and the parents of
paediatric patients.
472

Descriptive labels were assigned to the two groups separately as below:
Group 1: Young adults: -
• Presenting problem;
• Physical and verbal;
• Patient behaviours;
• Fast tracking;
• Physical and psychological - fearful.
Group 2: Parents of paediatric patients
• Verbal;
• Parent behaviours;
• Nurses’ concerns for children/patients;
• Unpredictable, psychological.
The data grouped under each descriptive label was analysed and emergent themes
identified as detailed below:
Group 1: Young adults: -
• Presenting problem – alcohol intoxication, substance abuse and mental health
diagnoses;
• Patient behaviours – demanding to be seen;
Group 2: Parents of paediatric patients
• Parent behaviours – worried about child and wanting them to be seen quickly;
• Nurses’ concerns for children/patients – unpredictable and psychological -
fearful.
Stage 3: Results of coding discussed and compared to determine commonalities
and differences with qualitative expert (MH).
473

The themes decided on for the two groups were:-
• Alcohol and substance abuse;
• Performing and attention seeking behaviours;
• Verbal and physical violence;
• Parental emotions.
Similarities between the descriptive labels for the two groups were identified and
these results discussed with the qualitative expert (MH)
Similarities were identified between the types of violence experienced – with both
groups experiencing verbal abuse – but physical violence only reported in the
“young adult” group. In addition both groups shared some behaviour in common:
for example being loud and demanding attention/to be seen; and trying to attract the
attention of not just the ED staff but others in the ED for example those in the waiting
room. A decision was made to label these behaviours as “performing and attention
seeking” with the aim of being fast tracked through the ED. In addition those in the
“young adult” group presented with a group of people and performed to them
primarily.
A decision was also made to label episodes where objects were thrown/hit as
“symbolic violence”.
Stage 4: Themes and relationships between descriptive labels were agreed upon
with qualitative expert.
The relationships between the themes for the two groups are illustrated in Figure 2.
A decision was made to include a final theme of “feeling unsafe at work” as an over-
arching theme as it was mentioned frequently in different areas.
The methods used to ensure rigour in this part of the study are detailed below.
474

Trustworthiness
In qualitative research rigour is considered in terms of trustworthiness. The concept
of rigour speaks to the overall truth and validity of a study and how the methods
employed stand up to the scrutiny of other researchers (Milne & Oberle, 2005). This
study adopted the four criteria proposed by Guba to establish trustworthiness:
credibility, transferability, dependability and confirmability (Guba, 1981).
Credibility
The provisions employed to ensure credibility included: -
• Consistent interview process with all participants.
• The use of a professional transcriber to transcribe the recorded interviews
verbatim.
• The use of member-checking, which Lincoln and Guba regard as the single
most important method of ensuring credibility in a study (Lincoln & Guba,
1985).
• Peer review of emergent themes was provided by an experienced qualitative
researcher (MH) to confirm consistency with the data and to reduce subjective
interpretation (Milne & Oberle, 2005).
• Frequent debriefing sessions between the researcher and her supervisors also
were conducted throughout the data analysis process to enable the researcher
to identify any biases or preferences in analysis and to widen and strengthen
the discussion (Shenton, 2004).
• Scrutiny of this project by peers has also been welcomed through the
presentation of the findings at a number of domestic and international
conferences.
475

Transferability
In this study transferability was demonstrated by comparison of the results to the
body of evidence based literature on the topic with similar themes consistently
identified (Streubert & Carpenter, 1995). While a small sample size can limit
transferability, the fact that the participants in this study were drawn from four
Australian states and territories extends the representativeness of the findings to
similar EDs throughout the country.
Dependability
Dependability has been demonstrated by providing a detailed account of the
research design, method and process and by documenting the field notes and an
audit trail for the study. In addition the strengths and limitations of the study have
been acknowledged (Milne & Oberle, 2005).
Confirmability
This was achieved through the use of an audit trail (Schneider et al., 2004), where
decisions made during analysis were documented and reviewed by the peer
reviewer (MH). In addition the use of direct quotes from the interviews illustrated
that the findings are grounded in the data.
476

Figure 8: Audit Trail Flowchart
What are ED nurses’ experiences with violence from young adults (16-25 years of age) and/or the parents of paediatric patients?
Process
Determine appropriate
research method
Determine appropriate
sampling method Data collection
Study aim clearly stated
Description of nurses’
experiences is desired
Purposeful sampling
Expression of interest used to
recruit participants
2 Interview schedules and
demographic profile
Questions derived from research
question and literature
Place and time of
interview
Option of phone or face
to face
All face to face at participants’’
place of employment
Interviews digitally recorded
and field notes taken
Transcripts professionally
transcribed
Checked by qualitative expert Copy of transcript sent to
participants to verify accuracy
Final interviews schedules included questions about: -Typical encounter, types, impact and management
Data saturation achieved – no further participants recruited
Qualitative
Descriptive
Methodology
4 phone and 7 face-to-face interviews conducted
Transcripts
deemed accurate 477

Figure 9: Flowchart of identification of themes
Young Adults
(16-25 years of age) Parents of paediatric patient
Typical encounter
Patient behaviours
Management of
patients Typical
encounter Types of violence Impact on
nurses Impact on
nurses
Types of violence Management of parents
Presenting problem
Alcohol intoxication; Substance
abuse; Mental health diagnosis
Demanding to
be seen
Physical
Verbal Verbal
Verbal and
physical
Physical; Psychological;
Fearful
Worry; wanting child to
be seen quickly
Unpredictable, psychological
Feeling unsafe at work
Nurses’ concerns for
children/patients
Parent behaviours
Alcohol and substance abuse
Performing and
attention seeking
behaviours
Fast
tracking
Parental emotions
478
Appendix V: IENJ article
479

480

481

482

483

484