
J. Electrochem. Sci. Eng. 4(4) 2014
197
ISSN: 1847-9286 Open Access Journal www.jese-online.org Journal of Electrochemical Science and Engineering J. Electrochem. Sci. Eng. 4(4) 2014, 135-326 Volume 4 (2014) No. 04 pp. 135-326 IAPC
-
Upload
khangminh22 -
Category
Documents
-
view
0 -
download
0
Transcript of J. Electrochem. Sci. Eng. 4(4) 2014
ISSN: 1847-9286 Open Access Journal www.jese-online.org
Journal of Electrochemical
Science and Engineering
J. Electrochem. Sci. Eng. 4(4) 2014, 135-326
Volume 4 (2014) No. 04 pp. 135-326
IAPC
J. Electrochem. Sci. Eng. 4(4) (2014) 135-236 Published: December 6, 2014
Open Access : : ISSN 1847-9286
www.jESE-online.org
Contents
Mahbobeh Moazampour, Fahimeh Tahernejad-Javazmi, Maryam Salimi-Amiri, Hassan Karimi-Maleh, Mehdi Hatami Voltammetric determination of hydroxylamine in water and waste water samples using a NiO nanoparticle/new catechol derivative modified carbon paste electrode .............................................. 135
Abel I. Balbín Tamayo, Ana M. Esteva Guas, Juan J. Piña Leyte-Vidal Marcelo Maccini Analytical method for heavy metal determination in algae and turtle eggs from Guanahacabibes Protected Sea Park ............................................................................................................................. 145
Irena Ciglenečki, Marija Marguš, Elvira Bura-Nakić, Ivana Milanović Electroanalytical methods in characterization of sulfur species in aqueous environment ..................... 155
Ana Carolina O. Santana, Erica F. Southgate, João Paulo B. G. Mendes, Jo Dweck, Eliana Mosse Alhadeff, Ninoska Isabel Bojorge Ramirez Characterization of an hrp-aox-polyaniline-graphite composite biosensor ........................................... 165
Paul-Cristinel Verestiuc, Igor Cretescu, Oana-Maria Tucaliuc, Iuliana-Gabriela Breaban, Gheorghe Nemtoi Voltammetric determination of hydroxylamine in water and waste water samples using a NiO nanoparticle/new catechol derivative modified carbon paste electrode .............................................. 177
Ramakrishnan Kamaraj, Pandian Ganesan, Subramanyan Vasudevan Use of hydrous titanium dioxide as potential sorbent for the removal of manganese from water......... 187
Annabel Fernandes, Catarina Oliveira, Maria J Pacheco, Lurdes Ciríaco, Ana Lopes Anodic oxidation of oxytetracycline: Influence of the experimental conditions on the degradation rate and mechanism .............................. 203
Marijana Kraljić Roković, Mario Čubrić, Ozren Wittine Phenolic compounds removal from mimosa tannin model water and olive mill wastewater by energy-efficient electrocoagulation process ........................................................................................ 215
Mani Nandhini, Balasubramanian Suchithra, Ramanujam Saravanathamizhan, Dhakshinamoorthy Gnana Prakash Optimization of parameters for dye removal by electro-oxidation using Taguchi Design ..................... 227
Camilo González-Vargas, Ricardo Salazar, Ignasi Sirés Electrochemical treatment of Acid Red 1 by electro-Fenton and photoelectro-Fenton processes .......... 235
María I. León, Zaira G. Aguilar, José L. Nava Electrochemical combustion of indigo at ternary oxide coated titanium anodes .................................. 247

Jéssica Pires de Paiva Barreto, Elisama Vieira dos Santos, Mariana Medeiros Oliveira, Djalma Ribeiro da Silva, João Fernandes de Souza, Carlos A. Martínez-Huitle Electrochemical mediated oxidation of phenol using Ti/IrO2 and Ti/Pt-SnO2-Sb2O5 electrodes ............. 259
Djamel Ghernaout, Abdulaziz Ibraheem Al-Ghonamy, Mohamed Wahib Naceur, Noureddine Ait Messaoudene, Mohamed Aichouni Influence of operating parameters on electrocoagulation of C.I. disperse yellow 3............................... 271
Carlos E. Barrera-Díaz, Gabriela Roa-Morales, Patricia Balderas Hernández, Carmen María Fernandez-Marchante, Manuel Andrés Rodrigo Enhanced electrocoagulation: New approaches to improve the electrochemical process (Review) ....... 285
Mohammed A. Karim Electrokinetics and soil decontamination: concepts and overview (Review) ......................................... 297
Anil N. Ghadge, Mypati Sreemannarayana, Narcis Duteanu, Makarand M. Ghangrekar Influence of ceramic separator’s characteristics on microbial fuel cell performance ............................. 315

J. Electrochem. Sci. Eng. 4(4) (2014)
Open Access : : ISSN 1847-9286
www.jESE-online.org
EDITORIAL Special Issue on New achievements and methodologies of electrochemistry and electrochemical engineering in the environmental protection and pollution control
During the last decades, many applications of Electrochemistry and Electrochemical Engineering
have arisen for the characterization and remediation of environmental problems. As a result, now-
adays this subject has become one of the most interesting areas of research in applied
electrochemistry, with hundreds of papers published every year and many applications already
available in the market. This special issue contains sixteen very valuable contributions on these
topics, written by highly recognized authors and covering the most relevant areas of interest
within the topic.
Environmental monitoring is a matter of the major importance because it helps to prevent and
remediate pollution with the development of novel warning detection systems. For this reason,
the first sets of contributions are related to characterization of environmental issues with electro-
chemical methods and it contains valuable information about new tools for the characterization of
organics, heavy metals and sulphur.
Treatment of industrial wastes is one of the more stimulating environmental applications
nowadays. Water is extensively used in industry not only as a heat exchanger fluid or a cleaning
agent, but also for the production of many chemicals. As a consequence, significant volumes of
wastewater are produced every day in our industries and they get into the environment after their
treatment with technologies which are not always completely effective. An electrochemically-
based solution to this problem is faced in this special issue with exciting contributions on
electrolysis, electro-Fenton oxidation and electrocoagulation of wastewater, in which technologies
for the efficient removal of dyes, persistent chemicals and inorganic pollutants are evaluated.
Finally, the last set of papers included in this special issue focusses on soil remediation and bio-
electrochemical treatments. Electrokinetic soil remediation (EKSR) is one of the most motivating
topics of research for electrochemical and environmental engineering in our time. Many
applications are currently working at the full scale and in this issue, an authoritative review is
included, in which the fundamentals and applications of the technology are clearly described.

J. Electrochem. Sci. Eng. 4(4) (2014) EDITORIAL
To conclude, trying to save energy, one of the more exciting and innovative areas of research is
the production of electricity from bio-electrochemical processes. Research on this topic is still at a
very early stage but results are promising and the concept of producing energy directly from waste
is an out breaking idea as it is explained in the last contribution of this special issue.
As a conclusion, this special issue is a very good summary of the most exciting research on
electrochemistry and electrochemical engineering in the environmental protection and pollution
control and, for sure, it will become a reference for many researchers in the near future.
Manuel Andrés Rodrigo Rodrigo
doi: 10.5599/jese.2013.0049 135
J. Electrochem. Sci. Eng. 4(4) (2014) 135-144; doi: 10.5599/jese.2014.0049
Open Access: ISSN 1847-9286
www.jESE-online.org
Original scientific paper
Voltammetric determination of hydroxylamine in water and waste water samples using a NiO nanoparticle/new catechol derivative modified carbon paste electrode
Mahbobeh Moazampour, Fahimeh Tahernejad-Javazmi, Maryam Salimi-Amiri*, Hassan Karimi-Maleh and Mehdi Hatami**
Department of Chemistry, Graduate University of Advanced Technology, Kerman, Iran *Department of Physics, Sari Branch, Islamic Azad University, Sari, Iran **Polymer Research Laboratory, University of Bonab, Bonab, Iran
Corresponding author: E-mail: [email protected] Tel.: +989112540112
Received: February 21, 2014; Revised: March 22, 2014; Published: December 6, 2014
Abstract A (9,10-dihydro-9,10-ethanoanthracene-11,12-dicarboximido)-4-ethylbenzene-1,2-diol (DED) mo-dified NiO/NPs carbon paste electrode “(DED/NiO nanoparticle (NiO/NPs)/CPE) was constructed for determination of hydroxylamine (HX). The cyclic voltammogram showed that the electro-catalytic oxidation of HX at the surface of DED/NiO/NPs/CPE occurs at a potential of about 800 mV less positive than with an unmodified electrode. Square-wave voltammetry results presented that the electrocatalytic oxidation peak currents of HX in pH 8.0 had two linear dynamic ranges in the range of 0.1 to 2.0 and 2.0 to 400.0 µM HX, with a detection limit of 0.07 µM. The kinetic
parameters such as electron transfer coefficient (0.47) and rate constant (2.454 × 10³ M-1 s-1) were determined for the chemical reaction between HX and DED. Finally, this method was evaluated for the determination of HX in water and waste water samples.
Keywords Hydroxylamine; NiO nanoparticle; water and waste water analysis; sensor; voltammetry
Introduction
Hydroxylamine (HX) is known as a type of reducing agent and is widely used in industrial and
pharmaceutical applications. It has been identified as a key intermediate in nitrogen cycles and
nitrous oxide production [1]. The quantitative determination of HX is very important in both
studies of biological processes and for industrial purposes. It has been confirmed that HX is
produced during the reduction of nitrates by Escherichia coli and Torula yeast [2].

J. Electrochem. Sci. Eng. 4(4) (2014) 1350-144 VOLTAMMETRIC DETERMINATION OF HYDROXYLAMINE
136
Electrochemical analysis is gaining significance within industrial process control, environmental
monitoring and various pharmaceutical and biotechnology applications [3-7]. The use of
unmodified electrodes for electrochemical detection has a number of limitations, such as low
selectivity and sensitivity, poor reproducibility, slow electron transfer reaction, low stability over a
wide range of solution compositions and the high overpotential at which the electron transfer
process occurs [8-10]. Chemical modification of inert substrate electrodes with redox active thin
films offers significant advantages in the design and development of electrochemical sensors. In
operation, the redox active sites shuttle electrons between the analyte and the electrodes with a
significant reduction in activation overpotential [11]. A further advantage of chemically modified
electrodes is that they are less prone to surface fouling and oxide formation, compared to inert
substrate electrodes [12-14]. A wide variety of compounds have been used as electron transfer
mediators for the modification of electrode surfaces in various procedures [15-17].
Nanotechnology has become one of the most interesting disciplines in science and technology
today. The intense interest in nanotechnology is being driven by various interesting fields and is
creating a new industrial revolution [18]. Nano-materials such as nanoparticles, carbon nanotubes
or nanocomposite connected with biomolecules are being used for several bioanalytical
applications [19-21]. Electroanalysis is taking advantage of all the possibilities offered by
nanomaterials that are easy to detect using conventional electrochemical methods.
Nanocomposite of a variety of shapes, sizes and compositions continues to change the field of
bioanalytical measurement.
In the present work, we describe the preparation and suitability of a DED modified NiO/NPs
carbon paste electrode as a new electrode for electrocatalysis and determination of HX in an
aqueous buffer solution. To demonstrate the catalytic ability of the modified electrode toward the
electrooxidation of HX in real samples, we examined the utility of this method for the
voltammetric determination of HX in water and waste water samples.
Experiment
Chemicals
All chemicals used were of analytical reagent grade purchased from Merck (Darmstadt,
Germany), unless otherwise stated. Doubly distilled water was used throughout.
1.0×10⁻² mol L–1 HX solution was prepared daily by dissolving 0.064 g HX in water and the
solution was diluted to 100 mL with water in a 100 mL volumetric flask. The solution was kept in a
refrigerator at 4oC and in the dark. Further dilution was made with water.
Phosphate buffer solutions (sodium dihydrogen phosphate and disodium monohydrogen
phosphate, plus sodium hydroxide, 0.1 mol L–1) (PBS) with different pH values were used.
High viscosity paraffin (d = 0.88 kg L–1) from Merck was used as the pasting liquid for the
preparation of the carbon paste electrode. Spectrally pure graphite powder (particle size <50 µm)
from Merck was used as the substrate for the preparation of the carbon paste electrode as a
working electrode.
Apparatus
Cyclic voltammetry (CV), chronoamperometry and square wave voltammetry (SWV) were
performed using an analytical system, Autolab, with PGSTAT 302N (Eco Chemie, The Netherlands).
The system was run on a PC using GPES software. A conventional three-electrode cell assembly
consisting of a platinum wire as an auxiliary electrode and an Ag/AgCl (KClsat) electrode as a
S. Kaushal at al. J. Electrochem. Sci. Eng. 4(4) (2014) 1350-144
doi: 10.5599/jese.2014.0049 137
reference electrode was used. The working electrode was either an unmodified carbon paste
electrode (CPE) or a DED/NiO/NPs/CPE. X-ray powder diffraction studies were carried out using a
STOE diffractometer with Cu–K radiation (l = 1.54 Å).
Preparation of the modified electrode
To prepare the modified electrode, 150.0 mg of NiO/NPs and 70.0 mg of DED was hand mixed
with 780.0 mg of graphite powder using a mortar and pestle. Using a syringe, 15 drops of paraffin
were added to the mixture and mixed well for 55 min until a uniformly wetted paste was obtained.
The paste was then packed into a glass tube. By pushing a copper wire down the glass tube into
the back of the mixture, electrical contact was created. When necessary, a new surface was
obtained by pushing an excess of the paste out of the tube and polishing it on weighing paper. The
unmodified carbon paste electrode (CPE) was prepared in the same way without NiO/NPs and DED
to the mixture, to be used for comparison purposes.
Preparation of real samples
Water samples were stored in a refrigerator immediately after collection. Ten millilitres of the
sample was centrifuged for 15 min at 1500 rpm. The supernatant was filtered using a 0.45 µm
filter and then diluted three times with the PBS pH 8.0. The solution was transferred into the
voltammetric cell to be analysed without any further pre-treatment. The standard addition
method was used for the determination of HX in real samples.
Results and discussion
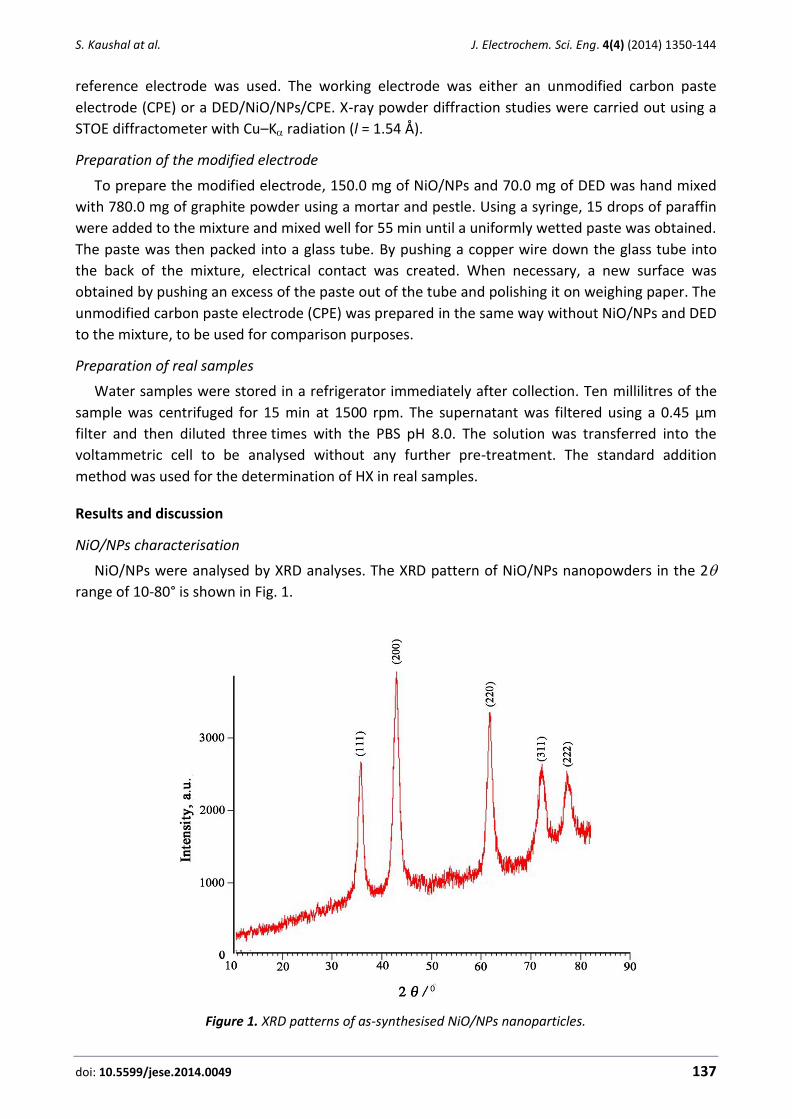
NiO/NPs characterisation
NiO/NPs were analysed by XRD analyses. The XRD pattern of NiO/NPs nanopowders in the 2
range of 10-80° is shown in Fig. 1.
Figure 1. XRD patterns of as-synthesised NiO/NPs nanoparticles.

J. Electrochem. Sci. Eng. 4(4) (2014) 1350-144 VOLTAMMETRIC DETERMINATION OF HYDROXYLAMINE
138
Figure 1 clearly proves the presence of NiO/NPs. An average diameter of as-synthesised
NiO/NPs was calculated from the broadness peak (2 = 44°) by using the Scherrer equation
D = Kλ/ cos , and measured about 25.0 nm.
Electrochemical investigation
Figure 2 depicts the cyclic voltammetry responses from the electrochemical oxidation of 400
µM HX at DED/NiO/NPs/CPE (curve c), DED/CPE (curve b), NiO/NPs/CPE (curve d) and unmodified
CPE (curve e). As shown, the anodic peak potential for HX oxidation at DED/NiO/NPs/CPE (curve c)
and at DED/CPE (curve b) was about 200 mV, while at NiO/NPs/CPE (curve d); the peak potential
was about 1000 mV. At the unmodified CPE, the peak potential of HX was about 1050 mV
(curve e). From these results, it was concluded that the best electrocatalytic effect for HX
oxidation was observed at DED/NiO/NPs/CPE (curve c).
Figure 2. Cyclic voltammograms of (a) the buffer solution at DED/NiO/NPs/CPE; (b) 400 µM HX at DED/CPE; (c) 400 µM HX at DED/NiO/NPs/CPE; (d) 400. µM HX at NiO/NPs/CPE; (e) 400 µM
HX at CPE. Conditions: 0.1 mol L-1 PBS (pH 8.0), scan rate of 20 mV s-1.
For example, the results show that the peak potential of HX oxidation at DED/NiO/NPs/CPE
(curve c) shifted by about 800 and 850 mV toward less positive values when compared with
NiO/NPs/CPE (curve d) and unmodified CPE (curve e), respectively. Additionally, DED/NiO/NPs/CPE
showed higher anodic peak current for the oxidation of HX compared to DED/CPE, indicating that
the combination of NiO/NPs and the mediator significantly improved the performance of the
electrode toward HX oxidation. In fact, DED/NiO/NPs/CPE in the absence of HX exhibited a well-
behaved redox reaction (Figure 2a) in the buffer solution (pH 8.0). However, there was a drastic
increase in the anodic peak current in the presence of 400 µM HX (curve c), which can be related
to the electrocatalytic role of DED/NiO/NPs/CPE towards oxidation of HX.
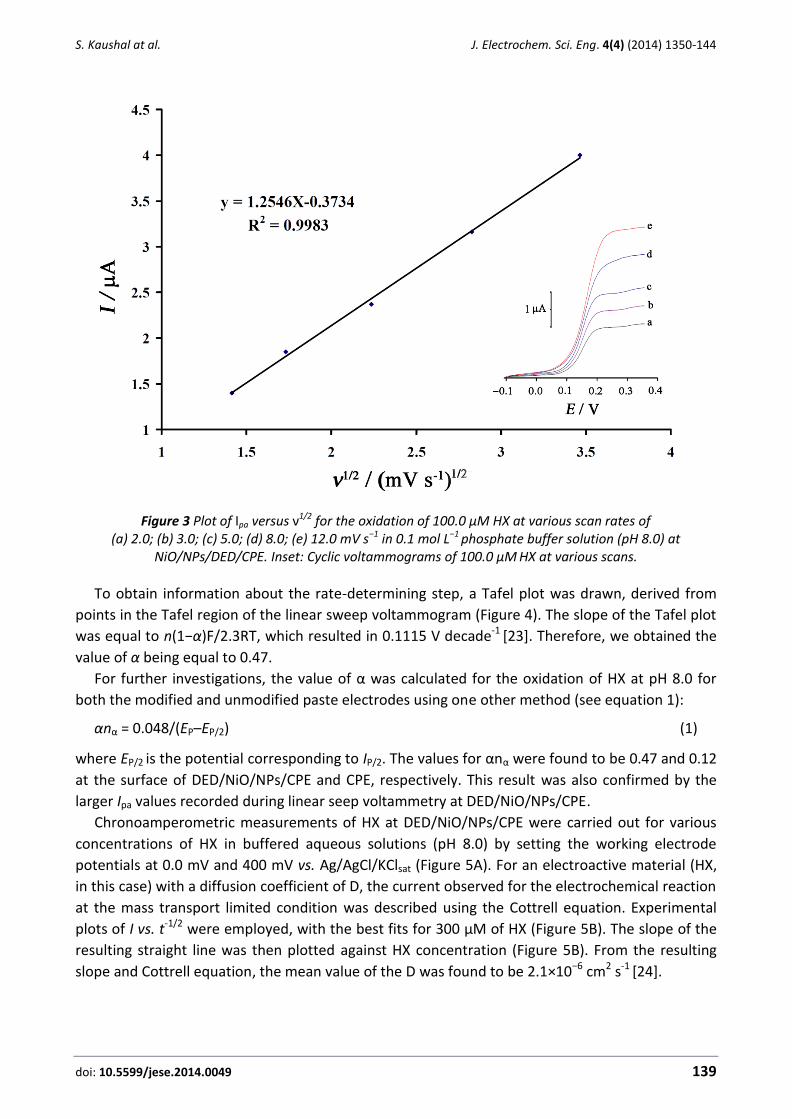
We observed a linear variation of the peak current with the square root of scan rate (ν1/2) at
scan rates ranging from 2-12 mV s–1 at pH 8.0 (Figure 3). This result clearly indicates a diffusion-
controlled electrooxidation process [22].
S. Kaushal at al. J. Electrochem. Sci. Eng. 4(4) (2014) 1350-144
doi: 10.5599/jese.2014.0049 139
Figure 3 Plot of Ipa versus ν1/2 for the oxidation of 100.0 µM HX at various scan rates of (a) 2.0; (b) 3.0; (c) 5.0; (d) 8.0; (e) 12.0 mV s−1 in 0.1 mol L−1 phosphate buffer solution (pH 8.0) at
NiO/NPs/DED/CPE. Inset: Cyclic voltammograms of 100.0 μM HX at various scans.
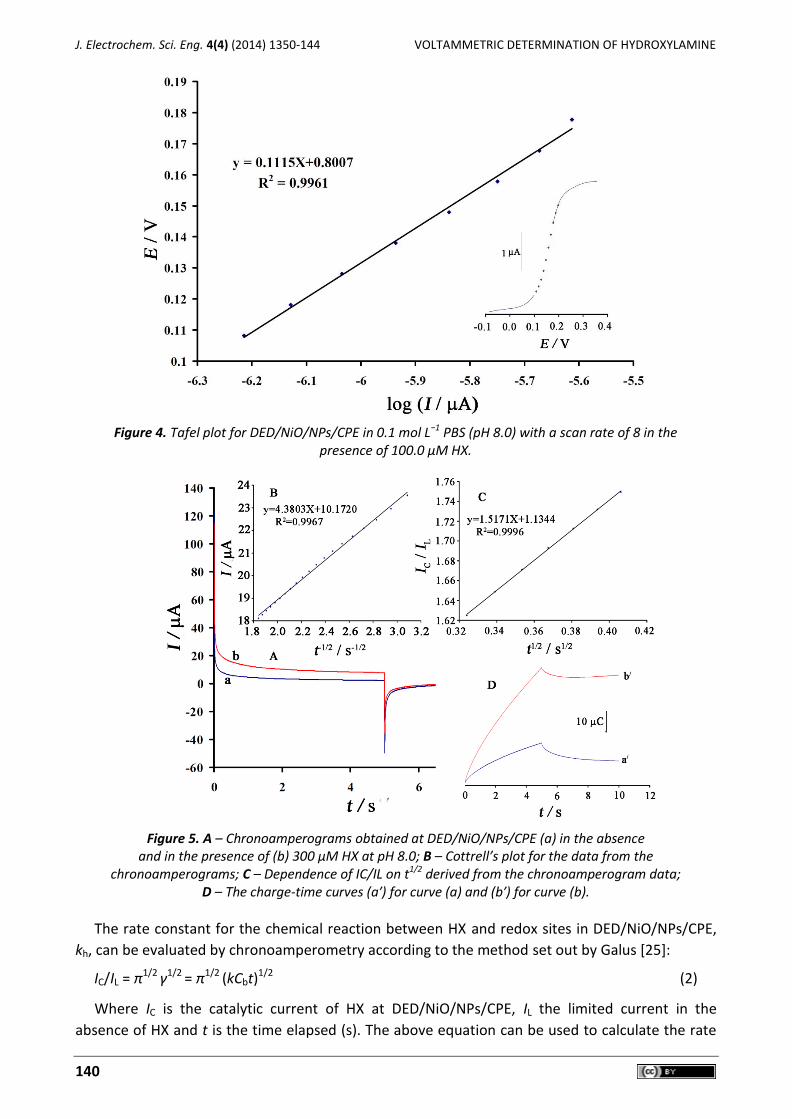
To obtain information about the rate-determining step, a Tafel plot was drawn, derived from
points in the Tafel region of the linear sweep voltammogram (Figure 4). The slope of the Tafel plot
was equal to n(1−α)F/2.3RT, which resulted in 0.1115 V decade-1 [23]. Therefore, we obtained the
value of α being equal to 0.47.
For further investigations, the value of α was calculated for the oxidation of HX at pH 8.0 for
both the modified and unmodified paste electrodes using one other method (see equation 1):
αnα = 0.048/(EP–EP/2) (1)
where EP/2 is the potential corresponding to IP/2. The values for αnα were found to be 0.47 and 0.12
at the surface of DED/NiO/NPs/CPE and CPE, respectively. This result was also confirmed by the
larger Ipa values recorded during linear seep voltammetry at DED/NiO/NPs/CPE.
Chronoamperometric measurements of HX at DED/NiO/NPs/CPE were carried out for various
concentrations of HX in buffered aqueous solutions (pH 8.0) by setting the working electrode
potentials at 0.0 mV and 400 mV vs. Ag/AgCl/KClsat (Figure 5A). For an electroactive material (HX,
in this case) with a diffusion coefficient of D, the current observed for the electrochemical reaction
at the mass transport limited condition was described using the Cottrell equation. Experimental
plots of I vs. t-1/2 were employed, with the best fits for 300 µM of HX (Figure 5B). The slope of the
resulting straight line was then plotted against HX concentration (Figure 5B). From the resulting
slope and Cottrell equation, the mean value of the D was found to be 2.1×10⁻⁶ cm2 s-1 [24].
J. Electrochem. Sci. Eng. 4(4) (2014) 1350-144 VOLTAMMETRIC DETERMINATION OF HYDROXYLAMINE
140
Figure 4. Tafel plot for DED/NiO/NPs/CPE in 0.1 mol L−1 PBS (pH 8.0) with a scan rate of 8 in the
presence of 100.0 µM HX.
Figure 5. A – Chronoamperograms obtained at DED/NiO/NPs/CPE (a) in the absence
and in the presence of (b) 300 μM HX at pH 8.0; B – Cottrell’s plot for the data from the chronoamperograms; C – Dependence of IC/IL on t1/2 derived from the chronoamperogram data;
D – The charge-time curves (a′) for curve (a) and (b′) for curve (b).
The rate constant for the chemical reaction between HX and redox sites in DED/NiO/NPs/CPE,
kh, can be evaluated by chronoamperometry according to the method set out by Galus [25]:
IC/IL = π1/2 γ1/2 = π1/2 (kCbt)1/2 (2)
Where IC is the catalytic current of HX at DED/NiO/NPs/CPE, IL the limited current in the
absence of HX and t is the time elapsed (s). The above equation can be used to calculate the rate

S. Kaushal at al. J. Electrochem. Sci. Eng. 4(4) (2014) 1350-144
doi: 10.5599/jese.2014.0049 141
constant of the catalytic process kh. Based on the slope of the IC/IL versus t1/2 plots (Figure 5C), kh
can be obtained for a given HX concentration. From the values of the slopes, an average value of
kh was found to be kh = 2.454×10³ M–1 s–1. The value of kh also explains the sharp feature of the
catalytic peak observed for catalytic oxidation of HX at the surface of DED/NiO/NPs/CPE.
Double potential step chronocoulometry, as well as other electrochemical methods, was in
addition employed for the investigation of the electrode processes at DED/NiO/NPs/CPE. Forward
and backward potential step chronocoulometry on the modified electrode in a blank buffer
solution showed very symmetrical chronocoulograms. These had about an equal charge consumed
for both oxidation and reduction of the DEDRed/DEDOx redox system in DED/NiO/NPs/CPE.
However, in the presence of HX, the charge value associated with forward chronocoulometry was
significantly greater than that observed for the backward chronocoulometry (Figure 5D). This
behaviour is typical of that expected for electrocatalysis at a chemically modified electrode [26].
Stability and reproducibility
The repeatability and stability of modified electrode was investigated using CV measurements
of 400.0 µM HX in a buffer solution. The relative standard deviation (RSD) for five successive
assays was 1.4 %. When seven different DED/NiO/NPs/CPEs were used, the RSD for ten
measurements was 2.1 %. When the electrode was stored in the laboratory, the modified
electrode retained 95 % of its initial response after a week and 92 % after 30 days (see Figure 6).
These results indicate that DED/NiO/NPs/CPE has good stability and reproducibility, and could be
used for HX measurements.
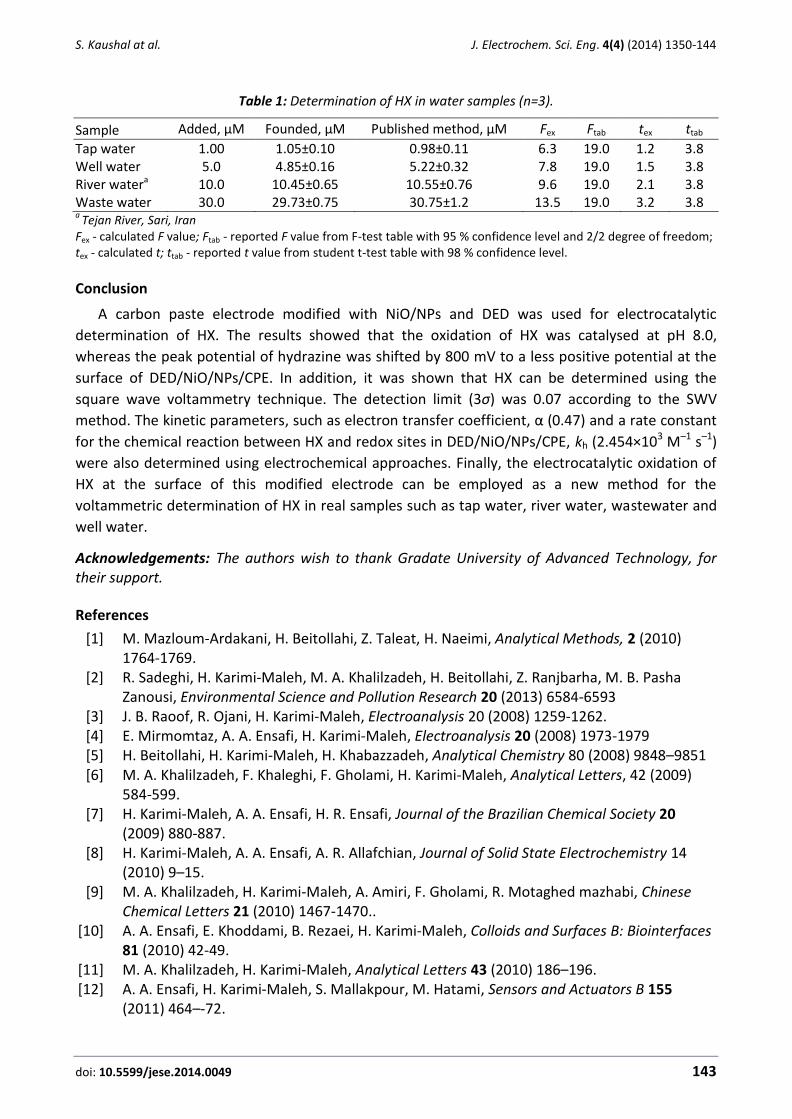
Determination of HX individually
Square wave voltammetry (SWV) was used to determine the concentration of HX. Since square
wave voltammetry has a much higher current sensitivity and better resolution than cyclic voltam-
metry, the SWV was used for the determination of HX (Figure 7 inset). The plot of peak current vs.
the HX concentration consisted of two linear segments with slopes of 5.9035 and 0.1498 µA/µM at
the concentration ranges of 0.1-2.0 µM and 2.0-400.0 µM, respectively (Fig. 7).
Figure 6. Cyclic voltammograms of 300 μM HX at a surface of DED/NiO/NPs/CPE in a 0.1 mol
L−1 phosphate buffer solution (pH 8.0) at different times.
J. Electrochem. Sci. Eng. 4(4) (2014) 1350-144 VOLTAMMETRIC DETERMINATION OF HYDROXYLAMINE
142
The decreasing of sensitivity (slope) of the second linear segment was likely due to kinetic
limitation. The detection limit was determined as 0.07 µM for HX based on YLOD = YB+3σ.
Interference study and real sample studies
Analytical selectivity was one of the important parameters that affected the accuracy of the
analysis. In order to evaluate the selectivity of the proposed method for the determination of HX,
the influence of various substances as potentially interfering compounds, which can be present in
the water and waste water samples with the determination of HX, were studied under optimum
conditions with 1.0 µM HX at pH 8.0. The tolerance limit was taken as the maximum concentration
of the foreign substances, which caused an approximate 3% relative error (in potential or current)
in the determination. The result of interfering studied for some of the various substances in
oxidation current and oxidation peak potential of HX showed that 1000-fold of Ni2+, CN–, Ca2+,
Mg2+, Mn+2, K+, Na+, Cl- and SCN–, 800-fold of glucose, sucrose, lactose and fructose did not affect
the selectivity.
Figure 7. The plots of the electrocatalytic peak current as a function of HX concentration. Inset
shows the SWVs of DED/NiO/NPs/CPE in a 0.1 mol L−1 phosphate buffer solution (pH 8.0) containing different concentrations of HX. From bottom-up corresponds to 0.0, 0.1, 0.5, 1.0,
2.0, 50.0, 100.0, 150.0, 200.0, 250.0, 300.0, 350.0 and 400.0 μM of HX.
In order to demonstrate the applicability of the new sensor in determining HX in real samples,
we used the new sensor in determining HX in tap water, river water, wastewater and well water.
The determinations of HX in samples were carried out using the standard addition method
(Table 1). The accuracy of the method was examined by comparing the results obtained from this
method with published methods for the determination of HX [2]. The results from the statistical
calculation indicated good agreement between them for the mean values (t-test) and the precision
(F-test) in the determination of HX in real samples for the three analyses. It was clear that a
modified electrode was capable of voltammetric determination of HX, with high selectivity and
good reproducibility.
S. Kaushal at al. J. Electrochem. Sci. Eng. 4(4) (2014) 1350-144
doi: 10.5599/jese.2014.0049 143
Table 1: Determination of HX in water samples (n=3).
Sample Added, µM Founded, µM Published method, µM Fex Ftab tex ttab
Tap water 1.00 1.05±0.10 0.98±0.11 6.3 19.0 1.2 3.8 Well water 5.0 4.85±0.16 5.22±0.32 7.8 19.0 1.5 3.8 River watera 10.0 10.45±0.65 10.55±0.76 9.6 19.0 2.1 3.8 Waste water 30.0 29.73±0.75 30.75±1.2 13.5 19.0 3.2 3.8 a
Tejan River, Sari, Iran Fex - calculated F value; Ftab - reported F value from F-test table with 95 % confidence level and 2/2 degree of freedom; tex - calculated t; ttab - reported t value from student t-test table with 98 % confidence level.
Conclusion
A carbon paste electrode modified with NiO/NPs and DED was used for electrocatalytic
determination of HX. The results showed that the oxidation of HX was catalysed at pH 8.0,
whereas the peak potential of hydrazine was shifted by 800 mV to a less positive potential at the
surface of DED/NiO/NPs/CPE. In addition, it was shown that HX can be determined using the
square wave voltammetry technique. The detection limit (3σ) was 0.07 according to the SWV
method. The kinetic parameters, such as electron transfer coefficient, α (0.47) and a rate constant
for the chemical reaction between HX and redox sites in DED/NiO/NPs/CPE, kh (2.454×10³ M–1 s–1)
were also determined using electrochemical approaches. Finally, the electrocatalytic oxidation of
HX at the surface of this modified electrode can be employed as a new method for the
voltammetric determination of HX in real samples such as tap water, river water, wastewater and
well water.
Acknowledgements: The authors wish to thank Gradate University of Advanced Technology, for their support.
References
[1] M. Mazloum-Ardakani, H. Beitollahi, Z. Taleat, H. Naeimi, Analytical Methods, 2 (2010) 1764-1769.
[2] R. Sadeghi, H. Karimi-Maleh, M. A. Khalilzadeh, H. Beitollahi, Z. Ranjbarha, M. B. Pasha Zanousi, Environmental Science and Pollution Research 20 (2013) 6584-6593
[3] J. B. Raoof, R. Ojani, H. Karimi-Maleh, Electroanalysis 20 (2008) 1259-1262. [4] E. Mirmomtaz, A. A. Ensafi, H. Karimi-Maleh, Electroanalysis 20 (2008) 1973-1979 [5] H. Beitollahi, H. Karimi-Maleh, H. Khabazzadeh, Analytical Chemistry 80 (2008) 9848–9851 [6] M. A. Khalilzadeh, F. Khaleghi, F. Gholami, H. Karimi-Maleh, Analytical Letters, 42 (2009)
584-599. [7] H. Karimi-Maleh, A. A. Ensafi, H. R. Ensafi, Journal of the Brazilian Chemical Society 20
(2009) 880-887. [8] H. Karimi-Maleh, A. A. Ensafi, A. R. Allafchian, Journal of Solid State Electrochemistry 14
(2010) 9–15. [9] M. A. Khalilzadeh, H. Karimi-Maleh, A. Amiri, F. Gholami, R. Motaghed mazhabi, Chinese
Chemical Letters 21 (2010) 1467-1470.. [10] A. A. Ensafi, E. Khoddami, B. Rezaei, H. Karimi-Maleh, Colloids and Surfaces B: Biointerfaces
81 (2010) 42-49. [11] M. A. Khalilzadeh, H. Karimi-Maleh, Analytical Letters 43 (2010) 186–196. [12] A. A. Ensafi, H. Karimi-Maleh, S. Mallakpour, M. Hatami, Sensors and Actuators B 155
(2011) 464–-72.
J. Electrochem. Sci. Eng. 4(4) (2014) 1350-144 VOLTAMMETRIC DETERMINATION OF HYDROXYLAMINE
144
[13] A. A. Ensafi, H. Karimi-Maleh, S. Mallakpour, B. Rezaei, Colloids and Surfaces B 87 (2011) 480-488.
[14] A .A. Ensafi, H. Karimi-Maleh, M. Ghiaci, M. Arshadi, Journal of Material Chemistry 21 (2011) 15022-15030
[15] R. Moradi, S. A. Sebt, H. Karimi-Maleh, R. Sadeghi, F. Karimi, A. Bahari, H. Arabi, Physical Chemistry Chemistry Physics 15 (2013) 5888-5897.
[16] M. Keyvanfard, R. Shakeri, H. Karimi-Maleh, K. Alizad, Materials Science and Engineering C 33 (2013) 811-816
[17] M. Roodbari Shahmiri, A. Bahari, H. Karimi-Maleh, R. Hosseinzadeh, N. Mirnia, Sensors and Actuators B 177 (2013) 70-77.
[18] M. Elyasi, M. A. Khalilzadeh, H. Karimi-Maleh, Food Chemistry 141 (2013) 4311-4317. [19] A. L. Sanati, H. Karimi-Maleh, A. Badiei, P. Biparva, A. A. Ensafi, Materials Science and
Engineering C 35 (2014) 379–385. [20] H. Karimi-Maleh, M. Moazampour, H. Ahmar, H. Beitollahi, A. A. Ensafi, Measurement 51
(2014) 91–99 [21] T. Tavana, M. A. Khalilzadeh, H. Karimi-Maleh, A. A. Ensafi, H. Beitollahi, D. Zareyee, Journal
of Molecular Liquids 168 (2012) 69-74. [22] H. Karimi-Maleh, M. Moazampour, H. Ahmar, H. Beitollahi, A.A. Ensafi, Measurement 51
(2014) 91-99. [23] N. B. Salah, F. M. Mhalla, Journal of Electroanalytical Chemistry 485 (2000) 42-48. [24] M. Mazloum Ardakani, M. A. Karimi, S. M. Mirdehghan, M. M. Zare, R. Mazidi, Sensors and
Actuators B 132 (2008) 52-59. [25] Z. Galus, Fundamentals of Electrochemical Analysis, Ellis Horwood, New York, 1976. [26] M. Keyvanfard, S. Sami, H. Karimi-Maleh, K. Alizad, Journal of the Brazilian Chemical Society
24 (2013) 32-39.
© 2014 by the authors; licensee IAPC, Zagreb, Croatia. This article is an open-access article distributed under the terms and conditions of the Creative Commons Attribution license
(http://creativecommons.org/licenses/by/4.0/)

doi: 10.5599/jese.2014.0051 145
J. Electrochem. Sci. Eng. 4(4) (2014) 145-154; doi: 10.5599/jese.2014.0051
Open Access: ISSN 1847-9286
www.jESE-online.org
Original scientific paper
Analytical method for heavy metal determination in algae and turtle eggs from Guanahacabibes Protected Sea Park
Abel I. Balbín Tamayo, Ana M. Esteva Guas, Juan J. Piña Leyte-Vidal and Marcelo Maccini*
Department of Analytical Chemistry, Faculty of Chemistry, University of Havana, Havana, 10400, Cuba *Department of Food Science, University of Teramo, 64023, Teramo, Italy
Corresponding author: E-mail: [email protected]; Tel.: +53 873 82 22
Received: February 4, 2014; Revised: April 4, 2014; Published: December 6, 2014
Abstract A standard digestion method coupled to electrochemical detection for the monitoring of heavy metals in biological samples has been used for the simultaneous analysis of the target analytes. Square wave anodic stripping voltammetry (SWASV) coupled to disposable screen-printed electrodes (SPEs) was employed as a fast and sensitive electroanalytical method for the detection of heavy metals. The aim of our study was to determine Cd, Pb and Cu by SWASV in brown algae (Sargasum natan) and green turtle eggs (Chelonia mydas) using screen-printed electrodes. The method proved useful for the simultaneous analysis of these metals by comparison between two different procedures for preparing the samples. Two different approaches in digestion protocols were assessed. The study was focused on Guanahacabibes brown algae and green turtle eggs because the metal concentrations recorded in this area may be used for intraspecific comparison within the Guanahacabibes Protected Sea Park area, a body of water for which information is still very scarce. The best results were obtained by digesting biological samples with the EPA 3050B method. This treatment allowed the fast and quantitative extraction from brown algae and green turtle eggs of the target analytes, with high sensitivity and avoiding organic residues, eventually affecting electrochemical measurements.
Keywords Cadmium; copper; lead; Sargasum Natan; Chelonia Mydas eggs; square-wave anodic stripping
Introduction
Marine contaminations by anthropogenic chemicals pose one of the worst problems to coastal
and estuarine ecosystems around the word. Certain heavy metals have gained great significance in
chemical and toxicological studies of the environment. Among those heavy metals are Cd and Pb,
J. Electrochem. Sci. Eng. 4(4) (2014) 145-154 HEAVY METAL DETERMINE IN ALGAE AND TURTLES EGGS
146
which are generally toxic even at very low levels, and potentially toxic metals, e.g. Cu which also
has indispensable essential properties with different threshold levels in different types of plants
and organisms, including man. Therefore, the evaluation of heavy metal concentrations in marine
organisms constitutes an important area of research [1-4].
The use of marine organisms (algae, turtles eggs, fish, etc.) as bioindicators to trace metal
pollution is very common these days [5-7].
Macroalgae are able to accumulate trace metals, reaching concentrations that are thousands of
times higher than the corresponding concentrations in sea water. Algae accumulate only free
metal ions, the concentrations of which depend on the nature of suspended particulate matter [8],
which, in turn, is formed by both organic and inorganic complexes. Moreover, algae satisfy all of
the basic requirements of bioindicators: they are sedentary, their dimensions are suitable, they
are easy to identify and collect, they are widely distributed, and they accumulate metals to a
satisfactory degree [9].
On the other hand, many investigations have reported the accumulation of heavy metals in
marine sea turtle having a long lifespan and occupying high trophic levels in the marine food
chains, and showed the utility of this specie as a biological indicator of heavy metal pollution. The
intentional killing of any living sea turtle is prohibited, except for research purposes, for which only
very limited samples are available. Hence, it is possible to estimate the concentration of heavy
metals in the tissue of nesting female sea turtles by using their eggs [10-15]. For that reason, the
eggs are a useful non-lethal indicator for monitoring heavy metals in the body of sea turtles.
A wet-digestion procedure can be applied to all types of biological materials. In this procedure,
small amounts of nitric and perchloric acids are added to the sample material. The overall
reliability of the digestion method will follow the adequate mineralisation of samples, i.e. the
levels of the heavy metals. If any metals were linked in their insoluble form, they are not of
relevance for pollution control [16].
The digestion method involves the liberation of the analyte (metal) of interest from an
interfering matrix using a reagent (mineral/oxidising acids or fusion flux) and/or heat. The
utilisation of reagents (acids) and external heat sources can then cause problems. In elemental
analysis, these problems are particularly focused on the risk of contamination and loss of
analytes [17-19].
Considering the low content of heavy metals in environmental samples, sensitive analytical
methods are required. The heavy metal determination in organic samples can usually be carried
out by atomic spectrometry: inductively-coupled plasma optical emission (ICP-OES) or
electrothermal and flame atomic absorption spectrometry (ETAAS and FAAS), although the
detection limits are not sufficient when the concentrations are too low. However, many pre-
concentration techniques have been employed for analysing complex matrices and samples with
low levels of metals. Hence, square-wave anodic stripping voltammetry (SWASV) includes a pre-
concentration step in situ; for this reason, this is an electroanalytical technique used for the
analysis of traces metals in solution [20-27]. Such a combination of an effective accumulation step
with an advanced measurement procedure results in a very low detection limit, and makes
stripping analysis one of the most important techniques in trace analysis.
The coupling of disposable screen-printed electrodes with stripping techniques is a revolution in
comparison with conventional stripping analysis: the design and operation are greatly simplified,
in accordance with the requirements of a decentralised assay. The greater proportion of articles
A. I. Balbín Tamayo at al. J. Electrochem. Sci. Eng. 4(4) (2014) 145-154
doi: 10.5599/jese.2014.0051 147
have utilised the technique of stripping voltammetry, gaining detection limits in the low ng/mL
(ppb) region [28].
Screen-printed electrodes are planar devices realised by printing layers of different
electroconductive and insulating inks with controlled thickness and shapes on a plastic substrate.
In this work, the carbon surface of the screen-printed working electrode was employed as a
substrate for a thin mercury film (TMF) [29].
The aim of our study was to apply a digestion method (EPA 3050B) to determine Cd, Pb and Cu
by square-wave anodic stripping voltammetry in brown algae (Sargasum natan) and green turtle
(Chelonia mydas) eggs, using a screen-printed electrode, and it demonstrated the usefulness of
this method for the simultaneous analysis of Cd, Pb and Cu by comparison between two different
procedures for preparing the samples.
Experimental
Collecting and treatment of samples
The study area was located in Antonio beach Guanahacabibes Protected Sea Park. This site is
situated in an area characterised by low anthropogenic activity [30].
The sample of brown algae (Sargasum natan) was handpicked in the subtidal zone at a depth of
about 2-3 m. Care was taken to choose the sample to ensure that all were at a similar stage of
development. The samples were washed in seawater at the sampling site and transferred to the
laboratory in pre-cleaned polyethylene bags under refrigerated conditions. Upon arrival at the
laboratory, they were thoroughly cleaned and any sediment was carefully removed with nylon
brushes under tap water for a few seconds. Algal material was rapidly rinsed in deionised water
(Milli-Q, Millipore Corp) to minimise any possible metal loss during the procedure and was then
pulverised. Finally, the samples were frozen and stored (4 °C) until analysis.
The green turtle (Chelonia mydas) egg samples were collected in the nesting area of this
species. All samples were stored at 4 °C until chemical analysis, and then the eggshell, the
albumen and the yolk were subsequently separated. The separation was carried out quickly to
prevent thawing.
Samples were digested by two separate digestion procedures in order to select the simplest,
which in turn would provide suitable analytical results:
a) General acid digestion: A 1 g dried sample was placed in a Teflon beaker; the acid digestion
reagent (concentrated HNO3) was added and the mixture was allowed to stand overnight.
The sample was heated until the production of red NO2 fumes had ceased. This mixture was
digested via the addition of HClO4 and was heated until it had evaporated to a small volume.
The samples were brought to an appropriate volume with a dilute acid solution (0.01 mol L-1
HCl).
b) The method EPA 3050B [17,18,31] was used to produce a transparent solution. This is a very
strong acid digestion that will dissolve almost all elements that could become
“environmentally available”. For the digestion of samples, a representative 1 g (dry weight)
sample was digested with the repeated addition of nitric acid (HNO3) and hydrogen peroxide
(H2O2). The resultant solutions were diluted to a known volume with 0.01 mol L-1 HCl.
For each analytical batch of samples processed, blanks were carried throughout the entire
sample preparation and analytical process. These blanks will be useful for determining whether
samples are contaminated, and are necessary to provide a realistic estimate of interferences that
could be encountered in the analysis of test samples.

J. Electrochem. Sci. Eng. 4(4) (2014) 145-154 HEAVY METAL DETERMINE IN ALGAE AND TURTLES EGGS
148
Heavy metal determination
All experiments were carried out using a PalmSens portable electrochemical analyser (Palmsens
BV, Houten, The Netherlands). The conditions for square wave voltammetry striping onto a screen-
printed electrode of carbon modified by plated Hg films were:
Cd(II), Pb(II) and Cu(II) analysis: conditioning potential (Econd) - 0.3 V for 60 s, deposition
potential (Edep) − 1.0 V for 300 s, equilibration time (teq) 30 s, SW amplitude (Eamp) 28 mV, step
potential (Estep) 3 mV, frequency (f) 15 Hz.
Electrodes were serigraphically screen-printed with a shape similar to that reported by Palchet-
ti [29]. They consisted of a round-shaped working electrode (diameter 3 mm), a graphite counter
electrode and a silver pseudo-reference electrode. In addition, the silver electrical contacts were
covered by a graphite layer in order to prevent oxidation phenomena during storage.
Graphite-based Hg-modified screen-printed electrodes were used as the working electrode.
These are based on the use of a special coating cellulose-derivative film deposited onto the
graphite working electrodes containing a Hg(II) salt, as reported by Meucci [32]. Hg(II) is reduced
from the salt to the metallic form and the modified sensor can be then used for heavy metal
accumulation and stripping. The use of this strategy allows the use of large amounts of Hg
solutions to be avoided, whilst retaining the high sensitivity which characterises mercury-coated
electrodes [32].
Each sensor was pre-treated in 0.1 mol L-1 HCl before being used for the first time, by applying
ten cycles of square wave voltammetry (SWV) using the following conditions: potential initial 1 V,
potential final 0 V, scan rate 50 mV s-1, SW amplitude (Eamp) 28 mV, step potential (Estep) 3 mV,
frequency (f) 15 Hz. This step is necessary to obtain a stable baseline.
Then, 0.1 mol L-1 HCl was used as the supporting electrolyte. All measurements were performed
without removing oxygen from the solution. The measurements were performed by immersing
the sensor in 5.0 ml of solution, with magnetic stirring during the conditioning and accumulation
steps, whereas the square wave scan was performed without stirring.
Suprapure grade hydrochloric acid was purchased from Merck. The water used for the
preparation of solutions was from a Milli-Q System (Millipore). The working standard solution of
Cd, Pb and Cu was prepared by diluting standard 1 g L-1 metal solutions with 0.01 mol L-1 HCl.
Statistical analysis
For the statistical treatment, the experimental results followed the recommendations proposed
by Miller [33]. Determinations of means, standard deviations, coefficients of variation and
percentage recovered were performed using statistical software.
LOD: The limit of detection, expressed as the concentration cL, or the quantity qL, is derived
from the smallest measure xL, that can be detected with reasonable certainty for a given analytical
procedure. The value of xL is given by equation (1):
xL = xbl + ksbl 1
LOQ: The lowest concentration of an analyte that can be determined with acceptable precision
(repeatability) and accuracy under the stated conditions of the test.
The ability to quantify is generally expressed in terms of the signal or analyte (true) value that
will produce estimates with a specified relative standard deviation (RSD), which is commonly 10%.
A. I. Balbín Tamayo at al. J. Electrochem. Sci. Eng. 4(4) (2014) 145-154
doi: 10.5599/jese.2014.0051 149
Results and Discussion
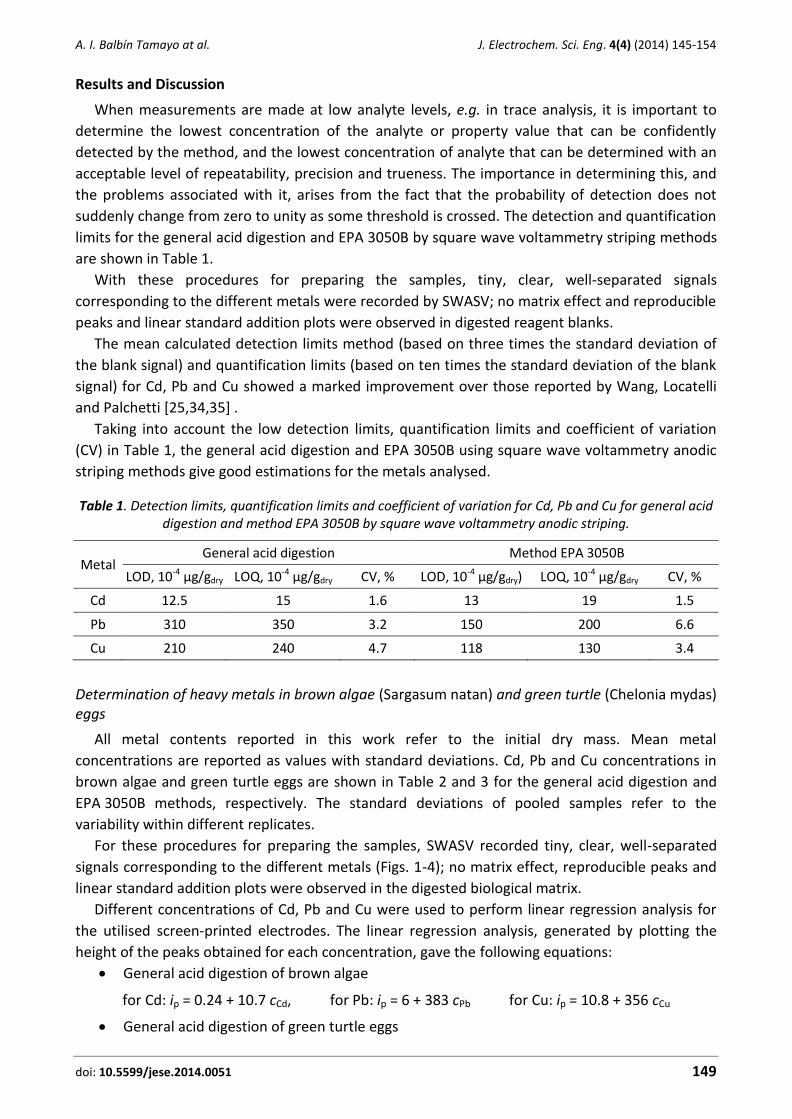
When measurements are made at low analyte levels, e.g. in trace analysis, it is important to
determine the lowest concentration of the analyte or property value that can be confidently
detected by the method, and the lowest concentration of analyte that can be determined with an
acceptable level of repeatability, precision and trueness. The importance in determining this, and
the problems associated with it, arises from the fact that the probability of detection does not
suddenly change from zero to unity as some threshold is crossed. The detection and quantification
limits for the general acid digestion and EPA 3050B by square wave voltammetry striping methods
are shown in Table 1.
With these procedures for preparing the samples, tiny, clear, well-separated signals
corresponding to the different metals were recorded by SWASV; no matrix effect and reproducible
peaks and linear standard addition plots were observed in digested reagent blanks.
The mean calculated detection limits method (based on three times the standard deviation of
the blank signal) and quantification limits (based on ten times the standard deviation of the blank
signal) for Cd, Pb and Cu showed a marked improvement over those reported by Wang, Locatelli
and Palchetti [25,34,35] .
Taking into account the low detection limits, quantification limits and coefficient of variation
(CV) in Table 1, the general acid digestion and EPA 3050B using square wave voltammetry anodic
striping methods give good estimations for the metals analysed.
Table 1. Detection limits, quantification limits and coefficient of variation for Cd, Pb and Cu for general acid digestion and method EPA 3050B by square wave voltammetry anodic striping.
Metal General acid digestion Method EPA 3050B
LOD, 10-4 µg/gdry LOQ, 10-4 µg/gdry CV, % LOD, 10-4 µg/gdry) LOQ, 10-4 µg/gdry CV, %
Cd 12.5 15 1.6 13 19 1.5
Pb 310 350 3.2 150 200 6.6
Cu 210 240 4.7 118 130 3.4
Determination of heavy metals in brown algae (Sargasum natan) and green turtle (Chelonia mydas) eggs
All metal contents reported in this work refer to the initial dry mass. Mean metal
concentrations are reported as values with standard deviations. Cd, Pb and Cu concentrations in
brown algae and green turtle eggs are shown in Table 2 and 3 for the general acid digestion and
EPA 3050B methods, respectively. The standard deviations of pooled samples refer to the
variability within different replicates.
For these procedures for preparing the samples, SWASV recorded tiny, clear, well-separated
signals corresponding to the different metals (Figs. 1-4); no matrix effect, reproducible peaks and
linear standard addition plots were observed in the digested biological matrix.
Different concentrations of Cd, Pb and Cu were used to perform linear regression analysis for
the utilised screen-printed electrodes. The linear regression analysis, generated by plotting the
height of the peaks obtained for each concentration, gave the following equations:
General acid digestion of brown algae
for Cd: ip = 0.24 + 10.7 cCd, for Pb: ip = 6 + 383 cPb for Cu: ip = 10.8 + 356 cCu
General acid digestion of green turtle eggs

J. Electrochem. Sci. Eng. 4(4) (2014) 145-154 HEAVY METAL DETERMINE IN ALGAE AND TURTLES EGGS
150
for Cd: ip = 0.198 + 9 cCd, for Pb: ip = 3.22 + 42 cPb for Cu: ip = 3.5 + 44 cCu
EPA 3050B of brown algae
for Cd: ip = 0.43 + 16 cCd, for Pb: ip = 3.38 + 227 cPb for Cu: ip = 3.95 + 59 cCu
EPA 3050B of green turtle eggs
for Cd: ip = 0.27 + 6.6 cCd, for Pb: ip = 7.64 + 84 cPb for Cu: ip = 7.9 + 88 cCu
E / V vs. Ag/AgCl
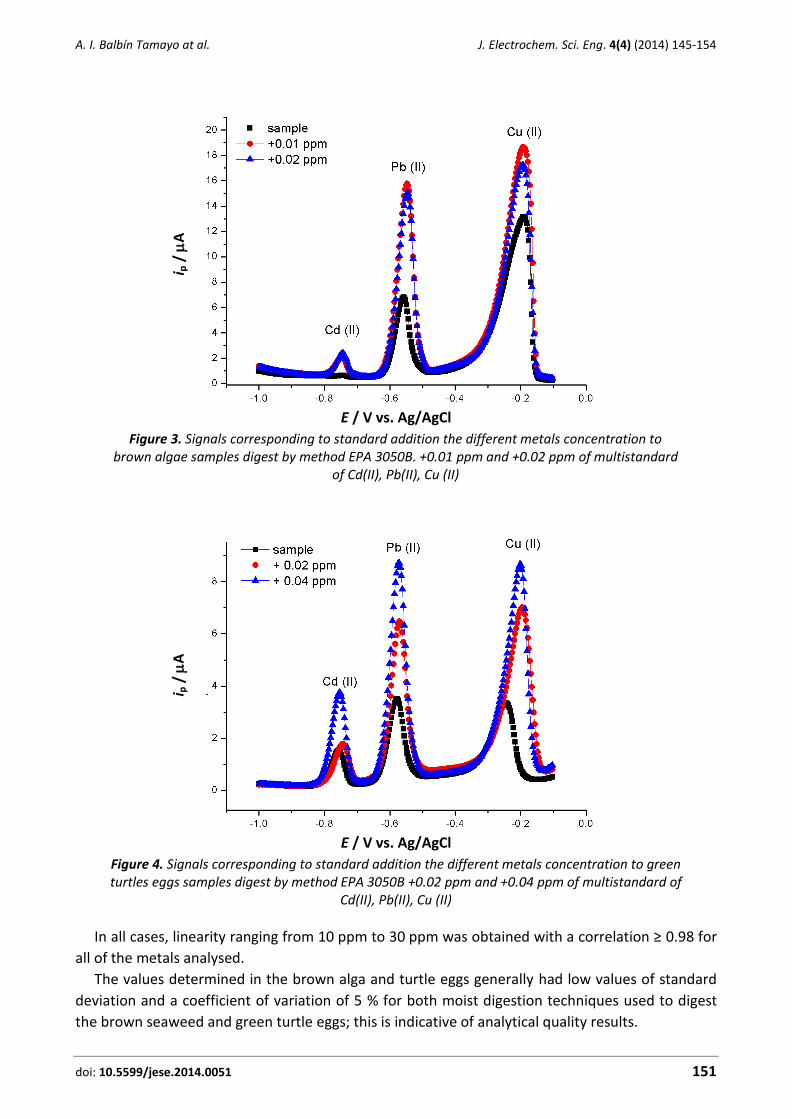
Figure 1. Signals corresponding to standard addition the different metals concentration to brown algae samples digest by method General acid digestion. +0.02 ppm and +0.04 ppm
of multistandard of Cd(II), Pb(II), Cu (II)
E / V vs. Ag/AgCl
Figure 2. Signals corresponding to standard addition the different metals concentration to green turtles eggs samples digest by method General acid digestion +0.01 pm and +0.02 ppm of
multistandard of Cd(II), Pb(II), Cu (II).
i p /
A
i p
/
A
A. I. Balbín Tamayo at al. J. Electrochem. Sci. Eng. 4(4) (2014) 145-154
doi: 10.5599/jese.2014.0051 151
E / V vs. Ag/AgCl
Figure 3. Signals corresponding to standard addition the different metals concentration to brown algae samples digest by method EPA 3050B. +0.01 ppm and +0.02 ppm of multistandard
of Cd(II), Pb(II), Cu (II)
E / V vs. Ag/AgCl
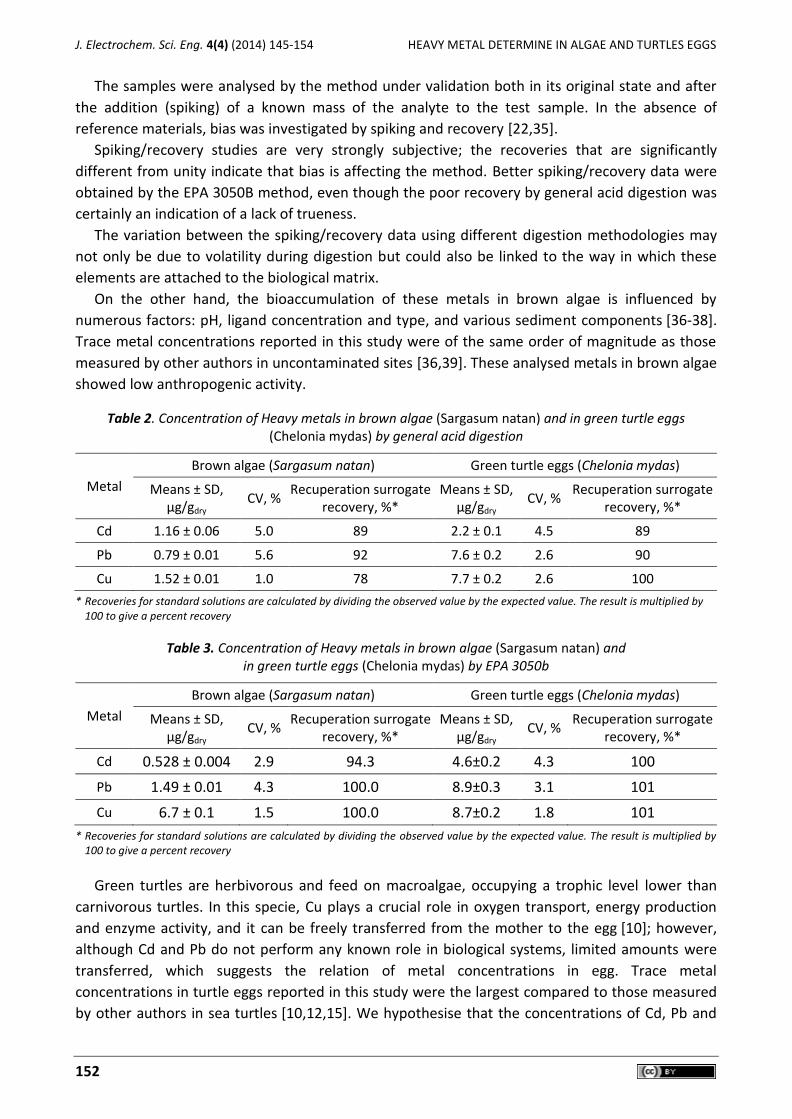
Figure 4. Signals corresponding to standard addition the different metals concentration to green turtles eggs samples digest by method EPA 3050B +0.02 ppm and +0.04 ppm of multistandard of
Cd(II), Pb(II), Cu (II)
In all cases, linearity ranging from 10 ppm to 30 ppm was obtained with a correlation ≥ 0.98 for
all of the metals analysed.
The values determined in the brown alga and turtle eggs generally had low values of standard
deviation and a coefficient of variation of 5 % for both moist digestion techniques used to digest
the brown seaweed and green turtle eggs; this is indicative of analytical quality results.
i p /
A
i p
/
A
J. Electrochem. Sci. Eng. 4(4) (2014) 145-154 HEAVY METAL DETERMINE IN ALGAE AND TURTLES EGGS
152
The samples were analysed by the method under validation both in its original state and after
the addition (spiking) of a known mass of the analyte to the test sample. In the absence of
reference materials, bias was investigated by spiking and recovery [22,35].
Spiking/recovery studies are very strongly subjective; the recoveries that are significantly
different from unity indicate that bias is affecting the method. Better spiking/recovery data were
obtained by the EPA 3050B method, even though the poor recovery by general acid digestion was
certainly an indication of a lack of trueness.
The variation between the spiking/recovery data using different digestion methodologies may
not only be due to volatility during digestion but could also be linked to the way in which these
elements are attached to the biological matrix.
On the other hand, the bioaccumulation of these metals in brown algae is influenced by
numerous factors: pH, ligand concentration and type, and various sediment components [36-38].
Trace metal concentrations reported in this study were of the same order of magnitude as those
measured by other authors in uncontaminated sites [36,39]. These analysed metals in brown algae
showed low anthropogenic activity.
Table 2. Concentration of Heavy metals in brown algae (Sargasum natan) and in green turtle eggs (Chelonia mydas) by general acid digestion
Metal
Brown algae (Sargasum natan) Green turtle eggs (Chelonia mydas)
Means ± SD, µg/gdry
CV, % Recuperation surrogate
recovery, %* Means ± SD,
µg/gdry CV, %
Recuperation surrogate recovery, %*
Cd 1.16 ± 0.06 5.0 89 2.2 ± 0.1 4.5 89
Pb 0.79 ± 0.01 5.6 92 7.6 ± 0.2 2.6 90
Cu 1.52 ± 0.01 1.0 78 7.7 ± 0.2 2.6 100
* Recoveries for standard solutions are calculated by dividing the observed value by the expected value. The result is multiplied by 100 to give a percent recovery
Table 3. Concentration of Heavy metals in brown algae (Sargasum natan) and in green turtle eggs (Chelonia mydas) by EPA 3050b
Metal
Brown algae (Sargasum natan) Green turtle eggs (Chelonia mydas)
Means ± SD, µg/gdry
CV, % Recuperation surrogate
recovery, %* Means ± SD,
µg/gdry CV, %
Recuperation surrogate recovery, %*
Cd 0.528 ± 0.004 2.9 94.3 4.6±0.2 4.3 100
Pb 1.49 ± 0.01 4.3 100.0 8.9±0.3 3.1 101
Cu 6.7 ± 0.1 1.5 100.0 8.7±0.2 1.8 101
* Recoveries for standard solutions are calculated by dividing the observed value by the expected value. The result is multiplied by 100 to give a percent recovery
Green turtles are herbivorous and feed on macroalgae, occupying a trophic level lower than
carnivorous turtles. In this specie, Cu plays a crucial role in oxygen transport, energy production
and enzyme activity, and it can be freely transferred from the mother to the egg [10]; however,
although Cd and Pb do not perform any known role in biological systems, limited amounts were
transferred, which suggests the relation of metal concentrations in egg. Trace metal
concentrations in turtle eggs reported in this study were the largest compared to those measured
by other authors in sea turtles [10,12,15]. We hypothesise that the concentrations of Cd, Pb and
A. I. Balbín Tamayo at al. J. Electrochem. Sci. Eng. 4(4) (2014) 145-154
doi: 10.5599/jese.2014.0051 153
Cu in turtle eggs could depend mainly on their feeding habits, as already suggested by other
authors [10,40]. In addition to diet composition, age and gender could be important factors
affecting metal excretion in egg.
Conclusions
Digestion techniques studied for the treatment of samples suggest that the EPA3050B
technique should be used for the simultaneous analysis of Cd, Pb and Cu in in brown algae and sea
turtle eggs by anodic stripping voltammetry with square wave, as it showed the highest
percentage recovery values with low coefficients of variation. The concentrations in brown algae
(Sargasum natan) confirm that pollution in Antonio beach Guanahacabibes Protected Sea Park
area is low, while the concentration in green turtle (Chelonia mydas) eggs suggest that it depends
on their feeding habitats within the Caribbean Sea.
References
[1] P. S. Rainbow, Australas. J. Ecotoxicol. 12 (2006) 107-122. [2] P. S. Rainbow, G. Blackmore, Mar. Environ. Res. 51 (2001) 441-463. [3] P. S. Rainbow, B. D. Fialkowski, A. D. Smith, Wat. Res. 34 (2000) 1823-1829. [4] P. S. Rainbow, Mar. Pollut. Bull. 31 (1995) 183-192. [5] L. St-Cyr, P. Campbell, Can. J. Fish. Aquat. Sci. 57 (2000) 1330-1341. [6] L. C. St-Cyr, P. G. C. Campbell, Can. J. Bot. 72 (1994) 429-439. [7] M. M. Díaz, Zool. Inf. 31 (1995) 17-35. [8] M. G. Lewander, M. Kautsky, L. Szareñ, Appl. Geochem. 11 (1996) 169-173. [9] L. G. B. Calva, B. L. Fernández, G. V. Ponce, I. H. U. Salgado, A. V. Botello, Rev. Biol. Trop. 56
(2008) 1381-1390. [10] H. Sakai, H. I. Suganuma, R. Tatsukawua, Mar. Pollut. Bull. 30 (1995) 347-353. [11] H. Sakai, H. Suganuma, R. Tatsukawua, Mar. Pollut. Bull. 40 (2000) 701-709. [12] D. L. Stoneburner, M. N. Nicora, E. R. Blood, J. Herpetol. 14 (1980) 171-176. [13] S. Franzelliti, G. Gerosa, C. Vallini, E. Fabbri, Comp. Biochem. Physiol C 138 (2004) 187-194. [14] Tesis Institucionales, http://tesis.ipn.mx/bitstream/handle/123456789/8954/DETMET.pdf
(09/05/2014) [15] L. Jame, S. Tanabe, E.K.W. Yuen, Mar. Pollut. Bull. 48 (2004) 164-192. [16] En EPA 3050B: Compilation of EPA's Sampling and Analysis Methods (1996) [17] En EPA 3050: Compilation of EPA's Sampling and Analysis Methods (1996) [18] En EPA 3010A: Compilation of EPA's Sampling and Analysis Methods (1996) [19] En APAHA-AWWA-WPCF: Standard Methods for the Examination of Water and Wastewater
(2012) [20] R. D. Riso, C. J. Chaumery, Anal. Chim. Acta 351 (1997) 83-89. [21] E. Fischer, C.M.G. van der Berg, Anal. Chim. Acta 385 (1999) 273-280. [22] C. G. T. Locatelli, Microchem. J. 65 (2000) 293-303. [23] K. A. Rubinson, J. F. Rubinson, L. L. Ros, Análisis Instrumental, Pearson Education S.A,
Madrid, España, 2004, p. 314 [24] J. Wang, Stripping analysis: principles, instrumentation, and applications, Wiley-VCH,
Florida, United States of America, 1985, p. 250 [25] J. Wang, Analytical electrochemistry, Wiley-VCH, New York, United States of America, 2006,
p. 223 [26] I. Palchetti, S. Laschi, M. Mascini, Anal. Chim. Acta 530 (2005) 61-67.

J. Electrochem. Sci. Eng. 4(4) (2014) 145-154 HEAVY METAL DETERMINE IN ALGAE AND TURTLES EGGS
154
[27] I. Palchetti, M. Mascini, M. Minunni, A. R. Bilia, F. F. Vincieri, J. Pharm. Biomed Anal. 32 (2003) 251-256.
[28] K. C. Honeychurch, J. P. Hart, Trends Anal. Chem. 22 (2003) 456-469. [29] I. Palchetti, M. Mascini, A. P. F. Turner, Microchim. Acta 131 (1999) 65-73. [30] F. Mocada, J. Azansa, G. Nodarse, Protocolo para el monitoreo de la anidación de Tortugas
Marinas en Cuba. Centro de Investigaciones Marinas, La Habana. Cuba, 2010, p 50 [31] A. E. Tryfonas, J. K. Tucker, P. E. Brunkow, K. A. Jhonson, S. H. Hussein, Z-Q. Lin,
Chemosphere 63 (2006) 39-48. [32] V. Meucci, S. Laschi, M. Minunni, C. Pretti, L. Intorre, G. Soldani, M. Mascini, Talanta 77
(2009) 1143-1148. [33] J. C. Miller, J. N. Miller, Estadística y Quimiometría para Química Analítica. Pearson
Education S.A, Madrid, España, 1994, p 296 [34] I. Parchetti, M. Mascini, Microchem. Acta 131 (1999) 65-73. [35] C. Locatelli, G. Torsi, Microchem. J. 65 (2000) 293-303. [36] T. A. David, B. Volesky, H. S. Vieira, Wat. Res. 34 (2000) 4270-4278. [37] A. M. Abdallah, A. Beltagy, E. Siam, Tox. Env. Chem. 88 (2006) 9-22. [38] Direccional Nacional del Antártico. Instituto Antártico Argentino
http://www.dna.gov.ar/CIENCIA/SANTAR04/CD/PDF/203BG.PDF (09/05/2014) [39] E. Marcelo, G. C. Conti, Env. Res. 93 (2003) 99-112. [40] J. S. Gray, Mar. Pollut. Bull. 45 (2002) 46-52.
© 2014 by the authors; licensee IAPC, Zagreb, Croatia. This article is an open-access article distributed under the terms and conditions of the Creative Commons Attribution license
(http://creativecommons.org/licenses/by/4.0/)
doi: 10.5599/jese.2014.0053 155
J. Electrochem. Sci. Eng. 4(4) (2014) 155-163; doi: 10.5599/jese.2014.0053
Open Access: ISSN 1847-9286
www.jESE-online.org
Original scientific paper
Electroanalytical methods in characterization of sulfur species in aqueous environment
Irena Ciglenečki, Marija Marguš, Elvira Bura-Nakić and Ivana Milanović
Division for Marine and Environmental Research, Ruđer Bošković Institute, Bijenička 54, 10 000 Zagreb, Croatia
Corresponding author: E-mail: [email protected]; Tel: 0038514561105; Fax: 0038514680242
Received: April 10, 2014; Revised: June 13, 2014; Published: December 6, 2014
Abstract Electroanalytical (voltammetric, polarographic, chronoamperometric) methods on an Hg electrode were applied for studying of different sulfur compounds in model and natural water systems (anoxic lakes, waste water, rain precipitation, sea-aerosols). In all investigated samples typical HgS reduction voltammetric peak, characteristic for many different reduced sulfur species (RSS: sulfide, elemental sulfur, polysulfide, labile metal sulfide and organosulfur species) was recorded at about -0.6 V vs. Ag/AgCl reference electrode. In addition, in anoxic waters which are enriched with sulfide and iron species, voltammetric peaks characteristic for the presence of free Fe(II) and FeS nanoparticles (NPs) were recorded at -1.4 V and around -0.45 V, respectively. Depending on the used electroanalytical method and experimental conditions (varying deposition potential, varying time of oxidative and/or reductive accumulation, sample pretreatment i.e. acidification followed by purging) it is possible to distinguish between different sulfur species. This work clearly shows a large potential of the electrochemistry as a powerful analytical technique for screening water quality regarding presence of different reduced sulfur species and their speciation between dissolved and colloidal/nanoparticle phases.
Keywords Voltammetry; chronoamperometry; speciation; reduced sulfur species; metal sulfide nanoparticles; Hg electrode; anoxic water samples
Electrochemical measurements are along with ICP-MS, the most used but challenging approaches
in essential elements analysis and speciation in complex natural samples. There is a wide range of
electroanalytical techniques for qualitative and quantitative determination of essential and poten-
tially toxic elements in natural waters [1,2]. Some examples include: potentiometry, polarography,
voltammetry, chronopotentiometry, chronoamperometry, etc. These electrochemical methods,
especially voltammetry, have appropriate features to be used as monitoring methods (early
warning tools) for assessment of water quality in aqueous systems in general and will be key

J. Electrochem. Sci. Eng. 4(4) (2014) 155-163 ELECTROANALYSIS IN SULFUR SPECIATION
156
methods for trace pollutant analyses (sulfur species [3-17], organic compounds [18-20], trace
metals [2-4, 8, 21-26], engineered and natural nanoparticles [27-34]).
Working electrodes, so called voltammetric sensors, have many embodiments that make them
specific for detection of above listed natural and anthropogenically introduced compounds in
natural environment, enabling their quantitative determination. Electrochemical techniques offer
increasing degree of accuracy, decreasing detection limits, simplicity, prompt response, ect. It
involves dramatically lower costs than other techniques to reach same sensibility and with
automated, portable instrumentation is suitable for fieldwork. In addition, many substances that
are analyzed by other techniques use electrochemical detectors.
Voltammetry is the only technique allowing speciation and determination of the truly dissolved
metal species without many sample handling [2,21-26]. Speciation of a metal affects its
biogeochemical cycling processes and its biological impacts. Thus, electrochemical measurements
in natural waters are essential in order to obtain more complete speciation information and to
fully understand the geochemical cycling and bioavailability (toxicity) of trace metals.
EU water quality guidelines are searching for new innovative methods for water quality mon-
itoring, and electrochemistry in comparison with Inductively Coupled Plasma Mass Spectrometry
(ICP-MS) and/or Inductively coupled plasma/optical emission spectrometry (ICP-OES) and diffusive
gradients in thin-films (DGT) approach was found as preferable choice. Besides, new investigations
showed that voltammetry has a potential to be used in determination of metal NPs, metal sulfide
(MS) NPs and aquatic colloids in natural waters [27-32]. Growing evidence implies that MS NPs of
natural and anthropogenic origin exist in aquatic environments. These NPs could play important
role as mediators of the trace metal nutrition and toxicity. Using different electrochemical
methods it is possible to measure a variety of soluble and particulate sulfur compounds [3-17,32].
In this work voltammetric, polarographic and chronoamperometric measurements on a Hg
electrode were used for characterization and speciation of dissolved and particulate sulfur species,
including thiols, HS-, S0, MS NPs (FeS, PbS), Sx2- in different contrasting aqueous natural samples
such as oxic/anoxic systems, rain precipitation and aerosols.
Experimental
Materials
All chemicals used were reagent grade and were not further purified. Stock solutions of sulfide,
polysulfide, suspensions containing NPs of FeS and PbS were prepared as previously described [6,
7, 10-14, 32]. All measurements were performed in NaCl (Chemica, Croatia) electrolyte solutions
with ionic strengths ranging from 0.11 to 0.55 M NaCl. In some experiments the NaCl electrolyte
was buffered with 0.03 M NaHCO3 (Chemica, Croatia)..
Instrumentation
Electrochemical measurements were performed with a BAS-100-A chemical analyser, µ-Autolab
Electrochemical Instruments (Eco Chemie) and PGSTAT 128 N (Metrohm, Switzerland) connected
to pencil like HMDE and 663 VA Stand Metrohm Electrode (Metrohm, Switzerland) as a working
electrodes, respectively. The reference electrode was an Ag/AgCl (3 M KCl) electrode connected to
the solution via an electrolyte bridge, and a platinum electrode served as an auxiliary electrode.
Reduced sulfur species (RSS) were determined by linear sweep and cyclic voltammetry (LSV, CV)
[6,7,13] and by polarographic measurements [3] in fresh nonfiltered samples. In the case of CV
and LSV the accumulation (ta = 0-120 s) of RSS on the Hg electrode surface with stirring was

I. Ciglenečki at al. J. Electrochem. Sci. Eng. 4(4) (2014) 155-163
doi: 10.5599/jese.2014.0053 157
performed at the deposition potential of E =-0.20 V (vs. Ag/AgCl). After accumulation the potential
was shifted in the negative direction (to E= -1.70 V vs. Ag/ AgCl) with a scan rate of 100 mV/s and
HgS reduction peak at around -0.6 V, characteristic of many RSS were recorded [6,7,13]. In the
same cycle reduction peaks characteristics for the presence of metal sulfide layers and NPs from
the bulk of the solution were recorded at potential more negative than -0.6 V [10,11,17]. Next, the
solution was acidified with 30 μL of concentrated HCl (Chemica, Croatia) to pH ~2 and purged for 5
min. After restoring the original pH with NaOH (Chemica, Croatia) the accumulation and scan steps
were repeated. The result of the first measurement, prior to acidification, is assigned as total redu-
ced sulfur species, RSST = H2S/HS- + S0 and the result of the second measurement is assigned to
elemental sulfur, S0 as model representative for non-volatile reduced sulfur species, RSSNV [6,7,13].
For detection of S0 and S2- presence in polysulfide (Alfa Aesar, USA) containing solutions
sampled DC polarography (SDC) or voltammetry at the Hg electrode was performed with step
potential of 0.0051 V, starting from -0.4 V (vs. Ag/AgCl) and shifting to more negative values.
In chronoamperometry the detection potential at which current was measured as a function of
time (I-t curves) was selected depending on the potential at which reduction of the NPs from the
bulk of the solution is proceeding [11,17,32]. In the case of PbS the used potential was -1.5 V. The
scan lasted for 30 s and the sampling time was 0.1 s. The suspension of PbS NPs was prepared by
mixing the equimolar concentrations of Pb2+ and HS- directly in the electrochemical cell [11].
During the ageing process the suspension was not stirred and recorded changes in the NPs sizes
were only due to aggregation caused by Brownian motion.
Results and discusion
Typical voltammetric signal which can be found in an anoxic sulfide rich environment is
presented in Fig. 1. The obtained peak, usually in our papers designated as C2, represents the well-
known dissolution/reduction of HgS layer on the Hg electrode surface [5-7,9-17]:
E / V (vs. Ag/AgCl)
-1,0-0,8-0,6-0,4-0,2
I /
nA
-120
-100
-80
-60
C21 2
E / V (vs. Ag/AgCl)
-1,0-0,8-0,6-0,4-0,2
I /
mA
-30
-20
-10
0
C21
2
a b
Figure 1. LSV obtained from Rogoznica Lake water in the oxic (a) and anoxic bottom water layer (b), before 1) and 2) after acidification and purging with N2; (E = -0.2 V, ta = 120 s). The C2 peak increases with
either sulfide or with S0 addition and corresponds to 6.5 nM RSSNV in a) and to mM RSSv in b. The shift of this peak to a more negative potential after the acid-purge-base treatment is due to a final pH which is higher
than the original pH. Carbonate buffering in the sample is destroyed by acidification, so it is difficult to return the sample exactly to the original pH.
J. Electrochem. Sci. Eng. 4(4) (2014) 155-163 ELECTROANALYSIS IN SULFUR SPECIATION
158
HgS + H+ + 2e-→ HS- + Hg0 (1)
This peak usually is taken as a measure for “free” and labile sulfur species content (H2S/HS-/S2-, S0,
SnS2-, thiols, labile metal sulfide complexes and nanoparticles). In oxic water layers, in addition to
C2, the peak at more positive potentials than -0.5 V can be frequently revealed. This peak usually
corresponds to the presence of different organosulfur species (DMS, 3-mercaptopropionat, thio-
compounds) which at used experimental conditions oxidize the Hg electrode but do not deposit
HgS layer on its surface, therefore their peak appears more positively than C2 [9].
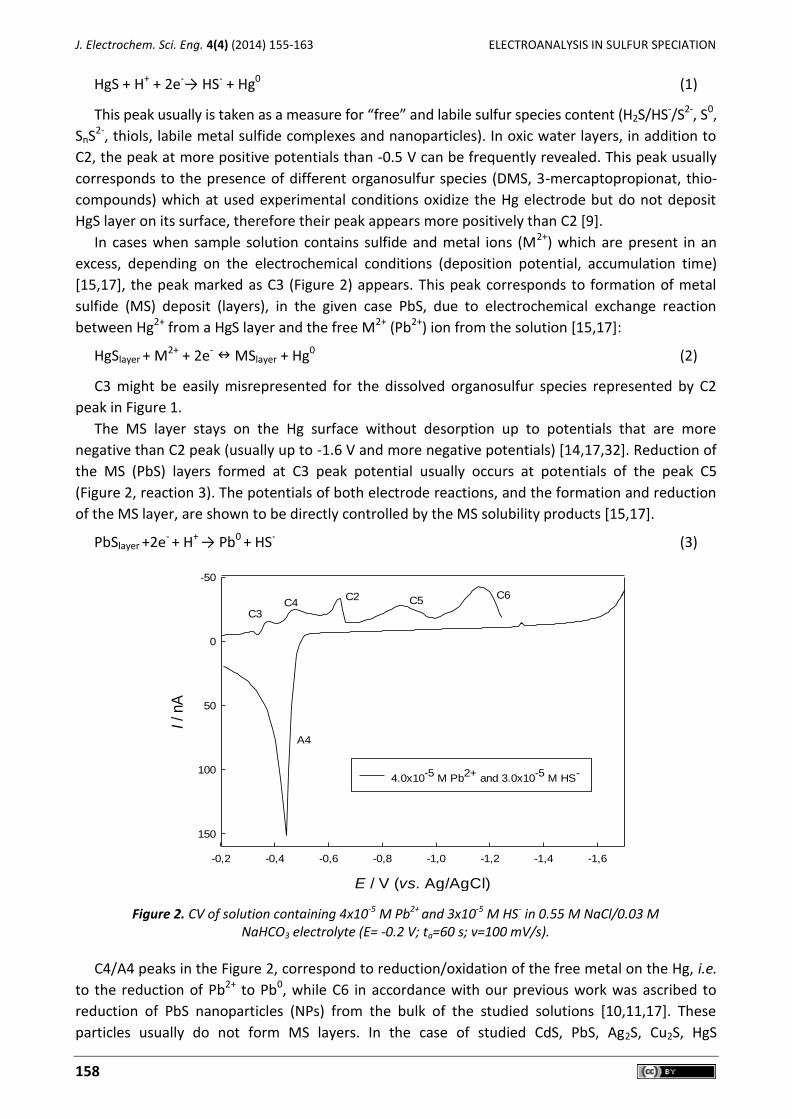
In cases when sample solution contains sulfide and metal ions (M2+) which are present in an
excess, depending on the electrochemical conditions (deposition potential, accumulation time)
[15,17], the peak marked as C3 (Figure 2) appears. This peak corresponds to formation of metal
sulfide (MS) deposit (layers), in the given case PbS, due to electrochemical exchange reaction
between Hg2+ from a HgS layer and the free M2+ (Pb2+) ion from the solution [15,17]:
HgSlayer + M2+ + 2e- MSlayer + Hg0 (2)
C3 might be easily misrepresented for the dissolved organosulfur species represented by C2
peak in Figure 1.
The MS layer stays on the Hg surface without desorption up to potentials that are more
negative than C2 peak (usually up to -1.6 V and more negative potentials) [14,17,32]. Reduction of
the MS (PbS) layers formed at C3 peak potential usually occurs at potentials of the peak C5
(Figure 2, reaction 3). The potentials of both electrode reactions, and the formation and reduction
of the MS layer, are shown to be directly controlled by the MS solubility products [15,17].
PbSlayer +2e- + H+ → Pb0 + HS- (3)
Figure 2. CV of solution containing 4x10⁻⁵ M Pb2+ and 3x10⁻⁵ M HS- in 0.55 M NaCl/0.03 M NaHCO3 electrolyte (E= -0.2 V; ta=60 s; v=100 mV/s).
C4/A4 peaks in the Figure 2, correspond to reduction/oxidation of the free metal on the Hg, i.e.
to the reduction of Pb2+ to Pb0, while C6 in accordance with our previous work was ascribed to
reduction of PbS nanoparticles (NPs) from the bulk of the studied solutions [10,11,17]. These
particles usually do not form MS layers. In the case of studied CdS, PbS, Ag2S, Cu2S, HgS
E / V (vs. Ag/AgCl)
-1,6-1,4-1,2-1,0-0,8-0,6-0,4-0,2
I / nA
-50
0
50
100
150
4.0x10⁻⁵
M Pb2+
and 3.0x10⁻⁵
M HS-
C2C4
A4
C3
C5C6
I. Ciglenečki at al. J. Electrochem. Sci. Eng. 4(4) (2014) 155-163
doi: 10.5599/jese.2014.0053 159
suspensions, depending on the solution conditions (concentration and ratio between metal and
sulfide species, ionic strength, pH) larger NPs will form and result in the appearance of the peaks
similar to recorded C6 reduction peak. Direct reduction of the formed NPs, which is placed more
negative than reduction process of the relevant MS layers [17] and/or reduction processes which
occur on the NPs surface upon collision with the Hg electrode, and the potential where this
process is occurring on the Hg surface is successfully used as a background for further NPs
characterization by chronoamperometric measurements [32], as shown here later.
In samples of anoxic seawater lake Rogoznica Lake (Croatia), shown in Figure 1, the peak at -0.5
V corresponds to the presence of organosulfur species (RSSNV) which do not deposit HgS, and peak
at -0.6 V corresponds to presence of RSStotal (all RSS that deposit HgS). The major difference
between oxic and anoxic Rogoznica lake water layers is in the existence of volatile sulfide species
(RSSV) which are present in mM concentration in anoxic part mainly in the form of sulfide (HS-) and
RSSNV which presence is determined to be around 10 nM in oxic and 1-10 µM in anoxic water
layers. The RSSv can be removed by acidification and purging while nonvolatile species during
acidification and purging procedure will remain in the sample and contribute to the C2 peak
(Figure 1b) [9,12,13,16].
With use of polarographic measurements on the Hg electrode it is possible to distinguish
further between detected RSS on the polysulfide (Sx2-), elemental S (S0) and/or HS- species without
any pretreatment of the samples [3] (Figure 3).
Figure 3. SDC polarographic curves recorded in: a) 0.55 M NaCl solution containing 7 x 10⁻⁶ M S4
2- and b) anoxic sample od Rogoznica lake taken at 11 m depth. The voltammograms were recorded
between –0.4 and -0.8 V vs. Ag/AgCl with potential steps of 1 mV.
The voltammograms measured in the tetrasulfide containing solution (Figure 3a) were charac-
terized by the anodic and cathodic currents in the potential range from –0.5 V to –0.8 V, respect-
tively. The cathodic current is assigned to a reduction process given by the equation (4) [3,33,34],
and it is a measure for the presence of S0 in the polysulfide molecule:
22S 2 1 e H O HS OHn n n n n (4)
Anodic current recorded at potentials more positive than –0.6 V is assigned to the well-known
oxidation of the Hg by HS- according to equation (5) [3-17,33], and it can be taken as a measure for
the S2- presence in the molecule of polysulfide:
HS Hg HgS 2e H (5)
E / V (vs. Ag/AgCl)
-0,8-0,7-0,6-0,5
I / nA
-20
-15
-10
-5
0
5
3x S0
1x S2- 7 x 10⁻⁶ M S42-
electrolyte
a
E / V (vs. Ag/AgCl)
-0,9-0,8-0,7-0,6-0,5-0,4-0,3
I / µ
A
-0,2
-0,1
0,0
0,1
0,2
0,3
0,4
0,5
sulfide
elemental sulfur
electrolyte
Rogoznica Lake sample,11m depth b
J. Electrochem. Sci. Eng. 4(4) (2014) 155-163 ELECTROANALYSIS IN SULFUR SPECIATION
160
Ratio between cathodic and anodic currents in the studied case of tetrasulfide solution was
roughly 3:1 indicating 3 S0 and 1 S2- in the molecule of S42-. In Rogoznica Lake sample this ratio was
much lower (1:6.5), pointing to a high excess of the free sulfide in the sample. Common ratio
between sulfide and elemental sulfur in the anoxic Rogoznica Lake samples is 10-15 to 1 in favour
of sulfide [6,13].
Similar voltammetric curves to Rogoznica Lake samples with revealed C2 - RSSNV peak can be
found in rain precipitation and aerosols. Usually in these samples RSSNV are detected in much
lower concentration range from 1-10 nM, while industrial waste samples could contain total RSS
from 10 µM up to mM concentration.
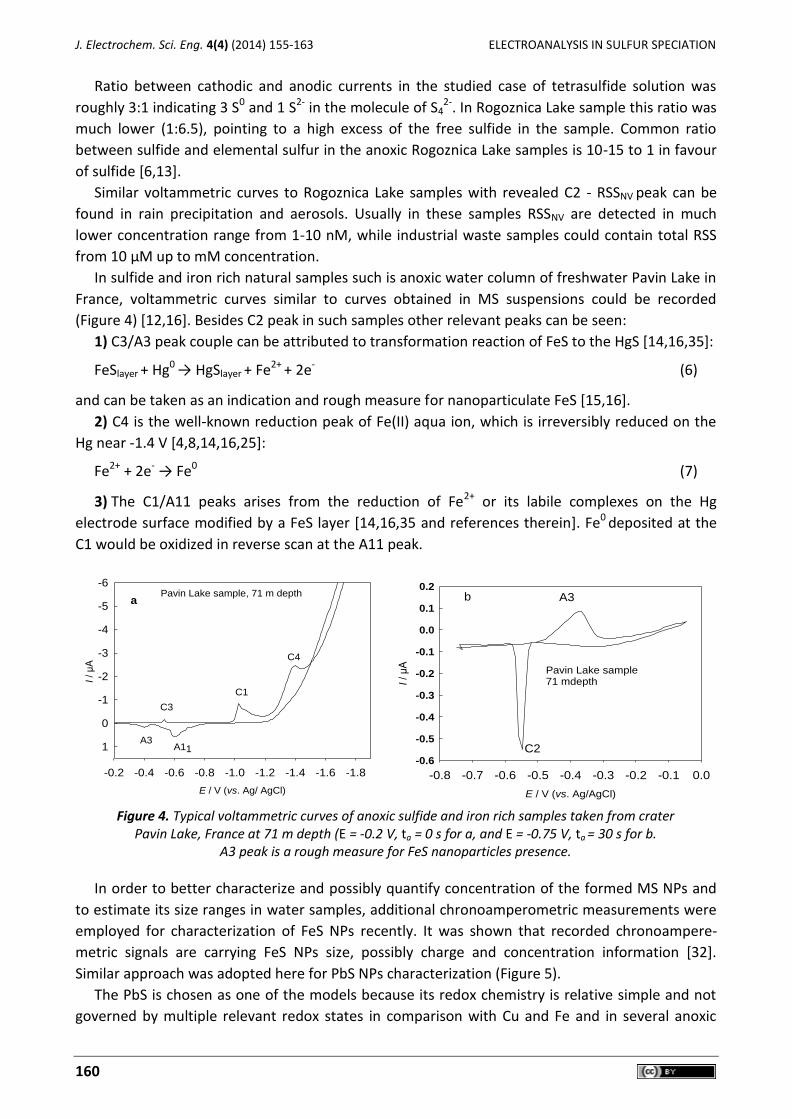
In sulfide and iron rich natural samples such is anoxic water column of freshwater Pavin Lake in
France, voltammetric curves similar to curves obtained in MS suspensions could be recorded
(Figure 4) [12,16]. Besides C2 peak in such samples other relevant peaks can be seen:
1) C3/A3 peak couple can be attributed to transformation reaction of FeS to the HgS [14,16,35]:
FeSlayer + Hg0 → HgSlayer + Fe2+ + 2e- (6)
and can be taken as an indication and rough measure for nanoparticulate FeS [15,16].
2) C4 is the well-known reduction peak of Fe(II) aqua ion, which is irreversibly reduced on the
Hg near -1.4 V [4,8,14,16,25]:
Fe2+ + 2e- → Fe0 (7)
3) The C1/A11 peaks arises from the reduction of Fe2+ or its labile complexes on the Hg
electrode surface modified by a FeS layer [14,16,35 and references therein]. Fe0 deposited at the
C1 would be oxidized in reverse scan at the A11 peak.
Figure 4. Typical voltammetric curves of anoxic sulfide and iron rich samples taken from crater
Pavin Lake, France at 71 m depth (E = -0.2 V, ta = 0 s for a, and E = -0.75 V, ta = 30 s for b. A3 peak is a rough measure for FeS nanoparticles presence.
In order to better characterize and possibly quantify concentration of the formed MS NPs and
to estimate its size ranges in water samples, additional chronoamperometric measurements were
employed for characterization of FeS NPs recently. It was shown that recorded chronoampere-
metric signals are carrying FeS NPs size, possibly charge and concentration information [32].
Similar approach was adopted here for PbS NPs characterization (Figure 5).
The PbS is chosen as one of the models because its redox chemistry is relative simple and not
governed by multiple relevant redox states in comparison with Cu and Fe and in several anoxic
E / V (vs. Ag/ AgCl)
-1.8-1.6-1.4-1.2-1.0-0.8-0.6-0.4-0.2
I / µ
A
-6
-5
-4
-3
-2
-1
0
1
C3
C1
C4
A11A3
aPavin Lake sample, 71 m depth
E / V (vs. Ag/AgCl)
-0.8 -0.7 -0.6 -0.5 -0.4 -0.3 -0.2 -0.1 0.0
I / µ
A
-0.6
-0.5
-0.4
-0.3
-0.2
-0.1
0.0
0.1
0.2A3
C2
b
Pavin Lake sample71 mdepth
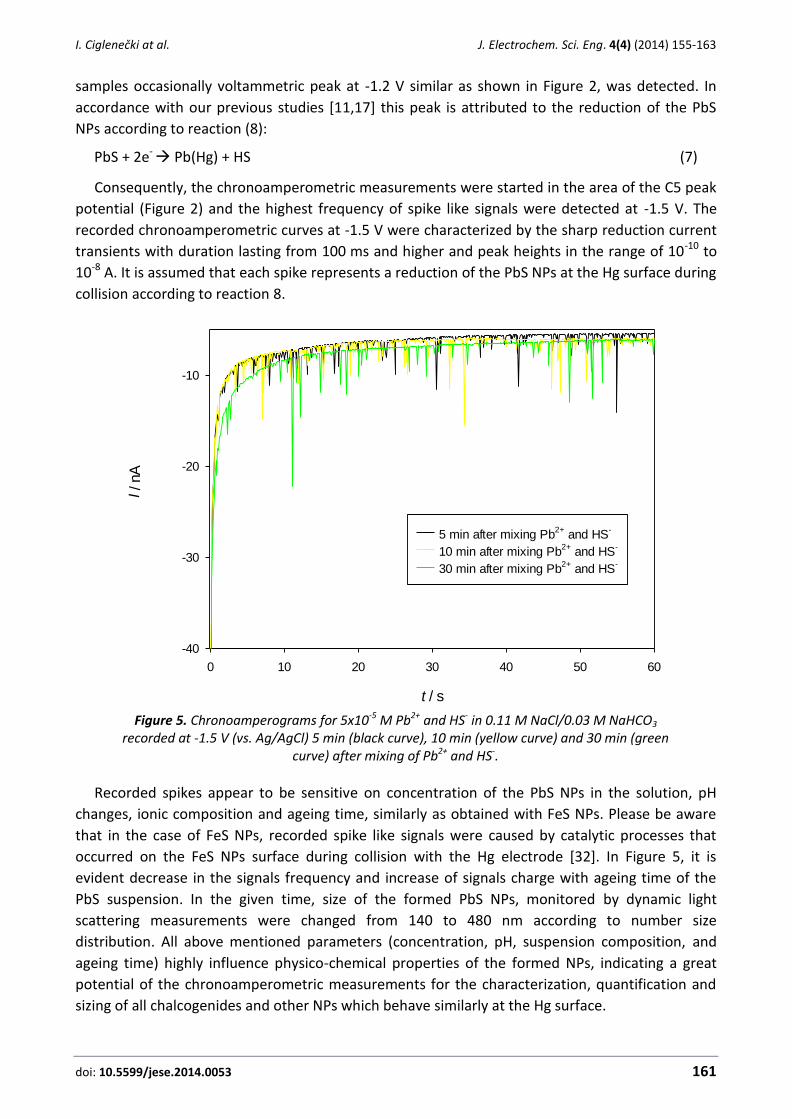
I. Ciglenečki at al. J. Electrochem. Sci. Eng. 4(4) (2014) 155-163
doi: 10.5599/jese.2014.0053 161
samples occasionally voltammetric peak at -1.2 V similar as shown in Figure 2, was detected. In
accordance with our previous studies [11,17] this peak is attributed to the reduction of the PbS
NPs according to reaction (8):
PbS + 2e- Pb(Hg) + HS (7)
Consequently, the chronoamperometric measurements were started in the area of the C5 peak
potential (Figure 2) and the highest frequency of spike like signals were detected at -1.5 V. The
recorded chronoamperometric curves at -1.5 V were characterized by the sharp reduction current
transients with duration lasting from 100 ms and higher and peak heights in the range of 10-10 to
10-8 A. It is assumed that each spike represents a reduction of the PbS NPs at the Hg surface during
collision according to reaction 8.
Figure 5. Chronoamperograms for 5x10⁻⁵ M Pb2+ and HS- in 0.11 M NaCl/0.03 M NaHCO3
recorded at -1.5 V (vs. Ag/AgCl) 5 min (black curve), 10 min (yellow curve) and 30 min (green curve) after mixing of Pb2+ and HS-.
Recorded spikes appear to be sensitive on concentration of the PbS NPs in the solution, pH
changes, ionic composition and ageing time, similarly as obtained with FeS NPs. Please be aware
that in the case of FeS NPs, recorded spike like signals were caused by catalytic processes that
occurred on the FeS NPs surface during collision with the Hg electrode [32]. In Figure 5, it is
evident decrease in the signals frequency and increase of signals charge with ageing time of the
PbS suspension. In the given time, size of the formed PbS NPs, monitored by dynamic light
scattering measurements were changed from 140 to 480 nm according to number size
distribution. All above mentioned parameters (concentration, pH, suspension composition, and
ageing time) highly influence physico-chemical properties of the formed NPs, indicating a great
potential of the chronoamperometric measurements for the characterization, quantification and
sizing of all chalcogenides and other NPs which behave similarly at the Hg surface.
t / s
0 10 20 30 40 50 60
-40
-30
-20
-10
5 min after mixing Pb2+
and HS-
10 min after mixing Pb2+
and HS-
30 min after mixing Pb2+
and HS-
I / nA
J. Electrochem. Sci. Eng. 4(4) (2014) 155-163 ELECTROANALYSIS IN SULFUR SPECIATION
162
Conclusion
In this work it is clearly shown how electrochemistry by choosing appropriate methodology and
experimental conditions can be successfully used for characterization, speciation and
deterimantion of different dissolved and colloidal sulfur species in natural waters including rain
precipitation and aerosols. Further, it appears that today, in the time of growing nanotechnology
and production of different NPs and nanomaterials, electroanalytical methods due to its relative
simplicity and prompt response, low cost and relatively high sensitivity and selectivity, might be a
good alternative analytical tools for characterization and possibly quantification of different NPs in
natural waters. This work is still challenging for the future.
Acknowledgements: This work is supported by the Ministry of Science and Technology of the Republic of Croatia Projects: ‘Nature of organic matter, interaction with traces and surfaces in environment’ (number 098-0982934-2717) and ‘Nanoparticles in aqueous environment: electrochemical, nanogravimetric,STM and AFM studies’, a Unity through Knowledge Fund, UKF project.
References
[1] K. Rajeshwar, J. G. Ibanez, Environmental Electrochemistry, Academic Press, San Diego, CA, 1997.
[2] J. Buffle, M-L Tercier-Waeber, Trends in Anal Chem. 24 (2005) 172-191 [3] G.W., Luther, A.E., Giblin, R. Varsolona, Limnol. Oceanogr. 30 (4) (1985) 727-736. [4] J.Buffle, O. Zali, R. De Vitre, Sci. Tot. Environ. 46(1-2)( 1987) 41-59. [5] N. Batina, I. Ciglenečki, B. Ćosović, Anal. Chim. Acta 267 (1992) 157-164. [6] I. Ciglenecki, Z. Kodba, B. Ćosović, Mar. Chem. 53 (1996) 101-110. [7] I. Ciglenečki, B. Ćosović, Electroanalysis 9(10) (1997) 1-7. [8] W. Davison, J. Buffle, R. De Vitre, Anal. Chim. Acta 77 (1998) 193-203. [9] I. Ciglenečki, B. Ćosović, Mar. Chem. 52 (1996) 87-97.
[10] I. Ciglenečki, D., Krznarić, G.R., Helz, Environ.Sci.Technol. 39(19) (2005) 7492-7498. [11] E. Bura-Nakić, D. Krznarić, D. Jurašin, G. R. Helz, I. Ciglenečki, Anal. Chim. Acta 594 (2007)
44-51. [12] E. Bura-Nakić, E. Viollier, D. Jezequel, I. Ciglenečki, Chem. Geol. 266 (2009) 320-326. [13] E. Bura-Nakić, G.R. Helz, B.Ćosović, I.Ciglenečki, Geochim.Cosmochim.Acta 73 (2009) 3738–
3751. [14] E. Bura-Nakic,D. Krznarić, G.R. Helz, I. Ciglenečki, Electroanalysis 23 (2011) 1376-1382. [15] I. Ciglenečki, E. Bura-Nakić, M. Marguš, J. Solid State Electrochem. 16(6) (2012) 2041-2046. [16] E. Bura-Nakić, E. Viollier, I. Ciglenečki, Environ. Sci. Technol. 43 (2013) 741-749. [17] I. Milanović, D. Krznarić, E. Bura-Nakić, I. Ciglenečki, Environ. Chem. 11(2014) 167-172. [18] B. Ćosović, V. Vojvodić, Limnol. Oceanogr.27 (1982) 361-369 [19] B. Ćosović, V. Vojvodić, Electroanalysis 10 (1998) 429-434. [20] B.Ćosović, Z.Kozarac, S.Frka, V.Vojvodić, Electroanalysis, 22 (17-18) (2010) 1994-2000. [21] M.-L. Tercier, J. Buffle, A. Zirino, R.R. De Vitre, Anal. Chim. Acta 237 (1990) 429-437 [22] E. P.Acherberg, C. Braungardt, Anal.Chim.Acta 40 (1-3) (1999) 381-397. [23] M. Taillefert, M., G.W. Luther III, D.B. Nuzzio, Elecroanalysis 12 (2000) 401-412. [24] I. Pižeta, G. Billon, J-C. Fisher, M. Wartel, Electroanalysis 15 (17) (2003) 1389-1396. [25] G.W. Luther, B. Glazer, S. Ma, R. Trouwborst, B.R. Shultz, G. Druschel, C. Kraiya, Aquatic.
Geochem. 9 (2003) 87-111. [26] C.B.Braungardt , E. Achterberg, B. Axelsson, J.Buffle, F.Graziottin, K.A. Howell , S. Illuminati,
G. Scarponi, A.D.Tappin, M.-L. Tercier-Waeber, D.Turner D. Mar. Chem. 114 (2009) 47-55 [27] A.D. Clegg, N.V. Rees, C.E. Banks, R.G. Compton, Chem. Phys. Chem. 7 (2006) 807-811.

I. Ciglenečki at al. J. Electrochem. Sci. Eng. 4(4) (2014) 155-163
doi: 10.5599/jese.2014.0053 163
[28] J. Cutress, N.V. Rees, Y. Zhou, R.G. Compton, J. Phys. Chem. Lett. 514 (2011) 58-61. [29] Y. Zhou, N.V. Rees, R.G. Compton, J. Phys. Chem. Lett. 511 (2011) 183-186. [30] Y. Zhou, N.V. Rees, R.G. Compton, Angew. Chem. Int. Ed. 50 (2011) 4219-4221 [31] Y. Zhou, N.V. Rees, J. Pillay, R. Tshikhudo, S. Vilakazi, R.G. Compton, Chem. Commun. 48
(2012) 224-226. [32] E. Bura-Nakić, M. Marguš, I. Milanović, D. Jurašin, I. Ciglenečki, Environ.Chem. 11 (2014)
187-196. [33] S. Kariuki, M.J. Morra, K.J.Umiker, I.F. Cheng, Anal. Chim. Acta 442 (2) (2001) 277-285. [34] K.J. Umiker, MJ. Morra, I.F. Cheng, Microchem. J. 73 (2002) 287-297. [35] K. Winkler, T. Krogulec, J. Electroanal. Chem. 386 (1995) 127-134.
© 2014 by the authors; licensee IAPC, Zagreb, Croatia. This article is an open-access article distributed under the terms and conditions of the Creative Commons Attribution license
(http://creativecommons.org/licenses/by/4.0/)

doi: 10.5599/jese.2014.0057 165
J. Electrochem. Sci. Eng. 4(4) (20YY) 165-175; doi: 10.5599/jese.2014.0057
Open Access: ISSN 1847-9286
www.jESE-online.org
Original scientific paper
Characterization of an hrp-aox-polyaniline-graphite composite biosensor
Ana Carolina O. Santana, Erica F. Southgate, João Paulo B. G. Mendes*, Jo Dweck, Eliana Mosse Alhadeff and Ninoska Isabel Bojorge Ramirez**,
Escola de Química, Universidade Federal do Rio de Janeiro, Av. Horácio Macedo, 2.030, Centro de Tecnologia, Bloco E, E-203, Cidade Universitária,CEP 21941-909, Rio de Janeiro, Brasil *Instituto de Química, Universidade Federal do Rio de Janeiro, Av. Horácio Macedo, 2.030, Centro de Tecnologia, Bloco A, A-302, Cidade Universitária, CEP 21941-909, Rio de Janeiro, Brasil **Universidade Federal Fluminense, Dep. Engenharia Química e de Petróleo, R. Passo da Pátria, 156, Bl E-226, São Domingos , Niterói, CEP 24210-240, Rio de Janeiro, Brasil
Corresponding author: E-mail: [email protected]; Tel.: +55-21-26295598
Received: March 23, 2014; Revised: June 7, 2014; Published: December 6, 2014
Abstract Nowadays there is an increasing demand to develop new and robust biosensors in order to detect low concentrations of different chemicals, in practical and small devices, giving fast and confident responses. The electrode material was a polyaniline-graphite-epoxy composite (PANI/GEC). Alcohol oxidase (AOX) and horseradish peroxidase (HRP) enzymes were immobilized and the responses were tested by cyclic voltammetry. The conductivities for the composites of graphite/polyaniline were determined. The cyclic voltammograms allowed detecting ethanol in pure diluted samples in a range from 0.036 to 2.62 M. Differential scanning calorimetry (DSC) and thermal gravimetry analysis (TGA) were used to verify the thermal characteristics of the composites (0, 10, 20, 30 and 100 % of graphite). The Imax value was determined for the dual enzyme biosensor
(0.0724 A), and the Kapp
m as 1.41 M (with R2 =0.9912).
Keywords Cyclic voltammetry; ethanol; immobilized enzymes; PANI/GCE
Introduction
Ethanol is the most frequently analyzed aliphatic alcohol and several methods have been
developed for its quantitative determination [1-3]. Measurement of alcohol levels in liquors and
alcoholic drinks is a common necessity as is clinical analysis of patient tissue samples. The method
J. Electrochem. Sci. Eng. X(4) (2014) 165-175 ELECTROKINETICS AND SOIL DECONTAMINATION: AN OVERVIEW
166
approved by the Association of Official Analytical Chemists [4] for quantitative volumetric
determination of alcohol in beer, wine and distilled spirits is pycnometry, which is the most
common method for determining solution density. This method is considered as reference and has
the advantages of accuracy and no need for comparison against a standard solution. The principal
disadvantage is that the methodology is laborious, requiring a significant amount of time for its
performance. Another disadvantage is that it requires pre-distillation, generally regarded as the
first step in which error is introduced during the process of quantitative detection and analysis [5].
Other more accurate analytical methods include spectrophotometry and chromatographic
techniques: gas chromatography (GC) or high performance liquid chromatography (HPLC).
However, these methodologies are often less favorable due to high equipment prices and the
need for well-trained operators. There is currently a movement toward replacing these methods
with low-cost, fast and reliable electrodes working in conjunction with immobilized enzymes [6].
There is a growing need for the development of disposable devices for clinical and/or
environmental monitoring. This need has stimulated the development of new technologies and
methodologies that can efficiently monitor an increasing number of analytes on site in the
environmental field or support clinical diagnoses as quickly and as cheaply as possible; offering
even the possibility of on-site field monitoring. Besides selectivity, an analytical device must also
be sensitive. In this respect, biosensors have shown great potential in recent years and thus
appear to be useful components of effective analytical tools [7-8].
Biosensors that link enzyme catalyzed chemical reactions with amperometric detectors are
having a great impact on fields such as environmental monitoring [9-10], analysis of the quality of
food and beverages [11-12], biomedical monitoring process [13-14] and biomedicine [15]. These
analytical tools, prepared by immobilization of enzymes on an electrode surface, are simple,
sensitive and offer a fast response. The main problem that appears in the operation of these
devices is the transfer of electrons from the active site of the enzyme to the electrode.
Immobilization of the biological material on the electrode surface constitutes a crucial step in
development of the biosensor, since the enzyme’s structure must be maintained in order to
enable its action on the sample of interest [16-18]. Horseradish peroxidase (HRP) is widely used in
enzyme-linked biosensors. However, there are at least two main drawbacks shown by this
enzyme: (1) It exhibits a very broad specificity to reduce substrates [19-20], which results in low
selectivity of the biosensor; (2) although it displays good stability at room temperature, it is
unstable at high temperatures [21-22]. The co-immobilization of alcohol oxidase with horseradish
peroxidase is expected to increase the selectivity and amplify the sensitivity of the biosensor for
the quantitative determination of ethanol [23-24].
Immobilization of dual enzymes provides an excellent basis for increasing the selectivity,
sensitivity and the thermal stability of the biosensor, depending on the strategy adopted for
immobilizing the enzymes [15]. The immobilized enzymes may be reused several times or
employed in an economical continuous flow path. Dual enzyme-linked sensors are amenable to
automation for analytical measurements, scale up of enzymatic biotransformation reactors, or to
recover a product with greater purity [19, 25]. Xie, et al. [26] reported recent advances in enzyme
immobilization technologies that enhance enzyme properties such as activity, stability, specificity
and reduced inhibition effects. The authors suggest that in the future multi-enzyme sensors based
on co-immobilization would be the solution to many of the applications for the biotechnology
industry and analytical devices.

A. C. O. Santana et al. J. Electrochem. Sci. Eng. 4(4) (2014) 165-175
doi: 10.5599/jese.2014.0057 167
The objective of this study was to characterize a composite-based on PANI / epoxy / graphite
and evaluate its performance as a substrate for horseradish peroxidase (HRP) and alcohol oxidase
(AOX) enzymes immobilized to an electrode creating a biosensor for ethanol detection. The
development of such a method for the immobilization of multiple enzymes is highly attractive,
especially for economic reasons because as enzymatic activity decays the support can be
regenerated and reloaded with fresh enzyme. In fact, the cost of support is often a primary factor
in the overall cost of the immobilized catalyst. In order to build the biosensor a composite
prepared with graphite and an electron conductor polymer as polyaniline was studied and
characterized in terms of its electrochemical conductance capacity and thermal stability [18,27].
We find critical compositions of the material that works with improved sensitivity over a relatively
broad range of ethanol concentrations.
Experimental
Materials
Horseradish peroxidase (HRP; EC 1.11.1.7) was purchased from Toyobo, Brazil and alcohol
oxidase (AOX, EC 1.1.1.1, specific activity of 200 units/mg of protein), graphite powder and
polyaniline (emeraldine salt) were purchased from Sigma-Aldrich. For the incorporation of
enzymatic solutions, a 2.5 % (v/v) of glutaraldehyde (Sigma-Aldrich) and 1 mg/mL of protein
albumin were used. The ethanol standard solutions were prepared with 0.1 M mono potassium
phosphate buffer (pH 7.0). All reagents were of analytical-reagent grade. All solutions were
prepared with distilled water.
Apparatus
Amperometric measurements were carried out using an AUTOLAB PGSTAT12 (Ecochemie)
connected to a personal computer via a serial RS232 port for data acquisition. The obtained
amperometric alcohol dual enzyme sensors were evaluated by means of cyclic voltammetry in a
three-electrode configuration with Ag/AgCl/KCl (3M) reference electrode and Pt-wire counter
electrode. When not in use, the electrode was stored dry at 4 °C in a refrigerator.
The thermal properties (thermogravimetric analysis (TGA) and differential scanning calorimetry
(DSC)) for the composites of graphite : PANI prepared with 0, 10, 20, 30 and 100 % of graphite
were performed by TA Instruments SDT Q600. Analyses were conducted in a 30 mL/min flow rate
of air atmosphere, with a ramp of 5 °C/min from 30 to 800 °C.
The electrical conductivities of the composites pellets were evaluated using the techniques of
two electrodes, between which a pellet of known composition of the composite was fixed with the
aid of a sleeve of Teflon. The tests were done using a bench meter ICEL Manaus MD - 6700
coupled to a computer. The disks pellets prepared with 0% and 100% of pure graphite and
composites with 1, 3, 5, 10, 20, 30, 50, 70, 100% of graphite mixed with PANI were measured. Pure
samples of PANI and graphite were also determined.
Preparation and evaluation of the AOX–HRP-based biosensors
HRP (3.60 g) was dissolved in 30 mL of 50 mM phosphate buffer (PB, pH 7.0). After filtration
and dialysis steps, a 0.133 mg/mL of HRP solution was mixed with AOX (47 mg/mL) in buffer
pH 7.0. The 10 % (w/v) of bovine serum albumin and 2.5% (v/v) of glutaraldehyde were also
prepared in 50 mM PB (pH 7.0) solution. A 10 μL volume of bovine serum albumin and 10 μL of
glutaraldehyde were deposited on the electrode surface sequentially. The excess of glutar-

J. Electrochem. Sci. Eng. X(4) (2014) 165-175 ELECTROKINETICS AND SOIL DECONTAMINATION: AN OVERVIEW
168
aldehyde was rinsed off with water. Teflon cylindrical electrodes (5.0 × 0.7 cm and 0.13 cm inside
orifice) were used to construct the working dual enzyme biosensor with a 20 mL electrolytic cell
and an Ag/AgCl reference electrode and a platinum counter-electrode.
Procedure for immobilization
The methodology used was the ionic immobilization of AOX and HRP enzymes on the electrode
surface constructed using a graphite matrix with polyaniline and an epoxy resin. During the
immobilization step, a solution containing 2.5 % (v/v) glutaraldehyde, 0.5 % (v/v) BSA and
97 % (v/v) enzyme solution containing 1100 μL HRP and 15 μL of AOX was deposited on the
electrode surface. The electrode was left at 4 °C for 24 hours [28].
Measurement procedure
Cyclic voltammetry (CV) measurements on the electrode were performed in a 3-electrode
system containing a Ag/AgCl/KCl 3M (Microquímica®) reference electrode, coiled platinum wire
(99.99 % pure) mounted at the end of a chemically-resistant epoxy rod as counter electrode in
addition to the modified working electrode based on PANI/GCE. The potential was cycled between
–400 and 400 mV vs. Ag/AgCl.
Determination of ethanol in samples
Ethanol (95 %) samples (0.15 mL) were diluted in a 10 mL flask with 0.1 M mono potassium
phosphate buffer solution (pH 7.0). Voltammetric determination was carried out by applying the
standard addition method. Diluted sample and standard ethanol solution (0.15 μL) were added to
the voltammetric cell containing 10 mL of 0.1 M mono potassium phosphate buffer solution
(pH 7.0).
Results and discussion
Study of differential scanning calorimetry and thermal gravimetry analysis
The thermal stability of the graphite composite samples was analyzed by TG, derivatived
thermogravimetric analysis (DTG) and DSC. Results of TG and DTG analyses are presented in Figure
1. The curves in Figure 1 follow the mass as a function of temperature of composite samples
containing 100 % graphite, 20 % graphite and 0% graphite (100 % polyaniline), respectively. The
curve for the composite of Graphite/PANI (red dashed line) shows an intermediate stability
between pure samples of Graphite and PANI polymer. The presence of the PANI introduces four
decomposition steps. In the first stage, beginning at 150 °C, there is a slow weight loss associated
to the release of trapped water or organic solvents in the polymer structure. The second stage of
weight loss is observed from 270 °C to 550 °C and is attributed to decomposition of the oligomers.
The third decay, from 350 °C to 450 °C, was assigned to the thermal decomposition of the PANI
chains. The DTG curves fully support the above mentioned losses. The pure graphite sample
decomposes above 600 °C, whereas the 20 % graphite composite presents four degradation steps
(three attributed to the pure polyaniline and one to the pure graphite). Similar results were found
by Kowner, et al. [29], Bourdo, et al. [30] and Mo, et al. [31].
A linear fitting between the data of polymer content estimated by TG and composition on a dry
basis of raw materials in the composites was proposed, showing a good correlation coefficient (R2
= 0.9811). The difference between the values estimated from the correlation with those of the
components in the composite has an average value of -0.1 % with standard deviation of 1.86 %.

A. C. O. Santana et al. J. Electrochem. Sci. Eng. 4(4) (2014) 165-175
doi: 10.5599/jese.2014.0057 169
Fig. 1. TG and DTG curves for the samples prepared with 100, 20 and 0 % of graphite.
Conductivity of graphite/PANI composite
Song and Choi [32] have reported that the most conductive form of PANI is the fully
protonated, half-oxidized emeraldine salt form. A decrease in conductivity was observed when the
polymer was deprotonated or either fully oxidized or reduced. This work intends to develop a
prototype composite-biosensor based on typical PANI that maintains the conductivity.
Conductivity values were determined for different concentrations of graphite : polyaniline
composites (1, 3, 5, 10, 20, 30, 50, 70, 100 % of graphite) and for the pure alcohol oxidase. As
shown in Figure 2 an increase in the conductivity of the composite samples was observed.
Fig. 2. Electrical conductivities of PANI/GEC as a function of graphite concentration in the
composites. Also shown are samples with 100 % PANI (green bar) and 100 % graphite (red bar).
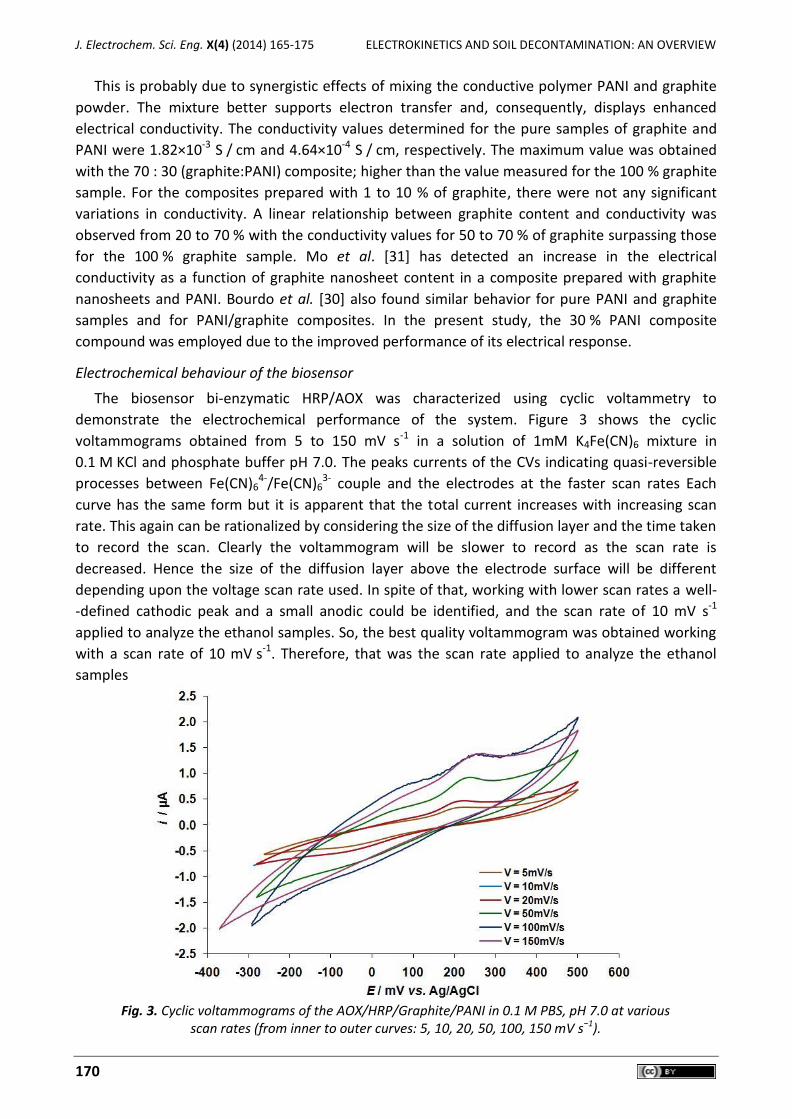
J. Electrochem. Sci. Eng. X(4) (2014) 165-175 ELECTROKINETICS AND SOIL DECONTAMINATION: AN OVERVIEW
170
This is probably due to synergistic effects of mixing the conductive polymer PANI and graphite
powder. The mixture better supports electron transfer and, consequently, displays enhanced
electrical conductivity. The conductivity values determined for the pure samples of graphite and
PANI were 1.82×10⁻³ S / cm and 4.64×10⁻⁴ S / cm, respectively. The maximum value was obtained
with the 70 : 30 (graphite:PANI) composite; higher than the value measured for the 100 % graphite
sample. For the composites prepared with 1 to 10 % of graphite, there were not any significant
variations in conductivity. A linear relationship between graphite content and conductivity was
observed from 20 to 70 % with the conductivity values for 50 to 70 % of graphite surpassing those
for the 100 % graphite sample. Mo et al. [31] has detected an increase in the electrical
conductivity as a function of graphite nanosheet content in a composite prepared with graphite
nanosheets and PANI. Bourdo et al. [30] also found similar behavior for pure PANI and graphite
samples and for PANI/graphite composites. In the present study, the 30 % PANI composite
compound was employed due to the improved performance of its electrical response.
Electrochemical behaviour of the biosensor
The biosensor bi-enzymatic HRP/AOX was characterized using cyclic voltammetry to
demonstrate the electrochemical performance of the system. Figure 3 shows the cyclic
voltammograms obtained from 5 to 150 mV s-1 in a solution of 1mM K4Fe(CN)6 mixture in
0.1 M KCl and phosphate buffer pH 7.0. The peaks currents of the CVs indicating quasi-reversible
processes between Fe(CN)64-/Fe(CN)6
3- couple and the electrodes at the faster scan rates Each
curve has the same form but it is apparent that the total current increases with increasing scan
rate. This again can be rationalized by considering the size of the diffusion layer and the time taken
to record the scan. Clearly the voltammogram will be slower to record as the scan rate is
decreased. Hence the size of the diffusion layer above the electrode surface will be different
depending upon the voltage scan rate used. In spite of that, working with lower scan rates a well-
-defined cathodic peak and a small anodic could be identified, and the scan rate of 10 mV s-1
applied to analyze the ethanol samples. So, the best quality voltammogram was obtained working
with a scan rate of 10 mV s-1. Therefore, that was the scan rate applied to analyze the ethanol
samples
Fig. 3. Cyclic voltammograms of the AOX/HRP/Graphite/PANI in 0.1 M PBS, pH 7.0 at various
scan rates (from inner to outer curves: 5, 10, 20, 50, 100, 150 mV s−1).
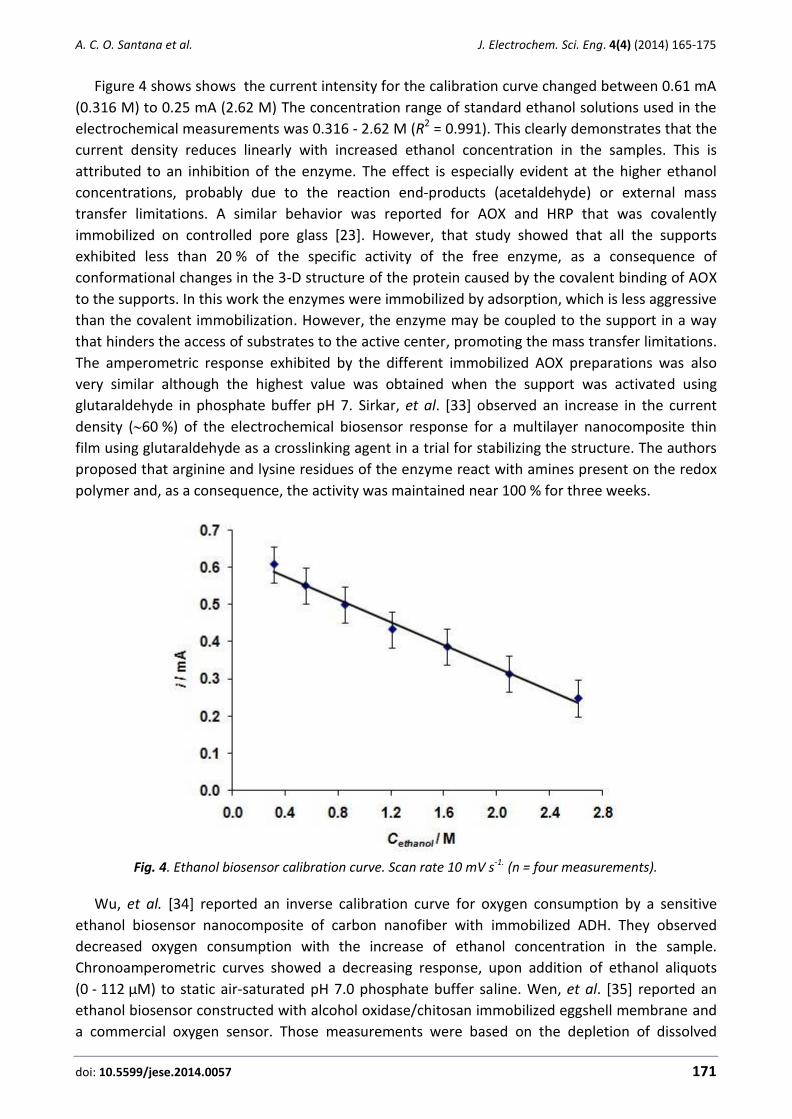
A. C. O. Santana et al. J. Electrochem. Sci. Eng. 4(4) (2014) 165-175
doi: 10.5599/jese.2014.0057 171
Figure 4 shows shows the current intensity for the calibration curve changed between 0.61 mA
(0.316 M) to 0.25 mA (2.62 M) The concentration range of standard ethanol solutions used in the
electrochemical measurements was 0.316 - 2.62 M (R2 = 0.991). This clearly demonstrates that the
current density reduces linearly with increased ethanol concentration in the samples. This is
attributed to an inhibition of the enzyme. The effect is especially evident at the higher ethanol
concentrations, probably due to the reaction end-products (acetaldehyde) or external mass
transfer limitations. A similar behavior was reported for AOX and HRP that was covalently
immobilized on controlled pore glass [23]. However, that study showed that all the supports
exhibited less than 20 % of the specific activity of the free enzyme, as a consequence of
conformational changes in the 3-D structure of the protein caused by the covalent binding of AOX
to the supports. In this work the enzymes were immobilized by adsorption, which is less aggressive
than the covalent immobilization. However, the enzyme may be coupled to the support in a way
that hinders the access of substrates to the active center, promoting the mass transfer limitations.
The amperometric response exhibited by the different immobilized AOX preparations was also
very similar although the highest value was obtained when the support was activated using
glutaraldehyde in phosphate buffer pH 7. Sirkar, et al. [33] observed an increase in the current
density (60 %) of the electrochemical biosensor response for a multilayer nanocomposite thin
film using glutaraldehyde as a crosslinking agent in a trial for stabilizing the structure. The authors
proposed that arginine and lysine residues of the enzyme react with amines present on the redox
polymer and, as a consequence, the activity was maintained near 100 % for three weeks.
Fig. 4. Ethanol biosensor calibration curve. Scan rate 10 mV s-1. (n = four measurements).
Wu, et al. [34] reported an inverse calibration curve for oxygen consumption by a sensitive
ethanol biosensor nanocomposite of carbon nanofiber with immobilized ADH. They observed
decreased oxygen consumption with the increase of ethanol concentration in the sample.
Chronoamperometric curves showed a decreasing response, upon addition of ethanol aliquots
(0 - 112 μM) to static air-saturated pH 7.0 phosphate buffer saline. Wen, et al. [35] reported an
ethanol biosensor constructed with alcohol oxidase/chitosan immobilized eggshell membrane and
a commercial oxygen sensor. Those measurements were based on the depletion of dissolved
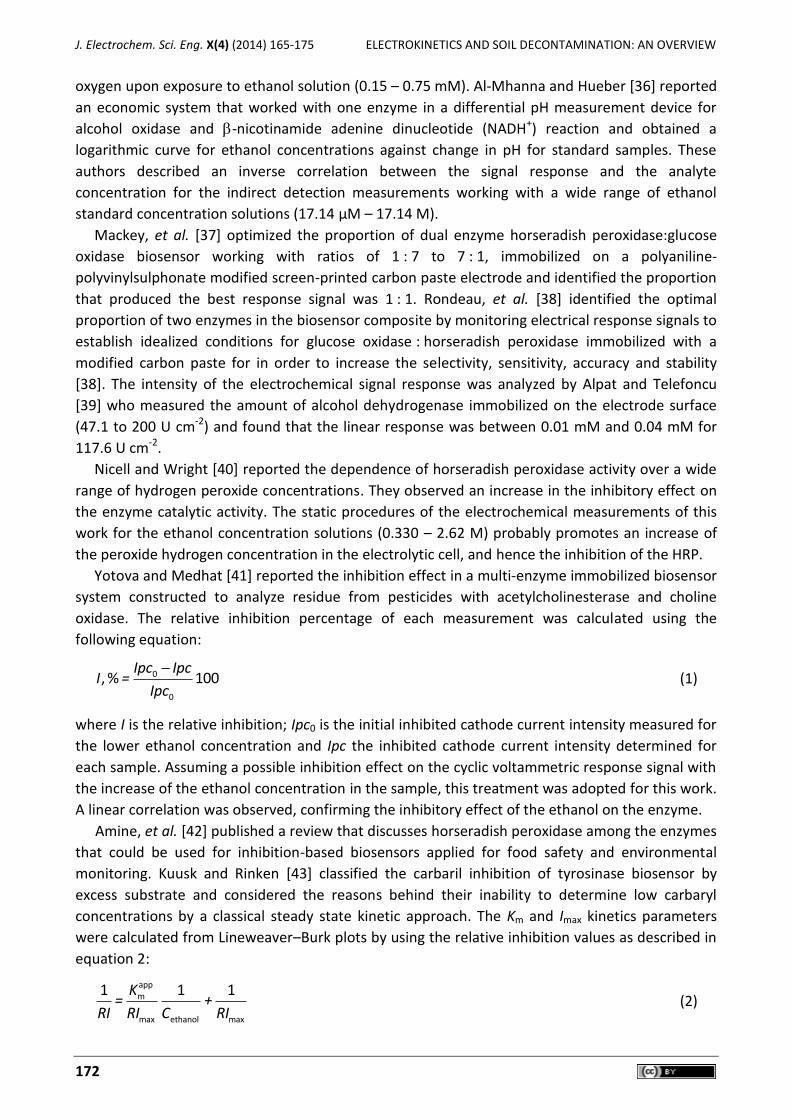
J. Electrochem. Sci. Eng. X(4) (2014) 165-175 ELECTROKINETICS AND SOIL DECONTAMINATION: AN OVERVIEW
172
oxygen upon exposure to ethanol solution (0.15 – 0.75 mM). Al-Mhanna and Hueber [36] reported
an economic system that worked with one enzyme in a differential pH measurement device for
alcohol oxidase and -nicotinamide adenine dinucleotide (NADH+) reaction and obtained a
logarithmic curve for ethanol concentrations against change in pH for standard samples. These
authors described an inverse correlation between the signal response and the analyte
concentration for the indirect detection measurements working with a wide range of ethanol
standard concentration solutions (17.14 μM – 17.14 M).
Mackey, et al. [37] optimized the proportion of dual enzyme horseradish peroxidase:glucose
oxidase biosensor working with ratios of 1 : 7 to 7 : 1, immobilized on a polyaniline-
polyvinylsulphonate modified screen-printed carbon paste electrode and identified the proportion
that produced the best response signal was 1 : 1. Rondeau, et al. [38] identified the optimal
proportion of two enzymes in the biosensor composite by monitoring electrical response signals to
establish idealized conditions for glucose oxidase : horseradish peroxidase immobilized with a
modified carbon paste for in order to increase the selectivity, sensitivity, accuracy and stability
[38]. The intensity of the electrochemical signal response was analyzed by Alpat and Telefoncu
[39] who measured the amount of alcohol dehydrogenase immobilized on the electrode surface
(47.1 to 200 U cm-2) and found that the linear response was between 0.01 mM and 0.04 mM for
117.6 U cm-2.
Nicell and Wright [40] reported the dependence of horseradish peroxidase activity over a wide
range of hydrogen peroxide concentrations. They observed an increase in the inhibitory effect on
the enzyme catalytic activity. The static procedures of the electrochemical measurements of this
work for the ethanol concentration solutions (0.330 – 2.62 M) probably promotes an increase of
the peroxide hydrogen concentration in the electrolytic cell, and hence the inhibition of the HRP.
Yotova and Medhat [41] reported the inhibition effect in a multi-enzyme immobilized biosensor
system constructed to analyze residue from pesticides with acetylcholinesterase and choline
oxidase. The relative inhibition percentage of each measurement was calculated using the
following equation:
0
0
, % 100Ipc Ipc
I =Ipc
(1)
where I is the relative inhibition; Ipc0 is the initial inhibited cathode current intensity measured for
the lower ethanol concentration and Ipc the inhibited cathode current intensity determined for
each sample. Assuming a possible inhibition effect on the cyclic voltammetric response signal with
the increase of the ethanol concentration in the sample, this treatment was adopted for this work.
A linear correlation was observed, confirming the inhibitory effect of the ethanol on the enzyme.
Amine, et al. [42] published a review that discusses horseradish peroxidase among the enzymes
that could be used for inhibition-based biosensors applied for food safety and environmental
monitoring. Kuusk and Rinken [43] classified the carbaril inhibition of tyrosinase biosensor by
excess substrate and considered the reasons behind their inability to determine low carbaryl
concentrations by a classical steady state kinetic approach. The Km and Imax kinetics parameters
were calculated from Lineweaver–Burk plots by using the relative inhibition values as described in
equation 2:
appm
max ethanol max
1 1 1K= +
RI RI C RI (2)

A. C. O. Santana et al. J. Electrochem. Sci. Eng. 4(4) (2014) 165-175
doi: 10.5599/jese.2014.0057 173
where 1/Cethanol is the concentration of the ethanol in the solution sample, RI and RImax represent
the initial and the maximum relative inhibition current, respectively, and Kapp
m is the apparent
Michaelis constant.
The Lineweaver-Burk plot for the dual enzyme AOX-HRP biosensor showing 1/I versus 1/Cethanol
is illustrated in Figure 5.
The Imax value determined considering the inhibition effect on the dual enzyme biosensor was
0.0724 μA, and the Kapp
m was 1.41 M (R2=0.9912).
Fig. 5. Line-weaver-Burk plot for the bienzimatic AOD-HRP biosensor for different ethanol concentration
Table 1 shows the analytical performance of the proposed ethanol biosensor towards ethanol
detection compared with various electrochemical biosensors modified for dual enzymes that also
reported Kapp
m and Imax. Despite the low affinity for substrate observed in this work, the sensitivity
was higher when compared with those determined for both redox hydrogel dual enzyme films
previously reported in the literature [44-45]. This suggests that the linear range and detection limit
of the proposed ethanol biosensor mentioned above appear to be beneficial compared to other
previously reported modified electrodes.
Table 1. Comparison of analytical characteristics of ethanol dual enzyme biosensors.
Film/Composite/Enzymes I.D. / cm Kapp
m / mM Imax / nA Sensitivity, nA/M Reference
HRP+AOX+PVI-Os 0.305 4.71 813.95 0.17 [44]
HRP/PVI10-Os/PEG-DGE/AOX/CP5 0.305 9.6 ± 0.3 572 ± 7 0.06 [45]
PANI-GEC/HRP/BSA/AOX 0.130 1.410 72.4 51.3.
This work
I.D. - internal diameter; PVI - Poly(vinyl-imidazole; PVI10-Os - redox hydrogel synthesized; PEG-DGE - Poly(ethylene glycol) (400) diglycidyl ether; CP5 - electrodeposition polymer; Os - complex: redox polymers synthesized (4,4'dimethylbipyridine); PANI-GEC: polyaniline in Graphite epoxy composite; BSA - Bovine serum albumin. The applied potentials for all configurations are –50 mV vs. Ag/AgCl.
J. Electrochem. Sci. Eng. X(4) (2014) 165-175 ELECTROKINETICS AND SOIL DECONTAMINATION: AN OVERVIEW
174
Conclusions
The composite material prepared from differing proportions of graphite and PANI displayed
enhancement in the conductivity for compositions of less than 20 % graphite and a synergistic
effect that increased its response for mixtures with more than 50 % of graphite. The thermal
analysis techniques applied to characterize the prepared composites showed a good agreement
with the original proposed formula composition. The electrochemical results confirm that it is
possible to detect ethanol with this biosensor in the ethanol concentration range of 0.316 to
2.62 mol L-1 limited by a significant inhibition effect observed in the enzyme.
Acknowledgements: Thanks to Toyobo of Brazil (enzyme horseradish peroxidase) and CNPq support from the Announcement Universal - 2008/2010 and PIBIC.
References
[1] ASTM. D5501-12 Standard Test Method, 100 Barr Harbor Drive, West Conshohocken, PA, USA, ASTM International (2012).
[2] G. Hall, W. M. Reuter, HPLC Analysis for the Monitoring of Fermentation Broth During Ethanol Production as a Biofuel, www.perkinelmer.com/pdfs/downloads/abr_ethanol-asbiofuelbyhplcappbrief.pdf (17. 07. 2014).
[3] K. Schugerl, J. Biotechnol. 85 (2001)149-173. [4] W. Horwitz, Official methods of Analysis of AOAC International. Gaithersburg, Maryland
20877-2417, USA, AOAC International (2005). [5] M. L. Wang, J. T. Wang, Y. M. Choong, Food Chem. 86 (2004) 609-615. [6] L. Cao, Introduction: Immobilized Enzymes: Past, Present and Prospects. In: Carrier-bound
Immobilized Enzymes: Principles, Application and Design. KGaA, Weinheim, WILEY-VCH Verlag GmbH & Co, 2005, p.100.
[7] H. Nakamura, I. Karube, Anal. Bioanal. Chem. 377(3) (2003) 446-468. [8] A. P. F. Turner, Chem. Soc. Rev. 42(8) (2013) 3184-3196. [9] R. W. Bogue, Sensor 4 (2003) 302-310.
[10] A. K. Wanekaya, W. Chen, A. Mulchandani, J. Environ. Monit. 10 (2008) 703-712. [11] M. C. Blanco-Lopez, M. J. Lobo-Castanon, A. J. Miranda-Ordieres, J. Chem. Education 84(4)
(2007) 677-678. [12] M. F. Barroso, M. F. C. Delerue-Matos, M. B. P. P. Oliveira, Food Chem. 132 (2012), 1055-
1062. [13] N. I. Bojorge-Ramírez, A. M. Salgado, B. Valdman, Assay Drug Dev. Technol. 5(5) (2007) 673-
682. [14] M. S. Belluzo, M. E. Ribone, C. M. Lagier, Sensors 8 (2008) 1366-1399. [15] J. Liu, J. Wang, Biotech. Applied Biochem. 30 (1999) 177-193. [16] N. I. Bojorge-Ramirez, A. M. Salgado, B. Valdman, Brazilian J. Chem. Eng. 26(2) (2009) 227-
249. [17] E. M. Alhadeff, A. M. Salgado, O. Cós, N. Pereira Jr., B. Valdman, F. Valero, Appl. Biochem.
Biotech. 146 (2008) 129-136. [18] N. I. Bojorge-Ramírez, E. Alhadeff, Graphite-Composites Alternatives for Electrochemical
Biosensor. In: Metal, Ceramic and Polymeric Composites for Various Uses, Uses. J. Cuppoletti: (2011) p. 684.
[19] N. C. Veitch, Phytochemistry 65 (2004) 249-259. [20] A. M. Azevedo, V. C. Martins, D. M. Prazeres, J. Vojinovic, J. M. S. Cabral, L. P. Fonseca,
Biotechnol. Annu. Rev. 9 (2003) 199-247. [21] K. Chattopadhayay, S. Mazumdar, Biochemistry 39 (2000) 263-270.
A. C. O. Santana et al. J. Electrochem. Sci. Eng. 4(4) (2014) 165-175
doi: 10.5599/jese.2014.0057 175
[22] A. S. L. Carvalho, E. Pinto e Melo, B. S. Ferreira, M.T. Neves-Petersen, S. B. Petersen, M.R. Aires-Barros, Arch. Biochem. Biophys. 415 (2003) 257 - 267.
[23] A. M. Azevedo, J. M. S. Cabral, T. D. Gibson, L. P. Fonseca, J. Mol. Catal. B-Enzym. 28(2-3) (2004) 45-53.
[24] A. M. Azevedo, D. M. Prazeres, J. M. S. Cabral, L. P. Fonseca, Biosens. Bioeletron. 21 (2005) 231-247.
[25] S. Datta, L. R. Christena, Y. R. S. Rajaram, Biotech. 3(1) (2013) 1- 9. [26] T. Xie, A. Wang, L. Huang, H. Li, Z. Chen, Q. Wang, X. Yin, Afr. J. Biotechnol. 8(19) (2009)
4724-4733. [27] J. Dweck, B.F. Andrade, E.E.C. Monteiro, R. Fischer, J. Therm. Anal. Calorim. 67 (2002) 321-
326. [28] R. S. Lima, G. S. Nunes, T. Noguer, J. Marty, Quím. Nova 30(1) (2007) 9-17. [29] S. Konwer, J. P. Gogoi, A. Kalita, S.K. Dolui, J. Mater. Sci.: Mater. Electron. 22 (2011) 1154 -
1161. [30] S. Bourdo, B. A. Warford, T. Viswanathan, J. Solid State Chem. 196 (2012) 309-313. [31] Z. Mo, H. Shi, G. Niu, Z. Zhao, Y. Wu, J. App. Polymer Sci. 112 (2009) 573-577. [32] E. Song, J.W. Choi, Nanomaterials 3, (2013) 498-523. [33] K. Sirkar, A. M. Revzin, V. Pishko, Anal. Chem. 72, (2000) 2930-2936. [34] L. Wu, J. Lei, X. Zhang, H. Ju, Biosens. Bioelectron. 24 (2008) 644-649. [35] G. Wen, Y. Zhang, S. Shuang, C. Dong, M. M. F. Choi, Biosens. Bioelectron. 23 (2007) 121-
129. [36] N. M. M. Al-Mhanna, H. Huebner, Int. J. Chem. 3(1) (2011) 47-56. [37] D. Mackey, A. Killard, A. Ambrosi, M. Smyth, Sens. Actuator B-Chem. 122 (2007) 395-402. [38] A. Rondeau, N. Larsson, M. Boujtita, L. Gorton, N. El Murr, Analysis 27 (1999) 649-656. [39] S. Alpat, A. Telefoncu, Sensors 10, (2010) 748-764. [40] J. A. Nicell and H. Wright, Enzyme Microb. Technol. 21(4) (1997) 302-310. [41] L. Yotova, N. Medhat, Int. J. Bioautomation 15(4) (2011) 267-276. [42] Amine A., H. Mohammadi, I. Bourais, G Palleschi, Biosens. Bioelectron. 21 (2006) 1405 -142. [43] E. Kuusk, T. Rinken, Enzyme Microb. Technol. 34 (2004) 657-661. [44] J. Castillo, S. Gáspar, I., Sakharov, E. Csöregi, Biosens. Bioelectron. 18 (2003) 705-714. [45] I. S. Alpeeva, A. Vilkanauskyte, B. Ngounou, E. Csöregi, I. Y. Sakharov, M. W. Gonchar,
Microchim. Acta 152 21-27 (2005).
© 2014 by the authors; licensee IAPC, Zagreb, Croatia. This article is an open-access article distributed under the terms and conditions of the Creative Commons Attribution license
(http://creativecommons.org/licenses/by/4.0/)


doi: 10.5599/jese.2014.0068 177
J. Electrochem. Sci. Eng. 4(4) (2014) 177-186; doi: 10.5599/jese.2014.0068
Open Access : : ISSN 1847-9286
www.jESE-online.org
Original scientific paper
Voltammetric studies on mercury behavior in different aqueous solutions for further development of a warning system designed for environmental monitoring
Paul-Cristinel Verestiuc, Igor Cretescu*,, Oana-Maria Tucaliuc, Iuliana-Gabriela Breaban and Gheorghe Nemtoi**
Faculty of Geography and Geology, Al. I. Cuza University of Iasi, 20 A. Carol I Bd., Iasi, 700505, Romania *Faculty of Chemical Engineering and Environmental Protection, Gheorghe Asachi Technical University of Iasi, 73, D. Mangeron Street, Iasi, 700050, Romania **Faculty of Chemistry, Al. I. Cuza University of Iasi, 11, Carol I Bd., Iasi, 700506, Romania
Corresponding author: E-mail: [email protected]; Tel.: +40-741-914-342.
Received: October 5, 2014; Revised: October 31, 2014; Published: December 6, 2014
Abstract This article presents some results concerning the electrochemical detection of mercury in different aqueous solutions, using the following electrodes: platinum-disk electrode (PDE), carbon paste electrode (CPE) and glass carbon electrode (GCE). Using the voltam-metric technique applied on the above mentioned electrodes, the experimental conditi-ons were established in order to obtain the maximum current peaks, in terms of the best analytical characteristics for mercury analyses. The dependence equations of cathodic current intensity on the scan rate were established in the case of mercury ion discharge in each prepared solution of 0.984 mM HgCl2 in different electrolyte background: 0.1 M KCl, 0.1 M H2SO4 and 0.9 % NaCl. Among the three investigated electrodes, the carbon paste electrode presented the highest detection sensitivity toward mercury ions in the aqueous solution. It was observed that, at a low scanning rate, the pH had an insi-gnificant influence over the current peak intensity; however, the quantification of this in-fluence was achieved using a quadratic polynomial equation, which could prevent the er-rors in mercury detection in case of industrial waste stream pH changes. The calibration curves for mercury in 0.9 % NaCl solution and in the tap water respectively were carried out.
Keywords Cathodic linear voltammetry; platinum electrode; carbon paste electrode; glass carbon
electrode; mercuric ion; flow electrochemical cell.
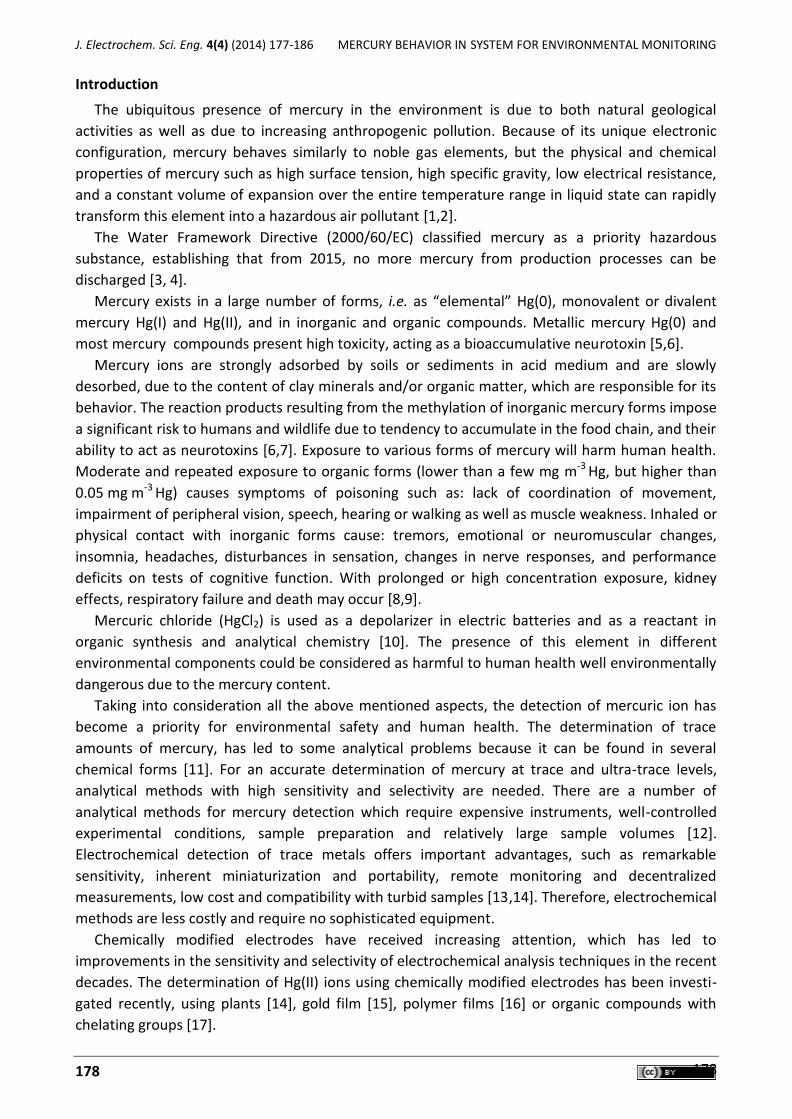
J. Electrochem. Sci. Eng. 4(4) (2014) 177-186 MERCURY BEHAVIOR IN SYSTEM FOR ENVIRONMENTAL MONITORING
178 178
Introduction
The ubiquitous presence of mercury in the environment is due to both natural geological
activities as well as due to increasing anthropogenic pollution. Because of its unique electronic
configuration, mercury behaves similarly to noble gas elements, but the physical and chemical
properties of mercury such as high surface tension, high specific gravity, low electrical resistance,
and a constant volume of expansion over the entire temperature range in liquid state can rapidly
transform this element into a hazardous air pollutant [1,2].
The Water Framework Directive (2000/60/EC) classified mercury as a priority hazardous
substance, establishing that from 2015, no more mercury from production processes can be
discharged [3, 4].
Mercury exists in a large number of forms, i.e. as “elemental” Hg(0), monovalent or divalent
mercury Hg(I) and Hg(II), and in inorganic and organic compounds. Metallic mercury Hg(0) and
most mercury compounds present high toxicity, acting as a bioaccumulative neurotoxin [5,6].
Mercury ions are strongly adsorbed by soils or sediments in acid medium and are slowly
desorbed, due to the content of clay minerals and/or organic matter, which are responsible for its
behavior. The reaction products resulting from the methylation of inorganic mercury forms impose
a significant risk to humans and wildlife due to tendency to accumulate in the food chain, and their
ability to act as neurotoxins [6,7]. Exposure to various forms of mercury will harm human health.
Moderate and repeated exposure to organic forms (lower than a few mg m-3 Hg, but higher than
0.05 mg m-3 Hg) causes symptoms of poisoning such as: lack of coordination of movement,
impairment of peripheral vision, speech, hearing or walking as well as muscle weakness. Inhaled or
physical contact with inorganic forms cause: tremors, emotional or neuromuscular changes,
insomnia, headaches, disturbances in sensation, changes in nerve responses, and performance
deficits on tests of cognitive function. With prolonged or high concentration exposure, kidney
effects, respiratory failure and death may occur [8,9].
Mercuric chloride (HgCl2) is used as a depolarizer in electric batteries and as a reactant in
organic synthesis and analytical chemistry [10]. The presence of this element in different
environmental components could be considered as harmful to human health well environmentally
dangerous due to the mercury content.
Taking into consideration all the above mentioned aspects, the detection of mercuric ion has
become a priority for environmental safety and human health. The determination of trace
amounts of mercury, has led to some analytical problems because it can be found in several
chemical forms [11]. For an accurate determination of mercury at trace and ultra-trace levels,
analytical methods with high sensitivity and selectivity are needed. There are a number of
analytical methods for mercury detection which require expensive instruments, well-controlled
experimental conditions, sample preparation and relatively large sample volumes [12].
Electrochemical detection of trace metals offers important advantages, such as remarkable
sensitivity, inherent miniaturization and portability, remote monitoring and decentralized
measurements, low cost and compatibility with turbid samples [13,14]. Therefore, electrochemical
methods are less costly and require no sophisticated equipment.
Chemically modified electrodes have received increasing attention, which has led to
improvements in the sensitivity and selectivity of electrochemical analysis techniques in the recent
decades. The determination of Hg(II) ions using chemically modified electrodes has been investi-
gated recently, using plants [14], gold film [15], polymer films [16] or organic compounds with
chelating groups [17].

P.-C. Verestiuc et al. J. Electrochem. Sci. Eng. 4(4) (2014) 177-186
doi: 10.5599/jese.2014.0068 179
The behavior of electrodes has also been studied using modified a carbon paste electrode [18],
modified glass carbon electrode [17] or modified gold nanoelectrode ensembles [19].
A relatively recent review of electrochemical sensors and detectors has been done by Bak-
ker [20], characterizing this area of research as being one of the most fruitful and interdisciplinary
areas of research in analytical chemistry. A recent paper by Pujol [21] analyzed the actual state of
art concerning the sensors and devices for heavy metals detection in water, but the mercury
detection from environmental samples was not studied in details.
For this reason in this study it was investigated the cathodic discharge of the mercuric ion on
different type of electrodes such as: platinum-disk electrode, carbon paste electrode and glass
carbon electrode, in respectively different aqueous solutions (0.1 M KCl, 0.1 M H2SO4, 0.9 % NaCl)
by the voltammetric method in order to find the most suitable conditions for analytical purpose.
EXPERIMENTAL
In order to simulate the wastewater from the industrial stream, aqueous solutions of HgCl2 in
0.1 M H2SO4 at a pH value of 0.99, 0.9 % NaCl at a pH value of 5.66 and 0.1 M KCl at a pH value of
7.43 was prepared, using analytical purity reagents and double distilled water. The investigation of
mercury behavior in these solutions was carried out using voltammetric measurements [22-26]
with the above mentioned electrodes (GCE, CPE and PDE) individually. These electrodes play the
role of working electrode (WE) in a flow electrochemical cell (as is presented in Fig. 1) through
which the samples from the industrial stream are passed using a peristaltic pump. A saturated
calomel electrode (SCE) was used as the reference electrode (RE), while a platinum electrode was
used as the counter (auxiliary) electrode (CE) at the temperature of 25 °C. Also, pH and tempera-
ture sensors were located in the electrochemical cell in order to provide corrections in the case of
possible changes in the above mentioned parameters which should be kept constant at the same
values as were used during the calibration procedure.
Figure 1. Experimental setup for study of the voltammetric detection of mercury in aqueous solution
The pH corrections were achieved using software (the pH dependence of the current peak was
determined by a simple equation), while the temperature corrections were first achieved by the
thermostatic system for sample processing and finally by the software corrections for the fine pH
adjustments.

J. Electrochem. Sci. Eng. 4(4) (2014) 177-186 MERCURY BEHAVIOR IN SYSTEM FOR ENVIRONMENTAL MONITORING
180 180
The voltammograms were recorded using the potentiostat VoltaLab 32 (Radiometer Analytical)
[27-29] after stopping the flow of liquid samples through the electrochemical cell (using a solenoid
mini-valve) and nitrogen bubbling in the investigated solutions, in order to remove the dissolved
oxygen.
The investigated electrodes were used as purchased from Radiometer Analytical, except for the
carbon paste electrode, which was prepared according to methods previously presented in the
literature [30-31]. The electrode surfaces were: 3.14·10-2 cm2 for PDE; 7.07 10-2 cm2 for GCE and
19.63 10-2 cm2 for CPE.
Results and discussion
In Figures 2, 3 and 4, the cathodic linear voltammograms are presented, corresponding to the
reduction of Hg2+ on the PDE (Φ = 2mm) at different scanning rates in different aqueous media.
Figure 2. Linear cathodic voltammograms on PDE in 0.1 M H2SO4 aqueous solution
recorded at different scanning rates
Figure 3. Linear cathodic voltammograms on PDE in 0.1 M KCl aqueous solution recorded
at different scanning rates
Figure 4. Linear cathodic voltammograms on PDE in 0.9 % NaCl aqueous solution recorded at different
scanning rates.
Figure 5. Linear cathodic voltammograms of mercury ion discharge on PDE in different solutions at
constant scanning rate of 50 mV s-1

P.-C. Verestiuc et al. J. Electrochem. Sci. Eng. 4(4) (2014) 177-186
doi: 10.5599/jese.2014.0068 181
Concerning the electrochemical behavior of mercuric ions in the three different aqueous
solutions shown in Figures 2-4, it was observed that there was a simultaneous increase in PDE
sensitivity with the scanning rate, at a concentration of 0.984 mM, as was expected.
This behavior leads to the following dependence equations for the cathodic peaks, which
express the discharge of the mercuric ion on the platinum electrode, in all investigated solutions:
a. 0.1 M H2SO4: I = -2.114 – 0.058 v + 3.474×10⁻⁵ v2 (R = 0.99952) (1)
b. 0.1 M KCl: I = -4.285 – 0.072 v + 2.168 ×10⁻⁵ v2 (R = 0.99757) (2)
c. physiological serum (0.9 % NaCl): I =-6.815 - 0.140v - 6.611×10⁻⁵ v2 (R = 0.99827) (3)
where: I = intensity current (mA), v = scanning rate (mV s-1), R = correlation coefficient
According to the experimental results, it was noted that the highest sensitivity of PDE was
obtained in physiological serum, followed by the solution prepared based on sulfuric acid and
potassium chloride, respectively (Figure 5).
Figure 6. Linear cathodic voltammograms on CGE in 0.1 M H2SO4 aqueous solution recorded at different
scanning rates.
Figure 7. Linear cathodic voltammograms on CGE in 0.1 M KCl aqueous solution recorded at different
scanning rates
Figure 8. Linear cathodic voltammograms on CGE in 0.9 % NaCl aqueous solution recorded at different
scanning rates
Figure 9. Linear cathodic voltammograms of mercury ion discharge on GCE in different aqueous
solution at constant scanning rate of 50 mV/s
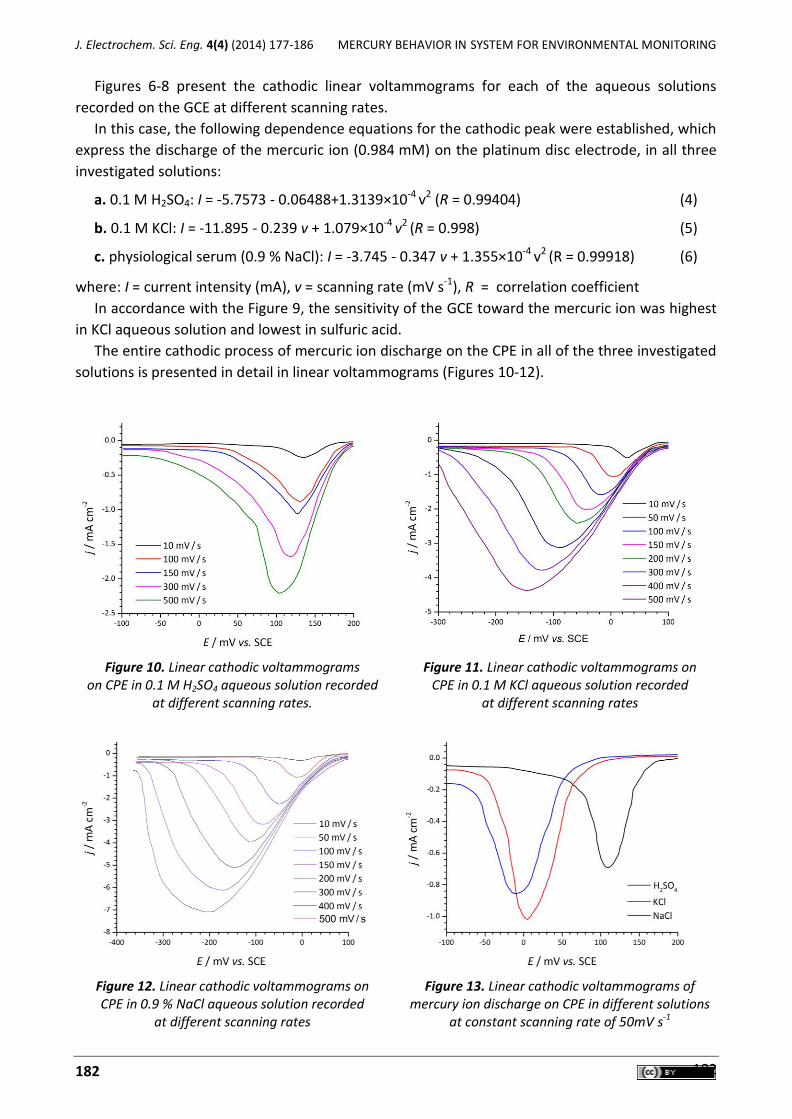
J. Electrochem. Sci. Eng. 4(4) (2014) 177-186 MERCURY BEHAVIOR IN SYSTEM FOR ENVIRONMENTAL MONITORING
182 182
Figures 6-8 present the cathodic linear voltammograms for each of the aqueous solutions
recorded on the GCE at different scanning rates.
In this case, the following dependence equations for the cathodic peak were established, which
express the discharge of the mercuric ion (0.984 mM) on the platinum disc electrode, in all three
investigated solutions:
a. 0.1 M H2SO4: I = -5.7573 - 0.06488+1.3139×10⁻⁴ v2 (R = 0.99404) (4)
b. 0.1 M KCl: I = -11.895 - 0.239 v + 1.079×10⁻⁴ v2 (R = 0.998) (5)
c. physiological serum (0.9 % NaCl): I = -3.745 - 0.347 v + 1.355×10⁻⁴ v2 (R = 0.99918) (6)
where: I = current intensity (mA), v = scanning rate (mV s-1), R = correlation coefficient
In accordance with the Figure 9, the sensitivity of the GCE toward the mercuric ion was highest
in KCl aqueous solution and lowest in sulfuric acid.
The entire cathodic process of mercuric ion discharge on the CPE in all of the three investigated
solutions is presented in detail in linear voltammograms (Figures 10-12).
Figure 10. Linear cathodic voltammograms
on CPE in 0.1 M H2SO4 aqueous solution recorded at different scanning rates.
Figure 11. Linear cathodic voltammograms on CPE in 0.1 M KCl aqueous solution recorded
at different scanning rates
Figure 12. Linear cathodic voltammograms on CPE in 0.9 % NaCl aqueous solution recorded
at different scanning rates
Figure 13. Linear cathodic voltammograms of mercury ion discharge on CPE in different solutions
at constant scanning rate of 50mV s-1
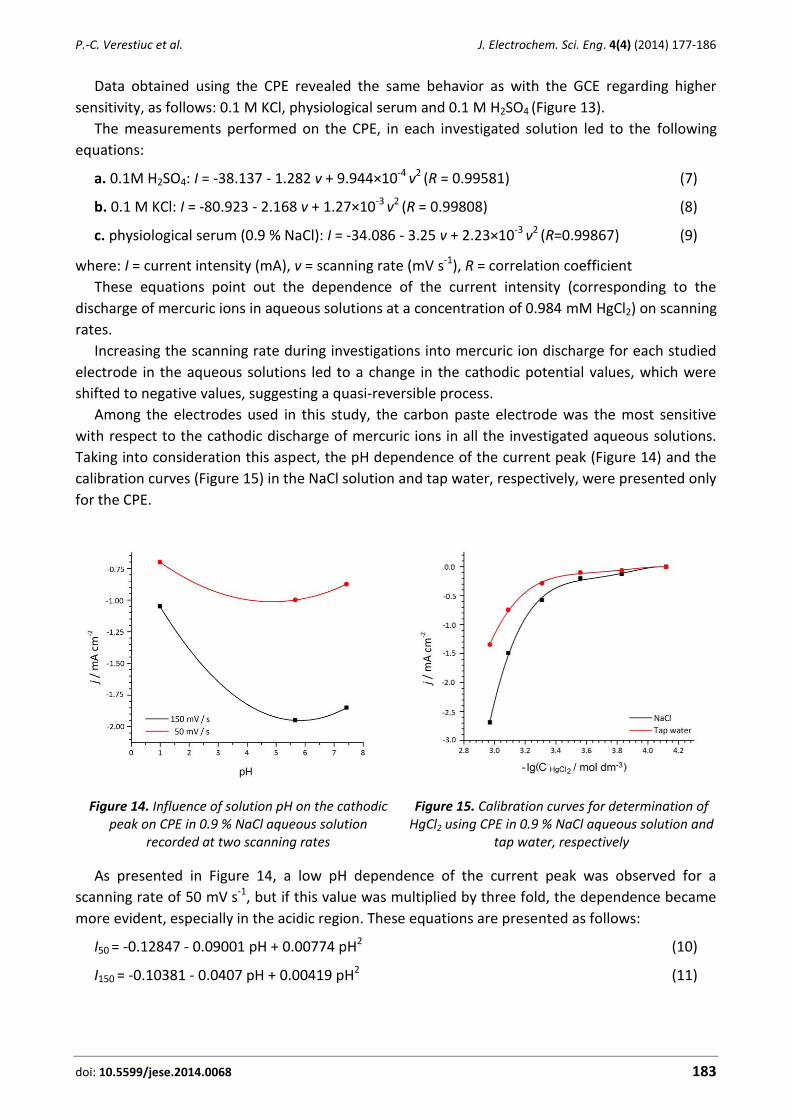
P.-C. Verestiuc et al. J. Electrochem. Sci. Eng. 4(4) (2014) 177-186
doi: 10.5599/jese.2014.0068 183
Data obtained using the CPE revealed the same behavior as with the GCE regarding higher
sensitivity, as follows: 0.1 M KCl, physiological serum and 0.1 M H2SO4 (Figure 13).
The measurements performed on the CPE, in each investigated solution led to the following
equations:
a. 0.1M H2SO4: I = -38.137 - 1.282 v + 9.944×10⁻⁴ v2 (R = 0.99581) (7)
b. 0.1 M KCl: I = -80.923 - 2.168 v + 1.27×10⁻³ v2 (R = 0.99808) (8)
c. physiological serum (0.9 % NaCl): I = -34.086 - 3.25 v + 2.23×10⁻³ v2 (R=0.99867) (9)
where: I = current intensity (mA), v = scanning rate (mV s-1), R = correlation coefficient
These equations point out the dependence of the current intensity (corresponding to the
discharge of mercuric ions in aqueous solutions at a concentration of 0.984 mM HgCl2) on scanning
rates.
Increasing the scanning rate during investigations into mercuric ion discharge for each studied
electrode in the aqueous solutions led to a change in the cathodic potential values, which were
shifted to negative values, suggesting a quasi-reversible process.
Among the electrodes used in this study, the carbon paste electrode was the most sensitive
with respect to the cathodic discharge of mercuric ions in all the investigated aqueous solutions.
Taking into consideration this aspect, the pH dependence of the current peak (Figure 14) and the
calibration curves (Figure 15) in the NaCl solution and tap water, respectively, were presented only
for the CPE.
Figure 14. Influence of solution pH on the cathodic peak on CPE in 0.9 % NaCl aqueous solution
recorded at two scanning rates
Figure 15. Calibration curves for determination of HgCl2 using CPE in 0.9 % NaCl aqueous solution and
tap water, respectively
As presented in Figure 14, a low pH dependence of the current peak was observed for a
scanning rate of 50 mV s-1, but if this value was multiplied by three fold, the dependence became
more evident, especially in the acidic region. These equations are presented as follows:
I50 = -0.12847 - 0.09001 pH + 0.00774 pH2 (10)
I150 = -0.10381 - 0.0407 pH + 0.00419 pH2 (11)
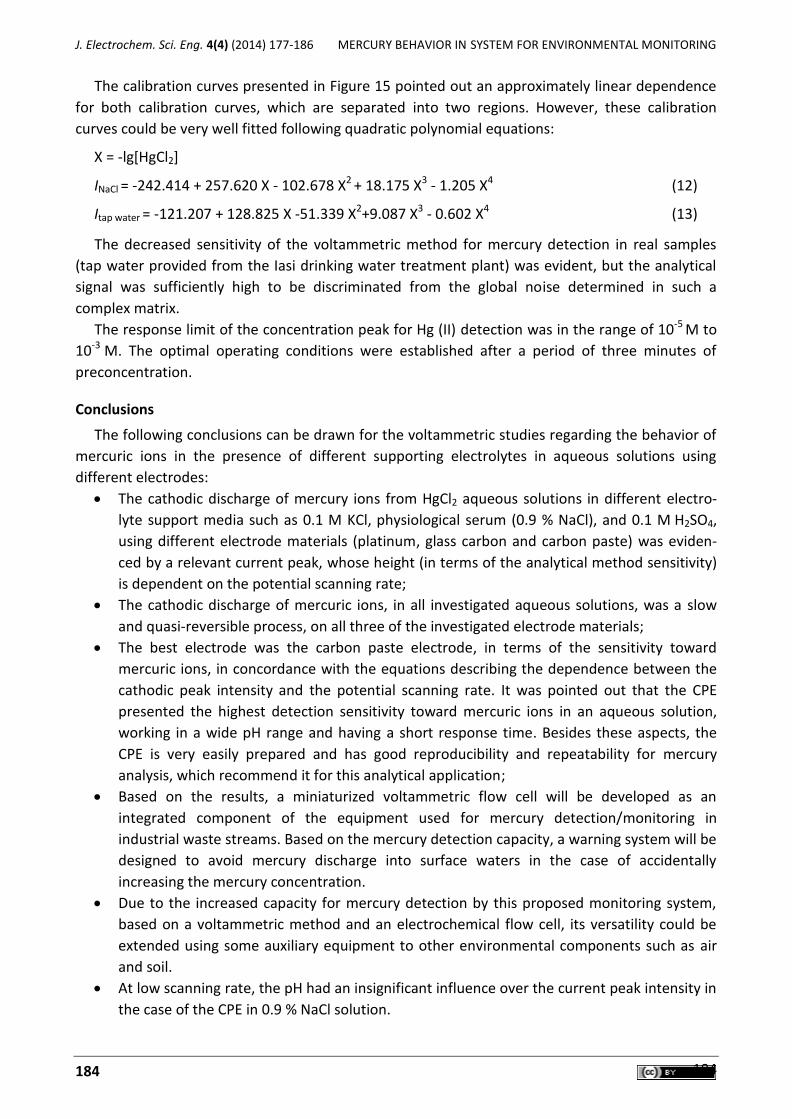
J. Electrochem. Sci. Eng. 4(4) (2014) 177-186 MERCURY BEHAVIOR IN SYSTEM FOR ENVIRONMENTAL MONITORING
184 184
The calibration curves presented in Figure 15 pointed out an approximately linear dependence
for both calibration curves, which are separated into two regions. However, these calibration
curves could be very well fitted following quadratic polynomial equations:
X = -lg[HgCl2]
INaCl = -242.414 + 257.620 X - 102.678 X2 + 18.175 X3 - 1.205 X4 (12)
Itap water = -121.207 + 128.825 X -51.339 X2+9.087 X3 - 0.602 X4 (13)
The decreased sensitivity of the voltammetric method for mercury detection in real samples
(tap water provided from the Iasi drinking water treatment plant) was evident, but the analytical
signal was sufficiently high to be discriminated from the global noise determined in such a
complex matrix.
The response limit of the concentration peak for Hg (II) detection was in the range of 10-5 M to
10-3 M. The optimal operating conditions were established after a period of three minutes of
preconcentration.
Conclusions
The following conclusions can be drawn for the voltammetric studies regarding the behavior of
mercuric ions in the presence of different supporting electrolytes in aqueous solutions using
different electrodes:
The cathodic discharge of mercury ions from HgCl2 aqueous solutions in different electro-
lyte support media such as 0.1 M KCl, physiological serum (0.9 % NaCl), and 0.1 M H2SO4,
using different electrode materials (platinum, glass carbon and carbon paste) was eviden-
ced by a relevant current peak, whose height (in terms of the analytical method sensitivity)
is dependent on the potential scanning rate;
The cathodic discharge of mercuric ions, in all investigated aqueous solutions, was a slow
and quasi-reversible process, on all three of the investigated electrode materials;
The best electrode was the carbon paste electrode, in terms of the sensitivity toward
mercuric ions, in concordance with the equations describing the dependence between the
cathodic peak intensity and the potential scanning rate. It was pointed out that the CPE
presented the highest detection sensitivity toward mercuric ions in an aqueous solution,
working in a wide pH range and having a short response time. Besides these aspects, the
CPE is very easily prepared and has good reproducibility and repeatability for mercury
analysis, which recommend it for this analytical application;
Based on the results, a miniaturized voltammetric flow cell will be developed as an
integrated component of the equipment used for mercury detection/monitoring in
industrial waste streams. Based on the mercury detection capacity, a warning system will be
designed to avoid mercury discharge into surface waters in the case of accidentally
increasing the mercury concentration.
Due to the increased capacity for mercury detection by this proposed monitoring system,
based on a voltammetric method and an electrochemical flow cell, its versatility could be
extended using some auxiliary equipment to other environmental components such as air
and soil.
At low scanning rate, the pH had an insignificant influence over the current peak intensity in
the case of the CPE in 0.9 % NaCl solution.
P.-C. Verestiuc et al. J. Electrochem. Sci. Eng. 4(4) (2014) 177-186
doi: 10.5599/jese.2014.0068 185
In order to avoid errors in mercury detection in cases of industrial stream pH changes, the
quantification of the pH influence was achieved using a quadratic polynomial equation.
The calibration curves for mercury in a 0.9 % NaCl solution and in tap water had similar
shapes (which could be divided into two linear sections) but with decreased the sensitivity
in tap water.
Acknowledgements: This work was supported by the strategic grant POSDRU/159/1.5/S/133652, co-financed by the European Social Fund within the Sectorial Operational Program Human Resources Development 2007 – 2013.
References
[1] R. P. Mason, W. F. Fitzgerald, F. M. M. Morel, Geochimica et Cosmochimica Acta 58 (15) (1994) 3191-3198
[2] W. H. Schroeder, J. Munthe, Atmospheric Environment 32 (5) (1998) 809-822 [3] A. Pichard, Mercury and its derivates, Institut National de L’environment Industiel et des
Risques, Amiens, France, 2000, p. 6-8 [4] J. De Clerq, International Journal of Industry Chemistry 3 (1) (2012) [5] O. Lindquist, K. Johansson, M. Aastrup, A. Andersson, L. Bringmark, G. Hovsenius, L.
Hakanson, A. Iverfeldt, M. Meili, B. Timm, Water, Air, & Soil Pollution 55 (1) (1991) 23-32 [6] H. Satoh, Industrial Health 38 (1) (2000) 153-164
[7] W. F. Fitzgerald, T.W. Clarkson, Environmental Health Perspectives 96 (1) (1991) 159-166 [8] U. S. Environmental Protection Agency, Mercury Study Report to Congress, Volume III,
1997, p. 93
[9] T. W. Clarkson, L. Magos, G. J. Myers, The New England Journal of Medicine 349 (18) (2003) 1731-1737
[10] W. T. S Zaugg, D. Foreman, L. M. Faires, M. G. Werner, T. J. Leiker; P. F. Rogerson, Environmental Science & Technology 26 (7) (1992) 1307-1314
[11] D. W. Boeing, Chemosphere 40 (1) (2000) 1335 – 1351 [12] O. M. Tucaliuc, I. Cretescu, G. Nemtoi , I. G. Breaban, G. Soreanu, O. G. Iancu,
Environmental Engineering and Management Journal 13 (8) (2014) 2051-2061 [13] J. Wang, B. Tian, J. Wang J. Lu, C. Olsen, C. Yarnitzky, K. Olsen, D. Hammerstrom, W.
Bennet, Analytica Chimica Acta 385 (1) (1999) 429-435 [14] D. S. Rajawat, S. Srivastava, S. P. Satsangee, International Journal of Electrochemical Science
7 (1) (2012) 11456-11469 [15] R. D. Riso, M. Waeles, P. Monbet, C. J. Chaumery, Analytica Chimica Acta 410 (1) (2000) 97-
105 [16] L. R. Popescu, E. M. Ungureanu, G. O. Buica, C. Dinu, M. Iordache, Scientific Bulletin-
University Politehnica of Bucharest Series B 75(4) (2013) 1454-2331 [17] F. Wang, J. Liu, Y. J. Wu, Y. M. Gao, X.F. Huang, Journal of Chinese the Chemical Society 56
(4) (2009) 778-784 [18] C. M. V. B. Almeida, B.F. Giannettio, Electrochemistry Communications 4 (1) (2002) 985-988 [19] B. K. Jena, C. R. Raj, Analytical Chemistry 80 (13) (2008) 4836-4844 [20] E. Bakker, M. Telting-Diaz, Analytical Chemistry 74 (1) (2002) 2781-2800 [21] L. Pujol, D. Evrard, K. Groenen-Serrano, M. Freyssinier, A. Ruffien-Cizsak, P. Gross, Frontiers
in Chemistry 2 (19) (2014) 1-24
[22] Y. M. Sin, W. F. Teh, M. K. Wong, P. K. Reddy, Bulletin of Environmental Contamination and Toxicology 44 (1) (1990) 616-622

J. Electrochem. Sci. Eng. 4(4) (2014) 177-186 MERCURY BEHAVIOR IN SYSTEM FOR ENVIRONMENTAL MONITORING
186 186
[23] D. M. Gordin, T. Gloriant, G. Nemtoi, R. Chelariu, N. Aelenei, A. Guillou, D. Ansel, Materials letters 59 (23) (2005) 2936-2941
[24] D. Mareci, C. Bocanu, G. Nemtoi, D. Aelenei, Journal of the Serbian Chemical Society. 70 (6) (2005) 891-897
[25] G. Nemtoi, A. Ciomaga, T. Lupascu, Revue Roumaine de Chimie 57 (9-10) (2012) 837-841 [26] A. V. Sandu, A. Ciomaga, G. Nemtoi, C. Bejenariu, I. Sandu, Microscopy Research and
Technique 75(12) ( 2012) 1711-1716 [27] G. Nemtoi, H. Chiriac, O. Dragoş, M.O. Apostu, D. Lutic, Acta Chemica Iasi 17 (2) (2009) 151-
168 [28] G. Nemtoi, M. S. Secula, I. Cretescu, S. Petrescu, Revue Roumaine de Chimie 58 (12) (2007)
655-659 [29] G. Nemtoi, D.I. Cuciurean, Revista de Chimie 53 (2) (2002) 146-149 [30] S. I. M. Zayed , H. A. M. Arida, International Journal of Electrochemical Science 8 (2013)
1340 – 1348 [31] J. Zima, I. Svancara, J. Barek, K. Vytras, Critical Reviews in Analytical Chemistry 39 (2009)
204–227
© 2014 by the authors; licensee IAPC, Zagreb, Croatia. This article is an open-access article distributed under the terms and conditions of the Creative Commons Attribution license
(http://creativecommons.org/licenses/by/4.0/)

doi: 10.5599/jese.2014.0067 187
J. Electrochem. Sci. Eng. 4(4) (2014) 187-201; doi: 10.5599/jese.2014.0067
Open Access : : ISSN 1847-9286
www.jESE-online.org
Original scientific paper
Use of hydrous titanium dioxide as potential sorbent for the removal of manganese from water
Ramakrishnan Kamaraj, Pandian Ganesan and Subramanyan Vasudevan
CSIR-Central Electrochemical Research Institute, Karaikudi - 630 006, India
Corresponding Author E-mail: [email protected]; Tel.: +91-4565-241278
Received: October 4, 2014; Revised: October 30, 2014; Published: December 6, 2014
Abstract This research article deals with an electrosynthesis of hydrous titanium dioxide by anodic dissolution of titanium sacrificial anodes and their application for the adsorption of manganese from aqueous solution. Titanium sheet was used as the sacrificial anode and galvanized iron sheet was used as the cathode. The optimization of different experimental parameters like initial ion concentration, current density, pH, temperature, etc., on the removal efficiency of manganese was carried out. The maximum removal efficiency of 97.55 % was achieved at a current density of 0.08 A dm-2 and pH of 7.0. The Langmuir, Freundlich and Redlich Peterson isotherm models were applied to describe the equilibrium isotherms and the isotherm constants were determined. The adsorption of manganese preferably followed the Langmuir adsorption isotherm. The adsorption kinetics was modelled by first- and second- order rate models and the adsorption kinetic studies showed that the adsorption of manganese was best described using the second-order kinetic model. Thermodynamic parameters indicate that the adsorption of manganese on hydrous titanium dioxide was feasible, spontaneous and exothermic.
Keywords: Titanium dioxide; manganese; adsorption; thermodynamics; isotherm; kinetics.
Introduction
Manganese (Mn) is a naturally occurring element found in the air, soil, and water. It can exist in
seven oxidation states ranging from -2 to +7. It is rarely found in its elemental state and is
therefore a component of over 100 minerals and exists mainly as oxides, carbonates, and silicates.
Its most common mineral is pyrolusite (MnO2). In ground water, manganese is a common
contaminant and its presence is due to leaching processes and varies widely depending on the
rock type. Also, manganese has a variety of applications such as in ceramics, metallurgical

J. Electrochem. Sci. Eng. 4(4) (2015) 187-201 TiO2 AS SORBENT FOR THE REMOVAL OF Mn FROM WATER
188 188
processes, mining, dry cell batteries, pigments and paints which all can be the sources of
underground pollution [1]. In addition to the disposal of untreated discharge from above the
applications into water, another major source of pollution of the manganese is burning of coal and
oil [2]. Manganese is an essential metal for the human system and many enzymes are activated by
manganese. The manganese contaminant in ground water affects the intelligent quotient (IQ) of
children. Intake of higher concentrations of manganese causes neuro toxic disease like
Parkinsonism and manganese psychosis, an irreversible neurological disorder [3–5]. The prolonged
over intake potentially affects the central nervous system, lungs, also causes diseases of disturbed
speech called prognosis, also cause bronchitis and pneumonia [6,7]. The World Health
Organization (WHO) prescribed the permissible limit for the manganese in the ground water is
0.05 mg L-1. For this reason, there is great interest in the development of environmentally clean
methods to destroy such compounds in aqueous medium for avoiding their dangerous
accumulation in the aquatic environment.
Because of its high solubility over a wide pH range, toxicity and non-degradable nature, it is
notoriously difficult to remove manganese from contaminated water [8,9]. Hence the researchers
in the world have carried out significant work on their removal from aqueous solutions and
industrial effluents [10-16]. The usual method for removing toxic metals from water include
electrodialysis, chemical coagulation, reverse osmosis, co-precipitation, complexation, solvent
extraction, ion exchange, electrochemical treatment and adsorption. Physical methods like ion
exchange, reverse osmosis and electrodialysis have proven to be either too expensive or
inefficient to remove manganese from water. At present, chemical treatments are not used due to
disadvantages like high costs of maintenance, problems of sludge handling and its disposal, and
neutralization of effluent. In this scenario, the electrochemical technologies have received great
attention for the prevention of pollution problems, as reported in several reviews [17-19].
In the recent decade, electrodissolution process, where the coagulants generated in-situ, has
been increasingly used in the world for treating the industrial wastewater, ground water and
surface water and many studies conducted to optimize this process for specific problems [19]. The
sacrificial anodic electrodes, commonly consisting of iron and aluminum, are used to continuously
supply metallic ions as the source of coagulants, which can hydrolyze near the anode to form a
series of metallic hydroxides capable of destabilizing dispersed particles. This process generates
large quantities of iron and aluminum salt coagulated sludge, which inhibits efficient water
treatment. From the generated coagulant, nothing may be recovered or reused, and require
further incineration and landfill treatment. Furthermore, the appearance of dissolved iron in
aquatic suspensions can lead to visual, odor and taste problems resulting from later growth of iron
bacteria [20]. Even aluminum salts are suspected to be harmful to human and living things [21].
Consequently, a coagulant that is safer and produces more reusable coagulated sludge could offer
a novel solution to many environmental and economic problems associated with sludge handling.
However, reports on novel electrodes materials remain very scarce in the literature for the
generation of reusable and environmentally friendly coagulant. Removal of metal contaminants by
the chemically synthesized, different forms of, titanium dioxide was widely reported [22-25] and
was similar to that of the most widely used iron and aluminum salt flocculation. Furthermore,
long-term toxicological studies have not found titanium salt in water to have any adverse effects.
All the above factors suggest that the titanium salt can be used as an alternative coagulant [26].
In this investigation, titanium was used instead of iron and aluminum as a novel alternative
sacrificial anode, and the removal of manganese from water by titanium-based electrocoagulation
R. Kamaraj et al. J. Electrochem. Sci. Eng. 4(4) (2015) 187-201
doi: 10.5599/jese.2014.0067 189
was investigated. To optimize the maximum removal efficiency of manganese, different
parameters like current density, pH, and temperature, inter electrode distance and co-existing
ions were studied. In doing so, the equilibrium adsorption behavior is analyzed by fitting models of
Langmuir, Freundlich and Redlich Peterson. The adsorption kinetics was modeled by first- and
second- order rate models. Activation energy is evaluated to study the nature of adsorption.
Experimental
Chemicals
Manganese nitrate [Mn(NO3)2] of analytical grade was purchased from MERCK. Hydrochloric
acid (HCl) and sodium hydroxide (NaOH) used for pH adjustment were of analytical grade from
MERCK. Sodium chloride (NaCl) used for better conductivity of electrolyte of analytical grade from
MERCK. Sodium phosphate, sodium silicate, sodium carbonate and sodium fluoride used as co-
existing ions were of analytical grade and purchased from MERCK.
Electrolytic system and electrolysis
The experiments were carried out in a monopolar batch reactor using 1000 mL Plexiglas vessel
that was fitted with a polycarbonate cell cover with slots to introduce the electrodes, pH sensor, a
thermometer and the electrolytes. Titanium (Alfa Aesar, UK) of surface area (0.02 m2) acted as the
anode. The cathode was galvanized iron (commercial grade, India) sheets of the same size as the
anode is placed at an inter-electrode distance of 3 cm. The temperature of the electrolyte was
controlled to the desired value with a variation of ± 2 K by adjusting the rate of flow of thermo-
statically controlled water through an external glass-cooling spiral. A regulated direct current (DC)
was supplied from a rectifier (10 A, 0-25 V; Aplab model).
The required concentration of manganese was prepared using Milli Q water. In all the
experiments 3 g L-1 of sodium chloride was used for better conductivity. The solution volume of 900
mL was used for each experiment as the electrolyte. The pH of the electrolyte was adjusted and
measured initially and during the electrolysis by a pH meter (DKK-TOC, Japan). The pH was
adjusted using either 0.1 M NaOH or 0.1 M HCl as necessary. After adjusting the initial solution pH
to the desired value (3 to 9), the current density was set. The solution was stirred at 250 rpm to
ensure good mixing and transport of reactants. Temperature studies were carried at varying
temperature (323-343 K) to determine the type of reaction.
Analytical procedures
The concentration of manganese was determined using UV-visible Spectrophotometer with
manganese kits (MERCK, Pharo 300, Germany). The SEM image of titanium dioxide was analyzed
with a Scanning Electron Microscope (SEM) made by Hitachi (model s-3000h). The constituents of
the titanium dioxide were analyzed by X-Ray Fluorescence (XRF) made by Horiba (model XGT-
2700). The Fourier transform infrared spectrum of titanium dioxide was obtained using Nexus 670
FTIR spectrometer (Thermo Electron Corporation, USA) and X-ray diffraction (XRD) patterns of
titanium dioxide was analyzed using an X’per PRO X-ray diffractometer (PANalytical, USA). TGA of
titanium dioxide was carried out in the Thermal Analyzer (TA Instruments; Model SDT Q600). The
concentration of carbonate, silicate, and phosphate were determined using UV-Visible
spectrophotometer with respective standard ion kits supplied by MERCK (MERCK, Pharo 300).
J. Electrochem. Sci. Eng. 4(4) (2015) 187-201 TiO2 AS SORBENT FOR THE REMOVAL OF Mn FROM WATER
190 190
Results and Discussion
Effect of current density on the removal efficiency
The current density is one of the prominent factors which strongly influence the performance
of electrodissolution process. The current density not only determines the coagulant dosage and
bubble production rate but also the size and growth of the flocks, which can influence the
treatment efficiency. Therefore, the effect of current density on the removal of manganese was
investigated. Applying a constant current to the titanium effectively dissolved Ti according to
Ti→Ti2+→TiO2+. TiO2+ combined easily with OH− to form TiO2·H2O or Ti(OH)4. Ti(OH)4 is unstable
substance, which changes gradually into TiO2·H2O by dehydration. The reaction equations were,
TiO2+ + 6OH- + 2e- → Ti(OH)4 + H2 + 3O2- (1)
and
TiO2+ + 2OH- → TiO2 . H2O (2)
and at the cathode the following reaction is taking place,
2H2O + 2e- → H2 (g) + 2OH- (3)
The amount of manganese removal depends upon the quantity of adsorbent (hydrous titanium
dioxide) generated, which is related to the time and current density [27]. The amount of adsorbent
was determined from Faraday’s law. With the increase in current density the amount of hydrous
titanium dioxide generation also increases. To investigate the effect of current density on the man-
ganese removal, a series of experiments were carried out by solutions containing a constant pol-
lutants loading of 2 mg L-1, at a pH 7.0, with current density being varied from 0.02 to 0.1 A dm-2.
The removal efficiencies are 60.25, 82.54, 90.10, 97.55 and 97.90 % for 0.02, 0.04, 0.06, 0.08 and
0.1 A dm-2 respectively. From the results, it was found that very small raise in removal efficiency
was observed for current densities 0.08 and 0.1 A dm-2. Hence, the further experiments were
carried out at 0.08 A dm-2.
Effect of pH on the removal efficiency
It is believed that the initial pH is an important operating factor influencing the performance of
electrodissolution process. To explain this effect, a series of experiments were carried out using
2 mg L-1 of manganese containing solutions, by adjusting the initial pH in the interval from 3 to 9.
The removal efficiencies for the pH 3, 4, 5, 6, 7, 8 and 9 are 60, 79, 82.5, 95.50, 97.55, 97.56 and
97.65 % respectively. It is well know that the titanium dioxide adsorption is pH dependent. At
acidic pH it is positively charged while at alkaline pH it negatively charged. Mostly point of zero
charge for titanium dioxide is approximately pH 6 to 8 [28,29]. The results agreed well with earlier
results from the literature. Further experiments were carried out at pH 7.
Effect of electrolyte concentration
In order to evaluate the effect of initial concentration of manganese, experiments were
conducted with varying initial concentration from 0.25-2.0 mg L-1. Figure 1 shows that the uptake
of manganese (mg g-1) increased with increase in manganese concentration and remained nearly
constant after equilibrium time. The equilibrium time was found to be 180 min for all
concentration studied. The amount of manganese adsorbed (qe) increased from 0.248 to 1.982 mg
g-1 as the concentration increased from 0.25-2.0 mg L-1. From the Figure 1 it is found that the plots
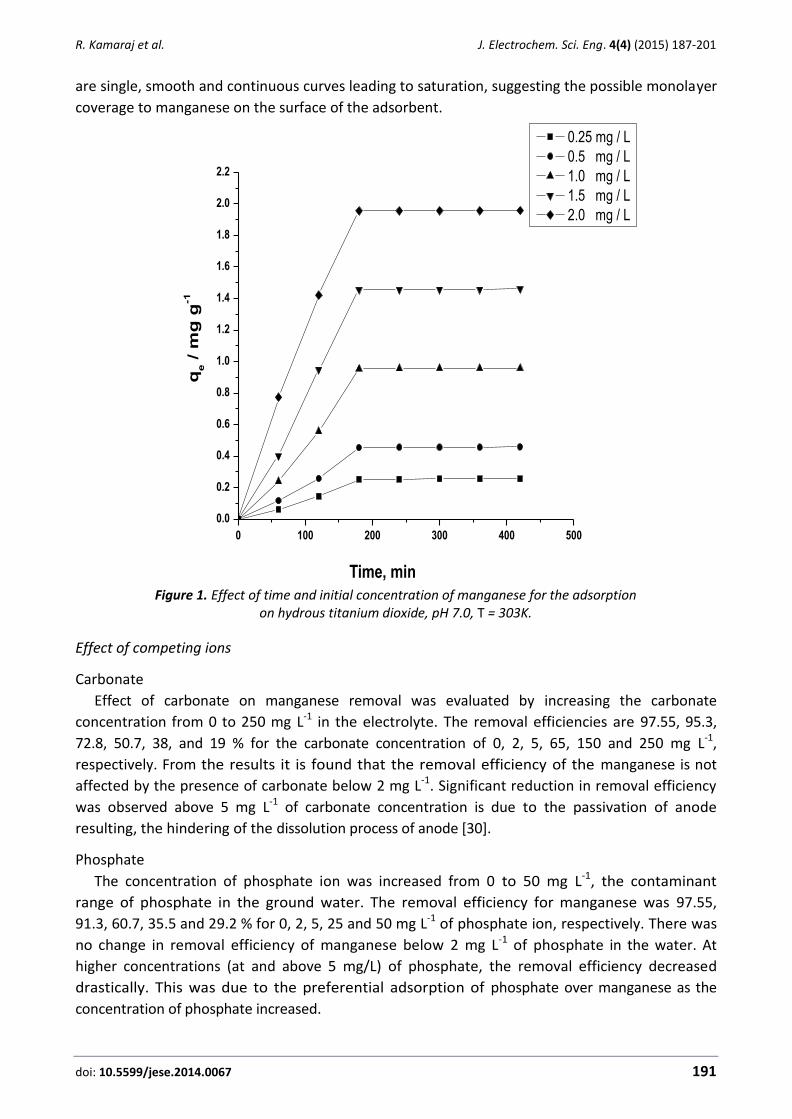
R. Kamaraj et al. J. Electrochem. Sci. Eng. 4(4) (2015) 187-201
doi: 10.5599/jese.2014.0067 191
are single, smooth and continuous curves leading to saturation, suggesting the possible monolayer
coverage to manganese on the surface of the adsorbent.
0 100 200 300 400 500
0.0
0.2
0.4
0.6
0.8
1.0
1.2
1.4
1.6
1.8
2.0
2.2
0.25 mg / L
0.5 mg / L
1.0 mg / L
1.5 mg / L
2.0 mg / L
qe /
mg
g-1
Time, min Figure 1. Effect of time and initial concentration of manganese for the adsorption
on hydrous titanium dioxide, pH 7.0, T = 303K.
Effect of competing ions
Carbonate
Effect of carbonate on manganese removal was evaluated by increasing the carbonate
concentration from 0 to 250 mg L-1 in the electrolyte. The removal efficiencies are 97.55, 95.3,
72.8, 50.7, 38, and 19 % for the carbonate concentration of 0, 2, 5, 65, 150 and 250 mg L-1,
respectively. From the results it is found that the removal efficiency of the manganese is not
affected by the presence of carbonate below 2 mg L-1. Significant reduction in removal efficiency
was observed above 5 mg L-1 of carbonate concentration is due to the passivation of anode
resulting, the hindering of the dissolution process of anode [30].
Phosphate
The concentration of phosphate ion was increased from 0 to 50 mg L-1, the contaminant
range of phosphate in the ground water. The removal efficiency for manganese was 97.55,
91.3, 60.7, 35.5 and 29.2 % for 0, 2, 5, 25 and 50 mg L-1 of phosphate ion, respectively. There was
no change in removal efficiency of manganese below 2 mg L-1 of phosphate in the water. At
higher concentrations (at and above 5 mg/L) of phosphate, the removal efficiency decreased
drastically. This was due to the preferential adsorption of phosphate over manganese as the
concentration of phosphate increased.
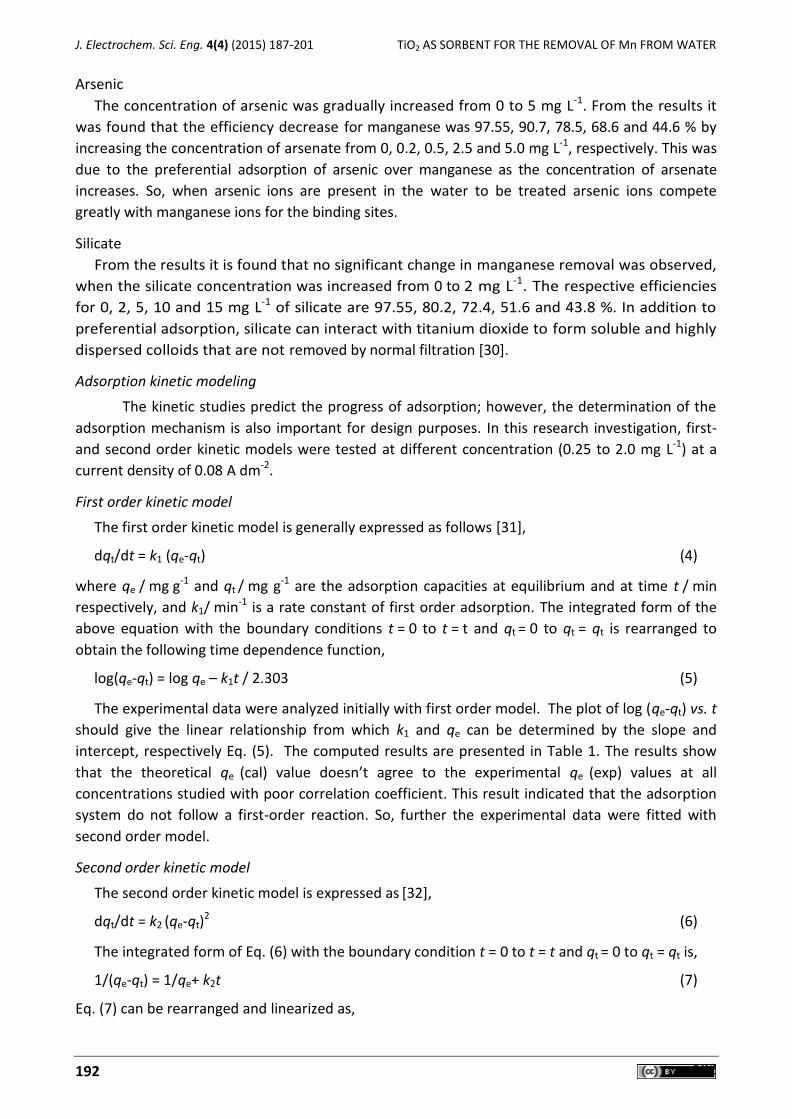
J. Electrochem. Sci. Eng. 4(4) (2015) 187-201 TiO2 AS SORBENT FOR THE REMOVAL OF Mn FROM WATER
192 192
Arsenic
The concentration of arsenic was gradually increased from 0 to 5 mg L-1. From the results it
was found that the efficiency decrease for manganese was 97.55, 90.7, 78.5, 68.6 and 44.6 % by
increasing the concentration of arsenate from 0, 0.2, 0.5, 2.5 and 5.0 mg L-1, respectively. This was
due to the preferential adsorption of arsenic over manganese as the concentration of arsenate
increases. So, when arsenic ions are present in the water to be treated arsenic ions compete
greatly with manganese ions for the binding sites.
Silicate
From the results it is found that no significant change in manganese removal was observed,
when the silicate concentration was increased from 0 to 2 mg L-1. The respective efficiencies
for 0, 2, 5, 10 and 15 mg L-1 of silicate are 97.55, 80.2, 72.4, 51.6 and 43.8 %. In addition to
preferential adsorption, silicate can interact with titanium dioxide to form soluble and highly
dispersed colloids that are not removed by normal filtration [30].
Adsorption kinetic modeling
The kinetic studies predict the progress of adsorption; however, the determination of the
adsorption mechanism is also important for design purposes. In this research investigation, first-
and second order kinetic models were tested at different concentration (0.25 to 2.0 mg L-1) at a
current density of 0.08 A dm-2.
First order kinetic model
The first order kinetic model is generally expressed as follows [31],
dqt/dt = k1 (qe-qt) (4)
where qe / mg g-1 and qt / mg g-1 are the adsorption capacities at equilibrium and at time t / min
respectively, and k1/ min-1 is a rate constant of first order adsorption. The integrated form of the
above equation with the boundary conditions t = 0 to t = t and qt = 0 to qt = qt is rearranged to
obtain the following time dependence function,
log(qe-qt) = log qe – k1t / 2.303 (5)
The experimental data were analyzed initially with first order model. The plot of log (qe-qt) vs. t
should give the linear relationship from which k1 and qe can be determined by the slope and
intercept, respectively Eq. (5). The computed results are presented in Table 1. The results show
that the theoretical qe (cal) value doesn’t agree to the experimental qe (exp) values at all
concentrations studied with poor correlation coefficient. This result indicated that the adsorption
system do not follow a first-order reaction. So, further the experimental data were fitted with
second order model.
Second order kinetic model
The second order kinetic model is expressed as [32],
dqt/dt = k2 (qe-qt)2 (6)
The integrated form of Eq. (6) with the boundary condition t = 0 to t = t and qt = 0 to qt = qt is,
1/(qe-qt) = 1/qe+ k2t (7)
Eq. (7) can be rearranged and linearized as,
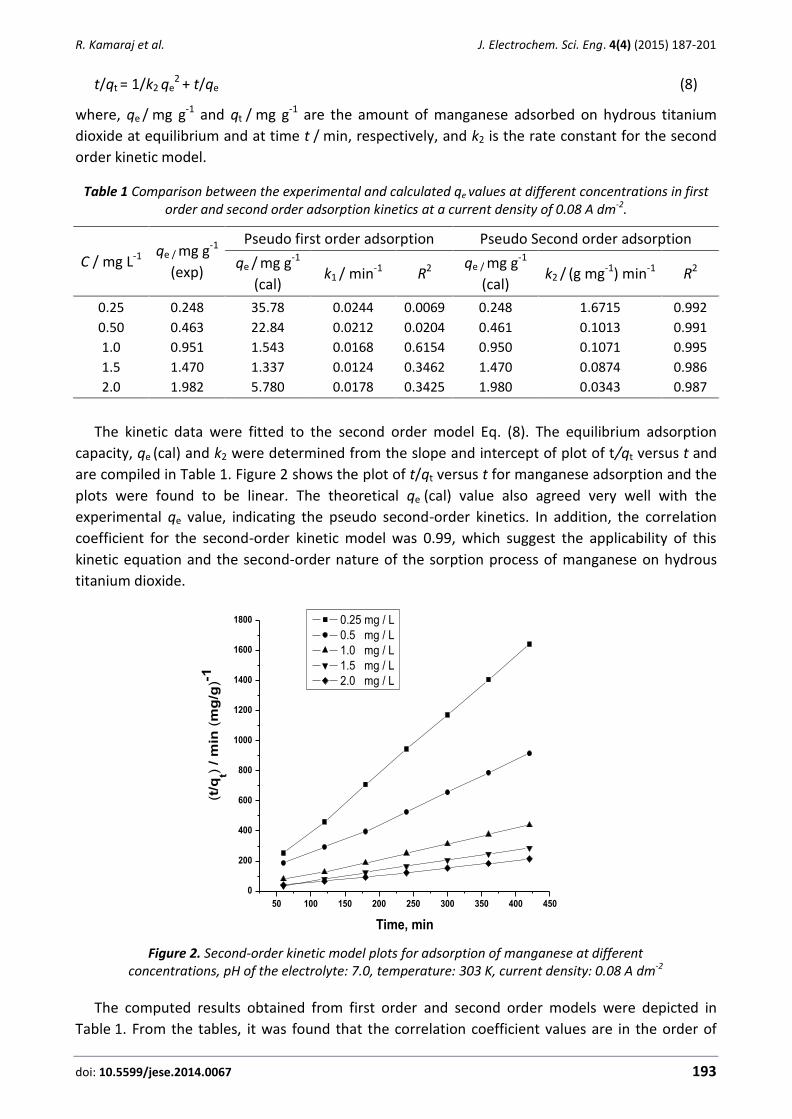
R. Kamaraj et al. J. Electrochem. Sci. Eng. 4(4) (2015) 187-201
doi: 10.5599/jese.2014.0067 193
t/qt = 1/k2 qe2 + t/qe (8)
where, qe / mg g-1 and qt / mg g-1 are the amount of manganese adsorbed on hydrous titanium
dioxide at equilibrium and at time t / min, respectively, and k2 is the rate constant for the second
order kinetic model.
Table 1 Comparison between the experimental and calculated qe values at different concentrations in first order and second order adsorption kinetics at a current density of 0.08 A dm-2.
C / mg L-1 qe / mg g-1
(exp)
Pseudo first order adsorption Pseudo Second order adsorption
qe / mg g-1
(cal) k1 / min-1 R2 qe / mg g-1
(cal) k2 / (g mg-1) min-1 R2
0.25
0.50
1.0
1.5
2.0
0.248
0.463
0.951
1.470
1.982
35.78
22.84
1.543
1.337
5.780
0.0244
0.0212
0.0168
0.0124
0.0178
0.0069
0.0204
0.6154
0.3462
0.3425
0.248
0.461
0.950
1.470
1.980
1.6715
0.1013
0.1071
0.0874
0.0343
0.992
0.991
0.995
0.986
0.987
The kinetic data were fitted to the second order model Eq. (8). The equilibrium adsorption
capacity, qe (cal) and k2 were determined from the slope and intercept of plot of t/qt versus t and
are compiled in Table 1. Figure 2 shows the plot of t/qt versus t for manganese adsorption and the
plots were found to be linear. The theoretical qe (cal) value also agreed very well with the
experimental qe value, indicating the pseudo second-order kinetics. In addition, the correlation
coefficient for the second-order kinetic model was 0.99, which suggest the applicability of this
kinetic equation and the second-order nature of the sorption process of manganese on hydrous
titanium dioxide.
50 100 150 200 250 300 350 400 450
0
200
400
600
800
1000
1200
1400
1600
1800
(t/q
t) /
min
(m
g/g
)-1
Time, min
0.25 mg / L
0.5 mg / L
1.0 mg / L
1.5 mg / L
2.0 mg / L
Figure 2. Second-order kinetic model plots for adsorption of manganese at different
concentrations, pH of the electrolyte: 7.0, temperature: 303 K, current density: 0.08 A dm-2
The computed results obtained from first order and second order models were depicted in
Table 1. From the tables, it was found that the correlation coefficient values are in the order of
J. Electrochem. Sci. Eng. 4(4) (2015) 187-201 TiO2 AS SORBENT FOR THE REMOVAL OF Mn FROM WATER
194 194
second order > first order. This indicates that the adsorption follows the second order model.
Further, the calculated qe values well agree with the experimental qe values for second order
kinetics model. These results indicate that the second-order kinetic model can be applied suitably
to predict the manganese adsorption process onto hydrous titanium dioxide.
Isotherm modeling
In order to explain the mechanism of the adsorption process, it is important to establish the
most appropriate correlation for the equilibrium curves. In this study, three adsorption isotherms
viz., Freundlich, Langmuir and Redlich isotherm models were applied to establish the relationship
between the amounts of manganese adsorbed onto the hydrous titanium hydroxide and its
equilibrium concentration in the electrolyte containing contaminant ions.
Freundlich Isotherm
The Freundlich adsorption isotherm typically fits the experimental data over a wide range of
concentrations. This empirical model includes considerations of surface heterogeneity and
exponential distribution of the active sites and their energies. The isotherm is adopted to describe
reversible adsorption and is not restricted to monolayer formation. The linearised in logarithmic
form and the Freundlich constants can be expressed as [33],
log qe = log kf + n log Ce (9)
where, kf is the Freundlich constant related to adsorption capacity, n is the energy or intensity of
adsorption, Ce is the equilibrium concentration of manganese (mg L-1).
In testing the isotherm, the manganese concentration used was 0.25 to 2.0 mg L-1, current
density of 0.08 A dm-2 and at an initial pH 7. The adsorption data is plotted as log qe versus log Ce
by equation (9) should result in a straight line with slope n and intercept kf. The intercept and the
slope are indicators of adsorption capacity and adsorption intensity, respectively. The value of n
falling in the range of 1-10 indicates favorable sorption. Freundlich constant (kf) and n values were
listed in Table 2. From the analysis of the results it is found that the Freundlich plots fit only
satisfactorily with the experimental data obtained in the present study which is shown in the
Figure. 3 (a).
Table 2 Constant parameters and correlation coefficient for different adsorption isotherm models for manganese adsorption at 0.25- 2.0 mg L-1 at a current density of 0.08 A dm-2
Isotherm Parameters Concentration of Mn, mg L-1
0.25 0.5 1.5 1.5 2.0
Langmuir qm / mg g-1 0.2383 0.4597 0.9564 1.4616 1.9491
b / L mg-1 0.1113 0.1102 0.1099 0.1014 0.0948
R2 0.9943 0.9987 0.9954 0.9962 0.9991
RL 0.9729 0.9479 0.8998 0.8569 0.8179
Freundlich
kf / mg g-1 0.5803 0.5512 0.5174 0.4897 0.4613
n / L mg-1) 2.1786 2.0257 1.9457 1.8798 1.7259
R2 0.9812 0.9789 0.9881 0.9836 0.9820
Redlich
Peterson
KF / L g-1 0.9978 0.9981 0.9968 0.9990 0.9891
0.9764 0.9854 0.9817 0.9897 0.9789
aR / L mmol-(1-1/β ) 27.412 28.417 29.648 30.568 32.516
R. Kamaraj et al. J. Electrochem. Sci. Eng. 4(4) (2015) 187-201
doi: 10.5599/jese.2014.0067 195
log (Ce / mg L
-1) Ce
-1 / g mg
-1
Figure 3. (a) Frendlich plot (log qe vs log Ce) for adsorption of manganese, pH of the electrolyte: 7.0, current density: 0.08 A dm-2, concentration: 2.0 mg L-1, (b) Langmuir plot (1/qe vs. 1/Ce) for adsorption of
manganese, pH of the electrolyte: 7.0, current density: 0.08 A dm-2, concentration: 2.0 mg L-1
Langmuir Isotherm
This model assumes a monolayer deposition on a surface with a finite number of identical sites.
It is well known that the Langmuir equation is valid for a homogeneous surface. The linearized
form of Langmuir adsorption isotherm model is [34],
Ce/qe=1/qmb+Ce/qm (10)
where, qe is amount adsorbed at equilibrium, Ce is the equilibrium concentration, qm is the
Langmuir constant representing maximum monolayer adsorption capacity and b is the Langmuir
constant related to energy of adsorption. The essential characteristics of the Langmuir isotherm
can be expressed as the dimensionless constant RL.
RL=1 / (1+bCo) (11)
where RL is the equilibrium constant it indicates the type of adsorption, b, is the Langmuir
constant. Co is various concentration of manganese solution. The RL values between 0 and 1
indicate the favorable adsorption.
Langmuir isotherm was tested from Eq. (10). The plots of 1/qe as a function of 1/Ce for the
adsorption of manganese on hydrous titanium dioxide are shown in Figure 3 (b). The plots were
found linear with good correlation coefficients (>0.99) indicating the applicability of Langmuir
model in the present study. The values of monolayer capacity (qm) and Langmuir constant (b) is
presented in Table 2. The values of qm calculated by the Langmuir isotherm were all close to
experimental values at given experimental conditions. These facts suggest that manganese is
adsorbed in the form of monolayer coverage on the surface of the adsorbent. The dimensionless
constant RL was calculated from Eq.(11). The RL values were found to be between 0 and 1 for all the
concentration of manganese studied. The correlation co-efficient values of Langmuir and
Freundlich isotherm models are presented in Table 2.
Redlich Peterson isotherm
It is a three parameter hybrid isotherm. It is having features of both the Langmuir and Frendlich
isotherms. This model has linear dependence in the numerator component and exponential
component in denominator of non-linear form [35,36].
log
(qe /
mg
g-1)
(t /
qe)
/ m
in (
mg
/ g)
-
1

J. Electrochem. Sci. Eng. 4(4) (2015) 187-201 TiO2 AS SORBENT FOR THE REMOVAL OF Mn FROM WATER
196 196
β
eR
eFe
1 Ca
CKq
(12)
where qe / mmol g-1 is the solid-phase sorbate concentration at equilibrium, Ce / mmol L-1 is the
concentration of adsorbate in equilibrium with liquid phase, KF / L g-1 and aR / L mmol-(1-1/β) are the
Redlich-Peterson isotherm constants, and is the exponent, which lies between 1 and 0. If the
tends to 0 then the adsorption follows the Frendlich isotherm and if the value tends to one it fits
with the Langmuir isotherm. In order to verify our investigation regarding the monolayer or
multilayer adsorption, the linear form of Redlich-Peterson is used. It is little bit complicated
compared to the other isotherms. The strategy to find these parameters is based in the
maximization of correlation coefficients (R2) from the linear fit to the data. In this way
the KF values are modified until obtain the best fit of the data. The linear form of the equation for
this model is
ln (KF(Ce/qe-1) = ln aR + ln Ce (13)
Plotting of ln (KF(Ce/qe-1) vs. ln Ce by the Eq. (13) gives the Redlich Peterson equation. This
isotherm is a three parameters isotherm in which KF values are indirectly obtained by plotting the
graph with maximum correlation coefficient by justifying the values of KF. By that KF, and aR are
in the Table 2 for all concentrations. Here the values are above the 0.95. So the adsorption
favors Langmuir isotherm rather than Frendlich isotherm.
Adsorption thermodynamics
To understand the effect of temperature on adsorption process, thermodynamic parameters
should be determined at various temperatures. The energy of activation for adsorption of manga-
nese can be determined by the second order rate constant is expressed in Arrhenius form [37],
ln k2 = ln ko - E/RT (14)
where ko is the constant of the equation (g mg-1) min-1), E is the energy of activation (J mol-1), R is
the gas constant (8.314 J mol-1 K-1) and T is the temperature (K). Figure 4(a) shows that the rate
constants vary with temperature according to Eq.(14) giving an activation energy of 21.01 kJ mol-1
for manganese from the slope of the fitted equation. The free energy change is obtained using the
following relationship
∆G = -RT ln Kc (15)
where ∆G is the free energy (kJ mol-1), Kc is the equilibrium constant, R is the universal gas
constant and T is the temperature in K. The values of Kc and ∆G are presented in Table 3. The
negative value of ∆G indicates the spontaneous nature of adsorption. Other thermodynamic
parameters such as entropy change (ΔS) and enthalpy change (ΔH) were determined using the
van’t Hoff equation:
RT
H
R
SK
cln (16)
The enthalpy change (∆H = -60.57 J mol-1) and entropy change (∆S = -0.047 J mol-1 K-1) were
obtained from the slopes and intercepts of the van't Hoff linear plots of ln Kc versus 1/T (Figure.
4(b)) Eq.(16). Negative value of enthalpy change (∆H) indicates that the adsorption process is
exothermic in nature, and the negative value of change in internal energy (∆G) show the
spontaneous adsorption of manganese on the adsorbent. Negative values of entropy change show
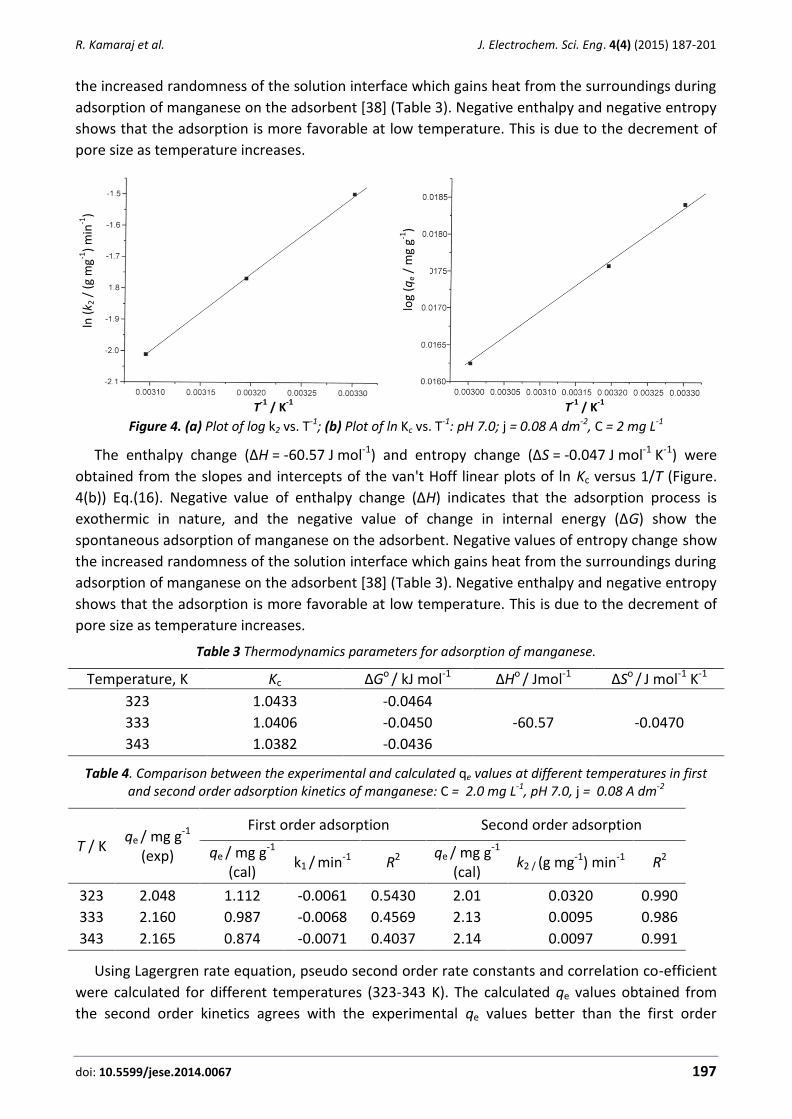
R. Kamaraj et al. J. Electrochem. Sci. Eng. 4(4) (2015) 187-201
doi: 10.5599/jese.2014.0067 197
the increased randomness of the solution interface which gains heat from the surroundings during
adsorption of manganese on the adsorbent [38] (Table 3). Negative enthalpy and negative entropy
shows that the adsorption is more favorable at low temperature. This is due to the decrement of
pore size as temperature increases.
T
-1 / K
-1 T
-1 / K
-1 Figure 4. (a) Plot of log k2 vs. T-1; (b) Plot of ln Kc vs. T-1: pH 7.0; j = 0.08 A dm-2, C = 2 mg L-1
The enthalpy change (∆H = -60.57 J mol-1) and entropy change (∆S = -0.047 J mol-1 K-1) were
obtained from the slopes and intercepts of the van't Hoff linear plots of ln Kc versus 1/T (Figure.
4(b)) Eq.(16). Negative value of enthalpy change (∆H) indicates that the adsorption process is
exothermic in nature, and the negative value of change in internal energy (∆G) show the
spontaneous adsorption of manganese on the adsorbent. Negative values of entropy change show
the increased randomness of the solution interface which gains heat from the surroundings during
adsorption of manganese on the adsorbent [38] (Table 3). Negative enthalpy and negative entropy
shows that the adsorption is more favorable at low temperature. This is due to the decrement of
pore size as temperature increases.
Table 3 Thermodynamics parameters for adsorption of manganese.
Temperature, K Kc ∆Go / kJ mol-1 ∆Ho / Jmol-1 ∆So / J mol-1 K-1
323
333
343
1.0433
1.0406
1.0382
-0.0464
-0.0450
-0.0436
-60.57
-0.0470
Table 4. Comparison between the experimental and calculated qe values at different temperatures in first and second order adsorption kinetics of manganese: C = 2.0 mg L-1, pH 7.0, j = 0.08 A dm-2
T / K qe / mg g-1
(exp)
First order adsorption Second order adsorption
qe / mg g-1
(cal) k1 / min-1 R2 qe / mg g-1
(cal) k2 / (g mg-1) min-1 R2
323
333
343
2.048
2.160
2.165
1.112
0.987
0.874
-0.0061
-0.0068
-0.0071
0.5430
0.4569
0.4037
2.01
2.13
2.14
0.0320
0.0095
0.0097
0.990
0.986
0.991
Using Lagergren rate equation, pseudo second order rate constants and correlation co-efficient
were calculated for different temperatures (323-343 K). The calculated qe values obtained from
the second order kinetics agrees with the experimental qe values better than the first order
log
(qe /
mg
g-1)
ln (
k 2 /
(g
mg-1
) m
in-1
)
J. Electrochem. Sci. Eng. 4(4) (2015) 187-201 TiO2 AS SORBENT FOR THE REMOVAL OF Mn FROM WATER
198 198
kinetics model, indicating adsorption following second order kinetics. Table 4 depicts the
computed results obtained from pseudo first and pseudo second order kinetic models.
Characterization of hydrous titanium dioxide
XRF studies
The contents of titanium dioxide were analyzed by XRF. The titanium dioxide sample was dried
in a drying chamber at 100 °C were ground in the agate mortar. As shown in Table 5, 95.2 % of the
sample, by weight, was titanium dioxide. Sodium chloride was came from the electrolyte, and
calcium and barium elements came from the impurity in the titanium electrode.
XRD studies
The crystal structure of hydrous titanium dioxide nanoparticles was analyzed by X-ray powder
diffractometer operating with CuKα radiation source filtered with a graphite monochromator.
Figure. 5(a) shows the X-ray diffraction pattern of hydrous titanium dioxide nanoparticles. From
the figure it is found that, most diffraction peaks belong to the anatase phase (JCPDS Card Number
73-1764), and minor peaks from the brookite phase (JCPDS Card Number 76-1936) could also be
observed. The crystallite size D was determined from the broadening of corresponding strongest
X-ray diffraction peaks by using Scherrer's formula [39]:
cos
9.0D (17)
where D is the crystalline size, λ is the average wavelength of the X-ray radiation (λ = 1.5418 Å),
is the line-width at half-maximum peak position, and is the diffracting angle (2 = 25.4°). The
average crystallite size of the hydrous titanium dioxide is 4.3-8.4 nm.
FT-IR spectrum
The hydrous titanium dioxide was analyzed using FTIR and results are presented in Figure 5(b).
The strong peak at 3381 cm−1 is attributed to the stretching vibrations of surface and interlayer
water molecules and hydroxyl groups. This is related to the formation of hydrogen bonds of inter-
layer water with guest anions as well as with hydroxide groups of layers. At 1630.18 cm-1, there is
a strong adsorption peak for hydroxyl bending vibration belonging to physically adsorbed H2O.
One small adsorption peak could also be identified at 1371.37 cm-1, which represents the
coordinated hydroxyl groups. These observations demonstrate that these hydrous titanium
dioxide nanoparticles have high adsorption capacities to H2O and hydroxyl groups exist on their
surfaces [40].
SEM and EDAX analysis
Figure 5(c) shows the SEM images of hydrous titanium dioxide. The SEM images show different
size, shape and dimension and these nanoparticles are aggregated into micro-sized particles. The
volume median diameter value of these nanoparticles in distilled water was determined at
approximately 9.8 nm by the dynamic light scattering technique, which is in accordance with the
SEM observation. This type of aggregation of nanoparticles is beneficial to their removal from
aqueous environment after the treatment process.
Energy-dispersive analysis of X-rays was used to analyze the elemental constituents of titanium
dioxide generated during the electro dissolution process and the results are presented in
Figure 5(d). The figure indicates that the titanium dioxide was composed mainly of Ti an O, which
affirms that the titanium dioxide was generated by anodic dissolution.

R. Kamaraj et al. J. Electrochem. Sci. Eng. 4(4) (2015) 187-201
doi: 10.5599/jese.2014.0067 199
a
b
Wavenummber, cm-1
c
d
Figure 5. (a) X-ray diffraction pattern of hydrous TiO2, (b) FTIR pattern of hydrous TiO2, (c) SEM image of the hydrous TiO2, (d) EDAX image of the hydrous TiO2
TGA analysis
TGA analysis (figure not shown) of hydrous titanium dioxide was carried out. From the results
we found that the weight loss of 13.0 % where observed when the samples were heated from the
32 - 800°C. The entire range will be divided into three stages viz., first, second and third stage. In
the first stage (32 – 122 °C) weight loss (6.9%) could be attributed to the elimination of physically
absorbed water. In the second stage (122 to 438 °C) weight loss (6.0 %) could be contributed to
the loss of surface hydroxyl groups. In the third stage (438 to 800 °C) no exothermic peak was
observed and the weight loss is around 0.1 %.
Conclusions
The maximum removal efficiency of 97.55 % was achieved with titanium as sacrificial anode at a
current density of 0.08 A dm-2, pH 7.0. The results indicate that the hydrous titanium dioxide, by
electro-dissolution of sacrificial anodes, efficiently adsorbs the manganese from water. Hence this
process can be used as an effective process for the removal of manganese contaminated water
resources. The results indicate that, the second-order kinetic model accurately described the
adsorption kinetics. The adsorption mechanism was found to be chemisorption and the rate-
J. Electrochem. Sci. Eng. 4(4) (2015) 187-201 TiO2 AS SORBENT FOR THE REMOVAL OF Mn FROM WATER
200 200
limiting step was mainly surface adsorption. The Langmuir isotherm showed a better fit than the
Freundlich and Redlich isotherms, thus, indicating the applicability of monolayer coverage of
manganese on hydrous titanium dioxide.
The thermodynamic parameters like ΔG, ΔH and ΔS were determined. Their values indicated
that the adsorption process was favorable, spontaneous, and exothermic in nature. As the
temperature increased ΔG became less negative, indicating a stronger driving force, resulting in a
greater adsorption capacity at higher temperatures. The negative value of ΔH confirmed that the
process was exothermic. Negative values of entropy change show the increased randomness of
the solution interface which gains heat from the surroundings during adsorption of manganese on
the adsorbent. EDAX analysis confirmed that manganese was adsorbed on to the hydrous titanium
dioxide.
Acknowledgments: The authors wish to express their gratitude to Dr. Vijayamohanan K. Pillai, Director, CSIR-Central Electrochemical Research Institute, Karaikudi to publish this article.
References
[1] Y. H. Chang, K. H. Hsieh, F. C. Chang, Journal of Applied Polymer Science 112 (2009) 2445–2454.
[2] K. Kannan, Fundamentals of Environmental Pollution, S Chand Co. Limited, New Delhi, 1995 [3] Y. C. Sharma Uma, S. N. Singh Paras, F. Gode, Chemical Engineering Journal 132 (2007) 319–
323. [4] A. Takeda, Brain Research Reviews 41 (2003) 79–87. [5] J. Donaldson, Neuro Toxicology 8 (1987) 451–462. [6] S. M. Bamforth, D. A.C. Manning, I. Singleton, P. L. Younger, K. L. Johnson, Applied
Geochemistry 21 (2006) 1274–1287 [7] R. W. Leggett, Science of the Total Environment 409 (2011) 4179–4186 [8] M. K. Doula, Water Research 40 (2006) 3167-3176. [9] World Health Organization, Manganese in drinking water, Background document for
development of WHO guidelines for drinking water quality report: 2011. (www.who.int/ /water_sanitation_health/dwq/chemicals/manganese.pdf), accessed November 2014
[10] S. R. Taffarel, J. Rubio, Minerals Engineering 22 (2009) 336–343 [11] M. K. Doula, Water Research 40 (2006) 3167-3176
[12] D. Barloková, J. Ilavský, Polish Journal of Environmental Studies 19 (2010) 1117-1122 [13] S.-C. Han, K.-H. Choo, S.-J. Choi, M. M. Benjamin, Journal of Membrane Science 290 (2007)
55–61 [14] A. G. Tekerlekopoulou, D. V. Vayenas, Desalination 210 (2007) 225–235 [15] E. Okoniewska, J. Lach, M. Kacprzak, E. Neczaj, Desalination 206 (2007) 251–258 [16] A. Omri , M. Benzina, Alexandria Engineering Journal 51 (2012) 343–350
[17] D. Simonsson, Chemical Society Reviews 26 (1997) 181–189. [18] G. Chen, Separation &.Purification Technology 38 (2004) 11 – 41 [19] S. Vasudevan, M. A. Oturan, Environmental Chemistry Letters 12 (2014) 97 – 108 [20] M. Ben Sasson, A. Adin, Water Research 44 (2010) 3973 – 3981. [21] W. P. Cheng, F. H. Chi, Water Research 36 (2002) 4583–4591. [22] M. Patel, L. Lippincott, X. Meng, Water Research 39 (2005) 2327-2337 [23] M. Pirilä, M. Martikainen, K. Ainassaari, T. Kuokkanen, R. L. Keiski, Journal of Colloid and
Interface Science 353 (2011) 257–262 [24] Z. Xu, Q. Li, S. Gao, J. K. Shang, Water Research 44 (2010) 5713-5721
R. Kamaraj et al. J. Electrochem. Sci. Eng. 4(4) (2015) 187-201
doi: 10.5599/jese.2014.0067 201
[25] M. C. Lu, G..D. Roam, J..N. Chen, C. P. Huang, Water Research 30 (1996) 1670-1678 [26] H. K. Shon, S. Vgneswaran, I. S. Kim, J. Cho, G. J. Kim, J. B. Kim, J. H. Kim, Environmental
Science and Technology 42 (2007) 1372-1377 [27] S. Vasudevan, J. Lakshmi, G. Sozhan, Desalination 310 (2013) 122-129 [28] P. Westerhoff, Arsenic Removal with Agglomerated Nanoparticle Media, AWWA Research
Foundation, Arizona state University, 2006. [29] H. Jezequel, K. H. Chu, Journal of Environmental Science Health A. 41(2006) 1519-1528. [30] S. Vasudevan, J. Lakshmi, J. Jayaraj, G. Sozhan, Journal of Hazardous Materials 164 (2009)
1480-1486. [31] [Y. P. Teoh, M. Ali Khan, T. S. Y. Choong, Chemical. Engineering Journal 217 (2013) 248–255 [32] Y. S. Ho, G. McKay, Process Biochemistry 34 (1999) 451 – 456. [33] H. M. F. Freundlich, Journal of Physical Chemistry 57 (1906) 385 – 470. [34] I. Langmuir, Journal of American Chemical Society. 40 (1918) 1316-1403. [35] Y. S. Ho, J. F. Porter, G. Mckay, Water Air. Soil Pollution 141 (2002) 1-33. [36] K. Y. Foo, B. H. Hameed, Chemical Engineering Journal 156 (2010) 2-10. [37] S. Pan, H. Shen, Q. Xu, J. Luo, M. Hu, Journal of Colloid. Interface Science 365 (2012) 204–
212. [38] L. D. Rio, J. Aberg, R. Renner, O. Dahiaten , V. Vedral, Nature 474 (2011) 61-63 [39] C. S. Barrett, T. B. Massalski, Structure of Metals, Third edition, Mc Graw-Hill, NewYork,
1966 [40] S. Debnath, U. C. Ghosh, Desalination 273 (2011) 330-342.
© 2014 by the authors; licensee IAPC, Zagreb, Croatia. This article is an open-access article distributed under the terms and conditions of the Creative Commons Attribution license
(http://creativecommons.org/licenses/by/4.0/)


doi: 10.5599/jese.2014.0062 203
J. Electrochem. Sci. Eng. 4(4) (2014) 203-213; doi: 10.5599/jese.2014.0062
Open Access: ISSN 1847-9286
www.jESE-online.org
Original scientific paper
Anodic oxidation of oxytetracycline: Influence of the experimental conditions on the degradation rate and mechanism
Annabel Fernandes, Catarina Oliveira, Maria J Pacheco, Lurdes Ciríaco and Ana Lopes
UMTP and Department of Chemistry, University of Beira Interior, 6201-001 Covilhã, Portugal
Corresponding author: E-mail: [email protected]; Tel.: +351-275-329-259; Fax: +351-275-319-730
Received: August 19, 2014; Revised: September 1, 2014; Published: December 6, 2014
Abstract The anodic oxidation of oxytetracycline was performed with success using as anode a boron-doped diamond electrode. The experiments were conducted in batch mode, using two different electrochemical cells: an up-flow cell, with recirculation, that was used to evaluate the influence of recirculation flow rate; and a stirred cell, used to determine the influence of the applied current density. Besides oxytetracyclin electrodegradation rate and mineralization extent, oxidation by-products were also assessed. Both the flow rate and the applied current density have shown positive influence on the oxytetracycline oxidation rate. On the other hand, the mineralization degree presented the highest values at the lowest flow rate and the lowest current density tested. The main oxidation by-products detected were oxalic, oxamic and maleic acids.
Keywords Tetracyclines; BDD; antibiotics; pharmaceutical compounds; electrochemical degradation
Introduction
The increasing use of drugs has become a new environmental problem, which has aroused
great concern in recent years. Although these compounds are found in very low concentrations in
the environment, there is still a lack of information about the long-term risks that the presence of
a wide variety of drugs can bring to ecosystems and to human health. These drugs are
continuously introduced into the environment due to their domestic, hospital and veterinary use,
and its presence has been detected in wastewaters [1-4]. Its potential biological activity associated

J. Electrochem. Sci. Eng. 4(4) (2014) 203-213 ANODIC OXIDATION OF OXYTETRACYCLINE
204
with low removal during conventional wastewater treatment processes, can lead to adverse
environmental effects, including the contamination of soil and water resources [5,6].
Among these drugs, tetracyclines are one of the most widely used in the prophylaxis and
therapy of human and animal infections and also at subtherapeutic levels in animal feed as growth
promoters [7,8]. Tetracyclines are considered bacteriostatic antibiotics, although they have also
various non-antibiotic properties. They are characterized by a four ring structure with a
carboxamide functional group and by several ionizable functional groups [8,9]. As a result of the
waste disposal, the drug is transferred to different environmental compartments (water,
sediment, soil) and can contaminate trophic network, transitioning into food and cause negative
effects on natural resources, including the effects on microbial community structure and selection
of strains with antibiotic resistance [10-12]. The presence of tetracyclines in several environmental
matrices has been investigated and the evidence of their existence has been reported [8,13-15].
This is due to the fact that antibiotics are very resistant to biodegradation..
In recent years, there has been a growing awareness about pollution caused by pharmaceutical
wastes, including antibiotics [16,17]. Biological processes, the most economical for wastewater
treatment, have been extensively studied, but they are ineffective in the removal of recalcitrant
compounds with poor biodegradability [17,18]. Some physical and physicochemical techniques,
such as coagulation, flocculation, adsorption, ultrafiltration and reverse osmosis, have been
successfully employed to remove recalcitrant pollutants. However, these conventional treatments
simply transfer pollutants from one phase to another, resulting in secondary pollution [17,19].
New technologies based on the application of advanced oxidation processes have been
reported in the treatment of effluents containing tetracycline [20-37]. Tetracycline degradation
efficiency obtained by photo-Fenton processes in the treatment of wastewaters and surface
waters was reported by Bautitz and Nogueira [21]. Results showed that the photo-Fenton process
under solar radiation can be applied in the degradation of tetracycline present in surface water
samples or even in more complex samples, such as effluent from sewage treatment plants.
However, the processes that involve photolysis should only be applied to bleached effluents, since
the color prevents the efficient propagation of radiation. Li et al. [23] studied the effect of
different pH values on oxytetracycline degradation by ozonation in aqueous solution and found
that this technique had potential to be used as a partial step in combined treatment of
pharmaceutical effluents containing high concentrations of oxytetracycline. The removal rates
increased as a result of high decomposition rates, favored by pH increase. However,
bioluminescence results indicate that after partial ozonation, byproducts of oxytetracycline have a
higher toxicity than the parent compound. Jiao et al. [22] and Shaojun et al. [24] studied the
degradation of tetracyclines by photolysis and reported high COD removals, of 80 %, but very low
TOC removal, about 14 %, which indicated the production of intermediate compounds. On their
studies, it was also found that the toxicity of the treated effluent was higher than in the original
effluent. Photocatalysis studies applied to the treatment of waters with low loads of organic
matter, such as rivers, ground water and drinking water, containing tetracyclines have been
performed by several authors and high removals were obtained, indicating that this method is
promising for this type of waters [20,35].
Electrochemical processes have shown to be effective for the treatment of effluents containing
refractory and toxic organic pollutants [38-41]. Furthermore, they are an effective, versatile, easy
and clean technology [39,42]. For all these reasons, this technology has been applied to remove
tetracycline under different experimental conditions. Removals above 90 % were achieved using

A. Fernandes et al. J. Electrochem. Sci. Eng. 4(4) (2014) 203-213
doi: 10.5599/jese.2014.0062 205
Ti/RuO2-IrO2 anodes [25] and Ti/IrO2 anodes [29]. Despite these good results in tetracyclines
removal, no significant levels of mineralization were achieved using these active anodes. In the last
decade, BDD anode, a non-active anode, is being widely used. It has several advantages, namely
good chemical and electrochemical stability, extended lifetime and a high overpotential for water
decomposition, being known for its ability to promote complete mineralization of a wide range of
organic pollutants [39,43-47] due to the hydroxyl radicals formed from water decomposition on
the electrode surface. Brinzila et al. [30] reported an electrodegradation study of tetracycline on
BDD anode where removals of 93 % and 87 % were obtained for COD and TOC, respectively. These
authors also studied the influence on the degradation rate of initial pH, applied current intensity
and electrolyte added [37]. It was observed that an increase in current density leads to a decrease
in the current efficiency of the process and the complete removal of tetracycline was much faster
in the presence of chloride ions that promoted the complete degradation of this antibiotic in 30
min. The effect of different anode materials in both electrochemical oxidation and electro-Fenton
processes on the oxidation of tetracycline was investigated by Oturan et al. [36]. They have
reported that processes using BDD anode demonstrated superior oxidation/mineralization power.
Almost total mineralization (TOC removal up to 98 %) of 100 mg L−1 of tetracycline solutions was
achieved after 6 h treatment with BDD anode.
Considering the good results obtained with the BDD anode, in the present study it is proposed
its use in the electrochemical degradation of oxytetracycline, an antibiotic from the tetracycline
family, widely used in intensive animal husbandry to treat enteric and respiratory diseases. The
influence of the hydrodynamics inside the electrochemical cell on the rate of electrodegradation
and mineralization of oxytetracycline was studied and the oxidation by-products were also
assessed, in order to establish the degradation mechanism.
Experimental
Oxytetracycline (OTC) used in this study was purchased from Sigma Aldrich (purity 99 %), with
the chemical formula C22H24N2O9.2H2O (Table 1), and used without further purification.
Oxytetracycline degradation experiments were conducted in batch mode using two different
electrochemical cells. The first set of assays was performed in an up-flow electrochemical cell, with
recirculation, composed by a BDD anode with an area of 20 cm2 and a stainless steel cathode with
identical area, using 250 mL of solution. The recirculation of the solution was enabled by a
centrifugal pump, Pan World Magnet, Model: NH-30PX, Pan World Co., Ltd. Tokyo, Japan, which
allowed the evaluation of different flow rates: 37, 75, 100 and 120 L h-1. The applied current
density was kept constant at 20 mA cm-2. The second set of assays was conducted in batch mode,
with stirring, in a cell containing a BDD anode, with an immersed area of 10 cm2, and a stainless
steel cathode, with identical area. 200 mL of solution were used in each run. In order to study the
oxidation mechanism and identify the by-products, assays were performed applying different
current densities: 2.5, 5, 7.5, 10, 20 and 30 mA cm-2. The experimental conditions used are
summarized in Table 1.
For all the experiments performed, the initial oxytetracycline concentration was 100±10 mg L-1.
The assays were conducted at room temperature (25±2 °C), adding as support electrolyte
anhydrous sodium sulfate (Merck, 99.5 %), in a concentration of 5 g L-1. A GW, Lab DC, model
GPS-3030D (0–30 V, 0–3 A), was used as power supply. The assays were performed in duplicate,
and the values presented for the parameters used to follow the assays are the mean values.
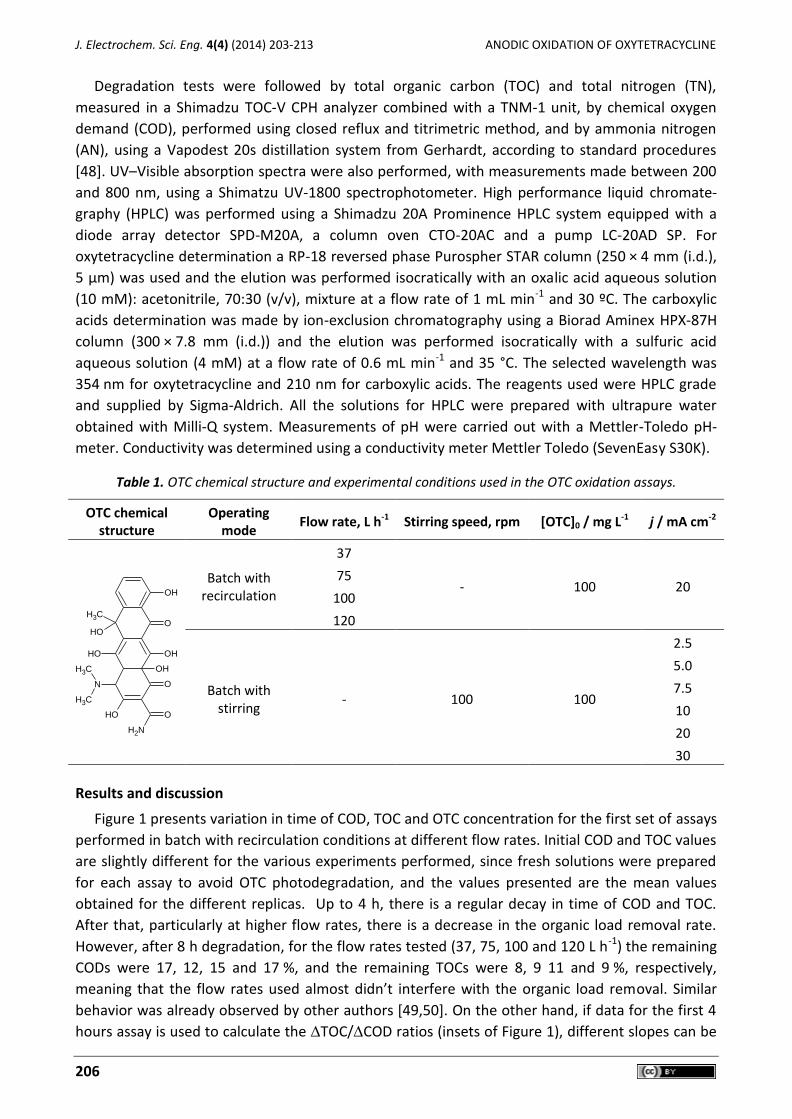
J. Electrochem. Sci. Eng. 4(4) (2014) 203-213 ANODIC OXIDATION OF OXYTETRACYCLINE
206
Degradation tests were followed by total organic carbon (TOC) and total nitrogen (TN),
measured in a Shimadzu TOC-V CPH analyzer combined with a TNM-1 unit, by chemical oxygen
demand (COD), performed using closed reflux and titrimetric method, and by ammonia nitrogen
(AN), using a Vapodest 20s distillation system from Gerhardt, according to standard procedures
[48]. UV–Visible absorption spectra were also performed, with measurements made between 200
and 800 nm, using a Shimatzu UV-1800 spectrophotometer. High performance liquid chromate-
graphy (HPLC) was performed using a Shimadzu 20A Prominence HPLC system equipped with a
diode array detector SPD-M20A, a column oven CTO-20AC and a pump LC-20AD SP. For
oxytetracycline determination a RP-18 reversed phase Purospher STAR column (250 × 4 mm (i.d.),
5 µm) was used and the elution was performed isocratically with an oxalic acid aqueous solution
(10 mM): acetonitrile, 70:30 (v/v), mixture at a flow rate of 1 mL min-1 and 30 ºC. The carboxylic
acids determination was made by ion-exclusion chromatography using a Biorad Aminex HPX-87H
column (300 × 7.8 mm (i.d.)) and the elution was performed isocratically with a sulfuric acid
aqueous solution (4 mM) at a flow rate of 0.6 mL min-1 and 35 °C. The selected wavelength was
354 nm for oxytetracycline and 210 nm for carboxylic acids. The reagents used were HPLC grade
and supplied by Sigma-Aldrich. All the solutions for HPLC were prepared with ultrapure water
obtained with Milli-Q system. Measurements of pH were carried out with a Mettler-Toledo pH-
meter. Conductivity was determined using a conductivity meter Mettler Toledo (SevenEasy S30K).
Table 1. OTC chemical structure and experimental conditions used in the OTC oxidation assays.
OTC chemical structure
Operating mode
Flow rate, L h-1 Stirring speed, rpm [OTC]0 / mg L-1 j / mA cm-2
OH
CH3
OH
CH3
CH3
N
OH
NH2
O
O
OH
OH
O
OH
Batch with recirculation
37
- 100 20 75
100
120
Batch with stirring
- 100 100
2.5
5.0
7.5
10
20
30
Results and discussion
Figure 1 presents variation in time of COD, TOC and OTC concentration for the first set of assays
performed in batch with recirculation conditions at different flow rates. Initial COD and TOC values
are slightly different for the various experiments performed, since fresh solutions were prepared
for each assay to avoid OTC photodegradation, and the values presented are the mean values
obtained for the different replicas. Up to 4 h, there is a regular decay in time of COD and TOC.
After that, particularly at higher flow rates, there is a decrease in the organic load removal rate.
However, after 8 h degradation, for the flow rates tested (37, 75, 100 and 120 L h-1) the remaining
CODs were 17, 12, 15 and 17 %, and the remaining TOCs were 8, 9 11 and 9 %, respectively,
meaning that the flow rates used almost didn’t interfere with the organic load removal. Similar
behavior was already observed by other authors [49,50]. On the other hand, if data for the first 4
hours assay is used to calculate the TOC/COD ratios (insets of Figure 1), different slopes can be

A. Fernandes et al. J. Electrochem. Sci. Eng. 4(4) (2014) 203-213
doi: 10.5599/jese.2014.0062 207
obtained for the different flow rates, showing the influence of this parameter on the degradation
mechanism. In fact, TOC vs. COD slope decreases with the increase in flow rate, showing that the
increase in flow rate has a negative impact on the OTC mineralization degree at the earlier stages
of the electrodegradation assay. This happens because the increase in flow rate decreases the dif-
fusion layer width, favoring the counter diffusion of the reaction intermediate products, avoiding
their complete mineralization. After 4 h assay, the TOC vs. COD slope changes, since the products
in solution are other than OTC, as can be seen by the OTC concentration determined by HPLC.
Regarding the OTC concentration decay (Figure 1), the electrodegradation process kinetics is
almost independent of the imposed flow rate. It presents a pseudo-first order kinetic and only the
assay performed at the lowest flow rate shows a lower kinetic constant (1.18 h-1), probably due to
some diffusional hindrance at low flux and to cathodic reactions that can contribute to the overall
kinetic process (including COD and TOC kinetic rates).
Figure 1. Variation of COD, TOC and [OTC] with time for the electrodegradation assays
performed in batch with recirculation mode for the different flow rates tested. Insets: Variation of TOC with COD along time.
The samples collected during the assays were also used to run UV-Vis absorption spectra and
results for the flow rates of 37 and 120 L h-1 are presented as the absorbance variation in time me-
asured at 276 and 355 nm, the two major OTC characteristic absorption bands (Figure 2, a and b).
Similarly to COD and TOC, the absorbance decay at both wavelengths increase with flow rate,
being the decay at 355 nm faster than at 276 nm. This means that in the OTC molecule the ring
containing the N-groups (responsible for the absorbance at 276 nm) is not so easily opened as the
other rings, or the intermediate products formed also absorb at this wavelength, thus contributing
to increase the absorbance at 276 nm.

J. Electrochem. Sci. Eng. 4(4) (2014) 203-213 ANODIC OXIDATION OF OXYTETRACYCLINE
208
Regarding nitrogen removal from solution (Figure 2c), there is only a very slight decay in the
total nitrogen amount and an increase followed by a decrease in the ammonium nitrogen
concentration during the 8 h assays. This means that the organic nitrogen is slowly converted into
ammonium and, only when the organic load is very small, ammonium is oxidized to nitrogen
volatile species, being this conversion higher for higher flow rates, probably because COD and TOC
removal rates also increase with flow rate.
Figure 2. Variation with time of absorbance, measured at (a) 276 and (b) 355 nm, (c) AN and
TN for the electrodegradation assays performed in batch mode with recirculation for two different flow rates tested: 37 and 120 L h-1.
The influence of the current density on the OTC degradation rate was studied in a stirred batch
system and results for the decays in COD, TOC and absorbance, measured at 276 and 355 nm, are
presented in Figure 3. The absolute COD and TOC removals increased with current density, mainly
due to the increase in indirect oxidation promoted by the hydroxyl radicals, formed when the
applied current exceeds the limiting current corresponding to the organic load of the solution.
Simultaneously, the formation of persulfate radicals can also happen, since sulfate was the chosen
electrolyte.
The absorbance variation measured at the OTC characteristic absorption bands presents a
behavior that seems dependent on the applied current density. For the lowest applied current,
after 4 h assay there is a divergence between the absorbance curves at 276 and 355 nm, with an
increase in the absorbance at 276 nm, meaning that products that absorb at this wavelength are
being formed. These products must be resistant to oxidation, since the curve related with
absorbance at 355 nm suffers a sudden decay that must be related with an increase in the
degradation of the remaining OTC, since at this applied current density the OTC decay is slower, as
will be discussed below.
For higher applied current densities, there is a separation between the absorbance curves
measured at the two characteristic wavelengths that increases with the applied current density,
due to reasons already discussed. This fact must also be a consequence of the different minera-
lization degree for the different experimental conditions, as can be observed in Figure 4. In fact,
the mineralization degree decreases with applied current densities between 2.5 and 7.5 mA cm-2,
showing a smaller increase for higher current densities. This behavior must be related with

A. Fernandes et al. J. Electrochem. Sci. Eng. 4(4) (2014) 203-213
doi: 10.5599/jese.2014.0062 209
hydroxyl radicals’ indirect oxidation and the diffusion hindrance promoted by the oxygen
evolution at higher applied current densities.
Figure 3. COD and TOC decays with time for the electrodegradation assays performed in batch with stirring mode for the different applied current densities tested. Insets: Relative absorbance
decays in time, measured at 276 and 355 nm.
Regarding the electrodegradation kinetics (Figure 5), the OTC concentration decays show a
dependence on the applied current density. As previously observed for the assays run in batch
mode with recirculation, it presents a pseudo-first order kinetic, with the kinetic constant (Figure
5, symmetric of the slopes of the adjusted equations) increasing with current density.

J. Electrochem. Sci. Eng. 4(4) (2014) 203-213 ANODIC OXIDATION OF OXYTETRACYCLINE
210
Figure 4. TOC vs COD variation for the electrodegradation assays performed in batch mode
with stirring at different applied current densities.
Figure 5. Variation of OTC concentration with time for the electrodegradation assays
performed in batch mode with stirring at different applied current intensities.
In order to compare the values obtained in both operating systems used, the slope obtained for
20 mA cm-2 was converted to the same units as those in Figure 1, giving 0.71 h-1, showing that in
the applied experimental conditions batch with stirring operating mode is less efficient than batch
with recirculation mode, probably due to the importance of the OTC diffusion to the reaction zone
in the degradation process.
The concentration of the main reaction intermediate products was also followed by HPLC.
Besides the main carboxylic acids detected, oxalic, oxamic and maleic acids and vestiges of formic
acid were also identified, particularly at higher current densities. In Figure 6, the variation in time
of the oxalic, oxamic and maleic acids is presented for the current densities of 2.5, 10 and
30 mA cm-2, for the two first current densities between 0 and 8 h and for 30 mA cm-2 between 0
and 12 h. When OTC is the main organic compound in solution, there is an increase in those
intermediates concentration. After that, their concentration start to decrease and they are
mineralized. The existence of only small dicarboxylic acids with conjugated double bonds points to
a degradation mechanism characteristic of indirect oxidation, where the parent molecule is
attacked in many different places, leaving unchanged double conjugated bond systems, less easily
oxidized.
A. Fernandes et al. J. Electrochem. Sci. Eng. 4(4) (2014) 203-213
doi: 10.5599/jese.2014.0062 211
Figure 6. Influence of the current density on the variation with time of the concentration of
some of the intermediate products formed during the OTC electrodegradation, performed in batch with stirring mode at different applied current intensities.
Conclusions
In this study oxytetracycline was successfully degraded through anodic oxidation with a BDD
anode. The investigation of the influence of the experimental conditions on the OTC degradation
allowed drawing the following conclusions:
- Degradation mechanism occurred mainly through indirect oxidation.
- COD and TOC removals increased with current density, being almost independent of the flow
rates tested, meaning that the current density plays an important role in the OTC oxidation
rate, mainly due to the formation of hydroxyl and persulfate radicals that are the main species
responsible for the indirect OTC oxidation.
- The increase in flow rate has a negative impact on the OTC mineralization degree.
- The organic nitrogen is slowly converted into ammonium and, only when the organic load is
very small, ammonium is oxidized to nitrogen volatile species, being this conversion higher for
higher flow rates.
- The electrodegradation process presents pseudo-first order kinetic and the kinetic constant
increases with current density. For flow rates higher than 75 L h-1, the process kinetics is almost
J. Electrochem. Sci. Eng. 4(4) (2014) 203-213 ANODIC OXIDATION OF OXYTETRACYCLINE
212
independent of the imposed flow rate. However, for lower flow rate the diffusion hindrance
leads to lower OTC removal rates.
- The main by-products detected were oxalic, oxamic and maleic acids, whose concentration
increased while OTC was the main organic compound in solution. After that, the by-products
concentration started to decrease, indicating their mineralization.
Acknowledgements: Financial support from FEDER, Programa Operacional Factores de Competitividade – COMPETE, and FCT, for the project PEst-OE/CTM/UI0195/2011 of the MTP Unit and for the grant awarded to A. Fernandes SFRH/BD/81368/2011.
References
[1] D. Bendz, N. A. Paxeus, T. R. Ginn, F. J. Loge, Journal of Hazardous Materials 122 (2005) 195-204
[2] P. H. Roberts, K. V. Thomas, Science of the Total Environment 356 (2006) 143-153 [3] S. D. Kim, J. Cho, I. S. Kim, B. J. Vanderford, S. A. Snyder, Water Research 41 (2007) 1013-
1021 [4] T. Deblonde, C. Cossu-Leguilleb, P. Hartemanna, International Journal of Hygiene and
Environmental Health 214 (2011) 442-448 [5] D. Calderón-Preciado, V. Matamoros, J. M. Bayona, Science of the Total Environment 412-
413 (2011) 14-19 [6] D. J. Lapworth, N. Baran, M. E. Stuart, R. S. Ward, Environmental Pollution 163 (2012)
287-303 [7] I. Chopra, M. Roberts, Microbiology and Molecular Biology Reviews 65 (2001) 232-260 [8] A. A. Borghi, M. S. A. Palma, Brazilian Journal of Pharmaceutical Sciences 50 (2014) 25-40 [9] B. Halling-Sorensen, G. Sengelov, J. Tjornelund, Archives of Environmental Contamination
and Toxicology 42 (2002) 263-271 [10] B. Halling-Sorensen, S. N. Nielsen, P. F. Lanzky, F. Ingerslev, H. C. H. Lutzhoft, S. E.
Jorgensen, Chemosphere 36 (1998) 357-394 [11] Q. Yang, J. Zhang, K. Zhu, H. Zhang, Journal of Environmental Sciences 21 (2009) 954-959 [12] L. Migliore, F. Godeas, S. P. De Filippis, P. Mantovi, D. Barchi, C. Testa, N. Rubattu, G.
Brambilla, Environmental Pollution 158 (2010) 129-134 [13] V. Andreu, P. Vasquez-Roig, C. Blasco, Y. Picó, Analytical and Bioanalytical Chemistry 394
(2009) 1329-1339 [14] L. Zhao, Y. H. Dong, H. Wang, Science of The Total Environment 408 (2010) 1069-1075 [15] H. Kim, Y. Hong, J. Park, V. K. Sharma, S. Cho, Chemosphere 91 (2013) 888-894 [16] I. Sirés, E. Brillas, Environment International 40 (2012) 212-229 [17] L. Feng, E.D. van Hullebusch, M. A. Rodrigo, G. Esposito, M. A. Oturan, Chemical
Engineering Journal 228 (2013) 944-964 [18] I. Oller, S. Malato, J. A. Sánchez-Pérez, Science of the Total Environment 409 (2011) 4141-
4166 [19] N. A. Alonso-Salles, F. Fourcade, F. Geneste, D. Floner, A. Amrane, Journal of Hazardous
Materials 181 (2010) 617-623 [20] C. Reyes, J. Férnandez, J. Freer, M.A. Mondaca, C. Zaror, S. Malato, H. D. Mansilla, Journal
of Photochemistry and Photobiology A 184 (2006) 141-146 [21] I. R. Bautitz, R. F. P. Nogueira, Journal of Photochemistry and Photobiology A 187 (2007) 33-39 [22] S. Jiao, S. Zheng, D. Yin, L. Wang, L. Chen, Chemosphere 73 (2008) 377-382 [23] K. Li, A. Yediler, M. Yang, S. Schulte-Hostede, M. H. Wong, Chemosphere 72 (2008) 473-478 [24] J. Shaojun, Z. Shourong, Y. Daqiang, W. Lianhong, C. Liangyan, Journal of Environmental
Sciences 20 (2008) 806-813

A. Fernandes et al. J. Electrochem. Sci. Eng. 4(4) (2014) 203-213
doi: 10.5599/jese.2014.0062 213
[25] H. Zhang, F. Liu, W. Xiaogang, J. Zhang, D. Zhang, Asia-Pacific Journal of Chemical Engineering 4 (2009) 568-573
[26] J. Jeong, W. Song, W. J. Cooper, J. Jung, J. Greaves, Chemosphere 78 (2010) 533-540. [27] J. J. Lopez-Peñalver, M. Sánchez-Polo, C. V. Gómez-Pacheco, J. Rivera-Utrilla, Journal of
Chemical Technology and Biotechnology 85 (2010) 1325-1333 [28] H. Lee, E. Lee, C.H. Lee, K. Lee, Journal of Industrial and Engineering Chemistry 17 (2011)
468-473 [29] M. Miyata, I. Ihara, G. Yoshid, K. Toyod, K. Umetsu, Water Science & Technology 63 (2011)
456-461 [30] C. I. Brinzila, M.J. Pacheco, L. Ciríaco, R. C. Ciobanu, A. Lopes, Chemical Engineering Journal
209 (2012) 54-61 [31] R. Daghrira, P. Droguia, I. Kab, M. A. El Khakanib, Journal of Hazardous Materials 199-200
(2012) 15-24 [32] C. V. Gómez-Pacheco, M. Sánchez-Polo, J. Rivera-Utrilla, J.J. Lopez-Peñalver, Chemical
Engineering Journal 187 (2012) 89-95 [33] L. Hou, H. Zhang, X. Xue, Separation and Purification Technology 84 (2012) 147-152 [34] J. Wu, H. Zhang, N. Oturan, Y. Wang, L. Chen, M.A. Oturan, Chemosphere 87 (2012) 614-620 [35] D. Bu, H. Zhuang, Applied Surface Science 265 (2013) 677-685 [36] N. Oturan, J. Wu, H. Zhang, V. K. Sharma, M. A. Oturan, Applied Catalysis B: Environmental
140-141 (2013) 92-97 [37] C. I. Brinzila, N. Monteiro, M.J. Pacheco, L. Ciríaco, I. Siminiceanu, A. Lopes, Environmental
Science and Pollution Research, DOI 10.1007/s11356-014-2778-y [38] C. A. Martínez-Huitle, E. Brillas, Applied Catalysis B: Environmental 87 (2009) 105-145 [39] M. Panizza, G. Cerisola, Chemical Reviews 109 (2009) 6541-6569 [40] L. Jiancheng, Y. Jie, L. Weishan, H. Qiming, X. Hongkang, Journal of Electrochemical Science
and Engineering 2(4) (2012) 171-183 [41] A. N. S. Rao, V.T. Venkatarangaiah, Journal of Electrochemical Science and Engineering 3
(2013) 167-184 [42] C. C. Jara, D. Fino, V. Specchia, G. Saracco, P. Spinelli, Applied Catalysis B: Environmental 70
(2007) 479-487 [43] A. Morão, A. Lopes, M.T. Pessoa de Amorim, I.C. Gonçalves, Electrochimica Acta 49 (2004)
1587-1595 [44] M. Panizza, G. Cerisola, Electrochimica Acta 51 (2005) 191-199 [45] M.J. Pacheco, A. Morão, A. Lopes, L. Ciríaco, I. Gonçalves, Electrochimica Acta 53 (2007)
629-636 [46] L. Círiaco, C. Anjo, J. Correia, M. J. Pacheco, A. Lopes, Electrochimica Acta 54 (2009) 1464-1472 [47] A. El-Ghenymy, P.L. Cabot, F. Centellas, J. A. Garrido, R. M. Rodríguez, C. Arias, E. Brillas,
Electrochimica Acta 90 (2013) 254-264 [48] A. Eaton, L. Clesceri, E. Rice, A. Greenberg, M. A. Franson, Standard Methods for
Examination of Water and Wastewater, twenty-first ed., American Public Health Association, Washington, DC, 2005
[49] J. L. Nava, I. Sires, E. Brillas, Environmental Science and Pollution Research 21(14) (2014) 8485-8492
[50] J. L. Nava, A. Recendiz, J. C. Acosta, I. Gonzalez, Water Science and Technology 58(12) (2008) 2413-2419
© 2014 by the authors; licensee IAPC, Zagreb, Croatia. This article is an open-access article distributed under the terms and conditions of the Creative Commons Attribution license
(http://creativecommons.org/licenses/by/3.0/)

doi: 10.5599/jese.2014.0066 215
J. Electrochem. Sci. Eng. 4(4) (2014) 215-225; doi: 10.5599/jese.2014.0066
Open Access : : ISSN 1847-9286
www.jESE-online.org
Original scientific paper
Phenolic compounds removal from mimosa tannin model water and olive mill wastewater by energy-efficient electrocoagulation process
Marijana Kraljić Roković, Mario Čubrić and Ozren Wittine
Faculty of Chemical Engineering and Technology, University of Zagreb, Marulićev trg 19, Croatia
Corresponding Author E-mail: [email protected]; Tel.: +-385-1-4597112; Fax: +-385-1-4597139
Received: August 1, 2014; Revised: August 26, 2014; Published: December 6, 2014
Abstract
The objective of this work was to study the influence of NaCl concentration, time, and current density on the removal efficiency of phenolic compounds by electrocoagulation process, as well as to compare the specific energy consumption (SEC) of these processes under different experimental conditions. Electrocoagulation was carried out on two different samples of water: model water of mimosa tannin and olive mill wastewater (OMW). Low carbon steel electrodes were used in the experiments. The properties of the treated effluent were determined using UV/Vis spectroscopy and by measuring total organic carbon (TOC). Percentage of removal increased with time, current density, and NaCl concentration. SEC value increased with increased time and current density but it was decreased significantly by NaCl additions (0-29 g L-1). It was found that electro-coagulation treatment of effluents containing phenolic compounds involves complex formation between ferrous/ferric and phenolic compounds present in treated effluent, which has significant impact on the efficiency of the process.
Keywords
Complexation; NaCl; low carbon steel, UV/Vis spectroscopy, total organic carbon (TOC).
Introduction
High amounts of waste water are generated in the Mediterranean area each year during the
short periods of the olive oil production process, from October to December. Its direct disposal in
nature is not acceptable since it contains dark colour, organic materials, and emulsion oils.
Additionally, such waters contain phenolic compounds that have a negative impact on vegetation
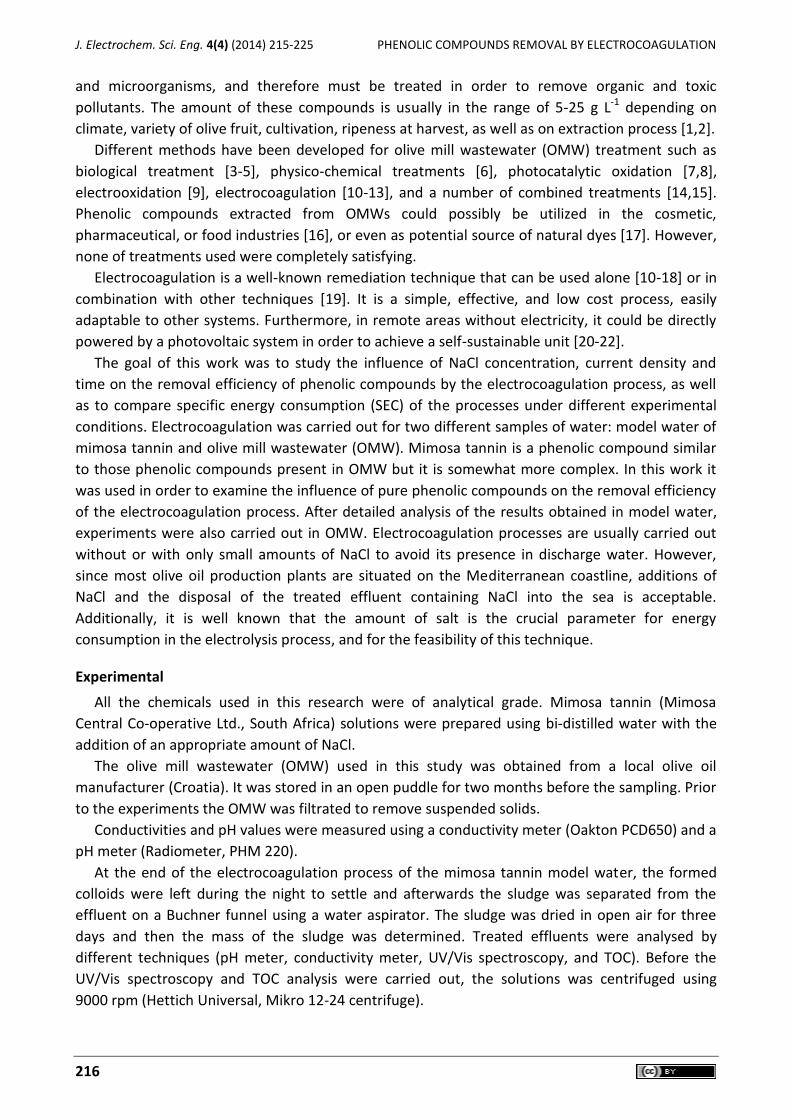
J. Electrochem. Sci. Eng. 4(4) (2014) 215-225 PHENOLIC COMPOUNDS REMOVAL BY ELECTROCOAGULATION
216
and microorganisms, and therefore must be treated in order to remove organic and toxic
pollutants. The amount of these compounds is usually in the range of 5-25 g L-1 depending on
climate, variety of olive fruit, cultivation, ripeness at harvest, as well as on extraction process [1,2].
Different methods have been developed for olive mill wastewater (OMW) treatment such as
biological treatment [3-5], physico-chemical treatments [6], photocatalytic oxidation [7,8],
electrooxidation [9], electrocoagulation [10-13], and a number of combined treatments [14,15].
Phenolic compounds extracted from OMWs could possibly be utilized in the cosmetic,
pharmaceutical, or food industries [16], or even as potential source of natural dyes [17]. However,
none of treatments used were completely satisfying.
Electrocoagulation is a well-known remediation technique that can be used alone [10-18] or in
combination with other techniques [19]. It is a simple, effective, and low cost process, easily
adaptable to other systems. Furthermore, in remote areas without electricity, it could be directly
powered by a photovoltaic system in order to achieve a self-sustainable unit [20-22].
The goal of this work was to study the influence of NaCl concentration, current density and
time on the removal efficiency of phenolic compounds by the electrocoagulation process, as well
as to compare specific energy consumption (SEC) of the processes under different experimental
conditions. Electrocoagulation was carried out for two different samples of water: model water of
mimosa tannin and olive mill wastewater (OMW). Mimosa tannin is a phenolic compound similar
to those phenolic compounds present in OMW but it is somewhat more complex. In this work it
was used in order to examine the influence of pure phenolic compounds on the removal efficiency
of the electrocoagulation process. After detailed analysis of the results obtained in model water,
experiments were also carried out in OMW. Electrocoagulation processes are usually carried out
without or with only small amounts of NaCl to avoid its presence in discharge water. However,
since most olive oil production plants are situated on the Mediterranean coastline, additions of
NaCl and the disposal of the treated effluent containing NaCl into the sea is acceptable.
Additionally, it is well known that the amount of salt is the crucial parameter for energy
consumption in the electrolysis process, and for the feasibility of this technique.
Experimental
All the chemicals used in this research were of analytical grade. Mimosa tannin (Mimosa
Central Co-operative Ltd., South Africa) solutions were prepared using bi-distilled water with the
addition of an appropriate amount of NaCl.
The olive mill wastewater (OMW) used in this study was obtained from a local olive oil
manufacturer (Croatia). It was stored in an open puddle for two months before the sampling. Prior
to the experiments the OMW was filtrated to remove suspended solids.
Conductivities and pH values were measured using a conductivity meter (Oakton PCD650) and a
pH meter (Radiometer, PHM 220).
At the end of the electrocoagulation process of the mimosa tannin model water, the formed
colloids were left during the night to settle and afterwards the sludge was separated from the
effluent on a Buchner funnel using a water aspirator. The sludge was dried in open air for three
days and then the mass of the sludge was determined. Treated effluents were analysed by
different techniques (pH meter, conductivity meter, UV/Vis spectroscopy, and TOC). Before the
UV/Vis spectroscopy and TOC analysis were carried out, the solutions was centrifuged using
9000 rpm (Hettich Universal, Mikro 12-24 centrifuge).

M. Kraljić Roković et al. J. Electrochem. Sci. Eng. 4(4) (2014) 215-225
doi: 10.5599/jese.2014.0066 217
At the end of electrocoagulation process of the OMW, the water was immediately filtrated in a
Buchner funnel and analysed using the same techniques as in the case of mimosa tannin solution.
The phenolic compounds concentration was measured at the wavelength corresponding to the
maximum absorbance using a spectrophotometer (Ocean Optics 200, UV light source Analytical
Instrument Systems Inc., Model D 1000 CE) connected to a computer, in 1 cm path-length cells.
The equation used to calculate the phenol removal efficiency in the experiments was:
0
0
/ % = 100R
(1)
where γ0 and γ are defined as the concentration before and after electrocoagulation process. A
similar equation was used to calculate total organic carbon (TOC) removal efficiency (RTOC / %).
The TOC measurements were done on a Shimadzu Analyser TOC V-CSN using the NPOC
method.
The electrocoagulation experiments were carried out in a glassy electrolytic cell with
dimensions of 7 x 7 x 6 cm. Parallel plate electrodes were immersed in the cell with a working
electrode situated between two counter electrodes in order to achieve a good current and
potential distribution, and a uniform electrode dissolution. Low carbon steel (composition:
0.06 % C, 0.015 % P, 0.008 % S, 0.007 % Si and 0.35 % Mn) was used for all electrodes. Before the
experiment the electrodes were polished using 600 grit emery paper, they were washed with bi-
distilled water, and finally, with ethanol. The working electrode had a total immersed area of
10 cm2, and the counter electrodes had a total immersed area of 20 cm2. The distance between
the electrodes was 1 cm. Before the experiment, the appropriate amount of NaCl was dissolved in
the treated solutions. During the experiment constant stirring speeds of 600 rpm and DC Power
Supply (Iskra, MA 4165; 1.5 A; 25 V) were used. All the experiments were carried out at room temperature (23±1 oC).
RESULTS AND DISCUSSIONS
Treatment of the model water containing mimosa tannin
The mimosa tannin (γ = 1 g L-1) solution prepared in 0.5 mol dm-3 NaCl has pH 5.1 and
κ = 38.3 mS cm-1. In order to find out the removal efficiency of mimosa tannin over different
durations, the process was carried out for 5, 15, and 35 minutes using current densities of 10 mA
cm-2. The characteristic voltage of this process was 1.25 V. The influence of the duration of the
experiment on the electrocoagulation efficiency is presented in Table 1.
Within the 5 min removal period removal efficiency reached 92.2 %, while further treatment
resulted only in its slight increase (35 min, 96.7 %). Energy consumption during the experiment
increased proportionally with time since the current density and voltage were constant
throughout the experiments.
To explain the mechanism of the electrocoagulation process one must consider the reactions
occurring on both electrodes. During the anodic process iron is oxidized and dissolved as Fe2+.
Under the experimental conditions used in this work (pH = 5.1) it does not undergo hydrolysis.
However, in aerated conditions it is further oxidized by dissolved oxygen to Fe3+, which is
susceptible to hydrolysis, resulting in different aqua and hydroxyl complexes, such as Fe(OH)2+,
Fe(OH)+, Fe(OH)3 under acid conditions, or Fe(OH)63- and Fe(OH)4
- under alkaline conditions [23].
Since the pH values registered before and after electrocoagulation process varied from 5-7,
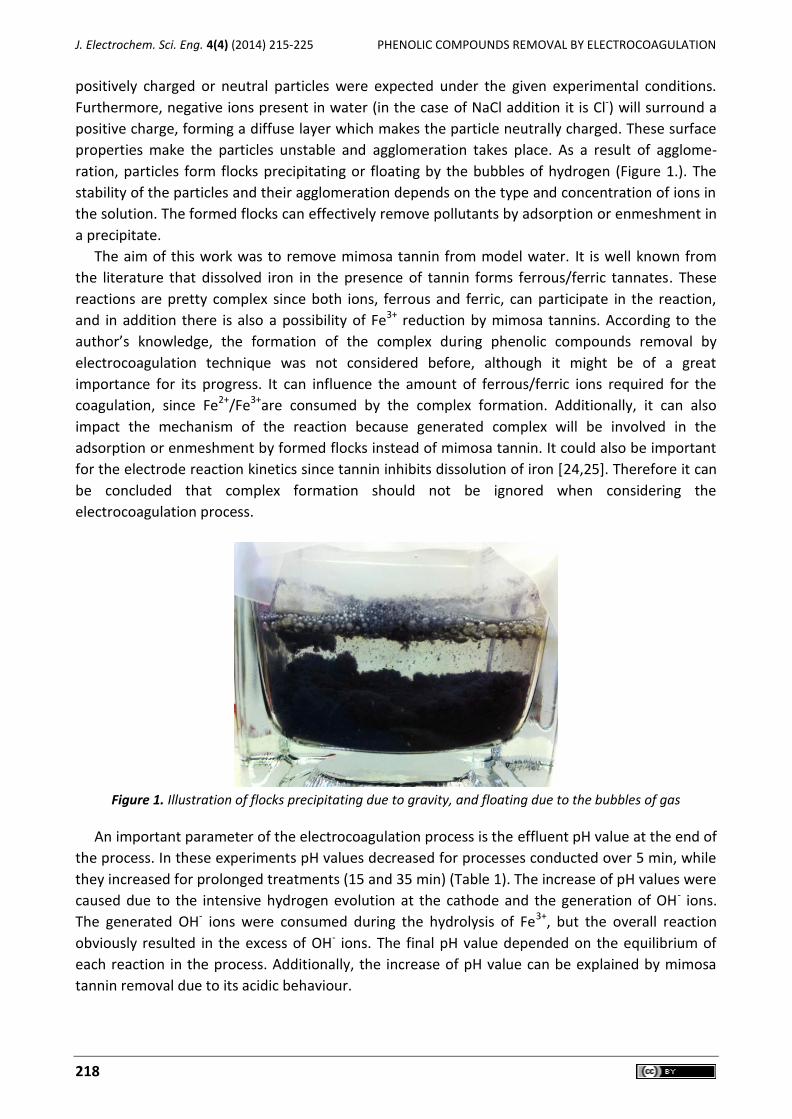
J. Electrochem. Sci. Eng. 4(4) (2014) 215-225 PHENOLIC COMPOUNDS REMOVAL BY ELECTROCOAGULATION
218
positively charged or neutral particles were expected under the given experimental conditions.
Furthermore, negative ions present in water (in the case of NaCl addition it is Cl-) will surround a
positive charge, forming a diffuse layer which makes the particle neutrally charged. These surface
properties make the particles unstable and agglomeration takes place. As a result of agglome-
ration, particles form flocks precipitating or floating by the bubbles of hydrogen (Figure 1.). The
stability of the particles and their agglomeration depends on the type and concentration of ions in
the solution. The formed flocks can effectively remove pollutants by adsorption or enmeshment in
a precipitate.
The aim of this work was to remove mimosa tannin from model water. It is well known from
the literature that dissolved iron in the presence of tannin forms ferrous/ferric tannates. These
reactions are pretty complex since both ions, ferrous and ferric, can participate in the reaction,
and in addition there is also a possibility of Fe3+ reduction by mimosa tannins. According to the
author’s knowledge, the formation of the complex during phenolic compounds removal by
electrocoagulation technique was not considered before, although it might be of a great
importance for its progress. It can influence the amount of ferrous/ferric ions required for the
coagulation, since Fe2+/Fe3+are consumed by the complex formation. Additionally, it can also
impact the mechanism of the reaction because generated complex will be involved in the
adsorption or enmeshment by formed flocks instead of mimosa tannin. It could also be important
for the electrode reaction kinetics since tannin inhibits dissolution of iron [24,25]. Therefore it can
be concluded that complex formation should not be ignored when considering the
electrocoagulation process.
Figure 1. Illustration of flocks precipitating due to gravity, and floating due to the bubbles of gas
An important parameter of the electrocoagulation process is the effluent pH value at the end of
the process. In these experiments pH values decreased for processes conducted over 5 min, while
they increased for prolonged treatments (15 and 35 min) (Table 1). The increase of pH values were
caused due to the intensive hydrogen evolution at the cathode and the generation of OH- ions.
The generated OH- ions were consumed during the hydrolysis of Fe3+, but the overall reaction
obviously resulted in the excess of OH- ions. The final pH value depended on the equilibrium of
each reaction in the process. Additionally, the increase of pH value can be explained by mimosa
tannin removal due to its acidic behaviour.

M. Kraljić Roković et al. J. Electrochem. Sci. Eng. 4(4) (2014) 215-225
doi: 10.5599/jese.2014.0066 219
Table 1. Results of treatments at different times (j = 10 mA cm-2, U = 1.25 V, γ (NaCl) = 29.22 mol g L-1, κ = 38.3 mS cm-1, pH = 5.1, γ0(tannin)=1 g L-1, V = 0.1 L).
T / min R / % SEC/ kW h kg-1 m(precipitate) / g pH(after EC)
5 92.21 0.113 0.143 4.81
15 95.54 0.327 0.197 5.74
35 96.68 0.754 0.263 6.31
Since the concentration of ferrous/ferric ions is dependent on current density, the efficiency of
the process is dependent on current density as well. In this work the electrocoagulation process
was conducted for 15 min using different current values (Figures 2 and 3). When the current
increased from 1 to 10 mA cm-2, removal efficiency increased from 10 to 20 % in 0.58 g L-1 NaCl,
from 47 to 93 % in 5.84 g L-1 NaCl, and from 58 to 96 % in 29.22 mol dm-3 NaCl (Figure 2). However,
specific energy consumption per mass of mimosa tannin increased more significantly from 0.302
to 7.311 kW h kg-1 in 0.58 g L-1 NaCl, from 0.034 to 0.469 kW h kg-1 in 5.84 g L-1 NaCl, and from
0.021 to 0.327 kW h kg-1 in 29.22 g L-1 NaCl (Table 2). As evident, the highest removal efficiency
was obtained at high current density. The obtained results also show that the highest removal
efficiency was registered in the presence of high NaCl concentrations, where the lowest specific
energy consumption is required. It is supported by Figure 4, where the colour of the solution
suggests more difficult precipitation of flocks for small additions of NaCl causing reduced removal
efficiency. This is in accordance with theory that coagulation process depends on type and
concentration of ions present in solution. It is obvious that optimal process conditions were
obtained in the presence of high amounts of NaCl. These results pointed out the importance of the
NaCl concentration as a key parameter for an efficient and low cost process.
NaCl’s presence is important because of the two effects: (a) it decreased the applied voltage
and energy power demand [26] and (b) it changed the ionic strength that affected the coagulation
process as evident from Figures 2 and 4. The influence of ionic concentration and zeta potential on
the electrocoagulation process was reported previously [27, 28].
Figure 2. Influence of NaCl concentration and current density on removal efficiency.
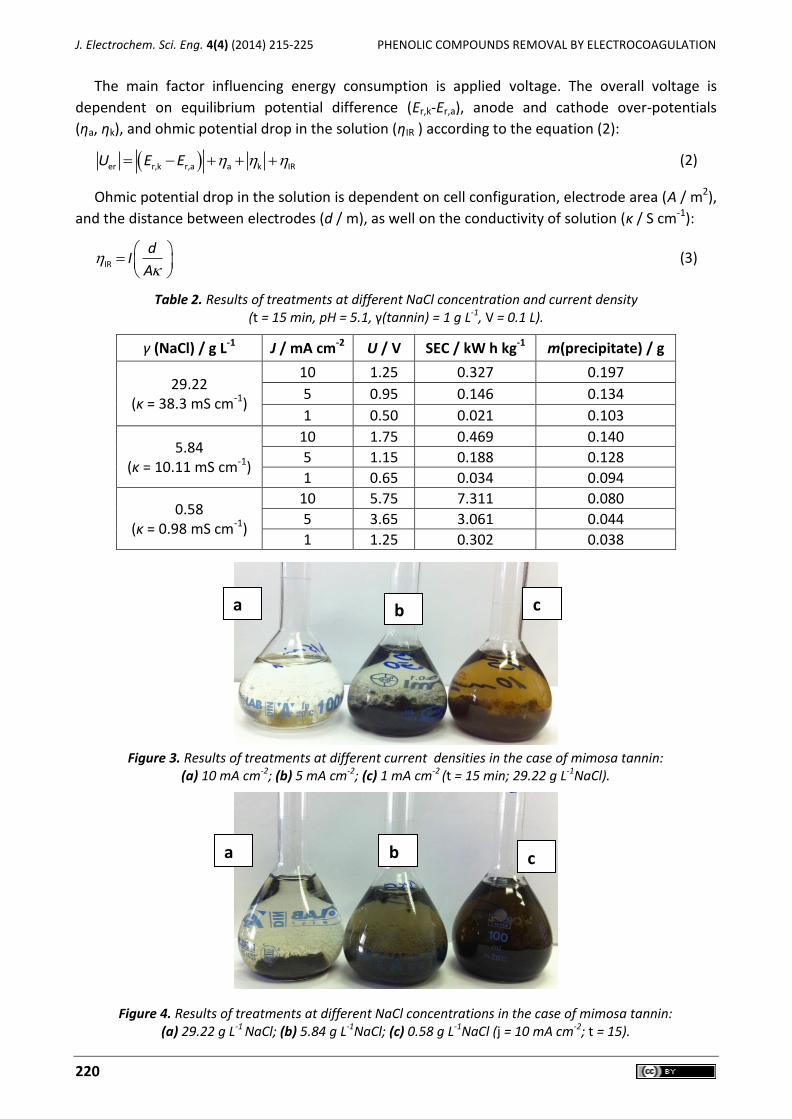
J. Electrochem. Sci. Eng. 4(4) (2014) 215-225 PHENOLIC COMPOUNDS REMOVAL BY ELECTROCOAGULATION
220
The main factor influencing energy consumption is applied voltage. The overall voltage is
dependent on equilibrium potential difference (Er,k-Er,a), anode and cathode over-potentials
(ηa, ηk), and ohmic potential drop in the solution (ηIR ) according to the equation (2):
er r,k r,a a k IRU E E (2)
Ohmic potential drop in the solution is dependent on cell configuration, electrode area (A / m2),
and the distance between electrodes (d / m), as well on the conductivity of solution (κ / S cm-1):
IR
dI
A
(3)
Table 2. Results of treatments at different NaCl concentration and current density (t = 15 min, pH = 5.1, γ(tannin) = 1 g L-1, V = 0.1 L).
γ (NaCl) / g L-1 J / mA cm-2 U / V SEC / kW h kg-1 m(precipitate) / g
29.22 (κ = 38.3 mS cm-1)
10 1.25 0.327 0.197
5 0.95 0.146 0.134
1 0.50 0.021 0.103
5.84 (κ = 10.11 mS cm-1)
10 1.75 0.469 0.140
5 1.15 0.188 0.128
1 0.65 0.034 0.094
0.58 (κ = 0.98 mS cm-1)
10 5.75 7.311 0.080
5 3.65 3.061 0.044
1 1.25 0.302 0.038
Figure 3. Results of treatments at different current densities in the case of mimosa tannin:
(a) 10 mA cm-2; (b) 5 mA cm-2; (c) 1 mA cm-2 (t = 15 min; 29.22 g L-1NaCl).
Figure 4. Results of treatments at different NaCl concentrations in the case of mimosa tannin: (a) 29.22 g L-1 NaCl; (b) 5.84 g L-1NaCl; (c) 0.58 g L-1NaCl (j = 10 mA cm-2; t = 15).
a
a c b
c b

M. Kraljić Roković et al. J. Electrochem. Sci. Eng. 4(4) (2014) 215-225
doi: 10.5599/jese.2014.0066 221
SEC is dependent on current value (I), applied voltage (U) and time (t) and it is expressed as
energy consumption per mass of removed tannin:
0
SEC IUt
tannin tannin V
(4)
where γ is the mass concentration of tannin or phenolic compound, V is volume of treated
solution.
Another important parameter for SEC is the distance between the electrodes, which in most of
the previous reports ranged from 0.3-3.0 cm, while the distance in this work was 1 cm. A small
distance is preferable to decrease potential drop, but the electrodes should be adequately
separated in order to enable unhindered movement of flocks between them.
Conductivity of the solution i.e. salt concentration also plays important role for SEC value and
according to our knowledge its value was quite different in different reports.
Kobaya et al. [29] treated textile wastewater by electrocoagulation process and it was shown
that an addition of NaCl (κ = 1000-4000 S cm-1) did not influence process efficiency but energy
consumption decreased with increased wastewater conductivity (2.2-0.75 kW h kg-1 (COD)).
Sengil et al. [30] have used electrocoagulation for decolourization of Reactive red and it was found
that small additions (0.5-2.0 g L-1) of NaCl increase efficiency while further addition did not have
any impact. The optimal conditions were found to be 2.3 g L-1 NaCl and 4.54 kW h kg-1 (dye). B. K.
Nandi et al. [31] varied NaCl concentration from 0.1-1.0 g L-1 and it was found that efficiency had
increased from 97-100 % and energy consumption had decreased from 17-3 kW h kg-1 (Fe). X.
Chen et al. [32] separated pollutants from restaurant wastewater by electrocoagulation process
without the addition of NaCl when energy consumption was in the range of 0.2-1.4 kW h m-3 dep-
ending on the solution conductivity that varied from 770-227 S cm-1. The additions of NaCl chang-
ed conductivity from 443-2850 S cm-1 and energy consumption as well, from 0.32-0.29 kW h m-3;
however, it did not change the efficiency of the process.
From the previous results it follows that NaCl concentration can influence specific energy
consumption drastically, which will have an impact on operating cost. However, the dependence
of removal efficiency on NaCl concentration is not completely clear and it depends on the type of
pollutant and its concentration.
The results of this paper confirm that NaCl addition decreases specific energy consumption in
accordance with the previous results. Furthermore, it was shown that efficiency of the phenolic
compound removal can also be improved considerably by the addition of NaCl in the range from
0.58 g L-1 to 29.22 g L-1.
Treatment of OMW
The starting OMW solution had the following characteristics: pH 5.37, concentration of phenolic
compounds, γ0 = 0.613 g L-1 (mimosa tannin equivalent), and the TOC value was 1376 mg L-1. These
values were somewhat lower in comparison to the values frequently found in the literature
[10-12]. This can be explained by the fact that the OMW was kept in an open puddle for 2 months.
During OMW treatment by electrocoagulation process in previous investigations the solution as
received was used or it was diluted with water. The conductivity of the pure OMW sample was
11 mS cm-1 [10-12] and for diluted OMW (1:5) conductivity was 3.6 S cm-1 [13]. The SEC value
obtained during the OMW treatment was found to be 4 kW h kg-1 (COD) [13] or 20-300 kW h m-3
(volume of treated solution) [12], which were quite similar considering the characteristic COD

J. Electrochem. Sci. Eng. 4(4) (2014) 215-225 PHENOLIC COMPOUNDS REMOVAL BY ELECTROCOAGULATION
222
value for OMW. Also, it was shown that small additions of NaCl improve removal efficiency while
additions higher than 2 g L-1 decrease removal efficiency. Energy consumption has decreased upon
NaCl addition.
From the results of the treatment of mimosa tannin, the current density of 10 mA cm-2 was
chosen for the OMW treatment. The process was carried out with different additions of NaCl from
0-20 g L-1 during 35 or 60 min. Depending on NaCl addition conductivity of the solutions was
changed from the value similar to the previously reported values (2.3 S cm-1) to the value higher
than previously reported (23.7 S cm-1). The SEC value was changed from 8.5-1.6 kW h kg-1 (mass of
phenolic compounds) during 35 min or it was changed from 8.2-2.6 kW h kg-1 (mass of phenolic
compounds) during 60 min.
Similarly as in the case of model water, addition of NaCl had positive impact on removal
efficiency (Figures 5 and 6) and energy consumption (Table 3). Furthermore, better efficiency was
obtained by prolonged process time while SEC was not increased significantly. At the end of the
electrocoagulation process pH value was close to 7, which was acceptable for discharge, while
conductivity increased only slightly.
Table 3. Results of treatments at different NaCl concentration and process times (j= 10 mA cm-2. pH = 5.37. V= 0.1 L, γ0 = 0.613 g L-1).
t/ min γ(NaCl) / g L-1
U / V SEC/ kW h kg-1
pHafter EC κ(OMW)before EC / mS cm-1
κ(OMW)after EC / mS cm-1
0 3.8 8.492 6.65 2.32 3.43
35 5 1.9 2.677 6.85 8.23 9.48
10 1.5 1.998 6.88 13.77 14.75
20 1.4 1.604 6.9 23.72 24.79
0 3.9 8.226 6.7 2.32 3.26
60 5 2.1 4.26 6.81 5.99 6.55
10 1.6 2.941 6.94 10.12 10.98
20 1.5 2.562 6.98 20.44 21.75
Figure 5. Dependence of removal efficiency of phenolic compound in OMW treated effluent on NaCl concentration and process time.
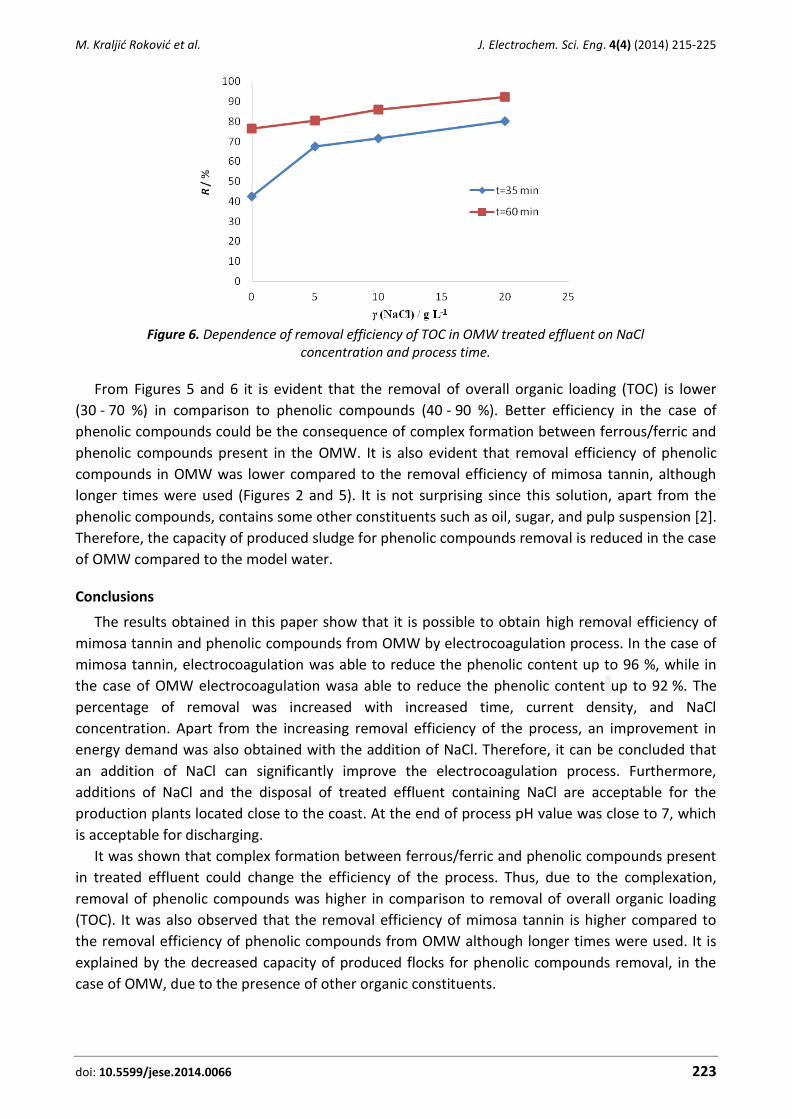
M. Kraljić Roković et al. J. Electrochem. Sci. Eng. 4(4) (2014) 215-225
doi: 10.5599/jese.2014.0066 223
Figure 6. Dependence of removal efficiency of TOC in OMW treated effluent on NaCl
concentration and process time.
From Figures 5 and 6 it is evident that the removal of overall organic loading (TOC) is lower
(30 - 70 %) in comparison to phenolic compounds (40 - 90 %). Better efficiency in the case of
phenolic compounds could be the consequence of complex formation between ferrous/ferric and
phenolic compounds present in the OMW. It is also evident that removal efficiency of phenolic
compounds in OMW was lower compared to the removal efficiency of mimosa tannin, although
longer times were used (Figures 2 and 5). It is not surprising since this solution, apart from the
phenolic compounds, contains some other constituents such as oil, sugar, and pulp suspension [2].
Therefore, the capacity of produced sludge for phenolic compounds removal is reduced in the case
of OMW compared to the model water.
Conclusions
The results obtained in this paper show that it is possible to obtain high removal efficiency of
mimosa tannin and phenolic compounds from OMW by electrocoagulation process. In the case of
mimosa tannin, electrocoagulation was able to reduce the phenolic content up to 96 %, while in
the case of OMW electrocoagulation wasa able to reduce the phenolic content up to 92 %. The
percentage of removal was increased with increased time, current density, and NaCl
concentration. Apart from the increasing removal efficiency of the process, an improvement in
energy demand was also obtained with the addition of NaCl. Therefore, it can be concluded that
an addition of NaCl can significantly improve the electrocoagulation process. Furthermore,
additions of NaCl and the disposal of treated effluent containing NaCl are acceptable for the
production plants located close to the coast. At the end of process pH value was close to 7, which
is acceptable for discharging.
It was shown that complex formation between ferrous/ferric and phenolic compounds present
in treated effluent could change the efficiency of the process. Thus, due to the complexation,
removal of phenolic compounds was higher in comparison to removal of overall organic loading
(TOC). It was also observed that the removal efficiency of mimosa tannin is higher compared to
the removal efficiency of phenolic compounds from OMW although longer times were used. It is
explained by the decreased capacity of produced flocks for phenolic compounds removal, in the
case of OMW, due to the presence of other organic constituents.
J. Electrochem. Sci. Eng. 4(4) (2014) 215-225 PHENOLIC COMPOUNDS REMOVAL BY ELECTROCOAGULATION
224
Acknowledgements: Financial support by Ministry of Science, Education and Sports of Republic of Croatia (project 125-1252973-2576) is gratefully acknowledged. The authors express their - gratitude to Višnja Pavić for providing mimosa tannin.
References
[1] http://www.agbiolab.com/files/agbiolab_Polyphenols.pdf [2] F. Federici, Pomologia Croatica 12 (2006) 15-27. [3] D. Quaratino, A. D’Annibale, F. Federici, C.Cereti, F. Rossini, M. Fenice, Chemosphere 66
(2007) 1627–1633. [4] T. Landeka Dragičević, M. Zanoški Hren, M. Gmajnić, S. Pelko, D. Kungulovski, I.
Kungulovski, D. Čvek, J. Frece, K. Markov, F. Delaš, Archives of Industrial Hygiene and Toxicology 61 (2010) 399-405.
[5] P. Paraskeva, E. Diamadopoulos, Journal of Chemical Technology and Biotechnology 81 (2006) 1475–1485.
[6] A.C. Barbera , C. Maucieri , A. Ioppolo, M. Milani, V. Cavallaro, Water Research 52 (2014) 275-281.
[7] I. Michael, A. Panagi, L.A. Ioannou, Z. Frontistis, D. Fatta-Kassinos, Water Research 60 (2014) 28-40.
[8] E. Chatzisymeon, E. Stypas, S. Bousios, N.P. Xekoukoulotakis, D. Mantzavinos, Journal of Hazardous Materials 154 (2008) 1090-1097.
[9] U.T. Un, U. Altay, A. S. Koparal, U.B. Ogutveren, Chemical Engineering Journal 139 (2008) 445–452.
[10] U . T. Ün, S. Ugur , A.S. Koparal , U. B. Öğütveren, Separation and purification technology 52 (2006) 136-141.
[11] N. Adhoum, L. Monser, Chemical Engineering and Processing 43 (2004) 1281-1287. [12] H. Inan, A. Dimoglo, H. Dimsek, M. Karpuzcu, Separation and purification technology 36
(2004) 23-31. [13] F. Hanafi, O. Assobhei, M. Mountadar, Journal of Hazardous Materuials 174 (2010) 807-
812. [14] S. Khoufi, F. Aloui, S. Sayadi, Water Research 40 (2006) 2007 – 2016.
[15] J.M. Ochando-Pulidoa, G. Hodaifab, M.D. Victor-Ortegaa,S. Rodriguez-Vivesa, A. Martinez-Ferez, Journal of Hazardous Materials 263P (2013) 158– 167.
[16] J H. Zbakh, A. El Abbassi, Journal of Functional Foods 4 ( 2012) 53-65 [17] N. Meksi, W. Haddar, S. Hammami, M.F. Mhenni, Industrial Crops and Products 40 (2012)
103– 109. [18] S. Zodi, O. Potier, C. Michon, H. Poirot, G. Valentin, J. P. Leclerc, F. Lapicque, Journal of
Electrochemical Science and Engineering 1 (2011) 55-65. [19] A. Aouni, C. Fersi, M. B. Sik Ali, M. Dhahbi, Journal of Hazardous Materials 168 (2009) 868–
874. [20] J. M. Ortiz, E. Expósito, F. Gallud, V. García-García, V. Montiel, A. Aldaz, Desalination 208
(2007) 89–100. [21] D. Valero, J. M. Ortiz, E. Expósito, V. Montiel, A. Aldaz, Solar Energy Materials & Solar Cell
92 (2008) 291-297. [22] R. García-Valverde, N. Espinosa, A. Urbina, International Journal of HydrogenEenergy 36
(2011) 10574-10586. [23] M. Yousuf, A. Mollah, R. Schennach, J. R. Parga, D. L. Cocke, Journal of Hazardous Materials
B84 (2001) 29-41.

M. Kraljić Roković et al. J. Electrochem. Sci. Eng. 4(4) (2014) 215-225
doi: 10.5599/jese.2014.0066 225
[24] S. Yahya, A. M. Shah, A. A. Rahim, N. H. A. Aziz, R. Roslan, Journal of Physical Science 19 (2008) 31-41.
[25] S. Martinez, Materials Chemistry and Physics 77 (2002) 97–102. [26] A. N. Subba Rao and V. T. Venkatarangaiah, Journal of Electrochemical Science and
Engineering 3 (2013) 167-184. [27] C. Barrbera-Díaz, B. Frontana-Uribe, B. Bilyeu, Chemosphere 105 (2014) 160-164. [28] M. Vepsäläinen, M. Pulliainen, M. Sillanpää, Separation and Purification Technology 99
(2012) 20-27. [29] M. Kobya, O. T. Can, M. Bayramoglu, Journal of Hazardous Materials B100 (2003) 163-178. [30] I. A. Şengil, M. Özacar, B. Ömürlü, Chemical and Biochemical Engineering Quarterly 18
(2004) 391-401. [31] B. K. Nandi, S. Pateol, Arabian Journal of Chemistry, In Press, Corrected Proof, DOI:
10.1016/j.arabjc.2013.11.032 [32] X. Chen, G. Chen, P. L. Yue, Separation and Purification Technology 19 (2000) 65-76.
© 2014 by the authors; licensee IAPC, Zagreb, Croatia. This article is an open-access article distributed under the terms and conditions of the Creative Commons Attribution license
(http://creativecommons.org/licenses/by/4.0/)

doi: 10.5599/jese.2014.0056 227
J. Electrochem. Sci. Eng. 4(4) (2014) 227-234; doi: 10.5599/jese.2014.0056
Open Access: ISSN 1847-9286
www.jESE-online.org
Original scientific paper
Optimization of parameters for dye removal by electro-oxidation using Taguchi Design
Mani Nandhini, Balasubramanian Suchithra,
Ramanujam Saravanathamizhan and Dhakshinamoorthy Gnana Prakash
Department of Chemical Engineering, SSN College of Engineering, Kalavakkam, Chennai 603110, India
Corresponding author: E-mail: [email protected]; Tel. +91 44 27469700; Fax +91 44 27469772
Received: April 18, 2014; Revised: May 9, 2014; Published: December 6, 2014
Abstract The aim of the present investigation is to treat the dye house effluent using electro-oxidation and to analyse the result using Taguchi method. L16 orthogonal array was applied as an experimental design to analyse the results and to determine optimum conditions for acid fast red dye removal from aqueous solution. Various operating parameters were selected to study the electro-oxidation for the colour removal of the effluent. The operating parameter such as dye concentration, reaction time, solution pH and current density were studied and the significance of the variables was analysed using Taguchi method. Taguchi method is suitable for the experimental design and for the optimization of process variables for the dye removal.
Keywords Electro-oxidation; Taguchi design; colour removal; acid fast red; optimization
Introduction
Effluents discharged from textile industries have high intensity of colour, which leads to
pollution. Highly coloured wastewater can be treated by different methods such as biological
treatment, chemical coagulation, activated carbon adsorption, ultrafiltration, ozonation, wet
oxidation, photocatalysis, electrochemical methods etc. [1-5]. Among these methods the electro-
chemical treatment has been receiving greater attention in recent years due to its unique features
such as versatility, energy efficiency, automation and cost effectiveness [6]. The electrochemical
technique offers high removal efficiencies and the main reagent is the electron called ‘clean
reagent’ which degrades all the organics present in the effluent without generating any secondary
pollutant or by-product/sludge.
J. Electrochem. Sci. Eng. 4(4) (2014) 227-234 DYE REMOVAL USING TAGUCHI DESIGN
228
Industrial wastewaters have been treated by electro-oxidation techniques and the operating
parameters have been optimized by different techniques. The widely used technique is response
surface methodology for the experimental design and process optimization. Taguchi method is
another method in the experimental design, proposed by Genichi Taguchi, contains system design,
parameter design, and tolerance design. Taguchi method was effectively used to improve the
product or process effectiveness by using a loss function to attain the product quality in terms of
the parameter design [7]. Taguchi is the preferable technique among statistical experimental
design methods since it uses a special design of an orthogonal array to study the effective para-
meters with a minimum number of experiments. This method helps researchers to determine the
possible combinations of factors and identify the best combination. However, in industrial set-
tings, it is extremely costly to run a number of experiments to test all combinations. The parame-
ter design using Taguchi method minimizes the time and experimental runs. In the design, ‘signal’
and ‘noise’ (S/N) represent the desirable and undesirable values for the output characteristics,
respectively and the ratio is a measure of the quality characteristic deviating from the desired
value. Further an analysis of variance (ANOVA) is used to determine the significant parameters.
Recently Taguchi’s designs have been applied to various chemical and environmental
engineering studies for the experimental design and for the optimization of the process variables.
Asghari et al. [8] used Taguchi method to determine the optimum conditions for methylene blue
dye removal from aqueous solutions using electrocoagulation. The authors found that the amount
of electrolyte was the most significant parameter for the colour removal. Srivastava et al. [9] used
Taguchi method to determine the optimum conditions for the orange-G dye removal from
aqueous solution by electrocoagulation using iron plate electrodes. Author also applied this
methodology to optimize the process variables for the multi-component adsorption of metal ions
onto bagasse fly ash and rice husk ash [10]. Kaminari et al. [11] used Taguchi method to determine
the optimum condition of process variables and find the influencing parameters for the recovery
of heavy metals from acidified aqueous solutions using electrochemical reactor. Kim et al. [12]
optimized the experimental process variable using Taguchi technique for the nano-sized silver
particles production by chemical reduction method. In another study Mohammadi et al. [13] used
Taguchi method to determine the optimal experimental conditions for the separation of copper
ions from a solution. Moghaddam et al. [14] used Taguchi method to design the experimental runs
and optimize the parameters for the ammonium carbonate leaching of nonsulphide zinc ores.
Maria et al. [15] designed the experimental runs and optimized the process parameters using
Taguchi method for the adsorption of acid orange 7 dyes on guava seed. In that way Taguchi
method was used to study the electro oxidation of dye removal.
The objective of the present study is to treat the acid fast red dye using electro-oxidation. The
effect of experimental parameters such as initial dye concentration, reaction time, solution pH and
current density on colour removal was investigated using an L16 orthogonal array. The Taguchi
experimental design has been used to determine the optimum conditions for the maximum colour
removal of the dye from aqueous solutions.
Materials and Methods
All the chemicals used in this study were AR grade (Merck). Acid fast red was prepared by
dissolving definite quantity of dye in the distilled water. To increase the conductivity of the
solution of 1 mg L-1 NaCl was used as supporting electrolyte for all experimental runs. The initial
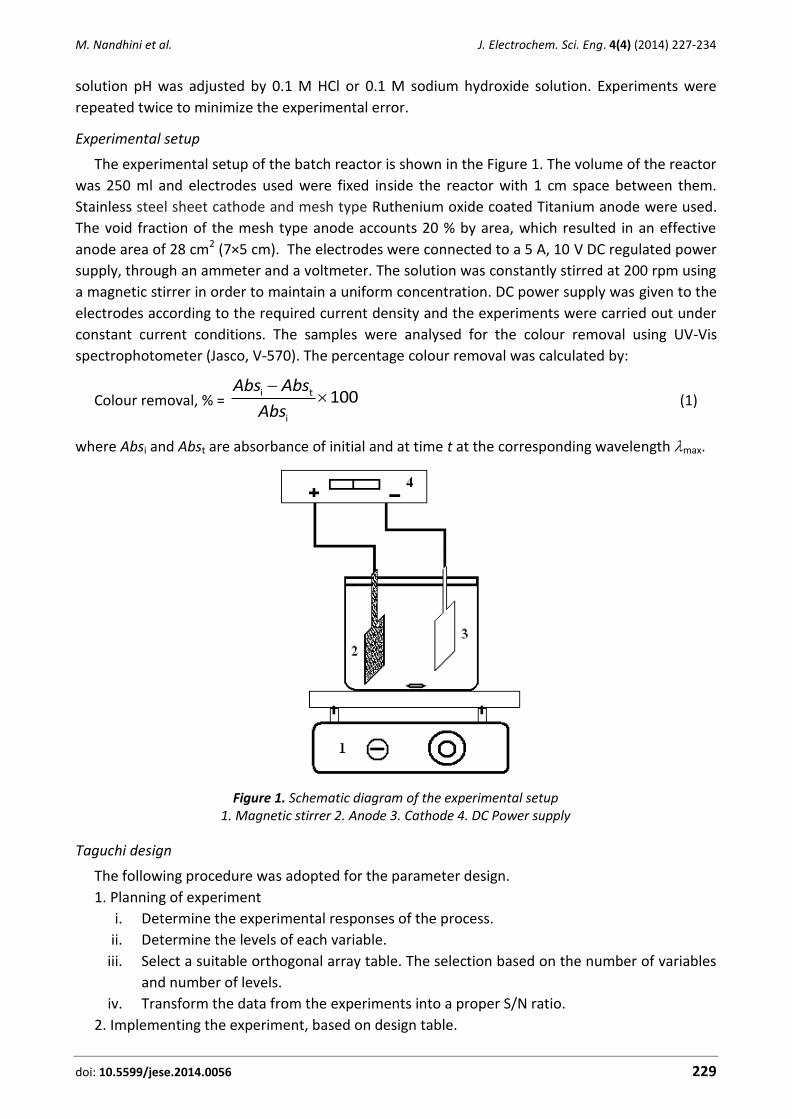
M. Nandhini et al. J. Electrochem. Sci. Eng. 4(4) (2014) 227-234
doi: 10.5599/jese.2014.0056 229
solution pH was adjusted by 0.1 M HCl or 0.1 M sodium hydroxide solution. Experiments were
repeated twice to minimize the experimental error.
Experimental setup
The experimental setup of the batch reactor is shown in the Figure 1. The volume of the reactor
was 250 ml and electrodes used were fixed inside the reactor with 1 cm space between them.
Stainless steel sheet cathode and mesh type Ruthenium oxide coated Titanium anode were used.
The void fraction of the mesh type anode accounts 20 % by area, which resulted in an effective
anode area of 28 cm2 (7×5 cm). The electrodes were connected to a 5 A, 10 V DC regulated power
supply, through an ammeter and a voltmeter. The solution was constantly stirred at 200 rpm using
a magnetic stirrer in order to maintain a uniform concentration. DC power supply was given to the
electrodes according to the required current density and the experiments were carried out under
constant current conditions. The samples were analysed for the colour removal using UV-Vis
spectrophotometer (Jasco, V-570). The percentage colour removal was calculated by:
Colour removal, % = i t
i
100Abs Abs
Abs
(1)
where Absi and Abst are absorbance of initial and at time t at the corresponding wavelength max.
Figure 1. Schematic diagram of the experimental setup
1. Magnetic stirrer 2. Anode 3. Cathode 4. DC Power supply
Taguchi design
The following procedure was adopted for the parameter design.
1. Planning of experiment
i. Determine the experimental responses of the process.
ii. Determine the levels of each variable.
iii. Select a suitable orthogonal array table. The selection based on the number of variables
and number of levels.
iv. Transform the data from the experiments into a proper S/N ratio.
2. Implementing the experiment, based on design table.
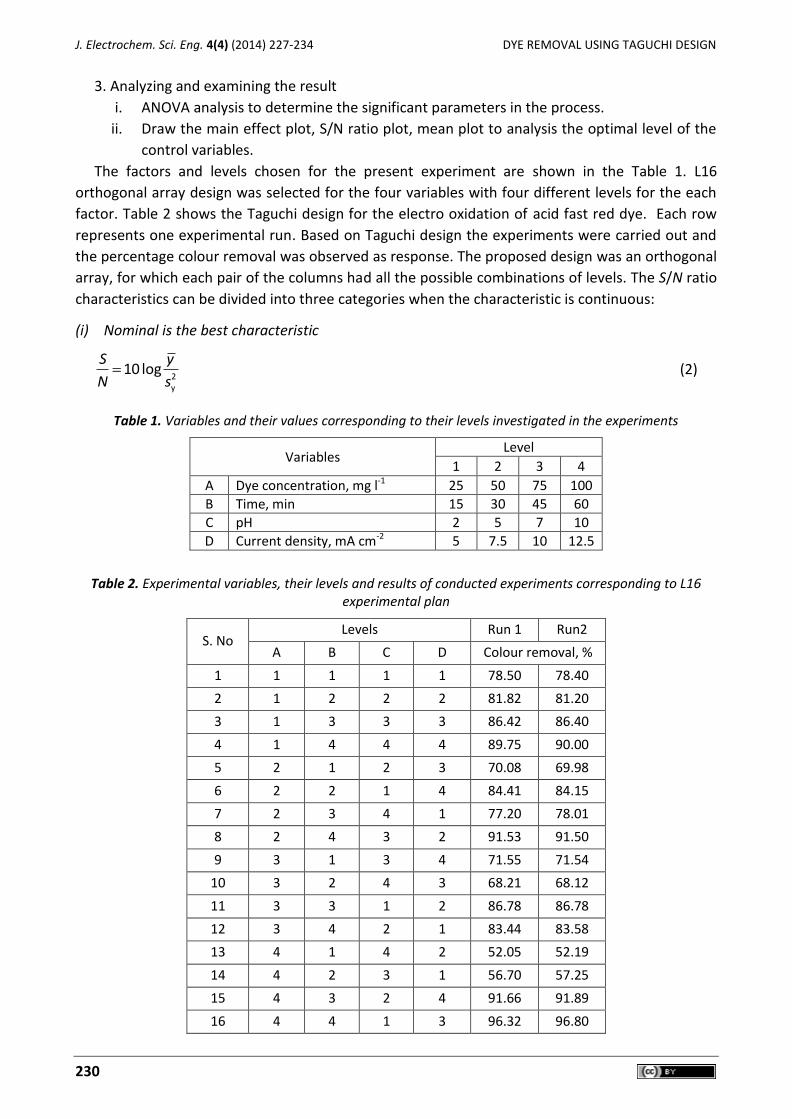
J. Electrochem. Sci. Eng. 4(4) (2014) 227-234 DYE REMOVAL USING TAGUCHI DESIGN
230
3. Analyzing and examining the result
i. ANOVA analysis to determine the significant parameters in the process.
ii. Draw the main effect plot, S/N ratio plot, mean plot to analysis the optimal level of the
control variables.
The factors and levels chosen for the present experiment are shown in the Table 1. L16
orthogonal array design was selected for the four variables with four different levels for the each
factor. Table 2 shows the Taguchi design for the electro oxidation of acid fast red dye. Each row
represents one experimental run. Based on Taguchi design the experiments were carried out and
the percentage colour removal was observed as response. The proposed design was an orthogonal
array, for which each pair of the columns had all the possible combinations of levels. The S/N ratio
characteristics can be divided into three categories when the characteristic is continuous:
(i) Nominal is the best characteristic
2y
10 logS y
N s (2)
Table 1. Variables and their values corresponding to their levels investigated in the experiments
Variables Level
1 2 3 4
A Dye concentration, mg l-1 25 50 75 100
B Time, min 15 30 45 60
C pH 2 5 7 10
D Current density, mA cm-2 5 7.5 10 12.5
Table 2. Experimental variables, their levels and results of conducted experiments corresponding to L16 experimental plan
S. No Levels Run 1 Run2
A B C D Colour removal, %
1 1 1 1 1 78.50 78.40
2 1 2 2 2 81.82 81.20
3 1 3 3 3 86.42 86.40
4 1 4 4 4 89.75 90.00
5 2 1 2 3 70.08 69.98
6 2 2 1 4 84.41 84.15
7 2 3 4 1 77.20 78.01
8 2 4 3 2 91.53 91.50
9 3 1 3 4 71.55 71.54
10 3 2 4 3 68.21 68.12
11 3 3 1 2 86.78 86.78
12 3 4 2 1 83.44 83.58
13 4 1 4 2 52.05 52.19
14 4 2 3 1 56.70 57.25
15 4 3 2 4 91.66 91.89
16 4 4 1 3 96.32 96.80
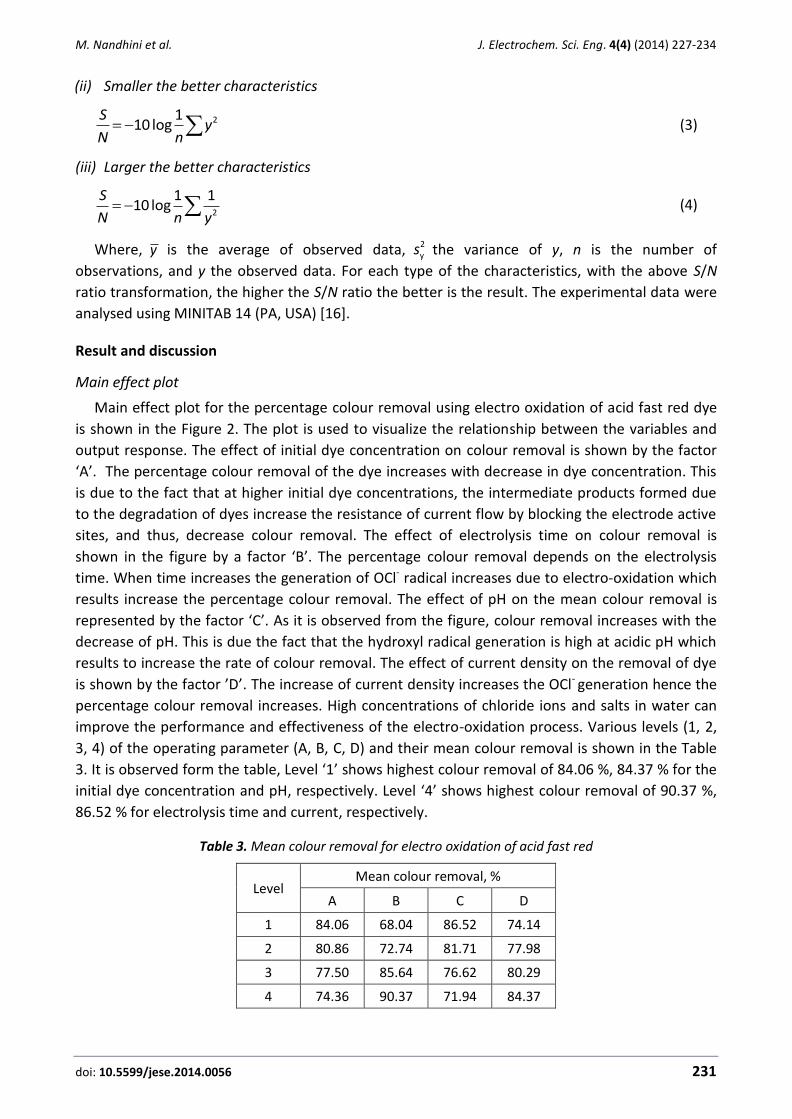
M. Nandhini et al. J. Electrochem. Sci. Eng. 4(4) (2014) 227-234
doi: 10.5599/jese.2014.0056 231
(ii) Smaller the better characteristics
2110 log
Sy
N n (3)
(iii) Larger the better characteristics
2
1 110 log
S
N n y (4)
Where, y is the average of observed data, 2ys the variance of y, n is the number of
observations, and y the observed data. For each type of the characteristics, with the above S/N
ratio transformation, the higher the S/N ratio the better is the result. The experimental data were
analysed using MINITAB 14 (PA, USA) [16].
Result and discussion
Main effect plot
Main effect plot for the percentage colour removal using electro oxidation of acid fast red dye
is shown in the Figure 2. The plot is used to visualize the relationship between the variables and
output response. The effect of initial dye concentration on colour removal is shown by the factor
‘A’. The percentage colour removal of the dye increases with decrease in dye concentration. This
is due to the fact that at higher initial dye concentrations, the intermediate products formed due
to the degradation of dyes increase the resistance of current flow by blocking the electrode active
sites, and thus, decrease colour removal. The effect of electrolysis time on colour removal is
shown in the figure by a factor ‘B’. The percentage colour removal depends on the electrolysis
time. When time increases the generation of OCl- radical increases due to electro-oxidation which
results increase the percentage colour removal. The effect of pH on the mean colour removal is
represented by the factor ‘C’. As it is observed from the figure, colour removal increases with the
decrease of pH. This is due the fact that the hydroxyl radical generation is high at acidic pH which
results to increase the rate of colour removal. The effect of current density on the removal of dye
is shown by the factor ’D’. The increase of current density increases the OCl- generation hence the
percentage colour removal increases. High concentrations of chloride ions and salts in water can
improve the performance and effectiveness of the electro-oxidation process. Various levels (1, 2,
3, 4) of the operating parameter (A, B, C, D) and their mean colour removal is shown in the Table
3. It is observed form the table, Level ‘1’ shows highest colour removal of 84.06 %, 84.37 % for the
initial dye concentration and pH, respectively. Level ‘4’ shows highest colour removal of 90.37 %,
86.52 % for electrolysis time and current, respectively.
Table 3. Mean colour removal for electro oxidation of acid fast red
Level Mean colour removal, %
A B C D
1 84.06 68.04 86.52 74.14
2 80.86 72.74 81.71 77.98
3 77.50 85.64 76.62 80.29
4 74.36 90.37 71.94 84.37

J. Electrochem. Sci. Eng. 4(4) (2014) 227-234 DYE REMOVAL USING TAGUCHI DESIGN
232
Figure 2. Main effect plot for the percentage colour removal of acid fast red
A: Dye concentration parameter; B: Time parameter; C: pH parameter; D: Current density parameter
Signal to noise (S/N) ratio
Taguchi method was used to identify the optimal conditions and most influencing parameters
on colour removal. In the Taguchi method, the terms ‘signal’ to ‘noise’ ratio represent the
desirable and undesirable values for the output response, respectively. The S/N ratios are different
according to the type of output response. In the present case, larger S/N ratio is better for high
colour removal. Figure 3 shows the S/N ratio of dye removal using electro-oxidation.
Figure 3. S/N ratio plot for the percentage colour removal of acid fast red .
A: Dye concentration parameter; B: Time parameter; C: pH parameter; D: Current density parameter
Mea
n c
olo
ur
rem
iva
l, %
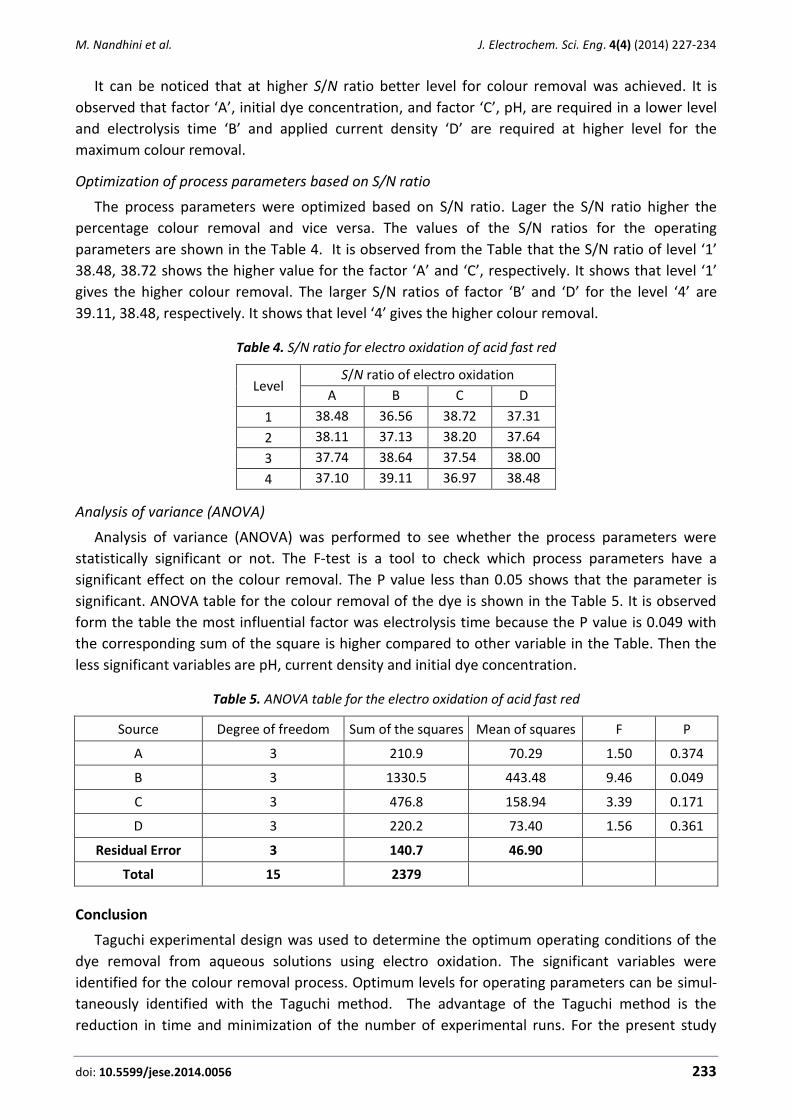
M. Nandhini et al. J. Electrochem. Sci. Eng. 4(4) (2014) 227-234
doi: 10.5599/jese.2014.0056 233
It can be noticed that at higher S/N ratio better level for colour removal was achieved. It is
observed that factor ‘A’, initial dye concentration, and factor ‘C’, pH, are required in a lower level
and electrolysis time ‘B’ and applied current density ‘D’ are required at higher level for the
maximum colour removal.
Optimization of process parameters based on S/N ratio
The process parameters were optimized based on S/N ratio. Lager the S/N ratio higher the
percentage colour removal and vice versa. The values of the S/N ratios for the operating
parameters are shown in the Table 4. It is observed from the Table that the S/N ratio of level ‘1’
38.48, 38.72 shows the higher value for the factor ‘A’ and ‘C’, respectively. It shows that level ‘1’
gives the higher colour removal. The larger S/N ratios of factor ‘B’ and ‘D’ for the level ‘4’ are
39.11, 38.48, respectively. It shows that level ‘4’ gives the higher colour removal.
Table 4. S/N ratio for electro oxidation of acid fast red
Level S/N ratio of electro oxidation
A B C D
1 38.48 36.56 38.72 37.31
2 38.11 37.13 38.20 37.64
3 37.74 38.64 37.54 38.00
4 37.10 39.11 36.97 38.48
Analysis of variance (ANOVA)
Analysis of variance (ANOVA) was performed to see whether the process parameters were
statistically significant or not. The F-test is a tool to check which process parameters have a
significant effect on the colour removal. The P value less than 0.05 shows that the parameter is
significant. ANOVA table for the colour removal of the dye is shown in the Table 5. It is observed
form the table the most influential factor was electrolysis time because the P value is 0.049 with
the corresponding sum of the square is higher compared to other variable in the Table. Then the
less significant variables are pH, current density and initial dye concentration.
Table 5. ANOVA table for the electro oxidation of acid fast red
Source Degree of freedom Sum of the squares Mean of squares F P
A 3 210.9 70.29 1.50 0.374
B 3 1330.5 443.48 9.46 0.049
C 3 476.8 158.94 3.39 0.171
D 3 220.2 73.40 1.56 0.361
Residual Error 3 140.7 46.90
Total 15 2379
Conclusion
Taguchi experimental design was used to determine the optimum operating conditions of the
dye removal from aqueous solutions using electro oxidation. The significant variables were
identified for the colour removal process. Optimum levels for operating parameters can be simul-
taneously identified with the Taguchi method. The advantage of the Taguchi method is the
reduction in time and minimization of the number of experimental runs. For the present study

J. Electrochem. Sci. Eng. 4(4) (2014) 227-234 DYE REMOVAL USING TAGUCHI DESIGN
234
level ‘1’ is best for initial dye concentration (25 g L-1) and initial pH (2), level ’4’ is best for
electrolysis time (60 min) and current density (12.5 mA cm-2) for the highest colour removal. It can
be concluded that Taguchi method is suitable for the experimental design and to optimize the
process variable for the colour removal of the dye effluent.
Acknowledgement: The authors are grateful to the SSN Trust for the financial support of this work.
References
[1] M. C. Gutierrez, M. Crespi, Journal of the Society of Dyers and Colorists 115 (1999) 342–345. [2] M. Panizza, G. Cerisola, Chemical Reviews 109 (2009) 6541–6569. [3] C. A. Martinez-Huitle, E. Brillas, Applied Catalysis B: Environmental 87 (2009) 105-145. [4] L. C. Davies, I. S. Pedro, J. M. Novais, S. Martins-Dias, Water Research 40 (2006) 2055 - 2063. [5] G. Chen, Separation & Purification Technology 38 (2004) 11–41. [6] F. C. Walsh, Pure and Applied Chemistry 73 (2001) 1819–1837. [7] J. A. Ghani, I. A. Choudhury, H. H. Hassan, Journal of Materials Processing Technology 145
(2004) 84–92. [8] A. Asghari, M. Kamalabadi, H. Farzinia, Chemical and Biochemical Engineering Quarterly 26
(2012) 145–154. [9] V. C. Srivastava, I. D. Mall, I. M. Mishra, Chemical Engineering Journal 140 (2008) 136–144
[10] V. C. Srivastava, I. D. Mall, I. M. Mishra, Industrial & Engineering Chemistry Research 46 (2007) 5697-5706.
[11] N. M. S. Kaminari, D. R. Schultz, M. J. J. S. Ponte, H. A. Ponte, C. E. B. Marino, A. C. Neto, Chemical Engineering Journal 126 (2007)139-146.
[12] K. D. Kim, D. N. Han, H. T. Kim, Chemical Engineering Journal 104 (2004) 55-61. [13] T. Mohammadi, A. Moheb, M. Sadrzadeh, A. Razmi, Desalination 169 (2004) 21-31. [14] J. Moghaddam, R. Sarraf-Mamoory, M. Abdollahy, Y. Yamini, Separation & Purification
Technology 51 (2006)157-164. [15] M. P. Elizalde-Gonzalez, V. Hernandez-Montoya, Journal of Hazardous Materials 168 (2009)
515–522. [16] K. Ravikumar, S. Ramalingam, S. Krishnan, K. Balu, Dyes and Pigments 70 (2006) 18-26.
© 2014 by the authors; licensee IAPC, Zagreb, Croatia. This article is an open-access article distributed under the terms and conditions of the Creative Commons Attribution license
(http://creativecommons.org/licenses/by/3.0/)
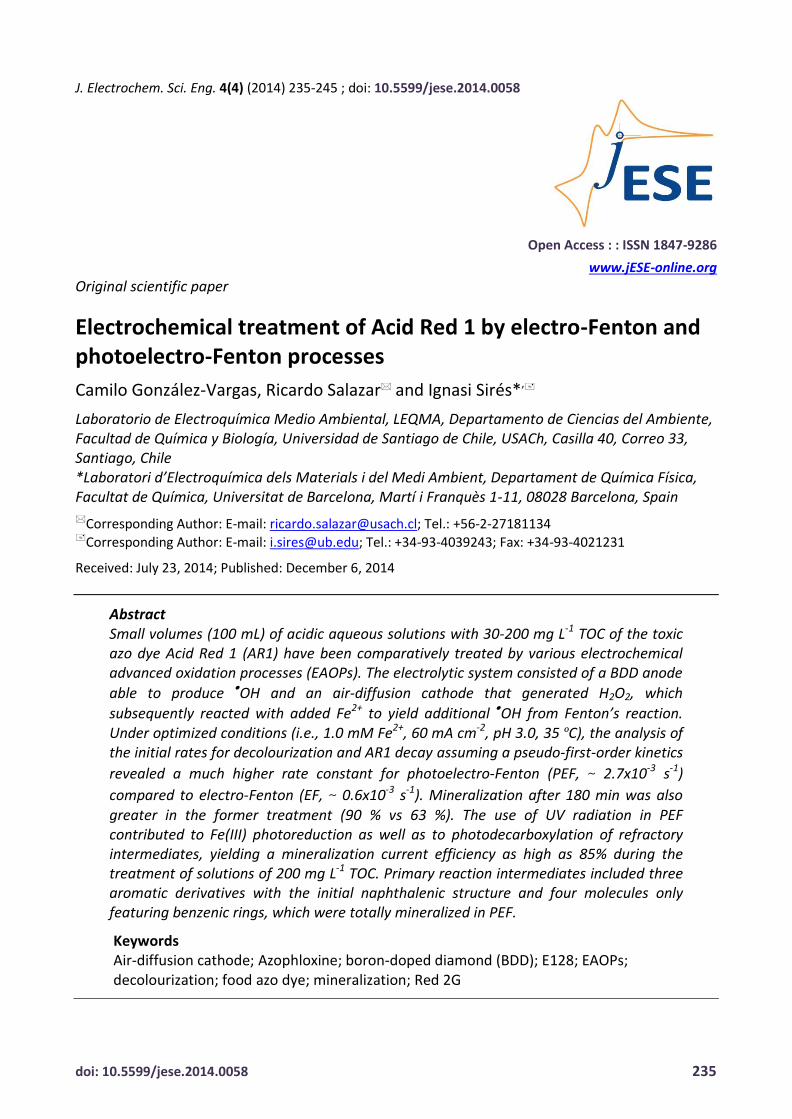
doi: 10.5599/jese.2014.0058 235
J. Electrochem. Sci. Eng. 4(4) (2014) 235-245 ; doi: 10.5599/jese.2014.0058
Open Access : : ISSN 1847-9286
www.jESE-online.org
Original scientific paper
Electrochemical treatment of Acid Red 1 by electro-Fenton and photoelectro-Fenton processes
Camilo González-Vargas, Ricardo Salazar and Ignasi Sirés*,
Laboratorio de Electroquímica Medio Ambiental, LEQMA, Departamento de Ciencias del Ambiente, Facultad de Química y Biología, Universidad de Santiago de Chile, USACh, Casilla 40, Correo 33, Santiago, Chile *Laboratori d’Electroquímica dels Materials i del Medi Ambient, Departament de Química Física, Facultat de Química, Universitat de Barcelona, Martí i Franquès 1-11, 08028 Barcelona, Spain
Corresponding Author: E-mail: [email protected]; Tel.: +56-2-27181134 Corresponding Author: E-mail: [email protected]; Tel.: +34-93-4039243; Fax: +34-93-4021231
Received: July 23, 2014; Published: December 6, 2014
Abstract Small volumes (100 mL) of acidic aqueous solutions with 30-200 mg L-1 TOC of the toxic azo dye Acid Red 1 (AR1) have been comparatively treated by various electrochemical advanced oxidation processes (EAOPs). The electrolytic system consisted of a BDD anode
able to produce OH and an air-diffusion cathode that generated H2O2, which
subsequently reacted with added Fe2+ to yield additional OH from Fenton’s reaction. Under optimized conditions (i.e., 1.0 mM Fe2+, 60 mA cm-2, pH 3.0, 35 ºC), the analysis of the initial rates for decolourization and AR1 decay assuming a pseudo-first-order kinetics
revealed a much higher rate constant for photoelectro-Fenton (PEF, ~ 2.7x10⁻³ s-1)
compared to electro-Fenton (EF, ~ 0.6x10⁻³ s-1). Mineralization after 180 min was also greater in the former treatment (90 % vs 63 %). The use of UV radiation in PEF contributed to Fe(III) photoreduction as well as to photodecarboxylation of refractory intermediates, yielding a mineralization current efficiency as high as 85% during the treatment of solutions of 200 mg L-1 TOC. Primary reaction intermediates included three aromatic derivatives with the initial naphthalenic structure and four molecules only featuring benzenic rings, which were totally mineralized in PEF.
Keywords Air-diffusion cathode; Azophloxine; boron-doped diamond (BDD); E128; EAOPs; decolourization; food azo dye; mineralization; Red 2G

J. Electrochem. Sci. Eng. 4(4) (2014) 235-245 ACID RED 1 BY ELECTRO-FENTON AND PHOTOELECTRO-FENTON
236
Introduction
In recent years, great attention has been paid to the electrochemical advanced oxidation
processes (EAOPs) based on Fenton’s reaction chemistry for water decontamination [1]. Among
them, electro-Fenton (EF) and photoelectro-Fenton (PEF) have been the most studied methods for
the treatment of waters polluted by organic pollutants such as pharmaceuticals [2-4], pesticides
[5-7] and synthetic dyes [8-11] due to their outstanding performance. In EF and PEF, H2O2 is
continuously electrogenerated in the reaction cell from the two-electron reduction of injected or
flushed gaseous O2 as follows [1]:
O2 + 2 H+ + 2 e → H2O2 (1)
The use of carbonaceous cathodes, particularly in the form of gas-diffusion electrodes (GDEs),
promotes the production of a high yield of H2O2 at high rate. Therefore, the current efficiency for
reaction (1) on GDEs turns out to be the highest among all tested materials. The activation of H2O2,
which is a weak oxidant, is achieved in the presence of a small amount of metal catalyst, especially
Fe2+, at pH around 3. Under such conditions, OH is produced in the bulk from Fenton’s reac-
tion (2) [1]:
Fe2+ + H2O2 → Fe3+ + OH + OH (2)
In PEF, the contaminated acidic solution is irradiated with artificial UV light, thus causing: (i) the
photoreduction of Fe(OH)2+, which is the main Fe3+ species at pH 3, via photo-Fenton’s reaction (3),
and (ii) the photodecarboxylation of some Fe(III)-carboxylate complexes, which are quite refractory
to oxidation by OH formed from Fenton’s reaction, via reaction (4) [1]. While reaction (3)
contributes to form additional OH as well as to maintain the Fenton’s cycle by continuously
regenerating Fe2+, reaction (4) makes it possible to reach great mineralization degrees.
Fe(OH)2+ + hν → Fe2+ + OH (3)
[Fe(OOCR)2+] + hν → Fe2+ + CO2 + R (4)
For some pollutants, the performance of EF and PEF can be further enhanced by using a large
O2-overpotential anode such as boron-doped diamond (BDD). This material favours the electro-
oxidation (EO) of the organic molecules by action of OH adsorbed on the anode surface via
reaction (5) [12]:
BDD + H2O → BDD(OH) + H+ + e (5)
Acid Red 1 (AR1, also called Amido Naphtol Red G, Red 2G, Food Red 10 or Azophloxine, see
chemical structure in Table 1) is a synthetic monoazo dye. Azo dyes constitute the most
comprehensive and varied family among all synthetic organic dyes available in the industry for
dyeing all kinds of fabrics [13]. Until 2007, AR1 was the preferred dye for baby food colouring due
to the resulting intense red colour, but the Scientific Panel of the European Food Safety Authority
(EFSA) on food additives, flavourings, processing aids and materials in contact with food was then
asked to re-evaluate this dye due to food safety concerns related to its high toxicity and
carcinogenic effects [14]. Based on this report, the European Union has agreed with its suspension
as food colouring, as published in the Official Journal [15]. Not surprisingly, it is also banned in
other countries outside Europe.
At present, it is known that AR1 is extensively metabolized to aniline, it may interfere with
blood haemoglobin and it is suspected of being a carcinogen [16]. It is therefore one of the dyes
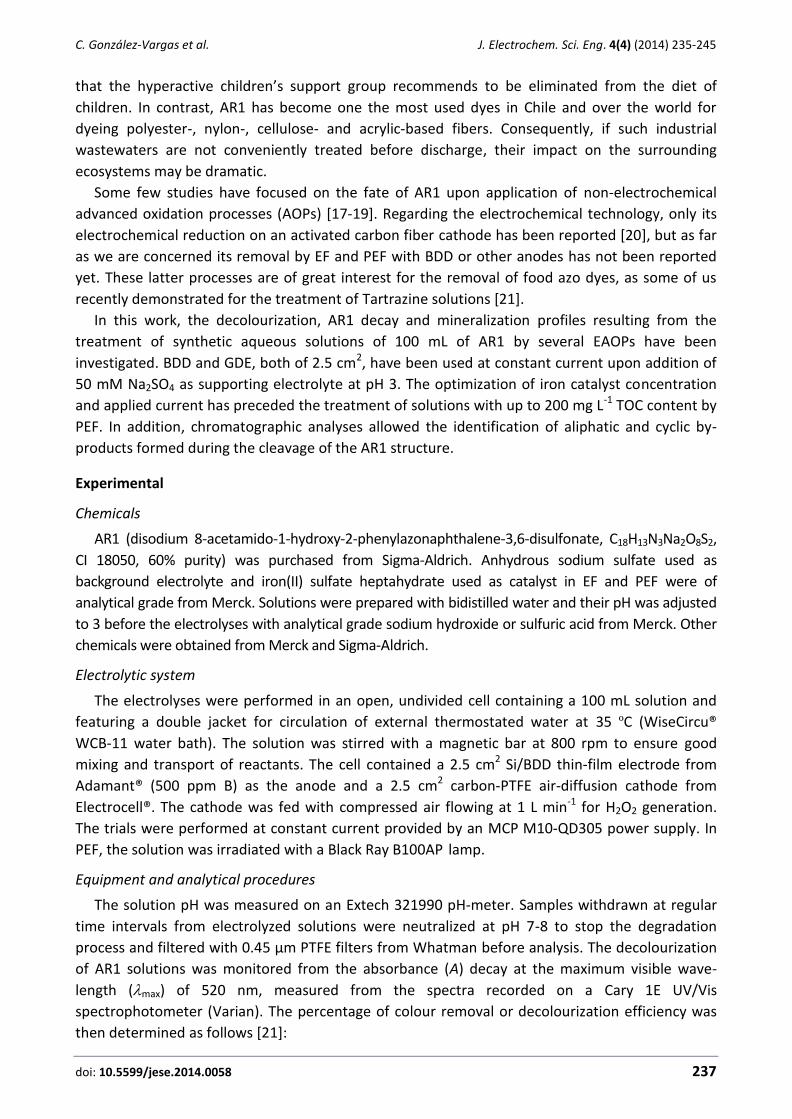
C. González-Vargas et al. J. Electrochem. Sci. Eng. 4(4) (2014) 235-245
doi: 10.5599/jese.2014.0058 237
that the hyperactive children’s support group recommends to be eliminated from the diet of
children. In contrast, AR1 has become one the most used dyes in Chile and over the world for
dyeing polyester-, nylon-, cellulose- and acrylic-based fibers. Consequently, if such industrial
wastewaters are not conveniently treated before discharge, their impact on the surrounding
ecosystems may be dramatic.
Some few studies have focused on the fate of AR1 upon application of non-electrochemical
advanced oxidation processes (AOPs) [17-19]. Regarding the electrochemical technology, only its
electrochemical reduction on an activated carbon fiber cathode has been reported [20], but as far
as we are concerned its removal by EF and PEF with BDD or other anodes has not been reported
yet. These latter processes are of great interest for the removal of food azo dyes, as some of us
recently demonstrated for the treatment of Tartrazine solutions [21].
In this work, the decolourization, AR1 decay and mineralization profiles resulting from the
treatment of synthetic aqueous solutions of 100 mL of AR1 by several EAOPs have been
investigated. BDD and GDE, both of 2.5 cm2, have been used at constant current upon addition of
50 mM Na2SO4 as supporting electrolyte at pH 3. The optimization of iron catalyst concentration
and applied current has preceded the treatment of solutions with up to 200 mg L-1 TOC content by
PEF. In addition, chromatographic analyses allowed the identification of aliphatic and cyclic by-
products formed during the cleavage of the AR1 structure.
Experimental
Chemicals
AR1 (disodium 8-acetamido-1-hydroxy-2-phenylazonaphthalene-3,6-disulfonate, C18H13N3Na2O8S2,
CI 18050, 60% purity) was purchased from Sigma-Aldrich. Anhydrous sodium sulfate used as
background electrolyte and iron(II) sulfate heptahydrate used as catalyst in EF and PEF were of
analytical grade from Merck. Solutions were prepared with bidistilled water and their pH was adjusted
to 3 before the electrolyses with analytical grade sodium hydroxide or sulfuric acid from Merck. Other
chemicals were obtained from Merck and Sigma-Aldrich.
Electrolytic system
The electrolyses were performed in an open, undivided cell containing a 100 mL solution and
featuring a double jacket for circulation of external thermostated water at 35 ºC (WiseCircu®
WCB-11 water bath). The solution was stirred with a magnetic bar at 800 rpm to ensure good
mixing and transport of reactants. The cell contained a 2.5 cm2 Si/BDD thin-film electrode from
Adamant® (500 ppm B) as the anode and a 2.5 cm2 carbon-PTFE air-diffusion cathode from
Electrocell®. The cathode was fed with compressed air flowing at 1 L min-1 for H2O2 generation.
The trials were performed at constant current provided by an MCP M10-QD305 power supply. In
PEF, the solution was irradiated with a Black Ray B100AP lamp.
Equipment and analytical procedures
The solution pH was measured on an Extech 321990 pH-meter. Samples withdrawn at regular
time intervals from electrolyzed solutions were neutralized at pH 7-8 to stop the degradation
process and filtered with 0.45 μm PTFE filters from Whatman before analysis. The decolourization
of AR1 solutions was monitored from the absorbance (A) decay at the maximum visible wave-
length (max) of 520 nm, measured from the spectra recorded on a Cary 1E UV/Vis
spectrophotometer (Varian). The percentage of colour removal or decolourization efficiency was
then determined as follows [21]:

J. Electrochem. Sci. Eng. 4(4) (2014) 235-245 ACID RED 1 BY ELECTRO-FENTON AND PHOTOELECTRO-FENTON
238
Colour removal, % = 0 t
0
100A A
A
(6)
where A0 and At denote the absorbance at initial time and after an electrolysis time t, respectively.
The mineralization of solutions was monitored from their total organic carbon (TOC)
abatement, determined on a Vario TOC Select analyzer. From these data, the mineralization
current efficiency (MCE) at a given current (I / A) and electrolysis time (t / h) were estimated as
follows [1]:
MCE, % = s exp
7
( )100
4.32 10
nFV TOC
mIt
(7)
where F is the Faraday constant (96487 C mol-1), Vs is the solution volume (L), ∆(TOC)exp is the
experimental TOC decay (mg L-1), 4.32107 is a conversion factor (3600 s h-1 12000 mg mol-1) and
m is the number of carbon atoms of AR1 (18 atoms). The number of electrons (n) consumed per
each dye molecule was taken as 98 considering that its mineralization leads to carbon dioxide and
nitrate and sulfate ions as follows:
C18H13N3Na2O8S2 + 45 H2O 18 CO2 + 3 NO3 + 2 SO4
2 + 2 Na+ + 103 H+ + 98 e (8)
AR1 decay was followed by reversed-phase high performance liquid chromatography (HPLC)
with a Waters 625 LC fitted with a Hibar® RP-18e 5 µm, 150 4 mm, column at 25 ºC and coupled
with a photodiode array detector set at = 520 nm. The mobile phase was a 70:30 (v/v) acetonitri-
le/1.0 mM ammonium acetate (pH 4) mixture at 0.5 mL min-1. Generated carboxylic acids were de-
tected by ion-exclusion HPLC using the same LC fitted with a Bio-Rad Aminex HPX 87H,
300 × 7.8 mm, column at 25 °C and setting the array detector at = 210 nm. The isocratic elution
at 0.6 mL min-1 with 4 mM H2SO4 as the mobile phase yielded good peaks for maleic (tr = 8.8 min),
oxamic (tr = 10.6 min), malic (tr = 11.3 min), formic (tr = 14.9 min) and acetic (tr = 16.1 min).
The cyclic and/or aromatic intermediates were analyzed by gas chromatography coupled to
mass spectrometry (GC-MS). Several electrolyses were carried out under different experimental
conditions for short and long times. The final solutions were collected together until reaching
500 mL, which were then extracted three times with 30 mL CH2Cl2. The resulting organic solution
(90 mL) was dried with anhydrous Na2SO4, then filtered and completely evaporated in a rotary to
obtain a pale yellow solid that was further analyzed.
Results and Discussion
Influence of the experimental parameters on the degradation of Acid Red 1 by EF process
Solutions containing 300 mg L-1 AR1 (i.e., 0.59 mM AR1 or 100 mg L-1 TOC) were electrolyzed at
60 mA cm-2 in the presence of different amounts of Fe2+ as catalyst. As can be seen in Fig. 1, the
absence of Fe2+ (so-called EO process) caused the slowest decolourization and TOC abatement,
only reaching 70 % colour removal after 70 min and 25 % TOC decay after 180 min. Under the
present EO conditions, given the weak oxidation power of H2O2, the organic matter can be mainly
degraded by BDD(OH) formed via reaction (5). This radical tends to be very active towards the
initial pollutants and their by-products because it is weakly physisorbed on the anode surface and
it is generated at a very positive potential. Moreover, it is known that hydroxyl radicals can react
at high rate with all double bonds in the aromatic rings and, especially, with the –N=N– bond.
However, since BDD(OH) is confined to the anode vicinity, the degradation process becomes
C. González-Vargas et al. J. Electrochem. Sci. Eng. 4(4) (2014) 235-245
doi: 10.5599/jese.2014.0058 239
severely limited by mass transport, thus being needed a much longer electrolysis time to
effectively destroy the molecules in a batch system without recirculation like the one tested here.
In contrast to the previous finding, within the same time period the presence of Fe2+ allowed
the complete decolourization as well as a greater mineralization in all cases, which can be account-
ed for by the crucial contribution of OH formed in the bulk from Fenton’s reaction (2). As can be
seen in Fig. 1a, the increase in Fe2+ concentration from 0.1 to 0.5 and then to 1.0 mM clearly
accelerated the colour removal, being necessary 70, 60 and 40 min, respectively, to get colourless
solutions.
Figure 1. Effect of Fe2+ concentration on (a) decolourization efficiency at 520 nm and
(b) TOC removal with electrolysis time for the electro-Fenton treatment of solutions of 300 mg L-1 AR1 in 0.05 M Na2SO4 at pH 3.0, 35 °C and 60 mA cm-2.
The rising catalyst content had a positive effect on the mineralization profiles as well, since 47,
54 and 63 % TOC removal was attained after 180 min using 0.1, 0.5 and 1.0 mM Fe2+. In contrast,
further increase to 1.5 mM was detrimental, eventually leading to slower colour removal and only
59 % TOC abatement at 180 min. This phenomenon can be mainly explained by the larger extent
of parasitic reactions causing the consumption of OH, particularly by Fe2+. It must be noted that
the mineralization was always partial, with a tendency to reach a plateau owing to the plausible
J. Electrochem. Sci. Eng. 4(4) (2014) 235-245 ACID RED 1 BY ELECTRO-FENTON AND PHOTOELECTRO-FENTON
240
accumulation of refractory intermediates (as confirmed later on) that could not be oxidized by OH
in the bulk and were very slowly destroyed by BDD(OH). In conclusion, 1.0 mM was chosen as the
optimum Fe2+ concentration for subsequent tests.
The effect of current density within the range 8-80 mA cm-2, carried out under conditions
shown in Fig. 1 with 1 mM Fe2+ as the optimized amount, is depicted in Fig. 2. These trials aimed at
exploring the possibility of enhancing the decolourization and mineralization kinetics, which is
based on the fact that the applied current determines the yield of BDD(OH) formed via reaction
(5) as well as that of OH via reaction (2) because it depends on the H2O2 formation rate and Fe2+
regeneration rate.
Figure 2. Effect of current density on (a) decolourization efficiency at 520 nm and (b) TOC
removal with electrolysis time for the electro-Fenton treatment of solutions of 300 mg L-1 AR1 in 0.05 M Na2SO4 with 1.0 mM Fe2+ at pH 3.0 and 35 ºC.
A progressive increase in current density from 8 to 60 mA cm-2 caused the acceleration of both,
decolourization and mineralization. This can be easily explained by the faster generation of
BDD(OH) on the anode and OH in the bulk. Note that even the lowest current densities were able
to yield the complete decolourization at long electrolysis time. However, further increase to
80 mA cm-2 was detrimental since it caused a slower colour removal and led to a lower TOC
C. González-Vargas et al. J. Electrochem. Sci. Eng. 4(4) (2014) 235-245
doi: 10.5599/jese.2014.0058 241
removal. This negative effect arises from the shift in cathode potential to unfavourable values that
promoted the reduction of O2 to H2O over reaction (1) and hindered the conversion of Fe3+ to Fe2+.
As a matter of fact, H2O2 concentration analyzed during the electrolyses at 60 and 80 mA cm-2
reached 25 mM and 15 mM, respectively. Thus, 60 mA cm-2 was chosen as the optimum value.
Effect of UVA light
As discussed in the Introduction, for most of the contaminated solutions studied in the past it
was possible to enhance the degradation process by irradiating them with UV light, which
favoured the oxidation of pollutants and their by-products due to the action of reaction (3) and
(4). In the present study, no direct photolysis of AR1 by UV light was observed, since its peak
during the HPLC analyses remained unchanged. This ensured the photostability of AR1 during the
electrolyses run under PEF conditions. For this purpose, the AR1 solutions were treated as done in
the previous EF experiments but incorporating the UV lamp near the cell.
As shown in Fig. 3a, solutions of 300 mg L-1 AR1 treated by PEF under the optimized conditions
described before (i.e., 1.0 mM Fe2+ and 60 mA cm-2) were more quickly decolourized compared to
EF trials, being required 50 min instead of 60 min to become colourless (see Fig. 1a for
comparison). The key contribution of photoreduction reaction (3) favoured the faster regeneration
of Fe2+, which then was able to accelerate the production of OH from reaction (2). On the other
hand, PEF also yielded a much larger mineralization after 180 min, reaching 90 % owing to
photodecarboxylation reaction (4). As reported elsewhere [1], some of the reaction intermediates
can form stable complexes with Fe(III) that can be effectively degraded only upon action of UV
photons since OH and BDD(OH) are much less effective. Fig. 3a also depicts the decay of AR1
monitored by HPLC during the same experiment. Its profile is quite similar to colour removal
profile, which means that no other coloured by-products were formed during the treatment.
Assuming a pseudo-first-order kinetics, an apparent rate constant (kapp) of 2.74×10⁻³ s-1 for AR1
decay was determined. The decay of the dye was also similar to the colour removal trend for EF
treatment (not shown), revealing a much smaller kapp = 0.59×10⁻³ s-1. Therefore, the beneficial
synergy between OH, BDD(OH) and UV light for the decontamination of AR1 solutions is
demonstrated.
Due to production needs, actual wastewaters may present a significant variation in the dye
content over time and thus, it is mandatory that the water treatment technology is flexible enough
to be adapted to such changes. The effect of AR1 concentration on the mineralization profile vs.
time is shown in Fig. 3b. A similar TOC removal was attained after 180 min for solutions containing
30 and 100 mg L-1 TOC. In contrast, only 75 % mineralization was reached for solutions with
200 mg L-1 TOC, which is simply due to the much larger number of organic molecules to be
degraded in the latter case. But, an important feature to be highlighted is the progressively
increasing slope of the curves (i.e., larger mineralization rate) upon increase of AR1 concentration,
which can be related to the more efficient reaction between OH/BDD(OH) and the organic
molecules. Indeed, low AR1 concentrations cause the waste of radicals in self-destruction and
other side reactions, whereas high organic contents lead to effective oxidation reactions. This is
clearly demonstrated in Fig. 3c, which compares the evolution of MCE vs time for several EAOPs.
For solutions with 100 mg L-1 TOC, the efficiency increases in the sequence EO < EF < PEF, with
maximum values of 10, 25 and 55 %, respectively. As discussed before, this can be related to the
more favorable synergy between different oxidants in the case of PEF. In addition, a greater MCE
resulted from the treatment of larger AR1 concentrations in PEF, reaching 85 % during the

J. Electrochem. Sci. Eng. 4(4) (2014) 235-245 ACID RED 1 BY ELECTRO-FENTON AND PHOTOELECTRO-FENTON
242
treatment of 200 mg L-1 TOC, thus confirming the lower extent of parasitic reactions that cause
radical waste. Note that MCE tends to decrease at long electrolyses time, which can be explained
by (i) the formation of more resistant intermediates and (ii) the mass transport limitations related
to low organic loads.
Figure 3. (a) Decolourization efficiency at 520 nm and percentage of AR1 removal with
electrolysis time for the photoelectro-Fenton treatment of solutions of 300 mg L-1 AR1 in 0.05 M Na2SO4 with 1.0 mM Fe2+ at pH 3.0, 35 °C and 60 mA cm-2. (b) TOC abatement vs. time for the same experiment compared to trials at different AR1 concentrations. (c) MCE for trials shown in (b) compared to EO (0 mM Fe2+) and EF (1.0 mM Fe2+) treatments shown in Fig. 1b.

C. González-Vargas et al. J. Electrochem. Sci. Eng. 4(4) (2014) 235-245
doi: 10.5599/jese.2014.0058 243
Identification of reaction intermediates
Table 1 summarizes the seven aromatic intermediates identified during PEF treatments.
Table 1. Structures of Acid Red 1 and its degradation intermediates identified by GC-MS analysis.
Chemical name Structure m/z
Acid Red 1
509.42
Naphthalene derivatives
Disodium 8-acetamido-1-hydroxy-2-(4-hydroxyphenylazo)naphthalene-3,6-disulfonate
524.12
Disodium 1,2-dihydroxy-3-phenylazonaphthalene-4,7-disulfonate
468.37
(5-Phenylazo-3,4,6-trihydroxynaphthalene)sulfonic acid
362.33
Benzene derivatives
Sodium (3,5-dihydroxy-2-phenylazo)benzenesulfonate
316.26
Sodium (1-hydroxy-2-[4-hydroxyphenylazo]-2-oxo)ethanesulfonate
282.21
2-(3,5-dihydroxyphenylazo)-1-hydroxy-2-oxo-ethanesulfonic acid
276.22
Hydroquinone
110.11

J. Electrochem. Sci. Eng. 4(4) (2014) 235-245 ACID RED 1 BY ELECTRO-FENTON AND PHOTOELECTRO-FENTON
244
As can be seen, OH and BDD(OH) led to the hydroxylation of the benzenic and naphthalenic
rings of AR1 to yield three naphthalene derivatives. The subsequent action of radicals onto AR1
and/or onto those intermediates led to the formation of four benzene derivatives. The
accumulation of these aromatic intermediates would be dangerous due to their inherent high
toxicity and thus, PEF treatments had to be prolonged until their complete disappearance.
The progressive cleavage and oxidation of the aromatic intermediates gave rise to the
formation of short-chain aliphatic carboxylic acids, as also described elsewhere for other
pollutants [22]. Five C1-C4 acids were identified by ion-exclusion HPLC, namely maleic, oxamic,
malic, formic and acetic. As explained from Fig. 3, PEF ensured the almost complete removal of all
these acids since the TOC in the final solutions was <10 % after 180 min.
Conclusions
PEF technology is confirmed as a very powerful alternative for giving response to environmental
concerns related to water contamination by organic pollutants. This process allows a much faster
destruction of AR1 as well as a more significant and efficient TOC removal compared to EO and EF,
thus becoming a promising technology for the treatment of industrial wastewaters containing this
azo dye. The toxic intermediates formed during the first degradation stages are completely
transformed into aliphatic molecules, which are slowly converted to CO2 and H2O. The use of
renewable energy such us sunlight in sunny countries like Chile and Spain, giving rise to the so-
called solar photoelectro-Fenton (SPEF) process, would be an interesting feature for real-scale
application.
Acknowledgements: The authors thank CONICYT (Chile) for support under FONDECYT grant 1130391 and DICYT-USACh, as well as for the PhD fellowship N° 21130071 awarded to C. González-Vargas.
References
[1] E. Brillas, I. Sirés, M. A. Oturan, Chemical Reviews 109 (2009) 6570–6631 [2] A. Dirany, S. Efremova Aaron, N. Oturan, I. Sirés, M. A Oturan, J. J. Aaron, Analytical and
Bioanalytical Chemistry 400 (2011) 353–360 [3] A. El-Ghenymy, N. Oturan, M. A. Oturan, J.A. Garrido, P. L. Cabot, F. Centellas, R. M.
Rodríguez, E. Brillas, Chemical Engineering Journal 234 (2013) 115–123 [4] S. Loaiza-Ambuludi, M. Panizza, N. Oturan, A. Özcan, M. A. Oturan, Journal of
Electroanalytical Chemistry 702 (2013) 31–36 [5] N. Oturan, M. Zhou, M. A. Oturan, Journal of Physical Chemistry A 114 (2010) 10605–10611 [6] R. Salazar, M. S. Ureta-Zañartu, Water Air Soil Pollution 223 (2012) 4199–4207 [7] J. Urzúa, C. González-Vargas, F. Sepúlveda, M. S. Ureta-Zañartu, R. Salazar, Chemosphere 93
(2013) 2774–2781 [8] M. Zhou, Q. Yu, L. Lei, Dyes and Pigments 77 (2008) 129–136 [9] M. Panizza, M. A. Oturan, Electrochimica Acta 56 (2011) 7084–7087
[10] E. J. Ruiz , A. Hernández-Ramírez, J. M. Peralta-Hernández, C. Arias, E. Brillas, Chemical Engineering Journal 171 (2011) 385–392
[11] R. Salazar, E. Brillas, I. Sirés, Applied Catalysis B: Environmental 115-116 (2012) 107–116 [12] M. Panizza, G. Cerisola, Chemical Reviews 109 (2009) 6541–6569 [13] C. A. Martínez-Huitle, E. Brillas, Applied Catalysis B: Environmental 87(2009) 105–145 [14] European Food Safety Authority, The EFSA Journal 515 (2007) 1-28

C. González-Vargas et al. J. Electrochem. Sci. Eng. 4(4) (2014) 235-245
doi: 10.5599/jese.2014.0058 245
[15] Official Journal of the European Union L 195/8, 27.7.2007. Commission regulation (EC) No 884/2007 of July 2007 on emergency measures suspending the use of E 128 Red 2G as food colour
[16] A. F. Villa , F. Conso, EMC - Toxicologie-Pathologie 1 (2004) 161-177 [17] Cs. M. Földváry, L. Wojnárovits, Radiation Physics and Chemistry 78 (2009) 13–18 [18] N. K. Daud, M.A. Ahmad, B.H. Hameed, Chemical Engineering Journal 165 (2010) 111–116 [19] S. Thomas, R. Sreekanth, V. A. Sijumon, U. K. Aravind, C. T. Aravindakumar, Chemical
Engineering Journal 244 (2014) 473–482 [20] Z. Shen, W. Wang, J. Jia, J. Ye, X. Feng, A. Peng, Journal of Hazardous Materials B84 (2001)
107–116. [21] A. Thiam, M. Zhou, E. Brillas, I. Sirés, Applied Catalysis B: Environmental 150-151(2014)
116–125 [22] M. A. Oturan, M. Pimentel, N. Oturan, I. Sirés, Electrochimica Acta 54 (2008) 173–182
© 2014 by the authors; licensee IAPC, Zagreb, Croatia. This article is an open-access article distributed under the terms and conditions of the Creative Commons Attribution license
(http://creativecommons.org/licenses/by/3.0/)

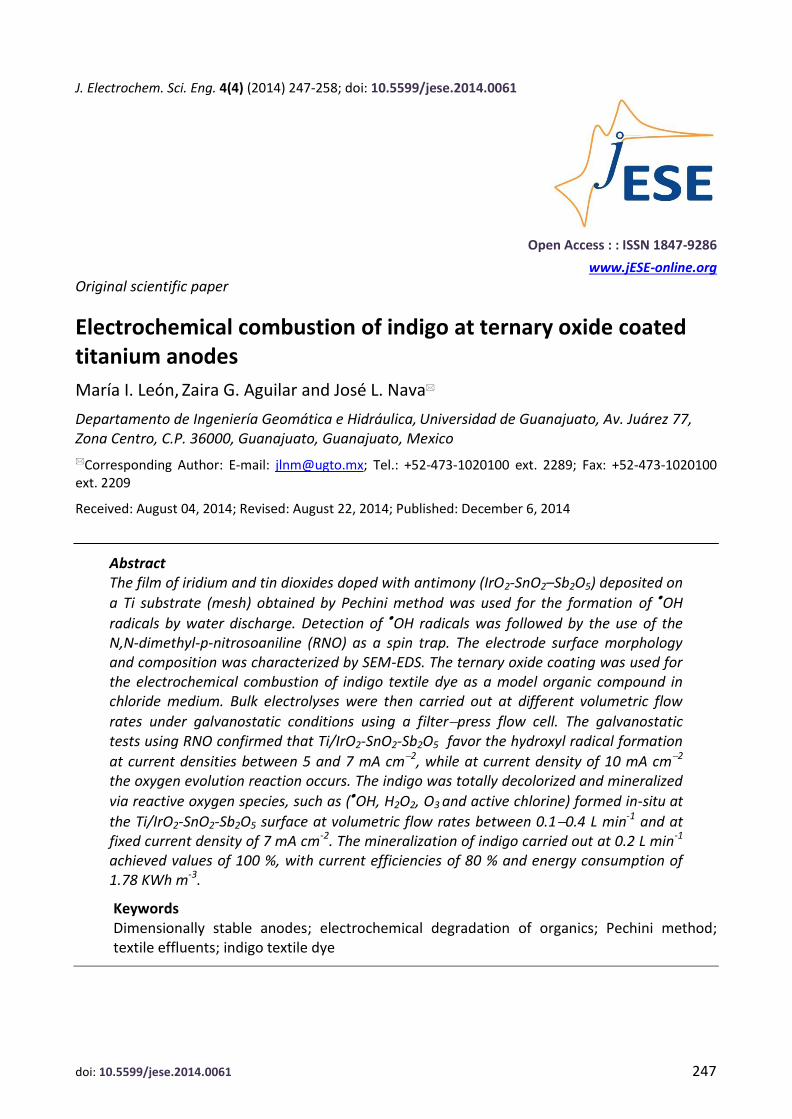
doi: 10.5599/jese.2014.0061 247
J. Electrochem. Sci. Eng. 4(4) (2014) 247-258; doi: 10.5599/jese.2014.0061
Open Access : : ISSN 1847-9286
www.jESE-online.org
Original scientific paper
Electrochemical combustion of indigo at ternary oxide coated titanium anodes
María I. León, Zaira G. Aguilar and José L. Nava
Departamento de Ingeniería Geomática e Hidráulica, Universidad de Guanajuato, Av. Juárez 77, Zona Centro, C.P. 36000, Guanajuato, Guanajuato, Mexico
Corresponding Author: E-mail: [email protected]; Tel.: +52-473-1020100 ext. 2289; Fax: +52-473-1020100 ext. 2209
Received: August 04, 2014; Revised: August 22, 2014; Published: December 6, 2014
Abstract The film of iridium and tin dioxides doped with antimony (IrO2-SnO2–Sb2O5) deposited on
a Ti substrate (mesh) obtained by Pechini method was used for the formation of OH
radicals by water discharge. Detection of OH radicals was followed by the use of the N,N-dimethyl-p-nitrosoaniline (RNO) as a spin trap. The electrode surface morphology and composition was characterized by SEM-EDS. The ternary oxide coating was used for the electrochemical combustion of indigo textile dye as a model organic compound in chloride medium. Bulk electrolyses were then carried out at different volumetric flow
rates under galvanostatic conditions using a filterpress flow cell. The galvanostatic tests using RNO confirmed that Ti/IrO2-SnO2-Sb2O5 favor the hydroxyl radical formation
at current densities between 5 and 7 mA cm2, while at current density of 10 mA cm2 the oxygen evolution reaction occurs. The indigo was totally decolorized and mineralized
via reactive oxygen species, such as (OH, H2O2, O3 and active chlorine) formed in-situ at
the Ti/IrO2-SnO2-Sb2O5 surface at volumetric flow rates between 0.10.4 L min-1 and at fixed current density of 7 mA cm-2. The mineralization of indigo carried out at 0.2 L min-1 achieved values of 100 %, with current efficiencies of 80 % and energy consumption of 1.78 KWh m-3.
Keywords Dimensionally stable anodes; electrochemical degradation of organics; Pechini method; textile effluents; indigo textile dye

J. Electrochem. Sci. Eng. 4(4) (2014) 247-258 ELECTROCHEMICAL COMBUSTION OF INDIGO TEXTILE DYE
248 248
Introduction
Textile processing industries nowadays are widespread sectors in many countries. This industry
is one of the most polluting industries in terms of the volume, color and complexity of its effluent
discharge. Textile effluents include dyes that have a complex chemical structure, which most of
the time are disposed on municipal sewers or into surface waters. Residual textile dyes tend to be
transformed into toxic aromatic amines which cannot be degraded by sunlight and, once in the
environment, they exhibit recalcitrant properties [1-3].
Electrochemical incineration [4-10] is a technique that has been found adequate for the
treatment of colored wastewaters. It is important to point out that several color degradation
studies mention systems with platinum electrodes [7] and dimensionally stable anodes (DSA) [6,8],
which have shown mineralization of 50-70 %. Dogan and Turkdemir [7] consider that mineraliza-
tion of indigo dye on Pt is induced by by-products of water and chloride discharge on the platinum
surface; however, the indigo achieved mineralization of 60 %. Similar results in the degradation of
acid red 29 [11], reactive blue 19 [8], mediated by active chlorine (given by the mixture of chlorine
(Cl2), hypochlorous acid (HOCl) and hypochlorite ion (OCl-)), produced on DSA lead to mineraliza-
tion of 56 % and 70 %, respectively. BDD electrodes exhibit a superior performance, since a large
amount of hydroxyl radicals (OH) are formed by water oxidation on the BDD surface [5-6,12-13],
achieving 100 % efficiency in color removal and mineralization. The main problem encountered
with BDD electrode is its high price limiting its industrial application.
For the above it is necessary to develop a DSA of metal oxides as an alternative to oxidize
recalcitrant organic matter similar to a BDD electrode, in other words to produce DSA(OH)
capable to oxidize recalcitrant organic matter. Comninellis and coworkers have developed a DSA
electrode of SnO2–Sb2O5 with an interlayer between supports (Ti) of IrO2 by the spray pyrolysis
technique, capable to produce hydroxyl radicals physisorbed on DSA (Eq. 1), by water dischar-
ge [14]. The interlayer of IrO2 improves useful life of the electrode. These authors put on evidence
that the physisorbed hydroxyl radical DSA(OH) cause predominantly the complete combustion of
organics (R), Eq. (2); for example, these authors demonstrated that DSA(OH) reacts with
p-clorophenol leading to complete combustion. On such electrode, IrO2 acts as a catalyst, SnO2
acts as a dispersing agent and Sb2O5 as a doping agent. Such ternary electrodes are among the
best electrocatalysts for O2 evolution, being able to produce physisorbed hydroxyl radicals on their
surface from water discharge. The high catalytic activity of this ternary oxide electrode has been
recently reported for the electrochemical oxidation of other organic compounds [15,16]. Another
paper by Comninellis put on evidence the convenience of using Ti/SnO2 to oxidize phenol matter
via OH radicals adsorbed onto Ti/SnO2 [17]. However, the main problem encountered with the
Ti/SnO2 anode is its low stability under anodic polarization, which is not the case of the SnO2–
Sb2O5 coating having an IrO2 interlayer between the Ti substrate [18].
-2DSA H O DSA( OH) H 1e (1)
-z 2R DSA( OH) CO zH ze DSA (2)
In a previous paper carried out by our group a film of iridium and tin dioxides doped with
antimony oxide (IrO2-SnO2–Sb2O5) was deposited onto Ti substrate mesh and plate by the Pechini
method [19]. The ternary oxide coating was used for the anodic decolorization of methyl orange
(MO) azo dye via reactive oxygen species, such as (OH, H2O2 and O3) formed in-situ from water

M. I. León et al. J. Electrochem. Sci. Eng. 4(4) (2014) 247-258
doi: 10.5599/jese.2014.0061 249
oxidation at the Ti/IrO2-SnO2-Sb2O5 surface. However, in that paper we did not follow the
formation of OH at DSA surface and the electrochemical combustion of organic matter.
The indirect technique for the detection and identification of low concentration of OH radicals
formed by water discharge at the oxide anodes involves trapping of the OH radical by an addition
reaction (spin trap) to produce a more stable radical (spin adduct). A number of OH radical spin
traps are available in the literature but N,N-dimethyl-p-nitrosoaniline (RNO) has demonstrated to
be effective owing to the selective reaction of RNO with OH radicals, the high rate of the reaction
with OH radicals (k = 1.2×10⁴ M1 s1) and the ease of application as one merely observes the
bleaching of the sensitive absorption band at 440 nm [17, 20].
The goal of this manuscript is to prepare a film of iridium and tin dioxides doped with antimony
(IrO2-SnO2–Sb2O5) onto titanium mesh (expanded metal) to produce OH radicals via water
discharge for the electrochemical combustion of indigo textile dye (which resembles a denim
laundry industrial wastewater). Bulk electrolyses were then carried out at different mean linear
flow velocities and at constant current density using a filterpress flow cell. The integral current
efficiency and the energy consumption of electrolysis were estimated. The detection of OH
radicals formed by water discharge at the oxide anode using RNO as spin trap was also examined.
Experimental
Indigo dye solution was 1 mM indigo textile dye (536 ppm COD) in 0.05 M NaCl (which resem-
bles a denim laundry industrial wastewater). The resulting solution exhibited a conductivity of
5.78 mS cm-1, and a pH of 6.3 at 298 K. The solution was deoxygenated with nitrogen for about
10 minutes before each experiment. All the chemicals employed in this work were reactive grade.
Equipment
A potentiostat-galvanostat model SP-150 coupled to a booster model VMP-3 (20V-10A) both
from Bio-LogicTM with EC-Lab® software were used for the electrolysis experiments. The potentials
were measured versus a saturated calomel reference electrode (SCE), Bio-Logic model
002056RE-2B. All electrode potentials shown in this work are presented with regard to a standard
hydrogen electrode (SHE).
COD analyses were performed using a dry-bath (Lab Line Model 2008), and a Genesys 20 spec-
trophotometer. Chloride volumetric titrations were confirmed by potentiometric measurements
using a silver wire and a SCE, which was inserted in a glassy titration cell. The potential differences
between silver wire and SCE were detected by a high impedance multimeter (Agilent-mo-
del-34401A). The colour removal was registered using a visible spectrophotometer (Genesys 20).
Microelectrolysis experiments
A 100-mL Pyrex electrochemical cell, with a three electrode system and nitrogen inlet was used
for the construction of the anodic polarization curves. The working electrode was
mesh-(IrO2-SnO2–Sb2O5) with 1 cm2 geometric area exposed to the electrolyte. The potentials
were measured vs. SCE and the counter electrode was a glassy carbon. All the potential measure-
ments shown in this work are presented with regard to standard hydrogen electrode (SHE).
A divided cell made of two compartment quartz cells of 3 mL capacity each one for the indirect
detection of OH radicals was used. The anode was in the form of plate (1 cm2) and the cathode
was a vitreous carbon rod (1 cm2). A home-made salt bridge to connect both semi-cells was
employed; this was fabricated with vitreous Pyrex tube of 2 mm diameter sealed with Pt at the
ends; this bridge was filled with phosphate buffer (pH 7.4). The quartz cell used as the anodic
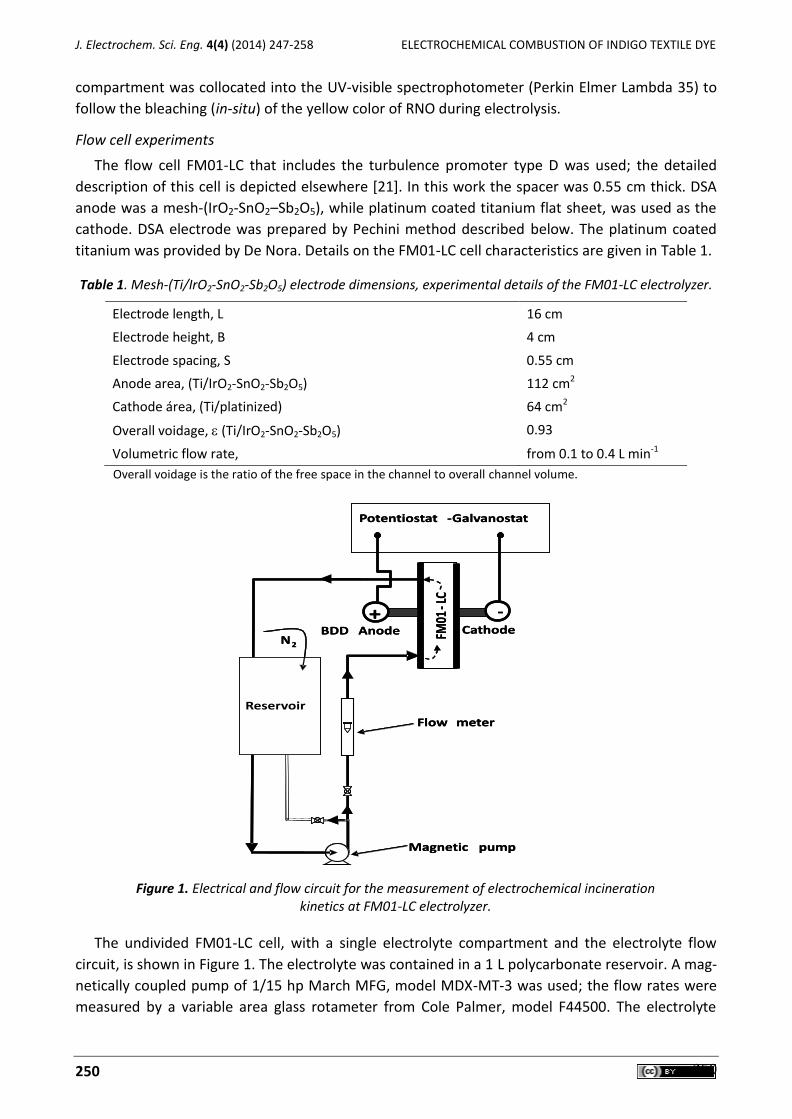
J. Electrochem. Sci. Eng. 4(4) (2014) 247-258 ELECTROCHEMICAL COMBUSTION OF INDIGO TEXTILE DYE
250 250
compartment was collocated into the UV-visible spectrophotometer (Perkin Elmer Lambda 35) to
follow the bleaching (in-situ) of the yellow color of RNO during electrolysis.
Flow cell experiments
The flow cell FM01-LC that includes the turbulence promoter type D was used; the detailed
description of this cell is depicted elsewhere [21]. In this work the spacer was 0.55 cm thick. DSA
anode was a mesh-(IrO2-SnO2–Sb2O5), while platinum coated titanium flat sheet, was used as the
cathode. DSA electrode was prepared by Pechini method described below. The platinum coated
titanium was provided by De Nora. Details on the FM01-LC cell characteristics are given in Table 1.
Table 1. Mesh-(Ti/IrO2-SnO2-Sb2O5) electrode dimensions, experimental details of the FM01-LC electrolyzer.
Electrode length, L 16 cm
Electrode height, B 4 cm
Electrode spacing, S 0.55 cm
Anode area, (Ti/IrO2-SnO2-Sb2O5) 112 cm2
Cathode área, (Ti/platinized) 64 cm2
Overall voidage, (Ti/IrO2-SnO2-Sb2O5) 0.93
Volumetric flow rate, from 0.1 to 0.4 L min-1
Overall voidage is the ratio of the free space in the channel to overall channel volume.
Figure 1. Electrical and flow circuit for the measurement of electrochemical incineration kinetics at FM01-LC electrolyzer.
The undivided FM01-LC cell, with a single electrolyte compartment and the electrolyte flow
circuit, is shown in Figure 1. The electrolyte was contained in a 1 L polycarbonate reservoir. A mag-
netically coupled pump of 1/15 hp March MFG, model MDX-MT-3 was used; the flow rates were
measured by a variable area glass rotameter from Cole Palmer, model F44500. The electrolyte
+ -
Flow meter
Magnetic pump
BDD Anode CathodeN2
FM01
- LC
Reservoir
Potentiostat -Galvanostat
+ -
Flow meter
Magnetic pump
BDD Anode CathodeN2
FM01
- LC
Reservoir
Potentiostat -Galvanostat
M. I. León et al. J. Electrochem. Sci. Eng. 4(4) (2014) 247-258
doi: 10.5599/jese.2014.0061 251
circuit was constructed from Master Flex tubing, C-Flex 6424-16, of 0.5 inch diameter. The valves
and the three way connectors were made of PVC.
Scanning electron microscopy
Surface characterization of the metallic coating was performed using a SEM Carl Zeiss DSM
940A microscope. The energy of the primary electrons beam employed was 15 keV.
Methodology
Preparation of the DSA material
A ternary oxide (IrO2-SnO2–Sb2O5) film was deposited onto a Ti plate and mesh to be used in the
three electrode cell and in the flow cell (Figure 1) by Pechini method using appropriate molar
ratios of the oxide components. The precursor polymer solution was a mixture of citric acid (CA) in
ethylene glycol (EG) at 60-70 °C. After total dissolution of the CA, H2IrCl6xH2O, SnCl4 and SbCl3
were added to the mixture according to a molar composition of EG:CA:Ir:Sn:Sb as
16:0.12:0.0296:0.0296:0.0004, maintaining the temperature at 60-70 °C for 30 min. This mixture
was then applied with a brush to both sides of the pre-treated Ti support. After the application of
the coating, the electrode was heated at 100 oC for 5 min in a furnace in order to induce the
polymerization of the precursor. This procedure was repeated eight times. After the final coating,
the electrodes were maintained at 550 oC for 1 h in order to calcinate the polymer and form the
ternary oxide (IrO2-SnO2–Sb2O5); XRD analysis confirmed at such at temperature these oxide
phases are obtained [22]. The temperature did not exceed 600 oC to avoid the formation of TiO2
that markedly reduces the electrocatalytic properties of the Ti/IrO2-SnO2–Sb2O5 coating due to
passivation [23].
Microelectrolysis tests
Anodic polarization curves to determine the limits of potential and current density where the
media is oxidized at Ti/IrO2-SnO2–Sb2O5 electrode were performed. These studies were carried out
in the solution containing phosphate buffer (pH 7.4), and in the presence of 2×10⁵ M RNO in the
same buffer at room temperature (298 K). Anodic potential limit of 1.6 V vs. SHE was applied from
open circuit potential (OCP) (0.82 V vs. SHE) using the linear sweep voltammetry technique at
50 mV s1. Based on these polarization curves the detection of hydroxyl radicals was performed.
Detection of hydroxyl radicals
In this paper RNO was used as spin trap for the detection of low concentration of OH radicals
formed by water discharge at the Ti/IrO2-SnO2-Sb2O5 electrode and the bleaching of the yellow
colour was measured during electrolysis [17]. RNO traps the OH radical by an addition reaction to
produce a more stable radical (spin adduct), Eq. (3) [17].
(3)
It is important to mention that RNO is electrochemical inactive at Pt, SnO2 and IrO2 anodes
[17,20]. A divided cell for the indirect detection of OH radicals was used (see microelectrolysis
experiments section). Anodes screening tests were carried out in phosphate buffer (pH=7.4)
containing 2×10⁵ M RNO. Galvanostatic electrolyses at current densities of 5, 7 and 10 mA cm2
applied to the Ti/IrO2-SnO2-Sb2O5 electrode were performed; at the same time the bleaching

J. Electrochem. Sci. Eng. 4(4) (2014) 247-258 ELECTROCHEMICAL COMBUSTION OF INDIGO TEXTILE DYE
252 252
(in-situ) of the yellow color of RNO during electrolysis was followed. The same tests were
performed using Pt plate (1 cm2) as anode for which the surface OH radical concentration is
almost zero [17].
Electrochemical incineration in the filter-press flow cell.
Electrochemical incinerations of indigo were carried out in the FM01-LC cell equipped with
mesh-(Ti/IrO2-SnO2-Sb2O5) at current density of 7 mA cm-2, value determined from microelectro-
lysis studies, at different volumetric flow rates between 0.10.4 L min.1.
Incineration evolution was estimated by COD analysis of samples taken at different times. The
COD values were determined by closed reflux dichromate titration method [24]. It is important to
mention that estimating residual organic matter by COD analysis allowed eliminating any interfe-
rence from chloride species. For this method, an excess of HgSO4 was added and Ag2SO4 in the di-
gestion and catalyst solutions, respectively, with the purpose of eliminating possible interferences
from chloride species during the estimation of the residual organic matter from COD analysis [12].
The chloride concentration was evaluated by volumetric titration using a 0.5 M AgNO3, con-
firmed by potentiometric measurements [12]. In addition, the color removal was determined by
the decrease in absorbance at 639 nm, during electrolyzes.
Results and Discussion
Characterization of DSA
Figure 2 presents typical scanning electron micrographs for freshly prepared electrode Ti/IrO2-
SnO2-Sb2O5. The surface morphology of the layer is characterized by the presence of crackers and
plates. The presence of plates on the surface is probably due to the drastic heat treatment to
which the sampled was submitted, that promoted the rapid exit of CO2 gas originated from the
decomposition of the organic polymer. EDX analyses focused on several plate structures show
heterogeneous atomic percentage ratio of Sn and Ir (between 1.6 to 2.74), indicating that Sn
segregates from other oxide to form a Sn rich deposit. Moreover, antimony was randomly
detected along the electrode, showing that Sb is not homogeneously distributed along the
electrode surface owing to its low content.
Figure 2. SEM images of Ti/IrO2-SnO2-Sb2O5.
Figure 3 shows typical linear sweep voltammetries obtained on Ti/IrO2-SnO2-Sb2O5 electrode in
the solution containing phosphate buffer (pH 7.4), and in the presence of 2×10⁵ M RNO in the
20 mm

M. I. León et al. J. Electrochem. Sci. Eng. 4(4) (2014) 247-258
doi: 10.5599/jese.2014.0061 253
same buffer where no differences were detected. The fact that no changes were detected in both
electrolytic solutions suggests the oxidation of water which is found in excess. Tafel slope
performed on Ti/IrO2-SnO2-Sb2O5 from these curves (see inset), gives value of 190 mV dec-1, which
is different to that reported for Ti/IrO2/SnO2-Sb2O5 and Ti/Pt/SnO2-Sb2O4, 120 and 204 mV dec-1
obtained at 298 K, respectively [12,25]; this difference is associated with the electrode
composition and by the method of preparation.
Figure 3. Typical linear sweep voltammetries on Ti/IrO2-SnO2-Sb2O5 anode.
Electrolyte: phosphate buffer (pH 7.4), and phosphate buffer + 2×10⁵ M RNO. The scan rate was 50 mV s1. The inset shows the Tafel plot for J-E curves for phosphate buffer. A = 1 cm2. T = 298 K.
Figure 4. Absorbance spectra of RNO (2×10⁵ M) in phosphate buffer (pH=7.4) obtained at 5 min intervals during galvanostatic electrolyses with Ti/IrO2-SnO2-Sb2O5 (a) and Pt (b) anodes. A = 1 cm2. T=298 K.
For screening tests of anodes we used RNO as spin trap of OH radicals. Figure 4 shows the
absorption spectrum of aqueous solution (2×10⁵ M RNO) in phosphate buffer at pH 7.4 during
0
4
8
12
16
0.8 0.9 1 1.1 1.2 1.3 1.4 1.5 1.6
J /
mA
cm
-2
E / V vs. SHE
Phosphate buffer + RNO
Phosphate buffer
1.1
1.14
1.18
1.22
1.26
1.3
-0.6 -0.4 -0.2 0 0.2 0.4
E / V
vs. S
HE
log J / mA cm-2
J. Electrochem. Sci. Eng. 4(4) (2014) 247-258 ELECTROCHEMICAL COMBUSTION OF INDIGO TEXTILE DYE
254 254
galvanostatic electrolysis at 5, 7 and 10 mA cm2 with Ti/IrO2-SnO2-Sb2O5 and Pt electrode. With Pt
anode, there is no decrease in absorbance at 440 nm, at the three current densities, contrary to
the Ti/IrO2-SnO2-Sb2O5 anode for which there is a rapid decrease in the absorbance at 5 and
7 mA cm2. These results show that there is accumulation of OH radicals at the Ti/IrO2-SnO2-Sb2O5
electrode surface contrary to Pt anode for which the surface OH radical is almost zero. The fact
that the Ti/IrO2-SnO2-Sb2O5 anode at 10 mA cm2 behaves similar to that Pt suggests that at such
current density the accumulation of OH radicals is zero and the oxygen evolution reaction starts
to appear. Therefore, according to the proposed reactions (Eqs. (1) and (2)) [14,17] the Ti/IrO2-
SnO2-Sb2O5 will favor complete combustion of indigo textile dye at 5 and 7 mA cm2.
Electrochemical incineration of indigo textile dye in the FM01-LC using DSA electrode
Figures 5 (a) and (b) show the normalized color (detected at = 639 nm) and COD results
obtained from experiments performed at constant current density (7 mA cm-2) and variable
volumetric flow rates. In these figures, the normalized color decreases faster than COD with the
electrolysis time at different volumetric flow rates. COD kinetic was lower than that obtained for
color decay owing to the slower combustion of by-products. However, color and COD depletion do
not show marked improvement at the elevated volumetric flow rates.
Given that the presence of chloride ions (i.e., 0.05 M in this study) is relevant due to the
possible formation of active chlorine by oxidation at Ti/IrO2-SnO2-Sb2O5, the chloride consumption
at the end of the electrolysis was measured (Figure 6), giving an average conversion between
15-40 %. This value did not show a marked dependence with hydrodynamics. This indicates that,
despite the predominant role of Ti/IrO2-SnO2-Sb2O5 (OH) as oxidant species, indigo and/or its by-
products can be simultaneously destroyed by other oxidants such as dissolved chlorine gas,
hypochlorous acid (HClO) and hypochlorite ion (ClO-), as well as chlorate and perchlorate ions
formed upon electro-oxidation with Ti/IrO2-SnO2-Sb2O5 electrode.
The complete combustion obtained here confirms that the OH radical, in addition to the other
oxidants, are responsible for the oxidation of indigo, which does not occur on platinum electrodes,
where the oxidation of indigo in chloride medium achieved 60 % in terms of COD [7]. The results
obtained here are in agreement with other articles carried out by our group, where we achieved
the complete combustion of indigo mediated by OH and active chlorine (produced on BDD in the
same filter-press flow cell) [12,13].
The fact that hydrodynamics does not improve indigo oxidation and color removal may be
associated with a complex mechanism of indigo degradation. HPLC studies would be helpful in the
identification of possible indigo oxidation by-products; however, these were beyond the scope of
the present work. It is important to point out that all of the electrolyses presented herein were
carried out in the undivided FM01-LC cell, for which reason the degradation of indigo may also
involve reactions at the cathode (Ti/Pt).
With the data obtained from COD for all of the electrolyses at their respective volumetric flow
rates, integral current efficiency and energy consumption were analyzed as a function of
percentage of indigo oxidation, for electrolyses performed at 7 mA cm-2, Figure 7 (a)-(b). The esti-
mation of integral current efficiency and energy consumption were determined using Equations
(4) and (5) [12]:

M. I. León et al. J. Electrochem. Sci. Eng. 4(4) (2014) 247-258
doi: 10.5599/jese.2014.0061 255
Figure 5. Normalized color ( = 639 nm) (a) and COD (b) decay during the electrolyses of indigo on
(Ti/IrO2-SnO2-Sb2O5) in the FM01-LC electrolyzer. Electrolyte: 1 mM indigo in 0.05 M NaCl; this composition resembles a denim laundry wastewater. A = 112 cm2, j = 7 mA cm-2, T = 298 K.
Volumetric flow rates are shown in the figure.
Figure 6. Normalized concentration of chloride versus volumetric flow rates evaluated at the end of the
electrolyses similar to those from Fig. 5(b). Electrolyte: 1 mM indigo in 0.05 M NaCl. A = 112 cm2, j = 7 mA cm-2, T = 298 K. Volumetric flow rates are shown in the figure.
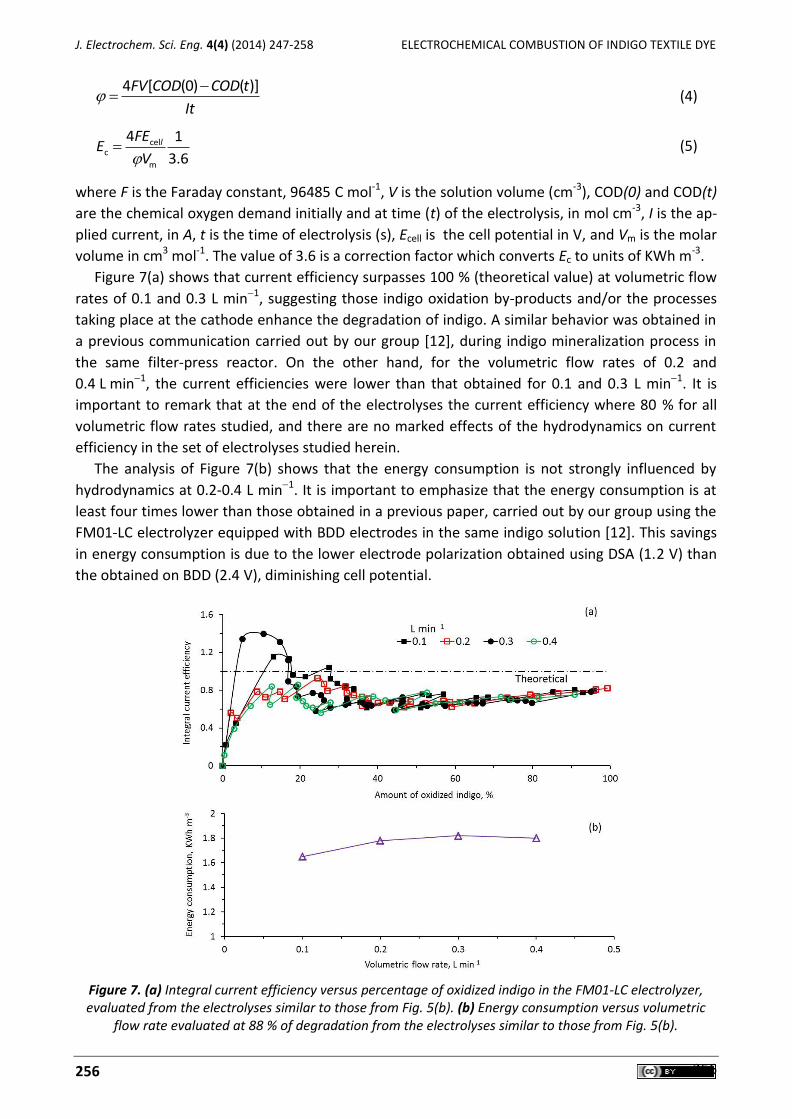
J. Electrochem. Sci. Eng. 4(4) (2014) 247-258 ELECTROCHEMICAL COMBUSTION OF INDIGO TEXTILE DYE
256 256
4 [ (0) ( )]FV COD COD t
It
(4)
celc
m
4 1
3.6lFE
EV
(5)
where F is the Faraday constant, 96485 C mol-1, V is the solution volume (cm-3), COD(0) and COD(t)
are the chemical oxygen demand initially and at time (t) of the electrolysis, in mol cm-3, I is the ap-
plied current, in A, t is the time of electrolysis (s), Ecell is the cell potential in V, and Vm is the molar
volume in cm3 mol-1. The value of 3.6 is a correction factor which converts Ec to units of KWh m-3.
Figure 7(a) shows that current efficiency surpasses 100 % (theoretical value) at volumetric flow
rates of 0.1 and 0.3 L min1, suggesting those indigo oxidation by-products and/or the processes
taking place at the cathode enhance the degradation of indigo. A similar behavior was obtained in
a previous communication carried out by our group [12], during indigo mineralization process in
the same filter-press reactor. On the other hand, for the volumetric flow rates of 0.2 and
0.4 L min1, the current efficiencies were lower than that obtained for 0.1 and 0.3 L min1. It is
important to remark that at the end of the electrolyses the current efficiency where 80 % for all
volumetric flow rates studied, and there are no marked effects of the hydrodynamics on current
efficiency in the set of electrolyses studied herein.
The analysis of Figure 7(b) shows that the energy consumption is not strongly influenced by
hydrodynamics at 0.2-0.4 L min1. It is important to emphasize that the energy consumption is at
least four times lower than those obtained in a previous paper, carried out by our group using the
FM01-LC electrolyzer equipped with BDD electrodes in the same indigo solution [12]. This savings
in energy consumption is due to the lower electrode polarization obtained using DSA (1.2 V) than
the obtained on BDD (2.4 V), diminishing cell potential.
Figure 7. (a) Integral current efficiency versus percentage of oxidized indigo in the FM01-LC electrolyzer, evaluated from the electrolyses similar to those from Fig. 5(b). (b) Energy consumption versus volumetric
flow rate evaluated at 88 % of degradation from the electrolyses similar to those from Fig. 5(b).
M. I. León et al. J. Electrochem. Sci. Eng. 4(4) (2014) 247-258
doi: 10.5599/jese.2014.0061 257
The study presented here indicates that, despite the predominant role of
Ti/IrO2-SnO2-Sb2O5(OH) as oxidant species, indigo and/or its by-products can be simultaneously
destroyed by other oxidants such as dissolved chlorine gas, hypochlorous acid (HClO) and
hypochlorite ion (ClO-), as well as chlorate and perchlorate ions formed upon electro-oxidation
with Ti/IrO2-SnO2-Sb2O5 electrode.
Conclusions
The detection of OH radicals formed by water discharge at Ti/IrO2-SnO2-Sb2O5 using
N,N-dimethyl-p-nitrosoaniline (RNO) as a spin trap showed that exits an accumulation of OH
radical at Ti/IrO2-SnO2-Sb2O5 surface. Therefore, the Ti/IrO2-SnO2-Sb2O5 anode favors complete
combustion of indigo by bulk electrolysis.
The galvanostatic tests using RNO as spin trap of OH radicals confirmed that Ti/IrO2-SnO2-Sb2O5
will favor the hydroxyl radical formation at current densities between 5 and 7 mA cm2, while at
current density of 10 mA cm2 the oxygen evolution reaction occurs.
Electrolyses in a FM01-LC flow cell indicates, that despite the predominant role of
Ti/IrO2-SnO2-Sb2O5 (OH) as oxidant species, indigo and/or its by-products can be simultaneously
destroyed by other oxidants such as dissolved chlorine gas, hypochlorous acid (HClO) and
hypochlorite ion (ClO-), as well as chlorate and perchlorate ions formed upon electro-oxidation
with Ti/IrO2-SnO2-Sb2O5 electrode.
The mineralization of indigo carried out at 0.2 L min1 and 7 mA cm2 achieved values of 100 %,
with current efficiencies 80 %, and energy consumption of 1.78 KWh m-3. The FM01-LC equipped
with mesh-(Ti/IrO2-SnO2-Sb2O5) improves space-time yield, allowing better interaction between
mesh-(Ti/IrO2-SnO2-Sb2O5)(OH) and organics, a phenomenon that increases organic mineralization
efficiency.
In this manner, the complete mineralization of indigo with high current efficiency, obtained in
this work is a notable improvement over those reported in the literature by using other DSA
electrode. Additionally, the performance of the FM01-LC electrolyzer equipped with mesh-
(Ti/IrO2-SnO2-Sb2O5) electrodes, demonstrate the convenience of using this electrochemical
reactor as a pre-pilot cell for other water samples containing recalcitrant organic matter.
Acknowledgements: María I. León and Zaira G. Aguilar thank CONACYT for the given grant. Authors are grateful to CONACYT and CONCYTEG for the economic support via the project FOMIX GTO-2012-C04-195057. Authors also acknowledge Universidad de Guanajuato for the financial support.
References
[1] Y. Wong, J. Yu, Water Research 33 (1999) 3512-3520. [2] P. Cañizares, F. Martínez, C. Jiménez, J. Lobato, M. A. Rodrigo, Environmental Science &
Technology 40 (2006) 6418-6424. [3] N. Mohan, N. Balasubramanian, V. Subramanian, Chemical Engineering & Technology 24
(2001) 749-753. [4] M. Faouzi, P. Cañizares, A. Gadri, J. Lobato, B. Nasr, R. Paz, M. A. Rodrigo, C. Sáez,
Electrochimica Acta 52 (2006) 325-331. [5] X. Chen, G. Chen, Separation and Purification Technology 48 (2006) 45-49. [6] X. Chen, F. Gao, G. Chen, Journal of Applied Electrochemistry 35 (2005) 185-191. [7] D. Dogan, H. J. Turkdemir, Journal of Chemical Technology and Biotechnology 80 (2005)
916-923.
J. Electrochem. Sci. Eng. 4(4) (2014) 247-258 ELECTROCHEMICAL COMBUSTION OF INDIGO TEXTILE DYE
258 258
[8] D. Rajkumar, B. J. Song, J. G. Kim, Dyes and Pigments 72 (2007) 1-7. [9] A. M. Faouzi, B. Nasr, G. Abbdellati, Dyes and Pigments 73 (2007) 86-89.
[10] P. Cañizares, A. Gadri, J. Lobato, B. Nasr, M. A. Rodrigo, C. Saez, Industrial & Engineering Chemistry Research 45 (2006) 3468-3473.
[11] F. H. Oliveira, M. E. Osugi, F. M. M. Paschoal, D. Profeti, P. Olivi, M. V. B. Zanoni, Journal of Applied Electrochemistry 37 (2007) 583-592.
[12] E. Butrón, M. E. Juárez, M. Solis, M. Teutli, I. González and J. L. Nava, Electrochimica Acta 52 (2007) 6888-6894.
[13] J. L. Nava, I. Sirés, E. Brillas. Environmental Science and Pollution Research 21 (2014) 8485-8492.
[14] C. L. P. S. Zanta, P. A. Michaud, C. Comninellis, A. R. de Andrade, J. F. C. Boodts, Journal of Applied Electrochemistry 33 (2003) 1211-1215.
[15] M. Tian, L. Bakovic, A. Chen, Electrochimica Acta 52 (2007) 6517-6524. [16] N. Matyasovszky, M. Tian, A. Chen, Journal of Physical Chemistry A 113 (2009) 9348-9353. [17] C. Comninellis, Electrochimica Acta 39 (1994) 1857-1862. [18] B. Correa-Lozano, Ch. Comninellis, A. De Battisti, Journal of Applied Electrochemistry 27
(1997) 970-974. [19] R. Chaiyont, C. Badoe, C. Ponce de León, J.L. Nava, J. Recio, I. Sirés, P. Herrasti, F.C. Walsh,
Chemical Engineering & Technology 36 (2013) 123-129. [20] J. Muff, L. R. Bennedsen, E. G. Søgaard, Journal of Applied Electrochemistry 41 (2011) 599–
607. [21] C. J. Brown, F. C. Walsh, D. Pletcher, Transactions of the Institute of Chemical Engineers,
73A, (1994) 196205. [22] X. Qin, F. Gao, G. Chen, Journal of Applied Electrochemistry 40 (2010) 1797–1805. [23] M. P. Pechini, N. Adams, US Patent 3 3,330,697 (1967). [24] APHA, AWWA, WPCF, Standard methods for the examination of water and wastewater,
New York, USA, 1995. [25] D. Santos, A. Lopes, M. J. Pacheco, A. Gomes, L. Ciríaco, Journal of the Electrochemical
Society 161 (2014) H564–H572.
© 2014 by the authors; licensee IAPC, Zagreb, Croatia. This article is an open-access article distributed under the terms and conditions of the Creative Commons Attribution license
(http://creativecommons.org/licenses/by/3.0/)

doi: 10.5599/jese.2014.0069 259
J. Electrochem. Sci. Eng. 4(4) (2014) 259-270; doi: 10.5599/jese.2014.0069
Open Access : : ISSN 1847-9286
www.jESE-online.org
Original scientific paper
Electrochemical mediated oxidation of phenol using Ti/IrO2 and Ti/Pt-SnO2-Sb2O5 electrodes
Jéssica Pires de Paiva Barreto, Elisama Vieira dos Santos, Mariana Medeiros Oliveira, Djalma Ribeiro da Silva, João Fernandes de Souza* and Carlos A. Martínez-Huitle
Federal University of Rio Grande do Norte, CCET - Institute of Chemistry, Campus Universitario, Lagoa Nova - CEP 59.072-970, RN, Brazil *Federal University of Rio Grande do Norte, CCET – Department of Chemical Engineering, Campus Universitario, Lagoa Nova - CEP 59.072-970, RN, Brazil
Corresponding Author: E-mail: [email protected]; Tel.: +55-84-9181-7147;
Received: October 13, 2014; Published: December 6, 2014
Abstract The indirect electrochemical oxidation of phenol was studied at Ti/IrO2 and Ti/Pt-SnO2-Sb2O5 electrodes by bulk electrolysis experiments under galvanostatic control. The obtained results clearly shown that the electrode material was an important para-meter for the optimization of such processes determining their mechanism and oxidation products. Different current efficiencies were obtained at Ti/IrO2 and Ti/Pt-SnO2-Sb2O5, depending on the applied current density in the range from 10, 20 and 30 mA cm−2. The effect of the amount of dissolved NaCl was studied also. It was observed that the electrochemical processes (direct/indirect) favor specific oxidation pathways depending on electrocatalytic material. Phenol degradation generates several intermediates eventually leading to complete mineralization, as indicated by the results obtained with the High-performance liquid chromatography (HPLC) technique.
Keywords Phenol; anode material; chlorine active species; indirect electrochemical oxidation.
Introduction
Phenol is an aromatic compound and it is a hygroscopic crystalline solid at ambient temperatu-
re and pressure. When pure, solid phenol is white but is mostly colored due to the presence of im-
purities. Phenol is very soluble in ethyl alcohol, in ether and in several polar solvents, as well as in
hydrocarbons such as benzene. In water it has a limited solubility and behaves as a weak acid [1].
More phenol than is usually found in the environment has been found in surface waters and
J. Electrochem. Sci. Eng. 4(4) (2014) 259-270 ELECTROCHEMICAL OXIDATION OF PHENOL
260 260
surrounding air that were contaminated when phenol was released from industries and
commercial products containing phenol. It has been found in materials released from landfills and
hazardous waste sites, and it has been found in the groundwater near these sites [2,3].
The interest in developing new and more efficient methods for destruction of hazardous waste
such as phenol [4] and the conversion of mixed waste to low-level-toxicity waste has significantly
increased. These wastewaters are difficult to be effectively treated by conventional biological
methods, for this reason, advanced oxidation processes (AOPs) have been developed to treat
these bio-refractory organic wastewaters [1-11]. In this frame, the electrochemical oxidation of
the model substrates has been investigated using several anodic materials, generally metal oxides
like IrO2, PbO2, SnO2 and SnO2–Sb2O5 [5,6]. Dimensionally stable anodes (DSAs) belong to a
particular category of electrodes, constituted of a Ti-support coated by noble metal oxides, which
confer the enhanced catalytic activity towards chlorine evolution and oxygen evolution reaction
(o.e.r). To date, DSAs have been largely employed in the chloro-alkali industry, due to their
excellent catalytic property and service life [12,13]; however, significant performances have been
obtained when these have been used for electrochemical treatment of industrial effluents [14].
In the case of active chlorine, the interest in this oxidant is based on the ubiquitous presence of
chloride ions in a certain number of effluents and natural waters, making possible the involvement
of active chlorine during electrochemical treatment using principally DSA electrodes; and the chemi-
stry and electrochemistry of higher oxidation states for chlorine close to neutral pH [15,16].
The electrochemical treatment of phenol has been already studied by other authors [2-4,9-11,
17,18]. Using NaCl solutions to degradate phenol by direct anodic reaction and/or through the
mediation of active chlorine [19,20]; the possible role of the Cl- ion during the process was not
taken into account by the authors [19,20]. Therefore, the electrochemical degradation of phenol
was studied at Ti/IrO2 and Ti/Pt-SnO2-Sb2O5 electrodes by varying operating conditions such as
current density and Cl- concentration. The intermediate species formed at each one of the anodes
were compared.
Experimental
Chemicals
The compounds used such as phenol, catechol, hydroquinone, oxalic acidic were of analytical
grade. The chromatographic elution solvents were of HPLC grade (Merck). The stock solutions
(1000 mg L-1) of phenol and its degradation products were prepared from certified reference
standards (purity > 98 %), with the dissolution in methanol HPLC grade. All electrolyte solutions
were prepares using purified Milli-Q water system with a conductivity of 0.1 µS cm-1.
Electrochemical measurements
Electrochemical analyses were performed with an Autolab model PGSTAT320N (Metrohm).
Quasi-steady polarization curves were carried out at a scan rate of 2.5 mV s−1 and with a 0.45 mV
step potential, in solutions of NaCl at different concentrations. Experiments were carried out in a
conventional three-electrode system, and measurements were performed in a range from 0.0 V to
3.5 V. Ti/IrO2 and Ti-Pt-SnO2-Sb2O5, with an exposed geometric area of ca. 1.0 cm2, were used as
the working electrode, while a platinum wire and an Ag/AgCl (KCl 3 mol L−1) electrode were
employed as the auxiliary and reference electrodes, respectively.

J. P. de Paiva Barreto et al. J. Electrochem. Sci. Eng. 4(4) (2014) 259-270
doi: 10.5599/jese.2014.0069 261
Electrolytic systems
Bulk oxidations were performed in an electrolytic flow cell with a single-compartment with
parallel plate electrodes [21]. Circular electrodes (Ti/IrO2 and Ti-Pt-SnO2-Sb2O5 electrode) were
used as anodes exposing to the effluent a nominal surface area of 63.5 cm2. In all cases, a Ti disc
was used as the cathode. The inter-electrode gap was 10 mm. For the electrochemical flow cell,
inlet and outlet were provided for effluent circulation through the reactor; the solution of phenol
was stored in a thermoregulated glass tank (1 L) and circulated through the cell using a peristaltic
pump, at a flow rate of 151 dm3 h−1, which allowed a mass transfer coefficient (determined using
the ferri/ferro-cyanide redox couple) of 2.0×10⁻⁵ m s−1 [22]. The oxidation experiments of phenol
were performed under galvanostatic conditions (using a power supply MINIPA-3305M) at 25 °C for
studying the role of applied current density (j = 10, 20 and 30 mA cm-2) adding 20 and 30 mM of Cl-
for studying the effect of Cl-mediated approach.
Analytical methods
The oxidation intermediates, produced during the electrolysis experiments at both anodes,
were analyzed by HPLC. Chromatographic separations were performed on an analytical column
Supelcosil-C18 (5 µm, 25 × 46 mm) at room temperature and with an UV detector at λ = 225 nm.
Generated carboxylic acids were detected and quantified using an Ultimate TMAQ- C18 5 m
(25 × 46 mm) column at room temperature and photodiode array detector set at λ = 210 nm. For
these analyses, a 70:30 (v/v) methanol/water mixture at 0.5 mL min-1 for the elution was used. The
flow rate of the mobile phase was 1.5 mL min-1. Spectrophotometric measurements (UV–Vis) were
also performed using a Shimadzu model UV-160 spectrophotometer. Experimentally, degradation
of phenol was monitored from the abatement of their chemical oxygen demand (COD). Values
were obtained, using a HANNA HI 83099 spectrophotometer after digestion of samples in a
HANNA thermo-reactor, in order to estimate the Total Current Efficiency (TCE), using the following
relationship [23]:
0 fCOD CODTCE, % 100
8FV
I t
(1)
where COD0 and CODf are chemical oxygen demands at times t=0 (initial) and f (final time) in
g O2 dm−3, respectively; I the current (A), F the Faraday constant (96,487 C mol−1), V the electrolyte
volume (dm3), 8 is the oxygen equivalent mass (g eq.−1) and Δt is the total time of electrolysis,
allowing for a global determination of the overall efficiency of the process. Additionally, the
limiting current can be estimated from the value of COD using the equation 2 for electrochemical
oxidation of phenol [24,25].
lim m( ) 4 COD( )I t FAk t (2)
where Ilim(t) is the limiting current (A) at a given time t, 4 the number of exchanged electrons, A
the electrode area (m2), F the Faraday’s constant, km the average mass transport coefficient in the
electrochemical reactor (m s−1) and COD(t) the COD, mol O2 m−3 at a given time t.
The energy consumption (EC) per volume of phenol oxidized was estimated and expressed in
kWh dm-3. The average cell voltage, during the electrolysis, is taken for calculating the energy EC,
as follows:
cEnergy consumption3600
E It
V
(3)
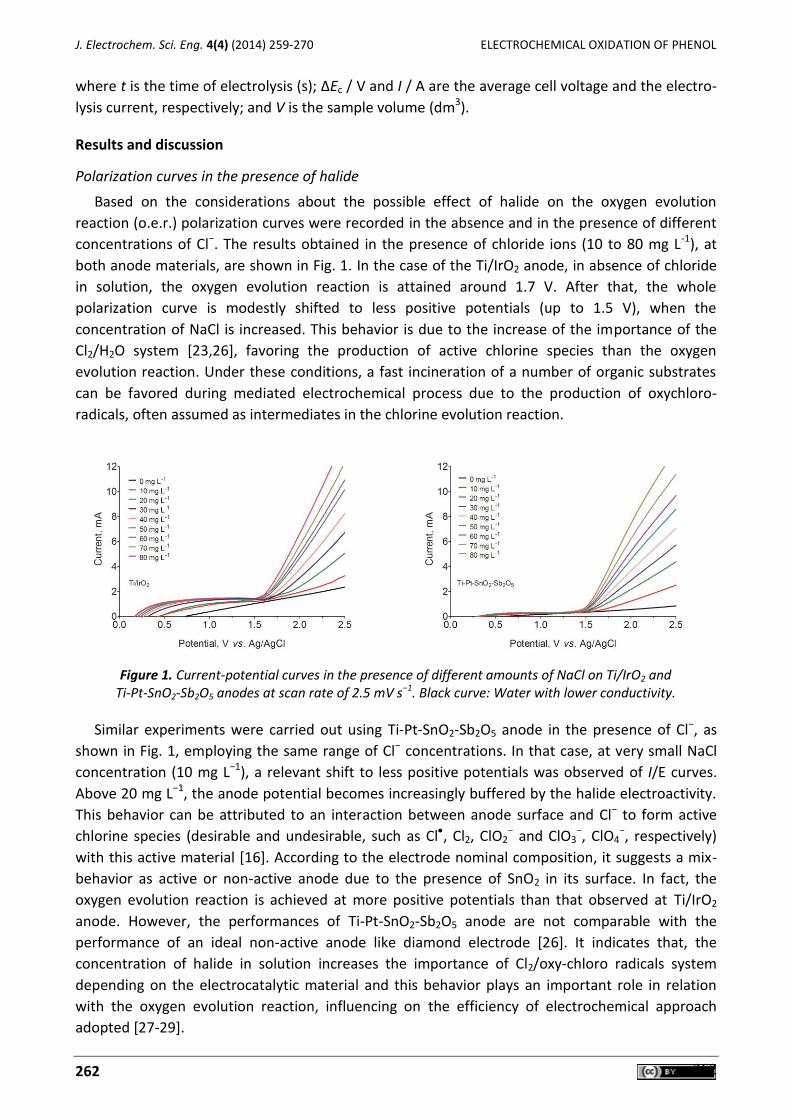
J. Electrochem. Sci. Eng. 4(4) (2014) 259-270 ELECTROCHEMICAL OXIDATION OF PHENOL
262 262
where t is the time of electrolysis (s); ΔEc / V and I / A are the average cell voltage and the electro-
lysis current, respectively; and V is the sample volume (dm3).
Results and discussion
Polarization curves in the presence of halide
Based on the considerations about the possible effect of halide on the oxygen evolution
reaction (o.e.r.) polarization curves were recorded in the absence and in the presence of different
concentrations of Cl−. The results obtained in the presence of chloride ions (10 to 80 mg L-1), at
both anode materials, are shown in Fig. 1. In the case of the Ti/IrO2 anode, in absence of chloride
in solution, the oxygen evolution reaction is attained around 1.7 V. After that, the whole
polarization curve is modestly shifted to less positive potentials (up to 1.5 V), when the
concentration of NaCl is increased. This behavior is due to the increase of the importance of the
Cl2/H2O system [23,26], favoring the production of active chlorine species than the oxygen
evolution reaction. Under these conditions, a fast incineration of a number of organic substrates
can be favored during mediated electrochemical process due to the production of oxychloro-
radicals, often assumed as intermediates in the chlorine evolution reaction.
Figure 1. Current-potential curves in the presence of different amounts of NaCl on Ti/IrO2 and
Ti-Pt-SnO2-Sb2O5 anodes at scan rate of 2.5 mV s−1. Black curve: Water with lower conductivity.
Similar experiments were carried out using Ti-Pt-SnO2-Sb2O5 anode in the presence of Cl−, as
shown in Fig. 1, employing the same range of Cl− concentrations. In that case, at very small NaCl
concentration (10 mg L−1), a relevant shift to less positive potentials was observed of I/E curves.
Above 20 mg L−1, the anode potential becomes increasingly buffered by the halide electroactivity.
This behavior can be attributed to an interaction between anode surface and Cl− to form active
chlorine species (desirable and undesirable, such as Cl, Cl2, ClO2− and ClO3
−, ClO4−, respectively)
with this active material [16]. According to the electrode nominal composition, it suggests a mix-
behavior as active or non-active anode due to the presence of SnO2 in its surface. In fact, the
oxygen evolution reaction is achieved at more positive potentials than that observed at Ti/IrO2
anode. However, the performances of Ti-Pt-SnO2-Sb2O5 anode are not comparable with the
performance of an ideal non-active anode like diamond electrode [26]. It indicates that, the
concentration of halide in solution increases the importance of Cl2/oxy-chloro radicals system
depending on the electrocatalytic material and this behavior plays an important role in relation
with the oxygen evolution reaction, influencing on the efficiency of electrochemical approach
adopted [27-29].

J. P. de Paiva Barreto et al. J. Electrochem. Sci. Eng. 4(4) (2014) 259-270
doi: 10.5599/jese.2014.0069 263
Bulk electrolysis
The experiments were performed at 25 °C varying Cl- concentration ions (20 and 30 mM) in
solution and applied different current density (10, 20 and 30 mA cm-2) in order to evaluate the
elimination of organic load. Fig. 2 shows the performances of each one of the electrocatalytic
material used as a function of applied current density and electrolyte concentration during the
COD removal. It was observed that efficiency of COD removal was dependent on the applied
current density and Cl- concentration. In fact, when 10, 20 and 30 mA cm-2 were applied by using
Ti/IrO2, the initial COD (338 mg L-1) was reduced 262 mg L-1; 182 mg L-1 and 140 mg L-1 with 20 mM
of Cl- in solution, while at 30 mM of Cl-, COD decays to 193 mg L-1, 123 mg L-1 and 121 mg L-1 for 10,
20 and 30 mA cm-2, respectively, after 120 min of electrolysis. For Ti-Pt-SnO2-Sb2O5 anode, under
similar conditions, COD concentration was reduced from 338 mg L-1 to 223, 45 and 96 mg L-1 at
20 mM of Cl- and 158; 18 and 98 mg L-1 when 30 mM of Cl- was added by applying 10, 20 and
30 mA cm-2, respectively.
Based on the COD removal reported in Fig. 2, the increase in the applied current density con-
tributes to the degradation of phenol and the intermediates generated during the electrolysis,
thanks to the action of active chlorine species produced on the electrodes surface. However, the
results reveal that at Ti-Pt-SnO2-Sb2O5 there is greater reduction in COD than that achieved at
Ti/IrO2 (Fig. 2), principally at 20 mA cm-2. Conversely, when 30 mA cm-2 was applied, the elimina-
tion of COD decreased due to the promotion of Cl2 rather than the production of active chlorine
species.
Figure 2. Effect of NaCl for COD removal at different concentrations during mediated
electrochemical oxidation of phenol by using (a) Ti/IrO2 and (b) Ti-Pt-SnO2-Sb2O5 anodes. Operational conditions: [Phenol]0= 100 mg L−1, initial COD = 338 mg L-1, T = 25°C.
This behavior suggests that phenol oxidation depends on the nature of the anode material due
to the efficient production of active chlorine species on anode surface [23, 26-29]. Ti/IrO2 and
Ti-Pt-SnO2-Sb2O5 materials are classified as active anodes [5,6] because these electrocatalytical
materials are characterized by strong electrode-hydroxyl radical interaction, resulting in a low
chemical reactivity for organics oxidation. This problem can be avoided when Cl-mediated
approach is used [14]. Generally, under favorable pH conditions and NaCl in solution,
electrochemical oxidation via •OH radicals is not the only oxidation mechanism that occurs on the
DSA anodes [14]. In this case, chlorohydroxyl radicals are also generated on anode surface and
consequently oxidizing organic matter (Equations 4 and 5) [30,31]:
J. Electrochem. Sci. Eng. 4(4) (2014) 259-270 ELECTROCHEMICAL OXIDATION OF PHENOL
264 264
H2O + M + Cl- → M[•ClOH] + H+ + 2е- (4)
R + M[•ClOH] → M + RO + H+ + Cl- (5)
Reactions between water and radicals near to anode surface can yield molecular oxygen, free
chlorine, and hydrogen peroxide (6, 7 and 8) [32]:
H2O + M[•OH] → M + O2 +3H+ + 3е- (6)
H2O + M[•ClOH] + Cl-→ M + O2 +Cl2 + 3 H++ 4е- (7)
H2O + M[•OH] → M + H2O2 + H++ е- (8)
Furthermore, hypochlorite can be formed as follows (9 and 10) [31]:
Cl2(diss) + H2O → HOCl + H+ + Cl- (Acidic medium) (9)
Cl2(diss) + 2OH- → ClO- + Cl- + H2O (Alkaline medium) (10)
Therefore, indirect oxidation results in reduction of organic pollutants such as phenol thanks to
the participation of active chlorine species electrochemically formed [15,23,31]. Oxidants are quite
stable and migrate in the solution bulk, and then, these indirectly oxidize the effluent, favored by
hydrodynamic configuration of electrochemical cell. The efficiency of indirect oxidation depends
on the diffusion rate of oxidants in the solution, concentration of oxidants, and pH of solution [15].
For the electrochemical flow cell used in this study, the mass transfer coefficient was
2.0×10⁻⁵ m s−1, and the limiting current (for both anodes) results in an average value of 0.88 A,
according to Eq. 2. This current is lower than all the currents applied in this work (1.27–1.90 A),
suggesting that the oxidation under these experimental conditions could occur under mass
transport control since 120 min of electrochemical treatment. These assumptions are in
agreement with the studies published by Cañizares and co-workers [33].
UV spectroscopic characteristics of the electrochemical oxidation of phenol
The oxidation of phenol at Ti/IrO2 and Ti-Pt-SnO2-Sb2O5 electrodes was also monitored by
spectrophotometric measurements, which allow a straightforward way to follow the elimination
of phenol. Thus, UV spectra for phenol degradation at Ti/IrO2 and Ti-Pt-SnO2-Sb2O5 electrodes, at
20 mM and 30 mM of Cl- in solution at 25°C by applying 20 mA cm−2, are shown in Figure 3. An
inspection of these UV spectra allowed confirming that phenol was more rapidly removed at
Ti/IrO2 (Fig. 3a and 3b, at 20 mM and 30 mM of Cl- in solution by applying 20 mA cm−2) than at Ti-
Pt-SnO2-Sb2O5 electrodes under the same experimental conditions (Fig. 3c and 3d). Moreover, the
bands in Fig 3a and 3b are completely different after 5 minutes of electrolysis due to formation of
reaction intermediates, confirming the fast degradation of phenol. These major changes in UV- vis
bands are not observed in Figs. 3c and 3d. This behavior depends on the effective electrochemical
production of active chlorine species at both anodes. Perhaps, at IrO2, metal cations in the oxide
lattice may reach higher oxidation states under anodic polarization stabilizing •OH radicals and Cl-
ions on its surface [6,32,34], which favors the O2 and Cl2 evolution at the expense of the electro-
chemical incineration reaction. This feature avoids the formation of enough active chlorine species
that promote an efficient degradation of phenol, generating different aromatic intermediaates.
However, it is not possible to reliably ensure that phenol is degraded because the products and/or
intermediates formed during the process may have a higher molar absorptivity () and absorb in
the same wavelength region of phenol.

J. P. de Paiva Barreto et al. J. Electrochem. Sci. Eng. 4(4) (2014) 259-270
doi: 10.5599/jese.2014.0069 265
Figure 3. Spectrophotometric measurements, as a function of time, during Cl-mediated electrochemical treatment of phenol (100 mg L-1) by applying 20 mA cm-2 at 25°C. Ti/IrO2: (a) 20 mM of Cl- and (b) 30 mM of Cl-. Ti-Pt-SnO2-Sb2O5: (c) 20 mM of Cl- and (d) 30 mM of Cl-.
Conversely, at Ti-Pt-SnO2-Sb2O5 electrode (Fig. 3c and 3d), the elimination of phenol is attained
by the reactive chlorine species such as chlorine and hypochlorous acid or hypochlorite ion (Cl2,
HClO and OCl−) that react rapidly with organics mainly by the reactions in solution [23,35,36]. In
acidic conditions, free chlorine is the dominant oxidizing agent, while in slightly alkaline conditions
hypochlorite, chloride ions and hydroxyl radicals are all generated in relevant concentrations
[26,31]. In fact, pH typically varies between 5.5 and 6.2 throughout the course of the reaction for
phenol. Then, this pH behavior suggests the participation of active chlorine oxidants, confirming
the increase on COD removal rate when Ti-Pt-SnO2-Sb2O5 electrode was used.
Distribution of by-products of phenol oxidation
As stated above, phenol could be transformed into different intermediates or carbon dioxide
during the process and such differences would not be apparent from the time- or charge-course of
this parameter. For this reason, identification of some intermediates was performed by HPLC. The
change in concentration of phenol (initial concentration of 100 mg L-1) and intermediates in the
course of indirect electrochemical treatment, by applying 20 mA cm-2 at 25°C, is shown in Fig. 4a-
d. As can be observed, the degradation of phenol (main by-product formed) is influenced by the
amount of Cl- as well as the electrocatalytic material used. In fact, 84 % and 88 % of phenol was
removed by using Ti/IrO2 anode after 120 min of electrolysis when 20 and 30 mM of Cl- in solution
were used, respectively. Conversely, the decrease of phenol on Ti-Pt-SnO2-Sb2O5 was about 93 %
and 83 % by applying 20 mA cm-2 for 20 and 30 mM of Cl-, respectively. As shown in Fig. 4, the
intermediates concentration produced on Ti/IrO2 and Ti-Pt-SnO2-Sb2O5 electrodes are different.
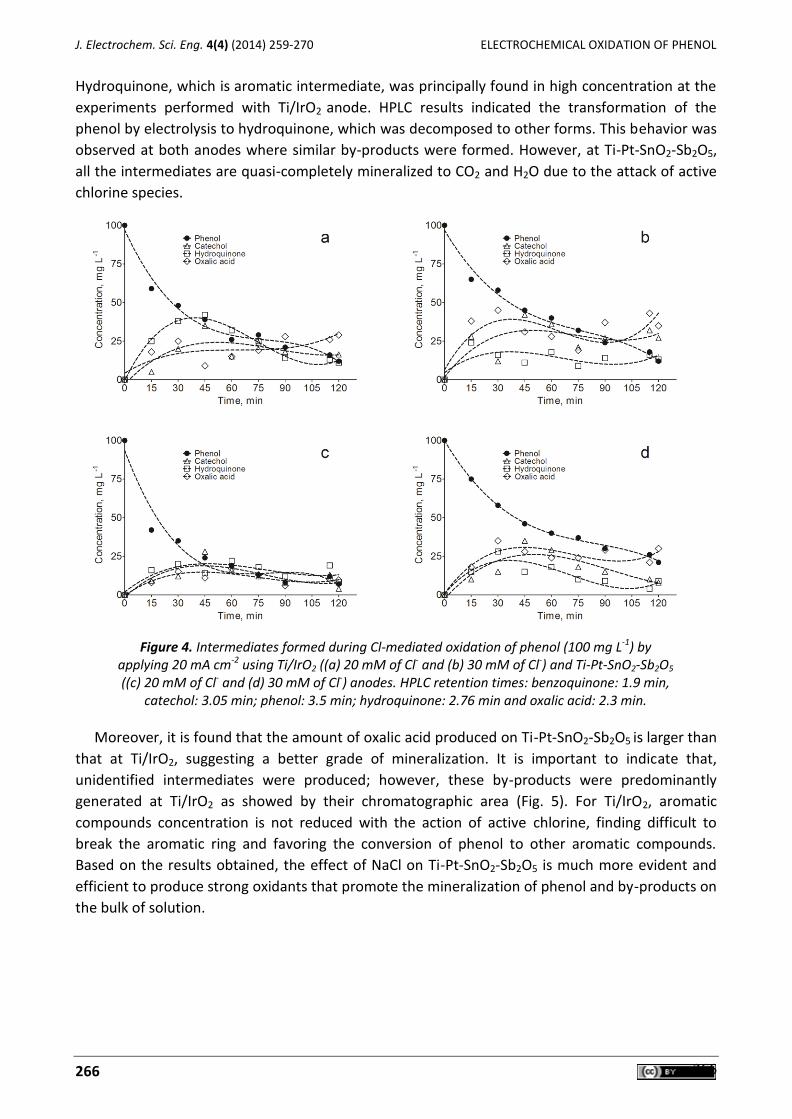
J. Electrochem. Sci. Eng. 4(4) (2014) 259-270 ELECTROCHEMICAL OXIDATION OF PHENOL
266 266
Hydroquinone, which is aromatic intermediate, was principally found in high concentration at the
experiments performed with Ti/IrO2 anode. HPLC results indicated the transformation of the
phenol by electrolysis to hydroquinone, which was decomposed to other forms. This behavior was
observed at both anodes where similar by-products were formed. However, at Ti-Pt-SnO2-Sb2O5,
all the intermediates are quasi-completely mineralized to CO2 and H2O due to the attack of active
chlorine species.
Figure 4. Intermediates formed during Cl-mediated oxidation of phenol (100 mg L-1) by
applying 20 mA cm-2 using Ti/IrO2 ((a) 20 mM of Cl- and (b) 30 mM of Cl-) and Ti-Pt-SnO2-Sb2O5 ((c) 20 mM of Cl- and (d) 30 mM of Cl-) anodes. HPLC retention times: benzoquinone: 1.9 min,
catechol: 3.05 min; phenol: 3.5 min; hydroquinone: 2.76 min and oxalic acid: 2.3 min.
Moreover, it is found that the amount of oxalic acid produced on Ti-Pt-SnO2-Sb2O5 is larger than
that at Ti/IrO2, suggesting a better grade of mineralization. It is important to indicate that,
unidentified intermediates were produced; however, these by-products were predominantly
generated at Ti/IrO2 as showed by their chromatographic area (Fig. 5). For Ti/IrO2, aromatic
compounds concentration is not reduced with the action of active chlorine, finding difficult to
break the aromatic ring and favoring the conversion of phenol to other aromatic compounds.
Based on the results obtained, the effect of NaCl on Ti-Pt-SnO2-Sb2O5 is much more evident and
efficient to produce strong oxidants that promote the mineralization of phenol and by-products on
the bulk of solution.
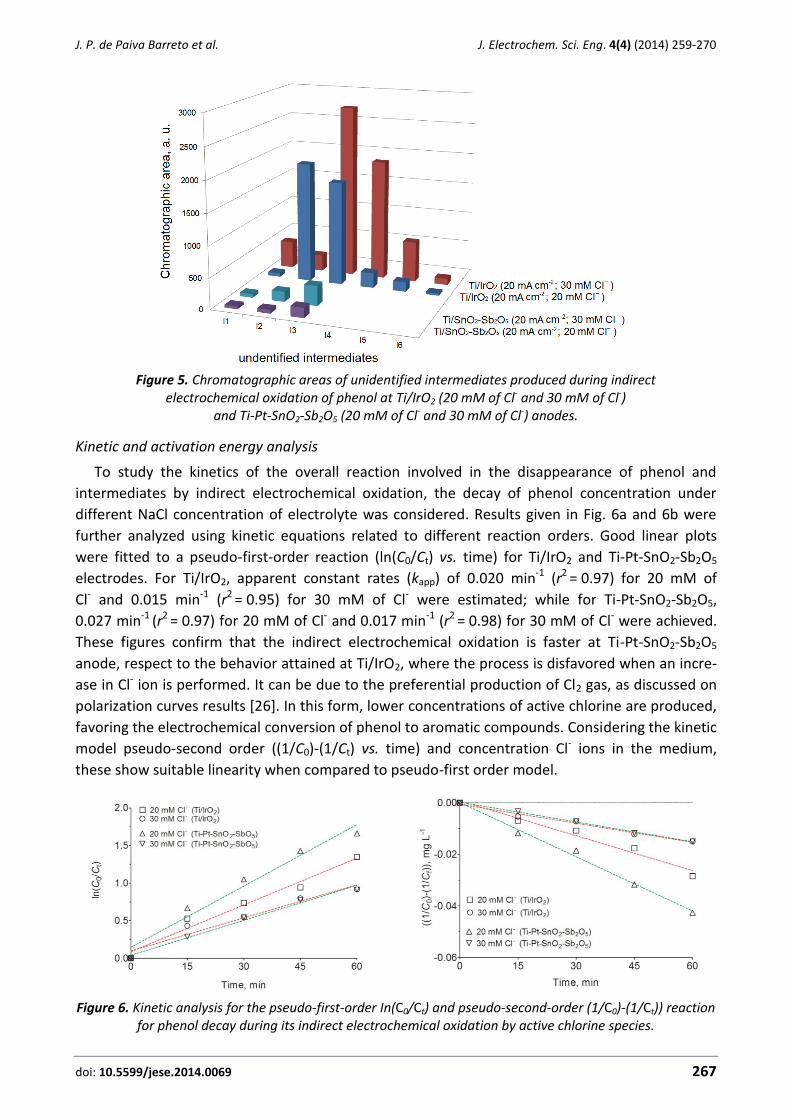
J. P. de Paiva Barreto et al. J. Electrochem. Sci. Eng. 4(4) (2014) 259-270
doi: 10.5599/jese.2014.0069 267
Figure 5. Chromatographic areas of unidentified intermediates produced during indirect
electrochemical oxidation of phenol at Ti/IrO2 (20 mM of Cl- and 30 mM of Cl-) and Ti-Pt-SnO2-Sb2O5 (20 mM of Cl- and 30 mM of Cl-) anodes.
Kinetic and activation energy analysis
To study the kinetics of the overall reaction involved in the disappearance of phenol and
intermediates by indirect electrochemical oxidation, the decay of phenol concentration under
different NaCl concentration of electrolyte was considered. Results given in Fig. 6a and 6b were
further analyzed using kinetic equations related to different reaction orders. Good linear plots
were fitted to a pseudo-first-order reaction (ln(C0/Ct) vs. time) for Ti/IrO2 and Ti-Pt-SnO2-Sb2O5
electrodes. For Ti/IrO2, apparent constant rates (kapp) of 0.020 min-1 (r2 = 0.97) for 20 mM of
Cl- and 0.015 min-1 (r2 = 0.95) for 30 mM of Cl- were estimated; while for Ti-Pt-SnO2-Sb2O5,
0.027 min-1 (r2 = 0.97) for 20 mM of Cl- and 0.017 min-1 (r2 = 0.98) for 30 mM of Cl- were achieved.
These figures confirm that the indirect electrochemical oxidation is faster at Ti-Pt-SnO2-Sb2O5
anode, respect to the behavior attained at Ti/IrO2, where the process is disfavored when an incre-
ase in Cl- ion is performed. It can be due to the preferential production of Cl2 gas, as discussed on
polarization curves results [26]. In this form, lower concentrations of active chlorine are produced,
favoring the electrochemical conversion of phenol to aromatic compounds. Considering the kinetic
model pseudo-second order ((1/C0)-(1/Ct) vs. time) and concentration Cl- ions in the medium,
these show suitable linearity when compared to pseudo-first order model.
Figure 6. Kinetic analysis for the pseudo-first-order In(C0/Ct) and pseudo-second-order (1/C0)-(1/Ct)) reaction
for phenol decay during its indirect electrochemical oxidation by active chlorine species.

J. Electrochem. Sci. Eng. 4(4) (2014) 259-270 ELECTROCHEMICAL OXIDATION OF PHENOL
268 268
The coefficients of pseudo-second order were about 7.0110-4 min-1 (r2 = 0.99) and
2.510-4 min-1 (r2 = 0.99) for concentration 20 and 30 mM of Cl-, respectively, using
Ti-Pt-SnO2-Sb2O5. Conversely, values of 4.510-4 min-1 (r2 = 0.97) and 2.410-3 min-1 (r2 = 0.98) at
concentration 20 and 30 mM of Cl- where estimated at Ti/IrO2 electrode. Then, the kinetic data
obtained by pseudo-second order model indicate that the indirect oxidation is controlled by the
rate at which organic molecules are carried from the bulk to the electrode surface, but when the
concentration of final intermediates increase, their rate is limited by diffusion control. However,
the principal step for the electrochemical approach is the production of active chlorine species, as
indicated by pseudo-second order model.
Finally, it is very important to estimate the treatment applicability, and thus, Table 1 reports the
current efficiency and energy consumption (kWh dm−3) at 10, 20 and 30 mA cm−2, after 120 min of
electrochemical treatment. As can be observed, Ti-Pt-SnO2-Sb2O5 consumed relatively less
electrical energy than Ti/IrO2 anode, but different current efficiencies were achieved after 120 min
of electrolysis at both anode materials.
Table 1. Energy requirements and total current efficiency for elimination of phenol at different applied current densities by Cl-mediated electrochemical oxidation.
Current density, mA cm-2 Current total efficiency, % Energy consumption, kWh dm-3
Ti/IrO2 Ti-Pt-SnO2-SbO5 Ti/IrO2 Ti-Pt-SnO2-Sb2O5
10 59 72 36 28
20 39 56 42 40
30 26 49 69 54
Conclusions
The Cl-mediated electrochemical oxidation of phenol was investigated under galvanostatic
conditions at Ti/IrO2 and Ti-Pt-SnO2-Sb2O5 electrodes, as a function of applied current density and
amount of NaCl dissolved. A partial elimination of the organic pollutant was achieved at Ti/IrO2,
while a quasi-complete electrochemical elimination takes place at Ti-Pt-SnO2-Sb2O5 anode. The in-
fluence of the anode material on the elimination of phenol seems to be very important due to an
efficient production of active chlorine species during electrolysis. In fact, Ti-Pt-SnO2-Sb2O5 showed
good electrocatalytic activity to promote the electrochemical generation of active chlorine, as
indicated by potentiodynamic measurements, and as a consequence of this characteristic,
significant removal efficiency of phenol and its by-products was attained.
The effect of chloride on the electrooxidation of organics with Ti/IrO2 and Ti-Pt-SnO2-Sb2O5
depends mainly on the reaction between electrogenerated •OH and Cl− ions or the conversion of
chloride ion to chlorine which is further hydrolyzed to other active species [26,37]. At the same
time, the production of Cl- to active chlorine is directly related to different experimental con-
ditions, but it is principally dependent on the concentration of free •OH radicals, the increase of
the importance of the Cl2/H2O system and the interaction of Cl- and •OH radicals with the anode
surface. Because, increasing the concentration of Cl- ions in solution, elimination of Cl- from
solution by Cl2 is favored [23,37,38].
Acknowledgements: E. V. dos S. gratefully acknowledges the Programa de Recursos Humanos – PETROBRAS (PBFRH-22) for her PhD fellowship and support provided by the Núcleo de Processamento Primário e Reuso de Água Produzida e Resíduos (NUPPRAR-UFRN) for analyzing the
J. P. de Paiva Barreto et al. J. Electrochem. Sci. Eng. 4(4) (2014) 259-270
doi: 10.5599/jese.2014.0069 269
samples electrochemically treated. The authors thank the financial support provided by CNPq and PETROBRAS. They also thank to the Dott. Christian Urgeghe (Industrie De Nora S.p.A. - Milan, Italy) for providing Ti/IrO2 and Ti-Pt-SnO2-Sb2O5 electrodes.
References
[1] J. E. Amore, E. Hautala, Journal of Applied Toxicology 3 (1983) 272–290. [2] Y.-q. Wang, B. Gu, W.-l. Xu, Journal of Hazardous Materials 162 (2009) 1159-1164. [3] M. Pimentel, N. Oturan, M. Dezotti, M. A. Oturan, Applied Catalysis B: Environmental 83
(2008) 140-149. [4] Y. J. Feng, X. Y. Li, Water Research, 37 (2003) 2399-2407. [5] C. A. Martínez-Huitle, S. Ferro, Chemical Society Reviews 35 (2006) 1324. [6] M. Panizza, G. Cerisola, Chemical Reviews 109 (2009) 6541. [7] E. Chatzisymeon, S. Fierro, I. Karafyllis, D. Mantzavinosa, N, Kalogerakis, A. Katsaounis,
Catalysis Today 151 (2010) 185–189. [8] Ch. Comninellis, Electrochemica Acta 39 (1994) 1857-1862. [9] S. Chai, G. Zhao, P. Li, Y. Lei, Y.-N. Zhang, D. Li, Journal of Physical Chemistry C, 115 (2011)
18261-18269. [10] S. Dutta, R. Chowdhury, P. Bhattacharya, Indian Journal of Chemical Technology 16 (2009)
7-16. [11] M. H. Entezari, C. Pétrier, P. Devidal, Ultrasonics Sonochemistry 10 (2003) 103-108. [12] S. Trasatti, Electrochimica Acta 45 (2000) 2377-2385 [13] S. Trasatti (Ed.), Studies in Physical and Theoretical Chemistry, Vol. 11: Electrodes of
Conductive Metallic Oxides, Pt. A, Elsevier Science Publishers, Amsterdam, Netherlands, 1980.
[14] A. N. Subba Rao, V. T. Venkatarangaiah, Environmental Science Pollution Research 21 (2014) 3197–3217.
[15] I. Sirés, E. Brillas, M. A. Oturan, M. A. Rodrigo, M. Panizza, Environmental Science Pollution Research 21 (2014) 8336-8367.
[16] D. C. de Moura, C. K. C. de Araújo, C. L.P.S. Zanta, R. Salazar, C. A. Martínez-Huitle, Journal of Electroanalytical Chemistry 731 (2014) 145-152.
[17] A. Kapałka, G. Foti, C. Comninellis, Journal of Applied Electrochemical 38 (2008) 7–16. [18] J. Iniesta, P. A. Michaud, M. Panizza, G. Cerisola, A. Aldaz, Ch. Comninellis, Electrochimica
Acta 46 (2001) 3573-3578. [19] Ch. Comninellis and A. Nerini, Journal of Applied Electrochemical 25 (1995) 23–28. [20] Ch. Comninellis and E. Plattner, Chimia 42 (1988) 250–252. [21] E. V. Santos, S. F. M. Sena, D. R. Silva, S. Ferro, A. De Battisti, C. A. Martínez-Huitle
Environmental Science and Pollutation Research 21 (2014) 8466 – 8475. [22] C. A. Martínez-Huitle, M. A. Quiroz, C. Comninellis, S. Ferro, A. De Battisti, Electrochim. Acta
50 (2004) 949-956. [23] C. A. Martínez-Huitle, S. Ferro, A. De Battisti, Electrochemical and Solid-State Letters 8
(2005) D35 – 39. [24] M. Panizza, G. Cerisola, Journal of Electroanalytical Chemistry 32 (2010) 638-28 [25] C. A. Martínez-Huitle, E. V. Santos, D. M. Araújo, M. Panizza, Journal of Electroanalytical
Chemistry 674 (2012) 103–107. [26] J. H. Bezerra Rocha, M. M. Soares Gomes, E. Vieira dos Santos, E. C. Martins de Moura, D.
Ribeiro da Silva, M. A. Quiroz, C. A. Martínez-Huitle, Electrochimica Acta 140 (2014) 419–426.
[27] A. J. C. da Silva, E. V. dos Santos, C. C. de Oliveira Morais, C. A. Martínez-Huitle, S. S. L. Castro, Chemical Engineering Journal 233 (2013) 47.
J. Electrochem. Sci. Eng. 4(4) (2014) 259-270 ELECTROCHEMICAL OXIDATION OF PHENOL
270 270
[28] A. Kapałka, L. Joss, A. Anglada, Ch. Comninellis, K. M. Udert, Electrochemistry Communications 12 (2010) 1714.
[29] C. Indermuhle, M. J. Martín de Vidales, C. Sáez, J. Robles, P. Cañizares, J. F. García-Reyes, A. Molina-Díaz, Ch. Comninellis, M. A. Rodrigo, Chemosphere 93 (2013) 1720.
[30] K. Juttner, U. Galla and H. Schmieder, Electrochimica Acta 45 2000 2575–2594. [31] C. A. Martínez-Huitle, E. Brillas. Angewantle Chemie International Edition 47 (2008) 1998 –
2005. [32] A. M. Z. Ramalho, C. A. Martínez-Huitle, D. R. d Silva, Fuel 89 (2010) 531-534. [33] P. Canizares, J. Lobato, R. Paz, M. A. Rodrigo, C. Saez , Water Research 39 (2005) 2687–
2703 [34] Ch. Comninellis, A. De Battisti, Journal Chimie Physique 93 (1996) 673–679. [35] F. Bonfatti, S. Ferro, F. Lavezzo, M. Malacarne, G. Lodi, A. De Battisti, Journal of the
Electrochemical Society 147 (2000) 592 - 596 [36] F. Bonfatti, A. De Battisti, S. Ferro, G. Lodi, S. Osti, Electrochimica Acta 46 (2000) 305 - 314 [37] A. Vacca, M. Mascia, S. Palmas, A. Da Pozzo, Journal of Applied Electrochemical 41 (2011)
1087–1097. [38] P. Cañizares, C. Sáez, A. Sánchez-Carretero, M.A. Rodrigo, Journal of Applied
Electrochemistry 39 (2009) 2143.
© 2014 by the authors; licensee IAPC, Zagreb, Croatia. This article is an open-access article distributed under the terms and conditions of the Creative Commons Attribution license
(http://creativecommons.org/licenses/by/4.0/)
doi: 10.5599/jese. 2014.0065 271
J. Electrochem. Sci. Eng. 4(4) (2014) 271-283; doi: 10.5599/jese.2014.0065
Open Access : : ISSN 1847-9286
www.jESE-online.org
Original scientific paper
Influence of operating parameters on electrocoagulation of C.I. disperse yellow 3
Djamel Ghernaout*,**,, Abdulaziz Ibraheem Al-Ghonamy**, Mohamed Wahib Naceur*, Noureddine Ait Messaoudene** and Mohamed Aichouni**
*Department of Chemical Engineering, University of Blida, PO Box 270, Blida 09000, Algeria
**Binladin Research Chair on Quality and Productivity Improvement in the Construction Industry; College of Engineering, University of Hail, PO Box 2440, Ha’il 81441, Saudi Arabia
Corresponding Author: E-mail: [email protected] Tel.: +213-025-433-631; Fax: +213-025-433-631
Received: July 24, 2014; Revised: August 14, 2014; Published: December 6, 2014
Abstract This work deals with the electrocoagulation (EC) process for an organic dye removal. The chosen organic dye is C.I. disperse yellow 3 (DY) which is used in textile industry. Experiments were performed in batch mode using Al electrodes and for comparison purposes Fe electrodes. The experimental set-up was composed of 1 L beaker, two identical electrodes which are separated 2 cm from each other. The main operating parameters influencing EC process were examined such as pH, supporting electrolyte concentration CNaCl, current density i, and DY concentration. High performance EC process was shown during 45 min for 200 mg/L dye concentration at i = 350 A m-2 (applied voltage 12 V) and CNaCl = 1 g L-1 reaching 98 % for pHs 3 and 10 and 99 % for pH 6. After 10 min, DY was also efficiently removed (86 %) showing that EC process may be conveniently applied for textile industry wastewater treatment. EC using Fe electrodes exhibited slightly lower performance comparing EC using Al electrodes.
Keywords: Dye removal; aluminium; iron; current density; mechanism.
Introduction
The main problem of access to safe drinking water is continuous pollution of water resources by
agriculture, urban waste and industry. In countries where water resources are relatively limited,
treated wastewater reuse in agriculture has become an urgent necessity. The textile industry
consumes considerable amounts of water in the dyeing and finishing. Effluents containing dyes
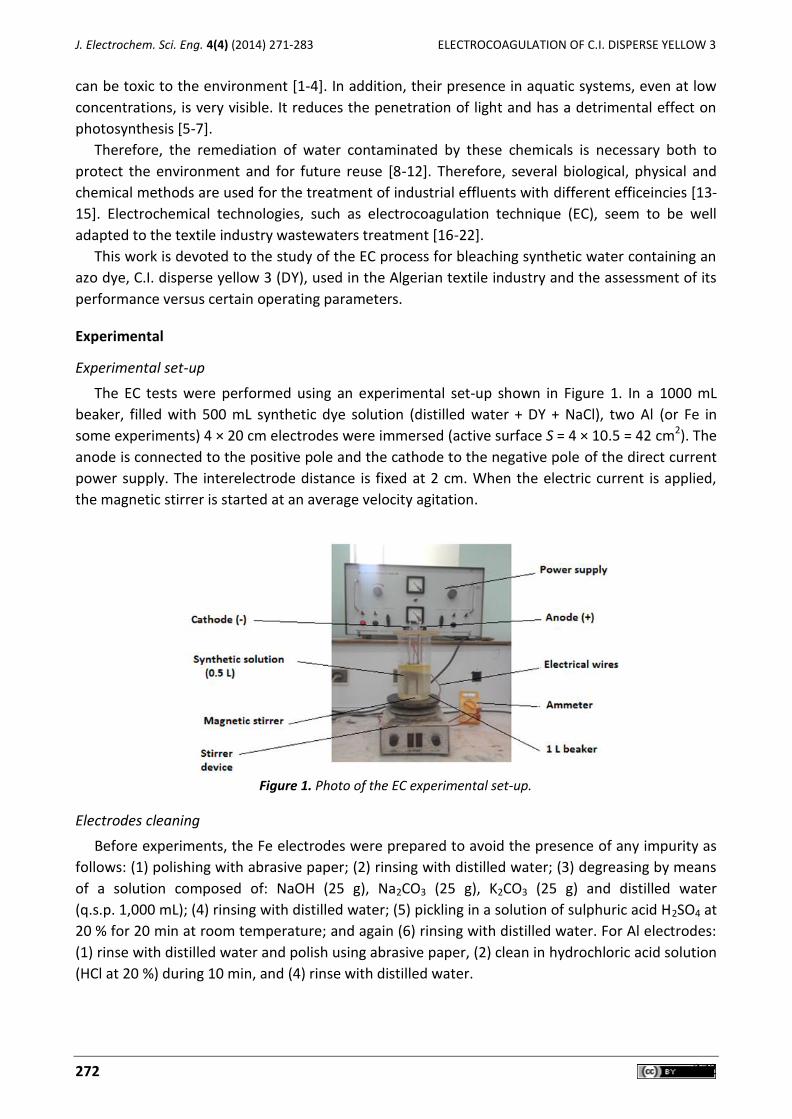
J. Electrochem. Sci. Eng. 4(4) (2014) 271-283 ELECTROCOAGULATION OF C.I. DISPERSE YELLOW 3
272 272
can be toxic to the environment [1-4]. In addition, their presence in aquatic systems, even at low
concentrations, is very visible. It reduces the penetration of light and has a detrimental effect on
photosynthesis [5-7].
Therefore, the remediation of water contaminated by these chemicals is necessary both to
protect the environment and for future reuse [8-12]. Therefore, several biological, physical and
chemical methods are used for the treatment of industrial effluents with different efficeincies [13-
15]. Electrochemical technologies, such as electrocoagulation technique (EC), seem to be well
adapted to the textile industry wastewaters treatment [16-22].
This work is devoted to the study of the EC process for bleaching synthetic water containing an
azo dye, C.I. disperse yellow 3 (DY), used in the Algerian textile industry and the assessment of its
performance versus certain operating parameters.
Experimental
Experimental set-up
The EC tests were performed using an experimental set-up shown in Figure 1. In a 1000 mL
beaker, filled with 500 mL synthetic dye solution (distilled water + DY + NaCl), two Al (or Fe in
some experiments) 4 × 20 cm electrodes were immersed (active surface S = 4 × 10.5 = 42 cm2). The
anode is connected to the positive pole and the cathode to the negative pole of the direct current
power supply. The interelectrode distance is fixed at 2 cm. When the electric current is applied,
the magnetic stirrer is started at an average velocity agitation.
Figure 1. Photo of the EC experimental set-up.
Electrodes cleaning
Before experiments, the Fe electrodes were prepared to avoid the presence of any impurity as
follows: (1) polishing with abrasive paper; (2) rinsing with distilled water; (3) degreasing by means
of a solution composed of: NaOH (25 g), Na2CO3 (25 g), K2CO3 (25 g) and distilled water
(q.s.p. 1,000 mL); (4) rinsing with distilled water; (5) pickling in a solution of sulphuric acid H2SO4 at
20 % for 20 min at room temperature; and again (6) rinsing with distilled water. For Al electrodes:
(1) rinse with distilled water and polish using abrasive paper, (2) clean in hydrochloric acid solution
(HCl at 20 %) during 10 min, and (4) rinse with distilled water.
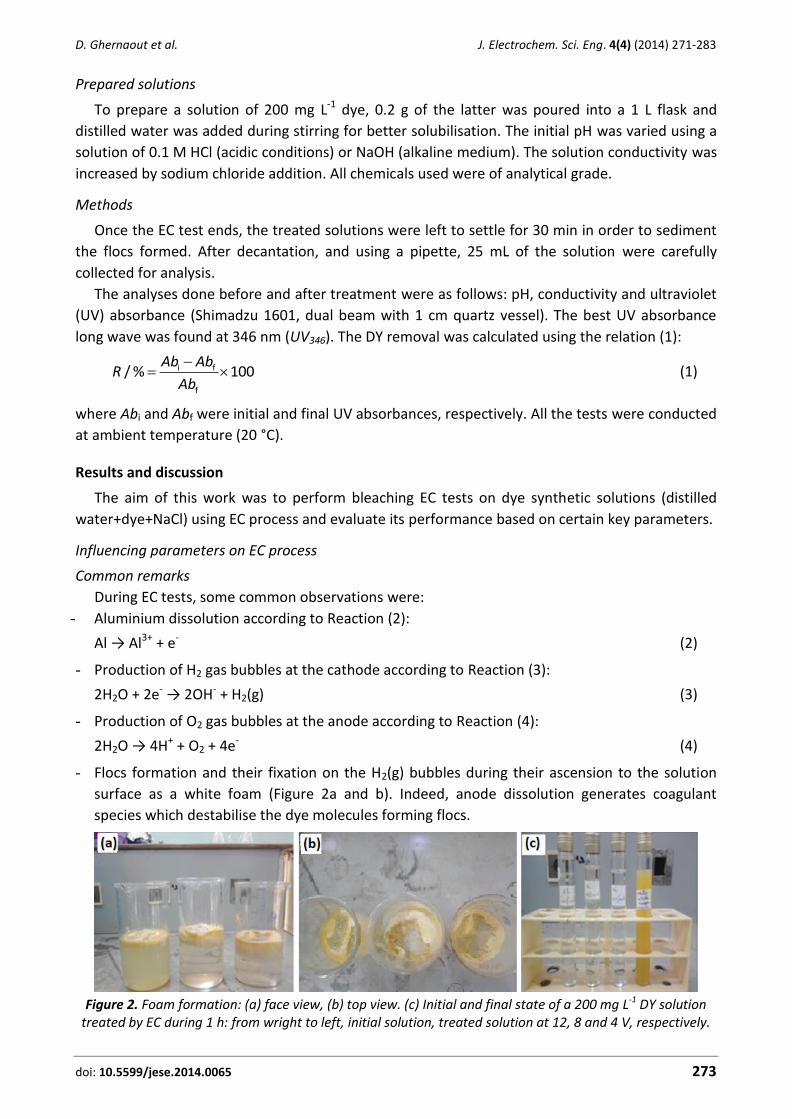
D. Ghernaout et al. J. Electrochem. Sci. Eng. 4(4) (2014) 271-283
doi: 10.5599/jese.2014.0065 273
Prepared solutions
To prepare a solution of 200 mg L-1 dye, 0.2 g of the latter was poured into a 1 L flask and
distilled water was added during stirring for better solubilisation. The initial pH was varied using a
solution of 0.1 M HCl (acidic conditions) or NaOH (alkaline medium). The solution conductivity was
increased by sodium chloride addition. All chemicals used were of analytical grade.
Methods
Once the EC test ends, the treated solutions were left to settle for 30 min in order to sediment
the flocs formed. After decantation, and using a pipette, 25 mL of the solution were carefully
collected for analysis.
The analyses done before and after treatment were as follows: pH, conductivity and ultraviolet
(UV) absorbance (Shimadzu 1601, dual beam with 1 cm quartz vessel). The best UV absorbance
long wave was found at 346 nm (UV346). The DY removal was calculated using the relation (1):
i f
f
/ % 100Ab Ab
RAb
(1)
where Abi and Abf were initial and final UV absorbances, respectively. All the tests were conducted
at ambient temperature (20 °C).
Results and discussion
The aim of this work was to perform bleaching EC tests on dye synthetic solutions (distilled
water+dye+NaCl) using EC process and evaluate its performance based on certain key parameters.
Influencing parameters on EC process
Common remarks
During EC tests, some common observations were:
- Aluminium dissolution according to Reaction (2):
Al → Al3+ + e- (2)
- Production of H2 gas bubbles at the cathode according to Reaction (3):
2H2O + 2e- → 2OH- + H2(g) (3)
- Production of O2 gas bubbles at the anode according to Reaction (4):
2H2O → 4H+ + O2 + 4e- (4)
- Flocs formation and their fixation on the H2(g) bubbles during their ascension to the solution
surface as a white foam (Figure 2a and b). Indeed, anode dissolution generates coagulant
species which destabilise the dye molecules forming flocs.
Figure 2. Foam formation: (a) face view, (b) top view. (c) Initial and final state of a 200 mg L-1 DY solution
treated by EC during 1 h: from wright to left, initial solution, treated solution at 12, 8 and 4 V, respectively.

J. Electrochem. Sci. Eng. 4(4) (2014) 271-283 ELECTROCOAGULATION OF C.I. DISPERSE YELLOW 3
274 274
EC time
The EC efficiency is strongly influenced by the time residence in the electrochemical device. To
study its effect, the EC period was varied from 5 to 75 min and the other parameters were kept
constant. The results obtained are illustrated in Figure 3. The H2 and O2 release and flocs
formation increased over time and the foam became thicker. From 30 min, the flocs settled and
the solution became clearer.
As seen in Figure 3, the dye removal efficiency increased with electrolysis time until 45 min.
After this time, EC performance decreased. Moreover, the good EC efficiencies were reached
between 15 and 45 min.
The removal efficiency was directly dependent upon the metal concentration in solution [23-
25]. The positive metallic species were produced by the Al anode neutralising the negative charges
on the polluting molecules [26-30]. When the electrolysis duration was increased, the cationic
species as well as metal hydroxide (Al(OH)3(s)) concentrations increased [30-32]. Consequently, the
pollutant removal increased [33-36].
Figure 3. Dye removal as a function of EC time (pH 6.5; CNaCl = 1 g L-1; CDY = 20 mg L-1; d = 2 cm).
Electric current density
The electric current density is the most important parameter of the electrochemical
process [37]. The electric current density effect on the dye removal was studied. The current
intensities were 120, 250 and 350 mA corresponding to the applied voltages of 4, 8 and 12 V,
respectively. The dye concentration was fixed at 20 and 200 mg/L. The other parameters were
maintained constant (pH 6.5; CNaCl = 1 g/L; d = 2 cm). The obtained results are shown in Figure 4.
For I = 120 mA (i = 29 A/m2), the produced gas bubbles were small and the formed froth was
thin. For I = 250 mA (i = 60 A/m2), the gas emanation was medium and the formed froth became
important. For I = 350 mA (i = 83 A/m2), flocs settling became significant, the gas emanation
became intense and the solution was transformed clear.
As seen in Figure 4, the electric current had a great effect on the dye removal especially for the
first ten minutes. After 20 min, the electric current had a small effect. This is explained by the fact
that the negative charge on the organic dye is neutralised after the Al3+ action on the dye
molecules.
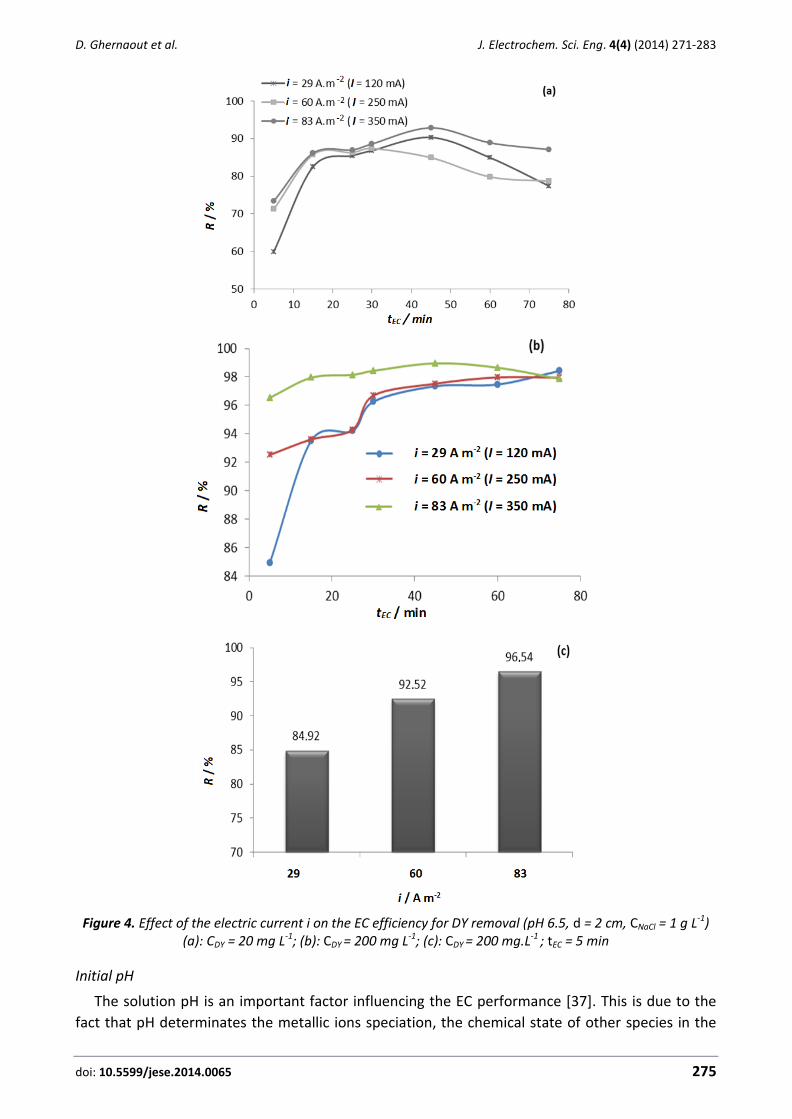
D. Ghernaout et al. J. Electrochem. Sci. Eng. 4(4) (2014) 271-283
doi: 10.5599/jese.2014.0065 275
Figure 4. Effect of the electric current i on the EC efficiency for DY removal (pH 6.5, d = 2 cm, CNaCl = 1 g L-1)
(a): CDY = 20 mg L-1; (b): CDY = 200 mg L-1; (c): CDY = 200 mg.L-1 ; tEC = 5 min
Initial pH
The solution pH is an important factor influencing the EC performance [37]. This is due to the
fact that pH determinates the metallic ions speciation, the chemical state of other species in the

J. Electrochem. Sci. Eng. 4(4) (2014) 271-283 ELECTROCOAGULATION OF C.I. DISPERSE YELLOW 3
276 276
solution, and the formed products solubility. In order to examine the pH effect, the solution pH
was adjusted to the values from 3 to 12 maintaining other parameters constant: U = 12 V
(I = 83 A m-2), CNaCl = 1 g L-1, d = 2 cm, tEC = 30 min). The obtained results are shown in Figure 5.
Figure 5. Effect of the pH on the EC efficiency for DY removal
(CDY = 200 mg L-1, U = 12 V (i = 83 A m-2); tEC = 30 min; d = 2 cm).
For the acidic medium, the solution colour became orange after the addition of HCl. From the
cathode, there is an intense emanation of H2 bubbles. From the anode, there is an important
formation of O2 bubbles. The foam and sediment formed are denser at the anode.
For the alkaline medium, there was formation of white sediment at the bottom of the beaker,
and its volume increased with time in comparison with the acidic medium.
As seen in Figure 5, we noted that the dye removal was well performed between pH 3 and 10.
Several researchers found that the best removal efficiency with aluminum electrodes was reached
in the pH range between 3 and 9 [19,34-36].
In Figure 6, we chose four pH values: 3, 4, 6.5 and 10 with other parameters fixed in order to
illustrate the pH effect.
We also followed the change in pH as a function of time; Figure 7 shows the obtained results.
The medium pH changed during the EC process. This change depended on the type of electrode
material and the initial pH of the treated solution.
We note from Figure 7 an increase in pH in the case of solutions with pH < 7. This increase was
probably due to the release of H2 from the cathode and the formation of OH- according to the
Reaction (3). Moreover, a decrease in pH in the case of solutions with pH > 7 was also noticed. This
decrease was affected to the hydroxyl (OH-) consumption according to Reaction (5):
Al(OH)3(aq) + OH-(aq) → Al(OH)4-(aq) (5)
Initial conductivity
Conductivity promotes the performance of electrochemical processes [26]. We chose NaCl as a
supporting electrolyte. In order to determine its effect on the efficiency of bleaching of the
synthetic solutions, we varied the concentration (0.25, 0.5, 1 and 1.5 g L-1) while keeping the other
parameters constant. The results are shown in Figure 8.
We have observed that (1) the gas production becomes higher with the increase in salt
concentration, (2) the conductivity decreases during EC treatment and, (3) the formation of a small
deposit on the anode.
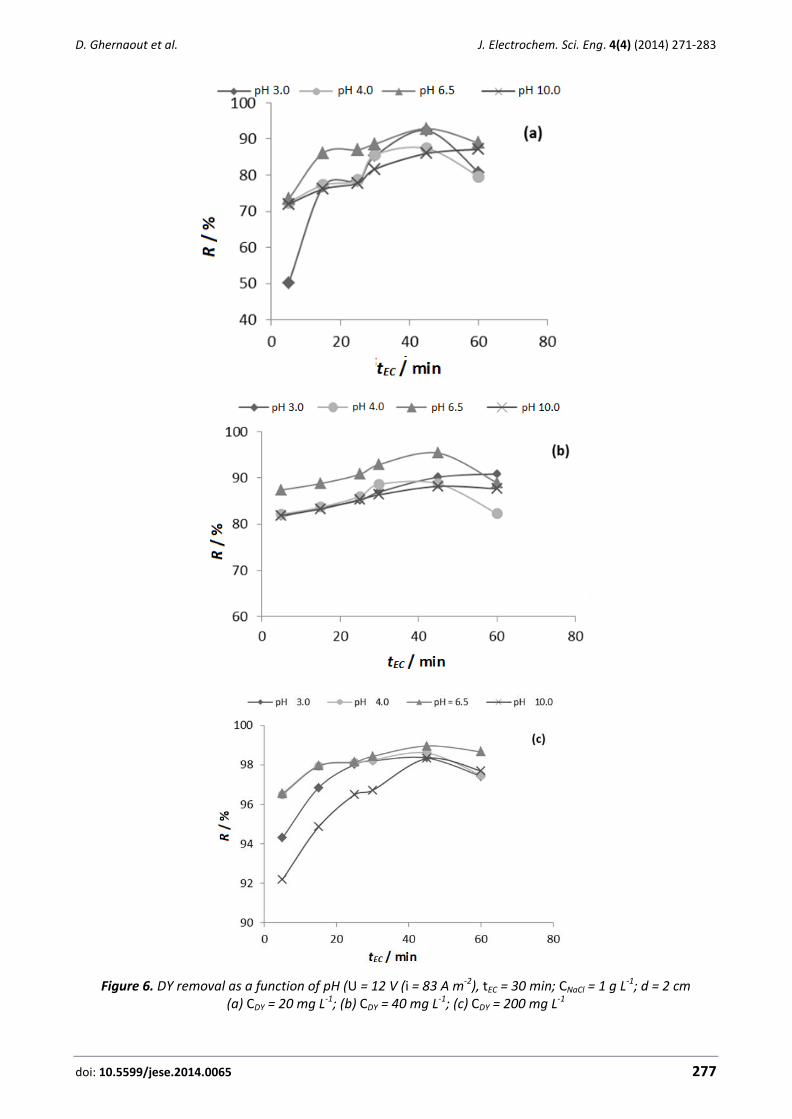
D. Ghernaout et al. J. Electrochem. Sci. Eng. 4(4) (2014) 271-283
doi: 10.5599/jese.2014.0065 277
Figure 6. DY removal as a function of pH (U = 12 V (i = 83 A m-2), tEC = 30 min; CNaCl = 1 g L-1; d = 2 cm
(a) CDY = 20 mg L-1; (b) CDY = 40 mg L-1; (c) CDY = 200 mg L-1
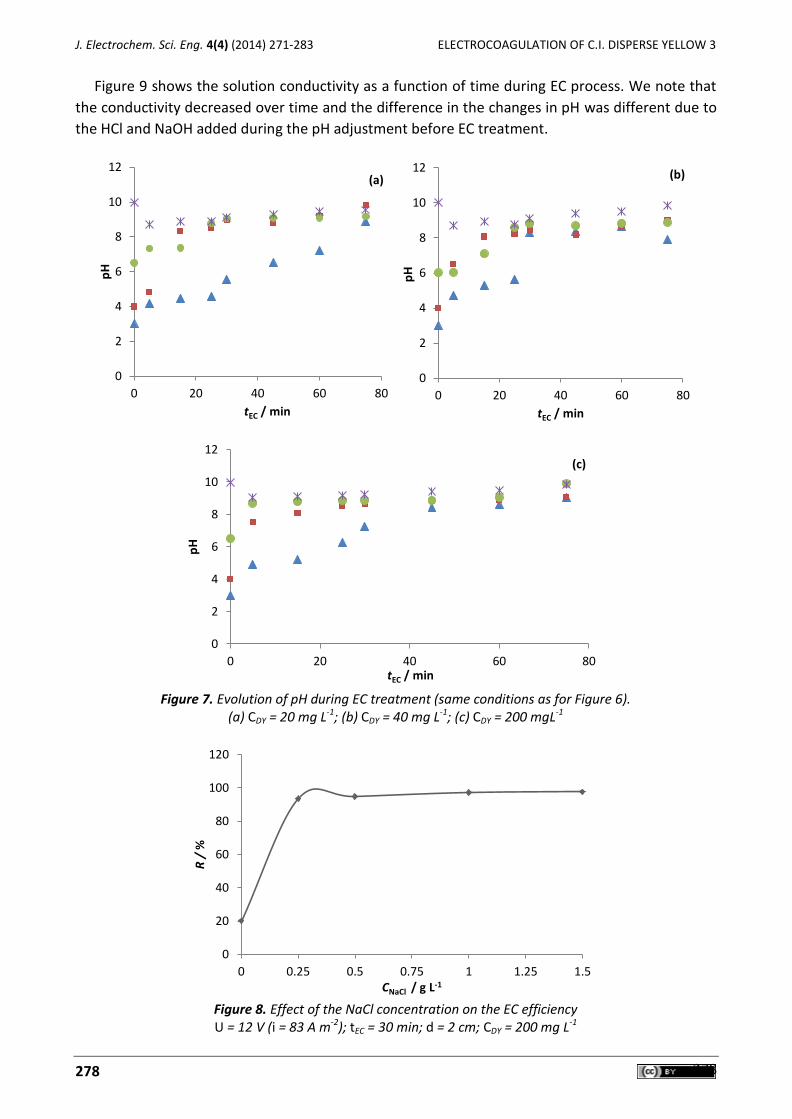
J. Electrochem. Sci. Eng. 4(4) (2014) 271-283 ELECTROCOAGULATION OF C.I. DISPERSE YELLOW 3
278 278
Figure 9 shows the solution conductivity as a function of time during EC process. We note that
the conductivity decreased over time and the difference in the changes in pH was different due to
the HCl and NaOH added during the pH adjustment before EC treatment.
Figure 7. Evolution of pH during EC treatment (same conditions as for Figure 6).
(a) CDY = 20 mg L-1; (b) CDY = 40 mg L-1; (c) CDY = 200 mgL-1
Figure 8. Effect of the NaCl concentration on the EC efficiency U = 12 V (i = 83 A m-2); tEC = 30 min; d = 2 cm; CDY = 200 mg L-1
0
2
4
6
8
10
12
0 20 40 60 80
pH
tEC / min
(a)
0
2
4
6
8
10
12
0 20 40 60 80p
H
tEC / min
(b)
0
2
4
6
8
10
12
0 20 40 60 80
pH
tEC / min
(c)
0
20
40
60
80
100
120
0 0.25 0.5 0.75 1 1.25 1.5
R /
%
CNaCl / g L-1

D. Ghernaout et al. J. Electrochem. Sci. Eng. 4(4) (2014) 271-283
doi: 10.5599/jese.2014.0065 279
Figure 9. Solution conductivity as a function of time during EC process
(CNaCl = 1 g L-1; CDY = 200 mg L-1; d = 2 cm; U = 12 V (i = 83 A-2)
Inter-electrode distance
We varied the distance between the electrodes d = 0.8; 1; 1.5 and 2 cm while fixing the other
factors. The results are shown in Figure 10. When increasing the inter-electrode distance, the EC
efficiency also increased. This can be explained as follows: for d = 2 cm, there would be more
probabilities to generate global flocs that are able to adsorb more dye molecules.
Figure 10. Effect of the inter-electrode distance on the EC performance
(CNaCl = 1 g L-1, CDY = 200 mg L-1, pH = 6.5, U = 12 V (i = 83 A m-2).
DY concentration
The aim of this part is to determine whether the EC method was applicable to solutions with a
range of concentrations from 20 to 500 mg L-1. The solutions were electrolysed, for a treatment
time of 45 min, at a fixed voltage U = 12 V (i = 83 A m-2) and an inter-electrode distance of 2 cm.
The results obtained are shown in Fig. 11.
Figure 11 shows that the EC method is effective in the range of selected concentrations. A yield
of 97 % is reached at a dye concentration of 200 mg L-1. The results obtained can be justified by
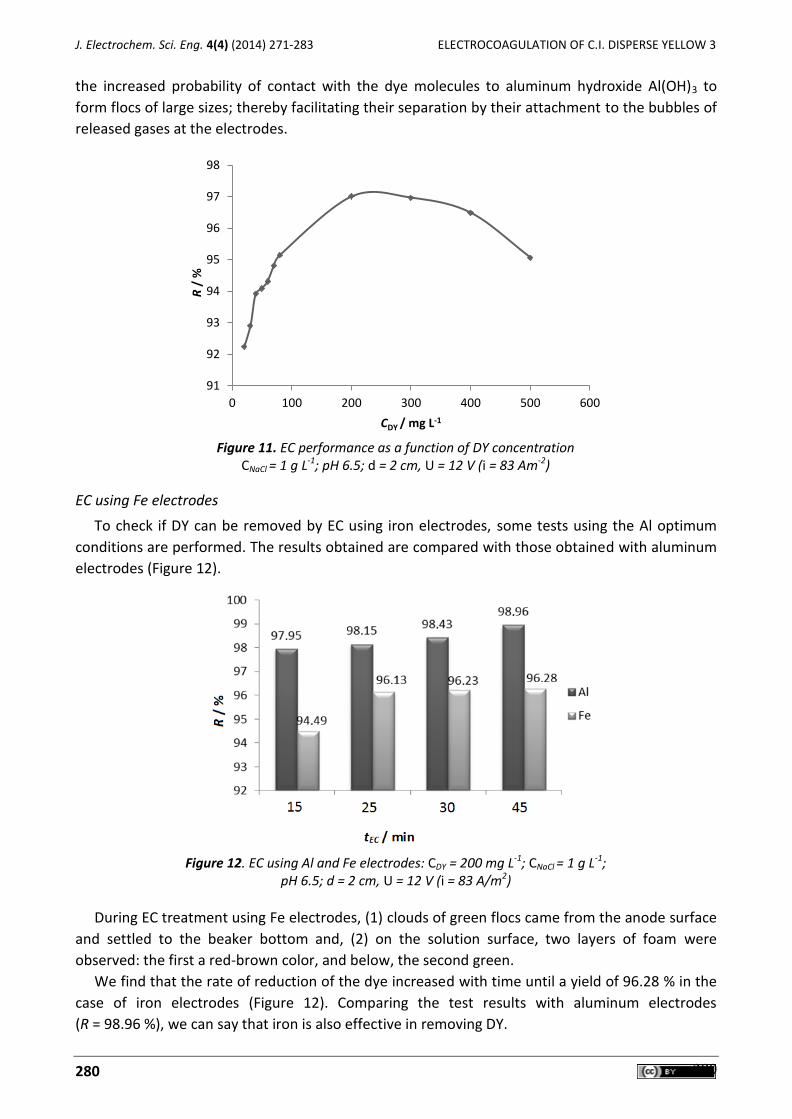
J. Electrochem. Sci. Eng. 4(4) (2014) 271-283 ELECTROCOAGULATION OF C.I. DISPERSE YELLOW 3
280 280
the increased probability of contact with the dye molecules to aluminum hydroxide Al(OH)3 to
form flocs of large sizes; thereby facilitating their separation by their attachment to the bubbles of
released gases at the electrodes.
Figure 11. EC performance as a function of DY concentration
CNaCl = 1 g L-1; pH 6.5; d = 2 cm, U = 12 V (i = 83 Am-2)
EC using Fe electrodes
To check if DY can be removed by EC using iron electrodes, some tests using the Al optimum
conditions are performed. The results obtained are compared with those obtained with aluminum
electrodes (Figure 12).
Figure 12. EC using Al and Fe electrodes: CDY = 200 mg L-1; CNaCl = 1 g L-1; pH 6.5; d = 2 cm, U = 12 V (i = 83 A/m2)
During EC treatment using Fe electrodes, (1) clouds of green flocs came from the anode surface
and settled to the beaker bottom and, (2) on the solution surface, two layers of foam were
observed: the first a red-brown color, and below, the second green.
We find that the rate of reduction of the dye increased with time until a yield of 96.28 % in the
case of iron electrodes (Figure 12). Comparing the test results with aluminum electrodes
(R = 98.96 %), we can say that iron is also effective in removing DY.
91
92
93
94
95
96
97
98
0 100 200 300 400 500 600
R /
%
CDY / mg L-1
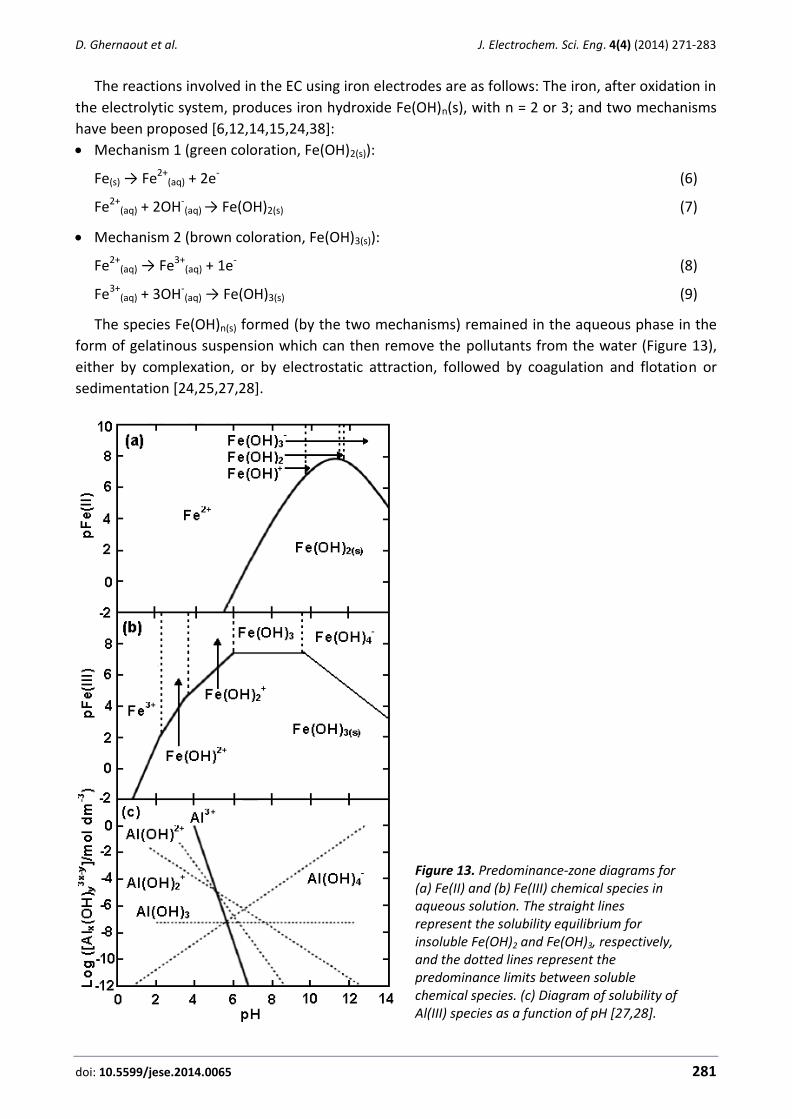
D. Ghernaout et al. J. Electrochem. Sci. Eng. 4(4) (2014) 271-283
doi: 10.5599/jese.2014.0065 281
The reactions involved in the EC using iron electrodes are as follows: The iron, after oxidation in
the electrolytic system, produces iron hydroxide Fe(OH)n(s), with n = 2 or 3; and two mechanisms
have been proposed [6,12,14,15,24,38]:
Mechanism 1 (green coloration, Fe(OH)2(s)):
Fe(s) → Fe2+(aq) + 2e- (6)
Fe2+(aq) + 2OH-
(aq) → Fe(OH)2(s) (7)
Mechanism 2 (brown coloration, Fe(OH)3(s)):
Fe2+(aq) → Fe3+
(aq) + 1e- (8)
Fe3+(aq) + 3OH-
(aq) → Fe(OH)3(s) (9)
The species Fe(OH)n(s) formed (by the two mechanisms) remained in the aqueous phase in the
form of gelatinous suspension which can then remove the pollutants from the water (Figure 13),
either by complexation, or by electrostatic attraction, followed by coagulation and flotation or
sedimentation [24,25,27,28].
Figure 13. Predominance-zone diagrams for (a) Fe(II) and (b) Fe(III) chemical species in aqueous solution. The straight lines represent the solubility equilibrium for insoluble Fe(OH)2 and Fe(OH)3, respectively, and the dotted lines represent the predominance limits between soluble chemical species. (c) Diagram of solubility of Al(III) species as a function of pH [27,28].
J. Electrochem. Sci. Eng. 4(4) (2014) 271-283 ELECTROCOAGULATION OF C.I. DISPERSE YELLOW 3
282 282
Conclusions
Highly performant EC process is shown in dye removal during 45 min for 200 mg/L dye
concentration at i = 350 A/m2 (applied voltage 12 V) and CNaCl = 1 g/L reaching 98 % for pH 3 and
10 and 99 % for pH 6. For 10 min, DY is also efficiently removed (86 %) showing that EC process
may be well convenient for textile industry wastewater treatment. EC using Fe electrodes is
slightly less performant than EC using Al electrodes.
Acknowledgements: The present research work was undertaken by the Binladin Research Chair on Quality and Productivity Improvement in the Construction Industry funded by the Saudi Binladin Constructions Group; this is gratefully acknowledged. The opinions and conclusions presented in this paper are those of the authors and do not necessarily reflect the views of the sponsoring organisation.
References
[1] A. R. Amani-Ghadim, S. Aber, A. Olad, H. Ashassi-Sorkhabi, Chemical Engineering and Processing 64 (2013) 68-78.
[2] W. Lemlikchi, S. Khaldi, M.O. Mecherri, H. Lounici, N. Drouiche, Separation Science and Technology 47 (2012) 1682-1688.
[3] M. S. Secula, B. Cagnon, T. F. de Oliveira, O. Chedeville, H. Fauduet, Journal of the Taiwan Institute of Chemical Engineers 43 (2012) 767-775.
[4] B. Merzouk, B. Gourich, K. Madani, Ch. Vial, A. Sekki, Desalination 272 (2011) 246-253. [5] M. Kobya, E. Demirbas, O. T. Can, M. Bayramoglu, Journal of Hazardous Materials B132
(2006) 183-188. [6] A. Aleboyeh, N. Daneshvar, M. B. Kasiri, Chemical Engineering and Processing 47 (2008)
827-832. [7] S. Zodi, B. Merzouk, O. Potier, F. Lapicque, J.-P. Leclerc, Separation and Purification
Technology 108 (2013) 215-222. [8] M. Eyvaz, M. Kirlaroglu, T. S. Aktas, E. Yuksel, Chemical Engineering Journal 153 (2009) 16-
22. [9] E. Pajootan, M. Arami, N. M. Mahmoodi, Journal of the Taiwan Institute of Chemical
Engineers 43 (2012) 282-290. [10] M.-C. Wei, K.-S. Wang, C.-L. Huang, C.-W. Chiang, T.-J. Chang, S.-S. Lee, S.-H. Chang,
Chemical Engineering Journal 192 (2012) 37-44. [11] C. Phalakornkule, P. Sukkasem, C. Mutchimsattha, International Journal of Hydrogen Energy
35 (2010) 10934-10943. [12] M. Chafi, B. Gourich, A. H. Essadki, C. Vial, A. Fabregat, Desalination 281 (2011) 285-292. [13] P. Cañizares, F. Martínez, M.A. Rodrigo, C. Jiménez, C. Sáez, J. Lobato, Separation and
Purification Technology 60 (2008) 147-154. [14] C. Gong, Z. Zhang, H. Li, D. Li, B. Wu,Y. Sun, Y. Cheng, Journal of Hazardous Materials 274
(2014) 465-472. [15] J. Llanos, S. Cotillas, P. Cañizares, M.A. Rodrigo, Water Research 53 (2014) 329-338. [16] S. Pulkka, M. Martikainen, A. Bhatnagar, M. Sillanpää, Separation and Purification
Technology 132 (2014) 252-271. [17] E-S. Z. El-Ashtoukhy, N.K. Amin, Journal of Hazardous Materials 179 (2010) 113-119. [18] A. K. Golder, N. Hridaya, A. N. Samanta, S. Ray, Journal of Hazardous Materials B127 (2005)
134-140. [19] S. Aoudj, A. Khelifa, N. Drouiche, M. Hecini, H. Hamitouche, Chemical Engineering and
Processing 49 (2010) 1176-1182. [20] Y. Ş Yildiz, Journal of Hazardous Materials 153 (2008) 194-200.
D. Ghernaout et al. J. Electrochem. Sci. Eng. 4(4) (2014) 271-283
doi: 10.5599/jese.2014.0065 283
[21] C.-L. Yang, J. McGarrahan, Journal of Hazardous Materials B127 (2005) 40-47. [22] J. G. Ibanez, M. M. Singh, Z. Szafran, Journal of Chemical Education 75 (1998) 1040-1041. [23] D. Ghernaout, S. Irki, A. Boucherit, Desalination and Water Treatment 52 (2014) 3256-3270. [24] D. Ghernaout, Desalination and Water Treatment 51 (2013) 7536-7554. [25] D. Ghernaout, M. W. Naceur, B. Ghernaout, Desalination and Water Treatment 28 (2011)
287-320. [26] D. Ghernaout, B. Ghernaout, Desalination and Water Treatment 27 (2011) 243-254. [27] D. Ghernaout, M.W. Naceur, A. Aouabed, Desalination 270 (2011) 9-22. [28] C. A. Martínez-Huitle, E. Brillas, Applied Catalysis B: Environmental 87 (2009) 105-145. [29] D. Ghernaout, A. Mariche, B. Ghernaout, A. Kellil, Desalination and Water Treatment 22
(2010) 311-329. [30] A. Saiba, S. Kourdali, B. Ghernaout, D. Ghernaout, Desalination and Water Treatment 16
(2010) 201-217. [31] D. Ghernaout, B. Ghernaout, Desalination and Water Treatment 16 (2010) 156-175. [32] D. Belhout, D. Ghernaout, S. Djezzar-Douakh, A. Kellil, Desalination and Water Treatment
16 (2010) 1-9. [33] D. Ghernaout, B. Ghernaout, A. Boucherit, M.W. Naceur, A. Khelifa, A. Kellil, Desalination
and Water Treatment 8 (2009) 91-99. [34] D. Ghernaout, A. Badis, A. Kellil, B. Ghernaout, Desalination 219 (2008) 118-125. [35] D. Ghernaout, B. Ghernaout, A. Saiba, A. Boucherit, A. Kellil, Desalination 239 (2009) 295-
308. [36] D. Ghernaout, B. Ghernaout, A. Boucherit, Journal of Dispersion Science and Technology 29
(2008) 1272-1275. [37] M. Muthukumar, M. Govindaraj, A. Muthusamy, G. Bhaskar Raju, Separation Science and
Technology 46 (2011) 272-282. [38] C. Barrera-Díaz, B. Bilyeu, G. Roa, L. Bernal-Martinez, Separation and Purification Reviews
40 (2011) 1-24.
© 2014 by the authors; licensee IAPC, Zagreb, Croatia. This article is an open-access article distributed under the terms and conditions of the Creative Commons Attribution license
(http://creativecommons.org/licenses/by/4.0/)


doi: 10.5599/jese.2014.0060 285
J. Electrochem. Sci. Eng. 4(4) (2014) 285-296; doi: 10.5599/jese.2014.0060
Open Access : : ISSN 1847-9286
www.jESE-online.org
Review
Enhanced electrocoagulation: New approaches to improve the electrochemical process
Carlos E. Barrera-Díaz, Gabriela Roa-Morales, Patricia Balderas Hernández, Carmen María Fernandez-Marchante* and Manuel Andrés Rodrigo*
Centro Conjunto de Investigación en Química Sustentable UAEM – UNAM, Carretera Toluca-Atlacomulco, km 14.5, Unidad El Rosedal, C.P. 50200, Toluca, Estado de México, México *Departartment of Chemical Engineering. Faculty of Chemical Sciences & Technologies, Enrique Costa Building, Campus Universitario s/n 13071 Ciudad Real, Spain
Corresponding Author: E-mail: [email protected]
Received: August 14, 2014; Published: December 6, 2014
Abstract Electrocoagulation is a promising technology for the removal of colloids from different types of wastewater and it has also demonstrated good efficiencies for the breaking-up of emulsions. It consists of the dissolution of aluminum or iron anodes, promoting the formation of coagulant reagents in wastewater that helps to coagulate pollutants and the formation of bubbles that favors the mixing (electroflocculation) and the removal of suspended solids by flotation (electroflotation). During the recent years, the combination of this technology with other treatment technologies has become a hot topic looking for a synergistic improvement in the efficiencies. This work aims to review some of the more recent works regarding this topic, in particular the combination of electrocoagulation with ozonation, adsorption and ultrasound irradiation.
Keywords Electrocoagulation; ozonation; adsorption; ultrasound irradiation; pulse application
Introduction
Electrochemical treatment techniques have attracted a great deal of attention because of their
versatility and environmental compatibility. Electrochemical reactions take place at the anode and
the cathode of an electrolytic cell when an external direct current voltage is applied. In fact, the
main reagent is the electron, which is a “clean reagent”[1,2] and this fact helps to explain the
lower production of wastes associated to these technologies. Applications studied in the recent
years range from the oxidation of organic pollutants contained in wastewater to the
electroremediation of soils.
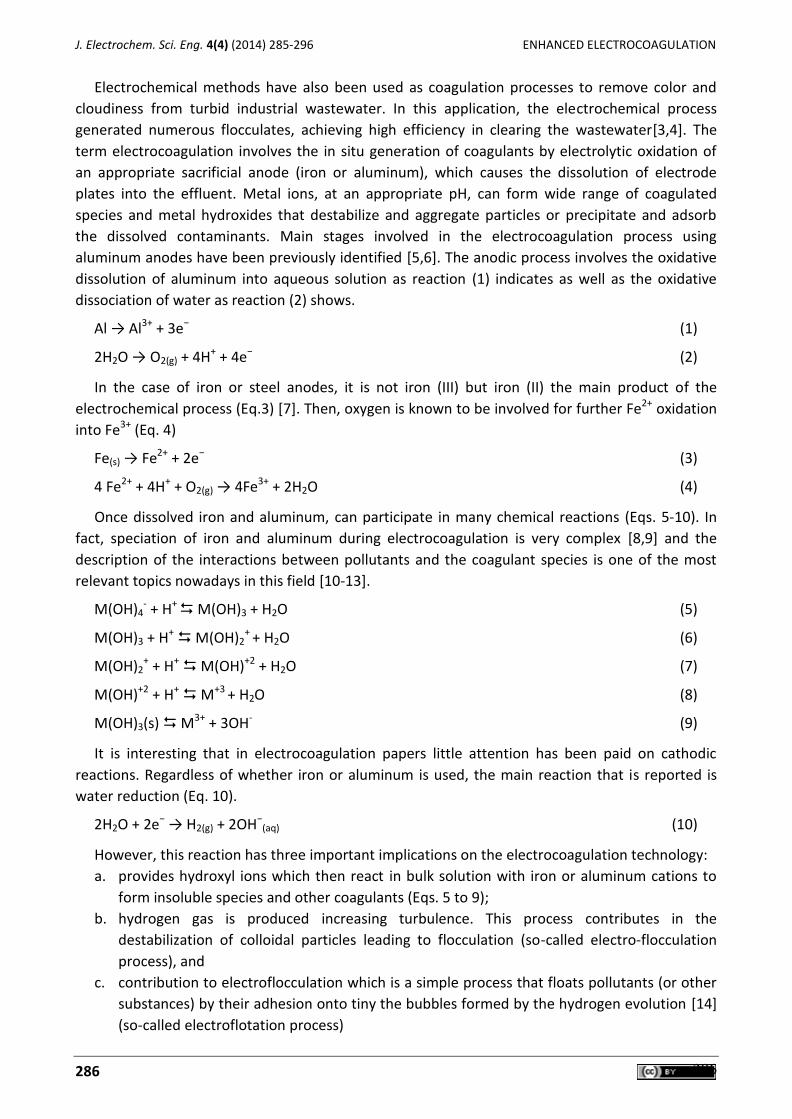
J. Electrochem. Sci. Eng. 4(4) (2014) 285-296 ENHANCED ELECTROCOAGULATION
286 286
Electrochemical methods have also been used as coagulation processes to remove color and
cloudiness from turbid industrial wastewater. In this application, the electrochemical process
generated numerous flocculates, achieving high efficiency in clearing the wastewater[3,4]. The
term electrocoagulation involves the in situ generation of coagulants by electrolytic oxidation of
an appropriate sacrificial anode (iron or aluminum), which causes the dissolution of electrode
plates into the effluent. Metal ions, at an appropriate pH, can form wide range of coagulated
species and metal hydroxides that destabilize and aggregate particles or precipitate and adsorb
the dissolved contaminants. Main stages involved in the electrocoagulation process using
aluminum anodes have been previously identified [5,6]. The anodic process involves the oxidative
dissolution of aluminum into aqueous solution as reaction (1) indicates as well as the oxidative
dissociation of water as reaction (2) shows.
Al → Al3+ + 3e− (1)
2H2O → O2(g) + 4H+ + 4e− (2)
In the case of iron or steel anodes, it is not iron (III) but iron (II) the main product of the
electrochemical process (Eq.3) [7]. Then, oxygen is known to be involved for further Fe2+ oxidation
into Fe3+ (Eq. 4)
Fe(s) → Fe2+ + 2e− (3)
4 Fe2+ + 4H+ + O2(g) → 4Fe3+ + 2H2O (4)
Once dissolved iron and aluminum, can participate in many chemical reactions (Eqs. 5-10). In
fact, speciation of iron and aluminum during electrocoagulation is very complex [8,9] and the
description of the interactions between pollutants and the coagulant species is one of the most
relevant topics nowadays in this field [10-13].
M(OH)4- + H+
M(OH)3 + H2O (5)
M(OH)3 + H+ M(OH)2+ + H2O (6)
M(OH)2+ + H+ M(OH)+2 + H2O (7)
M(OH)+2 + H+ M+3 + H2O (8)
M(OH)3(s) M3+ + 3OH- (9)
It is interesting that in electrocoagulation papers little attention has been paid on cathodic
reactions. Regardless of whether iron or aluminum is used, the main reaction that is reported is
water reduction (Eq. 10).
2H2O + 2e− → H2(g) + 2OH−(aq) (10)
However, this reaction has three important implications on the electrocoagulation technology:
a. provides hydroxyl ions which then react in bulk solution with iron or aluminum cations to
form insoluble species and other coagulants (Eqs. 5 to 9);
b. hydrogen gas is produced increasing turbulence. This process contributes in the
destabilization of colloidal particles leading to flocculation (so-called electro-flocculation
process), and
c. contribution to electroflocculation which is a simple process that floats pollutants (or other
substances) by their adhesion onto tiny the bubbles formed by the hydrogen evolution [14]
(so-called electroflotation process)

C. E. Barrera-Díaz et al. J. Electrochem. Sci. Eng. 4(4) (2014) 285-296
doi: 10.5599/jese.2014.0060 287
As a consequence of this complex interaction, the electrochemical cell combines several
processes at the same time in the same reactor and this becomes a significant advantage of this
type of processes as compared with conventional coagulation treatments. In particular, from the
economical point of view they compare favorably with coagulation processes [15-17] in many
applications.
As for coagulation processes, electrocoagulation highly depends on the wastewater pH and it
becomes a critical parameter in the performance of this technology. This parameter determines
the speciation of aluminum and iron and hence the primary coagulation mechanisms occurring in
the electrocoagulation cell. In fact, pH is one of the key differences between coagulation and
electrocoagulation as conventional coagulation acidifies the treated wastewater due to the acidic
properties of the typical coagulants dosed (iron chloride, aluminum sulfate, etc.), which are known
to behave as Lewis acid. These properties make necessary the neutralization of wastewater after
the coagulation treatment and this process implies an undesired increase in the salinity of the
effluent. On the other hand, electrocoagulation typically buffers the pH during the treatment in
values within the range 8-9, which should be a proper value even for direct discharge and no
further neutralization is required [18].
Recent studies shows many promising applications of electrocoagulation in the treatment of
lowland surface water [19], water [6,20,21], metal plating wastes [22], other types of industrial
wastewater [5,23-30], urban wastewater [31-33] and even in disinfection [34,35]. In fact, it is one
of the most promising environmental technologies based on electrochemical engineering [36,37].
Electrochemical methods offer two main advantages over traditional chemical treatment: less
coagulant ion is required and less sludge is formed [19,22,31]. In the recent years, the potential of
this technology is tried to be even further increased by the synergistic combination with other
treatment technologies. The objective of the present manuscript is to review the potential of
electrocoagulation for the treatment of industrial effluents coupling it with four types of
processes: Electrocoagulation-ozone processes
Electrocoagulation- adsorption processes
Electrocoagulation-ultrasound processes
Electrocoagulation-pulses processes
2. Electrocoagulation-ozone processes
Ozonation implies the use of ozone in the treatment of wastewater. Ozone is a strong oxidant
that oxidizes organic pollutants via two pathways: direct oxidation with ozone molecules and/or
the generation of free-radical intermediates, such as the •OH radical, which is a powerful,
effective, and non-selective oxidizing agent [38]. The ozonation process has the advantage of
being able to be applied when the flow rate and/or composition of the effluents are fluctuating.
However, the high cost of equipment and maintenance, as well as energy required to supply the
process, constitutes some of the disadvantages. Moreover, ozonation process requires the
transfer of ozone molecules from gas phase to liquid phase, where the attack on the organic
molecules occurs. Therefore, mass transfer limitations are also a relevant factor to be considered
in the oxidation process involving ozone. In many cases, the ozone consumption rate per unit of
volume can be so high that mass transfer is the limiting step, reducing the process efficiency and
increasing the operating costs [39]. In addition, the ozonation performance is affected by the
presence of organic matter, suspended solids, carbonate, bicarbonate and chlorine ions and also
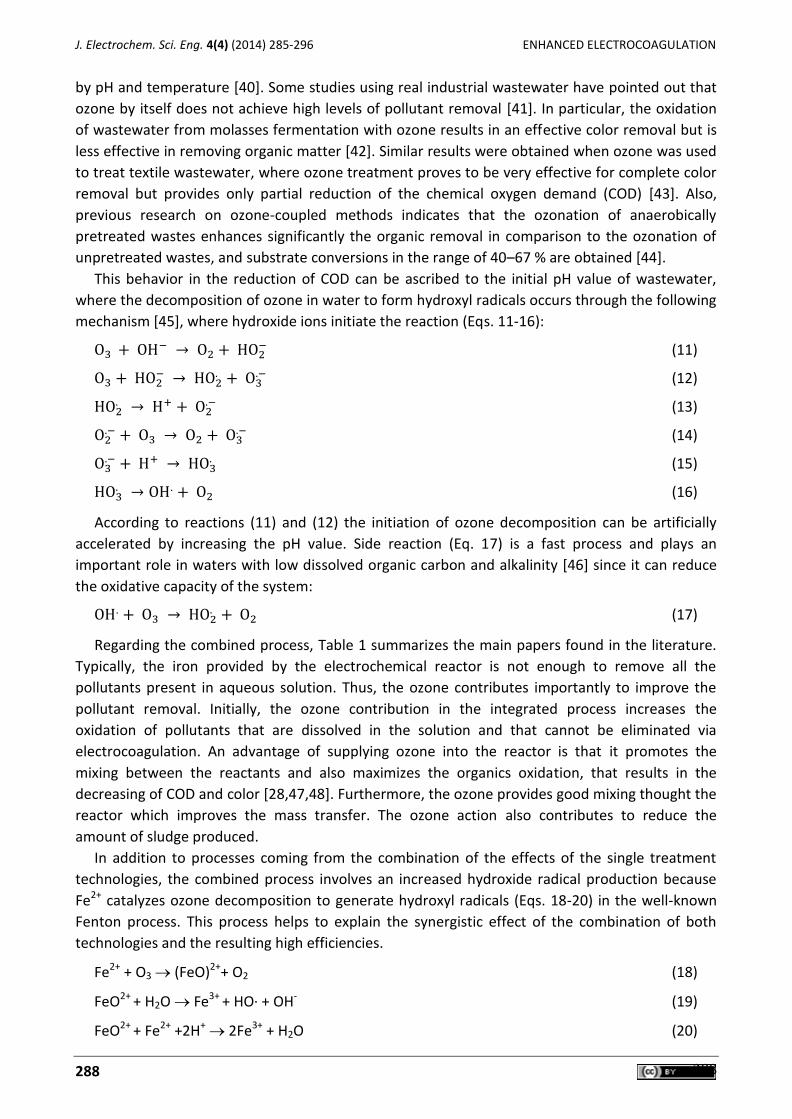
J. Electrochem. Sci. Eng. 4(4) (2014) 285-296 ENHANCED ELECTROCOAGULATION
288 288
by pH and temperature [40]. Some studies using real industrial wastewater have pointed out that
ozone by itself does not achieve high levels of pollutant removal [41]. In particular, the oxidation
of wastewater from molasses fermentation with ozone results in an effective color removal but is
less effective in removing organic matter [42]. Similar results were obtained when ozone was used
to treat textile wastewater, where ozone treatment proves to be very effective for complete color
removal but provides only partial reduction of the chemical oxygen demand (COD) [43]. Also,
previous research on ozone-coupled methods indicates that the ozonation of anaerobically
pretreated wastes enhances significantly the organic removal in comparison to the ozonation of
unpretreated wastes, and substrate conversions in the range of 40–67 % are obtained [44].
This behavior in the reduction of COD can be ascribed to the initial pH value of wastewater,
where the decomposition of ozone in water to form hydroxyl radicals occurs through the following
mechanism [45], where hydroxide ions initiate the reaction (Eqs. 11-16):
O3 + OH− → O2 + HO2− (11)
O3 + HO2− → HO2
. + O3.− (12)
HO2. → H+ + O2
.− (13)
O2.− + O3 → O2 + O3
.− (14)
O3.− + H+ → HO3
. (15)
HO3. → OH. + O2 (16)
According to reactions (11) and (12) the initiation of ozone decomposition can be artificially
accelerated by increasing the pH value. Side reaction (Eq. 17) is a fast process and plays an
important role in waters with low dissolved organic carbon and alkalinity [46] since it can reduce
the oxidative capacity of the system:
OH. + O3 → HO2. + O2 (17)
Regarding the combined process, Table 1 summarizes the main papers found in the literature.
Typically, the iron provided by the electrochemical reactor is not enough to remove all the
pollutants present in aqueous solution. Thus, the ozone contributes importantly to improve the
pollutant removal. Initially, the ozone contribution in the integrated process increases the
oxidation of pollutants that are dissolved in the solution and that cannot be eliminated via
electrocoagulation. An advantage of supplying ozone into the reactor is that it promotes the
mixing between the reactants and also maximizes the organics oxidation, that results in the
decreasing of COD and color [28,47,48]. Furthermore, the ozone provides good mixing thought the
reactor which improves the mass transfer. The ozone action also contributes to reduce the
amount of sludge produced.
In addition to processes coming from the combination of the effects of the single treatment
technologies, the combined process involves an increased hydroxide radical production because
Fe2+ catalyzes ozone decomposition to generate hydroxyl radicals (Eqs. 18-20) in the well-known
Fenton process. This process helps to explain the synergistic effect of the combination of both
technologies and the resulting high efficiencies.
Fe2+ + O3 (FeO)2++ O2 (18)
FeO2+ + H2O Fe3+ + HO· + OH- (19)
FeO2+ + Fe2+ +2H+ 2Fe3+ + H2O (20)
C. E. Barrera-Díaz et al. J. Electrochem. Sci. Eng. 4(4) (2014) 285-296
doi: 10.5599/jese.2014.0060 289
Table 1. Pollutant removal using coupled electrocoagulation - ozone processes
Wastewater Process Conditions Poll. Removal Ref.
C.I. Reactive Yellow 84 Ozone flow rate 20 mL min-1,
Iron electrodes; current density 15 mA cm-2
85 % TOC
100 % color [49]
Reactive Blue 19 Ozone flow rate 20 mL min-1,
Iron electrodes; current density 10 mA cm-2
80 % TOC
96 % Color [50]
Reactive Black 5 Ozone flow rate 20 mL min-1,
Iron electrodes; current density 10 mA cm-2
60 % COD
94 % Color
[51]
Distillery effluent Ozone flow rate 15 L min−1; initial pH 6
Iron electrodes; current density 3 Adm−2
83 % COD
100 % Color [52]
Industrial wastewater Ozone flow rate 23 L min−1; initial pH 7
Iron electrodes; current density 26 mA cm−2
63 % COD
90 % Turbidity [42]
Red MX-5B Ozone flow rate 0.5 L min−1; initial pH 6.1
Iron electrodes current density of 1.5 mA cm−2 100 % Color [53]
Boat pressure washing
wastewater
Iron and aluminium electrodes
current density 17 mA cm−2
88.46 %,TOC
76.28 % COD [54]
Acid Orange 6 azo
Dye
Ozone concentration 36 mg L−1; initial pH 4.5
Iron electrodes current density 88.6 mA cm−2
50 % TOC
80 % Color [55]
Main challenge for this technology is the scale-up. Most of the studies are at the lab-scale or
the bench-scale and typically efficiencies can be greatly improved if a proper scale up is carried
out. The design of the reactor seems to be a critical point because it fixes the flow patterns and
hence the interaction of the species formed by electrocoagulation with ozone. Another challenge
for this technology is the production of ozone by simultaneous anodic oxidation, taking advantage
of the possibilities of electrochemical technology to produce oxidants[56]. A good possibility could
be the use of cells equipped with bipolar cells such as the recently proposed by Llanos et al. [35]
3. Combined electrocoagulation- adsorption processes
Adsorption is a very well-known water and wastewater treatment process, which is gaining
prominence as a means of reducing metal ion and organic concentrations in industrial efflux-
ents [57]. The biosorbents derived from dead biomass, are considered the cheapest and most
abundant environmentally friendly option [58,59]. Nowadays, the development of inexpensive
adsorbents for the treatment of wastewater is an important area in the environmental
sciences [60,61].
The use of an electrochemical treatment in combination with adsorption as a pre-treatment
step to enhance adsorption capability of biosorbents has been assessed in many cases. However,
the applications must be carefully evaluated, because technical incompatibilities may arise. This
combined technology demonstrates a very good efficiency in the removal of many different
pollutants as it is shown in Table 2. The filtering capacity of the sorbent bed is an efficient
treatment to remove the suspended solids produced by the electrocoagulation process while
simultaneously it helps to remove all soluble pollutants that were not effectively trapped by the
flocs. Most of the studies select aluminum instead of iron as anode because aluminum coagulants
promotes neutralization coagulation processes instead of enmeshment into growing precipitates
which helps avoiding operational problems in the filtering system.
J. Electrochem. Sci. Eng. 4(4) (2014) 285-296 ENHANCED ELECTROCOAGULATION
290 290
Table 2. Pollutant removal using coupled electrocoagulation-adsorption processes
Wastewater Process Conditions Pollutant Removal Ref.
Cr(VI) Al electrodes, sorbent red onion skin, pH 3-6
97 % Cr [62]
Cardboard paper mill effluents
Al electrodes, current density 4.41 mA cm-2
sorbent granular activated carbon, pH 5.3
99 % COD [63]
Marine Blue Erionyl MR Al electrodes, sorbent granular activated carbon, pH 6.0
100 % dye [64]
Reactive Black 5 current density 277 A m
-2
sorbent granular activated carbon, pH 7 100 % dye, 100 % COD, 100% Toxicity
[65]
Cr(VI) Al-Fe, current density 26.7 mA cm
-2
Sorbent granular activated carbon 99 % Cr(VI) [66]
Indigo carmine Al electrodes Sorbent granular activated carbon
99 % Colorant [67]
Nakdong River Al electrodes, Al-fiber filter 65 % TOC [20]
Industrial Wastewater Al electrodes, current density 45.45 A m
−2
Sorbent Ectodermis of Opuntia, pH 8
84 % COD, 78 %, BOD5, 97 % color, 98 % turbidity, 99 % fecal coliforms
[68]
Thus, the coupling of electrochemical and adsorption processes might prove a judicious choice
for treating industrial wastewater with mixtures of different types of pollutants including both
organic and inorganic pollutants. This technology has also been studied in systems in which an
adsorbent bed used for the fast removal of pollution from wastewater is continuously regenerated
using electrolysis [69,70]. Efficiencies obtained are high enough to consider this technology as a
promising choice in the treatment of many effluents polluted with organic species. Most studied
found in the literature are carried out at the lab or bench-scale. As for the combination of
electrocoagulation with ozone, it is expected that with a proper scale-up, which develop an
efficient cell from the view point of the filtering, adsorption and electrochemical processes,
efficiencies obtained would be even higher.
4. Combined electrocoagulation-ultrasound processes
The treatment of wastewater in an electrolytic cell by ultrasound irradiation is expected to
improve significantly the kinetics and the effectiveness of the electrode processes taking place in
the cell [71-73]. A number of favorable impacts of using ultrasound in electrocoagulation are the
following: Destruction of the compact layer formed at the electrode surfaces by the products of
electrode reactions.
Decrease in the thickness of the diffuse part of the electrical double layer created at the
electrode surface.
Direct activation of the ions in the reaction zone at the electrodes by ultra-sound waves.
Activation of the electrode surfaces by means of generation of defects in the crystal lattices
of the electrodes.
Local augmentation of the temperature at the electrode surfaces as a result of friction
between the liquid and the surfaces.
However, the ultrasound used may cause a few negative effects directly related to the
purification process, such as the following: Destruction of a part of the obtained colloidal hydroxides by the action of the acoustic
waves. This means a diminution of the solid phase that takes part in the adsorption process
and a diminution of the removed contaminations respectively.
C. E. Barrera-Díaz et al. J. Electrochem. Sci. Eng. 4(4) (2014) 285-296
doi: 10.5599/jese.2014.0060 291
Destruction of a part of the formed adsorption layer at the surface of the colloidal particles
and possible return of the adsorbed ions to the liquid phase.
Disorganization of the migration processes in the medium by the ultra-sonic waves.
Main studies found in the literature regarding this combined technology are shown in Table 3.
Table 3. Pollutant removal using coupled electrocoagulation- US irradiation processes
Pollutant Process Conditions Pollutant Removal, % Ref.
Cl - SO4-2
treatment time 60 min; Ultrasonic low-frequency Electrocoagulation Fe, current density 40 mA cm
−2
Media Cl- 500 ppm pH 3.8; Media SO4-2
500 ppm pH 2.8; Mine water
Very important removals with an increase in the amount of sludge at 25Hz.
[71]
Cr(VI)
Ultrasonic and sludge obtained for Electrocoagu-lation Fe of pharmaceutical wastewater ; EC: Conditions: rpm = 150, pH = 7.0 and sludge = 10 g L
-1.; Sono-EC Conditions:
frequency 30 kHz, pH = 7.0 and time = 100 min.
100 % of removal at 275 min when used 200 mg L
-1 of Cr(VI);
100 % of removal at 190 min when used 200 mg L
-1 of Cr(VI)
[72]
Cu(II)
Current 1.0 A. Electrolysis 8 h In the sonicated field, voltage and temperature were constantly increased, in order to maintain the same thermal conditions for non-sonicated solutions. Temperature was adjusted to match those during the sonicated process.
Electrolysis 100 and 200 mg L-1
removed 55 an 63 % of Cu(II) increasing concentration of Cu the removal was of 93 %; Sono-Electrolysis 100 and 200 mg L
-1
removed 94.6 an 95.5 % of Cu(II) increaseing concentration of Cu the removal
[73]
Non-ionic surfactants (SA)
Current density 0.5–2.5 A dm-2
, treatment time 5–40 min, ultrasonic power density 0.5–3.0 W cm
-2.
Frequency 22 ± 1 kHz. Treatment time: 10 min
68 % of AS only CE EC with US 90 %
[74]
car-washing wastewater
I=1.2 A pH= 6 treatment time 20 min
COD 68.77 % and turbidity 96.27 %
[75]
Main results of these studies show that the combined process promotes the flocculation
through vigorous mixing and the oxidation through the formation of radicals that contribute to the
enhancement of the efficiency of electrocoagulation processes by chemical polishing of the
surface of the flocs and by the oxidation of soluble pollutants in the bulk. This fact helps to explain
the high efficiencies reached. In this case, performance of iron electrodes is better than that of
aluminum electrodes. This fact can be explained in terms of the enhanced performance of the
enmeshment of the pollutant into growing metal hydroxide flocs which is much more important
for iron than for aluminum coagulants.
Hence, sono-electrocoagulation treatment has demonstrated superior performances in
treatment of industrial effluents than single electrocoagulation. However, and as it was described
for the other two previous technologies, scale-up should be considered as a major challenge.
5. Electrocoagulation-pulsed processes
Pulsed electrocoagulation technology is a novel method for wastewater treatment. It uses the
interactions of electrochemical technology and polarity reversal in an electrical field to induce
dipole formation in nonpolar particles in the wastewater, thus enabling the formation of micro-
aggregates of insoluble substances.
The aggregates formed are further assisted in forming macro-aggregates. Charge neutralization
of ions or charged materials also takes place in the electrochemical reactor, turning them into
insoluble, suspended substances in the wastewater. The neutralization process enhances the
efficiency of removing electrical conductivity [76]. In Table 4, there are some examples of using
J. Electrochem. Sci. Eng. 4(4) (2014) 285-296 ENHANCED ELECTROCOAGULATION
292 292
electrocoagulation pulsed treatments, which show that has been done with wastewater of
different origins. As it can be observed, it has proven effective in the treatment of urban
wastewater and different types of industrial wastes.
Table 4. Pollutant removal using coupled electrocoagulation-pulsed processes
Wastewater Process Conditions Pollutant Removal Ref.
Higher Cr(VI) concentrations
Cr(VI) initial concentrations (50- 1000 mg L-1
) Electrical energy consumption (EEC) range: 4-58 kWh m
-3 wastewater, current density (CD):
56–222 A m-2
, operating time: 20–110 min, pH 3–9 (pHoptimum 5), voltage: 15–25 V.
99 % [47]
Synthetic solutions containing mercury(II)
Hg (II) 2×10⁻⁵
M,distance between the electrodes was 3 cm, current density ranging from 2.5 to 3.1 A dm
−2; charge loading 9.33- 15.55 F m
−3 ,
iron and aluminum electrodes, 3 - 7.
99.9 %. With iron, 15 min of electrolysis was sufficient to reach the highest removal; aluminum required 25 min for the same result.
[77]
Solutions of a dye Dianix Yellow CC (DY) and Procion Yellow (PY)
Range pH (4-8), Current density (40-120 A m-2
) Frequency (200-900 Hz
-1),
Operation time (100 min) 99 % [78]
Industrial and municipal wastewater
Pilot plant of electrochemical treatment system (0.3 m
3h
−1). Ti/RuO2–TiO2 anode was larger than
with a platinum anode
The removal of T-N, T-P, NH4–N and COD was approximately 90 %
[79]
Berberine hydrochloride (BH) wastewater
Fe electrodes and Al electrodes. The optimal conditions of reaction time of 3.5 h, pulse duty cycle of 0.3, pulse frequency of 1.0 kHz, current density of 19.44 mA cm
-2, and
electrode distance of 2.0 cm
90.1 % BH and 62.6 % COD
[80]
Dye wastewater Fe electrodes and 1000 mg L
-1 Dye solution in a
15 mins electrolyzing time 99.62% of color removal and 91.15% of COD
[81]
Old corrugated containerboard (OCC)-based Paper Mill Wastewater
Current density of 0 to 240 A m-1
, a hydraulic retention time of 8 to 16 min and a coagulant (anionic polyacrylamide) dosage of 0 to 30 mg L
-1
Electrical conductivity: 47.7 %; Suspended. Solids: 99.3 %;COD: 75 %
[76]
Cooking oil (1800 mg/L, scour (1000 mg/L) and sodium sulfate (1g/L)
Al electrodes, dimensions of 50×110×2 mm; AC power (SMD 30)
Passivation of Al electrodes is not observed
[82]
Electroplating wastewater
Having a pH of 4, voltage 2.5 V, hydraulic retention time of 15 minutes, current density of 25 A m
-2
99.5 % [83]
Oil wastewater Electrode distance of 3.3 cm, pH of 4, current density of 49.38 mAcm
-2, reaction time of 15 min
and pole switching time of 10 s.
96.21% [84]
Conclusions
Electrocoagulation has demonstrated to be a promising technology in the removal of pollutants
from different types of wastewater. However its combination with other technologies can help to
increase efficiency due to synergistic effects such as those derived from the formation of radicals
in the ozonation (by interaction of ozone with iron (II)) or in the US irradiation. Results depend on
the particular application (technology combined and type of wastewater) and should be evaluated
carefully. Scale-up is the major challenge of this technology for the next years, although the very
positive results obtained at the lab and bench scales make these studies very promising.

C. E. Barrera-Díaz et al. J. Electrochem. Sci. Eng. 4(4) (2014) 285-296
doi: 10.5599/jese.2014.0060 293
Acknowledgements: The authors wish to acknowledge the support given by the UAEM trough the project 3409/2013 M and financial support from CONACYT in project 153828 is greatly appreciated.
References
[1] G. Roa-Morales, E. Campos-Medina, J. Aguilera-Cotero, B. Bilyeu, C. Barrera-Díaz, Separation and Purification Technology 54 (2007) 124-129.
[2] L. J. J. Janssen, L. Koene, Chemical Engineering Journal 85 (2002) 137-146. [3] A. B. Ribeiro, E. P. Mateus, L. M. Ottosen, G. Bech-Nielsen, Environmental Science &
Technology 34 (2000) 784-788. [4] O. T. Can, M. Bayramoglu, M. Kobya, Industrial & Engineering Chemistry Research 42 (2003)
3391-3396. [5] O. T. Can, M. Kobya, E. Demirbas, M. Bayramoglu, Chemosphere 62 (2006) 181-187. [6] P. K. Holt, G. W. Barton, M. Wark, C. A. Mitchell, Colloids and Surfaces A: Physicochemical
and Engineering Aspects 211 (2002) 233-248. [7] K. Rajeshwar, J. Ibañez, Environmental Electrochemistry; fundamentals and applications in
Pollution Abatement, Academic Press, United States of America, 1997. [8] P. Canizares, F. Martinez, C. Jimenez, J. Lobato, M.A. Rodrigo, Industrial & Engineering
Chemistry Research 45 (2006) 8749-8756. [9] P. Canizares, C. Jimenez, F. Martinez, C. Saez, M.A. Rodrigo, Industrial & Engineering
Chemistry Research 46 (2007) 6189-6195. [10] P. Canizares, F. Martinez, C. Jimenez, J. Lobato, M.A. Rodrigo, Environmental Science &
Technology 40 (2006) 6418-6424. [11] E. Lacasa, P. Canizares, C. Saez, F. Martinez, M. A. Rodrigo, Separation and Purification
Technology 107 (2013) 219-227. [12] P. Canizares, F. Martinez, M. A. Rodrigo, C. Jimenez, C. Saez, J. Lobato, Separation and
Purification Technology 60 (2008) 155-161. [13] P. Canizares, F. Martinez, M. A. Rodrigo, C. Jimenez, C. Saez, J. Lobato, Separation and
Purification Technology 60 (2008) 147-154. [14] R. G. Casqueira, M. L. Torem, H. M. Kohler, Minerals Engineering 19 (2006) 1388-1392. [15] P. Canizares, F. Martinez, C. Jimenez, C. Saez, M. A. Rodrigo, Journal of Chemical
Technology and Biotechnology 84 (2009) 702-710. [16] E. Yuksel, E. Gurbulak, M. Eyvaz, Environmental Progress & Sustainable Energy 31 (2012)
524-535. [17] M. Bayramoglu, M. Kobya, O. T. Can, M. Sozbir, Separation and Purification Technology 37
(2004) 117-125. [18] P. Canizares, C. Jimenez, F. Martinez, M. A. Rodrigo, C. Saez, Journal of Hazardous Materials
163 (2009) 158-164. [19] J.-Q. Jiang, N. Graham, C. André, G.H. Kelsall, N. Brandon, Water Research 36 (2002) 4064-
4078. [20] Y. Cho, G. Ji, P. Yoo, C. Kim, K. Han, Korean Journal of Chemical Engineering 25 (2008) 1326-
1330. [21] E. Lacasa, C. Saez, P. Canizares, F. J. Fernandez, M. A. Rodrigo, Separation Science and
Technology 48 (2013) 508-514. [22] C. Barrera-Díaz, M. Palomar-Pardavé, M. Romero-Romo, S. Martínez, Journal of Applied
Electrochemistry 33 (2003) 61-71. [23] N. Abdessamad, H. Akrout, G. Hamdaoui, K. Elghniji, M. Ksibi, L. Bousselmi, Chemosphere
93 (2013) 1309-1316. [24] X. Chen, G. Chen, P.L. Yue, Separation and Purification Technology 19 (2000) 65-76.
J. Electrochem. Sci. Eng. 4(4) (2014) 285-296 ENHANCED ELECTROCOAGULATION
294 294
[25] B. Merzouk, B. Gourich, A. Sekki, K. Madani, C. Vial, M. Barkaoui, Chemical Engineering Journal 149 (2009) 207-214.
[26] B. Merzouk, M. Yakoubi, I. Zongo, J.P. Leclerc, G. Paternotte, S. Pontvianne, F. Lapicque, Desalination 275 (2011) 181-186.
[27] C. Barrera-Dıaz, F. Ureña-Nuñez, E. Campos, M. Palomar-Pardavé, M. Romero-Romo, Radiation Physics and Chemistry 67 (2003) 657-663.
[28] C. Barrera-Díaz, G. Roa-Morales, L. Ávila-Córdoba, T. Pavón-Silva, B. Bilyeu, Industrial & Engineering Chemistry Research 45 (2005) 34-38.
[29] S. Zodi, O. Potier, C. Michon, H. Poirot, G. Valentin, J. P. Leclerc and F. Lapicque, J. Electrochem. Sci. Eng. 1(1) (2011) 55-65.
[30] M. Kraljić Roković, M. Čubrić and O. Wittine, J. Electrochem. Sci. Eng. 4(4) (2014) 215-225. [31] E.A. Vik, D.A. Carlson, A.S. Eikum, E.T. Gjessing, Water Research 18 (1984) 1355-1360. [32] L. Zaleschi, C. Teodosiu, I. Cretescu, M. Andres Rodrigo, Environmental Engineering and
Management Journal 11 (2012) 1517-1525. [33] M.A. Rodrigo, P. Canizares, C. Buitron, C. Saez, Electrochimica Acta 55 (2010) 8160-8164. [34] S. Cotillas, J. Llanos, P. Canizares, S. Mateo, M. A. Rodrigo, Water Research 47 (2013) 1741-
1750. [35] J. Llanos, S. Cotillas, P. Canizares, M. A. Rodrigo, Water Research 53 (2014) 329-338. [36] S. Bebelis, K. Bouzek, A. Cornell, M. G. S. Ferreira, G. H. Kelsall, F. Lapicque, C. P. de Leon,
M. A. Rodrigo, F. C. Walsh, Chemical Engineering Research & Design 91 (2013) 1998-2020. [37] I. Sires, E. Brillas, M. A. Oturan, M. A. Rodrigo, M. Panizza, Environmental Science and
Pollution Research 21 (2014) 8336-8367. [38] M. A. García-Morales, G. Roa-Morales, C. Barrera-Díaz, B. Bilyeu, M. A. Rodrigo,
Electrochemistry Communications 27 (2013) 34-37. [39] J. M. Britto, M. d. C. Rangel, Química Nova 31 (2008) 114-122. [40] U. von Gunten, Water Research 37 (2003) 1443-1467. [41] P. Cañizares, M. Hernández-Ortega, M. A. Rodrigo, C. E. Barrera-Díaz, G. Roa-Morales, C.
Sáez, Journal of Hazardous Materials 164 (2009) 120-125. [42] M. Hernández-Ortega, T. Ponziak, C. Barrera-Díaz, M. A. Rodrigo, G. Roa-Morales, B. Bilyeu,
Desalination 250 (2010) 144-149. [43] R. Rosal, A. Rodríguez, J. A. Perdigón-Melón, A. Petre, E. García-Calvo, Chemical Engineering
Journal. 149 (2009) 311-318. [44] P. Cañizares, R. Paz, C. Sáez, M. A. Rodrigo, Journal of Environmental Management 90
(2009) 410-420. [45] R. Andreozzi, V. Caprio, A. Insola, R. Marotta, Catalysis Today 53 (1999) 51-59. [46] E. Guinea, E. Brillas, F. Centellas, P. Cañizares, M. A. Rodrigo, C. Sáez, Water Research. 43
(2009) 2131-2138. [47] E. Keshmirizadeh, S. Yousefi, M.K. Rofouei, Journal of Hazardous Materials. 190 (2011) 119-
124. [48] H. M. Menapace, N. Diaz, S. Weiss, Journal of Environmental Science and Health, Part A 43
(2008) 961-968. [49] Z. Q. He, S. Song, J. P. Qiu, J. Yao, X. Y. Cao, Y. Q. Hu, J. M. Chen, Environmental Technology
28 (2007) 1257-1263. [50] S. Song, J. Yao, Z. He, J. Qiu, J. Chen, Journal of Hazardous Materials 152 (2008) 204-210. [51] S. Song, Z. He, J. Qiu, L. Xu, J. Chen, Separation and Purification Technology 55 (2007) 238-
245. [52] P. Asaithambi, M. Susree, R. Saravanathamizhan, M. Matheswaran, Desalination 297 (2012)
1-7. [53] C.-H. Wu, C.-L. Chang, C.-Y. Kuo, Dyes and Pigments 76 (2008) 187-194.
C. E. Barrera-Díaz et al. J. Electrochem. Sci. Eng. 4(4) (2014) 285-296
doi: 10.5599/jese.2014.0060 295
[54] V. Orescanin, R. Kollar, K. Nad, Journal of Environmental Science and Health, Part A 46 (2011) 1338-1345.
[55] H.-J. Hsing, P.-C. Chiang, E. E. Chang, M.-Y. Chen, Journal of Hazardous Materials 141 (2007) 8-16.
[56] P. Canizares, C. Saez, A. Sanchez-Carretero, M. A. Rodrigo, Journal of Applied Electrochemistry 39 (2009) 2143-2149.
[57] K. K. H. Choy, J. F. Porter, G. McKay, Langmuir 20 (2004) 9646-9656. [58] B. Nasernejad, T. E. Zadeh, B. B. Pour, M. E. Bygi, A. Zamani, Process Biochemistry 40 (2005)
1319-1322. [59] L. K. Cabatingan, R. C. Agapay, J. L. L. Rakels, M. Ottens, L. A. M. van der Wielen, Industrial
& Engineering Chemistry Research 40 (2001) 2302-2309. [60] K. Wagner, S. Schulz, Journal of Chemical & Engineering Data 46 (2001) 322-330. [61] A. K. Jain, V. K. Gupta, S. Jain, Suhas, Environmental Science & Technology 38 (2004) 1195-
1200. [62] Y. Ait Ouaissa, M. Chabani, A. Amrane, A. Bensmaili, Chemical Engineering & Technology 36
(2013) 147-155. [63] S. Bellebia, S. Kacha, A.Z. Bouyakoub, Z. Derriche, Environmental Progress & Sustainable
Energy 31 (2012) 361-370. [64] S. Bellebia, S. Kacha, Z. Bouberka, A.Z. Bouyakoub, Z. Derriche, Water Environment
Research 81 (2009) 382-393. [65] S.-H. Chang, K.-S. Wang, H.-H. Liang, H.-Y. Chen, H.-C. Li, T.-H. Peng, Y.-C. Su, C.-Y. Chang,
Journal of Hazardous Materials 175 (2010) 850-857. [66] N. Vivek Narayanan, M. Ganesan, Journal of Hazardous Materials 161 (2009) 575-580. [67] M. S. Secula, B. Cagnon, T. F. de Oliveira, O. Chedeville, H. Fauduet, Journal of the Taiwan
Institute of Chemical Engineers 43 (2012) 767-775. [68] I. Linares-Hernández, C. Barrera-Díaz, G. Roa-Morales, B. Bilyeu, F. Ureña-Núñez, Journal of
Hazardous Materials 144 (2007) 240-248. [69] P. Canizares, J. Lobato, J. Garcia-Gomez, M. A. Rodrigo, Journal of Applied Electrochemistry
34 (2004) 111-117. [70] P. Canizares, J. A. Dominguez, M. A. Rodrigo, J. Villasenor, J. Rodriguez, Industrial &
Engineering Chemistry Research 38 (1999) 3779-3785. [71] V. K. Kovatcheva, M. D. Parlapanski, Colloids and Surfaces A: Physicochemical and
Engineering Aspects 149 (1999) 603-608. [72] M. N. Kathiravan, K. Muthukumar, Environmental Technology 32 (2011) 1523-1531. [73] R. Farooq, Y. Wang, F. Lin, S. F. Shaukat, J. Donaldson, A. J. Chouhdary, Water Research 36
(2002) 3165-3169. [74] V. G. Sister, E. V. Kirshankova, Chemical and Petroleum Engineering 41 (2005) 553-556. [75] J. Y. Chu, Y. R. Li, N. Li, W. H. Huang, Advanced Materials Research 433 (2012) 227-232. [76] P. Yuan-Shing, W. E. I-Chen, Y. Shih-Tsung, C. An-Yi, S. Chi-Yuan, Water quality research
Journal of Canada 42 (2007) 63-71. [77] C. P. Nanseu-Njiki, S. R. Tchamango, P. C. Ngom, A. Darchen, E. Ngameni, Journal of
Hazardous Materials 168 (2009) 1430-1436. [78] M. Eyvaz, M. Kirlaroglu, T. S. Aktas, E. Yuksel, Chemical Engineering Journal 153 (2009) 16-
22. [79] C. Feng, N. Sugiura, S. Shimada, T. Maekawa, Journal of Hazardous Materials 103 (2003) 65-
78. [80] M. Ren, Y. Song, S. Xiao, P. Zeng, J. Peng, Chemical Engineering Journal 169 (2011) 84-90. [81] Z. Cao, L. Sun, X. Cao, Y. He, Advanced Materials Research 233-235 (2011) 444-451.

J. Electrochem. Sci. Eng. 4(4) (2014) 285-296 ENHANCED ELECTROCOAGULATION
296 296
[82] X. Mao, S. Hong, H. Zhu, H. Lin, L. Wei, F. Gan, Journal of Wuhan University of Technology-Mater. Sci. Ed. 23 (2008) 239-241.
[83] Q. Yuan, S. Yongqi, Z. Xiangyang, L. Desheng, K. Wu, Chinese Journal of Environmental Engineering 6 (2009) 1029-1032.
[84] Y.-F. Xiang, Z.-M. Xie, Y. Zou, Journal of Chongqing University, 9(1) (2010) 41-46.
© 2014 by the authors; licensee IAPC, Zagreb, Croatia. This article is an open-access article distributed under the terms and conditions of the Creative Commons Attribution license
(http://creativecommons.org/licenses/by/4.0/)
doi: 10.5599/jese.2014.0054 297
J. Electrochem. Sci. Eng. 4(4) (2015) 297-313; doi: 10.5599/jese.2014.0054
Open Access: ISSN 1847-9286
www.jESE-online.org
Review
Electrokinetics and soil decontamination: concepts and overview
Mohammed A. Karim
Department of Civil and Construction Engineering, Southern Polytechnic State University (SPSU), 1100 South Marietta Parkway, Marietta, Georgia 30060, USA
E-mail: [email protected] & [email protected], Phone: (678) 915-3026 (Off.); (804) 986-3120 (Cell)
Received: February 12, 2014; Revised: May 17, 2014; Published: December 6, 2014
Abstract Electrokinetic decontamination and extraction have been proven to be one of the most viable, cost effective and emerging techniques in removing contaminants, especially heavy metals from soils for about last five decades. Basic concepts and an overview of the electrokinetic extraction processes and their potential applications in geotechnical and geoenvironmental engineering have been reviewed based on the literature and presented in this paper. Primarily, theoretical and laboratory experimental studies related to electroreclamation of soils are summarised in brief with basic concepts of electrokinetic processes. The paper has been divided into different sections that include history of electrokinetics, background and concepts, modelling, parameter effects, instrumentation, contaminant extraction, field applications, and summary and recommendation. Based on the review it is obvious that the field application of electrokinetic technology to remediate heavy metal contaminated soils /sediments is very limited and site specific. Additional laboratory studies and more pilot- and full-scale information from field applications are critical to the further understanding of the technology and to customize the process in different field conditions.
Keywords Electrokinetic decontamination; heavy metals; site remediation; soil; EDTA; soil pH; electro-osmosis; electrophoresis; streaming potential; ion migration; sediment potential; zeta potential; electrolysis; electrokinetic modelling
Introduction
Contaminant such as heavy metals removal from solid porous medium such as soils and
sediments has been a technological challenge for engineers and scientists for the past several
decades. A variety of remedial options exist to cleanup a hazardous waste site; however, the
J. Electrochem. Sci. Eng. 4(4) (2014) 297-313 ELECTROKINETICS AND SOIL DECONTAMINATION
298
technological challenge, efficiency, and costs of these options may vary widely. Conventional
ground burial and land disposal are often economical, but they do not provide a permanent
solution, and in some cases they are not necessarily the most effective solutions. For removing
contaminants such as organics and inorganics from solid porous media, the most common ex-situ
methods employed include soil washing, and ligand extraction. Ex-situ methods may not be
technologically challenged that much; however, they suffer from several problems. Apart from the
generic problems of any ex-situ process, i.e., the need to excavate the media and place it in an
external reactor, the above mentioned processes suffer from several disadvatages [1].
Several in situ methods include vacuum extraction, thermal desorption, hydraulic fracturing,
electrokinetic decontamination (including the "Lasagna" process), biotreatment, immobilization by
encapsulation, and placement of barrier systems are already in use to some extent for soil and
sediment remediation and decontamination. Most of these processes are employed for removal of
organics present in soils or sediments. Among these in-situ methods electrokinetic
decontamination (EKD) processes are in use for the past five decades in different applications. The
major advatages of the EKD processes include (a) they can be implemented in-situ with minimal
disruption, (b) they are well suited for fine-grained, heterogenous media, where other processes
can be ineffective, and (c) accelerated rates contaminant extraction and transport may be
achieved. The basic concepts and an overview of the EKD processes and their real life applications,
as of now, in geotechnical and geoenvironmental engineering have been reviewed and presented
in this paper. Primarily, theoretical and laboratory experimental studies related to EKD of soils and
sediments are presented in brief with basic concepts of electrokinetic processes.
History
The movement of water through capilary and pores as a result of the application of electric
potential is known as electrokinetic phenomena and this phenomena was first described by F. F.
Reuss in Russia in 1808. This phenomenon was first treated analytically by Helmholtz in 1879,
which was later modified by Pellat in 1903 and Smoluchowski in 1921. This phenomenon is widely
known as the Helmholtz-Smoluchowski model which relates electro-osmotic velocity of a fluid of
certain viscosity and di-electric constant, through a charged porous medium under an electric
gradient. The Helmholtz-Smoluchowski model is the most common theoretical description of
electro-osmosis and is based on the assumption of fluid transport in the soil or sediment pores
due to transport of the excess positive charge in the diffuse double layer towards the cathode [2].
It applies to systems with pores that are large relative to the size electric diffuse double layer and
provides with reasonable predictions for electro-osmotic flow in most soils. The rate of electro-
osmotic flow is controlled by the coefficient of electro-osmotic permeability of porous media and
the balance between the electrical force on the liquid and the friction between the liquid and the
surface of the particles of the porous media. The first application of electrokinetics was made by
Casagrande in 1939 for consolidation and stabilization of soft fine-grained soils. Numerous
laboratory studies and a very few field applications have been conducted to investigate the
electrokinetic processes to date. The areas in which electrokinetics have been applied successfully
to some extent include increasing pile strength, stability of soil during excavation and
embankments, increasing flow rate of petroleum production, removal of salts from agricultural
soils, removal of metalic objects from the ocean bottom, injection of grouts, microorganisms and
nutrients into the subsoil strata of low permeability, barriers and leak detection systems in clay
liners, dewatering of clayey formations during excavation, control and decontamination of
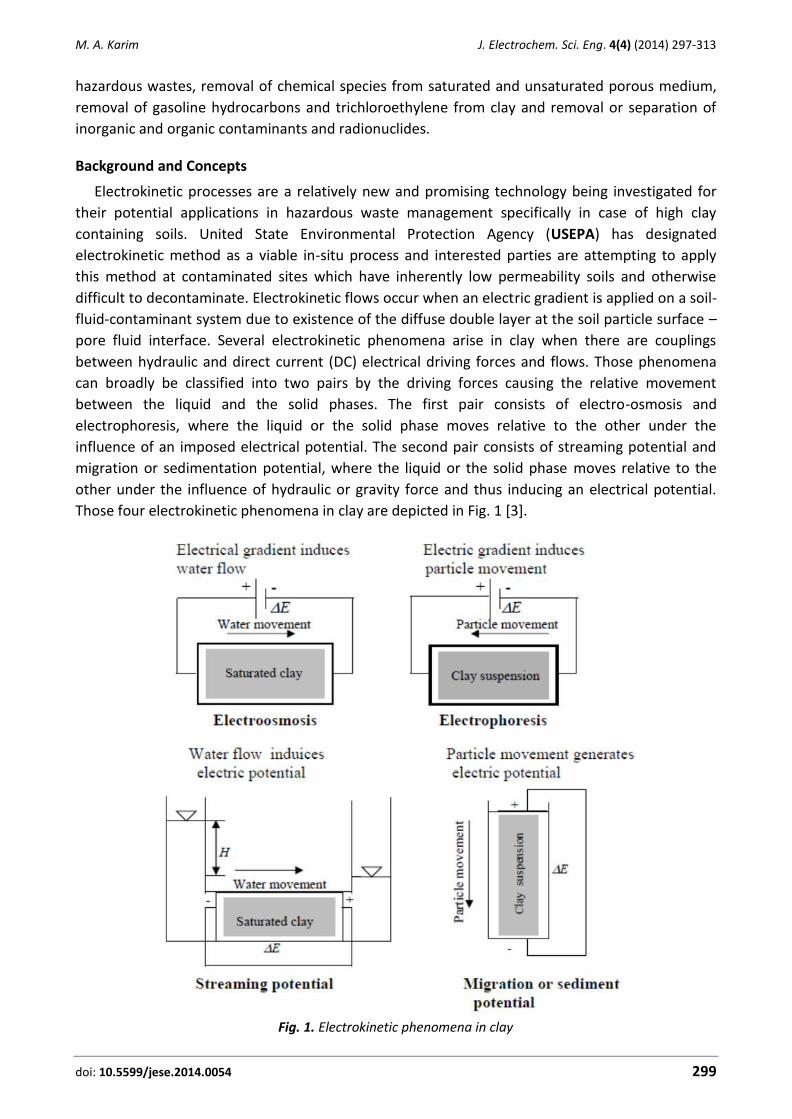
M. A. Karim J. Electrochem. Sci. Eng. 4(4) (2014) 297-313
doi: 10.5599/jese.2014.0054 299
hazardous wastes, removal of chemical species from saturated and unsaturated porous medium,
removal of gasoline hydrocarbons and trichloroethylene from clay and removal or separation of
inorganic and organic contaminants and radionuclides.
Background and Concepts
Electrokinetic processes are a relatively new and promising technology being investigated for
their potential applications in hazardous waste management specifically in case of high clay
containing soils. United State Environmental Protection Agency (USEPA) has designated
electrokinetic method as a viable in-situ process and interested parties are attempting to apply
this method at contaminated sites which have inherently low permeability soils and otherwise
difficult to decontaminate. Electrokinetic flows occur when an electric gradient is applied on a soil-
fluid-contaminant system due to existence of the diffuse double layer at the soil particle surface –
pore fluid interface. Several electrokinetic phenomena arise in clay when there are couplings
between hydraulic and direct current (DC) electrical driving forces and flows. Those phenomena
can broadly be classified into two pairs by the driving forces causing the relative movement
between the liquid and the solid phases. The first pair consists of electro-osmosis and
electrophoresis, where the liquid or the solid phase moves relative to the other under the
influence of an imposed electrical potential. The second pair consists of streaming potential and
migration or sedimentation potential, where the liquid or the solid phase moves relative to the
other under the influence of hydraulic or gravity force and thus inducing an electrical potential.
Those four electrokinetic phenomena in clay are depicted in Fig. 1 [3].
Fig. 1. Electrokinetic phenomena in clay

J. Electrochem. Sci. Eng. 4(4) (2014) 297-313 ELECTROKINETICS AND SOIL DECONTAMINATION
300
The detailed description of these flow processes and the associated complicated features
generated by electrochemical reactions are given by several authors [4-23]. The use of
electrokinetics in sealing leaks in geomembrane and compacted clay liners has been explained in
detail by a few authors [24-28]. Potential applications of electrokinetics in geotechnical and
geoenvironmental engineering are described elaborately by multiple authors [21,22,27,29,30-34].
Some of the applications, as appropriate, are reviewed and included in the subsequent sections.
The extraction technique, variably called electrokinetic remediation, electroremediation,
electroreclamation, electrorestoration, electrochemical soil processing or electrochemical decon-
tamination, uses low level constant voltage DC power supply, potential gradients in the range of
20–200 V m-1 [35] or alternatively a constant current density in the range of 0.025–5 A m-2 [31]
between the electrodes placed at the end of the contaminated soil sample. When an electric field
is imposed to a wet soil mass, positive ions are moved toward the cathode (the negative
electrode) and the negative ions toward the anode (positive electrode) as illustrated in Fig. 2 [36].
Because of the isomorphous substitution and the presence of broken bonds in the soil structures,
excess mobile cations are required to balance the negative fixed charges on the soil particle
surfaces. Therefore, mobile cations exert more momentum to the pore fluid than do mobile
anions. As a result there is a net movement of fluid relative to soil particles under the influence of
imposed electric potential gradient which is called electro-osmosis (field-induced convection of
water through a porous medium with a surface charge). Unlike water flow under pressure, electro-
-osmosis depends on the electric current through the soil, the flow resistance of soil, and the
frictional drag exerted by the migrating ions in the water molecule and this flow originates at the
electric double layer of the soil pores. The electrokinetic flow rate qeo in a porous medium of
length L, porosity n, area A and degree of saturation S, may be presented by the following
equation [37]:
d o seo s
D Rq I nAS
L
(1)
where d is the potential at the slipping plane, o is the permeability of free space, D is the
dielectric constant of the pore fluid, is the pore water viscosity, Is is the current carried by
surface conductance and Rs is the surface resistance of the porous medium i.e. soil.
Fig. 2. Concept of electrokinetic extraction of contaminants
M. A. Karim J. Electrochem. Sci. Eng. 4(4) (2014) 297-313
doi: 10.5599/jese.2014.0054 301
When the electrokinetic technique is applied without conditioning of the process fluid at the
electrodes, which is termed as unenhanced electrokinetic remediation, the applied electric current
leads to electrolysis reactions at the elctrodes, generating an acidic medium at the anode and an
alkaline medium at the cathode [38]. The electrolysis reactions of the primary electrodes are
presented in the following equations:
Anode Reaction: 2H2O - 4e- O2 + 4H+, Eo = -1.229 V (2)
Cathode Reaction: 2H2O + 2e- H2 + 2OH-, Eo = -0.828 V (3)
where Eo is the standard reduction electrochemical potential, which is a measure of the tendency
of the reactants in their standard states to proceed to products in their standard states. Although
some secondary reactions might occur at the cathode because of their lower electrochemical
potential, the water reduction half reaction (H2O/H2) is dominant at early stages of the process.
Within the first few days of the process, electrolysis reaction drops the pH at the anode below 2
and increases the pH at the cathode above 10, depending the total current applied [9]. The
following are the secondary reactions that may exist depending upon the concentration of
available species:
H+ + e- (1/2) H2 (4)
Mn+ + ne- M (5)
M(OH)n(s) + ne- M + nOH- (6)
where M refers to metals. The acid medium (Eq. 2) generated at the anode advances through the
soil toward the cathode by ionic migration and electro-osmosis due to electrical gradient, pore
fluid flow due to any externally applied or internally generated hydraulic gradient and diffusion
due to the chemical gradients developed in the system. The base developed at the cathode initially
advances toward the anode by diffusion and ionic migration. However, the counterflow due to
electro-osmosis retards the back-diffusion and migration of the base front. The advance of this
front is slower than the advance of the acid front because of the counteracting electro-osmotic
flow and also because the ionic mobility of H+ is about 1.76 times that of OH-. As a result, the acid
front dominates the chemistry across the specimen except for small section of the specimen close
to the cathode, where base front prevails [21,35]. As the acid buffer capacity of soil or sediment is
low, acid front moving through the soil lowers the system pH. Since most heavy metals are soluble
in an acidic environment, this lowering of pH promotes desorption of heavy metals from the soil
and solubilization of metal ions. Ions in dissolved phase can be removed effectively by the
combined actions of electro-osmosis and ion migration. However, the presence of heavy
molecular weight organic matter (humus substances) within the soil pores may reduce the
mobility of the heavy metals due to the formation of organometallic compounds. Under these
circumstances, enhanced electrokinetic remediation could be necessary. Numerous studies have
been conducted to date using different chelating and complexation agents to enhance the
remedial techniques [39-52]. The particular use of the enhancing and conditioning agents are
reviewed and included in the appropriate sections.
Modeling electrokinetics
Electrokinetic modeling is based on the applicability of coupled flow phenomena for fluid,
solute, current and temperature flow through porous media under the influence of hydraulic,

J. Electrochem. Sci. Eng. 4(4) (2014) 297-313 ELECTROKINETICS AND SOIL DECONTAMINATION
302
electrical, concentration, and thermal gradients, respectively. The governing equations for these
analyses generally have been formulated on the basis of the postulates of irreversible
thermodynamics and the applicability of the Onsager reciprocal relations under the assumption of
isothermal conditions [14,16], although equation formulation on the basis of continuity
considerations has also been shown [53,54]. The state-of-the-art in modeling electrokinetic
remediation is represented by the one-dimensional finite element model for coupled multi-
component, multispicies transport under electrical, chemical and hydraulic gradients described in
a study conducted by Alshawabkeh and Acar [54]. This study compared the predictions of Pb
removal using the model with the results of pilot scale study involving electrokinetic extraction of
Pb from a spiked kaolinite sand mixture. Multidimensional models for multi spices transport have
been developed by several reserachers [55-57]. A study conducted by Haran et al. [58] developed
a mathematical model for decontamination of hexavalent chromium from low surface charged
soils. They simulated the concentration profiles for the movement of ionic species under a
potential field for different time period. The model predicted the sweep of the alkaline front
across the cell due to the transport of OH- ions. A comparison of chromate concentration profiles
with experimental data for 28 days of electrolysis showed a good agreement. A numerical model
of transport and electrochemical processes was extended for the first time to incorporate
complexion and precipitation reactions in a study by Jacobs et al. [59]. Their model confirmed that
the isoelectric focusing could be eliminated and high metal removal efficiencies could be achieved
by washing the cathode. In order to describe the transport and reaction processes in a porous
medium in electrical field, one-dimensional numerical models have been developed by several
authors [60-62]. In several studies, Choi and Lui [63-66] developed a mathematical model for the
elctrokinetic remediation of contaminated soils assuming the contaminants are mostly heavy
metals, water is in excess, the dissociation-association of water into hydrogen and hydroxyl ions is
rapid, and that electro-osmosis is significant when compared to electromigration (field-induced
transport of ions in an electrolyte as defined earlier) as a transport mechanism. The analytical
steady state solutions of electroplating and transport in binary electrolyte arising from
electrochemistry were provided in several articles by several authors [67-70]. Electrolysis and
isoelectric focusing effects were also theoretically analyzed by various researchers [68-71].
Modified finite difference model of electrokinetic transport in porous media was developed and
numerical solutions were provided in studies [60,72]. An assessment of available multispecies
transport model and an investigation of long-time behavior of multi-dimensional electrophoretic
models were done in couple of studies [9,73]. The quantitative determination of potential
distribution in Stern-Gouy double layer model was elaborated by Shang et al. [74]. The analytical
and numerical steady state solutions for electrochemical processes with multiple reacting species
were provided in articles [75,76]. Shackelford [77] summarized the modeling electrokinetic
remediation. In his review he emphasized that the prediction of multi-component, multi-species
transport with chemical reactions through soil medium represents one of the challenging
modeling endeavors in environmental geotechnics. He compared his statement with studies
conducted by Acar and Alshawabkeh [78] and mentioned that this study provided some insight of
the advances along these lines. However, he stressed on the additional effort that is needed in
evaluating the potential limitations in modeling these electrokinetic processes in terms of the
assumptions inherent in the models and field-scale applications.

M. A. Karim J. Electrochem. Sci. Eng. 4(4) (2014) 297-313
doi: 10.5599/jese.2014.0054 303
Instrumentation
Electrokinetics has many applications in geo-environmental and geotechnical engineering. For
the measurements of electrokinetic properties of soil and soil remediation processes, individual
researchers have designed their own apparatuses of various shapes, sizes and materials for
different purposes. Some significant experimental apparatuses used for geotechnical and geo-
environmental engineering investigation have been reviewed in detail by Yeung [13]. A number of
important apparatuses that have been used for soil remediation by electrokinetics are mentioned
here. The apparatuses currently available for the purpose of electrokinetic remediation include
those developed at Louisiana State University [31,79], Lehigh University [52,80,81], University of
Texas at Austin [11,82], the University of California at Berkeley [3,83], Massachusetts Institute of
Technology [38, 47, 59], Texas A & M University [6], The Technical University of Denmark [84,85],
Vanderbilt University, Nashville, Tennessee [86], Royal Institute of Technology, Stockholm, Sweden
[87-89], University of South Carolina [58] and many others. A comprehensive review of the
apparatus used in the EKD experiments has been presented by Yeung et al. [6]. However, it is
obvious from the literature that most of these apparatuses are used for the remediation of fine-
grained soils by electro-osmosis. None of them except the last three are used for the
decontamination of course-grained soils such as sandy/salty soils, where the electro-osmosis is
ineffective [90]. It is reported that the last two instruments have been successfully used to
decontaminate sandy soils using electrolysis and electro-migration.
Parameter Effects
The important parameters of EKD processes are electric gradient, system pH, electro-osmotic
flow, ion-migration, zeta potential, electro-osmotic permeability, and current density. All of these
parameters play important role in the process efficiency, soil decontamination, and ultimately the
cost. Therefore, parameter optimization should be an important part the process performance. In
general, the application of electric gradient induces electric current density and promotes the
electrolysis reactions at anode and cathode. Electric current results in generation of protons (H+)
at the anode (Eq. 2) that migrate together with the metal cations to the negatively charged ca-
thode (Fig. 2) for removal and processing. A very low voltage can serve the purpose of electrolytic
reactions and create low pH solution in the anode. So determination of optimum electric gradient
or current density is important as higher electric gradient or current density may increase the cost
of the process and create higher gases in anode and cathode which may require careful watch and
become difficult to maintain experiments. Electro-osmotic flow is the prevalent parameter for the
low permeable soils having high surface charges whereas ion-migration may be the driving force
for high permeable soils having low surface charges. System pH contributes to the dissolution of
metal precipitates and depends on the type of contaminants and their salts present in the soils.
Most of the metal salts may be soluble in a pH range of 2 to 4. Therefore, bringing the soil pH
below 2 may not be necessary to optimize the removal efficiency.
It is reported that the values of hydraulic conductivity of different soils can differ by orders of
magnitude; however, those of coefficients of electro-osmotic conductivity are generally between
1 × 10⁻⁵ and 10 × 10-5 cm2 V-1 s-1 and are relatively independent of soil type. Thus, an electric
gradient is much more effective driving force than a hydraulic gradient for moving fluid through
fine-grained soils of low hydraulic conductivity [6,9,83]. Korfiatis et al. [91] used an experimental
approach to assess the relative magnitudes of hydraulic and electro-osmotic permeability under
application of hydraulic or electric gradients or both and to study the extent of pH changes during

J. Electrochem. Sci. Eng. 4(4) (2014) 297-313 ELECTROKINETICS AND SOIL DECONTAMINATION
304
the electro-osmotic process. The practical and theoretical aspects of ion exchange resins and
membranes have been investigated by Hansen [85,92]. Acar et al. [30] estimated the electro-
osmotic permeability in kaolinite to be in the range of 0.80 × 10⁻⁵ to 3.0 × 10⁻⁵ cm2 V-1 s-1 which is
within the range reported in the literature.
The zeta potential of most soils, except for quartz, is negative, because soil surfaces carry a
negative charge that causes the electro-osmotic generally from anode to cathode. The pH and
ionic strength of the pore fluid may affect the value of zeta potential and zeta potential is reported
to decrease linearly with logarithm of the pH of the porous medium [2]. High acidic solution causes
the zeta potential to become less negative and even to attain positive values at low pH. As a result
flow rates have been reported to decrease if the pH of the electrolyze is depressed below neutral
and to increase at alkaline pH values [47,93]. The effect of zeta potential on electro-osmotic
permeability has further been investigated by Shang [94].
The steady state and limiting current conditions are investigated by Dzenitis [95]. Influence of
current density and system pH on electro-remediation of kaolinite clay was investigated by
Rahman [45] and Hamed and Bhadra [93] and soil saturation effect on electrorestoration was
investigated by Puppala [46]. The effects of temperature on electrokinetic remediation on low
permeability soils are explored by Penn [96]. The effects of electrokinetics in complex natural
sediments are explained by Grundl and Reese [97]. Shang et al. [98] investigated the effects of
polarization and conduction on clay-water-electrolyte systems. Shri Ranjan and Karthigesu [99]
devised a capillary flow meter for measuring the hydraulic conductivity of clay under the
applications of low gradients. A theoretical and experimental basis on electrokinetic
sedimentation is explained by Shang [5]. Reddy et al. [100] investigated the effects of soil
composition on the electrokinetic extraction of chromium (VI). They used three kinds of soil
minerals such as kaolin, glacial till, and Na-montmorillonite in their study. Their study found that
the adsorption and removal of Cr (VI) are greatly dependent on the compositions of the soil
minerals.
Contaminant extraction
There are some cases where unenhanced electrokinetic extraction is ineffective for soil
remediation. In this situation chelating and conditioning agents are used to enhance the process
which is termed as enhanced electrokinetic remediation. The most commonly used chelating and
conditioning agents are Ethylene diamine tetraacetate (EDTA), HCl, acetic acid, iodine-iodide etc. A
few important studies using enhanced and unenhanced electrokinetic process have been reviewed
and presented below. However, only the studies related to heavy metal removals were reviewed
and reported here.
Heay Metal Removal with Enhanced Process
In a study conducted by Cameselle and Reddy [101] found that electro-osmotic flow under
applied electric potential depends on a number of soil, contaminant and applied electric potential
conditions. Electro-osmotic flow induced in the same direction of metal or complexed metal ions
transport can enhance heavy metal removal. In case of hydrophobic organic contaminants,
periodic voltage application combined with the use of a solubilizing solution is shown to create
sustained electro-osmotic flow and enhanced contaminant removal. The suggested to validate the
optimum conditions determined from laboratory investigations for generating significant electro-
osmotic flow through field pilot-scale demonstrations. Joseph et al. [41] investigated the feasibility
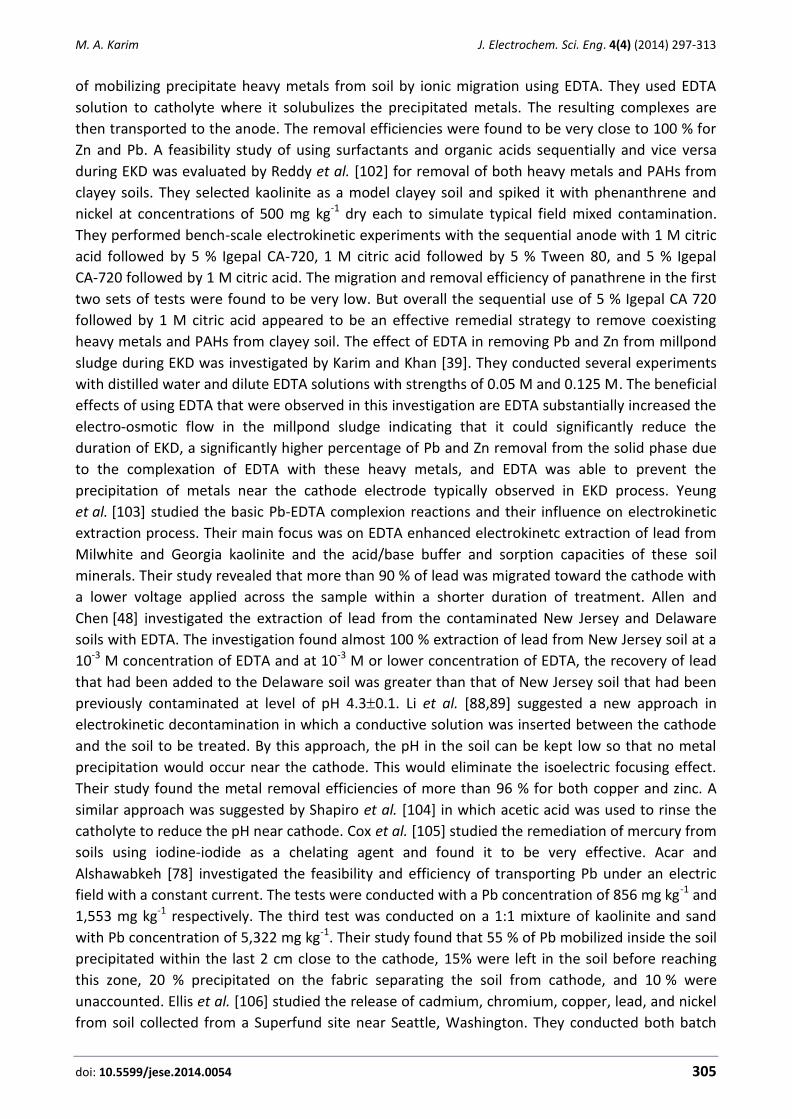
M. A. Karim J. Electrochem. Sci. Eng. 4(4) (2014) 297-313
doi: 10.5599/jese.2014.0054 305
of mobilizing precipitate heavy metals from soil by ionic migration using EDTA. They used EDTA
solution to catholyte where it solubulizes the precipitated metals. The resulting complexes are
then transported to the anode. The removal efficiencies were found to be very close to 100 % for
Zn and Pb. A feasibility study of using surfactants and organic acids sequentially and vice versa
during EKD was evaluated by Reddy et al. [102] for removal of both heavy metals and PAHs from
clayey soils. They selected kaolinite as a model clayey soil and spiked it with phenanthrene and
nickel at concentrations of 500 mg kg-1 dry each to simulate typical field mixed contamination.
They performed bench-scale electrokinetic experiments with the sequential anode with 1 M citric
acid followed by 5 % Igepal CA-720, 1 M citric acid followed by 5 % Tween 80, and 5 % Igepal
CA-720 followed by 1 M citric acid. The migration and removal efficiency of panathrene in the first
two sets of tests were found to be very low. But overall the sequential use of 5 % Igepal CA 720
followed by 1 M citric acid appeared to be an effective remedial strategy to remove coexisting
heavy metals and PAHs from clayey soil. The effect of EDTA in removing Pb and Zn from millpond
sludge during EKD was investigated by Karim and Khan [39]. They conducted several experiments
with distilled water and dilute EDTA solutions with strengths of 0.05 M and 0.125 M. The beneficial
effects of using EDTA that were observed in this investigation are EDTA substantially increased the
electro-osmotic flow in the millpond sludge indicating that it could significantly reduce the
duration of EKD, a significantly higher percentage of Pb and Zn removal from the solid phase due
to the complexation of EDTA with these heavy metals, and EDTA was able to prevent the
precipitation of metals near the cathode electrode typically observed in EKD process. Yeung
et al. [103] studied the basic Pb-EDTA complexion reactions and their influence on electrokinetic
extraction process. Their main focus was on EDTA enhanced electrokinetc extraction of lead from
Milwhite and Georgia kaolinite and the acid/base buffer and sorption capacities of these soil
minerals. Their study revealed that more than 90 % of lead was migrated toward the cathode with
a lower voltage applied across the sample within a shorter duration of treatment. Allen and
Chen [48] investigated the extraction of lead from the contaminated New Jersey and Delaware
soils with EDTA. The investigation found almost 100 % extraction of lead from New Jersey soil at a
10-3 M concentration of EDTA and at 10-3 M or lower concentration of EDTA, the recovery of lead
that had been added to the Delaware soil was greater than that of New Jersey soil that had been
previously contaminated at level of pH 4.30.1. Li et al. [88,89] suggested a new approach in
electrokinetic decontamination in which a conductive solution was inserted between the cathode
and the soil to be treated. By this approach, the pH in the soil can be kept low so that no metal
precipitation would occur near the cathode. This would eliminate the isoelectric focusing effect.
Their study found the metal removal efficiencies of more than 96 % for both copper and zinc. A
similar approach was suggested by Shapiro et al. [104] in which acetic acid was used to rinse the
catholyte to reduce the pH near cathode. Cox et al. [105] studied the remediation of mercury from
soils using iodine-iodide as a chelating agent and found it to be very effective. Acar and
Alshawabkeh [78] investigated the feasibility and efficiency of transporting Pb under an electric
field with a constant current. The tests were conducted with a Pb concentration of 856 mg kg-1 and
1,553 mg kg-1 respectively. The third test was conducted on a 1:1 mixture of kaolinite and sand
with Pb concentration of 5,322 mg kg-1. Their study found that 55 % of Pb mobilized inside the soil
precipitated within the last 2 cm close to the cathode, 15% were left in the soil before reaching
this zone, 20 % precipitated on the fabric separating the soil from cathode, and 10 % were
unaccounted. Ellis et al. [106] studied the release of cadmium, chromium, copper, lead, and nickel
from soil collected from a Superfund site near Seattle, Washington. They conducted both batch

J. Electrochem. Sci. Eng. 4(4) (2014) 297-313 ELECTROKINETICS AND SOIL DECONTAMINATION
306
equilibrium and column studies using EDTA alone and EDTA followed by hydroxylamine
hydrochloride, to reduce iron oxides in the soil. Results of their batch and column tests showed
that EDTA was able to remove more than 90 % Pb and 60 % Cd. Huang et al. [107] found that the
removal of Zn (II) from solids is independent of types of solids. The addition of EDTA resulted in a
shift of maximum Zn (II) adsorption to the acidic pH range, and reduction of zeta potential and
overall Zn (II) removal in presence of EDTA was significantly reduced at alkaline pH range and
slightly enhanced in the acidic range. Klewick and Morgan [108] explored the rates of decompo-
sition of complexes for Manganese in the +III oxidation state as a function of the complexing
ligand, the total ligand: manganese concentration ratio and the pH. Three ligands were chosen,
EDTA was one of them. The rate of appearance of the Mn (III) complex decreased with increasing
pH over the range of 6 to 8. McArdell et al. [109] studied cobalt-EDTA complexation generated on
site at Oak Ridge, TN shallow landfills. Their study confirmed the ability of EDTA to solubilize
mineral surface-bond Co (III). Davis and Singh [110] studied the several chemical washing
procedures for Zn (II) contaminated soil to determine the metal extraction efficiency from using
specific extractants such as acid solution, EDTA, diethylenetriamine pentaacetic acid (DTPA), and
Chlorine. Their study found 79 % removal of Zn(II) with 0.001 M EDTA, 85 % with 0.003 M EDTA for
pH around 2; 79 % with 0.001 M DTPA, 90% with 0.003 M DTPA for a pH of 2, and 85 % with
0.003 M DTPA for a pH of 6. They also found that about 99 % of Zn(II) was in the form of Zn-EDTA
complex at pH level 6. Amrate et al. [111] tested the removal of lead from an Algerian contami-
nated soil (with Pb concentration ≈4.43 mg/g of soil) sited near a battery plant using EDTA at
various concentrations (0.05–0.20 M). They applied a constant voltage corresponding to nominal
electric field strength of 1 V cm-1 for duration of 240 hours. Results of contaminant distribution
across the experimental cell have shown efficient transport of lead toward the anode despite the
presence of calcite (25 %) and the high acid/base buffer capacity of the soil. They modified the cell
by adding extra compartments and inserting cation exchange membranes (Neosepta CMX) to
avoid ligand loss, which would be anodically oxidized. They found simultaneous recovery of EDTA
and lead from their chelated solutions. Reddy et al. [112] conducted batch and electrokinetic
experiments to investigate the removal of three different heavy metals, chromium (VI), nickel (II),
and cadmium (II), from a clayey soil by using EDTA as a complexing agent. Their batch experiments
revealed that high removal of these heavy metals (62–100 %) was possible by using either a 0.1 M
or 0.2 M EDTA concentration over a wide range of pH conditions (2–10). However, the results of
the electrokinetic experiments using EDTA at the cathode showed low heavy metal removal
efficiency. They used EDTA at the cathode along with the pH control at the anode with NaOH
which increased the pH throughout the soil and achieved high (95 %) Cr (VI) removal, but the
removal of Ni (II) and Cd (II) was limited due to the precipitation of these metals near the cathode.
Their finding was that the low mobility of EDTA and its migration direction, which opposed electro-
-osmotic flow, prevented EDTA complexation from occurring. They also found many complicating
factors that affected EDTA-enhanced electrokinetic remediation and suggested further research to
optimize this process to achieve high contaminant removal efficiency.
Heay Metal Removal with Unenhanced Process
A comprehensive treatise on removal of Pb (II) from kaolin is reported by Hamed [34] and
Hamed et al. [79]. The process removed about 75 % to 95 % of Pb (II) at concentrations up to
1500 g g-1 across the test specimen at a energy expenditure of 29–60 kWh m-3 of soil processed.
Li et al. [88] examined the efficiency of electro-migration process in removing Pb (II), Cd (II) and
M. A. Karim J. Electrochem. Sci. Eng. 4(4) (2014) 297-313
doi: 10.5599/jese.2014.0054 307
Cr (III) from sandy soils. Their study showed the removal efficiencies more than 90 % for all three
metals. Hamed and Bhadra [93] studied the effect of current density and influent pH on
electrokinetic processing. Their study results revealed that flow rate increases as the current
density increases and the electro-osmotic flow increases gradually between pH of 2 to 10 and
sharply between pH of 10 to 12. Acar and Alshawabkeh [78] investigated the feasibility and
efficiency of transporting lead under electric field conducting three pilot-scale tests with lead-
spiked kaolinite at an electrode spacing of 72 cm. In their tests program, a constant current of
density 133 A cm-2 was applied. Out of three tests, two of them were conducted with a lead
concentration of 856 mg kg-1 and 1,533 mg kg-1 respectively. The third test was conducted on a 1:1
mixture of kaolinite and sand with lead concentration of 5,322 mg kg-1. Their study found that
55 % of lead removal across the soil precipitated within the last 2 cm close to the cathode, 15 %
left in the soil before reaching this zone, 20 % precipitated on the fabric separating the soil from
cathode and 10 % unaccounted. Hansen et al. [84] investigated the removal of Cu, Cr, Hg, Pb and
Zn from sandy loam by electrodialysis. Their study found that decontamination of soil was to an
extent lower than the recommended critical values for metal concentration in soil. The
elctrochemical analysis of ion-exchange membrane with respect to a possible use in electrodialytic
decontamination of soil polluted with heavy metals was also studied by Hansen et al. [85]. Their
study revealed that cation-exchange membranes show the transport number of average 0.97 in
NaCl and CaCl2 solutions and anion-exchange membranes about 0.95 in NaCl, CaCl2 and ZnCl2
solutions. One-dimensional experimental studies were conducted by Yeung et al. [113] and
Darilek et al. [27,28] to examine the feasibility of using electrophoresis to repair in-service leaking
surface impoundment lined by geomembranes. Their studies were concentrated on the effect of
clay type, clay particle concentration in the suspension and the electric field strength on the cake
formation mechanism. Acar et al. [114] investigated the removal of Cd (II) from saturated kaolinite
under the application of electric current and found to remove more than 95 % of Cd (II) within
10 days of experiment. The effect of various sites and operating conditions on the efficacy of metal
removal by electromigration was investigated by Hicks and Tondorf [38] and Pamukcu and
Wittle [81]. Pamukcu et al. [52] investigated the feasibility of electro-osmosis to remove zinc from
soil since it was listed among the 129 priority pollutants by EPA and is known to possess moderate
noncarcinogenic toxicity and is found frequently in the soil in contaminated sites. Their finding was
encouraging in zinc migration to the cathode chamber. Reddy and Chinthamreddy [115] studied
the migration of hexavalent chromium, Cr (VI), nickel, Ni(II), and cadmium, Cd (II), in clayey soils
that contain different reducing agents under an induced electric potential. They conducted bench-
scale electrokinetic experiments using two different clays, kaolin and glacial till, both with and
without a reducing agent. The reducing agent used was either humic acid, ferrous iron, or sulfide,
in a concentration of 1,000 mg kg-1. They spiked the soils with Cr (VI), Ni (II), and Cd (II) in
concentrations of 1000, 500 and 250 mg kg-1, respectively, and tested under an induced electric
potential of 1 V DC cm-1 for duration of over 200 hours. Their study found that the reduction of
chromium from Cr (VI) to Cr (III) occurred prior to electrokinetic treatment and the extent of this
Cr (VI) reduction was found to be dependent on the type and amount of reducing agents present
in the soil. The maximum reduction was found to be occurred in the presence of sulfides, while the
minimum reduction was found to be occurred in the presence of humic acid. Their study
concluded that significant removal of the contaminant from the soils was not achieved and
suggested additional research to determine strategies by which contaminant migration may be
enhanced and ultimately lead to significant contaminant removal. Ricart et al. [116] investigated
J. Electrochem. Sci. Eng. 4(4) (2014) 297-313 ELECTROKINETICS AND SOIL DECONTAMINATION
308
the feasibility of electrokinetic remediation for the restoration of polluted soil with organic and
inorganic compounds had been development and evaluated using a model soil sample. They
prepared model soil was prepared with kaolinite clay artificially polluted in the laboratory with
chromium (Cr) and an azo dye: Reactive Black 5 (RB5). They focused on the electromigration of Cr
in a spiked kaolinite sample in alkaline conditions. Despite of the high pH registered in the
kaolinite sample (around pH 9.5), they reported that Cr migrated towards the cathode and it was
accumulated in the cathode chamber forming a white precipitate. The removal was not complete,
and only 23 % of the initial Cr was retained into the kaolinite sample close to the cathode side.
They also reported that the electrokinetic treatment of a kaolinite sample polluted with both Cr
and RB5 yielded very good results. The removal of Cr was improved compared to the experiment
where Cr was the only pollutant, and RB5 reached a removal as high as 95 %. RB5 was removed by
electromigration towards the anode, where the dye was degraded upon the surface of the
electrode by electrochemical oxidation. Chromium (Cr) was transported towards the cathode by
electromigration and electro-osmosis. The concluded that the interaction among RB5 and Cr into
the kaolinite sample prevented premature precipitation and allow Cr to migrate and concentrate
in the cathode chamber. The removal of PAH and metal contaminants from a former
manufactured gas plant polluted soil was studied by Reddy et al. [117] and found that the removal
is influenced by the type of flushing solution and application of voltage gradient. Igepal surfactant
was shown to remove PAHs, while EDTA chelant was shown to remove heavy metals. Sequential
application of surfactant and chelant removed both PAHs and heavy metals present in the soil and
the efficacy of the process depends on the order of flushing. Application of voltage gradient is
found to retard the removal of PAHs and enhance the removal of metals from the soil. Their
experiments conducted only for a short duration and suggested to run the experiments for longer
duration to establish this as a potent technology for the remediation of soil contaminated by
mixed wastes. The study suggested that soil composition can have a profound effect on the
contaminant removal; therefore, site-specific soil investigations must be conducted to develop
sequential process that will be effective to remove mixed contaminants from the soil.
It is apparent to say that enhanced electrokinetic removal technology has been more effective
in removing heavy metals from low permeability soils compared to unenhanced electrokinetic
removal technology as the enhanchment agents eliminate the pH jump topwards the cathode
region and be able to break the organometalic complexes in samples where organic matters are
present. EDTA, a chelating agent that is readily available and environmentally benign and does not
interact with soils, seems to be the best enhancing agent, especially to break the organometalic
complexes. Many of the chelating agents other than EDTA are ionic and can, in principle, be
introduced into the soil by ionic migration. Allen and Chen [48] have shown that EDTA is an
excellent solubilizing agent for many metals including Pb and Zn. It is of interest that EDTA has
been used medically to promote removal of lead from the human body and also as an additive to
render floor polishes with zinc binders amenable to detergent washing [41].
EDTA is a tetraprotic acite abbreviated as H4Y where Y denotes the ethylenediamine-
tetraacetate ion EDTA4-. It is slightly solution in water and the four stepwise dissociation constants
of the parent acid to yield H3Y-, H2Y2-, HY3- and Y4- ions are 1.00 × 10⁻², 2.16 × 10⁻³, 6.92 × 10⁻⁷ and
5.50 × 10⁻¹¹, respectively [48]. It implies that H2Y2- and HY3- species are major EDTA anions
adsorbed [107]. Each EDTA4- ion can attach to a metal ion at six different sites since each of four
acetate groups and the two nitrogen atoms have free electron pairs available for coordinate bond
formation as shown in Fig. 3 [118].
M. A. Karim J. Electrochem. Sci. Eng. 4(4) (2014) 297-313
doi: 10.5599/jese.2014.0054 309
Fig. 3. Configuration of metal-EDTA complexes
Unless the pH is very high, the EDTA will not be completely deprotonated. In fact, this is the
reason for the high solubility of metal-EDTA complexes. The complexation of metals by EDTA is
dependent on pH. With a metal ion M, it can form a complex MY, a protonated complex MHY, a
hydro complex MY(OH)n and a mixed complex of the form MYX where X is a unidentate ligand.
Field Applications
In most practical applications of electrokinetics, the anodes are iron or aluminum rods and the
cathodes are steel tubes. Sometimes graphite electrodes are also used for both anodes and
cathodes. Lageman et al. [119] reported the results of field applications in the Netherlands. These
studies demonstrated about 60 % of Zn removal at a concentration of 70 g g-1 from sandy clay
soils; 80 % of As removal at a concentration of 90 g g-1 from heavy clayey soils and 75 % of Pb
removal at a concentration of 340 g g-1 from dredged sediment. The energy expenditure ranged
from 60 to 220 kWh m-3 of soil processed. Banerjee et al. [120] applied the electrokinetic
extraction process in conjunction with the pump-and-treat method in a abandoned industrial
hard-chrome plating facility superfund site in Corvallis, Oregon, USA. Their study demonstrated
that chromium removal slightly increased, but they didn’t provide any numerical value of removal
efficiency. They primarily concluded that ion migration plays a significant role in the
decontamination process. In another field study conducted at Stadskanaal, The Netherlands [121],
it is reported that at an energy expenditure of 20 kWh m-3 of soil, Pb concentration reduced to
120 mg kg-1, Cd 150 mg kg-1, and Zn 320 mg kg-1; at 65 kWh m-3 of soil, Pb concentration reduced
to 90 mg kg-1, Cd 50 mg kg-1, and Zn 120 mg kg-1; and at 180 kWh m-3 of soil, Pb and Zn
concentrations reduced to less than 10 mg kg-1and Cd less than 2 mg kg-1. In all cases the initial
concentrations of Pd, Cd and Zn were 210 mg kg-1, 300 mg kg-1, and 480 mg kg-1, respectively.
However, a number of problems not encountered in the laboratory studies arose in the field trails,
e.g., presence of unexpected large objects (> 10 cm) buried in the soil.
Summary and Recommendation
An overview and concept of electrokinetic extraction processes and their potential applications
in geotechnical and geoenvironmental engineering have been reviewed and presented.
Historically, the success of electrokinetics in soil restoration and decontamination in terms of
inorganic contaminants (i.e. heavy metals) has demonstrated its ability to be one of the most cost
effective and viable in-situ remediation processes compared to the conventional remediation
technologies such as soil washing, ligand extraction, vacuum extraction, thermal desorption,
hydraulic fracturing, biotreatment, immobilization by encapsulation, and placement of barrier
-OOCH2C H H CH2COO- N C C N
-OOCH2C H H CH2COO- Mn+
J. Electrochem. Sci. Eng. 4(4) (2014) 297-313 ELECTROKINETICS AND SOIL DECONTAMINATION
310
systems. Based on the literature review and researches, it is obvious that the field application of
electrokinetic technology to remediate heavy metal contaminated soils /sediments is very limited
and site specific. Additional laboratory studies and more pilot- and full-scale information from field
applications are critical to the further understanding of the technology and to customize the
process in different field conditions.
References
[1] M. A. Karim, L. I. Khan, Soil Sediment Contam. 20(7) (2011) 857-875. [2] R. J. Hunter, Zeta potential in colloid science, Principles and applications, Academic Press:
London (1982). [3] J. K. Mitchell, A. T. Yeung, Transport. Res. Rec. 1288 (1990) 1-9. [4] J. M. Dzenitis, Environ. Sci. Tehnol. 31 (1997) 1191-1197. [5] J. Q. Shang, Canadian Geotech. J. 34(2) (1997) 305-314. [6] A. T. Yeung, T. B. Scott, S. Gopinath, R. M. Menon, C.N. Hsu, Geotech. Test. J. 20(2) (1997)
199-210. [7] A. T. Yeung, S. Datla, Canadian Geotech. J., 32(4) (1995) 569-583. [8] A. N. Alshawabkeh, Ph.D. Dissertation, Louisiana State University, (1994) 376. [9] A. N. Alshawabke, Y. B. Acar, Preprint of Extended Abstract, I&EC Special Symposium, the
American Chemical Society, Atlanta, GA, September 19-21 (1994). [10] S. Datla, A. T. Yeung, Proceedings of 8th International conferenceof the International
Association for Computational Method and Advances in Geomechanics, The Netherlands, 1994, p. 1043-1048.
[11] G. R. Eykholt, R. E. Daniel, J. Geotech. Eng. 120(5) (1994) 797-815. [12] A. T. Yeung, J. Non-Equil. Thermody. 15(3) (1990) 247-267. [13] A. T. Yeung, J. Adv. Porous Media 2 (1994) 309-395. [14] A. T. Yeung and J. K. Mitchell, J. Geotechnique 43(1) (1993) 121-134. [15] J. J. Horng, Ph.D. Dissertation, Department of Civil Engineering, University of Washington,
USA (1993). [16] J. K. Mitchell, J. Geotechnique 41(3) (1991) 299-340. [17] J. K. Mitchell, Fundamentals of soil behavior, 2nd ed., Wiley & Sons, New York, 1993. [18] Y. B. Acar and J. Hamed, Transport. Res. Rec. 1312 (1991) 152-161. [19] S. Laursen, Ph.D. Dissertation, Denmark Technical University, Denmark (1991). [20] Y. B. Acar, R. J. Gale, G. Putnam, and J. Hamed, in Proceedings of the 2nd International
Symposium on Environmental Geotechnology, Shanghai, China, Hsai-Yang Fang, Sibel Pamukcu, Eds., Envo Pub. Co., Bethlehem, PA, USA, 1989, p. 25-38.
[21] Y. B. Acar, R. J. Gale and G. Putnam, J. Environ. Sci. Heal. A 25(6) (1990) 687-714. [22] Y. B. Acar, A. N. Alshawabkeh and R. J. Gale, Waste Manage. 13 (1993) 141-151. [23] Y. B. Acar, R. J. Gale, A. N. Alshawabkeh, R. Marks, S. Puppala, M. Bricka and R. Parker, J.
Hazard. Mater. 40(2) (1995) 117-137. [24] M. Y. Corapcioglu and A. T. Yeung, Technical Completion Report Submitted to Advanced
Technology Program, Texas Higher Education Coordinating Board, October 1994. [25] A. T. Yeung, G. T. Darilek and M. Y. Corapcioglu, J. Civil Eng. 66(3) (1996) 23. [26] G. T. Darilek, M. Y. Corapcioglu and A. T. Yeung, J. Environ. Eng.-ASCE 122(6) (1996) 540-544. [27] G. T. Darilek, M. Y. Corapcioglu and A. T. Yeung, Proc. Geosynthetics '95, Nashville,
Tennessee, 2 (1995) 539-549. [28] G. T. Darilek, M. Y. Corapcioglu and A. T. Yeung, Emerg. Technol. 1(2) (1994) 1-4. [29] A. Czediwoda, H. Stichnothe and A. Schonbucher, in Contaminated Soil '95, Proceedings of
the Fifth International FZK/TNO Conference on Contaminated Soil, Maastricht, The
M. A. Karim J. Electrochem. Sci. Eng. 4(4) (2014) 297-313
doi: 10.5599/jese.2014.0054 311
Netherlands, W. J. Van Den Brink, R. Bosman, F. Arendt, Eds., Kliwer Academic Publishers, Dordrecht, The Netherlands, 1995, p. 1181-1182.
[30] A. T. Yeung, Hong Kong Engineer 21(11) (1993) 25-30. [31] Y. B. Acar, J. Hamed, R. J. Gale and G. Putnam, Transp. Res. Record 1288 (1990) 23-34. [32] A. T. Yeung, Geotechnical News, 13(3) (1995) 25-28. [33] J. K. Mitchell, A. T. Yeung, Transp. Res. Record 1288 (1990) 1-9 [34] J. T. Hamed, Ph.D. Dissertation, Department of Civil & Environmental Engineering, Louisiana
State University, (1990) 200. [35] R. F. Probstein and R. E. Hicks, Science 260 (1993) 498-504. [36] Y. B. Acar and A. N. Alshawabkeh, Environ. Sci. Technol. 27(13) (1993) 2638-2647. [37] L. I. Khan, Ph.D. Dissertation, Department of Civil Engineering, Lehigh University, Bethelham,
PA, USA (1991). [38] R. E. Hicks and S. Tondorf, Environ. Sci. Technol. 28(12) (1994) 2203-2210. [39] M. A. Karim and L. I. Khan, Environ. Technol. (2012), DOI:10.1080/09593330.2012.665493 [40] M. Kubal and T. Machula, Separ. Sci. Technol. 33(13) (1998) 1969. [41] S. H. Joseph, R. Wong, R. E. Hicks and R. F. Probstein, J. Hazard. Mater. 55(1-3) (1997) 61-79. [42] S. K. Puppala, A. N. Alshawabkeh, Y. B. Acar, R. J. Gale and M. Bricka, J. Hazard. Mater. 55
(1997) 203-220. [43] J. S. H. Wong, R. E. Hicks and R. F. Probstein, J. Hazard. Mater. 55 (1996) 61-79. [44] A. T. Yeung, C. Hsu and R. M. Menon, J. Hazard. Mater. 55 (1996) 221-237. [45] M. M. Rahman, M.Sc. Thesis, Dept. of Civil & Environmental Engineering, Cleveland State
University, OH, USA (1996). [46] S. K. Puppala, M.Sc. Thesis, Louisiana State University (1994) 260. [47] A. P. Shapiro and R. F. Probstein, Environ. Sci. Technol. 27(2) (1993) 281-291. [48] H. E. Allen and P. H. Chen, Environ. Prog. 12(4) (1993) 284-293. [49] R. W. Peters and L. Shem, ASCE Symposium Seroes 509, American Chemical Society,
Washington, D.C., (1992) 70-84. [50] Y. B. Acar, H. Li, H. and R. J. Gale, ASCE J. Geotech. Eng. 118(11) (1992) 1837-1851. [51] J. Apatoczky, M.Sc. Thesis, Department of Civil Engineering, Lehigh University, USA (1992). [52] S. Pamucku, L. I. Khan and H. Y. Fang, Transport. Res. Rec. 1288 (1990) 41-46. [53] A. N. Alshawabkeh and Y. B. Acar, J. Environ. Sci. Heal. A 27(7) (1992) 1835-1861. [54] A. N. Alshawabkeh and Y. B. Acar, J. Geotech. Eng. 122(3) (1996) 186-196. [55] M. Z. Sengun, R. E. Hicks and R. F. Probstein, J. Environ. Sci. Heal. A 29(9) (1994). [56] A. P. Shapiro, Ph.D. Dissretation, Department of Mechanical Engineering, Massachusetts
Institute of Technology (MIT), MA, USA (1990). [57] R. A. Jacobs and R. F. Probstein, AIChE J, 42(6) (19960 1685-1696. [58] B. S. Haran, B. N. Popov, G. Zheng and R. E. White, J. Haz. Mat. 55 (1996) 93-108. [59] R. A. Jacobs, M. Z. Sengun, R. E. Hicks and R. F. Probstein, J. Environ. Sci. Heal. A 29(9) (1994)
1933-1955. [60] J. Yu and I. Neretnieks, J. Chem. Eng. Sci. 51(19) (1996) 4355-4368. [61] D. J. Wilson, J. M. Rodriguez-Maroto and C. Gomez-Lahoz, Sep. Sci. & Tech. 30(15) (1995)
2937-2961. [62] B. A. Sengun and C. J. Brunell, J. Environ. Eng.-ASCE 118(1) (1992) 84-100. [63] Y. S. Choi and R. Lui, J. Differ. Equations 108 (1994) 424-437. [64] Y. S. Choi and R. Lui, Arch. Ration. Mech. An. 130 (1995) 315-342. [65] Y. S. Choi and R. Lui, J. Hazard. Mater. 44 (1995) 61-75. [66] Y. S. Choi and R. Lui, J. Differ. Equations 116 (1995) 306-317. [67] Y. S. Choi and Y. Xun, J. Appl. Math. 51 (1993) 251-267. [68] Y. S. Choi and K. Y. Chan, J. Nonlinear Anal. 18(4) (1992) 317-331.
J. Electrochem. Sci. Eng. 4(4) (2014) 297-313 ELECTROKINETICS AND SOIL DECONTAMINATION
312
[69] Y. S. Choi and K-Y. Chan, J. Electroanal. Chem. Interf. Electrochem. 334 (1992) 13-23. [70] Y. S. Choi and K. Y. Chan, J. Math. Comput. Simul. 34 (1992) 101-112. [71] Y. S. Choi, R. Lui and Y. Xun, J. Appl. Math. 52 (1994) 105-122. [72] A. Wilkowe, M.Sc. Thesis, Department of Civil Engineering, Lehigh University, USA (1992). [73] K. Euhee, Ph. D. Dissertation, University of Connecticut, USA (1995). [74] J. Q. Shang, K. Y. Lo and R.M. Quigley, Can. Geotech. J. 31 (1994) 624-636. [75] Y. Xun, Ph.D. Dissertation, University of Connecticut, USA (1992). [76] Y. Xun, Quart. Appl. Math. 53(3) (1995) 507-525. [77] C. D. Shackelford, Environmental Geotechnics, Proceedings of the Second International
Congress on Environmental Geotechnics, Vol. 3, Osaka, Japan, 5 - 8 November 1996, p 1375-1404.
[78] Y. B. Acar and A. N. Alshawabkeh, J. Geotech. Eng. 122(3) (1996) 173-185. [79] J. T. Hamed, Y. B. Acar, and R. J. Gale, J. Geotech. Eng. 117(2) (1991) 241-271. [80] S. Pamukcu, A. Weeks, A. and J. K. Wittle, J. Hazard. Mater. 55(1-3) (1997) 305-318. [81] S. Pamukcu and J. K. Wittle, Environ. Prog. 11(3) (1992) 241-250. [82] G. R. Eykholt, Ph.D. Dissertation, Department of Civil Engineering, University of Texas at
Austin, Texas, USA (1992). [83] A. T. Yeung, S. M. Sadek and J. K. Mitchell, Geotech. Test. J. 15(3) (1992) 207-216. [84] H. K. Hansen, L. M. Ottosen, B. MK. Kliem and A. Villumsen, J. Chem. Technol. Biotechnol. 70
(1997) 67-73. [85] H. K. Hansen, L. M. Ottosen, B. MK. Kliem and A. Villumsen, Separ. Sci. Technol. 32(15)
(1997) 2425-2444. [86] D. J. Wilson, J. M. Rodriguez-Maroto and C. Gomez-Lahoz, Separ. Sci. Technol. 30(16) (1995)
3111-3128. [87] Z. Li, J. W. Yu, I. Neretnieks J. Hazard. Mater. 55(1-3) (1997) 295-304. [88] Z. Li, J. W. Yu, I. Neretnieks, J. Contam. Hydrol. 22 (1996) 241-253. [89] Z. Li, J. W. Yu, I. Neretnieks, J. Environ. Sci. Heal. 32(2) (1996). [90] L. I. Khan, M. S. Alam, J. Environ. Eng.-ASCE 120(6) (1994) 1524-1545. [91] G. P. Korfiatis, L. N. Reddi, B. Montanti, Transport. Res. Rec. 1288 (1990) 35-40. [92] H. K. Hansen, Ph.D. Dissertation, Department of Physical Chemistry, The Technical University
of Denmark (1995). [93] J. T. Hamed, A. Bhadra, J. Hazard. Mater. 55(1-3) (1997) 279-294. [94] J. Q. Shang, Can. Geotech. J. 34(4) (1997). [95] J. M. Dzenitis, J. Electrochem. Soc. 144(4) (1997) 1317-1322. [96] M. Penn, Proceedings British Geotechnical Society Young Engineers Symposium, Oxford, UK,
1-3 (1996). [97] T. Grundl, C Reese, J. Hazard. Mater. 55 (1997) 187-201. [98] J. Q. Shang, K. Y. Lo and I. I. Inculet, J. Environ. Eng.-ASCE 121(3) (1995) 243-248. [99] R. Sri Ranjan, T. Karthigesu, Can. Geotech. J. 33(3) (1996) 504-509.
[100] K. R. Reddy, U. S. Parupudi, S. N. Devulapalli, C. Y. Xu, J. Hazard. Mater. 55 (1997) 135-158. [101] C. Cameselle, K. R. Reddy, Electrochim. Acta 86 (2012) 10-12. [102] K. R. Reddy, K. Maturi, C. Cameselle, J. Environ. Eng.-ASCE 135(10) (2009) 989-998. [103] A. T. Yeung, C. Hsu, R. M. Menon, J. Geotech. Eng. 122(8) (1996) 666-673. [104] A. P. Shapiro, P. C. Renaud, R. F. Probstein, Physicochem. Hydrodyn. 11(5/6) (1989) 785-802. [105] C. D. Cox, M. A. Shoesmith, M. M. Ghosh, Environ. Sci. Technol. 30(6) (1996) 1933-1938. [106] W. D. Ellis, T. R. Fog, A. N. Tafuri, Proceedings of the 12th Annual Research Symposium: Land
Disposal, Remediation Action, Incineration and Treatment of Hazardous Waste, (1986) 201-207.
[107] C. P. Huang, E. A. Rhoads, O. J. Hao, Water Res. 22(8) (1988) 1001-1009.
M. A. Karim J. Electrochem. Sci. Eng. 4(4) (2014) 297-313
doi: 10.5599/jese.2014.0054 313
[108] J. K. Klewick, J. J. Morgan, Environ. Sci. Technol. 32(19) (1998) 2916-2922. [109] C. S. McArdell, A. T. Stone, J. Tian, Environ. Sci. Technol. 32(19) (1998) 2923-2930. [110] A. P. Davis, I. Singh, J. Environ. Eng.-ASCE 121(2) (1992) 174-185. [111] S. Amrate, D. E. Akretche, C. Innocent, P. Seta, Sci. Total Environ. 349(1-5) (2005) 56-66. [112] K. R. Reddy, S. Danda, P. Saichek, J. Environ. Eng.-ASCE 130(11) (2004) 1357-1366. [113] A. T. Yeung, M. Chung, M. Y. Corapcioglu, W. M. Stallard, In Geoenvironment 2000:
Characterization, Containment, Remediation, and Performance in Environmental Geotechnics, Geotechnical Special Publication (GSP) No. 46, Vol. 2, Yalcin B. Acar, David E. Daniel, Eds., American Society of Civil Engineers, New York, NY, USA, 1995, p. 1564-1575.
[114] Y. B. Acar, J. T. Hamed, A. N.Alshawabkeh, R. J. Gale, J. Geotechnique 44(3) (1994) 239-254 [115] K. R. Reddy, S. Chinthamreddy, Waste Manage. 19 (1999) 269-282. [116] M. T. Ricart, M. Pazos, S. Gouveia, C. Cameselle, M. A. Sanroman, J. Environ. Sci. Heal. A
43(8) (2008) 871-875. [117] K. R. Reddy, C. Cameselle and P. Ala J. Appl. Electrochem. 40 (2010) 1269-1279. [118] A. T. Yeung, C. Hsu and R. M. Menon, J. Hazard. Mater. 55 (1996) 221-237. [119] R. Lageman, P. Wieberen and S. Geert, Chem. Ind.-London, 18 (1989) 585-590. [120] S. Banerjee, J. J. Horng, J. F. Ferguson, Transp. Res. Record 1312 (1991)167-174. [121] R. Lageman, Environ. Sci. Technol. 27(13) (1993) 2648-2650.
© 2014 by the authors; licensee IAPC, Zagreb, Croatia. This article is an open-access article distributed under the terms and conditions of the Creative Commons Attribution license
(http://creativecommons.org/licenses/by/3.0/)

doi: 10.5599/jese.2014.0047 315
J. Electrochem. Sci. Eng. 4(4) (2014) 315-326; doi: 10.5599/jese.2014.0047
Open Access : : ISSN 1847-9286
www.jESE-online.org
Original scientific paper
Influence of ceramic separator’s characteristics on microbial fuel cell performance
Anil N. Ghadge, Mypati Sreemannarayana, Narcis Duteanu* and Makarand M. Ghangrekar
Department of Civil Engineering, Indian Institute of Technology, Kharagpur -721302, India *University “Politehnica” of Timisoara, Industrial Chemistry and Environmental Engineering, 2 Victoria Sq., 300006 Timisoara, Romania
Corresponding Author: [email protected]; Tel.: +91-3222-283440
Received: January 27, 2013; Revised: February 15, 2014; Published: December 6, 2014
Abstract This study aimed at evaluating the influence of clay properties on the performance of microbial fuel cell made using ceramic separators. Performance of two clayware microbial fuel cells (CMFCs) made from red soil (CMFC-1) typically rich in aluminum and silica and black soil (CMFC-2) with calcium, iron and magnesium predominant was evaluated. These MFCs were operated under batch mode using synthetic wastewater. Maximum sustainable volumetric power density of 1.49 W m-3 and 1.12 W m-3 was generated in CMFC-1 and CMFC-2, respectively. During polarization, the maximum power densities normalized to anode surface area of 51.65 mW m-2 and 31.20 mW m-2 were obtained for CMFC-1 and CMFC-2, respectively. Exchange current densities at cathodes of CMFC-1 and CMFC-2 are 3.38 and 2.05 times more than that of respective anodes, clearly indicating that the cathodes supported much faster reaction than the anode. Results of laboratory analysis support the presence of more number of exchangeable cations in red soil, representing higher proton exchange capacity of CMFC-1 than CMFC-2. Higher power generation was observed for CMFC-1 with separator made of red soil. Hence, separators made of red soil were more suitable for fabrication of MFC to generate higher power.
Keywords Cation exchange capacity; Coulombic efficiency; Charge transfer resistance; Charge transfer coefficient; Exchange current density; Power density; Wastewater treatment
Introduction
Recently considerable attention is being paid on the two major problems of the world, which
are namely maintaining quality of water body and energy crisis. Solution to these problems could
be provided by microbial fuel cell (MFC) to treat organic matter present in wastewater and
J. Electrochem. Sci. Eng. 4(4) (2014) 315-326 CERAMIC SEPARATOR IN MICROBIAL FUEL CELL
316
simultaneously produce bio-electricity [1-5]. Although, considerable progress has been achieved in
the performance of a MFC in the past ten years, one of the main challenge for commercializing
scalable MFCs is the high cost and low mechanical strength of the separator materials used for
fabrication of this device. Tian et al. [6], demonstrated that placing of an anaerobic membrane
filtration process sequentially with an MFC accomplished efficient nutrients removal with low
propensity of membrane fouling. It was reported that the use of poly(tetrafluoro-ethylene) (PTFE)
layered activated charcoal electrode and Zirfon® as separator, improved MFCs performance and
can be used to replace costly polymeric membrane and expensive catalyst in MFCs [7]. Proton
exchange membrane (PEM) such as Nafion [8], nano-composite membrane made of sulfonated
polymer (ether ether ketone) and Montmorillonite Clay [9], nano-composite membranes of Nafion
and montmorillonite clay [10] were used in the MFCs to separate anodic chamber from cathodic
chamber. However, these polymeric membranes or composite membranes are costly; hence, limit
the practical application of the MFCs.
Ceramic membranes are found to be promising materials in MFCs because of their low
production cost and better structural strength, thus, providing an alternative for the costly
polymeric membranes [11-15]. Application of such ceramic membranes in MFC has been practiced
since last ten years and its utility has been demonstrated through different studies. This was the
first attempt where Park and Zeikus [11] developed a porcelain septum separator for single
chambered MFC using 100% Kaolin and found comparable performance with that dual chambered
MFC. A three layered cathode composed of a cellulose acetate film, a ceramic membrane, and a
porous graphite plate to create a single chamber MFC that linked with solar cell to enhance power
generation [12]. Behera and Ghangrekar [13] studied the effect of different thickness of such
ceramic membrane on performance of the dual chambered MFC, and reported better power
output for MFC having smallest thickness of the membrane. Use of terracotta pot for making
single chamber MFC, after coating outer surface with conductive graphite paint, demonstrated
Coulombic efficiency of 21 ± 5 % with power density of 33.13 mW m-2 [14]. More recently, Winfield
et al. [15] compared performance of MFCs made from terracotta and earthenware by considering
wall thickness, porosity and cathode hydration. More porosity of earthenware proved to be the
better material compared to terracotta. However, these studies do not include the effect of soil
pH, conductivity and cation exchange capacity (CEC) on the performance of MFCs.
For effectual use of such ceramic membranes, made from clay minerals, they should have
higher cation exchange capacity. The existence of the pH dependent charge portion of the cation
exchange capacity of soils is widely accepted for many years [16]. Electrical conductivity of the soil
is the measure of salt concentration in the soil solution. Bulk electrical conductivity of soil is
generally assumed to be dominated by the electrical conductivity of the soil solution, with perhaps
a small contribution from surface charges associated with soil solids [17].
In MFCs, the rate of proton consumption at the cathode is often higher than the transfer rate
through the membrane [18,19]. Hence, for enhancing power generation of this device the
separator used should offer higher rate of proton/cation transfer. The transfer of protons from a
protonated species to an uncharged molecule at the surface of the clay mineral is an important
process [20]. The soil used for making ceramic separator in MFC participates in exchange of
cations from anodic chamber to cathodic chamber. Protons released during the oxidation of
organic matter from the anodic chamber are being adsorbed on to the surface of the soil by
replacing the loosely held cations. The layered silicate clay minerals like smectite clays, show
attractive hydrophilic properties and good thermal stability at high temperature [21]. The layered

A. N. Ghadge at al. J. Electrochem. Sci. Eng. 4(4) (2014) 315-326
doi: 10.5599/jese.2014.0047 317
silicates commonly used for proton exchange membrane fuel cell applications are montmorillonite
made of silica tetrahedral and alumina octahedral sheets which has advantageous hygroscopic
properties [22,23]. The cations Ca2+, Mg2+, K+ and Na+ are called the base cations and H+ and Al3+
are called acidic cations. The acidity of the soil is the amount of the total cation exchange capacity
(CEC) occupied by the acidic cations [24]. More than proton, this cation migration also affects the
performance of cathode, hence overall performance of MFC.
Porosity of the soil represents the hydraulic conductivity which depends upon the pore throat
radii of clay materials. Typically clays have very low hydraulic conductivity due to their small throat
radii. For MFC made with such clayware separator, different soil porosities play a vital role in the
seepage of substrate from anodic to cathodic chamber [25]. Apart from loss of fuel, this may lead
to the availability of organic matter at higher concentration on the cathode, supporting
heterotrophic bacterial growth on cathode and thereby reducing cathode potential. Under such
circumstances, the cathode often gives negative potentials (vs. Ag/AgCl), than the positive
potential it is expected to give, while using oxygen as an electron acceptor [26]. Hence, hydraulic
conductivity and cation exchange capacity are the important properties of the materials to be
selected as a separator in MFC.
The objective of this study was to investigate the effect of different soil properties like pH,
conductivity, porosity, cation exchange capacity on the performance of MFCs having ceramic
separators made from two different soils. In addition, the electrode reaction kinetics was
investigated for assessing performance of these MFCs.
Experimental
Construction of Microbial Fuel Cell
The study was carried out using dual-chambered Clayware Microbial Fuel Cells (CMFCs). The
anodic chambers of these CMFCs were made up of baked clayware pot and the wall material of
the pot (about 5 mm thick) itself acted as a separator allowing transfer of protons from anode to
cathode. The pots were made from the red soil (typically rich in aluminum and silica) in CMFC-1
and black soil (rich in calcium, iron and magnesium predominant) in CMFC-2. The anodic chamber
of the CMFC-1 and CMFC-2 had a liquid volume capacity of 550 ml and 700 ml, respectively.
Cathodic chambers in both the MFCs were made up of plastic container having 5 liter capacity.
Although there is difference in anodic chamber volume of both the MFCs, however, cathodic
chamber volume of 5 litre, which was kept same in both the MFCs. It is important to note here
that the rate of proton transfer largely depends on the separator area to anodic chamber volume
ratio (Sa/v). In the present study, this ratio was 83.3 and 86.5 m2/m3, respectively, for CMFC-1
(separator made of red soil) and CMFC-2 (separator made of black soil), which indicates that there
was no significant difference in Sa/v ratio. Carbon Felt (Panex®35, Zoltek Corporation) with 230
cm2 and 261 cm2 projected surface areas were used as cathode in CMFC-1 and CMFC-2,
respectively. Anodes in CMFC-1 and CMFC-2 were made from stainless steel mesh having total
surface area of 268 cm2 and 304 cm2, respectively. An aquarium aerator was inserted at the
bottom of cathodic chamber to supply air continuously with an aquarium air pump (SOBO
Aquarium Pump, China). The connections between two electrodes were made with concealed
copper wire through external resistance of 100 Ω.

J. Electrochem. Sci. Eng. 4(4) (2014) 315-326 CERAMIC SEPARATOR IN MICROBIAL FUEL CELL
318
Inoculation and operation of CMFCs
Anaerobic mixed sludge collected from septic tank was used as an inoculum in the anodic
chamber of the CMFCs. When mixed anaerobic sludge is used as source of inoculum, it contains
both electrogenic as well as non-electrogenic (mostly methanogenic) bacteria. In the anodic
chamber of MFC, it is necessary to dominate electrogenesis to obtain higher Coulombic efficiency.
Methanogens in the MFCs compete for substrate and electrode space with electrogenic bacteria
and reduce the power output. Therefore, the inoculum sludge was given a heat pre-treatment
(heated at 100 °C for 15 min) to suppress methanogens and required amount of sludge was added
to the anodic chamber [27]. Synthetic wastewater containing sodium acetate as a source of carbon
with chemical oxygen demand (COD) of about 3000 mg L-1 was used in this study. The sodium
acetate medium was prepared by adding 3843 mg L-1 CH3COONa, 4500 mg L-1 NaHCO3,
954 mg L-1 NH4Cl, 81 mg L-1 K2HPO4, 27 mg L-1 KH2PO4, 750 mg L-1 CaCl2.2H2O, 192 mg L-1
MgSO4.7H2O and trace metals like Fe, Ni, Mn, Zn, Co, Cu, and Mo as per the composition given by
[27]. The feeding frequency of 5 days was adopted. These CMFCs were operated at temperatures
varying from 33 to 37 °C under batch mode. The pH of tap water used as catholyte remained in the
range of 8.2-8.5; whereas, anolyte pH was in the range of 7.1-7.4.
Analysis and calculations
The pH and conductivity of anolyte and catholyte was measured using pH meter (Cyber Scan pH
620) and TDS meter (Cyber Scan CD 650, Eutech instruments, Singapore), respectively. COD
concentrations were measured according to APHA standard methods [28], using closed reflux
method. The performance of CMFCs was evaluated in terms of voltage (U) and current (I) mea-
sured using a digital multimeter with data acquisition unit (Agilent Technologies, Malaysia) and
converted to power according to P = UI, where P = power, W; I = current, A; and U = voltage, V.
Power density and power per unit volume were calculated by normalizing power to the anode
surface area and net liquid volume of anodic chamber, respectively. The current density id was
calculated using
d
ext d
Ui
A
R (1)
where, Rext is the external resistance (Ω) and Ad (m2) is the surface area of the anode. Polarization
studies were carried out by varying the external resistance from 10000 to 10 Ω using the resis-
tance box (GEC 05 R Decade Resistance Box) and cell voltages (U) were recorded. Internal resis-
tance of the CMFCs was measured from the slope of the line from plot of voltage versus current
[29]. Columbic Efficiency (CE) was determined by integrating the current measured over time, t,
and compared with the theoretical current on the basis of COD removal and calculated as [1]:
0
d
=
t
M I t
CEFbV COD
(2)
where, V is the volume of the anodic chamber of MFC; M = 32, molecular weight of oxygen; F,
Faraday’s constant = 96485 C mol-1; b = 4, the number of electrons exchanged per mole of oxygen;
ΔCOD is the difference in the influent and effluent COD for time t.
A. N. Ghadge at al. J. Electrochem. Sci. Eng. 4(4) (2014) 315-326
doi: 10.5599/jese.2014.0047 319
Analysis of the soil properties
The pH and the conductivity of the soil samples were measured according to the Indian
Standard method of test for soils. Indian standard IS: 2720 (Part 26) – 1987 was used for determi-
nation of pH value [30] and conductivity of the soil was measured according to IS 14767: 2000
[31]. Cation exchange capacity of the soil was measured according to Indian standard, IS: 2720
(Part 24) – 1976 [32]. Chemical constituents for the red and black soils were obtained through the
X-Ray Fluorescence (XRF) analysis. Porosity of the soil was indirectly measured from the
percentage water absorbed by the clayware pot made from respective soils after immersing in
water for 24 hours.
Reaction kinetics at electrodes
Tafel plot, as derived from equation (3) [33], was employed to measure the reaction kinetics for
working electrode (anode and cathode) and Ag/AgCl was used as the reference electrode. The
reference electrode was placed in the working chamber during the measurements.
0
lnF
RT
i
i
(3)
where i0 is exchange current density, i is the electrode current density (mA m-2), is the electron transfer coefficient, R is the ideal gas constant (8.31 J mol-1 K-1), F is the Faraday’s constant (96,485 C mol-1), T is the absolute temperature, K and η is the activation overpotential. Purpose of using
Tafel plot is to calculate the i0 and value. The i0 is a fundamental parameter in the rate of electro-oxidation or electro-reduction of a chemical species at an electrode at equilibrium. The charge transfer resistance (Rct) was calculated from the following equation:
ct
0
RTR
nFi (4)
where, n is the number of electrons.
Results and Discussion
Physico-chemical properties of the soil used in CMFCs
The soils used for manufacturing the pots showed different pH. The electrical conductivity and
cation exchange capacity of the red soil is higher than that of the black soil, indicating usefulness
of the former in the clayware separator application (Table 1). However, the porosity of the pot
made from black soil was higher than the pot made from red soil. Higher porosity may allow the
anolyte to come to the cathode resulting in not only the physical substrate loss but also it will
allow oxygen to penetrate in anodic chamber, reducing Coulombic efficiency of the system due to
direct oxidation of the substrate.
Table 1. Physical, chemical and electrical properties of red and black soil used for making separators
Sl. No Soil properties Red soil (CMFC-1) Black soil (CMFC-2)
1 pH 7.4 8.5
2 Porosity, % 11.6 17.6
3 Electrical conductivity, mS cm-1 2.403 0.045
4 Cation exchange capacity (CEC), mmol (kg soil)-1 125 20

J. Electrochem. Sci. Eng. 4(4) (2014) 315-326 CERAMIC SEPARATOR IN MICROBIAL FUEL CELL
320
Wastewater treatment
After inoculating the anodic chamber of the CMFCs with heat pretreated anaerobic mixed
consortia, synthetic feed was supplied and wastewater treatment performance of the CMFCs
under different feed cycles was observed. Average COD removal efficiency of 78.9 ± 3.9 % and
89.6 ± 3.2 % was observed in CMFC-1 and CMFC-2, respectively. COD removal efficiency in the
CMFC-2 was higher than the CMFC-1. It was observed that porosity of clayware pot used in
CMFC-2 was 52 % higher (Table 1) than that of CMFC-1, because of which probably it has
permitted more diffusion of oxygen from cathodic chamber to anodic chamber to support aerobic
oxidation of fraction of substrate present in anodic chamber to establish higher COD removal
efficiency. The oxygen diffusion coefficient in the range of 5.38 x 10⁻⁶ to 6.67 x 10⁻⁶ cm2 s-1 is
reported in early studies for this clayware separator by Behera and Ghangrekar [13]. In addition,
due to more porosity of separator used in CMFC-2, exchange of water molecules due to osmosis
across the membrane might have diluted the anolyte, resulting in higher COD removal rate.
Electricity generation
Performance of CMFCs was evaluated by measuring the open circuit voltage and operating
voltage. The current and voltage gradually increased with time of operation. The maximum voltage
across 100 Ω resistance of 286 mV and 280 mV was observed in CMFC-1 and CMFC-2, respectively.
CMFC-1 generated a maximum sustainable power density (normalized to the anode surface area)
and volumetric power (normalized to the working volume of anodic chamber) of 30.5 mW m-2 and
1.49 W m-3 (Fig. 1), respectively; whereas, CMFC-2 generated power density of 25.7 mW m-2 and
volumetric power of 1.12 W m-3. The power produced by CMFC-1, made from red soil, was 1.33
times higher than the CMFC-2 wherein the separator was made from black soil with lower CEC and
electrical conductivity. It is interesting to note here that in spite of having higher separator area
and more liquid volume (anodic chamber) for CMFC-2, it generated less power compared to
CMFC-1.
Figure 1. Volumetric power density of CMFC-1 and CMFC-2
0 2 4 6 8 10 12 14 16 18 20 22
0.4
0.6
0.8
1.0
1.2
1.4
1.6
Po
we
r d
en
sity
, W m
-3
Time, days MFC-1 MFC-2

A. N. Ghadge at al. J. Electrochem. Sci. Eng. 4(4) (2014) 315-326
doi: 10.5599/jese.2014.0047 321
Effect of chemical properties of soil used for making separator on electricity generation
The CEC of red soil is 6.25 times (Table 1) higher than black soil, indicating more number of
exchange sites are available for the transfer of cations in red soil. Due to availability of more
exchange sites in CMFC-1, better transfer of the protons occurred to improve the power
generation in CMFC-1 compared to CMFC-2. In addition, the XRF data (Table 2) confirms that the
aluminum content of the red soil is more than the black soil which makes the red soil more acidic
than black soil. The pH of the red soil (Table 1) was lower than black soil confirming that the red
soil is more acidic and has high capacity to hold the H+ ions which improved the performance of
CMFC-1 in terms of power generation.
Electrical conductivity is the measure of salt concentration in the soil solution. Soils high in
smectite often exhibit high electrical conductivity due to water associated with the clays. The soil
with high montmorillonite mineral can act as better proton exchange material due to its
hydrophilic nature and the high cation exchange capacity [34]. The conductivity of soil used as
separator in CMFC-1 is almost 53.4 times (Table 1) more compared to CMFC-2, authenticating
utility of the red soil for making separator to harvest more power from the CMFCs.
Table 2. Chemical compounds present in red and black soil
Sl. No
Compound Content, % Sl.
No Compound
Content, %
Red soil Black soil Red soil Black soil
1 Na2O 3.95 0.273 14 Co 0.406 0.441
2 MgO 0.654 3.86 15 Ni 0.004 0.006
3 Al2O3 26.3 21.6 16 Cu 0.274 0.282
4 SiO2 57.5 53.4 17 Zn 0.005 0.023
5 P2O5 1.13 0.204 18 Ga 0.001 0.001
6 SO3 0.258 0.162 19 Rb 0.007 0.008
7 K2O 1.78 0.798 20 Sr 0.004 0.017
8 CaO 0.791 10.4 21 Y 0.004 0.002
9 Fe2O3 4.70 6.75 22 Zr 0.013 0.010
10 Cl 1.45 0.071 23 Nb 0.001 0.0005
11 Ti 0.658 1.45 24 Ba 0.012 0.020
12 Cr 0.01 0.01 25 Ce 0.021 0.023
13 Mn 0.067 0.093 26 Pb 0.003 0.002
Coulombic efficiency
Coulombic efficiency compares the recovery of the coulombs through the external circuit
against theoretical coulombs that is present in the organic matter. CMFC-1 showed average CE of
7.69 ± 1.52 %, whereas in CMFC-2 it was 6.39 ± 1.40 %. Higher CE of CMFC-1 than CMFC-2 might
have been due to the difference in the CEC of red and black soil and also due to more diffusion of
oxygen in case of black soil due to high porosity. In MFCs higher CE is reported with pure inoculum
culture and with synthetic wastewater [35].

J. Electrochem. Sci. Eng. 4(4) (2014) 315-326 CERAMIC SEPARATOR IN MICROBIAL FUEL CELL
322
Polarization and Internal resistance
Polarization curve helps to understand the performance of MFC in terms of power generation
and internal resistance. It represents the cell voltage and power density as a function of the
current density. Figure 2 shows power and polarization curves obtained using variable resistor box
for CMFC-1 and CMFC-2.
Figure 2. Polarization curve for CMFC-1 and CMFC-2
During polarization, the maximum power density observed for CMFC-1 was 51.65 mW m-2
(E = 0.204 V, Rext = 30 Ω) and that of CMFC-2 it was 31.20 mW m-2 (E = 0.217 V, Rext = 50 Ω). This
indicates that the higher CEC of red soil supported better proton transfer from the anode to the
cathode in CMFC-1. Conversely, lower power output observed in CMFC-2 could be attributed to
the lesser CEC of black soil used for making separator (Table 1). It is well documented that the
cation exchange capacity of soil plays vital role in the proton transfer mechanism in soil [36].
Internal resistances of CMFC-1 and CMFC-2 measured from the slope of the plot of voltage vs.
current were 36 Ω and 56.5 Ω, respectively. In the region of low current density (Fig. 2) rapid
voltage drops were observed in both the MFCs, and in the region of high current density, voltage
decreased linearly at lower rate. Lower proton transfer rate and low conductivity of black soil used
for making separator of CMFC-2 increased the internal resistance.
Electrode Potential
Electrode potentials represent the energy level of the electrons at anode and cathode.
Electrons move from area of higher potential energy to area of lower potential energy. As the
anode has a higher potential energy so electrons move from anode to cathode through an external
circuit. During polarization, cathode of CMFC-1 well supported for the reduction reaction up to
0.5 mA current at 1000 Ω external resistance. However, the cathode potential of CMFC-2 dropped
to zero (vs. Ag/AgCl) at 0.25 mA current at 2100 Ω external resistance, showing inefficiency of
cathode for reduction reaction at higher current (Fig. 3).
0 50 100 150 200 250 300 350 400
0
100
200
300
400
500
600
700
CMFC-2 Cell voltage CMFC-1 Cell voltage
CMFC-2 Power density CMFC-1 Power density
Current density, mA m-2
Volt
age,
mV
0
5
10
15
20
25
30
35
40
45
50
55
Pow
er d
ensi
ty, m
W m
-2

A. N. Ghadge at al. J. Electrochem. Sci. Eng. 4(4) (2014) 315-326
doi: 10.5599/jese.2014.0047 323
Figure 3. Change of the cathode and anode potentials during polarization in CMFC-1 and CMFC-2
The open circuit potentials (OCP) for anode observed before polarization (vs. Ag/AgCl) for
CMFC-1 and CMFC-2 were -610 mV and -580 mV, respectively. During polarization, increase in
anode potentials was observed in both the MFCs due to transfer of electrons from anode to
cathode, thus positive overpotential was observed. However, the anode potentials during polariz-
ation in both the MFCs were only slightly increased, indicating better stability of the anodes.
Electrode Kinetics
Tafel plot analyses were carried out to determine the exchange current density (i0), charge
transfer coefficient () and charge transfer resistance (Rct). The values obtained from these
analyses are summarized in Table 3. Based on the Tafel-type linear equation obtained from the
graphs (Figs. 4A, 4B), the slope is F/RT and the y-axis intercept is the logarithm of the exchange
current.
For anodic reaction at 25°C, the slope of Tafel plot is
b = 0.059 / 1 - (5)
and at the same time the slope for cathodic reaction is
b = 0.059 / (6)
The value of i0 represents the rate of exchange current density at equilibrium state when the
reaction overpotential is zero. Higher the exchange current (i0) faster is the reaction rate, resulting
in a lower activation energy barrier of forward reaction [37]. The electrode materials used in both
the CMFCs were same, however different reaction kinetics at electrodes was observed. The
reactions at cathodes were faster than anode. Presence of very high actual surface area of the
carbon felt material resulted in producing a low cathodic overpotential [38]. Comparing the i0
values for the reduction reactions at cathode of CMFC-1 and CMFC-2, the CMFC-1 with separator
made from red soil had better performance. It indicates that the reactions at cathode of CMFC-1
were faster; might be due to the higher transfer of H+ ions and other cations in CMFC-1, enhancing
the reaction rates at cathode. Comparing the anodes of both the CMFCs, reactions at the anode of
CMFC-2 were slightly faster than CMFC-1. Apart from the differences in the CEC, the reactions at
cathode of CMFC-2 were slower than CMFC-1. This could be probably due to the higher porosity of
0 2 4 6 8 10 12-600
-500
-400
-300
-200
-100
0
100
200
300
Ele
ctro
de
po
ten
tial
, mV
Current, mA
CMFC-1 Cathode potential CMFC-1 Anode potential
CMFC-2 Cathode potential CMFC-2 Anode potential
J. Electrochem. Sci. Eng. 4(4) (2014) 315-326 CERAMIC SEPARATOR IN MICROBIAL FUEL CELL
324
the clayware separator used in CMFC-2, due to which the substrate exchange occurred and oxygen
supplied in the cathodic chamber was utilized by the substrate. The exchange current densities of
CMFC-1 and CMFC-2 cathodes were 3.38 and 2.05 times more than that of the respective anodes,
clearly indicating that the reaction at cathode was much faster than anode.
A
B
Figure 4. Tafel plots for A - cathode of CMFC-1 and CMFC-2, and
B - anode of CMFC-1 and CMFC-2
According to the Butler–Volmer model of electrode kinetics, the charge transfer coefficient ()
is used to describe the symmetry between the forward and reverse electron transfer steps and the
magnitude of ranges in value from 0 to 1. Charge transfer coefficient signifies the fraction of the
interfacial potential at an electrode-electrolyte interface that helps in lowering the free energy
barrier for the electrochemical reaction. Lower electron transfer coefficient indicates less
activation energy required for the electron transfer, resulting lower activation loss [37]. Charge
transfer resistance (Rct) represents the capability to resist the transfer of charge from electrode-
electrolyte interface. It is interesting to note that the Rct and (Table 3) of cathodes for both the
MFCs were much lesser than the anode of both the MFCs.
-250 -200 -150 -100 -50 00.0
0.5
1.0
1.5
2.0
Cathode CMFC-1 Cathode CMFC-2
Overpotential, mV
ln (
i / m
A m
-2)
0 20 40 60 80 100 120 140 1602
3
4
5
6
7
8
Overpotential, mV
Anode CMFC-2 Anode CMFC-1
ln (
i / m
A m
-2)

A. N. Ghadge at al. J. Electrochem. Sci. Eng. 4(4) (2014) 315-326
doi: 10.5599/jese.2014.0047 325
Table 3. Tafel analysis of CMFC-1 and CMFC-2
Parameter CMFC-1 CMFC-2
Anode Cathode Anode Cathode
Exchange current density (i0), mA m-2 0.60 2.03 0.74 1.52
Charge transfer coefficient () 0.30 0.032 0.45 0.038
Charge transfer resistance (Rct), Ω m2 10.70 3.16 8.67 4.22
The Rct and values for cathode of CMFC-1 were lower than CMFC-2, which supports that the
clayware membrane made from red soil supported better reaction at the cathode. This is because
of high cation transported from CMFC-1 to the cathode side, increased the rate of electrochemical
transformation with lower electrical energy loss, thus charge transfer coefficient gets reduced.
Lower Rct for anode of CMFC-2 than anode of CMFC-1 indicated that the anode of CMFC-2 was
performing slightly better, as also evident from the exchange current density. However, due to
limitations of the cathodic reactions the overall performance of CMFC-2 was inferior as compared
to CMFC-1.
Conclusions
Properties of the clayware separator such as CEC, pH and electrical conductivity influenced the
performance of MFCs. The power generation of MFC having separator made from red soil was
better than the black soil, due to high CEC, low pH and higher electrical conductivity of the red soil.
Results of Tafel plots showed that lower exchange current density and higher charge transfer
resistance of anodes compared to cathodes, contributed towards more activation loss in both the
MFCs. In spite of similar electrode materials in both CMFCs, variation in electrode kinetics
accentuate effect of properties of separator on the performance of CMFCs. Detailed studies on the
mineral composition of soils are required to enhance the CEC for further improving power
generation of MFC made with such low cost clayware separator. Development of such efficient
and cheaper separator material will help in drastically reducing fabrication cost of MFC for field
implementation.
Acknowledgement: Grants received from Department of Science and Technology, Government of India (File No. DST/TSG/NTS/2010/61) to undertake this work is duly acknowledged.
References
[1] B. E. Logan, B. Hamelers, R. Rozendal, U. Schröder, J. Keller, S. Freguia, P. Aelterman, W. Verstraete, K. Rabaey, Environ. Sci. Technol. 40 (2006) 5181-5192.
[2] D. A.Lowy, L. M. Tender, J. G. Zeikus, D. H. Park, D. R. Lovley, Biosens. Bioelectron. 21 (2006) 2058-2063.
[3] K. Rabaey, W. Ossieur , M. Verhaege, W. Verstraete, Water Sci. Technol. 52(1) (2005) 515-523.
[4] K. Rabaey, W. Verstraete, Trends Biotechnol. 23 (2005) 291-298. [5] B. E. Logan, J.M. Regan, Environ. Sci. Technol. 40 (2006) 5172-5180. [6] Y. Tian, C. Ji, K. Wang, P. Le-Clech, J. Membr. Sci. 450 (2014) 242-248. [7] D. Pant, G. Van Bogaert, M. De Smet, L. Diels, K. Vanbroekhoven, Electrochim. Acta 55
(2010) 7710-7716. [8] R. A. Rozendal, H. V. Hamelers, C. J. Buisman, Environ. Sci. Technol. 40(17) 5206-5211.
J. Electrochem. Sci. Eng. 4(4) (2014) 315-326 CERAMIC SEPARATOR IN MICROBIAL FUEL CELL
326
[9] M. M. Hasani-Sadrabadi, S. H. Emami, R. Ghaffarian, H. Moaddel, Energ. Fuel 22 (2008) 2539-2542.
[10] C. Felice, S. Ye, D. Qu, Ind. Eng. Chem. Res. 49 (2010) 1514-1519. [11] D. H. Park, J. G. Zeikus, Biotechnol. Bioeng. 81 (2003) 348-355. [12] H. N. Seo, W. J. Lee, T. S. Hwang, D. H. Park, J. Microbiol. Biotechnol. 19 (2009) 1019-1027. [13] M. Behera, M. M. Ghangrekar, Water Sci. Technol. 64 (2011) 2468-2473. [14] F. F. Ajayi, P. R. Weigele, Bioresour. Technol. 116 (2012) 86-91. [15] J. Winfield, J. Greenman, D. Huson, I. Ieropoulos, Bioprocess Biosyst. Eng. 36 (2013) 1913-
1921. [16] V. V. Volk, M. L. Jackson, Clays Clay Mineral. 12 (1964) 281-285. [17] A. G. Hunt, S. D. Logsdon, D. A. Laird, Soil Sci. Soc. Am. J. 70 (2006) 14-23. [18] G. C. Gil, I. S. Chang, B. H. Kim, M. Kim, J. K. Jang, H. S. Park, H. J. Kim, Biosens. Bioelectron.
18 (2003) 327-334. [19] H. Liu, B. E. Logan, Environ. Sci. Technol. 38 (2004) 4040-4046. [20] K. Raman, M. Mortland, Soil Sci. Soc. Am. J. 33 (1969) 313-317. [21] M. F. Delbem, T. S. Valera, F. R. Valenzuela-Diaz, N. R. Demarquette, Quím. Nova 33 (2010)
309-315. [22] J. H. Chang, J. H. Park, G. G. Park, C. S. Kim, O. O. Park, J. Power Sources 124 (2003) 18-25. [23] B. Liao, M. Song, H. Liang, Y. Pang, Polymer 42 (2001) 10007-10011. [24] J. Derome, A. J. Lindroos, Environ. Pollut. 99 (1998) 225-232. [25] G. P. Matthews, G. M. Laudone, A. S. Gregory, N. R. A. Bird, A. D. G. Matthews, W. R.
Whalley, Water Resour. Res. 46 (2010) W05501. [26] M. Behera, P. S. Jana, M. M. Ghangrekar, Bioresour. Technol. 101 (2010) 1183-1189. [27] G. S. Jadhav, M. M. Ghangrekar, Appl. Biochem. Biotech. 151 (2008) 319-332. [28] APHA, Standard methods for examination of water and wastewater. American Public
Health Association, American Water Works Association, Water Environment Federation, 20th ed.,Washington, DC 1998.
[29] C. Picioreanu, I. M. Head, K. P. Katuri, M. van Loosdrecht, K. Scott, Water Res. 41 (2007) 2921-2940.
[30] Indian standards, IS:2720-Part 26, Methods of test for soils (Determination of pH value), Bureau of Indian Standard, New Delhi, India 1987.
[31] Indian standards, IS:14767, Methods of test for soils (Determination of specific electrical conductivity), Bureau of Indian Standard, New Delhi, India, 2000.
[32] Indian standards, IS:2720-Part 24, Methods of test for soils (Determination of cation exchange capacity), Bureau of Indian Standard, New Delhi, India, 1976.
[33] A. J. Bard, L. R. Faulkner, Electrochemical methods: principles and applications, John Wiley & Sons, Inc. New York, 2001.
[34] H. Quiquampoix, J. Soil Sci. Plant Nutr. 8 (2008) 75-83. [35] P. Aelterman, K. Rabaey, H. T. Pham, N. Boon, W. Verstraete, Environ. Sci. Technol. 40
(2006) 3388-3394. [36] B. Ulrich, J. Plant Nutr. Soil SC. 149 (1986) 702-717. [37] S. Srikanth, M. Venkateswar Reddy, S. Venkata Mohan, Bioresour. Technol. 119 (2012) 241-
251. [38] Q. Deng, X. Li, J. Zuo, A. Ling, B.E. Logan, J. Power Sources 195 (2010) 1130-1135.
© 2014 by the authors; licensee IAPC, Zagreb, Croatia. This article is an open-access article distributed under the terms and conditions of the Creative Commons Attribution license
(http://creativecommons.org/licenses/by/3.0/)


![Starbucks Am Sci 2021;17(4):37-47]. ISSN 15451003 (print)](https://static.fdokumen.com/doc/165x107/6334af9f62e2e08d4902bbea/starbucks-am-sci-202117437-47-issn-15451003-print.jpg)