Ion permeation through a narrow channel: using gramicidin to ascertain all-atom molecular dynamics...
22
Ion Permeation through a Narrow Channel: Using Gramicidin to Ascertain All-Atom Molecular Dynamics Potential of Mean Force Methodology and Biomolecular Force Fields Toby W. Allen,* Olaf S. Andersen, y and Benoit Roux y *Department of Chemistry, University of California at Davis, Davis, California; and y Department of Physiology and Biophysics, Weill Medical College of Cornell University, New York, New York ABSTRACT We investigate methods for extracting the potential of mean force (PMF) governing ion permeation from molecular dynamics simulations (MD) using gramicidin A as a prototypical narrow ion channel. It is possible to obtain well-converged meaningful PMFs using all-atom MD, which predict experimental observables within order-of-magnitude agreement with experimental results. This was possible by careful attention to issues of statistical convergence of the PMF, finite size effects, and lipid hydrocarbon chain polarizability. When comparing the modern all-atom force fields of CHARMM27 and AMBER94, we found that a fairly consistent picture emerges, and that both AMBER94 and CHARMM27 predict observables that are in semiquantitative agreement with both the experimental conductance and dissociation coefficient. Even small changes in the force field, however, result in significant changes in permeation energetics. Furthermore, the full two-dimensional free-energy surface describing permeation reveals the location and magnitude of the central barrier and the location of two binding sites for K 1 ion permeation near the channel entrance—i.e., an inner site on-axis and an outer site off-axis. We conclude that the MD-PMF approach is a powerful tool for understanding and predicting the function of narrow ion channels in a manner that is consistent with the atomic and thermally fluctuating nature of proteins. INTRODUCTION As computational methods increasingly are used to interpret or predict biomolecular function (1), it becomes important to critically evaluate their suitability. In principle, the molecular dynamics (MD) potential of mean force (PMF) approach offers the best route from computer simulation to experiment (2) in a manner that is consistent with the atomic and thermally fluctuating nature of proteins (3,4). In practice, computational studies of ion permeation face significant challenges due to the widely varying timescales of protein and membrane thermal fluctuations that become relevant when constructing permea- tion models. These fluctuations range from rapid bond, angle, and torsion fluctuations to side-chain isomerizations and large- scale protein and lipid conformational changes (5). Because these fluctuations underlie all protein function, they need to be incorporated in computational models that aim to interpret biological structure-function relationships (6). Moreover, be- cause these thermal protein fluctuations are associated with large variations in ion energetics (3,7), it becomes essential to explicitly incorporate their effects in order to obtain appropri- ate equilibrium averages for the parameters of interest. A direct connection between structure and function cannot easily be obtained via MD simulation, however, because ionic fluxes correspond to transit times of 10–100 ns— meaning that it becomes difficult to establish contact with experimental results (single-channel conductances and ion binding constants). To circumvent this difficulty, macro- scopic (e.g., (8–10) or semimicroscopic (e.g., (7,11–13)) physical models, which treat some or all of the system as uniform dielectric media, have been invoked. In this study, we instead chose to keep the fully microscopic treatment and demonstrate that permeation can be accurately described via an equilibrium free energy surface that incorporates all of the thermal fluctuations of the ions, water, protein, and phos- pholipids and which is free of parameter fitting. For this purpose, we employ MD to sample a statistical ensemble of configurations for a fully explicit, atomistic system which, with ion mobility calculations, is fed into a phenomenolog- ical conduction model consistent with the PMF calculation (14,15). We show that this approach can be used to obtain a rigorously defined, well-converged, and consistent free energy surface and demonstrate that present-day MD force fields—in conjunction with present-day computational methods—are, perhaps surprisingly, accurate in describing ion permeation through a narrow pore. To test the approach, and its ability to predict experimental observables, we chose the gramicidin A (gA) channel as our test case because this channel, with its single file pore, poses an extreme challenge for computational investigations of molecular function. The gA channel structure is known, being a single-stranded, right-handed b 6.3 -helical dimer (16), which has been thoroughly characterized structurally (17– 20) and functionally (21–25). It is also small enough to allow good sampling with rather modest computational resources (26). The gA channel thus is an excellent system for testing how well MD-PMF simulations can be used to predict Submitted November 2, 2005, and accepted for publication February 6, 2006. Address reprint requests to Toby W. Allen, Dept. of Chemistry, University of California, Davis, One Shields Ave., Davis, CA 95616. Tel.: 530-754- 5968, Fax: 530-752-8995; E-mail: [email protected]. Benoit Roux’s present address is Institute of Molecular Pediatric Sciences Center for Integrative Science, University of Chicago, Chicago, IL. Ó 2006 by the Biophysical Society 0006-3495/06/05/3447/22 $2.00 doi: 10.1529/biophysj.105.077073 Biophysical Journal Volume 90 May 2006 3447–3468 3447
-
Upload
independent -
Category
Documents
-
view
0 -
download
0
Transcript of Ion permeation through a narrow channel: using gramicidin to ascertain all-atom molecular dynamics...

Ion Permeation through a Narrow Channel: Using Gramicidin toAscertain All-Atom Molecular Dynamics Potential of Mean ForceMethodology and Biomolecular Force Fields
Toby W. Allen,* Olaf S. Andersen,y and Benoit Rouxy
*Department of Chemistry, University of California at Davis, Davis, California; and yDepartment of Physiology and Biophysics,Weill Medical College of Cornell University, New York, New York
ABSTRACT We investigate methods for extracting the potential of mean force (PMF) governing ion permeation from moleculardynamics simulations (MD) using gramicidin A as a prototypical narrow ion channel. It is possible to obtain well-convergedmeaningful PMFs using all-atom MD, which predict experimental observables within order-of-magnitude agreement withexperimental results. This was possible by careful attention to issues of statistical convergence of the PMF, finite size effects, andlipid hydrocarbon chain polarizability. When comparing the modern all-atom force fields of CHARMM27 and AMBER94, we foundthat a fairly consistent picture emerges, and that both AMBER94 andCHARMM27 predict observables that are in semiquantitativeagreement with both the experimental conductance and dissociation coefficient. Even small changes in the force field, however,result in significant changes in permeation energetics. Furthermore, the full two-dimensional free-energy surface describingpermeation reveals the location andmagnitudeof the central barrier and the location of twobinding sites forK1 ion permeation nearthe channel entrance—i.e., an inner site on-axis and an outer site off-axis. We conclude that the MD-PMF approach is a powerfultool for understandingandpredicting the functionof narrow ionchannels inamanner that is consistentwith theatomicand thermallyfluctuating nature of proteins.
INTRODUCTION
As computational methods increasingly are used to interpret
or predict biomolecular function (1), it becomes important to
critically evaluate their suitability. In principle, the molecular
dynamics (MD) potential of mean force (PMF) approach
offers the best route from computer simulation to experiment
(2) in a manner that is consistent with the atomic and thermally
fluctuating nature of proteins (3,4). In practice, computational
studies of ion permeation face significant challenges due to the
widely varying timescales of protein and membrane thermal
fluctuations that become relevant when constructing permea-
tion models. These fluctuations range from rapid bond, angle,
and torsion fluctuations to side-chain isomerizations and large-
scale protein and lipid conformational changes (5). Because
these fluctuations underlie all protein function, they need to be
incorporated in computational models that aim to interpret
biological structure-function relationships (6). Moreover, be-
cause these thermal protein fluctuations are associated with
large variations in ion energetics (3,7), it becomes essential to
explicitly incorporate their effects in order to obtain appropri-
ate equilibrium averages for the parameters of interest.
A direct connection between structure and function cannot
easily be obtained via MD simulation, however, because
ionic fluxes correspond to transit times of 10–100 ns—
meaning that it becomes difficult to establish contact with
experimental results (single-channel conductances and ion
binding constants). To circumvent this difficulty, macro-
scopic (e.g., (8–10) or semimicroscopic (e.g., (7,11–13))
physical models, which treat some or all of the system as
uniform dielectric media, have been invoked. In this study,
we instead chose to keep the fully microscopic treatment and
demonstrate that permeation can be accurately described via
an equilibrium free energy surface that incorporates all of the
thermal fluctuations of the ions, water, protein, and phos-
pholipids and which is free of parameter fitting. For this
purpose, we employ MD to sample a statistical ensemble of
configurations for a fully explicit, atomistic system which,
with ion mobility calculations, is fed into a phenomenolog-
ical conduction model consistent with the PMF calculation
(14,15). We show that this approach can be used to obtain a
rigorously defined, well-converged, and consistent free energy
surface and demonstrate that present-day MD force fields—in
conjunction with present-day computational methods—are,
perhaps surprisingly, accurate in describing ion permeation
through a narrow pore.
To test the approach, and its ability to predict experimental
observables, we chose the gramicidin A (gA) channel as our
test case because this channel, with its single file pore, poses
an extreme challenge for computational investigations of
molecular function. The gA channel structure is known,
being a single-stranded, right-handed b6.3-helical dimer (16),
which has been thoroughly characterized structurally (17–
20) and functionally (21–25). It is also small enough to allow
good sampling with rather modest computational resources
(26). The gA channel thus is an excellent system for testing
how well MD-PMF simulations can be used to predict
SubmittedNovember 2, 2005, and accepted for publication February 6, 2006.
Address reprint requests to Toby W. Allen, Dept. of Chemistry, University
of California, Davis, One Shields Ave., Davis, CA 95616. Tel.: 530-754-
5968, Fax: 530-752-8995; E-mail: [email protected].
Benoit Roux’s present address is Institute of Molecular Pediatric Sciences
Center for Integrative Science, University of Chicago, Chicago, IL.
� 2006 by the Biophysical Society
0006-3495/06/05/3447/22 $2.00 doi: 10.1529/biophysj.105.077073
Biophysical Journal Volume 90 May 2006 3447–3468 3447
complex molecular functions. Since the first MD simulations
on this molecule in 1984 (27), several studies have improved
our understanding of the microscopic mechanisms of ion
permeation (for review, see (28)). The aim of this study was
to critically examine, and hopefully validate, this approach
by directly finding contact with experimental measurements.
A perennial problem in previous studies has been that MD
simulations predicted free energies corresponding to rates of
ion movement several orders-of-magnitude smaller than the
measured rates (27,29,30). Perhaps the most notable exam-
ple was the pioneering computations by Mackay et al. (27),
in 1984, which revealed a barrier of nearly 40 kcal/mol op-
posing translocation of a Cs1 along the axis of the gA channel
(these results were reported in (31)). In more recent studies
(29,30), the MD-PMF profiles for K1 across the gA channel
were constructed using no more than 80 ps simulations per
umbrella sampling window (30) (see also (32)). These cal-
culations also predicted barriers for ion permeation that were
several kcal/mol too high to be compatible with experiment
(possibly as much as ;7 kcal/mol, based on the findings of
this study), meaning that the predicted rates of ion movement
were approximately five orders-of-magnitude too low. This
could suggest that the atomic force fields used in MD simu-
lations are not adequately calibrated and therefore unable to
sufficiently stabilize ions within the narrow pore, as compared
to bulk water. Methodological limitations, such as the con-
struction of starting configurations, equilibration, and simu-
lation times also might account for the poor prediction of
experimental observables. Indeed, a recent study in which the
sampling of the equilibrium distribution of ions was greatly
extended (15), and in which destabilizing effects of periodicity
and hydrocarbon polarizability were accounted for, led to a
well-converged PMF that allowed for semiquantitative pre-
diction of experimental observables. Therefore, as these com-
putational studies have become more sophisticated (with
improved methodologies and computational sampling), they
provide increasing confidence that MD-PMF calculations
could become a powerful tool for understanding (and eventu-
ally predicting) ion permeation (and, by implication, other
molecular functions).
The difficulties encountered in MD simulations of ion
permeation can be traced largely to the observation that the
measured rates of ion permeation for gA channels are very
high (at low permeant ion concentrations comparable to
predictions based on a simple waterfilled pore immersed in
bulk water (33)). This means that there cannot be a major
energy barrier for ion movement, such that the energy profile
for permeating ions result from almost complete cancellation
of two very large opposing contributions: ion dehydration
and protein/pore water solvation. MD simulations going back
to 1984 (27) identified a possible major role of the single-file
water to overcome the large dehydration barrier, and almost
complete cancellation of the barrier by a combination of the
single-file water and protein was demonstrated when the
overall PMF was decomposed into water, protein, and mem-
brane/bulk water contributions (15). This need to accurately
represent ion solvation in both extremes of bulk water and
almost complete dehydration in a narrow pore poses sig-
nificant challenges to MD force fields.
The MD-PMF strategy adopted in this study is based on
the assumption that the long-time behavior of an ion per-
meation event is dominated by some rate-determining step(s)
and that its dynamical evolution can be described as a prog-
ress along some reaction coordinate (2). The true reaction
coordinate for a given system is not known a priori, and the
MD-PMF strategy consists in choosing some suitable order
parameter (e.g., the position of the translocating ion along
the channel axis) as a mathematical surrogate for the true
reaction coordinate. The underlying assumption is that all
other variables fluctuate rapidly, such that they can be inte-
grated over in order to obtain a PMF for the chosen order
parameter(s). Different choices of order parameters may pro-
vide adequate descriptions of the rate-determining step(s)—
and usually yield slightly different PMFs—but the absolute
transition rate is insensitive to such choices as long as
dissipative factors are considered properly (34,35). In our
case, relatively slowly varying degrees of freedom have been
associated with the orientation/reorientation of the single file
water column (15), which could be important for describing
the microscopic dynamical mechanisms of permeation, in
particular the kinetics of ion entry/exit. For now, however,
we describe the permeation mechanism in terms of the ionic
spatial coordinates alone, as a useful simplification.
Within this framework, we pursued strategies for identi-
fying the most vulnerable aspects of MD-PMF simulations
with the goal of improving their ability to predict experi-
mental observables. To this end, we examine the dependence
of ion conduction observables on the choice of MD force
field and explore the sensitivity of the results to small changes
in parameters. We conclude: first, that careful attention to the
physical system at hand allows for significantly improved
predictions of experimental observables; second, that simple
changes in a given force field are unlikely to provide sig-
nificant improvements; and third, that while semiquantitative
agreement with experiment can be achieved with a modern all-
atom fixed-charge force field, ultimately an electronically
polarizable simulationwill be required for further improvement.
METHODS AND RESULTS
Ion channel-membrane simulations
Simulations were done with the programCHARMM (36) using
the PARAM27 (37) force field (referred to as CHARMM27
from here on), with standard protein (37) and TIP3P water
(38) with ion parameters from Beglov and Roux (39). Sim-
ulations were also donewith the all-atomAMBER PARAM94
(40), using TIP3P water, with ion Lennard-Jones parameters
from Aqvist (41), and also with the united-atom GROMOS87
(42) force field, using the SPC water model (43) and ion
3448 Allen et al.
Biophysical Journal 90(10) 3447–3468

parameters from Straatsma and Berendsen (44). We employ
the AMBER94 force field previously imported into the
CHARMM program (45) and imported GROMOS87 into
CHARMM for comparison. In each case, the standard
CHARMM27 lipid parameters were used (46) so as to isolate
the effects of the protein when comparing PMFs. The use of
particle-mesh Ewald (47), SHAKE (48), and constant pres-
sure and temperature algorithms (49), have been described
previously (15,20).
Systems that consist of a gA helical dimer (Protein Data
Bank (PDB) No. 1JNO (18)) embedded in a DMPC bilayer
(Fig. 1), were created using extensions of previous mem-
brane-building techniques (50). The choice of starting gA
structure is based on evidence (20) that dynamical trajecto-
ries starting with the PDB:1JNO structure reproduce exper-
imental solid-state NMR measurements (51) better than the
solid-state NMR PDB:1MAG structure (19). Membrane
patches of approximately one and three shells of lipid
molecules around the gA protein were used in the simulations.
These patches consisted of 20 and 96 lipid molecules, and
1080 and 3996 water molecules, respectively. For the smaller
one-shell system, hexagonal periodic boundaries of xy-translation length 32.1 A, as determined from the area of the
protein and lipids, and average height ;74 A, were imposed
on the protein-membrane system. For the larger three-shell
system, the hexagon xy-translation length was 61.9 A, with
average height;75 A. Pressure coupling was employed in the
z-direction (parallel to the membrane normal); the x,ydimensions of the hexagonal boundaries remained fixed
during simulations. A 1 M KCl ionic solution was to used
ensure good sampling of the ionic bath; this corresponds to 19
K1 and Cl� pairs in the smaller system and 74 pairs in the
larger system. Fig. 1 A shows the gA ion channel embedded in
one shell of lipids. Fig. 1, B and C, shows the small and large
systems, respectively, from the top with periodic images.
The selection of starting configurations for umbrella
sampling PMF calculation was influenced by our observa-
tions from unbiased simulation. First, we need to consider
the occurrence of side-chain isomerizations (20). Trp-9
isomerizations occur on the nanosecond timeframe, meaning
that sampling long enough to get an equilibrium distribution
of rotameric states presents a challenge. Based on compar-
isons with solid-state NMR observables, we determined that
the dominant Trp-9 rotameric state is the one suggested by
solution-state NMR (17,18). Fig. 2 shows the distribution of
side-chain conformations, with the dominant rotamer high-
lighted with a solid rectangular box. It is important to ensure
that the protein remains near its dominant structure. This side-
chain rotamer of Trp-9 was maintained by a flat-bottom
harmonic potential with force constant 100 kcal/mol/rad2. To
maintain 140 , x1 , 250�, the harmonic potential was
activated for dihedral values x1 , 150� or x1 . 240�.Similarly, to maintain 0 , x2 , 150� the potential was
activated for dihedral values x2 , 10� or x2 . 140�. Thus,the side chain experiences no force within the indicated
box (to allow the usual thermal fluctuations), but provides
stiff opposition if the side chains attempt to change rotameric
state.
FIGURE 1 Gramicidin A in the bilayer: (A) one-shell
system: gA dimer (yellow); DMPC bilayer atoms C (gray),
O (red), N (blue), and P (green); K1 (green spheres) andCl� (gray spheres); water O (red) and H (white). Within
the channel, seven single-file water molecules are drawn as
spheres adjacent to a single K1 ion at the channel entrance.
The chosen MD frame has a channel axis with tilt angle
;9� relative to the membrane normal vector z. Some lipid
molecules and electrolyte from neighboring images are
visible. (B) One-shell system (CPK color with green lipid
C atoms) with hexagonal periodic images (CPK color with
gray lipid C atoms) viewed along the membrane normal.
Water molecules and ions have been removed for clarity.
(C) Three-shell (large) system with hexagonal periodic
images.
Ion Permeation through a Narrow Channel 3449
Biophysical Journal 90(10) 3447–3468

Secondly, we observed occasional interference by phos-
pholipid headgroups near the channel entrances (in particular
for the larger three-shell system). Fig. 3 shows two-
dimensional lipid distributions around the gA channel for
the one- and three-shell systems. The proximity of the lipid
headgroup to the channel entrance is evident in this sample of
trajectory for the three-shell system. When choosing initial
configurations for the PMF calculation, a test was done to see if
any lipid atoms were within 4 A of the channel axis. No
constraintswere applied to control lipids during the simulations.
Another observation from unbiased simulation was that
occasionally water may protrude deep into the membrane
nearby the channel protein. This is consistent with the
experimentally observed water mole fractions of the order of
10�4 in bulk C7–C16 hydrocarbons (52), which is likely to be
enhanced further by the presence of protein. While this is
a natural occurrence, we wished to begin with a similar
environment for all window simulations. Thus if water mol-
ecules were penetrating very deep into the membrane near the
protein (jzj# 6 A), the initial configuration was discarded. No
constraints were applied to prevent water penetration into the
bilayer during the production simulations; during the 1–2 ns/
window simulation period, the equilibrium sampling therefore
did include configurations with water penetration. We did not
pursue this question further.
Next, while the water inside the channel maintains a
single-file column without any manipulation, occasionally
small gaps in that column may occur; especially when an ion
is in close proximity to the channel entrance. To test if a
system configuration was suitable for a starting point for a
window, the maximum space between waters inside the
channel was computed. This was done by checking for any
gap greater than 1.5 A in the range �10.5# z# 10.5 A. No
constraints were used to maintain the pore water structure
during simulations. (These breaks in the water column may
become important when predicting, or interpreting, the dif-
fusion coefficient of the ion-water column within the pore.)
Constraints were applied to ensure the membrane and
protein are kept near the center of the periodic box. A weak
harmonic planar constraint, of force constant 5 kcal/mol/A2
was applied to the z-coordinate of the center of mass of the
lipid bilayer to prevent drifting. A weak center-of-mass
constraint was also applied on the xy position of the center ofmass of the channel by application of a cylindrical harmonic
constraint of force constant 5 kcal/mol/A2. These constraints
have no effect on the z position of the channel relative to the
membrane, nor the tilting of the channel. They only act to
center the membrane and channel independently and have no
impact on results.
Reaction coordinate for ion permeation
Following the general statistical mechanical equilibrium
theory formulated in Roux (53) and reviewed in Roux et al.
(2), the system can be separated into pore and bulk regions,
which allows the definition of the free energy surface
Wðr1; . . . ; rnÞ generated for pore occupation by n ions with
coordinates ri (i ¼ 1, n). One can form a hierarchy of n-ionPMFs for different occupancy states of the pore (53). For
FIGURE 2 Observed rotameric states of the Trp-9 residues in the gA
channel during 47 ns of unbiased simulation (adapted from (20)). The solid
box highlights the correct rotameric state and indicates the placement of
a two-dimensional flat-bottomed restraint to maintain this rotamer during
PMF calculations.
FIGURE 3 Density of lipid heavy atoms around the gA dimer. Density is
plotted as a two-dimensional histogram in axial and radial directions with
respect to the protein. The one-shell histogram is an average over 10 ns of
simulation whereas the three-shell system is an average over only the first
2 ns of a 10-ns simulation to highlight the presence of a lipid density over the
channel entrance.
3450 Allen et al.
Biophysical Journal 90(10) 3447–3468

low-to-moderate ionic concentration, the gA channel should
be occupied by just one cation (25,54), and a one-ion PMF,
Wðr1Þ, will reveal much about the function of this ion
channel in this regime. This one-ion PMF can be written in
terms of a configurational integral (see Eq. 13 in (53)). (As
noted above, to achieve satisfactory sampling, the simula-
tions were done using a 1 M KCl solution where the channel
may be occupied also by two ions, as noted below; this will
not affect any of our conclusions, except that they pertain
only to the one-ion case.)
To calculate a meaningful one-ion PMF, Wðr1Þ, we must
choose a pore region which is almost exclusively occupied
by a single ion. Table 1 shows distributions of ion occu-
pancies on either side of the channel (nleft, nright) as a functionof the size of an exclusion sphere, centered on the origin,
based on analysis of 10.9 ns of unbiased simulation. A
suitable choice for this radius appears to be 14 A, above
which it becomes possible to see two cations on one side of
the channel within the sphere. Furthermore, with this radius,
an anion is found inside the sphere during only 1% of
simulation, which is evidence of valence selectivity of the
gA channel (this question will be examined further in a
separate study). Still, 19% of the time, one cation may be
bound at both entrances of the channel. To calculate a one-
ion PMF, starting configurations were chosen such that only
the one ion was in the 14 A sphere, and during biased
simulation other ions (cations and anions) were excluded
with a repulsive flat-bottom spherical harmonic restraint with
force constant 5 kcal/mol, applied to other ions only when
they enter this exclusion sphere. Thus, our simulation
methodology is designed to compute the one-ion PMF
from MD simulations that rule out multiple pore occupancy
(as would occur with 1.0 M K1 in the aqueous solution (54)).
The objective of the present calculations is to establish
contact with experimental conductance measurements. Net
ion movement flow through the channel is driven by a trans-membrane potential difference that arises from a very small
ionic charge imbalance between intra- and extracellular
spaces, widely distributed across the membrane-water inter-
face (55). This potential is changing in a direction normal to
the membrane surface, and the chosen reaction coordinate
must include a coordinate, z, parallel to the membrane
normal vector to allow for the computation of ionic fluxes
due to the potential difference. Therefore, we used the
z-component of the distance of the ion to the center-of-mass
(CoM) of the gA dimer. In a later section, we discuss the
significance of this choice by comparing to the instantaneous
channel CoM-axis (monomer CoM to monomer CoM).
Because the ion is confined within a narrow region in the
xy-plane within the channel, one may assume that the
equilibrium distribution of lateral displacements is obtained
quickly and thus may be integrated away, leading to the one-
dimensional PMF W(z), or free-energy profile (2,53).
However, as reported previously (15), the ion becomes
unbounded in the xy-plane at a distance of 14–15 A from
the channel center. Thus, this one-dimensional profile has
limited significance outside the channel because integration
over all xy extents will cause the PMF to tend toward –N. To
obtain an unambiguous free energy profile one must restrict
the lateral displacement of the ion. In the current computa-
tions, a flat-bottom cylindrical constraint with radius 8 A
(relative to the center of mass of the dimer) of force constant
10 kcal/mol/A2 (applied only outside 8 A) was employed.
Without this restraint, the shape of the PMF near the channel
entrances is ill-defined and the bulk reference value is mean-
ingless because it is determined by the extent of sampling, as
it may have been in previous attempts (30). (The influence of
the cylindrical restraint can be, and is, rigorously accounted
for in the present analysis.)
The one-dimensional PMF and convergence
Initial configurations for the simulations to calculate the
PMF were chosen by searching a 4-ns sample of unbiased
TABLE 1 Pore ion occupancy: for spherical radii, ranging from 9 to 20 A, the distribution of ion occupancies,
n (0, 1, or 2 within the sphere on each side of the center), are given as percentage of time
% Cation occupation ðnK1
left ; nK1
rightÞ % Anion occupation ðnCl�left ; nCl�
rightÞ
Radius (0,0) (1,0) (1,1) (2,0) (2,1) (2,2) (0,0) (1,0) (1,1) (2,0) (2,1) (2,2)
9 A 96 4 0 0 0 0 100 0 0 0 0 0
10 A 89 11 0 0 0 0 100 0 0 0 0 0
11 A 76 24 0 0 0 0 100 0 0 0 0 0
12 A 68 32 0 0 0 0 100 0 0 0 0 0
13 A 54 38 8 0 0 0 100 0 0 0 0 0
14 � 48 33 19 0 0 0 99 1 0 0 0 015 A 44 31 24 1 0 0 98 2 0 0 0 0
16 A 40 31 28 1 0 0 95 5 0 0 0 0
17 A 34 32 32 1 1 0 91 9 0 0 0 0
18 A 29 32 36 1 2 0 83 15 0 2 0 0
19 A 24 31 38 1 6 0 73 23 1 3 0 0
20 A 19 31 38 1 10 1 61 32 2 5 0 0
The ion occupancy is listed here as (nleft, nright) and the percent of the time in the MD simulation is listed. Occupancies have been symmetrized such that
(1, 0) [ (1, 0) 1 (0, 1), for example. The optimal choice of single-ion region is indicated in bold.
Ion Permeation through a Narrow Channel 3451
Biophysical Journal 90(10) 3447–3468

MD trajectory for a frame in which the ion exists very close
to the reaction coordinate and the center of the window
(within 1 A). When no configuration was found with a K1
ion near the center of a window, as was the case deep within
the channel, a nearby water molecule was exchanged with
the outermost ion. The trajectory was searched until a water
oxygen atom was located close to that point, and that water
molecule was exchanged with the K1 ion furthermost from
the channel.
We calculated the PMF W(z) using umbrella sampling
(56). This requires a set of equally spaced simulations fig,biased by window functions wiðzÞ ¼ ð1=2ÞKiðz� ziÞ2 that
hold the ion near positions along the z-axis. We simulated
101 independent windows, defined by harmonic potential
functions, positioned at 0.5 A increments in z ¼ (�20, 130)
A. Harmonic potentials have a force constant 10 kcal/mol/
A2, chosen to ensure overlap of neighboring windows. For
each of the 101 windows, equilibration was performed for
80 ps before 1–2 ns of trajectory generation on separate
CPUs. Ionic distributions were unbiased using the weighted
histogram analysis method (WHAM) (57), which consists of
solving coupled equations for the optimal estimate for the
unbiased density Ær(z)æ. Strict attention was paid to the
convergence of these WHAM equations. Achieving conver-
gence in the free energy constants (to, say, 0.001 kcal/mol),
does not guarantee a comparable convergence in the PMF, as
further iterating the WHAM equations can lead to many kcal/
mol changes in the PMF. To guard against this, each 100
iterations we check every point in the PMF for convergence
to within 0.001 kcal/mol. This is a very strict criterion and
usually requires .10,000 WHAM iterations. A total of 2 ns
of trajectory was generated for each of the 81 windows
between z ¼ �20 to 1 20 A and 1 ns for each of the 20
windows from z ¼ 1 20.5 to 1 30 A. The one-dimensional
PMF,W(z), shown in Fig. 4 (defined only between the dottedvertical lines) reveals much about the permeation process,
including a high central barrier and local free energy minima
throughout the channel.
A first measure of the error in the convergence of the PMF
can be obtained by examining the asymmetry ;z ¼ 0 (a
spatial convergence). If sampling were complete, the PMF
should exhibit perfect symmetry. We compared the PMFs
obtained based on simulations for different lengths of time
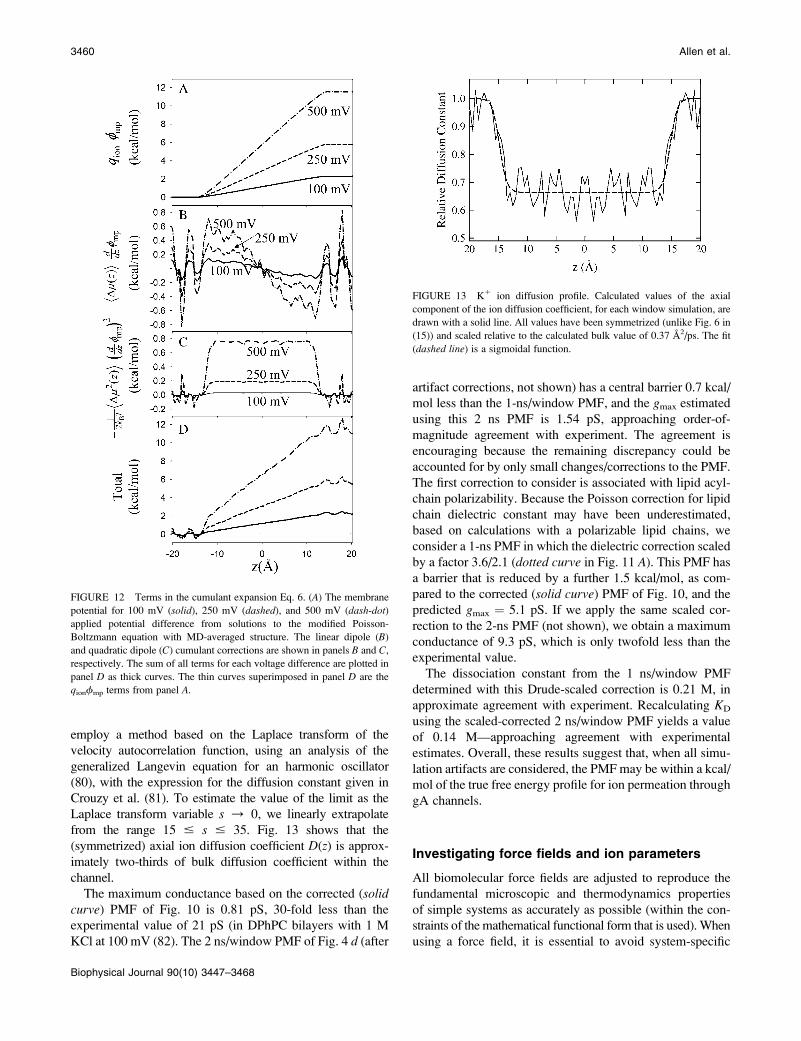
(50 ps to 2 ns for each window). Fig. 4 A shows the 40 PMFs
calculated with 50 ps per window (from the total of 2 ns).
The asymmetry (PMF z ¼ �15 to 15 A) varied from �8 to 8
kcal/mol (although the asymmetry arises from incomplete
sampling all along the reaction coordinate, all the trajectories
are defined to be at 0 kcal/mol at z ¼ �15, meaning that
the fluctuations become evident as an asymmetry in the re-
sulting PMFs). Similarly, comparison of all calculations with
100, 200, 300, 500, and 1000 ps per window (not shown)
revealed asymmetries of up to ;8, 7, 5, 3, and 2 kcal/mol,
respectively—decreasing with sampling time, as expected.
Even after 1 ns of simulation, the PMF is somewhat
asymmetric at the channel center (Fig. 4 B). After 2 ns of
simulation, the asymmetry at the channel center has dimin-
ished to ,1 kcal/mol within the pore region (Fig. 4 C). Thisremaining asymmetry corresponds to an average force of
0.03 kcal/mol/A across the channel, which is much smaller
than typical ensemble-averaged atomic forces (of the order
of 10 kcal/mol/A). This asymmetry is associated with noise
originating from all degrees of freedom other than the chosen
FIGURE 4 One-dimensional PMFs from simulations with the CHARMM27
force field (without artifact correction). (A) PMFs for all 40 3 50 ps blocks
in the total of 2 ns simulation/window. Panels B and C reveal asymmetry in
the PMF for 1 and 2 ns per window, respectively, by plotting with the mirror
image about z = 0 (dashed curves). The symmetrized PMFs for 1 and 2 ns
are shown in panel D. Broken vertical lines at jzj = 15 A indicate that the
one-dimensional PMF is not defined approximately beyond those points.
3452 Allen et al.
Biophysical Journal 90(10) 3447–3468

order parameter (z-coordinate of one ion). We do not pursue
this asymmetry further, but note that it can be removed from
the analysis by symmetrization, which imposes a constraint
on the solutions.
We computed symmetrical PMFs by applying the WHAM
equations to the biased ion-density distribution after creating
duplicate windows on opposite sides of the channel. The
second test of convergence is thus the difference in the
symmetrized 1- and 2-ns PMFs (a temporal convergence).
Fig. 4 D shows the PMFs following symmetrization for both
the 1 and 2 ns calculations. The PMF is well converged with
a maximum deviation near the center of ;0.7 kcal/mol
(lower in the 2-ns PMF). The average deviation between the
two curves is 0.30 kcal/mol, which becomes our estimate for
the convergence error in PMF calculation. We conclude that
1 ns per window is sufficient to obtain a well-converged,
symmetrized PMF, and we use 1-ns-per-window simulations
for all subsequent PMF calculations in this article. The
symmetrized CHARMM27 one-dimensional PMF (after 2 ns)
reveals a central barrier of ;11 kcal/mol with respect to the
binding site. This barrier height should be compared with
previous estimates (29,30,32) of the order of 15 kcal/mol.
There is a deep outer binding site at z ¼ 11.3 A, and a more
shallow inner binding site at 9.7 A.
As is evident from Fig. 4 A, attempts to estimate the height
of the central barrier from a short simulation will result in
considerable uncertainty. Though, as noted above, the one-
dimensional PMF is not rigorously defined outside the
channel, the variation in the value at the channel center
relative to 620 A provides a measure of the PMF con-
vergence. Thus, when comparing all 40 possible 50-ps
blocks in the 2-ns total simulation per window (Fig. 4 A), thecentral barrier varied by 17 kcal/mol—from as little as just
1.2 kcal/mol to as much as 18.2 kcal/mol. The same analysis
for the set of 100-ps nonsymmetrized PMFs leads to values
ranging from 5.5 to 18.2 kcal/mol. This range drops to 9.6,
5.8, 5.8, and 4.0 for simulations lasting 200, 300, 500, and
1000 ps/window, respectively. The decreasing range (or un-
certainty in the height of the central barrier) with increasing
simulation is comforting, but it is important to establish an
independent test. In the following section, the barrier height
from the full two-dimensional PMF (a well-defined quantity)
will be computed and compared to an independent free energy
perturbation (FEP) calculation.
Two-dimensional free energy landscape
The range of validity of the one-dimensional PMF is within
the bounds of the ion channel. Thus, a complete description
of permeation requires a three-dimensional PMF, which can
be approximated by a two-dimensional PMF, W(z, r), usingradially symmetric configurational integration. Other coor-
dinates may describe slowly varying degrees of freedom in
the system. For example, the dipole moment, m, of the
single-file water column was shown, via W(z, m), to provide
a barrier to permeation that is not a function of ion position
(15). Equilibrium distributions, biased in z, involving a
secondary variable r, Ærðz; rÞæbiasðiÞ , may be readily unbiased to
produce a two-dimensional PMF W(z, r). Once the WHAM
equations (57) have been iterated to convergence, Ærðz; rÞæbiasðiÞmay be unbiased via a straightforward extension of the one-
dimensional equation.
The resulting two-dimensional PMF (Fig. 5 A), reveals theposition of binding sites at the channel entrances and the
scale of the free energy barrier experienced by the perme-
ating ion relative to the entrances. It also reveals the extent of
lateral ion motion of the ion. Because the two-dimensional
PMF is determined in the laboratory frame, lateral movement
of the ion relative to the channel, combined with channel
tilting, lead to fairly broad free energy wells. This tilt has an
impact on the shape of the one-dimensional PMF of Fig. 4
because the ion experiences a greater radial range, with lower
free energies, near the channel entrances (raising the barrier
with respect to the binding sites compared to the two-
dimensional PMF). The action of the cylindrical constraint in
the bulk is evident in this graph. It is also evident that the free
energy surface is becoming flat away from the channel.
Because this two-dimensional PMF is determined only up to
FIGURE 5 Creating a two-dimensional PMF. (A) The PMF obtained from
two-dimensional unbiasing of equilibrium distributions from umbrella
sampling simulations. (B) The PMF obtained by analysis of bulk ion
densities. (C) A blend of panels A and B using linear interpolation, similar to
that in Allen et al. (15), but with extended range.
Ion Permeation through a Narrow Channel 3453
Biophysical Journal 90(10) 3447–3468

a constant, and we need a bulk reference to establish the zero
of this free energy surface. To find the correct bulk reference
for the two-dimensional PMF, an additional 4-ns simulation
(in the absence of a window biasing potential) was used to
calculate the bulk ion density and thus the bulk limit, via
Wbulkðz; rÞ ¼ �kBTln Ærbulkðz; rÞæ=rð Þ, where r is the K1
density far from the channel (30 , jzj ,35 A). The result
is shown in Fig. 5 B. This surface extends out to jzj ¼ 35 A
and reveals a flat PMF away from the channel. The values
Wbulk(z, r) and W(z, r) were then matched by linearly
interpolating over the range 25 , jzj , 29 A, for r , 8 A
with the resultant two-dimensional PMF shown in Fig. 5 C.Ion free energies are now known at all positions relative to
the bulk. The outer binding site at z ¼ 11.3 A, can be seen to
be �3.2 kcal/mol relative to the bulk. In the narrowest part
of the channel, an ion experiences a barrier of 7.2 kcal/mol
relative to the bulk.
An independent check of the barrier height in W(z, r) wasobtained by free energy perturbation calculations, where an
ion on-axis at the center of the channel (z ¼ 0) was
interchanged alchemically with a water on-axis in the bulk
(z ¼ 30 A) (15) The estimated free energy WðrÞ �Wðr9Þwas 8.6 6 0.4 kcal/mol, consistent with the value obtained
from the two-dimensional PMF, and suggests an uncertainty
of the order of 1 kcal/mol.
A comparison of reaction coordinates
While a coordinate parallel to the membrane normal is
necessary for conduction calculation, the free energy surface
governing ion permeation also can be studied along an
instantaneous channel CoM-axis to reveal in more detail the
ion-protein-water interplay during permeation. Such a PMF is
interesting for describing the free energyof the ion relative to the
ion channel b-helix. We chose the time-varying vector passing
through the center of mass ofmonomer 1 andmonomer 2 of the
gAdimer to create a different PMF, based on umbrella sampling
along a coordinate that is the ion distance from the center of
mass of the channel dimer, projected onto the axis connecting
the two centers of mass of themonomers. As before, we apply a
lateral constraint in the form of an 8 A flat-bottom cylinder
centered on the instantaneous channel CoM-axis to ensure a
well-defined region of sampling outside the channel.
We expect the two PMFs to differ because the channel on
average tilts 12� with respect to the bilayer normal (15),
which contributes to a radial displacement of ions away
from the channel center. Fig. 6 shows the average tilt of the
channel as a function of ion position (averaged over 1-ns
umbrella sampling for each window). The average tilt de-
creases steadily as the ion moves from the channel center
(where it experiences a maximum of 16�) to the entrances.
The decreased tilt near the entrances can be rationalized
by considering the interaction between the ion and the bulk
electrolyte as a function of depth. The attractive force be-
tween an ion in the pore and the bulk solution and membrane
interface is stronger when the ion is nearer either interface
(58). As a result, the ion-interface interactions will exert a
torque on the tilted channel, which will tend to reduce the tilt
when the ion is further from the channel center (closer to the
interface), as observed in Fig. 6.
The two-dimensional PMF as a function of distance along
the instantaneous CoM-axis and radial displacement is
shown in Fig. 7 A, with the fixed-frame PMF in Fig. 7 Bfor comparison. This figure focuses in on the region�20# z# 20 and r # 8 A to highlight the effect of choice of
FIGURE 6 Average channel tilt angle (from average cosine of the angle
separating the channel axis and membrane normal, z) as a function of ion
position z for the small, one-shell, system. Results have been symmetrized
by averaging windows on each side of z ¼ 0. Error bars are not shown for
clarity. The average standard deviation in ion position is 0.25 A and that of
tilt angle is 3.6�.
FIGURE 7 Two-dimensional PMFs in the pore region for two different
reaction coordinates: the position along the instantaneous channel axis
(monomer center-of-mass to the monomer center-of-mass) (A), and the
projection of the distance to the center-of-mass onto the membrane normal,
the z-axis (B). Each surface is based on a calculation with a symmetrized
biased density. Only the first 1 ns of simulation for each window is included.
3454 Allen et al.
Biophysical Journal 90(10) 3447–3468

coordinate frame. Unlike the two-dimensional PMF of Fig. 5,
the PMF has not been merged with a larger spanning bulk
region and the zero has been set from the average in the
region 18 # z # 20 and r # 8 A. Based on the shape of
the free energy surface in Fig. 5, one may conclude that the
consequences of the choice of bulk reference region is ,1
kcal/mol, which can be ignored because this PMF is primarily
for illustration purposes.
The shape of the two-dimensional free energy surface near
the channel axis is markedly different as a result of this
choice of coordinate frame. The two-dimensional PMF in
fixed-membrane normal vector frame (Fig. 5 B) has wide,
low free-energy vestibules whereas the two-dimensional
PMF in the instantaneous CoM-axis vector frame (Fig. 5 A)does not. Secondly, the size of the barrier in the two-
dimensional PMF has dropped from 7.2 (Fig. 5 B) to 5.5
kcal/mol (Fig. 5 A) relative to the bulk. The fixed-frame PMF
appears to get narrower at the center, but this simply reflects
the widening of the PMF near the entrances due to tilting.
Differences in the free energies for lateral displacements
away from axis, due to the increased cross section as a result
of tilting in the fixed z-PMF, maybe too small to see in this
1 kcal/mol contoured map. Thirdly, the outer binding sites
can be seen to be off-axis; a fact that was hidden the PMF of
Fig. 5 due to the channel tilting smearing out this feature.
Finally, the inner binding sites at 9.7 A are now clearly
visible—and are deeper than the outer sites in the CoM-axis
PMF. In this coordinate frame the inner binding site is
;�3.5 kcal/mol, whereas the outer binding site is ;�3.0
kcal/mol, relative to the bulk. This is very different from the
original fixed-membrane normal vector frame where the
inner binding site was;�0.5 kcal/mol and the outer binding
site;�3.2 kcal/mol. The difference arises because the outer
binding sites are off-axis, and therefore correspond to a
greater spatial volume, such that the integrated one-dimen-
sional PMF has a global minimum there. An off-axis outer
binding site implies greater translational freedom of the ion
in this region and, perhaps, less distortion of the protein
backbone. In any case, the existence of two cation binding
sites, with a slight preference for outer site binding in the
case of K1, is consistent with the analysis of NMR data
(59)—but in conflict with the x-ray scattering results of Olah
et al. (60), which shows the major binding site to be at 9.5 A.
The one-dimensional PMF from this instantaneous CoM-
axis umbrella sampling calculation is shown in Fig. 8,
together with the 1-ns symmetrized PMF for the original
z-coordinate PMF of Fig. 4 C. Not surprisingly, this one-
dimensional PMF along a channel-axis vector is not that
different to the PMF along the z-vector. The reason for this isthat the lateral displacement corresponding to the average tilt
is ,0.2 A near the binding sites. One would expect that the
depth of the binding sites will change slightly: because of the
greater lateral displacements in the z-vector frame (away
from z ¼ 0) relative to the instantaneous channel CoM-axis
frame, the binding sites should be (a little) deeper (relative to
the center of the channel) in the original fixed frame PMF
along the fixed z-vector. This is the case in Fig. 8, although
the difference is just a fraction of a kcal/mol. There also are
small differences in the center of the channel where the
original fixed-frame PMF experiences a slightly higher bar-
rier. Given the uncertainties of the PMF and the nontrivial rela-
tionship between tilting and the PMF, the origin of the small
differences in the PMFs remains unclear.
The dependence of the free energy barrier in the one-
dimensional PMF on the choice of coordinate used in the
umbrella sampling computations could be cause for concern.
It therefore is important to recall that the absolute transition
rate involves not only the PMF, but also dissipative contri-
butions (e.g., diffusion, friction, memory function, transmission
coefficient), which themselves depend on the choice of order
parameters (34). Within reasonable restrictions, the resulting
absolute transition rate is invariant with respect to the choice
of order parameter despite differences in the free energy
barrier; see Hinsen and Roux (35), for example. Differences
between the CoM-axis and z-axis results do not imply that the
MD-PMF computational strategy yields inconsistent results,
rather the different reaction coordinates highlight different
aspects of the underlying process. The calculations with the
instantaneous channel CoM-axis vector choice of reaction
coordinate, for example, reveal details about the passage of an
ion through the channel, which were hidden in the fixed z-axisPMF calculations. First, the ion in the outer binding site is not
entirely within the narrow single-file column, as would be
anticipated by knowing it is solvated by three water molecules
(15,29,59). Second, a K1 at this site prefers to stay off-axis,
which may be a more general result (see (61)). The inner
binding site is within the narrow single-file region proper,
where the cation is solvated by just two water molecules (15),
and stays closer to the channel axis. In the present calculations,
a K1 appears to preferentially reside in the outer binding site
FIGURE 8 One-dimensional PMFs from simulations with the CHARMM27
force field (without artifact corrections) using two different reaction coordinates:
the position along the instantaneous channel axis (solid) and the projection of
the distance from the center of mass onto the membrane normal, z (dashed).
Each curve has been symmetrized (via biased density) and only the first 1 ns of
simulation for each window is included.
Ion Permeation through a Narrow Channel 3455
Biophysical Journal 90(10) 3447–3468

because the radially integrated (one-dimensional) PMF re-
sults in a global minimum at that distance from the channel
center, consistent with NMR analysis (59) but contradictory
to earlier x-ray scattering results (60). Yet, our original
choice of fixed-membrane normal vector z remains the only
choice for computing the single-channel conductance with
an appliedmembrane potential difference. Beforewe can com-
pute the conductance from the PMF, we need to account for
simulation artifacts that affect our estimates.
Correcting for simulation artifacts
A spurious destabilization of the ion is caused by the finite
size and the periodicity of the system. In addition, in current
MD force fields the hydrocarbon chains of the lipid
molecules are nonpolarizable, meaning that they have an
effective dielectric constant of 1 (62), which is quite different
from the value deduced for the bilayer hydrophobic core
(63,64) and measured for bulk hydrocarbons (65),;2. These
artifacts can be approximately corrected using a continuum
electrostatic approximation (15,66) utilizing trajectories to
average over protein and single-file water configurations. We
estimate these corrections for an ion near the channel axis
and apply to the one-dimensional PMF calculations (with the
two-dimensional PMFs remaining uncorrected). However,
as we shall show in the following section, all comparisons
with experimental measurements can be formulated using the
one-dimensional PMF.
To implement the corrections, we establish a free energy
cycle (Fig. 9). The corrected PMF Wcorr(z; em ¼ 2; L ¼ N),
with the correct membrane dielectric constant, em ¼ 2, and
for an infinite membrane with no periodic effect, may be
obtained from the MD-PMF WMD(z; em ¼ 1; L ¼ L0), withrespect to some reference position far from the channel, z9,where the dielectric constant of the membrane is em ¼ 1 and
the periodic length is L ¼ L0 in the xy-plane. The relation
may be written as
This may be rewritten as
WcorrðzÞ ¼ WMDðzÞ1DGdielðzÞ1DGsizeðzÞ; (2)
where WMD(z) and Wcorr(z) are defined relative to z9,
DGdielðzÞ ¼ DGðz; em ¼ 1/2; L ¼ NÞ� DGðz9; em ¼ 1/2; L ¼ NÞ; (3)
and
DGsizeðzÞ ¼ DGðz; em ¼ 1; L ¼ L0/NÞ� DGðz9; em ¼ 1; L ¼ L0/NÞ: (4)
To estimate the various corrections, we embarked on a
series of finite-difference Poisson calculations, using the
PBEQ module of CHARMM, averaging over several
instantaneous configurations (snapshots) extracted from
MD trajectories of the protein and its water contents. For
each ion position, we extracted 50 snapshots from 500 ps of
trajectory from umbrella sampling windows between z ¼ 0
and 20 A in 2 A increments. For each ion position, Poisson’s
equation was solved both with and without the ion present (by
setting the K charge to 11 or 0), with membrane dielectric
constant em ¼ 1 or 2, and for systems of different sizes to
obtain corrections for our PMFs calculated using small (Fig.
4) and large membranes (reported below). These sizes
included the one-shell (small) system, the three-shell (large)
system, and a very large system that represents an infinite
membrane (similar in size to a five-shell system not reported
here) with image translation vector 90 A. The membrane core
was assumed to be 25 A thick (comparable to the hydrophobic
thickness of a DMPC bilayer (67)) and was assigned a
dielectric constant em. Bulk water (and the membrane/solution
interface) was assigned a dielectric constant of 80. Because we
average over thermal fluctuations of the explicit protein and
channel water we assume a dielectric constant of 1 for the
protein (ep) and channel water (ec) regions. The protein and
any water molecules within�12.5# z# 12.5 A and within a
cylinder of radius 3 A (centered on the channel axis) were
extracted from each frame of the trajectory. Protein and
channel water were oriented with respect to the membrane
normal at each frame, and a water-sized reentrant probe was
used to assign dielectric constants (3). This set of Poisson
solutions are all that is needed to compute the ensemble-
averaged corrections in Eqs. 3 and 4.
Periodic boundaries are orthorhombic in the PBEQ
algorithm whereas they are hexagonal in the MD-PMF.
We chose to match the area of the unit cell so as to equate the
number of channels per unit area. To do so, the orthorhombic
xy-translation vector for PBEQ images was set to 29.9 A for
the one-shell system, instead of 32.1 A for the hexagonal
boundaries. In the three-shell case the length was set to 57.6
A instead of 61.9 A. To test the significance of this approx-
imation, we performed calculations with explicitly included
hexagonal and cubic periodic xy images of the MD averaged
protein and ion in the PBEQ module of CHARMM. The
results for hexagonal and cubic images differed by just 0.19
kcal/mol, suggesting that the corrections are not significantly
affected by this choice.
To make these profiles more readily applicable as correc-
tions (requiring interpolation onto a finer grid), we fitted the
Wcorrðz9/z; em ¼ 2; L ¼ NÞ ¼ DGðz9; em ¼ 2/1; L ¼ NÞ1DGðz9; em ¼ 1; L ¼ N/L0Þ1WMDðz9/z; em ¼ 1; L ¼ L0Þ1DGðz; em ¼ 1; L ¼ L0/NÞ1DGðz; em ¼ 1/2; L ¼ NÞ: (1)
3456 Allen et al.
Biophysical Journal 90(10) 3447–3468

MD-averaged Poisson solutions with solutions for a single
structure using optimized dielectric constants of protein (and
channel water). This was done with a single MD-averaged
structure of the protein with implicit water inside the pore. The
MD-averaged protein structure was obtained by constrained
minimization of the PDB:1JNO structure to MD-averaged
heavy atom positions. The dielectric constants ep ¼ ec were
optimized to obtain the best numerical fit the MD data.
Estimates, obtained from averages over MD trajectories,
show that correcting for the spurious destabilization leads to
a �1.6 kcal/mol correction (at the channel center, relative to
the bulk) for the one-shell system (Fig. 9 A). Fits using
values of em ¼ ep ¼ 1 and 2 envelop the MD solutions, and
the optimal choice was found to be ep ¼ ec¼ 1.25 (Fig. 9 A).
For the three-shell system, the correction for periodicity
had a maximum amplitude of 0.03 kcal/mol. The spurious
destabilization has decayed almost completely when the
system size is doubled.
Correcting for the effect of the dielectric constant of the
hydrocarbon chains leads to a further �2.1 kcal/mol sta-
bilization of the ion in the center of the channel, as revealed
in Fig. 9 B. The MD-averaged data were fitted with a Poisson
solution using ep ¼ ec ¼ 1.75. To test the extent of the
effect of polarizability of the phospholipid hydrocarbon
tails on the stability of the ion, we previously carried out
calculations using Drude oscillators (68) to describe the
hydrocarbon chains (15). A similar approach using a grid of
polarizable point-dipoles was used by Aqvist and Warshel in
1989 (69). In this case, the change in the stabilization of the
ion was �3.66 0.3 kcal/mol, which can be compared to our
estimate DGdiel(0) from the Poisson solutions (�2.1 kcal/
mol). The continuum electrostatics approximation captures
the effect of the polarizability, but may underestimate its
magnitude.
It is also possible to estimate the effect of high electrolyte
concentration (70) by approximating the effect of reducing
the concentration from 1 M to a level of 0.1 M that better
corresponds to the single-ion regime
DGconcðzÞ ¼ DGðz; em ¼ 1; L ¼ N; c ¼ 0:1MÞ� DGðz9; em ¼ 1; L ¼ N; c ¼ 1:0MÞ; (5)
using the Poisson-Boltzmann equation (see (70)). As
expected, the effect of reducing the ionic concentration
from 1 M to 0.1 M is a small additional stabilization of �0.2
kcal/mol at the channel center, as seen in Fig. 10 C.Fig. 11 A shows the PMF for the small system after 1 ns of
simulation per window with the CHARMM27 force field
after corrections for periodicity, membrane dielectric con-
stant, and high concentration (solid curve). The barrier is
significantly lower, at ;8.1 kcal/mol, with respect to the
deepest point (the outer binding site). With this estimate of
the free energy profile, we are in a position to compare the
predictions of our calculations to experimental binding and
conductance measurements.
For comparison we also show a corrected PMF with a
scaled DGdiel correction in Fig. 11 A as a dotted curve. The
correction has been scaled by a factor of 3.6/2.1 based on our
calculations of the effect of lipid chain polarizability with the
Drude oscillator model (and shall be referred to as the
‘‘Drude-corrected PMF’’). The resulting PMF has a barrier
that is reduced by a further 1.5 kcal/mol.
To test the accuracy of our size correction of Fig. 9 A, andto further evaluate the consistency and convergence of the
results, we obtained a PMF with the larger three-shell
membrane system. Fig. 11 B compares the one- and three-
shell PMFs (using 1 ns of simulation in both cases) before
corrections as dashed curves. The two PMFs differ by 1.6
kcal/mol at the channel center, a difference that is similar to
FIGURE 9 The free energy cycle illustrates the sequence of correction
calculations required for a PMF calculated with finite system size and
nonpolarizable membrane. The gA channel is shown as yellow; high
dielectric (e ¼ 80) bulk water as blue; membrane core with e ¼ 1 as white;
membrane core with correct hydrocarbon dielectric constant (e¼ 2) as gray;
pore water molecules as red (O) and white (H) circles; and K1 as green
circles with 1 sign.
Ion Permeation through a Narrow Channel 3457
Biophysical Journal 90(10) 3447–3468

the size correction for the one-shell system (Fig. 10). The
solid curves in Fig. 11 B show our final results with all cor-
rections (size, dielectric of the membrane, and concentration).
The two PMFs now look very similar and differ on average by
0.28 kcal/mol. The correction obtained with Poisson solutions
therefore accounts for reduced membrane size.
Channel binding and conductance
Experimental observables may be predicted from the calcu-
lated MD-PMFs to ascertain their agreement with electro-
physiology. Here we outline the strategy by which we use the
equilibrium free energy calculations to predict macroscopic
observables and apply these methods using our corrected
PMF.
Equilibrium dissociation constants
The equilibrium single-ion dissociation constant KD can be
expressed either in terms of the three-dimensional one-ion
three-dimensional PMF, WðrÞ, or in terms of the one-
dimensional PMF, W(z), (see (53)) as long as the sampling of
the lateral motion (i.e., with a cylindrical restraint) and
corresponding offset constant are incorporated correctly (15).
The dissociation constant for the channel (encompassed by
�15 , z , 15 A) from the corrected 1-ns PMF (Fig. 11) is
0.30 M. The 2 ns/window PMF for the CHARMM27 force
field from Fig. 4 d, after artifact corrections (not shown) yieldsa dissociation coefficient of 0.21 M. This estimate is in within
the range of experimental values determined from NMR and
conductance studies: 0.017 M (71) (measured in dodecyl-
phosphocholine micelles); 0.019–0.73 M (72) (in aqueous
lysophosphatidylcholine dispersions); 0.035 M (54) (in gly-
cerylmonoolein bilayers); and a recent estimate of 0.07M (25)
(in diphytanoylphosphatidylcholine/n-decane bilayers). When
integrating over the regions defining the individual sites, ions
will bind to the outer (10.2 , z , 12.5 A) and inner (6.9, z
FIGURE 10 Corrections applied to the one-dimensional PMF to correct
for simulation artifacts. (A) Poisson size correction (one shell of lipids /infinite bilayer); (B) Poisson membrane dielectric constant correction (em ¼1 / 2); (C) Poisson-Boltzmann concentration correction (1 M / 0.1 M).
Data points represent calculations which are ensemble averages of Poisson
solutions using a set of MD protein and channel-water coordinates. Short-
dashed curves in panels A and B are corrections that use a single MD-
averaged structure with the dielectric constant of the protein and channel
water of 1. Long-dashed curves are corrections that assume the dielectric
constant of the protein and channel water to be 2. The solid curves in panels
A and B employ protein/channel-water dielectric constants of 1.25 and 1.75,
respectively, as a fit to the calculated MD averages. In panel C, the dielectricconstant was assumed to be 1.5.
FIGURE 11 (A) One-dimensional CHARMM27 PMFs (from 1 ns sim-
ulation per window) before (dashed) and after (solid) artifact corrections.The dotted curve shows the corrected PMF with scaled hydrocarbon
dielectric correction (see text) to be referred to as the ‘‘Drude-corrected’’
CHARMM27 PMF. (B) comparison of PMFs, before and after corrections,
between small (20 lipids, red) and large (96 lipid, blue) membranes. The
PMFs have been matched at z ¼ 20 A. PMFs from 2 ns/window simulation
(not shown) experience barriers that are 0.7 kcal/mol less than the plotted
1 ns/window PMFs (with or without Drude-oscillator-scaled corrections).
3458 Allen et al.
Biophysical Journal 90(10) 3447–3468
, 10.2 A) sites with dissociation constants of 0.83 M and 3.6
M, respectively. Previous studies have found mixed results for
the most stable position for a Na1 (29,73,74). Experimentally,
the major cation binding site for both Na1 and K1 is the inner
site (60,71). Significant K1 binding may also occur further
from the channel center, as Tian and Cross (59) show that the
Na1-induced chemical shift of Leu-10 to Trp-11 linkage
exceeds that of Leu-12 to Trp-13, whereas the reverse is the
case for K1.
Channel conductance
To ascertain the magnitude of the current that can pass
through the channel, the net stationary flux of ions across the
channel can be calculated using a one-dimensional one-ion
pore Nernst-Planck theory of Levitt (75) (see also (2) for
application to MD-PMF). The ion flow is governed by the
total PMF, Wtot, which can be expressed as a sum of the
equilibrium PMF W, dominated by local molecular inter-
actions, and the interaction of atomic charges with the
transmembrane scalar potential, fmp; see Eqs. 38 and 39 in
Roux (53). The one-ion pore NP theory of Levitt (75)
provides a convenient route to quickly obtain a rough
estimate of the maximum conductance given a one-dimen-
sional PMF. There are alternative approaches that, however,
must be considered with caution. For example, utilizing the
one-dimensional MD-PMF in any three-dimensional model
of permeation as done by Corry and Chung (76) requires
additional assumptions and approximations about the width,
the length, and the shape of the pore, as well as the absolute
value of the free energy in order to construct a complete
three-dimensional PMF (the ambiguities in such an operation
are well illustrated by considering Fig. 5).
The charge distribution changes considerably as the ion
moves, with most of the change being due to the dipole
moment of the pore water (15). To gauge the contributions
from the coupling to the system dipole moment to the trans-membrane potential, we express the total PMF as a cumulant
expansion in the dipole moment of the system (see Eq. 36 in
(53),
WtotðzÞ � WðzÞ1 qionfmpðzÞ1 ÆDmðzÞæ ddz
fmp
� 1
2kBTÆDm2ðzÞæ d
dzfmp
� �2
; (6)
where Dm(z) is the deviation from the mean value of the
dipole moment of the pore system as a function of the ion
position. The value fmp is estimated by solving the modified
Poison-Boltzmann equation (2,53) for an MD-averaged gA
structure in a 25 A membrane slab of dielectric constant 2,
using 1 M KCl salt in the bulk regions with dielectric
constant 80. Poisson-Boltzmann solutions for fmp, together
with histograms of the dipole moment of the single-file water
column obtained from all umbrella sampling trajectories
(with symmetrization), have been used to estimate the
perturbations to the equilibrium PMF of Eq. 6. The charge
distribution within the pore region is represented by an
expansion in the dipole moment, dominated by the single-file
water column in Eq. 6, and the dielectric constant is set to
1 inside the protein and channel regions. We also evaluate
ðd=dzÞfmp ¼ Vmp=Lp, the value where Lp is the length of thepore region. The value Lp is equal to the diameter of the sphere
defining the single-ion region (28 A) and is within the range
where the one-dimensional PMF is meaningful (jzj , 15 A).
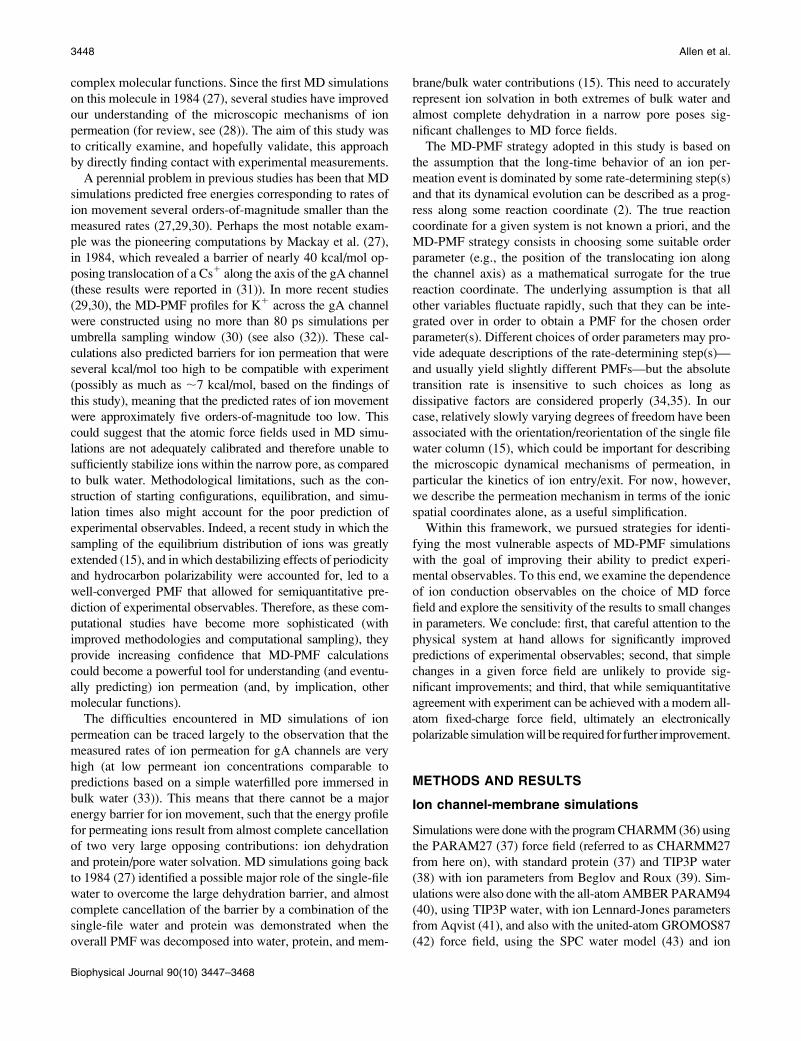
Conductance calculations are complicated by the coupling
of the dipole to the membrane potential, with the linear term
in Dm(z) influencing the flow of ions and the quadratic term
creating an additional barrier as a consequence of the
bimodal nature of the dipole distribution in the bulk (15).
Fig. 12 A shows the membrane potential term qionfmp of Eq.
6, increasing linearly across the channel. Fig. 12 B shows the
first correction of Eq. 6 (due to the linear term in the dipole
moment), and Fig. 12 C the second correction (due to the
quadratic term). The sum of all three terms representing the
coupling of the system charge distribution to the applied
voltage is shown in Fig. 6 D (with curves from Fig. 6 Asuperimposed as thin curves). When 100 mV is applied
across the membrane (solid curves in Fig. 12), the linear andquadratic dipole corrections have maximum amplitudes of
only 0.15 and 0.04 kcal/mol, respectively. Because of the
different voltage dependencies, the quadratic term becomes
substantial at larger applied potentials. At 500 mV (dash-dotcurves), the corrections approach 1 kcal/mol and, as the
voltage applied across the membrane is increased, these
corrections may have considerable effect on the conduc-
tance.
The above discussion is aimed at a correct and accurate
computation of the channel conductance at the high poten-
tials that are needed to do a full kinetic analysis based on
current-concentration-voltage data (25,77). At lower volt-
ages (comparable to the cell membrane potential), the effects
of the coupling of the charge distribution to the membrane
potential are small and may be neglected. Presently, we aim
to gauge only the order-of-magnitude ability of MD to
reproduce experimental observables and neglect these cor-
rections in the following. With symmetric concentrations on
both sides of the membrane and low membrane potential, the
maximum conductance can be obtained directly from the
one-dimensional PMF and a one-dimensional diffusion
profile (78), assuming that the pore can be, at most, occupied
by a single ion (it is a one-ion Nernst-Planck theory). This
description provides only an order-of-magnitude estimate
because we ignore multiple-ion occupancy at high concen-
tration (73), as well as the effects of aqueous diffusion
limitations (79), which should be valid in the limit of high
concentrations.
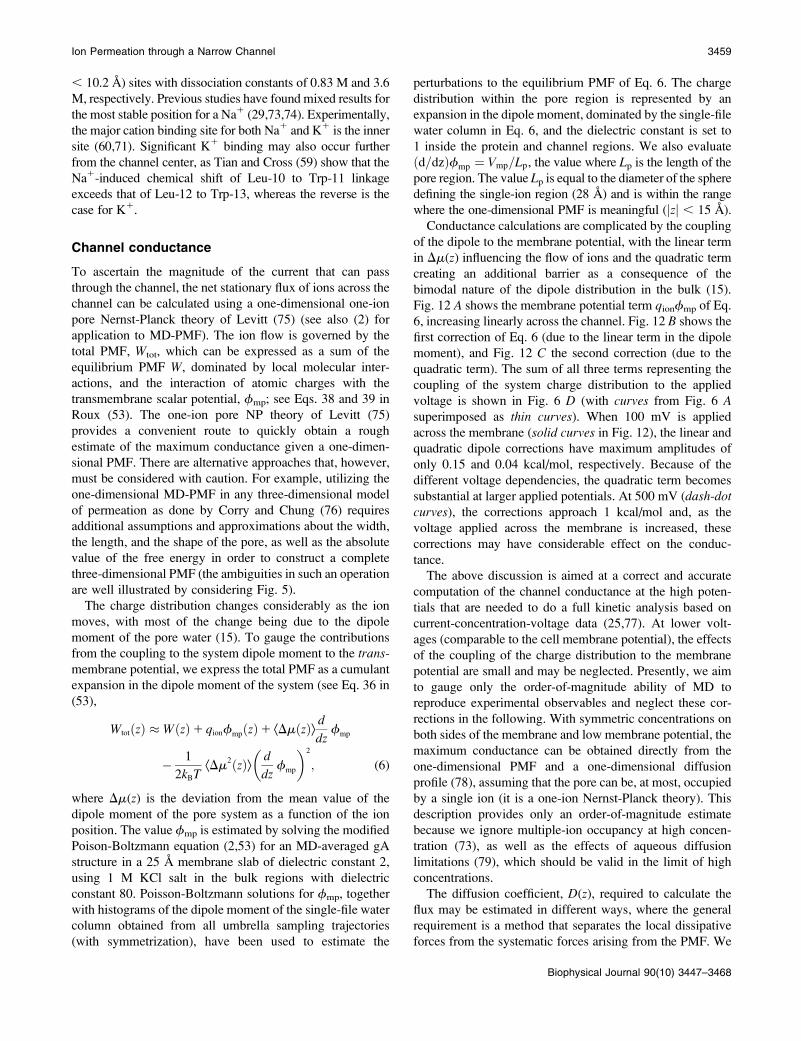
The diffusion coefficient, D(z), required to calculate the
flux may be estimated in different ways, where the general
requirement is a method that separates the local dissipative
forces from the systematic forces arising from the PMF. We
Ion Permeation through a Narrow Channel 3459
Biophysical Journal 90(10) 3447–3468
employ a method based on the Laplace transform of the
velocity autocorrelation function, using an analysis of the
generalized Langevin equation for an harmonic oscillator
(80), with the expression for the diffusion constant given in
Crouzy et al. (81). To estimate the value of the limit as the
Laplace transform variable s / 0, we linearly extrapolate
from the range 15 # s # 35. Fig. 13 shows that the
(symmetrized) axial ion diffusion coefficient D(z) is approx-imately two-thirds of bulk diffusion coefficient within the
channel.
The maximum conductance based on the corrected (solidcurve) PMF of Fig. 10 is 0.81 pS, 30-fold less than the
experimental value of 21 pS (in DPhPC bilayers with 1 M
KCl at 100 mV (82). The 2 ns/window PMF of Fig. 4 d (after
artifact corrections, not shown) has a central barrier 0.7 kcal/
mol less than the 1-ns/window PMF, and the gmax estimated
using this 2 ns PMF is 1.54 pS, approaching order-of-
magnitude agreement with experiment. The agreement is
encouraging because the remaining discrepancy could be
accounted for by only small changes/corrections to the PMF.
The first correction to consider is associated with lipid acyl-
chain polarizability. Because the Poisson correction for lipid
chain dielectric constant may have been underestimated,
based on calculations with a polarizable lipid chains, we
consider a 1-ns PMF in which the dielectric correction scaled
by a factor 3.6/2.1 (dotted curve in Fig. 11 A). This PMF has
a barrier that is reduced by a further 1.5 kcal/mol, as com-
pared to the corrected (solid curve) PMF of Fig. 10, and the
predicted gmax ¼ 5.1 pS. If we apply the same scaled cor-
rection to the 2-ns PMF (not shown), we obtain a maximum
conductance of 9.3 pS, which is only twofold less than the
experimental value.
The dissociation constant from the 1 ns/window PMF
determined with this Drude-scaled correction is 0.21 M, in
approximate agreement with experiment. Recalculating KD
using the scaled-corrected 2 ns/window PMF yields a value
of 0.14 M—approaching agreement with experimental
estimates. Overall, these results suggest that, when all simu-
lation artifacts are considered, the PMF may be within a kcal/
mol of the true free energy profile for ion permeation through
gA channels.
Investigating force fields and ion parameters
All biomolecular force fields are adjusted to reproduce the
fundamental microscopic and thermodynamics properties
of simple systems as accurately as possible (within the con-
straints of the mathematical functional form that is used).When
using a force field, it is essential to avoid system-specific
FIGURE 12 Terms in the cumulant expansion Eq. 6. (A) The membrane
potential for 100 mV (solid), 250 mV (dashed), and 500 mV (dash-dot)
applied potential difference from solutions to the modified Poisson-
Boltzmann equation with MD-averaged structure. The linear dipole (B)
and quadratic dipole (C) cumulant corrections are shown in panels B and C,
respectively. The sum of all terms for each voltage difference are plotted in
panel D as thick curves. The thin curves superimposed in panel D are the
qionfmp terms from panel A.
FIGURE 13 K1 ion diffusion profile. Calculated values of the axial
component of the ion diffusion coefficient, for each window simulation, are
drawn with a solid line. All values have been symmetrized (unlike Fig. 6 in
(15)) and scaled relative to the calculated bulk value of 0.37 A2/ps. The fit
(dashed line) is a sigmoidal function.
3460 Allen et al.
Biophysical Journal 90(10) 3447–3468

adjustments of the force-field parameters, as this would
compromise attempts to gain mechanistic insights. Equally
important, one should strive to identify the elementary (or
physical) properties that would be expected to have a
significant impact on a system of interest. For example, the
energetics of ion permeation through the narrow gramicidin
channel would be expected to be directly affected by the
magnitude of ion-water and ion-peptide interactions, and
indirectly by water-water, water-peptide, and peptide-pep-
tide interactions. To ascertain and illustrate the sensitivity of
the results to these different contributions, we repeated our
PMF calculations with different commonly used biomolec-
ular force fields. The three force fields we compare are
CHARMM27, AMBER94, and the united-atom GRO-
MOS87 force fields which have been used in several studies
of ion permeation through the KcsA potassium channel;
CHARMM27 (29,83–85), AMBER94 (86,87), and GRO-
MOS87 (88–90). The version of the GROMOS force field
implemented (GROMOS87) is that commonly employed in
the GROMACS program (force-field ffgmx), which has beenwidely used in the aforementioned ion-channel simulations,
despite the more recent improvements in that force field (e.g.,
Oostenbrink et al. (91)).
Table 2 includes a comparison of the gas phase interaction
energies between a K1 and a single water (first column) or
N-methyl-acetamide (NMA, second column) molecule with
each force field, as well as experimental and ab initio
calculations (variations on the CHARMM27 force field will
be described below). All three force fields approximately
reproduce the ion-water interaction, but only CHARMM27
and AMBER94 come close to reproducing the ion-NMA
interaction energy. The magnitude of the interaction between
an ion and a single NMA molecule with the GROMOS87
force field is 8.2 kcal/mol less than the lower limit of the ab
initio result in magnitude.
To further quantify how the force field represents the
solvation of an ion by the protein backbone, we carried out
FEP calculations on the charging of the ion in liquid NMA.
Though the solvation free energy of K1 in bulk-NMA is not
known experimentally, it is anticipated to be slightly more
negative than the hydration free energy based on results with
formamide (92).
For the solvation free energy computation, a sphere of 100
NMA molecules was simulated with the spherical solvent
boundary potential method (39); the bulk solvent surround-
ing the sphere was represented by a uniform dielectric of
178.9 (93). The ion, fixed at the center, has its charge slowly
turned off in a series of 11 windows after which the WHAM
method is used to extract the free energy of charging. A total
simulation time of 200 ps was used for each free energy
calculation. A comparison of charging free energies is listed
in Table 2. The standard CHARMM27 force field predicts a
free energy of 89.2 kcal/mol, in comparison to AMBER94
and GROMOS87, which yield values of 81.8 and 71.6 kcal/
mol, respectively.
Within limits it is possible to adjust the 6-12 Lennard-
Jones parameter of the ion-carbonyl oxygen, without
changing the atomic charge distribution, to reproduce the
solvation free energy of K1 in liquid NMA. This method
was used by Aqvist for the SPC water model (41), and by
Roux and Beglov for the TIP3P water model (39), to develop
the LJ parameters of the small ions. Such adjustments
are justified because the additive sij ¼ (sii 1 sjj)/2 or
multiplicative sij ¼ffiffiffiffiffiffiffiffiffiffiffisiisjj
pcombination rules that are used
to generate the atom-atom LJ pair parameters are very
limited. In the case of CHARMM27 and AMBER94, such
small empirical adjustment of the LJ parameters can be done
without affecting the structure of the force fields. In the case
of the GROMOS87, the situation is more difficult because
the underestimated ion-carbonyl interactions are directly
related to the atomic charge distribution of the protein
backbone. Indeed, in comparison with CHARMM27 and
AMBER94, the backbone partial charges with GROMOS87
are much smaller in magnitude: the C, O, N, and H charges
are 10.51, �0.51, �0.47, and 10.31 e for CHARMM27;
10.60,�0.57,�0.42, and10.27 e for AMBER94; and10.38,
�0.38, �0.28, and 10.28 e for GROMOS87. Therefore, it is
not possible to obtain an acceptable solvation free energy of
cations in liquid NMA using the GROMOS87 force field
without modifying the atomic partial charges assigned to the
backbone. Because of the significantly underestimated ion-
carbonyl interactions, one would anticipate that the GRO-
MOS87 force field will yield a larger barrier in the PMF.
We have previously shown, through mean force decom-
position, that within the channel the protein is responsible for
up to half of the ion’s solvation free energy (15). Based on
the above liquid NMA calculations, we anticipate that a PMF
of ion permeation obtained with the GROMOS87 force field
will have a barrier that is up to 5 kcal/mol higher than that
obtained with AMBER94.
TABLE 2 Ion gas phase water and NMA interaction energies
and liquid NMA free energies of charging (absolute values,
referred to as ‘‘solvation free energies’’) for different force fields
K-water
gas phase
K-NMA
gas phase
K solvation free
energy in
liquid NMA
Force field (kcal/mol)
Experiment 17.9 28.3–32.3 –
Ab initio 15.9–17.6 24.8–31.7 –
CHARMM, sKO ¼ 3.20 A 18.9 28.0 101.3
CHARMM271, sKO ¼ 3.30 A 18.9 26.5 97.6
CHARMM, sKO ¼ 3.35 A 18.9 25.8 92.6
CHARMM27, sKO ¼ 3.46 A 18.9 24.2 89.2
CHARMM27�, sKO ¼ 3.69 A 18.9 21.6 82.0
AMBER94 18.2 23.7 81.8
GROMOS87 17.8 16.6 71.6
Results for CHARMM27, AMBER94, and GROMOS87 force fields, as
well as variations on CHARMM27, where the K1-carbonyl O Lennard-
Jones s has been modified, are given. Values for gas phase interactions
with water and NMA have been taken from Roux and Berneche (98).
Ion Permeation through a Narrow Channel 3461
Biophysical Journal 90(10) 3447–3468
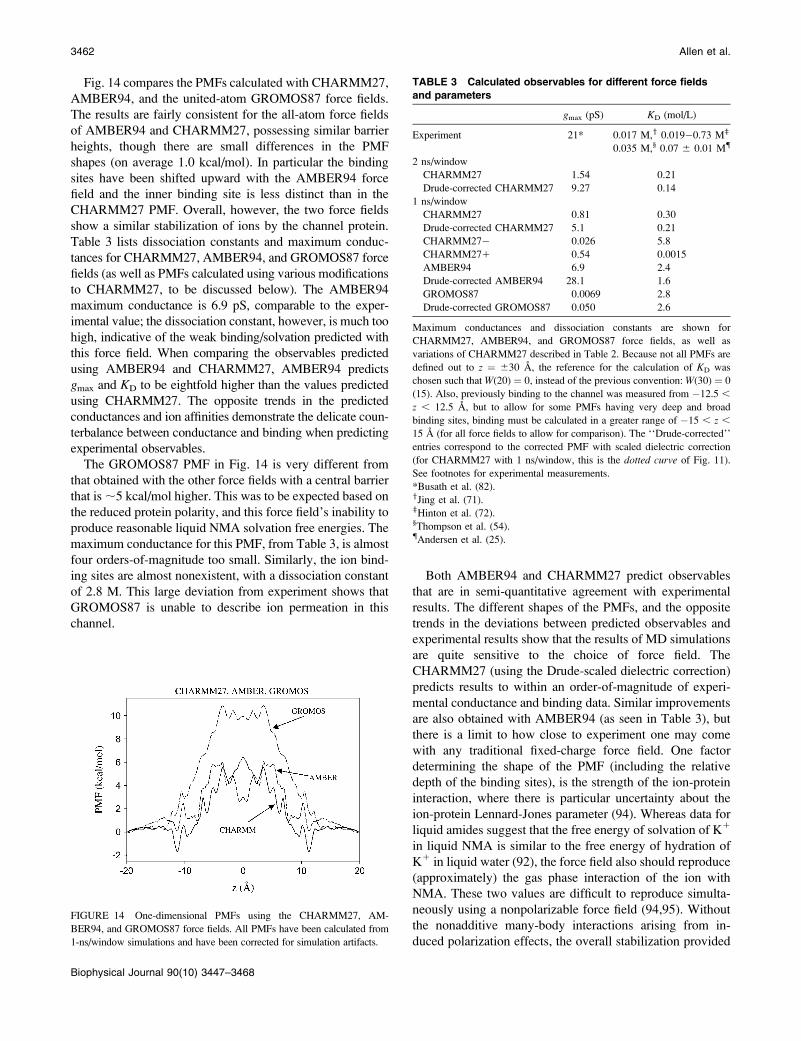
Fig. 14 compares the PMFs calculated with CHARMM27,
AMBER94, and the united-atom GROMOS87 force fields.
The results are fairly consistent for the all-atom force fields
of AMBER94 and CHARMM27, possessing similar barrier
heights, though there are small differences in the PMF
shapes (on average 1.0 kcal/mol). In particular the binding
sites have been shifted upward with the AMBER94 force
field and the inner binding site is less distinct than in the
CHARMM27 PMF. Overall, however, the two force fields
show a similar stabilization of ions by the channel protein.
Table 3 lists dissociation constants and maximum conduc-
tances for CHARMM27, AMBER94, and GROMOS87 force
fields (as well as PMFs calculated using various modifications
to CHARMM27, to be discussed below). The AMBER94
maximum conductance is 6.9 pS, comparable to the exper-
imental value; the dissociation constant, however, is much too
high, indicative of the weak binding/solvation predicted with
this force field. When comparing the observables predicted
using AMBER94 and CHARMM27, AMBER94 predicts
gmax and KD to be eightfold higher than the values predicted
using CHARMM27. The opposite trends in the predicted
conductances and ion affinities demonstrate the delicate coun-
terbalance between conductance and binding when predicting
experimental observables.
The GROMOS87 PMF in Fig. 14 is very different from
that obtained with the other force fields with a central barrier
that is;5 kcal/mol higher. This was to be expected based on
the reduced protein polarity, and this force field’s inability to
produce reasonable liquid NMA solvation free energies. The
maximum conductance for this PMF, from Table 3, is almost
four orders-of-magnitude too small. Similarly, the ion bind-
ing sites are almost nonexistent, with a dissociation constant
of 2.8 M. This large deviation from experiment shows that
GROMOS87 is unable to describe ion permeation in this
channel.
Both AMBER94 and CHARMM27 predict observables
that are in semi-quantitative agreement with experimental
results. The different shapes of the PMFs, and the opposite
trends in the deviations between predicted observables and
experimental results show that the results of MD simulations
are quite sensitive to the choice of force field. The
CHARMM27 (using the Drude-scaled dielectric correction)
predicts results to within an order-of-magnitude of experi-
mental conductance and binding data. Similar improvements
are also obtained with AMBER94 (as seen in Table 3), but
there is a limit to how close to experiment one may come
with any traditional fixed-charge force field. One factor
determining the shape of the PMF (including the relative
depth of the binding sites), is the strength of the ion-protein
interaction, where there is particular uncertainty about the
ion-protein Lennard-Jones parameter (94). Whereas data for
liquid amides suggest that the free energy of solvation of K1
in liquid NMA is similar to the free energy of hydration of
K1 in liquid water (92), the force field also should reproduce
(approximately) the gas phase interaction of the ion with
NMA. These two values are difficult to reproduce simulta-
neously using a nonpolarizable force field (94,95). Without
the nonadditive many-body interactions arising from in-
duced polarization effects, the overall stabilization provided
FIGURE 14 One-dimensional PMFs using the CHARMM27, AM-
BER94, and GROMOS87 force fields. All PMFs have been calculated from
1-ns/window simulations and have been corrected for simulation artifacts.
TABLE 3 Calculated observables for different force fields
and parameters
gmax (pS) KD (mol/L)
Experiment 21* 0.017 M,y 0.019�0.73 Mz
0.035 M,§ 0.07 6 0.01 M{
2 ns/window
CHARMM27 1.54 0.21
Drude-corrected CHARMM27 9.27 0.14
1 ns/window
CHARMM27 0.81 0.30
Drude-corrected CHARMM27 5.1 0.21
CHARMM27� 0.026 5.8
CHARMM271 0.54 0.0015
AMBER94 6.9 2.4
Drude-corrected AMBER94 28.1 1.6
GROMOS87 0.0069 2.8
Drude-corrected GROMOS87 0.050 2.6
Maximum conductances and dissociation constants are shown for
CHARMM27, AMBER94, and GROMOS87 force fields, as well as
variations of CHARMM27 described in Table 2. Because not all PMFs are
defined out to z ¼ 630 A, the reference for the calculation of KD was
chosen such that W(20) ¼ 0, instead of the previous convention:W(30) ¼ 0
(15). Also, previously binding to the channel was measured from �12.5 ,
z , 12.5 A, but to allow for some PMFs having very deep and broad
binding sites, binding must be calculated in a greater range of �15 , z ,15 A (for all force fields to allow for comparison). The ‘‘Drude-corrected’’
entries correspond to the corrected PMF with scaled dielectric correction
(for CHARMM27 with 1 ns/window, this is the dotted curve of Fig. 11).
See footnotes for experimental measurements.
*Busath et al. (82).yJing et al. (71).zHinton et al. (72).§Thompson et al. (54).{Andersen et al. (25).
3462 Allen et al.
Biophysical Journal 90(10) 3447–3468

by a coordination shell of carbonyls surrounding a cation
will be overestimated by a parameterization that matches
gas-phase ion-NMA interaction (73,95). In a nonpolarizable
force field, a compromise between local and global energet-
ics is achieved through the parameterization of the ion-
oxygen Lennard-Jones 6-12 interaction.
To explore the effects of small changes in the Lennard-
Jones parameters on these fixed-charge force field results, we
carried out simulations with modified CHARMM27 param-
eters (Table 2). The CHARMM27 force field gives a K1-
liquid NMA free energy;7 kcal/mol more negative than the
K1-bulk water free energy and gives a gas phase interaction
with NMA slightly less than the lower bound of the ab initio
results. To explore the sensitivity of permeation energetics
to precise ion parameterizations, and thus to investigate
the robustness of the force fields, we chose two different
modifications of CHARMM27 to compute new PMFs. The
first, called CHARMM27�, where the � symbol denotes
weaker ion-protein interaction, has an increased K1-O
Lennard-Jones radius, s, leading to a liquid NMA charging
free energy similar to that of bulk water. (This is also similar
to the modification used in studies of KcsA permeation (83).)
The second, called CHARMM271, where the 1 symbol
denotes a stronger ion-protein interaction, has a reduced
K1-O Lennard-Jones radius, to give a gas phase interaction
energy within the ab initio range—and nearer the lower
bound seen experimentally.
The PMF calculated using the CHARMM271 force field
is shown as a dashed curve in Fig. 15. Because the parameter
was chosen to reproduce the K1-NMA interaction energy in
gas phase, the central barrier in the PMF is reduced and the
depths of the binding sites increased. The central barrier
height is only a few kcal/mol above the channel entrances but
remains at ;8 kcal/mol with respect to the binding sites.
With this force field there is a broad deep free energy well at
the channel entrance and the inner and outer binding sites are
of similar depth. In fact, this was predicted based on the
increased involvement of the protein carbonyls in solvating
the ion at the inner binding site (15). The CHARMM27�force field is shown as a dash-dot curve in Fig. 15. The
central barrier has increased dramatically, to almost 11 kcal/
mol because s has been modified to give a K1 charging free
energy in liquid NMA similar to that in bulk water. More-
over, the binding sites have almost vanished. We conclude
that, calculated, the PMFs are remarkably sensitive to very
small changes in the MD force field.
When computing the maximum conductances and disso-
ciation constants using these two variations of the force field
parameters (Table 3), the CHARMM271 PMF leads to a
lower gmax than the unmodified CHARMM27 PMF, and a
dissociation constant that is at least an order-of-magnitude
too low. Using the CHARMM27� PMF there is almost no
binding and the conductance is three orders-of-magnitude
too low. The unmodified CHARMM27 (and to a similar
extent AMBER94) force fields strike a good compromise
between gas and liquid phase properties and allow for the
best predictions of gA ion permeation.
DISCUSSION AND CONCLUSION
We have shown that it is possible to use MD-PMF simu-
lations to reliably predict experimental observables with
semiquantitative accuracy. We could do so by implementing
the procedures required to obtain a well-defined PMF in one
and two dimensions. These procedures include: the creation
of a realistic ion channel-membrane system; application of
force field potentials that accurately describe the interactions
between ions, water, protein, and phospholipids; the choice
of reaction coordinate that adequately captures the perme-
ation process; and the construction of a conduction model
consistent with the definition of the free energy surface. The
key step was the construction of a two-dimensional PMF, as a
function of both axial and radial coordinates, to characterize the
free energy surface governing the permeation of K1 through a
gA channel embedded in a phospholipid bilayer—with the
correct bulk reference value. This free energy surface reveals the
details of the equilibrium distribution of ions inside and around
the ion channel, including the height of the central barrier and
the depths and positions of the K1 binding sites. Of particular
interest is that, when we recalculated the PMF in the
instantaneous channel CoM-axis frame, we saw that the ion is
binding off-axis when in the outer binding site. The prediction of
two cation binding site, at the entrance of the channel is in
accord with previous experimental results (59,60), as well as
previous MD simulations (29,74). There is divergence among
the experimental results, however, with the x-ray scattering
results of Olah et al. (62), predicting the predominant K1
binding to occur deeper within the channel (at our inner site),
whereas a preferred outer-site binding would be inferred from
FIGURE 15 One-dimensional PMFs using the CHARMM27 force field
and variations CHARMM271 and CHARMM27�. The dashed curve uses
the CHARMM271 force field (as defined in Table 2 with modification to K1-O
Lennard-Jones interaction). The dash-dot curve uses the CHARMM27� force
field, also defined in Table 2. All PMFs have been calculated from 1-ns/
window simulations and have been corrected for simulation artifacts.
Ion Permeation through a Narrow Channel 3463
Biophysical Journal 90(10) 3447–3468

the solid-state NMR results of Tian and Cross (61). So, even
though we find that K1 preferentially binds to the outer site, in
agreement with the analysis of solid state NMR data (59), it
remains unclear whether this, in fact, is the preferred K1 binding
site.
To validate the absolute energy scale deduced from the
two-dimensional PMF, we performed free energy perturba-
tion computational alchemy, in which a K1 ion in the center
of the channel alchemically was transformed into a water
molecule. The two-dimensional PMF could be converted
into a one-dimensional PMF by integrating over lateral
displacements, with attention to sampling of x,y ionic
coordinates in the bulk. We have demonstrated that this
one-dimensional PMF allows for the prediction of rates of
ion permeation and energetics of ion binding—for compar-
ison with experimental flux and binding measurement.
A perennial concern in MD simulations is whether the
configurational sampling is adequate. To assess this issue,
we compared the PMFs obtained based on different simu-
lation times (50 ps to 2 ns for each window). This analysis
revealed that the PMF was highly asymmetric for short (50–
100 ps) simulation times, and that the asymmetry was
reduced to ,1 kcal/mol after 2 ns/window. This asymmetry
corresponds to a very small force across the length of the
channel which can be avoided by symmetrization. The sym-
metrized PMFs over 1-and 2-ns simulation times, were con-
verged (on average) to within 0.3 kcal/mol (Fig. 4 D). Giventhis convergence, it was possible to investigate the effects of a
range of different simulation parameters on the PMF using
only 1 ns simulation per window. The large asymmetry and
variation in central barrier height obtained with short simu-
lations demonstrate that previous simulations using a set of
short (,100 ps) nonsymmetrized PMFs (30,32) may have
considerable uncertainty. As a comparison, we investigated
PMFs obtained by sequential sampling of windows across the
channel, e.g., the dragging procedure used in the aforemen-
tioned articles, by calculating PMFs (using CHARMM27)
from �10 to110 A with 80-ps sampling sequentially in each
0.2 A window and then from110 to�10 A (T.W. Allen, O.S.
Andersen, and B. Roux, unpublished results). These forward
and reverse PMFs were different in shape and quite
asymmetrical. With short simulation times it is no surprise
that the two PMFs were different, but in both cases the free
energy increased as the PMF progressed from one side of the
channel to the other, to yield a hysteresis of;8 kcal/mol and a
difference in barrier height of ;7 kcal/mol. The more robust
approach is to place the ions along the reaction coordinate and
simulate for at least 1 ns per window.
Though encouraging, the PMF from the 2-ns simulations
still has a barrier of 7 kcal/mol with respect to the bulk
solution (based on the two-dimensional PMF), which is
several kcal/mol too high to be compatible with measured
rates of ion movement. We identified the physical basis for
most of this discrepancy, namely the systematic artifacts that
arise in the simulation of finite nonpolarizable membrane
systems, and implemented reasonable procedures to correct
for these artifacts. We confirmed our continuum-based size
correction by recalculating the PMF with a larger (three-
shell) membrane system. Before correcting for the simula-
tion artifacts, the two PMFs differed by as much as 1.8 kcal/
mol; after correction, the agreement between the small and
large systems differed on average by just 0.3 kcal/mol after
1 ns of simulation. We further tested the hydrocarbon
dielectric corrections using calculations with a polarizable
force field and found that the continuum electrostatic approx-
imation, though capturing the effect of lipid polarizability,
may have underestimated the magnitude of the effect.
We conclude that an appropriately calculated and corrected
PMF allows for predictions that are in order-of-magnitude
agreement with experimental binding and conductance mea-
surements. Using our best estimate, the 2 ns/window Drude-
corrected PMF, we obtain agreement with experimental
conductance and binding to within a factor of 2. We further
conclude that the nonpolarizable CHARMM27 force field, as
well as the AMBER94 force field, does a surprisingly good
job of modeling ions within narrow pores. But the permeation
model used to extrapolate from equilibrium PMF to observ-
able mean conductance is approximate. It uses a one-ion PMF
to predict the conductance at saturating concentrations, where
the channel would be occupied by more than one ion.
Furthermore, whereas the magnitude of the predicted con-
ductance is determined primarily by the free energy barrier in
the PMF, dissipative factors such as the ion mobility within
the channel also have a direct impact. The calculated diffusion
coefficient within the pore is approximately two-thirds of the
bulk diffusion coefficient, being four-to-fivefold larger than
would be predicted for a single-file column of ion and water
moving through the channel as a single cooperative unit (96).
The diffusion coefficient would be higher if the cooperative unit
was smaller than the complete single file, as suggested by our
finding of small gaps in the water column, but the result suggests
an uncertainty in our estimate of the diffusion coefficient—and
possibly an overestimate of the channel conductance, which still
would remain of the same order of magnitude.
When comparing different force fields, AMBER94 yields a
PMF that is fairly similar to that obtained using CHARMM27,
demonstrating overall consistency among modern all-atom
force fields used in MD. There are, nonetheless, differences
between the PMFs determined using AMBER94 and
CHARMM27, which reflect subtle differences in the protein
force fields. Overall, the two force fields are equivalent,
insofar as the improved prediction of gmax using AMBER94,
as compared to the prediction using CHARMM27, is matched
by a worse prediction of KD. Application of the Drude-scaled
dielectric correction (see Table 3) does, however, tend to
suggest that CHARMM27 provides the most balanced force
field for studying permeation through this narrow ion channel.
The total barrier for ion movement is expected to be well
correlated with the relative solvation in water and liquid
NMA. But the fine structure of the free energy profile through
3464 Allen et al.
Biophysical Journal 90(10) 3447–3468

gA will depend also on the strength of the b-helix hydrogen-
bonds and the backbone f-c dihedral potential terms, which
are different between AMBER94 and CHARMM27 force
fields; e.g., AMBER94 has a tendency to favor a-helical con-
formations relative to CHARMM27 (97).
In contrast, the GROMOS87 united-atom force field yields
predictions that were in rather severe disagreement with both
ion binding and conductance measurements, which can be
traced to the low polarity of the protein backbone in that force
field. We conclude that widely used GROMOS87 appears to
be unsuitable for studies of ion permeation through narrow ion
channels One should note that the most recent all-atom
GROMOS force field version 53A of Oostenbrink et al. (91)
probably does not suffer from these problems.
Though AMBER94 and CHARMM27 can approximately
reproduce both experimental binding and maximum con-
ductance measurements, there is a limit to how close to ex-
periment one can come within this framework—as evident
also in the differences between the PMFs calculated using
AMBER94 and CHARMM27. To analyze the roles of force-
field parameters in the PMF calculation, we explored the
effect of CHARMM27 force-field modifications that have
direct impact on bulk solvation and gas phase interaction
energies of a K1 ion with NMA molecules. The PMF and
macroscopic observables are quite sensitive to small changes
in the K1-O Lennard-Jones s; a parameter that has been
varied in previous studies. Changes on the order of one-tenth
of an A are sufficient to destroy the order-of-magnitude
agreement with experiment. It is in this context also im-
portant that simple adjustments of the force field provide
little, if any, improvement in the PMF—in terms of improved
ability to predict experimental observables, whereas signif-
icant improvement was obtained by addressing the physical
limitations inherent in the standard implementations of MD,
the neglected system size, and acyl-chain electronic polar-
izability (Fig. 11 A, Table 3).What needs to be done to improve the agreement with
experiment beyond what is possible using the unmodified
CHARMM27 force fields? Because the best estimate for a
system-artifact-corrected PMF predicts ion conductances
and binding constants that are within an order of magnitude
of experimental values, the PMF is likely to be correct within
;1 kcal/mol of the true free energy profile for permeation.
Protein and water polarizability would be expected to play
some role in ion permeation through a narrow pore, and
neglect of polarizability is likely to account for most of the
remaining discrepancies. It is not sufficient, however, to just
introduce polarizability—except in the very special case of
the lipid acyl chains—because the force fields have been
calibrated to reproduce a wide variety of experimental results,
that each in their own way depend on interactions between
polarizable atoms. It will be necessary to develop, and cali-
brate, a new set of force fields de novo. Previously, we have
shown, through mean force decomposition, that the single file
of water inside the channel plays a surprisingly large role in
stabilizing the ion; accounting for almost half of the free
energy of solvation of the ion deep within the channel (15). In
this region, the channel water is approximately twice as im-
portant as the protein in terms of stabilizing the ion,�38 kcal/
mol as compared to �19 kcal/mol (15). It thus becomes
important to ascertain, what is the role of water polarizability
inside the channel? This question was explored previously
(15), in calculations of the charging free energy of a K1 in a
model single-file column of water surrounded by a cavity
reaction field arising from bulk water. FEP calculations were
done with the nonpolarizable TIP3P water model (38) as well
as the Drude oscillator-based polarizable water model SWM4-
DP (68). These calculations showed that the role of water
polarizability is of the order of 0.1�0.5 kcal/mol, indicating
that the nonpolarizable TIP3P water model adequately
describes two extremes of ion solvation: by the bulk water;
and by the anisotropic single-file water. But, while the effect
of polarizability may be small, the predicted channel proper-
ties are extremely sensitive to small changes in the PMF.
Reproducing quantitatively the local interaction of a cation
with a carbonyl group (related to the gas phase ion-NMA
complex) as well as the global magnitude of the free energy
barrier through gA (related to bulk ion solvation in liquid
NMA) will require taking induced nonadditive many-body
polarization effects into account (95). When the next gener-
ation of polarizable force field is developed, one will also need
to pay careful attention to the solvation free energy of ions in
water and also in various organic liquids (amides, alcohols,
etc. . .)—in addition to the gas phase interaction energies. It is
in this relevant context that variations in the nonpolarizable
CHARMM27 force field (CHARMM27� and CHARMM271)
did not improve the predictions, whereas introducing Drude-
oscillator-based lipid acyl-chain polarizability did so.
The moderately optimistic conclusions of this study, per-
taining to the use of MD-PMF simulations to reliably predict
experimental observables are encouraging, because MD
remains the only viable method for calculating the forces
acting on an ion in a narrow pore undergoing thermal
fluctuations (3). Previous attempts to validate the use of MD-
PMF as a tool to predict experimental observables (29,30,32)
were less successful than this study. The three key elements
underlying the different outcomes and assessments are:
1. Attention to the convergence of the PMF calculations,
which was possible by the availability of more powerful
computational resources.
2. Attention to the proper referencing of the PMFs relative
to the bulk solution.
3. The identification of, and correction for, artifacts that
would introduce systematic errors into any MD-PMF-
based predictions.
Taken together, these elements ensure that it is possible to
compare with experimental data by using the one-ion PMF to
predict KD and gmax. The conductances reported here are,
however, the extrapolated gmax values in the limit of very
Ion Permeation through a Narrow Channel 3465
Biophysical Journal 90(10) 3447–3468

high ion concentration (.10 KD); we do not consider the
impact of double-ion occupancy, which will be nontrivial
(25,73). This becomes important when comparing the pre-
dictions of different permeation models. Indeed, any com-
parison among permeation models can be meaningful only
when all efforts are made to ensure that the different ap-
proaches are describing the same physical situation. Employ-
ing a PMF out of context (with respect to dimensionality,
pore occupancy, concentration regime, or timescale) would
be expected to lead to questionable predictions.
There is reason to be optimistic about the use of all-atom
MD-PMF as a tool to understand protein function, as evi-
denced by the convergence and consistency of the PMF ob-
tained in this study. Despite the limitations of the conduction
model (the neglect of double-ion occupancy and uncertainty
about the precise value of the diffusion coefficient), compu-
tational studies on gA ion permeation constitutes a suitable
system for critically evaluating these approaches to under-
stand ion conduction through narrow pores, which remains
one of the most challenging of problems in computational
biophysics.
Note added in proof: We have performed calculations to demonstrate
further the robustness of the PMF calculations reported here since accep-
tance. Regarding the application of a spherical constraint to both cations
and anions to maintain a 1-ion pore, we have repeated the PMF calculation
with only a constraint on cations (other than the one in question), leaving
anions unbiased, and found a very similar PMF with inner and outer
binding sites of unaltered depths (though a small shift toward the channel
center of the inner site by 0.3–0.4 A, remaining in agreement with the
position determined experimentally). We note that when the PMF was
recalculated without any Umbrella sampling bias, but holding an ion inside
the range 7.5–13.5 A, the inner and outer binding site positions and depths
were approximately reproduced. We have also recalculated the PMF with-
out the lateral restraint that is used to provide a well-defined region in the
bulk for the ion to occupy, and found no noticeable changes in the PMF
within the pore, with the PMF dropping steadily as the ion departs the
channel, as expected.
The National Center for Supercomputing Applications Origin supercom-
puter was used for some reported large-membrane unbiased simulations
before the PMF calculations.
This work was supported by the Revson and Keck Foundations (to T.W.A.)
and National Institutes of Health grants No. GM21342 (to O.S.A.), No.
GM62342 (to B.R.), and No. GM70791 (to O.S.A. and B.R).
REFERENCES
1. Karplus, M. 2002. Molecular dynamics simulations of biomolecules.Acc. Chem. Res. 35:321–323.
2. Roux, B., T. Allen, S. Berneche, and W. Im. 2004. Theoretical andcomputational models of biological ion channels. Q. Rev. Biophys. 37:15–103.
3. Allen, T. W., O. S. Andersen, and B. Roux. 2004. On the importance offlexibility in studies of ion permeation. J. Gen. Physiol. 124:679–690.
4. Lindorff-Larsen, K., R. Best, M. Depristo, C. Dobson, and M.Vendruscolo. 2005. Simultaneous determination of protein structureand dynamics. Nature. 433:128–132.
5. Karplus, M., and J. McCammon. 1981. The internal dynamics ofglobular proteins. CRC Crit. Rev. Biochem. 9:293–349.
6. Karplus, M., and G. Petsko. 1990. Molecular dynamics simulations inbiology. Nature. 347:631–639.
7. Mamonov, A. B., R. D. Coalson, A. Nitzan, and M. G. Kurnikova.2003. The role of the dielectric barrier in narrow biological channels:a novel composite approach to modeling single-channel currents.Biophys. J. 84:3646–3661.
8. Kurnikova, M., R. Coalson, P. Graf, and A. Nitzan. 1999. A latticerelaxation algorithm for three-dimensional Poisson-Nernst-Plancktheory with application to ion transport through the gramicidin Achannel. Biophys. J. 76:642–656.
9. Nadler, B., U. Hollerbach, and R. S. Eisenberg. 2003. Dielectric bound-ary force and its crucial role in gramicidin. Phys. Rev. E. 68:021905.
10. Edwards, S., B. Corry, S. Kuyucak, and S.-H. Chung. 2002.Continuum electrostatics fails to describe ion permeation in thegramicidin channel. Biophys. J. 83:1348–1360.
11. Mashl, R., Y. Tang, J. Schnitzer, and E. Jakobsson. 2001. Hierarchicalapproach to predicting permeation in ion channels. Biophys. J. 81:2473–2483.
12. Chung, S. H., T. Allen, and S. Kuyucak. 2002. Conducting stateproperties of the KcsA potassium channel from molecular andBrownian dynamics simulations. Biophys. J. 82:628–645.
13. Dorman, V. L., and P. C. Jordan. 2004. Ionic permeation free energy ingramicidin: a semi-microscopic perspective. Biophys. J. 86:3529–3541.
14. Berneche, S., and B. Roux. 2003. A microscopic view of ion con-duction through the KcsA K1 channel. Proc. Natl. Acad. Sci. USA.100:8644–8648.
15. Allen, T. W., O. S. Andersen, and B. Roux. 2004. Energetics ofion conduction through the gramicidin channel. Proc. Natl. Acad. Sci.USA. 101:117–122.
16. Urry, D. W. 1971. The gramicidin A transmembrane channel: aproposed pLD helix. Proc. Natl. Acad. Sci. USA. 68:672–676.
17. Arseniev, A. S., A. L. Lomize, I. L. Barsukov, and V. F. Bystrov. 1986.Gramicidin A transmembrane ion-channel three-dimensional structurereconstruction based on NMR spectroscopy and energy refinement. (InRussian.). Biol. Membr. 3:1077–1104.
18. Townsley, L. E., W. A. Tucker, S. Sham, and J. F. Hinton. 2001.Structures of gramicidins A, B, and C incorporated into sodiumdodecyl sulfate micelles. Biochemistry. 40:11676–11686.
19. Ketchem, R. R., B. Roux, and T. A. Cross. 1997. High resolutionrefinement of a solid-state NMR-derived structure of gramicidin A in alipid bilayer environment. Structure. 5:1655–1669.
20. Allen, T. W., O. S. Andersen, and B. Roux. 2003. The structure ofgramicidin A in a lipid bilayer environment determined usingmolecular dynamics simulations and solid-state NMR data. J. Am.Chem. Soc. 125:9868–9877.
21. Hladky, S. B., B. Urban, and D. Haydon. 1979. Ion movements in poresformed by gramicidin A. Membr. Transport Processes. 3:89–103.
22. Eisenman, G., and R. Horn. 1983. Ionic selectivity revisited: the role ofkinetic and equilibrium processes in ion permeation through channels.J. Membr. Biol. 76:197–225.
23. Andersen, O., and R. Koeppe. 1992. Molecular determinants of chan-nel function. Physiol. Rev. 72:S89–S158.
24. Busath, D. 1993. The use of physical methods in determining gramicidinchannel structure and function. Annu. Rev. Physiol. 55:473–501.
25. Andersen, O. S., R. E. Koeppe II, and B. Roux. 2005. Gramicidinchannels. IEEE Trans. Nanobiosci. 4:10–20.
26. Faraldo-Gomez, J. D., L. R. Forrest, M. Baaden, P. J. Bond, C.Domene, G. Patargias, J. Cuthbertson, and M. S. P. Sansom. 2004.Conformational sampling and dynamics of membrane proteins from10-nanosecond computer simulations. Proteins. 57:783–791.
27. Mackay, D. H. J., P. H. Berens, K. R. Wilson, and A. T. Hagler. 1984.Structure and dynamics of ion transport through gramicidin A.Biophys. J. 46:229–248.
28. Roux, B. 2002. Computational studies of the gramicidin channel. Acc.Chem. Res. 35:366–375.
3466 Allen et al.
Biophysical Journal 90(10) 3447–3468

29. Roux, B., and M. Karplus. 1993. Ion transport in the gramicidinchannel: free energy of the solvated right-handed dimer in a modelmembrane. J. Am. Chem. Soc. 115:3250–3262.
30. Allen, T. W., T. Bastug, S. Kuyucak, and S. H. Chung. 2003.Gramicidin-A channel as a test ground for molecular dynamics forcefields. Biophys. J. 84:2159–2168.
31. Jordan, P. C. 1987. Microscopic approach to ion transport throughtransmembrane channels. The model system gramicidin. J. Phys. Chem.91:6582–6591.
32. Batug, T., and S. Kuyucak. 2005. Test of molecular dynamics forcefields in gramicidin A. Eur. Biophys. J. 34:377–382.
33. Andersen, O. S. 1984. Gramicidin channels. Annu. Rev. Physiol. 46:531–548.
34. Chandler, D. 1978. Statistical mechanics of isomerization dynamicsin liquids and the transition state approximation. J. Chem. Phys. 68:2959–2970.
35. Hinsen, K., and B. Roux. 1997. Potential of mean force and reaction ratesfor proton transfer in acetylacetone. J. Chem. Phys. 106:3567–3577.
36. Brooks, B. R., R. E. Bruccoleri, B. D. Olafson, D. J. States, S.Swaminathan, and M. Karplus. 1983. CHARMM: a program for macro-molecular energy minimization and dynamics calculations. J. Comput.Chem. 4:187–217.
37. MacKerell, A. D., Jr., D. Bashford, M. Bellot, R. L. Dunbrack, J. D.Evanseck, M. J. Field, S. Fischer, J. Gao, H. Guo, S. Ha, D. Joseph-McCarthy, L. Kuchnir, K. Kuczera, F. T. K. Lau, C. Mattos, S.Michnick, T. Ngo, D. T. Nguyen, B. Prodhom, W. E. Reiher III, B.Roux, B. Schlenkrich, J. Smith, R. Stote, J. Straub, M. Watanabe, J.Wiorkiewicz-Kuczera, and M. Karplus. 1998. All-atom empiricalpotential for molecular modeling and dynamics studies of proteins.J. Phys. Chem. B. 102:3586–3616.
38. Jorgensen, W. L., J. Chandrasekhar, J. D. Madura, R. W. Impey, andM. L. Klein. 1983. Comparison of simple potential functions for simu-lating liquid water. J. Chem. Phys. 79:926–935.
39. Beglov, D., and B. Roux. 1994. Finite representation of an infinite bulksystem: solvent boundary potential for computer simulations. J. Chem.Phys. 100:9050–9063.
40. Cornell, W., P. Cieplak, C. Bayly, I. Gould, K. Merz, Jr., D. Ferguson,D. Spellmeyer, T. Fox, J. Caldwell, and P. Kollman. 1995. A secondgeneration force field for the simulation of proteins and nucleic acids.J. Am. Chem. Soc. 117:5179–5197.
41. Aqvist, J. 1990. Ion water interaction potential derived from freeenergy perturbation simulations. J. Phys. Chem. 94:8021–8024.
42. van Gunsteren, W., X. Daura, and A. Mark. 1999. GROMOS forcefield. In Encyclopaedia of Computational Chemistry, Vol. 2. E.-I.-C. P.von Ragu Schelyer, editor. John Wiley & Sons, London. 1211–1216.
43. Berendsen, H., J. Postma, W. van Gunsteren, and J. Hermans. 1981.Interaction models for water in relation to proteins hydration. InIntermolecular Forces. B. Pullman, editor. Reidel, Dordrecht, TheNetherlands. 331–342.
44. Straatsma, T. P., and H. J. C. Berendsen. 1988. Free energy of ionichydration: analysis of a thermodynamic intergration technique toevaluate free energy differences by molecular dynamics simulations. J.Chem. Phys. 89:5876–5886.
45. Cornell, W. D., P. Cieplak, C. I. Bayly, I. R. Gould, K. M. Merz, Jr.,D. M. Ferguson, D. C. Spellmeyer, T. Fox, J. W. Caldwell, and P. A.Kollman. 1995. A second-generation force field for the simulation ofproteins and nucleic acids. J. Am. Chem. Soc. 117:5179–5197.
46. Schlenkrich, M., J. Brickmann, A. J. MacKerell, and M. Karplus. 1996.An empirical potential energy function for phospholipids: criteria forparameters optimization and applications. In Biological Membranes. AMolecular Perspective from Computation and Experiment. K. Merz,and B. Roux, editors. Birkhauser, Boston, MA. 31–81.
47. Darden, T., D. York, and L. Pedersen. 1993. Particle mesh Ewald: anN�log(N) method for Ewald sums in large systems. J. Chem. Phys. 98:10089–10092.
48. Ryckaert, J. P., G. Ciccotti, and H. J. C. Berendsen. 1977. Numericalintegration of the Cartesian equation of motions of a system with
constraints: molecular dynamics of n-alkanes. J. Comput. Chem. 23:327–341.
49. Feller, S. E., Y. H. Zhang, R. W. Pastor, and B. R. Brooks. 1995.Constant pressure molecular dynamics simulation—the Langevinpiston method. J. Chem. Phys. 103:4613–4621.
50. Woolf, T., and B. Roux. 1996. Structure, energetics and dynamics oflipid-protein interactions: a molecular dynamics study of the gramicidinA channel in a DMPC bilayer. Proteins Struct. Funct. Genet. 24:92–114.
51. Ketchem, R. R., W. Hu, and T. A. Cross. 1993. High-resolutionconformation of gramicidin A in lipid bilayer by solid-state NMR.Science. 261:1457–1460.
52. Schatzberg, P. 1963. Solubilities of water in several normal alkanesfrom c7 to c16. J. Phys. Chem. 67:776–779.
53. Roux, B. 1999. Statistical mechanical equilibrium theory of selectiveion channels. Biophys. J. 77:139–153.
54. Thompson, N., G. Thompson, C. D. Cole, M. Cotten, T. A. Cross, andD. D. Busath. 2001. Noncontact dipole effects on channel permeation.IV. Kinetic model of 5F-Trp13 gramicidin A currents. Biophys. J. 81:1245–1254.
55. Roux, B. 1997. The influence of the membrane potential on the freeenergy of an intrinsic protein. Biophys. J. 73:2980–2989.
56. Torrie, G. M., and J. P. Valleau. 1977. Nonphysical sampling dis-tributions in Monte Carlo free-energy estimation: umbrella sampling.J. Comput. Phys. 23:187–199.
57. Kumar, S., D. Bouzida, R. H. Swendsen, P. A. Kollman, and J. M.Rosenberg. 1992. The weighted histogram analysis method for free-energy calculations on biomolecules. I. The method. J. Comput. Chem.13:1011–1021.
58. Parsegian, A. 1969. Energy of an ion crossing a low dielectric membrane:solution to four relevant electrostatic problems. Nature. 221:844–846.
59. Tian, F., and T. Cross. 1999. Cation transport: an example of structuralbased selectivity. J. Mol. Biol. 285:1993–2003.
60. Olah, G. A., H. W. Huang, W. Liu, and Y. Wu. 1991. Location of ion-binding sites in the gramicidin channel by x-ray diffraction. J. Mol.Biol. 218:847–858.
61. Finkelstein, A., and O. S. Andersen. 1981. The gramicidin A channel: areview of its permeability characteristics with special reference to thesingle-file aspect of transport. J. Membr. Biol. 59:155–171.
62. Stern, H. A., and S. E. Feller. 2003. Calculation of the dielectricpermittivity profile for a nonuniform system: application to a lipidbilayer simulation. J. Chem. Phys. 118:3401–3412.
63. Huang, W., and D. G. Levitt. 1977. Theoretical calculation of thedielectric constant of a bilayer membrane. Biophys. J. 17:111–128.
64. Simon, S. A., and T. J. McIntosh. 1986. Depth of water penetration intobilayers. Methods Enzymol. 127:511–521.
65. Lide, D. R. (Editor-in-Chief). 1992. CRC Handbook of Chemistry andPhysics, 72nd Ed. CRC Press, Boston, MA.
66. Hunenberger, P. H., and J. A. McCammon. 1999. Ewald artifacts incomputer simulations of ionic solvation and ion-ion interaction: acontinuum electrostatics study. J. Chem. Phys. 110:1856–1872.
67. Lewis, B. A., and D. M. Engelman. 1983. Lipid bilayer thicknessvaries linearly with acyl chain length in fluid phosphatidylcholinevesicles. J. Mol. Biol. 166:211–217.
68. Lamoureux, G., A. D. MacKerell Jr., and B. Roux. 2003. A simplepolarizable model of water based on classical drude oscillators. J.Chem. Phys. 119:5185–5197.
69. Aqvist, J., and A. Warshel. 1989. Energetics of ion permeation throughmembrane channels. Solvation of Na1 by gramicidin A. Biophys. J.56:171–182.
70. Jordan, P. C., R. J. Bacquet, J. A. McCammon, and P. Tran. 1989. Howelectrolyte shielding influences the electrical potential in transmem-brane ion channels. Biophys. J. 55:1041–1052.
71. Jing, N., K. U. Prasad, and D. W. Urry. 1995. The determination ofbinding constants of micellar-packaged gramicidin A by 13C-and 23Na-NMR. Biochim. Biophys. Acta. 1238:1–11.
Ion Permeation through a Narrow Channel 3467
Biophysical Journal 90(10) 3447–3468

72. Hinton, J. F., W. L. Whaley, D. C. Shungu, R. E. Koeppe II, and F. S.Millett. 1986. Equilibrium binding constant for the group I metalcations with gramicidin-A determined by competition studies and Tl1
205 nuclear magnetic resonance spectroscopy. Biophys. J. 50:539–544.
73. Roux, B., B. Prod’hom, and M. Karplus. 1995. Ion transport in thegramicidin channel: molecular dynamics study of single and doubleoccupancy. Biophys. J. 68:876–892.
74. Woolf, T., and B. Roux. 1997. The binding site of sodium in thegramicidin A channel: a comparison of molecular dynamics simula-tions with solid state NMR data. Biophys. J. 72:1930–1945.
75. Levitt, D. 1986. Interpretation of biological channel flux data—reaction-rate theory versus continuum theory. Annu. Rev. Biophys. Chem. 15:29–57.
76. Corry, B., and S. H. Chung. 2005. Influence of protein flexibility on theelectrostatic energy landscape in gramicidin a. Eur. Biophys. J. 34:208–216.
77. Becker, M. D., R. E. Koeppe, and O. S. Andersen. 1992. Amino acidsubstitutions and ion channel function. Model-dependent conclusions.Biophys. J. 62:25–27.
78. Roux, B., and M. Karplus. 1991. Ion transport in a gramicidin-likechannel: dynamics and mobility. J. Phys. Chem. 95:4856–4868.
79. Andersen, O. S. 1983. Ion movement through gramicidin A channels.Studies on the diffusion-controlled association step. Biophys. J. 41:147–165.
80. Berne, B. J., M. Borkovec, and J. E. Straub. 1988. Classical andmodern methods in reaction rate theory. J. Phys. Chem. 92:3711–3725.
81. Crouzy, S., T. Woolf, and B. Roux. 1994. A molecular dynamics studyof gating in dioxolane-linked gramicidin A channels. Biophys. J. 67:1370–1386.
82. Busath, D. D., C. D. Thulin, R. W. Hendershot, L. R. Phillips, P.Maughan, C. D. Cole, N. C. Bingham, S. Morrison, L. C. Baird, R. J.Hendershot, M. Cotten, and T. A. Cross. 2003. Noncontact dipole.Biophys. J. 75:2830–2844.
83. Berneche, S., and B. Roux. 2001. Energetics of ion conduction throughthe K1 channel. Nature. 414:73–77.
84. Allen, T. W., S. Kuyucak, and S. H. Chung. 1999. Molecular dynamicsstudy of the KcsA potassium channel. Biophys. J. 77:2502–2516.
85. Allen, T., A. Bliznyuk, A. Rendell, S. Kuyucak, and S. Chung. 2000.The potassium channel: structure, selectivity and diffusion. J. Chem.Phys. 112:8191–8204.
86. Guidoni, L., V. Torre, and P. Carloni. 1999. Potassium and sodiumbinding to the outer mouth of the K1 channel. Biochemistry. 38:8599–8604.
87. Guidoni, L., V. Torre, and P. Carloni. 2000. Water and potassiumdynamics inside the KcsA K1 channel. FEBS Lett. 477:37–42.
88. Shrivastava, I., and M. Sansom. 2000. Simulations of ion permeationthrough a potassium channel: molecular dynamics of KcsA in aphospholipid bilayer. Biophys. J. 78:557–570.
89. Biggin, P., G. Smith, I. Shrivastava, S. Choe, and M. Sansom. 2001.Potassium and sodium ions in a potassium channel studied by molec-ular dynamics simulations. Biochim. Biophys. Acta. 1510:1–9.
90. Aqvist, J., and V. Luzhkov. 2000. Ion permeation mechanism of thepotassium channel. Nature. 404:881–884.
91. Oostenbrink, C., A. Villa, A. E. Mark, and W. F. van Gunsteren. 2004.A biomolecular force field based on the free enthalpy of hydration andsolvation: the GROMOS force field parameter sets 53a5 and 53a6.J. Comput. Chem. 25:1656–1676.
92. Cox, B. G., G. R. Hedwig, A. J. Parker, and D. W. Watts. 1974.Solvation of ions. XIX. Thermodynamic properties for transfer ofsingle ions between protic and dipolar aprotic solvents. Aust. J. Chem.27:477–501.
93. Nathan, W. I., R. M. Meighan, and R. H. Cole. 1964. Dielectricproperties of alkyl amides. II. Liquid dielectric constant and loss.J. Phys. Chem. 68:509–515.
94. Roux, B., and S. Berneche. 2002. On the potential functions usedin molecular dynamics simulations of ion channels. Biophys. J. 82:1681–1684.
95. Roux, B. 1993. Nonadditivity in cation-peptide interactions: a molec-ular dynamics and ab initio study of Na1 in the gramicidin channel.Chem. Phys. Lett. 212:231–240.
96. Finkelstein, A., and P. A. Rosenberg. 1979. Membrane TransportProcesses, Vol. 3. C.F. Stevens and R.W. Tsien, editors. Raven Press,New York. 73–88.
97. Mackerell, A. D., Jr. 2004. Empirical force fields for biological macro-molecules: overview and issues. J. Comput. Chem. 25:1584–1604.
98. Roux, B., and S. Berneche. 2002. On the potential functions usedin molecular dynamics simulations of ion channels. Biophys. J. 82:1681–1684.
3468 Allen et al.
Biophysical Journal 90(10) 3447–3468