International Journal of Emerging Trends in Engineering and ...
11
International Journal of Emerging Trends in Engineering and Development Issue 3, Vol.5 (September 2013) Available online on http://www.rspublication.com/ijeted/ijeted_index.htm ISSN 2249-6149 R S. Publication, [email protected] Page 75 FLEXURAL BEHAVIOUR OF RC BEAMS WITH PARTIAL REPLACEMENTS OF SLAG SAND WITH RIVER SAND AND FLY ASH WITH CEMENT Hemanth v 1 , Dr. H.B.Balakrishna 2 1. PG student, Bangalore Institute of Technology,Bangalore-04 2. Professor, Bangalore Institute of Technology, Bangalore-04 ___________________________________________________________________________ Abstract: In the present study the experimental investigations carried out to evaluate the effects of replacing the fly ash with cement and slag sand with river sand, on various concrete properties. The main objective of this study was to identify alternative source of good quality fine aggregates which is depleting very fast due to the fast pace of construction activities in India. Use of slag sand is a waste industrial by-product of iron and steel production and fly ash is a by product of power plants provides great opportunity to utilize it as an alternative to normally available aggregates and cement. In this study, M40 grades Concrete was considered for a water content (w/c) 0.39 and fly ash replaced 30% with cement and slag sand replacements of 0%,10%,20%,30%,40%,50% with river sand. To investigate the properties of compressive strength, split tensile strength, flexural strength of concrete mix. The strength of cube specimens varied from 40.11 N/mm 2 to 46.51 N/mm 2 . The marginal strength of slag sand (41.71N/mm 2 ) 40% replacement was considered to cast the reinforced concrete beams. The beam casted with 40% replace of slag sand mix was tested for flexure, under two point loading condition. Different structural parameters were investigated. Keywords- steel slag sand, Fly ash, compressive strength, flexural strength of prisms, split tensile strength and flexural strength of beams. ___________________________________________________________________________ 1. Introduction: Concrete is the most preferred and the single largest building material used by the construction industry. Concrete is basically made of aggregates, both fine and coarse, glued by a cement paste which is made of cement and water. In fact, many by-products and solid wastes can be used in concrete mixes as aggregates or cement replacement, depending on their chemical and physical characterization, if adequately treated. The incorporation of fly ash and granular slag sand in concrete leads to many technical advantages. The present work aims at developing a cementation material that can replace the conventional cement in concrete work using the waste product like fly ash, granulated slag sand used as fine aggregate. This will solve the problem of waste disposal side by side preserving our natural resources. Isa yuksela [1], Durability of concrete incorporating non-ground blast furnace slag and bottom ash as fine aggregate. He presents investigation of how the usage of bottom ash (BA), granulated blast furnace slag (GBFS), and combination of both of these materials as fine aggregate in concrete affects the concrete durability. Mohammed Nadeem [2], Experimental investigation of using slag as an alternative to normal Aggregates (coarse and fine) in concrete. He present results of experimental investigations carried out to evaluate effects of replacing aggregate (coarse and fine) with that of slag on various concrete properties. Singh S.P. [3] eco-friendly concrete using by-products of steel industry. He outlines the method of preparation, testing procedure and salient results on the eco-friendly concrete that is manufactured using the waste products of steel industries and hydraulic lime.
-
Upload
khangminh22 -
Category
Documents
-
view
1 -
download
0
Transcript of International Journal of Emerging Trends in Engineering and ...

International Journal of Emerging Trends in Engineering and Development Issue 3, Vol.5 (September 2013)
Available online on http://www.rspublication.com/ijeted/ijeted_index.htm ISSN 2249-6149
R S. Publication, [email protected] Page 75
FLEXURAL BEHAVIOUR OF RC BEAMS WITH PARTIAL REPLACEMENTS OF
SLAG SAND WITH RIVER SAND AND FLY ASH WITH CEMENT
Hemanth v1, Dr. H.B.Balakrishna
2
1. PG student, Bangalore Institute of Technology,Bangalore-04
2. Professor, Bangalore Institute of Technology, Bangalore-04
___________________________________________________________________________
Abstract: In the present study the experimental investigations carried out to evaluate the
effects of replacing the fly ash with cement and slag sand with river sand, on various concrete
properties. The main objective of this study was to identify alternative source of good quality
fine aggregates which is depleting very fast due to the fast pace of construction activities in
India. Use of slag sand is a waste industrial by-product of iron and steel production and fly
ash is a by product of power plants provides great opportunity to utilize it as an alternative to
normally available aggregates and cement. In this study, M40 grades Concrete was
considered for a water content (w/c) 0.39 and fly ash replaced 30% with cement and slag
sand replacements of 0%,10%,20%,30%,40%,50% with river sand. To investigate the
properties of compressive strength, split tensile strength, flexural strength of concrete mix.
The strength of cube specimens varied from 40.11 N/mm2
to 46.51 N/mm2. The marginal
strength of slag sand (41.71N/mm2) 40% replacement was considered to cast the reinforced
concrete beams. The beam casted with 40% replace of slag sand mix was tested for flexure,
under two point loading condition. Different structural parameters were investigated.
Keywords- steel slag sand, Fly ash, compressive strength, flexural strength of prisms, split
tensile strength and flexural strength of beams.
___________________________________________________________________________
1. Introduction: Concrete is the most preferred and the single largest building material used by the
construction industry. Concrete is basically made of aggregates, both fine and coarse, glued
by a cement paste which is made of cement and water. In fact, many by-products and solid
wastes can be used in concrete mixes as aggregates or cement replacement, depending on
their chemical and physical characterization, if adequately treated. The incorporation of fly
ash and granular slag sand in concrete leads to many technical advantages. The present work
aims at developing a cementation material that can replace the conventional cement in
concrete work using the waste product like fly ash, granulated slag sand used as fine
aggregate. This will solve the problem of waste disposal side by side preserving our natural
resources. Isa yuksela [1], Durability of concrete incorporating non-ground blast furnace slag
and bottom ash as fine aggregate. He presents investigation of how the usage of bottom ash
(BA), granulated blast furnace slag (GBFS), and combination of both of these materials as
fine aggregate in concrete affects the concrete durability. Mohammed Nadeem [2], Experimental investigation of using slag as an alternative to normal Aggregates (coarse and
fine) in concrete. He present results of experimental investigations carried out to evaluate
effects of replacing aggregate (coarse and fine) with that of slag on various concrete
properties. Singh S.P. [3] eco-friendly concrete using by-products of steel industry. He
outlines the method of preparation, testing procedure and salient results on the eco-friendly
concrete that is manufactured using the waste products of steel industries and hydraulic lime.
International Journal of Emerging Trends in Engineering and Development Issue 3, Vol.5 (September 2013)
Available online on http://www.rspublication.com/ijeted/ijeted_index.htm ISSN 2249-6149
R S. Publication, [email protected] Page 76
2. Experimental program:
2.1 Materials used:
The materials used in the experimental program are:
Cement, Fly ash, Fine aggregates, Slag sand, Coarse aggregates, Water, Super plasticizer
Cement: Ordinary Portland cement of 53 grades conforming to IS: 12269-1987 has been
used. The physical properties of the cement obtained on conducting appropriate tests as per
IS: 12269-1987.
Fly ash: Fly ash used in this experimental work is brought from Raichur thermal power
station (RTPS) Karnataka. It is a class F fly ash (the fly ash which contains less than 10 % of
the Calcium), fly ash is tested for its physical and chemical properties.
Fine aggregates: Locally available clean river sand passing through IS-480 sieves have been
used. The results of sieve analysis conducted as per the specification of IS: 383-1970. The
fine aggregate was of Zone II, Fineness Modulus = 3.276.
Slag sand: The Granulated Blast Furnace Slag used in the present investigation was collected
from JSW steel plant, district of Bellary. The tests on granulated blast furnace slag were
carried out as per IS: 383-1970. Slag sand was of Zone I. Fineness Modulus=2.512.
Coarse aggregates: The coarse aggregate used is crushed (angular) aggregate conforming to
IS 383: 1970. The maximum size of aggregate considered is 20mm IS sieve passing and
minimum size of aggregate considered is 12.5mm IS sieve passing. The results of sieve
analysis conducted as per the specification of IS: 383-1970. Fineness Modulus = 5.82
Water: Clean potable water is used for Mixing and Curing operation for the work. The Water
supplied in the campus is of the potable standard of PH value 7 is used.
Super plasticizer: To improve the workability of fresh concrete sulphonated naphthalene
based super plasticizer i.e., Conplast SP 430 was used supplied by FOSROC chemicals, 1.4%
(max 2%) dosages was used to increase the workability of concrete.
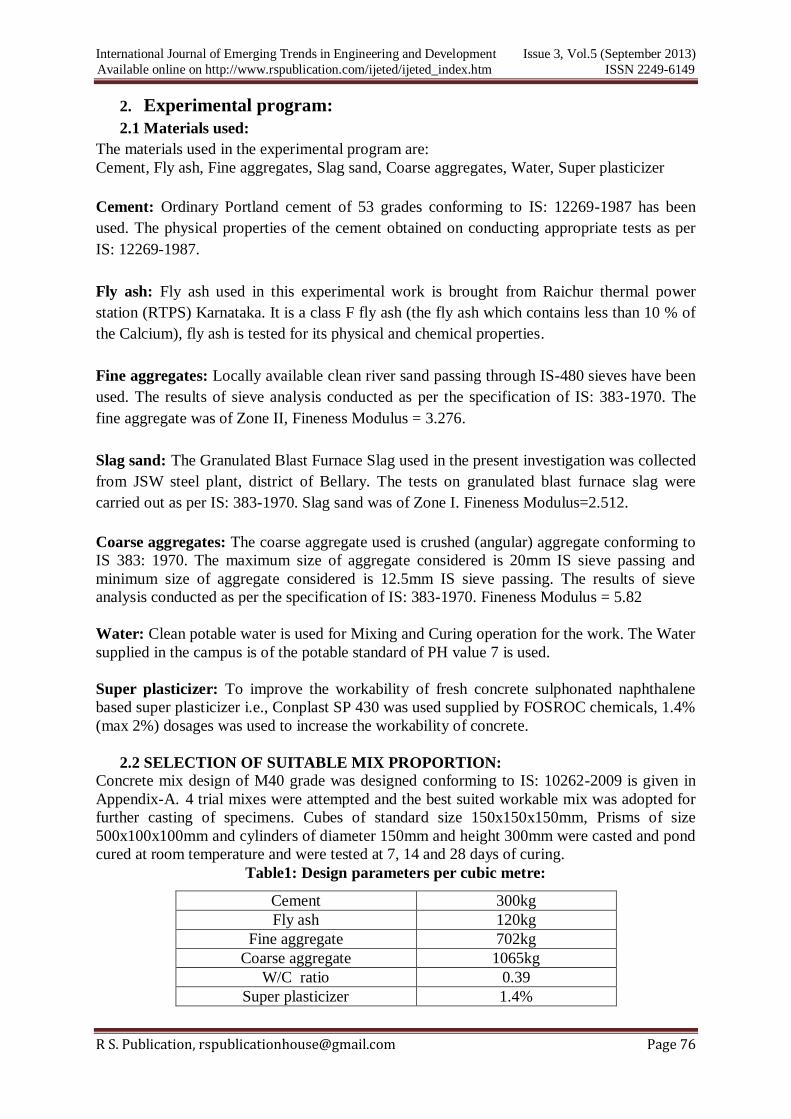
2.2 SELECTION OF SUITABLE MIX PROPORTION:
Concrete mix design of M40 grade was designed conforming to IS: 10262-2009 is given in
Appendix-A. 4 trial mixes were attempted and the best suited workable mix was adopted for
further casting of specimens. Cubes of standard size 150x150x150mm, Prisms of size
500x100x100mm and cylinders of diameter 150mm and height 300mm were casted and pond
cured at room temperature and were tested at 7, 14 and 28 days of curing.
Table1: Design parameters per cubic metre:
Cement 300kg
Fly ash 120kg
Fine aggregate 702kg
Coarse aggregate 1065kg
W/C ratio 0.39
Super plasticizer 1.4%

International Journal of Emerging Trends in Engineering and Development Issue 3, Vol.5 (September 2013)
Available online on http://www.rspublication.com/ijeted/ijeted_index.htm ISSN 2249-6149
R S. Publication, [email protected] Page 77
2.3 PROPERTIES OF FRESH CONCRETE:
Concrete mixes were checked for workability through slump test. Adequate workability or
slump value of control mix achieved decreased as the percentage of slag sand increased. The
slump values obtained for different percentages of slag sand mixes are tabulated below.
Table 2: Slump values
Mix Designation Slump in mm
CM 140
SS-10% 136
SS-20% 130
SS-30% 124
SS-40% 120
SS-50% 110
Fig1: Slump values for various proportion Fig 2: Slump test on Fresh Concrete
2.4 COMPRESSIVE STRENGTH:
Compressive strength test is carried out on the various mixes by varying percentage of slag
sand and keeping all other parameters as constant. The main objective of conducting the tests
on various mixes is to find out the most suitable mix of having higher compressive strength
with better workability. For each mix 9 cube specimens were cast in moulds. After 7, 14 and
28 days of curing the cubes were removed from the curing tank, weighed and tested for
compressive strength in a 2000 KN compression testing machine according to IS: 516-1959.
The cast face parallel to the axis of loading at the rate of 14N/mm2/minute as per IS: 516. 3
cubes were tested at 7 days, 3 cubes were tested at 14 days and the remaining 3 cubes were
tested at 28 days of curing. Each compressive strength result is the average of 3 test results
the experimental compressive strength was obtained by dividing the maximum load applied
on the specimen during the test by its cross sectional area.
Mix designation
Avg compressive
strength(N/mm2compressive
strength(N/mm2)
CM 48.83
SS-10 46.51
SS-20 45.05
SS-30 40.84
SS-40 41.71
SS-50 40.11
0
50
100
150
0 10 20 30 40 50
Slu
mp
val
ue
in m
m
Slag sand content in %
International Journal of Emerging Trends in Engineering and Development Issue 3, Vol.5 (September 2013)
Available online on http://www.rspublication.com/ijeted/ijeted_index.htm ISSN 2249-6149
R S. Publication, [email protected] Page 78
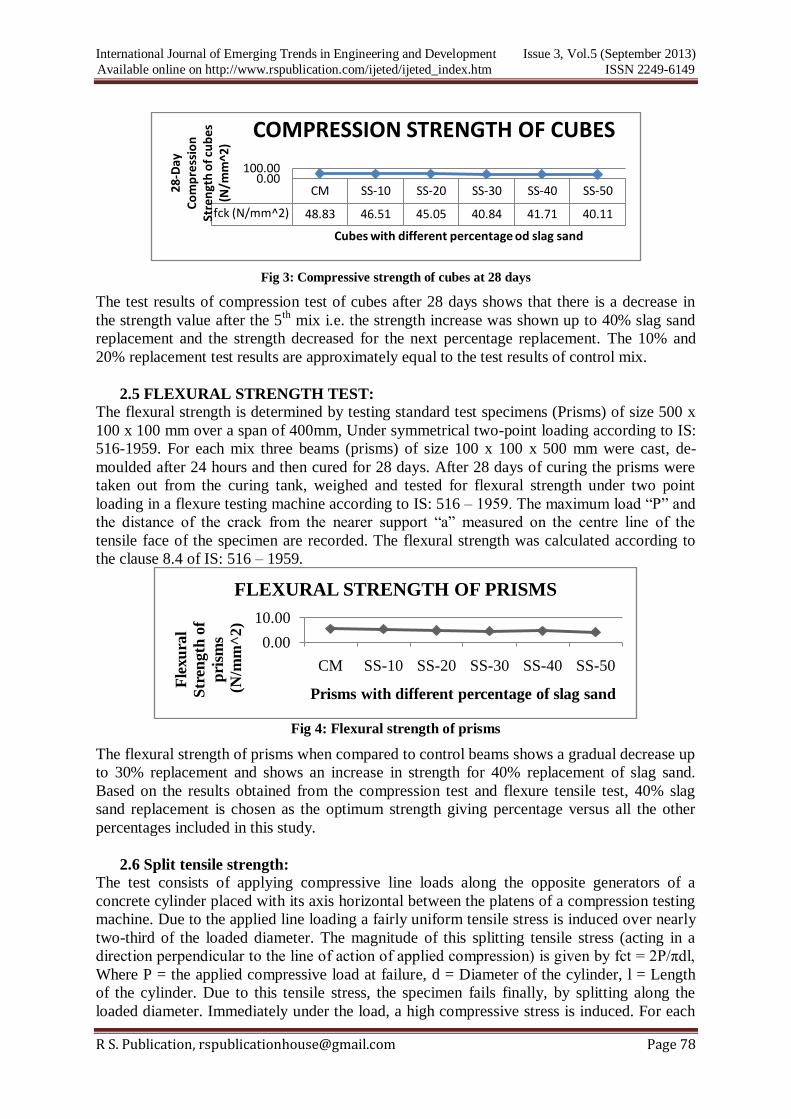
Fig 3: Compressive strength of cubes at 28 days
The test results of compression test of cubes after 28 days shows that there is a decrease in
the strength value after the 5th
mix i.e. the strength increase was shown up to 40% slag sand
replacement and the strength decreased for the next percentage replacement. The 10% and
20% replacement test results are approximately equal to the test results of control mix.
2.5 FLEXURAL STRENGTH TEST:
The flexural strength is determined by testing standard test specimens (Prisms) of size 500 x
100 x 100 mm over a span of 400mm, Under symmetrical two-point loading according to IS:
516-1959. For each mix three beams (prisms) of size 100 x 100 x 500 mm were cast, de-
moulded after 24 hours and then cured for 28 days. After 28 days of curing the prisms were
taken out from the curing tank, weighed and tested for flexural strength under two point
loading in a flexure testing machine according to IS: 516 – 1959. The maximum load “P” and
the distance of the crack from the nearer support “a” measured on the centre line of the
tensile face of the specimen are recorded. The flexural strength was calculated according to
the clause 8.4 of IS: 516 – 1959.
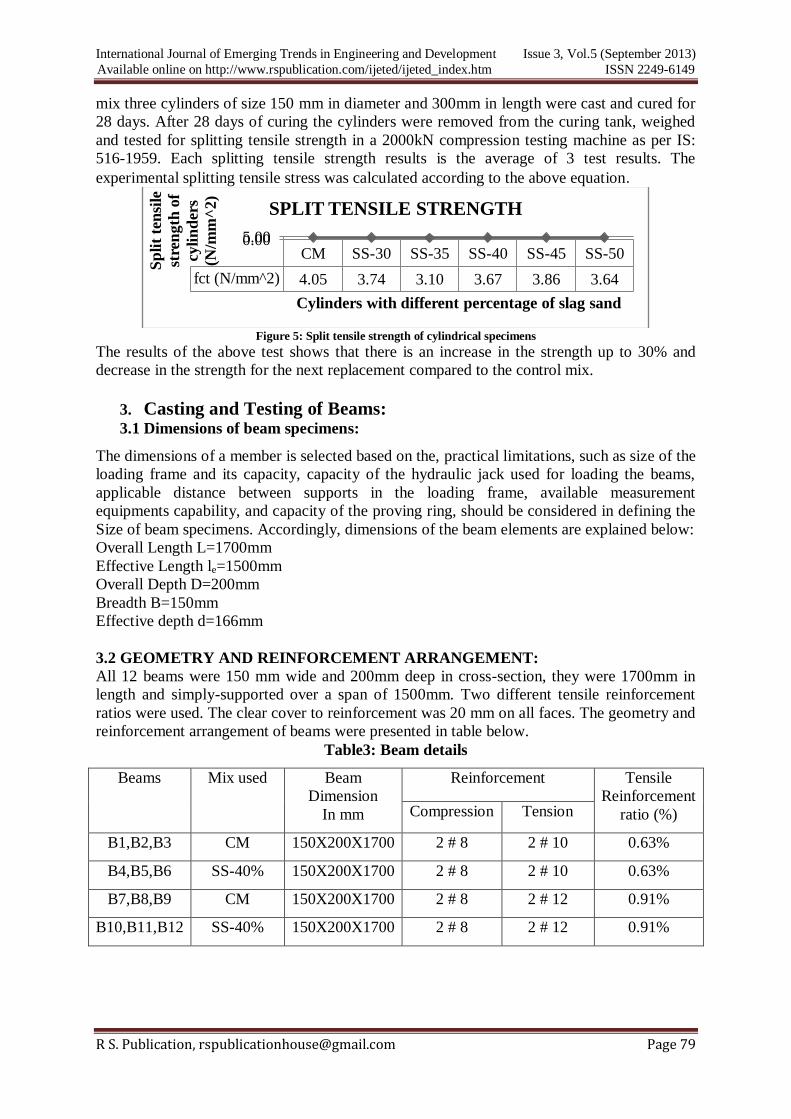
Fig 4: Flexural strength of prisms
The flexural strength of prisms when compared to control beams shows a gradual decrease up
to 30% replacement and shows an increase in strength for 40% replacement of slag sand.
Based on the results obtained from the compression test and flexure tensile test, 40% slag
sand replacement is chosen as the optimum strength giving percentage versus all the other
percentages included in this study.
2.6 Split tensile strength: The test consists of applying compressive line loads along the opposite generators of a
concrete cylinder placed with its axis horizontal between the platens of a compression testing
machine. Due to the applied line loading a fairly uniform tensile stress is induced over nearly
two-third of the loaded diameter. The magnitude of this splitting tensile stress (acting in a
direction perpendicular to the line of action of applied compression) is given by fct = 2P/πdl,
Where P = the applied compressive load at failure, d = Diameter of the cylinder, l = Length
of the cylinder. Due to this tensile stress, the specimen fails finally, by splitting along the
loaded diameter. Immediately under the load, a high compressive stress is induced. For each
CM SS-10 SS-20 SS-30 SS-40 SS-50
fck (N/mm^2) 48.83 46.51 45.05 40.84 41.71 40.11
0.00100.00
28-D
ay
Co
mp
ress
ion
St
ren
gth
of
cub
es
(N/m
m^2
)Cubes with different percentage od slag sand
COMPRESSION STRENGTH OF CUBES
0.00
10.00
CM SS-10 SS-20 SS-30 SS-40 SS-50
Fle
xu
ral
Str
ength
of
pri
sms
(N/m
m^
2)
Prisms with different percentage of slag sand
FLEXURAL STRENGTH OF PRISMS
International Journal of Emerging Trends in Engineering and Development Issue 3, Vol.5 (September 2013)
Available online on http://www.rspublication.com/ijeted/ijeted_index.htm ISSN 2249-6149
R S. Publication, [email protected] Page 79
mix three cylinders of size 150 mm in diameter and 300mm in length were cast and cured for
28 days. After 28 days of curing the cylinders were removed from the curing tank, weighed
and tested for splitting tensile strength in a 2000kN compression testing machine as per IS:
516-1959. Each splitting tensile strength results is the average of 3 test results. The
experimental splitting tensile stress was calculated according to the above equation.
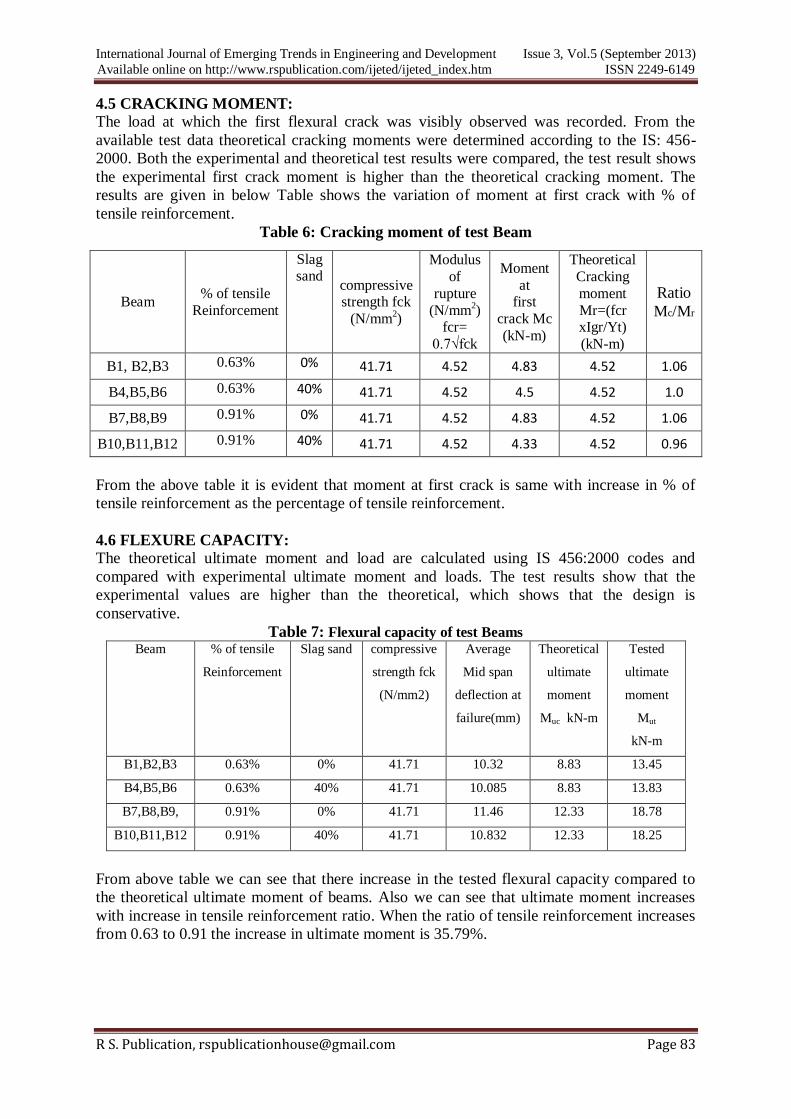
Figure 5: Split tensile strength of cylindrical specimens
The results of the above test shows that there is an increase in the strength up to 30% and
decrease in the strength for the next replacement compared to the control mix.
3. Casting and Testing of Beams: 3.1 Dimensions of beam specimens:
The dimensions of a member is selected based on the, practical limitations, such as size of the
loading frame and its capacity, capacity of the hydraulic jack used for loading the beams,
applicable distance between supports in the loading frame, available measurement
equipments capability, and capacity of the proving ring, should be considered in defining the
Size of beam specimens. Accordingly, dimensions of the beam elements are explained below:
Overall Length L=1700mm
Effective Length le=1500mm
Overall Depth D=200mm
Breadth B=150mm
Effective depth d=166mm
3.2 GEOMETRY AND REINFORCEMENT ARRANGEMENT:
All 12 beams were 150 mm wide and 200mm deep in cross-section, they were 1700mm in
length and simply-supported over a span of 1500mm. Two different tensile reinforcement
ratios were used. The clear cover to reinforcement was 20 mm on all faces. The geometry and
reinforcement arrangement of beams were presented in table below.
Table3: Beam details
Beams Mix used
Beam
Dimension
In mm
Reinforcement Tensile
Reinforcement
ratio (%) Compression Tension
B1,B2,B3 CM 150X200X1700 2 # 8 2 # 10 0.63%
B4,B5,B6 SS-40% 150X200X1700 2 # 8 2 # 10 0.63%
B7,B8,B9 CM 150X200X1700 2 # 8 2 # 12 0.91%
B10,B11,B12 SS-40% 150X200X1700 2 # 8 2 # 12 0.91%
CM SS-30 SS-35 SS-40 SS-45 SS-50
fct (N/mm^2) 4.05 3.74 3.10 3.67 3.86 3.64
0.005.00
Sp
lit
ten
sile
stre
ngth
of
cyli
nd
ers
(N/m
m^
2)
Cylinders with different percentage of slag sand
SPLIT TENSILE STRENGTH

International Journal of Emerging Trends in Engineering and Development Issue 3, Vol.5 (September 2013)
Available online on http://www.rspublication.com/ijeted/ijeted_index.htm ISSN 2249-6149
R S. Publication, [email protected] Page 80
3.3 TEST SETUP AND INSTRUMENTATION:
All the beams are simply supported over the span 1500mm and tested by using 500 kN
capacity loading frame. All the beams were tested by two point load method, three dial gauge
of least count 0.001 mm are placed on the tension face of the beam to measure the deflection
along the length. Demec gauge with least count of 0.002 was used to measure the surface
strains, crack width was measured using the Brinnel microscope with least count of 0.01 mm.
The testing arrangement of the beam specimens are shown below.
Fig 6: Schematic diagram for flexure test on beam
3.4 TEST PROCEDURE:
Before placing the beam specimens on the loading frame, all the specimens were white
washed in order to facilitate marking of cracks. After white wash the beam specimens were
placed on the loading frame with all the arrangement shown in, load is applied in an interval
of 2kN using hydraulic jack at the same time deflection is noted down with the help of digital
dial gauges, and also Demec gauge reading is also noted. Crack load, crack width, crack
length, ultimate load is recorded also the cracking patterns are marked to study the crack
patterns of the specimens. The loading is continued until the failure of beam specimens.
Fig7: marking and test setup of beam.
4. Result and discussion:
4.1 Crack pattern:
The 12 beam specimens were failed in same mode, as the load increases the flexure cracks
initiates in the pure bending zone and the first cracks appears almost in the mid span. As the
Load increases, existing cracks propagated and new cracks developed along the span. The
Cracks at the mid-span opened widely near failure, the beams deflected significantly, thus
indicating that the tensile steel must have yielded at failure. The cracks almost found in
bending zone. The shear cracks were not observed. The cracks are almost straight and
propagating towards compression zone. The failure mode was typical of that of an under
reinforced.
Fig 8: Crack patterns

International Journal of Emerging Trends in Engineering and Development Issue 3, Vol.5 (September 2013)
Available online on http://www.rspublication.com/ijeted/ijeted_index.htm ISSN 2249-6149
R S. Publication, [email protected] Page 81
4.2 DEFLECTIONS: Totally 6 control beams and 6 slag sand specimens were casted and tested for flexure the
specimens are designated as B1, B2, B3, B4, B5, B6,B7,B8,B9,B10,B11 and B12, three dial
gauges were used to measure the deflections at 1/3rd span, mid span and at 1/6th span.
Demec gauge were used to measure the top and bottom strain at mid span. The deflections
were recorded up to failure load and compared with test values. The Load versus mid-span
deflection curves of the test beams are presented below.
Fig 9: Load v/s mid span deflections of control beams –B1, B2, B3 and B4, B5, B6
Fig 10: Load v/s mid span deflections of control beams –B7, B8, B9 and B10, B11, B12
4.3 EXPERIMENTAL RESULTS:
All the reinforced concrete beam specimens were tested in a 500 KN capacity loading frame.
As the load is increased the beam starts to deflect. Typical cracking, service and ultimate load
to which the beam is subjected and the deflection at those load value is also recorded.
pcr = load at 1st crack, δcr = deflection at 1
st crack, Wcr= width of 1
st crack, Ps= service load
δs= deflection at service load, Ws= crack width of service load, Pu= ultimate load
δu=deflection at ultimate load, Wu= crack width of ultimate load
Here, two categories of beams are been compared by the results obtained from the flexural
test. In the first category control beam and 40% slag sand beam with 10mm diameter
longitudinal bars as tension reinforcements are compared and in the second category beams
with 12mm diameter tension reinforcements are compared. The comparison shows that there
is a slight increase in the strength of later beam in the first category by 2.8%. Similarly in
second category the later beam shows about 1.3% increase in the strength compared to the
later one.
0
10
20
30
40
50
60
70
0 10 20
Load
in
kN
Deflection at mid span in mm
BEAM 1
BEAM 2
BEAM 3 0
10
20
30
40
50
60
0 5 10 15
Load
in
kN
Deflection at mid span in mm
BEAM-4
BEAM-5
BBEAM-6
0
50
100
0 10 20
Load
in
kN
Deflection at mid span in mm
BEAM-7
BEAM-8
BEAM-90
50
100
0 5 10 15
Load
in
kN
Deflection at mid span in mm
BEAM-10
BEAM-11
BEAM-12

International Journal of Emerging Trends in Engineering and Development Issue 3, Vol.5 (September 2013)
Available online on http://www.rspublication.com/ijeted/ijeted_index.htm ISSN 2249-6149
R S. Publication, [email protected] Page 82
Table 4: Experimental values of cracking, service and ultimate load with deflections
4.4 SURFACE STRAIN:
Surface strains were measured using demec gauges. The strains were measured at every 2 KN
load increments and are tabulated below.
Table 5: Surface strains at service load of RC beams
Beam
designation
% of tensile
Reinforcement
Slag
sand
Working
Load
(KN)
Surface Strain
Compression Tension
B-1 0.63% 0% 40 -0.000083 0.000105
B-2 0.63% 0% 34 -0.00012 0.000255
B-3 0.63% 0% 34 -0.00012 0.000187
B-4 0.63% 40% 36 -0.00015 0.000125
B-5 0.63% 40% 38 -0.0002 0.000249
B-6 0.63% 40% 38 -0.00019 0.000285
B-7 0.91% 0% 50 -0.00021 0.000233
B-8 0.91% 0% 52 -0.00019 0.000236
B-9 0.91% 0% 48 -0.00017 0.000233
B-10 0.91% 40% 42 -0.0002 0.000212
B-11 0.91% 40% 54 -0.00023 0.000235
B-12 0.91% 40% 52 -0.00017 0.000254
Beam
number
Ast
%
Slag
sang
Experiment values
Pcr
(kN) δcr
Wcr
mm
Ps
(kN) δs
Ws
mm
Pu
(kN)
δu
mm
Wu
mm
B-1 0.63% 0% 20 1.071 0.03 40 3.596 1 60.5 9.560 1.6
B-2 0.63% 0% 18 1.235 0.04 34 3.393 0.9 50.5 9.420 1.5
B-3 0.63% 0% 20 1.365 0.03 34 3.370 1.3 50.5 11.990 2.5
B-4 0.63% 40% 20 1.455 0.05 36 3.930 0.9 52.5 9.980 1.5
B-5 0.63% 40% 16 0.970 0.04 38 4.015 1.4 56.5 10.35 2.5
B-6 0.63% 40% 18 1.210 0.04 38 3.990 1.1 57 10.240 2.2
B-7 0.91% 0% 20 1.010 0.05 50 4.1 1.3 75.5 13.040 2.5
B-8 0.91% 0% 20 1.150 0.04 52 4.2 1.4 78.5 11.195 2.5
B-9 0.91% 0% 18 0.935 0.03 48 3.950 1.2 71.3 10.131 2.5
B-10 0.91% 40% 16 1.239 0.04 42 4.195 1.1 63 10.290 2.2
B-11 0.91% 40% 18 1.007 0.05 54 4.462 1.3 79 11.675 2.3
B-12 0.91% 40% 18 0.708 0.04 52 3.683 1 77 10.531 2.2
International Journal of Emerging Trends in Engineering and Development Issue 3, Vol.5 (September 2013)
Available online on http://www.rspublication.com/ijeted/ijeted_index.htm ISSN 2249-6149
R S. Publication, [email protected] Page 83
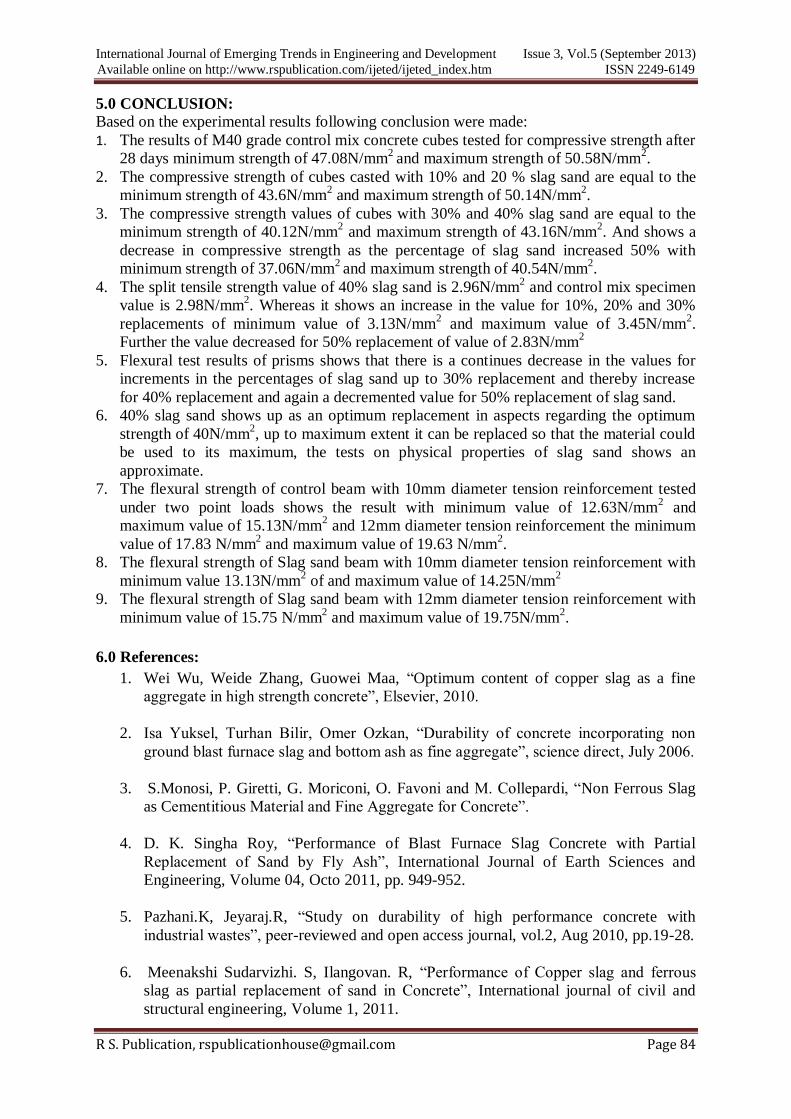
4.5 CRACKING MOMENT:
The load at which the first flexural crack was visibly observed was recorded. From the
available test data theoretical cracking moments were determined according to the IS: 456-
2000. Both the experimental and theoretical test results were compared, the test result shows
the experimental first crack moment is higher than the theoretical cracking moment. The
results are given in below Table shows the variation of moment at first crack with % of
tensile reinforcement.
Table 6: Cracking moment of test Beam
Beam % of tensile
Reinforcement
Slag sand
compressive strength fck
(N/mm2)
Modulus
of
rupture
(N/mm2)
fcr=
0.7√fck
Moment
at first
crack Mc
(kN-m)
Theoretical
Cracking
moment
Mr=(fcr xIgr/Yt)
(kN-m)
Ratio
Mc/Mr
B1, B2,B3 0.63% 0% 41.71 4.52 4.83 4.52 1.06
B4,B5,B6 0.63% 40% 41.71 4.52 4.5 4.52 1.0
B7,B8,B9 0.91% 0% 41.71 4.52 4.83 4.52 1.06
B10,B11,B12 0.91% 40% 41.71 4.52 4.33 4.52 0.96
From the above table it is evident that moment at first crack is same with increase in % of
tensile reinforcement as the percentage of tensile reinforcement.
4.6 FLEXURE CAPACITY:
The theoretical ultimate moment and load are calculated using IS 456:2000 codes and
compared with experimental ultimate moment and loads. The test results show that the
experimental values are higher than the theoretical, which shows that the design is
conservative.
Table 7: Flexural capacity of test Beams Beam % of tensile
Reinforcement
Slag sand compressive
strength fck
(N/mm2)
Average
Mid span
deflection at
failure(mm)
Theoretical
ultimate
moment
Muc kN-m
Tested
ultimate
moment
Mut
kN-m
B1,B2,B3 0.63% 0% 41.71 10.32 8.83 13.45
B4,B5,B6 0.63% 40% 41.71 10.085 8.83 13.83
B7,B8,B9, 0.91% 0% 41.71 11.46 12.33 18.78
B10,B11,B12 0.91% 40% 41.71 10.832 12.33 18.25
From above table we can see that there increase in the tested flexural capacity compared to
the theoretical ultimate moment of beams. Also we can see that ultimate moment increases
with increase in tensile reinforcement ratio. When the ratio of tensile reinforcement increases
from 0.63 to 0.91 the increase in ultimate moment is 35.79%.
International Journal of Emerging Trends in Engineering and Development Issue 3, Vol.5 (September 2013)
Available online on http://www.rspublication.com/ijeted/ijeted_index.htm ISSN 2249-6149
R S. Publication, [email protected] Page 84
5.0 CONCLUSION:
Based on the experimental results following conclusion were made:
1. The results of M40 grade control mix concrete cubes tested for compressive strength after
28 days minimum strength of 47.08N/mm2
and maximum strength of 50.58N/mm2.
2. The compressive strength of cubes casted with 10% and 20 % slag sand are equal to the
minimum strength of 43.6N/mm2 and maximum strength of 50.14N/mm
2.
3. The compressive strength values of cubes with 30% and 40% slag sand are equal to the
minimum strength of 40.12N/mm2 and maximum strength of 43.16N/mm
2. And shows a
decrease in compressive strength as the percentage of slag sand increased 50% with
minimum strength of 37.06N/mm2 and maximum strength of 40.54N/mm
2.
4. The split tensile strength value of 40% slag sand is 2.96N/mm2 and control mix specimen
value is 2.98N/mm2. Whereas it shows an increase in the value for 10%, 20% and 30%
replacements of minimum value of 3.13N/mm2 and maximum value of 3.45N/mm
2.
Further the value decreased for 50% replacement of value of 2.83N/mm2
5. Flexural test results of prisms shows that there is a continues decrease in the values for
increments in the percentages of slag sand up to 30% replacement and thereby increase
for 40% replacement and again a decremented value for 50% replacement of slag sand.
6. 40% slag sand shows up as an optimum replacement in aspects regarding the optimum
strength of 40N/mm2, up to maximum extent it can be replaced so that the material could
be used to its maximum, the tests on physical properties of slag sand shows an
approximate.
7. The flexural strength of control beam with 10mm diameter tension reinforcement tested
under two point loads shows the result with minimum value of 12.63N/mm2 and
maximum value of 15.13N/mm2 and 12mm diameter tension reinforcement the minimum
value of 17.83 N/mm2 and maximum value of 19.63 N/mm
2.
8. The flexural strength of Slag sand beam with 10mm diameter tension reinforcement with
minimum value 13.13N/mm2 of and maximum value of 14.25N/mm
2
9. The flexural strength of Slag sand beam with 12mm diameter tension reinforcement with
minimum value of 15.75 N/mm2 and maximum value of 19.75N/mm
2.
6.0 References:
1. Wei Wu, Weide Zhang, Guowei Maa, “Optimum content of copper slag as a fine
aggregate in high strength concrete”, Elsevier, 2010.
2. Isa Yuksel, Turhan Bilir, Omer Ozkan, “Durability of concrete incorporating non
ground blast furnace slag and bottom ash as fine aggregate”, science direct, July 2006.
3. S.Monosi, P. Giretti, G. Moriconi, O. Favoni and M. Collepardi, “Non Ferrous Slag
as Cementitious Material and Fine Aggregate for Concrete”.
4. D. K. Singha Roy, “Performance of Blast Furnace Slag Concrete with Partial
Replacement of Sand by Fly Ash”, International Journal of Earth Sciences and
Engineering, Volume 04, Octo 2011, pp. 949-952.
5. Pazhani.K, Jeyaraj.R, “Study on durability of high performance concrete with
industrial wastes”, peer-reviewed and open access journal, vol.2, Aug 2010, pp.19-28.
6. Meenakshi Sudarvizhi. S, Ilangovan. R, “Performance of Copper slag and ferrous
slag as partial replacement of sand in Concrete”, International journal of civil and
structural engineering, Volume 1, 2011.
International Journal of Emerging Trends in Engineering and Development Issue 3, Vol.5 (September 2013)
Available online on http://www.rspublication.com/ijeted/ijeted_index.htm ISSN 2249-6149
R S. Publication, [email protected] Page 85
7. Mohammed nadeem, arun D. Pofale, “Experimental investigation of using slag as an
alternative to normal Aggregates (coarse and fine) in concrete”, International journal
of civil and structural engineering, Volume 3, 2012.
8. L. Zeghichi, “The effect of replacement of naturals Aggregates by slag products on
the strength of Concrete”, Asian journal of civil engineering vol. 7, (2006), Pages 27 -
35.
9. M. Shariq, J. Prasad and A.K. Ahuja, “Strength development of cement mortar and
Concrete incorporating ggbfs”, Asian journal of civil engineering, VOL. 9, (2008), pp
61-74.
10. Singh, S.P. and Murmu, M. “Eco-friendly concrete using by-products of Steel
industry”.
11. Suresh Chandra Pattanaik , Dr. Akshaya Kumar Sabat, “A study of nalco fly ash on
compressive strength For effective use in high volume mass concrete for A
sustainable development”, 2010.
12. Li Yijin, Zhou Shiqiong, Yin Jian, and Gao Yingli, “The effect of fly ash on the
fluidity of Cement paste, mortar, and concrete”.
Codal references 1. IS 456-2000, Indian Standard, Plain and reinforced concrete – code of practice.
2. SP 16 Design aids for reinforced concrete.
3. IS 516- 1959, (reaffirmed-1999) Indian Standard, Methods of tests for strength of
concrete.
4. IS 2386 Part III-1963, Indian Standard, Methods of tests for aggregates for concrete.
5. IS 383 -1970, Indian Standard, Specification for coarse and fine aggregates from
natural sources for concrete.