Institute for Housing and Urban Development Studies ...
89
MSc Programme in Urban Management and Development Rotterdam, The Netherlands September 2013 Thesis EARMARKED CONTRIBUTIONS FROM CAPTURED LAND VALUE What do they do for social housing? Sarah Redoblado Supervisor: Carlos Morales-Schechinger UMD 9
-
Upload
khangminh22 -
Category
Documents
-
view
4 -
download
0
Transcript of Institute for Housing and Urban Development Studies ...

MSc Programme in Urban Management and Development
Rotterdam, The Netherlands
September 2013
Thesis
EARMARKED CONTRIBUTIONS FROM CAPTURED LAND VALUE
What do they do for social housing?
Sarah Redoblado
Supervisor: Carlos Morales-Schechinger
UMD 9

EARMARKED CONTRIBUTIONS FROM CAPTURED LAND VALUE ii
MASTER’S PROGRAMME IN URBAN MANAGEMENT AND DEVELOPMENT
(October 2012 – September 2013)
EARMARKED CONTRIBUTIONS FROM CAPTURED LAND VALUE
What do they do for social housing?
Sarah Redoblado
Philippines
Supervisor: Carlos Morales Schechinger
UMD 9 Report number:
Rotterdam, September 2013
EARMARKED CONTRIBUTIONS FROM CAPTURED LAND VALUE iii
Summary
The Urban Development and Housing Act (UDHA) of the Philippines incorporates three land
value capture instruments that may be earmarked by local governments for delivery of
housing services. These are the idle lands tax, the socialized housing tax, and the balanced
housing requirement for developers.
More than 20 years after UDHA’s enactment in 1992, and with at least 18% of the country’s
population needing new or upgraded housing, a wider use of the instruments might be
expected. As of 2010, only eight of 121 cities and five of 80 provinces have imposed the idle
lands tax. To date, Quezon City is the only local government with the socialized housing tax.
Balanced housing is technically being implemented by national government for most local
governments.
The opportunities offered by the resource-mobilizing instruments could be lost in local
governments’ unwillingness to impose new contributions, and unfamiliarity with their
implementation. This thesis seeks to contribute to an understanding of these policies by
documenting the implementation of the three instruments and their impact on social housing
in Quezon City.
The three land value capture instruments are examined in this study according to the concepts
of equity, efficiency and effectiveness. Equity is taken up as the concept of assessment
equity, which is the measure of how well the tax system is administered in terms of assessed
values (Plimmer, McCluskey and Conellan, 2000). Assessment equity has horizontal and
vertical dimensions where uniformity of manner of assessment within and among the
different classes of properties and taxpayers is seen as a key indicator of the fairness of the
tax system.
The coefficient of dispersion (COD) is used as the indicator for horizontal equity in this
study, while the price related differential (PRD) is used to indicate vertical equity. Sales data
for vacant residential lands are used to derive COD and PRD.
Efficiency is examined using the factors in the tax revenue identity (Walters, 2011), namely,
Base, Rate, Coverage, Valuation, and Collection. Taken together, the components indicate
how much land value that could be captured is actually being captured.
In this study, Base and Rate are defined by the policies governing the implementation of the
idle lands and socialized housing taxes, and the balanced housing policy in Quezon City.
Coverage, Valuation and Collection are the administrative components quantified by the data
found on the proportion of properties in the tax rolls, the proportion of identified taxable
value, and the proportion of collections to total tax dues.
Effectiveness is defined as the success of resources in achieving the objectives set for their
utilization (Mandl et al, 2008). As contributions earmarked for housing the poor, the idle
lands tax, socialized housing tax, and balanced housing are analyzed by the information
gathered on the quantity and quality of housing delivered to the intended market.
The findings of this study indicate that the land taxes in Quezon City are outside the
acceptable standard for assessment equity, horizontally or vertically, with the taxes tending to
EARMARKED CONTRIBUTIONS FROM CAPTURED LAND VALUE iv
be regressive. The balanced housing guidelines are inherently inequitable, being non-uniform
in the calculation of values for compliance.
The instruments are also at a low level of efficiency, with the factors of Rate, Valuation and
Collection found to be the limiting factors. For balanced housing, the level of efficiency is
not quantifiable in the period of study as Rate and Valuation are variable, and Collection is
unknown.
The idle lands and socialized housing taxes have so far not resulted in dramatic change in
quantities of housing production. However, if the committed and pipeline projects funded by
the earmarked taxes proceed as planned, the number of units produced will be higher per
year. The city will also be utilizing more of its locally generated funds in land purchase and
land development, rather than merely providing assistance for beneficiaries to access
nationally operated financing programs. On the other hand, the responsibility for
effectiveness of the balanced housing policy remains borne by national government agencies
and cannot be accounted at the city government level.
Over-all, the three land value capture instruments present deficiencies in the areas of equity,
efficiency and effectiveness. However, the findings also present opportunities for how those
areas can be improved, and the findings do not as yet detect negative effects on social
housing delivery or its intended beneficiaries. When local governments can make the political
decision to implement the land value capture instruments and at the same time address the
identified areas for improvement, then the idle lands tax, socialized housing tax, and balanced
housing policy may start to be seen as appropriately earmarked for social housing.
Keywords
Land value capture, earmarking, idle lands tax, socialized housing tax, balanced housing

EARMARKED CONTRIBUTIONS FROM CAPTURED LAND VALUE v
Acknowledgments

EARMARKED CONTRIBUTIONS FROM CAPTURED LAND VALUE vi
Abbreviations
AV Assessed values
BLGF Bureau of Local Government Finance
CMP Community Mortgage Program
COD Coefficient of dispersion
CPDO City Planning and Development Office
DOF Department of Finance
HCDRD Housing, Community Development and Resettlement Department
HDMF Home Development Mutual Fund
HH Households
HLURB Housing and Land Use Regulatory Board
HUDCC Housing and Urban Development Coordinating Council
IAAO International Association of Assessing Officers
IRR Implementing Rules and Regulations
LGC Local Government Code
LHB Local Housing Board
MV Market values
NHA National Housing Authority
NSCB National Statistical Coordinating Board
NSO National Statistics Office
PRD Price related differential
QC Quezon City
QC-ITDO Quezon City – Information Technology Development Office
SAU Subdivision Administration Unit
SHFC Social Housing Finance Corporation
UDHA Urban Development and Housing Act

EARMARKED CONTRIBUTIONS FROM CAPTURED LAND VALUE vii
Table of Contents
Summary iii
Acknowledgments v
Abbreviations
vi
List of Tables ix
List of Figures
ix
Chapter 1: Introduction
1.1. Background
1.1.1. Property-related mechanisms in local government funding
1.1.2. The case of the Philippines’ Urban Development and Housing Act and
its implementation in Quezon City
1.2. Problem Statement
1.3. Research Objective
1.4. Provisional Research Questions
1.5. Significance of the Study
1.6. Scope and Limitations
10
10
10
10
13
14
14
15
15
Chapter 2: Literature Review
2.1. State of the Art of the Theories of the Study
2.1.1. Some concepts in land value capture
2.1.1.1. Land value capture
2.1.1.2. Land and property taxes and fees
2.1.1.3. Tax on vacant or idle lands
2.1.1.4. Betterment tax and tax increment financing
2.1.1.5. Inclusionary housing and fees-in-lieu
2.1.1.6. Earmarking
2.1.2. Selected criteria for analysis
2.1.2.1. Equity
2.1.2.2. Efficiency
2.1.2.3. Effectiveness
2.1.3. Summary
2.2. Conceptual Framework
17
17
17
17
17
18
18
20
21
21
21
22
24
25
26
Chapter 3: Research Design and Methods
3.1. Revised Research Questions
3.2. Operationalization: Variables, Indicators
3.3. Data Sources and Collection Methods
3.4. Validity and Reliability
3.5. Data Analysis Methods
28
28
28
35
37
37
Chapter 4: Research Findings
4.1. The Institutional Context of the Case Study
4.1.1. Policies governing the implementation of the idle lands tax, socialized
housing tax, and balanced housing in Quezon City
4.1.2. Organizational mechanisms for implementation
4.1.3. Taxable land values in Quezon City
4.2. The Idle Lands Tax, the Socialized Housing Tax, and Balanced Housing as
40
40
40
41
42
44

EARMARKED CONTRIBUTIONS FROM CAPTURED LAND VALUE viii
Instruments for Land Value Capture
4.2.1. The idle lands tax
4.2.2. The socialized housing tax
4.2.3. Balanced housing
4.3. Indicators of Equity
4.3.1. Description of dataset
4.3.2. Horizontal equity for the idle lands and socialized housing taxes
4.3.3. Vertical equity for the idle lands and socialized housing taxes
4.3.4. Assessment equity for balanced housing
4.3.5. Perceived issues in achieving equity
4.4. Indicators of Efficiency
4.4.1. Base
4.4.2. Rate
4.4.3. Coverage
4.4.4. Valuation
4.4.5. Collection
4.4.6. Levels of efficiency for the idle lands and socialized housing taxes
4.4.7. Efficiency indicators for balanced housing
4.4.8. Perceived issues in achieving efficiency
4.5. Indicators of Effectiveness
4.5.1. Services and budget provided by the city government in the delivery
of socialized housing
4.5.2. Number of units, location and amenities provided for socialized
housing
4.5.3. Perceived issues in achieving effectiveness
44
45
46
46
46
47
49
49
50
50
50
51
51
52
53
54
55
56
57
57
59
60
Chapter 5: Conclusion and Recommendations
5.1. Key Findings on the Idle Lands Tax
5.2. Key Findings on the Socialized Housing Tax
5.3. Key Findings on the Balanced Housing Policy
5.4. Conclusions
5.5. Recommendations
62
62
62
63
64
65
Bibliography
Annex 1: Interview Guides
Annex 2: Cases Processed for COD and PRD
68
74
79
EARMARKED CONTRIBUTIONS FROM CAPTURED LAND VALUE ix
List of Figures
Figure 1. Index Map of Quezon City 12
Figure 2. Tax Revenue Identity 23
Figure 3. Conceptual Framework 27
Figure 4. Coefficient of Dispersion (COD) 37
Figure 5. Price-Related Differential (PRD) 38
Figure 6. Rate 38
Figure 7. Coverage 38
Figure 8. Valuation 38
Figure 9. Collection 38
Figure 10. Real Property Taxes Due on Land, by Classification, as of End of 2012 43
Figure 11. Real Property Taxes Due on Residential Land, by Sub-classification, as of
June 2013
44
Figure 12. Efficiency of the Idle Lands Tax – Upper Limit 54
Figure 13. Efficiency of the Idle Lands Tax – Lower Estimate 55
Figure 14. Efficiency of the Socialized Housing Tax 55
List of Tables
Table 1. Population and Land Area 12
Table 2. Comparative Data for Housing, Calendar Year 2010 13
Table 3. Overview of Research Questions 30
Table 4. Sources of Data 35
Table 5. Standard for COD and PRD 38
Table 6. Assessment Levels 42
Table 7. Fair Market Values (Per Square Meter) by Sub-classification 43
Table 8. Summary of Cases Processed for COD and PRD 47
Table 9. COD for Sub-groups According to Source of Data 48
Table 10. COD for Sub-groups According to Assessment Values 48
Table 11. COD for Sub-groups According to Market Values 49
Table 12. PRD for Sub-groups According to Source of Data 49
Table 13. Taxes Due 51
Table 14. Effective Rates 53
Table 15. Collections and Taxes Due 54
Table 16. Per Capita Collection in 2012 54

EARMARKED CONTRIBUTIONS FROM CAPTURED LAND VALUE 10
Chapter 1: Introduction
1.1 Background
1.1.1 Property-related mechanisms in local government funding
As decentralization approaches the norm in public administration globally, local governments
have been pressured to generate increasing revenues for the services they have to provide.
One of the instruments for revenue generation most familiar to local governments is the
annual property tax. The property tax contributes significantly to the general fund of local
governments, which is allocated to various development sectors such as social services,
infrastructure, economic support services, and growing more visible lately, environmental
management.
Researchers and writers on the property tax such as Walters and De Cesare argue that there is
much room for improvement in the performance of property tax (Walters, 2011; De Cesare,
2012), and therefore in the improvement of revenues, especially in developing countries. Be
that as it may, other mechanisms that are property-related, but distinct from the property tax,
have evolved to address the apparent funding shortfall that yearly confronts local
governments.
Walters divides the array of property-related mechanisms into 1) fees and taxes and 2) nontax
value capture tools. To the first group belongs the property tax as well as development fees,
estate tax, capital gains tax, transfer tax and stamp tax, betterment tax, and land rent or lease.
In the second group are mechanisms such as developer land sale, project-related land sale,
and tax increment financing (Walters, 2012). Some of these mechanisms, like the betterment
tax, sale of development rights and tax increment financing, may be intended or ‘earmarked’
for specific purposes or infrastructure.
Earmarking is the practice of keeping separate from general revenue all revenue from a
particular tax or obligation, and using such revenue only for a specific program (Carling,
2007). Earmarking is done by law and not by executive action. Through the practice of
earmarking, popular local programs or services in sectors such as education, health and
housing are able to obtain contributions from taxpayers in addition to the basic property tax.
1.1.2 The case of the Philippines’ Urban Development and Housing Act and
its implementation in Quezon City
The practice of earmarking local government revenues for specific social services is
demonstrated in the housing sector in the Philippines. A year after decentralization was
institutionalized in 1991 by the Local Government Code (LGC), the Urban Development and
Housing Act (UDHA) created mechanisms to generate resources for the promotion of
“socialized housing”1 by local government.
1 “Socialized housing” is defined in Sec. 3r of the Urban Development and Housing Act as “housing programs
and projects covering houses and lots or homelots only undertaken by the Government or the private sector for
underprivileged and homeless citizens.” In Philippine usage, it is roughly equivalent to “affordable housing.”

EARMARKED CONTRIBUTIONS FROM CAPTURED LAND VALUE 11
Without these mechanisms, housing has to compete with equally compelling programs that
need to be financed from the local government’s general fund, which is made up of local tax
and non-tax revenues, and inter-governmental transfers.
Among the major expenditure categories (in the Philippines, these are: General public
services, Economic services, Education, Health, Debt service, Social services and welfare,
Housing, and Labor and employment), housing typically gets one of the smallest portions of
the local government budget (BLGF-DOF, 2008). Nationally, less than 2% of local
government expenditures go to housing, while for cities alone, the comparative percentage is
only slightly higher at less than 3% (BLGF-DOF, 2008).
Housing need not be limited to the general fund though because the two laws mentioned
above provide means for mobilizing additional resources purposely (earmarking) for social
housing. The LGC and the UDHA authorize local governments to employ the following:
Tax on idle lands – an additional ad valorem tax up to 5% of the assessed value of the
property in addition to the basic real property tax (LGC 1991, Sections 236-239; UDHA
1992, Section 42[e]). As a surcharge on the property tax, this tax is assessed and paid
annually by owners of land that meet the legal definition of being “idle”.
Socialized housing tax– an additional 0.5% tax on the assessed value of all lands in urban
areas in excess of PHP 50,000 (about US$ 1,960 in 1992, the year UDHA became law)
(UDHA 1992, Section 43). This tax is also assessed and paid annually with the property
tax.
Balanced housing2 – a requirement for developers of subdivision projects to develop an
area for socialized housing equivalent to at least 20% of the total subdivision area or
project cost, in the same city or municipality (UDHA 1992, Section 18). However, other
means of compliance have come to be allowed.
With property taxes firmly in the realm of local governments in the Philippines (LGC 1991,
Section 132), it is not surprising that the resource mobilization mechanisms for housing in
UDHA would be property-related. In international literature, property-related mechanisms
such as these that are employed by the government to mobilize resources for the public good
are sometimes referred to as value capture mechanisms, where “property” refers to both land
and improvements. Mechanisms that are solely based on land values are referred to as
instruments of land value capture.
But even with the mandate from national legislation dating from the early 1990s, only a
handful of cities have taken up the three above-listed mechanisms in order to improve
delivery of housing services to their constituents. As of 2010, only eight out of the country’s
121 cities3, and only five out of 80 provinces
4 were collecting idle lands tax (BLGF in
Philippines Today, 2010). Quezon City is the only city so far to have enacted a local
ordinance to implement the socialized housing tax (Quezon City, 2013k). Balanced housing
2 If implemented in the same city or municipality, as described in Section 18 of UDHA, “balanced housing” is
equivalent to the mechanism of inclusionary housing in other countries. 3 Cities in the Philippines are a tier of local government differentiated from municipalities by a) the amount of
autonomy they enjoy, especially from provincial administrative supervision, b) population and c) income. 4 Provinces and cities are the tiers of government tasked in the Local Government Code with responsibility for
housing services.
EARMARKED CONTRIBUTIONS FROM CAPTURED LAND VALUE 12
got a much earlier start, with the issuance of development permits serving as tool for
developers’ compliance with this policy.
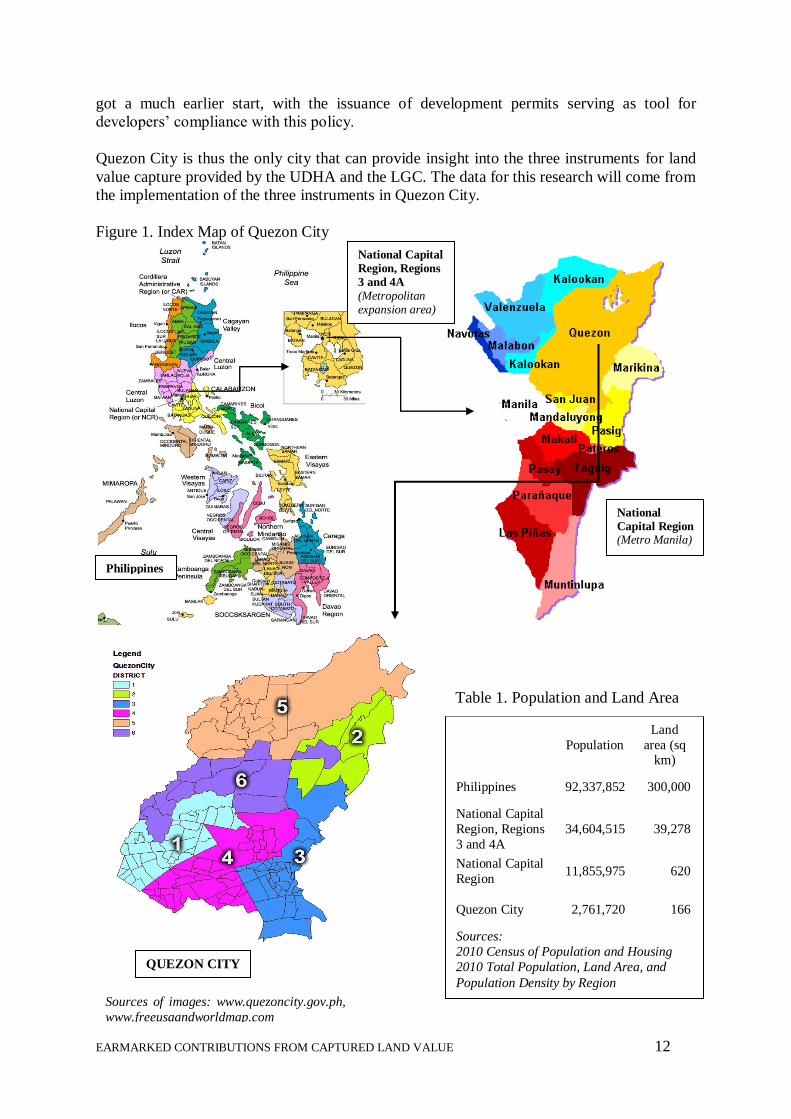
Quezon City is thus the only city that can provide insight into the three instruments for land
value capture provided by the UDHA and the LGC. The data for this research will come from
the implementation of the three instruments in Quezon City.
Figure 1. Index Map of Quezon City
National Capital
Region, Regions
3 and 4A
(Metropolitan expansion area)
Population
Land
area (sq km)
Philippines 92,337,852 300,000
National Capital
Region, Regions
3 and 4A
34,604,515 39,278
National Capital
Region 11,855,975 620
Quezon City 2,761,720 166
Sources:
2010 Census of Population and Housing
2010 Total Population, Land Area, and
Population Density by Region
Philippines
QUEZON CITY
National
Capital Region (Metro Manila)
Table 1. Population and Land Area
Sources of images: www.quezoncity.gov.ph,
www.freeusaandworldmap.com
EARMARKED CONTRIBUTIONS FROM CAPTURED LAND VALUE 13
1.2 Problem Statement
The housing need in the Philippines is not growing smaller, especially with the frequent
severe flooding experienced in recent years, which more clearly revealed the extent of
settlements in precarious situations. Responding to the housing need is a big concern for local
governments, with many unable to take action because of the huge resources required.
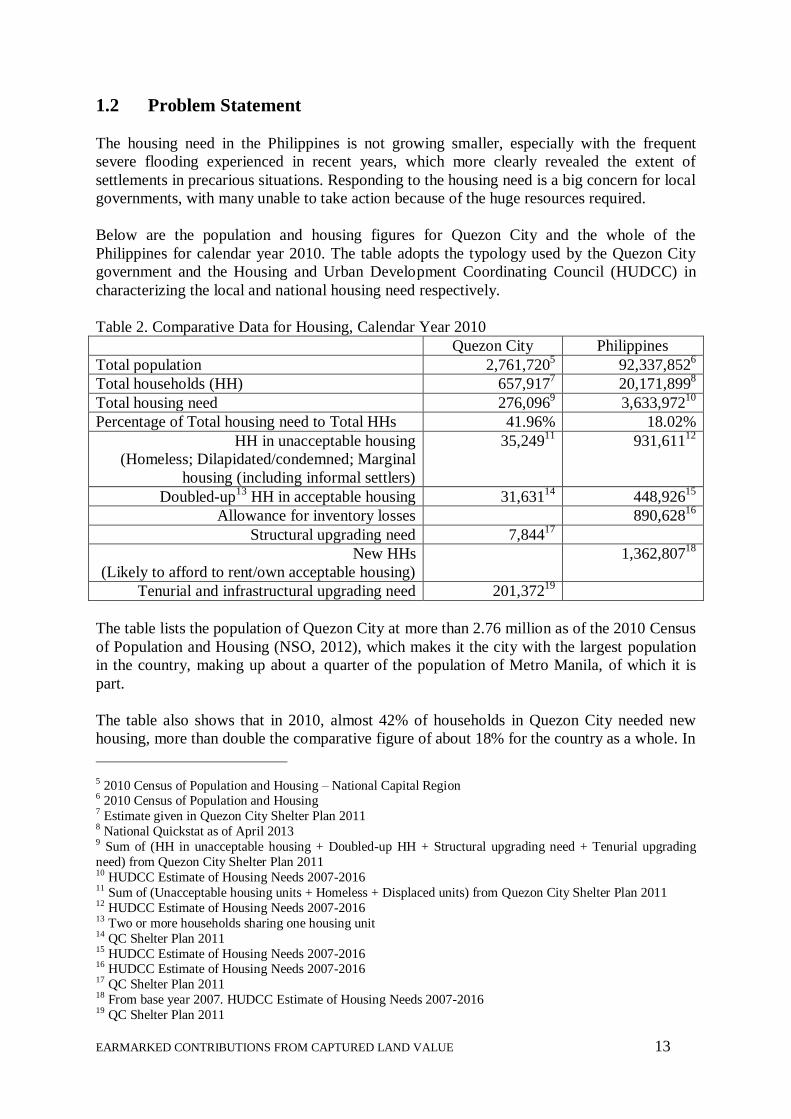
Below are the population and housing figures for Quezon City and the whole of the
Philippines for calendar year 2010. The table adopts the typology used by the Quezon City
government and the Housing and Urban Development Coordinating Council (HUDCC) in
characterizing the local and national housing need respectively.
Table 2. Comparative Data for Housing, Calendar Year 2010
Quezon City Philippines
Total population 2,761,7205 92,337,852
6
Total households (HH) 657,9177 20,171,899
8
Total housing need 276,0969 3,633,972
10
Percentage of Total housing need to Total HHs 41.96% 18.02%
HH in unacceptable housing
(Homeless; Dilapidated/condemned; Marginal
housing (including informal settlers)
35,24911
931,61112
Doubled-up13
HH in acceptable housing 31,63114
448,92615
Allowance for inventory losses 890,62816
Structural upgrading need 7,84417
New HHs
(Likely to afford to rent/own acceptable housing)
1,362,80718
Tenurial and infrastructural upgrading need 201,37219
The table lists the population of Quezon City at more than 2.76 million as of the 2010 Census
of Population and Housing (NSO, 2012), which makes it the city with the largest population
in the country, making up about a quarter of the population of Metro Manila, of which it is
part.
The table also shows that in 2010, almost 42% of households in Quezon City needed new
housing, more than double the comparative figure of about 18% for the country as a whole. In
5 2010 Census of Population and Housing – National Capital Region 6 2010 Census of Population and Housing 7 Estimate given in Quezon City Shelter Plan 2011 8 National Quickstat as of April 2013 9 Sum of (HH in unacceptable housing + Doubled-up HH + Structural upgrading need + Tenurial upgrading
need) from Quezon City Shelter Plan 2011 10 HUDCC Estimate of Housing Needs 2007-2016 11 Sum of (Unacceptable housing units + Homeless + Displaced units) from Quezon City Shelter Plan 2011 12 HUDCC Estimate of Housing Needs 2007-2016 13 Two or more households sharing one housing unit 14 QC Shelter Plan 2011 15 HUDCC Estimate of Housing Needs 2007-2016 16 HUDCC Estimate of Housing Needs 2007-2016 17 QC Shelter Plan 2011 18 From base year 2007. HUDCC Estimate of Housing Needs 2007-2016 19 QC Shelter Plan 2011

EARMARKED CONTRIBUTIONS FROM CAPTURED LAND VALUE 14
contrast to that scale of need, city records also indicate that the average annual production
from 2000 to 2010 in Quezon City was 2,003 units of socialized housing and 2,649 units of
open-market housing, or a total of 4,652 housing units yearly (Quezon City, 2011). The
annual production of 4,652 units from 2000 to 2010 is less than 2% of the accumulated
housing need as of 2010.
In financial terms, Quezon City’s requirement for the housing component, computed at just
the current ceiling of PHP 400,000 (US$ 9,69920
) for socialized housing (HUDCC MC 2008-
01), amounts to more than PHP 110.4 Billion (US$ 2.68 Billion). The entire gross revenue of
the city for 2012 was about PHP 13.1 Billion (Quezon City, 2013i) (US$ 317.48 Million).
This means that the total revenue of the city for one year, which it has to divide among many
programs and services, is less than 10% of the total financial requirement for housing as of
2010.
As previously noted, national legislation recognizes the severity of the housing need, gives
local governments a leading role in addressing the need, and provides them with various
means to mobilize additional resources to address such need. These means are principally the
idle lands tax, the socialized housing tax, and the balanced housing policy.
However, introducing new obligations to constituents is never easy for government officials
who are regularly up for election. Policy studies in the Philippines find that a major constraint
cited by local governments for wider application of fiscal instruments is the lack of clear
implementation guidelines (Boo, 2007 in Gomez, 2010). A contrary view is that the
guidelines are clear enough, but the unpopularity of the obligations outweighs their gains in
the eyes of local government officials (Gomez, 2010).
In the face of such perceptions, as well as the opportunities offered by the land value capture
instruments, documentation of their implementation and impact as earmarked contributions
could help enlighten local governments and other housing stakeholders in determining
whether or not such instruments are appropriate means for improving social housing delivery.
1.3 Research Objective
Using the case of Quezon City then, the research seeks to describe and gain insight on how
the design and implementation of the idle lands tax, the socialized housing tax, and the
balanced housing policy affect the outcomes of social housing delivery.
1.4 Provisional Research Questions
The main question that the research seeks to answer is: Are earmarked contributions
appropriate ways of capturing land value for social housing?
The above main question is broken down into the following specific questions:
20 All conversion on this page is at US$ 1 = PHP 41.24, as per 2013 average, Peso – US Dollar Watch, National
Statistical Coordinating Board.

EARMARKED CONTRIBUTIONS FROM CAPTURED LAND VALUE 15
1. Are the idle lands tax, socialized housing tax, and balanced housing policy equitable in
the manner of obtaining contributions derived from land value?
2. Are they efficient in capturing land value?
3. Are they effective in fulfilling the objective of providing for social housing?
1.5 Significance of the Study
The research will establish a baseline and offer a methodology for assessing the effectiveness
of the contributions that local governments earmark for social housing, as delineated in
Philippine laws. Locally mobilized housing resources, namely the idle lands tax, socialized
housing tax, and balanced housing policy, are not as well-documented as the nationally
administered mortgage mechanism, also mandated by UDHA, called the Community
Mortgage Program (CMP), which has been the subject of a case study commissioned by UN
Habitat in 2009.
This study seeks to inform local and national policymaking in promoting or modifying the
practice for the three types of contributions in order to better serve the delivery of social
housing. Documentation and analysis of cases where the instruments have been applied is
intended to be useful to various groups involved in housing, such as:
- officials and administrators of other cities in the Philippines who may need clearer
directions on a way forward for implementing the instruments, and the implications of
doing so;
- taxpayers and developers who may be looking for validation that their contribution will
be suitably levied and utilized;
- legislators and civil society organizations who continue to review the provisions of the
Urban Development and Housing Act;
- the Quezon City local government and housing stakeholders who will benefit from
knowing which mechanism, among the three subjects of this study, is more efficient for
the local government’s administration, and with better chances of showing good results
for social housing.
The research also seeks to add to the body of knowledge on property-related taxes and
obligations. The results will show how land value capture instruments may have been adapted
in the Philippine context in order to gain a foothold for fiscal and non-fiscal contributions to
social housing.
1.6 Scope and Limitations
The Urban Development and Housing Act enables the use of other financing mechanisms
such as mortgage (Community Mortgage Program) and subsidy (exemption from capital
gains tax for sellers of land to be used for social housing provision). Conceivably, these other
mechanisms are exerting an influence on the outcomes of the idle lands tax, socialized
housing tax and balanced housing. However, this study will not be able to analyze the aspect
of the possible relationship of the three value capture instruments (idle lands tax, socialized
EARMARKED CONTRIBUTIONS FROM CAPTURED LAND VALUE 16
housing tax, balanced housing) with the other available financing mechanisms (mortgage and
subsidy).
Secondly, this study focuses on the three instruments as implemented in Quezon City. The
country’s statutory framework allows cities room to localize or add certain features to the
national guideline. Also, Quezon City cannot be said to be an average-sized Philippine city in
terms of population or income. It is one of the very few cities in the Philippines that have
been able to report budget surpluses, and it has the biggest population. The features of
implementation in Quezon City may therefore have a number of differences with how the
instruments could be implemented in other cities.
EARMARKED CONTRIBUTIONS FROM CAPTURED LAND VALUE 17
Chapter 2: Literature review
2.1 State of the Art of the Theories of the Study
This section is divided into two main parts. The first gives some definitions relevant to land
value capture and various instruments relevant to this research. The second part takes up the
criteria in the research questions for examining land value capture instruments – equity,
efficiency, and effectiveness – as they are conceptualized in the literature of value capture.
2.1.1 Some concepts in land value capture
2.1.1.1 Land value capture
Land value capture is the public sector practice of taking, for the benefit of the community,
through fiscal and non-fiscal means, the increases in land value resulting from collective
action such as public infrastructure investments, public approval of land use changes, and
population growth (Smolka and Amborski, 2000).
Ingram and Hong (2012) reiterate this definition of land value capture even as they say that
increases in land value resulting from private investments and productivity should remain in
private hands. Property value factors like improvements made by landowners and the original
productivity of the land paid for by the current owner therefore are not included in the
concept of land value capture by the public sector (Ingram and Hong, 2012).
The United Nations Human Settlements Programme (1976, p. 30) itself embeds the principle
of land value capture in its founding document, the Vancouver Action Plan, where the
following is recommended under the agenda item of Land: “The unearned increment
resulting from the rise in land values resulting from change in use of land, from public
investment or decision, or due to the general growth of the community must be subject to
appropriate recapture by public bodies...”
2.1.1.2 Land and property taxes and fees
Land and property taxes and fees are distinguished from other taxes by having land and
immovable improvements as their base, in the same way that the base of the income tax is
personal or business income, and the base of the value added tax is the price of a good, going
from one stage of the value chain to the next (Walters, 2011).
Land and property taxes are diverse and range from one-time payments like development
fees, inheritance tax, and capital gains tax, to recurring payments like annual property taxes
and land rents and leases (Walters, 2011).
The definition of land value capture above conceptually distinguishes the increases in value
in the land component of properties, from increases in value due to privately invested
improvements, even if in most cases land and improvements are assessed as one.
EARMARKED CONTRIBUTIONS FROM CAPTURED LAND VALUE 18
2.1.1.3 Tax on vacant or idle lands
Undeveloped land is the base of the vacant or idle lands tax. This type of tax usually has a
rate higher than the rate given to land with improvements. Morales Schechinger (2007) offers
three reasons for imposing a higher rate on vacant land:
- To induce owners to undertake development on their land;
- To bear the costs of extending infrastructure networks to the peripheral areas, given that
network capacities are wasted in central areas by the presence of vacant land; and
- To recover for the State land value increment that was generated collectively.
This conception leads to a treatment of vacant land that taxes it as if it is developed (Morales
Schechinger, 2007).
However, authors like Bird and Slack (2002 and 2006) challenge the purpose of imposing a
higher rate on vacant land, writing that there is little evidence that “non-fiscal” purposes such
as discouraging holding of idle land have ever been achieved. Fainstein (2012) agrees that
taxing undeveloped land cannot wholly discourage speculation unless the tax is based on 100
percent of increased value (which view also seems to correspond with Morales Schechinger).
Writing after the mortgage crisis in the US, Mallach and Vey (2011) note the harmful effect
of vacant land and abandoned buildings on the local economy and fiscal health. A result of
the foreclosures during the crisis, these types of properties were looked on as “major potential
assets” for their communities (Mallach and Vey, 2011).
Among the tools Mallach and Vey list to address vacant or blighted land and buildings is the
Vacant Property Registration Fee Ordinance enacted by Wilmington, Delaware, to pay a fee
that increases annually for ten years. Mallach and Vey look on such fees as the cost of the
problem properties to the community. The fees should pay for increased fire safety and police
services, building code enforcement, property maintenance, demolition, and reduced quality
of life and value of surrounding properties (Mallach and Vey, 2011).
2.1.1.4 Betterment tax, tax increment financing (TIF), and temporary
property tax rate increase
The betterment tax, TIF, and temporary property tax rate increase are included in this
literature review as the theoretical bases of analysis for the socialized housing tax in Quezon
City. The socialized housing tax, as legislated in the city ordinance, features the
characteristics of a) public infrastructure investment, b) borrowing against future taxes, and c)
having a fixed number of years for collection. These are features that are demonstrated, in
one way or another, by the three instruments that are discussed in this section.
Walters describes the betterment tax as an instrument to capture the land value increment that
“often results when infrastructure is improved or permission is granted to change land use”
(Walters, 2012). It is classified among the one-time fees, and its base is the difference in the
value of property from the time before and after the public infrastructure investment was
made or land use change was granted (Walters, 2012).
Booth (2012) proposes that the approach to collection of betterment value depends at least in
part on the definition of its purpose. Is it offsetting external impacts of development projects?
Funding infrastructure within a given locality? For the general interest and for the public
EARMARKED CONTRIBUTIONS FROM CAPTURED LAND VALUE 19
good because property in land is not wholly a private interest? (Booth, 2012) He concludes
that resolutions will reflect countries’ varying statutory frameworks.
Smolka (2013) illustrates the betterment charge by listing the considerations for estimating
and distributing the charge among beneficiaries of the project funded by the betterment
contributions. These considerations are:
- Total cost of project or investment to be recovered
- Overall land value increment, valorization, or benefits resulting from the investment
- Definition of the impacted area and identification of all benefited properties
- Criteria to distribute the charge among beneficiaries
- Payment schedule for the charges
(Smolka, 2013)
Tax increment financing (TIF), on the other hand, is characterized by Walters (2012) as a
financing mechanism rather than a method to increase tax revenues, although he also cites
several authors whose writings appear to support TIF as a land value capture mechanism
(Carroll, 2008; Byrne, 2006; Zhao, Das and Larson, 2011; in Walters, 2012).
The TIF concept makes use of designated districts where developments are planned, and
differences in land values (resulting from the planned developments) are calculated. The
difference in land values leads to increased property taxes. In the US, states borrow against
this future increase in property taxes in order to fund specific infrastructure, services or debts
(Walters, 2012).
Weber and Goddeeris (2007) explains the mechanics of TIF as having the following
requirements:
- A “base value” or “initial assessed value” that serves as the baseline for measuring
eventual increase in property taxes as a result of redevelopment
- TIF-funded public incentives to attract private development
- The “value increment” or the difference between the base value and the new assessed
value, which results in a tax increment
- Channelling of the tax increment to a TIF authority for use in financing any debt
accumulated for redevelopment
(Weber and Goddeeris, 2007)
The third mechanism discussed in this section is the temporary property tax rate increase.
Smolka cites the example of Buenos Aires to illustrate how an additional charge can be
collected to finance “large-scale urban infrastructure that benefits all residents directly or
indirectly in proportion to their property values” (2013, p. 23). To finance a new subway line,
a law was created in Buenos Aires in 1987 adding five percent to the property taxes of all city
residents, and another surcharge of 2.4 percent to residents living within 400 meters of the
subway stations.
Another example is Chile, which applied a surcharge of 0.275% in the years 2011 and 2012
on real estate with fiscal value over US$ 202,207 (Deloitte, 2011). This temporary increase of
property tax, along with other tax measures, was intended to finance reconstruction after the
February 2010 earthquake.
In 2011 when it was facing default on its its obligations with international financing
institutions, Greece also used this measure to raise billions of euros to qualify for bailout
EARMARKED CONTRIBUTIONS FROM CAPTURED LAND VALUE 20
(Kitsantonis, 2011). The emergency tax, or so-called second property tax, was intended to be
collected annually until 2014, but was later merged with the regular property tax effective
January 2014.
These examples indicate that temporary property tax increases or surcharges tend to be
earmarked for specific purposes.
2.1.1.5 Inclusionary housing and fees-in-lieu
Inclusionary housing and linkage fees are not in Walters’ list of property-related mechanisms.
But the practices belong to the list of nontax value capture tools, especially in the light of the
trend for public-private sector cooperation in delivering traditional public services like
housing.
Calavita and Mallach provide a comprehensive overview of inclusionary housing in the book
Inclusionary Housing in International Perspective (2010). The first article, which introduces
the concept and international history of inclusionary housing, opens with the definition:
“Inclusionary housing is a means of using the planning system to create affordable housing
and foster social inclusion by capturing resources created through the marketplace” (Calavita
and Mallach, 2010a). The definition has four components – a) use of the planning system, b)
provision of affordable housing, c) social inclusion, and d) harnessing of market resources.
Given the last component above, it may not be surprising that Calavita and Mallach (2010b),
as well as Voith and Wachter (2012) conclude that inclusionary housing has stronger chances
of succeeding in strong rather than in weak market environments.
The definition of inclusionary housing is given more nuance in Inclusionary Housing’s last
article, also written by Calavita and Mallach: “. . . the most fundamental purpose of enacting
inclusionary housing is to create housing that is affordable to those who cannot effectively
compete in the marketplace. Land value recapture is a means to that end, while social
inclusion can come into being only to the extent that the inclusionary housing system actually
produces affordable housing,” (2010b, p. 369). In this statement, the balance between the
inclusionary housing components of affordable housing and social inclusion appears to be
tilting more towards affordable housing.
Voith and Wachter add another dimension to the affordability of homes provided by
inclusionary housing programs. They express a concern for “durable” affordable housing,
which means “permanently available at a reduced cost” (2012, p. 262)
They see this condition as hard to achieve in an environment of competitive communities
because of the conflict between short-run maximization of tax revenues, where sale and
resale of housing at high market rates is desirable, and what they call long-run “optimization
of community wealth” where affordable housing is preserved to the extent of being offered at
below-market rates to low-income households (2012, p. 269).
Calavita and Mallach describe “in-lieu” cash payments as a variation of inclusionary housing
where developers make a contribution to a trust fund, or donate land off-site (Calavita and
Mallach, 2010a).

EARMARKED CONTRIBUTIONS FROM CAPTURED LAND VALUE 21
Evans-Cowley places fees-in-lieu among developer exactions along with linkage fees and
impact fees (Evans-Cowley, 2006). A developer could choose to pay fees instead of
providing a public facility on-site when it would be impractical to do so. This arrangement is
supposed to give local governments flexibility on where to site public facilities so as to best
serve their communities (Evans-Cowley, 2006).
The literature on inclusionary housing and fees-in-lieu will serve as the theoretical frame for
examining the implementation of the balanced housing policy in the Philippines. Although
the provision in UDHA that created the balanced housing policy reads like its first intent is
inclusionary housing, subsequent developments in the UDHA’s Implementing Rules and
Regulations (IRR) now allow modes of compliance that are more like fees-in-lieu.
2.1.1.6 Earmarking
In Tax Earmarking: Is It Good Practice? (2007), Carling defines the “pure” or “strong” form
of tax earmarking or “hypothecation” as keeping separate from general revenue all revenue
from a particular tax, such revenue to be used only for a specific government program, and
fully funds it.
When these conditions are met, he sees earmarking as beneficial in that it leads to better
fiscal choices by taxpayers who are informed of the true costs of expenditure programs. The
allocation of resources would then be more in line with public preferences than would be the
case with general funding (Carling, 2007).
However, Carling sees more use of what he calls “soft” forms of earmarking rather than
“strong”, possibly as governments’ way of addressing the rigidities imposed on budgeting by
the “strong” form of earmarking. “Soft” earmarking uses the earmarked revenues only to
partly fund or top up general revenues applied to the same program, while “strong”
earmarking would fully fund it.
“Soft” earmarking has several dangers that include:
- Lack of transparency on the true costs of the program they are paying for;
- Creation of a bigger public sector by leaving in place the non-transparent programs in
addition to the transparent programs;
- Promoting inefficiency by tapping additional resources for new priorities instead of
searching for savings from existing expenditures; and
- Making earmarking meaningless due to the elasticity of the general funding component.
(Carling, 2007)
The idle lands tax, socialized housing tax, and balanced housing policy are all mechanisms
for earmarking contributions to housing provision for the poor in Quezon City.
2.1.2 Selected criteria for analysis
2.1.2.1 Equity
Equity is discussed in literature in many ways, at times related to notions of fairness, at times
with justice. But Plimmer, McCluskey and Conellan (2000) differentiate between fairness
and equity, relating fairness to the legislation promulgating the tax, which may allow
preferential treatment for certain taxpayers or types of property. On the other hand, the
EARMARKED CONTRIBUTIONS FROM CAPTURED LAND VALUE 22
authors denote equity in taxation as “assessment equity”, which is the measure of how well
the property tax system is administered in terms of assessed values (Plimmer, McCluskey and
Conellan, 2000).
Assessment equity is further discussed by Plimmer et al as either horizontal equity (two
properties of the same value should have the same assessed value), or vertical equity (a
property with twice the value of another property should have twice the assessed value). The
concept of vertical equity gives rise to the concepts of regressivity (higher-value properties
are under-assessed relative to lower-value properties) and progressivity (lower-value
properties are under-assessed relative to higher-value properties).
For the methodology of assessment equity, De Cesare and Ruddock provide the basic text in
A New Approach to the Analysis of Assessment Equity (1998). In their methodology, the
coefficient of dispersion (COD) is used as indicator for horizontal inequity or assessment
bias, while the price related differential (PRD) is used to indicate the degree of vertical
inequity or assessment bias. COD and PRD are calculated using regression analysis with two
variables – assessed values and sales prices. Alternatively, multiple variables can be
introduced to substitute for sales prices in order to identify factors causing assessment bias.
Other writers like Kerr, Aitken and Grimes (2004), Soule and Bluestone (2005), Bahl and
Martinez-Vazquez (2007), Connolly and Bell (2009), and Sjoquist and Stephenson (2009)
also take up this definition of equity, especially vertical equity, in their studies of various
revenue-raising instruments in different development contexts.
Case (1986) associates equity with both fairness and justice, which may mean more equal
distribution of income or poverty alleviation. Kerr, Aitken and Grimes (2004) add the
following: equality of opportunity relative to equality of outcome, equity based on access to
services, and consistency relative to distribution of costs. Slack (2013) relates equity to
ability to pay, which connects to vertical equity, but also adds the notion of equity based on
benefits received.
For the rest of the chapters in this study, the concept of equity will be taken up as assessment
equity, in both the horizontal and vertical aspects.
2.1.2.2 Efficiency
Some references to efficiency in taxation get close to the language of Pareto efficiency,
although the point of most authors is rather Pareto improvement where efficient change
makes some people better off and no one worse off (Case, 1986), not the state of Pareto
optimality where no one could be made better off without making another person worse off.
Nechyba (2001) explains that taxes can have an income effect (the reduction in real income
due to tax payment results in a taxpayer’s change in choices) or a substitution effect (the
existence of the tax changes relative prices, and gives incentives to taxpayers to substitute
non-taxed goods for taxed goods). The latter results in economic distortion, the taxpayer is
worse off, and government gets no revenue.
Nechyba and other authors cite the land tax as having no substitution effect while the
property tax distorts the cost of making improvements to the property. Another case of
substitution happens at the thresholds of bands when tax rates are set by bands.

EARMARKED CONTRIBUTIONS FROM CAPTURED LAND VALUE 23
Other authors touch on the aspect of economic efficiency that refers to the use of resources or
revenues to provide the desired level of public goods. Sjoquist and Stephenson (2009)
analyse welfare benefit or loss, while De Cesare (2012) and Bahl and Martinez-Vazquez
(2007) examine the administrative side of the revenue sources.
Taxes can be considered inefficient when poor administration makes the investment in
taxation a losing proposition (Bahl and Martinez-Vazquez, 2007), or when taxation leads to
more constricted land supply and less affordable housing (Soule and Bluestone, 2005).
Focusing on tax administration, De Cesare (2012) offers a number of indicators for the
measurement of performance of property tax systems. The indicators come under the general
concerns of a) cadastral records, b) property assessment, c) tax collection and enforcement, d)
public relations such as taxpayer satisfaction and claims and appeals, and e) global issues
such as the tax authority’s fiscal independence, proportion of the property tax to local tax
revenues, property tax revenue per capita, proportion of revenues to assessments, and
comparison of administrative costs to revenues generated (De Cesare, 2012).
Many of De Cesare’s indicators correspond with Walters’ five variables in his conception of
the tax revenue identity in Land and Property Tax: A Policy Guide (2011):
- The value of the base as legally defined (Base)
- The rate as set by law and policy (Rate)
- The proportion of all land that should legally appear on the tax rolls that actually is
included in the fiscal cadastre (Coverage)
- The proportion of taxable value that is identified by the valuation process (Valuation)
- The proportion of the tax levied that is actually collected (Collection)
(2011, p. 31)
The first two items in the list above are classified by Walters as policy variables, while the
last three are administrative factors. The variables relate as follows:
Figure 2. Tax Revenue Identity
Revenue = Base X Rate X Coverage X Valuation X Collection
(2011, p. 31)
Netzer (1998) earlier pointed out two aspects of efficiency that seem to correspond with
Walters’ outlining of policy and administrative variables. Netzer identifies a) revenue
potential and b) the costs of taxation.
Several authors relate efficiency with various other concerns. Mills (1998) looks at efficiency
in terms of effects on urban land uses and land values. On the other hand, Fainstein (2012)
brings in as a measure of efficiency the quality of life for the broad public rather than Pareto
optimality as the objective of development.
McGee (1999) expresses a concern regarding earmarking and efficiency. He says that in
theory, earmarking taxes is efficient because funds are set aside for a specific purpose or
program rather than disappear into a general fund. Depending on voters’ perception of the
program, they can abolish both the program and the tax. McGee predates Carling’s caution
against bigger government (Carling, 2007) when he says that what is more likely to happen is
that, with earmarked funding programs in place, general fund revenues that used to be spent

EARMARKED CONTRIBUTIONS FROM CAPTURED LAND VALUE 24
for the programs will just be shifted to pay for some other programs that “taxpayers may or
may not want” (McGee, 1999).
The analysis on efficiency in succeeding chapters of this study will take off from the
components of Walters’ revenue identity, which shares many features with the conceptions of
Netzer and De Cesare.
2.1.2.3 Effectiveness
As mentioned in previous sections, the literature on equity and efficiency brings up the idea
of fairness a lot. “Does it feel fair” is a recurring question important for the success of
collection of contributions. And the idea of fairness and justice is often connected to the
outcomes or effects of the contributions, on whether they resulted in positive or negative
impact on the group of taxpayers themselves or other groups (for example Fainstein, 2012).
For the purposes of this research, the aspect of outcomes mentioned with both equity and
efficiency is discussed separately under the concept of effectiveness. For the operational
definition of effectiveness, a conceptual framework on public spending and performance
from a European Commission Economic Paper can serve as a guide. In the framework in the
Economic Paper by Mandl, Dierx and Ilzkovitz (2008), effectiveness is “the success of the
resources used in achieving the objectives set,” which objectives are often linked to welfare
or development aims (2008, p. 3).
Thus, as contributions earmarked for housing the poor, the idle lands tax, socialized housing
tax, and balanced housing shall be analyzed for delivery of housing to the intended market,
and with the intended quality, envisioned by the relevant legislation.
Literature also discusses unintended outcomes, many of them negative. For example,
Fainstein (2012) mentions possible adverse effects of taxation on equity such as withdrawal
of land from agricultural uses, environmental damage, and displacement of low-income
households and small businesses from central or accessible locations.
In positive terms, possible outcomes are equity in the possession of space, thus enhancing the
right to the city (Lefebvre, 1991 in Fainstein, 2012), and spatial (e.g. from downtown to other
areas) and socio-economic (e.g. poorest neighbourhoods get more) redistribution of funds
(Fagotto and Fung, 2006; Fainstein and Hirst, 1996; in Fainstein, 2012).
On the other hand, Smolka and Amborski (2000), from the evidence of Latin American cities,
caution against value capture schemes that attempt redistribution by earmarking recovered
land value gains from well-serviced areas to poorly-serviced areas. They mention bonus
zoning, inclusionary housing, and linkage fees as mechanisms that may be used in this
manner. They believe that in the urban context of Latin America, the process could magnify
intra-urban and land price differences (Smolka and Amborski, 2000).
The focus of this research on the issue of effectiveness will be the intended direct results of
the earmarked contributions rather than the unintended outcomes.
EARMARKED CONTRIBUTIONS FROM CAPTURED LAND VALUE 25
2.1.3 Summary
The review of literature renders the definitions of several concepts in land value capture that
are central to this study:
Land value capture is the appropriation by the public sector, for the benefit of the
community, the increases in land value resulting from collective action such as public
infrastructure investments, public approval of land use changes, and population growth
(Smolka and Amborski, 2000).
Land and property taxes and fees are instruments of land value capture that are distinguished
from other taxes by having land and immovable improvements as their base (Walters, 2011).
Taxes on vacant or idle land have undeveloped land as the tax base, and a tax rate that is
usually higher than the rate given to land with improvements (Morales Schechinger, 2007).
Betterment tax is a one-time fee, and its base is the difference in the value of property from
the time before and after a public infrastructure investment was made or land use change was
granted (Walters, 2012).
Tax increment financing allows states to fund specific infrastructure, services or debts by
borrowing against future increases in property taxes that are expected to result from increased
land values in districts where developments are planned (Walters, 2012).
Temporary property tax rate increase is an additional charge that can be collected to finance
“large-scale urban infrastructure that benefits all residents directly or indirectly in proportion
to their property values” (Smolka 2013, p. 23).
Inclusionary housing uses the planning system to provide for affordable housing and foster
social inclusion by capturing market resources. (Calavita and Mallach, 2010a).
Fees-in-lieu are a variation of inclusionary housing where developers make a contribution to
a trust fund or donate land off-site (Calavita and Mallach, 2010a).
Earmarking is a legislative action that keeps separate from general revenue all revenue from
a particular tax, such revenue to be used only for a specific government program, and fully
funds it (Carling, 2007).
In addition to the brief explanations relevant to land value capture given above, following
below are operational definitions of three criteria from public finance that will be used as the
scope for analysis in this study:
Equity shall be taken to mean “assessment equity”, which is the measure of how well the
property tax system is administered in terms of assessed values (Plimmer, McCluskey and
Conellan, 2000). Assessment equity is examined in terms of horizontal equity and vertical
equity, with the latter giving rise to the concepts of regressivity and progressivity.
Efficiency will be studied in line with the five variables of the tax revenue identity, namely:
a) the value of the base as legally defined, b) the rate as set by law and policy, c) coverage,
which is the proportion of all land that should legally appear on the tax rolls that actually is

EARMARKED CONTRIBUTIONS FROM CAPTURED LAND VALUE 26
included in the fiscal cadastre, d) valuation, referring to the proportion of taxable value that is
identified by the valuation process, and e) collection, referring to the proportion of the tax
levied that is actually collected (Walters, 2011).
Effectiveness shall refer to the extent that intended objectives have been achieved with the
resources that have been provided. Such objectives are often linked to welfare or
development aims (Mandl, Dierx and Ilzkovitz, 2008).
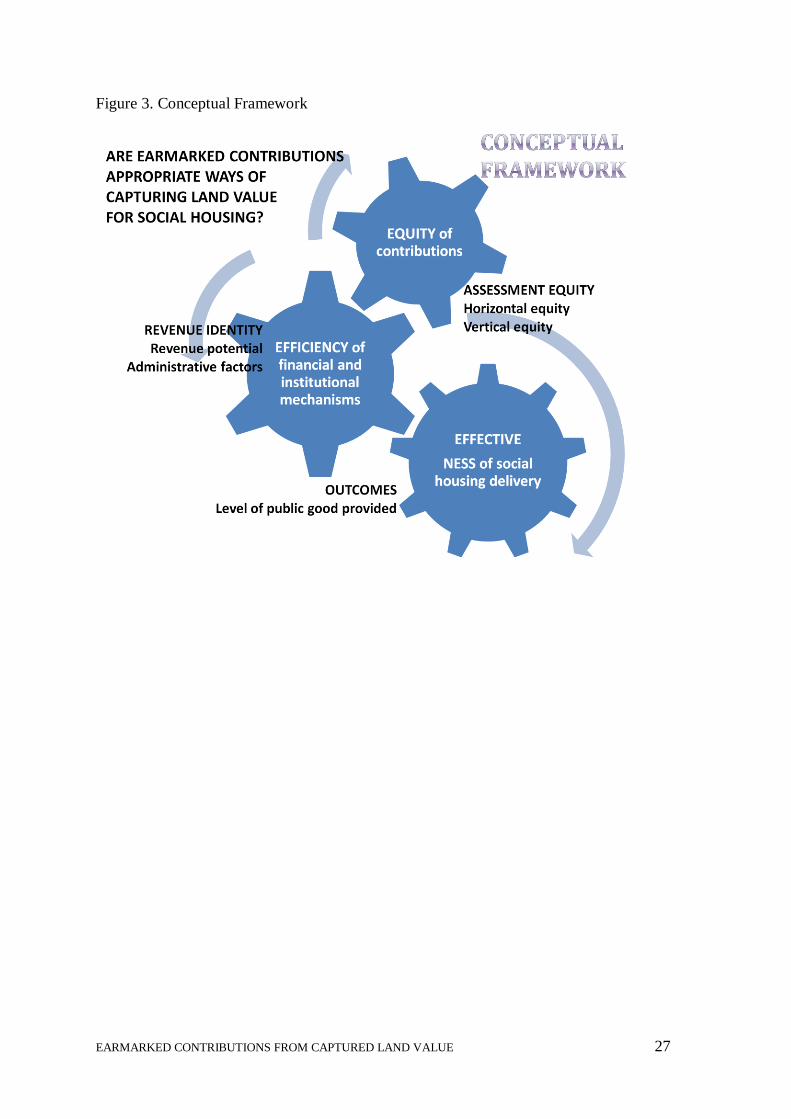
2.2 Conceptual Framework
Going back to the main research question (Are earmarked contributions appropriate ways of
capturing land value for housing?), the notion of appropriateness in this study is taken to
encompass the linked concepts of equity, efficiency and effectiveness. The framework used
in this research examines these concepts as applied in the context of the implementation of
the idle lands tax, the socialized housing tax, and the balanced housing policy for the
provision of housing for the poor in Quezon City.
Literature does not indicate directly causal relationships among any of the three, but rather
overlapping aspects that affect each other in practice and in the perception of housing
stakeholders. This research thus seeks to shed light on the three value capture mechanisms as
they exhibit the combined characteristics of equity, efficiency, and effectiveness in their
implementation.
For simplicity, both the equity and efficiency issues will be studied principally on the
obligation side, and the research and discussion on effectiveness will take up the intended
achievement of social housing delivery.
EARMARKED CONTRIBUTIONS FROM CAPTURED LAND VALUE 27
Figure 3. Conceptual Framework

28
Chapter 3: Research Design and Methods
3.1 Revised Research Questions
Based on the theories found in literature and the definitions adopted for the concepts in the
theoretical framework, the research questions were revised as follows:
Main question: Are earmarked contributions appropriate ways of capturing land value for
social housing?
1. What is the basis for characterizing the idle lands tax, socialized housing tax, and
balanced housing policy in Quezon City as land value capture instruments?
2. Are the idle lands tax, socialized housing tax, and balanced housing policy equitable in
the manner of obtaining contributions derived from land value?
a. Is there horizontal equity? (Do properties with similar values have similar
assessed values?)
b. Is there vertical equity? (Do properties with twice the assessed value of
another property have twice its assessed value?)
3. Are they efficient in capturing land value?
a. What is the revenue potential for the three instruments? (What are the tax
bases and rates as defined by law and policy?)
b. How much of this potential is actually being captured?
c. To what extent do administrative factors affect the revenues? (What
proportion of the legal coverage is actually included in the cadastre, identified
in the valuation process, and collected?)
4. Are they effective in fulfilling the objective of providing for social housing?
a. What is the amount and quality of social housing that needs to be provided in
Quezon City?
b. What is the amount and quality of social housing that has been provided from
the resources mobilized by the three types of contributions?
3.2 Operationalization: Variables, Indicators
The concept of equity is operationalized as assessment equity, which is measured along two
variables: 1) horizontal equity and 2) vertical equity. The quantitative indicators for the two
variables are: the coefficient of dispersion (COD) for horizontal equity, and the price-related
differential (PRD) for vertical equity.
The qualitative indicators for assessment equity are the factors and methodology used in
assessment, including the factors and methods for granting exemptions or preferential
treatment to certain types of properties or taxpayers.
Efficiency is operationalized by the formula of the tax revenue identity, which has two
variables: 1) policy and 2) administrative factors. The policy variable has two quantitative
29
indicators: the tax base and the tax rate, while the administrative variable has three: coverage,
valuation, and collection.
Qualitative indicators for the tax revenue identity are the level, types, functions, and inter-
relations of the organizations responsible for the policy and administrative factors.
Effectiveness is operationalized by the outcomes, which is represented by the variable level
of social housing provided. This variable has several indicators, including the quantitative
and qualitative: number, amenities, location, amount and manner of allocating budget, and
the services provided by the city in housing delivery.
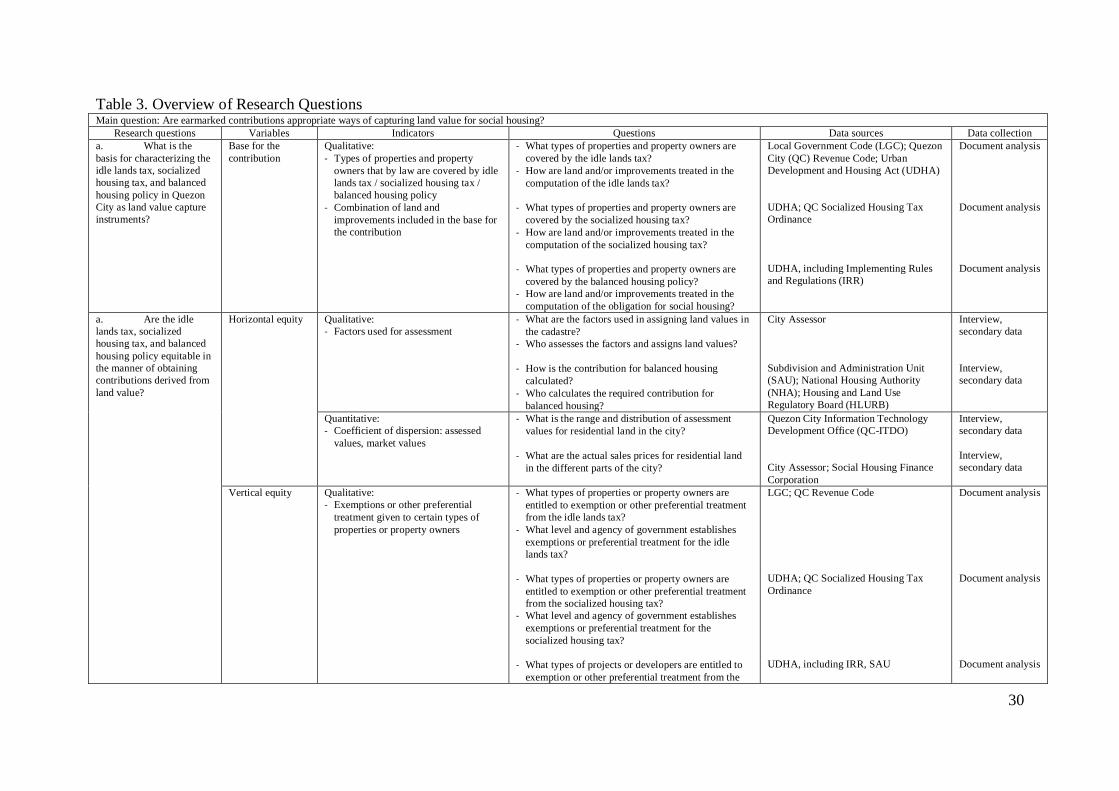
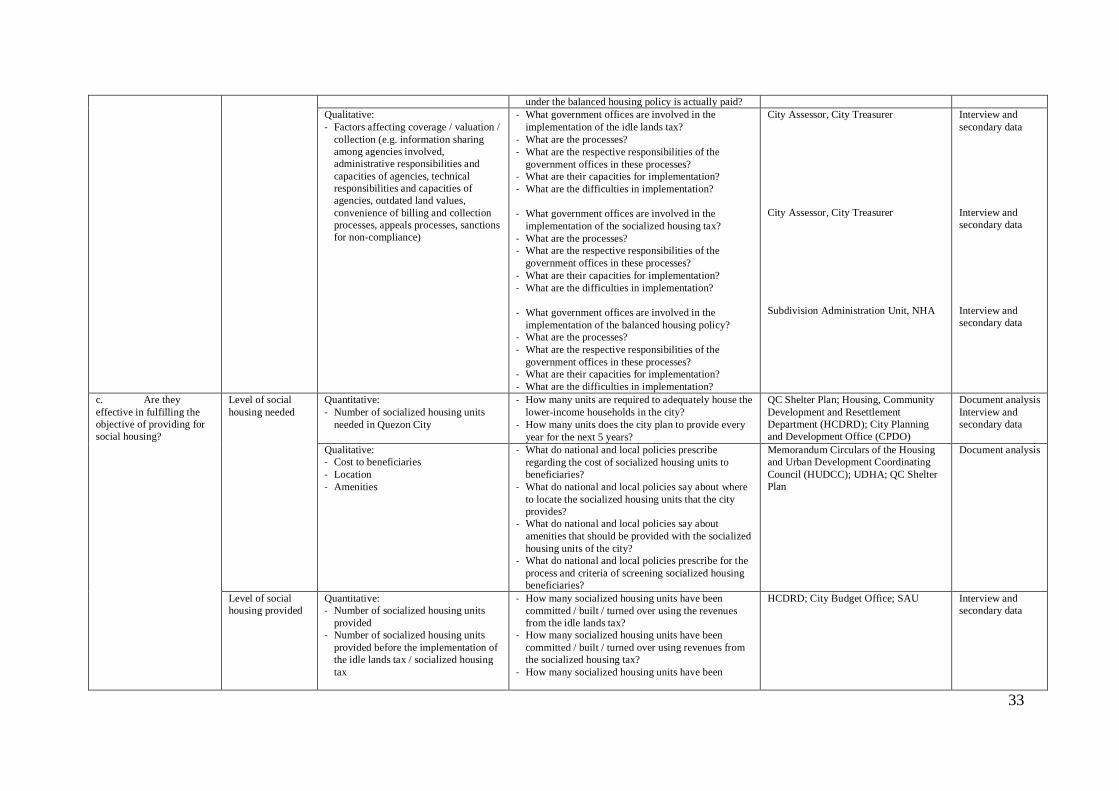
The operationalization of the research questions into the variables, indicators, sub-questions,
and the data collection and analysis methods is shown in the table below.
30
Table 3. Overview of Research Questions Main question: Are earmarked contributions appropriate ways of capturing land value for social housing?
Research questions Variables Indicators Questions Data sources Data collection
a. What is the
basis for characterizing the
idle lands tax, socialized
housing tax, and balanced
housing policy in Quezon
City as land value capture
instruments?
Base for the
contribution
Qualitative:
- Types of properties and property
owners that by law are covered by idle
lands tax / socialized housing tax /
balanced housing policy
- Combination of land and
improvements included in the base for
the contribution
- What types of properties and property owners are
covered by the idle lands tax?
- How are land and/or improvements treated in the
computation of the idle lands tax?
- What types of properties and property owners are
covered by the socialized housing tax?
- How are land and/or improvements treated in the
computation of the socialized housing tax?
- What types of properties and property owners are
covered by the balanced housing policy?
- How are land and/or improvements treated in the
computation of the obligation for social housing?
Local Government Code (LGC); Quezon
City (QC) Revenue Code; Urban
Development and Housing Act (UDHA)
UDHA; QC Socialized Housing Tax
Ordinance
UDHA, including Implementing Rules
and Regulations (IRR)
Document analysis
Document analysis
Document analysis
a. Are the idle
lands tax, socialized
housing tax, and balanced
housing policy equitable in
the manner of obtaining
contributions derived from
land value?
Horizontal equity Qualitative:
- Factors used for assessment
- What are the factors used in assigning land values in
the cadastre?
- Who assesses the factors and assigns land values?
- How is the contribution for balanced housing
calculated?
- Who calculates the required contribution for
balanced housing?
City Assessor
Subdivision and Administration Unit
(SAU); National Housing Authority
(NHA); Housing and Land Use
Regulatory Board (HLURB)
Interview,
secondary data
Interview,
secondary data
Quantitative:
- Coefficient of dispersion: assessed
values, market values
- What is the range and distribution of assessment
values for residential land in the city?
- What are the actual sales prices for residential land
in the different parts of the city?
Quezon City Information Technology
Development Office (QC-ITDO)
City Assessor; Social Housing Finance
Corporation
Interview,
secondary data
Interview,
secondary data
Vertical equity Qualitative:
- Exemptions or other preferential
treatment given to certain types of
properties or property owners
- What types of properties or property owners are
entitled to exemption or other preferential treatment
from the idle lands tax?
- What level and agency of government establishes
exemptions or preferential treatment for the idle
lands tax?
- What types of properties or property owners are
entitled to exemption or other preferential treatment
from the socialized housing tax?
- What level and agency of government establishes
exemptions or preferential treatment for the
socialized housing tax?
- What types of projects or developers are entitled to
exemption or other preferential treatment from the
LGC; QC Revenue Code
UDHA; QC Socialized Housing Tax
Ordinance
UDHA, including IRR, SAU
Document analysis
Document analysis
Document analysis

31
balanced housing policy?
- What level and agency of government establishes
exemptions or preferential treatment for the balanced
housing policy?
Quantitative:
- Price related differential: assessed
values, sales prices
- What is the range and distribution of assessment
values for residential land in the city?
- What are the actual sales prices for residential land
in the different parts of the city?
City Assessor
Register of Deeds; Social Housing
Finance Corporation
Interview,
secondary data
Interview,
secondary data
b. Are they
efficient in capturing land
value?
Revenue potential Qualitative:
- Types of properties and property
owners that by law are covered by the
idle lands tax / socialized housing tax /
balanced housing policy
- Exemptions or other preferential
treatment given to certain types of
properties or property owners
- Level and agency of government that
sets tax rates
- Level and agency of government that
gives exemptions or preferential
treatment
- What types of properties and property owners are
covered by the idle lands tax?
- What types of properties or property owners are
entitled to exemption or other preferential treatment
from the idle lands tax?
- What level and agency of government establishes the
rate for the idle lands tax?
- What level and agency of government establishes
exemptions or preferential treatment for the idle
lands tax?
- What types of properties and property owners are
covered by the socialized housing tax?
- What types of properties or property owners are
entitled to exemption or other preferential treatment
from the socialized housing tax?
- What level and agency of government establishes the
rate for the required contribution for the socialized
housing tax?
- What level and agency of government establishes
exemptions or preferential treatment for the
socialized housing tax?
- What types of properties and property owners are
covered by the balanced housing policy?
- What types of properties or property owners are
entitled to exemption or other preferential treatment
from the balanced housing policy?
- What level and agency of government establishes the
rate for the required contribution for balanced
housing?
- What level and agency of government establishes
exemptions or preferential treatment for the balanced
housing policy?
LGC; QC Revenue Code; UDHA
UDHA; QC Socialized Housing Tax
Ordinance
UDHA, including IRR; Subdivision
Administration Unit (SAU)
Document analysis
Document analysis
Document
analysis; Interview
Quantitative:
- Tax base: Land area covered by the
idle lands tax / socialized housing tax /
balanced housing policy, land values,
assessment rates, assessed values
- What is the total residential land area covered by the
idle lands tax?
- What are the land values for the areas covered by the
idle lands tax?
- What is the assessment rate for residential land?
City Assessor; QC Revenue Code; QC-
Information Technology Development
Office (QC-ITDO)
Interview and
secondary data;
Document analysis

32
- Tax rate: Percentage established by
law to be applied to assessed values for
computing the tax bill
- What is the rate for computing the idle lands tax?
- What is the total residential land area covered by the
socialized housing tax?
- What are the land values for the areas covered by the
socialized housing tax?
- What is the rate for computing the socialized
housing tax?
- What is the total land area covered by new
applications for development permits and subject to
the balanced housing policy?
- What are the land values for these areas?
- What is the rate for computing the contribution
under the balanced housing policy?
City Assessor; QC Revenue Code; QC-
Information Technology Development
Office (QC-ITDO)
SAU; NHA; HLURB
Interview and
secondary data;
Document analysis
Interview and
secondary data
Actual revenues Quantitative:
- Amount collected from idle lands tax /
socialized housing tax / in-lieu fees for
balanced housing
- Number of affordable housing units
produced due to balanced housing
policy
- How much has been collected every year from the
idle lands tax since its implementation?
- How much has been collected every year from the
socialized housing tax since its implementation?
- How many socialized housing units have been
committed under the balanced housing policy?
- How much cash has been contributed under
alternative modes of compliance of the balanced
housing policy?
City Treasurer
SAU; National Housing Authority
(NHA)
Interview and
secondary data
Interview and
secondary data
Administrative
factors
Quantitative:
- Coverage: Percentage of all land that
should be covered to land actually in
cadastre
- Valuation: Percentage of taxable value
that is identified in the valuation
process
- Collection: Percentage of collected to
billed amount
- How much of the land area that should be covered
by the idle lands tax is actually included in the
cadastre?
- How much is the variance in the Valuation that
results from assessment inequity?
- How much of the total billed amount for the idle
lands tax is actually paid?
- How much of the land area that should be covered
by the socialized housing tax is actually included in
the cadastre?
- How much is the variance in the Valuation that
results from assessment inequity?
- How much of the total billed amount for the
socialized housing tax is actually paid?
- How much of the land area that should be covered
by new applications for development permits are
actually reported?
- How much of the total required contribution in
socialized housing units under the balanced housing
policy is actually built?
- How much of the total required contribution in cash
City Assessor; City Treasurer
City Assessor; City Treasurer
SAU; NHA
Interview and
secondary data
Interview and
secondary data
Interview and
secondary data
33
under the balanced housing policy is actually paid?
Qualitative:
- Factors affecting coverage / valuation /
collection (e.g. information sharing
among agencies involved,
administrative responsibilities and
capacities of agencies, technical
responsibilities and capacities of
agencies, outdated land values,
convenience of billing and collection
processes, appeals processes, sanctions
for non-compliance)
- What government offices are involved in the
implementation of the idle lands tax?
- What are the processes?
- What are the respective responsibilities of the
government offices in these processes?
- What are their capacities for implementation?
- What are the difficulties in implementation?
- What government offices are involved in the
implementation of the socialized housing tax?
- What are the processes?
- What are the respective responsibilities of the
government offices in these processes?
- What are their capacities for implementation?
- What are the difficulties in implementation?
- What government offices are involved in the
implementation of the balanced housing policy?
- What are the processes?
- What are the respective responsibilities of the
government offices in these processes?
- What are their capacities for implementation?
- What are the difficulties in implementation?
City Assessor, City Treasurer
City Assessor, City Treasurer
Subdivision Administration Unit, NHA
Interview and
secondary data
Interview and
secondary data
Interview and
secondary data
c. Are they
effective in fulfilling the
objective of providing for
social housing?
Level of social
housing needed
Quantitative:
- Number of socialized housing units
needed in Quezon City
- How many units are required to adequately house the
lower-income households in the city?
- How many units does the city plan to provide every
year for the next 5 years?
QC Shelter Plan; Housing, Community
Development and Resettlement
Department (HCDRD); City Planning
and Development Office (CPDO)
Document analysis
Interview and
secondary data
Qualitative:
- Cost to beneficiaries
- Location
- Amenities
- What do national and local policies prescribe
regarding the cost of socialized housing units to
beneficiaries?
- What do national and local policies say about where
to locate the socialized housing units that the city
provides?
- What do national and local policies say about
amenities that should be provided with the socialized
housing units of the city?
- What do national and local policies prescribe for the
process and criteria of screening socialized housing
beneficiaries?
Memorandum Circulars of the Housing
and Urban Development Coordinating
Council (HUDCC); UDHA; QC Shelter
Plan
Document analysis
Level of social
housing provided
Quantitative:
- Number of socialized housing units
provided
- Number of socialized housing units
provided before the implementation of
the idle lands tax / socialized housing
tax
- How many socialized housing units have been
committed / built / turned over using the revenues
from the idle lands tax?
- How many socialized housing units have been
committed / built / turned over using revenues from
the socialized housing tax?
- How many socialized housing units have been
HCDRD; City Budget Office; SAU
Interview and
secondary data

34
- Variation (increase or decrease) in
amount allocated in annual budget for
socialized housing
committed / built / turned over under the balanced
housing policy?
- How many socialized housing units were built and
turned over by the city in the 5 years before the
implementation of the idle lands tax?
- How much has been allotted every year by the city
for housing since the implementation of the idle
lands and socialized housing taxes?
- How much was allotted by the city for housing in the
5 years before the implementation of the idle lands
and socialized housing taxes?
HCDRD; City Budget Office; SAU
Interview and
secondary data
Qualitative:
- Cost to beneficiaries
- Location
- Amenities
- Services provided in housing delivery
- Clarity and transparency in utilizing
the contributions for provision of
socialized housing
- What is the cost to beneficiaries of the socialized
housing units built from the idle lands and socialized
housing taxes?
- Where are the socialized housing units built from the
idle lands and socialized housing taxes located?
- What amenities were provided?
- What is the profile of the beneficiaries of the idle
lands and socialized housing taxes?
- How were they screened?
- What is the cost to beneficiaries of the socialized
housing units built under the balanced housing
policy?
- Where are the socialized housing units built under
the balanced housing policy located?
- What amenities were provided?
- What is the profile of the beneficiaries of the
balanced housing policy?
- How were they screened?
- Do prospective beneficiaries know how and where
the contributions from the idle lands tax / socialized
housing tax / balanced housing policy should be
spent?
HCDRD; Urban poor representative in
the Local Housing Board (LHB)
HCDRD; NHA; Urban poor
representative in the LHB
Urban poor representative in the LHB
Interview and
secondary data
Interview and
secondary data
Interview and
secondary data

35
3.3 Data Sources and Collection Methods
To address the research questions, data was collected from official documents, reports, and
semi-structured interviews with key informants. The offices that provided information, in the
form of interviews and/or documents were the following:
Table 4. Sources of Data
Local/national agency Type of information Supporting document
City Assessor’s Office
(Quezon City)
Market values (Equity) Registration data sheets
Schedule of fair market
values (Equity)
City Ordinance No. 357,
Series of 1995
Base, exemptions and rates
for idle lands and socialized
housing taxes (Efficiency)
Quezon City Revenue Code;
Socialized Housing Tax
Ordinance
Assessment methodology
(Equity and Efficiency)
Bureau of Local Government
Finance Circulars
City Budget Department
(Quezon City)
Budget allocations for
housing (Effectiveness)
State of the City Address
City Planning and
Development Office (Quezon
City)
Housing need (Effectiveness) Quezon City Shelter Plan
City Treasurer’s Office
(Quezon City)
Real estate tax collections
(Efficiency)
Collection reports
Tax payment procedures
(Efficiency)
Forms and posters
Housing and Land Use
Regulatory Board
Compliance guidelines for
balanced housing (Equity and
Efficiency)
Board Resolution;
Memorandum Circulars
Housing, Community
Development and
Resettlement Department
(Quezon City)
Housing services and
projects provided by the city
(Effectiveness)
Accomplishment reports
Information Technology
Development Office (Quezon
City)
Taxable real estate properties
(Efficiency)
Assessment reports
Local Housing Board
(Quezon City) – Urban poor
representative
Knowledge about housing
services, projects and budget
provided by the city for
housing (Effectiveness)
National Housing Authority Guidelines for socialized
housing units participation
trust fund (Efficiency and
Effectiveness)
Memorandum Circulars;
Accomplishment reports;
Sample computations
Social Housing Finance
Corporation
Market values (Equity) List of approved housing
project loans
Subdivision Administration
Unit (Quezon City)
Land area of subdivisions
given development permits
(Efficiency)
Accomplishment reports
36
As discussed in previous sections, equity is taken up in the concepts of horizontal and vertical
equity, using the indicators of coefficient of dispersion (COD) and price-related differential
(PRD) respectively. For both COD and PRD, the data required to derive them are assessed
values and market values.
The sources of market values for this study are sale prices and appraisals. Sale prices were
taken from sales data regularly collected by the City Assessor’s Office to keep track of
prevailing property prices. Appraised values were taken from the published list of socialized
housing projects financed by the Social Housing Finance Corporation.
Only transactions on vacant land were used for this study in order to remove the need to
extract land values from property prices as well as to eliminate the attributes of improvements
from the appraisals and market considerations. For the latter reason, a group of appraisals on
property (land and improvements) from a private bank was not included in this study.
The source for assessed values is City Ordinance No. 357, Series of 1995, which contains the
schedule of fair market values used for real property assessment.
For the efficiency aspect, the variables of Base, Rate, Coverage, Valuation, and Collection all
required quantitative data from various government sources.
The Base is taxable value measured in land area and price per unit area, based on the policy
set by law on what properties and taxpayers are to be covered by the tax. Quantitative data for
the base came from information from the City Assessor’s Office as well as the Quezon City
Information Technology Development Office (QC-ITDO). The Rate is a percentage also set
by law.
Coverage is the land area of properties that are actually in the cadastre as a percentage of the
total land area that should be in the cadastre. Information on Coverage also came from the
City Assessor’s Office and QC-ITDO.
Valuation is the percentage of the taxable value that is identified by the valuation process.
Here the quantified equity results of the price related differential was plugged into the
Valuation variable of the efficiency formula.
For the variable of Collection, Collection Reports from the City Treasurer’s Office provided
the data for actual collections, while the QC-ITDO provided information on taxes due.
Effectiveness was studied in terms of the intentions of the national and local laws creating
idle lands tax, socialized housing tax and the balanced housing policy. Thus, the indicators
are a mix of quantitative and qualitative data: numbers of housing units, the housing need,
location and amenities provided for socialized housing, and the resulting increase (or
decrease) in the city government’s resources for housing.
Information for the effectiveness indicators came from the Housing, Community
Development and Resettlement Department, the City Budget Department, the urban poor
representative to the Local Housing Board, the City Planning and Development Office, the
Subdivision Administration Unit, and the National Housing Authority.
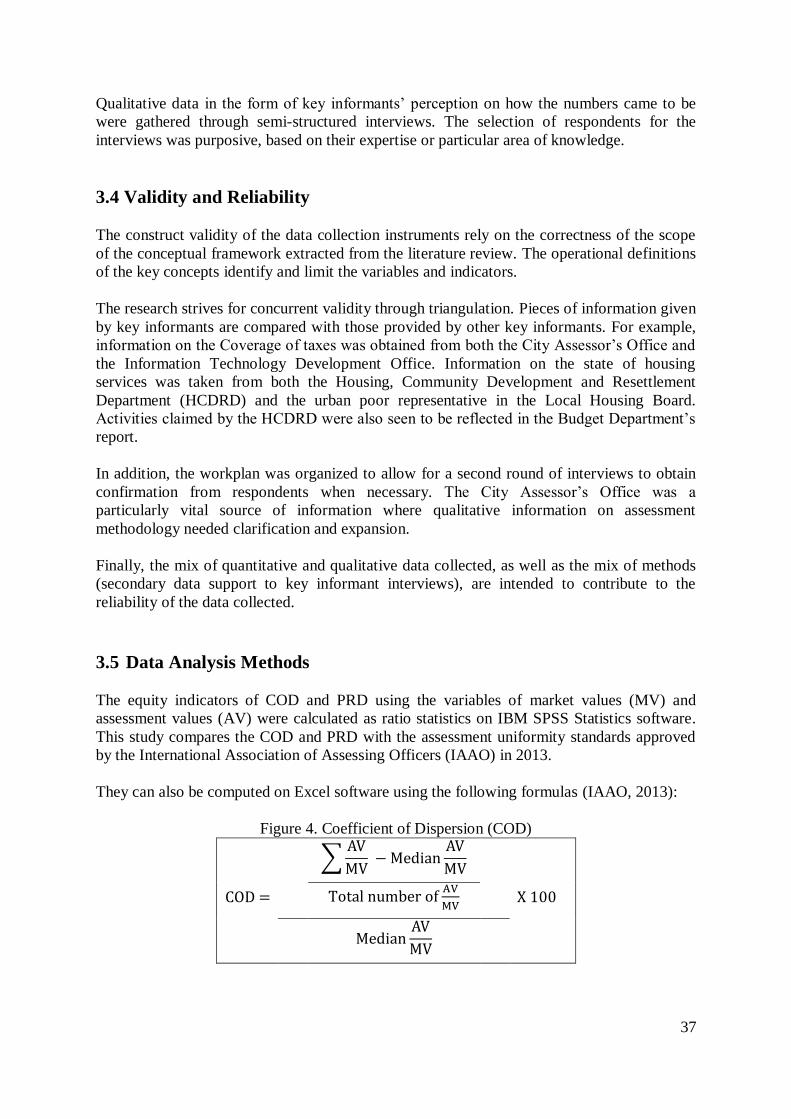
37
Qualitative data in the form of key informants’ perception on how the numbers came to be
were gathered through semi-structured interviews. The selection of respondents for the
interviews was purposive, based on their expertise or particular area of knowledge.
3.4 Validity and Reliability
The construct validity of the data collection instruments rely on the correctness of the scope
of the conceptual framework extracted from the literature review. The operational definitions
of the key concepts identify and limit the variables and indicators.
The research strives for concurrent validity through triangulation. Pieces of information given
by key informants are compared with those provided by other key informants. For example,
information on the Coverage of taxes was obtained from both the City Assessor’s Office and
the Information Technology Development Office. Information on the state of housing
services was taken from both the Housing, Community Development and Resettlement
Department (HCDRD) and the urban poor representative in the Local Housing Board.
Activities claimed by the HCDRD were also seen to be reflected in the Budget Department’s
report.
In addition, the workplan was organized to allow for a second round of interviews to obtain
confirmation from respondents when necessary. The City Assessor’s Office was a
particularly vital source of information where qualitative information on assessment
methodology needed clarification and expansion.
Finally, the mix of quantitative and qualitative data collected, as well as the mix of methods
(secondary data support to key informant interviews), are intended to contribute to the
reliability of the data collected.
3.5 Data Analysis Methods
The equity indicators of COD and PRD using the variables of market values (MV) and
assessment values (AV) were calculated as ratio statistics on IBM SPSS Statistics software.
This study compares the COD and PRD with the assessment uniformity standards approved
by the International Association of Assessing Officers (IAAO) in 2013.
They can also be computed on Excel software using the following formulas (IAAO, 2013):
Figure 4. Coefficient of Dispersion (COD)
COD =
Total number of
X 100
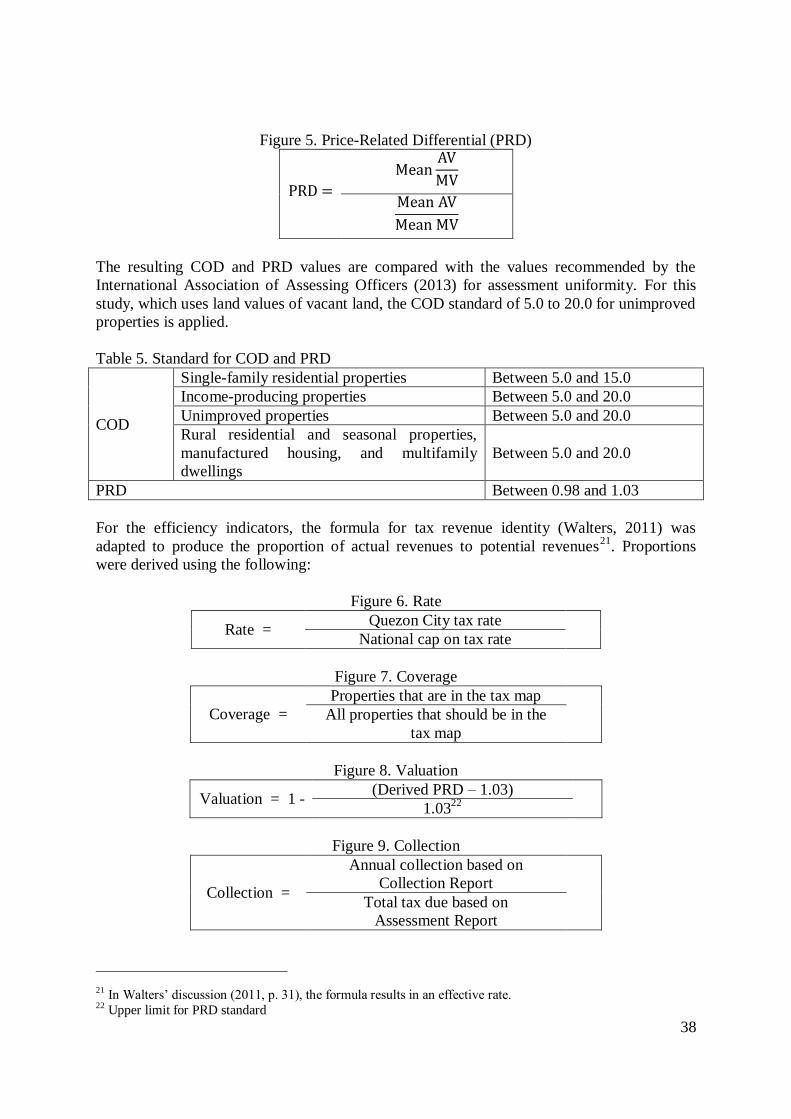
38
Figure 5. Price-Related Differential (PRD)
PRD =
The resulting COD and PRD values are compared with the values recommended by the
International Association of Assessing Officers (2013) for assessment uniformity. For this
study, which uses land values of vacant land, the COD standard of 5.0 to 20.0 for unimproved
properties is applied.
Table 5. Standard for COD and PRD
COD
Single-family residential properties Between 5.0 and 15.0
Income-producing properties Between 5.0 and 20.0
Unimproved properties Between 5.0 and 20.0
Rural residential and seasonal properties,
manufactured housing, and multifamily
dwellings
Between 5.0 and 20.0
PRD Between 0.98 and 1.03
For the efficiency indicators, the formula for tax revenue identity (Walters, 2011) was
adapted to produce the proportion of actual revenues to potential revenues21
. Proportions
were derived using the following:
Figure 6. Rate
Rate = Quezon City tax rate
National cap on tax rate
Figure 7. Coverage
Coverage =
Properties that are in the tax map
All properties that should be in the
tax map
Figure 8. Valuation
Valuation = 1 - (Derived PRD – 1.03)
1.0322
Figure 9. Collection
Collection =
Annual collection based on
Collection Report
Total tax due based on
Assessment Report
21 In Walters’ discussion (2011, p. 31), the formula results in an effective rate. 22 Upper limit for PRD standard
39
With Base equal to 100%, the ideal result for Base X Rate X Coverage X Valuation X
Collection is 100%.
40
Chapter 4: Research Findings
4.1 The Institutional Context of the Case Study
4.1.1 Policies governing the implementation of the idle lands tax, socialized
housing tax, and balanced housing in Quezon City
As discussed in Chapter 1, the three instruments of land value capture in this study are
enabled by national legislation, for local government units in the Philippines to implement
according to their powers to “generate and apply resources” (LGC 1991, Section 132). The
idle lands tax, the socialized housing tax, and the balanced housing policy are all provided in
the Urban Development and Housing Act (UDHA) of 1992 as means of mobilizing resources
for socialized housing. Before that, the Local Government Code (LGC) of 1991 had
authorized local governments to levy the idle lands tax as a means for raising general funds.
The idle lands tax became part of the city’s taxing powers with the adoption of the Quezon
City Revenue Code of 1993. By decision of the city executives, however, the idle lands tax
only started to be collected in the year 2011. Only seven other cities in the Philippines have
empowered themselves to collect the idle lands tax.
Like the Local Government Code, the Quezon City Revenue Code does not earmark the idle
lands tax for housing. In official pronouncements and practice, though, the revenues from the
idle lands tax have been committed to the socialized housing projects of the city. The purpose
of the tax is expected to be clarified by an ordinance which, as of July 2013, was due for final
reading at the City Council. The draft ordinance creates the city’s “Socialized Housing
Special Account,” which puts the idle lands tax revenues along with other housing-related
collections in a fund reserved exclusively for the development and improvement of socialized
housing projects of the City (PO2013-35 Draft Ordinance 2013, Sections 1 and 3).
The socialized housing tax, on the other hand, is clearly an earmarked tax. The Socialized
Housing Tax Ordinance enacted in 2011 states that the tax is intended to provide the city with
“sufficient funds to initiate, implement and undertake socialized housing projects and other
related preliminary activities” (Socialized Housing Tax Ordinance 2011).
The tax started to be collected in 2012. As of this writing, no other city in the Philippines has
adopted the socialized housing tax.
In contrast to the taxes which are backed up by city ordinance, the balanced housing
provision in UDHA has not been localized in Quezon City by ordinance or executive
issuance. By default, the implementation of the provision in the city is governed by the
Implementing Rules and Regulations (IRR) formulated by a national agency, the Housing
and Land Use Regulatory Board (HLURB).
The latest version of the IRR was issued in 2012 through Board Resolution 89023
. Subsequent
Memorandum Circulars in 201324
, also from HLURB, give further details on how the
23 Revised Implementing Rules and Regulations to Govern Section 18 of Republic Act No. 7279 Otherwise
Known as the Urban Development and Housing Act of 1992

41
balanced housing provision may be complied. Board Resolution 890 and the 2013 Circulars
repeal previous balanced housing IRRs that are inconsistent with the new guidelines.
4.1.2 Organizational mechanisms for implementation
After approval by the City Council of the local legislation, the City Assessor’s Office and the
City Treasurer’s Office take on the biggest tasks in the tax effort.
The City Assessor’s Office is responsible for:
- Appraising real properties through field inspections and verification of full market values
through the use of accepted methods
- Maintaining subsidiary records for purposes of periodical adjustment of schedule of
values and general re-assessment
- Accounting of real properties
- Establishing a systematic method of real property identification, assessment and
accounting
- Maintaining a system of tax mapping shoring geographically all properties subject to
assessment
(Quezon City 2013, City Assessor’s Department)
On the other hand, the functions of the City Treasurer’s Office with regard to taxes are as
follows:
- Issuing revenue receipts and disbursements of the city government
- Billing and collecting real property and business taxpayers
- Sending demand letters and notices to delinquent realty and business taxpayers
- Conducting examinations of financial records to determine the correctness of taxes paid
by business taxpayers
(Quezon City 2013, City Treasurer’s Office)
The Offices of the City Assessor and the City Treasurer receive support from the Information
and Technology Development Office (QC-ITDO), which is responsible for “integrating . . .
the city government’s (information technology) structures and systems”, and thus for
“minimizing the processing time of . . . information-based public transactions.” QC-ITDO is
in charge of establishing an “electronic data center that consolidates and archives all
information pertinent to the city government’s plans, programs and projects” (Quezon City
2013, QC Information Technology Development Office).
The City Budget Office and the City Accounting Department provide related work in the
preparation of financial programs and reports for the city, which include the revenues and
utilization of the idle lands and socialized housing taxes.
In the utilization of revenues from the idle lands and socialized housing taxes, the city’s
Housing, Community Development and Resettlement Department is mandated to take the
lead through the design and implementation of programs for the city’s underprivileged
residents and informal settlers (Quezon City 2013, Housing and Community Development
and Resettlement Department).
24 HLURB Memorandum Circular Nos. 01, 02, 02A, 03, 04, 05, 06, 07, 07A, 10, and 13, all Series of 2013

42
However, if and when the Socialized Housing Special Account is created by ordinance, the
Local Housing Board will be the approving body for disbursements from the account into
which the idle lands and socialized housing taxes shall have been paid. The Local Housing
Board is a multi-stakeholder mechanism mandated to “formulate, develop and ensure the
implementation of policies in the provision of housing and resettlement areas,” and to ensure
“observance of the rights of the underprivileged and homeless” in cases of eviction and
demolition (Local Housing Board Ordinance 2002). It is composed of government and non-
government representatives, with the Mayor as the Chairperson.
For balanced housing, the agency principally responsible is a national agency, the Housing
and Land Use Regulatory Board (HLURB). It is the agency authorized to issue and interpret
guidelines for balanced housing compliance. It is also the agency responsible for monitoring
and enforcing compliance through approval or withholding a housing development project’s
Certificate of Registration and License to Sell.
Several other national government agencies may become involved in balanced housing
through the various manners of compliance allowed to developers. These include the
National Housing Authority (if a developer opts to contribute to slum upgrading), the Social
Housing Finance Corporation (for contributions to projects under the Community Mortgage
Program), and any housing agency that issues bonds or securities, or is interested in a joint-
venture arrangement.
Local government units may also be involved if a developer opts to contribute or form a
joint-venture project with them.
4.1.3 Taxable land values in Quezon City
The Quezon City Revenue Code mandates that all real property shall be appraised at current
and fair market value using the government schedule of fair market values as basis.
Assessment levels are then applied to the current and fair market value to determine the
taxable value of a property. Assessment levels for land in Quezon City are set according to
the following classifications:
Table 6. Assessment Levels
Residential 18%
Commercial 45%
Industrial 45%
Agricultural 18%
The City Ordinance approved in 1995 remains the reference for the schedule of fair market
values used for real property assessment. The ordinance divides the city into assessment
districts and identifies the classifications (residential, commercial, industrial, institutional)
and sub-classifications of given areas in each assessment district.
The schedule of fair market values for residential land is specified in the Ordinance as
follows:
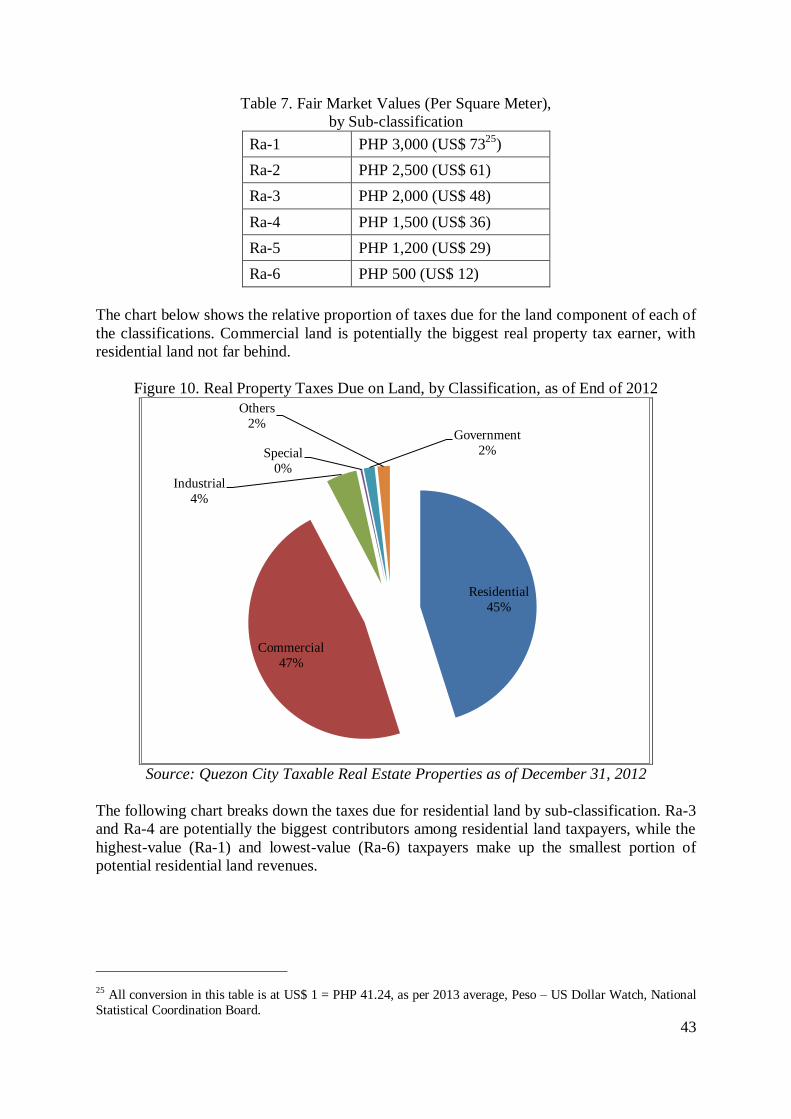
43
Table 7. Fair Market Values (Per Square Meter),
by Sub-classification
Ra-1 PHP 3,000 (US$ 7325
)
Ra-2 PHP 2,500 (US$ 61)
Ra-3 PHP 2,000 (US$ 48)
Ra-4 PHP 1,500 (US$ 36)
Ra-5 PHP 1,200 (US$ 29)
Ra-6 PHP 500 (US$ 12)
The chart below shows the relative proportion of taxes due for the land component of each of
the classifications. Commercial land is potentially the biggest real property tax earner, with
residential land not far behind.
Figure 10. Real Property Taxes Due on Land, by Classification, as of End of 2012
Source: Quezon City Taxable Real Estate Properties as of December 31, 2012
The following chart breaks down the taxes due for residential land by sub-classification. Ra-3
and Ra-4 are potentially the biggest contributors among residential land taxpayers, while the
highest-value (Ra-1) and lowest-value (Ra-6) taxpayers make up the smallest portion of
potential residential land revenues.
25 All conversion in this table is at US$ 1 = PHP 41.24, as per 2013 average, Peso – US Dollar Watch, National
Statistical Coordination Board.
Residential
45%
Commercial
47%
Industrial
4%
Special
0%
Government
2%
Others
2%
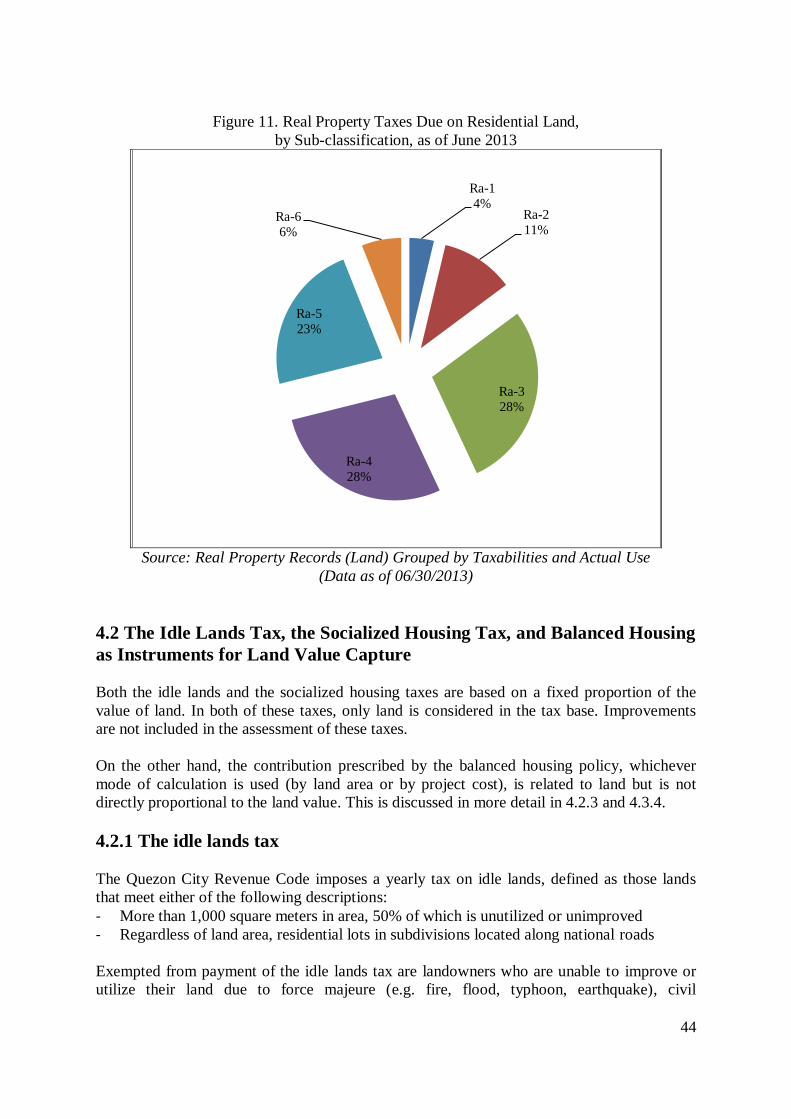
44
Figure 11. Real Property Taxes Due on Residential Land,
by Sub-classification, as of June 2013
Source: Real Property Records (Land) Grouped by Taxabilities and Actual Use
(Data as of 06/30/2013)
4.2 The Idle Lands Tax, the Socialized Housing Tax, and Balanced Housing
as Instruments for Land Value Capture
Both the idle lands and the socialized housing taxes are based on a fixed proportion of the
value of land. In both of these taxes, only land is considered in the tax base. Improvements
are not included in the assessment of these taxes.
On the other hand, the contribution prescribed by the balanced housing policy, whichever
mode of calculation is used (by land area or by project cost), is related to land but is not
directly proportional to the land value. This is discussed in more detail in 4.2.3 and 4.3.4.
4.2.1 The idle lands tax
The Quezon City Revenue Code imposes a yearly tax on idle lands, defined as those lands
that meet either of the following descriptions:
- More than 1,000 square meters in area, 50% of which is unutilized or unimproved
- Regardless of land area, residential lots in subdivisions located along national roads
Exempted from payment of the idle lands tax are landowners who are unable to improve or
utilize their land due to force majeure (e.g. fire, flood, typhoon, earthquake), civil
Ra-1
4% Ra-2
11%
Ra-3
28%
Ra-4
28%
Ra-5
23%
Ra-6
6%

45
disturbance, pending litigation, or the presence of squatters, or due to the failure of the
developer to make site improvements on the residential subdivision according to plan.
The tax rate is two-tier:
- Three percent (3%) of the assessed value for properties located along national roads
- One percent (1%) of the assessed value for idle lands in other areas
Although the Local Government Code empowers provinces and cities to impose an idle lands
tax up to five percent (5%) of the assessed values, Quezon City has chosen to enact the
abovementioned lower rates. These rates for idle lands are collected in addition to the basic
real property tax.
According to the city’s website, the idle lands tax “raise(s) revenues for the city’s socialized
housing projects while encouraging . . . landowners to make their lands productive” (Quezon
City 2013, Socialized housing tax will remove urban blight).
4.2.2 The socialized housing tax
The socialized housing tax is levied on all lands in the city with assessed values of more than
PHP 100,000 (US$ 2,425)26
. In terms of the rate and its objectives, the city ordinance hews
closely to the Urban Development and Housing Act, the national law that enables local
governments to impose the socialized housing tax. The rate is one-half percent (0.5%) of the
assessed value of the property, and the sole purpose of the tax is to provide the city
government with funds for the initiation and implementation of socialized housing projects.
There is a difference in the threshold, though, with UDHA exempting lands with assessed
value only below PHP 50,000 (US$ 1,212)27
. The higher threshold of Quezon City allows
more taxpayers to be exempted than would have been with the lower threshold of UDHA.
The ordinance however adds provisions that are not envisioned in the national law. One
provision makes the socialized housing tax a special assessment that is imposed for a period
of five (5) years only (calendar years 2012 to 2016).
Another provision transforms the socialized housing tax payments into tax credits for those
who have dutifully paid the special assessment for five years. The tax credits may be enjoyed
(deducted from the real property tax due) in equal amounts (20% of total socialized housing
taxes paid) over the five years (2017 to 2021) following the five years of socialized housing
tax payments.
The city government added these provisions because it expects that after the five-year period,
the socialized housing program shall be able to finance itself from the long-term financing
institutions and from the amortization payments of the beneficiaries (Quezon City 2013,
Socialized housing tax will remove urban blight).
26 At US$ 1 = PHP 41.24, per Peso – US Dollar Watch, National Statistical Coordinating Board 27 Ibid.

46
4.2.3 Balanced housing
As noted in 4.2, the contribution prescribed by the balanced housing policy, whichever mode
of calculation is used (by land area or by project cost), is related to land but is not directly
proportional to its value.
The rate of compliance required by the balanced housing policy (UDHA 1992, Sec. 18) from
housing developers is the development of an area for socialized housing equivalent to at least
1) 20 percent of the total subdivision area, or 2) 20 percent of total subdivision project cost, at
the option of the developer. The contribution should be made within the same city or
municipality whenever feasible, but could also be made elsewhere in the country.
For the first option, the contribution is explicitly land-based, although the rate is computed by
area and not by value.
For the second option, the cash contribution is based on the value of both land and
improvements. There are several manners of compliance given by the guidelines but the
Memorandum Circulars emphasize that the computation of 20% project cost should be the
basic consideration for this alternative. The various ways of complying through 20% project
cost are:
- Development of new settlement through 1) joint-venture with a developer of socialized
housing, 2) contribution to a non-profit developer of socialized housing, or 3) provision
of basic amenities and facilities in socialized housing projects
- Slum upgrading in cooperation with the National Housing Authority
- Joint-venture project with a local government or national housing agency through 1)
cooperation with the Housing and Land Use Regulatory Board on a socialized housing
project, 2) purchase of socialized housing bonds, 3) rehabilitation of non-performing
socialized housing assets, or 4) provision of basic amenities and facilities in socialized
housing projects
- Participation in the Community Mortgage Program (CMP) of the Social Housing Finance
Corporation (SHFC) by 1) providing a parcel of land to a CMP project, 2) providing or
developing road right-of-way or upgrading of amenities of a CMP project, or 3)
purchasing asset-backed securities conveyed by SHFC
(HLURB Board Resolution 890 2012, Section 4)
All subdivision projects with housing units above the ceiling price for socialized housing are
required to comply with this policy.
4.3 Indicators of Equity
4.3.1 Description of dataset
The sample data used for examining assessment equity comes from two sources: 1) records of
registration of new ownership for issuance of tax declaration compiled by the Quezon City
Assessor’s Office, and 2) the online list of housing project loans appraised and approved by
the Social Housing Finance Corporation (SHFC).
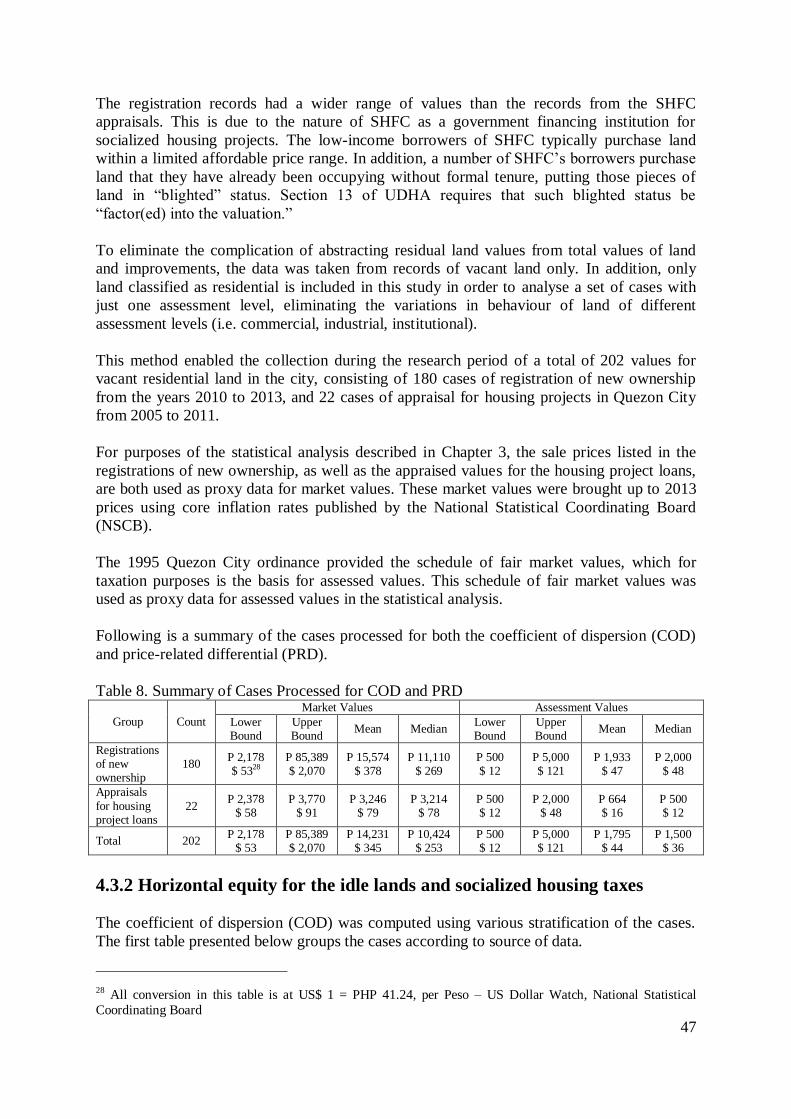
47
The registration records had a wider range of values than the records from the SHFC
appraisals. This is due to the nature of SHFC as a government financing institution for
socialized housing projects. The low-income borrowers of SHFC typically purchase land
within a limited affordable price range. In addition, a number of SHFC’s borrowers purchase
land that they have already been occupying without formal tenure, putting those pieces of
land in “blighted” status. Section 13 of UDHA requires that such blighted status be
“factor(ed) into the valuation.”
To eliminate the complication of abstracting residual land values from total values of land
and improvements, the data was taken from records of vacant land only. In addition, only
land classified as residential is included in this study in order to analyse a set of cases with
just one assessment level, eliminating the variations in behaviour of land of different
assessment levels (i.e. commercial, industrial, institutional).
This method enabled the collection during the research period of a total of 202 values for
vacant residential land in the city, consisting of 180 cases of registration of new ownership
from the years 2010 to 2013, and 22 cases of appraisal for housing projects in Quezon City
from 2005 to 2011.
For purposes of the statistical analysis described in Chapter 3, the sale prices listed in the
registrations of new ownership, as well as the appraised values for the housing project loans,
are both used as proxy data for market values. These market values were brought up to 2013
prices using core inflation rates published by the National Statistical Coordinating Board
(NSCB).
The 1995 Quezon City ordinance provided the schedule of fair market values, which for
taxation purposes is the basis for assessed values. This schedule of fair market values was
used as proxy data for assessed values in the statistical analysis.
Following is a summary of the cases processed for both the coefficient of dispersion (COD)
and price-related differential (PRD).
Table 8. Summary of Cases Processed for COD and PRD
Group Count
Market Values Assessment Values
Lower Bound
Upper Bound
Mean Median Lower Bound
Upper Bound
Mean Median
Registrations of new ownership
180 P 2,178 $ 5328
P 85,389 $ 2,070
P 15,574 $ 378
P 11,110 $ 269
P 500 $ 12
P 5,000 $ 121
P 1,933 $ 47
P 2,000 $ 48
Appraisals
for housing project loans
22 P 2,378
$ 58 P 3,770
$ 91 P 3,246
$ 79 P 3,214
$ 78 P 500 $ 12
P 2,000 $ 48
P 664 $ 16
P 500 $ 12
Total 202 P 2,178
$ 53 P 85,389 $ 2,070
P 14,231 $ 345
P 10,424 $ 253
P 500 $ 12
P 5,000 $ 121
P 1,795 $ 44
P 1,500 $ 36
4.3.2 Horizontal equity for the idle lands and socialized housing taxes
The coefficient of dispersion (COD) was computed using various stratification of the cases.
The first table presented below groups the cases according to source of data.
28 All conversion in this table is at US$ 1 = PHP 41.24, per Peso – US Dollar Watch, National Statistical
Coordinating Board

48
Table 9. COD for Sub-groups According to Source of Data
Group Count Median of
AV/MV
95% Confidence Interval for Median
COD Lower
Bound
Upper
Bound
Actual
Coverage Registrations of new ownership
180 .173 .150 .182 95.6% 43.7
Appraisals for housing project loans
22 .161 .149 .176 98.3% 35.7
Total 202 .166 .152 .180 95.9% 44.5
For both sub-groups of data, as well as for the whole group, the coefficient of dispersion is
higher than the acceptable range of 5.0 to 20.0 for vacant land (IAAO, 2013). The sub-group
of appraisals is closer to the acceptable range, but is still nearly double the upper limit of the
range. The high CODs indicate a lack of horizontal equity or assessment uniformity.
The second table groups the cases according to the sub-classifications in the schedule of fair
market values.
Table 10. COD for Sub-groups According to Assessment Values
Group Count Median of
AV/MV
95% Confidence Interval for Median
COD Lower
Bound
Upper
Bound
Actual
Coverage Ra-6: P 500 ($ 12)
21 .158 .148 .164 97.3% 12.9
Ra-5: P 1200 ($ 29)
33 .216 .166 .282 96.5% 36.5
Ra-4: P 1500 ($
36) 51 .145 .120 .200 95.1% 47.9
Ra-3: P 2000 ($ 48)
64 .179 .160 .184 96.7% 44.6
Ra-1 and Ra-2: P 2500 ($ 61) and P 3000 ($ 73)
33 .128 .111 .200 96.5% 60.8
When the sample data is stratified according to assessment values, the cases in the lowest-
value group are in the acceptable range. As the assessment values go up, COD strays farther
from the acceptable range for horizontal equity. This means that properties that are paying at
the same assessment values actually have highly variable market values.
Referring to Figure 10, which shows the proportion of taxes due from each of the sub-
classifications, Ra-3, Ra-4 and Ra-5 make up 79% of the taxes due on residential land. They
all exhibit a high degree of horizontal inequity. Ra-6, which has acceptable COD, makes up
only 6% of the taxes due on residential land.
Another way of stratifying attempted in the table below is by market value.
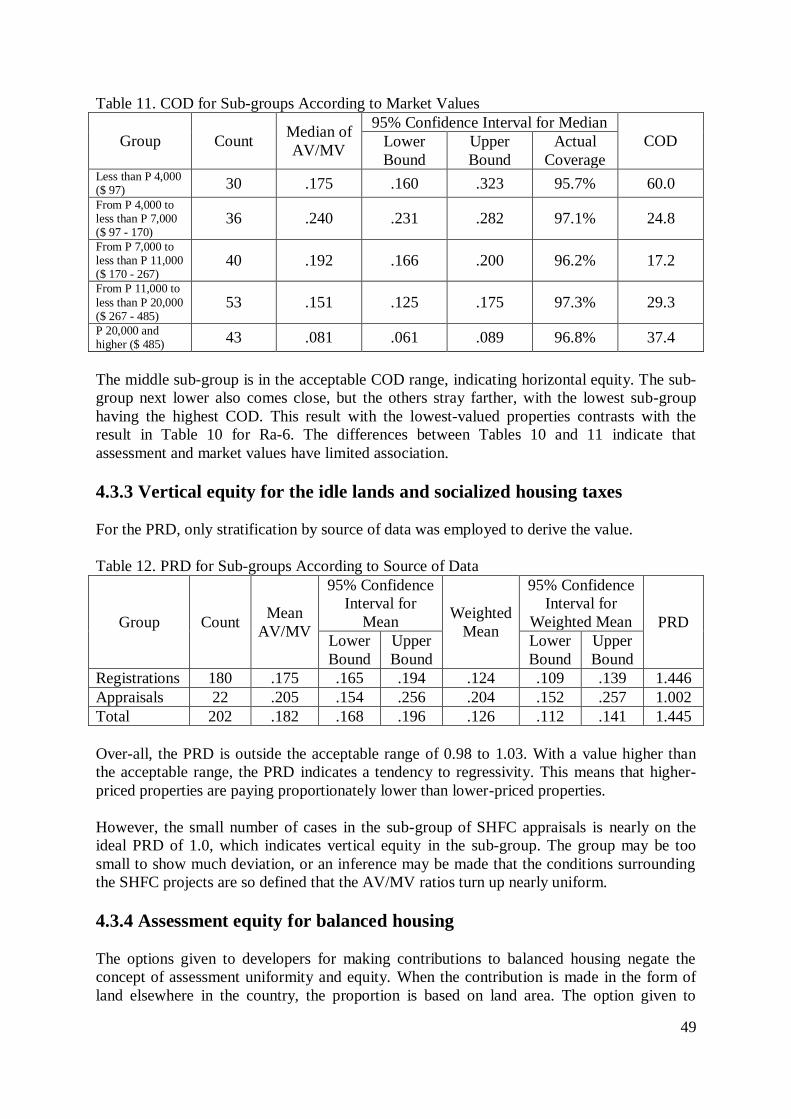
49
Table 11. COD for Sub-groups According to Market Values
Group Count Median of
AV/MV
95% Confidence Interval for Median
COD Lower
Bound
Upper
Bound
Actual
Coverage Less than P 4,000 ($ 97) 30 .175 .160 .323 95.7% 60.0
From P 4,000 to less than P 7,000 ($ 97 - 170)
36 .240 .231 .282 97.1% 24.8
From P 7,000 to less than P 11,000 ($ 170 - 267)
40 .192 .166 .200 96.2% 17.2
From P 11,000 to
less than P 20,000 ($ 267 - 485)
53 .151 .125 .175 97.3% 29.3
P 20,000 and higher ($ 485)
43 .081 .061 .089 96.8% 37.4
The middle sub-group is in the acceptable COD range, indicating horizontal equity. The sub-
group next lower also comes close, but the others stray farther, with the lowest sub-group
having the highest COD. This result with the lowest-valued properties contrasts with the
result in Table 10 for Ra-6. The differences between Tables 10 and 11 indicate that
assessment and market values have limited association.
4.3.3 Vertical equity for the idle lands and socialized housing taxes
For the PRD, only stratification by source of data was employed to derive the value.
Table 12. PRD for Sub-groups According to Source of Data
Group Count Mean
AV/MV
95% Confidence
Interval for
Mean Weighted
Mean
95% Confidence
Interval for
Weighted Mean PRD
Lower
Bound
Upper
Bound
Lower
Bound
Upper
Bound
Registrations 180 .175 .165 .194 .124 .109 .139 1.446
Appraisals 22 .205 .154 .256 .204 .152 .257 1.002
Total 202 .182 .168 .196 .126 .112 .141 1.445
Over-all, the PRD is outside the acceptable range of 0.98 to 1.03. With a value higher than
the acceptable range, the PRD indicates a tendency to regressivity. This means that higher-
priced properties are paying proportionately lower than lower-priced properties.
However, the small number of cases in the sub-group of SHFC appraisals is nearly on the
ideal PRD of 1.0, which indicates vertical equity in the sub-group. The group may be too
small to show much deviation, or an inference may be made that the conditions surrounding
the SHFC projects are so defined that the AV/MV ratios turn up nearly uniform.
4.3.4 Assessment equity for balanced housing
The options given to developers for making contributions to balanced housing negate the
concept of assessment uniformity and equity. When the contribution is made in the form of
land elsewhere in the country, the proportion is based on land area. The option given to

50
developers to locate the compliance project anywhere in the country makes the proportion of
captured land value variable.
When the contribution is a proportion of the total project cost, the base includes both land and
improvements. This makes the proportion of captured residual land value variable, but
because this mode of contribution is value-based, total contributions are in principle made at
a uniform rate.
A challenge for the second mode is the incentive to developers to optimally price any or all of
the project cost components in order to avoid a large contribution.
4.3.5 Perceived issues in achieving equity
In interviews with the City Assessor’s Office and the Subdivision Administration Unit, the
following were cited as areas for improvement:
- The qualification of idle lands as 50% “unutilized” or “unimproved” needs a better
operational definition.
- The schedule of fair market values still based on the 1995 ordinance needs to be updated.
The Assessor’s Office regularly prepares a budget for a general revision, and is capable of
conducting a general revision. However, the budget and the plan for general revision are
also regularly turned down, with city executives and legislators justifying the
postponement with consideration for taxpayers’ economic situation.
- The ruling of the Department of Justice that condominium developments are exempted
from balanced housing has significant adverse effect on the policy’s equal treatment of
developers. (However, there may be confusion about this concern as this research has
failed to turn up documentation of said ruling.)
4.4 Indicators of Efficiency
4.4.1 Base
For the idle lands tax, the base is defined in the Quezon City Revenue Code as: 1) all lands
greater than 1,000 square meters in area, 50% of which is unutilized or unimproved, and 2)
regardless of area, residential lots in subdivisions along existing national roads (Quezon City
Revenue Code 1993, Section 11[a] and [b]).
For the socialized housing tax, the base is all lands with assessed values greater than PHP
100,000 (US$ 2,42529
) (Socialized Housing Tax Ordinance 2011, Section 3). The policy
specifies land as the base of this tax, and a check with assessment reports confirms that
buildings are not included in calculating values for this tax.
For whatever definition the tax policy adopts, in the formula for tax revenue identity, the
Base is assigned the value of 100%.
29 At US$ 1 = PHP 41.24, per Peso – US Dollar Watch, National Statistical Coordinating Board
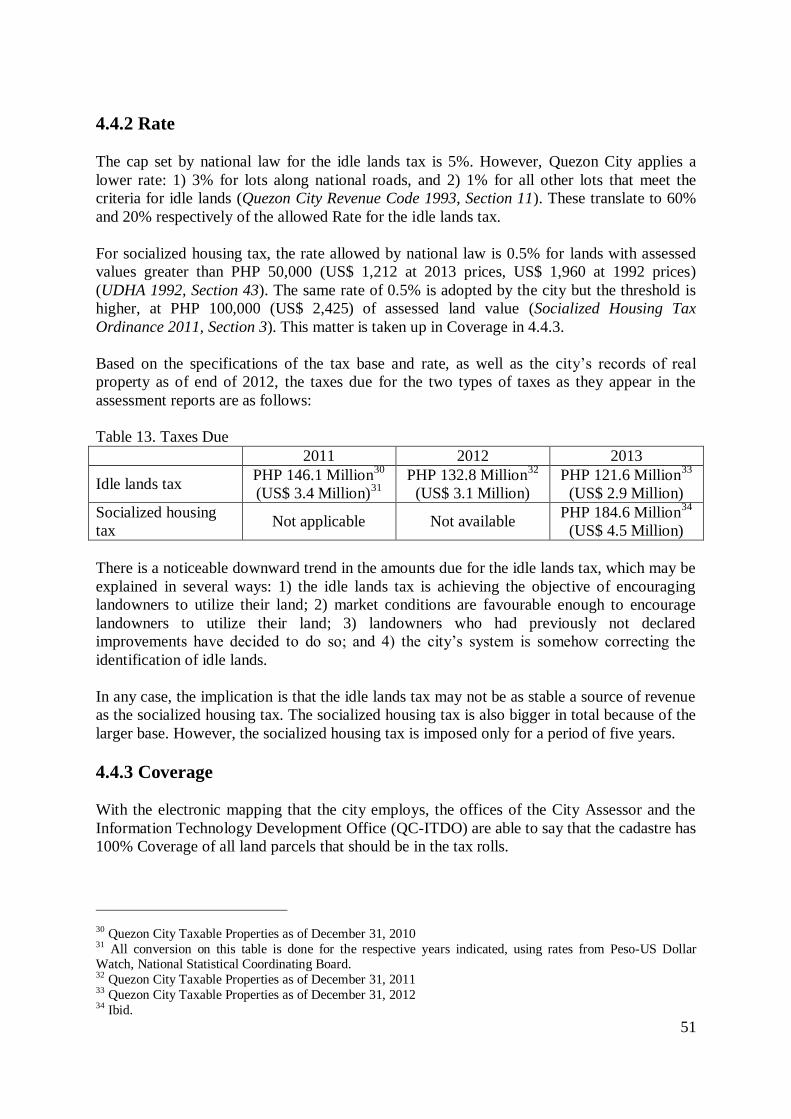
51
4.4.2 Rate
The cap set by national law for the idle lands tax is 5%. However, Quezon City applies a
lower rate: 1) 3% for lots along national roads, and 2) 1% for all other lots that meet the
criteria for idle lands (Quezon City Revenue Code 1993, Section 11). These translate to 60%
and 20% respectively of the allowed Rate for the idle lands tax.
For socialized housing tax, the rate allowed by national law is 0.5% for lands with assessed
values greater than PHP 50,000 (US$ 1,212 at 2013 prices, US$ 1,960 at 1992 prices)
(UDHA 1992, Section 43). The same rate of 0.5% is adopted by the city but the threshold is
higher, at PHP 100,000 (US$ 2,425) of assessed land value (Socialized Housing Tax
Ordinance 2011, Section 3). This matter is taken up in Coverage in 4.4.3.
Based on the specifications of the tax base and rate, as well as the city’s records of real
property as of end of 2012, the taxes due for the two types of taxes as they appear in the
assessment reports are as follows:
Table 13. Taxes Due
2011 2012 2013
Idle lands tax PHP 146.1 Million
30
(US$ 3.4 Million)31
PHP 132.8 Million32
(US$ 3.1 Million)
PHP 121.6 Million33
(US$ 2.9 Million)
Socialized housing
tax Not applicable Not available
PHP 184.6 Million34
(US$ 4.5 Million)
There is a noticeable downward trend in the amounts due for the idle lands tax, which may be
explained in several ways: 1) the idle lands tax is achieving the objective of encouraging
landowners to utilize their land; 2) market conditions are favourable enough to encourage
landowners to utilize their land; 3) landowners who had previously not declared
improvements have decided to do so; and 4) the city’s system is somehow correcting the
identification of idle lands.
In any case, the implication is that the idle lands tax may not be as stable a source of revenue
as the socialized housing tax. The socialized housing tax is also bigger in total because of the
larger base. However, the socialized housing tax is imposed only for a period of five years.
4.4.3 Coverage
With the electronic mapping that the city employs, the offices of the City Assessor and the
Information Technology Development Office (QC-ITDO) are able to say that the cadastre has
100% Coverage of all land parcels that should be in the tax rolls.
30 Quezon City Taxable Properties as of December 31, 2010 31 All conversion on this table is done for the respective years indicated, using rates from Peso-US Dollar Watch, National Statistical Coordinating Board. 32 Quezon City Taxable Properties as of December 31, 2011 33 Quezon City Taxable Properties as of December 31, 2012 34 Ibid.
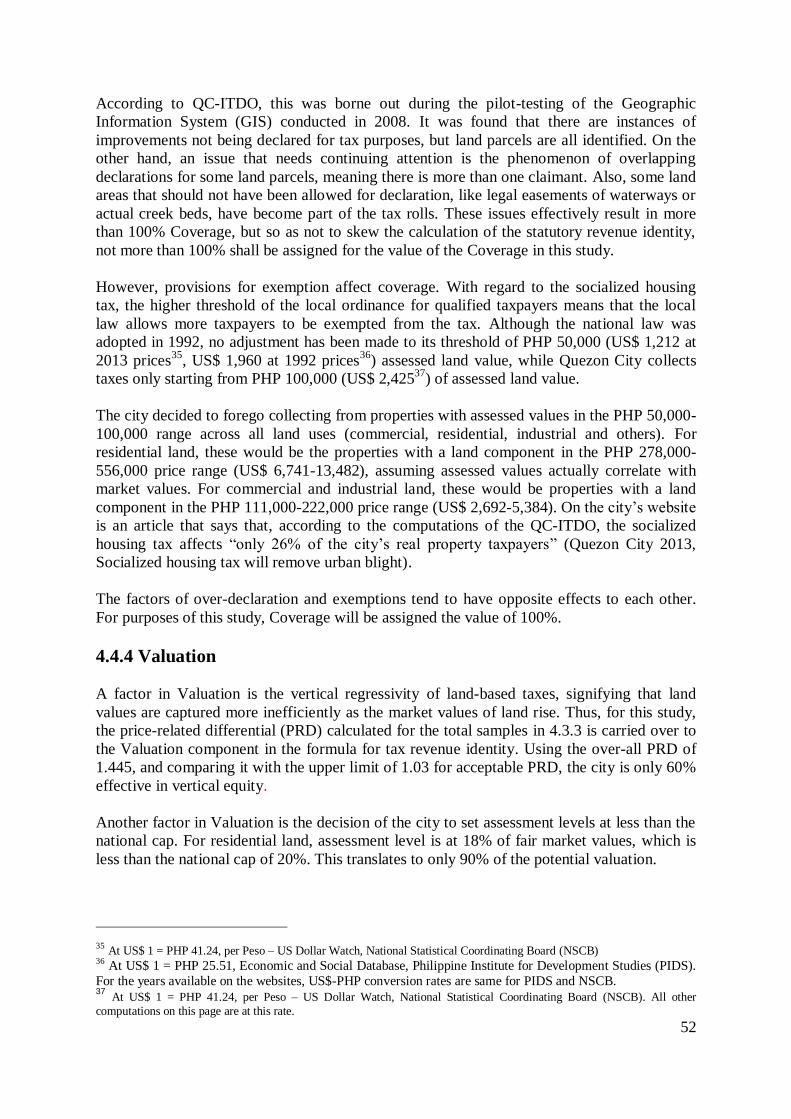
52
According to QC-ITDO, this was borne out during the pilot-testing of the Geographic
Information System (GIS) conducted in 2008. It was found that there are instances of
improvements not being declared for tax purposes, but land parcels are all identified. On the
other hand, an issue that needs continuing attention is the phenomenon of overlapping
declarations for some land parcels, meaning there is more than one claimant. Also, some land
areas that should not have been allowed for declaration, like legal easements of waterways or
actual creek beds, have become part of the tax rolls. These issues effectively result in more
than 100% Coverage, but so as not to skew the calculation of the statutory revenue identity,
not more than 100% shall be assigned for the value of the Coverage in this study.
However, provisions for exemption affect coverage. With regard to the socialized housing
tax, the higher threshold of the local ordinance for qualified taxpayers means that the local
law allows more taxpayers to be exempted from the tax. Although the national law was
adopted in 1992, no adjustment has been made to its threshold of PHP 50,000 (US$ 1,212 at
2013 prices35
, US$ 1,960 at 1992 prices36
) assessed land value, while Quezon City collects
taxes only starting from PHP 100,000 (US$ 2,42537
) of assessed land value.
The city decided to forego collecting from properties with assessed values in the PHP 50,000-
100,000 range across all land uses (commercial, residential, industrial and others). For
residential land, these would be the properties with a land component in the PHP 278,000-
556,000 price range (US$ 6,741-13,482), assuming assessed values actually correlate with
market values. For commercial and industrial land, these would be properties with a land
component in the PHP 111,000-222,000 price range (US$ 2,692-5,384). On the city’s website
is an article that says that, according to the computations of the QC-ITDO, the socialized
housing tax affects “only 26% of the city’s real property taxpayers” (Quezon City 2013,
Socialized housing tax will remove urban blight).
The factors of over-declaration and exemptions tend to have opposite effects to each other.
For purposes of this study, Coverage will be assigned the value of 100%.
4.4.4 Valuation
A factor in Valuation is the vertical regressivity of land-based taxes, signifying that land
values are captured more inefficiently as the market values of land rise. Thus, for this study,
the price-related differential (PRD) calculated for the total samples in 4.3.3 is carried over to
the Valuation component in the formula for tax revenue identity. Using the over-all PRD of
1.445, and comparing it with the upper limit of 1.03 for acceptable PRD, the city is only 60%
effective in vertical equity.
Another factor in Valuation is the decision of the city to set assessment levels at less than the
national cap. For residential land, assessment level is at 18% of fair market values, which is
less than the national cap of 20%. This translates to only 90% of the potential valuation.
35 At US$ 1 = PHP 41.24, per Peso – US Dollar Watch, National Statistical Coordinating Board (NSCB) 36 At US$ 1 = PHP 25.51, Economic and Social Database, Philippine Institute for Development Studies (PIDS).
For the years available on the websites, US$-PHP conversion rates are same for PIDS and NSCB. 37
At US$ 1 = PHP 41.24, per Peso – US Dollar Watch, National Statistical Coordinating Board (NSCB). All other
computations on this page are at this rate.
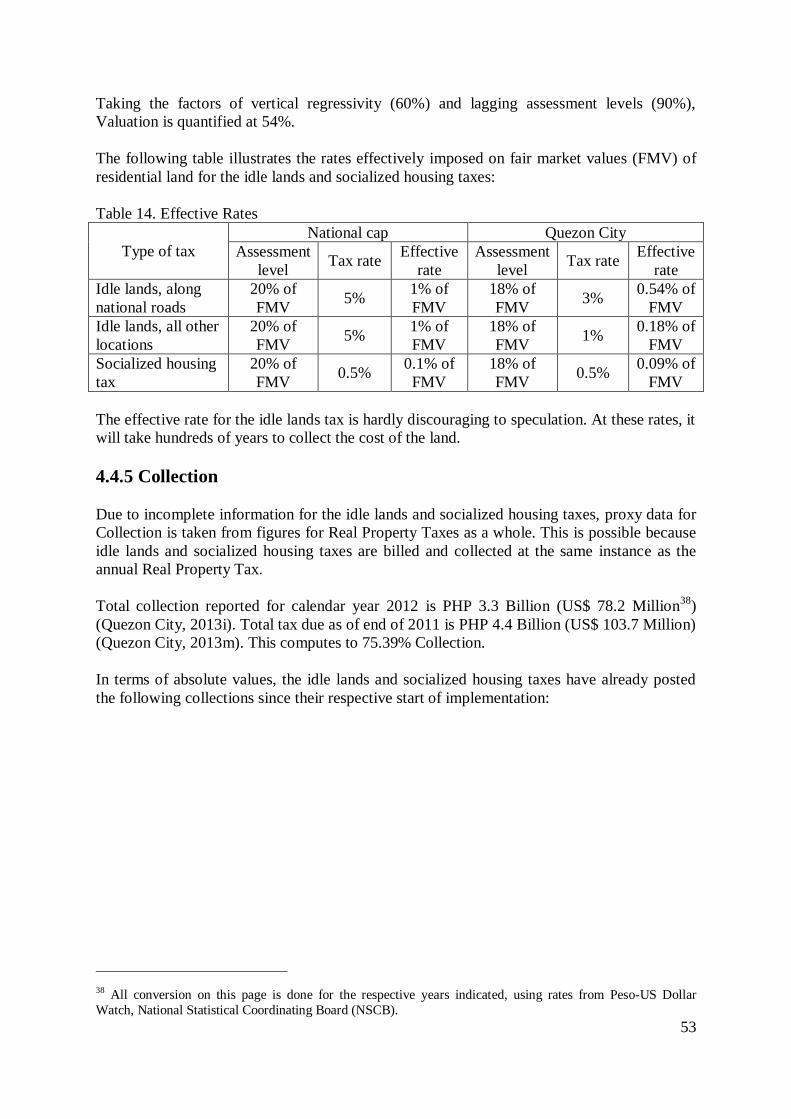
53
Taking the factors of vertical regressivity (60%) and lagging assessment levels (90%),
Valuation is quantified at 54%.
The following table illustrates the rates effectively imposed on fair market values (FMV) of
residential land for the idle lands and socialized housing taxes:
Table 14. Effective Rates
Type of tax
National cap Quezon City
Assessment
level Tax rate
Effective
rate
Assessment
level Tax rate
Effective
rate
Idle lands, along
national roads
20% of
FMV 5%
1% of
FMV
18% of
FMV 3%
0.54% of
FMV
Idle lands, all other
locations
20% of
FMV 5%
1% of
FMV
18% of
FMV 1%
0.18% of
FMV
Socialized housing
tax
20% of
FMV 0.5%
0.1% of
FMV
18% of
FMV 0.5%
0.09% of
FMV
The effective rate for the idle lands tax is hardly discouraging to speculation. At these rates, it
will take hundreds of years to collect the cost of the land.
4.4.5 Collection
Due to incomplete information for the idle lands and socialized housing taxes, proxy data for
Collection is taken from figures for Real Property Taxes as a whole. This is possible because
idle lands and socialized housing taxes are billed and collected at the same instance as the
annual Real Property Tax.
Total collection reported for calendar year 2012 is PHP 3.3 Billion (US$ 78.2 Million38
)
(Quezon City, 2013i). Total tax due as of end of 2011 is PHP 4.4 Billion (US$ 103.7 Million)
(Quezon City, 2013m). This computes to 75.39% Collection.
In terms of absolute values, the idle lands and socialized housing taxes have already posted
the following collections since their respective start of implementation:
38 All conversion on this page is done for the respective years indicated, using rates from Peso-US Dollar
Watch, National Statistical Coordinating Board (NSCB).

54
Table 15. Collections and Taxes Due
2011 2012 January-July 2013
Idle lands
tax
Collections PHP 71.4 Million
(US$ 1.6 Million)
PHP 80.1 Million
(US$ 1.9 Million)
PHP 70.8 Million
(US$ 1.7 Million)
Tax due PHP 146.1 Million
(US$ 3.4 Million)
PHP 132.8 Million
(US$ 3.1 Million)
PHP 121.6 Million
(US$ 2.9 Million)
Proportion 48.9% 60.3% 58.2%
Socialized
housing
tax
Collections Not applicable PHP 140 Million
(US$ 3.3 Million)
PHP 173.4 Million
(US$ 4.2 Million)
Tax due Not applicable Not available PHP 184.6 Million
(US$ 4.5 Million)
Proportion Not applicable Not available 93.9%
Source: Report of Collections for CY 2012
The collections for the first half of 2013 appear high in comparison to the total and the given
period, but this could perhaps be explained by the discounts given by the city for early
payment. Taxpayers are given discounts if they pay the full annual amount at the start of the
year, rather than make the regular quarterly payments.
Since the two taxes are collected in the same way, the variance in the proportion of
collections between the idle lands tax and the socialized housing tax gives rise to the
possibility that, as a whole, taxpayers of the socialized housing tax are more diligent about
paying than the taxpayers who are eligible for the idle lands tax.
In sum, the city collected in 2012 the following tax pesos for each of its residents:
Table 16. Per Capita Collection in 2012
Population 2,761,720
Real property tax PHP 1,195 (US$ 28)
Idle lands tax PHP 29 (US$ 0.69)
Socialized housing tax PHP 51 (US$ 1.2)
A family of five members would theoretically be able to avail of PHP 6,375 (US$ 149.45)
worth of housing services per year.
4.4.6 Levels of efficiency for the idle lands and socialized housing taxes
Taking the indicators of efficiency together, the formula for tax revenue identity calculates as
follows:
Figure 12. Efficiency of the Idle Lands Tax – Upper Limit Base
X Rate
X Coverage
X Valuation
X Collection
= Revenues
100% 60% 100% 54% 75.39% 24.43%
The idle lands tax is currently, at most, at only 24.43% of its potential. The computation
above assumes that all identified idle lands are along national roads and charged the 3% tax
rate.
If that assumption is changed such that half of the taxable value is along national roads, and
half is on other locations, the potential for revenue goes even lower, to 16.28% (The actual
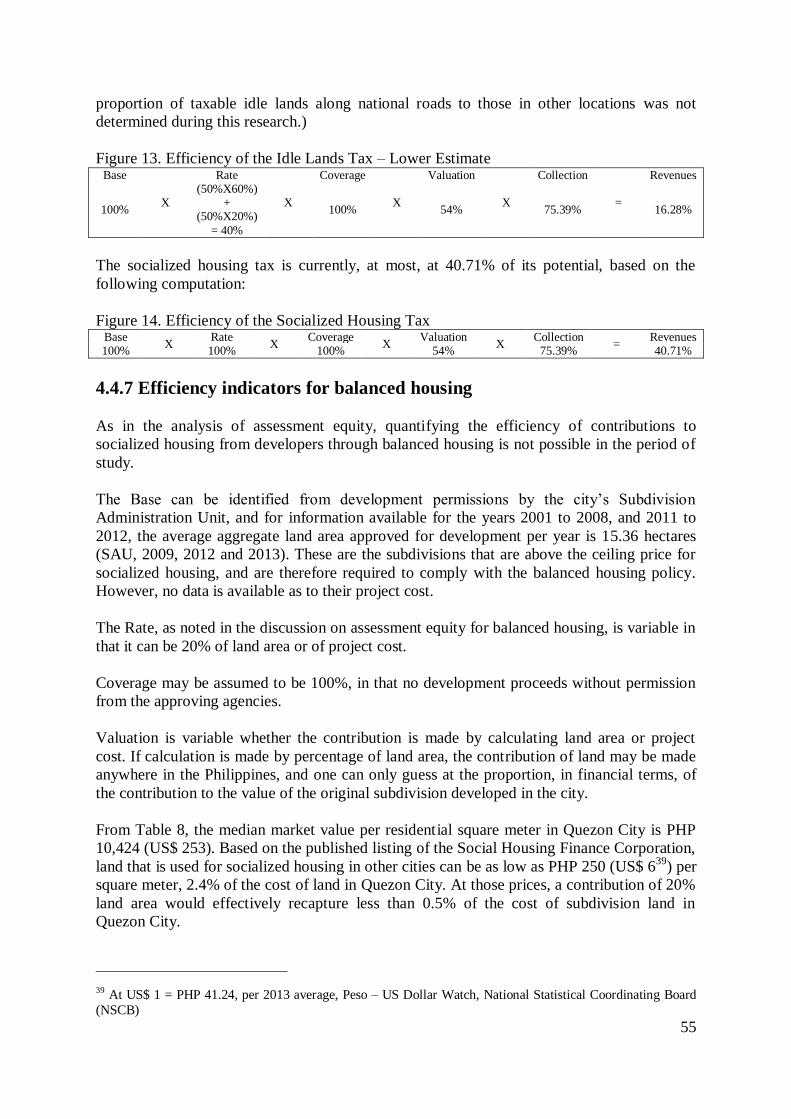
55
proportion of taxable idle lands along national roads to those in other locations was not
determined during this research.)
Figure 13. Efficiency of the Idle Lands Tax – Lower Estimate Base
X
Rate
X
Coverage
X
Valuation
X
Collection
=
Revenues
100%
(50%X60%) +
(50%X20%)
= 40%
100% 54% 75.39% 16.28%
The socialized housing tax is currently, at most, at 40.71% of its potential, based on the
following computation:
Figure 14. Efficiency of the Socialized Housing Tax Base
X Rate
X Coverage
X Valuation
X Collection
= Revenues
100% 100% 100% 54% 75.39% 40.71%
4.4.7 Efficiency indicators for balanced housing
As in the analysis of assessment equity, quantifying the efficiency of contributions to
socialized housing from developers through balanced housing is not possible in the period of
study.
The Base can be identified from development permissions by the city’s Subdivision
Administration Unit, and for information available for the years 2001 to 2008, and 2011 to
2012, the average aggregate land area approved for development per year is 15.36 hectares
(SAU, 2009, 2012 and 2013). These are the subdivisions that are above the ceiling price for
socialized housing, and are therefore required to comply with the balanced housing policy.
However, no data is available as to their project cost.
The Rate, as noted in the discussion on assessment equity for balanced housing, is variable in
that it can be 20% of land area or of project cost.
Coverage may be assumed to be 100%, in that no development proceeds without permission
from the approving agencies.
Valuation is variable whether the contribution is made by calculating land area or project
cost. If calculation is made by percentage of land area, the contribution of land may be made
anywhere in the Philippines, and one can only guess at the proportion, in financial terms, of
the contribution to the value of the original subdivision developed in the city.
From Table 8, the median market value per residential square meter in Quezon City is PHP
10,424 (US$ 253). Based on the published listing of the Social Housing Finance Corporation,
land that is used for socialized housing in other cities can be as low as PHP 250 (US$ 639
) per
square meter, 2.4% of the cost of land in Quezon City. At those prices, a contribution of 20%
land area would effectively recapture less than 0.5% of the cost of subdivision land in
Quezon City.
39 At US$ 1 = PHP 41.24, per 2013 average, Peso – US Dollar Watch, National Statistical Coordinating Board
(NSCB)
56
The option of contributing 20% of the project cost offers a greater opportunity for uniform
valuation, but the challenge is the underlying incentive to developers to optimally price any
or all of the various development components of land, site improvements and building
construction so as to lower the developer’s contribution.
Collection, likewise, cannot be assigned a value as there is as yet no monitoring of housing
production resulting from balanced housing compliance, at either the national or local level of
government. It is too early for data resulting from the 2012-2013 compliance guidelines to be
available. But even with the previous set of IRRs, the only reporting on housing development
available to this researcher that is directly attributed to balanced housing is the Socialized
Housing Units Participation Trust Fund in the books of the National Housing Authority.
Annual reports of the National Housing Authority (NHA) show that PHP 72 Million (US$
1.6 Million40
) and PHP 65 Million (US$ 1.4 Million41
) were paid into the Trust Fund, from
developers’ contributions all over the country, in 2008 (NHA, 2009) and 2009 (NHA, 2010)
respectively. These were the years that the Trust Fund was authorized. The Trust Fund was
allowed to be used in any of the NHA’s project sites (NHA Board Resolution 5056 2007),
regardless of where the contributions originated.
Board Resolution 890 and the 2013 Circulars of the Housing and Land Use Regulatory
Board, which are now the governing balanced housing regulations, likewise have not required
that contributions under the balanced housing policy be made available to the city where the
contribution originated.
4.4.8 Perceived issues in achieving efficiency
Officers in the City Assessor’s Office, Information Technology Development Office, City
Treasurer’s Office, and the Subdivision Administration Unit discussed the following issues
related to efficiency:
- The former city mayor made it his policy to prioritize improvement of collection
efficiency over the imposition of new or higher taxes. Measures to improve collections
included 1) auctioning off delinquent properties, 2) digitization of tax records, 3)
computerized billing, 4) improving security of records, 5) integration of data within the
city for the use of all departments. Eventually, assessment levels were raised in 2005 (e.g.
from 15% to 18% of fair market values for residential land).
- The measures to improve collections succeeded in their purpose for several years.
However, collections levelled off around the years 2006 to 2007, providing indication that
tax rates may have been optimized at that point.
- The city recognized that it is always difficult to introduce new taxes, and the city
departments put effort into providing enough information to taxpayers about the idle
lands and socialized housing taxes. Information was given through mass media, primers,
and big posters at the billing and payment stations.
40 At US$ 1 = PHP 44.48, per 2008 average, Peso – US Dollar Watch, National Statistical Coordinating Board
(NSCB) 41 At US$ 1 = PHP 47.64, per 2009 average, Peso – US Dollar Watch, National Statistical Coordinating Board
(NSCB)

57
- The coverage and therefore the amount of contribution to balanced housing are adversely
affected by the exemption of condominium developments from the policy. However this
was a ruling of the Department of Justice as an interpretation of the law, and may be
challenged. (As noted in 4.3.5, there may be confusion about this concern as this research
has failed to turn up documentation of said ruling.)
- Local government feels powerless to monitor compliance of developers to this policy, as
that role remains with the national agency Housing and Land Use Regulatory Board. As a
result, even to the local government, the degree of efficiency of balanced housing is not
transparent.
4.5 Indicators of effectiveness
4.5.1 Services and budget provided by the city government in the delivery
of socialized housing
As discussed in 4.1.2, the Housing, Community Development and Resettlement Department
is the city’s lead office42
in designing and implementing “short-term and long-term housing
programs and projects . . . for informal settlers and other underprivileged residents” (Quezon
City 2013, Housing, Community Development and Resettlement Department).
Through this Department, the city implements the Direct Sale Program and participates in the
implementation of the nationally-run Community Mortgage Program to help its constituents
access adequate housing. Through the Direct Sale Program, the city itself disposes land that it
already owns or recently acquired by sale or donation. The Community Mortgage Program is
a financing scheme for low-income earners managed by the Social Housing Finance
Corporation, an agency of the national government.
The Department performs the following functions to help low-income households access the
Direct Sale Program, Community Mortgage Program (CMP), and other available housing
assistance:
- Mediate negotiates for land acquisition
- Validate lists of beneficiaries and issue certifications
- Facilitate parcellation of titles for CMP project
- Document the loan process
- Assist national agencies in site studies for housing projects
- Assist in the establishment of community organizations
- Maintain a master list of hold-outs, “professional squatters”, “squatting syndicates”43
, and
help prosecute cases filed by urban poor communities against them
- Assist urban poor families or associations that are the subject of court-ordered eviction or
demolition
- Prepare technical plans pertinent to housing and resettlement projects and attend to the
documentation needed for such projects
42 Another agency under the local government, the Housing and Urban Renewal Authority (HURA), is also mandated to undertake socialized housing projects. 43 These are defined in the Urban Development and Housing Act.

58
- Conduct census and maintain master list of all informal settlers in the city
- Facilitate delivery of basic utilities to socialized housing and relocation communities by
helping to secure clearances, permits and other required documentation
- Monitor and help upgrade collection efficiency rates of housing project beneficiaries
- Issue schedules and orders of payment, as well as demand letters, to Direct Sale Program
beneficiaries
All of the above services are within the scope of the regular services of the Department
personnel and do not require additional funds aside from the Department’s operating budget.
Additional funds are required when services rendered are beyond the above scope.
For instance, in 2009, PHP 108 Million (US$ 2.27 Million44
) was committed by the city to
Direct Sale and CMP projects, meaning the city advanced funds for land purchase and/or
provided site improvements such as road network and drainage. In 2010, PHP 18.5 Million
(US$ 410,112) was allotted to contribute to the community development of a national
government housing project. And from 2007 onwards, PHP 1 Million (US$ 21,669) has been
allotted annually for land survey and titling assistance (UPAO in FDUP, 2011).
In a July 2013 interview, the City Budget Officer discussed that the charging of housing
expenses was improved in 2012, and for that year, the Office can say that of the total PHP
148.8 Million (US$ 3.5 Million) certified expenses for the socialized housing program, PHP
118.6 Million (US$ 2.8 Million) was charged to the block of funds from national government
transfers and PHP 30.2 Million (US$ 715,064) came from locally generated funds.
In the same interview, it was discussed that a total of PHP 49.4 Million (US$ 1.2 Million) has
been spent in the first half of 2013 for the socialized housing program, but the breakdown of
accounts charged is not yet available. According to the Housing, Community Development
and Relocation Department, the expenses include payments to developers of the socialized
housing projects that are supposed to be funded by the idle lands and socialized housing
taxes.
Balanced housing has so far not figured in the programs and budget of the city government,
either as a means to mobilize resources or as a program to support with infrastructure
provided by the city.
4.5.2 Number of units, location and amenities provided for socialized
housing
From 2006 to 2008, before the implementation of the idle lands and socialized housing taxes,
the city contributed to the production of 2,558 units by acting as loan originator for land
purchase through the Community Mortgage Program. In addition, for an unspecified number
of years, the city contributed to a total of 5,203 units through the Direct Sale Program.
44 All conversion on this page is done for the respective years indicated, using rates from Peso-US Dollar
Watch, National Statistical Coordinating Board (NSCB).
59
As noted in 1.2, the Quezon City Shelter Plan (2011) also reports that the average annual
production in the city for socialized housing from 2000 to 2010 was 2,003 units. These
figures include both projects that received, and projects that did not receive, support from the
city government.
In comparison, the city has 2,287 units in on-going and committed projects since 2011,
funded from the idle lands and socialized housing taxes. In the pipeline are projects with a
total of another 3,840 units. The city is advancing payment for land purchase and
construction of housing units, and making an outlay for site improvements (Quezon City,
2013b).
The site improvements include the road network, drainage, parks and open spaces, slope
protection when necessary, and sports facilities for some. These address the requirements of
Section 21 of the Urban Development and Housing Act for basic services that local
government must provide for socialized housing.
According to the Housing, Community Development and Resettlement Department, the cost
of site development is typically subsidized by the city, not included in the computation of
socialized housing beneficiaries’ purchase price, in order to keep the cost to them at
affordable levels. The current ceiling price set by the national government for socialized
housing is PHP 400,000 (US$ 9,69945
).
The Community Mortgage and Direct Sale Programs are both implemented in-city. The
housing projects funded by the idle lands and socialized housing taxes are also implemented
in-city. The total land area in on-going and committed projects is 11.34 hectares, while
another 9.82 hectares are in pipeline projects.
The city government cannot attribute any housing production in the city to contributions from
balanced housing.
The total number of new or upgraded housing units needed by the city’s residents as of 2010
is 276,096. Deducting the numbers for doubled-up households in acceptable housing
(31,631), as well as the number of units needing structural upgrading (7,844), the total
requirement for socialized housing as of 2010 was 236,621 units. This is about a hundredfold
of the average annual production that has been recorded so far.
4.5.3 Perceived issues in achieving effectiveness
The following problems were cited by officers of the Housing, Community Development and
Resettlement Department, the Subdivision Administration Office and the Local Housing
Board as obstacles to better service delivery in housing:
- Long-term financing is very slow in coming from the Home Development Mutual Fund
(HDMF), the government financing institution that is currently being depended on by the
city to roll over the funds it has advanced. This causes the city’s funds to be locked up in
one place for a long time rather than benefit more households and communities. From the
proceeds of the two new taxes, the city had planned to advance payments to landowners,
45 At US$ 1 = PHP 41.24, per 2013 average, Peso – US Dollar Watch, National Statistical Coordinating Board
(NSCB)
60
but not to developers. However, the processing of buyer financing from government
financing institutions has proven to be much slower and more tedious than expected, and
the city has had to make payments to developers in order to keep them working on the
projects.
- The causes of slow processing of financing include 1) tedious requirements, 2)
unwillingness of beneficiaries to cooperate with documentation once they have been
allowed to move in, and 3) difficulty of many prospective beneficiaries in qualifying for
the program of the government financing institution (only the formally employed
qualify).
- The interest rate of HDMF for the lowest bracket has gone up.
- Hold-outs and rival community organizations are able to obstruct development in many
instances by overturning decisions that had already been made by majority of
beneficiaries.
- It is difficult to find relocation areas for resident families that cannot be accommodated in
a re-blocked community. These include families with dwelling structures that are on road
right-of-way.
- The documents from the Bureau of Internal Revenue which are required for loan
documentation, including the Certificate Authorizing Registration, are hard to obtain.
- Overlapping claims and legal challenges to land ownership can halt development.
- Regarding the balanced housing policy, the local government has no powers to monitor
and ensure compliance. The Housing and Land Use Regulatory Board is not compelled to
conduct joint inspections with the local government.
- The ruling of the Department of Justice exempting condominium developments from the
balanced housing policy limits the scope of the program, especially with the growing
number of such developments in the city.
- Compliance to balanced housing is not transparent to its target beneficiaries. Likewise,
reporting on the utilization of the idle lands and socialized housing taxes need to be more
transparent to the groups they are intended to benefit.
Many of the concerns (e.g. bureaucracy, legal challenges) expressed by the local government
officials are unrelated to the three instruments that are the subject of this study in the sense
that the issues cannot be resolved by the local government alone nor by their use of more
funds. However, they are listed here as the views of the officials themselves on the
effectiveness of housing services, which might affect the perception of the effectiveness of
the taxes and policies supporting them.
61
Chapter 5: Conclusions and Recommendations
5.1. Key Findings on the Idle Lands Tax
a. The idle lands tax is de facto earmarked for socialized housing. If the City Ordinance
creating the Socialized Housing Special Account is adopted, it will be earmarked de jure.
b. The idle lands tax is a local tax imposed by the Quezon City Revenue Code, which was
adopted by City Ordinance. The imposition was enabled by two national laws, the Local
Government Code of 1991 and the Urban Development and Housing Act of 1992.
c. The idle lands tax is an instrument for land value capture, with unimproved land as its
base.
d. The tax has two explicit purposes: 1) to generate additional revenues, and 2) to encourage
landowners to initiate development on their land. The low tax rate suggests that it may not
be enough to discourage holding land idle. However, there is a noticeable downward
trend in the amounts due every year for the tax, which may or may not be a result of more
land development encouraged by the idle lands tax.
e. The tax is administered through the efforts of several departments of the city, with a
shared database.
f. Sample cases indicate that the land taxes in Quezon City have a low degree of assessment
equity, horizontally or vertically. The COD results indicate that taxpayers are being
assessed the same even if their market values are disparate, and that as the assessment
value goes up, there is a worsening level of assessment uniformity. However, there are
certain strata among the cases that exhibit horizontal equity. On the other hand, the PRD
results indicate that the taxes tend to be regressive. Higher-valued properties are taxed
proportionately less than lower-valued properties.
g. Real property assessment relies on a schedule of fair market values that dates back to a
City Ordinance adopted in 1995.
h. Efficiency of the idle lands tax in revenue generation is still at only a quarter of its
potential. It is adversely affected by the factors of Rate, Valuation and Collection. Rate
and Valuation in this case are decided by policy, while Collection is affected by
administrative factors.
5.2 Key Findings on the Socialized Housing Tax
a. The socialized housing tax is earmarked for socialized housing.
b. It is a local tax imposed by City Ordinance. The imposition was enabled by a national
law, the Urban Development and Housing Act.
62
c. The socialized housing tax is an instrument for land value capture, with its base in all land
parcels with assessed values of more than PHP 100,000 (US$ 2,425). Improvements are
not included in the base of this tax.
d. The socialized housing tax is closer to the mechanism of a temporary property tax rate
increase than to betterment tax or tax increment financing (TIF). Although the socialized
housing tax shares the features of a fixed payment schedule with the betterment tax and
TIF, it misses other significant features of the betterment tax (computation of total project
cost or investment to be recovered, valorization resulting from the investment,
identification of properties benefiting from the investment) and TIF (determination of a
base value, measurement of value increment from the base value).
The socialized housing tax is like the temporary property tax rate increase used in other
countries that is usually earmarked for a specific purpose that benefits the city as a whole,
directly or indirectly. However, the tax credits feature of the socialized housing tax is
something that is so far not seen in literature reviewed for this research.
e. The socialized housing tax shares its administration by the city departments with the real
property tax and the idle lands tax.
f. The conclusions regarding assessment inequity may also be reached regarding the
socialized housing tax since the assessment methodology is one and the same. However,
regressivity may have been addressed to a certain degree by the exemption given to land
under a certain threshold of assessed values. This means that the smallest taxpayers are
protected from having to pay this tax.
g. The socialized housing tax has a bigger base than the idle lands tax, which results in a
larger total tax due, in spite of having a much lower rate than the idle lands tax.
h. The efficiency in revenue generation of the socialized housing tax is adversely affected
by Valuation and Collection. The tax is at less than half of its potential.
5.3 Key Findings on the Balanced Housing Policy
a. The policy seeks to benefit socialized housing.
b. The guidelines for implementation were drafted, and are being imposed, by a national
agency.
c. The balanced housing policy may be considered an instrument of land value capture. The
contribution required by the policy may be calculated in two ways, both land-based, but
not in direct proportion to land value. The first option of contribution of land is based on
land area, not value. The second option of contribution of percentage of the project cost is
based on the cost land as well as improvements.
d. The balanced housing policy is more like fees-in-lieu than inclusionary housing. The
guidelines make it clear that the option of land contribution may be made anywhere in the
country, not necessarily in or near the main housing project. The guidelines give more
attention to the various ways of complying through the option of contributing a
63
percentage of the project cost. A difference though is that, in literature on fees-in-lieu, the
resulting public good becomes flexible but remains tangible in the arena of the local
government (Evans-Cowley, 2006), not aggregated in the bigger pool of national
government, as what happens with balanced housing contributions.
e. The local government of Quezon City has no part in the enforcing compliance of the
policy among developers with projects in Quezon City.
f. The various modes for compliance fail to exhibit assessment uniformity.
g. There are too many indicators with unknown (Base with regard to project cost,
Collection) or variable (Rate, Valuation) indicators to be able to say that the policy is
efficient to any degree in mobilizing resources for socialized housing.
5.4 Conclusions
a. The three land value capture instruments present deficiencies in the areas of equity,
efficiency and effectiveness.
b. The idle lands and socialized housing taxes have so far not resulted in dramatic change in
quantities of housing production. However, if the committed and pipeline projects funded
by the earmarked taxes proceed as planned, the number of units produced will be higher
per year. The city will also be utilizing more of its locally generated funds in land
purchase and land development, rather than merely providing assistance for beneficiaries
to access nationally operated financing programs.
c. The obstruction of external factors hinders to a degree the effectiveness of the earmarked
contributions. Some of the problems are being resolved with the resources mobilized by
the earmarked contributions, but others cannot be resolved through bigger local
government funding.
d. The idle lands and socialized housing taxes present a means for the city to more actively
and deliberately initiate affordable housing projects in-city. They increase the capacity of
the city to acquire locations within its territory that would minimize displacement to
constituents needing new or better housing.
In contrast, balanced housing has so far not shown visible results in terms of spatially
integrating affordable housing with other kinds of land uses in the city. The responsibility
for effectiveness of the balanced housing policy remains borne by national government
agencies and cannot be accounted at the city government level.
e. The advent of the new earmarked taxes seems to have improved the transparency of
budgeting and accounting for housing. The Budget Office, the Local Housing Board and
other departments have their respective tasks in programming and tracking utilization of
the proceeds for socialized housing. Already, figures have been reported for the 2012 and
2013 budgets and expenditures that were not previously reported for housing.
The proposed Socialized Housing Special Account will also enhance transparency.

64
f. Not enough data is available as of yet to establish whether the annual budget for housing
will see an increase due to the proceeds from the idle lands and socialized housing taxes.
The concern expressed in literature about earmarking resulting in bigger government is
not appropriate in this context as the earmarked taxes are not enough to fully fund the
requirement. A more appropriate concern would be if the local government executives
decide to wholly rely on the earmarked taxes for housing delivery, replacing previous
sources from general funds.
g. The three instruments share the characteristic of being unstable in terms of providing a
steady supply of resources for socialized housing: 1) the idle lands tax is likely to get
smaller with time and continued urban development, 2) the socialized housing tax is
imposed for a period of five years only, and in fact will be given back as tax credits to
taxpayers, 3) balanced housing is only as good as the performance of the housing market
as a whole.
h. Over-all, the findings do not detect negative effects on social housing delivery or its
intended beneficiaries. However, there are many areas that need to be improved before
the idle lands tax, the socialized housing tax, and the balanced housing policy may truly
be seen as appropriately earmarked for social housing.
5.5 Recommendations
On equity
a. Updating the city’s schedule of fair market values through a general revision appears to
be the critical task in order to correct the apparent regressivity and improve assessment
uniformity of property taxes in general, including the idle lands and socialized housing
taxes. The city has the technical resources to undertake a revision but has so far chosen to
exhaust other administrative measures (e.g. auctions of delinquent properties,
computerization) to improve tax collection.
The strata that exhibited equity may be studied to see if conditions favourable to
assessment uniformity can be identified. When such a general revision takes place, the
operational definition of idle lands should also be reviewed and clarified.
b. The balanced housing policy needs to be localized – in terms of legal mandate,
organizational mechanisms for monitoring and enforcement, and availment of the
resources mobilized by the policy. Localization will make the policy more transparent to
the city’s stakeholders, and through their engagement, give balanced housing a better
chance of becoming a strong and useful policy.
c. Equitable treatment of developers under the balanced housing policy entails a uniform
rate of assessment. A uniform rate based on selling prices instead of project costs or land
area might be easier to validate for monitoring and enforcement agencies.

65
On efficiency:
d. If ever the balanced housing policy is localized, the fees-in-lieu could be pooled with the
other funds in the Socialized Housing Special Account. This will improve the
transparency and administration of the policy.
e. The IAAO suggests that sunset provisions on exemptions (whether full or partial) become
part of tax legislation, not only in consideration of erosion of Base values due to inflation
but also to prevent ‘entrenchment’ (IAAO, 2010) where taxpayers begin to consider
exemptions as permanent rights rather than as conditional concessions.
f. The efficiency factors of Rate and Valuation, in this case, are policy issues. Sensitivity
studies can be done with regard to approaching the national cap on tax rates and
assessment levels.
g. Quezon City has already done much to improve Coverage through electronic tax mapping
and improving the security of records. Collection has also climbed to its present level due
to enforcement and administrative measures such as auctions of delinquent properties,
discounts to early taxpayers, computerized billing, and data-sharing among departments.
These are strong measures that need to be sustained and enhanced in order to protect the
gains.
On effectiveness:
h. There are many more factors, external and internal, affecting effectiveness of housing
delivery aside from the availability of funds. Utilization of the earmarked contributions
needs to be designed and located with deliberation so as to leverage optimal results out of
the housing programs and projects where the contributions will be used.
i. Considering the scale and long-standing nature of the housing need, the stability of the
funding sources needs to be looked at. The current instruments may be reviewed to
improve their stability, but other sources might also need to come into play.
j. With the particularly short span of the socialized housing tax, a plan has to be in place to
ensure that the expected long-term funding from external institutions does come to
fruition. Project finance accounting might be useful.
Areas for further study:
k. This research is an initial attempt to put together a methodology that combines
quantitative with qualitative measures to review various aspects of fiscal and non-fiscal
resources of the city. The statistical analysis employed is very rudimentary, and the
sample is very small compared to the scale of the city. The results could, however, be
considered indicative for a bigger study that could be implemented by the city with big
data and more rigorous analysis.
l. In the same way that the use of earmarked contributions needs to be designed and located
in the most optimal way to achieve the best results in the present time, there is reason in
looking farther into the future for more durable results. The benefits of the housing
programs and projects where the earmarked contributions will be used can be short-lived.
66
Beneficiaries can be substituted, subsidized units can go into the market and move out of
the affordable stock, properties with public investments can be badly managed and
deteriorate. With more careful planning and application of learning from experiences, the
benefits could be longer-term, more enduring for the public good, and social housing less
a constant process of depletion of public resources.
67
Bibliography
Bahl, R. and Martinez-Vazquez, J. 2007. The Property Tax in Developing Countries: Current
Practice and Prospects. Working Paper. Available at:
https://www.lincolninst.edu/pubs/dl/1075_Soule_complete_web.pdf (Accessed 01 June 2013)
Bird, R. and Slack, E. 2002. Land and Property Taxation: A Review. Available at:
https://www.google.nl/#hl=en&gs_rn=12&gs_ri=psyab&tok=bJVwdLGE8C6TAJO3WzpkO
Q&pq=bird%20and%20slack%202002&cp=50&gs_id=60&xhr=t&q=bird+and+slack+land+
and+property+taxation+a+review&es_nrs=true&pf=p&sclient=psyab&oq=bird+and+slack+l
and+and+property+taxation+a+review&gs_l=&pbx=1&bav=on.2,or.r_qf.&fp=345ec6be39cf
6daf&biw=1024&bih=499 (Accessed 27 April 2013).
Bird, R. and Slack, E. 2006. Taxing Land and Property in Emerging Economies: Raising
Revenue . . . and More? Available at: https://www.google.nl/#hl=en&sclient=psy-
ab&q=bird+and+slack+taxing+land+and+property+in+emerging+economies&oq=bird+and+
slack+taxing+land+and+property+in+emerging+economies&gs_l=serp.3...153746.163174.3.
164089.48.48.0.0.0.0.149.4260.34j14.48.0...1.0...1c.1.12.psyab.KC_3Lfz_d08&pbx=1&bav=
on.2,or.r_qf.&fp=345ec6be39cf6daf&biw=1024&bih=499 (Accessed 27 April 2013).
Booth, P. 2012. The Unearned Increment: Property and the Capture of Betterment Value in
Britain and France In: G. K. Ingram and Y. Hong, eds. 2012. Value Capture and Land
Policies. Cambridge, MA: Lincoln Institute of Land Policy, pp. 74-93.
Bruce Jones Design Inc. 2010. Philippines Map with Administrative Districts and Names.
Available at:
http://www.freeusandworldmaps.com/html/Countries/Asia%20Countries/Philippines.html
(Accessed 26 August 2013).
Bureau of Local Government Finance (BLGF) – Department of Finance (DOF), 2008.
Moving Towards a Positive and Sustainable LGU Financial Performance. Statement of
Income and Expenditures CY 2005-2007 Publication. Available at:
http://www.blgf.gov.ph/downloads/lgudata/SIE_2004_Bulletin/CY_2005_2007_SIE_Publica
tion.pdf [Accessed 27 January 2013].
Calavita, N. and Mallach, A. 2010a. An International Perspective on Inclusionary Housing
In: Inclusionary Housing in International Perspective. 2010. Cambridge, MA: Lincoln
Institute of Land Policy, pp. 1-13.
Calavita, N. and Mallach, A. 2010b. National Differences and Commonalities In:
Inclusionary Housing in International Perspective. 2010. Cambridge, MA: Lincoln Institute
of Land Policy, pp. 359-386.
Carling, R. 2007. Tax Earmarking: Is It Good Practice? NSW: The Center for Independent
Studies. Available at: http://www.cis.org.au/images/stories/policy-monographs/pm-75.pdf
(Accessed 1 May 2013).
Case, K.E. 1986. Economics and Tax Policy. Cambridge, MA: Lincoln Institute of Land
Policy.

68
Connolly, K. and Bell, M.E. 2009. Area-based Property Tax Systems: Current Practice and
Equity Concerns. Working Paper. Available at:
https://www.lincolninst.edu/pubs/dl/1075_Soule_complete_web.pdf (Accessed 01 June
2013).
De Cesare, C.M. 2012. Improving the Performance of the Property Tax in Latin America.
Cambridge, MA: Lincoln Institute of Land Policy.
De Cesare, C.M. and Ruddock, L. 1998. A New Approach to the Analysis of Assessment
Equity. Assessment Journal 5-2: 57-69.
Deloitte. 2011. Doing Business in Chile. Available at: http://www.deloitte.com/assets/Dcom-
Chile/Local%20Assets/Documents/Nuevos/DoingBusinessChile%20_Mayo2011_.pdf
(Accessed 2 September 2013).
Evans-Cowley, J. 2006. Development Exactions: Process and Planning Issues. Working
Paper. Cambridge, MA: Lincoln Institute of Land Policy. Available at:
http://www.lincolninst.edu/subcenters/teaching-fiscal-dimensions-of-
planning/materials/evans-cowley-planning.pdf (Accessed 22 August 2013).
Fainstein, S. 2012. Land Value Capture and Justice In: G. K. Ingram and Y. Hong, eds. 2012.
Value Capture and Land Policies. Cambridge, MA: Lincoln Institute of Land Policy, pp. 21-
40.
Foundation for the Development of the Urban Poor. 2011. Budget Transparency Fund –
World Bank Report: Quezon City (Unpublished).
Gomez, M. 2010. The Failure of the Real Property Tax in Local Governments. Quezon City:
Action for Economic Reforms.
Housing and Land Use Regulatory Board. 2012. Board Resolution No. 890.
Housing and Urban Development Coordinating Council. 2013. Estimate of Housing Needs
2007 – 2016. Available at:
http://www.hudcc.gov.ph/Plans.aspx?name=Housing%20Need%20Projection (Accessed 13
May 2013).
Ingram, G.K. and Hong, Y. 2012. Land Value Capture: Types and Outcomes In: G.K. Ingram
and Y. Hong, eds. 2012. Value Capture and Land Policies. Cambridge, MA: Lincoln Institute
of Land Policy, pp. 3-18.
International Association of Assessing Officers. 2013. Standard on Ratio Studies. Kansas
City, Missouri: IAAO.
Kerr, S., Aitken, Aitken, A. and Grimes, A. 2004. Land Taxes and Revenue Needs as
Communities Grow and Decline: Evidence from New Zealand. Working Paper. Cambridge,
MA: Lincoln Institute of Land Policy. Available at:
https://www.lincolninst.edu/pubs/dl/932_Complete_PDF.pdf (Accessed 01 June 2013).
69
Kitsantonis, N. 2011. Greece Adopts a New Property Tax. Available at:
http://www.nytimes.com/2011/09/28/business/global/greece-adopts-new-property-
tax.html?_r=0 (Accessed 3 September 2013).
Mallach, A. and Calavita, N. 2010. From Radical Innovation to Mainstream Housing Policy
In: Inclusionary Housing in International Perspective. 2010. Cambridge, MA: Lincoln
Institute of Land Policy, pp. 15-77.
Mallach, A. and Vey, J. 2011. Recapturing Land for Economic and Fiscal Growth.
Washington DC: Brookings-Rockefeller – Project on State and Metropolitan Innovation
Mandl, U., Dierx, A. and Ilzkovitz, F. 2008. The effectiveness and efficiency of public
spending. Economic Papers 301. Brussels: European Commission.
McGee, R. 1999. The Ethics of Earmarking Taxes. Journal of Accounting, Ethics & Public
Policy, 2 (1), pp. 104-115, Winter 1999. Available at:
http://papers.ssrn.com/sol3/papers.cfm?abstract_id=251473 (Accessed 1 May 2013).
Mills, E. S. 1998. The Economic Consequences of a Land Tax In: Netzer, ed. 1998. Land
Value Taxation. Cambridge, MA: Lincoln Institute of Land Policy, pp. 31-48.
Morales Schechinger, C. 2007. El Impuesto Territorial y el Financiamento Urbano In: D.
Erba, ed. 2007. Catastro Multifinalitario – aplicado a la definicion de politicas de suelo
urbano. Cambridge, MA: Lincoln Institute of Land Policy, pp. 67-109.
National Housing Authority. 2007. Board Resolution No. 5056.
National Statistical Coordination Board. 2013a. Concepts and Definitions – City
Classifications. Available at:
http://www.nscb.gov.ph/activestats/psgc/articles/con_cityclass.asp (Accessed 30 May 2013).
National Statistical Coordination Board. 2013b. Concepts and Definitions – Local
Government Units. Available at :
http://www.nscb.gov.ph/activestats/psgc/articles/con_lgu.asp (Accessed 30 May 2013).
National Statistical Coordination Board. 2013c. Core Inflation Rate, Philippines. Available
at: http://www.nscb.gov.ph/secstat/d_price.asp (Accessed 30 July 2013).
National Statistical Coordination Board. 2013d. Peso-US Dollar Watch. Available at:
http://www.nscb.gov.ph/stats/pesodollar.asp (29 July 2013).
National Statistics Office. 2012.The 2010 Census of Population and Housing Reveals the
Philippine Population at 92.34 Million. Available at: http://www.census.gov.ph/content/2010-
census-population-and-housing-reveals-philippine-population-9234-million (Accessed 4 May
2012).
National Statistics Office, 2013a. National Quickstat as of April 2013. Available at:
http://www.census.gov.ph/sites/default/files/attachments/ird/quickstat/April2013.pdf
(Accessed 14 May 2013).

70
National Statistics Office. 2013b. Total Population, Land Area, and Population Density by
Region: 2010. Available at:
http://www.census.gov.ph/sites/default/files/attachments/hsd/pressrelease/Table%201%20Tot
al%20Population%2C%20Land%20Area%2C%20and%20Population%20Density%20by%20
Region%2C%202010.pdf (Accessed 6 September 2013).
Nechyba, T.J. 2001. Prospects for Local Land Rent Taxesin State and Local Tax Reforms.
Working Paper. Cambridge, MA: Lincoln Institute of Land Policy.
Netzer, D. 1998. The Relevance and Feasibility of Land Value Taxation in the Rich
Countries In: Netzer, D., ed. 1998. Land Value Taxation. Cambridge, MA: Lincoln Institute
of Land Policy, pp. 109-136.
Philippine Institute for Development Studies. 2013. Economic and Social Database.
Available at: http://econdb.pids.gov.ph/tablelists/table/49 (Accessed 19 August 2013).
Philippines Today. 2010. Quezon City to Start Taxing Idle Lands. Available at:
http://www.philippinestodayus.com/news/metro/quezon-city-to-start-taxing-idle-lands/.
(Accessed 4 May 2013).
Plimmer, F., McCluskey, W.J. and Connellan, O. 2000. Equity and Fairness Within Ad
Valorem Real Property Taxes. Working Paper. Cambridge, MA: Lincoln Institute of Land
Policy. Available at:
https://www.lincolninst.edu/pubs/dl/107_PlimmerMcCluskeyConnellan00.pdf (Accessed 01
June 2013)
Quezon City. 1995. Ordinance No. SP-357, S-95.
Quezon City. 2002. Local Housing Board Ordinance.
Quezon City. 2009. The Subdivision Administration Unit Under the Belmonte
Administration (Unpublished).
Quezon City. 2011. Quezon City Shelter Plan 2011 (Unpublished).
Quezon City. 2012. Quezon City Revenue Code As Amended.
Quezon City. 2012. Summary of 2011 Approved Development Permits (Unpublished).
Quezon City. 2013a. 2012 Accomplishments of the Subdivision Administration Unit
(Unpublished).
Quezon City. 2013b. Bistekville [Powerpoint] (Unpublished).
Quezon City, 2013c. City Assessor’s Department. Available at:
http://www.quezoncity.gov.ph/index.php?option=com_content&view=article&id=292%3Aas
sessors&catid=64&Itemid=118. Accessed 16 August 2013.

71
Quezon City, 2013d. City Treasurer’s Office. Available at:
http://www.quezoncity.gov.ph/index.php?option=com_content&view=article&id=277%3Atr
easurer&catid=64&Itemid=118. Accessed 16 August 2013.
Quezon City. 2013e. (Draft) Ordinance PO2013-35.
Quezon City, 2013f. QC Information Technology Development Office. Available at:
http://www.quezoncity.gov.ph/index.php?option=com_content&view=article&id=284%3Aqc
it&catid=64&Itemid=118. Accessed 16 August 2013.
Quezon City. 2013g. Quezon City District Maps. Available at:
http://www.quezoncity.gov.ph/index.php?option=com_content&view=article&id=1076:qc-
district-maps&catid=95. (Accessed 4 September 2013).
Quezon City. 2013h. Real Property Records (Land) by Taxabilities and Actual Use (Data as
of 06/30/2013) (Unpublished).
Quezon City. 2013i. Report of Collections for CY 2012 (Unpublished).
Quezon City. 2013j. Socialized Housing Tax Ordinance. Available at:
http://www.quezoncity.gov.ph/index.php?option=com_content&view=article&id=357:sociali
zed-housing-tax-ordinance&catid=1&Itemid=362 (Accessed 4 May 2013).
Quezon City. 2013k. Socialized Housing Tax Will Remove Urban Blight. Available at:
http://www.quezoncity.gov.ph/index.php?option=com_content&view=article&id=382:sociali
zed-housing-tax-will-remove-urban-blight&catid=1&Itemid=362 (Accessed 25 April 2013).
Quezon City. 2013l. Statement of Income and Expenses For the Period Ending December 31,
2012. Available at:
http://www.quezoncity.gov.ph/images/stories/cityfinancialreports/generalfund/dec2012/gen_f
und_statement_of_income_%20expense.pdf (Accessed 17 May 2013).
Quezon City. 2013m. Taxable/Exempt/Special Taxable/Special Exempt Real Estate
Properties as of December 31, 2011 (Unpublished).
Quezon City. 2013n. Taxable/Exempt/Special Taxable/Special Exempt Real Estate Properties
as of December 31, 2012 (Unpublished).
Quezon City. 2013o. Taxable/Exempt/Special Taxable/Special Exempt Real Estate Properties
as of March 31, 2011 (Unpublished).
Quezon City. 2013p. Taxable/Exempt/Special Taxable/Special Exempt/Idle Land
Taxable/Idle Land Exempt Real Estate Properties as of December 31, 2010 (Unpublished).
Quezon City, 2013q. Urban Poor Affairs Office. Available at:
http://www.quezoncity.gov.ph/index.php?option=com_content&view=article&id=246%3Au
pao&catid=62&Itemid=28. Accessed 16 August 2013.
Republic of the Philippines. 1991. Republic Act 7160 The Local Government Code.

72
Republic of the Philippines. 1992. Republic Act 7279 The Urban Development and Housing
Act.
Sjoquist, D.L. and Stephenson, A.V. 2010. An Analysis of Alternative Revenue Sources for
Local Governments In: G.K. Ingram and Y. Hong, eds. Municipal Revenues and Land
Policies, 2010. Cambridge, MA: Lincoln Institute of Land Policy, pp. 433-473.
Slack, E. 2013. The Politics of the Property Tax. In: W.J. McCluskey, G.C. Cornia, and L.C.
Walters, eds. A Primer on Property Tax, 2013. Blackwell Publishing, pp. 69-87.
Smolka, M. 2013. Implementing Value Capture in Latin America: Policies and Tools for
Urban Development. Cambridge, MA: Lincoln Institute of Land Policy.
Smolka, M. and Amborski, D. 2000. Value Capture for Urban Development: An Inter-
American Comparison. Cambridge, MA: Lincoln Institute of Land Policy.
Social Housing Finance Corporation. 2013. SHFC Appraisals of CMP Projects. Available at:
http://f3-preview.runhosting.com/shfcph.com/projects.html (Accessed 11 July 2013).
Soule, D.C. and Bluestone, B. 2005. Equity and Efficiency Considerations in Use Value
Taxation. Working Paper. Cambridge, MA: Lincoln Institute of Land Policy. Available at:
https://www.lincolninst.edu/pubs/dl/1075_Soule_complete_web.pdf (Accessed 01 June 2013)
The World Bank. 2013. Official Exchange Rate. Available at:
http://data.worldbank.org/indicator/PA.NUS.FCRF?page=4 (Accessed 30 May 2013).
United Nations Conference on Human Settlements. 1976. The Vancouver Action Plan.
Vancouver: UNCHS.
Voith, R. and Wachter, S. 2012. The Affordability Challenge In: G. K. Ingram and Y. Hong,
eds. 2012. Value Capture and Land Policies. Cambridge, MA: Lincoln Institute of Land
Policy, pp. 261-281.
Walters, L. 2011. Land and Property Tax: A Policy Guide. Nairobi: United Nations Human
Settlements Program.
Walters, L. 2012. Are Property-Related Taxes Effective Value Capture Instruments? In: G.
K. Ingram and Y. Hong, eds. 2012. Value Capture and Land Policies. Cambridge, MA:
Lincoln Institute of Land Policy, pp. 187-214.
Weber, R. and Goddeeris, L. 2007. Tax Increment Financing: Process and Planning Issues.
Working Paper. Cambridge, MA: Lincoln Institute of Land Policy. Available at:
https://www.lincolninst.edu/subcenters/teaching-fiscal-dimensions-of-
planning/materials/goddeeris-weber-financing.pdf (Accessed 2 September 2013).
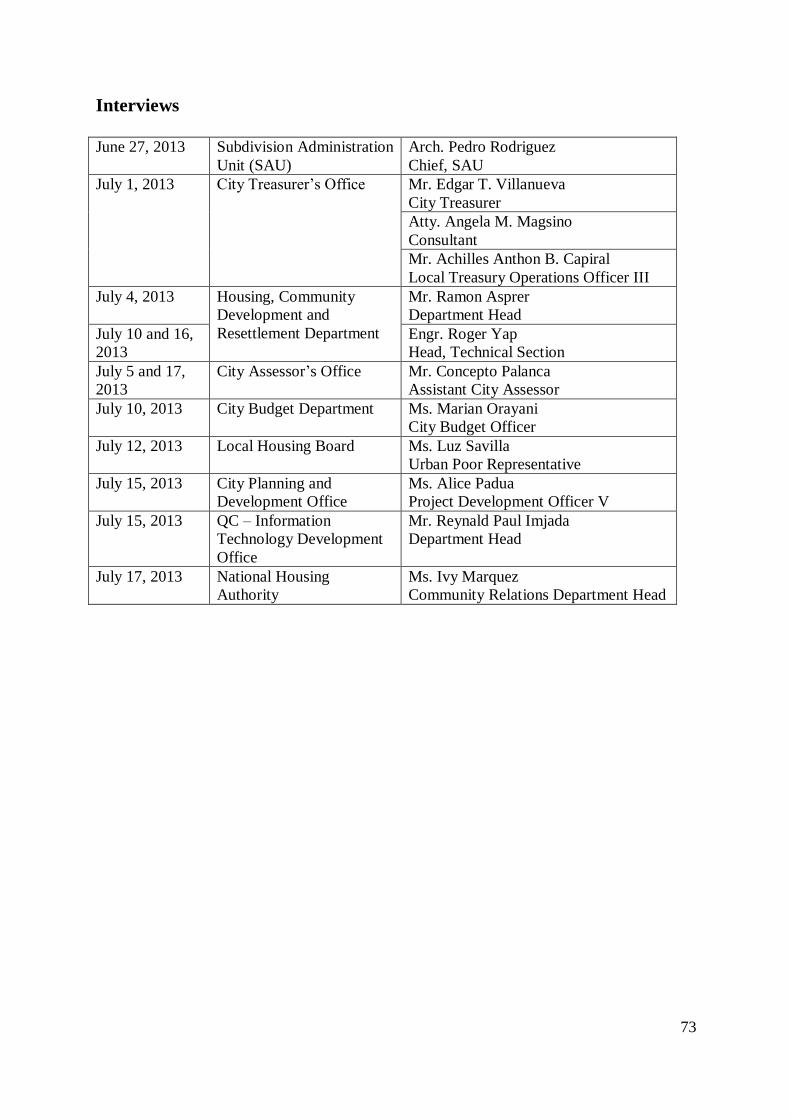
73
Interviews
June 27, 2013 Subdivision Administration
Unit (SAU)
Arch. Pedro Rodriguez
Chief, SAU
July 1, 2013 City Treasurer’s Office Mr. Edgar T. Villanueva
City Treasurer
Atty. Angela M. Magsino
Consultant
Mr. Achilles Anthon B. Capiral
Local Treasury Operations Officer III
July 4, 2013 Housing, Community
Development and
Resettlement Department
Mr. Ramon Asprer
Department Head
July 10 and 16,
2013
Engr. Roger Yap
Head, Technical Section
July 5 and 17,
2013
City Assessor’s Office Mr. Concepto Palanca
Assistant City Assessor
July 10, 2013 City Budget Department Ms. Marian Orayani
City Budget Officer
July 12, 2013 Local Housing Board Ms. Luz Savilla
Urban Poor Representative
July 15, 2013 City Planning and
Development Office
Ms. Alice Padua
Project Development Officer V
July 15, 2013 QC – Information
Technology Development
Office
Mr. Reynald Paul Imjada
Department Head
July 17, 2013 National Housing
Authority
Ms. Ivy Marquez
Community Relations Department Head
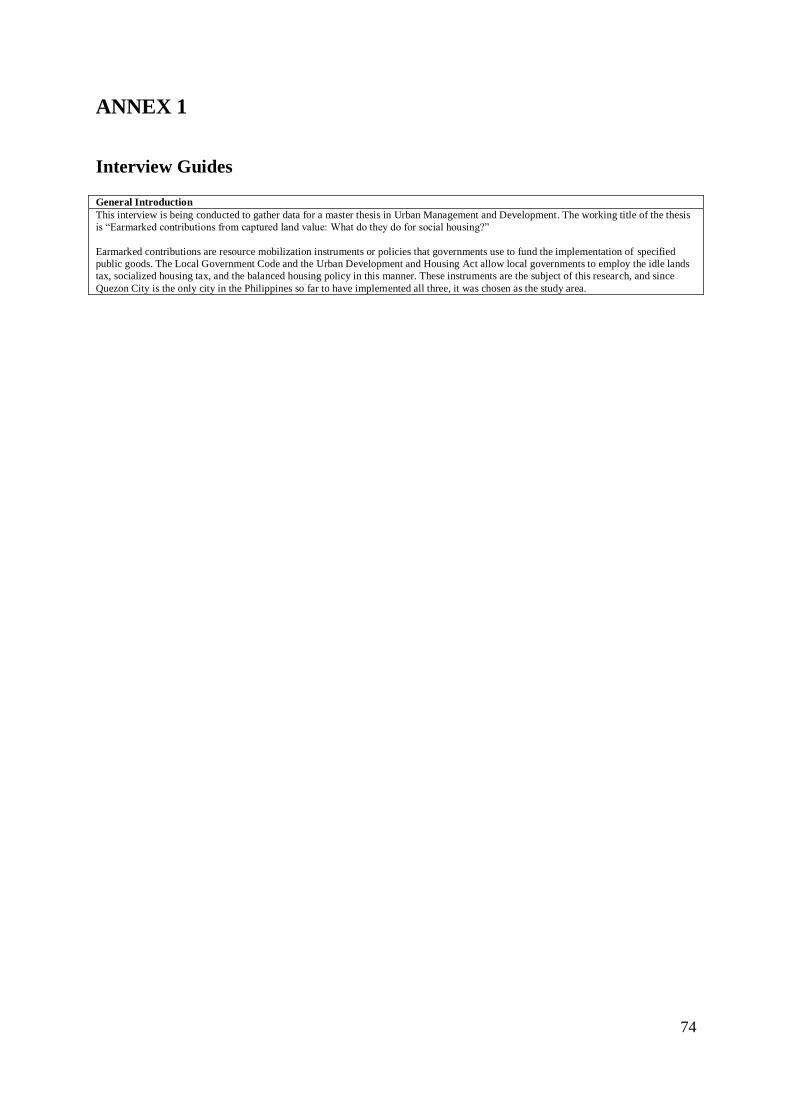
74
ANNEX 1
Interview Guides General Introduction
This interview is being conducted to gather data for a master thesis in Urban Management and Development. The working title of the thesis
is “Earmarked contributions from captured land value: What do they do for social housing?”
Earmarked contributions are resource mobilization instruments or policies that governments use to fund the implementation of specified
public goods. The Local Government Code and the Urban Development and Housing Act allow local governments to employ the idle lands
tax, socialized housing tax, and the balanced housing policy in this manner. These instruments are the subject of this research, and since
Quezon City is the only city in the Philippines so far to have implemented all three, it was chosen as the study area.
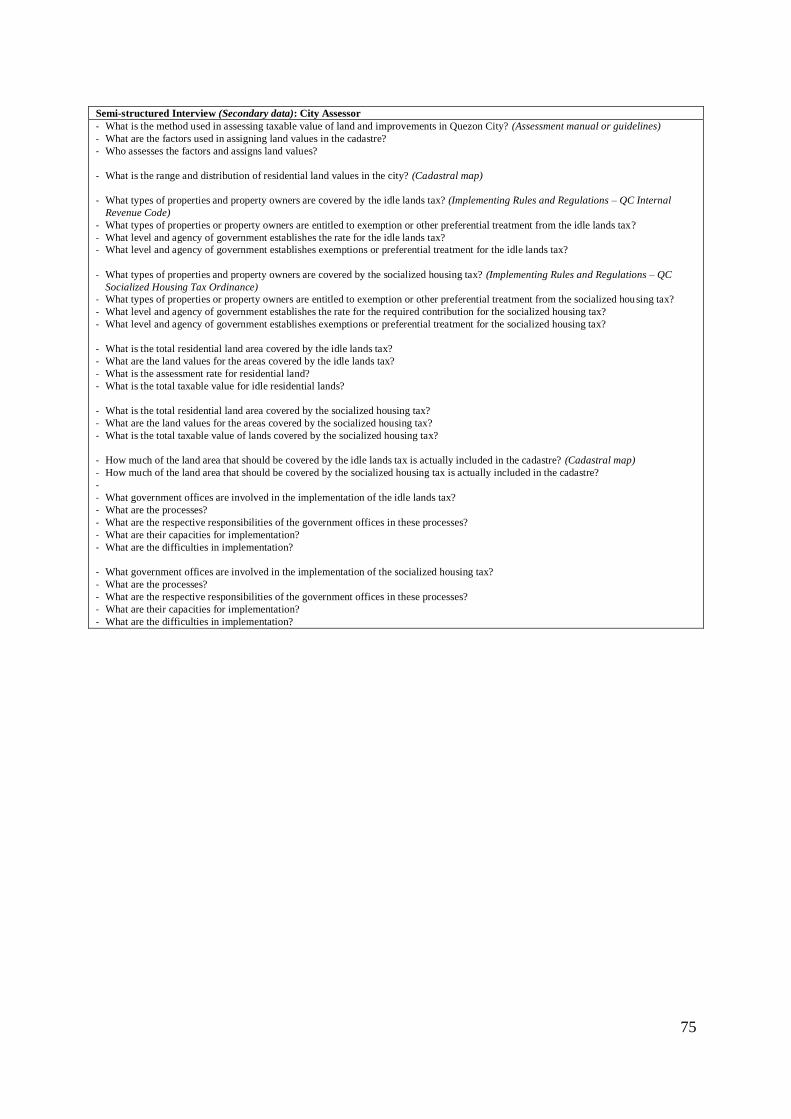
75
Semi-structured Interview (Secondary data): City Assessor
- What is the method used in assessing taxable value of land and improvements in Quezon City? (Assessment manual or guidelines)
- What are the factors used in assigning land values in the cadastre?
- Who assesses the factors and assigns land values?
- What is the range and distribution of residential land values in the city? (Cadastral map)
- What types of properties and property owners are covered by the idle lands tax? (Implementing Rules and Regulations – QC Internal
Revenue Code)
- What types of properties or property owners are entitled to exemption or other preferential treatment from the idle lands tax?
- What level and agency of government establishes the rate for the idle lands tax?
- What level and agency of government establishes exemptions or preferential treatment for the idle lands tax?
- What types of properties and property owners are covered by the socialized housing tax? (Implementing Rules and Regulations – QC
Socialized Housing Tax Ordinance)
- What types of properties or property owners are entitled to exemption or other preferential treatment from the socialized housing tax?
- What level and agency of government establishes the rate for the required contribution for the socialized housing tax?
- What level and agency of government establishes exemptions or preferential treatment for the socialized housing tax?
- What is the total residential land area covered by the idle lands tax?
- What are the land values for the areas covered by the idle lands tax?
- What is the assessment rate for residential land?
- What is the total taxable value for idle residential lands?
- What is the total residential land area covered by the socialized housing tax?
- What are the land values for the areas covered by the socialized housing tax?
- What is the total taxable value of lands covered by the socialized housing tax?
- How much of the land area that should be covered by the idle lands tax is actually included in the cadastre? (Cadastral map)
- How much of the land area that should be covered by the socialized housing tax is actually included in the cadastre?
-
- What government offices are involved in the implementation of the idle lands tax?
- What are the processes?
- What are the respective responsibilities of the government offices in these processes?
- What are their capacities for implementation?
- What are the difficulties in implementation?
- What government offices are involved in the implementation of the socialized housing tax?
- What are the processes?
- What are the respective responsibilities of the government offices in these processes?
- What are their capacities for implementation?
- What are the difficulties in implementation?

76
Semi-structured Interview (Secondary data): Subdivision Administration Unit
- What types of properties and property owners are covered by the balanced housing policy? (Implementing Rules and Regulations)
- What types of properties or property owners are entitled to exemption or other preferential treatment from the balanced housing policy?
- What level and agency of government establishes the rate for the required contribution for balanced housing?
- What level and agency of government establishes exemptions or preferential treatment for the balanced housing policy?
- How is the developer’s contribution to socialized housing calculated under the balanced housing policy? (Implementing Rules and
Regulations)
- What are the various modes of compliance?
- For the modes of compliance based on land value, are the same land values in the cadastre used when calculating the contribution for
balanced housing?
- Who calculates the required contribution for balanced housing?
- What is the total land area covered by new applications for development permits that is subject to the balanced housing policy? (Report on
development applications 2012)
- What are the land values for these areas?
- How many socialized housing units were committed under the balanced housing policy from 2007 to 2011? (Reports on development
applications)
- How much cash has been committed under alternative modes of compliance of the balanced housing policy?
- How much of the land area that should be covered by new applications for development permits is actually reported?
- How many socialized housing units were built under the balanced housing policy from 2007 to 2011?
- How much of the total required contribution in cash under the balanced housing policy was actually paid from 2007 to 2011?
- What government offices are involved in the implementation of the balanced housing policy?
- What are the processes?
- What are the respective responsibilities of the government offices in these processes?
- What are their capacities for implementation?
- What are the difficulties in implementation?
- How many socialized housing units were built and turned over by the city in the 5 years before the implementation of the balanced
housing policy?
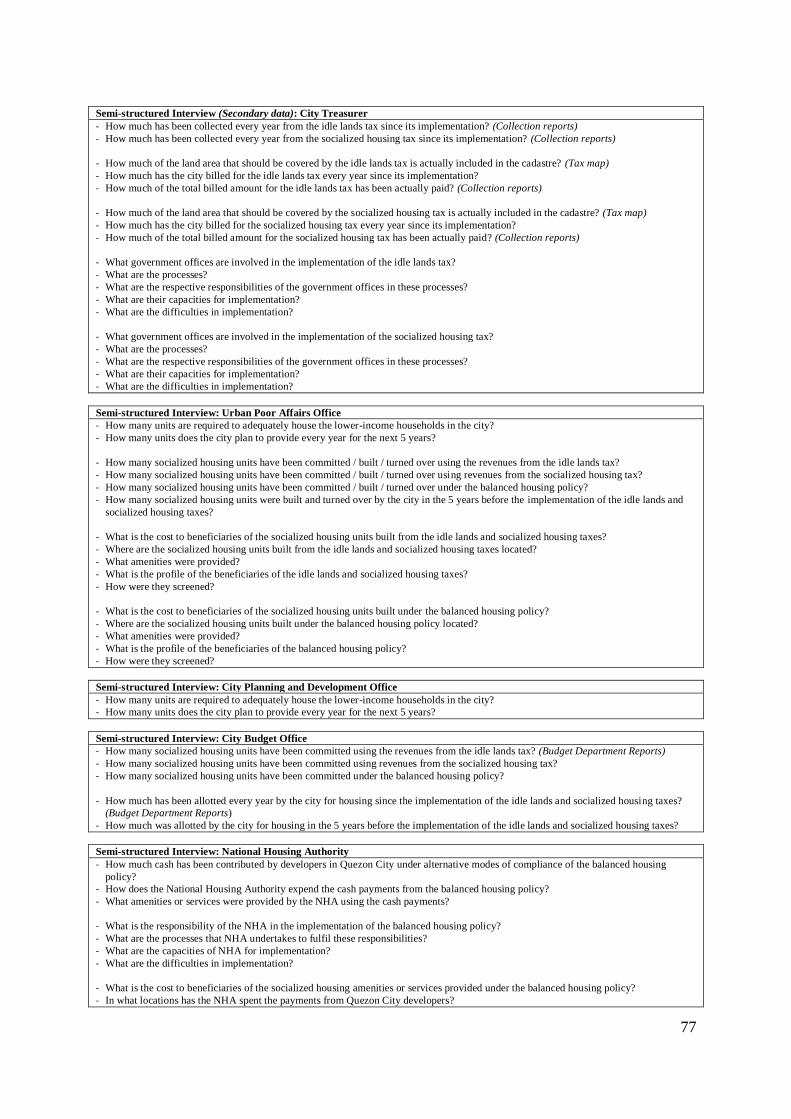
77
Semi-structured Interview (Secondary data): City Treasurer
- How much has been collected every year from the idle lands tax since its implementation? (Collection reports)
- How much has been collected every year from the socialized housing tax since its implementation? (Collection reports)
- How much of the land area that should be covered by the idle lands tax is actually included in the cadastre? (Tax map)
- How much has the city billed for the idle lands tax every year since its implementation?
- How much of the total billed amount for the idle lands tax has been actually paid? (Collection reports)
- How much of the land area that should be covered by the socialized housing tax is actually included in the cadastre? (Tax map)
- How much has the city billed for the socialized housing tax every year since its implementation?
- How much of the total billed amount for the socialized housing tax has been actually paid? (Collection reports)
- What government offices are involved in the implementation of the idle lands tax?
- What are the processes?
- What are the respective responsibilities of the government offices in these processes?
- What are their capacities for implementation?
- What are the difficulties in implementation?
- What government offices are involved in the implementation of the socialized housing tax?
- What are the processes?
- What are the respective responsibilities of the government offices in these processes?
- What are their capacities for implementation?
- What are the difficulties in implementation?
Semi-structured Interview: Urban Poor Affairs Office
- How many units are required to adequately house the lower-income households in the city?
- How many units does the city plan to provide every year for the next 5 years?
- How many socialized housing units have been committed / built / turned over using the revenues from the idle lands tax?
- How many socialized housing units have been committed / built / turned over using revenues from the socialized housing tax?
- How many socialized housing units have been committed / built / turned over under the balanced housing policy?
- How many socialized housing units were built and turned over by the city in the 5 years before the implementation of the idle lands and
socialized housing taxes?
- What is the cost to beneficiaries of the socialized housing units built from the idle lands and socialized housing taxes?
- Where are the socialized housing units built from the idle lands and socialized housing taxes located?
- What amenities were provided?
- What is the profile of the beneficiaries of the idle lands and socialized housing taxes?
- How were they screened?
- What is the cost to beneficiaries of the socialized housing units built under the balanced housing policy?
- Where are the socialized housing units built under the balanced housing policy located?
- What amenities were provided?
- What is the profile of the beneficiaries of the balanced housing policy?
- How were they screened?
Semi-structured Interview: City Planning and Development Office
- How many units are required to adequately house the lower-income households in the city?
- How many units does the city plan to provide every year for the next 5 years?
Semi-structured Interview: City Budget Office
- How many socialized housing units have been committed using the revenues from the idle lands tax? (Budget Department Reports)
- How many socialized housing units have been committed using revenues from the socialized housing tax?
- How many socialized housing units have been committed under the balanced housing policy?
- How much has been allotted every year by the city for housing since the implementation of the idle lands and socialized housing taxes?
(Budget Department Reports)
- How much was allotted by the city for housing in the 5 years before the implementation of the idle lands and socialized housing taxes?
Semi-structured Interview: National Housing Authority
- How much cash has been contributed by developers in Quezon City under alternative modes of compliance of the balanced housing
policy?
- How does the National Housing Authority expend the cash payments from the balanced housing policy?
- What amenities or services were provided by the NHA using the cash payments?
- What is the responsibility of the NHA in the implementation of the balanced housing policy?
- What are the processes that NHA undertakes to fulfil these responsibilities?
- What are the capacities of NHA for implementation?
- What are the difficulties in implementation?
- What is the cost to beneficiaries of the socialized housing amenities or services provided under the balanced housing policy?
- In what locations has the NHA spent the payments from Quezon City developers?

78
- What is the profile of the beneficiaries of the balanced housing policy?
- How were they screened?
Semi-structured Interview: Taxpayers Alliance of the Philippines Inc.
- Are taxpayers aware of how land values are assigned?
- Are taxpayers aware of how the idle lands tax is calculated?
- Are taxpayers aware of how the socialized housing tax is calculated?
- Do taxpayers feel that the idle lands tax is a fair tax?
- Do taxpayers feel that the socialized housing tax is a fair tax?
- Do taxpayers know how and where the contributions from the idle lands tax and socialized housing tax should be spent?
Semi-structured Interview: Chamber of Real Estate and Builders Associations Inc.
- Are developers aware of how land values are assigned and used in the calculation of contributions for balanced housing?
- Do developers feel that the balanced housing policy is a fair policy?
- What are the actual sales prices for residential land in the different parts of the city?
- Do developers know how and where the contributions from the balanced housing policy should be spent?
Semi-structured Interview: Urban Poor Representative in Local Housing Board
- What is the cost to beneficiaries of the socialized housing units built from the idle lands and socialized housing taxes?
- Where are the socialized housing units built from the idle lands and socialized housing taxes located?
- What amenities were provided?
- What is the profile of the beneficiaries of the idle lands and socialized housing taxes?
- How were they screened?
- What is the cost to beneficiaries of the socialized housing units built under the balanced housing policy?
- Where are the socialized housing units built under the balanced housing policy located?
- What amenities were provided?
- What is the profile of the beneficiaries of the balanced housing policy?
- How were they screened?
- Do prospective beneficiaries know how and where the contributions from the idle lands tax / socialized housing tax / balanced housing
policy should be spent?
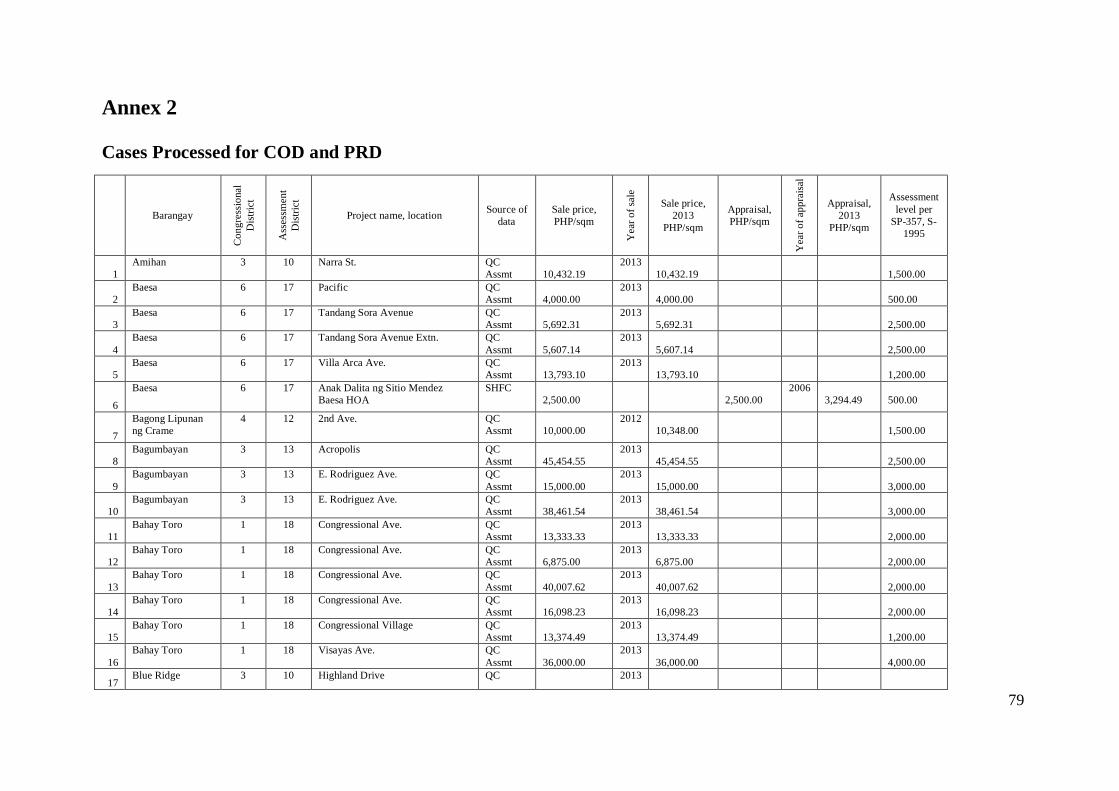
79
Annex 2
Cases Processed for COD and PRD
Barangay
Co
ng
ress
ional
Dis
tric
t
Ass
essm
ent
Dis
tric
t
Project name, location Source of
data
Sale price,
PHP/sqm
Yea
r o
f sa
le
Sale price,
2013
PHP/sqm
Appraisal,
PHP/sqm
Yea
r o
f ap
pra
isal
Appraisal,
2013
PHP/sqm
Assessment
level per
SP-357, S-
1995
1
Amihan 3 10 Narra St. QC
Assmt
10,432.19
2013
10,432.19
1,500.00
2
Baesa 6 17 Pacific QC
Assmt
4,000.00
2013
4,000.00
500.00
3
Baesa 6 17 Tandang Sora Avenue QC
Assmt
5,692.31
2013
5,692.31
2,500.00
4
Baesa 6 17 Tandang Sora Avenue Extn. QC
Assmt
5,607.14
2013
5,607.14
2,500.00
5
Baesa 6 17 Villa Arca Ave. QC
Assmt
13,793.10
2013
13,793.10
1,200.00
6
Baesa 6 17 Anak Dalita ng Sitio Mendez
Baesa HOA
SHFC
2,500.00
2,500.00
2006
3,294.49
500.00
7
Bagong Lipunan
ng Crame
4 12 2nd Ave. QC
Assmt
10,000.00
2012
10,348.00
1,500.00
8
Bagumbayan 3 13 Acropolis QC
Assmt
45,454.55
2013
45,454.55
2,500.00
9
Bagumbayan 3 13 E. Rodriguez Ave. QC
Assmt
15,000.00
2013
15,000.00
3,000.00
10
Bagumbayan 3 13 E. Rodriguez Ave. QC
Assmt
38,461.54
2013
38,461.54
3,000.00
11
Bahay Toro 1 18 Congressional Ave. QC
Assmt
13,333.33
2013
13,333.33
2,000.00
12
Bahay Toro 1 18 Congressional Ave. QC
Assmt
6,875.00
2013
6,875.00
2,000.00
13
Bahay Toro 1 18 Congressional Ave. QC
Assmt
40,007.62
2013
40,007.62
2,000.00
14
Bahay Toro 1 18 Congressional Ave. QC
Assmt
16,098.23
2013
16,098.23
2,000.00
15
Bahay Toro 1 18 Congressional Village QC
Assmt
13,374.49
2013
13,374.49
1,200.00
16
Bahay Toro 1 18 Visayas Ave. QC
Assmt
36,000.00
2013
36,000.00
4,000.00
17 Blue Ridge 3 10 Highland Drive QC 2013

80
Assmt 9,125.00 9,125.00 2,000.00
18
Blue Ridge 3 10 Hillside Loop QC
Assmt
11,000.00
2013
11,000.00
2,000.00
19
Bungad 1 6 Bayaya St. QC
Assmt
10,714.29
2013
10,714.29
2,000.00
20
Central 4 9 Kalayaan Ave. QC
Assmt
18,630.65
2012
19,278.99
4,000.00
21
Central 4 9 Malakas St. QC
Assmt
53,388.09
2012
55,246.00
2,000.00
22
Central 4 9 Malakas St. QC
Assmt
59,276.10
2012
61,338.91
2,000.00
23
Central 4 9 Marunong St. QC
Assmt
11,030.97
2012
11,414.85
2,000.00
24
Central 4 9 Matapang St. QC
Assmt
12,123.66
2012
12,545.56
2,000.00
25
Central 4 9 Matiyaga St. QC
Assmt
5,012.53
2012
5,186.97
2,000.00
26
Culiat 6 18 Commonwealth Ave. QC
Assmt
20,000.00
2013
20,000.00
4,500.00
27
Culiat 6 18 Congressional Ave. QC
Assmt
8,316.01
2013
8,316.01
2,000.00
28
Culiat 6 18 Kalaw St. QC
Assmt
5,496.02
2013
5,496.02
1,500.00
29
Culiat 6 18 Lopez Jaena St. QC
Assmt
6,523.53
2013
6,523.53
1,500.00
30
Culiat 6 18 Tierra Pura QC
Assmt
7,434.94
2013
7,434.94
1,500.00
31
Culiat 6 18 UP Professors Subd. QC
Assmt
8,000.00
2013
8,000.00
1,200.00
32
Culiat 6 18 Villa Firenze QC
Assmt
5,714.29
2013
5,714.29
1,200.00
33
Culiat 6 18 Villa Firenze QC
Assmt
5,555.56
2013
5,555.56
1,200.00
34
Culiat 6 18 Kapisanan ng Sambahayang
Magkakapitbahay ng Barangay
Culiat HOA
SHFC
2,350.00
2,375.00
2006
3,129.76
500.00
35
Culiat 6 18 Nepomuceno Compound HOA SHFC
2,000.00
2,941.00
2007
3,770.07
500.00
36
Damayan 1 6 F. D. Mayo QC
Assmt
7,500.00
2013
7,500.00
1,500.00
37
Damayan Lagi 4 14 12th St. QC
Assmt
32,902.47
2013
32,902.47
2,000.00
38
Damayan Lagi 4 14 9th St. QC
Assmt
12,172.28
2013
12,172.28
2,000.00
39
Damayan Lagi 4 14 Calvary Hill QC
Assmt
7,228.92
2013
7,228.92
2,000.00

81
40
Damayan Lagi 4 14 Madison QC
Assmt
15,422.65
2013
15,422.65
2,000.00
41
Del Monte 1 6 Mariblo St. QC
Assmt
5,213.27
2013
5,213.27
1,500.00
42
Dona Imelda 4 2 Araneta Ave. QC
Assmt
25,405.79
2012
26,289.91
5,000.00
43
Dona Imelda 4 2 Kapiligan St. QC
Assmt
16,800.00
2013
16,800.00
1,500.00
44
Dona Imelda 4 2 Zaragosa QC
Assmt
12,621.71
2013
12,621.71
1,500.00
45
Dona Josefa 4 3 Agno St. QC
Assmt
57,142.86
2013
57,142.86
2,000.00
46
Duyan-duyan 3 10 Narra St. QC
Assmt
10,476.19
2013
10,476.19
1,500.00
47
E. Rodriguez 3 12 E. Garcia cor. 15th Ave. QC
Assmt
6,535.95
2013
6,535.95
2,000.00
48
E. Rodriguez 3 12 Montreal QC
Assmt
8,888.89
2013
8,888.89
2,000.00
49
East Kamias 3 9 K-11th QC
Assmt
9,994.68
2013
9,994.68
2,000.00
50
East Kamias 3 9 K-8th QC
Assmt
40,000.00
2013
40,000.00
2,000.00
51
East Kamias 3 9 K-8th QC
Assmt
40,000.00
2013
40,000.00
2,000.00
52
East Kamias 3 9 K-J QC
Assmt
12,383.35
2013
12,383.35
2,000.00
53
Kamuning 4 8 K-3rd QC
Assmt
66,666.67
2013
66,666.67
1,500.00
54
Kamuning 4 8 K-4th QC
Assmt
28,333.33
2013
28,333.33
1,500.00
55
Kaunlaran 4 12 Banahaw St. QC
Assmt
10,000.00
2012
10,348.00
2,000.00
56
Kaunlaran 4 12 Kaunlaran QC
Assmt
15,000.00
2013
15,000.00
1,500.00
57
Laging Handa 4 8 Sct. Lozano QC
Assmt
10,864.20
2013
10,864.20
2,000.00
58
Lourdes 1 3 Cordillera St. QC
Assmt
23,333.33
2013
23,333.33
2,000.00
59
Lourdes 1 3 Laon Laan St. QC
Assmt
39,473.68
2013
39,473.68
2,000.00
60
Lourdes 1 3 Lourdes QC
Assmt
15,100.67
2013
15,100.67
1,500.00
61
Lourdes 1 3 Speaker Perez St. QC
Assmt
12,500.00
2013
12,500.00
2,000.00
62
Loyola Heights 3 15 B. Gonzales St. QC
Assmt
20,120.72
2013
20,120.72
2,000.00

82
63
Loyola Heights 3 15 Esteban Abada St. QC
Assmt
20,000.00
2013
20,000.00
2,000.00
64
Loyola Heights 3 15 Esteban Abada St. QC
Assmt
20,000.00
2013
20,000.00
2,000.00
65
Loyola Heights 3 15 Guerrero St. QC
Assmt
24,558.18
2013
24,558.18
2,000.00
66
Loyola Heights 3 15 Katipunan Ave. QC
Assmt
37,201.06
2013
37,201.06
4,500.00
67
Loyola Heights 3 10 Katipunan Ave. QC
Assmt
15,021.46
2013
15,021.46
4,500.00
68
Loyola Heights 3 15 Moscow St. QC
Assmt
11,150.00
2013
11,150.00
2,000.00
69
Loyola Heights 3 15 Xavierville 3 QC
Assmt
20,000.00
2013
20,000.00
2,500.00
70
Manresa 1 5 Pagataan St. QC
Assmt
8,200.00
2013
8,200.00
2,000.00
71
Mariana 4 12 12th St. QC
Assmt
24,640.66
2013
24,640.66
1,500.00
72
Mariana 4 12 12th St. QC
Assmt
14,719.00
2013
14,719.00
1,500.00
73
Mariana 4 12 14th St. QC
Assmt
12,012.01
2013
12,012.01
1,500.00
74
Mariana 4 14 5th St. QC
Assmt
21,145.37
2013
21,145.37
1,500.00
75
Mariana 4 12 8th St. QC
Assmt
42,062.38
2013
42,062.38
1,500.00
76
Mariana 4 12 Balite Drive QC
Assmt
14,107.30
2013
14,107.30
2,500.00
77
Mariana 4 14 Hemady QC
Assmt
17,080.75
2013
17,080.75
2,500.00
78
Masagana 3 10 J. Perez St. QC
Assmt
9,730.21
2013
9,730.21
1,500.00
79
Masagana 3 10 Kalantiaw St. QC
Assmt
22,222.22
2013
22,222.22
1,500.00
80
Masambong 1 5 Gasan St. QC
Assmt
4,803.92
2013
4,803.92
2,000.00
81
Masambong 1 5 Mabituin St. QC
Assmt
4,500.00
2013
4,500.00
2,000.00
82
Masambong 1 5 Mabituin St. QC
Assmt
4,500.00
2013
4,500.00
2,000.00
83
Milagrosa 3 10 P. Tuazon Ave. QC
Assmt
8,474.58
2013
8,474.58
1,500.00
84
Paang Bundok 1 4 Bulusan St. QC
Assmt
2,916.67
2013
2,916.67
1,500.00
85
Paang Bundok 1 4 Iba St. QC
Assmt
7,500.00
2012
7,500.00
1,500.00

83
86
Pag-ibig sa Nayon 1 17 A. Bonifacio cor. Marvex QC
Assmt
15,576.32
2013
15,576.32
4,500.00
87
Paltok 1 6 Catanduanes St. QC
Assmt
8,571.43
2013
8,571.43
2,000.00
88
Paltok 1 6 La Union St. QC
Assmt
7,000.00
2013
7,000.00
1,500.00
89
Paltok 1 6 Natividad St. QC
Assmt
5,102.04
2013
5,102.04
2,000.00
90
Pansol 3 15 Ayala Heights QC
Assmt
19,455.25
2013
19,455.25
2,500.00
91
Pansol 3 15 Denmark St. QC
Assmt
11,000.00
2013
11,000.00
2,000.00
92
Pansol 3 15 Loyola Grand Villas QC
Assmt
12,000.00
2013
12,000.00
2,000.00
93
Pansol 3 15 Loyola Grand Villas QC
Assmt
11,150.00
2013
11,150.00
2,000.00
94
Pansol 3 15 Moscow St. QC
Assmt
11,150.00
2013
11,150.00
2,000.00
95
Pansol 3 15 Moscow St. QC
Assmt
11,000.00
2013
11,000.00
2,000.00
96
Pansol 3 15 Moscow St. QC
Assmt
11,120.00
2013
11,120.00
2,000.00
97
Pansol 3 15 Moscow St. QC
Assmt
11,100.00
2013
11,100.00
2,000.00
98
Pansol 3 15 Moscow St. QC
Assmt
11,100.00
2013
11,100.00
2,000.00
99
Pansol 3 15 Moscow St. QC
Assmt
11,471.86
2013
11,471.86
2,000.00
100
Pansol 3 15 Moscow St. QC
Assmt
11,100.00
2013
11,100.00
2,000.00
101
Pansol 3 15 Soliven Extn. QC
Assmt
11,500.00
2013
11,500.00
2,500.00
102
Pansol 3 15 Yakan St. QC
Assmt
28,089.89
2013
28,089.89
2,500.00
103
Pasong Tamo 6 18 Bato Bato St. QC
Assmt
6,483.79
2013
6,483.79
1,500.00
104
Pasong Tamo 6 18 Bonifacio Village QC
Assmt
6,250.00
2013
6,250.00
1,200.00
105
Pasong Tamo 6 18 Bonifacio Village QC
Assmt
3,400.00
2013
3,400.00
1,200.00
106
Pasong Tamo 6 18 Bonifacio Village QC
Assmt
5,000.00
2013
5,000.00
1,200.00
107
Pasong Tamo 6 18 Bonifacio Village QC
Assmt
3,400.00
2013
3,400.00
1,200.00
108
Pasong Tamo 6 18 Caimito St. QC
Assmt
11,295.60
2012
11,688.69
1,200.00

84
109
Pasong Tamo 6 18 Dao St. Mapayapa IV QC
Assmt
3,521.13
2013
3,521.13
1,200.00
110
Pasong Tamo 6 18 Maries Village QC
Assmt
2,673.80
2013
2,673.80
1,200.00
111
Pasong Tamo 6 18 Mira-Nila Homes QC
Assmt
6,500.00
2013
6,500.00
1,500.00
112
Pasong Tamo 6 18 Mira-Nila Homes QC
Assmt
6,483.79
2013
6,483.79
1,500.00
113
Pasong Tamo 6 18 Pampanga QC
Assmt
5,250.00
2011
5,633.71
1,500.00
114
Pasong Tamo 6 18 Road 17 QC
Assmt
2,178.33
2013
2,178.33
500.00
115
Pasong Tamo 6 18 Sarimanok cor. Alondras QC
Assmt
7,000.00
2013
7,000.00
1,500.00
116
Pasong Tamo 6 18 T. Legarda QC
Assmt
7,000.00
2013
7,000.00
500.00
117
Pasong Tamo 6 18 Trinity Drive QC
Assmt
5,000.00
2013
5,000.00
1,200.00
118
Pasong Tamo 6 18 Trinity Drive QC
Assmt
7,000.00
2012
7,243.60
1,200.00
119
Pasong Tamo 6 18 Augustine Ville HOA SHFC
2,500.00
2,792.86
2007
3,580.17
500.00
120
Pasong Tamo 6 18 Camachile Pasong Tamo Quezon
City HOA
SHFC
2,000.00
2,124.34
2010
2,377.63
500.00
121
Pasong Tamo 6 18 Lema Ville HOA SHFC
2,300.00
2,638.08
2009
3,058.91
500.00
122
Pasong Tamo 6 18 Maria Victoria HOA SHFC
2,847.00
2,625.00
2005
3,719.58
1,200.00
123
Pasong Tamo 6 18 M-Pilar Ville HOA SHFC
3,300.00
2,807.88
2009
3,255.80
2,000.00
124
Pasong Tamo 6 18 Palmdale HOA SHFC
1,741.73
2,375.00
2008
2,866.77
500.00
125
Pasong Tamo 6 18 Realm Village HOA SHFC
2,250.00
2,524.70
2008
3,047.47
1,200.00
126
Pasong Tamo 6 18 Samahang Magkakapitbahay ng
Sitio Evergreen HOA
SHFC
1,500.00
3,833.33
2011
4,113.50
500.00
127
Pasong Tamo 6 18 San Labrador HOA SHFC
2,500.00
2,200.00
2005
3,117.36
500.00
128
Pasong Tamo 6 18 Shining Hope HOA Phase I SHFC
2,500.00
2,625.00
2007
3,364.99
500.00
129
Pasong Tamo 6 18 Shining Hope HOA Phase II SHFC
3,000.00
2,625.00
2007
3,364.99
500.00
130
Pinyahan 4 9 Mapang-akit QC
Assmt
10,416.67
2013
10,416.67
2,000.00
131
Pinyahan 4 9 Matapang cor. Mapagbigay QC
Assmt
9,442.87
2013
9,442.87
2,000.00
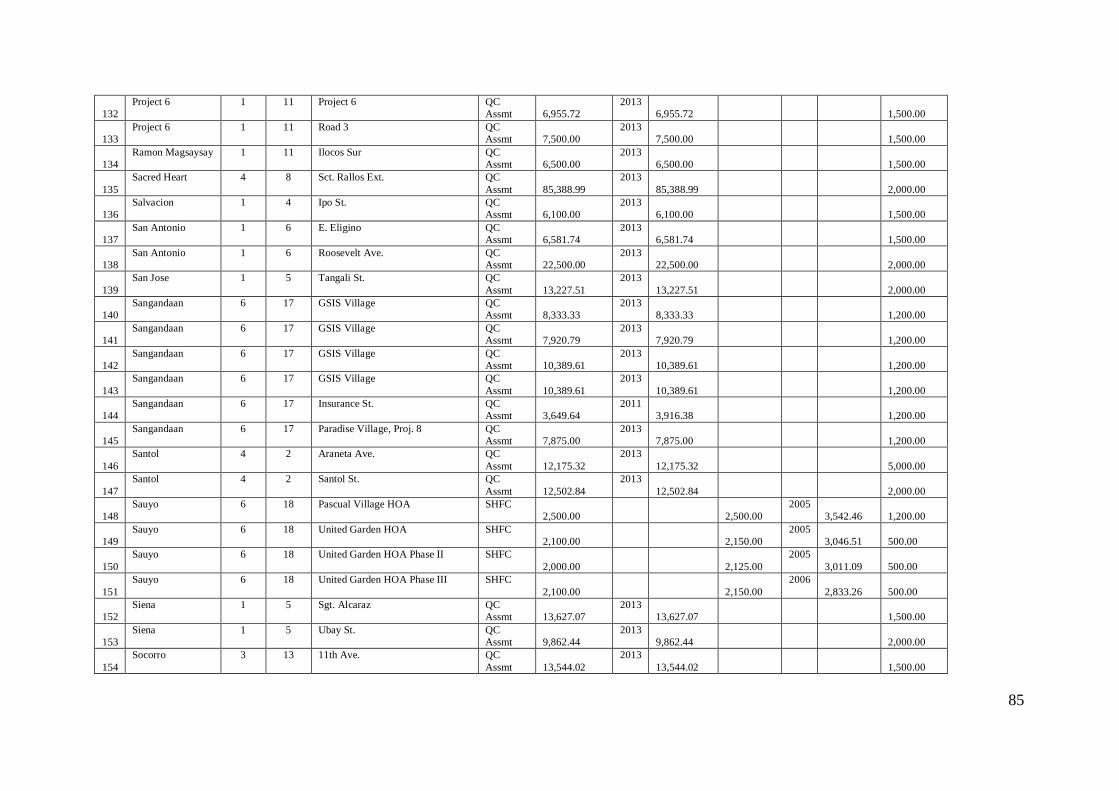
85
132
Project 6 1 11 Project 6 QC
Assmt
6,955.72
2013
6,955.72
1,500.00
133
Project 6 1 11 Road 3 QC
Assmt
7,500.00
2013
7,500.00
1,500.00
134
Ramon Magsaysay 1 11 Ilocos Sur QC
Assmt
6,500.00
2013
6,500.00
1,500.00
135
Sacred Heart 4 8 Sct. Rallos Ext. QC
Assmt
85,388.99
2013
85,388.99
2,000.00
136
Salvacion 1 4 Ipo St. QC
Assmt
6,100.00
2013
6,100.00
1,500.00
137
San Antonio 1 6 E. Eligino QC
Assmt
6,581.74
2013
6,581.74
1,500.00
138
San Antonio 1 6 Roosevelt Ave. QC
Assmt
22,500.00
2013
22,500.00
2,000.00
139
San Jose 1 5 Tangali St. QC
Assmt
13,227.51
2013
13,227.51
2,000.00
140
Sangandaan 6 17 GSIS Village QC
Assmt
8,333.33
2013
8,333.33
1,200.00
141
Sangandaan 6 17 GSIS Village QC
Assmt
7,920.79
2013
7,920.79
1,200.00
142
Sangandaan 6 17 GSIS Village QC
Assmt
10,389.61
2013
10,389.61
1,200.00
143
Sangandaan 6 17 GSIS Village QC
Assmt
10,389.61
2013
10,389.61
1,200.00
144
Sangandaan 6 17 Insurance St. QC
Assmt
3,649.64
2011
3,916.38
1,200.00
145
Sangandaan 6 17 Paradise Village, Proj. 8 QC
Assmt
7,875.00
2013
7,875.00
1,200.00
146
Santol 4 2 Araneta Ave. QC
Assmt
12,175.32
2013
12,175.32
5,000.00
147
Santol 4 2 Santol St. QC
Assmt
12,502.84
2013
12,502.84
2,000.00
148
Sauyo 6 18 Pascual Village HOA SHFC
2,500.00
2,500.00
2005
3,542.46
1,200.00
149
Sauyo 6 18 United Garden HOA SHFC
2,100.00
2,150.00
2005
3,046.51
500.00
150
Sauyo 6 18 United Garden HOA Phase II SHFC
2,000.00
2,125.00
2005
3,011.09
500.00
151
Sauyo 6 18 United Garden HOA Phase III SHFC
2,100.00
2,150.00
2006
2,833.26
500.00
152
Siena 1 5 Sgt. Alcaraz QC
Assmt
13,627.07
2013
13,627.07
1,500.00
153
Siena 1 5 Ubay St. QC
Assmt
9,862.44
2013
9,862.44
2,000.00
154
Socorro 3 13 11th Ave. QC
Assmt
13,544.02
2013
13,544.02
1,500.00

86
155
Socorro 3 13 14th Ave. QC
Assmt
10,937.50
2013
10,937.50
1,500.00
156
Socorro 3 13 14th Ave. QC
Assmt
6,250.00
2013
6,250.00
1,500.00
157
South Triangle 4 16 Quezon Ave. QC
Assmt
61,162.08
2013
61,162.08
5,000.00
158
South Triangle 4 16 Sct. Borromeo QC
Assmt
30,000.00
2013
30,000.00
2,500.00
159
South Triangle 4 16 Timog Ave. QC
Assmt
16,055.05
2013
16,055.05
5,000.00
160
Sta. Cruz 1 7 Heroes Hill Subd. QC
Assmt
7,500.00
2013
7,500.00
2,000.00
161
Sta. Cruz 1 7 Quezon Ave. QC
Assmt
37,548.89
2013
37,548.89
5,000.00
162
Sto. Domingo 1 3 Biak-na-Bato St. QC
Assmt
10,008.84
2012
10,357.15
2,500.00
163
Talipapa 6 18 Don Mariano QC
Assmt
5,000.00
2013
5,000.00
1,200.00
164
Talipapa 6 17 Quirino Highway QC
Assmt
14,929.58
2013
14,929.58
2,000.00
165
Talipapa 6 17 Villa Sabina QC
Assmt
3,825.14
2013
3,825.14
1,200.00
166
Tandang Sora 6 18 Administration St. QC
Assmt
7,000.00
2013
7,000.00
1,200.00
167
Tandang Sora 6 18 Auditing St. QC
Assmt
6,265.66
2013
6,265.66
1,200.00
168
Tandang Sora 6 18 Botocan St. QC
Assmt
5,555.56
2013
5,555.56
1,200.00
169
Tandang Sora 6 18 Carmel 3 QC
Assmt
7,211.54
2013
7,211.54
1,200.00
170
Tandang Sora 6 18 Florencio St. QC
Assmt
5,144.69
2013
5,144.69
1,200.00
171
Tandang Sora 6 18 Greenfield St. QC
Assmt
5,406.25
2013
5,406.25
1,500.00
172
Tandang Sora 6 18 NAPOCOR Village QC
Assmt
12,500.00
2013
12,500.00
1,200.00
173
Tandang Sora 6 18 NIA Village QC
Assmt
4,250.00
2013
4,250.00
1,200.00
174
Tandang Sora 6 18 NIA Village QC
Assmt
4,250.00
2013
4,250.00
1,200.00
175
Tandang Sora 6 18 Proposed Visayas Ave. QC
Assmt
3,500.00
2013
3,500.00
2,000.00
176
Tandang Sora 6 18 G. H. Aldana Compound HOA SHFC
2,000.00
2,170.00
2005
3,074.85
500.00
177
Tandang Sora 6 18 Handog sa Iyo Anak HOA SHFC
3,000.00
2,833.89
2010
3,171.78
500.00

87
178
Tandang Sora 6 18 Malolos HOA SHFC
3,047.00
2,637.50
2007
3,381.01
500.00
179
Tandang Sora 6 18 Tandang Sora Ville HOA SHFC
2,000.00
2,575.00
2007
3,300.90
500.00
180
Tatalon 4 3 Galintan St. QC
Assmt
18,000.00
2013
18,000.00
1,500.00
181
Tatalon 4 3 Kitanlad St. QC
Assmt
32,000.00
2013
32,000.00
2,000.00
182
Tatalon 4 3 Kitanlad St. QC
Assmt
10,096.15
2013
10,096.15
2,000.00
183
Ugong Norte 3 13 Fuentes St. QC
Assmt
28,087.94
2013
28,087.94
2,500.00
184
Ugong Norte 3 13 Greenmeadows Subd. QC
Assmt
32,500.00
2013
32,500.00
3,000.00
185
Ugong Norte 3 13 Madrigal Circle QC
Assmt
49,261.08
2013
49,261.08
2,500.00
186
Ugong Norte 3 13 Navarro St. QC
Assmt
39,538.71
2012
40,914.66
2,500.00
187
Ugong Norte 3 13 Swallow Drive QC
Assmt
30,000.00
2013
30,000.00
3,000.00
188
Valencia 4 14 1st St. QC
Assmt
21,895.86
2012
22,657.84
2,000.00
189
Veterans Village 1 11 Bakawan St. QC
Assmt
7,958.62
2013
7,958.62
1,500.00
190
Veterans Village 1 11 Bakawan St. QC
Assmt
11,876.48
2013
11,876.48
1,500.00
191
Veterans Village 1 11 Bakawan St. QC
Assmt
16,501.65
2013
16,501.65
1,500.00
192
Veterans Village 1 11 M. H. Del Pilar St. QC
Assmt
6,137.72
2013
6,137.72
1,500.00
193
West Kamias 3 9 K-6th QC
Assmt
12,000.00
2013
12,000.00
1,500.00
194
West Triangle 1 16 Free Press St. QC
Assmt
20,000.00
2013
20,000.00
2,500.00
195
West Triangle 1 16 Liwayway St. QC
Assmt
20,689.66
2013
20,689.66
2,500.00
196
West Triangle 1 16 Times St. QC
Assmt
20,000.00
2010
22,384.61
2,500.00
197
West Triangle 1 16 West Triangle Homes I QC
Assmt
18,000.00
2013
18,000.00
2,500.00
198
White Plains 3 13 Katipunan Ave. QC
Assmt
12,469.14
2013
12,469.14
1,500.00
199
White Plains 3 13 Pinesville cor. Roseville QC
Assmt
33,232.63
2013
33,232.63
1,500.00
200
White Plains 3 13 Red Arrow QC
Assmt
7,791.67
2013
7,791.67
1,500.00
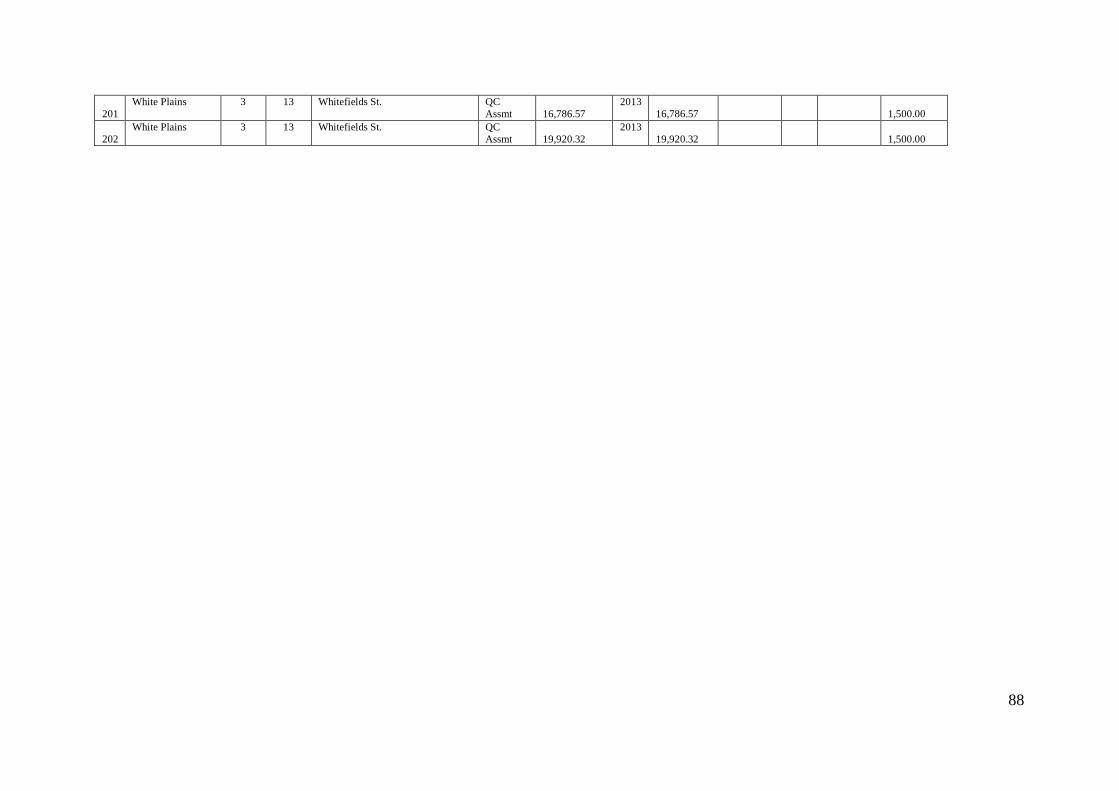
88
201
White Plains 3 13 Whitefields St. QC
Assmt
16,786.57
2013
16,786.57
1,500.00
202
White Plains 3 13 Whitefields St. QC
Assmt
19,920.32
2013
19,920.32
1,500.00

89

![Yap - Housing Priorities Expenditure Patterns and the Urban Poor [1989]](https://static.fdokumen.com/doc/165x107/63443337ec3062c5b408af48/yap-housing-priorities-expenditure-patterns-and-the-urban-poor-1989.jpg)