Indicators of Education on the Russian Federation
317
-
Upload
khangminh22 -
Category
Documents
-
view
3 -
download
0
Transcript of Indicators of Education on the Russian Federation


Editorial Board: Leonid Gokhberg, Natalia Kovaleva, and Yaroslav Kuzminov
Authors: Natalia Bondarenko, Leonid Gokhberg, Irina Zabaturina, Natalia Kovaleva, Vera Kuznetsova, Olga Ozerova, Marina Pinskaya, Oleg Podolskiy, Alena Ponomareva, Ekaterina Rylko, and Nikolay Schugal
With contributions by Rosstat experts: Zifa Zaynullina, Nadezhda Konovka, Vasily Kuznetsov, Marina Ryazanova, Marina Sabelnikova, Tatyana Savostyanova, Elena Frolova, and Venera Chumarina
Indicators of Education in the Russian Federation : Data Book / N. Bondarenko, L. Gokhberg, I. Zabaturina, et al.; National Research University Higher School of Economics. – Moscow: HSE, 2017. – 316 p.
The data book prepared by Institute for Statistical Studies and Economics of Knowledge, National Research University Higher School of Economics (HSE ISSEK) covers data on the level and trends in the education indicators in the Russian Federation, including comparative international data. Some sections contain an assessment of the educational attainment of students, relation between the educational attainment and the labour market, education funding, enrolment, personnel, and conditions of studying.
The data book uses information provided by the Federal State Statistics Service, the Ministry of Education and Science of the Russian Federation, Federal Treasury, the Organisation for Economic Co-operation and Development as well as the results of methodological and analytical studies by HSE ISSEK.
The publication was prepared within the framework of the Basic Research Programme at the National Research University Higher School of Economics (HSE) and supported within the framework of a subsidy by the Russian Academic Excellence Project ‘5-100’.
© National Research University Higher School of Economics, 2017 Reference is mandatory in case of reproduction

3 Indicators of Education in the Russian Federation
CONTENTS
Education System in the Russian Federation ......................................16
1. Educational Potential of the Population ..........................17
1.1. Educational attainment of the population aged 15 and over: 2015 .........................................................18
1.2. Educational attainment of the population aged 25–64 by age: 2015 .......................................................19
1.3. Education expectancy of children aged 6 .................................22
1.4. Graduation rates from professional education institutions ........................................................................23
1.5. Russian 15-year-old students’ performance ..............................24
1.6. Percentage distribution of Russian and OECD countries’ 15-year-old students by level of science performance ................25
1.7. Distribution of 15-year-old students with the lowest and the highest level of science performance by country ............26
1.8. Percentage distribution of Russian and OECD countries’ 15-year-old students by level of reading performance ................28
1.9. Distribution of 15-year-old students with the lowest and the highest level of reading performance by country ............29
1.10. Percentage distribution of Russian and OECD countries’ 15-year-old students by level of mathematics performance ........31
1.11. Distribution of 15-year-old students with the lowest and the highest level of mathematics performance by country ..........................................................................32
1.12. Literacy proficiency of the population aged 16–65 by educational attainment and country ...................................34
1.13. Numeracy proficiency of the population aged 16–65 by educational attainment and country ...................................35
1.14. Literacy proficiency of the population aged 16–65 by labour force status and country .........................................36
1.15. Literacy proficiency of 16 to 29-year-olds having attained secondary vocational and higher education by country ..........................................................................37
1.16. Participation of the population in lifelong learning ...................38
1.17. Participation of the population of Russia and European countries in lifelong learning by type ......................................40
Technical notes ........................................................................... 44
2. Education and the Labour Market ....................................47
2.1. Employment and unemployment rates by educational attainment: 2015 .................................................................48
2.2. Employed population by educational attainment.......................49
2.3. Employed population by educational attainment and age: 2015 .....................................................................50
2.4. Unemployed population by educational attainment ...................51
2.5. Unemployed population by educational attainment and age: 2015 .....................................................................52

4Contents
2.6. Average duration of unemployment by educational attainment .........................................................................53
2.7. Long-term unemployment by educational attainment and gender: 2015 .................................................................55
2.8. Share of population having higher education in the workforce by field of studies (major) according to their diploma: 2015 ............................................56
2.9. Share of population having secondary vocational education (programmes for mid-career professionals) in the workforce by field of studies (major) according to their diploma: 2015 ..........................................................57
2.10. Share of population having secondary vocational education (programmes for skilled workers, junior technicians and employees) in the workforce by field of studies (major) according to their diploma: 2015 ...................58
2.11. Share of 2012–2014 graduates of secondary vocational education institutions and of higher education institutions in the workforce: 2015 .........................................59
2.12. Correspondence between the main job and the educational qualification of employed population by educational attainment .........................................................................60
2.13. Potential workforce by educational attainment ........................61
2.14. Average salaries by educational attainment and gender .............62
2.15. Relative average salaries of employees by educational attainment .........................................................................63
2.16. Average salaries by occupation and educational attainment: 2015 .................................................................64
2.17. Secondary vocational education graduates (programmes for skilled workers, junior technicians and employees) (intramural full-time form of studies) .....................................65
2.18. Bachelors, specialists and masters who graduated from state and municipal educational institutions (intramural full-time form of studies) .....................................66
2.19. Number of educational institutions graduates, registered with the public employment service ........................................67
Technical notes ............................................................................68
3. Funding .......................................................................69
3.1. Expenditure on education in the Russian Federation ..................70
3.2. Еxpenditure on education in the Russian Federation as a percentage of GDP .........................................................71
3.3. Public expenditure on education by level of the budget system ............................................................72
3.4. Trends in еxpenditure on education ........................................73
3.5. Public expenditure on education as a percentage of the total expenditure of the consolidated budget of the Russian Federation and the budgets of state extra-budgetary funds ..........................................................74
3.6. Public expenditure on education as a percentage of GDP by level of the budget system .......................................75
3.7. Public expenditure on education by subsection of budgetary expenditure classification ...................................76
3.8. Public expenditure on education as a percentage of Russian by subsection of budgetary expenditure classification ...............77

5 Indicators of Education in the Russian Federation
3.9. Public expenditure on education per student by section of the budget expenditure classification ...................78
3.10. Fixed investment in the education sector .................................79
3.11. Fixed investment in the education sector by funding source ................................................................79
3.12. Fixed investment in the education sector by form of ownership .......................................................................80
3.13. Paid services in the education system .....................................81
3.14. Household expenditure on educational services ........................81
3.15. Household expenditure on educational services by income deciles ................................................................82
3.16. Funds of preschool education institutions by source of funds .............................................................................83
3.17. Funds of general education institutions by source of funds ............................................................................ 84
3.18. Funds of educational institutions of supplementary education implementing supplementary general education programmes for children by source of funds ...............85
3.19. Funds of educational institutions implementing secondary vocational education programmes by source of funds: 2015 .......................................................86
3.20. Funds of higher education institutions by source of funds .............................................................................87
3.21. Average consumer prices for educational services .....................89
3.22. Consumer price indices for certain types of services in the education system ........................................................90
3.23. Enrolment, entrants and graduates from secondary vocational education institutions implementing programmes for skilled workers, junior technicians and employees institutions by funding source ..........................91
3.24. Enrolment, entrants and graduates from secondary vocational education institutions implementing programmes for mid-career professionals by funding source ................................................................92
3.25. Enrolment, entrants and graduates from higher education institutions implementing bachelor’s, specialist’s and master’s programmes by funding source .............................94
3.26. Average monthly accrued salaries in the education sector ..........96
3.27. Real accrued salaries in the education sector and the economy .................................................................97
3.28. Average monthly accrued salaries in the education sector by ownership .......................................................................97
3.29. Average monthly accrued salaries in the education sector by type of activity ...............................................................98
3.30. Average monthly accrued salaries in the education sector as a percentage of salaries in the national economy by type of activity ...............................................................99
3.31. Average salaries of pedagogical personnel at state and municipal educational institutions ................................. 100
Technical notes .......................................................................... 102
4. Enrolment ..................................................................105
4.1. Trends in the number of students studying within selected educational programmes ..................................................... 106

6Contents
4.2. Enrolment in institutions engaged in educational activities within educational programmes of preschool education, baby and child care ........................... 107
4.3. Enrolment in institutions engaged in educational activities within educational programmes of preschool education, baby and child care by group: 2015 .................................................................. 108
4.4. Enrolment in institutions engaged in educational activities within educational programmes of preschool education, baby and child care by gender and age: 2015 ..................................................... 109
4.5. Attendance at institutions engaged in educational activities within educational programmes of preschool education, baby and child care ........................... 109
4.6. Number of children attending short-term groups ..................... 110
4.7. General education enrolment .............................................. 111
4.8. Participation of children and adolescents in programmes of primary education, basic and secondary general education ......................................................................... 112
4.9. Enrolment in general education institutions (excluding part-time (shift) general education institutions) by gender and age: 2015/2016 ........................... 113
4.10. Enrolment in general education institutions (excluding part-time (shift) general education institutions) by grade......................................................... 114
4.11. General education enrolment of people with limited health capacities, disabled children and disabled people .......... 115
4.12. Enrolment of people with limited health capacities, disabled children and disabled people in general education institutions (excluding part-time (shift) general education institutions) in classes (groups) that are not special classes (groups) for those sdudying activities in accordance with adapted basic general education programmes .................. 116
4.13. Enrolment of people with limited health capacities, disabled children and disabled people, who are tutored at home ..................................................... 117
4.14. Enrolment in state and municipal special general education institutions and classes (groups) for students with limited health capacities ............................ 118
4.15. General education students who have successfully completed their school education ......................................... 119
4.16. Number of children and adolescents aged 7–18 not studying at educational institutions due to various reasons .............................................................120
4.17. Percentage distribution of children and adolescents aged 7–18 not studying at educational institutions by gender and age: 2015 ..................................................... 121
4.18. Enrolment in educational institutions of supplementary education implementing supplementary general education programmes for children ............................122
4.19. Secondary vocational education enrolment: programmes for skilled workers, junior technicians and employees...................................................................122

7 Indicators of Education in the Russian Federation
4.20. Participation of young people in secondary vocational education: programmes for skilled workers, junior technicians and employees .........................................123
4.21. Secondary vocational education enrolment: programmes for skilled workers, junior technicians and employees by age ......................................................... 124
4.22. Secondary vocational education enrolment (programmes for skilled workers, junior technicians and employees) of people with limited health capacities, disabled children and disabled people ....................125
4.23. Secondary vocational education entrants: programmes for skilled workers, junior technicians and employees...................................................................125
4.24. Secondary vocational education graduates (programmes for skilled workers, junior technicians and employees) by occupation .............................................126
4.25. Secondary vocational education enrolment: programmes for mid-career professionals ............................... 127
4.26. Participation of young people in secondary vocational education: programmes for mid-career professionals by gender .........................................................................128
4.27. Secondary vocational education enrolment (programmes for mid-career professionals) by gender and age ..............................................................129
4.28. Percentage distribution of secondary vocational education enrolment (programmes for mid-career professionals) by mode of study: 2015/2016 ...........................130
4.29. Secondary vocational education enrolment (programmes for mid-career professionals) of people with limited health capacities, disabled children and disabled people: 2015/2016 ........................................... 131
4.30. Secondary vocational education enrolment of foreign students (programmes for mid-career professionals) ................132
4.31. Secondary vocational education entrants: programmes for mid-career professionals ...............................133
4.32. Secondary vocational education graduates (programmes for mid-career professionals) .............................133
4.33. Secondary vocational education graduates (programmes for mid-career professionals) by major occupation group: 2004–2013 .................................134
4.34. Secondary vocational education graduates (programmes for mid-career professionals) by major occupation group: 2014, 2015 .................................135
4.35. Higher education enrolment: bachelor’s, specialist’s and master’s programmes .................................................... 137
4.36. Participation of young people in higher education: bachelor’s, specialist’s and master’s programmes by gender .........................................................................138
4.37. Higher education enrolment (bachelor’s, specialist’s and master’s programmes) by gender and age .........................139
4.38. Higher education enrolment by degree .................................. 140
4.39. Percentage distribution of higher education enrolment (bachelor’s, specialist’s and master’s programmes) by mode of study: 2015/2016 ............................................... 141

8Contents
4.40. Enrolment (bachelor’s, specialist’s and master’s programmes) of people with limited health capacities, disabled children and disabled people ................................... 142
4.41. Higher education enrolment of foreign students (bachelor’s, specialist’s and master’s programmes) .................. 143
4.42. Percentage distribution of higher education enrolment of foreign students (bachelor’s, specialist’s and master’s programmes) studying on general terms by citizenship: 2015/2016 ..........................................144
4.43. Higher education entrants: bachelor’s, specialist’s and master’s programmes .................................................... 145
4.44. Higher education entrants by degree .................................... 146
4.45. Higher education entrants: bachelor’s, specialist’s and master’s programmes by major occupation group and by field of study ........................................................... 147
4.46. Higher education graduates: bachelor’s, specialist’s and master’s programmes .................................................... 149
4.47. Percentage distribution of graduates by diploma degree ..........150
4.48. Training of academic personnel in postgraduate courses ........... 151
4.49. Postgraduate courses enrolment by gender and age .................152
4.50. Postgraduate courses graduates by field of science and technology .................................................................153
4.51. People who defended dissertation during the period of training by field of science and technology: 2015 ................154
Technical notes ..........................................................................155
5. Personnel ...................................................................157
5.1. Average annual number of the employed population by economic activity ..........................................................158
5.2. Population employed in education as a percentage of the total population employed in the economy ...................159
5.3. Female proportion in the total population employed in the economy and in education .......................................... 160
5.4. Percentage distribution of the population employed in the economy and in education by educational attainment: 2015 ............................................................... 161
5.5. Average age of the population employed in the economy and in education ............................................................... 162
5.6. Average annual employment in the education sector ................ 163
5.7. Employees (pedagogical personnel) at institutions engaged in educational activities within educational programmes of preschool education, baby and child care by category ........... 164
5.8. Pedagogical personnel at institutions engaged in educational activities within educational programmes of preschool education, baby and child care by position ........... 165
5.9. Female proportion in the number of employees (pedagogical personnel) at institutions engaged in educational activities within educational programmes of preschool education, baby and child care by position ............................................ 166
5.10. Educational attainment of pedagogical personnel at institutions engaged in educational activities within educational programmes of preschool education, baby and child care ............................................................ 167

9 Indicators of Education in the Russian Federation
5.11. Educational attainment of pedagogical personnel at institutions engaged in educational activities within educational programmes of preschool education, baby and child care by position: 2015 .................................... 168
5.12. Percentage distribution of the employees (pedagogical personnel) at institutions engaged in educational activities within educational programmes of preschool education, baby and child care by age ................................................... 169
5.13. Percentage distribution of the employees (pedagogical personnel) at institutions engaged in educational activities within educational programmes of preschool education, baby and child care by position and age: 2015 ........................ 170
5.14. Number of children attending educational institutions engaged in educational activities within educational programmes of preschool education, baby and child care per one educator ................................................................ 171
5.15. Personnel at general education institutions by category .......... 172
5.16. Employees at general education institutions (excluding part-time (shift) general education institutions) by category ....................................................................... 173
5.17. Pedagogical personnel at general education institutions by position ....................................................................... 174
5.18. Staffing level at general education institutions: 2015 .............. 175
5.19. Pedagogical personnel at general education institutions (excluding part-time (shift) general education institutions) by position ....................................................................... 176
5.20. Female proportion in the number of pedagogical personnel at general education institutions by position ......................... 177
5.21. Female proportion in the number of pedagogical personnel at general education institutions (excluding part-time (shift) general education institutions) by position .................. 178
5.22. Educational attainment of pedagogical personnel at general education institutions ......................................... 179
5.23. Educational attainment of pedagogical personnel at general education institutions (excluding part-time (shift) general education institutions) .................................. 180
5.24. Educational attainment of pedagogical personnel at general education institutions by position: 2015 ................. 181
5.25. Percentage distribution of the pedagogical personnel at general education institutions by age ................................ 182
5.26. Percentage distribution of the pedagogical personnel at general education institutions by position and age: 2015 ..... 183
5.27. Teachers at general education institutions by specialisation .....184
5.28. Staffing level at general education institutions by specialisation: 2015 .......................................................186
5.29. Female proportion in the number of teachers at general education institutions by specialisation ................................ 188
5.30. Educational attainment of teachers at general education institutions by age and qualification: 2015 ............................ 190
5.31. Number of students at general education institutions per one teacher ................................................................. 191
5.32. General overview of teachers and school principals ................. 192
5.33. Mean age of teachers and school principals .......................... 194
5.34. Total teachers’ working hours per week ................................. 194

10Contents
5.35. Allocation of working time of teachers and principals by activity ....................................................................... 195
5.36. Teachers reporting moderate or high levels of need for professional development in different areas ...................... 197
5.37. Barriers to participation in professional development .............. 198
5.38. Outcomes of teacher appraisal ............................................. 199
5.39. Personnel at institutions for supplementary general education of children by category .........................................200
5.40. Pedagogical personnel at institutions for supplementary general education of children by position ..............................200
5.41. Staffing level at institutions for supplementary general education of children: 2015 .................................................201
5.42. Female proportion in the pedagogical personnel at institutions for supplementary general education of children by position ........................................................202
5.43. Educatonal attainment of pedagogical personnel at institutions for supplementary general education of children ........................................................................202
5.44. Educatonal attainment of pedagogical personnel at institutions for supplementary general education of children by position: 2015 ...............................................203
5.45. Percentage distribution of the pedagogical personnel at institutions for supplementary general education of children by age ..............................................................204
5.46. Percentage distribution of the pedagogical personnel at institutions for supplementary general education of children by position and age: 2015 ....................................205
5.47. Personnel at vocational education institutions implementing secondary vocational education programmes for skilled workers, junior technicians and employees by category .......................................................................206
5.48. Pedagogical personnel at vocational education institutions implementing secondary vocational education programmes for skilled workers, junior technicians and employees by position ....................................................................... 207
5.49. Staffing level at vocational education institutions implementing secondary vocational education programmes for skilled workers, junior technicians and employees by position: 2015 ...............................................................208
5.50. Female proportion in the pedagogical personnel at vocational education institutions implementing secondary vocational education programmes for skilled workers, junior technicians and employees by position ..................................................209
5.51. Educational attaimnemt of the pedagogical personnel at vocational education institutions implementing secondary vocational education programmes for skilled workers, junior technicians and employees .............. 210
5.52. Educational attaimnemt of the pedagogical personnel at vocational education institutions implementing secondary vocational education programmes for skilled workers, junior technicians and employees by position: 2015 ............................................................... 211
5.53. Percentage distribution of the pedagogical personnel at vocational education institutions implementing secondary vocational education programmes for skilled workers, junior technicians and employees by position and age ...................... 212

11 Indicators of Education in the Russian Federation
5.54. Percentage distribution of the pedagogical personnel at vocational education institutions implementing secondary vocational education programmes for skilled workers, junior technicians and employees by position and age: 2015 ................................................... 213
5.55. Teachers at vocational education institutions implementing secondary vocational education programmes for skilled workers, junior technicians and employees................................................................... 214
5.56. Industrial training instructors at vocational education institutions implementing secondary vocational education programmes for skilled workers, junior technicians and employees whose professional skills are of the same level and/or higher than those of the graduates ................................................................ 215
5.57. Number of students at vocational education institutions implementing secondary vocational education programmes for skilled workers, junior technicians and employees per one teacher (including industrial training instructors) ....... 216
5.58. Personnel at educational institutions implementing secondary vocational education programmes for mid-career professionals by category ................................ 217
5.59. Pedagogical personnel at educational institutions implementing secondary vocational education programmes for mid-career professionals by position ............... 218
5.60. Female proportion in the number of pedagogical personnel at educational institutions implementing secondary vocational education programmes for mid-career professionals .................................................221
5.61. Female proportion in the number of pedagogical personnel at educational institutions implementing secondary vocational education programmes for mid-career professionals by position: 2015/2016 ................222
5.62. Educational attainment of pedagogical personnel at educational institutions implementing secondary vocational education programmes for mid-career professionals .....................................................................223
5.63. Educational attainment of pedagogical personnel at educational institutions implementing secondary vocational education programmes for mid-career professionals by position: 2015/2016 .................................... 224
5.64. Teachers at educational institutions implementing secondary vocational education programmes for mid-career professionals .................................................225
5.65. Female proportion in the number of teachers at educational institutions implementing secondary vocational education programmes for mid-career professionals .....................................................................226
5.66. Teachers at educational institutions implementing secondary vocational education programmes for mid-career professionals having scientific degrees and/or academic status ........................................... 227
5.67. Teachers at educational institutions implementing secondary vocational education programmes for mid-career professionals who have undergone professional development (aimed at upgrading professional skills) and/or retraining.....................................228

12Contents
5.68. Percentage distribution of teachers at educational institutions implementing secondary vocational education programmes for mid-career professionals by age ......................229
5.69. Personnel at higher education institutions by category ............230
5.70. Pedagogical personnel at higher education institutions ...........232
5.71. Pedagogical personnel at higher education institutions by position .......................................................................233
5.72. Female proportion in the pedagogical personnel at higher education institutions ...........................................234
5.73. Female proportion in the pedagogical personnel at higher education institutions by position: 2015/2016 ..........235
5.74. Pedagogical personnel at higher education institutions having scientific degrees and/or academic status ....................236
5.75. Pedagogical personnel at higher education institutions who have undergone professional development (aimed at upgrading professional skills) and/or retraining ............................................................... 237
5.76. Percentage distribution of the pedagogical personnel at higher education institutions by age .................................238
Technical notes ..........................................................................239
6. Conditions of Education ...............................................241
6.1. Fixed assets of the education sector ..................................... 242
6.2. Quantity index of the fixed assets in the education sector ........ 242
6.3. New fixed assets formation in the education sector, fixed assets renewal ratio and retirement rate ......................... 243
6.4. Newly constructed premises of educational institutions ........... 243
6.5. Educational institutions number dynamics .............................244
6.6. Institutions engaged in educational activities within educational programmes of preschool education, baby and child care ........................................................... 245
6.7. Places at institutions engaged in educational activities within educational programmes of preschool education, baby and child care ............................................................ 246
6.8. Average group size at institutions engaged in educational activities within educational programmes of preschool education, baby and child care: 2015 .................................... 247
6.9. Total floor area of preschool education institutions ................. 248
6.10. Rented area as a percentage of the total floor area of preschool education institutions ...................................... 249
6.11. Technical state and amenities of preschool education institutions ......................................................................250
6.12. Preschool education institutions with personal computers and internet access: 2015 .................................................... 251
6.13. General education institutions .............................................252
6.14. General education institutions (excluding part-time (shift) general education institutions) ..................................253
6.15. Part-time (shift) general education institutions .....................254
6.16. Average class size at general education institutions (excluding part-time (shift) general education institutions) .....255
6.17. Shifts at general education institutions (excluding part-time (shift) general education institutions) ....................256

13 Indicators of Education in the Russian Federation
6.18. Students studying two- and three-shift as a percentage of the total enrolment in general education institutions (excluding part-time (shift) general education institutions) ..... 257
6.19. Students attending extended-day groups at state and municipal general education institutions (excluding part-time (shift) general education institutions) .....................................................................258
6.20. Training area of general education institutions (excluding part-time (shift) general education institutions) .....................................................................259
6.21. Training area of general education institutions (excluding part-time (shift) general education institutions) per one student ...............................................259
6.22. Technical state of general education institutions (excluding part-time (shift) general education institutions) .....................................................................260
6.23. Amenities at general education institutions (excluding part-time (shift) general education institutions) ..................................................................... 261
6.24. Students at general education institutions (excluding part-time (shift) general education institutions) who get hot meals ..........................................262
6.25. Personal computers at general education institutions (excluding part-time (shift) general education institutions) .....263
6.26. Personal computers used for teaching per 100 students at general education institutions (excluding part-time (shift) general education institutions) ..................................264
6.27. General education institutions (excluding part-time (shift) general education institutions) with internet access, e-mail address and website ....................265
6.28. Institutions for supplementary general education of children ........................................................................266
6.29. Technical state and amenities of institutions for supplementary general education of children .....................267
6.30. Vocational education institutions implementing secondary vocational education programmes for skilled workers, junior technicians and employees...................................................................268
6.31. Vocational education institutions implementing secondary vocational education programmes for mid-career professionals .................................................268
6.32. Branches of vocational education institutions implementing secondary vocational education programmes for mid-career professionals ...............................269
6.33. Floor area of vocational education institutions implementing secondary vocational education programmes: 2015..............................................................269
6.34. Floor area distribution of vocational education institutions implementing secondary vocational education programmes by ownership and by exploitation: 2015 ......................................................... 270
6.35. Technical state of the buldings of vocational education institutions, implementing secondary vocational education programmes: 2015 ................................ 271

14Contents
6.36. Usage of training and laboratory premises of vocational education institutions implementing secondary vocational education programmes: 2015 ................................ 272
6.37. Availability of student dormitories in vocational education institutions implementing secondary vocational education programmes: 2015.............................................................. 273
6.38. Availability of public catering to students at vocational education institutions implementing secondary vocational education programmes: 2015 ................................ 274
6.39. Personal computers used for teaching at vocational education institutions implementing secondary vocational education programmes: 2015 ................................ 274
6.40. Personal computers used for teaching per 100 students at vocational education institutions implementing secondary vocational education programmes ......................... 275
6.41. Higher education institutions .............................................. 276
6.42. Branches of higher education institutions implementing bachelor’s, specialist’s and master’s programmes .................... 276
6.43. Floor area of higher education institutions ............................ 277
6.44. Floor area distribution of higher education institutions by ownership and by exploitation: 2015 ................................. 278
6.45. Technical state of the buldings of higher education institutions ...................................................................... 279
6.46. Usage of training and laboratory premises of higher education institutions ........................................................280
6.47. Availability of student dormitories in higher education institutions: 2015 ..............................................................281
6.48. Availability of public catering to students at higher education institutions ........................................................282
6.49. Personal computers used for teaching at higher education institutions ........................................................283
6.50. Personal computers used for teaching per 100 students at higher education institutions ...........................................284
6.51. Institutions offering postgraduate courses for academic personnel .........................................................................285
Technical notes ..........................................................................286
7. International Comparisons ...........................................289
7.1. Educational attainment of the adult population in Russia and OECD countries: 2015 .......................................290
7.2. Adult population in Russia and OECD countries having attained higher education (ISCED 6, 7 and 8) by age: 2015 .....................................................................292
7.3. Adult population in Russia and OECD countries having attained basic general education and below (ISCED 0, 1 and 2) by age: 2015 ...........................................293
7.4. Employment and unemployment in Russia and OECD countries by educational attainment: 2015 ............................294
7.5. Employment rate of people having attained secondary vocational education (programmes for mid-career professionals) and higher education (ISCED 5, 6, 7 and 8) in Russia and OECD countries by field of science: 2012 .............296
7.6. Public expenditure on education in Russia and OECD countries as a percentage of GDP: 2015 .................................298

15 Indicators of Education in the Russian Federation
7.7. Public expenditure on education as a percentage of the total public expenditure in Russia and OECD countries: 2015 .................................................................299
7.8. Participation in education of the population aged 5–29 in Russia and OECD countries: 2015 ........................300
7.9. The proportion of foreign students and postgraduate students in the total number thereof in Russia and OECD countries: secondary vocational education (programmes for mid-career professionals) and higher education (ISCED 5, 6, 7 and 8): 2015 ..................................................302
7.10. Percentage distribution of graduates in Russia and OECD countries having attained secondary vocational education (programmes for mid-career professionals) and higher education for the first time by educational attainment: 2015 ....303
7.11. Female proportion in the total number of teachers in Russia and OECD countries: 2015 .......................................305
7.12. Number of students per teacher in Russia and OECD countries: 2015 ................................................................. 307
7.13. Average class size in Russia and OECD countries: 2015 .............309
Technical notes .......................................................................... 311
Symbols used in tables are: … data not available and not included in the totals, – data not applicable, 0.0 insignificant value.
In some tables, details may not add up to the total because of rounding.

16Education System in the Russian Federation
Secondary vocational education diplom
a
ISCED 1 ISCED 2ISCED 0
Vocational training
Basic general education certificate
Higher education – highly-qualified personnel training programm
es
Higher education – bachelor’s, specialist’s, and master’s program
mes
Postgraduate diplom
a
Secondary vocational education diplom
a
EDUCATION
SYSTEM IN
THE RU
SSIAN FEDERATION
Secondary general education
Secondary vocational education program
mes
for skilled workers, junior
technicians and employees
Postgraduate program-
mes for academ
ic person- nel (including postgra- duate m
ilitary studies)
Defence of a dissertation
Residency program
mes
Apprenticeship program
mes (in
the sphere of arts and perform
ing)
Professional training program
mes for skilled
workers, junior techni-cians and em
ployees
Retraining pro-gram
mes for skilled
workers, junior technicians and
employees
Professional develop-m
ent programm
es aim
ed at upgrading professional skills of
skilled workers, junior technicians
and employees
Secondary vocational education program
mes for
mid-career professionals
1716
Residency diplom
a
Candidate of sciences diploma
Apprenticeship diplom
a (in the sphere of arts and perform
ing)
2121
Supplementary professional education
Supplementary education of children and adults
Preschool education
Basic general education
Primary general education
Theoretical age, yearsStandard educational
period, yearsInternational Standard Classification of Education (ISCED 2011)
Federal Law “On Education in the Russian Federation”
654321 0
654321
10987 1514131211
54321
Secondary general education certificate
4321 21
4321
18171615
171615
321
Secondary vocational education
Skilled workers, junior technicians
and employees certificate
Bachelor’s program
mes
Master’s program
mes
2221
20191817
Bachelor’s diploma
Master’s diplom
a
214321
4321
ISCED 5ISCED 4 ISCED 8ISCED 3
Specialist’s diploma
Specialist’s program
mes
2120191817
54321
ISCED 6 ISCED 7

1. Educational Potential of the Population

181. Educational Potential of the Population
1.1. EDUCATIONAL ATTAINMENT OF THE POPULATION AGED 15 AND OVER: 2015*(per 1000 inhabitants in the respective age group who indicated their educational attainment)
0
50
100
150
200
250
300
350
258234
277
1
28 30 26
2
311 301319
3
92114
74
4
179195
166
5
97 101 95
6
32 2239
7
3 3 4
8
Education attained:1 – higher2 – incomplete higher3 – secondary vocational – programmes for mid-career professionals4 – secondary vocational – programmes for skilled workers, junior technicians and employees5 – secondary general6 – basic general7 – primary general8 – no primary general education
Total Male Female
Headcount
* According to the 2015 microcensus.

19 Indicators of Education in the Russian Federation
1.2. EDUCATIONAL ATTAINMENT OF THE POPULATION AGED 25–64 BY AGE: 2015*(per 1000 inhabitants in the respective age group who indicated their educational attainment)
0 100 200 300 400 500 600 700 800 900 1000
209
10
385 113 207
6
1
261
14
394 113 176
3
2
336 20 332 97 155
4
2
405 37 283 84 135
4
3
304 21 347 102 168
4
2
Total populationAge, years
Education attained:
incomplete higher
secondary vocational – programmes for skilled workers, junior technicians and employees
higher secondary generalbasic generalprimary generalno primary general education
secondary vocational – programmes for mid-career professionals
55–64
45–54
35–44
25–34
25–64Headcount
68
37
54
48
52
* According to the 2015 microcensus.

201. Educational Potential of the Population
(continued)
0 100 200 300 400 500 600 700 800 900 1000
198
11
335 139 229 79
7
2
223
16
364 139 206 46
4
2
281 21 328 120 174 68
5
3
337 40 303 104 148 59
6
3
264 23 331 125 187 63
5
2
MaleAge, years
55–64
45–54
35–44
25–34
25–64Headcount
Education attained:
incomplete higher
secondary vocational – programmes for skilled workers, junior technicians and employees
higher secondary generalbasic generalprimary generalno primary general education
secondary vocational – programmes for mid-career professionals
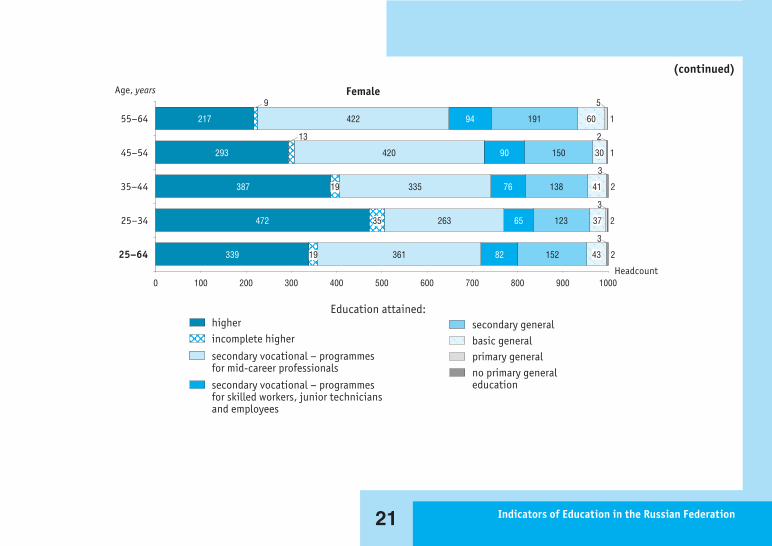
21 Indicators of Education in the Russian Federation
(continued)
0 100 200 300 400 500 600 700 800 900 1000
217
9
422 94 191
5
1
293
13
420 90 150
2
1
387 19 335 76 138
3
2
472 35 263 65 123
3
2
339 19 361 82 152
3
2
FemaleAge, years
55–64
45–54
35–44
25–34
25–64Headcount
60
30
41
37
43
Education attained:
incomplete higher
secondary vocational – programmes for skilled workers, junior technicians and employees
higher secondary generalbasic generalprimary generalno primary general education
secondary vocational – programmes for mid-career professionals
221. Educational Potential of the Population
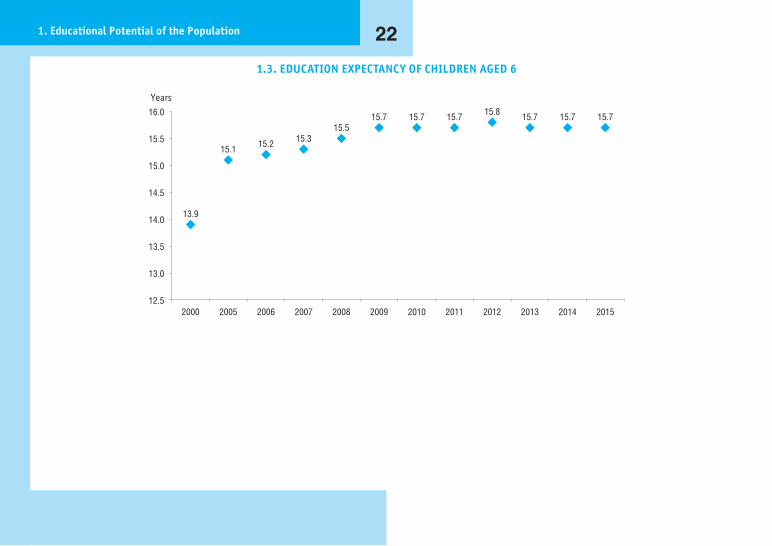
1.3. EDUCATION EXPECTANCY OF CHILDREN AGED 6
12.5
13.0
13.5
14.0
14.5
15.0
15.5
16.0
13.9
15.1 15.2 15.315.5
15.7 15.7 15.7 15.8 15.7 15.7 15.7
2000 2005 2006 2007 2008 2009 2010 2011 2012 2013 2014 2015
Years

23 Indicators of Education in the Russian Federation
1.4. GRADUATION RATES FROM PROFESSIONAL EDUCATION INSTITUTIONS(graduates who participated in professional education programmes as a percentage of the total population
at the age theoretically corresponding to completion of education at a certain level*)
0
10
20
30
40
50
60
70
80
90
28.8
45.5
60.2
61.2 64
.8 67.3
82.5
Bachelor's, specialist's, and master's programmes
23.6 27
.2 32.2
32.2
30.3 32
.5 34.1
Programmes for mid-career professionals
29.6
29.1
37.8
33.5
32.0
30.6
27.2
Programmes for skilled workers, junior technicians and employees**
2013
2012
2015
2014
2010
2005
2000
Per cent
* 22 years – for the graduates of bachelor’s, specialist’s, and master’s programmes; 18 years – for the graduates of programmes for mid-career professionals and 17 years – for the graduates of programmes for skilled workers, junior technicians and employees.
** Since 2010 - including students studying according to commercial contracts, except for those studying short-term (less than 500 hours) programmes.

241. Educational Potential of the Population
1.5. RUSSIAN 15-YEAR-OLD STUDENTS’ PERFORMANCE*(mean score according to the international 1000-score PISA scale)
410
420
430
440
450
460
470
480
490
500
462
442 440
459475
495
468 476 468
482
494479 478
486
487
2000 2003 2006 2009 2012 2015
Reading performanceMathematics performanceScience performance
Score
OECD average493490493
* According to the OECD Programme for International Student Assessment, PISA; the OECD average is given in accordance with the number of countries/economies that took part in the assessment in the corresponding year.

25 Indicators of Education in the Russian Federation
1.6. PERCENTAGE DISTRIBUTION OF RUSSIAN AND OECD COUNTRIES’ 15-YEAR-OLD STUDENTS BY LEVEL OF SCIENCE PERFORMANCE*
0
20
40
60
80
100
4.2
73.6
22.2
Russia
9.0
71.7
19.3
OECD4.3
73.6
22.0
Russia Russia
8.5
73.6
18.0
OECD4.2
77.0
18.8
8.4
73.8
17.8
OECD3.7
78.1
18.2
Russia
7.8
71.0
21.2
OECD
Level 5 or 6 (633 score points or more)
Level 2, 3, 4 (410–633 score points)
Level 1 or below (less than 410 score points)
Levels:
2006 20122009 2015
* According to the OECD Programme for International Student Assessment, PISA; the OECD average is given in accordance with the number of countries/economies that took part in the assessment in the corresponding year.
261. Educational Potential of the Population
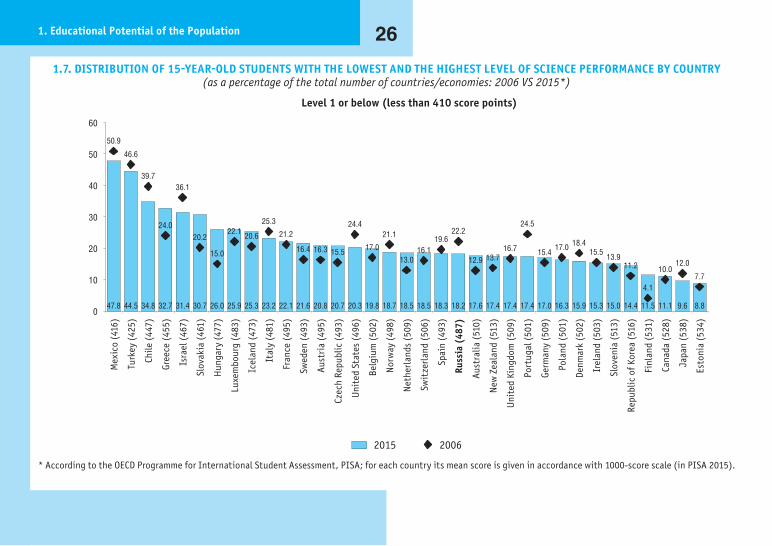
1.7. DISTRIBUTION OF 15-YEAR-OLD STUDENTS WITH THE LOWEST AND THE HIGHEST LEVEL OF SCIENCE PERFORMANCE BY COUNTRY(as a percentage of the total number of countries/economies: 2006 VS 2015*)
0
10
20
30
40
50
60
47.8
Mex
ico
(416
)
44.5
Turk
ey (4
25)
34.8
Chile
(447
)
32.7
Gree
ce (4
55)
31.4
Isra
el (4
67)
30.7
Slov
akia
(461
)
26.0
Hung
ary
(477
)
25.9
Luxe
mbo
urg
(483
)
25.3
Icel
and
(473
)
23.2
Ital
y (4
81)
22.1
Fran
ce (4
95)
21.6Sw
eden
(493
)20.8
Aust
ria
(495
)
20.7
Czec
h Re
publ
ic (4
93)
20.3
Unit
ed S
tate
s (49
6)
19.8
Belg
ium
(502
)
18.7
Norw
ay (4
98)
18.5
Neth
erla
nds (
509)
18.5
Swit
zerla
nd (5
06)
18.3
Spai
n (4
93)
18.2
Russ
ia (
487)
17.6
Aust
ralia
(510
)
17.4
New
Zea
land
(513
)
17.4
Unit
ed K
ingd
om (5
09)
17.4
Port
ugal
(501
)
17.0
Germ
any
(509
)
16.3
Pola
nd (5
01)
15.9
Denm
ark
(502
)
15.3
Irel
and
(503
)
15.0
Slov
enia
(513
)
14.4
Repu
blic
of K
orea
(516
)
11.5
Finl
and
(531
)
11.1
Cana
da (5
28)
9.6
Japa
n (5
38)
8.8
Esto
nia
(534
)
50.9
46.6
39.7
24.0
36.1
20.2
15.0
22.1 20.6
25.3
21.2
16.4 16.3 15.5
24.4
17.0
21.1
13.016.1
19.622.2
12.9 13.716.7
24.5
15.417.0 18.4
15.513.9
11.2
4.1
10.012.0
7.7
20062015
Level 1 or below (less than 410 score points)Проценты
* According to the OECD Programme for International Student Assessment, PISA; for each country its mean score is given in accordance with 1000-score scale (in PISA 2015).

27 Indicators of Education in the Russian Federation
(continued)
0
5
10
15
20
25
15.3 14.3 13.5 12.8 12.4 11.2 11.1 10.9 10.6 10.6 10.6 9.8 9.0 8.5 8.5 8.0 8.0 7.7 7.4 7.3 7.3 7.1 7.0 6.9 5.8 5.0 4.6 4.1 3.8 3.7 3.6 2.1 1.2
0.3
0.1
20062015
15.1
20.9
11.5
17.6
14.4 14.613.1 13.7
11.810.3
12.9
10.5 10.19.1
7.9 8.0
6.1
10.0
3.1
11.6
6.8
9.4
6.85.9
5.2 4.9
6.9
4.6
6.3
4.25.8
3.41.9
0.9 0.3
Japa
n (5
38)
Finl
and
(531
)
Esto
nia
(534
)
New
Zea
land
5(1
3)
Cana
da (5
28)
Aust
ralia
(510
)
Neth
erla
nds (
509)
Unit
ed K
ingd
om (5
09)
Germ
any
(509
)
Repu
blic
of K
orea
(516
)
Slov
enia
(513
)
Swit
zerla
nd (5
06)
Belg
ium
(502
)
Unit
ed S
tate
s (49
6)
Swed
en (4
93)
Fran
ce (4
95)
Norw
ay (4
98)
Aust
ria
(495
)
Port
ugal
(501
)
Czec
h Re
publ
ic (4
93)
Pola
nd (5
01)
Irel
and
(503
)
Denm
ark
(502
)
Luxe
mbo
urg
(483
)
Isra
el (4
67)
Spai
n (4
93)
Hung
ary
(477
)
Ital
y (4
81)
Icel
and
(473
)
Russ
ia (
487)
Slov
akia
(461
)
Gree
ce (4
55)
Chile
(447
)
Turk
ey (4
25)
Mex
ico
(416
)
Level 5 or 6 (633 score points or more)Проценты

281. Educational Potential of the Population
1.8. PERCENTAGE DISTRIBUTION OF RUSSIAN AND OECD COUNTRIES’ 15-YEAR-OLD STUDENTS BY LEVEL OF READING PERFORMANCE*
0
20
40
60
80
100
3.2
69.4
27.5
9.5
72.7
17.9
3.1
69.5
27.4
7.6
73.6
18.8
4.7
73.1
22.3
8.4
73.6
18.0
6.6
77.1
16.2
8.3
71.6
20.1
Level 5 or 6 (626 score points or more)
Level 2, 3, 4 (407–626 score points)
Level 1 or below (less than 407 score points)
Levels:
Russia OECD Russia RussiaOECD OECD Russia OECD
2000 20122009 2015
* According to the OECD Programme for International Student Assessment, PISA; the OECD average is given in accordance with the number of countries/economies that took part in the assessment in the corresponding year.

29 Indicators of Education in the Russian Federation
1.9. DISTRIBUTION OF 15-YEAR-OLD STUDENTS WITH THE LOWEST AND THE HIGHEST LEVEL OF READING PERFORMANCE BY COUNTRY(as a percentage of the total number of countries/economies: 2009 VS 2015*)
0
5
10
15
20
25
30
35
40
45
41.7
Mex
ico
(423
)
40.0
Turk
ey (4
28)
32.1
Slov
akia
(453
)
28.4
Chile
(459
)
27.5
Hung
ary
(470
)
27.3
Gree
ce (4
67)
26.6
Isra
el (4
79)
25.6
Luxe
mbo
urg
(481
)
22.1
Icel
and
(482
)
22.0
Czec
h Re
publ
ic (4
87)
21.5
Fran
ce (4
99)
21.0It
aly
(485
)20.0
Swit
zerla
nd (4
92)
19.5
Belg
ium
(499
)
19.0
Unit
ed S
tate
s (49
7)
18.4
Swed
en (5
00)
18.1
Aust
ralia
(503
)
18.1
Neth
erla
nds (
503)
17.9
Unit
ed K
ingd
om (4
98)
17.3
New
Zea
land
(509
)
17.2
Port
ugal
(498
)
16.2
Germ
any
(509
)
16.2
Russ
ia (
495)
16.2
Spai
n (4
96)
15.1
Slov
enia
(505
)
15.0
Denm
ark
(500
)
14.9
Norw
ay (5
13)
14.4
Pola
nd (5
06)
13.7
Repu
blic
of K
orea
(517
)
12.9
Japa
n (5
16)
11.1
Finl
and
(526
)
10.7
Cana
da (5
27)
10.6
Esto
nia
(519
)
10.2
Irel
and
(521
)
40.1
24.522.2
30.6
17.6
21.3
26.5 26.0
16.8
23.1
19.821.0
16.8 17.7 17.6 17.4
14.2 14.3
18.4
14.3
17.6 18.5
27.4
19.621.2
15.2 15.0 15.0
5.8
13.6
8.110.3
13.3
17.2
20092015
Level 1 or below (less than 407 score points)
* According to the OECD Programme for International Student Assessment, PISA; for each country its mean score is given in accordance with 1000-score scale (in PISA 2015).

301. Educational Potential of the Population
(continued)
0
2
4
6
8
10
12
14
16
14.0
Cana
da (5
27)
13.7
Finl
and
(526
)
13.6
New
Zea
land
(509
)
12.7
Repu
blic
of K
orea
(517
)
12.5
Fran
ce (4
99)
12.2
Norw
ay (5
13)
11.7
Germ
any
(509
)
11.0
Esto
nia
(519
)
11.0
Aust
ralia
(503
)
10.9
Neth
erla
nds (
503)
10.8Ja
pan
(516
)10.7
Irel
and
(521
)10.0
Swed
en (5
00)
9.6
Unit
ed S
tate
s (49
7)
9.3
Belg
ium
(499
)
9.2
Unit
ed K
ingd
om (4
98)
9.2
Isra
el (4
79)
8.9
Slov
enia
(505
)
8.2
Pola
nd (5
06)
8.1
Luxe
mbo
urg
(481
)
7.9
Czec
h Re
publ
ic (4
87)
7.8
Swit
zerla
nd (4
92)
7.5
Port
ugal
(498
)
6.6
Icel
and
(482
)
6.6
Russ
ia (
495)
6.5
Denm
ark
(500
)
5.7
Ital
y (4
85)
5.5
Spai
n (4
96)
4.3
Hung
ary
(470
)
4.0
Gree
ce (4
67)
3.5
Slov
akia
(453
)
2.3
Chile
(459
)
0.6
Turk
ey (4
28)
0.3
Mex
ico
(423
)
20092015
12.8
14.5
15.7
12.9
9.6
8.47.6
6.1
12.8
9.8
13.4
7.0
9.09.9
11.2
8.07.4
4.6
7.2
5.75.1
8.1
4.8
8.5
3.2
4.7
5.8
3.3
6.15.6
4.5
1.31.9
0.4
Level 5 or 6 (626 score points or more)
31 Indicators of Education in the Russian Federation
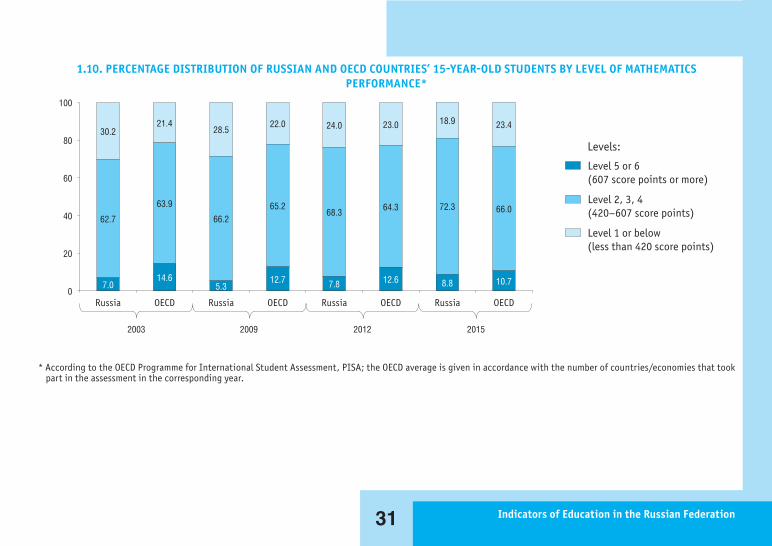
1.10. PERCENTAGE DISTRIBUTION OF RUSSIAN AND OECD COUNTRIES’ 15-YEAR-OLD STUDENTS BY LEVEL OF MATHEMATICS PERFORMANCE*
0
20
40
60
80
100
7.0
62.7
30.2
14.6
63.9
21.4
5.3
66.2
28.5
12.7
65.2
22.0
7.8
68.3
24.0
12.6
64.3
23.0
8.8
72.3
18.9
10.7
66.0
23.4
Russia OECD Russia RussiaOECD OECD Russia OECD
Level 5 or 6 (607 score points or more)
Level 2, 3, 4 (420–607 score points)
Level 1 or below (less than 420 score points)
Levels:
2003 20122009 2015
* According to the OECD Programme for International Student Assessment, PISA; the OECD average is given in accordance with the number of countries/economies that took part in the assessment in the corresponding year.
321. Educational Potential of the Population
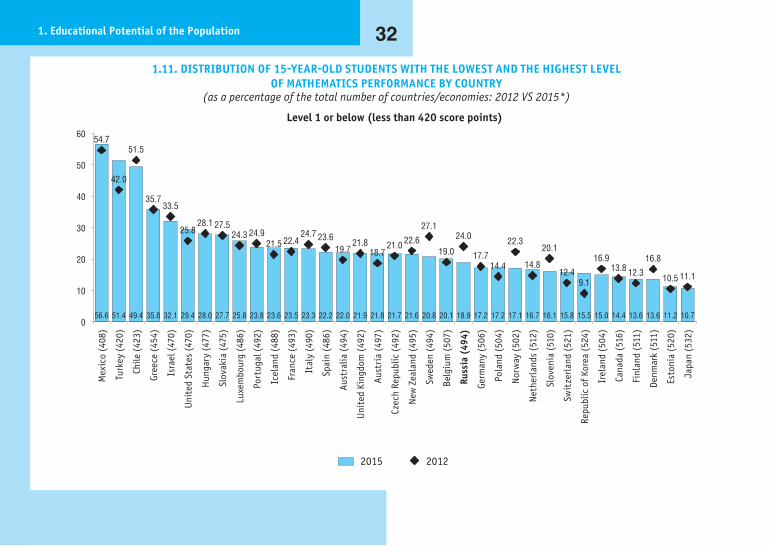
1.11. DISTRIBUTION OF 15-YEAR-OLD STUDENTS WITH THE LOWEST AND THE HIGHEST LEVEL OF MATHEMATICS PERFORMANCE BY COUNTRY
(as a percentage of the total number of countries/economies: 2012 VS 2015*)
0
10
20
30
40
50
60
56.6
Mex
ico
(408
)
51.4
Turk
ey (4
20)
49.4
Chile
(423
)
35.8
Gree
ce (4
54)
32.1
Isra
el (4
70)
29.4
Unit
ed S
tate
s (47
0)
28.0
Hung
ary
(477
)
27.7
Slov
akia
(475
)
25.8
Luxe
mbo
urg
(486
)
23.8
Port
ugal
(492
)
23.6
Icel
and
(488
)
23.5
Fran
ce (4
93)
23.3It
aly
(490
)22.2
Spai
n (4
86)
22.0
Aust
ralia
(494
)
21.9
Unit
ed K
ingd
om (4
92)
21.8
Aust
ria
(497
)
21.7
Czec
h Re
publ
ic (4
92)
21.6
New
Zea
land
(495
)
20.8
Swed
en (4
94)
20.1
Belg
ium
(507
)
18.9
Russ
ia (
494)
17.2
Germ
any
(506
)
17.2
Pola
nd (5
04)
17.1
Norw
ay (5
02)
16.7
Neth
erla
nds (
512)
16.1
Slov
enia
(510
)
15.8
Swit
zerla
nd (5
21)
15.5
Repu
blic
of K
orea
(524
)
15.0
Irel
and
(504
)
14.4
Cana
da (5
16)
13.6
Finl
and
(511
)
13.6
Denm
ark
(511
)
11.2
Esto
nia
(520
)
10.7
Japa
n (5
32)
20122015
Level 1 or below (less than 420 score points)
54.7
42.0
51.5
35.733.5
25.828.1 27.5
24.3 24.921.5 22.4
24.7 23.619.7
21.818.7
21.0 22.6
27.1
19.0
24.0
17.714.4
22.3
14.8
20.1
12.49.1
16.913.8 12.3
16.8
10.5 11.1

33 Indicators of Education in the Russian Federation
(continued)
0
5
10
15
20
25
30
35
20.9
Repu
blic
of K
orea
(524
)
20.3
Japa
n (5
32)
19.2
Swit
zerla
nd (5
21)
15.9
Belg
ium
(507
)
15.5
Neth
erla
nds (
512)
15.1
Cana
da (5
16)
14.2
Esto
nia
(520
)
13.5
Slov
enia
(510
)
12.9
Germ
any
(506
)
12.5
Aust
ria
(497
)
12.2
Pola
nd (5
04)
11.7Fi
nlan
d (5
11)
11.7
Denm
ark
(511
)
11.4
New
Zea
land
(495
)
11.4
Fran
ce (4
93)
11.4
Port
ugal
(492
)
11.3
Aust
ralia
(494
)
10.6
Norw
ay (5
02)
10.6
Unit
ed K
ingd
om (4
92)
10.5
Ital
y (4
90)
10.4
Swed
en (4
94)
10.4
Czec
h Re
publ
ic (4
92)
10.3
Icel
and
(488
)
10.0
Luxe
mbo
urg
(486
)
9.8
Irel
and
(504
)
8.9
Isra
el (4
70)
8.8
Russ
ia (
494)
8.1
Hung
ary
(477
)
7.8
Slov
akia
(475
)
7.2
Spai
n (4
86)
5.9
Unit
ed S
tate
s (47
0)
3.9
Gree
ce (4
54)
1.4
Chile
(423
)
1.1
Turk
ey (4
20)
0.3
Mex
ico
(408
)
20122015
Level 5 or 6 (607 score points or more)
30.9
23.721.4
19.5 19.3
16.414.6 13.7
17.5
14.316.7
15.3
10.0
15.012.9
10.6
14.8
9.411.8
9.98.0
12.911.2 11.2 10.7
9.47.8
9.311.0
8.0 8.8
3.91.6
5.9
0.6
* According to the OECD Programme for International Student Assessment, PISA; for each country its mean score is given in accordance with 1000-score scale (in PISA 2015).

341. Educational Potential of the Population
1.12. LITERACY PROFICIENCY OF THE POPULATION AGED 16–65 BY EDUCATIONAL ATTAINMENT AND COUNTRY*(mean score is given in accordance with 500-score scale)
200
225
250
275
300
325
252 252257
269
256 256
246
235244
248 249
260
244253
245
228237 239
234
254248
242
232 230
273267
272
289
274 271 269264
272276
258
282
265
282
271262
268273
269
287280
269262 262
279283
290
313
301 301292
282291
295 297
309
293302
296
282
292 294290
311306 303
294298
Russ
ia
Cypr
us
Esto
nia
Japa
n
Norw
ay
Czec
h Re
publ
ic
Denm
ark
Ital
y
Repu
blic
of K
orea
Slov
akia
Pola
nd
Finl
and
Germ
any
Aust
ralia
Aust
ria
Spai
n
Irel
and
Unit
ed K
ingd
om a
nd N
orth
ern
Irel
and
Cana
da
Neth
erla
nds
Swed
en
Belg
ium
(Fla
nder
s)
Fran
ce
Unit
ed S
tate
s
Score
Lower vocational Secondary general
Education attained:
Secondary vocational and higher
* Here and below (pic. 1.13–1.15) – according to the results of The Programme for the International Assessment of Adult Competencies (PIAAC) (2012).

35 Indicators of Education in the Russian Federation
1.13. NUMERACY PROFICIENCY OF THE POPULATION AGED 16–65 BY EDUCATIONAL ATTAINMENT AND COUNTRY*(mean score is given in accordance with 500-score scale)
200
225
250
275
300
325
242248
236
255
229
254248 250
235 236230
220
249245
224
249
225 222
245237
241 244
216204
267 269265
276
264
282278 275
253
269262
257
284278
255
273
262 259
280
267
278274
253
243
275
290284
305
280
307302 304
290 292285
278
308 306
285
310
286 285
307301
305310
295287
Russ
ia
Cypr
us
Esto
nia
Japa
n
Norw
ay
Czec
h Re
publ
ic
Denm
ark
Ital
y
Repu
blic
of K
orea
Slov
akia
Pola
nd
Finl
and
Germ
any
Aust
ralia
Aust
ria
Spai
n
Irel
and
Unit
ed K
ingd
om a
nd N
orth
ern
Irel
and
Cana
da
Neth
erla
nds
Swed
en
Belg
ium
(Fla
nder
s)
Fran
ce
Unit
ed S
tate
s
Score
Lower vocational Secondary general
Education attained:
Secondary vocational and higher

361. Educational Potential of the Population
1.14. LITERACY PROFICIENCY OF THE POPULATION AGED 16–65 BY LABOUR FORCE STATUS AND COUNTRY (mean score is given in accordance with 500-score scale)
200
220
240
260
280
300
320
254
243 24
6It
aly
260
243
239
Spai
n
266
257
254
Fran
ce
272
262
259
Pola
nd
272
283
273
Repu
blic
of K
orea
272
262
263
Cypr
us
274
259
258
Aust
ria
274
258
254
Irel
and
274
255 257
Germ
any
274
260
257
Unit
ed S
tate
s
277
266 27
0Cz
ech
Repu
blic
277
265
252
Denm
ark
278
287
269
Russ
ia
278
265
257
Cana
da
279
253 25
8Un
ited
Kin
gdom
and
Nor
ther
n Ir
elan
d27
926
5 268
Esto
nia
279
263 26
6Sl
ovak
ia
281
269
262
Belg
ium
(Fla
nder
s)
283
264
259
Norw
ay
286
275
263
Aust
ralia
287
257
258
Swed
en
290
274
264
Neth
erla
nds
295
288
268
Finl
and
298
312
291
Japa
n
Score
Employed Unemployed Out of the labour force

37 Indicators of Education in the Russian Federation
1.15. LITERACY PROFICIENCY OF 16 TO 29-YEAR-OLDS HAVING ATTAINED SECONDARY VOCATIONAL AND HIGHER EDUCATION BY COUNTRY
(mean score is given in accordance with 500-score scale)
0
50
100
150
200
250
300
350 328
Neth
erla
nds
305 32
6Be
lgiu
m (F
land
ers)
325
Aust
ria
308 32
2Sw
eden
301 31
8Es
toni
a
319
316
Germ
any
293 31
4Fr
ance
285
314
Norw
ay
293 31
1Un
ited
Sta
tes
309
Cana
da
295 30
8СШ
А
289 30
8Au
stra
lia
281 30
6Ir
elan
d
276
305
Czec
h Re
publ
ic
290 30
4Re
publ
ic o
f Kor
ea
289 30
3Un
ited
Kin
gdom
and
Nor
ther
n Ir
elan
d27
230
3De
nmar
k
291 30
1Po
land
300
Slov
akia
299
Spai
n
276 29
3It
aly
293
Cypr
us
271 28
9Ки
пр
270 28
4Ru
ssia
Secondary vocational education* Higher education
Score
* There are no data for the Netherlands, Norway, Poland, Slovakia and Italy, the data concerning Finland were removed.

381. Educational Potential of the Population
1.16. PARTICIPATION OF THE POPULATION IN LIFELONG LEARNING(as a percentage of respondents aged 25–64)
2006 2008 2010 2012 2013 2014 2015
Total participation during the past 12 months* 22.4 24.8 30.4 27.3 29.2 27.0** 24.0**Including the following types of lifelong learning:formal education 4.5 2.7 2.4 2.7 2.5 1.9 7.5
postgraduate studies, doctoral studies 0.2 0.2 0.1 0.2 0.3 0.2 0.5higher education – bachelor’s, specialist’s, and master’s programmes 2.3*** 1.4*** 1.8*** 1.8 2.0 1.3 2secondary vocational education – programmes for mid-career professionals 1.3 0.4 0.3 0.1 0.1 0.3 3.3secondary vocational education – programmes for skilled workers, junior technicians and employee 0.3 0.4 0.1 0.8 0.2 0.1 2
non-formal education/training 8.0 12.1 14.8 13.5 12.4 14.1** 12.2**higher education institution – second university degree programmes or master’s programmes in a different sphere … … … 0.6 0.5 0.5 0.9refresher courses 4.6 5.4 8.2 6.3 5.8 5.4 4.5professional conferences, seminars, and regularly conducted training events 1.5 1.4 3.2 3.7 3.5 3.9 2.2lectures, conferences, seminars, and one-off professional training events 1.1 3.2 2.8 4.7 3.1 3.7 1.4amateur (hobby) courses (housekeeping, dress-making, driving, etc.) 0.9 2.3 1.8 2.1 2.1 1.5 1.3****professional courses (to acquire new professions) 1.6 1.6 2.0 1.3 1.4 0.7 0.5private lessons with a teacher, instructor ... ... 0.3 1.4 0.5 0.6 0.3МВА studies 0.0 0.0 0.2 0.5 0.1 0.2 0.3internship … … … … … 0.5** 0.7**on-the-job training in the form of supervision … … … … … 1.3** 1.0**target-oriented training courses (aiming at mastering the following:new equipment, technology, computer software, materials, labour laws, etc.) … … … … … 1.4** 1.4**driving courses that teach driving vehicles of different categories … … … … … … 1.5**civil safety courses, labour protection courses, etc., concerning safety training and fire safety training … … … … … … 1.1**

39 Indicators of Education in the Russian Federation
2006 2008 2010 2012 2013 2014 2015
informal learning 17.4 20.9 24.4 24.4 28.7** 24.6** 20.4**self-education using printed materials (professional books, journals, etc.) 12.7 12.8 13.6 15.4 17.4 12.3 10.3excursions to museums, cultural and historic sites, natural sites and industrial sites … … 2.8 5.2 5.9 3.5 3.8using educational radio and TV programmes 2.0 3.1 3.8 4.3 5.5 3.1 3.7learning useful skills (e.g. computer software, driving, dress-making, knitting, etc.) under the supervision of a friend or a family member … … 5.6 5.1 5.3 2.7 3.7learning in the workplace under the supervision of tutors, colleagues 3.7 5.6 5.1 4.2 5.1 2.4 3.9*****computer-based learning, including on-line learning 0.8 2.1 7.9 4.6 3.6 2.6 3.3learning with the use of audiovisual materials 2.9 3.1 2.1 3.6 2.2 0.8 1.9attending learning centres, including libraries 6.3 4.4 2.8 2.8 1.8 1.4 1.7getting advisory support on topic-specific internet forums … … … … 3.8** 2.8** 2.6**self-education using podcasts or on-line apps for mobile phones, tablets, etc.(courses, separate lectures, or master classes for downloading) … … … … 0.9** 2.0** 0.9**self-education based on on-line webcasts of lectures/presentations, webinars … … … … 0.5** 0.6** 1**self-education based on other materials available on the internet … … … … 6.1** 7.4** 4.8**attending public lectures, seminars, listening to public speeches in parks, cafes, museums, etc. … … … … 2.3** 1.8** 1.6**attending clubs to learn foreign languages … … … … 0.5** 0.2** 0.4**attending public master classes, workshops … … … … 0.4** 0.7** 1.4**
* During the past 12 months the respondents could receive formal education as well as non-formal education/training, and/or engage in informal learning. Thus, in 2014 15.4% of respondents received formal education and non-formal education/traning (of at least one type).
** The indices are calculated based on extended list of educational activity types. *** In the 2006, 2008, 2010 surveys the position “higher education” included education in accordance with second university degree programmes or master’s programmes
in a different sphere. In 2012–2014 this position is included into non-formal education. **** Since 2015 – without driving courses (they are given in a separate entry). ***** Since 2015 – «getting vocational skills at the workplace (self-education or training with colleagues’ participation, but excluding apprenticeship)».
(continued)

401. Educational Potential of the Population
1.17. PARTICIPATION OF THE POPULATION OF RUSSIA AND EUROPEAN COUNTRIES IN LIFELONG LEARNING BY TYPE(as a percentage of all respondents aged 25–64)
0
10
20
30
40
50
60
70
80Sw
eden
*
Luxe
mbu
rg
Norw
ay
Neth
erla
nds
Denm
ark
Finl
and*
Fran
ce
Esto
nia
Germ
any
Unit
ed K
ingd
om*
Swit
zerla
nd*
Aust
ria
Port
ugal
Cypr
us
Slov
akia
Hung
ary
Belg
ium
Spai
n
Czec
h Re
publ
ic
Slov
enia
Mal
ta*
Latv
ia
Lith
uani
a
Bulg
aria
Pola
nd
Ital
y*
Croa
tia*
Russ
ia
Turk
ey*
Gree
ce
Rom
ania
Formal education and (or) non-formal education/training
7370
60 59 5955
51 50 50 49 49 4844 42 42 41
38 38 37 36 34 3229
26 24 22 21
15 14 128
* The data for the selected countries refer to 2007, the data for other European countries refer to 2011. The data for Russia refer to 2015.

41 Indicators of Education in the Russian Federation
(continued)
0
2
4
6
8
10
12
14
16 15Un
ited
Kin
gdom
*
13Sw
eden
*13
Denm
ark
12
Neth
erla
nds
10
Port
ugal
10
Finl
and*
10
Luxe
mbu
rg
8
Norw
ay
8
Russ
ia
7
Belg
ium
7
Spai
n
7
Esto
nia
7
Hung
ary
6
Aust
ria
6
Slov
akia
5
Pola
nd
5
Mal
ta*
5
Swit
zerla
nd*
5
Croa
tia*
4
Ital
y*
4
Latv
ia
4
Lith
uani
a
4
Czec
h Re
publ
ic
4
Cypr
us
4
Fran
ce
3
Germ
any
3
Gree
ce
2
Bulg
aria
2
Slov
enia
2
Turk
ey*
1
Rom
ania
Formal education

421. Educational Potential of the Population
(continued)
0
10
20
30
40
50
60
70
80Sw
eden
*
Luxe
mbu
rg
Norw
ay
Neth
erla
nds
Denm
ark
Finl
and*
Fran
ce
Germ
any
Esto
nia
Swit
zerla
nd*
Aust
ria
Cypr
us
Unit
ed K
ingd
om*
Port
ugal
Slov
akia
Hung
ary
Czec
h Re
publ
ic
Slov
enia
Spai
n
Belg
ium
Mal
ta*
Latv
ia
Lith
uani
a
Bulg
aria
Pola
nd
Ital
y*
Croa
tia*
Turk
ey*
Russ
ia
Gree
ce
Rom
ania
Non-formal education/training
69 68
57 55 53 51 49 48 48 47 4641 40 40 38 38
35 35 34 33 31 3026 24
21 20 1813 12 10
7

43 Indicators of Education in the Russian Federation
(continued)
0
10
20
30
40
50
60
70
80
90 84Sl
ovak
ia*
76Sw
eden
*76
Aust
ria*
72
Norw
ay*
64
Fran
ce*
64
Cypr
us*
62
Slov
enia
*
55
Czec
h Re
publ
ic*
55
Finl
and*
54
Latv
ia*
54
Unit
ed K
ingd
om*
52
Germ
any*
45
Lith
uani
a*
45
Esto
nia*
45
Croa
tia*
44
Mal
ta*
41
Ital
y*
39
Port
ugal
*
35
Belg
ium
*
31
Turk
ey*
28
Bulg
aria
*
28
Spai
n*
26
Hung
ary*
25
Pola
nd*
21
Gree
ce*
20
Russ
ia
18
Rom
ania
*
Informal learning

441. Educational Potential of the Population
TECHNICAL NOTES
The primary source of data on educational attainment of the population is the census. A census is a process of collec ting demographic, economic and social data characterizing each inhab-itant of a country or a territory at a certain period of time. A micro-census was conducted from October 1st till October 31st, 2015 in all the regions of the Russian Federation. It covered 2154.2 thousand people (1.5% of the population of Russia as of January 1st, 2016).
Education expectancy of children aged 6 (or average ex-pected years of education of children aged 6 during their life-time) is the number of years which a six-year-old person may spend on studying at all levels of education given the existing level of ed-ucation coverage and taking into account his or her potential edu-cation trajectory. It is determined by summarizing the education coverage of children of a respective age for each year of their lives starting with the age of six.
The Programme for International Students Assessment (PISA), launched by the Organisation for Economic Co-operation and Development (OECD), is intended to measure 15-year-old school pupils’ scholastic performance and their ability to apply that know ledge in life. The source of data is the OECD: http://www.oecd.org/pisa/. The following terms are used in the frame-work of this survey:
• reading performance (performance in reading) measures the capacity of a person to understand, use and reflect on written texts and to engage in reading in order to achieve goals, develop knowledge and potential, and participate in society;
• mathematics performance (performance in mathemat-ics) measures the capacity of a person to recognise the role that mathe matics plays in the world in order to make well-founded judgments and decisions and employ mathematics to satisfy pres-ent and future needs, characteristic of constructive, engaged and reflective citizens;
• scientific performance (performance in science) mea-sures the capacity of a person to acquire and use scientific know-ledge to identify questions, acquire new knowledge, explain sci-entific phenomena, and draw evidence-based conclusions about science-related issues; it is the ability to view science as a form of human knowledge and understand its the main peculiarieties; it is the ability to realise that science and technology influence the material, intellectual and cultural sides of a society’s life. A scientifically literate person, who is an active and reflective citi-zen, is willing to engage in reasoned discourse about science.
The Programme for the International Assessment of Adult Competencies (PIAAC) which is managed by the Organisa-tion for Economic Co-operation and Development (OECD), aims at gathering and assessing information concerning key compe-tencies of the adult population and at studying how basic skills are used at work and in everyday life. The key competencies are viewed as proficiency – engagement and the ability of people to use social and cultural facilities, including IT and communica-tions, to work with information, acquire knowledge and commu-nicate. The survey assesses the proficiency of adults in literacy,

45 Indicators of Education in the Russian Federation
numeracy and problem solving in technology-rich environments. The source of the data for foreign countries is the OECD Skills Out-look, 2013 (http://www.oecd-ilibrary.org/education/oecd-skills-outlook-2013_9789264204256-en). The following terms are used in the framework of this survey:
• literacy is the ability of an adult to understand, evalu-ate, use and engage with written texts to participate in society, to achieve one’s goals, and to develop one’s knowledge and po-tential;
• numeracy is defined as the ability of an adult to assess, use, interpret and communicate mathematical information in order to engage in and manage the mathematical demands of a range of situations in adult life.
Data about the participation of the population in lifelong learning are presented on the basis of representative surveys of the population. The source of the data for European countries is Eurostat (http://epp.eurostat.ec.europa.eu, results of the surveys “Adult Education Survey – AES” conducted in 2007 and 2011); the source of the data for Russia is Institute for Statistical Studies and Economics of Knowledge, National Research University – Higher School of Economics (results of the surveys “Lifelong Learning” conducted in 2006, 2008, 2012, 2014 and 2015 jointly with Levada Analytical Center, respectively 1138, 1135, 1179, 1189 and 1156 persons aged 25–64 were surveyed; as well as the results of the survey “Georating”conducted in 2010 jointly with the Public Opin-ion Foundation (FOM), 29.2 thousand persons aged 25–64 were surveyed). The survey “Lifelong Learning – 2014” was conducted
by Higher School of Economics within the framework of the project “Monitoring of Innovative Behavior of the Population”.
Lifelong learning encompasses all purposeful learning activi-ties, whether formal or informal, undertaken on an ongoing basis with the aim of improving knowledge, skills and competences.
Formal education includes education of different levels (secon-dary general, secondary vocational, higher) provided by education-al institutions, including postgraduate education up to a doctor’s degree. In international practice, the indicator of the population’s participation in formal education is used; it takes into account the proportion of persons in the population aged 25–64, who studied at any level of the formal education system during the past 12 months.
Non-formal education/training covers organized educational activities which are not a part of formal educational programmes: refresher courses; professional and amateur courses; vocational lectures, seminars, training events (conducted at work regu-larly or ad-hoc); programmes of non-formal education/training at education institutions; supplementary education programmes (including MBA studies). In international practice, the indicator of population’s participation in non-formal education/training takes into account the proportion of persons who have been ob-taining non-formal education/training during the past 12 months in the population aged 25–64. The indicator of population’s par-ticipation in formal and (or) non-formal education/training is also used, and takes into account the proportion of persons in the pop-ulation aged 25–64, who participated in all organized educational activities during the past 12 months.

461. Educational Potential of the Population
Informal learning is individual learning that, in contrast to for-mal and non-formal education, is not fixed by receiving a diploma or other document but contributes to the broadening of knowledge and skills. In international practice, the indicator of population partici-pation in informal education is used. It takes into account the pro-portion of persons aged 25–64 who have been acquiring knowledge
and skills during the past 12 months on their own using printed materials (professional books, journals, etc.); technical devices (audio visual records, computers, Internet); visiting institutions that disseminate knowledge (libraries, museums, exhibitions, thea-tres, cinemas, etc.); using educational TV and radio programmes); studying under supervision of relatives, friends and colleagues.

2. Education and the Labour Market

482. Education and the Labour Market
2.1. EMPLOYMENT AND UNEMPLOYMENT RATES BY EDUCATIONAL ATTAINMENT: 2015*
Per cent Per cent
higher secondarygeneral
basicgeneral
no basic generaleducation
Educationattained:
secondaryvocational –programmes
for mid-careerprofessionals
secondaryvocational –programmes
for skilled workers,junior technicians
and employees
0 0
5
10
15
20
25
3.44.5
5.8
8.6
13.4
21.3
10
20
30
40
50
60
70
80
9081.6
72.8 72.1
50.8
27.9
9.8
employment (left axis) unemployment (right axis)
Level of:
* Here and below (tables 2.2–2.5, 2.7–2.13, pic. 2.6) the information is given according to the results of sample surveys of labour force.

49 Indicators of Education in the Russian Federation
2.2. EMPLOYED POPULATION BY EDUCATIONAL ATTAINMENT
2000 2005 2010 2011 2012 2013 2014 2015
Total Male Female
Total employment, thousand, headcount 65070 68339 69934 70857 71545 71391 71539 72324 37136 35187Education attained:higher 13981 16646 20381 21129 21740 22616 23045 23847 10745 13102incomplete higher* 2104 1290 – – – – – – – –secondary vocational – programmes for mid-career professionals 20118 17519 18960 19118 18748 18400 18486 18668 8145 10523secondary vocational – programmes for skilled workers, junior technicians and employees 6603 12598 13683 13745 13955 13237 13618 13853 8764 5088secondary general 15056 15446 13894 13907 14236 14446 13745 13322 7816 5507basic general 5657 4367 2778 2730 2671 2511 2484 2485 1570 915no basic general education 1551 474 237 228 196 181 160 147 96 52Employment rate (employed population as a percentage of the total population with the respective educational attainment), per cent 58.5 61.3 62.7 63.9 64.9 64.8 65.3 65.3 71.1 60.1Education attained:higher 79.0 81.3 81.2 81.6 82.4 81.8 82.2 81.6 86.6 77.8incomplete higher* 49.3 40.4 – – – – – – – –secondary vocational – programmes for mid-career professionals 72.5 75.0 73.3 73.7 74.3 73.8 73.8 72.8 81.3 67.4secondary vocational – programmes for skilled workers, junior technicians and employees 68.1 75.5 72.3 73.0 73.7 73.0 72.8 72.1 78.1 63.6secondary general 56.4 52.9 48.7 49.5 50.0 50.4 51.3 50.8 59.3 42.2basic general 34.1 28.7 25.4 26.7 28.1 27.3 26.8 27.9 34.0 21.3no basic general education 18.3 13.9 11.1 11.6 11.6 11.1 9.5 9.8 12.6 6.9
* As of 2009 incomplete higher education is included into the last completed level of education.

502. Education and the Labour Market
2.3. EMPLOYED POPULATION BY EDUCATIONAL ATTAINMENT AND AGE: 2015(employed population as a percentage of the total population with the respective educational attainment
and in the respective age group; per cent)
Total Education attained
Higher Secondary vocational – programmes
for mid-career professionals
Secondary vocational – programmes
for skilled workers, junior technicians
and employees
Secondary eneral
Basic general
No basic general
education
Total employment 65.3 81.6 72.8 72.1 50.8 27.9 9.8Age, years:
15–19 5.9 18.6 53.0 53.3 8.2 2.8 1.920–24 49.9 74.2 77.2 77.7 25.7 43.0 16.125–29 82.4 87.0 86.0 84.7 73.2 62.9 24.030–34 84.7 89.0 88.0 87.0 77.6 62.2 25.035–39 87.4 92.7 90.4 87.9 80.8 68.1 34.440–44 88.9 94.4 92.0 88.9 81.4 68.2 24.045–49 88.4 94.7 90.4 87.5 81.6 66.7 33.950–54 83.0 90.6 85.0 81.7 76.9 62.1 30.455–59 62.0 75.0 61.5 62.3 54.6 41.6 21.460–64 30.8 44.2 31.2 28.4 24.2 20.1 13.365–72 11.7 18.1 13.3 9.0 9.2 7.5 4.4

51 Indicators of Education in the Russian Federation
2.4. UNEMPLOYED POPULATION BY EDUCATIONAL ATTAINMENT
2000 2005 2010 2011 2012 2013 2014 2015
Total Male Female
Total unemployment, thousand, headcount 7700 5242 5544 4922 4131 4137 3889 4264 2296 1968Education attained:higher 757 541 834 783 676 721 709 839 380 460incomplete higher* 268 145 – – – – – – – –secondary vocational – programmes for mid-career professionals 2028 1020 1152 1009 799 805 765 885 412 473secondary vocational – programmes for skilled workers, junior technicians and employees 940 977 1154 976 839 803 786 859 532 326secondary general 2425 1751 1799 1575 1355 1376 1223 1257 699 558basic general 1084 744 547 521 416 395 372 385 250 135no basic general education 198 64 58 58 46 38 35 40 24 16Unemployment rate (unemployed population as a percentage of the total economically active population with the respective educational attainment), per cent 10.6 7.1 7.3 6.5 5.5 5.5 5.2 5.6 5.8 5.3Education attained:higher 5.1 3.1 3.9 3.6 3.0 3.1 3.0 3.4 3.4 3.4incomplete higher* 11.3 10.1 – – – – – – – –secondary vocational – programmes for mid-career professionals 9.2 5.5 5.7 5.0 4.1 4.2 4.0 4.5 4.8 4.3secondary vocational – programmes for skilled workers, junior technicians and employees 12.5 7.2 7.8 6.6 5.7 5.7 5.5 5.8 5.7 6.0secondary general 13.9 10.2 11.5 10.2 8.7 8.7 8.2 8.6 8.2 9.2basic general 16.1 14.6 16.4 16.0 13.5 13.6 13.0 13.4 13.7 12.9no basic general education 11.3 11.9 19.7 20.2 18.9 17.2 17.7 21.3 19.9 23.8
* As of 2009 incomplete higher education is included into the last completed level of education.

522. Education and the Labour Market
2.5. UNEMPLOYED POPULATION BY EDUCATIONAL ATTAINMENT AND AGE: 2015(unemployed population as a percentage of the total economically active population
with the respective educational attainment and in the respective age group)
Total Education attained
Higher Secondary vocational – programmes
for mid-career professionals
Secondary vocational – programmes for skilled
workers, junior technicians
and employees
Secondary general
Basic general
No basic general
education
Total unemployment 5.6 3.4 4.5 5.8 8.6 13.4 21.3Age, years:
15–19 32.4 51.6 27.8 27.8 33.2 35.1 28.520–24 14.3 14.6 10.8 11.3 18.3 20.7 31.125–29 6.2 4.2 4.8 6.4 10.0 15.0 29.830–34 5.1 3.0 4.4 5.3 8.3 14.2 20.535–39 4.5 2.2 3.6 5.6 6.9 11.9 19.040–44 4.1 1.9 3.2 4.9 6.6 12.1 24.845–49 4.0 1.7 3.8 5.0 5.8 10.9 12.950–54 4.5 2.3 4.1 5.6 6.2 9.0 17.355–59 3.9 2.4 3.5 4.8 4.9 7.3 14.760–64 3.2 2.6 3.5 3.7 2.6 4.8 4.565–72 2.8 2.3 3.1 3.2 2.9 2.6 6.8

53 Indicators of Education in the Russian Federation
2.6. AVERAGE DURATION OF UNEMPLOYMENT BY EDUCATIONAL ATTAINMENT(average job seeking period; months)
6
7
8
9
10
11
12
13
9.0
6.7
9.3
7.2
8.6
7.4
9.2
7.5
9.2
7.6
10.3
7.2
2000 2015
Unemployed population aged 15–72
higher secondarygeneral
basicgeneral
no basic generaleducation
Educationattained:
secondaryvocational –programmes
for mid-careerprofessionals
secondaryvocational –programmes
for skilled workers,junior technicians
and employees
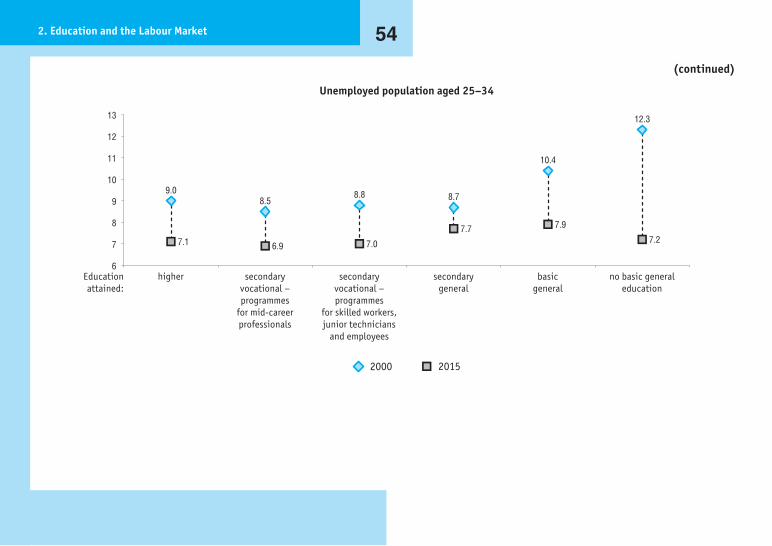
542. Education and the Labour Market
(continued)
6
7
8
9
10
11
12
13
9.08.5
8.8 8.7
10.4
12.3
2000 2015
Unemployed population aged 25–34
7.1 6.9 7.0
7.7 7.9
7.2
higher secondarygeneral
basicgeneral
no basic generaleducation
Educationattained:
secondaryvocational –programmes
for mid-careerprofessionals
secondaryvocational –programmes
for skilled workers,junior technicians
and employees

55 Indicators of Education in the Russian Federation
2.7. LONG-TERM UNEMPLOYMENT BY EDUCATIONAL ATTAINMENT AND GENDER: 2015(unemployed persons seeking a job for 12 months or longer as a percentage of the total unemployed population
with the respective educational attainment)
Unemployed population aged 15–72 Unemployed population aged 25–34
Total Male Female Total Male Female
Total 27.3 26.7 28.0 27.0 25.6 28.6Education attained:higher 22.7 22.5 22.8 24.3 23.7 24.8secondary vocational – programmes for mid-career professionals 25.9 23.4 28.0 24.4 21.2 27.4secondary vocational – programmes for skilled workers, junior technicians and employees 29.1 27.9 31.0 25.4 23.4 28.3secondary general 28.9 28.6 29.3 30.6 28.6 32.8basic general 31.3 30.2 33.3 32.0 31.3 33.2no basic general education 29.9 32.8 25.5 27.9 31.0 21.9
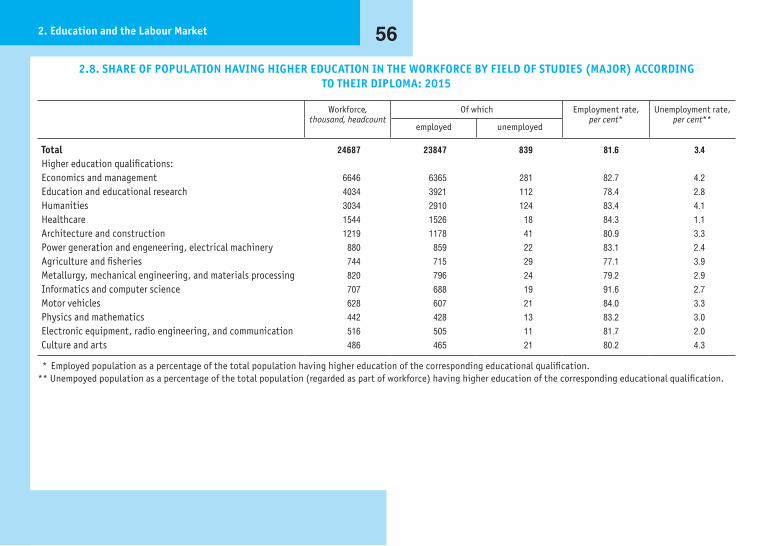
562. Education and the Labour Market
2.8. SHARE OF POPULATION HAVING HIGHER EDUCATION IN THE WORKFORCE BY FIELD OF STUDIES (MAJOR) ACCORDING TO THEIR DIPLOMA: 2015
Workforce, thousand, headcount
Of which Employment rate, per cent*
Unemployment rate, per cent**
employed unemployed
Total 24687 23847 839 81.6 3.4Higher education qualifications:Economics and management 6646 6365 281 82.7 4.2Education and educational research 4034 3921 112 78.4 2.8Humanities 3034 2910 124 83.4 4.1Healthcare 1544 1526 18 84.3 1.1Architecture and construction 1219 1178 41 80.9 3.3Power generation and engeneering, electrical machinery 880 859 22 83.1 2.4Agriculture and fisheries 744 715 29 77.1 3.9Metallurgy, mechanical engineering, and materials processing 820 796 24 79.2 2.9Informatics and computer science 707 688 19 91.6 2.7Motor vehicles 628 607 21 84.0 3.3Physics and mathematics 442 428 13 83.2 3.0Electronic equipment, radio engineering, and communication 516 505 11 81.7 2.0Culture and arts 486 465 21 80.2 4.3
* Employed population as a percentage of the total population having higher education of the corresponding educational qualification.** Unempoyed population as a percentage of the total population (regarded as part of workforce) having higher education of the corresponding educational qualification.

57 Indicators of Education in the Russian Federation
2.9. SHARE OF POPULATION HAVING SECONDARY VOCATIONAL EDUCATION (PROGRAMMES FOR MID-CAREER PROFESSIONALS) IN THE WORKFORCE BY FIELD OF STUDIES (MAJOR) ACCORDING TO THEIR DIPLOMA: 2015
Workforce, thousand, headcount
Of which Employment rate, per cent*
Unemployment rate, per cent**
employed unemployed
Total 19553 18668 885 72.8 4.5Higher education qualifications:Economics and management 3755 3557 198 68.3 5.3Education and educational research 2769 2700 68 74.6 2.5Humanities 1942 1857 85 81.8 4.4Healthcare 1744 1680 64 70.7 3.7Architecture and construction 1069 1022 47 74.0 4.4Power generation and engeneering, electrical machinery 1058 1003 55 69.8 5.2Agriculture and fisheries 1025 983 43 76.8 4.2Metallurgy, mechanical engineering, and materials processing 1054 1001 53 73.4 5.0Informatics and computer science 1092 1029 63 66.1 5.8Motor vehicles 680 637 42 79.8 6.2Physics and mathematics 516 492 24 72.6 4.6Electronic equipment, radio engineering, and communication 465 439 27 68.9 5.8Culture and arts 357 335 21 83.9 5.9
* Employed population as a percentage of the total population having secondary vocational education (programmes for mid-career professionals) of the corresponding educational qualification.
** Unempoyed population as a percentage of the total population (regarded as part of workforce) having having secondary vocational education (programmes for mid-career professionals)of the corresponding educational qualification.

582. Education and the Labour Market
2.10. SHARE OF POPULATION HAVING SECONDARY VOCATIONAL EDUCATION (PROGRAMMES FOR SKILLED WORKERS, JUNIOR TECHNICIANS AND EMPLOYEES) IN THE WORKFORCE BY FIELD OF STUDIES (MAJOR) ACCORDING TO THEIR DIPLOMA: 2015
Workforce, thousand, headcount
Of which Employment rate, per cent*
Unemployment rate, per cent**
employed unemployed
Total 14711 13853 859 72.1 5.8Secondary vocational education qualifications:Metalworking 2780 2621 159 77.4 5.7Public catering, trade and manufacturing of food products 2776 2608 168 68.5 6.0Transport 2616 2492 124 79.0 4.8Agriculture 1132 1050 82 71.2 7.2Construction 1352 1256 95 67.9 7.1Light industry 978 923 55 61.8 5.6Clerical occupations 463 430 33 65.6 7.1Services 584 558 26 76.3 4.4Common occupations for all types of economic activities 938 885 54 74.3 5.7
* Employed population as a percentage of the total population having secondary vocational education (programmes for skilled workers, junior technicians and employees) of the corresponding educational qualification.
** Unempoyed population as a percentage of the total population (regarded as part of workforce) having secondary vocational education (programmes for skilled workers, junior technicians and employees) of the corresponding educational qualification.
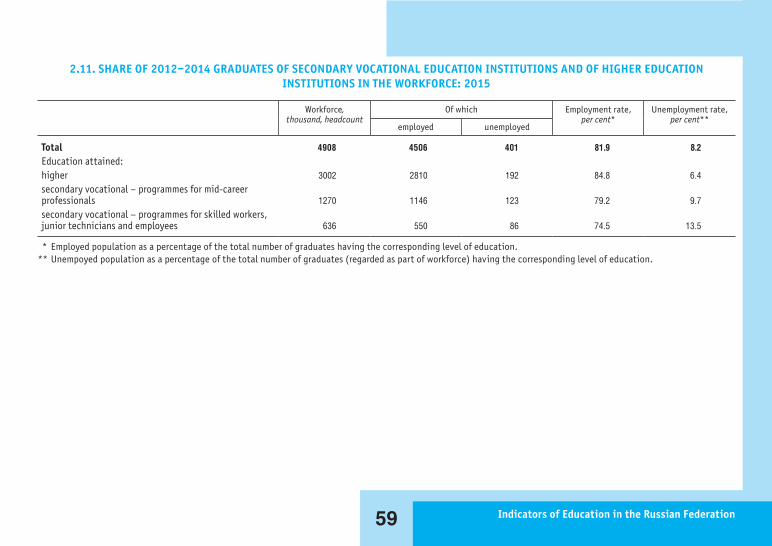
59 Indicators of Education in the Russian Federation
2.11. SHARE OF 2012–2014 GRADUATES OF SECONDARY VOCATIONAL EDUCATION INSTITUTIONS AND OF HIGHER EDUCATION INSTITUTIONS IN THE WORKFORCE: 2015
Workforce, thousand, headcount
Of which Employment rate, per cent*
Unemployment rate, per cent**
employed unemployed
Total 4908 4506 401 81.9 8.2Education attained: higher 3002 2810 192 84.8 6.4secondary vocational – programmes for mid-career professionals 1270 1146 123 79.2 9.7secondary vocational – programmes for skilled workers, junior technicians and employees 636 550 86 74.5 13.5
* Employed population as a percentage of the total number of graduates having the corresponding level of education. ** Unempoyed population as a percentage of the total number of graduates (regarded as part of workforce) having the corresponding level of education.

602. Education and the Labour Market
2.12. CORRESPONDENCE BETWEEN THE MAIN JOB AND THE EDUCATIONAL QUALIFICATION OF EMPLOYED POPULATION BY EDUCATIONAL ATTAINMENT
2013 2014 2015
Total employment, thousand,headcount 71391 71539 72324Of which those whose main job corresponds to their educational qualification, per cent
Total 54.2 55.3 54.8Education attained:
higher 23.0 23.5 23.8secondary vocational – programmes for mid-career professionals 15.3 15.6 15.4secondary vocational – programmes for skilled workers, junior technicians and employees 10.3 10.9 10.7

61 Indicators of Education in the Russian Federation
2.13. POTENTIAL WORKFORCE BY EDUCATIONAL ATTAINMENT (thousand, headcount)
2010 2011 2012 2013 2014 2015
Total Male Female
Potential workforce, total 1731 1580 1401 1439 1338 1343 607 736Education attained:higher 166 157 139 162 155 150 53 97secondary vocational – programmes for mid-career professionals 304 284 259 271 259 278 90 188secondary vocational – programmes for skilled workers, junior technicians and employees 336 307 270 269 241 256 135 121secondary general 585 520 472 493 437 436 207 230basic general 297 274 227 214 213 197 106 91no basic general education 44 38 33 29 33 26 17 9
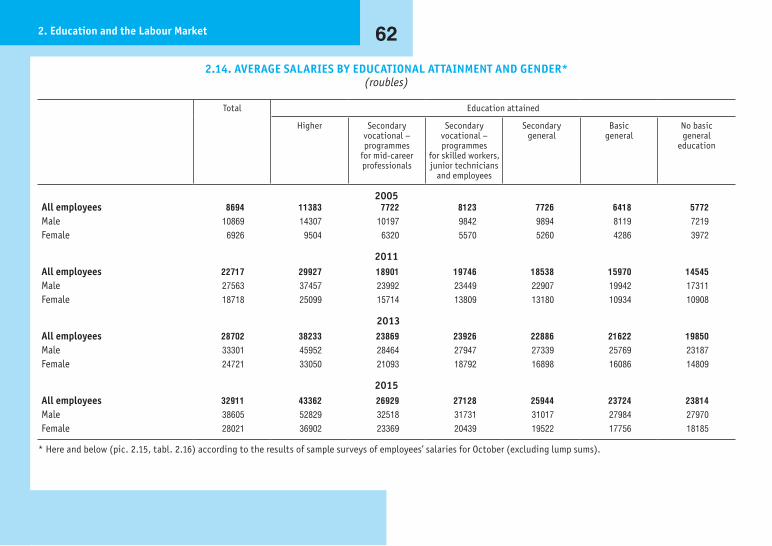
622. Education and the Labour Market
2.14. AVERAGE SALARIES BY EDUCATIONAL ATTAINMENT AND GENDER*(roubles)
Total Education attained
Higher Secondary vocational – programmes
for mid-career professionals
Secondary vocational – programmes
for skilled workers, junior technicians
and employees
Secondary general
Basic general
No basic general
education
2005All employees 8694 11383 7722 8123 7726 6418 5772Male 10869 14307 10197 9842 9894 8119 7219Female 6926 9504 6320 5570 5260 4286 3972
2011All employees 22717 29927 18901 19746 18538 15970 14545Male 27563 37457 23992 23449 22907 19942 17311Female 18718 25099 15714 13809 13180 10934 10908
2013All employees 28702 38233 23869 23926 22886 21622 19850Male 33301 45952 28464 27947 27339 25769 23187Female 24721 33050 21093 18792 16898 16086 14809
2015All employees 32911 43362 26929 27128 25944 23724 23814Male 38605 52829 32518 31731 31017 27984 27970Female 28021 36902 23369 20439 19522 17756 18185
* Here and below (pic. 2.15, tabl. 2.16) according to the results of sample surveys of employees’ salaries for October (excluding lump sums).

63 Indicators of Education in the Russian Federation
2.15. RELATIVE AVERAGE SALARIES OF EMPLOYEES BY EDUCATIONAL ATTAINMENT*(salary of employees with secondary general education = 100%)
Education attained:
secondary vocational – programmes for skilled workers, junior technicians and employees
higher basic general
no basic general educationsecondary vocational – programmes for mid-career professionals
147.3
161.4167.1 167.1
99.9
102.0 104.3 103.8105.1 106.5 104.5 104.6
83.1 86.194.5 91.4
74.7 78.586.7 91.8
50
100
150
200
2005 2011 2013 2015
Per cent
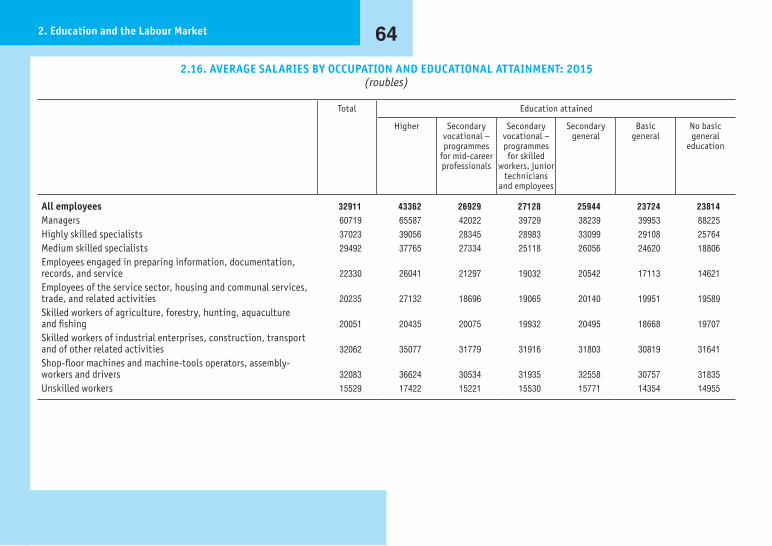
642. Education and the Labour Market
2.16. AVERAGE SALARIES BY OCCUPATION AND EDUCATIONAL ATTAINMENT: 2015(roubles)
Total Education attained
Higher Secondary vocational – programmes
for mid-career professionals
Secondary vocational – programmes for skilled
workers, junior technicians
and employees
Secondary general
Basic general
No basic general
education
All employees 32911 43362 26929 27128 25944 23724 23814Managers 60719 65587 42022 39729 38239 39953 88225Highly skilled specialists 37023 39056 28345 28983 33099 29108 25764Medium skilled specialists 29492 37765 27334 25118 26056 24620 18806Employees engaged in preparing information, documentation, records, and service 22330 26041 21297 19032 20542 17113 14621Employees of the service sector, housing and communal services, trade, and related activities 20235 27132 18696 19065 20140 19951 19589Skilled workers of agriculture, forestry, hunting, aquaculture and fishing 20051 20435 20075 19932 20495 18668 19707Skilled workers of industrial enterprises, construction, transport and of other related activities 32062 35077 31779 31916 31803 30819 31641Shop-floor machines and machine-tools operators, assembly-workers and drivers 32083 36624 30534 31935 32558 30757 31835Unskilled workers 15529 17422 15221 15530 15771 14354 14955

65 Indicators of Education in the Russian Federation
2.17. SECONDARY VOCATIONAL EDUCATION GRADUATES (PROGRAMMES FOR SKILLED WORKERS, JUNIOR TECHNICIANS AND EMPLOYEES) (INTRAMURAL FULL-TIME FORM OF STUDIES)*
(thousands)
2000 2005 2010 2011 2012 2013 2014 2015
Total number of skilled workers and qualified employees who upon graduating 645.6 595.3 452.8 388.3 351.4 310.1 283.6 244.7Received a job placement 341.1 348.5 246.9 213.0 194.7 171.2 168.5 143.6Continued education at the next level 67.7 70.2 57.0 48.4 42.4 34.6 26.3 22.2Were conscripted into the armed forces 97.9 85.9 76.3 70.6 63.2 59.3 44.2 40.9Were provided with independent job placement 135.1 84.0 52.4 38.3 34.0 30.6 30.4 26.4
of whom did not find a job placement:those who disagreed with the terms and conditions of an employer’s contract … … 2.9 3.5 2.4 1.8 2.0 2.3for lack of jobs … … 5.7 4.1 4.1 4.8 4.2 3.1
Other reasons 3.9 6.8 20.2 18.1 17.1 14.4 14.2 11.6
* Excluding specialized (correctional) educational institutions for students with deviant (socially dangerous) behavior and vocational education institutions under the Federal Penitentiary Service of Russia. Since 2010 – including graduates who studied according to commercial contracts except for those studying according to short-term (less than 500 hours) programmes.

662. Education and the Labour Market
2.18. BACHELORS, SPECIALISTS AND MASTERS WHO GRADUATED FROM STATE AND MUNICIPAL EDUCATIONAL INSTITUTIONS (INTRAMURAL FULL-TIME FORM OF STUDIES)*
(thousands)
2000 2005 2010 2011 2012 2013 2014 2015
Number of bachelors, specialists and masters 315.3 342.0 393.7 379.1 364.3 354.8 343.3 437.2of which female who upon graduation 172.2 186.2 216.9 208.3 203.9 201.4 193.2 240.2
Received a job placement 146.0 166.6 186.1 180.2 172.8 166.6 149.5 169.7Did not receive a job placement 36.2 23.8 28.3 27.8 20.3 21.4 22.3 28.8
of whom this was due to lack of offers 21.5 11.7 8.8 6.9 5.8 6.2 7.2 9.7of which female graduates who did not receive a job placement 22.1 14.2 17.0 14.9 11.9 13.5 13.0 16.9
Did not participate in job placement 133.1 151.5 179.2 171.2 171.3 166.8 171.5 238,6expressed a desire to be self-employed 76.4 96.3 93.7 88.0 90.7 83.8 86.2 109.5
including those who disagreed with the terms and conditions of an employer’s contract … … 4.4 4.1 4.2 3.4 3.8 5.9
Continued their education at the next level as full-time students 48.2 44.6 61.9 58.5 58.6 61.3 64.6 100.8Were conscripted into the armed forces 8.5 10.6 23.6 24.7 22.0 21.7 20.8 28.4
* Excluding those whose education was funded by individuals and/or legal entities under commercial contracts of paid educational services provision.

67 Indicators of Education in the Russian Federation
2.19. NUMBER OF EDUCATIONAL INSTITUTIONS GRADUATES, REGISTERED WITH THE PUBLIC EMPLOYMENT SERVICE*(at the end of the year; thousand, headcount)
2000 2005 2010 2011 2012 2013 2014 2015
Number of unemployed – total 1037.0 1830.1 1589.4 1285.6 1064.7 917.7 883.3 1001.1Male 322.2 630.5 698.4 559.6 471.7 415.9 403.8 465.8Female 714.8 1199.5 891.0 725.9 593.0 501.8 479.5 535.4
Of whom graduates of:general education institutions 21.6 57.8 … … … … 3.4 2.8
male 6.5 22.8 … … … … 1.6 1.4female 15.1 34.9 … … … … 1.8 1.5
vocational education institutions 44.7 87.9 34.4 16.7 12.9 11.1 9.1 10.6male 35.8 28.5 14.3 6.5 5.0 4.4 3.6 4.3female 8.9 59.4 20.1 10.2 7.9 6.7 5.5 6.2
higher education institutions (bachelor’s programmes, specialist’s and master’s programmes) 9.5 24.7 15.5 10.2 7.4 5.9 4.5 8.7
male 1.9 6.6 5.0 3.2 2.3 1.9 1.5 2.6female 7.6 18.1 10.5 7.0 5.1 4.0 3.1 6.2
* Source: Federal Service for Labour and Employment.

682. Education and the Labour Market
TECHNICAL NOTES
The information about employed and unemployed persons is given in accordance with the results of sample surveys of labour force, conducted by statistical authorities of the Russian Federa-tion. The units under observation are households and population (members of these households) aged 15–72. The data for 2000–2005 do not comprise the data for the Chechen Republic. The data con-cerning all indicators correspond to the annual average. Indicators for 2005 and 2010 are recalculated taking into account the results of the All-Russian population census of 2010. The data for 2014 are provided without the data for the Republic of Crimea and the city of Sevastopol.
Workforce (labour force) – population aged 15–72 which are considered as employed and unemployed during the period under review.
Employed persons (population) – people aged 15–72 who du ring the period under review were involved in any activity (tak-ing at least one hour a week), connected with goods manufactur-ing or services provision for payment or profit. The number of those employed includes persons who were temporarily absent from work for a short period of time and who retained connection with the work-place during the absence.
Employment rate is the proportion of employed population as a percentage of the total population.
Unemployed persons (population) – according to the Inter-national Labour Organisation (ILO), people aged 15–72, who dur-ing the period under review simultaneously met the following criteria:
– had no job (no gainful occupation);– were looking for a job, i.e. applied to the public or commer-
cial employment service, made use of or put up advertisements in the mass-media and on the Internet, approached the adminis-tration of firms and/or organisations (employer) directly, used their personal ties or undertook steps to start their own business;
– were ready to start working during the week when the survey was conducted.
Students, pensioners and people with disabilities are included into the number of those unemployed, if they did not have a job, were looking for a job and were ready to take it.
Unemployment rate is the proportion of unemployed population as a percentage of the total workforce.
Duration of unemployment (job seeking period) is a time in-terval within which a person being unemployed is looking for a job using every means available.
Average duration of unemployment (average job seeking pe-riod) is calculated as a weighted mean of the given composition of the unemployed.
Potential labour force (workforce) refers to unemployed per-sons, who are interested in finding a job for payment or profit, but the current circumstances limit their active job search or their readiness to start working.
The information about secondary vocational education gradu-ates (programmes for skilled workers, junior technicians and employees) is given in accordance with such programmes provided by higher education institutions.

3. Funding

703. Funding
3.1. EXPENDITURE ON EDUCATION IN THE RUSSIAN FEDERATION*
0
20
40
60
80
100
120
140
160
180
200
144 142159 155
141132
161 160
180 178162
149
94 88 9585 78 78
2010 2011 2012 2013 2014 20150
500
1000
1500
2000
2500
3000
3500
4000
1036.4
340.0
2006
1893.9
365.2
2010
2231.8
401.7
2011
2558.4
443.7
2012
2888.8
451.0
2013
3037.3
481.1
2014
3034.6
522.7
2015
1376.4
2259.1
2633.53002.1
3339.83518.4 3557.3
Billion roubles Per cent
At current prices At constant 2006 prices
Public expenditureExpenditure from extra-budgetary sources**
TotalPublic expenditureTotal
Expenditure from extra-budgetary sources**
* Here and below, total expenditure on education from all the funding sources is given on the basis of estimates made by the National Research University Higher School of Economics.
** Here and below (pic. 3.2), extra-budgetary funds (including own funds of institutions) of preschool education institutions, general education institutions (including the funds from commercial supplementary education services provision) and higher education institutions are calculated by the National Research University Higher School of Economics using the data of the federal state statistical observation.

71 Indicators of Education in the Russian Federation
3.2. ЕXPENDITURE ON EDUCATION IN THE RUSSIAN FEDERATION AS A PERCENTAGE OF GDP
Total
Public expenditure
Expenditure from extra-budgetary sources
0
1
2
3
4
5
6
3.9
1.3
2006
4.1
0.8
2010
3.7
0.7
2011
3.8
0.7
2012
4.1
0.6
2013
3.8
0.6
2014
3.6
0.6
2015
5.14.9
4.4 4.54.7
4.4 4.3

723. Funding
3.3. PUBLIC EXPENDITURE ON EDUCATION BY LEVEL OF THE BUDGET SYSTEM(billion roubles)
2000 2005 2010 2011 2012 2013 2014 2015 2016** 2017***
Consolidated budget of the Russian Federation and state extra-budgetary funds* 214.7 801.8 1893.9 2231.8 2558.4 2888.8 3037.3 3034.6 … …Federal budget 38.1 162.1 442.8 553.4 603.8 672.3 638.3 610.6 603.9 595.0State extra-budgetary funds … 11.0 0.1 0.1 0.1 0.2 0.2 0.2 0.3 …Consolidated budgets of Russian regions 176.6 628.6 1450.9 1728.4 2047.0 2333.8 2474.3 2472.5 2615.1 …Budgets of territorial state extra-budgetary funds … 0.01 0.0 0.0 0.0 0.0 0.0 0.0 … …
* Here and below, the data for 2000 excludes the budgets of state extra-budgetary funds. ** Annual data are enacted by the consolidated budget breakdown as amended (the report on the implementation of the consolidated budget of the Russian Federation
and budgets of state extra-budgetary funds as of December 1, 2016). *** According to the Federal Law of December 19, 2016 № 415-FZ «On the federal budget for 2017 and the target period for 2018 and 2019».

73 Indicators of Education in the Russian Federation
3.4. TRENDS IN ЕXPENDITURE ON EDUCATION(at constant prices)
6
56
106
156
206
256
169.8
222.6 226.3239.5
258.1245.1
226.3
113.393.0 101.7 105.8 107.7
95.0 92.3
2005 2010 2011 2012 2013 2014 2015
As a percentage of 2000
As a percentage of the previous year
Per cent

743. Funding
3.5. PUBLIC EXPENDITURE ON EDUCATION AS A PERCENTAGE OF THE TOTAL EXPENDITURE OF THE CONSOLIDATED BUDGET OF THE RUSSIAN FEDERATION AND THE BUDGETS OF STATE EXTRA-BUDGETARY FUNDS
Per cent
9.0
9.5
10.0
10.5
11.0
11.5
12.0
11.0
2000
11.8
2005
10.8
2010
11.2
2011
11.0
2012
11.4
2013
11.0
2014
10.2
2015
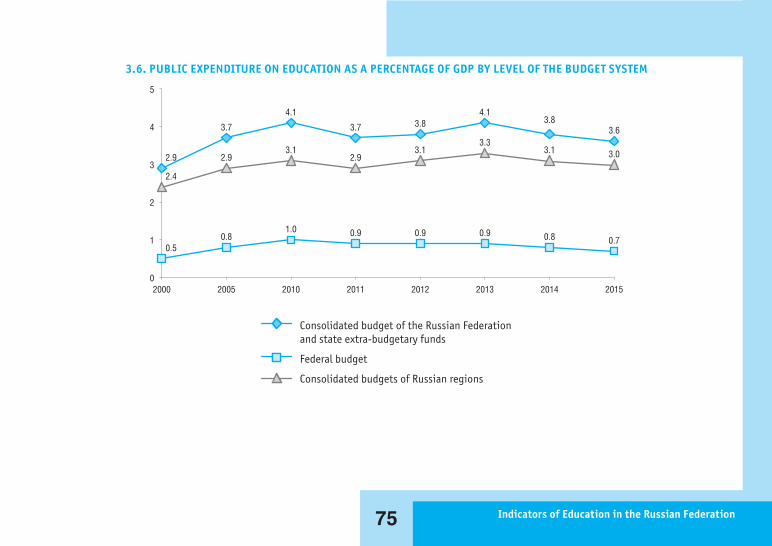
75 Indicators of Education in the Russian Federation
3.6. PUBLIC EXPENDITURE ON EDUCATION AS A PERCENTAGE OF GDP BY LEVEL OF THE BUDGET SYSTEM
Consolidated budget of the Russian Federation and state extra-budgetary funds
Federal budget
Consolidated budgets of Russian regions
0
1
2
3
4
5
2.9
3.7
4.1
3.7 3.84.1
3.83.6
0.50.8
1.0 0.9 0.9 0.9 0.8 0.7
2.4
2.93.1
2.93.1
3.33.1 3.0
2000 2005 2010 2011 2012 2013 2014 2015

763. Funding
3.7. PUBLIC EXPENDITURE ON EDUCATION BY SUBSECTION OF BUDGETARY EXPENDITURE CLASSIFICATION(billion roubles)
2000 2005 2010 2011 2012 2013 2014 2015
Consolidated budget of the Russian Federation and state extra-budgetary funds 214.7 801.8 1893.9 2231.8 2558.4 2888.8 3037.3 3034.6Preschool education 32.0 113.0 321.3 394.7 469.6 598.1 658.1 692.1General education 107.9 356.0 827.4 989.7 1184.0 1329.2 1414.7 1405.9Lower vocational education* 13.4 39.4 61.7 62.4 58.4 52.5 – _Secondary vocational education 10.2 43.3 102.1 115.3 130.3 144.9 201.8 197.8Higher and postgraduate education** 24.4 125.9 377.8 416.8 464.0 512.5 519.7 517.1Professional training, retraining and professional development*** 1.4 6.7 13.2 16.0 16.5 17.5 21.1 19.5Youth policies and children’s rehabilitation and recovery … 24.8 49.5 57.3 62.9 62.5 62.0 58.4Applied research in education … 1.8 15.7 20.2 13.7 8.8 15.5 13.4Other issues in the field of education**** 25.4 90.8 125.1 159.2 159.0 162.8 144.3 130.5
* Since 2014 the expenses are included in the section “Secondary vocational education” of the budget expenditure classification. ** In 2000, 2005 – section “Higher education” of the budget expenditure classification. *** In 2000, 2005 – section “Retraining and professional development” of the budget expenditure classification. **** In 2000 – section “Other expenditure on education”.

77 Indicators of Education in the Russian Federation
3.8. PUBLIC EXPENDITURE ON EDUCATION AS A PERCENTAGE OF GDP BY SUBSECTION OF BUDGETARY EXPENDITURE CLASSIFICATION
Professional training, retraining and professional development
Higher and postgraduate education
Secondary vocational education
Lower vocational education*
General education
Preschool education
2013
2015
2014
2010
2005
0 0.5 1.0 1.5 2.0
0.80.80.8
0.70.5
1.71.8
1.91.8
1.6
0.10.1
0.20.2
0.30.20.20.2
0.60.70.7
0.80.6
0.020.030.020.030.03
* Since 2014 the expenses are included in the section “Secondary vocational education” of the budget expenditure classification.
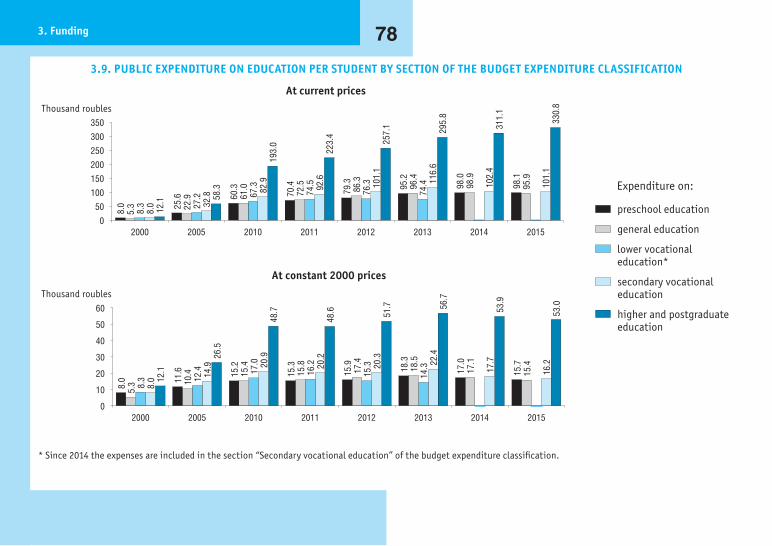
783. Funding
3.9. PUBLIC EXPENDITURE ON EDUCATION PER STUDENT BY SECTION OF THE BUDGET EXPENDITURE CLASSIFICATION
Expenditure on:
secondary vocational education
higher and postgraduate education
lower vocational education*
preschool education
general education
Thousand roubles
Thousand roubles
At current prices
At constant 2000 prices
050
100150200250300350
8.0
5.3
8.3
8.0 12.1
2000
25.6
22.9
27.2
32.8 58
.3
200560
.361
.067
.3 82.9
193.
0
2010
70.4
72.5
74.5 92
.622
3.4
2011
79.3
86.3
76.3 10
1.1
257.
1
2012
95.2
96.4
74.4 11
6.6
295.
8
2013
98.0
98.9
102.
431
1.1
2014
98.1
95.9
101.
133
0.8
2015
0
10
20
30
40
50
60
8.0
5.3 8.
38.
0 12.1
2000
11.6
10.4
12.4 14.9
26.5
2005
15.2
15.4
17.0 20
.948
.7
2010
15.3
15.8
16.2 20
.248
.6
2011
15.9
17.4
15.3 20
.351
.7
201218
.318
.514
.3 22.4
56.7
2013
17.0
17.1
17.7
53.9
2014
15.7
15.4
16.2
53.0
2015
* Since 2014 the expenses are included in the section “Secondary vocational education” of the budget expenditure classification.

79 Indicators of Education in the Russian Federation
3.10. FIXED INVESTMENT IN THE EDUCATION SECTOR*
2005 2010 2011 2012 2013 2014 2015
Fixed investment:million roubles; at current prices 68815 163687 198292 213337 228873 242687 239790As a percentage:
of the previous year, in comparable prices 119.3 109.7 113.4 102.3 103.1 100.6** 84.2of the total fixed investment 1.9 1.8 1.8 1.7 1.7 1.7 1.6
* The data for 2000 are presented according to the Russian Classification of Economy Branches; since 2005 – according to the ISIC/NACE-compatible Russian Classification of Economic Activities.
** To provide statistical data comparison the indicator is accounted without information for the Republic of Crimea and Sevastopol.
3.11. FIXED INVESTMENT IN THE EDUCATION SECTOR BY FUNDING SOURCE*(per cent)
2005 2010 2011 2012 2013 2014 2015
Fixed investment 100 100 100 100 100 100 100Own funds of institutions 9.6 4.2 4.4 4.1 4.1 4.3 6.3Obtained funds 90.4 95.8 95.6 95.9 95.9 95.7 93.7
Of which budgetary funds 79.4 88.3 87.3 86.8 86.7 86.6 85.0Federal budget 21.8 40.5 42.9 34.3 32.5 32.8 34.2Budgets of Russian regions 50.0 38.3 35.3 40.3 38.2 35.8 34.3Local budgets … … … 12.2 16.0 18.0 16.5
* Excluding small businesses and investments which are not observed by direct statistical methods.

803. Funding
3.12. FIXED INVESTMENT IN THE EDUCATION SECTOR BY FORM OF OWNERSHIP*
Form of ownership:
Public ownership
Municipal ownership
Private ownership
Ownership of consumers' cooperatives
Ownership of voluntary associations
Mixed ownership
Foreign ownership
Joint ownership (with both Russian and foreign participation)
Per cent
0
10
20
30
40
50
60
70
80
90
100
56.2
27.3
2.9 0.20.1
12.7
0.6
2005
66.5
26.0
7.0
0.020.10.3
0.1
2010
64.8
29.0
5.5
0.010.10.20.2
0.2
2011
53.9
38.9
6.5 0.010.01
0.20.4
0.01
0.1
2012
47.0
47.5
5.00.30.2
2013
44.0
48.6
5.9
0.010.31.10.03
0.03
2014
48.7
45.3
4.5
0.01
0.11.10.1
0.04
2015
* Excluding small businesses and investments which are not observed by direct statistical methods.

81 Indicators of Education in the Russian Federation
3.13. PAID SERVICES IN THE EDUCATION SYSTEM
2000 2005 2010 2011 2012 2013 2014 2015
Million roubles 41530 152670 326100 347351 378931 449233 486543 539685As a percentage:
of the previous year, in comparable prices 121.7 107.7 99.1 100.5 101.3 98.9 98.0* 96.8of 2000, in comparable prices 100 152.6 172.4 173.2 175.5 173.5 170.1* 164.6of the total volume of paid services the population 6.9 6.7 6.6 6.3 6.3 6.5 6.5 6.7
Volume of paid services per capita, roubles 285.3 1063.8 2282.8 2429.7 2646.1 3130.4 3330.4 3686.2
* To provide statistical data comparison the indicator is accounted without information for the Republic of Crimea and Sevastopol.
3.14. HOUSEHOLD EXPENDITURE ON EDUCATIONAL SERVICES*
Expenditure on educational services
Per household member a year,roubles
As a percentage of
consumer expenditure personal services expenditure
2000 137 1.0 7.22005 931 1.8 7.82010 1583 1.3 4.92011 1616 1.2 4.52012 1918 1.3 4.92013 1604 1.0 3.72014** 1766 1.0 3.82015 1573 0.9 3.3
* Based on the data of a sample survey of household budgets. ** Without information for the Republic of Crimea and Sevastopol.

823. Funding
3.15. HOUSEHOLD EXPENDITURE ON EDUCATIONAL SERVICES BY INCOME DECILES*(average, per household member a year; roubles)
2000 2005 2010 2011 2012 2013 2014** 2015
1st group (having the minimum income) 16 96 211 303 265 251 275 2822nd group 22 162 426 488 463 497 463 4003d group 34 226 612 688 740 724 725 7504th group 50 375 1099 921 913 976 1055 8525th group 80 548 1209 1178 1387 1411 1319 16076th group 110 1078 1507 1612 1588 1662 1756 18987th group 130 1118 2348 3553 2622 2491 2798 23928th group 217 1520 3339 2527 4251 2676 2790 29219th group 303 2069 3000 2632 3593 3297 3649 252810th group (having the maximum income) 406 2109 2076 2259 3359 2057 2831 2096
* Based on the data of a sample survey of household budgets. ** Without information for the Republic of Crimea and Sevastopol.

83 Indicators of Education in the Russian Federation
3.16. FUNDS OF PRESCHOOL EDUCATION INSTITUTIONS BY SOURCE OF FUNDS
2009 2010 2011 2012 2013 2014 2015
Million roublesFunds – total 327851.5 338043.9 411416.6 480342.1 557518.7 653956.6 672498.3Budgetary funds 277949.1 293930.0 362071.8 424905.1 492821.0 573147.3 574588.3
of which budgetary funds offederal budget 7957.3 6208.8 7668.4 6294.1 15464.1 19713.3 17542.4budgets of Russian regions 56894.7 65580.1 84310.5 115665.5 104576.9 305781.4 328612.1local budgets 213097.2 222141.1 270092.9 302945.6 372780.0 247652.6 228433.9
Own funds of institutions 4597.6 4806.8 5321.2 5766.7 5560.5 5114.6 4968.9Funds of populations 43592.1 37323.0 41663.3 47493.5 56498.5 73026.4 90192.6
of which parents' payments 41844.6 35437.9 39532.1 44958.3 53690.7 69823.6 86461.6Extra-budgetary funds 388.6 387.5 452.4 525.9 544.0 649.9 690.9Funds from abroad 1.0 1.6 0.1 2.1 3.7 0.2 3.8Other 1323.0 1595.0 1907.8 1648.8 2091.0 2018.2 2053.8
Per centFunds – total 100 100 100 100 100 100 100Budgetary funds 84.8 87.0 88.0 88.5 88.4 87.6 85.4
of which budgetary funds offederal budget 2.4 1.8 1.9 1.3 2.8 3.0 2.6budgets of Russian regions 17.4 19.4 20.5 24.1 18.8 46.8 48.9local budgets 65.0 65.7 65.6 63.1 66.9 37.9 34.0
Own funds of institutions 1.4 1.4 1.3 1.2 1.0 0.8 0.7Funds of populations 13.3 11.0 10.1 9.9 10.1 11.2 13.4
of which parents' payments 12.8 10.5 9.6 9.4 9.6 10.7 12.9Extra-budgetary funds 0.1 0.1 0.1 0.1 0.1 0.1 0.1Funds from abroad 0.0 0.0 0.0 0.0 0.0 0.0 0.0Other 0.4 0.5 0.5 0.3 0.4 0.3 0.3

843. Funding
3.17. FUNDS OF GENERAL EDUCATION INSTITUTIONS BY SOURCE OF FUNDS
Total State and municipal institutions Private institutions
2012 2013 2014 2015 2012 2013 2014 2015 2012 2013 2014 2015
Million roublesFunds – total 944208.9 1093717.4 1195331.3 1231160.0 927953.3 1076080.5 1175218.1 1205958.3 16255.6 17636.9 20113.2 25201.7Budgetary funds 909660.1 1053188.1 1145741.0 116970.2 905980.9 1049493.2 1141247.2 1164221.5 3679.2 3694.9 4493.9 4848.7
of which budgetary funds of
federal budget 46929.8 41613.1 18099.8 9853.6 46787.4 41481.0 17886.8 9678.5 142.4 132.1 213.0 175.1budgets of Russian regions 699265.8 841220.2 911993.3 947907.6 696063.4 838173.9 908097.0 943587.9 3202.4 3046.3 3896.3 4319.7local budgets 163464.5 170354.8 215647.9 211308.9 163130.0 169838.3 215263.4 210955.1 334.5 516.5 384.6 353.9
Own funds of institutions 7345.9 7431.2 8104.3 8898.8 3572.1 4104.8 4619.7 4454.7 3773.8 3326.3 3484.6 4444.1Funds of poplulation 25531.0 31281.4 39057.6 50767.0 17223.3 21143.5 27469.1 35446.4 8307.8 10138.0 11588.5 15320.6Extra-budgetary funds 1658.2 1795.5 2410.3 2387.4 1173.7 1332.8 1873.2 1832.1 484.5 462.7 537.1 555.3Funds from abroad 13.6 21.2 18.0 36.6 3.4 6.3 8.9 3.6 10,3 15.0 9.1 33.0
Per centFunds – total 100 100 100 100 100 100 100 100 100 100 100 100Budgetary funds 96.3 96.3 95.9 95.0 97.6 97.5 97.1 96.5 22.6 20.9 22.3 19.2
of which budgetary funds of
federal budget 5.0 3.8 1.5 0.8 5.0 3.9 1.5 0.8 0.9 0.7 1.1 0.7budgets of Russian regions 74.1 76.9 76.3 77.0 75.0 77.9 77.3 78.2 19.7 17.3 19.4 17.1local budgets 17.3 15.6 18.0 17.2 17.6 15.8 18.3 17.5 2.1 2.9 1.9 1.4
Own funds of institutions 0.8 0.7 0.7 0.7 0.4 0.4 0.4 0.4 23.2 18.9 17.3 17.6Funds of poplulation 2.7 2.9 3.3 4.1 1.9 2.0 2.3 2.9 51.1 57.5 57.6 60.8Extra-budgetary funds 0.2 0.2 0.2 0.2 0.1 0.1 0.2 0.2 3.0 2.6 2.7 2.2Funds from abroad 0.0 0.0 0.0 0.0 0.0 0.0 0.0 0.0 0.1 0.1 0.0 0.1

85 Indicators of Education in the Russian Federation
3.18. FUNDS OF EDUCATIONAL INSTITUTIONS OF SUPPLEMENTARY EDUCATION IMPLEMENTING SUPPLEMENTARY GENERAL EDUCATION PROGRAMMES FOR CHILDREN BY SOURCE OF FUNDS*
2011 2012 2013 2014 2015
Million roublesFunds – total 75765.4 95271.9 139104.5 253531.6 239867.6Budgetary funds 71236.1 88465.7 128229.7 232772.9 217299.2Funds left at the beginning of the year 230.9 305.1 707.8 1891.7 1547.8Gains from paid supplementary educational services 2430.6 3802.3 6008.2 11289.4 12338.5Gains from production activity 292.8 378.4 445.3 871.7 1308.9Charity 437.8 600.5 1013.0 2524.5 2264.8Other 1137.2 1720.0 2700.5 4181.4 5108.5
Per centFunds – total 100 100 100 100 100Budgetary funds 94.0 92.9 92.2 91.8 90.6Funds left at the beginning of the year 0.3 0.3 0.5 0.7 0.6Gains from paid supplementary educational services 3.2 4.0 4.3 4.5 5.1Gains from production activity 0.4 0.4 0.3 0.3 0.5Charity 0.6 0.6 0.7 1.0 0.9Other 1.5 1.8 1.9 1.6 2.1
* According to the Ministry of Education and Science of the Russian Federation.

863. Funding
3.19. FUNDS OF EDUCATIONAL INSTITUTIONS IMPLEMENTING SECONDARY VOCATIONAL EDUCATION PROGRAMMES BY SOURCE OF FUNDS: 2015
Total State and municipal institutions Private institutions
Million roublesFunds – total 199814.8 194580.0 5234.8Budgetary funds 167178.6 167140.9 37.7
of which budgetary funds offederal budget 14991.8 14986.0 5.8budgets of Russian regions 149307.2 149284.1 23.2local budgets 2879.5 2870.8 8.7
Own funds of institutions 7750.3 5861.7 1888.6Funds of population 21706.1 18448.4 3257.8Extra-budgetary funds 3139.9 3089.4 50.6Funds from abroad 39.8 39.7 0.1
Per centFunds – total 100 100 100Budgetary funds 83.7 85.9 0.7
of which budgetary funds offederal budget 7.5 7.7 0.1budgets of Russian regions 74.7 76.7 0.4local budgets 1.4 1.5 0.2
Own funds of institutions 3.9 3.0 36.1Funds of population 10.9 9.5 62.2Extra-budgetary funds 1.6 1.6 1.0Funds from abroad 0.0 0.0 0.0

87 Indicators of Education in the Russian Federation
3.20. FUNDS OF HIGHER EDUCATION INSTITUTIONS BY SOURCE OF FUNDS
Total State and municipal institutions Private institutions
2012 2013 2014 2015 2012 2013 2014 2015 2012 2013 2014 2015
Million roublesFunds – total 695010.1 739134.2 781671.7 768246.8 650046.7 686931.3 728747.6 718172.8 44963.4 52202.9 52924.1 50074.0Budgetary funds 397216.6 426461.7 460806.1 438103.9 396072.3 425266.0 459261.6 436626.8 1144.3 1195.6 1544.5 1477.1
of which budgetary funds of:
federal budget 381933.1 408942.7 438200.2 416297.2 381051.9 408053.2 437041.9 415075.2 881.2 889.5 1158.2 1222.1budgets of Russian regions 14463.3 16939.5 20477.0 20467.3 14252.3 16656.7 20286.5 20331.1 211.0 282.9 190.6 136.2local budgets 820.2 579.4 2128.9 1339.3 768.1 556.2 1933.2 1220.5 52.1 23.2 195.7 118.8
Own funds of institutions 98871.6 100176.0 91533.9 93971.4 94123.1 92451.4 83842.2 86653.3 4748.4 7724.6 7691.7 7318.1Funds of population 189483.8 201274.5 210915.1 212899.6 151244.5 159056.2 168245.9 173191.5 38239.4 42218.4 42669.2 39708.1Extra-budgetary funds 5181.7 4937.6 9981.6 12330.8 4972.7 4497.8 9580.4 11928.1 209.0 439.8 401.2 402.7Funds from abroad 4256.4 6284.4 8435.0 10941.2 3634.0 5659.9 7817.5 9773.2 622.3 624.5 617.4 1168.0
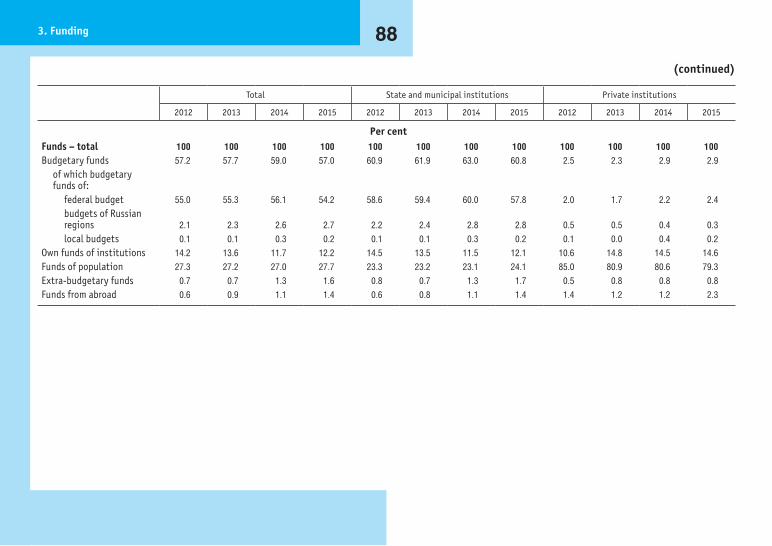
883. Funding
(continued)
Total State and municipal institutions Private institutions
2012 2013 2014 2015 2012 2013 2014 2015 2012 2013 2014 2015
Per centFunds – total 100 100 100 100 100 100 100 100 100 100 100 100Budgetary funds 57.2 57.7 59.0 57.0 60.9 61.9 63.0 60.8 2.5 2.3 2.9 2.9
of which budgetary funds of:
federal budget 55.0 55.3 56.1 54.2 58.6 59.4 60.0 57.8 2.0 1.7 2.2 2.4budgets of Russian regions 2.1 2.3 2.6 2.7 2.2 2.4 2.8 2.8 0.5 0.5 0.4 0.3local budgets 0.1 0.1 0.3 0.2 0.1 0.1 0.3 0.2 0.1 0.0 0.4 0.2
Own funds of institutions 14.2 13.6 11.7 12.2 14.5 13.5 11.5 12.1 10.6 14.8 14.5 14.6Funds of population 27.3 27.2 27.0 27.7 23.3 23.2 23.1 24.1 85.0 80.9 80.6 79.3Extra-budgetary funds 0.7 0.7 1.3 1.6 0.8 0.7 1.3 1.7 0.5 0.8 0.8 0.8Funds from abroad 0.6 0.9 1.1 1.4 0.6 0.8 1.1 1.4 1.4 1.2 1.2 2.3

89 Indicators of Education in the Russian Federation
3.21. AVERAGE CONSUMER PRICES FOR EDUCATIONAL SERVICES(at the end of the year; roubles)
2000 2005 2010 2011 2012 2013 2014* 2015
Attending nursery-kindergartens, per day 9.19 26.53 54.86 56.97 61.66 67.30 76.55 85.19Studying at private general education institutions, per month** 1703.76 4168.46 9420.77 10002.34 11431.92 12008.43 14037.35 16029.83Additional studies at state and municipal intramural full-time general education institutions, per academic hour … … 79.08 71.52 83.74 94.54 113.05 124.85Studying at secondary vocational education institutions, per semester 4232.07 8672.05 13981.85 16516.96 17639.59 19943.13 23731.83 27371.91Studying at state and municipal higher education institutions, per semester 7033.69 16026.90 25520.38 28211.22 35273.32 38813.35 42331.74 47626.92Studying at private higher education institutions, per semester 8310.66 15153.15 22983.61 24793.75 27358.44 28840.34 33030.85 38085.28Studying at foreign languages courses, per academic hour 31.09 72.24 148.21 181.84 206.34 221.36 236.85 261.77Studying at professional training courses, per academic hour 21.87 49.60 82.21 79.70 90.33 97.26 107.07 120.62Initial driving course, per course … … 17725.13 18660.52 19058.30 19457.99 27234.47 28588.22
* To provide statistical data comparison the indicator is accounted without information for the Republic of Crimea and Sevastopol. ** In 2000, 2005 – studying at secondary general education institutions.

903. Funding
3.22. CONSUMER PRICE INDICES FOR CERTAIN TYPES OF SERVICES IN THE EDUCATION SYSTEM(December to December of the preceding year)
0
20
40
60
80
100
120
14011
6.7
122.
1
115.
9
117.
3
109.
2
2000
107.
7
111.
5
106.
4
104.
8
103.
4
2010
111.
3
108.
5
107.
4
107.
4
103.
8
2011
106.
4
107.
3
107.
1 120.
7
104.
5
2012
109.
9
108.
0
111.
7
109.
0
105.
8
2013
115.
6
107.
4 116.
3
108.
8
108.
9
2014*
116.
8
109.
4
112.
3
110.
2
110.
2
2015
Per cent
Preschool education services Studying at state and municipal higher education institutionsStudying at private general education
institutions** Studying at private higher education institutionsStudying at secondary vocational education
institutions
* To provide statistical data comparison the indicator is accounted without information for the Republic of Crimea and Sevastopol.** In 2000 – studying at secondary general education institutions.

91 Indicators of Education in the Russian Federation
3.23. ENROLMENT, ENTRANTS AND GRADUATES FROM SECONDARY VOCATIONAL EDUCATION INSTITUTIONS IMPLEMENTING PROGRAMMES FOR SKILLED WORKERS, JUNIOR TECHNICIANS AND EMPLOYEES INSTITUTIONS BY FUNDING SOURCE
(thousand, headcount)
Enrolment, at the end of the year Entrants Graduates
2010 2015 2010 2015 2010 2015
Total 1006.6 686.1 609.4 395.6 580.5 368.2At the expense of the founder of the educational institutions 964.7 670.0 508.6 371.4 484.2 346.6Studying under contracts 41.9 16.1 100.8 24.2 96.3 21.7
At the expense of budgetary funds 12.7 3.9 29.5 4.9 29.0 4.9of which:federal budget 1.9 0.1 10.9 0.8 11.4 0.9budgets of Russian regions 10.2 3.8 16.4 3.7 15.0 3.7local budgets 0.6 0.0 2.2 0.3 2.5 0.3
At the expense of organisations (employers) 1.6 0.4 9.7 2.1 9.4 2.2of which:state 0.7 0.1 4.1 1.1. 4.3 1.1private 0.9 0.3 5.5 1.1 5.1 1.0
At the expense of students 26.9 11.8 58.9 17.1 54.9 14.5At the expense of other sources 0.8 0.0 2.7 0.1 3.0 0.1

923. Funding
3.24. ENROLMENT, ENTRANTS AND GRADUATES FROM SECONDARY VOCATIONAL EDUCATION INSTITUTIONS IMPLEMENTING PROGRAMMES FOR MID-CAREER PROFESSIONALS BY FUNDING SOURCE
(thousand, headcount)
2000 2005 2010 2011 2012 2013 2014 2015
Enrolment, at the beginning of the academic year 2360.8 2590.7 2125.7 2081.7 2087.1 1984.3 2103.1 2180.2
Of which studying at the expense:of budgetary funds 1590.1 1603.9 1485.9 1492.4 1524.2 1452.4 1516.0 1533.3
at state and municipal institutions 1590.1 1603.9 1485.7 1491.9 1523.4 1450.5 1514.7 1531.0
at private institutions … … 0.2 0.5 0.8 1.9 1.3 2.3
of individuals and/or legal entities under commercial contracts of paid educational services provision 770.7 986.8 639.8 589.3 562.9 532.0 587.2 646.9
at state and municipal institutions 718.5 869.1 541.2 492.1 461.0 407.9 448.6 500.3
at private institutions 52.2 117.7 98.6 97.2 101.9 124.1 138.5 146.6
Entrants 867.2 854.1 705.3 659.6 656.2 637.7 672.8 699.3
Of whom studying at the expense:of budgetary funds 516.5 500.5 489.8 480.1 481.9 448.4 455.3 455.4
at state and municipal institutions 516.5 500.5 489.7 479.9 481.2 447.9 455.1 454.7
at private institutions … … 0.0 0.2 0.7 0.5 0.3 0.7
of individuals and/or legal entities under commercial contracts of paid educational services provision 350.7 353.6 215.5 179.5 174.3 189.3 217.5 243.9
at state and municipal institutions 325.9 310.4 182.1 148.9 139.6 143.4 163.3 185.1
at private institutions 24.8 43.2 33.5 30.6 34.7 45.9 54.2 58.8

93 Indicators of Education in the Russian Federation
2000 2005 2010 2011 2012 2013 2014 2015
Graduates from secondary vocational education institutions implementing programmes for mid-career professionals 579.3 684.4 572.1 518.0 486.3 439.0 451.0 446.0
Of whom studying at the expense:of budgetary funds 414.2 399.3 356.8 331.0 319.1 299.7 319.3 320.1
at state and municipal institutions 414.2 399.3 356.8 330.9 319.0 299.4 319.3 319.4
at private institutions … … 0.0 0.1 0.0 0.4 0.1 0.7
of individuals and/or legal entities under commercial contracts of paid educational services provision 165.1 285.1 215.3 187.0 167.3 139.3 131.6 125.9
at state and municipal institutions 153.5 252.1 178.9 153.3 135.9 104.6 98.7 91.6
at private institutions 11.6 33.0 36.4 33.7 31.4 34.7 32.9 34.3
(continued)
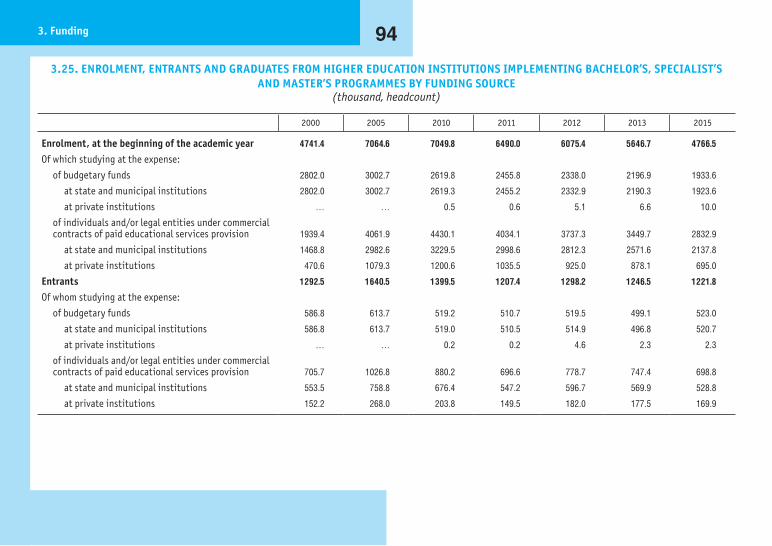
943. Funding
3.25. ENROLMENT, ENTRANTS AND GRADUATES FROM HIGHER EDUCATION INSTITUTIONS IMPLEMENTING BACHELOR’S, SPECIALIST’S AND MASTER’S PROGRAMMES BY FUNDING SOURCE
(thousand, headcount)
2000 2005 2010 2011 2012 2013 2015
Enrolment, at the beginning of the academic year 4741.4 7064.6 7049.8 6490.0 6075.4 5646.7 4766.5
Of which studying at the expense:of budgetary funds 2802.0 3002.7 2619.8 2455.8 2338.0 2196.9 1933.6
at state and municipal institutions 2802.0 3002.7 2619.3 2455.2 2332.9 2190.3 1923.6
at private institutions … … 0.5 0.6 5.1 6.6 10.0
of individuals and/or legal entities under commercial contracts of paid educational services provision 1939.4 4061.9 4430.1 4034.1 3737.3 3449.7 2832.9
at state and municipal institutions 1468.8 2982.6 3229.5 2998.6 2812.3 2571.6 2137.8
at private institutions 470.6 1079.3 1200.6 1035.5 925.0 878.1 695.0
Entrants 1292.5 1640.5 1399.5 1207.4 1298.2 1246.5 1221.8
Of whom studying at the expense:of budgetary funds 586.8 613.7 519.2 510.7 519.5 499.1 523.0
at state and municipal institutions 586.8 613.7 519.0 510.5 514.9 496.8 520.7
at private institutions … … 0.2 0.2 4.6 2.3 2.3
of individuals and/or legal entities under commercial contracts of paid educational services provision 705.7 1026.8 880.2 696.6 778.7 747.4 698.8
at state and municipal institutions 553.5 758.8 676.4 547.2 596.7 569.9 528.8
at private institutions 152.2 268.0 203.8 149.5 182.0 177.5 169.9

95 Indicators of Education in the Russian Federation
2000 2005 2010 2011 2012 2013 2015
Graduates from higher education institutions implementing bachelor’s, specialist’s and master’s programmes 635.1 1151.7 1467.9 1442.9 1397.2 1291.0 1300.5
Of whom studying at the expense:of budgetary funds 451.8 517.2 546.7 521.3 496.8 473.4 536.1
at state and municipal institutions 451.8 517.2 546.6 521.0 496.7 473.3 535.6
at private institutions … … 0.1 0.3 0.1 0.1 0.5
of individuals and/or legal entities under commercial contracts of paid educational services provision 183.3 634.5 921.2 921.6 900.5 817.6 764.4
at state and municipal institutions 127.1 461.2 631.2 636.3 628.7 586.7 574.4
at private institutions 56.2 173.3 290.1 285.3 271.8 230.9 190.0
(continued)
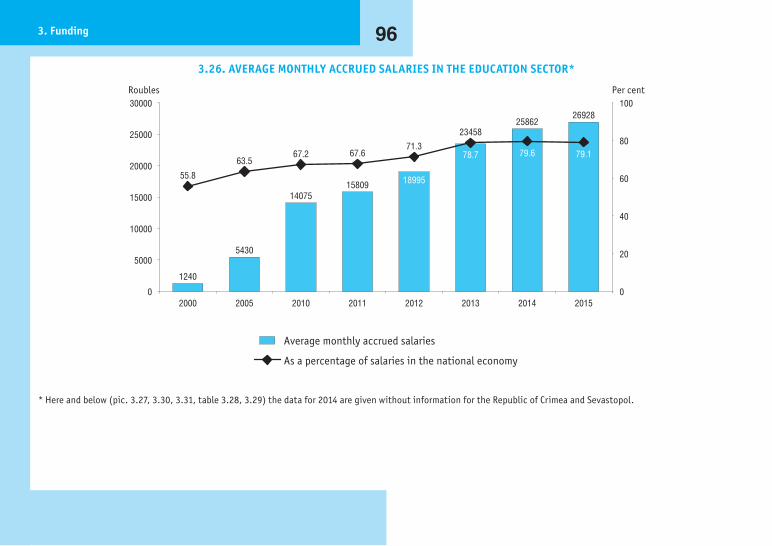
963. Funding
3.26. AVERAGE MONTHLY ACCRUED SALARIES IN THE EDUCATION SECTOR*
Roubles Per cent
Average monthly accrued salaries
As a percentage of salaries in the national economy
1240
5430
1407515809 18995
2345825862
26928
0
5000
10000
15000
20000
25000
30000
0
20
40
60
80
100
55.8
2000
63.5
2005
67.2
2010
67.6
2011
71.3
2012
78.7
2013
79.6
2014
79.1
2015
* Here and below (pic. 3.27, 3.30, 3.31, table 3.28, 3.29) the data for 2014 are given without information for the Republic of Crimea and Sevastopol.

97 Indicators of Education in the Russian Federation
3.27. REAL ACCRUED SALARIES IN THE EDUCATION SECTOR AND THE ECONOMY(as a percentage of the previous year)
Education
National economy
80
85
90
95
100
105
110
115
120114.7
99.1
103.6
114.4 115.7
102.2
90.4
112.6 105.2
102.8
108.4104.8
101.291.0
2005 2010 2011 2012 2013 2014 2015
3.28. AVERAGE MONTHLY ACCRUED SALARIES IN THE EDUCATION SECTOR BY OWNERSHIP(roubles)
2005 2010 2011 2012 2013 2014 2015
Total 5430 14075 15809 18995 23458 25862 26928Ownership:
public 7189 19974 22056 25707 30938 34406 36068municipal 4380 10682 12294 15258 19490 21665 22497private 9527 21430 22191 23733 27832 26425 28692non-profit-making and religious organisations (associations) 7449 15715 16361 17504 18388 19903 20314mixed (without foreign participation) 11075 22827 24698 27461 27513 29890 35812foreign, joint Russian and foreign 12758 33425 29006 35088 39260 39926 46102

983. Funding
3.29. AVERAGE MONTHLY ACCRUED SALARIES IN THE EDUCATION SECTOR BY TYPE OF ACTIVITY(roubles)
2005 2010 2011 2012 2013 2014 2015
Total 5430 14075 15809 18995 23458 25862 26928Preschool and primary general education 4235 10718 12103 14492 18577 20382 20958
Preschool education … 10222 11562 13919 18008 19407 19718Primary education … 10436 12115 15626 20000 21724 23454Supplementary education of children … 12722 14250 16649 20664 24020 25433
Basic general, secondary (complete) general, lower vocational, and secondary vocational education 5238 13898 15890 19797 24479 27007 28037
Basic general and secondary (complete) general education … 13566 15658 19735 24678 27162 28151Basic general education … 11347 13062 16525 20988 23289 23971Secondary (complete) general education … 13971 16129 20290 25298 27813 28838
Lower vocational and secondary vocational education … 15266 16856 20061 23601 26285 27483Lower vocational education … 12620 14139 16734 20060 22600 24745Secondary vocational education … 16702 18194 21453 24809 27144 27857
Higher education 8503 21319 23180 26321 31666 35503 38185Education of adults, and other education 6394 16426 17786 19861 20898 21736 27621

99 Indicators of Education in the Russian Federation
3.30. AVERAGE MONTHLY ACCRUED SALARIES IN THE EDUCATION SECTOR AS A PERCENTAGE OF SALARIES IN THE NATIONAL ECONOMY BY TYPE OF ACTIVITY
201520142010 20132012
0
20
40
60
80
100
120
48.8 52
.3 60.4
59.7
57.9
Preschool education
64.7
74.1 82
.8
83.6
82.7
Basic generaland secondary
(complete) generaleducation
60.2 62.8 67
.3 69.5 72
.7
Lowervocationaleducation
79.7
80.6 83.3
83.5
81.9
Secondaryvocationaleducation
101.
7
98.8 10
6.3
109.
3
112.
2
Highereducation
60.7
62.5 69
.4 73.9
74.7
Supplementary educationof children
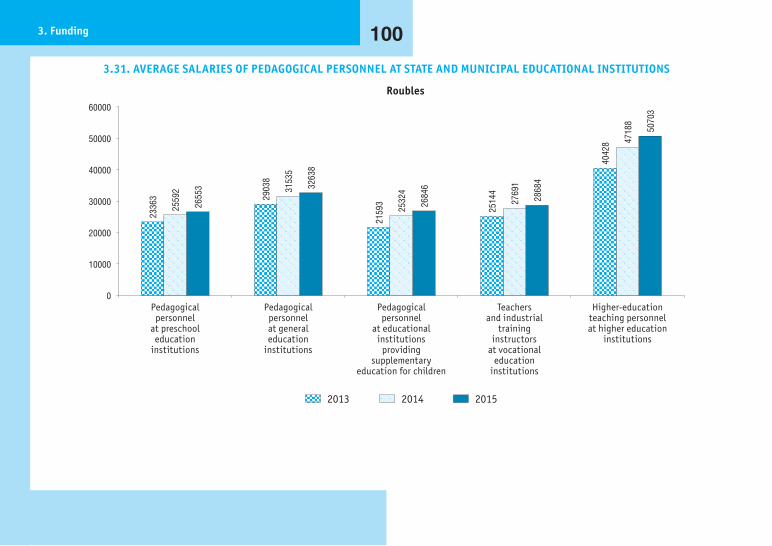
1003. Funding
3.31. AVERAGE SALARIES OF PEDAGOGICAL PERSONNEL AT STATE AND MUNICIPAL EDUCATIONAL INSTITUTIONS
Roubles
0
10000
20000
30000
40000
50000
60000
2336
3
2559
2
2655
3
Pedagogicalpersonnel
at preschooleducation
institutions
2903
8
3153
5
3263
8Pedagogicalpersonnelat generaleducation
institutions
2159
3
2532
4
2684
6
Pedagogicalpersonnel
at educationalinstitutions
providingsupplementary
education for children
2514
4
2769
1
2868
4
Teachersand industrial
traininginstructors
at vocationaleducation
institutions
4042
8 4718
8
5070
3
Higher-educationteaching personnelat higher education
institutions
201520142013

101 Indicators of Education in the Russian Federation
(continued)
As a percentage of the total salaries*
0
20
40
60
80
100
120
140
160
180
94.9
94.3
94.4
96.9
96.7 10
6.3
73.5 80
.6
83.4
83.9
84.9 93
.5
134.
9 144.
7
165.
2
201520142013
Pedagogicalpersonnel
at preschooleducation
institutions
Pedagogicalpersonnelat generaleducation
institutions
Pedagogicalpersonnel
at educationalinstitutions
providingsupplementary
education for children
Teachersand industrial
traininginstructors
at vocationaleducation
institutions
Higher-educationteaching personnelat higher education
institutions
* Since 2015 – average salaries of hired personnel of organisations, sole trades and individuals (average monthly income from working activity). The salaries of the pedagogical personnel at preschool education institutions as a percentage of the average salaries in the general education sector and the salaries of pedagogical personnel at educational institutions providing supplementary education for children as a percentage the average salaries of teachers.

1023. Funding
TECHNICAL NOTES
The consolidated budget of the Russian Federation com-prises the federal budget and the aggregate consolidated bud-gets of the Russian regions (excluding inter-budgetary transfers between these budgets).
The federal extra-budgetary funds are special funds that are not part of the federal or regional budgets of the Russian Federa-tion.
The federal budget is intended for the execution of liabilities of the Russian Federation.
The consolidated budget of a Russian region comprises a budget of a Russian region and the aggregate municipal budgets within the region (excluding inter-budgetary transfers between these budgets).
Budget expenditure (public expenditure) – monetary funds allocated for financial provision for objectives and functions of the state, regional and local governments.
Budget expenditure on education in the Russian Federation (public expenditure on education) stands for monetary funds al-located for financial provision for education. The related informa-tion is based on annual reports about the implementation of the consolidated budget of the Russian Federation and federal extra-budgetary funds according to section 0700 “Education”. Section 0700 “Education” includes 8 subsections and accumulates expen-diture on the task-oriented process of formation and education following the interests of the people, society and state.
Public expenditure on education growth rates at constant prices show the change in these expenses in the current year in comparison with the base-year at constant prices. In order to calculate public expenditure on education at current prices the GDP deflator is used.
Public expenditure on education per student by budgetary expenditure classification is estimated by dividing total public ex-penditure on each level of education by the number of students en-rolled in the corresponding level whose education is state funded. An estimated enrolment as a full-time equivalent is used for lower and secondary vocational education and higher education.
Fixed investment (or fixed capital investment) refers to the total expenses connected with the reconstruction (inclu-ding expansion and modernization) of facilities which lead to the increase of their original value; acquisition of machinery, equipment, vehicles, etc. Since 2013 fixed capital investment in-cludes investments into intellectual property: scientific, literary and artistic works: software programmes and computer devices databases, inventions, utility models, industrial designs, selec-tion inventions, incurred intangible search costs, R&D expen-diture, development expenditure, engineering costs, etc. Since 2001 fixed capital investment is calculated without VAT. Fixed capital investment growth rates are calculated at constant prices. For the sake of comparison the average constant prices of the pre-vious period are used.

103 Indicators of Education in the Russian Federation
The amount of paid services rendered to the population in the education system is the monetary equivalent of the fol-lowing services rendered to the population: children education and care at preschool education institutions, training on a fee basis at educational institutions of all forms of ownership, at paid courses, workshops, study (hobby) groups, studios at educational institutions, services of private tutors, services of day care camps at educational institutions and other services classified accord-ing to the National Classification of Services to the Population following subsection 11 “Services in the education system”. This indicator is calculated using the data of the federal state statistical observation and estimates of the invisible services market ( before and including 2012 – according to the procedure approved by Decree No. 15 of the State Statistics Committee ( Goskomstat) of the Russian Federation of February 25, 2000, since 2013 – using the methodology approved by order No. 234 of the Federal State Statistics Service (Rosstat) of June 26, 2013).
Growth rates of the amount of paid services rendered to the population in the education system at constant prices shows the change in the amount of those services in the current year as opposed to the base-year without taking into consideration price fluctuations.
Household budget surveys are conducted by the state sta-tistics authorities in all the regions of the Russian Federation as a sample survey including 48.5 thousand households. It is based upon voluntary participation. The survey programme is based on a journal of current expenditure kept by the households and
on the interviews with the household members when the account-ing period (which takes a quarter) of the survey is over.
Since 2001 the acquisition and processing of statistical data, characterising the level (rate) and structure of consumer expen-diture of households while conducting household budget surveys, is conducted on the basis of the Classification of Individual Con-sumption by Purpose (KIPTs-DH). The Classification was created by Rosstat on the basis of the Classification of Individual Con-sumption by Purpose (COICOP), which is one of the functional classifications of the United Nations System of National Accounts (UNSNA), which serves as a means of standard classification of household expenditure on personal needs.
A household refers to all individuals living in one dwelling or a part thereof who are either connected or not connected by kin-ship ties and who jointly provide themselves will all the neces-sities of life by pooling and spending their resources in full or in part. A household may consist of an individual living by him-self/herself.
Consumer expenditure of households is a part of the cash expenses allocated to the acquisition of consumer goods and ser-vices. These exclude expenditure on artwork, antiques and jewel-lery purchased as capital investment, spendings on materials and works connected with construction and major structural repairs of dwel lings and back rooms regarded as investments.
Expenditure of households on paid services in the educa-tion system comprises payment for preschool and primary edu-cation (payment for studying at primary schools, in preparatory

1043. Funding
groups of kindergartens and schools etc.), for secondary general education (payment for studying at secondary schools, gymna-sia, lyceum schools (including the payment for cleaning servic-es, attending extended-day groups (without meals), security, etc.), inclu ding secondary non-school-based education of young people and adults; for secondary vocational education (payment for the education); for higher education (payment for the educa-tion). The indicator also includes expenditure on education that is not specified by level, i.e. payment for educational services in vo-cational training (not requiring previous specialised education) and for other types of education such as courses in computer ba-sics, foreign languages or accounting courses, etc.
Average consumer prices (tariffs) for the Russian Federa-tion are calculated as a weighted average value of the price level by region of the Russian Federation taking into account the pro-portion of the population in the regions of the Russian Federation in the total population of Russia.
Consumer price (tariffs) index shows the relation between the cost of the fixed set of services at current prices and the cost thereof at the prices of the base-year and reflects temporal chan-ges in the overall price levels and in tariffs for services acquired by the population within unproductive consumption. The monitoring of the changes in prices (tariffs) is conducted in all the regions of the Russian Federation. The information concerning the prices is gathered in the capitals of the republics, territorial centers, provin ces, autonomous regions, autonomous districts, federal cities and in some selected regional centers.
Average monthly accrued salaries (average monthly nomi-nal accrued salaries) over a year are calculated by dividing the fund of accrued employee wages by the average annual num-ber of employees and by 12. The allowances obtained by the em-ployees from the state extra-budgetary funds are not included in the wages fund and in the average monthly salary.
Real accrued salaries characterise the purchasing power of salaries during the period under review in connection with the change in prices for consumer goods and services in compa-rison with the base period. The index of real accrued salaries is calculated by dividing the index of nominal accrued salary by the consumer price index during the same period of time.
Average salaries of pedagogical personnel at state and mu-nicipal educational institutions are calculated for the personnel on the payroll on the headcount basis by dividing the fund of ac-crued employee wages (excluding the wages fund of external mul-tiple jobholders (those employed on a plural basis) and wages fund of persons who are not on the institution payroll and are employed under civil law contracts) by the average number of listed em-ployees (headcount) (without external multiple jobholders (those employed on a plural basis) and persons employed under civil law contracts) and by the number of months in the period under re-view. The indicator also comprises the wages (salaries) of the per-sonnel working part-time on several positions (holding multiple jobs) within the institution (on internal secondary employment basis), and includes bonuses paid under civil law contracts con-cluded between the staff members and the institution.
4. Enrolment

1064. Enrolment
4.1. TRENDS IN THE NUMBER OF STUDENTS STUDYING WITHIN SELECTED EDUCATIONAL PROGRAMMES
Million persons
20152014201020052000
0
5
10
15
20
25
4.3 4.55.4
6.8 7.2
Educationalprogrammesof preschooleducation*
20.6
15.6
13.614.414.8
Primary general,basic general
and secondarygeneral education
programmes**
1.7 1.5 1.0 0.7 0.7
Secondary vocationaleducation – programmes
for skilled workers,junior techniciansand employees***
2.4 2.6 2.1 2.1 2.2
Secondary vocationaleducation –programmes
for mid-careerprofessionals
4.7
7.1 7.05.2 4.8
Higher education –bachelor's,specialist's
and master'sprogrammes
0.1 0.1 0.2 0.1 0.1
Higher education –postgraduateprogrammesfor academic
personne
* Including babies and children who only receive care. ** Excluding students studying in accordance with educational programmes of secondary general education within educational programmes of secondary vocational
education. *** Beginning with 2010 – including persons who studied under a contract, excluding those who studied less than 500 hours.

107 Indicators of Education in the Russian Federation
4.2. ENROLMENT IN INSTITUTIONS ENGAGED IN EDUCATIONAL ACTIVITIES WITHIN EDUCATIONAL PROGRAMMES OF PRESCHOOL EDUCATION, BABY AND CHILD CARE*
(at the end of the year)
2000 2005 2010 2011 2012 2013 2014 2015
Enrolment, thousand, headcount** 4263.0 4530.4 5388.0 5661.1 5982.9 6347.3 6813.6 7151.6Urban areas 3408.5 3611.0 4280.6 4502.4 4750.6 5037.1 5415.6 5693.8Rural areas 854.5 919.4 1107.3 1158.8 1232.2 1310.2 1398.0 1457.7
Participation of children in preschool education, as a percentage of all children aged 1–6 55.0 56.7 59.2 60.6 62.1 63.0 64.6 66.2
Urban areas 64.2 64.3 66.5 68.1 69.6 70.3 72.1 73.6
Rural areas 34.9 38.7 41.5 42.5 43.8 44.9 46.1 47.7
* Since 2014, in the number of institutions engaged in educational activities within educational programmes of preschool education, baby and child care besides preschool education and general education institutions are included educational institutions for supplementary education, vocational education institutions, higher education institutions and other institutions.
** Here and below – including babies and children who only receive care.

1084. Enrolment
4.3. ENROLMENT IN INSTITUTIONS ENGAGED IN EDUCATIONAL ACTIVITIES WITHIN EDUCATIONAL PROGRAMMES OF PRESCHOOL EDUCATION, BABY AND CHILD CARE BY GROUP: 2015
(at the end of the year)
Total, headcount Of which children with limited health capacities
headcount per cent
Total 7151553 343591 100General groups 6327248 40793 11.9Compensatory groups 411036 269946 78.6Including the following categories of children:
with hearing impairment 6062 4174 1.2with speech impediment 292505 175290 51.0with visual impairment 34346 27125 7.9
with mental development disorder 6206 5891 1.7with mental retardation 32099 28346 8.2with muscle-skeleton disorder 26921 19653 5.7with multiple special needs 5212 4750 1.4other 7685 4717 1.4
Health groups 90791 4676 1.4Of which for:children with tuberculous intoxication 26021 2841 0.8sickly children 33198 548 0.2
Combined groups 130096 27200 7.9Groups for young children (babies) 142794 433 0.1Baby and child care groups 31114 253 0.1Family preschool groups 18474 290 0.1

109 Indicators of Education in the Russian Federation
4.4. ENROLMENT IN INSTITUTIONS ENGAGED IN EDUCATIONAL ACTIVITIES WITHIN EDUCATIONAL PROGRAMMES OF PRESCHOOL EDUCATION, BABY AND CHILD CARE BY GENDER AND AGE: 2015
(at the end of the year; full years as of January, 1; thousand, headcount)
Total Age, years
Below 1 year 1 2 3 4 5 6 7 and over
Total 7151.6 1.6 138.2 921.8 1518.0 1521.2 1531.5 1390.8 128.4Male 3708.6 0.8 72.2 478.5 783.3 785.9 792.9 721.7 73.2Female 3442.9 0.8 66.0 443.3 734.7 735.4 738.6 669.0 55.2
4.5. ATTENDANCE AT INSTITUTIONS ENGAGED IN EDUCATIONAL ACTIVITIES WITHIN EDUCATIONAL PROGRAMMES OF PRESCHOOL EDUCATION, BABY AND CHILD CARE
2010 2011 2012 2013 2014 2015
Attendance of students, million days 835.5 882.2 900.4 996.7 1019.5 1082.8Absence of students, million days 360.3 375.7 406.6 424.9 467.5 499.6
Due to illness 79.4 86.0 90.9 97.1 108.0 113.1Due to other reasons 280.9 289.7 315.7 327.8 359.5 386.5
Number of days missed due to the illness per child 15.6 15.8 15.8 16.0 17.0 15.9Attendance ratio, per cent 65.7 65.4 62.7 66.3 64.9 61.6

1104. Enrolment
4.6. NUMBER OF CHILDREN ATTENDING SHORT-TERM GROUPS(at the end of the year)
Per centThousand, headcount
Number of children attending short-term groups
As a percentage of the total enrolment in institutions engaged in educational activities within educational programmes of preschool education, baby and child care
0
20
40
60
80
100
120
140
160
180
200
0
0.5
1.0
1.5
2.0
2.5
3.0
1.1
2003
1.6
2005
2.3
2010
1.8
2011
2.3
2012
2.3
2013
2.4
2014
2.4
2015
48.370.7
126.2103.7
138.4 147.4160.6
173.5

111 Indicators of Education in the Russian Federation
4.7. GENERAL EDUCATION ENROLMENT(at the beginning of the academic year; thousand, headcount)
2000/2001 2005/2006 2010/2011 2011/2012 2012/2013 2013/2014 2014/2015 2015/2016
Total 20553.5 15630.9 13642.4 13737.8 13804.5 13877.4 14398.9 14770.4General education institutions (excluding part-time (shift) general education institutions) 20073.8 15185.1 13317.7 13445.8 13537.3 13643.2 14191.6 14596.3
State and municipal institutions 20013.3 15112.8 13244.2 13362.3 13445.4 13548.3 14091.6 14491.8in urban areas 13998.0 10496.8 9501.9 9689.8 9835.0 9980.0 10406.1 10765.7in rural areas 6015.2 4615.9 3742.3 3672.4 3610.4 3568.3 3685.5 3726.1
Private institutions 60.6 72.3 73.5 83.5 91.9 94.9 99.9 104.5in urban areas … … 68.8 78.0 86.4 88.8 92.9 96.7in rural areas … … 4.7 5.5 5.5 6.1 7.0 7.8
Part-time (shift) general education institutions 479.6 445.8 324.7 292.0 267.2 234.3 207.3 174.1in urban areas 391.1 347.9 259.4 232.8 211.1 187.7 168.7 145.3in rural areas 88.6 97.8 65.3 59.2 56.1 46.6 38.6 28.7

1124. Enrolment
4.8. PARTICIPATION OF CHILDREN AND ADOLESCENTS IN PROGRAMMES OF PRIMARY EDUCATION, BASIC AND SECONDARY GENERAL EDUCATION
(the proportion of the number of 1–11 (12) grade students at general education institutions and the number of students studying in accordance with general education programmes of secondary general education within educational programmes
of secondary vocational education to the number of children aged 7–17)
Per cent
0
10
20
30
40
50
60
70
80
90
100
110
91.6
2000
92.9
2005
98.6
2010
99.6
2011
100.3
2012
100.2
2013
100.8
2014
100.5
2015

113 Indicators of Education in the Russian Federation
4.9. ENROLMENT IN GENERAL EDUCATION INSTITUTIONS (EXCLUDING PART-TIME (SHIFT) GENERAL EDUCATION INSTITUTIONS) BY GENDER AND AGE: 2015/2016*
(at the beginning of the academic year; full years as of January, 1; thousand, headcount)
Total Age, years
5 6 7 8 9 10 11 12 13 14 15 16 17 18 and over
TotalTotal 14250.1 7.5 183.4 1567.9 1589.6 1458.9 1428.4 1467.3 1436.8 1375.9 1288.7 1165.4 713.0 523.7 43.5Male 7184.3 3.6 88.1 794.6 812.2 742.9 725.8 746.7 731.0 699.7 655.4 589.1 335.3 238.4 21.6Female 7065.8 3.9 95.3 773.3 777.4 716.1 702.6 720.6 705.9 676.3 633.3 576.2 377.7 285.3 21.9
State and municipal institutionsTotal 14145.7 7.2 180.8 1556.1 1577.1 1447.4 1417.6 1457.7 1427.6 1367.2 1280.3 1157.6 706.8 519.2 43.0Male 7129.2 3.4 86.8 788.5 805.6 736.8 720.1 741.7 726.1 695.0 650.9 584.9 332.0 236.1 21.3Female 7016.5 3.8 94.0 767.5 771.5 710.6 697.5 716.0 701.5 672.2 629.4 572.6 374.9 283.1 21.7
Private institutionsTotal 104.4 0.3 2.6 11.9 12.5 11.5 10.9 9.6 9.3 8.7 8.3 7.8 6.1 4.5 0.5Male 55.1 0.2 1.3 6.1 6.6 6.1 5.7 5.0 4.9 4.7 4.5 4.2 3.3 2.3 0.3Female 49.3 0.1 1.3 5.8 5.9 5.5 5.1 4.6 4.4 4.1 3.8 3.6 2.8 2.2 0.2
* Excluding general education institutions or classes (groups) for students with limited health capacities; specialized (correctional) educational institutions for students with deviant (socially dangerous) behavior; sanatorium educational institutions for students who need long-term medical care; educational institutions for students who need psycho-pedagogical and medico-social assistance.

1144. Enrolment
4.10. ENROLMENT IN GENERAL EDUCATION INSTITUTIONS (EXCLUDING PART-TIME (SHIFT) GENERAL EDUCATION INSTITUTIONS) BY GRADE*
(at the beginning of the academic year; thousand, headcount)
2000/2001 2005/2006 2010/2011 2011/2012 2012/2013 2013/2014 2014/2015 2015/2016
TotalTotal 19560.2 14755.4 12970.1 13104.2 13195.8 13303.4 13848.8 14250.1Grades:
1–4 5702.3 5164.7 5318.3 5514.8 5651.7 5725.5 5982.6 6198.85–9 11076.5 7131.3 6205.5 6095.0 6119.6 6238.3 6548.8 6780.610–11(12) 2781.3 2459.4 1446.3 1494.3 1424.4 1339.6 1317.4 1270.7
State and municipal institutionsTotal 19499.7 14683.1 12896.6 13020.8 13104.1 13208.6 13748.9 14145.7Grades:
1–4 5682.4 5136.1 5285.0 5477.4 5609.4 5681.4 5936.0 6149.65–9 11047.9 7102.1 6174.9 6060.6 6082.2 6199.2 6507.3 6737.210–11(12) 2769.4 2444.8 1436.7 1482.8 1412.5 1328.0 1305.7 1258.9
Private institutionsTotal 60.6 72.3 73.5 83.4 91.8 94.8 99.9 104.4Grades:
1–4 20.0 28.6 33.3 37.4 42.4 44.1 46.6 49.25–9 28.7 29.1 30.6 34.5 37.4 39.1 41.5 43.410–11(12) 12.0 14.6 9.6 11.6 12.0 11.6 11.8 11.8
* Excluding general education institutions or classes (groups) for students with limited health capacities; specialized (correctional) educational institutions for students with deviant (socially dangerous) behavior; sanatorium educational institutions for students who need long-term medical care; educational institutions for students who need psycho-pedagogical and medico-social assistance (for private institutions – since 2011/2012 academic year).

115 Indicators of Education in the Russian Federation
4.11. GENERAL EDUCATION ENROLMENT OF PEOPLE WITH LIMITED HEALTH CAPACITIES, DISABLED CHILDREN AND DISABLED PEOPLE(at the beginning of the academic year)
2012/2013 2014/2015 2015/2016
People with limited health capacities
Disabled children and disabled people
People with limited health capacities
Disabled children and disabled people
People with limited health capacities
Disabled children and disabled people
Thousand, headcount
As a per-centage
of the total enrolment
Thousand, headcount
As a per-centage
of the total enrolment
Thousand, headcount
As a per-centage
of the total enrolment
Thousand, headcount
As a per-centage
of the total enrolment
Thousand, headcount
As a per-centage
of the total enrolment
Thousand, headcount
As a per-centage
of the total enrolment
Total 407.4 3.0 225.8 1.6 455.5 3.2 235.5 1.6 507.1 3.4 250.5 1.7General education institutions (excluding part-time (shift) general education institutions) 406.0 3.0 224.1 1.7 454.5 3.2 234.3 1.7 505.9 3.5 249.2 1.7
State and municipal institutions 405.5 3.0 223.3 1.7 453.9 3.2 233.7 1.7 505.3 3.5 248.3 1.7Private institutions 0.5 0.5 0.8 0.8 0.6 0.6 0.6 0.6 0.6 0.5 0.8 0.8
Part-time (shift) general education institutions 1.5 0.6 1.7 0.6 1.0 0.5 1.2 0.6 1.2 0.7 1.4 0.8

1164. Enrolment
4.12. ENROLMENT OF PEOPLE WITH LIMITED HEALTH CAPACITIES, DISABLED CHILDREN AND DISABLED PEOPLE IN GENERAL EDUCATION INSTITUTIONS (EXCLUDING PART-TIME (SHIFT) GENERAL EDUCATION INSTITUTIONS) IN CLASSES (GROUPS)
THAT ARE NOT SPECIAL CLASSES (GROUPS) FOR THOSE SDUDYING ACTIVITIES IN ACCORDANCE WITH ADAPTED BASIC GENERAL EDUCATION PROGRAMMES*
(at the beginning of the academic year)
2012/2013 2014/2015 2015/2016
Total State and municipal
institutions
Private institutions
Total State and municipal
institutions
Private institutions
Total State and municipal
institutions
Private institutions
People with limited health capacities:thousand, headcount 139.3 138.9 0.4 159.7 159.1 0.6 174.3 173.9 0.5as a percentage of the total enrolment of students with limited health capacities 34.3 34.3 88.0 35.1 35.1 100 34.5 34.4 82.3
Disabled children and disabled people:thousand, headcount 135.0 134.2 0.8 139.2 138.5 0.6 146.0 145.2 0.8as a percentage of the total enrolment of disabled children and disabled people 60.2 60.1 99.0 59.4 59.3 100 58.6 58.5 95.5
* Excluding general education institutions for students with limited health capacities; specialized (correctional) educational institutions for students with deviant (socially dangerous) behavior; sanatorium educational institutions for students who need long-term medical care; educational institutions for students who need psycho-pedagogical and medico-social assistance.

117 Indicators of Education in the Russian Federation
4.13. ENROLMENT OF PEOPLE WITH LIMITED HEALTH CAPACITIES, DISABLED CHILDREN AND DISABLED PEOPLE, WHO ARE TUTORED AT HOME
(at the beginning of the academic year; headcount)
2012/2013 2014/2015 2015/2016
Total Of which those using distance
learning technology
Total Of which those using distance
learning technology
Total Of which those using distance
learning technology
People with limited health capacities:General education institutions (excluding part-time (shift) general education institutions) 43579 3709 49666 4174 52526 4286
state and municipal institutions 43550 3707 49636 4173 52499 4279private institutions 29 2 30 1 27 7
Disabled children and disabled people:General education institutions (excluding part-time (shift) general education institutions) 67985 13654 72605 14423 75172 13222
state and municipal institutions 67942 13648 72550 14414 75127 13216private institutions 43 6 55 9 45 6

1184. Enrolment
4.14. ENROLMENT IN STATE AND MUNICIPAL SPECIAL GENERAL EDUCATION INSTITUTIONS AND CLASSES (GROUPS) FOR STUDENTS WITH LIMITED HEALTH CAPACITIES
(at the beginning of the academic year; thousand, headcount)
2000/2001 2005/2006 2010/2011 2011/2012 2012/2013 2013/2014 2014/2015 2015/2016
Special general education institutions 281.3 236.1 207.7 208.9 211.1 210.2 212.2 213.4Of which for the following categories of children:
mentally disadvantaged 203.7 162.3 139.4 138.4 140.5 140.6 141.3 143.3blind 3.0 2.4 2.3 2.3 2.2 2.4 2.4 2.4visually impaired and late blind 10.3 10.8 11.1 11.1 11.4 11.1 11.2 11.6deaf 10.8 9.1 7.2 7.0 6.5 6.6 6.6 6.6hearing-impaired and late hearing-impaired 10.5 9.9 9.0 9.7 9.9 10.1 10.2 10.1with musculoskeletal system disorders 9.3 9.0 8.0 8.0 7.8 7.2 7.6 8.0with severe speech pathology 11.5 10.6 9.6 9.6 9.9 10.0 11.0 10.0with mental retardation 19.2 19.3 18.7 19.9 19.6 19.5 19.4 19.0individual tutoring at home for disabled children 3.0 2.8 2.3 2.8 3.1 2.7 2.6 2.6
Special classes (groups) within general education institutions 228.7 188.8 119.8 111.7 109.4 110.2 110.3 114.1
Of which for the following categories of children:mentally disadvantaged 24.2 26.7 22.6 21.8 23.2 25.0 26.2 30.6with mental retardation 202.2 149.0 86.8 80.2 76.2 75.5 74.0 72.1

119 Indicators of Education in the Russian Federation
4.15. GENERAL EDUCATION STUDENTS WHO HAVE SUCCESSFULLY COMPLETED THEIR SCHOOL EDUCATION(thousand, headcount)
2000 2005 2010 2011 2012 2013 2014 2015
Students who have received a certificate of basic general educationTotal 2199.5 1944.1 1354.1 1321.8 1249.7 1220.3 1223.2 1198.3General education institutions (excluding part-time (shift) general education institutions) 2132.7 1875.8 1308.3 1277.6 1207.7 1181.3 1196.3 1170.8
State and municipal institutions 2128.0 1868.5 1302.8 1270.4 1200.5 1174.2 1188.9 1163.3in urban areas 1529.0 1311.8 899.8 894.9 847.7 831.9 845.7 831.7in rural areas 599.1 556.8 403.1 375.5 352.8 342.3 343.2 331.6
Private institutions 4.7 7.3 5.5 7.2 7.2* 7.2* 7.4* 7.5*Part-time (shift) general education institutions** 66.8 68.3 45.8 44.2 42.1 39.0 26.9 27.4
Students who have received a certificate of secondary (complete) general educationTotal 1457.8 1466.0 789.3 702.7 765.8 735.2 701.4 647.8General education institutions (excluding part-time (shift) general education institutions) 1322.0 1319.7 724.0 645.0 715.5 690.5 659.7 614.2
State and municipal institutions 1317.2 1312.1 719.6 639.6 709.2 684.4 653.4 608.4in urban areas 952.0 956.0 509.1 444.7 517.2 506.7 488.7 466.2in rural areas 365.2 356.1 210.4 194.9 192.0 177.7 164.7 142.2
Private institutions 4.8 7.6 4.5 5.4 6.3* 6.1* 6.3* 5.8*Part-time (shift) general education institutions** 135.8 146.3 65.2 57.7 50.3 44.7 41.7 33.6
* Including students who have completed studies externally at private general education institutions. ** Including students who have completed studies externally at state and municipal general education institutions.

1204. Enrolment
4.16. NUMBER OF CHILDREN AND ADOLESCENTS AGED 7–18 NOT STUDYING AT EDUCATIONAL INSTITUTIONS DUE TO VARIOUS REASONS*(as of October, 1)
2003 2005 2010 2011 2012 2013 2014 2015
Total Male Female
Number of children and adolescents not studying at educational institutions, headcount 40579 27960 34833 29998 30387 26291 24139 23287 14339 8948Of which
for health reasons 24350 19242 18731 17515 16943 16136 15438 13940 8637 5303those who never studied (excluding those unable to study for health reasons) 2252 1253 630 448 435 374 264 345 212 133those who dropped out of institutions implementing educational programmes of primary general, basic general and secondary general education 9539 5938 6975 5167 4677 3895 3585 3043 1847 1196those who dropped out vocational education institutions implementing educational programmes of secondary vocational education for skilled workers, junior technicians and employees and decided not to continue their education 2869 1034 4071 3047 2679 1994 1110 612 418 194those who dropped out vocational education institutions implementing educational programmes of secondary vocational education for mid-career professionals and decided not to continue their education 1569 493 4426 3821 5653 3892 3742 5347 3225 2122
As a percentage of the total enrolment of children and adolescents of a respective age 0.238 0.188 0.200 0.176 0.181 0.157 0.145 0.134 0.161 0.105
* The data for 2003, 2005 – for the age group including those aged 7–15.

121 Indicators of Education in the Russian Federation
4.17. PERCENTAGE DISTRIBUTION OF CHILDREN AND ADOLESCENTS AGED 7–18 NOT STUDYING AT EDUCATIONAL INSTITUTIONS BY GENDER AND AGE: 2015
(as of October, 1)
Per cent Per cent Per cent
Total Male FemaleAge, years Age, years Age, years
0 5 10 15 20
12.7
7
15.6
8
16.1
9
9.5
10
6.4
11
5.9
12 6.0
13
6.1
14
5.8
15
5.3
16
5.1
17
5.3
18
0 5 10 15 20
12.9
7
15.7
8
16.2
9
9.0
10
6.4
11
5.9
12 6.0
13
6.1
14
5.9
15
5.5
16
5.0
17
5.4
18
0 5 10 15 20
12.4
7
15.6
8
16.0
9
10.2
10
6.5
11
5.9
12 6.1
13
6.1
14
5.8
15
5.1
16
5.3
17
5.1
18

1224. Enrolment
4.18. ENROLMENT IN EDUCATIONAL INSTITUTIONS OF SUPPLEMENTARY EDUCATION IMPLEMENTING SUPPLEMENTARY GENERAL EDUCATION PROGRAMMES FOR CHILDREN
(thousand, headcount)
2000 2005 2010 2011 2012 2013 2014 2015
Enrolment in educational institutions of supplementary education implementing supplementary general education programmes for children* 7905.8 8443.7 8083.3 7853.4 7976.5 8881.6 9617.2 11010.0Enrolment in sports schools** 866.2 1097.3 1455.7 1674.3 1782.4 1860.6 1981.3 2000.5Enrolment in children’s music, art, choreographic schools and schools of fine arts*** 1284.5 1280.9 1433.0 1446.6 1442.5 1458.6 1496.6 1533.4
* According to the Ministry of Education and Science of the Russian Federation; since 2010 – including children studying at scientific societies. ** According to the Ministry of Sports and Tourism of the Russian Federation. *** According to the Ministry of Culture of the Russian Federation; 2014 г. – without information for the Republic of Crimea and Sevastopol.
4.19. SECONDARY VOCATIONAL EDUCATION ENROLMENT: PROGRAMMES FOR SKILLED WORKERS, JUNIOR TECHNICIANS AND EMPLOYEES*(at the end of the year)
2000 2005 2010 2011 2012 2013 2014 2015
Enrolment, thousand, headcount 1679.3 1509.4 1006.6 921.0 838.0 774.2 727.3 686.1of whom female 642.0 541.2 345.0 311.3 278.5 249.7 224.3 208.6
Enrolment per 10 000 population, thousand, headcount 115 105 70 64 58 54 50 47
* Here and below since 2010 – including students studying according to commercial contracts except for those studying according to short-term (less than 500 hours) programmes.
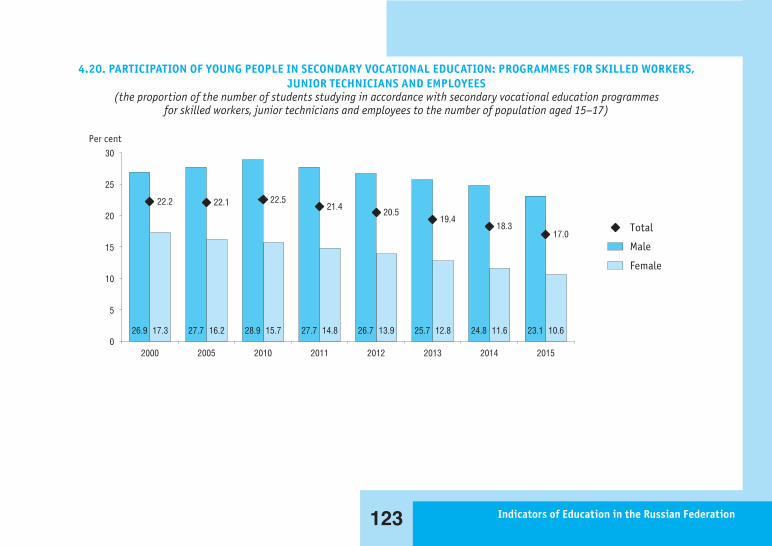
123 Indicators of Education in the Russian Federation
4.20. PARTICIPATION OF YOUNG PEOPLE IN SECONDARY VOCATIONAL EDUCATION: PROGRAMMES FOR SKILLED WORKERS, JUNIOR TECHNICIANS AND EMPLOYEES
(the proportion of the number of students studying in accordance with secondary vocational education programmes for skilled workers, junior technicians and employees to the number of population aged 15–17)
Female
Male
Total
Per cent
0
5
10
15
20
25
30
26.9 17.3
2000
27.7 16.2
2005
28.9 15.7
2010
27.7 14.8
2011
26.7 13.9
2012
25.7 12.8
2013
24.8 11.6
2014
23.1 10.6
2015
22.2 22.1 22.521.4
20.519.4
18.317.0

1244. Enrolment
4.21. SECONDARY VOCATIONAL EDUCATION ENROLMENT: PROGRAMMES FOR SKILLED WORKERS, JUNIOR TECHNICIANS AND EMPLOYEES BY AGE*
(at the end of the year; headcount)
Total Age, years
14 and below
15 16 17 18 19 20 21 22 23 24–29 30 and over
2011Total 920959 2328 32726 162844 234233 198895 101098 52602 28662 17693 12752 33901 40983Including those who study:
at the expense of a founder’s budget 892668 2309 32315 159723 229804 193843 98063 50052 26839 16323 11717 31193 38436under contracts 28291 19 411 3121 4429 5052 3035 2550 1823 1370 1035 2708 2547
2015Total 686120 913 21516 122871 172203 149206 68768 30215 19218 12581 9744 31882 44668Including those who study:
at the expense of a founder’s budget 670028 897 21138 119961 168829 146531 67397 29341 18737 12146 9342 30437 43044under contracts 16094 16 378 2910 3374 2675 1371 874 481 435 402 1445 1624
* Figures may not add up to the total due to persons whose age is unknown.

125 Indicators of Education in the Russian Federation
4.22. SECONDARY VOCATIONAL EDUCATION ENROLMENT (PROGRAMMES FOR SKILLED WORKERS, JUNIOR TECHNICIANS AND EMPLOYEES) OF PEOPLE WITH LIMITED HEALTH CAPACITIES, DISABLED CHILDREN AND DISABLED PEOPLE
(at the end of the year)
Total Of whom studying
at the expense of a founder’s budget under contracts
2011People with limited health capacities
headcount 28913 28701 212as a percentage of the total enrolment 3.1 3.2 0.7
Disabled children, disabled peopleheadcount 9417 9335 82as a percentage of the total enrolment 1.0 1.0 0.3
2015People with limited health capacities
headcount 27580 27508 72as a percentage of the total enrolment 4.0 4.1 0.4
Disabled children, disabled peopleheadcount 9996 9950 46as a percentage of the total enrolment 1.5 1.5 0.3
4.23. SECONDARY VOCATIONAL EDUCATION ENTRANTS: PROGRAMMES FOR SKILLED WORKERS, JUNIOR TECHNICIANS AND EMPLOYEES
2000 2005 2010 2011 2012 2013 2014 2015
Entrants, thousand, headcount 844.9 687.8 609.4 532.5 499.2 451.3 415.6 395.6As a percentage of the total population aged 15 (entrants ratio) 34.2 32.0 42.3 39.1 38.6 33.9 32.0 28.8
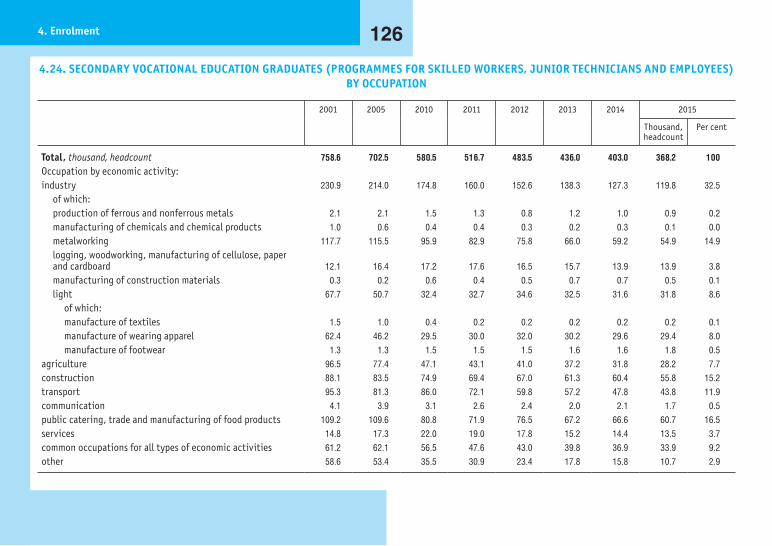
1264. Enrolment
4.24. SECONDARY VOCATIONAL EDUCATION GRADUATES (PROGRAMMES FOR SKILLED WORKERS, JUNIOR TECHNICIANS AND EMPLOYEES) BY OCCUPATION
2001 2005 2010 2011 2012 2013 2014 2015
Thousand, headcount
Per cent
Total, thousand, headcount 758.6 702.5 580.5 516.7 483.5 436.0 403.0 368.2 100Occupation by economic activity:industry 230.9 214.0 174.8 160.0 152.6 138.3 127.3 119.8 32.5
of which:production of ferrous and nonferrous metals 2.1 2.1 1.5 1.3 0.8 1.2 1.0 0.9 0.2manufacturing of chemicals and chemical products 1.0 0.6 0.4 0.4 0.3 0.2 0.3 0.1 0.0metalworking 117.7 115.5 95.9 82.9 75.8 66.0 59.2 54.9 14.9logging, woodworking, manufacturing of cellulose, paper and cardboard 12.1 16.4 17.2 17.6 16.5 15.7 13.9 13.9 3.8manufacturing of construction materials 0.3 0.2 0.6 0.4 0.5 0.7 0.7 0.5 0.1light 67.7 50.7 32.4 32.7 34.6 32.5 31.6 31.8 8.6
of which:manufacture of textiles 1.5 1.0 0.4 0.2 0.2 0.2 0.2 0.2 0.1manufacture of wearing apparel 62.4 46.2 29.5 30.0 32.0 30.2 29.6 29.4 8.0manufacture of footwear 1.3 1.3 1.5 1.5 1.5 1.6 1.6 1.8 0.5
agriculture 96.5 77.4 47.1 43.1 41.0 37.2 31.8 28.2 7.7construction 88.1 83.5 74.9 69.4 67.0 61.3 60.4 55.8 15.2transport 95.3 81.3 86.0 72.1 59.8 57.2 47.8 43.8 11.9communication 4.1 3.9 3.1 2.6 2.4 2.0 2.1 1.7 0.5public catering, trade and manufacturing of food products 109.2 109.6 80.8 71.9 76.5 67.2 66.6 60.7 16.5services 14.8 17.3 22.0 19.0 17.8 15.2 14.4 13.5 3.7common occupations for all types of economic activities 61.2 62.1 56.5 47.6 43.0 39.8 36.9 33.9 9.2other 58.6 53.4 35.5 30.9 23.4 17.8 15.8 10.7 2.9
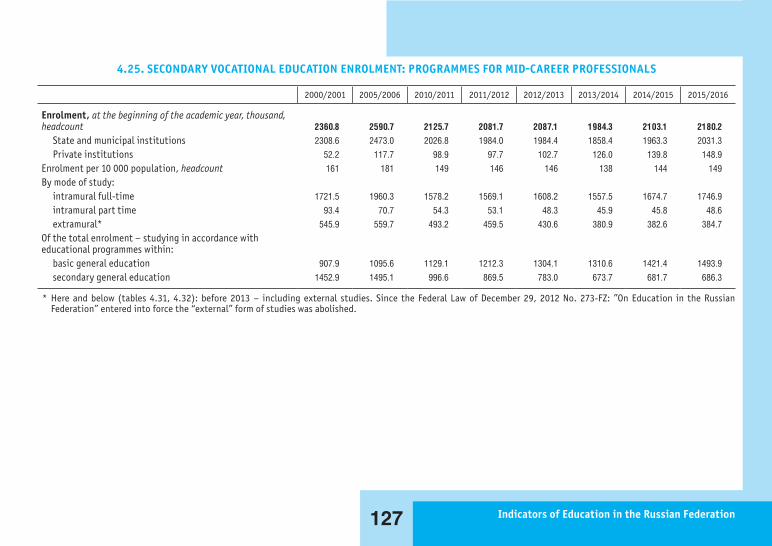
127 Indicators of Education in the Russian Federation
4.25. SECONDARY VOCATIONAL EDUCATION ENROLMENT: PROGRAMMES FOR MID-CAREER PROFESSIONALS
2000/2001 2005/2006 2010/2011 2011/2012 2012/2013 2013/2014 2014/2015 2015/2016
Enrolment, at the beginning of the academic year, thousand, headcount 2360.8 2590.7 2125.7 2081.7 2087.1 1984.3 2103.1 2180.2
State and municipal institutions 2308.6 2473.0 2026.8 1984.0 1984.4 1858.4 1963.3 2031.3Private institutions 52.2 117.7 98.9 97.7 102.7 126.0 139.8 148.9
Enrolment per 10 000 population, headcount 161 181 149 146 146 138 144 149By mode of study:
intramural full-time 1721.5 1960.3 1578.2 1569.1 1608.2 1557.5 1674.7 1746.9intramural part time 93.4 70.7 54.3 53.1 48.3 45.9 45.8 48.6extramural* 545.9 559.7 493.2 459.5 430.6 380.9 382.6 384.7
Of the total enrolment – studying in accordance with educational programmes within:
basic general education 907.9 1095.6 1129.1 1212.3 1304.1 1310.6 1421.4 1493.9secondary general education 1452.9 1495.1 996.6 869.5 783.0 673.7 681.7 686.3
* Here and below (tables 4.31, 4.32): before 2013 – including external studies. Since the Federal Law of December 29, 2012 No. 273-FZ: ”On Education in the Russian Federation” entered into force the “external” form of studies was abolished.

1284. Enrolment
4.26. PARTICIPATION OF YOUNG PEOPLE IN SECONDARY VOCATIONAL EDUCATION: PROGRAMMES FOR MID-CAREER PROFESSIONALS BY GENDER
(the proportion of the number of students studying in accordance with secondary vocational education programmes for mid-career professionals to the number of population aged 15–19)
0
5
10
15
20
25
30
35
17.0 21.4 21.0 22.7 25.1 26.6 27.6 27.0 29.2 29.1 28.6 28.5 30.4 31.2 31.7 33.1
19.2
21.9
25.827.3
29.2 28.530.8
32.4
Per cent
2000 2005 2010 2011 2012 2013 2014 2015
Female
Male
Total
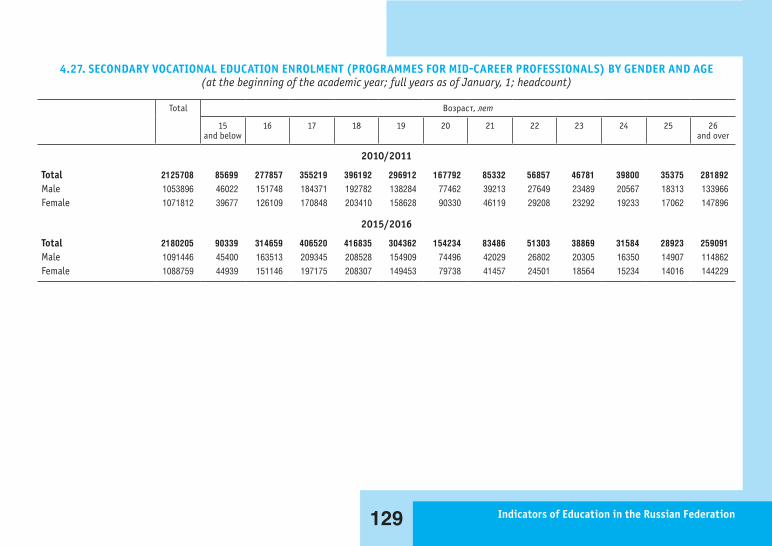
129 Indicators of Education in the Russian Federation
4.27. SECONDARY VOCATIONAL EDUCATION ENROLMENT (PROGRAMMES FOR MID-CAREER PROFESSIONALS) BY GENDER AND AGE(at the beginning of the academic year; full years as of January, 1; headcount)
Total Возраст, лет
15 and below
16 17 18 19 20 21 22 23 24 25 26 and over
2010/2011
Total 2125708 85699 277857 355219 396192 296912 167792 85332 56857 46781 39800 35375 281892Male 1053896 46022 151748 184371 192782 138284 77462 39213 27649 23489 20567 18313 133966Female 1071812 39677 126109 170848 203410 158628 90330 46119 29208 23292 19233 17062 147896
2015/2016
Total 2180205 90339 314659 406520 416835 304362 154234 83486 51303 38869 31584 28923 259091Male 1091446 45400 163513 209345 208528 154909 74496 42029 26802 20305 16350 14907 114862Female 1088759 44939 151146 197175 208307 149453 79738 41457 24501 18564 15234 14016 144229

1304. Enrolment
4.28. PERCENTAGE DISTRIBUTION OF SECONDARY VOCATIONAL EDUCATION ENROLMENT (PROGRAMMES FOR MID-CAREER PROFESSIONALS) BY MODE OF STUDY: 2015/2016
(at the beginning of the academic year)
0 20 40 60 80 100
2.2
17.7Total
2.3
17.2Stateand municipal
institutions
1.0
24.2Privateinstitutions
Per cent
Mode of study:
intramural full-time extramuralintramural part-time
80.1
80.5
74.8

131 Indicators of Education in the Russian Federation
4.29. SECONDARY VOCATIONAL EDUCATION ENROLMENT (PROGRAMMES FOR MID-CAREER PROFESSIONALS) OF PEOPLE WITH LIMITED HEALTH CAPACITIES, DISABLED CHILDREN AND DISABLED PEOPLE: 2015/2016
(at the beginning of the academic year)
Total State and municipal institutions
Private institutions
People with limited health capacities:headcount 5647 5576 71as a percentage of total enrolment 0.3 0.3 0.0
of which those studying in accordance with adapted educational programmes:headcount 976 969 7as a percentage of the total enrolment of students with limited health capacities 17.3 17.4 9.9
Disabled children, disabled people:headcount 14788 14218 570as a percentage of total enrolment 0.7 0.7 0.4
of which those studying in accordance with adapted educational programmes:headcount 2041 2030 11as a percentage of the total enrolment of disabled children and disabled people 13.8 14.3 1.9
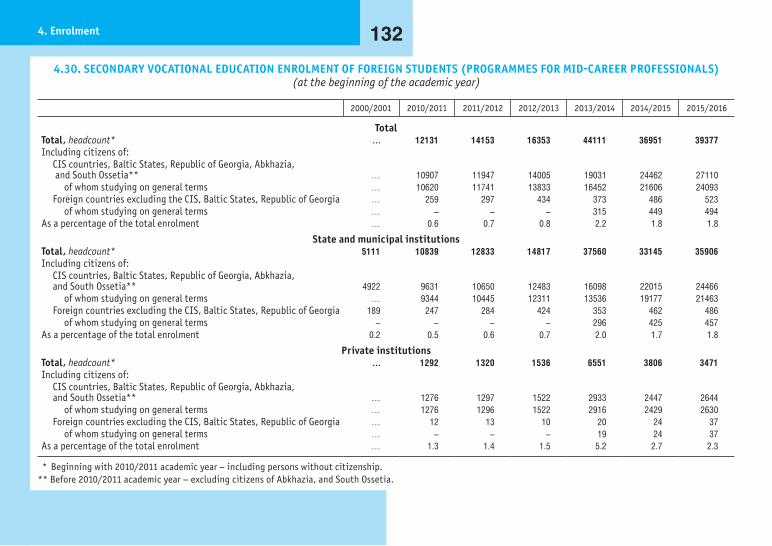
1324. Enrolment
4.30. SECONDARY VOCATIONAL EDUCATION ENROLMENT OF FOREIGN STUDENTS (PROGRAMMES FOR MID-CAREER PROFESSIONALS)(at the beginning of the academic year)
2000/2001 2010/2011 2011/2012 2012/2013 2013/2014 2014/2015 2015/2016
TotalTotal, headcount* … 12131 14153 16353 44111 36951 39377Including citizens of:
CIS countries, Baltic States, Republic of Georgia, Abkhazia, and South Ossetia** … 10907 11947 14005 19031 24462 27110
of whom studying on general terms … 10620 11741 13833 16452 21606 24093Foreign countries excluding the CIS, Baltic States, Republic of Georgia … 259 297 434 373 486 523
of whom studying on general terms … – – – 315 449 494As a percentage of the total enrolment … 0.6 0.7 0.8 2.2 1.8 1.8
State and municipal institutionsTotal, headcount* 5111 10839 12833 14817 37560 33145 35906Including citizens of:
CIS countries, Baltic States, Republic of Georgia, Abkhazia, and South Ossetia** 4922 9631 10650 12483 16098 22015 24466
of whom studying on general terms … 9344 10445 12311 13536 19177 21463Foreign countries excluding the CIS, Baltic States, Republic of Georgia 189 247 284 424 353 462 486
of whom studying on general terms – – – – 296 425 457As a percentage of the total enrolment 0.2 0.5 0.6 0.7 2.0 1.7 1.8
Private institutionsTotal, headcount* … 1292 1320 1536 6551 3806 3471Including citizens of:
CIS countries, Baltic States, Republic of Georgia, Abkhazia, and South Ossetia** … 1276 1297 1522 2933 2447 2644
of whom studying on general terms … 1276 1296 1522 2916 2429 2630Foreign countries excluding the CIS, Baltic States, Republic of Georgia … 12 13 10 20 24 37
of whom studying on general terms … – – – 19 24 37As a percentage of the total enrolment … 1.3 1.4 1.5 5.2 2.7 2.3
* Beginning with 2010/2011 academic year – including persons without citizenship.** Before 2010/2011 academic year – excluding citizens of Abkhazia, and South Ossetia.

133 Indicators of Education in the Russian Federation
4.31. SECONDARY VOCATIONAL EDUCATION ENTRANTS: PROGRAMMES FOR MID-CAREER PROFESSIONALS
2000 2005 2010 2011 2012 2013 2014 2015
Total, thousand, headcount 867.2 854.1 705.3 659.6 656.2 637.7 672.8 699.3State and municipal institutions 842.4 810.9 671.8 628.8 620.8 591.3 618.4 639.8Private institutions 24.8 43.2 33.5 30.8 35.4 46.4 54.4 59.5
As a percentage of the population aged 15 (entrants ratio) 35.1 39.7 49.0 48.5 50.8 47.8 51.9 50.8By mode of study:
intramural full-time 625.1 662.0 537.9 515.2 518.6 507.8 544.8 567.7intramural part-time 35.5 20.9 19.2 17.0 15.8 16.1 15.3 16.9extramural 206.7 171.2 148.2 127.4 121.8 113.8 112.7 114.7
4.32. SECONDARY VOCATIONAL EDUCATION GRADUATES (PROGRAMMES FOR MID-CAREER PROFESSIONALS)(thousand, headcount)
2000 2005 2010 2011 2012 2013 2014 2015
Total 579.3 684.4 572.1 518.0 486.3 439.0 451.0 446.0State and municipal institutions 567.7 651.4 535.7 484.2 454.9 404.0 418.0 410.9Private institutions 11.6 33.0 36.5 33.8 31.4 35.0 33.0 35.0
By mode of study:intramural full-time 426.4 493.4 418.0 372.7 349.2 323.5 348.9 354.4intramural part-time 25.7 22.7 15.2 13.4 12.9 11.0 10.6 9.8extramural 127.2 168.3 139.0 132.0 124.2 104.5 91.4 81.8

1344. Enrolment
4.33. SECONDARY VOCATIONAL EDUCATION GRADUATES (PROGRAMMES FOR MID-CAREER PROFESSIONALS) BY MAJOR OCCUPATION GROUP: 2004–2013
(thousand, headcount)
2004 2005 2010 2011 2012 2013
Total 702.7 684.4 572.1 518.0 486.3 439.0Physics and mathematics 0.3 – – – – –Natural sciences 0.5 0.5 0.4 0.3 0.3 0.2Humanities 72.3 72.1 50.6 44.3 42.0 34.7Social sciences 1.0 1.1 1.0 1.2 1.2 1.5Education and educational research 58.6 54.9 45.6 40.5 38.2 33.5Healthcare 67.7 57.3 63.3 56.8 50.3 47.0Culture and arts 18.3 18.3 18.1 17.4 17.3 14.9Economics and management 207.9 203.1 148.1 135.4 115.7 87.4Information security – – 0.4 0.4 0.6 0.7Services 9.0 10.0 14.7 15.1 14.8 20.9Agriculture and fisheries 28.6 28.4 17.6 15.3 14.9 15.7Geodesics and land use planning 2.2 2.5 2.6 2.5 3.0 6.0Geology, exploration and exploitation of mineral resources 7.6 7.5 8.4 8.2 8.8 8.0Power generation and engeneering, electrical machinery 19.6 19.0 16.7 14.9 15.1 14.4Metallurgy, mechanical engineering, and materials processing 30.6 30.2 22.6 19.7 18.5 17.6Aircraft and aerospace engineering 2.2 2.0 2.0 1.6 1.7 1.8Marine engineering 4.1 3.9 3.2 2.7 3.1 3.2Motor vehicles 51.0 50.5 44.6 40.4 40.2 39.6Instrument engineering, optical engineering 1.7 1.7 1.3 0.9 0.9 0.8Electronic equipment, radio engineering, and communication 12.9 12.2 9.0 7.3 6.6 6.1Automation and control systems 8.2 7.5 5.9 5.4 5.3 5.4Informatics and computer science 22.1 26.0 31.1 27.7 26.4 24.0Chemistry and biotechnology 5.5 5.4 3.8 3.3 3.2 3.1Reproduction and processing of forest resources 6.6 6.3 4.8 4.2 4.3 4.0Technology of food products and consumer goods 29.0 28.1 22.4 19.9 20.2 17.8Architecture and construction 32.6 33.0 31.7 30.5 31.4 28.1Health and safety, environmental engineering, and environmental protection 2.5 2.9 2.4 2.0 2.3 2.6

135 Indicators of Education in the Russian Federation
4.34. SECONDARY VOCATIONAL EDUCATION GRADUATES (PROGRAMMES FOR MID-CAREER PROFESSIONALS) BY MAJOR OCCUPATION GROUP: 2014, 2015
2014 2015
Headcount Per cent Headcount Per cent
Total 450966 100 445960 100Earth sciences 318 0.1 314 0.1Architecture 1592 0.4 1696 0.4Civil engineering and technology 27321 6.1 25597 5.7Informatics and computer science 28575 6.3 29378 6.6Information security 629 0.1 1166 0.3Electronics, radio-engineering and communication systems 6766 1.5 6289 1.4Photonic engineering, instrument engineering, optical and bioengineering systems and technology 368 0.1 482 0.1Power engineering and thermal power engineering 15534 3.4 15335 3.4Nuclear power engineering and technology 234 0.1 1723 0.4Mechanical engineering 18530 4.1 15613 3.5Chemical engineering 2869 0.6 2911 0.7Industrial ecology and biotechnology 16065 3.6 16791 3.8Technosphere safety and environmental engineering 3017 0.7 3467 0.8Applied geology, mining, oil and gas engineering and geodesics 18806 4.2 17534 3.9Materials engineering 4185 0.9 4363 1.0Surface transport engineering and technology 40107 8.9 40606 9.1Aircraft and aerospace engineering 664 0.1 764 0.2Flight navigation and aircraft and aerospace equipment operation 1042 0.2 1654 0.4Shipbuilding and water-borne transportation engineering and technology 5707 1.3 4742 1.1Engineering systems management 2949 0.7 2495 0.6Light industry technological processes 3002 0.7 2609 0.6
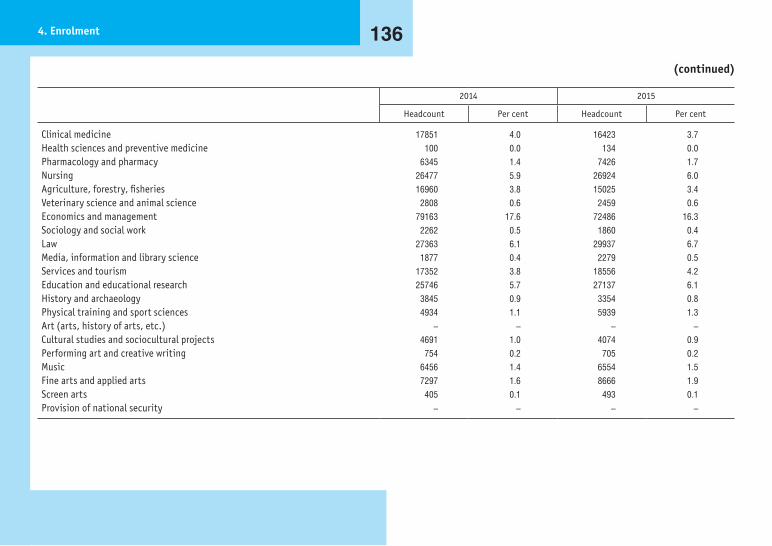
1364. Enrolment
(continued)
2014 2015
Headcount Per cent Headcount Per cent
Clinical medicine 17851 4.0 16423 3.7Health sciences and preventive medicine 100 0.0 134 0.0Pharmacology and pharmacy 6345 1.4 7426 1.7Nursing 26477 5.9 26924 6.0Agriculture, forestry, fisheries 16960 3.8 15025 3.4Veterinary science and animal science 2808 0.6 2459 0.6Economics and management 79163 17.6 72486 16.3Sociology and social work 2262 0.5 1860 0.4Law 27363 6.1 29937 6.7Media, information and library science 1877 0.4 2279 0.5Services and tourism 17352 3.8 18556 4.2Education and educational research 25746 5.7 27137 6.1History and archaeology 3845 0.9 3354 0.8Physical training and sport sciences 4934 1.1 5939 1.3Art (arts, history of arts, etc.) – – – –Cultural studies and sociocultural projects 4691 1.0 4074 0.9Performing art and creative writing 754 0.2 705 0.2Music 6456 1.4 6554 1.5Fine arts and applied arts 7297 1.6 8666 1.9Screen arts 405 0.1 493 0.1Provision of national security – – – –
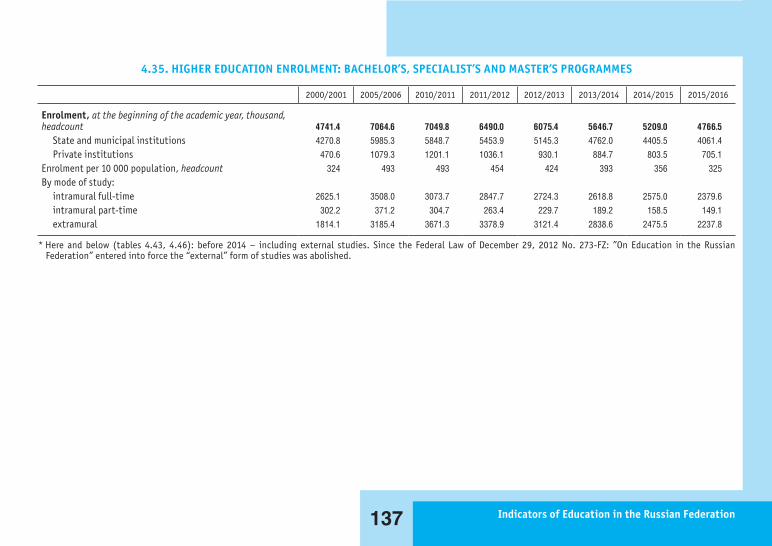
137 Indicators of Education in the Russian Federation
4.35. HIGHER EDUCATION ENROLMENT: BACHELOR’S, SPECIALIST’S AND MASTER’S PROGRAMMES
2000/2001 2005/2006 2010/2011 2011/2012 2012/2013 2013/2014 2014/2015 2015/2016
Enrolment, at the beginning of the academic year, thousand, headcount 4741.4 7064.6 7049.8 6490.0 6075.4 5646.7 5209.0 4766.5
State and municipal institutions 4270.8 5985.3 5848.7 5453.9 5145.3 4762.0 4405.5 4061.4Private institutions 470.6 1079.3 1201.1 1036.1 930.1 884.7 803.5 705.1
Enrolment per 10 000 population, headcount 324 493 493 454 424 393 356 325By mode of study:
intramural full-time 2625.1 3508.0 3073.7 2847.7 2724.3 2618.8 2575.0 2379.6intramural part-time 302.2 371.2 304.7 263.4 229.7 189.2 158.5 149.1extramural 1814.1 3185.4 3671.3 3378.9 3121.4 2838.6 2475.5 2237.8
* Here and below (tables 4.43, 4.46): before 2014 – including external studies. Since the Federal Law of December 29, 2012 No. 273-FZ: ”On Education in the Russian Federation” entered into force the “external” form of studies was abolished.

1384. Enrolment
4.36. PARTICIPATION OF YOUNG PEOPLE IN HIGHER EDUCATION: BACHELOR’S, SPECIALIST’S AND MASTER’S PROGRAMMES BY GENDER
(the proportion of the number of students studying in accordance with higher education programmes (bachelor’s, specialist’s and master’s programmes) to the number of population aged 17–25)
Per cent
15
20
25
30
35
40
45
19.7 26.4
2000
26.8 37.9
2005
29.9 41.1
2010
29.5 39.1
2011
29.8 38.2
2012
30.4 37.2
2013
29.6 36.2
2014
29.3 35.1
2015
23.0
32.3
35.434.2 33.9 33.7 32.9 32.1
Female
Male
Total

139 Indicators of Education in the Russian Federation
4.37. HIGHER EDUCATION ENROLMENT (BACHELOR’S, SPECIALIST’S AND MASTER’S PROGRAMMES) BY GENDER AND AGE(at the beginning of the academic year; full years as of January, 1; headcount)
Total Age, years
17 and below
18 19 20 21 22 23 24 25 26 and over
2010/2011Total 7049815 318444 617107 794153 906190 930911 719909 487230 360519 284754 1630598Male 3019722 144419 270581 335345 377328 386551 303145 210584 159463 128524 703782Female 4030093 174025 346526 458808 528862 544360 416764 276646 201056 156230 926816
2015/2016Total 4766479 152900 431213 572761 646345 626237 463409 323174 231839 182967 1135634Male 2217879 70768 194825 250300 285076 277193 209636 151889 116227 94018 567947Female 2548600 82132 236388 322461 361269 349044 253773 171285 115612 88949 567687

1404. Enrolment
4.38. HIGHER EDUCATION ENROLMENT BY DEGREE(at the beginning of the academic year; thousand, headcount)
Total Oh which programmes by degree
bachelor's specialist's master's
Total2011/2012 6490.0 1425.4 4929.3 135.42012/2013 6075.4 2271.8 3634.8 168.82013/2014 5646.7 2994.8 2453.5 198.32014/2015 5209.0 3516.1 1465.9 227.02015/2016 4766.5 3530.9 904.9 330.7
State and municipal institutions2011/2012 5453.9 1159.6 4166.8 127.52012/2013 5145.3 1875.6 3113.1 156.62013/2014 4762.0 2453.3 2125.8 182.92014/2015 4405.5 2893.0 1300.1 212.42015/2016 4061.4 2924.8 823.3 313.3
Private institutions2011/2012 1036.1 265.8 762.5 7.92012/2013 930.1 396.2 521.7 12.22013/2014 884.7 541.5 327.8 15.52014/2015 803.5 623.1 165.8 14.62015/2016 705.1 606.1 81.6 17.4

141 Indicators of Education in the Russian Federation
4.39. PERCENTAGE DISTRIBUTION OF HIGHER EDUCATION ENROLMENT (BACHELOR’S, SPECIALIST’S AND MASTER’S PROGRAMMES) BY MODE OF STUDY: 2015/2016
(at the beginning of the academic year)
Mode of study:
extramuralintramural full-time intramural part-time
0 20 40 60 80 100
3.1 47.0Total
3.1 41.0State
and municipal institutions
3.5 80.8Private institutions
Per cent
49.9
55.9
15.7

1424. Enrolment
4.40. ENROLMENT (BACHELOR’S, SPECIALIST’S AND MASTER’S PROGRAMMES) OF PEOPLE WITH LIMITED HEALTH CAPACITIES, DISABLED CHILDREN AND DISABLED PEOPLE
(at the beginning of the academic year)
2014/2015 2015/2016
Total State and municipal
institutions
Private institutions
Total State and municipal
institutions
Private institutions
People with limited health capacities:Headcount 4052 3974 78 5730 5610 120As a percentage of the total enrolment 0.1 0.1 0.0 0.1 0.1 0.0
Of which those studying in accordance with adapted educational programmes:Headcount 555 525 30 755 722 33As a percentage of the total enrolment of people with limited health capacities 13.7 13.2 38.5 13.2 12.9 27.5
Disabled children and disabled people:Headcount 16768 16201 567 21222 21355 767As a percentage of the total enrolment 0.3 0.4 0.1 0.5 0.5 0.1
Of which those studying in accordance with adapted educational programmes:Headcount 1262 1227 35 1868 1835 33As a percentage of the total enrolment of disabled children and disabled people 7.5 7.6 6.2 8.4 8.6 4.3

143 Indicators of Education in the Russian Federation
4.41. HIGHER EDUCATION ENROLMENT OF FOREIGN STUDENTS (BACHELOR’S, SPECIALIST’S AND MASTER’S PROGRAMMES)(at the beginning of the academic year)
2010/2011 2011/2012 2012/2013 2013/2014 2014/2015 2015/2016
TotalTotal, headcount* 160.9 159.5 171.6 205.7 224.6 242.5Including citizens of:
CIS countries, Baltic States, Republic of Georgia, Abkhazia,and South Ossetia** 116.7 121.8 127.5 156.3 175.5 188.1of whom studying on general terms 105.3 108.2 110.2 137.7 154.6 169.6
foreign countries excluding the CIS, Baltic States, Republic of Georgia 37.1 36.6 37.4 39.5 44.5 49.5of whom studying on general terms – – – 25.9 32.4 36.0
As a percentage of the total enrolment 2.3 2.4 2.8 3.6 4.3 5.1
State and municipal institutionsTotal, headcount* 130.6 126.9 139.4 160.3 178.6 195.6Including citizens of:
CIS countries, Baltic States, Republic of Georgia, Abkhazia,and South Ossetia** 86.7 89.8 98.4 113.3 130.7 142.2of whom studying on general terms 75.3 76.2 81.1 94.9 109.9 124.0
foreign countries excluding the CIS, Baltic States, Republic of Georgia 36.8 36.5 37.1 39.1 43.9 48.6of whom studying on general terms – – – 25.5 31.8 35.2
As a percentage of the total enrolment 2.2 2.3 2.7 3.3 4.0 4.8
Private institutionsTotal, headcount* 30.3 32.6 32.2 45.4 45.9 46.9Including citizens of:
CIS countries, Baltic States, Republic of Georgia, Abkhazia,and South Ossetia** 30.0 32.0 29.1 43.0 44.8 45.9of whom studying on general terms 30.0 32.0 29.0 42.8 44.7 45.7
foreign countries excluding the CIS, Baltic States, Republic of Georgia 0.2 0.1 0.2 0.4 0.6 0.9of whom studying on general terms – – – 0.4 0.6 0.8
As a percentage of the total enrolment 2.5 3.1 3.5 5.1 5.7 6.7
* Including persons without citizenship.** 2010/2011 academic year – excluding citizens of Abkhazia, and South Ossetia.
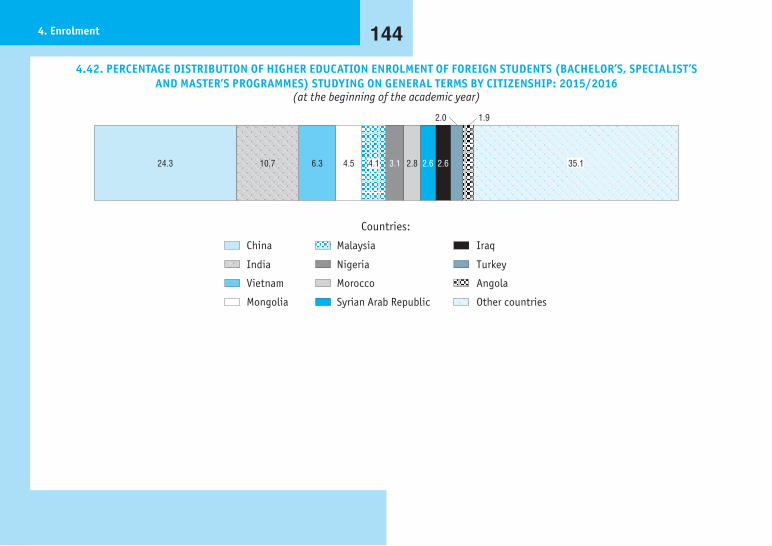
1444. Enrolment
4.42. PERCENTAGE DISTRIBUTION OF HIGHER EDUCATION ENROLMENT OF FOREIGN STUDENTS (BACHELOR’S, SPECIALIST’S AND MASTER’S PROGRAMMES) STUDYING ON GENERAL TERMS BY CITIZENSHIP: 2015/2016
(at the beginning of the academic year)
24.3 10.7 6.3 4.5 4.1 3.1 2.8 2.6 2.6
2.0 1.9
Countries:
China
India
Vietnam
Mongolia
Malaysia
Nigeria
Morocco
Syrian Arab Republic
Iraq
Turkey
Angola
Other countries
35.1

145 Indicators of Education in the Russian Federation
4.43. HIGHER EDUCATION ENTRANTS: BACHELOR’S, SPECIALIST’S AND MASTER’S PROGRAMMES
2000 2005 2010 2011 2012 2013 2014 2015
Entrants, thousand, headcount 1292.5 1640.5 1399.5 1207.4 1298.2 1246.5 1191.7 1221.8State and municipal institutions 1140.3 1372.5 1195.4 1057.7 1111.6 1066.8 1020.8 1049.6Private institutions 152.2 268.0 204.0 149.7 186.6 179.7 170.9 172.2
As a percentage of the population aged 17 (entrants ratio) 50.1 68.0 91.1 80.0 90.0 91.4 90.6 90.1By mode of study:
intramural full-time 687.5 830.7 659.6 628.0 673.4 664.5 653.7 676.2intramural part-time 81.9 86.1 52.4 40.4 40.8 34.6 32.4 36.3extramural 523.1 723.7 687.5 539.0 584.0 547.5 505.6 509.3
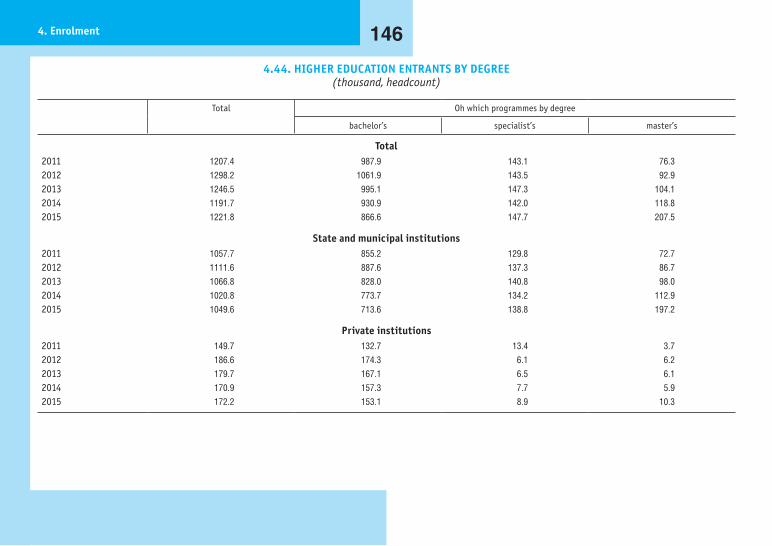
1464. Enrolment
4.44. HIGHER EDUCATION ENTRANTS BY DEGREE(thousand, headcount)
Total Oh which programmes by degree
bachelor’s specialist’s master’s
Total2011 1207.4 987.9 143.1 76.32012 1298.2 1061.9 143.5 92.92013 1246.5 995.1 147.3 104.12014 1191.7 930.9 142.0 118.82015 1221.8 866.6 147.7 207.5
State and municipal institutions2011 1057.7 855.2 129.8 72.72012 1111.6 887.6 137.3 86.72013 1066.8 828.0 140.8 98.02014 1020.8 773.7 134.2 112.92015 1049.6 713.6 138.8 197.2
Private institutions2011 149.7 132.7 13.4 3.72012 186.6 174.3 6.1 6.22013 179.7 167.1 6.5 6.12014 170.9 157.3 7.7 5.92015 172.2 153.1 8.9 10.3

147 Indicators of Education in the Russian Federation
4.45. HIGHER EDUCATION ENTRANTS: BACHELOR’S, SPECIALIST’S AND MASTER’S PROGRAMMES BY MAJOR OCCUPATION GROUP AND BY FIELD OF STUDY
2014 2015
Thousand, headcount Per cent Thousand, headcount Per cent
Total 1191.7 100 1221.8 100Mathematics and mechanics 10.7 0.9 12.4 1.0Computer and information sciences 4.8 0.4 5.1 0.4Physical sciences and astronomy 6.9 0.6 7.9 0.6Chemistry 4.9 0.4 5.0 0.4Earth sciences 11.0 0.9 11.4 0.9Biological sciences 7.7 0.6 7.6 0.6Architecture 5.8 0.5 6.1 0.5Civil engineering and technology 43.6 3.7 45.1 3.7Informatics and computer science 43.0 3.6 46.9 3.8Information security 6.0 0.5 6.3 0.5Electronics, radio-engineering and communication systems 16.2 1.4 18.6 1.5Photonic engineering, instrument engineering, optical and bioengineering systems and technology 5.8 0.5 6.5 0.5Power engineering and thermal power engineering 31.1 2.6 33.5 2.7Nuclear power engineering and technology 2.0 0.2 2.3 0.2Mechanical engineering 30.7 2.6 33.1 2.7Engineering physics and technology 1.7 0.1 1.7 0.1Weapons and armaments systems 0.7 0.1 0.8 0.1Chemical engineering 11.5 1.0 13.4 1.1Industrial ecology and biotechnology 12.8 1.1 12.9 1.1Technosphere safety and environmental engineering 13.8 1.2 15.0 1.2Applied geology, mining, oil and gas engineering and geodesics 29.4 2.5 30.4 2.5Materials engineering 5.2 0.4 6.1 0.5

1484. Enrolment
(continued)
2014 2015
Thousand, headcount Per cent Thousand, headcount Per cent
Surface transport engineering and technology 35.5 3.0 38.4 3.1Aircraft and aerospace engineering 4.6 0.4 5.1 0.4Flight navigation and aircraft and aerospace equipment operation 3.2 0.3 3.1 0.3Shipbuilding and water-borne transportation engineering and technology 7.0 0.6 7.2 0.6Engineering systems management 13.2 1.1 14.8 1.2Nano-technology and nano-materials 0.9 0.1 1.1 0.1Light industry technological processes 3.3 0.3 3.3 0.3Basic medicine 0.7 0.1 0.8 0.1Clinical medicine 43.8 3.7 45.4 3.7Health sciences and preventive medicine 1.9 0.2 1.9 0.2Pharmacology and pharmacy 5.2 0.4 5.0 0.4Nursing 1.4 0.1 1.2 0.1Agriculture, forestry, fisheries 33.4 2.8 34.0 2.8Veterinary science and animal science 12.1 1.0 11.9 1.0Psychology 21.1 1.8 20.3 1.7Economics and management 323.9 27.2 300.5 24.6Sociology and social work 12.9 1.1 12.9 1.1Law 134.3 11.3 150.3 12.3Political sciences and area studies 9.9 0.8 11.4 0.9Media, information and library science 16.2 1.4 17.1 1.4Services and tourism 16.1 1.4 14.8 1.2Education and educational research 113.0 9.5 114.8 9.4Linguistics and literature studies 21.4 1.8 24.0 2.0History and archaeology 6.7 0.6 7.3 0.6Philosophy, ethics and religion 1.5 0.1 1.7 0.1

149 Indicators of Education in the Russian Federation
2014 2015
Thousand, headcount Per cent Thousand, headcount Per cent
Theological studies 1.1 0.1 1.3 0.1Physical training and sport sciences 13.4 1.1 13.6 1.1Art (arts, history of arts, etc.) 1.3 0.1 1.7 0.1Cultural studies and sociocultural projects 8.2 0.7 8.4 0.7Performing art and creative writing 3.3 0.3 3.9 0.3Music 5.1 0.4 5.9 0.5Fine arts and applied arts 9.6 0.8 9.2 0.8Screen arts 1.3 0.1 1.4 0.1
4.46. HIGHER EDUCATION GRADUATES: BACHELOR’S, SPECIALIST’S AND MASTER’S PROGRAMMES(thousand, headcount)
2000 2005 2010 2011 2012 2013 2014 2015
Total 635.1 1151.7 1467.9 1442.9 1397.2 1291.0 1226.2 1300.5State and municipal institutions 578.9 978.4 1177.8 1157.3 1125.4 1060.0 1017.7 1109.9Private institutions 56.2 173.3 290.1 285.6 271.9 231.0 208.4 190.5
By mode of study:intramural full-time 375.3 570.5 689.8 654.2 617.4 568.5 527.2 698.2intramural part-time 39.8 59.9 68.0 65.8 61.2 53.1 48.4 38.5extramural 220.0 521.3 710.0 722.8 718.8 669.3 650.6 563.8
(continued)
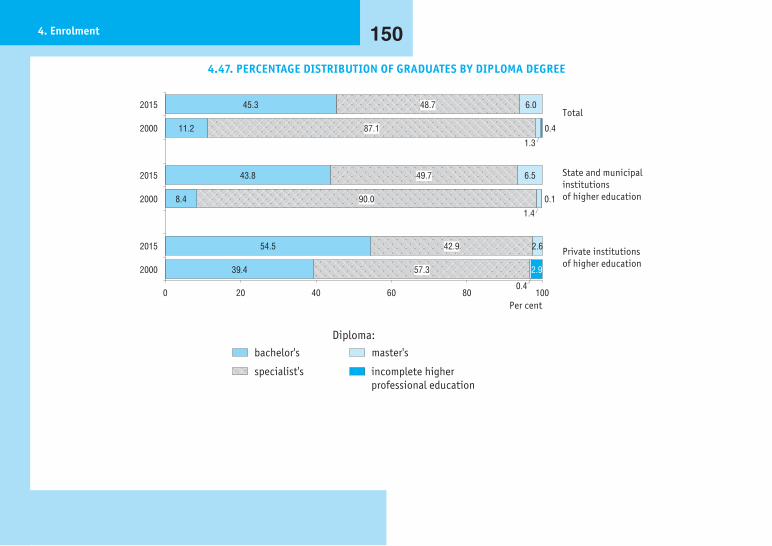
1504. Enrolment
4.47. PERCENTAGE DISTRIBUTION OF GRADUATES BY DIPLOMA DEGREE
Total
State and municipal institutions of higher education
Private institutions of higher education
incomplete higher professional education
master's
specialist's
bachelor'sDiploma:
Per cent0 20 40 60 80 100
45.3 48.7 6.02015
11.2 87.1
1.3
0.42000
43.8 49.7 6.52015
8.4 90.0
1.4
0.12000
54.5 42.9 2.62015
39.4 57.3
0.4
2.92000
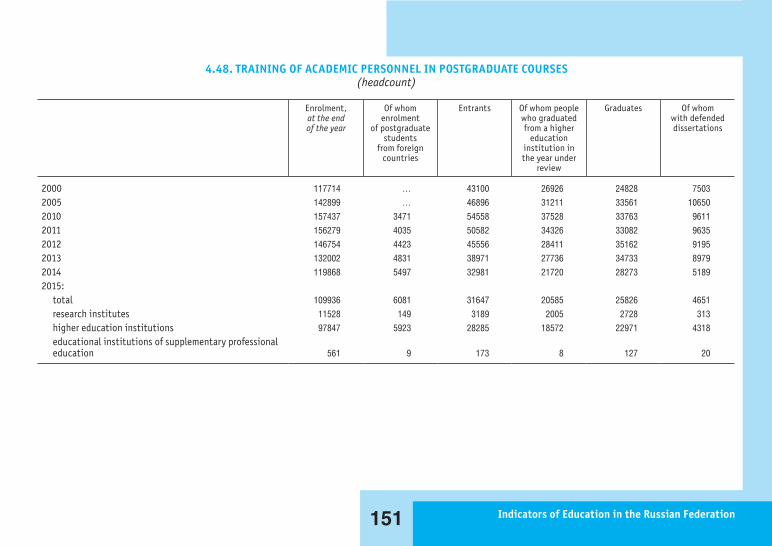
151 Indicators of Education in the Russian Federation
4.48. TRAINING OF ACADEMIC PERSONNEL IN POSTGRADUATE COURSES(headcount)
Enrolment,at the endof the year
Of whom enrolment
of postgraduate students
from foreign countries
Entrants Of whom peoplewho graduatedfrom a higher
educationinstitution inthe year under
review
Graduates Of whomwith defendeddissertations
2000 117714 … 43100 26926 24828 75032005 142899 … 46896 31211 33561 106502010 157437 3471 54558 37528 33763 96112011 156279 4035 50582 34326 33082 96352012 146754 4423 45556 28411 35162 91952013 132002 4831 38971 27736 34733 89792014 119868 5497 32981 21720 28273 51892015:
total 109936 6081 31647 20585 25826 4651research institutes 11528 149 3189 2005 2728 313higher education institutions 97847 5923 28285 18572 22971 4318educational institutions of supplementary professional education 561 9 173 8 127 20

1524. Enrolment
4.49. POSTGRADUATE COURSES ENROLMENT BY GENDER AND AGE(at the end of the year; headcount)
Total Age, years
22 and below
23 24 25 26 27 28 29 30–34 35–39 40 and over
2007
Total 147719 19713 29092 30021 20115 12172 7570 4950 4046 9300 5037 5703Male 84399 12920 19094 19510 12125 6528 3338 1963 1595 3236 1844 2246Female 63320 6793 9998 10511 7990 5644 4232 2987 2451 6064 3193 3457
2015
Total 109936 4815 13423 18420 17178 12838 8675 5920 4772 11457 6001 6437Male 57372 2796 8050 10853 9642 6860 4101 2619 2120 4904 2608 2819Female 52564 2019 5373 7567 7536 5978 4574 3301 2652 6553 3393 3618

153 Indicators of Education in the Russian Federation
4.50. POSTGRADUATE COURSES GRADUATES BY FIELD OF SCIENCE AND TECHNOLOGY(headcount)
2000 2005 2010 2011 2012 2013 2014 2015
Total Of whom,with defendeddissertation
Total 24828 33561 33763 33082 35162 34733 28273 25826 4651Fields of science and technology:Physics and Mathematics 1933 1843 1771 1910 2106 2069 1669 1230 272Chemical sciences 725 823 878 806 935 919 694 497 146Biological sciences 1354 1616 1680 1750 1763 1740 1371 1235 232Engineering and technology 6279 7480 7761 7547 8491 8738 7282 6723 1093Agricultural sciences 1047 1212 1078 1074 1188 1212 1024 1006 254History and archaeology 892 1219 1093 1003 1074 1072 932 855 127Philology and linguistics 1320 1724 1573 1509 1516 1556 1323 1248 272Philosophy 607 729 670 669 719 675 555 492 77Art (arts, history of arts, etc.) 438 635 521 431 569 558 549 304 12Psychology 483 694 770 735 854 718 621 544 69Economics 3807 6009 5887 5507 5800 5479 4040 3839 582Educational research 1414 2159 2179 2084 2202 2095 1800 1580 286Sociology 391 634 548 633 634 571 460 423 68Law 979 2222 2554 2494 2309 2270 1737 1461 205Political science 199 360 466 497 456 458 393 392 48Medical sciences 1730 2707 2798 2865 2671 2883 2429 2611 722Earth sciences 971 1160 1159 1111 1422 1299 1103 1104 154Other sciences 259 335 377 457 453 421 291 282 32

1544. Enrolment
4.51. PEOPLE WHO DEFENDED DISSERTATION DURING THE PERIOD OF TRAINING BY FIELD OF SCIENCE AND TECHNOLOGY: 2015
Total – 18.0
Per cent
Fields of science and technology:
1 – Physics and Mathematics2 – Chemical sciences3 – Biological sciences4 – Engineering and Technology5 – Agricultural sciences6 – History and Archaeology
7 –
9 –10 –11 –12 –
Philology and Linguistics
Art (Arts, History of Arts, etc.)PsychologyEconomicsEducational research
8 – Philosophy13– Sociology14 – Law15 – Political science16 – Medical sciences 17 – Earth sciences18 – Other sciences
0
10
20
30
40
22.1
1
29.4
2
18.8
3
16.3
4
25.2
5
14.9
6
21.8
7
15.7
8
3.9
9
12.7
10
15.2
11
18.1
12
16.1
13
14.0
14
12.2
15
27.7
16
13.9
17
11.3
18

155 Indicators of Education in the Russian Federation
TECHNICAL NOTES
Participation of children in preschool education is calcu-lated as the proportion of the number of children, attending edu-cational institutions engaged in educational activities and imple-menting programmes of preschool education and provide baby and child care to the total number of children aged 1–6, adjusted for the number of children aged 5–6, studying at educational insti-tutions of general education.
Number of days missed due to illness by a child per year is the proportion of the days missed by a student due to illness to the average annual number of students.
Attendance ratio at institutions engaged in educational activities within educational programmes of preschool educa-tion, baby and child care is calculated as a percentage of the aver-age number of days one student was in attendance to the number of working days in the year. With regard to this the average number of days one student was in attendance is calculated as the propor-tion of days spent in a group with other students to the average annual number of students.
General groups (general development groups) are groups where educational programmes of preschool education are implemented.
Compensatory groups are groups where there are implemented adapted educational programmes of preschool education for stu-dents with limited health capacities which take into account their psychophysical condition and individual capabilities and correct their developmental disorders and improve the social adaptation of students with limited health capacities.
Health groups are groups where educational programmes of preschool education are implemented together with sanitary and hygienic, health improving and preventive measures and acti-vities. These groups are created for students with tuberculous intoxication, sickly children and other categories of children who need long-term medical care and health improving technologies and assistance.
Combined groups are groups where study both healthy children and children with limited health capacities. They study in accor-dance with educational programmes of preschool education that is adapted for students with limited health capacities and takes into account their psychophysical condition and individual capabilities and corrects their developmental disorders and improves the social adaptation of students with limited health capacities.
Groups for young children (babies) are groups that do not im-plement educational programmes of preschool education. They pro-vide development and baby and child care and improve the health of young children and babies from 2 months to 3 years old.
Baby and child care groups are groups that do not implement educational programmes of preschool education. They organise a set of measures connected with feeding, tending to and catering for and taking care of babies and children, including their personal hygiene and daily routines.
Family preschool groups are groups created in order to meet the demand of the population in connection with preschool educa-tion in families. They may be aimed at either general development
1564. Enrolment
or babysitting and providing baby and child care without the im-plementation of educational programmes of preschool education.
Short-term groups are groups working part-time (from three to five hours a day), but at the same time based on systematic presence of children at institutions engaged in educational ac-tivities based on educational programmes of preschool education, as well as engaged in babysitting and baby and child care.
Number of children and adolescents not studying at educa-tional institutions is the index showing the number of people who given their age are to study at general educational institutions, but they do not study there and do not receive general education on other educational institutions due to viable reasons or without valid exuse.
The total enrolment of students studying in accordance with educational programmes of secondary vocational educa-tion – programmes for mid-career professionals, higher educa-tion – bachelor’s, specialist’s and master’s programmes as well as the total number of entrants and graduates does not include foreigners, persons without citizenship studying in the Russian
Federation in accordance with international contracts (agree-ments).
Secondary vocational education entrants, higher education entrants (bachelor’s, specialist’s and master’s programmes) – this index shows the number of people who entered educa-tional institutions and were enrolled. This procedure is carried out in 114accordance with the laid down rules and regulations. The number of entrants does not include repeaters or those who resume their studies.
A postgraduate student is a person who has attained higher level of education (specialist’s or master’s degree) and who stud-ies at postgraduate courses in accordance with postgraduate pro-grammes for academic personnel.
Enrolment of postgraduate students is registered at the end of the year, including the citizens of CIS countries and other for-eigners.
In the present chapter the data for 2014 (excluding tables 4.18) and for 2015 are given including the information for the Republic of Crimea and the city of Sevastopol.

5. Personnel

1585. Personnel
5.1. AVERAGE ANNUAL NUMBER OF THE EMPLOYED POPULATION BY ECONOMIC ACTIVITY*(thousand, headcount)
2000 2005 2010 2011 2012 2013 2014 2015
Employed in the economy 64517 66683 67493 67644 67968 67901 67813 68389Agriculture, hunting, and forestry 8996 7489 6622 6565 6467 6364 6247 6297Fishing and aquaculture 138 138 138 144 142 139 139 146Mining and quarrying 1110 1122 1054 1062 1080 1075 1064 1082Manufacturing 12297 11631 10260 10272 10170 10065 9872 9840Electricity, gas, and water supply 1886 1923 1941 1950 1947 1936 1914 1923Construction 4325 4986 5399 5479 5642 5712 5664 5652Wholesale and retail trade; repair of motor vehicles, motorcycles and personal and household goods 8806 11038 12073 12143 12292 12408 12695 12890Hotels and restaurants 948 1017 1181 1218 1250 1267 1272 1338Transport and communication 5056 5262 5336 5353 5430 5420 5409 5501Financial services 657 865 1121 1182 1223 1309 1312 1278Real estate, renting, and service activities 4490 4980 5374 5504 5709 5815 5889 6002Public administration and defense; compulsory social security 3098 3367 3901 3801 3734 3711 3732 3730Education 5979 6048 5897 5785 5697 5570 5520 5541Health and social services 4408 4433 4617 4603 4573 4523 4496 4529Other community, social, and personal services 2313 2359 2524 2526 2547 2520 2513 2560
* The data for 2005, 2010–2015 are given by main economic activity.

159 Indicators of Education in the Russian Federation
5.2. POPULATION EMPLOYED IN EDUCATION AS A PERCENTAGE OF THE TOTAL POPULATION EMPLOYED IN THE ECONOMY*
0
5
10
15
20
9.1
3.5
15.0
2000
9.2
3.7
14.8
2005
9.4
3.5
15.6
2010
9.2
3.3
15.2
2011
9.2
3.4
15.4
2012
9.2
3.3
15.3
2013
9.2
3.2
15.5
2014
9.2
3.2
15.5
2015
Female
Male
Total
* Here and below (pic. 5.3–5.5) – according to the results of sample surveys of labour force.

1605. Personnel
5.3. FEMALE PROPORTION IN THE TOTAL POPULATION EMPLOYED IN THE ECONOMY AND IN EDUCATION
40
50
60
70
80
90
48.4 49.4 49.1 49.1 49.0 48.9 48.8 48.7
79.9 79.781.3 81.5 81.5 81.6 82.2 82.1
2000 2005 2010 2011 2012 2013 2014 2015
National economy
Education
Per cent

161 Indicators of Education in the Russian Federation
5.4. PERCENTAGE DISTRIBUTION OF THE POPULATION EMPLOYED IN THE ECONOMY AND IN EDUCATION BY EDUCATIONAL ATTAINMENT: 2015
0
10
20
30
40
50
60
33.0
54.4
1
25.8 26.0
2
19.2
8.2
3
18.4
9.2
4
3.4 2.1
5
0.2 0.1
6
Educational attained:1 – higher2 – secondary vocational – programmes for mid-career professionals3 – secondary vocational – programmes for skilled workers, junior technicians and employees4 – secondary general5 – basic general6 – no basic general education
National economy Education

1625. Personnel
5.5. AVERAGE AGE OF THE POPULATION EMPLOYED IN THE ECONOMY AND IN EDUCATION
38
39
40
41
42
43
39.2
39.740.0 40.1
40.3 40.3 40.440.6
39.7
41.2
42.342.5 42.6
42.8 42.743.0
2000 2005 2010 2011 2012 2013 2014 2015
Age, years
National economy
Education

163 Indicators of Education in the Russian Federation
5.6. AVERAGE ANNUAL EMPLOYMENT IN THE EDUCATION SECTOR(thousand, headcount)
2005 2010 2011 2012 2013 2014 2015
Total 5834 5523 5364 5268 5168 5098 5102Preschool and primary education 1737 1840 1828 1847 1840 1818 1840
Preschool education … 1427 1421 1441 1434 1408 1424Primary education … 53 50 47 47 51 49Supplementary education of children … 360 357 359 359 359 368
Basic general, secondary (complete) general, lower vocational, and secondary vocational education 3186 2728 2607 2514 2461 2449 2466
Basic general and secondary (complete) general education … 2196 2102 2035 2005 2017 2043Basic general education … 339 322 300 289 280 288Secondary (complete) general education … 1857 1780 1735 1717 1727 1755
Lower vocational and secondary vocational education … 532 505 479 455 433 422Lower vocational education … 187 167 141 116 82 51Secondary vocational education … 345 338 338 339 351 371
Higher education 857 902 876 854 807 769 729Education of adults and other types of education 54 53 53 53 61 62 68
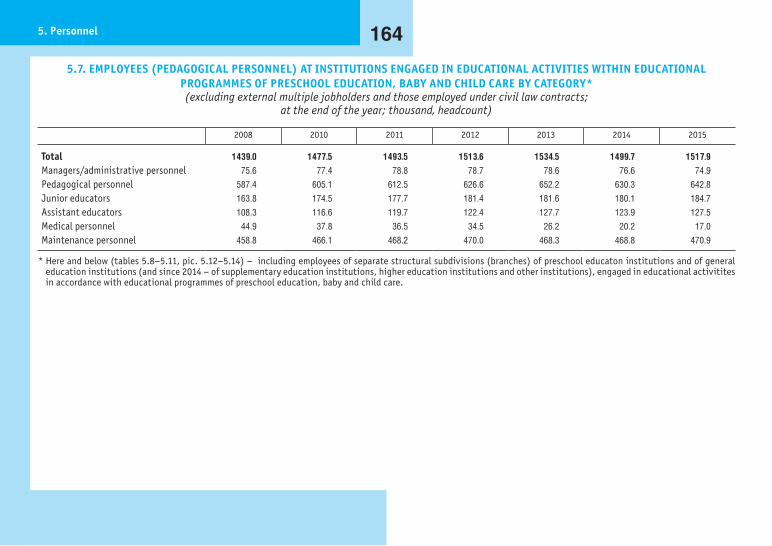
1645. Personnel
5.7. EMPLOYEES (PEDAGOGICAL PERSONNEL) AT INSTITUTIONS ENGAGED IN EDUCATIONAL ACTIVITIES WITHIN EDUCATIONAL PROGRAMMES OF PRESCHOOL EDUCATION, BABY AND CHILD CARE BY CATEGORY*(excluding external multiple jobholders and those employed under civil law contracts;
at the end of the year; thousand, headcount)
2008 2010 2011 2012 2013 2014 2015
Total 1439.0 1477.5 1493.5 1513.6 1534.5 1499.7 1517.9Managers/administrative personnel 75.6 77.4 78.8 78.7 78.6 76.6 74.9Pedagogical personnel 587.4 605.1 612.5 626.6 652.2 630.3 642.8Junior educators 163.8 174.5 177.7 181.4 181.6 180.1 184.7Assistant educators 108.3 116.6 119.7 122.4 127.7 123.9 127.5Medical personnel 44.9 37.8 36.5 34.5 26.2 20.2 17.0Maintenance personnel 458.8 466.1 468.2 470.0 468.3 468.8 470.9
* Here and below (tables 5.8–5.11, pic. 5.12–5.14) – including employees of separate structural subdivisions (branches) of preschool educaton institutions and of general education institutions (and since 2014 – of supplementary education institutions, higher education institutions and other institutions), engaged in educational activitites in accordance with educational programmes of preschool education, baby and child care.

165 Indicators of Education in the Russian Federation
5.8. PEDAGOGICAL PERSONNEL AT INSTITUTIONS ENGAGED IN EDUCATIONAL ACTIVITIES WITHIN EDUCATIONAL PROGRAMMES OF PRESCHOOL EDUCATION, BABY AND CHILD CARE BY POSITION
(at the end of the year; thousand, headcount)
Personnel (excluding external multiple jobholders and personswho were employed under civil law contracts)
External multiple jobholders
2010 2011 2012 2013 2014 2015 2010 2011 2012 2013 2014 2015
Total 605.1 612.5 626.6 652.2 630.3 642.8 21.2 21.8 21.9 21.1 19.2 18.4Of whom:
senior educators 17.9 18.1 18.5 19.7 19.8 21.2 0.6 0.6 0.6 0.6 0.5 0.5educators 467.3 475.2 487.1 507.1 491.1 500.2 2.6 2.8 3.0 2.8 2.4 2.2music instructors 43.2 42.9 43.1 44.4 43.3 44.0 8.3 8.6 9.1 8.6 8.1 7.8physical training instructors 19.3 19.2 19.6 21.0 20.3 20.8 1.6 1.7 1.9 1.9 1.8 1.8speech therapists 27.9 28.0 28.5 29.5 27.4 28.2 2.8 2.9 3.0 2.8 2.6 2.5speech pathologists 4.9 4.9 4.9 4.9 4.5 4.5 0.3 0.2 0.3 0.2 0.2 0.2teacher-psychologists 14.9 14.8 14.8 15.3 14.4 14.7 1.7 1.7 1.8 1.8 1.6 1.5social teachers 1.6 1.5 1.4 1.4 1.2 1.1 0.1 0.1 0.1 0.1 0.1 0.1teachers with administrative duties 0.4 0.3 0.3 0.3 0.2 0.2 0.2 0.2 0.1 0.1 0.0 0.0teachers of supplementary education 7.5 7.4 6.7 6.6 6.1 5.4 1.7 1.9 1.8 1.7 1.6 1.5

1665. Personnel
5.9. FEMALE PROPORTION IN THE NUMBER OF EMPLOYEES (PEDAGOGICAL PERSONNEL) AT INSTITUTIONS ENGAGED IN EDUCATIONAL ACTIVITIES WITHIN EDUCATIONAL PROGRAMMES OF PRESCHOOL EDUCATION, BABY AND CHILD CARE BY POSITION
(excluding external multiple jobholders and those employed under civil law contracts; at the end of the year)
Total, thousand, headcount As a percentage of the total personnel
2010 2011 2012 2013 2014 2015 2010 2011 2012 2013 2014 2015
Total 602.5 609.8 623.2 648.2 626.8 638.7 99.6 99.5 99.5 99.4 99.5 99.3Of whom:
senior educators 17.7 18.0 18.5 19.6 19.7 21.2 99.2 98.9 99.6 99.5 99.6 99.6educators 465.5 472.9 486.1 505.8 490.2 498.9 99.6 99.5 99.8 99.8 99.8 99.7music instructors 41.8 41.5 42.0 43.3 42.2 43.0 96.8 96.7 97.4 97.5 97.6 97.6physical training instructors 18.6 18.5 18.9 20.1 19.4 19.7 96.5 96.2 96.6 95.9 95.7 94.8speech therapists 27.7 27.7 28.4 29.3 27.3 28.1 99.3 99.0 99.6 99.4 99.6 99.5speech pathologists 4.8 4.9 4.9 4.9 4.4 4.5 99.5 99.5 99.7 99.7 99.6 99.8teacher-psychologists 14.7 14.5 14.6 15.1 14.3 14.6 98.4 98.1 99.0 98.8 99.1 99.0social teachers 1.6 1.4 1.4 1.4 1.2 1.1 98.1 98.3 98.2 97.7 98.4 97.4teachers with administrative duties 0.4 0.3 0.3 0.3 0.2 0.2 94.9 94.5 96.8 96.5 96.5 95.8teachers of supplementary education 7.3 7.1 6.5 6.5 5.9 5.2 97.1 96.6 97.2 97.3 96.8 96.4
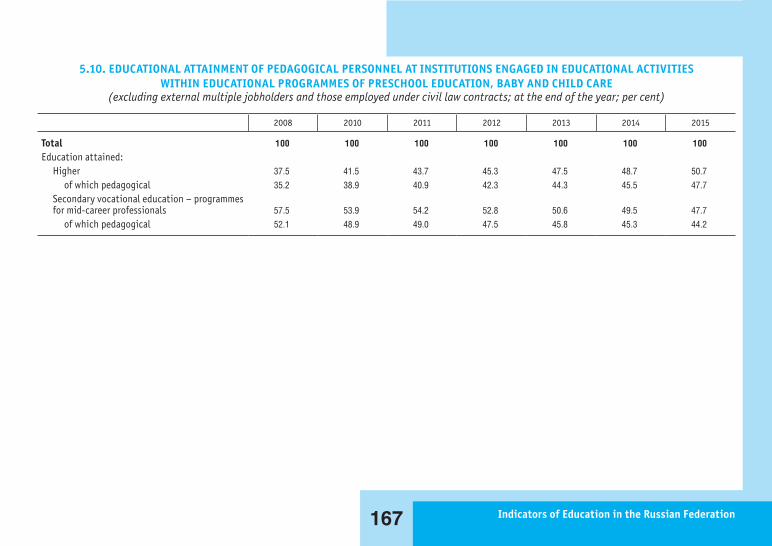
167 Indicators of Education in the Russian Federation
5.10. EDUCATIONAL ATTAINMENT OF PEDAGOGICAL PERSONNEL AT INSTITUTIONS ENGAGED IN EDUCATIONAL ACTIVITIES WITHIN EDUCATIONAL PROGRAMMES OF PRESCHOOL EDUCATION, BABY AND CHILD CARE
(excluding external multiple jobholders and those employed under civil law contracts; at the end of the year; per cent)
2008 2010 2011 2012 2013 2014 2015
Total 100 100 100 100 100 100 100Education attained:
Higher 37.5 41.5 43.7 45.3 47.5 48.7 50.7of which pedagogical 35.2 38.9 40.9 42.3 44.3 45.5 47.7
Secondary vocational education – programmes for mid-career professionals 57.5 53.9 54.2 52.8 50.6 49.5 47.7
of which pedagogical 52.1 48.9 49.0 47.5 45.8 45.3 44.2

1685. Personnel
5.11. EDUCATIONAL ATTAINMENT OF PEDAGOGICAL PERSONNEL AT INSTITUTIONS ENGAGED IN EDUCATIONAL ACTIVITIES WITHIN EDUCATIONAL PROGRAMMES OF PRESCHOOL EDUCATION, BABY AND CHILD CARE BY POSITION: 2015(excluding external multiple jobholders and those employed under civil law contracts; at the end of the year; per cent)
Total Education attained
Higher of which pedagogical Secondary vocational education – programmes
for mid-career professionals
of which pedagogical
Total 100 50.7 47.7 47.7 44.2Of whom:
senior educators 100 82.6 80.2 16.9 16.2educators 100 44.7 41.8 53.5 49.7music instructors 100 44.6 40.5 54.3 48.4physical training instructors 100 58.8 54.6 39.9 37.0speech therapists 100 98.2 96.8 1.5 1.3speech pathlogists 100 98.6 97.9 1.2 1.1teacher-psychologists 100 96.9 93.5 2.7 2.3social teachers 100 77.2 70.6 21.4 18.4teachers with administrative duties 100 64.1 57.3 32.8 22.9teachers of supplementary education 100 67.9 60.5 30.9 26.4

169 Indicators of Education in the Russian Federation
5.12. PERCENTAGE DISTRIBUTION OF THE EMPLOYEES (PEDAGOGICAL PERSONNEL) AT INSTITUTIONS ENGAGED IN EDUCATIONAL ACTIVITIES WITHIN EDUCATIONAL PROGRAMMES OF PRESCHOOL EDUCATION, BABY AND CHILD CARE BY AGE
(excluding external multiple jobholders and those employed under civil law contracts; at the end of the year; full years as of January, 1)
0 10 20 30 40 50 60 70 80 90 100
4.7 11.0 57.4 12.0 9.2 5.72015
4.9 11.7 56.4 12.5 9.0 5.62014
5.4 12.1 55.8 12.7 8.7 5.32013
6.1 12.3 55.5 12.8 8.3 4.92012
6.9 12.6 53.9 13.8 8.3 4.62011
7.1 12.4 54.4 13.6 8.1 4.32010
7.3 12.4 55.3 13.5 7.9 3.72008
below 25
25–29
30–49
50–54
55–59
60 and over
Age, years:

1705. Personnel
5.13. PERCENTAGE DISTRIBUTION OF THE EMPLOYEES (PEDAGOGICAL PERSONNEL) AT INSTITUTIONS ENGAGED IN EDUCATIONAL ACTIVITIES WITHIN EDUCATIONAL PROGRAMMES OF PRESCHOOL EDUCATION, BABY AND CHILD CARE BY POSITION AND AGE: 2015
(excluding external multiple jobholders and those employed under civil law contracts; at the end of the year; full years as of January, 1)
0 10 20 30 40 50 60 70 80 90 100
4.7 11.0 28.7 15.5 13.2 12.0 9.2 5.7
4.9 29.1 22.5 17.0 12.1 8.6 5.0
4.8 11.6 29.2 15.1 13.2 12.0 9.0 5.2
3.9 6.2 18.8 13.5 13.2 16.7 15.7 12.0
7.3 13.0 29.6 16.4 12.0 10.4 7.5 3.9
3.2 9.2 30.6 20.6 13.1 9.3 7.2 6.7
3.4 9.8 26.5 20.0 14.0 10.8 8.0 7.5
6.7 16.4 37.2 16.6 8.9 6.5 4.2 3.5
6.1 14.5 29.0 14.3 10.2 7.8 8.9 9.2
7.8 10.4 25.0 13.0 16.1 9.9 9.9 7.8
7.1 13.7 26.6 14.2 11.3 10.7 8.8 7.6Teachers of supplementary education
Teachers with administrative duties
Social teachers
Teacher-psychologists
Speech pathologists
Speech therapists
Physical training instructors
Music instructors
Educators
Senior educators
Total
below 25
25–29
45–49
50–54
30–39
40–44
55–59
60 and over
Age, years:
0.8

171 Indicators of Education in the Russian Federation
5.14. NUMBER OF CHILDREN ATTENDING EDUCATIONAL INSTITUTIONS ENGAGED IN EDUCATIONAL ACTIVITIES WITHIN EDUCATIONAL PROGRAMMES OF PRESCHOOL EDUCATION, BABY AND CHILD CARE PER ONE EDUCATOR*
(at the end of the year)
0
2
4
6
8
10
12
14
10
2000
10
2005
11
2010
11
2011
12
2012
12
2013
13
2014
14
2015
Headcount
* Including senior educators.

1725. Personnel
5.15. PERSONNEL AT GENERAL EDUCATION INSTITUTIONS BY CATEGORY*(as of September, 20; thousand, headcount)
Personnel (excluding external multiple jobholders) External multiple jobholders
2011 2012 2013 2014 2015 2011 2012 2013 2014 2015
TotalTotal 2138.6 2130.3 2136.2 2215.8 2202.2 128.5 130.1 126.1 123.2 114.5Management/Administration 188.6 184.0 178.5 175.2 165.9 2.0 2.0 2.0 2.0 1.9Pedagogical personnel 1248.2 1251.6 1265.5 1316.2 1321.0 84.5 85.0 80.0 76.5 70.7Professional support personnel 105.4 110.1 113.4 128.0 130.2 7.0 7.3 7.6 8.0 7.4Maintenance personnel 596.5 584.6 578.9 596.4 585.0 35.0 35.8 36.4 36.7 34.5
General education institutions (excluding part-time (shift) general education institutions)Total 2116.0 2109.4 2117.9 2199.9 2189.4 119.3 122.2 120.6 118.7 111.2Management/Administration 185.4 180.9 175.8 172.9 164.1 1.9 1.9 1.9 1.9 1.8Pedagogical personnel 1234.9 1239.2 1254.6 1306.6 1313.1 76.3 78.0 75.4 72.7 67.8Professional support personnel 104.2 109.0 112.5 127.1 129.6 6.8 7.1 7.5 7.9 7.4Maintenance personnel 591.5 580.2 575.1 593.2 582.6 34.3 35.2 35.8 36.2 34.2
Part-time (shift) general education institutions**Total 22.6 20.9 18.4 15.9 12.8 9.2 7.9 5.4 4.4 3.3Management/Administration 3.2 3.0 2.7 2.3 1.8 0.1 0.1 0.1 0.1 0.1Pedagogical personnel 13.3 12.4 10.9 9.6 7.9 8.2 6.9 4.6 3.8 2.8Professional support personnel 1.1 1.1 0.9 0.8 0.7 0.2 0.2 0.1 0.1 0.1Maintenance personnel 4.9 4.4 3.8 3.2 2.4 0.7 0.7 0.6 0.5 0.3
* Here and below (tables 5.16, 5.17, 5.19–5.24, 5.27, 5.29, 5.30, pic. 5.18, 5.25, 5.26, 5.28, 5.31) – including the personnel of the structural subdivisions (branches). ** At the beginning of the respective academic year.

173 Indicators of Education in the Russian Federation
5.16. EMPLOYEES AT GENERAL EDUCATION INSTITUTIONS (EXCLUDING PART-TIME (SHIFT) GENERAL EDUCATION INSTITUTIONS) BY CATEGORY
(as of September, 20; thousand, headcount)
State and municipal institutions* Private institutions
2009 2010 2011 2012 2013 2014 2015 2011 2012 2013 2014 2015
Number of employees (excluding external multiple jobholders)Total 2257.8 2159.5 2086.8 2079.1 2086.6 2166.9 2155.2 29.2 30.3 31.3 32.9 34.2Management/Administration 193.5 188.2 182.1 177.5 172.3 169.3 160.4 3.3 3.4 3.5 3.6 3.8Pedagogical personnel 1286.4 1243.0 1217.1 1220.8 1235.5 1286.5 1292.4 17.8 18.4 19.1 20.2 20.7Professional support personnel 108.4 105.8 102.8 107.5 110.9 125.5 127.7 1.5 1.6 1.6 1.7 1.8Maintenance personnel 669.6 622.4 584.8 573.3 567.9 585.7 574.7 6.7 6.9 7.2 7.5 7.9
Number of external multiple jobholdersTotal 115.3 112.6 114.8 117.9 116.2 114.2 106.8 4.5 4.3 4.4 4.6 4.4Management/Administration 1.6 1.8 1.7 1.8 1.7 1.7 1.6 0.2 0.2 0.2 0.2 0.2Pedagogical personnel 70.5 70.1 72.6 74.5 71.9 69.2 64.4 3.7 3.5 3.5 3.5 3.4Professional support personnel 6.8 6.5 6.7 7.0 7.4 7.8 7.2 0.1 0.1 0.2 0.2 0.1Maintenance personnel 36.4 34.2 33.8 34.6 35.2 35.6 33.6 0.6 0.5 0.6 0.6 0.6
* The data for 2010 and the previous years concerning general education institutions are provided by the Ministry of Education and Science of the Russian Federation.

1745. Personnel
5.17. PEDAGOGICAL PERSONNEL AT GENERAL EDUCATION INSTITUTIONS BY POSITION(as of September, 20; thousand, headcount)
Total General education institutions (excluding part-time (shift)
general education institutions)
Part-time (shift) general education institutions*
2011 2012 2013 2014 2015 2011 2012 2013 2014 2015 2011 2012 2013 2014 2015
Number of employees (excluding external multiple jobholders)Total 1248.2 1251.6 1265.5 1316.2 1321.0 1234.9 1239.2 1254.6 1306.6 1313.1 13.3 12.4 10.9 9.6 7.9Teachers 1060.4 1054.8 1056.2 1076.2 1077.3 1048.2 1043.5 1046.2 1067.4 1070.0 12.1 11.3 10.0 8.8 7.2Speech therapists 10.6 10.6 11.1 13.1 13.4 10.6 10.6 11.1 13.1 13.4 0.0 0.0 0.0 0.0 0.0Industrial training instructors 3.0 2.6 2.2 2.1 1.6 2.8 2.5 2.2 2.0 1.6 0.1 0.1 0.1 0.1 0.1Teacher-psychologists 20.4 20.4 20.9 22.6 23.0 20.2 20.1 20.7 22.4 22.9 0.3 0.2 0.2 0.2 0.1Social teachers 17.9 17.5 17.7 17.9 17.6 17.5 17.2 17.5 17.7 17.4 0.4 0.3 0.3 0.2 0.2Educators 86.6 91.3 98.5 115.4 114.2 86.6 91.3 98.5 115.4 114.2 0.0 0.0 0.0 0.0 0.0Tutors 0.3 0.4 0.6 1.0 1.4 0.3 0.4 0.6 1.0 1.4 – 0.0 0.0 0.0 0.0Other pedagogical personnel 49.0 54.0 58.2 67.9 72.5 48.6 53.6 57.9 67.6 72.2 0.4 0.3 0.3 0.3 0.2
Number of external multiple jobholdersTotal 84.5 85.0 80.0 76.5 70.7 76.3 78.0 75.4 72.7 67.8 8.2 6.9 4.6 3.8 2.8Teachers 64.2 62.3 57.7 54.5 50.0 56.2 55.5 53.2 50.8 47.3 8.0 6.8 4.5 3.7 2.7Speech therapists 1.2 1.2 1.2 1.2 1.0 1.2 1.2 1.2 1.2 1.0 0.0 0.0 0.0 – –Industrial training instructors 0.3 0.3 0.2 0.2 0.2 0.3 0.2 0.2 0.2 0.1 0.0 0.0 0.0 0.0 0.0Teacher-psychologists 1.5 1.5 1.4 1.4 1.3 1.5 1.4 1.4 1.4 1.3 0.0 0.0 0.0 0.0 0.0Social teachers 0.4 0.4 0.4 0.3 0.3 0.4 0.4 0.3 0.3 0.3 0.0 0.0 0.0 0.0 0.0Educators 1.6 1.7 1.5 1.4 1.1 1.6 1.7 1.5 1.4 1.1 0.0 0.0 0.0 0.0 0.0Tutors 0.1 0.1 0.1 0.1 0.1 0.1 0.1 0.1 0.1 0.1 0.0 0.0 0.0 0.0 0.0Other pedagogical personnel 15.3 17.7 17.5 17.4 16.7 15.2 17.6 17.4 17.4 16.6 0.1 0.1 0.1 0.0 0.1
* At the beginning of the respective academic year.

175 Indicators of Education in the Russian Federation
5.18. STAFFING LEVEL AT GENERAL EDUCATION INSTITUTIONS: 2015(as of September, 20)
93 94 95 96 97 98 99 100
99.2
99.4
97.4
97.7
97.0
98.6
99.1
96.2
98.4
98.1
98.1
100
100
93.7
98.5
93.8
100
98.3
Other pedagogical personnel
Tutors
Educators
Social teachers
Teacher-psychologists
Industrial training instructors
Speech therapists
Teachers
Total
Other pedagogical personnel
Tutors
Educators
Social teachers
Teacher-psychologists
Industrial training instructors
Speech therapists
Teachers
Total
Per cent
General education institutions(excluding part-time (shift)general education institutions)
Part-time (shift) general education institutions*
* At the beginning of the 2015/2016 academic year.

1765. Personnel
5.19. PEDAGOGICAL PERSONNEL AT GENERAL EDUCATION INSTITUTIONS (EXCLUDING PART-TIME (SHIFT) GENERAL EDUCATION INSTITUTIONS) BY POSITION(as of September, 20; thousand, headcount)
State and municipal institutions* Private institutions
2009 2010 2011 2012 2013 2014 2015 2011 2012 2013 2014 2015
Number of employees (excluding external multiple jobholders)Total 1286.4 1243.0 1217.1 1220.8 1235.5 1286.5 1292.4 17.8 18.4 19.1 20.2 20.7Teachers 1086.5 1053.0 1034.5 1029.4 1031.7 1052.2 1054.6 13.7 14.1 14.5 15.2 15.5Speech therapists 11.9 10.9 10.4 10.3 10.8 12.7 13.1 0.3 0.3 0.3 0.3 0.3Industrial training instructors 4.3 3.4 2.8 2.5 2.2 2.0 1.6 0.0 0.0 0.0 0.0 0.0Teacher-psychologists 21.9 20.9 19.7 19.6 20.2 21.9 22.3 0.5 0.5 0.5 0.5 0.6Social teachers 19.6 18.3 17.5 17.2 17.4 17.6 17.3 0.1 0.1 0.1 0.1 0.1Educators 93.7 89.0 84.1 88.6 95.7 112.6 111.5 2.5 2.7 2.7 2.8 2.7Tutors 0.2 0.2 0.3 0.3 0.5 0.9 1.3 0.0 0.0 0.0 0.0 0.1Other pedagogical personnel 48.3 47.3 47.9 52.8 57.0 66.5 70.7 0.7 0.8 0.9 1.2 1.5
Number of external multiple jobholdersTotal 70.5 70.1 72.6 74.5 71.9 69.2 64.4 3.7 3.5 3.5 3.5 3.4Teachers 50.1 50.3 53.0 52.4 50.3 47.8 44.4 3.2 3.0 3.0 3.0 2.9Speech therapists 1.2 1.2 1.1 1.1 1.1 1.1 1.0 0.1 0.1 0.1 0.1 0.1Industrial training instructors 0.4 0.3 0.3 0.2 0.2 0.2 0.1 0.0 0.0 – – –Teacher-psychologists 1.7 1.5 1.4 1.4 1.3 1.3 1.2 0.1 0.1 0.1 0.1 0.1Social teachers 0.4 0.4 0.4 0.3 0.3 0.3 0.3 0.0 0.0 0.0 0.0 0.0Educators 1.8 1.6 1.5 1.6 1.5 1.3 1.1 0.1 0.1 0.0 0.1 0.0Tutors 0.0 0.1 0.1 0.1 0.1 0.1 0.1 0.0 0.0 0.0 0.0 0.0Other pedagogical personnel 14.8 14.8 14.9 17.3 17.1 17.0 16.3 0.3 0.3 0.3 0.4 0.4
* The data for 2010 and the previous years concerning general education institutions are provided by the Ministry of Education and Science of the Russian Federation.

177 Indicators of Education in the Russian Federation
5.20. FEMALE PROPORTION IN THE NUMBER OF PEDAGOGICAL PERSONNEL AT GENERAL EDUCATION INSTITUTIONS BY POSITION(excluding external multiple jobholders; as of September, 20)
Total General education institutions (excluding part-time (shift)
general education institutions)
Part-time (shift) general education institutions*
2011 2012 2013 2014 2015 2011 2012 2013 2014 2015 2011 2012 2013 2014 2015
Thousand, headcountTotal 1098.9 1100.1 1112.3 1160.8 1165.7 1087.8 1089.8 1103.3 1153.0 1159.4 11.1 10.3 9.0 7.8 6.3Teachers 930.6 925.0 926.0 943.8 943.3 920.4 915.6 917.8 936.6 937.6 10.1 9.4 8.3 7.1 5.7Speech therapists 10.5 10.5 10.9 12.9 13.3 10.5 10.5 10.9 12.9 13.3 0.0 0.0 0.0 0.0 0.0Industrial training instructors 0.5 0.5 0.4 0.4 0.4 0.5 0.4 0.4 0.4 0.3 0.1 0.0 0.0 0.0 0.0Teacher-psychologists 19.3 19.2 19.6 21.4 21.9 19.1 19.0 19.4 21.3 21.7 0.2 0.2 0.2 0.2 0.1Social teachers 17.0 16.6 16.6 16.9 16.7 16.6 16.3 16.4 16.7 16.5 0.4 0.3 0.3 0.2 0.2Educators 82.1 86.2 92.7 109.8 109.8 82.0 86.1 92.7 109.8 109.8 0.0 0.0 0.0 0.0 0.0Tutors 0.3 0.3 0.5 0.8 1.2 0.3 0.3 0.5 0.8 1.2 – 0.0 0.0 0.0 0.0Other pedagogical personnel 38.6 41.8 45.6 54.7 59.1 38.4 41.6 45.3 54.5 59.0 0.3 0.2 0.2 0.2 0.2
As a percentage of the total personnelTotal 88.0 87.9 87.9 88.2 88.2 88.1 87.9 87.9 88.2 88.3 83.7 83.3 82.9 81.6 79.4Teachers 87.8 87.7 87.7 87.7 87.6 87.8 87.7 87.7 87.7 87.6 83.7 83.3 82.8 81.6 79.3Speech therapists 98.6 98.7 98.5 98.7 98.9 98.6 98.7 98.5 98.7 98.9 100 100 100 100 100Industrial training instructors 18.3 17.8 18.7 21.0 21.9 17.0 16.6 17.8 20.1 21.3 46.0 49.5 42.4 41.6 34.8Teacher-psychologists 94.6 94.4 93.7 94.7 95.1 94.6 94.4 93.7 94.7 95.1 93.3 94.3 94.8 92.6 94.0Social teachers 94.7 94.4 93.6 94.5 95.0 94.7 94.4 93.6 94.5 95.0 96.7 96.6 96.2 94.1 95.9Educators 94.8 94.4 94.1 95.1 96.1 94.8 94.4 94.1 95.1 96.1 95.9 97.7 93.1 92.6 86.7Tutors 91.1 83.1 81.9 86.1 87.0 91.1 82.6 81.9 86.0 87.0 – 100 100 100 100Other pedagogical personnel 78.8 77.5 78.3 80.6 81.6 78.9 77.5 78.3 80.6 81.6 72.9 69.5 76.0 75.3 70.7
* At the beginning of the respective academic year.

1785. Personnel
5.21. FEMALE PROPORTION IN THE NUMBER OF PEDAGOGICAL PERSONNEL AT GENERAL EDUCATION INSTITUTIONS (EXCLUDING PART-TIME (SHIFT) GENERAL EDUCATION INSTITUTIONS) BY POSITION
(excluding external multiple jobholders; as of September, 20)
State and municipal institutions* Private institutions
2009 2010 2011 2012 2013 2014 2015 2011 2012 2013 2014 2015
Thousand, headcountTotal 1129.6 1096.2 1071.9 1073.5 1086.4 1135.3 1141.2 15.8 16.3 16.9 17.7 18.2Teachers 950.7 925.1 908.4 903.3 905.2 923.5 924.3 12.0 12.2 12.6 13.2 13.3Speech therapists 11.8 10.8 10.2 10.2 10.6 12.6 12.9 0.3 0.3 0.3 0.3 0.3Industrial training instructors 0.7 0.6 0.5 0.4 0.4 0.4 0.3 0.0 – 0.0 – –Teacher-psychologists 20.8 19.8 18.6 18.5 19.0 20.8 21.2 0.4 0.5 0.5 0.5 0.5Social teachers 18.5 17.4 16.5 16.2 16.3 16.6 16.5 0.1 0.1 0.1 0.1 0.1Educators 88.3 84.7 79.6 83.6 90.0 107.0 107.1 2.4 2.5 2.7 2.7 2.6Tutors 0.2 0.2 0.3 0.3 0.4 0.8 1.1 0.0 0.0 0.0 0.0 0.1Other pedagogical personnel 38.7 37.6 37.8 40.9 44.6 53.6 57.7 0.5 0.7 0.7 0.9 1.2
As a percentage of the total personnelTotal 87.8 88.2 88.1 87.9 87.9 88.2 88.3 88.8 88.2 88.2 87.9 87.8Teachers 87.5 87.9 87.8 87.7 87.7 87.8 87.6 87.4 87.1 87.0 86.5 86.3Speech therapists 98.7 98.8 98.6 98.7 98.5 98.7 98.9 99.3 98.6 98.7 97.4 97.4Industrial training instructors 15.6 16.4 17.0 16.6 17.8 20.1 21.3 66.7 – 25.0 – –Teacher-psychologists 95.2 95.0 94.7 94.5 93.8 94.8 95.3 92.4 91.5 90.6 91.4 89.3Social teachers 94.3 95.0 94.7 94.4 93.6 94.5 95.0 96.3 89.6 86.7 84.6 92.4Educators 94.2 95.1 94.7 94.4 94.0 95.1 96.1 97.7 95.0 97.0 97.1 97.3Tutors 93.0 87.8 90.9 83.6 81.5 85.7 86.4 92.7 73.0 86.5 93.3 97.1Other pedagogical personnel 80.1 79.5 78.9 77.5 78.3 80.6 81.6 78.1 80.6 77.7 81.0 83.2
* The data for 2010 and the previous years concerning general education institutions are provided by the Ministry of Education and Science of the Russian Federation.

179 Indicators of Education in the Russian Federation
5.22. EDUCATIONAL ATTAINMENT OF PEDAGOGICAL PERSONNEL AT GENERAL EDUCATION INSTITUTIONS(excluding external multiple jobholders; as of September, 20; per cent)
Total General education institutions (excluding part-time (shift)
general education institutions)
Part-time (shift) general education institutions*
2011 2012 2013 2014 2015 2011 2012 2013 2014 2015 2011 2012 2013 2014 2015
Total 100 100 100 100 100 100 100 100 100 100 100 100 100 100 100Education attained:
Higher 80.9 81.2 81.6 82.0 82.7 80.7 81.1 81.5 81.9 82.6 94.1 94.8 95.0 94.7 94.8of which pedagogical 75.8 75.9 76.3 76.7 77.5 75.7 75.8 76.2 76.6 77.4 86.7 87.5 87.5 86.2 86.8
Secondary vocational education – programmes for mid-career professionals 17.5 17.3 16.9 16.6 16.2 17.7 17.4 17.0 16.7 16.2 4.7 4.3 4.2 4.6 4.5
of which pedagogical 14.8 14.7 14.4 14.2 14.0 15.0 14.8 14.5 14.3 14.1 2.9 2.7 2.5 2.7 3.0
* At the beginning of the respective academic year.

1805. Personnel
5.23. EDUCATIONAL ATTAINMENT OF PEDAGOGICAL PERSONNEL AT GENERAL EDUCATION INSTITUTIONS (EXCLUDING PART-TIME (SHIFT) GENERAL EDUCATION INSTITUTIONS)
(excluding external multiple jobholders; as of September, 20; per cent)
State and municipal institutions* Private institutions
2009 2010 2011 2012 2013 2014 2015 2011 2012 2013 2014 2015
Total 100 100 100 100 100 100 100 100 100 100 100 100Education attained:
Higher 79.1 79.9 80.6 81.0 81.4 81.8 82.5 87.8 88.7 88.7 89.2 89.5of which pedagogical 74.2 74.8 75.6 75.7 76.2 76.6 77.4 78.3 79.7 79.9 80.5 80.5
Secondary vocational education – programmes for mid-career professionals 19.1 18.4 17.8 17.5 17.1 16.8 16.3 10.8 10.2 10.0 9.8 9.7
of which pedagogical 16.2 15.6 15.1 14.9 14.6 14.4 14.2 8.2 7.8 7.9 7.8 7.8
* The data for 2010 and the previous years concerning general education institutions are provided by the Ministry of Education and Science of the Russian Federation.

181 Indicators of Education in the Russian Federation
5.24. EDUCATIONAL ATTAINMENT OF PEDAGOGICAL PERSONNEL AT GENERAL EDUCATION INSTITUTIONS BY POSITION: 2015(excluding external multiple jobholders; as of September, 20; per cent)
Total Education attained
Higher of which pedagogical Secondary vocational education – programmes
for mid-career professionals
of which pedagogical
Total 100 82.7 77.5 16.2 14.0Teachers 100 86.1 81.9 13.2 11.8Speech therapists 100 97.6 95.1 2.1 1.7Industrial training instructors 100 43.1 23.1 40.0 9.4Teacher-psychologists 100 96.4 88.0 2.8 2.2Social teachers 100 80.7 69.0 17.4 12.7Educators 100 53.8 47.8 42.9 37.6Tutors 100 81.7 67.7 15.4 10.7Other pedagogical personnel 100 71.3 55.5 24.6 15.7

1825. Personnel
5.25. PERCENTAGE DISTRIBUTION OF THE PEDAGOGICAL PERSONNEL AT GENERAL EDUCATION INSTITUTIONS BY AGE(excluding external multiple jobholders; as of September, 20)
0 10 20 30 40 50 60 70 80 90 100
76.7 23.32015
77.6 22.42014
78.3 21.72013
79.3 20.72012
80.5 19.52011
76.8 23.22015
77.8 22.22014
78.5 21.52013
79.5 20.52012
80.7 19.32011
58.5 41.52015
59.3 40.72014
59.0 41.02013
61.2 38.82012
62.6 37.42011
General education institutions (excluding part-time (shift) general education institutions)
Part-time (shift) general education institutions*
Total
working age older than working age
Age:
* At the beginning of the respective academic year.

183 Indicators of Education in the Russian Federation
5.26. PERCENTAGE DISTRIBUTION OF THE PEDAGOGICAL PERSONNEL AT GENERAL EDUCATION INSTITUTIONS BY POSITION AND AGE: 2015
(excluding external multiple jobholders; as of September, 20)
0 10 20 30 40 50 60 70 80 90 100
76.8 23.2
76.1 23.9
83.2 16.8
75.4 24.6
90.9 9.1
76.6 23.4
79.6 20.4
76.8 23.2
77.4 22.6
58.5 41.5
57.1 42.9
66.7 33.3
71.0 29.0
83.9 16.1
67.9 32.1
53.3 46.7
66.7 33.3
72.8 27.2
Other pedagogical personnel
Tutors
Educators
Social teachers
Teacher-psychologists
Industrial training instructors
Speech therapists
Teachers
Total
Other pedagogical personnel
Tutors
Educators
Social teachers
Teacher-psychologists
Industrial training instructors
Speech therapists
Teachers
Total
General education institutions(excluding part-time (shift)general education institutions)
Part-time (shift)general education institutions*
working age older than working ageAge:
* Beginning of the 2015/2016 academic year.

1845. Personnel
5.27. TEACHERS AT GENERAL EDUCATION INSTITUTIONS BY SPECIALISATION(as of September, 20; thousand, headcount)
Total General education institutions (excluding part-time (shift)
general education institutions)
Part-time (shift) general education institutions*
2011 2012 2013 2014 2015 2011 2012 2013 2014 2015 2011 2012 2013 2014 2015
Number of teachers (excluding external multiple jobholders)Total 1060.4 1054.8 1056.2 1076.2 1077.3 1048.2 1043.5 1046.2 1067.4 1070.0 12.1 11.3 10.0 8.8 7.2Teachers of:
grades 1–4 278.9 282.1 286.2 294.1 298.0 278.9 282.1 286.2 294.1 298.0 – – – – –Russian language and literature 128.5 126.9 126.3 128.1 127.2 125.8 124.5 124.2 126.2 125.7 2.7 2.5 2.1 1.8 1.5non-Russian language and literature 19.5 19.3 19.3 20.1 19.3 19.4 19.2 19.2 20.0 19.2 0.1 0.1 0.1 0.1 0.1history, law, social science, economics 64.7 64.7 64.8 66.1 66.5 63.0 63.1 63.3 64.9 65.5 1.7 1.6 1.4 1.2 1.0mathematics 102.6 101.2 100.8 101.9 101.6 100.4 99.2 99.0 100.4 100.4 2.2 2.0 1.8 1.5 1.2informatics/computer science 30.1 29.9 29.9 30.2 29.8 29.8 29.6 29.5 29.9 29.6 0.3 0.4 0.3 0.3 0.2physics 35.9 35.1 34.4 34.5 34.0 34.8 34.1 33.5 33.7 33.3 1.1 1.0 0.9 0.8 0.6chemistry 29.7 28.8 28.2 28.0 27.2 28.6 27.8 27.3 27.2 26.6 1.1 1.0 0.9 0.7 0.6geography 33.8 33.1 32.6 32.9 32.6 33.2 32.5 32.1 32.4 32.3 0.7 0.6 0.5 0.5 0.4biology 34.2 33.5 33.3 33.4 33.0 33.5 32.9 32.7 32.9 32.6 0.7 0.6 0.5 0.5 0.4foreign languages 111.9 112.0 112.5 115.7 116,6 110.9 111.0 111.7 115.0 115.9 1.0 0.9 0.9 0.8 0.7music and singing 23.9 23.1 22.7 23.2 23.1 23.8 23.1 22.6 23.2 23.1 0.0 0.0 0.0 0.0 0.0art, drawing 19.6 19.0 18.8 19.0 18.7 19.5 19.0 18.8 18.9 18.6 0.0 0.0 0.0 0.0 0.0fundamentals of health and safety 17.3 15.7 15.0 15.0 14.6 17.2 15.6 14.9 14.9 14.6 0.1 0.1 0.1 0.1 0.1physical training 69.4 71.5 73.3 76.3 77.5 69.2 71.4 73.2 76.2 77.3 0.1 0.1 0.1 0.1 0.1labour instruction 48.8 46.8 46.1 45.9 45.2 48.7 46.7 46.0 45.8 45.1 0.2 0.1 0.1 0.1 0.1other subjects 11.6 11.9 12.0 12.0 12.4 11.4 11.8 11.8 11.8 12.2 0.2 0.2 0.2 0.2 0.1

185 Indicators of Education in the Russian Federation
(continued)
Total General education institutions (excluding part-time (shift)
general education institutions)
Part-time (shift) general education institutions*
2011 2012 2013 2014 2015 2011 2012 2013 2014 2015 2011 2012 2013 2014 2015
Number of external multiple jobholdersTotal 64.2 62.3 57.7 54.5 50.0 56.2 55.5 53.2 50.8 47.3 8.0 6.8 4.5 3.7 2.7Teachers of:
grades 1–4 2.6 2.9 2.9 2.9 2.7 2.6 2.9 2.9 2.9 2.7 – – – – –Russian language and literature 4.4 4.1 3.7 3.6 3.0 3.0 3.0 3.0 3.0 2.6 1.4 1.1 0.7 0.6 0.4non-Russian language and literature 0.6 0.6 0.6 0.5 0.5 0.4 0.5 0.5 0.5 0.4 0.1 0.1 0.1 0.1 0.1history, law, social science, economics 5.2 5.0 4.5 4.0 3.7 4.1 4.1 3.9 3.5 3.4 1.1 0.9 0.6 0.5 0.3mathematics 4.4 4.2 3.7 3.4 3.1 3.2 3.1 3.1 2.9 2.7 1.2 1.0 0.6 0.5 0.3informatics/computer science 4.1 4.0 3.7 3.5 3.3 3.7 3.6 3.4 3.2 3.0 0.4 0.4 0.3 0.3 0.3physics 4.5 4.4 4.1 3.9 3.6 3.7 3.7 3.7 3.6 3.4 0.8 0.7 0.4 0.3 0.2chemistry 4.2 4.0 3.7 3.6 3.3 3.4 3.4 3.3 3.2 3.1 0.8 0.6 0.4 0.3 0.2geography 2.4 2.3 2.0 1.9 1.8 1.9 1.9 1.8 1.7 1.6 0.5 0.4 0.3 0.2 0.2biology 2.5 2.3 2.1 2.0 1.9 2.0 1.9 1.9 1.8 1.7 0.5 0.5 0.3 0.2 0.1foreign languages 6.9 6.7 6.2 5.7 5.3 6.1 5.9 5.6 5.2 5.0 0.8 0.8 0.6 0.5 0.3music and singing 6.0 5.7 5.3 5.0 4.6 6.0 5.6 5.3 5.0 4.6 0.0 0.0 0.0 0.0 0.0art, drawing 2.1 2.0 1.9 1.8 1.5 2.1 2.0 1.8 1.7 1.5 0.0 0.0 0.0 0.0 0.0fundamentals of health and safety 1.2 1.2 1.1 1.0 1.0 1.2 1.1 1.0 1.0 0.9 0.1 0.1 0.1 0.1 0.0physical training 5.8 5.5 5.1 4.7 4.3 5.7 5.4 5.0 4.6 4.2 0.1 0.1 0.1 0.1 0.1labour instruction 3.7 3.6 3.4 3.3 3.0 3.6 3.5 3.4 3.2 2.9 0.0 0.0 0.0 0.1 0.0other subjects 3.5 4.0 3.8 3.8 3.5 3.5 3.9 3.8 3.8 3.5 0.1 0.1 0.1 0.0 0.0
* At the beginning of the respective academic year.

1865. Personnel
5.28. STAFFING LEVEL AT GENERAL EDUCATION INSTITUTIONS BY SPECIALISATION: 2015(as of September, 20)
General education institutions(excluding part-time (shift) general education institutions)
Per cent other subjects
labour instruction
physical training
fundamentals of health and safety
art, drawing
music and singing
foreign languages
biology
geography
chemistry
physics
informatics/computer science
mathematics
history, law, social science, economics
non-Russian language and literature
Russian language and literature
Grades 1–4
Teachers of:
Total
80 85 90 95 100
99.4
99.7
99.6
99.5
99.6
99.3
99.0
98.8
99.1
99.4
99.4
98.9
98.0
99.1
98.5
99.6
99.1
98.9
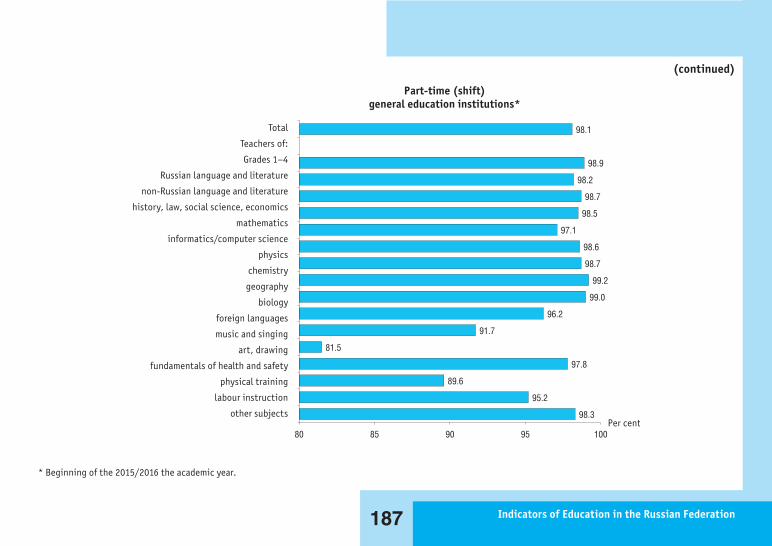
187 Indicators of Education in the Russian Federation
5.28. STAFFING LEVEL AT GENERAL EDUCATION INSTITUTIONS BY SPECIALISATION: 2015(as of September, 20)
General education institutions(excluding part-time (shift) general education institutions)
Per cent other subjects
labour instruction
physical training
fundamentals of health and safety
art, drawing
music and singing
foreign languages
biology
geography
chemistry
physics
informatics/computer science
mathematics
history, law, social science, economics
non-Russian language and literature
Russian language and literature
Grades 1–4
Teachers of:
Total
80 85 90 95 100
99.4
99.7
99.6
99.5
99.6
99.3
99.0
98.8
99.1
99.4
99.4
98.9
98.0
99.1
98.5
99.6
99.1
98.9
(continued)
80 85 90 95 100
98.1
98.9
98.2
98.7
98.5
97.1
98.6
98.7
99.2
99.0
96.2
91.7
81.5
97.8
89.6
95.2
98.3Per cent
Part-time (shift)general education institutions*
other subjects
labour instruction
physical training
fundamentals of health and safety
art, drawing
music and singing
foreign languages
biology
geography
chemistry
physics
informatics/computer science
mathematics
history, law, social science, economics
non-Russian language and literature
Russian language and literature
Grades 1–4
Teachers of:
Total
* Beginning of the 2015/2016 the academic year.

1885. Personnel
5.29. FEMALE PROPORTION IN THE NUMBER OF TEACHERS AT GENERAL EDUCATION INSTITUTIONS BY SPECIALISATION(as of September, 20)
Total General education institutions (excluding part-time (shift)
general education institutions)
Part-time (shift) general education institutions*
2011 2012 2013 2014 2015 2011 2012 2013 2014 2015 2011 2012 2013 2014 2015
Thousand, headcountTotal 930.6 925.0 926.0 943.8 943.3 920.4 915.6 917.8 936.6 937.6 10.1 9.4 8.3 7.1 5.7Teachers of:
grades 1–4 276.1 279.1 282.9 290.8 294.7 276.1 279.1 282.9 290.8 294.7 – – – – –Russian language and literature 125.4 123.6 123.0 124.8 123.9 123.0 121.3 121.1 123.1 122.5 2.5 2.3 2.0 1.7 1.3non-Russian language and literature 18.3 18.2 18.1 18.8 18.2 18.2 18.1 18.0 18.7 18.1 0.1 0.1 0.1 0.1 0.1history, law, social science, economics 52.9 52.7 52.7 53.7 53.6 51.7 51.5 51.7 52.8 52.9 1.2 1.1 1.0 0.9 0.7mathematics 96.6 94.9 94.6 95.4 94.7 94.7 93.2 93.0 94.1 93.7 1.9 1.7 1.6 1.3 1.0informatics/computer science 22.4 22.1 22.0 22.0 21.6 22.1 21.8 21.7 21.8 21.5 0.2 0.2 0.2 0.2 0.1physics 27.7 26.9 26.5 26.5 26.0 26.8 26.2 25.8 25.9 25.6 0.8 0.7 0.7 0.6 0.4chemistry 27.5 26.7 26.1 25.9 25.1 26.6 25.8 25.3 25.3 24.6 1.0 0.9 0.7 0.6 0.5geography 30.0 29.3 28.8 29.1 28.8 29.5 28.8 28.4 28.7 28.5 0.5 0.5 0.4 0.4 0.3biology 32.0 31.3 31.1 31.2 30.8 31.4 30.8 30.6 30.8 30.4 0.6 0.6 0.5 0.4 0.3foreign languages 107.8 107.6 107.9 111.0 111.5 106.9 106.8 107.1 110.3 111.0 0.9 0.8 0.7 0.7 0.6music and singing 21.1 20.6 20.3 20.8 20.8 21.1 20.6 20.3 20.8 20.7 0.0 0.0 0.0 0.0 0.0art, drawing 17.4 17.1 16.9 17.2 16.9 17.4 17.1 16.9 17.1 16.9 0.0 0.0 0.0 0.0 0.0fundamentals of health and safety 4.1 3.8 3.6 3.7 3.6 4.1 3.8 3.6 3.7 3.6 0.0 0.0 0.0 0.0 0.0physical training 31.9 32.7 33.3 34.5 34.6 31.9 32.7 33.3 34.4 34.6 0.0 0.0 0.0 0.0 0.0labour instruction 29.1 28.2 27.9 28.0 27.7 29.0 28.1 27.8 27.9 27.6 0.1 0.1 0.1 0.1 0.1other subjects 10.2 10.1 10.3 10.4 10.8 10.1 9.9 10.2 10.3 10.7 0.2 0.1 0.2 0.1 0.1

189 Indicators of Education in the Russian Federation
(continued)
Total General education institutions (excluding part-time (shift)
general education institutions)
Part-time (shift) general education institutions*
2011 2012 2013 2014 2015 2011 2012 2013 2014 2015 2011 2012 2013 2014 2015
As a percentage of the total personnelTotal 87.8 87.7 87.7 87.7 87.6 87.8 87.7 87.7 87.7 87.6 83.7 83.3 82.8 81.6 79.3Teachers of:
grades 1–4 99.0 98.9 98.8 98.9 98.9 99.0 98.9 98.8 98.9 98.9 – – – – –Russian language and literature 97.6 97.3 97.4 97.4 97.4 97.7 97.4 97.5 97.5 97.5 92.7 92.3 92.3 91.1 89.3non-Russian language and literature 93.9 94.0 93.7 93.8 94.2 94.0 94.0 93.8 93.9 94.4 80.8 80.0 77.3 80.5 70.9history, law, social science, economics 81.7 81.4 81.3 81.1 80.5 82.0 81.6 81.6 81.4 80.7 71.0 71.0 71.1 69.8 67.7mathematics 94.1 93.8 93.9 93.6 93.3 94.3 93.9 94.0 93.7 93.4 87.1 86.9 88.1 86.7 85.6informatics/computer science 74.3 73.6 73.5 72.9 72.6 74.3 73.7 73.6 73.0 72.7 69.4 69.5 68.7 66.7 58.5physics 77.0 76.7 76.9 76.8 76.5 77.1 76.8 77.0 76.9 76.6 73.4 72.3 73.1 70.8 69.9chemistry 92.7 92.9 92.4 92.7 92.4 92.8 93.0 92.6 92.8 92.6 89.1 88.4 87.1 86.7 85.5geography 88.8 88.5 88.4 88.4 88.1 88.9 88.6 88.5 88.5 88.3 83.9 83.4 80.6 79.9 76.3biology 93.6 93.5 93.4 93.5 93.2 93.6 93.6 93.5 93.6 93.3 91.3 89.8 89.3 88.3 85.4foreign languages 96.3 96.1 95.9 95.9 95.7 96.3 96.1 96.0 96.0 95.7 91.9 91.1 91.2 88.8 86.9music and singing 88.5 89.2 89.7 89.8 89.8 88.5 89.2 89.7 89.8 89.8 75.0 72.7 85.7 93.8 90.9art, drawing 89.1 90.1 90.1 90.5 90.8 89.1 90.1 90.1 90.5 90.8 89.7 90.9 100 86.4 95.5fundamentals of health and safety 23.9 24.3 24.0 24.9 24.7 23.8 24.2 23.9 24.8 24.6 40.9 40.7 40.9 36.8 33.0physical training 46.1 45.8 45.4 45.2 44.7 46.1 45.8 45.4 45.2 44.7 40.8 41.3 36.7 38.9 31.7labour instruction 59.7 60.3 60.5 61.0 61.2 59.6 60.3 60.5 60.9 61.2 66.4 70.7 72.1 72.7 71.0other subjects 88.0 84.6 86.2 86.9 87.4 87.9 84.5 86.3 87.0 87.3 88.8 88.7 78.5 80.2 90.7
* At the beginning of the respective academic year.

1905. Personnel
5.30. EDUCATIONAL ATTAINMENT OF TEACHERS AT GENERAL EDUCATION INSTITUTIONS BY AGE AND QUALIFICATION: 2015(excluding external multiple jobholders; as of September, 20; per cent)
Total Education attained Age
Higher of which pedagogical
Secondary vocational
education – programmes
for mid-career professionals
of which pedagogical
Working age Older than working age
Total 100 86.1 81.9 13.2 11.8 24.0 76.0Teachers of:
grades 1–4 100 74.3 72.8 25.2 24.7 19.3 80.7Russian language and literature 100 96.8 95.5 2.8 2.6 30.1 69.9non-Russian language and literature 100 91.4 90.0 8.1 7.8 19.3 80.7history, law, social science, economics 100 96.7 92.6 2.8 2.2 22.4 77.6mathematics 100 97.4 94.0 2.2 1.9 33.5 66.5informatics/computer science 100 91.9 76.7 7.2 5.2 11.3 88.7physics 100 98.3 92.2 1.2 0.9 33.7 66.3chemistry 100 98.6 92.8 0.9 0.6 34.2 65.8geography 100 96.2 92.3 3.2 2.7 27.9 72.1biology 100 97.3 93.0 2.2 1.8 29.3 70.7foreign languages 100 94.4 90.6 5.0 4.7 21.7 78.3music and singing 100 61.6 54.1 37.1 30.1 23.8 76.2art, drawing 100 71.6 61.8 26.9 21.6 22.1 77.9fundamentals of health and safety 100 82.2 62.0 16.0 10.1 24.0 76.0physical training 100 77.8 72.9 20.7 18.5 15.6 84.4labour instruction 100 69.1 55.9 28.0 16.7 29.5 70.5other subjects 100 81.8 71.9 16.2 12.5 29.0 71.0

191 Indicators of Education in the Russian Federation
5.31. NUMBER OF STUDENTS AT GENERAL EDUCATION INSTITUTIONS PER ONE TEACHER(at the beginning of the academic year)
0
2
4
6
8
10
12
1414
6
13
2000/2001
12
6
11
2005/2006
13
6
11
2010/2011
13
6
11
2011/2012
13
7
11
2012/2013
13
7
11
2013/2014
13
7
11
2014/2015
14
7
12
2015/2016
State and municipal general educationinstitutions (excluding part-time (shift) general education institutions)
Private general education institutions (excluding part-time (shift) general education institutions)
Part-time (shift) general education institutions
Headcount

1925. Personnel
5.32. GENERAL OVERVIEW OF TEACHERS AND SCHOOL PRINCIPALS*(as a percentage of those surveyed)
0
10
20
30
40
50
60
70
80
90
100
77.6
49.8
Female principals
52.557.9
Principals of pre-retirement
or retirement age (those aged 50 or over)
97.392.6
Principals with higher education
6.5
26.5
Principals who completed
principal training or school
administration programme or course
before taking up a position as principal
77.3
35.4
Principals with teaching
obligation and full-time
current employment
status as a principal
63.1
44.0
Principals who believe
that the teaching profession
is valued in society
94.1 95.6
Principals who are satisfied
with their job
Russia International average
School principals
* Here and below (pic. 5.33–5.38) – in accordance with the international survey of teachers and school principals (Teaching and Learning International Survey (TALIS 2013)); data source for international average (IA), for the OECD average, for the nine high performing countries (Н9) and for the eight low performing countries (L8), retained in international comparison in the education sector– OECD, TALIS 2013 International Database (https://data.oecd.org).

193 Indicators of Education in the Russian Federation
(continued)
0
10
20
30
40
50
60
70
80
90
100
85.6
68.8
Female teachers
39.6
30.8
Teachers of pre-retirement or retirement age
(those aged 50 or over)
89.9 89.6
Teachers with higher education
94.690.0
Teachers with
pedagogical education
91.6
73.7
Teachers who undertook
professional development in their
subject field(s) in the last 12 months
53.0
73.0
Teachers who teach
several subjects
44.0
32.0
Teachers who “agree” or “strongly agree” that
the teaching profession is valued in society
23.0
31.0
Teachers who “agree” or
“strongly agree” that it would
have been better to choose another
profession
Teachers
Russia International average

1945. Personnel
5.33. MEAN AGE OF TEACHERS AND SCHOOL PRINCIPALS (years)
0
10
20
30
40
50
60
50.3 51.5
School principals
45.542.9
Teachers
Russia
International average
5.34. TOTAL TEACHERS’ WORKING HOURS PER WEEK (hours spent during one complete calendar week)
0
10
20
30
40
50
60
46.3
38.7
Russia
International average

195 Indicators of Education in the Russian Federation
5.35. ALLOCATION OF WORKING TIME OF TEACHERS AND PRINCIPALS BY ACTIVITY (hours spent during one complete calendar week)
0
5
10
15
20
25
15.8
21.7
Curriculum and teaching-related
activities
10.6
15.0
Student interactions
10.9 11.2
Parent or guardian interactions
6.8 6.8
Interactions with local
and regional community
2.74.1
Other
Russia International average
School principals

1965. Personnel
(continued)
0
5
10
15
20
25 23.4
19.7
10.4
7.2
3.6 2.9
4.9 4.9
2.8 2.3 1.7 1.6
4.13.0
2.2 1.62.9 2.2 2.1 2.2
Teaching Individual planning
or preparation of lessons either at school or out
of school
Teamwork and dialogue
with colleagues
within the school
Marking/correcting of student
work
Counselling students
Participation in school
management
General administrative
work
Communication and
co-operation with parents or guardians
Engaging in extra-
curricular activities
Other
Russia International average
Teachers

197 Indicators of Education in the Russian Federation
5.36. TEACHERS REPORTING MODERATE OR HIGH LEVELS OF NEED FOR PROFESSIONAL DEVELOPMENT IN DIFFERENT AREAS (as a percentage of the total number of those surveyed)
0
10
20
30
40
50
60
7044
3943
36
Know
ledg
e/un
ders
tand
ing
of s
ubje
ct fi
eld(
s)
4743
4642
Peda
gogi
cal
com
pete
ncie
s in
teac
hing
subj
ect fi
eld
3834
4135
Know
ledg
e o
f the
cur
ricu
lum
4246
5045
Stud
ent e
valu
atio
n a
nd a
sses
smen
t p
ract
ice
58 5962
58
ICT
skill
s fo
r tea
chin
g
4043 45 46
Stud
ent
beh
avio
ur a
ndcl
assr
oom
man
agem
ent
2631 29
45
Scho
ol m
anag
emen
t a
nd a
dmin
istr
atio
n
3949
5450
Appr
oach
es to
indi
vidu
alis
ed le
arni
ng
3056 55
61
Teac
hing
stu
dent
s w
ith
spec
ial n
eeds
(wit
h lim
ited
hea
lth
capa
citi
es)
2436
3149
Teac
hing
in a
mul
ticu
ltur
al o
r mul
tilin
gual
sett
ing
45 47 49 50
Teac
hing
cr
oss-
curr
icul
ar sk
ills
4542
3852
Appr
oach
es to
dev
elop
ing
cro
ss-o
ccup
atio
nal
com
pete
ncie
s for
futu
re w
ork
or fu
ture
stu
dies
6256
5363
New
tech
nolo
gies
in th
e w
orkp
lace
41 42 4154
Stud
ent c
aree
r g
uida
nce
and
coun
selli
ng
OECDRussia H9 L8

1985. Personnel
5.37. BARRIERS TO PARTICIPATION IN PROFESSIONAL DEVELOPMENT(those who “agree” or “strongly agree” that specific issues present barriers to their participation
in professional development as a percentage of the total number of those surveyed)
0
10
20
30
40
50
38.8
27.7 27.6
20.6 19.5 18.214.9
49.246.9
42.8
37.835.0
30.6
11.1
Lack
of t
ime
due
to fa
mily
resp
onsi
bilit
ies
Prof
essi
onal
dev
elop
men
t c
onfli
cts w
ith
the
wor
k sc
hedu
leTh
ere
are
no in
cent
ives
for p
arti
cipa
ting
in su
ch a
ctiv
itie
sPr
ofes
sion
al d
evel
opm
ent
is to
o ex
pens
ive/
una
ffor
dabl
eTh
ere
is n
o re
leva
ntpr
ofes
sion
al d
evel
opm
ent o
ffer
ed
Ther
e is
a la
ck o
f em
ploy
er su
ppor
t
Do n
ot h
ave
the
prer
equi
site
s
Prof
essi
onal
dev
elop
men
t c
onfli
cts w
ith
the
wor
k sc
hedu
leTh
ere
are
no in
cent
ives
for p
arti
cipa
ting
in su
ch a
ctiv
itie
sPr
ofes
sion
al d
evel
opm
ent i
s to
o ex
pens
ive/
una
ffor
dabl
eTh
ere
is n
o re
leva
nt p
rofe
ssio
nal
dev
elop
men
t off
ered
Lack
of t
ime
due
to fa
mily
resp
onsi
bilit
ies
Ther
e is
a la
ck o
f em
ploy
er su
ppor
t
Do n
ot h
ave
the
prer
equi
site
s
International averageRussia

199 Indicators of Education in the Russian Federation
5.37. BARRIERS TO PARTICIPATION IN PROFESSIONAL DEVELOPMENT(those who “agree” or “strongly agree” that specific issues present barriers to their participation
in professional development as a percentage of the total number of those surveyed)
0
10
20
30
40
50
38.8
27.7 27.6
20.6 19.5 18.214.9
49.246.9
42.8
37.835.0
30.6
11.1
Lack
of t
ime
due
to fa
mily
resp
onsi
bilit
ies
Prof
essi
onal
dev
elop
men
t c
onfli
cts w
ith
the
wor
k sc
hedu
leTh
ere
are
no in
cent
ives
for p
arti
cipa
ting
in su
ch a
ctiv
itie
sPr
ofes
sion
al d
evel
opm
ent
is to
o ex
pens
ive/
una
ffor
dabl
eTh
ere
is n
o re
leva
ntpr
ofes
sion
al d
evel
opm
ent o
ffer
ed
Ther
e is
a la
ck o
f em
ploy
er su
ppor
t
Do n
ot h
ave
the
prer
equi
site
s
Prof
essi
onal
dev
elop
men
t c
onfli
cts w
ith
the
wor
k sc
hedu
leTh
ere
are
no in
cent
ives
for p
arti
cipa
ting
in su
ch a
ctiv
itie
sPr
ofes
sion
al d
evel
opm
ent i
s to
o ex
pens
ive/
una
ffor
dabl
eTh
ere
is n
o re
leva
nt p
rofe
ssio
nal
dev
elop
men
t off
ered
Lack
of t
ime
due
to fa
mily
resp
onsi
bilit
ies
Ther
e is
a la
ck o
f em
ploy
er su
ppor
t
Do n
ot h
ave
the
prer
equi
site
s
International averageRussia
5.38. OUTCOMES OF TEACHER APPRAISAL(teachers who gave corresponding answers as a percentage of the total number of those surveyed)
0
10
20
30
40
50
18
8
In case of positive appraisal the teacher will get an increase in salary
47
43
If a teacher is found to be a poor performer he/she will face dismissal
or non-renewal of contract
Russia International average

2005. Personnel
5.39. PERSONNEL AT INSTITUTIONS FOR SUPPLEMENTARY GENERAL EDUCATION OF CHILDREN BY CATEGORY(at the end of the year; thousand, headcount)
Personnel (excluding external multiple jobholders) External multiple jobholders
2009 2010 2011 2012 2013 2014 2015 2009 2010 2011 2012 2013 2014 2015
Total 315.2 307.4 291.1 306.8 371.1 424.0 522.1 122.8 118.0 115.4 114.8 119.2 115.4 121.8Management/Administration 30.4 30.4 29.0 31.0 36.3 40.1 47.7 0.6 0.6 0.6 0.7 0.7 0.8 0.9Pedagogical personnel 192.8 185.5 175.5 183.2 218.1 245.6 304.2 110.4 105.7 103.4 101.8 102.7 97.2 100.1Professional support personnel 14.1 14.9 14.4 15.7 17.9 20.5 24.8 2.2 2.3 2.2 2.5 3.1 3.3 4.1Maintenance personnel 77.8 76.6 72.2 76.9 98.8 117.8 145.3 9.6 9.4 9.3 9.7 12.7 14.1 16.8
5.40. PEDAGOGICAL PERSONNEL AT INSTITUTIONS FOR SUPPLEMENTARY GENERAL EDUCATION OF CHILDREN BY POSITION(at the end of the year; thousand, headcount)
Personnel (excluding external multiple jobholders) External multiple jobholders
2009 2010 2011 2012 2013 2014 2015 2009 2010 2011 2012 2013 2014 2015
Total 192.8 185.5 175.5 183.2 218.1 245.6 304.2 110.4 105.7 103.4 101.8 102.7 97.2 100.1Teachers 2.1 1.6 1.3 1.9 4.6 6.6 7.7 1.3 1.6 1.5 1.3 1.7 2.1 2.2Teachers of supplementary education 114.9 110.0 106.0 107.7 117.7 118.5 132.0 81.1 77.3 76.5 74.1 70.3 62.1 58.0Teachers with administrative duties 9.9 9.6 9.5 9.5 9.7 9.9 9.7 1.6 1.5 1.6 1.6 1.5 1.2 1.2Social teachers 0.7 0.6 0.7 0.5 0.5 0.5 0.7 0.2 0.1 0.1 0.1 0.1 0.1 0.1Teachers of physical training 41.0 39.1 34.9 37.5 49.1 57.5 72.9 19.9 18.9 17.5 17.6 20.2 21.0 23.2Methodologists 13.0 12.7 12.1 11.9 13.3 14.2 15.5 2.0 2.0 1.9 1.9 2.1 1.8 1.8Other pedagogical personnel 11.3 11.8 11.0 14.2 23.2 38.4 65.7 4.2 4.2 4.2 5.2 6.8 9.0 13.5

201 Indicators of Education in the Russian Federation
5.41. STAFFING LEVEL AT INSTITUTIONS FOR SUPPLEMENTARY GENERAL EDUCATION OF CHILDREN: 2015(at the end of the year)
95 96 97 98 99 100
98.0
98.6
98.2
97.3
97.0
98.1
96.5
97.8 Other pedagogical personnel
Methodologists
Teachers of physical training
Social teachers
Teachers with administrative duties
Teachers of supplementary education
Teachers
Total
Per cent

2025. Personnel
5.42. FEMALE PROPORTION IN THE PEDAGOGICAL PERSONNEL AT INSTITUTIONS FOR SUPPLEMENTARY GENERAL EDUCATION OF CHILDREN BY POSITION
(excluding external multiple jobholders; at the end of the year)
Total, thousand, headcount As a percentage of the total personnel
2009 2010 2011 2012 2013 2014 2015 2009 2010 2011 2012 2013 2014 2015
Total 121.7 118.5 112.6 119.0 142.4 160.8 200.5 63.1 63.9 64.1 65.0 65.3 65.5 65.9Teachers 1.8 1.2 1.1 1.5 3.9 5.5 6.4 82.0 76.7 83.5 83.1 84.5 83.5 82.7Teachers of supplementary education 81.5 79.3 76.5 79.3 87.6 88.6 100.0 70.9 72.0 72.2 73.6 74.4 74.8 75.7Teachers with administrative duties 8.1 7.8 7.7 7.7 7.8 8.0 7.8 81.8 81.3 81.7 81.1 80.6 81.0 80.7Social teachers 0.6 0.6 0.5 0.5 0.5 0.5 0.6 87.8 90.5 67.2 89.5 87.4 90.9 82.7Teachers of physical training 11.5 10.9 9.1 9.9 14.1 16.0 21.1 28.1 27.9 25.9 26.4 28.8 27.8 29.0Methodologists 10.6 10.5 9.9 9.7 10.9 11.5 12.6 81.9 82.3 82.0 81.9 81.4 81.5 81.3Other pedagogical personnel 7.6 8.2 7.8 10.4 17.6 30.6 52.0 67.8 70.0 71.0 72.8 76.0 79.7 79.2
5.43. EDUCATONAL ATTAINMENT OF PEDAGOGICAL PERSONNEL AT INSTITUTIONS FOR SUPPLEMENTARY GENERAL EDUCATION OF CHILDREN
(excluding external multiple jobholders; at the end of the year; per cent)
2009 2010 2011 2012 2013 2014 2015
Total 100 100 100 100 100 100 100Education attained:
Higher 65.1 66.2 66.9 67.5 68.2 69.1 69.4of which pedagogical 50.9 51.3 51.8 52.1 53.4 53.9 55.5
Secondary vocational education – programmes for mid-career professionals 27.3 26.5 26.2 26.3 26.4 25.6 26.3
of which pedagogical 16.6 16.1 15.8 16.4 17.6 17.4 19.3

203 Indicators of Education in the Russian Federation
5.44. EDUCATONAL ATTAINMENT OF PEDAGOGICAL PERSONNEL AT INSTITUTIONS FOR SUPPLEMENTARY GENERAL EDUCATION OF CHILDREN BY POSITION: 2015
(excluding external multiple jobholders; at the end of the year; per cent)
Total Education attained
Higher of which pedagogical Secondary vocational education – programmes
for mid-career professionals
of which pedagogical
Total 100 69.4 55.5 26.3 19.3Teachers 100 68.4 60.7 30.6 26.4Teachers of supplementary education 100 66.0 51.7 30.3 21.5Teachers with administrative duties 100 70.9 47.1 23.3 12.3Social teachers 100 76.8 61.2 17.6 13.1Teachers of physical training 100 79.2 66.1 15.2 10.5Methodologists 100 88.0 67.4 9.1 5.4Other pedagogical personnel 100 60.9 49.2 34.4 28.4

2045. Personnel
5.45. PERCENTAGE DISTRIBUTION OF THE PEDAGOGICAL PERSONNEL AT INSTITUTIONS FOR SUPPLEMENTARY GENERAL EDUCATION OF CHILDREN BY AGE
(excluding external multiple jobholders; at the end of the year)
0 10 20 30 40 50 60 70 80 90 100
76.0 24.02015
77.4 22.62014
79.6 20.42013
81.6 18.42012
84.0 16.02011
85.2 14.82010
85.9 14.12009
working age older than working age
Age:
Per cent

205 Indicators of Education in the Russian Federation
5.46. PERCENTAGE DISTRIBUTION OF THE PEDAGOGICAL PERSONNEL AT INSTITUTIONS FOR SUPPLEMENTARY GENERAL EDUCATION OF CHILDREN BY POSITION AND AGE: 2015
(excluding external multiple jobholders; at the end of the year)
0 10 20 30 40 50 60 70 80 90 100
76.0 24.0
70.6 29.4
74.9 25.1
83.6 16.4
82.4 17.6
83.7 16.3
79.1 20.9
68.6 31.4 Other pedagogical personnel
Methodologists
Teachers of physical training
Social teachers
Teachers with administrative duties
Teachers of supplementary education
Teachers
Total
working age older than working age
Age:
Per cent

2065. Personnel
5.47. PERSONNEL AT VOCATIONAL EDUCATION INSTITUTIONS IMPLEMENTING SECONDARY VOCATIONAL EDUCATION PROGRAMMES FOR SKILLED WORKERS, JUNIOR TECHNICIANS AND EMPLOYEES BY CATEGORY*
(at the end of the year; thousand, headcount)
Total (excluding external multiple jobholders) External multiple jobholders
2009 2010 2011 2012 2013 2014 2015 2009 2010 2011 2012 2013 2014 2015
Total 185.6 159.0 133.9 106.1 73.9 55.9 35.4 9.4 8.1 6.8 5.7 3.9 2.7 1.5Management/Administration 19.1 16.3 13.9 11.1 8.0 6.0 4.0 0.1 0.1 0.1 0.0 0.0 0.0 0.0Pedagogical personnel 86.5 73.8 61.6 48.2 33.4 25.2 16.5 5.8 4.7 4.1 3.4 2.3 1.5 0.8Professional support personnel 15.2 12.9 11.4 9.0 6.1 4.4 2.8 0.6 0.6 0.4 0.4 0.3 0.2 0.1Maintenance personnel 64.7 56.0 47.0 37.7 26.4 20.3 12.1 2.9 2.8 2.2 1.9 1.3 1.0 0.6
* Here and below (tables. 5.48, 5.50–5.52, 5.55, pic. 5.49, 5.53, 5.54, 5.56, 5.57) the information concerning personnel is given only for institutions implementing programmes for skilled workers, junior technicians and employees (excluding institutions implementing both programmes for skilled workers, junior technicians and employees and programmes for mid-career professionals).

207 Indicators of Education in the Russian Federation
5.47. PERSONNEL AT VOCATIONAL EDUCATION INSTITUTIONS IMPLEMENTING SECONDARY VOCATIONAL EDUCATION PROGRAMMES FOR SKILLED WORKERS, JUNIOR TECHNICIANS AND EMPLOYEES BY CATEGORY*
(at the end of the year; thousand, headcount)
Total (excluding external multiple jobholders) External multiple jobholders
2009 2010 2011 2012 2013 2014 2015 2009 2010 2011 2012 2013 2014 2015
Total 185.6 159.0 133.9 106.1 73.9 55.9 35.4 9.4 8.1 6.8 5.7 3.9 2.7 1.5Management/Administration 19.1 16.3 13.9 11.1 8.0 6.0 4.0 0.1 0.1 0.1 0.0 0.0 0.0 0.0Pedagogical personnel 86.5 73.8 61.6 48.2 33.4 25.2 16.5 5.8 4.7 4.1 3.4 2.3 1.5 0.8Professional support personnel 15.2 12.9 11.4 9.0 6.1 4.4 2.8 0.6 0.6 0.4 0.4 0.3 0.2 0.1Maintenance personnel 64.7 56.0 47.0 37.7 26.4 20.3 12.1 2.9 2.8 2.2 1.9 1.3 1.0 0.6
* Here and below (tables. 5.48, 5.50–5.52, 5.55, pic. 5.49, 5.53, 5.54, 5.56, 5.57) the information concerning personnel is given only for institutions implementing programmes for skilled workers, junior technicians and employees (excluding institutions implementing both programmes for skilled workers, junior technicians and employees and programmes for mid-career professionals).
5.48. PEDAGOGICAL PERSONNEL AT VOCATIONAL EDUCATION INSTITUTIONS IMPLEMENTING SECONDARY VOCATIONAL EDUCATION PROGRAMMES FOR SKILLED WORKERS, JUNIOR TECHNICIANS AND EMPLOYEES BY POSITION
(at the end of the year; thousand, headcount)
Total (excluding external multiple jobholders) External multiple jobholders
2009 2010 2011 2012 2013 2014 2015 2009 2010 2011 2012 2013 2014 2015
Total 86.5 73.8 61.6 48.2 33.4 25.2 16.5 5.8 4.7 4.1 3.4 2.3 1.5 0.8Teachers 34.2 29.3 24.8 19.4 13.4 10.1 6.6 4.2 3.5 3.0 2.5 1.7 1.1 0.6Industrial training instructors 42.1 35.6 29.1 22.4 15.4 11.4 7.5 0.6 0.5 0.4 0.3 0.2 0.1 0.1Educators 3.6 3.2 2.7 2.2 1.6 1.3 0.9 0.2 0.1 0.1 0.1 0.0 0.0 0.0Social teachers 1.7 1.4 1.3 1.0 0.7 0.6 0.4 0.0 0.0 0.0 0.0 0.0 0.0 0.0Teacher-psychologists 1.2 1.0 0.8 0.7 0.5 0.4 0.2 0.1 0.0 0.0 0.0 0.0 0.0 0.0Methodologists 1.1 1.0 0.9 0.7 0.5 0.4 0.3 0.0 0.0 0.0 0.0 0,0 0.0 0.0Other pedagogical personnel 2.6 2.3 2.0 1.8 1.2 1.0 0.6 0.7 0.6 0.5 0.4 0.3 0.2 0.1

2085. Personnel
5.49. STAFFING LEVEL AT VOCATIONAL EDUCATION INSTITUTIONS IMPLEMENTING SECONDARY VOCATIONAL EDUCATION PROGRAMMES FOR SKILLED WORKERS, JUNIOR TECHNICIANS AND EMPLOYEES BY POSITION: 2015
(at the end of the year)
60 65 70 75 80 85 90 95 100
72.0
68.5
74.4
81.0
80.6
73.7
75.6
64.7Other pedagogical personnel
Methodologists
Teacher-psychologists
Social teachers
Educators
Industrial training instructors
Teachers
Total
Per cent

209 Indicators of Education in the Russian Federation
5.50. FEMALE PROPORTION IN THE PEDAGOGICAL PERSONNEL AT VOCATIONAL EDUCATION INSTITUTIONS IMPLEMENTING SECONDARY VOCATIONAL EDUCATION PROGRAMMES FOR SKILLED WORKERS, JUNIOR TECHNICIANS AND EMPLOYEES BY POSITION
(excluding external multiple jobholders; at the end of the year)
Total, thousand, headcount As a percentage of the total personnel
2009 2010 2011 2012 2013 2014 2015 2009 2010 2011 2012 2013 2014 2015
Total 55.6 46.9 39.3 30.3 20.4 15.1 9.4 64.2 63.5 63.8 62.9 61.1 59.9 56.8Teachers 23.9 20.1 17.3 13.4 9.2 7.0 4.4 69.8 68.7 69.7 69.3 68.9 68.6 66.1Industrial training instructors 23.0 19.3 15.6 11.7 7.4 5.2 3.0 54.7 54.3 53.5 52.0 47.8 45.6 40.8Educators 3.3 2.9 2.4 1.9 1.4 1.1 0.7 90.5 90.3 89.3 86.6 87.5 82.9 81.4Social teachers 1.6 1.4 1.2 1.0 0.7 0.6 0.3 95.2 96.2 96.4 96.2 96.4 95.7 95.8Teacher-psychologists 1.1 0.9 0.8 0.6 0.5 0.3 0.2 94.1 95.7 95.9 95.4 95.2 93.6 94.3Methodologists 1.0 0.9 0.8 0.6 0.4 0.4 0.3 91.9 93.3 92.8 92.2 90.6 91.0 87.6Other pedagogical personnel 1.6 1.3 1.2 1.0 0.7 0.6 0.4 62.5 57.1 59.5 57.7 61.0 59.9 63.3

2105. Personnel
5.51. EDUCATIONAL ATTAIMNEMT OF THE PEDAGOGICAL PERSONNEL AT VOCATIONAL EDUCATION INSTITUTIONS IMPLEMENTING SECONDARY VOCATIONAL EDUCATION PROGRAMMES FOR SKILLED WORKERS, JUNIOR TECHNICIANS AND EMPLOYEES
(excluding external multiple jobholders; at the end of the year; per cent)
2009 2010 2011 2012 2013 2014 2015
Total 100 100 100 100 100 100 100Education attained:
Higher 59.6 60.4 61.9 62.6 64.3 65.5 67.0of which pedagogical 35.0 35.7 37.0 37.0 37.7 38.0 37.6
Secondary vocational education – programmes for mid-career professionals 31.0 30.8 30.2 29.6 28.7 28.6 28.1
of which pedagogical 8.9 9.0 8.7 8.7 8.5 8.4 8.2

211 Indicators of Education in the Russian Federation
5.52. EDUCATIONAL ATTAIMNEMT OF THE PEDAGOGICAL PERSONNEL AT VOCATIONAL EDUCATION INSTITUTIONS IMPLEMENTING SECONDARY VOCATIONAL EDUCATION PROGRAMMES FOR SKILLED WORKERS, JUNIOR TECHNICIANS
AND EMPLOYEES BY POSITION: 2015(excluding external multiple jobholders; at the end of the year; per cent)
Total Education attained
Higher of which pedagogical Secondary vocational education – programmes
for mid-career professionals
of which pedagogical
Total 100 67.0 37.6 28.1 8.2Teachers 100 89.0 59.9 9.8 3.5Industrial training instructors 100 46.6 15.2 45.5 11.6Educators 100 55.1 38.0 35.9 18.9Social teachers 100 77.6 52.9 19.3 8.1Teacher-psychologists 100 95.2 70.0 4.4 1.3Methodologists 100 92.4 56.7 6.2 0.7Other pedagogical personnel 100 66.2 40.2 28.0 9.3

2125. Personnel
5.53. PERCENTAGE DISTRIBUTION OF THE PEDAGOGICAL PERSONNEL AT VOCATIONAL EDUCATION INSTITUTIONS IMPLEMENTING SECONDARY VOCATIONAL EDUCATION PROGRAMMES FOR SKILLED WORKERS, JUNIOR TECHNICIANS
AND EMPLOYEES BY POSITION AND AGE(excluding external multiple jobholders; at the end of the year)
0 10 20 30 40 50 60 70 80 90 100
3.0 6.9 17.2 21.7 33.4 17.92015
3.1 7.6 17.5 22.2 32.8 16.82014
3.5 7.6 17.3 22.8 33.3 15.42013
4.4 8.6 17.7 23.6 31.8 13.92012
2015
2014
2013
2012
2011
2010
2009
69.3 30.7
70.7 29.3
71.7 28.3
74.2 25.8
75.3 24.7
82.4 17.6
77.5 22.5
Age:
working age
older than working age
Age, years:
below 25
25–29
30–39
60 and over
40–49
50–59
Per cent

213 Indicators of Education in the Russian Federation
5.54. PERCENTAGE DISTRIBUTION OF THE PEDAGOGICAL PERSONNEL AT VOCATIONAL EDUCATION INSTITUTIONS IMPLEMENTING SECONDARY VOCATIONAL EDUCATION PROGRAMMES FOR SKILLED WORKERS, JUNIOR TECHNICIANS AND EMPLOYEES
BY POSITION AND AGE: 2015(excluding external multiple jobholders; at the end of the year)
0 10 20 30 40 50 60 70 80 90 100
3.0 6.9 17.2 21.7 33.4 17.9
3.4 7.2 18.1 21.2 30.5 19.5
5.7 15.2 20.7 37.8 18.3
7.2 16.9 30.3 32.8 10.4
5.9 12.9 26.9 22.4 19.3 12.6
5.7 17.2 29.1 27.8 16.3 4.0
1.46.2 19.6 24.1 32.6 16.2
5.4 9.9 20.2 21.8 27.7 14.9
69.3 30.7
67.7 32.3
67.9 32.1
75.7 24.3
80.7 19.3
90.3 9.7
67.7 32.3
78.4 21.6 Other pedagogical personnel
Methodologists
Teacher-psychologists
Social teachers
Educators
Industrial training instructors
Teachers
Other pedagogical personnel
Methodologists
Teacher-psychologists
Social teachers
Educators
Industrial training instructors
Teachers
Total
Total
2.3
2.4
Age:
working age
older than working age
Age, years:
below 25
25–29
30–39
60 and over
40–49
50–59
Per cent
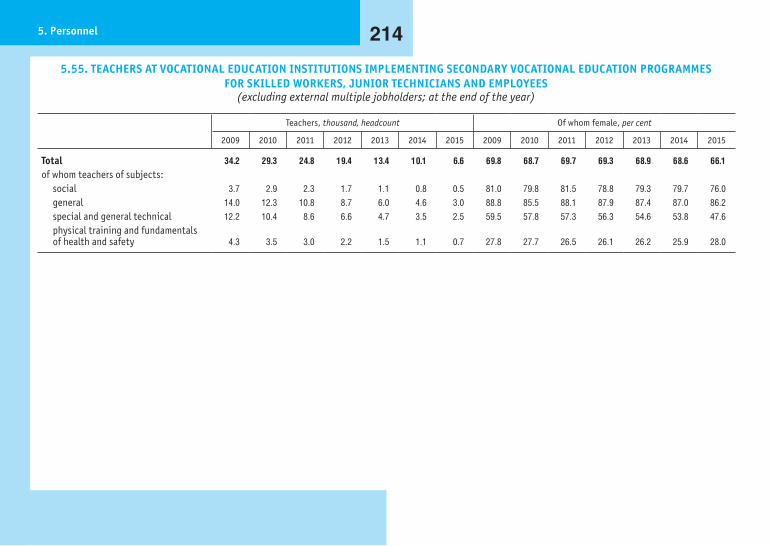
2145. Personnel
5.55. TEACHERS AT VOCATIONAL EDUCATION INSTITUTIONS IMPLEMENTING SECONDARY VOCATIONAL EDUCATION PROGRAMMES FOR SKILLED WORKERS, JUNIOR TECHNICIANS AND EMPLOYEES
(excluding external multiple jobholders; at the end of the year)
Teachers, thousand, headcount Of whom female, per cent
2009 2010 2011 2012 2013 2014 2015 2009 2010 2011 2012 2013 2014 2015
Total 34.2 29.3 24.8 19.4 13.4 10.1 6.6 69.8 68.7 69.7 69.3 68.9 68.6 66.1of whom teachers of subjects:
social 3.7 2.9 2.3 1.7 1.1 0.8 0.5 81.0 79.8 81.5 78.8 79.3 79.7 76.0general 14.0 12.3 10.8 8.7 6.0 4.6 3.0 88.8 85.5 88.1 87.9 87.4 87.0 86.2special and general technical 12.2 10.4 8.6 6.6 4.7 3.5 2.5 59.5 57.8 57.3 56.3 54.6 53.8 47.6physical training and fundamentals of health and safety 4.3 3.5 3.0 2.2 1.5 1.1 0.7 27.8 27.7 26.5 26.1 26.2 25.9 28.0

215 Indicators of Education in the Russian Federation
5.56. INDUSTRIAL TRAINING INSTRUCTORS AT VOCATIONAL EDUCATION INSTITUTIONS IMPLEMENTING SECONDARY VOCATIONAL EDUCATION PROGRAMMES FOR SKILLED WORKERS, JUNIOR TECHNICIANS AND EMPLOYEES WHOSE PROFESSIONAL SKILLS ARE
OF THE SAME LEVEL AND/OR HIGHER THAN THOSE OF THE GRADUATES(excluding external multiple jobholders; at the end of the year)
Per centThousand headcount
Thousand headcount
As a percentage of all industrial training instructors
34.7 28.4 23.2 15.6 10.2 7.3 4.7
82.4
79.7 79.7
69.3
66.164.1
63.1
50
55
60
65
70
75
80
85
0
5
10
15
20
25
30
35
2009 2010 2011 2012 2013 2014 2015

2165. Personnel
5.57. NUMBER OF STUDENTS AT VOCATIONAL EDUCATION INSTITUTIONS IMPLEMENTING SECONDARY VOCATIONAL EDUCATION PROGRAMMES FOR SKILLED WORKERS, JUNIOR TECHNICIANS AND EMPLOYEES PER ONE TEACHER
(INCLUDING INDUSTRIAL TRAINING INSTRUCTORS)*(at the end of the year)
0
2
4
6
8
10
12
14
11 11 11 1112
13 13
2009 2010** 2011** 2012** 2013** 2014** 2015**
Headcount
* Excluding external multiple jobholders. ** Including persons studying under a contract, excluding those who studied less than 500 hours.

217 Indicators of Education in the Russian Federation
5.58. PERSONNEL AT EDUCATIONAL INSTITUTIONS IMPLEMENTING SECONDARY VOCATIONAL EDUCATION PROGRAMMES FOR MID-CAREER PROFESSIONALS BY CATEGORY*
(excluding external multiple jobholders; at the beginning of the academic year; thousand, headcount)
2010/2011 2011/2012 2012/2013 2013/2014 2014/2015 2015/2016
TotalTotal 335.4 338.5 346.6 330.0 350.2 356.7Management/Administration 28.4 27.2 27.1 25.6 26.7 25.9Pedagogical personnel 154.8 156.5 161.3 153.5 164.9 172.3Professional support personnel 51.9 44.8 43.1 39.5 41.9 41.3Maintenance personnel 100.3 109.9 115.0 111.5 116.7 117.2
State and municipal institutionsTotal 326.7 329.7 337.7 317.6 337.6 344.1Management/Administration 27.1 26.0 25.9 24.2 25.2 24.6Pedagogical personnel 149.8 151.3 156.0 146.7 157.8 165.2Professional support personnel 50.8 43.8 42.1 37.9 40.3 39.8Maintenance personnel 99.0 108.5 113.6 108.9 114.2 114.6
Private institutionsTotal 8.8 8.8 8.9 12.3 12.6 12.6Management/Administration 1.2 1.2 1.2 1.4 1.5 1.3Pedagogical personnel 5.1 5.2 5.3 6.8 7.1 7.1Professional support personnel 1.1 1.0 1.0 1.6 1.6 1.5Maintenance personnel 1.3 1.4 1.4 2.6 2.5 2.6
* Here and below (tables 5.59–5.67, pic. 5.68) including employees of separate structural subdivisions (branches) of higher education institutions implementing programmes for mid-career professionals.

2185. Personnel
5.59. PEDAGOGICAL PERSONNEL AT EDUCATIONAL INSTITUTIONS IMPLEMENTING SECONDARY VOCATIONAL EDUCATION PROGRAMMES FOR MID-CAREER PROFESSIONALS BY POSITION
(excluding external multiple jobholders; at the beginning of the academic year; headcount)
2010/2011 2011/2012 2012/2013 2013/2014 2014/2015 2015/2016
TotalTotal 154828 156485 161302 153460 164901 172289Teachers 119950 118739 119662 112777 121069 126024Industrial training instructors 13594 15202 17167 17213 18568 19530Social teachers 1423 1562 1842 1937 2182 2395Teacher-psychologists 1785 1793 1879 1824 1985 2103Teachers with administrative duties 1665 1722 1778 1744 1903 2033Teachers of fundamentals of health and safety with administrative duties 1926 2013 2127 1992 2030 2072Physical training instructors 2510 2571 2622 2364 2412 2380Methodologists 4594 4730 4853 4473 4874 4920Tutors 195 178 259 241 298 341Others 7186 7975 9113 8895 9580 10491

219 Indicators of Education in the Russian Federation
(continued)
2010/2011 2011/2012 2012/2013 2013/2014 2014/2015 2015/2016
State and municipal institutionsTotal 149751 151326 156021 146683 157834 165165Teachers 115673 114383 115157 106828 114904 119838Industrial training instructors 13534 15137 17109 17138 18464 19465Social teachers 1407 1546 1826 1922 2160 2366Teacher-psychologists 1723 1733 1830 1784 1935 2048Teachers with administrative duties 1617 1655 1722 1681 1845 1969Teachers of fundamentals of health and safety with administrative duties 1832 1904 2024 1877 1912 1961Physical training instructors 2389 2442 2505 2232 2281 2237Methodologists 4311 4463 4596 4214 4641 4653Tutors 166 162 252 210 273 310Others 7099 7901 9000 8797 9419 10318

2205. Personnel
(continued)
2010/2011 2011/2012 2012/2013 2013/2014 2014/2015 2015/2016
Private institutionsTotal 5077 5159 5281 6777 7067 7124Teachers 4277 4356 4505 5949 6165 6186Industrial training instructors 60 65 58 75 104 65Social teachers 16 16 16 15 22 29Teacher-psychologists 62 60 49 40 50 55Teachers with administrative duties 48 67 56 63 58 64Teachers of fundamentals of health and safety with administrative duties 94 109 103 115 118 111Physical training instructors 121 129 117 132 131 143Methodologists 283 267 257 259 233 267Tutors 29 16 7 31 25 31Others 87 74 113 98 161 173

221 Indicators of Education in the Russian Federation
5.60. FEMALE PROPORTION IN THE NUMBER OF PEDAGOGICAL PERSONNEL AT EDUCATIONAL INSTITUTIONS IMPLEMENTING SECONDARY VOCATIONAL EDUCATION PROGRAMMES FOR MID-CAREER PROFESSIONALS(excluding external multiple jobholders; at the beginning of the academic year)
2010/2011 2011/2012 2012/2013 2013/2014 2014/2015 2015/2016
Thousand, headcountTotal 117.7 118.0 121.0 112.8 121.1 128.4State and municipal institutions 113.9 114.2 117.1 108.0 115.9 123.1Private institutions 3.8 3.8 3.9 4.9 5.2 5.4
As a percentage of the total personnelTotal 76.0 75.4 75.0 73.5 73.4 74.5State and municipal institutions 76.1 75.5 75.1 73.6 73.5 74.5Private institutions 74.8 73.8 74.1 72.2 73.0 75.1

2225. Personnel
5.61. FEMALE PROPORTION IN THE NUMBER OF PEDAGOGICAL PERSONNEL AT EDUCATIONAL INSTITUTIONS IMPLEMENTING SECONDARY VOCATIONAL EDUCATION PROGRAMMES FOR MID-CAREER PROFESSIONALS BY POSITION: 2015/2016
(excluding external multiple jobholders; at the beginning of the academic year; headcount)
Female proportion, headcount As a percentage of the total number of pedagogical personnel of the corresponding position
Total State and municipal institutions
Private institutions
Total State and municipal institutions
Private institutions
Total 128416 123063 5353 74.5 74.5 75.1Teachers 98807 94074 4733 78.4 78.5 76.5Industrial training instructors 10159 10115 44 52.0 52.0 67.7Social teachers 2235 2211 24 93.3 93.4 82.8Teacher-psychologists 1916 1865 51 91.1 91.1 92.7Teachers with administrative duties 1657 1604 53 81.5 81.5 82.8Teachers of fundamentals of health and safety with administrative duties 277 243 34 13.4 12.4 30.6Physical training instructors 717 669 48 30.1 29.9 33.6Methodologists 4412 4190 222 89.7 90.0 83.1Tutors 282 262 20 82.7 84.5 64.5Others 7954 7830 124 75.8 75.9 71.7

223 Indicators of Education in the Russian Federation
5.62. EDUCATIONAL ATTAINMENT OF PEDAGOGICAL PERSONNEL AT EDUCATIONAL INSTITUTIONS IMPLEMENTING SECONDARY VOCATIONAL EDUCATION PROGRAMMES FOR MID-CAREER PROFESSIONALS
(excluding external multiple jobholders; at the beginning of the academic year; per cent)
2010/2011 2011/2012 2012/2013 2013/2014 2014/2015 2015/2016
TotalTotal 100 100 100 100 100 100Education attained:
Higher 90.1 89.9 89.1 88.8 88.9 89.0of which pedagogical 53.2 53.8 53.3 52.3 52.8 53.1
Secondary vocational education – programmes for mid-career professionals 8.4 8.5 9.1 8.4 8.4 8.4
State and municipal institutionsTotal 100 100 100 100 100 100Education attained:
Higher 89.9 89.6 88.9 88.3 88.5 88.6of which pedagogical 53.2 53.7 53.3 52.3 52.8 53.1
Secondary vocational education – programmes for mid-career professionals 8.6 8.7 9.3 8.7 8.7 8.8
Private institutionsTotal 100 100 100 100 100 100Education attained:
Higher 96.5 97.2 97.2 97.7 97.3 98.0of which pedagogical 53.6 56.1 54.5 51.8 52.1 52.4
Secondary vocational education – programmes for mid-career professionals 3.0 2.1 2.1 1.7 1.6 1.2

2245. Personnel
5.63. EDUCATIONAL ATTAINMENT OF PEDAGOGICAL PERSONNEL AT EDUCATIONAL INSTITUTIONS IMPLEMENTING SECONDARY VOCATIONAL EDUCATION PROGRAMMES FOR MID-CAREER PROFESSIONALS BY POSITION: 2015/2016
(excluding external multiple jobholders; at the beginning of the academic year; per cent)
Total Education attained
Higher of which pedagogical Secondary vocational education – programmes
for mid-career professionals
Total 100 89.0 53.1 8.4Teachers 100 96.5 58.3 2.6Industrial training instructors 100 46.8 17.9 41.7Social teachers 100 87.4 61.4 10.1Teacher-psychologists 100 97.8 75.8 1.0Teachers with administrative duties 100 80.3 46.6 15.0Teachers of fundamentals of health and safety with administrative duties 100 93.4 44.9 5.0Physical training instructors 100 93.5 77.0 5.4Methodologists 100 95.7 59.1 2.8Tutors 100 83.3 49.0 12.9Others 100 72.1 44.0 19.9

225 Indicators of Education in the Russian Federation
5.64. TEACHERS AT EDUCATIONAL INSTITUTIONS IMPLEMENTING SECONDARY VOCATIONAL EDUCATION PROGRAMMES FOR MID-CAREER PROFESSIONALS
(at the beginning of the academic year)
2000/2001 2005/2006 2010/2011 2011/2012 2012/2013 2013/2014 2014/2015 2015/2016
TotalTeachers (excluding external multiple jobholders), thousands, headcount 131.9 146.2 120.0 118.7 119.7 112.8 121.1 126.0Teachers working as external multiple jobholders, thousand, headcount 32.5 40.6 36.8 33.1 31.4 27.3 27.8 27.3Foreign teachers and specialists, headcount … … 574 370 170 274 253 461Number of students per teacher on the staff (excluding external multiple jobholders), headcount 14 14 14 14 14 14 14 14
State and municipal institutionsTeachers (excluding external multiple jobholders), thousands, headcount 129.5 140.4 115.7 114.4 115.2 106.8 114.9 119.8Teachers working as external multiple jobholders, thousand, headcount 29.7 36.0 32.7 29.4 28.2 24.2 24.8 24.5Foreign teachers and specialists, headcount … … 548 327 169 232 218 362Number of students per teacher on the staff (excluding external multiple jobholders), headcount 14 14 14 14 14 14 14 14
Private institutionsTeachers (excluding external multiple jobholders), thousands, headcount 2.5 5.8 4.3 4.4 4.5 5.9 6.2 6.2Teachers working as external multiple jobholders, thousand, headcount 2.8 4.5 4.1 3.7 3.2 3.0 3.0 2.9Foreign teachers and specialists, headcount 4 12 26 43 1 42 35 99Number of students per teacher on the staff (excluding external multiple jobholders), headcount 11 13 15 15 16 16 18 19

2265. Personnel
5.65. FEMALE PROPORTION IN THE NUMBER OF TEACHERS AT EDUCATIONAL INSTITUTIONS IMPLEMENTING SECONDARY VOCATIONAL EDUCATION PROGRAMMES FOR MID-CAREER PROFESSIONALS
(excluding external multiple jobholders; at the beginning of the academic year)
2000/2001 2005/2006 2010/2011 2011/2012 2012/2013 2013/2014 2014/2015 2015/2016
Thousand, headcountTotal … … 95.7 94.3 94.8 87.4 93.5 98.8State and municipal institutions 96.9 107.4 92.4 91.0 91.4 83.0 88.9 94.1Private institutions … … 3.3 3.3 3.4 4.4 4.6 4.7
As a percentage of the total number of teachersTotal … … 79.7 79.4 79.2 77.5 77.2 78.4State and municipal institutions 74.9 76.5 79.9 79.5 79.4 77.7 77.4 78.5Private institutions … … 76.1 76.6 76.0 73.5 74.4 76.5

227 Indicators of Education in the Russian Federation
5.66. TEACHERS AT EDUCATIONAL INSTITUTIONS IMPLEMENTING SECONDARY VOCATIONAL EDUCATION PROGRAMMES FOR MID-CAREER PROFESSIONALS HAVING SCIENTIFIC DEGREES AND/OR ACADEMIC STATUS
(excluding external multiple jobholders; at the beginning of the academic year; headcount)
2010/2011 2011/2012 2012/2013 2013/2014 2014/2015 2015/2016
TotalHaving a scientific degree:
Doctor of Sciences 169 141 178 339 314 255Candidate of Sciences 3132 3410 3897 4703 5022 5203
Having the academic status of:Professor 138 150 173 285 259 185Assistant professor 683 750 1069 1444 1439 1309
State and municipal institutionsHaving a scientific degree:
Doctor of Sciences 96 74 122 185 179 131Candidate of Sciences 2478 2715 3126 3399 3787 3933
Having the academic status of:Professor 76 83 120 166 155 109Assistant professor 392 483 799 891 923 770
Private institutionsHaving a scientific degree:
Doctor of Sciences 73 67 56 154 135 124Candidate of Sciences 654 695 771 1304 1235 1270
Having the academic status of:Professor 62 67 53 119 104 76Assistant professor 291 267 270 553 516 539
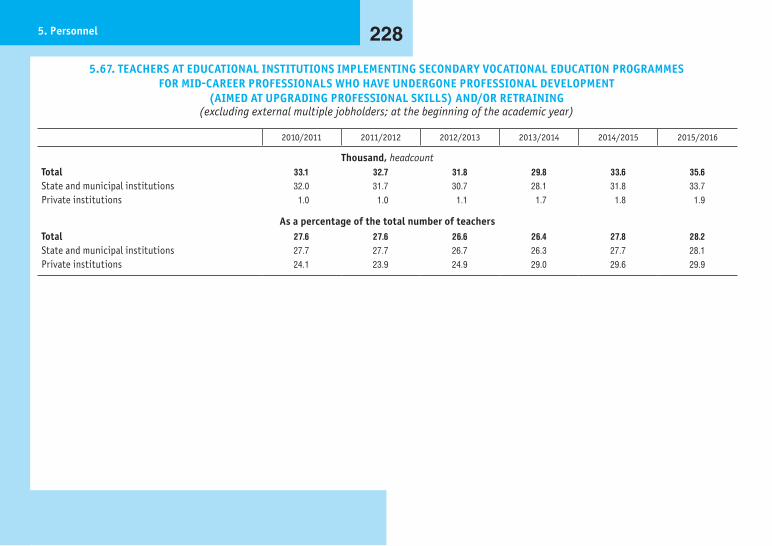
2285. Personnel
5.67. TEACHERS AT EDUCATIONAL INSTITUTIONS IMPLEMENTING SECONDARY VOCATIONAL EDUCATION PROGRAMMES FOR MID-CAREER PROFESSIONALS WHO HAVE UNDERGONE PROFESSIONAL DEVELOPMENT
(AIMED AT UPGRADING PROFESSIONAL SKILLS) AND/OR RETRAINING(excluding external multiple jobholders; at the beginning of the academic year)
2010/2011 2011/2012 2012/2013 2013/2014 2014/2015 2015/2016
Thousand, headcountTotal 33.1 32.7 31.8 29.8 33.6 35.6State and municipal institutions 32.0 31.7 30.7 28.1 31.8 33.7Private institutions 1.0 1.0 1.1 1.7 1.8 1.9
As a percentage of the total number of teachersTotal 27.6 27.6 26.6 26.4 27.8 28.2State and municipal institutions 27.7 27.7 26.7 26.3 27.7 28.1Private institutions 24.1 23.9 24.9 29.0 29.6 29.9

229 Indicators of Education in the Russian Federation
5.68. PERCENTAGE DISTRIBUTION OF TEACHERS AT EDUCATIONAL INSTITUTIONS IMPLEMENTING SECONDARY VOCATIONAL EDUCATION PROGRAMMES FOR MID-CAREER PROFESSIONALS BY AGE
(excluding external multiple jobholders; at the beginning of the academic year; full years as of January, 1)
0 10 20 30 40 50 60 70 80 90 100
4.0 9.1 10.2 11.2 10.5 9.7 11.8 13.2 10.3 10.02015/20163.8 8.9 10.2 11.1 10.2 9.8 12.7 13.2 10.4 9.92014/20153.7 8.7 10.2 10.8 9.9 10.0 13.2 13.4 10.6 9.52013/20143.9 8.8 10.5 10.6 9.4 10.3 13.3 13.4 10.8 9.12012/20133.9 8.9 10.6 10.4 9.2 10.7 13.5 13.4 11.0 8.52011/20124.2 9.1 10.7 9.9 9.0 11.2 13.5 13.3 11.1 8.12010/2011
4.0 9.0 10.0 11.0 10.4 9.7 11.9 13.3 10.4 10.22015/20163.8 8.7 10.0 11.0 10.1 9.7 12.7 13.3 10.6 10.12014/20153.7 8.5 10.0 10.7 9.8 9.9 13.2 13.6 10.8 9.72013/20143.9 8.6 10.3 10.4 9.3 10.3 13.4 13.5 11.0 9.32012/20133.9 8.7 10.5 10.2 9.1 10.7 13.6 13.6 11.1 8.62011/20124.1 8.9 10.5 9.8 8.9 11.2 13.5 13.5 11.2 8.22010/2011
4.8 11.1 13.0 14.1 12.6 10.3 11.3 9.5 7.6 5.72015/20164.0 11.5 13.3 13.3 12.6 11.1 11.4 10.1 7.0 5.62014/20154.0 11.7 13.7 13.9 12.2 10.8 11.5 9.5 7.0 5.72013/20144.8 13.5 14.7 13.8 11.8 11.1 11.1 8.7 5.9 4.62012/20135.1 13.1 13.7 15.0 11.1 10.3 10.4 8.9 7.0 5.32011/20125.2 13.7 14.8 12.4 11.3 11.1 11.2 9.2 6.5 4.42010/2011
30–3435–39 65 and over
60–6446–4940–45
55–5950–54below 25
25–29
Age, years:
Per cent
Total
State and municipal institutions
Private institutions

2305. Personnel
5.69. PERSONNEL AT HIGHER EDUCATION INSTITUTIONS BY CATEGORY*(excluding external multiple jobholders; at the beginning of the academic year; thousand, headcount)
2010/2011 2011/2012 2012/2013 2013/2014 2014/2015 2015/2016
TotalTotal 903.4 886.2 880.2 824.0 779.4 724.5Management/Administration 26.5 27.2 28.9 27.2 26.6 24.0Pedagogical personnel 356.8 348.2 342.0 319.3 299.8 279.8Researchers 21.6 22.1 21.9 18.9 17.7 18.4Engineers and technicians 47.2 49.7 49.3 48.1 48.4 46.7Administrative personnel 96.1 94.7 96.9 90.9 87.1 83.8Operative personnel 16.1 14.6 13.0 13.1 14.0 11.7Professional support personnel 163.4 157.8 154.9 141.8 130.5 121.8Maintenance personnel 175.6 172.0 173.2 164.6 155.4 138.3
State and municipal institutionsTotal 837.4 826.3 820.4 764.6 723.2 676.1Management/Administration 22.9 23.6 25.1 23.6 23.1 21.1Pedagogical personnel 324.8 319.0 312.8 288.2 271.5 255.8Researchers 21.3 21.8 21.6 18.5 17.0 17.7Engineers and technicians 45.4 47.8 47.4 46.3 46.6 45.2Administrative personnel 88.2 87.5 90.3 85.3 81.1 78.2Operative personnel 14.9 14.0 12.3 12.4 13.4 11.3Professional support personnel 151.3 146.9 144.1 131.8 120.8 113.5Maintenance personnel 168.6 165.7 166.8 158.4 149.7 133.3
* Here and below (tables 5.70–5.75, pic. 5.76) – including employees of branches.

231 Indicators of Education in the Russian Federation
(continued)
2010/2011 2011/2012 2012/2013 2013/2014 2014/2015 2015/2016
Private institutionsTotal 66.0 59.9 59.8 59.4 56.2 48.3Management/Administration 3.7 3.6 3.8 3.7 3.5 2.9Pedagogical personnel 32.0 29.2 29.2 31.1 28.2 23.9Researchers 0.3 0.3 0.3 0.4 0.7 0.8Engineers and technicians 1.8 1.8 1.9 1.7 1.8 1.5Administrative personnel 7.9 7.2 6.6 5.6 6.0 5.7Operative personnel 1.2 0.6 0.6 0.7 0.5 0.4Professional support personnel 12.1 10.9 10.9 10.0 9.7 8.2Maintenance personnel 7.0 6.3 6.5 6.2 5.7 5.0
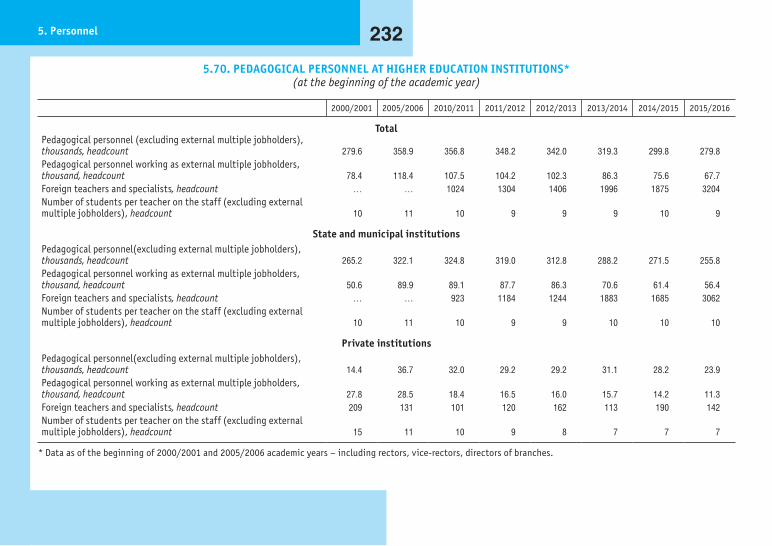
2325. Personnel
5.70. PEDAGOGICAL PERSONNEL AT HIGHER EDUCATION INSTITUTIONS*(at the beginning of the academic year)
2000/2001 2005/2006 2010/2011 2011/2012 2012/2013 2013/2014 2014/2015 2015/2016
TotalPedagogical personnel (excluding external multiple jobholders), thousands, headcount 279.6 358.9 356.8 348.2 342.0 319.3 299.8 279.8Pedagogical personnel working as external multiple jobholders, thousand, headcount 78.4 118.4 107.5 104.2 102.3 86.3 75.6 67.7Foreign teachers and specialists, headcount … … 1024 1304 1406 1996 1875 3204Number of students per teacher on the staff (excluding external multiple jobholders), headcount 10 11 10 9 9 9 10 9
State and municipal institutionsPedagogical personnel(excluding external multiple jobholders), thousands, headcount 265.2 322.1 324.8 319.0 312.8 288.2 271.5 255.8Pedagogical personnel working as external multiple jobholders, thousand, headcount 50.6 89.9 89.1 87.7 86.3 70.6 61.4 56.4Foreign teachers and specialists, headcount … … 923 1184 1244 1883 1685 3062Number of students per teacher on the staff (excluding external multiple jobholders), headcount 10 11 10 9 9 10 10 10
Private institutionsPedagogical personnel(excluding external multiple jobholders), thousands, headcount 14.4 36.7 32.0 29.2 29.2 31.1 28.2 23.9Pedagogical personnel working as external multiple jobholders, thousand, headcount 27.8 28.5 18.4 16.5 16.0 15.7 14.2 11.3Foreign teachers and specialists, headcount 209 131 101 120 162 113 190 142Number of students per teacher on the staff (excluding external multiple jobholders), headcount 15 11 10 9 8 7 7 7
* Data as of the beginning of 2000/2001 and 2005/2006 academic years – including rectors, vice-rectors, directors of branches.

233 Indicators of Education in the Russian Federation
5.71. PEDAGOGICAL PERSONNEL AT HIGHER EDUCATION INSTITUTIONS BY POSITION(excluding external multiple jobholders; at the beginning of the academic year)
2010/2011 2011/2012 2012/2013 2013/2014 2014/2015 2015/2016
TotalTotal 356.8 348.2 342.0 319.3 299.8 279.8Deans of faculties 6.7 6.3 5.9 5.5 5.2 4.8Heads of chairs 29.6 28.8 28.3 26.8 24.6 22.3Professors 40.4 41.1 42.4 41.9 40.2 38.1Assistant professors 149.1 149.2 149.9 144.1 140.9 134.5Senior teachers 76.5 72.9 69.4 61.5 55.2 50.3Teachers, assistants 54.6 49.9 46.2 39.6 33.7 29.8
State and municipal institutionsTotal 324.8 319.0 312.8 288.2 271.5 255.8Deans of faculties 5.5 5.2 4.9 4.6 4.3 4.1Heads of chairs 25.4 24.8 24.1 22.3 20.4 19.0Professors 36.2 36.9 37.9 36.2 35.4 34.0Assistant professors 137.5 138.6 139.1 132.0 129.1 123.8Senior teachers 69.6 66.8 63.6 56.2 50.5 46.3Teachers, assistants 50.7 46.6 43.2 37.0 31.9 28.6
Private institutionsTotal 32.0 29.2 29.2 31.1 28.2 23.9Deans of faculties 1.2 1.1 1.0 0.9 0.8 0.7Heads of chairs 4.1 4.0 4.1 4.6 4.2 3.4Professors 4.2 4.1 4.5 5.7 4.8 4.0Assistant professors 11.6 10.5 10.8 12.2 11.8 10.7Senior teachers 6.9 6.1 5.8 5.3 4.7 4.0Teachers, assistants 3.9 3.3 3.0 2.6 1.8 1.2

2345. Personnel
5.72. FEMALE PROPORTION IN THE PEDAGOGICAL PERSONNEL AT HIGHER EDUCATION INSTITUTIONS*(excluding external multiple jobholders; at the beginning of the academic year)
2000/2001 2005/2006 2010/2011 2011/2012 2012/2013 2013/2014 2014/2015 2015/2016
Thousand, headcountTotal 138.5 191.5 200.8 196.1 193.2 180.9 170.3 159.5State and municipal institutions 130.3 171.7 182.4 179.3 176.5 163.6 154.6 146.3Private institutions 8.2 19.8 18.4 16.8 16.7 17.3 15.7 13.2
As a percentage of the total personnelTotal 49.5 53.4 56.3 56.3 56.5 56.6 56.8 57.0State and municipal institutions 49.1 53.3 56.1 56.2 56.4 56.8 56.9 57.2Private institutions 57.1 53.8 57.6 57.6 57.1 55.4 55.7 55.3
* Data as of the beginning of 2000/2001 and 2005/2006 academic years – including rectors, vice-rectors, directors of branches.

235 Indicators of Education in the Russian Federation
5.73. FEMALE PROPORTION IN THE PEDAGOGICAL PERSONNEL AT HIGHER EDUCATION INSTITUTIONS BY POSITION: 2015/2016(excluding external multiple jobholders; at the beginning of the academic year)
Female proportion, headcount As a percentage of the total personnel
Total State and municipal institutions
Private institutions
Total State and municipal institutions
Private institutions
Total 159.5 146.3 13.2 57.0 57.2 55.3Deans of faculties 2.2 1.7 0.5 45.0 41.8 63.3Heads of chairs 9.9 8.2 1.7 44.2 43.0 51.0Professors 12.5 11.4 1.2 32.9 33.4 28.6Assistant professors 79.6 73.4 6.3 59.2 59.2 59.0Senior teachers 35.4 32.6 2.8 70.4 70.4 70.5Teachers, assistants 19.9 19.1 0.8 66.9 66.8 69.6

2365. Personnel
5.74. PEDAGOGICAL PERSONNEL AT HIGHER EDUCATION INSTITUTIONS HAVING SCIENTIFIC DEGREES AND/OR ACADEMIC STATUS(at the beginning of the academic year; thousand, headcount)
2000/2001 2005/2006 2010/2011 2011/2012 2012/2013 2013/2014 2014/2015 2015/2016
TotalHaving a scientific degree:
Doctor of Sciences 29.8 43.2 44.0 44.8 45.0 45.1 44.1 42.4Candidate of Sciences 131.3 172.1 185.5 183.6 183.0 174.6 169.2 160.0
Having the academic status of:Professor 28.7 38.5 35.8 35.9 35.6 34.5 33.1 30.7Assistant professor 94.2 112.7 115.7 115.7 115.2 109.4 106.7 100.3
State and municipal institutionsHaving a scientific degree:
Doctor of Sciences 28.0 37.3 40.2 41.1 41.0 39.7 39.4 38.4Candidate of Sciences 125.4 155.3 169.2 168.5 167.8 157.8 152.8 145.5
Having the academic status of:Professor 27.0 33.3 32.6 32.8 32.3 29.9 29.2 27.5Assistant professor 89.8 102.2 106.7 107.3 106.6 100.0 97.4 92.2
Private institutionsHaving a scientific degree:
Doctor of Sciences 1.7 5.9 3.8 3.7 4.0 5.3 4.7 4.0Candidate of Sciences 5.9 16.8 16.3 15.0 15.2 16.8 16.3 14.4
Having the academic status of:Professor 1.8 5.2 3.2 3.1 3.3 4.6 3.9 3.2Assistant professor 4.4 10.5 9.0 8.4 8.5 9.3 9.3 8.1

237 Indicators of Education in the Russian Federation
5.75. PEDAGOGICAL PERSONNEL AT HIGHER EDUCATION INSTITUTIONS WHO HAVE UNDERGONE PROFESSIONAL DEVELOPMENT (AIMED AT UPGRADING PROFESSIONAL SKILLS) AND/OR RETRAINING
(excluding external multiple jobholders; at the beginning of the academic year)
2010/2011 2011/2012 2012/2013 2013/2014 2014/2015 2015/2016
Thousand, headcountTotal 78.0 77.5 81.9 87.6 87.0 90.5State and municipal institutions 70.0 70.7 74.8 79.0 73.6 81.8Private institutions 8.0 6.8 7.2 8.6 13.4 8.7
As a percentage of the total personnelTotal 21.8 22.2 24.0 27.4 29.0 32.3State and municipal institutions 21.5 22.2 23.9 27.4 27.1 32.0Private institutions 25.0 23.2 24.6 27.7 47.5 36.5

2385. Personnel
5.76. PERCENTAGE DISTRIBUTION OF THE PEDAGOGICAL PERSONNEL AT HIGHER EDUCATION INSTITUTIONS BY AGE(excluding external multiple jobholders; at the beginning of the academic year; full years as of January, 1)
0 10 20 30 40 50 60 70 80 90 100
1.16.5 10.8 13.1 11.4 8.9 9.8 10.5 10.0 18.0
1.4 7.1 11.4 13.0 10.6 8.6 10.0 10.5 9.9 17.5
1.5 7.6 12.0 12.6 10.0 8.6 10.1 10.5 9.9 17.1
1.7 8.2 12.6 12.2 9.5 8.9 10.2 10.5 9.8 16.4
2.0 8.9 12.9 11.8 9.1 9.1 10.3 10.5 10.0 15.4
2.39.5 13.1 11.3 8.7 9.3 10.4 10.5 10.1 14.8
1.16.7 10.9 13.0 11.3 8.8 9.6 10.3 10.1 18.2
1.5 7.4 11.5 12.9 10.4 8.5 9.8 10.4 10.0 17.7
1.6 7.9 12.1 12.6 9.8 8.5 9.9 10.5 9.9 17.1
1.8 8.3 12.6 12.1 9.3 8.7 10.1 10.5 9.9 16.8
2.1 9.0 12.9 11.8 8.9 8.9 10.1 10.5 10.1 15.8
2.49.6 13.0 11.2 8.5 9.1 10.2 10.5 10.3 15.3
0.54.5 9.8 13.5 12.9 10.6 11.7 11.8 9.1 15.7
0.7 4.8 10.9 13.8 12.5 9.8 11.5 11.3 8.9 15.7
1.0 5.3 11.2 12.6 11.8 9.0 12.0 10.9 9.1 17.2
1.4 6.9 13.1 12.7 11.7 10.8 12.1 10.4 8.8 12.1
1.6 7.7 13.4 12.8 11.3 11.1 11.7 10.4 8.9 11.1
1.88.7 13.5 12.3 10.4 11.2 12.1 10.8 8.9 10.4
2015/20162014/20152013/20142012/20132011/20122010/2011
2015/20162014/20152013/20142012/20132011/20122010/2011
2015/20162014/20152013/20142012/20132011/20122010/2011
30–3435–39 65 and over
60–6446–4940–45
55–5950–54below 25
25–29
Age, years:
Total
Per cent
State and municipal institutions
Private institutions

239 Indicators of Education in the Russian Federation
TECHNICAL NOTES
The data on the average annual number of the employed population (persons) in the economy show the direct work of the civil population. The data are collected once a year when prepar-ing a balance of manpower resources that integrates the data of organisations, materials of sample surveys of labour force, and data of executive authorities. The average annual number of employed population includes employed foreign citizens, both residents and nonresidents, on the territory of the Russian Fede-ration. The data for 2000, 2005 do not include the information concerning the Chechen Republic.
Average annual employment in the education sector is cal-culated by summing up the monthly average number of employ-ees for each month within a year and dividing the sum by 12.
Monthly average number of employees is calculated by sum-ming up the average number of employees per calender day and di-viding the sum by the number of calendar day in a month. Women on maternity and childcare leave, employees studying at educa-tional institutions and persons on unpaid additional leave, as well as educational institutions entrants who were on unpaid leave to take their entrance examinations are excluded from the aver-age number of employees. Part-time workers (wor king part-day or part-week) are included into the average number of employees in proportion to the time worked.
The number of employees of organizations (institutions) includes those working under a labour contract and perform-ing regu lar, temporary or seasonal work one day or more, both
actually working and absent from work owing to various reasons (absent on annual, additional, education leaves, sick leave; ma-ternity, childcare leave, etc.).
Staffing level is the percentage ratio of the number of filled positions to the number of all positions according to the number of total staff (headcount).
Pedagogical personnel are natural persons employed by an institution engaged in educational activity and involved in the education and development of students and/or the organ-isation of educational activity.
A teacher is an employee of an educational institution who is engaged in educational, scientific, methodological, disciplinary, and organisational activity.
Number of students following educational programmes per one teacher is an indicator characterising the number of students per one teacher. It is calculated as the proportion of educational institution enrolment to the number of teachers (excluding exter-nal multiple jobholders). For general education programmes im-plemented in part-time (shift) general education institutions, as well as for secondary vocational education programmes and higher education programmes (bachelor’s, specialist’s and master’s pro-grammes) the following calculation system is used: the enrolment of students is calculated as intramural full-time students enrol-ment plus 25% of intramural part-time students enrolment plus 10% of extramural students enrolment (part-time (shift) general education institutions – including external studies enrolment).

2405. Personnel
The Teaching and Learning International Survey (TALIS) (the international survey of teachers and school principals) is conducted by the OECD to provide comparable information on teachers and school principals in different countries once in five years. The survey includes over 30 countries, several of which are non-OECD economies. In 2013 Russia became a par-ticipating country (the main part of the survey was conducted in 2014).
The TALIS 2013 survey had responses of 4000 teachers of ba-sic general eduction and secondary general education, 198 school principals from 200 schools from 14 regions of the Russian Fede ration.
TALIS indicators provide the information concerning teacher and school principal characteristics, including the following:
• structural charateristics of teachers and principals – teachers and school principals are characterised by their age and gender, level of education, working hours per one complete calendar week and allocation of working time;
• teachers’ professional development describes the need for professional development in subject matter and pedagogy;
• teachers’ and principals’ beliefs and attitudes describe their job satisfaction with current work environment and with profession. The index of “job satisfaction” was described by two scales from the TALIS survey for all the participating countries. The index was cal-culated to have a standard deviation of 2.0 and the midpoint of 10.
In the present chapter, the data for 2014 (excluding tables 5.1, 5.6, pic. 5.2–5.5) and for 2015 are given including the information for the Republic of Crimea and the city of Sevastopol.

6. Conditions of Education

2426. Conditions of Education
6.1. FIXED ASSETS OF THE EDUCATION SECTOR*(at the end of the year)
2000 2005 2010 2011 2012 2013 2014 2015
Fixed assets of the education sector (at gross book value):billion roubles 472.8 1278.8 2700.0 2924.7 3266.8 3535.4 3807.1 4023.6percentage of the total fixed assets value of the national economy 2.7 3.1 2.9 2.7 2.7 2.6 2.6 2.5
Degree of fixed assets depreciation, per cent 34.9 43.8 53.2 54.3 54.3 53.9 52.5 48.0
* The data for 2000 are presented according to the Russian Classification of Economy Branches; since 2005 – according to the ISIC/NACE-compatible Russian Classification of Economic Activities.
6.2. QUANTITY INDEX OF THE FIXED ASSETS IN THE EDUCATION SECTOR*(in comparable prices**; as a percentage of the previous year
99
100
101
102
103
104
105
99.8
101.4
102.6
103.4103.8 103.8
103.0 102.9
2000 2005 2010 2011 2012 2013 2014*** 2015
* The data for 2000 are presented according to the Russian Classification of Economy Branches; since 2005 – according to the ISIC/NACE-compatible Russian Classification of Economic Activities.
** The data for 2000 are in comparable prices of 1990, for 2005, 2010–2013 – in comparable prices of 2000, for 2014, 2015 – in comparable prices of 2010. *** Without information for the Republic of Crimea and Sevastopol.
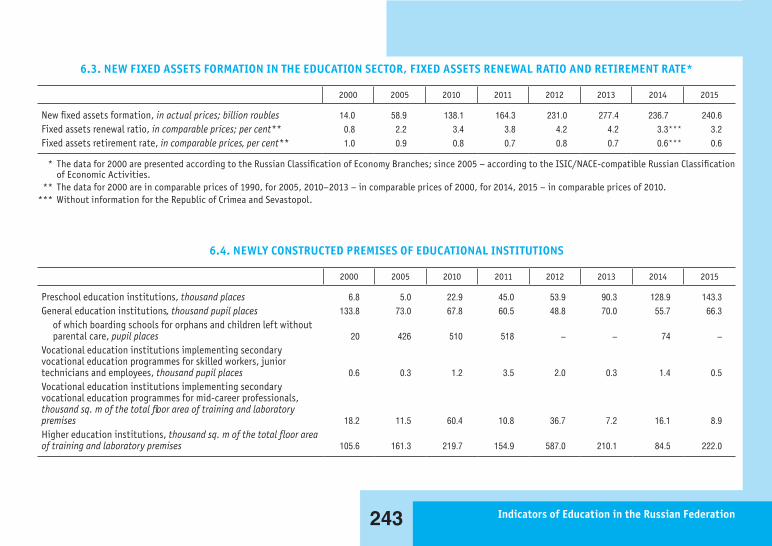
243 Indicators of Education in the Russian Federation
6.3. NEW FIXED ASSETS FORMATION IN THE EDUCATION SECTOR, FIXED ASSETS RENEWAL RATIO AND RETIREMENT RATE*
2000 2005 2010 2011 2012 2013 2014 2015
New fixed assets formation, in actual prices; billion roubles 14.0 58.9 138.1 164.3 231.0 277.4 236.7 240.6Fixed assets renewal ratio, in comparable prices; per cent** 0.8 2.2 3.4 3.8 4.2 4.2 3.3*** 3.2Fixed assets retirement rate, in comparable prices, per cent** 1.0 0.9 0.8 0.7 0.8 0.7 0.6*** 0.6
* The data for 2000 are presented according to the Russian Classification of Economy Branches; since 2005 – according to the ISIC/NACE-compatible Russian Classification of Economic Activities.
** The data for 2000 are in comparable prices of 1990, for 2005, 2010–2013 – in comparable prices of 2000, for 2014, 2015 – in comparable prices of 2010. *** Without information for the Republic of Crimea and Sevastopol.
6.4. NEWLY CONSTRUCTED PREMISES OF EDUCATIONAL INSTITUTIONS
2000 2005 2010 2011 2012 2013 2014 2015
Preschool education institutions, thousand places 6.8 5.0 22.9 45.0 53.9 90.3 128.9 143.3General education institutions, thousand pupil places 133.8 73.0 67.8 60.5 48.8 70.0 55.7 66.3
of which boarding schools for orphans and children left without parental care, pupil places 20 426 510 518 – – 74 –
Vocational education institutions implementing secondary vocational education programmes for skilled workers, junior technicians and employees, thousand pupil places 0.6 0.3 1.2 3.5 2.0 0.3 1.4 0.5Vocational education institutions implementing secondary vocational education programmes for mid-career professionals, thousand sq. m of the total floor area of training and laboratory premises 18.2 11.5 60.4 10.8 36.7 7.2 16.1 8.9Higher education institutions, thousand sq. m of the total floor area of training and laboratory premises 105.6 161.3 219.7 154.9 587.0 210.1 84.5 222.0

2446. Conditions of Education
6.5. EDUCATIONAL INSTITUTIONS NUMBER DYNAMICS
Preschool educationinstitutions
General educationinstitution
Vocational educationinstitutions
implementingsecondary vocational
education programmesfor skilled workers,junior techniciansand employees*
Vocational educationinstitutions
implementingsecondary vocational
education programmesfor mid-careerprofessionals
Higher educationinstitutions
Institutions offeringpostgraduate courses
Number
2015
2014
2010
2005
2000
0
10000
20000
30000
40000
50000
60000
70000
5132
9
4651
8
4511
1
4132
2
3953
3
6880
4
6317
4
5079
3
4484
8
4337
6
3893
3392
2356
1033
689 27
03
2905
2850
2909
2891
965
1068
1115
950
896
1362
1473
1568
1519
1446
* Vocational institions implementing programmes for skilled workers, junior technicians and employees (excluding institutions implementing both programmes for skilled workers, junior technicians and employees and programmes for mid-career professionals).

245 Indicators of Education in the Russian Federation
6.6. INSTITUTIONS ENGAGED IN EDUCATIONAL ACTIVITIES WITHIN EDUCATIONAL PROGRAMMES OF PRESCHOOL EDUCATION, BABY AND CHILD CARE* (at the end of the year)
2000 2005 2010 2011 2012 2013 2014 2015
Preschool education institutions 51329 46518 45111 44884 44326 43187 41322 39533Separate structural subdivisions (branches) of preschool education institutions … … 401 577 620 795 1100 1148Separate structural subdivisions (branches) of general education institutions … … 1136 1211 1504 1581 1808 2065Separate structural subdivisions (branches) of vocational education institutions and of higher education institutions … … … … … … 15 18Institutions with subdivisions (branches) engaged in educational activities within educational programmes of preschool education, baby and child care:
general education institutions … 4073 6353 6689 7250 7924 9440 10333vocational education institutions and higher education institutions … … … … … … 10 26educational institutions for supplementary education … … … … … … 87 91other institutions … … … … … … 120 132
* Including institutions under capital repair.

2466. Conditions of Education
6.7. PLACES AT INSTITUTIONS ENGAGED IN EDUCATIONAL ACTIVITIES WITHIN EDUCATIONAL PROGRAMMES OF PRESCHOOL EDUCATION, BABY AND CHILD CARE
(at the end of the year)
2000 2005 2010 2011 2012 2013 2014 2015
TotalPlaces at institutions engaged in educational activities within educational programmes of preschool education, baby and child care
thousand places 5231.9 4765.5 5031.4 5322.8 5708.9 6046.1 6453.2 6764.4per 1000 children aged 1–6 675 597 553 570 592 600 612 626
Urban areasPlaces at institutions engaged in educational activities within educational programmes of preschool education, baby and child care
thousand places 3862.2 3539.1 3796.2 4055.0 4366.9 4643.1 4960.1 5210.2per 1000 children aged 1–6 727 630 590 614 640 648 660 673
Rural areasPlaces at institutions engaged in educational activities within educational programmes of preschool education, baby and child care
thousand places 1369.7 1226.4 1235.2 1267.8 1342.0 1403.0 1493.0 1554.2per 1000 children aged 1–6 561 517 463 465 477 481 493 508
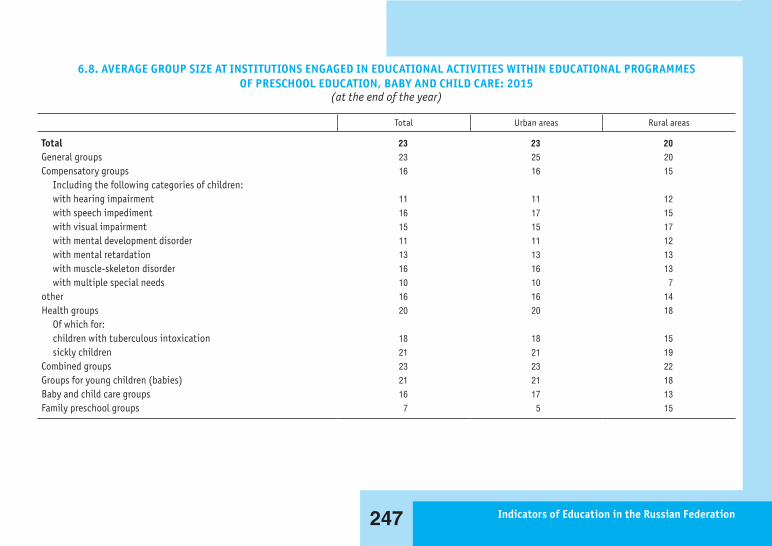
247 Indicators of Education in the Russian Federation
6.8. AVERAGE GROUP SIZE AT INSTITUTIONS ENGAGED IN EDUCATIONAL ACTIVITIES WITHIN EDUCATIONAL PROGRAMMES OF PRESCHOOL EDUCATION, BABY AND CHILD CARE: 2015
(at the end of the year)
Total Urban areas Rural areas
Total 23 23 20General groups 23 25 20Compensatory groups 16 16 15
Including the following categories of children:with hearing impairment 11 11 12with speech impediment 16 17 15with visual impairment 15 15 17with mental development disorder 11 11 12with mental retardation 13 13 13with muscle-skeleton disorder 16 16 13with multiple special needs 10 10 7
other 16 16 14Health groups 20 20 18
Of which for:children with tuberculous intoxication 18 18 15sickly children 21 21 19
Combined groups 23 23 22Groups for young children (babies) 21 21 18Baby and child care groups 16 17 13Family preschool groups 7 5 15

2486. Conditions of Education
6.9. TOTAL FLOOR AREA OF PRESCHOOL EDUCATION INSTITUTIONS*(at the end of the year)
2001 2004 2010 2011 2012 2013 2014 2015
Total floor area, million square metres 59.3 55.7 58.5 59.9 61.1 64.0 61.6 63.5
of which floor area, used directly for the educational institution's needs … … 49.7 51.2 52.2 55.2 52.4 54.1
of which floor area for groups 33.2 31.2 31.3 32.0 32.6 33.2 32.6 33.1
Total floor area, used directly for the educational institution's needs per 1 student, square metres … … 9.2 9.0 8.7 8.7 8.6 8.5
Urban areas … … 9.0 8.8 8.5 8.5 8.2 8.2
Rural areas … … 10.0 9.8 9.5 9.4 10.3 10.0
* Here and below (pic. 6.10, 6.12, table 6.11) since 2010 (pic. 6.10 – since 2007) the data are given including employees of separate structural subdivisions (branches) of preschool educaton institutions and of general education institutions, as well as of vocational education institutions (since 2015) and of higher education institution (since 2014), engaged in educational activitites in accordance with educational programmes of preschool education, baby and child care.
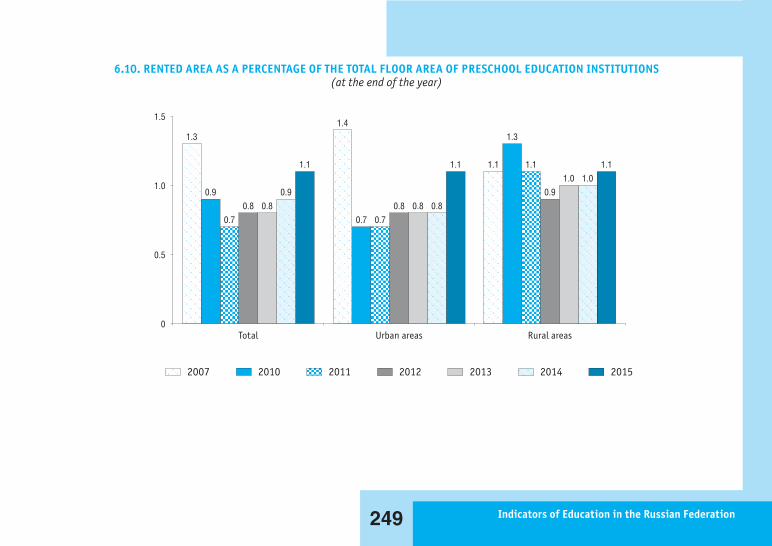
249 Indicators of Education in the Russian Federation
6.10. RENTED AREA AS A PERCENTAGE OF THE TOTAL FLOOR AREA OF PRESCHOOL EDUCATION INSTITUTIONS(at the end of the year)
Per cent
0
0.5
1.0
1.5
1.3
0.9
0.70.8 0.8
0.9
1.1
Total
1.4
0.7 0.70.8 0.8 0.8
1.1
Urban areas
1.1
1.3
1.1
0.91.0 1.0
1.1
Rural areas
2013 201520142012201120102007
6.9. TOTAL FLOOR AREA OF PRESCHOOL EDUCATION INSTITUTIONS*(at the end of the year)
2001 2004 2010 2011 2012 2013 2014 2015
Total floor area, million square metres 59.3 55.7 58.5 59.9 61.1 64.0 61.6 63.5
of which floor area, used directly for the educational institution's needs … … 49.7 51.2 52.2 55.2 52.4 54.1
of which floor area for groups 33.2 31.2 31.3 32.0 32.6 33.2 32.6 33.1
Total floor area, used directly for the educational institution's needs per 1 student, square metres … … 9.2 9.0 8.7 8.7 8.6 8.5
Urban areas … … 9.0 8.8 8.5 8.5 8.2 8.2
Rural areas … … 10.0 9.8 9.5 9.4 10.3 10.0
* Here and below (pic. 6.10, 6.12, table 6.11) since 2010 (pic. 6.10 – since 2007) the data are given including employees of separate structural subdivisions (branches) of preschool educaton institutions and of general education institutions, as well as of vocational education institutions (since 2015) and of higher education institution (since 2014), engaged in educational activitites in accordance with educational programmes of preschool education, baby and child care.

2506. Conditions of Education
6.11. TECHNICAL STATE AND AMENITIES OF PRESCHOOL EDUCATION INSTITUTIONS(at the end of the year)
2001 2004 2010 2011 2012 2013 2014 2015
Preschool education institutions, the buildings of which:require capital repair, thousand 16392 14281 10335 6700 5372 4431 3791 3552as a percentage of the total number of institutions 33.3 30.6 22.4 14.5 11.7 9.8 8.6 8.3
urban areas 29.6 27.3 19.5 12.3 9.9 8.2 7.2 7.3rural areas 37.9 34.9 26.4 17.5 14.2 12.0 10.5 9.9
are in the emergency state (in disrepair), thousand 626 444 527 252 92 67 127 150as a percentage of the total number of institutions 1.3 1.0 1.1 0.5 0.2 0.1 0.3 0.4
urban areas 0.8 0.8 1.0 0.4 0.2 0.1 0.2 0.2rural areas 1.9 1.2 1.4 0.8 0.3 0.2 0.5 0.5
have all kinds of amenities, thousand 39991 38139 40408 41170 41365 40847 40122 38568as a percentage of the total number of institutions 81.2 81.7 87.5 89.1 89.8 90.3 91.1 90.5
urban areas 95.0 95.1 96.6 96.7 96.7 96.8 97.1 95.9rural areas 63.7 64.2 75.1 78.4 80.2 81.5 82.8 82.7
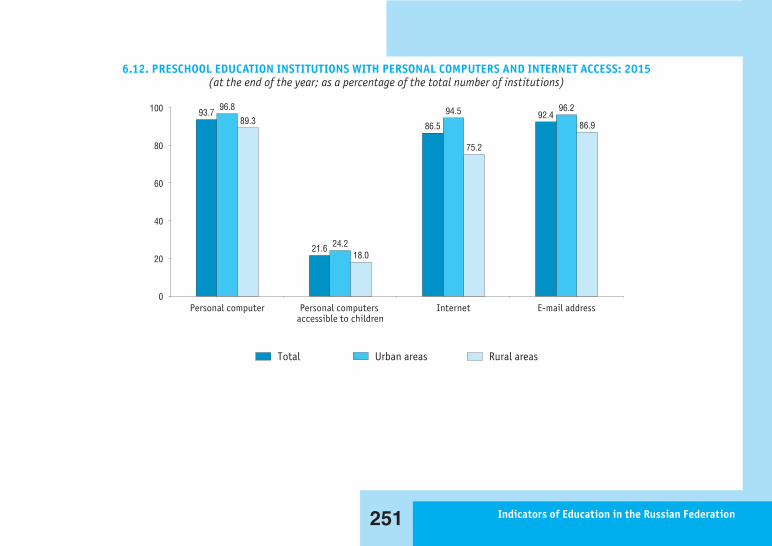
251 Indicators of Education in the Russian Federation
6.12. PRESCHOOL EDUCATION INSTITUTIONS WITH PERSONAL COMPUTERS AND INTERNET ACCESS: 2015(at the end of the year; as a percentage of the total number of institutions)
Total Urban areas Rural areas
0
20
40
60
80
100 93.796.8
89.3
Personal computer
21.6 24.218.0
Personal computers accessible to children
86.5
94.5
75.2
Internet
92.496.2
86.9
E-mail address

2526. Conditions of Education
6.13. GENERAL EDUCATION INSTITUTIONS(at the beginning of the academic year)
2000/2001 2005/2006 2010/2011 2011/2012 2012/2013 2013/2014 2014/2015 2015/2016
Total 68804 63174 50793 48342 46881 45419 44848 43376General education institutions (excluding part-time (shift) general education institutions) 67063 61497 49469 47146 45746 44436 43979 42687
State and municipal institutions* 66428 60771 48804 46459 45031 43716 43228 41906Urban areas 21271 20404 18478 18124 17900 17554 17285 16808Rural areas 45157 40367 30326 28335 27131 26162 25943 25098
Private institutions 635 726 665 687 715 720 751 781Urban areas … … 620 634 663 668 692 718Rural areas … … 45 53 52 52 59 63
Part-time (shift) general education institutions** 1741 1677 1324 1196 1135 983 869 689Urban areas 1423 1339 1027 918 859 764 673 531Rural areas 318 338 297 278 276 219 196 158
* Including institutions under capital repair. ** For the 2013/2014 academic year and earlier the data are given excluding private general education institutions.

253 Indicators of Education in the Russian Federation
6.14. GENERAL EDUCATION INSTITUTIONS (EXCLUDING PART-TIME (SHIFT) GENERAL EDUCATION INSTITUTIONS)*(at the beginning of the academic year)
2011/2012 2012/2013 2013/2014 2014/2015 2015/2016
Total 47146 45746 44436 43979 42687Educational institutions for children of preschool and primary school age 1199 1102 964 829 716General education institutions and boarding schools 43783 42503 41377 41066 40007
Primary 2510 1988 1651 1514 1334Basic 8643 8289 8038 7812 7542Secondary 28655 28194 27657 27661 27375Institutions with advanced curriculum in certain subjects 1305 1321 1304 1289 1121Gymnasia 1554 1574 1588 1627 1519Lyceum schools 1116 1137 1139 1163 1116
Cadet general education institutions 156 174 178 178 152General education institutions with fundamentals of flight instruction 6 6 6 5 5General education institutions for students with limited health capacities** 1827 1793 1730 1709 1649Sanatorium educational institutions for students who need long-term medical care 103 100 101 115 96Educational institutions for students who need psycho-pedagogical and medico-social assistance 72 68 80 77 62
* Including institutions under capital repair. ** Including specialized (correctional) educational institutions for students with deviant (socially dangerous) behavior.

2546. Conditions of Education
6.15. PART-TIME (SHIFT) GENERAL EDUCATION INSTITUTIONS*(at the beginning of the academic year)
2000/2001 2005/2006 2010/2011 2011/2012 2012/2013 2013/2014 2014/2015 2015/2016
Total 1741 1677 1324 1196 1135 983 869 689Part-time (shift) general education schools 1200 1074 771 692 614 500 431 342Part-time (shift) general education schools in correctional facilities 189 206 223 212 254 249 237 189Education centres 117 115 106 103 94 86 80 61Open (shift) general education schools health capacities 212 269 215 183 169 145 117 93General education institutions for students with limited health capacities 23 13 9 6 4 3 4 4
* For the 2013/2014 academic year and earlier the data are given excluding private general education institutions.

255 Indicators of Education in the Russian Federation
6.16. AVERAGE CLASS SIZE AT GENERAL EDUCATION INSTITUTIONS (EXCLUDING PART-TIME (SHIFT) GENERAL EDUCATION INSTITUTIONS)*
(at the beginning of the academic year)
2000/2001 2005/2006 2010/2011 2011/2012 2012/2013 2013/2014 2014/2015 2015/2016
TotalGrades:
1–4 18 18 20 20 20 20 21 215–9 21 18 18 18 18 19 19 1910–11(12) 21 19 17 17 17 17 17 17
State and municipal institutionsGrades:
1–4** 18 18 20 20 20 21 21 21urban areas 23 23 24 25 25 25 25 26rural areas 13 12 13 13 13 14 14 14
5–9 21 18 18 18 19 19 19 19urban areas 25 23 24 24 24 24 25 25rural areas 15 13 12 12 12 12 12 12
10–11(12) 21 19 17 18 17 17 17 17urban areas 24 23 22 23 22 22 22 22rural areas 15 13 11 11 10 10 10 9
Private institutionsGrades:
1–4** 10 10 11 12 13 13 13 135–9 11 10 10 11 11 12 12 1210–11(12) 12 11 9 10 10 10 10 10
* Excluding general education institutions and classes for students with limited health capacities; specialized (correctional) educational institutions for students with deviant (socially dangerous) behavior; sanatorium educational institutions for students who need long-term medical care; educational institutions for students who need psycho-pedagogical and medico-social assistance (for private general education institutions – since the 2011/2012 academic year).
** Including a complete set of classes (for private general education institutions – since the 2011/2012 academic year).

2566. Conditions of Education
6.17. SHIFTS AT GENERAL EDUCATION INSTITUTIONS (EXCLUDING PART-TIME (SHIFT) GENERAL EDUCATION INSTITUTIONS)*(at the beginning of the academic year)
2000/2001 2005/2006 2010/2011 2011/2012 2012/2013 2013/2014 2014/2015 2015/2016
Enrolment, thousand, headcount:students studying one-shift 15354.5 12456.1 11203.1 11300.0 11359.1 11442.9 11982.3 12355.9
students studying two- and three-shift 4033.8 2191.2 1689.8 1801.8 1835.3 1859.6 1865.8 1893.5
as a percentage of the total enrolment 20.8 15.0 13.1 13.8 13.9 14.0 13.5 13.3
urban areas 25.4 17.4 14.8 15.5 15.7 15.8 15.1 14.9
rural areas 10.2 9.6 8.8 9.1 9.1 9.0 8.9 8.7
* Excluding general education institutions and classes for students with limited health capacities; specialized (correctional) educational institutions for students with deviant (socially dangerous) behavior; sanatorium educational institutions for students who need long-term medical care; educational institutions for students who need psycho-pedagogical and medico-social assistance; also excluding 1st grades, organised in preschool education institutions; in the 2010/2011 academic year and before excluding private general education institutions.

257 Indicators of Education in the Russian Federation
6.18. STUDENTS STUDYING TWO- AND THREE-SHIFT AS A PERCENTAGE OF THE TOTAL ENROLMENT IN GENERAL EDUCATION INSTITUTIONS (EXCLUDING PART-TIME (SHIFT) GENERAL EDUCATION INSTITUTIONS)*
(at the beginning of the academic year)
Per cent
Institutions:
private
state and municipal
0
5
10
1513.8
3.9
2011/2012
14.0
3.5
2012/2013
14.1
3.0
2013/2014
13.6
2.6
2014/2015
13.4
2.5
2015/2016
* Excluding general education institutions and classes for students with limited health capacities; specialized (correctional) educational institutions for students with deviant (socially dangerous) behavior; sanatorium educational institutions for students who need long-term medical care; educational institutions for students who need psycho-pedagogical and medico-social assistance; also excluding 1st grades, organised in preschool education institutions.

2586. Conditions of Education
6.19. STUDENTS ATTENDING EXTENDED-DAY GROUPS AT STATE AND MUNICIPAL GENERAL EDUCATION INSTITUTIONS (EXCLUDING PART-TIME (SHIFT) GENERAL EDUCATION INSTITUTIONS)*
(at the beginning of the academic year)
2000/2001 2005/2006 2010/2011 2011/2012 2012/2013 2013/2014 2014/2015 2015/2016
Pupils in grades 1–9 attending extended-day groups, thousand, headcount 2491.6 2576.4 2056.1 1921.9 1908.5 1855.4 1706.6 1569.4As a percentage of total enrolment in grades 1–9 15.1 21.3 18.1 16.8 16.4 15.7 13.8 12.2
Urban areas 16.0 22.7 19.3 17.8 17.3 16.4 14.4 12.9Rural areas 13.1 18.0 15.0 13.8 13.9 13.7 11.9 10.3
Pupils in grades 1–4 attending extended-day groups, thousand, headcount 1858.6 2004.0 1748.6 1665.4 1676.1 1634.9 1503.2 1389.3As a percentage of total enrolment in grades 1–4 33.6 39.5 33.2 30.5 30.0 28.9 25.4 22.7
Urban areas 37.7 43.0 36.0 32.9 32.1 30.7 27.1 24.4Rural areas 25.8 31.5 25.9 23.8 24.0 23.3 20.4 17.6
* Excluding general education institutions and classes for students with limited health capacities; specialized (correctional) educational institutions for students with deviant (socially dangerous) behavior; sanatorium educational institutions for students who need long-term medical care; educational institutions for students who need psycho-pedagogical and medico-social assistance; also excluding students of boarding schools and 1st grades, organised in preschool education institutions.

259 Indicators of Education in the Russian Federation
6.20. TRAINING AREA OF GENERAL EDUCATION INSTITUTIONS (EXCLUDING PART-TIME (SHIFT) GENERAL EDUCATION INSTITUTIONS)* (at the beginning of the academic year)
2001/2002 2005/2006 2010/2011 2011/2012 2012/2013 2013/2014 2014/2015 2015/2016
Training area, million square metres 59.9 59.2 57.6 57.1 64.1 63.6 63.8 58.5As a percentage of the total floor area of general education institutions 38.4 32.4 34.5 33.9 34.3 33.8 33.6 33.2Per one student, square metres 4.0 4.8 5.0 4.9 5.5 5.4 5.2 4.6
Urban areas 3.4 4.0 4.1 4.0 4.8 4.8 4.4 3.8Rural areas 5.2 6.4 7.0 7.1 7.1 7.0 7.2 6.7
* Here and below (table 6.22–6.24): for the 2010/2011 academic year and earlier the data are given excluding private general education institutions; for the 2005/2006 academic year and earlier – also excluding general education institutions for students with limited health capacities; specialized (correctional) educational institutions for students with deviant (socially dangerous) behavior; sanatorium educational institutions for students who need long-term medical care; educational institutions for students who need psycho-pedagogical and medico-social assistance.
6.21. TRAINING AREA OF GENERAL EDUCATION INSTITUTIONS (EXCLUDING PART-TIME (SHIFT) GENERAL EDUCATION INSTITUTIONS) PER ONE STUDENT
(at the beginning of the academic year)
Institutions:
private
state and municipal
Square metres
0
2
4
64.9 5.2
2011/2012
5.5 5.3
2012/2013
5.4 5.2
2013/2014
5.25.7
2014/2015
4.6
5.8
2015/2016

2606. Conditions of Education
6.22. TECHNICAL STATE OF GENERAL EDUCATION INSTITUTIONS (EXCLUDING PART-TIME (SHIFT) GENERAL EDUCATION INSTITUTIONS)(at the beginning of the academic year)
2001/2002 2005/2006 2010/2011 2011/2012 2012/2013 2013/2014 2014/2015 2015/2016
General education institutions*, the buildings of which:require capital repair, thousand 23729 20629 10026 8808 7605 6281 6333 5837as a percentage of the total number of institutions 37.0 35.2 19.0 17.1 15.0 12.7 13.0 12.3
urban areas 40.4 38.8 20.1 17.0 14.3 12.1 12.7 11.4rural areas 35.5 33.4 18.4 17.1 15.4 13.1 13.1 12.8
are in the emergency state (in disrepair), thousand 3265 1798 840 783 658 490 536 440as a percentage of the total number of institutions 5.1 3.1 1.6 1.5 1.3 1.0 1.1 0.9
urban areas 4.2 2.0 1.0 1.0 0.9 0.6 0.7 0.6rural areas 5.5 3.6 1.9 1.8 1.6 1.2 1.3 1.1
Enrolment in general education institutions, the buildings of which:
require capital repair, thousand 8045.3 6025.5 2576.9 2375.3 2005.7 1639.4 1831.7 1774.0as a percentage of the total enrolment 42.9 41.1 19.5 17.7 14.8 12.0 12.9 12.2
urban areas 40.5 39.3 18.0 15.9 13.0 10.6 11.9 10.9rural areas 48.3 45.3 23.3 22.3 19.7 15.9 15.8 15.8
are in the emergency state (in disrepair), thousand 1003.7 435.7 206.1 201.3 169.4 130.4 146.4 115.6as a percentage of the total enrolment 5.4 3.0 1.6 1.5 1.3 1.0 1.0 0.8
urban areas 4.2 1.9 0.9 1.0 0.8 0.6 0.7 0.5rural areas 7.9 5.3 3.1 2.7 2.6 1.9 2.0 1.7
* Here and below (tables 6.23, 6.24): since the 2010/2011 academic year – including separate structural subdivisions (branches).

261 Indicators of Education in the Russian Federation
6.23. AMENITIES AT GENERAL EDUCATION INSTITUTIONS (EXCLUDING PART-TIME (SHIFT) GENERAL EDUCATION INSTITUTIONS)(at the beginning of the academic year)
2001/2002 2005/2006 2010/2011 2011/2012 2012/2013 2013/2014 2014/2015 2015/2016
General education institutions, the buildings of which have all kinds of amenities, thousand 33171 34047 38772 39161 40045 40057 40574 40537as a percentage of the total number of institutions 51.8 58.0 73.4 75.8 79.2 81.0 83.0 85.2
Urban areas 89.4 92.5 96.2 95.7 96.6 96.8 97.1 97.9Rural areas 35.1 41.8 61.0 64.3 68.9 71.7 74.7 77.7
Enrolment in general education institutions, the buildings of which have all kinds of amenities, thousand, headcount 15260.9 11924.4 11935.1 12138.5 12442.9 12644.8 13306.6 13843.9as a percentage of the total enrolment 81.4 81.4 90.1 90.3 91.9 92.7 93.8 94.8
Urban areas 94.4 93.3 96.7 96.0 96.8 96.9 97.5 98.1Rural areas 52.1 54.6 73.5 75.0 78.4 80.9 83.1 85.4

2626. Conditions of Education
6.24. STUDENTS AT GENERAL EDUCATION INSTITUTIONS (EXCLUDING PART-TIME (SHIFT) GENERAL EDUCATION INSTITUTIONS) WHO GET HOT MEALS
(at the beginning of the academic year)
2001/2002 2005/2006 2010/2011 2011/2012 2012/2013 2013/2014 2014/2015 2015/2016
General education institutions with a refectory or a canteen, thousand 50580 49491 48617 47981 47313 46576 46460 45410as a percentage of the total number of institutions 79.0 84.4 92.0 92.9 93.5 94.2 95.0 95.5
Urban areas 95.8 97.5 98.1 97.8 97.8 97.7 98.3 98.5Rural areas 71.5 78.2 88.7 90.0 91.0 92.1 93.1 93.7
Number of students getting hot meals, thousand 11300.3 9923.6 10175.5 10559.6 10782.0 11084.5 11540.0 11900.7as a percentage of the total enrolment 60.3 67.8 76.9 78.5 79.7 81.3 81.3 81.5
Urban areas 56.0 64.0 74.9 77.0 78.4 80.0 80.2 80.5Rural areas 69.8 76.2 81.7 82.7 83.2 84.7 84.5 84.7

263 Indicators of Education in the Russian Federation
6.25. PERSONAL COMPUTERS AT GENERAL EDUCATION INSTITUTIONS (EXCLUDING PART-TIME (SHIFT) GENERAL EDUCATION INSTITUTIONS)*(at the beginning of the academic year)
2009/2010 2010/2011 2011/2012 2012/2013 2013/2014 2014/2015 2015/2016
Number of computers, thousand Personal computers 1057.0 1169.8 1380.1 1771.8 2053.0 2248.8 2325.1
of which:within local area networks 555.8 630.1 763.3 1008.7 1183.8 1334.2 1410.3with internet access 524.8 611.0 787.9 1084.0 1304.0 1497.8 1597.5received over the past year 191.5 128.1 199.1 386.0 353.9 225.8 121.0used for educational purposes 826.4 918.8 1088.1 1430.6 1689.4 1862.6 1932.4
of which in classroom(s) for learning foundations of Informatics and Computer science 522.8 533.3 541.9 610.6 591.8 606.1 609.3
Per 100 students, pcsPersonal computers 8.0 8.8 10.3 13.1 15.0 15.8 15.9
of which:within local area networks 4.2 4.8 5.7 7.5 8.7 9.4 9.7with internet access 4.0 4.6 5.9 8.0 9.6 10.6 10.9received over the past year 1.4 1.0 1.5 2.9 2.6 1.6 0.8used for educational purposes 6.2 6.9 8.1 10.6 12.4 13.1 13.2
of which in classroom(s) for learning foundations of Informatics and Computer science 3.9 4.0 4.0 4.5 4.3 4.3 4.2
* For the 2009/2010 and the 2010/2011 academic years – excluding private general education institutions.

2646. Conditions of Education
6.26. PERSONAL COMPUTERS USED FOR TEACHING PER 100 STUDENTS AT GENERAL EDUCATION INSTITUTIONS (EXCLUDING PART-TIME (SHIFT) GENERAL EDUCATION INSTITUTIONS)
(at the beginning of the academic year)
Institutions:
private
state and municipal
Units
0
5
10
15
20
8.1
14.1
2011/2012
10.5
15.1
2012/2013
12.3
17.2
2013/2014
13.1
17.5
2014/2015
13.2
18.2
2015/2016
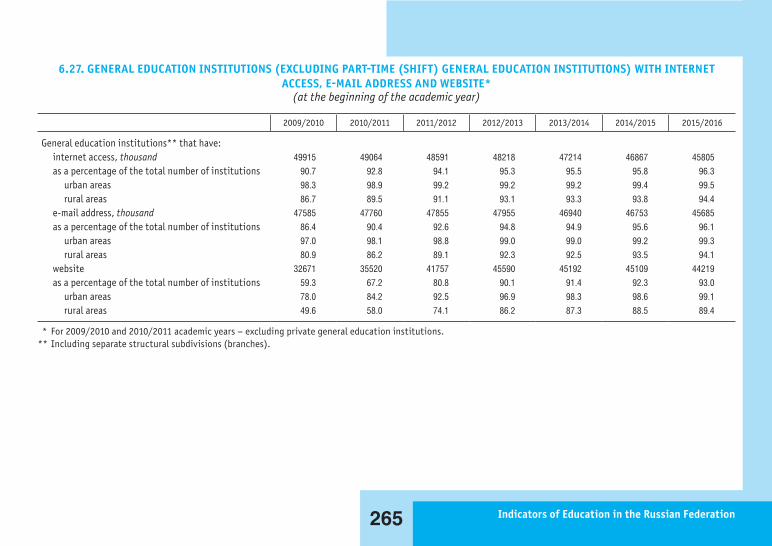
265 Indicators of Education in the Russian Federation
6.27. GENERAL EDUCATION INSTITUTIONS (EXCLUDING PART-TIME (SHIFT) GENERAL EDUCATION INSTITUTIONS) WITH INTERNET ACCESS, E-MAIL ADDRESS AND WEBSITE*
(at the beginning of the academic year)
2009/2010 2010/2011 2011/2012 2012/2013 2013/2014 2014/2015 2015/2016
General education institutions** that have:internet access, thousand 49915 49064 48591 48218 47214 46867 45805as a percentage of the total number of institutions 90.7 92.8 94.1 95.3 95.5 95.8 96.3
urban areas 98.3 98.9 99.2 99.2 99.2 99.4 99.5rural areas 86.7 89.5 91.1 93.1 93.3 93.8 94.4
e-mail address, thousand 47585 47760 47855 47955 46940 46753 45685as a percentage of the total number of institutions 86.4 90.4 92.6 94.8 94.9 95.6 96.1
urban areas 97.0 98.1 98.8 99.0 99.0 99.2 99.3rural areas 80.9 86.2 89.1 92.3 92.5 93.5 94.1
website 32671 35520 41757 45590 45192 45109 44219as a percentage of the total number of institutions 59.3 67.2 80.8 90.1 91.4 92.3 93.0
urban areas 78.0 84.2 92.5 96.9 98.3 98.6 99.1rural areas 49.6 58.0 74.1 86.2 87.3 88.5 89.4
* For 2009/2010 and 2010/2011 academic years – excluding private general education institutions. ** Including separate structural subdivisions (branches).

2666. Conditions of Education
6.28. INSTITUTIONS FOR SUPPLEMENTARY GENERAL EDUCATION OF CHILDREN
2000 2005 2010 2011 2012 2013 2014 2015
Institutions for supplementary general education of children* 8699 8876 8531 7902 8386 10462 11791 14359Of which:
Encompassing all types of educational activities 3577 3654 3683 3392 3487 3631 3703 3782Art 371 418 780 756 896 1909 2393 4375Ecological and biological 467 445 331 313 282 269 251 219Tourism and local lore studies 335 331 256 247 232 210 209 185Technical 570 536 327 305 287 261 245 217Sport 2968 3072 2760 2480 2582 3245 3714 4445Military and patriotic, sports and technical sports 112 89 101 107 90 85 83 68Other 299 331 293 302 530 852 1193 1068
Sports schools for children and youths** 1709 1839 2210 2449 2645 2746 2902 2809Children’s music, art, choreographic schools and schools of fine arts*** 5823 5555 5370 5328 5270 5223 5186 5108
* According to the Ministry of Education and Science of the Russian Federation. ** According to the Ministry of Sports of the Russian Federation. *** According to the Ministry of Culture of the Russian Federation. The data for 2014 are given without information for the Republic of Crimea and Sevastopol.

267 Indicators of Education in the Russian Federation
6.29. TECHNICAL STATE AND AMENITIES OF INSTITUTIONS FOR SUPPLEMENTARY GENERAL EDUCATION OF CHILDREN*(at the end of the year)
2001 2005 2010 2011 2012 2013 2014 2015
Institutions for supplementary general education of children, the buildings of which:
require capital repair, thousand 3757 3697 2034 1762 1675 2107 2215 2737as a percentage of the total number of institutions 43.1 41.7 23.8 22.3 20.0 20.1 18.8 19.1are in the emergency state (in disrepair) 399 338 122 103 97 141 142 156as a percentage of the total number of institutions 4.6 3.8 1.4 1.3 1.2 1.3 1.2 1.1have all kinds of amenities 4849 5384 5934 5677 6315 7980 9109 11375as a percentage of the total number of institutions 55.6 60.7 69.6 71.8 75.3 76.3 77.3 79.2
* According to the Ministry of Education and Science of the Russian Federation.

2686. Conditions of Education
6.30. VOCATIONAL EDUCATION INSTITUTIONS IMPLEMENTING SECONDARY VOCATIONAL EDUCATION PROGRAMMES FOR SKILLED WORKERS, JUNIOR TECHNICIANS AND EMPLOYEES*
(at the end of the year)
2000 2005 2010 2011 2012 2013 2014 2015
Total 3893 3392 2356 2040 1834 1319 1033 689Of which vocational education institutions under the Federal Penitentiary Service of Russia 340 338 328 332 332 318 276 275
* Here and below the information is given only for institions implementing programmes for skilled workers, junior technicians and employees (excluding institutions implementing both programmes for skilled workers, junior technicians and employees and programmes for mid-career professionals).
6.31. VOCATIONAL EDUCATION INSTITUTIONS IMPLEMENTING SECONDARY VOCATIONAL EDUCATION PROGRAMMES FOR MID-CAREER PROFESSIONALS
(at the beginning of the academic year)
2000/2001 2005/2006 2010/2011 2011/2012 2012/2013 2013/2014 2014/2015 2015/2016
Total 2703 2905 2850 2925 2981 2709 2909 2891State and municipal 2589 2688 2586 2665 2725 2494 2665 2645Private 114 217 264 260 256 215 244 246
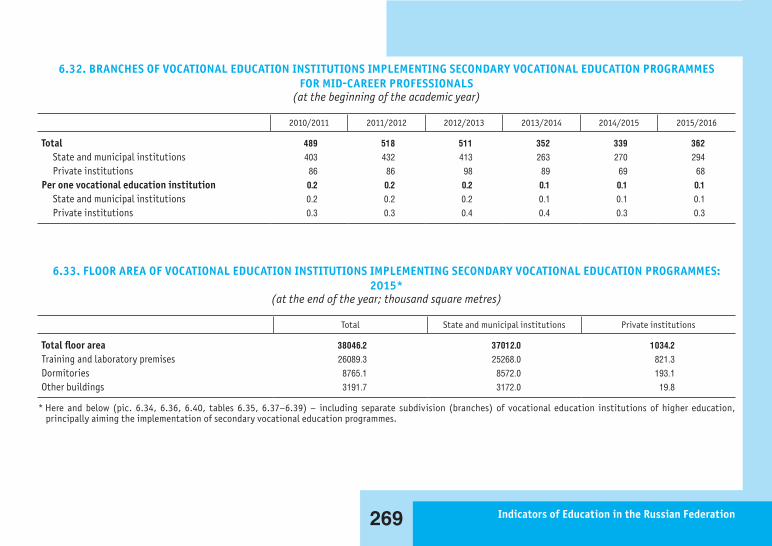
269 Indicators of Education in the Russian Federation
6.32. BRANCHES OF VOCATIONAL EDUCATION INSTITUTIONS IMPLEMENTING SECONDARY VOCATIONAL EDUCATION PROGRAMMES FOR MID-CAREER PROFESSIONALS
(at the beginning of the academic year)
2010/2011 2011/2012 2012/2013 2013/2014 2014/2015 2015/2016
Total 489 518 511 352 339 362State and municipal institutions 403 432 413 263 270 294Private institutions 86 86 98 89 69 68
Per one vocational education institution 0.2 0.2 0.2 0.1 0.1 0.1State and municipal institutions 0.2 0.2 0.2 0.1 0.1 0.1Private institutions 0.3 0.3 0.4 0.4 0.3 0.3
6.33. FLOOR AREA OF VOCATIONAL EDUCATION INSTITUTIONS IMPLEMENTING SECONDARY VOCATIONAL EDUCATION PROGRAMMES: 2015*
(at the end of the year; thousand square metres)
Total State and municipal institutions Private institutions
Total floor area 38046.2 37012.0 1034.2Training and laboratory premises 26089.3 25268.0 821.3Dormitories 8765.1 8572.0 193.1Other buildings 3191.7 3172.0 19.8
* Here and below (pic. 6.34, 6.36, 6.40, tables 6.35, 6.37–6.39) – including separate subdivision (branches) of vocational education institutions of higher education, principally aiming the implementation of secondary vocational education programmes.

2706. Conditions of Education
6.34. FLOOR AREA DISTRIBUTION OF VOCATIONAL EDUCATION INSTITUTIONS IMPLEMENTING SECONDARY VOCATIONAL EDUCATION PROGRAMMES BY OWNERSHIP AND BY EXPLOITATION: 2015
(at the end of the year)
Per cent
right of ownership
operational management
lease
other
Form of ownership, exploitation:
0
10
20
30
40
50
60
70
80
90
100
3.32.1
92.2
2.4
Total
2.71.1
93.9
2.3
State and municipal institutions
26.4
35.5
30.7
7.3
Privateinstitutions

271 Indicators of Education in the Russian Federation
6.35. TECHNICAL STATE OF THE BULDINGS OF VOCATIONAL EDUCATION INSTITUTIONS, IMPLEMENTING SECONDARY VOCATIONAL EDUCATION PROGRAMMES: 2015(at the end of the year; thousand square metres)
Floor area that requires capital repair Floor area that is in the emergency state (in disrepair)
Total State and municipal institutions
Private institutions
Total State and municipal institutions
Private institutions
Thousand square metres
Total floor area, thousand square metres 4643.4 4633.0 10.3 449.5 449.5 –Training and laboratory premises 2756.4 2747.3 9.1 237.9 237.9 –Dormitories 1582.6 1581.3 1.3 157.7 157.7 –Other buildings 304.4 304.4 – 53.9 53.9 –
As a percentage of the total floor area
Total floor area 12.2 12.5 1.0 1.2 1.2 –Training and laboratory premises 10.6 10.9 1.1 0.9 0.9 –Dormitories 18.1 18.4 0.6 1.8 1.8 –Other buildings 9.5 9.6 – 1.7 1.7 –

2726. Conditions of Education
6.36. USAGE OF TRAINING AND LABORATORY PREMISES OF VOCATIONAL EDUCATION INSTITUTIONS IMPLEMENTING SECONDARY VOCATIONAL EDUCATION PROGRAMMES: 2015*
(at the end of the year)
Floor area:
utility areaseducation support floor
training area premises of R&D divisions
0
10
20
30
40
50
60
70
80
90
100
21.9
0.5
20.4
57.2
Total
21.9
0.5
20.6
56.9
State and municipal institutions
20.3
0.4
15.5
63.9
Private institutions
Per cent
* Including buildings that are leased, subleased and being under capital repair.

273 Indicators of Education in the Russian Federation
6.37. AVAILABILITY OF STUDENT DORMITORIES IN VOCATIONAL EDUCATION INSTITUTIONS IMPLEMENTING SECONDARY VOCATIONAL EDUCATION PROGRAMMES: 2015
(at the end of the year)
Secondary vocational education programmes Vocational training programmes*
Supplementary professional education programmes*
programmes for skilled workers, junior technicians
and employees
programmes for mid-career professionals
TotalNumber of students, who need a place in a dormitory, thousand persons 101.7 253.5 32.3 3.7Of whom living in dormitories, per cent 92.7 90.7 88.7 94.6
Of whom living in dormitories of third-party organisations 2.4 3.0 1.6 1.5
State and municipal institutionsNumber of students, who need a place in a dormitory, thousand persons 101.3 248.2 27.2 3.2Of whom living in dormitories, per cent 92.7 90.6 86.6 93.8
Of whom living in dormitories of third-party organisations 2.4 2.8 1.7 1.7
Private institutionsNumber of students, who need a place in a dormitory, thousand persons 0.5 5.3 5.1 0.5Of whom living in dormitories, per cent 93.3 97.0 100 100
Of whom living in dormitories of third-party organisations 5.4 12.1 0.7 –
* For 2015.

2746. Conditions of Education
6.38. AVAILABILITY OF PUBLIC CATERING TO STUDENTS AT VOCATIONAL EDUCATION INSTITUTIONS IMPLEMENTING SECONDARY VOCATIONAL EDUCATION PROGRAMMES: 2015
(at the end of the year)
Total State and municipal institutions Private institutions
Number of seats in the catering facilities (divisions) of vocational education institutions, thousand* 378.0 361.3 16.8As a percentage of the total number of sets according to the standards 137.9 136.9 163.3
* Excluding catering facilities of the dormitories.
6.39. PERSONAL COMPUTERS USED FOR TEACHING AT VOCATIONAL EDUCATION INSTITUTIONS IMPLEMENTING SECONDARY VOCATIONAL EDUCATION PROGRAMMES: 2015
(at the end of the year)
Total State and municipal institutions Private institutions
Thousands As a percentage of the total
Thousands As a percentage of the total
Thousands As a percentage of the total
Personal computers 274.0 100 260.4 100 13.6 100Of which:within local area networks 205.0 74.8 194.0 74.5 11.0 81.0with internet access 210.3 76.8 198.8 76.3 11.5 85.0received in the reference year 13.4 4.9 12.6 4.8 0.8 5.9

275 Indicators of Education in the Russian Federation
6.40. PERSONAL COMPUTERS USED FOR TEACHING PER 100 STUDENTS AT VOCATIONAL EDUCATION INSTITUTIONS IMPLEMENTING SECONDARY VOCATIONAL EDUCATION PROGRAMMES
(at the end of the year)
0
5
10
15
20
25
17.6 17.3
23.4
Personal computers – total
13.1 12.9
18.9
Within local area networks
13.5 13.2
19.9
With Internet access
Private institutions
State and municipal institutions
Total
Units
* The number of students (Ns) used in the calculation is determined by the formula: Ns = Nf + 0.25 Np + 0.10 Ne, where Nf is the number (enrolment) of intramural full-time students, Np is the number (enrolment) of intramural part-time students, and Ne is the number (enrolment) of extramural students.

2766. Conditions of Education
6.41. HIGHER EDUCATION INSTITUTIONS(at the beginning of the academic year)
2000/2001 2005/2006 2010/2011 2011/2012 2012/2013 2013/2014 2014/2015 2015/2016
Total 965 1068 1115 1080 1046 969 950 896State and municipal institutions 607 655 653 634 609 578 548 530Private institutions 358 413 462 446 437 391 402 366
6.42. BRANCHES OF HIGHER EDUCATION INSTITUTIONS IMPLEMENTING BACHELOR’S, SPECIALIST’S AND MASTER’S PROGRAMMES (at the beginning of the academic year)
2005/2006 2010/2011 2011/2012 2012/2013 2013/2014 2014/2015 2015/2016
Total 1621 1668 1639 1603 1482 1319 1079State and municipal institutions 1102 1069 1045 1013 949 843 727Private institutions 519 599 594 590 533 476 352
Per one higher education institution 1.5 1.5 1.5 1.5 1.5 1.4 1.2State and municipal institutions 1.7 1.6 1.6 1.7 1.6 1.5 1.4Private institutions 1.3 1.3 1.3 1.4 1.4 1.2 1.0

277 Indicators of Education in the Russian Federation
6.43. FLOOR AREA OF HIGHER EDUCATION INSTITUTIONS*(at the end of the year; thousand square metres)
2009 2010 2011 2012 2013 2014 2015
TotalTotal floor area 66538.2 67270.1 65930.9 65933.4 66557.5 69253.7 65206.1Training and laboratory premises 49205.7 49624.5 47835.8 47117.5 47689.7 48960.9 45202.2Dormitories 13502.6 13799.0 14109.0 14544.5 14563.7 15471.1 15085.6Other buildings 3829.9 3846.6 3986.0 4271.4 4304.1 4821.7 4918.2
State and municipal institutionsTotal floor area 61132.8 62025.8 61168.1 61428.3 62067.1 65148.7 61911.0Training and laboratory premises 44052.0 44582.3 43317.0 42947.5 43516.0 45157.2 42205.9Dormitories 13357.2 13658.0 13955.7 14330.1 14362.4 15292.2 14920.3Other buildings 3723.7 3785.4 3895.4 4150.7 4188.8 4699.2 4784.9
Private institutionsTotal floor area 5405.4 5244.3 4762.8 4505.2 4490.3 4105.0 3295.0Training and laboratory premises 5153.7 5042.2 4518.8 4170.0 4173.7 3803.7 2996.3Dormitories 145.4 141.0 153.4 214.4 201.3 178.8 165.4Other buildings 106.2 61.2 90.6 120.8 115.3 122.5 133.3
* Here and below (pic. 6.44, 6.46, 6.50, tables 6.45, 6.47–6.49) – including separate subdivision (branches) of higher education institutions, principally aiming the imple-mentation of bachelor’s, specialist’s and master’s higher education programmes.
6.41. HIGHER EDUCATION INSTITUTIONS(at the beginning of the academic year)
2000/2001 2005/2006 2010/2011 2011/2012 2012/2013 2013/2014 2014/2015 2015/2016
Total 965 1068 1115 1080 1046 969 950 896State and municipal institutions 607 655 653 634 609 578 548 530Private institutions 358 413 462 446 437 391 402 366
6.42. BRANCHES OF HIGHER EDUCATION INSTITUTIONS IMPLEMENTING BACHELOR’S, SPECIALIST’S AND MASTER’S PROGRAMMES (at the beginning of the academic year)
2005/2006 2010/2011 2011/2012 2012/2013 2013/2014 2014/2015 2015/2016
Total 1621 1668 1639 1603 1482 1319 1079State and municipal institutions 1102 1069 1045 1013 949 843 727Private institutions 519 599 594 590 533 476 352
Per one higher education institution 1.5 1.5 1.5 1.5 1.5 1.4 1.2State and municipal institutions 1.7 1.6 1.6 1.7 1.6 1.5 1.4Private institutions 1.3 1.3 1.3 1.4 1.4 1.2 1.0

2786. Conditions of Education
6.44. FLOOR AREA DISTRIBUTION OF HIGHER EDUCATION INSTITUTIONS BY OWNERSHIP AND BY EXPLOITATION: 2015(at the end of the year)
0
10
20
30
40
50
60
70
80
90
100
9.8
3.3
84.8
2.1
Total
8.8
1.7
88.9
0.6
State and municipal institutions
28.3
34.2
6.5
31.0
Private institutions
Per cent
right of ownership
operational management
lease
other
Form of ownership, exploitation:

279 Indicators of Education in the Russian Federation
6.45. TECHNICAL STATE OF THE BULDINGS OF HIGHER EDUCATION INSTITUTIONS(at the end of the year)
Floor area that requires capital repair Floor area that is in the emergency state (in disrepair)
2009 2010 2011 2012 2013 2014 2015 2009 2010 2011 2012 2013 2014 2015
Thousand square metresTotal floor area, thousand square metres 6143.3 6319.1 7700.3 8052.3 8042.6 9023.4 8582.0 456.9 396.1 493.7 496.2 467.0 567.3 602.6Training and laboratory premises 3748.7 3929.6 4526.4 4725.1 4563.1 5293.5 5097.0 273.5 226.5 321.9 297.1 242.4 268.4 317.0Dormitories 2183.3 2202.8 2899.6 3009.4 3082.2 3337.5 3061.1 163.8 151.5 150.9 166.0 148.7 191.2 189.2Other buildings 211.3 186.7 274.3 317.8 397.3 392.3 423.9 19.6 18.1 21.0 33.1 75.9 107.6 96.4
As a percentage of the total floor areaTotal floor area 9.2 9.4 11.7 12.2 12.1 13.0 13.2 0.7 0.6 0.7 0.8 0.7 0.8 0.9
State and municipal institutions 10.0 10.1 12.5 13.1 13.0 13.8 13.8 0.7 0.6 0.8 0.8 0.8 0.9 1.0Private institutions 0.4 0.5 0.6 0.4 0.1 0.7 0.4 0.0 0.0 0.1 0.0 – – –
Training and laboratory premises 7.6 7.9 9.5 10.0 9.6 10.8 11.3 0.6 0.5 0.7 0.6 0.5 0.5 0.7State and municipal institutions 8.5 8.8 10.4 11.0 10.5 11.7 12.0 0.6 0.5 0.7 0.7 0.6 0.6 0.8Private institutions 0.4 0.5 0.5 0.2 0.1 0.8 0.4 0.0 0.0 0.1 – – – –
Dormitories 16.2 16.0 20.6 20.7 21.2 21.6 20.3 1.2 1.1 1.1 1.1 1.0 1.2 1.3State and municipal institutions 16.3 16.1 20.8 20.9 21.5 21.8 20.5 1.2 1.1 1.1 1.2 1.0 1.3 1.3Private institutions – 1.1 2.0 3.7 – – – – – 0.3 – – – –
Other buildings 5.5 4.9 6.9 7.4 9.2 8.1 8.6 0.5 0.5 0.5 0.8 1.8 2.2 2.0

2806. Conditions of Education
6.46. USAGE OF TRAINING AND LABORATORY PREMISES OF HIGHER EDUCATION INSTITUTIONS*(at the end of the year)
0
10
20
30
40
50
60
70
80
90
100
16.2
2.2
16.4
65.2
16.7
2.3
16.3
64.6
17.6
2.2
16.5
63.6
19.0
2.3
17.0
61.7
20.3
2.5
17.5
59.7
20.9
2.7
17.5
58.9
22.0
3.0
17.9
57.1
17.0
2.4
16.9
63.7
17.6
2.5
16.7
63.2
18.5
2.3
17.2
62.0
19.7
2.4
17.6
60.3
21.0
2.7
18.0
58.4
21.5
2.8
17.9
57.8
22.4
3.0
18.2
56.4
9.30.6
13.0
77.2
8.80.7
13.3
77.1
9.21.4
10.5
78.9
11.31.0
11.1
76.6
13.1
1.312.4
73.2
14.2
1.412.8
71.7
16.1
1.813.7
68.3
2009 2010 2011 2012 2013 2014 2015 2009 2010 2011 2012 2013 2014 2015 2009 2010 2011 2012 2013 2014 2015
Per cent
Total State and municipal institutions
Private institutions
Floor area:
utility areaseducation support floor
training area premises of R&D divisions
* Including buildings that are leased, subleased and being under capital repair.

281 Indicators of Education in the Russian Federation
6.47. AVAILABILITY OF STUDENT DORMITORIES IN HIGHER EDUCATION INSTITUTIONS: 2015(at the end of the year)
Higher education programmes Secondary vocational education programmes Vocational training
programmes*
Supplementary professional education
programmes*Bachelor's, specialist's, and master's programmes
Postgraduate pro-grammes for academic personnel, residency programmes, appren-ticeship programmes (in the sphere of arts
and performing)
programmes for skilled workers, junior technicians
and employees
programmes for mid-career professionals
TotalNumber of students, who need a place in a dormitory, thousand persons 897.4 21.7 1.9 57.9 3.6 15.6Of whom living in dormitories, per cent 86.7 87.2 95.5 91.3 100 70.7
Of whom living in dormitories of third-party organisations 2.3 0.9 – 3.5 – 1.5
State and municipal institutionsNumber of students, who need a place in a dormitory, thousand persons 886.7 21.7 1.9 56.7 3.6 15.4Of whom living in dormitories, per cent 86.6 87.2 95.5 91.2 100 70.3
Of whom living in dormitories of third-party organisations 1.9 0.9 – 2.9 – 0.9
Private institutionsNumber of students, who need a place in a dormitory, thousand persons 10.7 0.0 – 1.2 0.0 0.2Of whom living in dormitories, per cent 93.3 100 – 98.6 100 100
Of whom living in dormitories of third-party organisations 30.2 10.2 – 31.7 – 44.8
* For 2015.
6.46. USAGE OF TRAINING AND LABORATORY PREMISES OF HIGHER EDUCATION INSTITUTIONS*(at the end of the year)
0
10
20
30
40
50
60
70
80
90
100
16.2
2.2
16.4
65.2
16.7
2.3
16.3
64.6
17.6
2.2
16.5
63.6
19.0
2.3
17.0
61.7
20.3
2.5
17.5
59.7
20.9
2.7
17.5
58.9
22.0
3.0
17.9
57.1
17.0
2.4
16.9
63.7
17.6
2.5
16.7
63.2
18.5
2.3
17.2
62.0
19.7
2.4
17.6
60.3
21.0
2.7
18.0
58.4
21.5
2.8
17.9
57.8
22.4
3.0
18.2
56.4
9.30.6
13.0
77.2
8.80.7
13.3
77.1
9.21.4
10.5
78.9
11.31.0
11.1
76.6
13.1
1.312.4
73.2
14.2
1.412.8
71.7
16.1
1.813.7
68.3
2009 2010 2011 2012 2013 2014 2015 2009 2010 2011 2012 2013 2014 2015 2009 2010 2011 2012 2013 2014 2015
Per cent
Total State and municipal institutions
Private institutions
Floor area:
utility areaseducation support floor
training area premises of R&D divisions
* Including buildings that are leased, subleased and being under capital repair.

2826. Conditions of Education
6.48. AVAILABILITY OF PUBLIC CATERING TO STUDENTS AT HIGHER EDUCATION INSTITUTIONS(at the end of the year)
2009 2010 2011 2012 2013 2014 2015
TotalNumber of seats in the catering facilities (divisions) of educational institutions, thousand* 354.6 369.3 368.3 366.8 356.2 356.6 297.6As a percentage of the total number of sets according to the standards 51.1 57.8 60.4 63.3 62.8 60.5 57.0
State and municipal institutionsNumber of seats in the catering facilities (divisions) of educational institutions, thousand* 304.7 316.3 316.8 308.0 293.7 301.1 256.1As a percentage of the total number of sets according to the standards 48.9 54.7 56.2 57.8 56.4 54.8 52.9
Private institutionsNumber of seats in the catering facilities (divisions) of educational institutions, thousand* 49.9 52.9 51.5 58.8 62.5 55.5 41.5As a percentage of the total number of sets according to the standards 69.8 86.5 111.1 127.5 136.1 137.9 108.9
* Excluding catering facilities of the dormitories.

283 Indicators of Education in the Russian Federation
6.49. PERSONAL COMPUTERS USED FOR TEACHING AT HIGHER EDUCATION INSTITUTIONS(at the end of the year)
Total, thousand As a percentage of the total
2009 2010 2011 2012 2013 2014 2015 2009 2010 2011 2012 2013 2014 2015
TotalPersonal computers 626.2 643.3 689.1 700.2 733.8 744.0 712.4 100 100 100 100 100 100 100
Of which:within local area networks 520.5 548.0 586.6 613.2 652.6 674.0 631.1 83.1 85.2 85.1 87.6 88.9 90.6 88.6with internet access 488.0 504.2 562.0 598.1 645.6 668.9 639.3 77.9 78.4 81.6 85.4 88.0 89.9 89.7received in the reference year 52.6 46.3 59.4 57.4 57.2 50.8 43.4 8.4 7.2 8.6 8.2 7.8 6.8 6.1
State and municipal institutionsPersonal computers 563.8 580.9 629.2 640.8 664.9 679.6 652.9 100 100 100 100 100 100 100
Of which:within local area networks 463.5 490.3 530.4 557.5 587.4 612.8 582.2 82.2 84.4 84.3 87.0 88.4 90.2 89.2with internet access 437.1 452.6 509.6 543.1 579.9 606.3 581.5 77.5 77.9 81.0 84.7 87.2 89.2 89.1received in the reference year 46.8 40.9 55.4 52.1 49.8 44.6 35.4 8.3 7.0 8.8 8.1 7.5 6.6 5.4
Private institutionsPersonal computers 62.4 62.4 60.0 59.4 68.9 64.5 59.6 100 100 100 100 100 100 100
Of which:within local area networks 57.0 57.7 56.2 55.7 65.1 61.2 48.9 91.3 92.5 93.7 93.8 94.5 95.0 82.1with internet access 50.9 51.6 52.5 55.0 65.8 62.7 57.8 81.5 82.7 87.5 92.6 95.4 97.2 97.1received in the reference year 5.7 5.4 4.0 5.3 7.3 6.2 7.9 9.2 8.7 6.7 9.0 10.7 9.6 13.3

2846. Conditions of Education
6.50. PERSONAL COMPUTERS USED FOR TEACHING PER 100 STUDENTS AT HIGHER EDUCATION INSTITUTIONS(at the end of the year)
Per cent
2013 201520142012201120102009
0
5
10
15
20
25
16.217.7
20.021.6
23.322.2
24.3
13.515.0
17.118.9
20.7 20.121.5
12.713.8
16.3
18.4
20.5 19.921.8
Personal computers – total Within local area networks With Internet access
* The number of students (Ns) used in the calculation is determined by the formula: Ns = Nf + 0.25. Np + 0.10. Ne, where Nf is the number (enrolment) of intramural full-time students, Np is the number (enrolment) of intramural part-time students, and Ne is the number (enrolment) of extramural students.

285 Indicators of Education in the Russian Federation
6.51. INSTITUTIONS OFFERING POSTGRADUATE COURSES FOR ACADEMIC PERSONNEL(at the end of the year)
2000 2005 2010 2011 2012 2013 2014 2015
Total 1362 1473 1568 1570 1575 1557 1519 1446Research institutes 797 833 809 805 820 818 805 771Higher education institutions 565 640 748 750 740 724 698 661Educational institutions of supplementary education … … 11 15 15 15 16 14

2866. Conditions of Education
TECHNICAL NOTES
Fixed assets are produced assets due to be used repeatedly or permanently for longer than a year, with the purpose of manu-facturing products, rendering market and non-market services, either for managing or for rendering to other organizations for pay to be held and used temporarily or to be used temporarily. Fixed assets include buildings, facilities, machines and equipment, ve-hicles, draught animals and productive livestock, perennial plan-tations, etc.
Full accounting cost of fixed assets is the sum of depreciated costs of fixed assets and the cumulative depreciation cost, both recorded on balance sheets of organizations. This cost presents the availability of fixed assets, excluding the gradual loss of their consumer properties owing to usage.
The depreciated cost of fixed assets recorded on balance sheets of organizations presents the gradual loss of their consumer pro-per ties equal to cumulative depreciation.
The full accounting cost of fixed assets and the depreciated cost are usually recorded at mixed prices, as one part of the in-ventory is recorded on the balance sheet of organizations based on replacement cost at the moment of the last revaluation and an-other part that was not revaluated is recorded at the prices valid at the moment of procurement.
Fixed assets depreciation is a partial or complete loss of con-sumer properties and cost of fixed assets as affected by natural forces and technological progress owing to usage. Norms of fixed assets depreciation and methods used to calculate depreciation
are determined by the procedure of business accounting, tax ac-counting and statistical recording.
Degree of fixed assets depreciation is determined as the ratio of accumulated depreciation by a certain date (full accounting and net book valuation) to the full accounting cost of these fixed as-sets by the same date, in percentage terms.
New fixed assets formation (commissioning) is determined as the cost of construction projects (buildings, facilities, start-ing complexes and their order, as well as equipment, tools, pe-rennial plantations, draught animals and productive livestock and other kinds of fixed assets) completed and accepted into opera-tion according to established procedures. In statistical observa-tions the commissioning of new fixed assets is recorded simulta-neously with the commissioning of production capacities, as well as housing and civil projects based upon the acceptance report on the completed construction of projects and documents con-firming the state registration (by kinds of objects due to be regi-stered).
Fixed assets renewal ratio is the percentage ratio of the fixed assets, commissioned within a year to their presence at the end of the year according to the full accounting cost. This indicator reflects the proportion of new fixed assets commissioned during the year in their total cost.
Fixed assets retirement rate is the percentage ratio of fixed assets retired (phased out) within a year to their presence at the beginning of the year according to the full accounting cost.

287 Indicators of Education in the Russian Federation
This indicator, together with the fixed assets renewal ratio, re-flects the intensity of fixed assets renovation.
Educational institution is a non-profit organisation that fol-lowing a licence is engaged in educational activity as its main ac-tivity in accordance with the objectives for which it was founded. In the Russian Federation there are the following types of edu-cational institutions, implementing the following educational programmes: basic education programmes – preschool education institution, general education institution, vocational education institution, higher education institution; supplementary educa-tion programmes – institutions for supplementary education, in-stitutions for supplementary professional education.
Institution engaged in education is a legal entity that follow-ing a licence is alongside its main activity engaged in educational activity as its additional activity.
Institution engaged in educational activity is an education-al institution and institutions engaged in education.
Places at preschool education institutions per 1000 child-ren aged 1–6 is the proportion of places in preschool education institutions to the total number of children aged 1–6, adjusted for the number of children aged 5 and 6 studying at general educa-tion institutions, multiplied by 1000.
Total floor area of a building is a sum of all floors of the build-ing (including maintenance floor, attic, ground floor and base-ment) measured within the inner surfaces of external walls, as well as projecting and recessed balconies.
Training area is the area of premises where an educational pro-cess is performed: premises for group studies, classrooms, lecture
halls, training laboratories, training rooms, drawing rooms for pre-paring course and graduation designing papers, training shops, showrooms, assembly and test premises, covered athletic facilities (all kinds of sports halls, covered swimming pools).
Education support floor is the area where activities, ancil-lary to the teaching (educational) process, are conducted: teach-ers’ rooms, department managers’ offices, administrative offices, premises of social organisations, libraries (reading-rooms, book depositories), office and production premises, recreation rooms for employees, offices of the management, registries, vivariums, computer centre, conference room and related premises (rooms for amateur groups, projection room, broadcasting studio, store-room for utensils).
Average group size is determined as the ratio of the number of students (including babies and children who only receive care) listed (enrolled) as members of the groups at preschool education institutions to the number of groups.
Average class size is determined as the ratio of the number of students in a certain group of classes to the number of classes in this group; a complete set of classes (a student body from two or more classes instructed by one teacher at a small school) is equal to one class.
Availability of catering to students at secondary vocational institutions implementing secondary vocational education programmes for mid-career professionals and at higher educa-tion institutions is the proportion of seats at catering facilities (or subdivisions and divisions thereof) in educational institutions to the number of seats with respect to the norm. Number of seats

2886. Conditions of Education
with respect to the norm in calculated by multiplying the esti-mated number of students by 200 and dividing by 1000, because according to the existing norm per 1000 students there should be 200 seats at a catering facility in an educational institution. The estimated number of students is equal to the intramural full-time
enrolment plus 10% of extramural enrolment multiplied by atten-dance ratio which is equal to 0.9.
In the present chapter, excluding pic. 6.2 and tables 6.3, 6.28, the data for 2014 and for 2015 are given including the information for the Republic of Crimea and the city of Sevastopol.

7. International Comparisons

2907. International Comparisons
7.1. EDUCATIONAL ATTAINMENT OF THE ADULT POPULATION IN RUSSIA AND OECD COUNTRIES: 2015*(aged 25–64; as a percentage of the total population in the respective age group)
Total Educational attainment
Primary general education and below (ISCED 0 and 1)
Basic general education (ISCED 2)
Secondary general and secondary vocational education (programmes
for skilled workers, junior technicians and employees)
(ISCED 3 and 4)
Higher education (ISCED 6, 7 and 8)
(1) (2) (3) (4) (5)
Russia 100 5.8 26.8 34.5 30.2Australia 100 21.0 36.1 11.1 31.8Austria 100 15.4 54.1 15.1 15.4Belgium 100 25.3 37.8 0.4 36.5Canada 100 9.6 35.2 25.7 29.5Chile 100 38.6 40.3 7.2 13.9Czech Republic 100 6.8 71.0 0.2 22.0Denmark 100 19.6 43.3 4.4 32.7Estonia 100 9.1 52.9 7.1 30.9Finland 100 12.8 44.4 12.1 30.7France 100 22.7 43.8 14.6 19.0Germany 100 13.2 59.2 0.6 27.0Greece 100 29.8 41.2 1.6 27.4Hungary 100 16.8 59.0 1.3 22.9Iceland 100 25.3 35.9 4.1 34.8Ireland 100 20.2 37.0 13.0 29.8Israel 100 14.5 36.7 13.8 35.0Italy 100 40.1 42.3 0.0 17.5Japan 100 n(3) 50.5*** 20.6*** 28.9

291 Indicators of Education in the Russian Federation
Total Educational attainment
Primary general education and below (ISCED 0 and 1)
Basic general education (ISCED 2)
Secondary general and secondary vocational education (programmes
for skilled workers, junior technicians and employees)
(ISCED 3 and 4)
Higher education (ISCED 6, 7 and 8)
(1) (2) (3) (4) (5)
Latvia 100 12.2 56.2 2.4 29.2Luxembourg 100 25.4 34.8 7.0 32.8Mexico 100 64.5 19.2 0.5 15.8Netherlands 100 23.6 41.1 2.3 33.0New Zealand 100 25.3 40.7 4.1 30.0Norway 100 17.6 39.7 12.3 30.4Poland 100 9.2 63.0 0.1 27.6Portugal 100 54.9 22.3 – 22.9Republic of Korea 100 14.2 40.3 13.1 32.4Slovakia 100 8.7 70.1 0.3 20.8Slovenia 100 13.2 56.6 7.5 22.7Spain 100 42.6 22.4 11.0 24.1Sweden 100 18.0 42.2 9.9 29.9Switzerland 100 11.8 46.5 n(5)** 41.7Turkey 100 63.0 19.0 5.2 12.8United Kingdom 100 20.9 35.6 10.1 33.4United States 100 10.5 44.9 10.5 34.1
* The data for foreign countries refer to 2015 or the previous or following years for which the data are available; for Russia – according to the 2015 microcensus. ** Here and below “n” in a cell means, the data from this cell are posted in another cell, and the number of the new cell is indicated in the parentheses after “n”. *** People with ISCED 4 educational attainment are excluded from column 3 and included into column 4.
(continued)

2927. International Comparisons
7.2. ADULT POPULATION IN RUSSIA AND OECD COUNTRIES HAVING ATTAINED HIGHER EDUCATION (ISCED 6, 7 AND 8) BY AGE: 2015*(as a percentage of the total population in the respective age group)
0
10
20
30
40
50
6032
.1
14.5
20.3 24
.5
13.4
26.6
24.3
24.8
20.8
18.6
17.1
22.9
23.0
18.2 23
.0 24.2
30.9
22.5
19.4
24.1
31.4
22.3
23.1
10.7 12
.9
13.2 14.3 17
.3
24.9
17.2
11.9
12.3
9.3 11
.7
6.2 10
.4
48.6
46.7
44.3
43.7
43.1
42.7
41.6
41.0
40.3
40.2
40.0
39.4
39.2
38.8
38.6
36.8
36.1
35.9
35.8
34.9
34.5
34.4
34.2
33.9
33.1
30.9
30.8
29.2
29.2
28.2
27.7
25.1
22.3
20.4
19.7
18.7
Swit
zerla
nd
Repu
blic
of K
orea
Luxe
mbo
urg
Neth
erla
nds
Pola
nd
Belg
ium
Unit
ed K
ingd
om
Denm
ark
Russ
ia
Finl
and
Irel
and
Esto
nia
Japa
n
Gree
ce
Aust
ralia
Icel
and
Unit
ed S
tate
s
New
Zea
land
Swed
en
Latv
ia
Isra
el
Cana
da
Norw
ay
Slov
enia
Port
ugal
Slov
akia
Czec
h Re
publ
ic
Hung
ary
Germ
any
Spai
n
Fran
ce
Ital
y
Aust
ria
Mex
ico
Turk
ey
Chile
Age, years:25–34 55–64
* The data for foreign countries refer to 2015 or the previous or following years for which the data are available; for Russia – according to the 2015 microcensus.

293 Indicators of Education in the Russian Federation
7.3. ADULT POPULATION IN RUSSIA AND OECD COUNTRIES HAVING ATTAINED BASIC GENERAL EDUCATION AND BELOW (ISCED 0, 1 AND 2) BY AGE: 2015 *
(as a percentage of the total population in the respective age group)
0
10
20
30
40
50
60
70
80
90
Mex
ico
Turk
ey
Spai
n
Port
ugal
Ital
y
Icel
and
Chile
New
Zea
land
Norw
ay
Swed
en
Belg
ium
Gree
ce
Denm
ark
Luxe
mbo
urg
Latv
ia
Unit
ed K
ingd
om
Neth
erla
nds
Hung
ary
Fran
ce
Germ
any
Aust
ralia
Esto
nia
Finl
and
Aust
ria
Unit
ed S
tate
s
Irel
and
Isra
el
Swit
zerla
nd**
Slov
akia
Cana
da
Czec
h Re
publ
ic
Pola
nd
Slov
enia
Russ
ia
Repu
blic
of K
orea
55.1
47.9
34.4
33.3
25.6
24.8
20.0
19.0
18.7
17.7
17.5
16.4
16.4
15.5
15.1
14.8
14.4
14.0
13.3
12.7
11.9
10.9
10.5
10.0
9.5
9.2
8.8
8.3
7.2 6.7
6.3
6.1
5.9
5.5 1.7
75.3 77
.9
59.1
75.6
52.8
32.2
58.3
34.3
19.2 25
.4
39.3
48.2
27.7 33
.4
11.4
28.6 35
.1
22.3
35.8
14.0
33.4
8.2
20.2 23
.3
10.4
38.3
21.9
15.5
14.4
15.3
12.3 14
.9
23.1
7.5
42.8
Age, years:25–34 55–64
* The data for foreign countries refer to 2015 or the previous or following years for which the data are available; for Russia – according to the 2015 microcensus. ** Including people with ISCED 5 educational attainment.
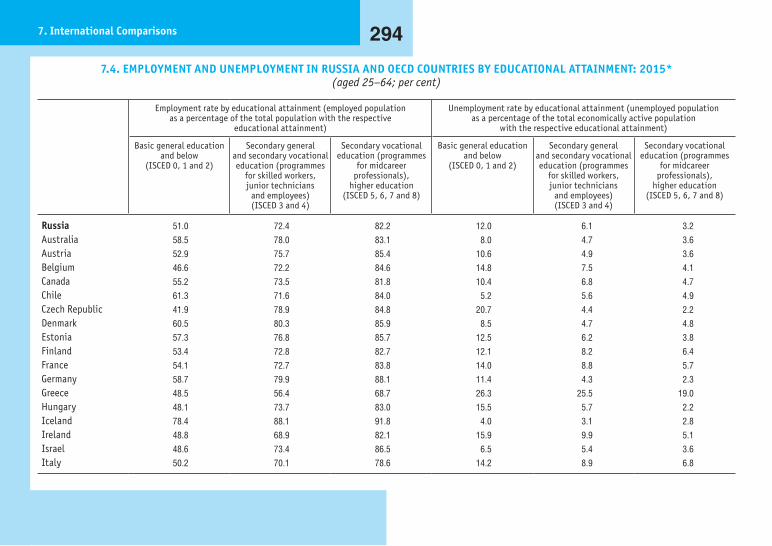
2947. International Comparisons
7.4. EMPLOYMENT AND UNEMPLOYMENT IN RUSSIA AND OECD COUNTRIES BY EDUCATIONAL ATTAINMENT: 2015*(aged 25–64; per cent)
Employment rate by educational attainment (employed population as a percentage of the total population with the respective
educational attainment)
Unemployment rate by educational attainment (unemployed population as a percentage of the total economically active population
with the respective educational attainment)
Basic general education and below
(ISCED 0, 1 and 2)
Secondary general and secondary vocational education (programmes
for skilled workers, junior technicians
and employees) (ISCED 3 and 4)
Secondary vocational education (programmes
for midcareer professionals),
higher education (ISCED 5, 6, 7 and 8)
Russia 51.0 72.4 82.2 12.0 6.1 3.2Australia 58.5 78.0 83.1 8.0 4.7 3.6Austria 52.9 75.7 85.4 10.6 4.9 3.6Belgium 46.6 72.2 84.6 14.8 7.5 4.1Canada 55.2 73.5 81.8 10.4 6.8 4.7Chile 61.3 71.6 84.0 5.2 5.6 4.9Czech Republic 41.9 78.9 84.8 20.7 4.4 2.2Denmark 60.5 80.3 85.9 8.5 4.7 4.8Estonia 57.3 76.8 85.7 12.5 6.2 3.8Finland 53.4 72.8 82.7 12.1 8.2 6.4France 54.1 72.7 83.8 14.0 8.8 5.7Germany 58.7 79.9 88.1 11.4 4.3 2.3Greece 48.5 56.4 68.7 26.3 25.5 19.0Hungary 48.1 73.7 83.0 15.5 5.7 2.2Iceland 78.4 88.1 91.8 4.0 3.1 2.8Ireland 48.8 68.9 82.1 15.9 9.9 5.1Israel 48.6 73.4 86.5 6.5 5.4 3.6Italy 50.2 70.1 78.6 14.2 8.9 6.8

295 Indicators of Education in the Russian Federation
Employment rate by educational attainment (employed population as a percentage of the total population with the respective
educational attainment)
Unemployment rate by educational attainment (unemployed population as a percentage of the total economically active population
with the respective educational attainment)
Basic general education and below
(ISCED 0, 1 and 2)
Secondary general and secondary vocational education (programmes
for skilled workers, junior technicians
and employees) (ISCED 3 and 4)
Secondary vocational education (programmes
for midcareer professionals),
higher education (ISCED 5, 6, 7 and 8)
Basic general education and below
(ISCED 0, 1 and 2)
Secondary general and secondary vocational education (programmes
for skilled workers, junior technicians
and employees) (ISCED 3 and 4)
Secondary vocational education (programmes
for midcareer professionals),
higher education (ISCED 5, 6, 7 and 8)
Japan … … … … … …Latvia 56.4 71.8 85.8 19.6 10.7 4.5Luxembourg 62.3 71.8 84.8 8.3 5.4 4.6Mexico 64.3 70.6 80.1 3.1 4.0 4.2Netherlands 60.0 78.2 88.2 9.3 6.8 3.7New Zealand 69.1 81.3 87.5 6.2 4.8 2.8Norway 61.0 80.5 89.2 7.7 3.3 2.5Poland 40.8 67.2 87.1 15.5 7.1 3.5Portugal 64.3 78.7 83.7 13.0 11.4 8.2Republic of Korea 65.8 72.4 77.4 2.7 3.3 3.2Slovakia 34.5 72.6 80.3 34.2 9.9 5.6Slovenia 49.0 69.7 84.4 13.6 9.4 5.7Spain 51.6 67.7 78.5 28.9 19.2 12.4Sweden 65.9 85.1 89.3 13.1 4.6 4.0Switzerland 68.8 83.2 89.2 9.6 3.6 3.2Turkey 50.9 62.1 76.2 9.1 9.2 8.4United Kingdom 58.6 80.7 85.9 6.8 3.6 2.7United States 54.7 68.6 81.2 9.2 6.0 2.7
* The data for foreign countries refer to 2015 or the previous or following years for which the data are available. ** The information is given according to the results of sample population surveys on employment issues.
(continued)

2967. International Comparisons
7.5. EMPLOYMENT RATE OF PEOPLE HAVING ATTAINED SECONDARY VOCATIONAL EDUCATION (PROGRAMMES FOR MID-CAREER PROFESSIONALS) AND HIGHER EDUCATION (ISCED 5, 6, 7 AND 8) IN RUSSIA AND OECD COUNTRIES
BY FIELD OF SCIENCE: 2012*(aged 25–64; excluding those studying at the moment of the survey; per cent)
Education and Educational
research
Arts and Humanities Social sciences. Economics and Law
Physics and Mathematics,
Natural sciences
Engineering and technology,
Engineering sciences
Healthcare Total
Russia 72.5 64.4 69.5 60.8 74.8 70.7 68.1Australia 81.4 79.1 87.3 86.2 88.5 85.4 85.2Austria 84.3 84.1 91.4 87.5 86.7 94.2 87.3Canada 85.4 82.1 84.0 88.7 91.4 85.4 86.0Chile 92.4 80.9 92.1 91.0 93.1 92.1 90.3Czech Republic 88.2 87.6 81.9 93.0 84.8 80.6 85.1Denmark 84.4 87.8 90.8 90.9 89.6 87.3 88.1Estonia 88.4 93.4 86.2 88.2 85.1 92.5 87.6Finland 90.1 84.3 87.7 90.4 88.6 89.6 88.2France 84.2 84.0 84.8 83.9 87.8 86.9 85.0Germany 84.4 84.7 89.9 90.5 92.9 89.9 89.5Greece 56.9 72.1 70.9 73.8 71.2 74.9 68.1Ireland 80.8 77.7 80.6 88.2 78.1 92.6 83.0Israel 77.5 84.0 87.9 88.6 90.6 90.0 85.8Italy … 69.5 90.4 77.9 93.2 85.1 82.9Japan 70.4 65.7 84.5 90.7 92.5 76.5 79.7Netherlands 85.7 87.2 89.9 89.1 88.1 87.3 88.3New Zealand 86.3 82.2 87.9 90.8 89.5 86.5 87.2Norway 92.3 90.8 91.1 94.4 92.6 93.2 92.4

297 Indicators of Education in the Russian Federation
Education and Educational
research
Arts and Humanities Social sciences. Economics and Law
Physics and Mathematics,
Natural sciences
Engineering and technology,
Engineering sciences
Healthcare Total
Poland 87.2 82.9 88.8 85.3 93.2 94.2 88.2Republic of Korea 72.9 70.2 83.1 81.6 84.9 79.0 79.4Slovakia 77.0 83.3 93.3 91.1 85.1 89.6 86.8Slovenia 76.8 87.3 81.3 83.8 86.1 85.3 82.8Spain 75.5 71.8 82.5 83.0 84.0 81.8 80.0Sweden 90.0 88.8 91.9 91.8 95.0 93.2 92.3Turkey 71.6 … 67.8 68.5 74.1 63.0 69.3United States 82.4 87.6 88.0 81.6 86.4 86.5 85.5
* According to the results of The Programme for the International Assessment of Adult Competencies (PIAAC). In Chile, Greece, Israel, New Zealand, Slovenia and Turkey the survey took part in 2015, in other countries – in 2012.
(continued)

2987. International Comparisons
7.6. PUBLIC EXPENDITURE ON EDUCATION IN RUSSIA AND OECD COUNTRIES AS A PERCENTAGE OF GDP: 2015*
0
1
2
3
4
5
6
76.2
Norw
ay6.1
Denm
ark
5.6
Finl
and
5.6
Belg
ium
5.6
Icel
and
5.2
Swed
en
5.2
Unit
ed K
ingd
om
5.1
Port
ugal
5.0
Irel
and
5.0
Esto
nia
4.8
Aust
ria
4.8
New
Zea
land
4.8
Isra
el
4.7
Swit
zerla
nd
4.7
Fran
ce
4.7
Neth
erla
nds
4.6
Cana
da
4.4
Pola
nd
4.4
Slov
enia
4.3
Turk
ey
4.2
Unit
ed S
tate
s
4.2
Mex
ico
4.0
Latv
ia
4.0
Repu
blic
of K
orea
3.9
Aust
ralia
3.6
Spai
n
3.5
Czec
h Re
publ
ic
3.4
Slov
akia
3.2
Japa
n
3.1
Hung
ary
1.5 1.6 1.71.3 1.2
1.51.1 0.9 1.1
1.9 1.7
0.9 0.91.3 1.2 1.2 1.3 1.2 1.0
1.41.0 0.9 1.0 0.9 0.7 0.9 1.1
0.8 0.6 0.8
Expenditure on education:
total higher education (ISCED 6, 7 and 8)**
3.7
Germ
any
3.7
Chile
3.7
Ital
y
1.0 1.0 0.8
3.6
Russ
ia
0.6
* The data for foreign countries refer to 2013 or the previous or following years for which the data are available, excluding expenditure that was not allocated to programmes; including state subsidies for households within the educational institutions’ funds and the direct expenditure on educational institutions financed from abroad (for Australia, Chile and the Republic of Korea – excluding funds from abroad). The data for Russia include the expenditure from the consolidated budget and state extra-budgetary funds.
** The data for foreign countries include the expenditure on ISCED 5 (excluding Portugal, Finland, Sweden and Estonia). The data for the United States include the expenditure on ISCED 4 also; the data for Japan and Portugal partly include the expenditure on ISCED 4.

299 Indicators of Education in the Russian Federation
7.7. PUBLIC EXPENDITURE ON EDUCATION AS A PERCENTAGE OF THE TOTAL PUBLIC EXPENDITURE IN RUSSIA AND OECD COUNTRIES: 2015*
0
2
4
6
8
10
12
14
16
18
20
18.4
4.5
New
Zea
land
17.3
4.0
Mex
ico
15.4
4.2
Chile
14.9
4.1
Swit
zerla
nd
13.8
3.3
Aust
ralia
13.5
3.4
Icel
and
13.2
2.9
Irel
and
13.0
4.3
Norw
ay
12.8
4.1
Denm
ark
12.8
2.7
Repu
blic
of K
orea
12.4
2.4
Cana
da
12.2
4.0
Unit
ed S
tate
s
12.1
3.0
Unit
ed K
ingd
om
11.7
3.6
Esto
nia
11.5
1.6
Isra
el
11.3
3.5
Neth
erla
nds
11.2
3.6
Swed
en
11.1
2.2
Latv
ia
10.5
3.5
Finl
and
10.4
2.6
Belg
ium
10.3
2.8
Pola
nd
10.2
1.7
Russ
ia9.
93.
0Au
stri
a
9.6
1.8
Port
ugal
9.5
2.9
Germ
any
8.7
2.3
Slov
akia
8.4
1.7
Fran
ce
8.2
1.8
Spai
n
8.1
1.7
Japa
n
8.0
2.1
Czec
h Re
publ
ic
7.5
1.8
Slov
enia
7.3
1.6
Ital
y
6.8
1.7
Hung
ary
higher education (ISCED 6, 7 and 8)**total Expenditure on education:
* The data for OECD countries refers to 2013 or the nearest years; without expenditure not allocated to the programmes; including state subsidies for households on students’ support expensed outside educational institutions and direct expenditure on educational institutions financed from abroad; the data for Russia includes expenditure from the consolidated budget and state extra-budgetary funds.
** The data for the OECD countries includes expenditure on R&D. The data for Denmark, Ireland, Mexico includes expenditure on ISCED 5, the data for the United States includes expenditure on ISCED 4 and ISCED 5; the data for Portugal and Japan partly includes expenditure on ISCED 4.

3007. International Comparisons
7.8. PARTICIPATION IN EDUCATION OF THE POPULATION AGED 5–29 IN RUSSIA AND OECD COUNTRIES: 2015*(per cent)
Participation in education of the population by age, years
5–14 15–19 20–29
Secondary general and secondary vocational education (programmes
for skilled workers, junior technicians and employees)
(ISCED 3 and 4)
Secondary vocational education (programmes for mid-career
professionals), higher education (ISCED 5, 6, 7 and 8)
Russia** 97.8 87.2 0.6 17.2Australia 100 86.8 9.4 23.4Austria 98.4 79.6 3.2 23.0Belgium 98.0 92.4 6.0 21.5Canada*** 90.6 73.1 2.8 19.2Chile 97.5 79.6 1.3 27.3Czech Republic 97.7 90.4 … 22.9Denmark 99.3 87.0 13.6 31.5Estonia 73.1 89.7 6.1 22.9Finland 96.7 86.0 12.7 28.4France 99.3 85.1 1.9 19.3Germany 99.1 89.7 11.6 22.8Greece 96.1 83.3 2.1 26.0Hungary 96.6 86.4 6.2 18.8Iceland … … … …Ireland 100 94.8 5.6 20.6Israel 97.8 65.5 1.4 21.0Italy 98.2 77.4 1.8 22.4Japan 100 94.1 … …Latvia 97.7 91.9 5.2 23.2

301 Indicators of Education in the Russian Federation
Participation in education of the population by age, years
5–14 15–19 20–29
Secondary general and secondary vocational education (programmes
for skilled workers, junior technicians and employees)
(ISCED 3 and 4)
Secondary vocational education (programmes for mid-career
professionals), higher education (ISCED 5, 6, 7 and 8)
Luxembourg 97.1 76.3 5.7 7.0Mexico 100 55.6 1.3 11.0Netherlands 99.4 92.1 7.7 24.0New Zealand 98.5 82.2 7.1 22.3Norway 99.4 87.0 5.5 25.2Poland 95.6 89.3 5.9 24.9Portugal 99.7 89.2 4.3 19.5Republic of Korea 98.5 87.2 0.0 31.3Slovakia 93.7 84.7 1.8 18.6Slovenia 97.0 93.2 4.0 27.9Spain 97.2 87.2 5.0 23.9Sweden 98.2 85.3 9.0 21.3Switzerland 99.8 85.5 6.6 20.1Turkey 95.9 72.2 4.6 28.5United Kingdom 98.8 84.6 6.0 15.3United States 97.2 81.6 1.3 24.2
* The data for foreign countries refer to 2014 or the previous or following years for which the data are available. The discrepancy between the data concerning the number of population and the number (enrolment) of students can give erroneously high or low results (e.g. if the majority of the population studies abroad: if there is a discrepancy in time properties underlying indices, used in the calculation, etc.). For countries where the index exceeds 100 per cent, the value given is 100.
** Estimates of the Institute for Statistical Studies and Economics of Knowledge, National Research University Higher School of Economics. *** Excluding programmes ISCED 010 and 4.
(continued)

3027. International Comparisons
7.9. THE PROPORTION OF FOREIGN STUDENTS AND POSTGRADUATE STUDENTS IN THE TOTAL NUMBER THEREOF IN RUSSIA AND OECD COUNTRIES: SECONDARY VOCATIONAL EDUCATION (PROGRAMMES FOR MID-CAREER PROFESSIONALS)
AND HIGHER EDUCATION (ISCED 5, 6, 7 AND 8): 2015*
0
2
4
6
8
10
12
14
16
18
20 18.7
18.3
18.2
17.1
15.5
11.2
10.1
9.9
9.8
9.8
9.7
7.4
7.2
7.0
7.0
5.9
5.6
5.0
4.2
4.2
4.1
4.1
3.7
3.5
3.4
2.8
2.7
2.4
2.0
1.6
0.9
New
Zea
land
Aust
ralia
Unit
ed K
ingd
om
Swit
zerla
nd
Aust
ria
Belg
ium
Neth
erla
nds
Denm
ark
Fran
ce
Czec
h Re
publ
ic
Cana
da
Finl
and
Germ
any
Hung
ary
Irel
and
Swed
en
Slov
akia
Latv
ia
Unit
ed S
tate
s
Gree
ce
Russ
ia
Port
ugal
Esto
nia
Norw
ay
Japa
n
Isra
el
Slov
enia
Spai
n
Pola
nd
Repu
blic
of K
orea
Turk
ey
Per cent
* The data for foreign countries refer to 2014 or the previous or following years for which the data are available.

303 Indicators of Education in the Russian Federation
7.10. PERCENTAGE DISTRIBUTION OF GRADUATES IN RUSSIA AND OECD COUNTRIES HAVING ATTAINED SECONDARY VOCATIONAL EDUCATION (PROGRAMMES FOR MID-CAREER PROFESSIONALS) AND HIGHER EDUCATION FOR THE FIRST TIME
BY EDUCATIONAL ATTAINMENT: 2015*(per cent)
Secondary vocational education (programmes for mid-career
professionals) (ISCED 5)
Higher education: bachelor’s programmes (ISCED 6)
Higher education: specialist’s and master’s programmes
(ISCED 7)
Russia 26.1 32.7 41.2Australia 6.4 75.9 17.7Austria 48.6 31.7 19.7Belgium … … … Canada … … … Chile 41.8 56.0 2.2Czech Republic 0.6 89.0 10.4Denmark 18.0 75.2 6.8Estonia … … … Finland _ 88.7 11.3France … … … Germany 0.1 79.7 20.3Greece … … … Hungary 19.2 68.8 12.0Iceland 3.0 95.4 1.6Ireland … … … Israel … … … Italy 0.5 81.5 18.0Japan 34.3 63.4 2.3

3047. International Comparisons
Secondary vocational education (programmes for mid-career
professionals) (ISCED 5)
Higher education: bachelor’s programmes (ISCED 6)
Higher education: specialist’s and master’s programmes
(ISCED 7)
Latvia 27.3 68.9 3.9Luxembourg 17.6 34.8 47.5Mexico 8.2 91.8 _Netherlands 1.4 90.9 7.7New Zealand 31.1 65.9 2.9Norway 9.0 81.4 9.6Poland … … … Portugal – 84.2 15.8Republic of Korea … … … Slovakia 2.6 92.9 4.5Slovenia 15.1 63.2 21.8Spain 35.3 38.7 26.0Sweden 3.2 63.3 33.5Switzerland 3.5 96.1 0.4Turkey 41.9 56.7 1.4United Kingdom 9.3 88.5 2.1United States 41.3 58.7 –
* The data for foreign countries refer to 2014 or the previous or following years for which the data are available.
(continued)

305 Indicators of Education in the Russian Federation
7.11. FEMALE PROPORTION IN THE TOTAL NUMBER OF TEACHERS IN RUSSIA AND OECD COUNTRIES: 2015*(per cent)
Primary education (ISCED 1)
Basic general education (ISCED 2)
Secondary vocational education (ISCED 3)**
Secondary vocational education (programmes
for mid-career professionals), higher education
(ISCED 5, 6, 7 and 8)
(1) (2) (3) (4)
Russia 98.9 n(3) 83.3 63.7Australia … … … 44.5***Austria 91.4 72.0 62.8 42.6Belgium 81.7 63.2 62.6 48.2Canada 73.6**** n(1) 73.6 49.4Chile 81.0 68.2 57.4 …Czech Republic 92.8 76.9 59.2 39.9Denmark 69.1 64.3 50.8 41.2Estonia 91.6 82.1 78.3 48.9Finland 79.5 72.4 69.8 50.3France 83.1 64.6 55.6 39.9*****Germany 86.8 66.1 54.7 38.0Greece 70.2 66.0 54.1 32.7Hungary 97.0 77.6 68.6 43.3Iceland ... … … …Ireland 86.9 n(3) 71.0 44.0Israel 85.3 78.9 70.0 …Italy 95.9 77.9 71.9 37.5Japan 64.8 42.4 30.0***** 26.8*****Latvia 92.8 84.3 84.5 55.7Luxembourg 74.5 58.5 54.1 38.4

3067. International Comparisons
Primary education (ISCED 1)
Basic general education (ISCED 2)
Secondary vocational education (ISCED 3)**
Secondary vocational education (programmes
for mid-career professionals), higher education
(ISCED 5, 6, 7 and 8)
(1) (2) (3) (4)
Mexico 67.6 52.4 47.2 …Netherlands 85.9 51.3 51.3 43.5New Zealand 83.8 65.6 60.4 49.1Norway 74.8 74.8 52.1***** 45.2***Poland 85.3 73.7 70.4 44.2Portugal 79.8 71.6 67.8***** 44.0*****Republic of Korea 78.6 69.2 51.0 34.7Slovakia 90.0 77.8 74.2 44.9Slovenia 96.9 79.5 70.0 38.8Spain 76.0 59.2 56.2 41.7Sweden 77.2 77.1 52.6 43.9Switzerland 82.0 53.9 46.0 34.0Turkey 58.2 53.2 45.7 42.8United Kingdom 84.1 58.8 61.9 44.3United States 87.2 66.8 57.0 49.1*****
* The data for foreign countries refer to 2014 or the previous or following years for which the data are available; the data for Israel, Ireland, the Netherlands, Switzerland – only for state institutions. For Russia the data refer to the teaching staff at general education institutions (excluding part-time (shift) general education institutions) (ISCED 1, 2 and 3), and to the teaching staff at educational institutions implementing secondary vocational education programmes for mid-career professionals and to the pedagogical personnel of higher education institutions (ISCED 5, 6 and 7).
** For foreign countries – general ISCED 3; for Israel, Canada, Mexico, Norway, Portugal, the United States, Sweden and Japan – all programmes (general and vocational). *** Excluding ISCED 5 programmes. **** Including ISCED 0 programmes. ***** Including ISCED 4 programmes; for Norway – including ISCED 5 programmes.
(continued)

307 Indicators of Education in the Russian Federation
7.12. NUMBER OF STUDENTS PER TEACHER IN RUSSIA AND OECD COUNTRIES: 2015*(headcount)
Primary education (ISCED 1)
Basic general education (ISCED 2)
Secondary vocational education
(ISCED 3)**
Secondary vocational education (programmes
for mid-career professionals), higher education
(ISCED 5, 6, 7 and 8)
(1) (2) (3) (4)
Russia n(3) n(3) 14 11Australia 16 n(3) 12 15***Austria 12 9 10 15Belgium 13 9 10 22Canada 16**** n(1) 14 …Chile 21 23 24 …Czech Republic 19 12 12 22Denmark 12 11 11 14Estonia 13 10 13 15Finland 13 9 14 14France 19 15 9 18*****Germany 15 13 13 12Greece 9 8 … 45Hungary 11 11 12 15Iceland … … … …Ireland 16 n(3) 14 20Israel 15 12 11 …Italy 12 12 13 19Japan 17 14 12***** …Latvia 11 8 8 19Luxembourg 9 11 8 …

3087. International Comparisons
Primary education (ISCED 1)
Basic general education (ISCED 2)
Secondary vocational education
(ISCED 3)**
Secondary vocational education (programmes
for mid-career professionals), higher education
(ISCED 5, 6, 7 and 8)
(1) (2) (3) (4)
Mexico 27 33 21 16Netherlands 17 16 16 16New Zealand 16 16 12 17Norway 10 10 10***** 10***Poland 11 10 13 15Portugal 14 10 9***** 14Republic of Korea 17 17 15 21Slovakia 17 12 14 14Slovenia 16 8 13 17Spain 14 12 12 13Sweden 13 12 14 11Switzerland 15 12 11 …Turkey 19 18 16 20United Kingdom 20 15 15 17United States 15 15 15 15*****
* The data for foreign countries refer to 2014 or the previous or following years for which the data are available and are presented in full-time equivalents; the data for Israel (only with reference to ISCED 3), Ireland, the Netherlands, Switzerland – only for state institutions. For Russia the data refer to the teaching staff at general education institutions (excluding part-time (shift) general education institutions) (ISCED 1, 2 and 3), and to the teaching staff at educational institutions implementing secondary vocational education programmes for mid-career professionals and to the pedagogical personnel of higher education institutions (ISCED 5, 6 and 7).
** For foreign countries – general ISCED 3; for Israel, Canada Mexico, Norway, Portugal, the United States, Sweden and Japan – all programmes (general and vocational). *** Excluding ISCED 5 programmes. **** Including ISCED 0 programmes. ***** Including ISCED 4 programmes; for Norway – including ISCED 5 programmes.
(continued)

309 Indicators of Education in the Russian Federation
7.13. AVERAGE CLASS SIZE IN RUSSIA AND OECD COUNTRIES: 2015*(headcount)
Primary education (ISCED 1) Basic general education (ISCED 2)
Total State and municipal institutions
Private institutions Total State and municipal institutions
Private institutions
Russia 21 21 13 19 19 12 Australia 24 23 25 24 23 25Austria 18 18 19 21 21 21Belgium … … … … … …Canada … … … … … …Chile 30 29 31 31 30 31Czech Republic 21 21 15 22 22 19Denmark … … … … … …Estonia 17 17 16 15 15 13Finland 19 19 17 20 20 20France 23 23 23 25 25 26Germany 21 21 21 24 24 24Greece … … … … … …Hungary 21 21 20 21 21 21Iceland 19 19 13 20 20 11Ireland … 25 … … … …Israel 27 28 24 28 29 24Italy 20 20 20 21 21 21Japan 27 27 29 32 32 33Latvia 16 16 9 15 15 10Luxembourg 16 15 21 19 19 19Mexico 19 19 19 28 28 24
Primary education (ISCED 1)
Basic general education (ISCED 2)
Secondary vocational education
(ISCED 3)**
Secondary vocational education (programmes
for mid-career professionals), higher education
(ISCED 5, 6, 7 and 8)
(1) (2) (3) (4)
Mexico 27 33 21 16Netherlands 17 16 16 16New Zealand 16 16 12 17Norway 10 10 10***** 10***Poland 11 10 13 15Portugal 14 10 9***** 14Republic of Korea 17 17 15 21Slovakia 17 12 14 14Slovenia 16 8 13 17Spain 14 12 12 13Sweden 13 12 14 11Switzerland 15 12 11 …Turkey 19 18 16 20United Kingdom 20 15 15 17United States 15 15 15 15*****
* The data for foreign countries refer to 2014 or the previous or following years for which the data are available and are presented in full-time equivalents; the data for Israel (only with reference to ISCED 3), Ireland, the Netherlands, Switzerland – only for state institutions. For Russia the data refer to the teaching staff at general education institutions (excluding part-time (shift) general education institutions) (ISCED 1, 2 and 3), and to the teaching staff at educational institutions implementing secondary vocational education programmes for mid-career professionals and to the pedagogical personnel of higher education institutions (ISCED 5, 6 and 7).
** For foreign countries – general ISCED 3; for Israel, Canada Mexico, Norway, Portugal, the United States, Sweden and Japan – all programmes (general and vocational). *** Excluding ISCED 5 programmes. **** Including ISCED 0 programmes. ***** Including ISCED 4 programmes; for Norway – including ISCED 5 programmes.

3107. International Comparisons
Primary education (ISCED 1) Basic general education (ISCED 2)
Total State and municipal institutions
Private institutions Total State and municipal institutions
Private institutions
Netherlands 23 23** … … … …New Zealand … … … 25 25 21Norway … … … … … …Poland 18 19 11 22 23 17Portugal 21 21 21 23 23 24Republic of Korea 24 24 28 32 32 31Slovakia 18 18 17 19 19 18Slovenia 19 19 20 20 20 21Spain 22 21 24 25 25 26Sweden 18 18 16 20 20 21Switzerland … … … … … …Turkey 23 23 19 28 28 19United Kingdom 25 26 21 19 20 18United States 21 22 18 27 28 20
* The data for foreign countries refer to 2014 year. For Russia – the date as of the beginning of the 2015/2016 academic year refer to general education institutions (excluding part-time (shift) general education institutions); general education institutions and classes for students with limited health capacities; specialized (correctional) educational institutions for students with deviant (socially dangerous) behavior; sanatorium educational institutions for students who need long-term medical care; educational institutions for students who need psycho-pedagogical and medico-social assistance.
** Including private institutions dependent from the state.
(continued)
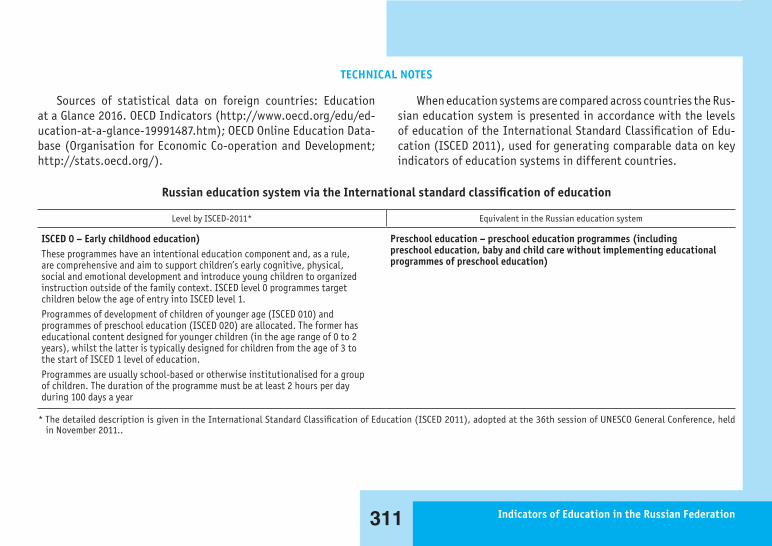
311 Indicators of Education in the Russian Federation
Russian education system via the International standard classification of education
Level by ISCED-2011* Equivalent in the Russian education system
ISCED 0 – Early childhood education) These programmes have an intentional education component and, as a rule, are comprehensive and aim to support children’s early cognitive, physical, social and emotional development and introduce young children to organized instruction outside of the family context. ISCED level 0 programmes target children below the age of entry into ISCED level 1. Programmes of development of children of younger age (ISCED 010) and programmes of preschool education (ISCED 020) are allocated. The former has educational content designed for younger children (in the age range of 0 to 2 years), whilst the latter is typically designed for children from the age of 3 to the start of ISCED 1 level of education. Programmes are usually school-based or otherwise institutionalised for a group of children. The duration of the programme must be at least 2 hours per day during 100 days a year
Preschool education – preschool education programmes (including preschool education, baby and child care without implementing educational programmes of preschool education)
TECHNICAL NOTES
* The detailed description is given in the International Standard Classification of Education (ISCED 2011), adopted at the 36th session of UNESCO General Conference, held in November 2011..
Sources of statistical data on foreign countries: Education at a Glance 2016. OECD Indicators (http://www.oecd.org/edu/ed-ucation-at-a-glance-19991487.htm); OECD Online Education Data-base (Organisation for Economic Co-operation and Development; http://stats.oecd.org/).
When education systems are compared across countries the Rus-sian education system is presented in accordance with the levels of education of the International Standard Classification of Edu-cation (ISCED 2011), used for generating comparable data on key indicators of education systems in different countries.
Primary education (ISCED 1) Basic general education (ISCED 2)
Total State and municipal institutions
Private institutions Total State and municipal institutions
Private institutions
Netherlands 23 23** … … … …New Zealand … … … 25 25 21Norway … … … … … …Poland 18 19 11 22 23 17Portugal 21 21 21 23 23 24Republic of Korea 24 24 28 32 32 31Slovakia 18 18 17 19 19 18Slovenia 19 19 20 20 20 21Spain 22 21 24 25 25 26Sweden 18 18 16 20 20 21Switzerland … … … … … …Turkey 23 23 19 28 28 19United Kingdom 25 26 21 19 20 18United States 21 22 18 27 28 20
* The data for foreign countries refer to 2014 year. For Russia – the date as of the beginning of the 2015/2016 academic year refer to general education institutions (excluding part-time (shift) general education institutions); general education institutions and classes for students with limited health capacities; specialized (correctional) educational institutions for students with deviant (socially dangerous) behavior; sanatorium educational institutions for students who need long-term medical care; educational institutions for students who need psycho-pedagogical and medico-social assistance.
** Including private institutions dependent from the state.

3127. International Comparisons
Level by ISCED-2011* Equivalent in the Russian education system
ISCED 1 – Primary education Programmes are typically designed to provide students with fundamental skills in reading, writing and mathematics (i.e. literacy and numeracy) and establish a solid foundation for learning and understanding core areas of knowledge, personal and social development, in preparation for ISCED 2 level of education. It focuses on learning at a basic level of complexity with little, if any, specialisation. Age is typically the only legal entry requirement at this level (in the majority of the countries the customary or legal age of entry is usually not below 5 years old nor above 7 years old). This level typically lasts 6 years, although its duration can range between 4 and 7 years. Typically, one main teacher is responsible for the educational process
Primary general education
ISCED 2 – Lower secondary education The programmes are typically designed to build on the learning outcomes from the previous level. Usually the aim is to lay the foundation for lifelong learning and personal development. Programmes at ISCED level 2 are usually organised around a more subject-oriented curriculum. This level requires the completion of ISCED level 1 or the ability to study ISCED level 2 content through a combination of prior education as well as life and work experiences. ISCED level 2 ends after 8–11 years of education after the beginning of ISCED level 1 and typically lasts nine years in total
Basic general education
(continued)

313 Indicators of Education in the Russian Federation
Level by ISCED-2011* Equivalent in the Russian education system
ISCED 3 – Upper secondary education The programmes at this level are typically designed to complete secondary education in preparation for tertiary education or provide skills relevant to employment, or both. Programmes at ISCED level 3 may be either general or vocational. The education at ISCED level 3 usually lasts from 11 to 13 years since the beginning of ISCED level 1. ISCED level 3 requires the completion of lower secondary education (ISCED level 2) or the ability to handle ISCED level 3 content through a combination of prior education as well as life and work experiences
Secondary general education; Secondary vocational education – programmes for skilled workers, junior technicians and employees based on secondary general education (both with or without attaining the secondary general education level); vocational training – professional training programmes for skilled workers, junior technicians and employees (for people without secondary general education)
ISCED 4 – Post-secondary non-tertiary education Post-secondary non-tertiary education provides learning experiences building on secondary education, preparing for labour market entry as well as tertiary education. It aims at the individual acquisition of knowledge, skills and competencies lower than the level of complexity characteristic of tertiary education. Programmes at ISCED level 4 are typically designed to provide individuals who completed ISCED level 3 with non-tertiary qualifications required for progression to tertiary education or for employment when their ISCED level 3 qualification does not grant such access. ISCED level 4 programmes are not considered to be tertiary education and are typically vocational programmes that prepare for the labour market. Such programmes target students who have completed ISCED level 3. Programmes are often not significantly more advanced than programmes at ISCED level 3 but the content is typically more specialised or detailed. At the same time the programmes are clearly less advanced than at the tertiary level
Secondary vocational education programmes for skilled workers, junior technicians and employees based on secondary general education programmes; vocational training – professional training programmes for skilled workers, junior technicians and employees; retraining programmes for skilled workers, junior technicians and employees; professional development programmes aiming at upgrading professional skills of skilled workers, junior technicians and employees (for people who have attained at least secondary general level of education)
(continued)

3147. International Comparisons
Level by ISCED-2011* Equivalent in the Russian education system
ISCED 5 – Short-cycle tertiary education The programmes at this level are designed to provide participants with professional knowledge and develop their professional skills and competencies. Programmes at ISCED level 5 are usually practically-based, occupationally specific and prepare students to enter the labour market, however, they may also provide a pathway to other tertiary education programmes. Some academic tertiary education programmes below the level of a bachelor’s programme or equivalent may also be classified as ISCED level 5. Entry into ISCED level 5 programmes requires the successful completion of ISCED level 3 or 4 programmes that give access to tertiary education. ISCED level 5 has a minimum duration of 2 years but not more than 3 years
Secondary vocational education – programmes for mid-career professionals (including programmes based on basic general education)
ISCED 6 – Bachelor’s or equivalent level Programmes at ISCED level 6 are often designed to provide participants with intermediate academic and/or professional knowledge, skills and competencies, leading to a first degree or equivalent qualification. Programmes at this level are typically theoretically-based but may include practical components and are informed by state of the art research and/or best professional practice. Entry into these programmes normally requires the successful completion of an ISCED level 3 or 4 programme with access to tertiary education. Programmes at this level typically have a duration of 3–4 years of intramural full-time study. Programmes at this level typically lead to first degrees or equivalent qualification in tertiary education
Higher education – bachelor’s programmes
(continued)

315 Indicators of Education in the Russian Federation
Level by ISCED-2011* Equivalent in the Russian education system
ISCED 7 – Master’s or equivalent level Programmes at ISCED level 7 are often designed to provide participants with advanced academic and/or professional knowledge, skills and competencies, leading to a second degree of tertiary education or equivalent qualification. Programmes at this level may have a substantial research component but do not yet lead to the award of a doctoral qualification (PhD). Entry into ISCED level 7 programmes normally requires the successful completion of an ISCED level 6 or 7 programmes
Higher education – specialist’s and master’s programmes
ISCED 8 – Doctoral or equivalent level Programmes at ISCED level 8 are designed primarily to lead to an advanced research qualification. Programmes at this ISCED level are devoted to advanced study and original research and the level usually concludes with the submission and defence of a thesis, dissertation or equivalent written work of publishable quality, representing a significant contribution to knowledge in the respective field of study. Entry into ISCED level 8 programmes normally requires the successful completion of ISCED level 7 programmes. ISCED level 8 requires at least three years of intramural full-time equivalent study with a cumulative duration of intramural full-time education at tertiary level of at least 7 years
Higher education – postgraduate programmes (including postgraduate military studies), residency programmes and apprenticeship programmes in the sphere of art and performance
(continued)

INDICATORS OF EDUCATION IN THE RUSSIAN FEDERATIONData Book
Edited by A. Kukovskaya, T. MagalaDesign P. Shelegeda
Desk-top publishing V. Parshina
National Research University Higher School of EconomicsInstitute for Statistical Studies and Economics of Knowledge
20 Myasnitskaya st., Moscow, 101000, Russia Tel.: +7(495) 621-28-73
http://issek.hse.ru, E-mail: [email protected]