inauguraldissertation - FreiDok plus
152
Structural and functional characterization of a novel Ammonium Transport protein from “Candidatus Kuenenia stuttgartiensis” INAUGURALDISSERTATION zur Erlangung des Doktorgrades der Fakultät für Chemie, Pharmazie und Geowissenschaften der Albert-Ludwig-Universität Freiburg im Breisgau vorgelegt von Camila José Hernández Frederick aus Caracas, Venezuela Freiburg 2011
-
Upload
khangminh22 -
Category
Documents
-
view
3 -
download
0
Transcript of inauguraldissertation - FreiDok plus

Structural and functional characterization of
a novel Ammonium Transport protein from
“Candidatus Kuenenia stuttgartiensis”
INAUGURALDISSERTATION
zur Erlangung des Doktorgrades
der Fakultät für Chemie, Pharmazie und Geowissenschaften
der Albert-Ludwig-Universität Freiburg im Breisgau
vorgelegt von
Camila José Hernández Frederick
aus Caracas, Venezuela
Freiburg 2011

Vorsitzender des Promotionsausschusses: Prof. Dr. Rolf Schubert
Referent: Dr. Susana Andrade
Korreferent: Prof. Dr. Oliver Einsle
Datum der Promotion: 23.09.2011

For my mother, my father and my little brother Los quiero con todo mi corazón

Table of contents
Camila Hernández
4
1 Zusammenfassung ............................................................................................................. 7
2 Summary ............................................................................................................................... 8
3 Introduction ......................................................................................................................... 9
3.1 Nitrogen cycle and biological relevance ................................................................. 9
3.2 Anaerobic ammonium oxidation (anammox) ................................................... 11
3.2.1 Anammox bacteria ................................................................................................................ 14
3.3 Ammonium transport proteins (Amt) ................................................................. 16
3.3.1 Amt protein structures ........................................................................................................ 17
3.3.2 Ammonia/ammonium transport mechanism ............................................................ 21
3.3.3 Regulation of Amt proteins ................................................................................................ 26
3.3.4 Multiplicity of Amt proteins .............................................................................................. 29
3.3.5 The Amt protein Ks-Amt5 from “Ca. Kuenenia stuttgartiensis” .......................... 30
3.4 Histidine kinases ......................................................................................................... 31
3.4.1 Characteristic sequence motifs and function .............................................................. 33
3.4.2 Classification of histidine kinase proteins ................................................................... 36
3.4.3 Structure of the cytoplasmatic portion of the sensor histidine-kinase TM083 from Thermotoga maritima ............................................................................................................. 38
3.5 Aims of this work ......................................................................................................... 40
4 Materials and Methods .................................................................................................. 42
4.1 Materials ......................................................................................................................... 42
4.1.1 Chemicals .................................................................................................................................. 42
4.1.2 Detergents ................................................................................................................................ 42
4.1.3 DNA and Protein Weight Markers ................................................................................... 42
4.1.4 Enzymes .................................................................................................................................... 42
4.1.5 Bacterial strains ..................................................................................................................... 43
4.1.6 DNA oligonucleotides ........................................................................................................... 44
4.1.7 Plasmids: The pET vector system ................................................................................... 44
4.2 Methods ........................................................................................................................... 47
4.2.1 Molecular biology .................................................................................................................. 47
4.2.1.1 Polymerase Chain Reaction (PCR)............................................................................... 47
4.2.1.2 Site-directed mutagenesis .............................................................................................. 49
4.2.1.3 DNA digestion with restriction endonucleases ...................................................... 49
4.2.1.4 DNA ligation ......................................................................................................................... 50
4.2.1.5 Agarose gel electrophoresis ........................................................................................... 50
4.2.1.6 Extraction of DNA from agarose gels ......................................................................... 51
4.2.1.7 DNA Sequence Analysis ................................................................................................... 52

Table of contents
Camila Hernández
5
4.2.2 Microbiological methods .................................................................................................... 52
4.2.2.1 Escherichia coli cultivation ............................................................................................ 52
4.2.2.2 Production and transformation of E. coli competent cells ................................. 52
4.2.2.3 Plasmid preparation ......................................................................................................... 53
4.2.2.4 Protein production in E. coli .......................................................................................... 54
4.2.3 Protein biochemistry ............................................................................................................ 54
4.2.3.1 Cell disruption and preparation of purification samples ................................... 54
4.2.3.2 Solubilization of membranes ......................................................................................... 55
4.2.3.3 Affinity chromatography ................................................................................................. 57
4.2.3.4 Size exclusion chromatography (SEC) ....................................................................... 58
4.2.3.5 Protein concentration determination ........................................................................ 60
4.2.3.6 SDS PAGE electrophoresis .............................................................................................. 61
4.2.3.7 Coomasie Brilliant Blue (CBB) staining ..................................................................... 63
4.2.3.8 Phosphorylation assay ..................................................................................................... 64
4.2.3.9 Western blot......................................................................................................................... 66
4.2.3.10 Blue Native PAGE (BN-PAGE) ..................................................................................... 68
4.2.3.11 Isothermal titration calorimetry ............................................................................... 69
4.2.3.11.1 ITC experiments with Ks-Kin................................................................................... 72
4.3 Protein crystallography ............................................................................................ 73
4.3.1 Crystallization ......................................................................................................................... 73
4.3.2 Crystallization of Ks-Amt5.................................................................................................. 74
4.3.3 Finescreens .............................................................................................................................. 75
4.3.4 Structure determination by X-ray crystallography .................................................. 76
4.3.5 Crystal arrangement ............................................................................................................. 76
4.3.6 X-ray diffraction by protein crystals .............................................................................. 77
4.3.7 The electron density function ........................................................................................... 80
4.3.8 Molecular replacement ........................................................................................................ 82
4.3.9 Structure determination of Ks-Amt5.............................................................................. 85
4.3.9.1 Cryo-cooling ......................................................................................................................... 85
4.3.9.2 Data collection and processing ..................................................................................... 86
4.3.9.3 Structure solution .............................................................................................................. 86
4.3.9.4 Model building and refinement .................................................................................... 87
4.4 Graphical representations ....................................................................................... 87
5 Results and discussion .................................................................................................. 88
5.1 Sequence analysis of Ks-Amt5 ................................................................................. 88
5.2 Cloning and mutagenesis of Ks-Amt5 ................................................................... 91
5.3 Protein production ..................................................................................................... 92
5.4 Protein purification .................................................................................................... 94
5.4.1 Ks-Amt5 ..................................................................................................................................... 94
5.4.2 Ks-Kin and variants ............................................................................................................... 97
5.5 Crystallization of Ks-Amt5 ...................................................................................... 100

Table of contents
Camila Hernández
6
5.6 Crystallization of Ks-Kin .......................................................................................... 102
5.7 Data collection and processing ............................................................................. 103
5.8 Overall structure and crystal packing ................................................................ 104
5.9 Ks-Amt5 monomer .................................................................................................... 107
5.10 Structural comparison of Ks-Amt5 with other Amt proteins .................. 111
5.11 Small Angle X-ray Scattering ............................................................................... 115
5.12 Functional studies .................................................................................................. 116
5.12.1 Thermodynamic characterization of Ks-Kin ........................................................... 116
5.12.2 Phosphorylation analysis of kinase activity of Ks-Amt5 .................................... 118
5.13 Remarks on the possible mechanism of transport for Ks-Amt5 ............ 122
5.14 Future perspectives ............................................................................................... 124
6 Appendix .......................................................................................................................... 126
6.1 Abbreviations ............................................................................................................. 126
6.2 Units ............................................................................................................................... 127
6.3 Prefixes ......................................................................................................................... 128
6.4 Amino acids ................................................................................................................. 128
6.5 Ks-Amt5 DNA sequence ........................................................................................... 129
6.6 Ks-Amt5 amino acid sequence .............................................................................. 130
7 References ....................................................................................................................... 131
8 Acknowledgements – Danksagung – Agradecimientos ...................................... 149
9 Curriculum Vitae ............................................................................................................ 152

Zusammenfassung
Camila Hernández
7
1 Zusammenfassung
Die Assimilierung von Stickstoff ist ein essenzieller biologischer Prozess.
Weitverbreitete Amt-Proteine katalysieren die Aufnahme von reduzierten Stickstoff
in Form von Ammonium. Sie sind in der Lage, Ammonium über zelluläre
Membranen zu transportieren und machen den reduzierten Stickstoff damit direkt
zugänglich für die Synthese von Biomolekülen. Trotzdem schon hochauflösende
Kristallstrukturen existieren, bleibt die Art des Substrats Gegenstand kontroverser
Diskussionen. Das Anammox-Bakterium “Candidatus Kuenenia stuttgartiensis“,
welches unter anaeroben Bedingungen in der Lage ist, Ammonium zu Stickstoff zu
oxidieren, besitzt fünf Kopien von amt-Genen in seinem Genom. Eine dieser Kopien
kodiert für ein untypisches, bisher unbeschriebenes Amt-Protein (Ks-Amt5). Neben
den typischen Charakteristica eines Ammoniumtransport-Proteins besitzt es eine
lösliche Domäne, welche als Histidin-Kinase identifiziert werden konnte. Histidin-
Kinasen sind Bestandteil eines Zweikomponentensystems zur Signalübertragung.
Sie sind in der Lage, extrazelluläre Signale zu erkennen, was zu alternierender
Aktivität von Autokinase und Autophosphatase führt. In dieser Arbeit wurde die
Kristallstruktur des Proteins Ks-Amt5 mit einer Auflösung von 2.1 Å gelöst. Das
Protein weist Homologien zu anderen Ammoniumtransport-Proteinen von
Escherichia coli (AmtB) oder Archaeoglobus fulgidus (Amt1) auf. Zusätzlich wurden
funktionelle Studien durchgeführt, welche die Kinase-Aktivität in Abhängigkeit der
Ammonium-Konzentration beschreiben. Mit diesen Ergebnissen kann ein möglicher
Reaktionsmechanismus für dieses spezielle Amt-Protein vorgeschlagen werden.

Summary
Camila Hernández
8
2 Summary
Nitrogen assimilation is an essential biological process. The ubiquitous Amt proteins
are involved in the uptake of reduced nitrogen in the form of ammonium. The Amt
proteins are able to transport ammonium across cellular membranes thus making
this reduced form of nitrogen directly accessible to organisms for assimilation.
Although, high resolution crystal structures are available the nature of the substrate
being transported is still on debate and controversially discussed. The anammox
bacteria “Candidatus Kuenenia stuttgartiensis” which is able to oxidize ammonium
under anoxic conditions to produce dinitrogen gas posseses five copies of amt genes
in the genome. One of these genes encodes for an exceptional and undescribed Amt
protein (Ks-Amt5). This protein presents besides the characteristic features of
ammonium transport proteins an extramembrane domain identified as a histidine
kinase protein. Histidine kinases are one of the basic components of two-component
signal transduction system. These proteins can recognize external signals which
lead to an alteration of its autokinase and autophosphatase activity. In this work,
Ks-Amt5 is structurally and functionally studied. By means of X-ray crystallography
the Ks-Amt5 structure was determined at 2.1 Å resolution. Ks-Amt5 presents
conserved topological and structural characteristics to its counterparts in
Escherichia coli (AmtB) and Archaeoglobus fulgidus (Amt1). In addition, functional
studies revealed that the kinase activity is linked to the variations in ammonium
concentrations. With this finding a possible mechanism for this remarkable protein
is proposed.

Introduction
Camila Hernández
9
3 Introduction
3.1 Nitrogen cycle and biological relevance
Nitrogen is an essential element in nature. It is the most frequent element in Earth’s
atmosphere, constituting 79% of air in the form of dinitrogen (N2) (Jetten et al.,
2009). Nitrogen is also important for living organisms, being found as a bound
component of nucleic acids, amino acids and other biomolecules, such as amino-
saccharides (Falkowski et al., 1998). Although nitrogen is highly abundant, its
bioavailability is very low due to the fact that most organisms, including plants and
animals, cannot metabolize atmospheric dinitrogen. Its characteristic triple bond
makes the inert gas dinitrogen the most stable form of nitrogen; therefore, its
conversion to further reduced states requires high amounts of energy (bond
dissociation energy 946 kJ mol-1) (Rees et al., 2005).
However, some microorganisms such as the diazotrophic organisms, are capable of
reducing dinitrogen (N2) into more accessible forms, such as ammonia (NH3) and
ammonium (NH4+) (Figure 1). This process known as biological nitrogen fixation is
of great importance to the environment and it is catalyzed by a broad class of
enzymes called nitrogenases (Rees & Howard, 2000; Dixon & Kahn, 2004; Rees et al.,
2005). Fixed and reduced nitrogen in the form of NH3/NH4+ can then be directly
assimilated for biosynthesis of biomolecules and incorporated as biomass.
The nitrification process describes the oxidation of NH3/NH4+ to nitrite (NO2
-) by
ammonia-oxidizing bacteria (AOB), such as Nitrosomonas, or further to nitrate
(NO3-) by nitrite-oxidizing bacteria (NOB), such as Nitrobacter. Nitrification is
carried out under strict aerobic conditions (Schmidt et al., 2001) or anaerobically by
selected species given an external supply of NO2- (N2O4) (Arp et al., 2007). This
process is catalyzed by three enzymes, the ammonia oxygenase, the hydroxylamine
oxidoreductase and the nitrite oxidase (Klotz & Stein, 2008).

Introduction
Camila Hernández
10
Figure 1: Basic steps of the Nitrogen Cycle. Nitrogen fixation: dinitrogen is
reduced to bio-accessible forms (ammonia/ammonium) by microorganisms called
diazotrophs. Nitrification: ammonia and ammonium are oxidized to nitrite by
ammonium-oxidizing bacteria (AOB) and to nitrate by nitrite-oxidizing bacteria
(NOB). The products of both processes, nitrogen fixation and nitrification, can be
then assimilated by other microorganisms and plants. The denitrification and
anammox processes close the cycle, converting the reduced and oxidized forms of
nitrogen back to gaseous dinitrogen.
The nitrogen cycle (Figure 1) is completed by the anaerobic process of
denitrification. During denitrification, nitrate and nitrite are reduced back to
gaseous dinitrogen. The process comprises four steps: (1) Nitrate is reduced to

Introduction
Camila Hernández
11
nitrite by the enzyme nitrate reductase, (2) nitrite is reduced further to nitric oxide
(NO) by the nitrite reductase, (3) nitric oxide is reduced to nitrous oxide (N2O) by
the nitric oxide reductase, and (4) the enzyme nitrous oxide reductase carries out
the last step of reduction of N2O to dinitrogen (Zumft et al., 1997; Einsle & Kroneck,
2004).
Recently, a fourth process was found to contribute to the production of N2 (Jetten et
al., 2005a). This process called anaerobic ammonia oxidation (anammox) is an
alternative route in the nitrogen cycle and it is found among one group of bacteria
known as Planctomycetes.
3.2 Anaerobic ammonium oxidation (anammox)
The anammox reaction is a microbiological process in which ammonium is oxidized
to dinitrogen gas coupled with the reduction of nitrite under strict anaerobic
conditions (Arp et al., 2007; Jetten et al., 2005b; Klotz & Stein, 2008). Important
intermediates of this reaction are hydrazine (N2H4), a toxic and high-energetic
compound, and hydroxylamine (NH2OH), a compound also used as solid propellant
(Jetten et al., 2002).
NH4++1.32 NO2
-+0.066 HCO3+0.13 H+ 0.26 NO3-+1.02 N2+0.066 CH2O0.5N0.15 +2.03 H2O
Scheme 1: Overall reaction of the anammox process and its stoicheometry (Strous et al., 1998).
While ammonium, nitrite and nitrate are primarily nitrogen sources to sustain
metabolic reactions, in higher concentrations they also contribute to the
eutrophication of water environments (Ye & Thomas, 2001). The anammox process
is considered as an important mechanism that removes undesired ammonium from
municipal and industrial waste water (Jetten et al., 2005b; Kuenen, 2008). Recently,
it has been estimated that 50% of the fixed nitrogen removal from the ocean is due
to the anammox (Strous et al., 2006).

Introduction
Camila Hernández
12
In 2008, van Niftrik et al., proposed a biochemical model (Figure 2) for the
anammox reaction. In this model, nitrite is reduced to nitric oxide by a cytochrome
c- and cytochrome d1-containing nitrite reductase (NirS). Further, nitric oxide and
ammonium are presumed to be combined into hydrazine by the hydrazine
hydrolase (HH). Finally, the hydrazine is oxidized to N2 by the
hydrazine/hydroxylamine oxidoreductase (HAO/HZO), an octaheme cytochrome c
enzyme. This oxidation step produces the release of four electrons, which are
transferred first to soluble cytochrome c electron carries and later to ubiquinone,
cytochrome bc1 complex (complex III) and other soluble cytochrome c electron
carries and finally back to nitrite reductase and hydrazine hydrolase. Consequently,
this process generates a proton motive force that could be used for the production
of energy by means of ATP synthesis.
Figure 2: Schematic representation of the ultrastructure of an anammox bacteria and
proposed biological model of the anaerobic ammonium oxidation process. A. Morphology of
anammox bacteria showing the different subcellular compartments and membranes. B. Postulated
coupling of the anammox reaction to the anammoxosome membrane. Nir: nitrite reductase
(cytochrome cd1); hh: hydrazine hydrolase; hao: hydrazine/hydroxylamine oxidoreductase
(octaheme cytochrome c); cyt: mono- or diheme cytochrome c electron carries; bc1: cytochrome bc1
complex (complex III); Q: coenzyme Q (ubiquinone). Result of this reaction is the production of
dinitrogen with an increasing proton motive force and the consequent synthesis of ATP by ATPases.
Reprinted from van Niftrik et al., 2008.

Introduction
Camila Hernández
13
The anammox reaction takes place in the anammoxosome (Figure 2A), an
intracytoplasmatic compartment that comprises 50-70% of the total cell volume.
The anammoxosome is surrounded by a dense membrane that contains unique rigid
lipids. These structurally unusual lipids are called ladderanes (Figure 3) and are
formed by the fusion of cyclobutane and cyclohexane rings (van Niftrik et al., 2004).
It is supposed that the ladderane lipids contribute to the limited diffusion of the
anammoxosome membrane thus preserving the concentration gradients during
replication and protecting the rest of the cell against toxic anammox intermediates
(Sinninghe-Damsté, 2002). Further, it has been found that the biosynthesis of these
ladderanes is exclusive to anammox bacteria. Therefore, they are currently used as
biomarkers for the presence of these organisms in environmental samples (Kuypers
et al., 2003).
Figure 3: Structure and composition of the ladderane lipids from anammox bacteria. Reprinted
from Jetten et al., 2009.

Introduction
Camila Hernández
14
3.2.1 Anammox bacteria
Anammox bacteria are chemolitoautothrophic organisms that use bicarbonate as a
sole carbon source for the biosynthesis of cell biomass and derive their energy from
the conversion of ammonium and nitrite into dinitrogen (van Niftrik et al., 2004). As
members of the Planctomycetales order from the bacterial domain they are
considered an ecologically and environmentally important group of microorganisms
(Jetten et al., 2009).
Anammox bacteria were first discovered in the 1990’s in the Gist-Brocades
fermentation plant, Netherlands (Kuenen & Jetten, 2001). From that time on,
anammox bacteria have been found in many different environments, such as coastal
sediments, lakes, marine suboxic zones and wastewater treatment plants (Schmid et
al., 2007). All anammox organisms belong to the monophyletic group called
Brocadiales. So far, only five genera of anammox bacteria with the status
“Candidatus” have been described: “Ca. Brocadia” (Strous et al. 1999; Kuenen &
Jetten, 2001; Kartal et al., 2008), “Ca. Kuenenia” (Schmid et al., 2000; Strous et al.,
2006), “Ca. Anammoxoglobus” (Kartal et al., 2007), “Ca. Jettenia” (Quan et al., 2008)
and “Ca. Scalidua” (Kuypers et al., 2003; Schmid et al., 2003; van de Vossenberg et
al., 2008).
Anammox bacteria are coccoid shaped bacteria (Figure 4) with a diameter of 800
nm and are characteristically slow growers with a variable doubling time from 10-
20 days (Jetten et al., 2009). Additionally, it is known that concentrations above 2
µM oxygen can inhibit their metabolism, as a consequence they are also classified as
obligate anaerobes (van Niftrik et al., 2004).

Introduction
Camila Hernández
15
Figure 4: Electron microscopy representation of a “Candidatus Kuenenia
stuttgartiensis” cell. The white dots show the distinct subcellular
compartments, including the anammoxosome, where the anammox
reaction takes place. The scale bar represents 200 nm. Reprinted from
Kuenen, 2008.
“Ca. Kuenenia stuttgartiensis” is the model organism for this study. In 2006, Strous
et al., published a nearly complete genome of “Ca. Kuenenia stuttgartiensis”. This
constituted the first sequenced genome of an anammox bacterium. The 4.2
megabase genome was used to decipher the biochemical pathway of anaerobic
ammonium oxidation. In this genome, 200 genes were detected to be relevant for
respiration and anammox catabolism (Strous et al., 2006). Additionally, five amt
genes were found to codify for ammonium transport proteins.

Introduction
Camila Hernández
16
3.3 Ammonium transport proteins (Amt)
Ammonium (NH4+/NH3) is a product of nitrogen fixation and a direct nitrogen
source for many organisms, such as bacteria, fungi and plants. It is used as a
substrate in metabolic reactions that involve the enzymes glutamine synthetase
(GS), glutamate synthase (GOGAT) and glutamate dehydrogenase (GDH), resulting
in the biosynthesis of the amino acid glutamine. From glutamine, other amino acids
can be synthesized upon transamination reactions (Purich, 1998). However, in high
concentrations, ammonia can be cytotoxic to animals.
Due to this crucial metabolic role, the transport of NH4+/NH3 is an essential
biological process in microorganisms and plants (Broach et al., 1976; van Dommelen
et al., 2001). In mammals, NH4+/NH3 transport is also essential to kidney physiology
for the maintenance of pH and in renal ammonia secretion (Knepper, 1991).
Ammonia is a hydrophobic gas that can diffuse freely across biological membranes
(Lande et al., 1995). However, in aqueous solution, NH3 is in equilibrium with the
protonated form NH4+ controlled by a pKa=9.25. Thus, at physiological pH of about
7.5, ammonia exists mainly as the membrane impermeable cation NH4+. A dedicated
transport protein is then necessary for the accessibility of NH4+ to convey metabolic
needs.
Proteins involved in the transport of ammonia/ammonium across cellular
membranes belong to the Amt/Rh family. This family of integral membrane proteins
is composed by the Ammonium transport proteins (Amt), found in bacteria, archaea
and plants, and their homologues Rhesus proteins (Rh) found in animals.
Amt proteins consist of 400-600 amino acids in length with a conserved core of 10-
12 transmembrane helices (Marini et al., 1994; Ninnemann et al., 1994; Thomas et
al., 2000a) and are mainly expressed at low substrate (ammonia/ammonium)
concentrations (Kleiner, 1985a). Several functions have been associated to these
proteins, being the high-affinity transport of NH4+ across the membrane the most
relevant. Additionally, it has been found that Amt proteins are required for optimal

Introduction
Camila Hernández
17
growth of some microorganisms at low pH (Marini et al., 1997; Soupene et al.,
1998). Recently, apart from transport function, Amt proteins have been found to act
as ammonium sensors in the regulation of nitrogen metabolism (Javelle et al., 2004;
Javelle & Merrick, 2005).
3.3.1 Amt protein structures
Despite intense research efforts on Amt proteins, so far only four crystal structures
have been solved. In 2004, Khademi et al., and in parallel Zeng et al., published the
first crystal structure of an Amt protein. The 1.4 Å resolution structure of AmtB from
E. coli confirmed the predicted trimeric stoichometry of these proteins (Blakey,
2002), and gave initial insights on how transport could work. Further, in 2005,
Andrade et al. published the Af-Amt1 structure, one of three Amt proteins from the
hyperthermophilic archaeon Archaeoglobus fulgidus, at a resolution of 1.54 Å. More
recently, two crystal structures of Rh proteins were solved at high resolution, the
Ne-Rh50 protein from Nitrosomonas europaea (Li et al., 2007, Lupo et al., 2007) at
1.3 Å resolution and the human RhCG (Gruswitz et al., 2010) at 2.1 Å resolution. All
these structures share a high degree of sequence and structural homology with
various conserved amino acids supposed to be involved in the ammonium transport.
Amt proteins are highly stable homotrimers containing 11-12 hydrophobic
transmembrane -helices per monomer. The sequence of Ec-AmtB presents a
twelfth N-terminal transmembrane helix as part of a leader peptide (residues M1-
A22) that is removed upon maturation and insertion of the protein into the cell
membrane (Khademi et al., 2004). However, the structure of human RhCG protein
presented an additional N-terminal transmembrane helix located at the interface of
each subunit. This additional N-terminal helix is conserved among higher
eukaryotes (Gruswitz et al., 2010).
Both crystal structures, Ec-AmtB (Figures 5A and 5C) and Af-Amt1 (Figures 5B and
5D), show a pseudo-twofold symmetry with a pseudo-twofold axis in the plane of
the membrane, formed by helices TM1-TM5 (counted from the N-terminus) and

Introduction
Camila Hernández
18
TM6-TM10, which is conserved among all Amt proteins (Khademi et al., 2004; Zeng
et al., 2004; Andrade et al., 2005). Additionally, they present an N-out/C-in topology
that follows the positive-inside rule for membrane proteins (von Heijne & Gavel,
1988), where the N-terminus is exposed to the periplasm and the C-terminus is
exposed to the cytoplasm. The final C-terminal helix, TM11, is tilted with respect to
the membrane plane and surrounds the monomer in the outer surface, holding
together the two pseudo-symmetric halves formed by helices TM1-TM5 and TM6-
TM10.
Figure 5: Structure of the Amt monomer from E. coli and A. fulgidus. A. Ec-AmtB monomer
(PDB accession code: 1U7G) and B. Af-Amt1 (PDB accession code: 2B2H) showing eleven
transmembrane -helices (TM1-TM11) in cartoon representation. The protein chain is colored
from blue at the N-terminus to red at the C-terminus. The cellular membrane is represented by
grey lines. C and D show the pseudo two-fold symmetry of the monomers of AmtB and Amt1,

Introduction
Camila Hernández
19
respectively.
The threefold symmetry of the homotrimeric protein (Figure 6) is given by the
interaction of residues from helices TM1, TM6, TM7, TM8 and TM9 of one monomer,
with residues of neighboring monomers from helices TM1, TM2 and TM3. Further,
the interfaces between monomers are highly hydrophobic. This fact led Khademi et
al. (2004) to suggest that the monomer is stable in the membrane during synthesis
before trimer formation.
Figure 6: Structure of the Af-Amt1 trimer. A. Side view of the molecular surface of the Amt1
trimer, the monomers are colored in silver, light and dark blue. B. View of the Amt1 trimer from the
extracellular side, the transmembrane helices that are involved in the trimer formation are labeled in
one of the monomer-monomer interaction surfaces. PDB accession code: 2B2H.
Every monomer presents two vestibules formed by helices TM1-TM10 on its
extracellular and intracellular side (Figure 7A). The putative substrate recruitment
site in each monomer, resides on the extracellular vestibule of the trimer. The Ec-
AmtB extracellular vestibule shows several carbonyl oxygens that form a funnel for
substrates (Khademi et al., 2004). In the inner part of this vestibule, two highly
conserved residues, W137 and S208 (numbered according to the Af-Amt1
sequence), are believed to be involved in the binding of NH4+. It is thought that NH4
+
could be selectively recruited at this position by the formation of a cation-π

Introduction
Camila Hernández
20
interaction with W137 in addition to a hydrogen bond to S208 (Andrade et al.,
2005). Below this NH4+ binding site, the side chains of two conserved residues, F96
and F204, constrict the channel to the cytoplasmatic side, indicating a possible
structural rearrangement upon substrate translocation (Figure 7B). Additionally,
the hydrophobic nature of the protein lumen leading to the cytoplasm could be
verified through pressurization experiments with the inert gas xenon (Andrade et
al., 2005). The one exception in this hydrophobic lumen is the presence of two
conserved histidine residues, H157 and H305, the imidazole rings of which are
arranged in an unusual manner forming a lateral hydrogen bond between their -
nitrogen atoms. In 2006, Javelle et al., reported the importance of this His pair in
substrate conductance.
Figure 7: Inside view of an Af-Amt1 monomer. A. The surface of the monomer is represented in
blue, where two vestibules are visible (shown by arrows), one extracellular and one intracellular
towards the cytoplasm. The cell membrene is represented by grey lines. B. Detail of A. The putative
recruitment site is at Trp137 and Ser208. Substrate passage is blocked by the “phenylalanine gate”
at Phe96 and Phe204. Following is the hydrophobic channel surrounded by hydrophobic residues

Introduction
Camila Hernández
21
except for the conserved coplanar His157 and His305. PDB accession code: 2B2H.
Regardless of the high structural similarities between Ec-AmtB and Af-Amt1,
especially in the transmembrane regions, significant differences were found in the
intracellular and extracellular loop regions. Contrary to Ec-AmtB, in the Af-Amt1
structure the entire protein and, for the first time, the C-terminal region was visible
and ordered in the crystal structure (Andrade et al., 2005). This C-terminal region
was later shown in Amt1;1 from Arabidopsis thaliana to be functionally important,
having an allosteric regulatory function for the transport activity (Loqué et al., 2007;
Loqué et al., 2009). The allosteric regulation is presumed to be controlled by the
phosphorylation of a conserved tyrosine residue located at the C-terminal region
( u hse, 2004; Loque et al., 2007). The phosphorylation event triggers a switch in
the ammonium transport protein, from an active state to an inactive state. This
change between active to inactive states, keeps the cell from incorporating too much
ammonium that in too high concentrations becomes toxic to the cell (Hess et al.,
2006; Szczerba, 2008).
3.3.2 Ammonia/ammonium transport mechanism
The knowledge gained from the high-resolution crystal structures of some Amt
family members represented a potential significant progress in the study of this
family of proteins. However, the understanding of the transport mechanism as well
as the identity of the substrate being transported (NH3 versus NH4+) remain
controversial and until now are not completely understood. So far, several models
for the transport mechanism by Amt proteins have been described. However, until
now, none of them have entirely explained the results obtained by the different
experiments.
In 1985, Kleiner, proposed a secondary active transport with co-transport of NH3/
H+. This system would be electrogenic, driven by an electrochemical gradient and
dependent on the proton-motive force and on the membrane potential. This
assumption was supported by uptake measurements of the 14C-labelled substrate

Introduction
Camila Hernández
22
analogue, methylamine (MA) in Amt proteins from yeast (Marini et al., 1994; Marini
et al., 1997) and Arabidopsis thaliana (Ninnemann et al., 1994; Gazzarrini et al.,
1999) where accumulation of intracellular MA was observed. Further, electrogenic
transport was proved in an oocyte system by voltage-clamp experiments with the
protein LeAMT1;1 from Lycopersicon esculentum (Ludewig et al., 2002) and the
RhBG glycoprotein (Nakhoul et al., 2005). These experiments demonstrated active
uptake of NH4+, showing a voltage-dependent current induced by the increase in
ammonium uptake upon increase of the external concentration of ammonium.
However, through these experiments it was not possible to discriminate the nature
of the transport between symport (NH3/H+) and uniport (NH4+). Therefore, this
model is still discussed and remains so far unproven.
Another model was proposed by the group of Sidney Kustu, which suggests that Amt
proteins work as gas channels facilitating the diffusion of the uncharged specie NH3.
This model was assumed after the results of in vivo studies made with whole cells of
E. coli (Soupene et al., 1998) and Salmonella typhimurium (Soupene et al., 2002),
where no accumulation of MA in the cytoplasm was observed, thus suggesting
diffusion of NH3 across the membrane. Moreover, first functional studies made with
Ec-AmtB proteins reconstituted into proteoliposomes (Khademi et al., 2004) in
combination with the independent observation of the hydrophobic nature of the
channel revealed by the crystal structures of Ec-AmtB and Af-Amt1 (Khademi et al.,
2004; Zeng et al., 2004; Andrade et al., 2005) supported the view of these proteins
as gas channels.
In these functional studies, Khademi et al. (2004), used a fluorescent pH-sensitive
dye, 5-carboxyfluorescein (CF) inside the proteoliposomes; it was then observed
that the internal pH of the proteoliposomes increased upon uptake of the substrate,
leading to the conclusion that NH3 is transported and becomes protonated to NH4+
(pKa=9.25) inside the proteoliposome causing the observed increase in pH. Based
on these findings and the fact that the select/recruitment site shows to bind NH4+
and not NH3, it was hypothesized that NH4+ would have to be deprotonated on the

Introduction
Camila Hernández
23
extracellular side and then reprotonated again in the cytoplasm, being translocated
as NH3 (Figure 8A) (Khademi & Stroud, 2006). However, this result represents a net
antiport of NH4+ versus H+ against a proton gradient, which encounters an energetic
problem (Andrade & Einsle, 2007). Due to the reverse H+ flow, the proton motive
force decreases and therefore energy would be required in the form of ATP to
perform such a type of transport. Consequent experimental data questioned the
model of Amt proteins as gas channels. In 2007, Fong et al., from the group of Kustu,
inferred uptake of NH4+ in a variant of Ec-AmtBW148L using a washed cell transport
assay with 14C-labelled MA. By means of these experiments the gas channel model
was questioned.
Figure 8: Critical view on the gas transport mechanism for Amt proteins.
A. At physiological pH values ammonium is mainly present as NH4+. The
uniport transport of NH3 requires the deprotonation of NH4+ in the periplasm
(extracellular) and reprotonation in the cytoplasm (intracellular). Thus, this
mechanism results in a net antiport of NH4+ versus H
+ that has no
physiological relevance. B. An alternative model showing a net uniport of
NH4+ occurring necessarily as a symport of NH3 and H
+. Adapted from
Andrade & Einsle, 2007.

Introduction
Camila Hernández
24
As stated, all transport mechanisms mentioned contradict themselves based on the
different experimental data. In addition, some of these functional studies,
particularly those presented by Khademi et al. (2004), were not reproducible
(Javelle et al., 2007), leading to a continuous debate about the ammonia vs.
ammonium transport.
A variation model was proposed to explain both observed hypotheses of
electrogenic transport and passive diffusion of NH3. This globalizing mechanism
includes the widely accepted view of deprotonation of NH4+ before entering the
hydrophobic pore and reprotonation in the cytoplasm after translocation of the
substrate. The model suggests that the substrate translocation occurs as a symport
of NH3 and H+, where the passage of H+ is coupled to the passage of NH3, leading to a
net uniport of NH4+ (Figure 8B) (Andrade et al., 2005; Andrade & Einsle, 2007). So
far, in order to give more experimental evidence to support this mechanistic model,
research has focused on residues involved in the permeation pathway, including the
external binding site or recruitment site of NH4+, the “Phenylalanine gate”, the
hydrophobic pore and the cytoplasmatic vestibule and possible deprotonation
site(s) (Marini et al., 2006; Javelle et al., 2008; Tremblay & Hallenbeck, 2008;
Lamoureux et al., 2010).
Despite the experimental data obtained so far, the molecular dynamic simulations
and theoretical calculations addressing the question of the transported substrate
and the function of the different conserved amino acids supposed to be involved in
the deprotonation event, it is still controversial how the NH4+ penetrates the
hydrophobic pore and how the conduction of H+ takes place if deprotonation occurs.
Molecular dynamic simulations made in Ec-AmtB proposed that other residues such
as A162 are involved in the coordination of NH4+ during the transition through the
phenylalanine gate (Nygaard et al., 2006; Bostick & Brooks, 2007). Additionally,
these theoretical calculations suggest that the phenylalanine gate is possibly more
permeable to NH4+ than NH3, thus preventing diffusion of NH3 back to the

Introduction
Camila Hernández
25
extracellular side (Lamoureux et al., 2010).
As mentioned, it is so far accepted that Amt proteins bind NH4+ at the extracellular
side of the pore in the recruitment site. However, human Rh proteins lack some of
the key residues involved in the binding of ammonium, suggesting that these
proteins act as NH3 channels (Ripoche et al., 2004; Gruswitz et al., 2010; Mouro-
Chanteloup et al., 2010). In addition, it has been reported by recent structural and
functional studies that the RhCG protein in fact conducts NH3 (Gruswitz et al., 2010).
Recently, Lamoreoux et al. (2010), proposed that co-transport of NH3 and H+ by Amt
proteins is a possible mechanism that might be used by other members of the
ammonium transport family that are known to show electrogenic transport, such as
the Amt1;1 and Amt1;2 from L. esculentum (Ludewig et al., 2002 and 2003) and the
Amt1;1 from A. thaliana (Mayer & Ludewig, 2006; Ludewig, 2006). In this
mechanism based on quantum calculations, they suggest that NH4+ deprotonates
after crossing the phenylalanine gate. At this position, called S2, located at the
entrance of the hydrophobic pore, NH4+ could be bound to residues F215, H168,
W212 (numbered according to Ec-AmtB sequence), and also to either water or
ammonia. In this site, two cation-π interactions are created with residues F215 and
W212, and two strong charge-dipole interactions with H168 and water are formed.
Under this environment, NH4+ could transfer a proton to H168, followed by the
diffusion of NH3 down the pore and the reprotonation of NH3 via H318.
Alternatively, if the excess of protons has already been transferred, reprotonation
takes place in the cytoplasm. The protonation state of the histidine residues can
then be reset via “proton loop” or by side-chain rotation (Lamoureux et al., 2010).
In addition, a second possibility could be conceived, where the H168/H318
interaction provides stabilization of water molecules present in the pore that acts as
a “proton wire” that would allow diffusion of a H+ from NH4+ to the intracellular side
of the pore, followed by the diffusion of NH3 through the hydrophobic pore
(Lamoureux et al., 2010). This proposal clearly supports the involvement of the
highly conserved “twin-his” motif in the transport. So far, however there is no

Introduction
Camila Hernández
26
conclusive experimental evidence for this.
3.3.3 Regulation of Amt proteins
Ammonium uptake and assimilation can be regulated on different levels in the cell.
Upon nitrogen starvation amt genes are highly expressed (von Wirén et al., 2000).
However, in the presence of ammonium, transcription of these genes can be
repressed by nitrogen-regulatory proteins (Arcondéguy et al., 2001). Once Amt
proteins are expressed, regulation of uptake can be achieved through the action of
PII proteins, which control the activity of the transporters and other enzymes
involved (Forchhammer, 2008; Tremblay & Hallenbeck, 2008).
In some prokaryotes, Amt proteins are organized in an operon, which contains a
second gene that encodes for a nitrogen-regulatory protein of the PII family, called
GlnK (product of the glnK gene) (Thomas et al., 2000b). PII proteins are signal
transduction proteins present in archaea, bacteria and plants that can sense
intracellular variations of carbon and nitrogen, and regulate nitrogen assimilation
through protein-protein interactions (Ninfa & Atkinson, 2000; Tremblay &
Hallenbeck, 2008). They are homotrimeric cytoplasmatic proteins, with highly
conserved structures. The trimer presents three protruding loops, called T-loops
(one per monomer), which can exhibit different conformations that are functionally
relevant for signal transduction and importantly involved in protein-protein
interactions (Xu et al., 1998; Sakai et al., 2005; Yildiz et al., 2007).
PII proteins can function in two different modes according to the signal recognition.
A conserved general and basic mode involves the binding of different effector
molecules like ATP, ADP and 2-oxoglutarate (2-OG) (Arcondéguy et al., 2001;
Forchhammer, 2004; Ninfa & Jiang, 2005). PII proteins possess three nucleotide
binding sites located between each subunit (Xu et al., 1998), such that, in the
presence of ATP only, the PII trimer can also bind up to three 2-OG molecules (Ninfa
& Jiang, 2005). In addition, the ATP-binding sites can be competitively occupied by
ADP. However, the presence of 2-OG increases the affinity of these binding sites

Introduction
Camila Hernández
27
towards ATP (Jiang & Ninfa, 2007). The binding of the different effectors influences
the conformation of the T-loop and also the interactions between the PII protein and
the receptor (Yildiz et al., 2007).
A second signal recognition mode not widely conserved involves the covalent
modification of the T-loop. So far, it is known that in proteobacteria, the covalent
modification of the T-loop is used to sense the glutamine levels through an enzyme
called GlnD, which uridylylates a tyrosine residue at the tip of the T-loop (Y51,
numbered as in Ec-GlnK) (Reitzer, 2003; Ninfa & Jiang, 2005). Overall, the covalent
modification at the T-loop and the (cooperative) binding of effector molecules leads
to different conformation states of the PII protein and thus distinct signal
recognition states. Upon these different conformational states, the PII protein can
bind or interact with a variety of PII signal receptors, such as transcription factors,
regulatory enzymes, metabolic enzymes, transport proteins or other proteins
involved in nitrogen metabolism. Complex formation (PII protein- PII signal
receptor) promotes activation or inhibition of activity of the receptor or target
protein (Forchhammer, 2008).
Recently, it has been demonstrated that the uptake of ammonium by Amt proteins is
regulated by GlnK proteins through complex formation (Conroy et al., 2007;
Gruswitz et al., 2007). The interaction between Amt and GlnK is ultimately
determined by the nitrogen requirements of the cell, indicated by the intracellular
pools of glutamine, ATP, ADP and 2-OG (Arcondéguy et al., 2001). The AmtB-GlnK
complex is formed only when nitrogen-deprived cells come across with an increased
nitrogen supply. GlnK proteins are synthesized under nitrogen deprivation; hence,
they accumulate in an uridylylated modified form (Ninfa & Atkinson, 2000). When
the nitrogen supply increases, the uridylylated GlnK protein becomes de-
uridylylated due to a subsequent increment of glutamine levels. Associated with
these events, the levels of 2-OG decrease due to intensifying nitrogen assimilation.
Just when all these conditions converge, GlnK binds to the integral membrane
protein AmtB effectively preventing ammonium transport (Javelle et al., 2004).
The crystal structure of the Ec-AmtB-GlnK complex (Figure 9A) reveals the mode of

Introduction
Camila Hernández
28
interaction between both proteins. Through an extended surface loop (T-loop)
(Figure 9B) that contains a tyrosine residue at the tip (Y51 in Ec-GlnK) GlnK blocks
the cytoplasmic pore exit preventing ammonium translocation. Inhibition by GlnK in
E. coli is then controlled by uridylylation of the Y51 residue preventing complex
formation (Conroy et al., 2007; Gruswitz et al., 2007).
Figure 9: Crystal structure of the Ec-AmtB-GlnK complex. A. Side view of the Ec-AmtB-GlnK
complex, the surface of the AmtB trimer is shown and each monomer is colored in different tones
of blue. The GlnK trimer is located at the C-terminal side and each monomer is shown as a cartoon
representation. B. Close up view of the Ec-GlnK trimer. The protruding T-Loop is indicated for one
monomer. C. Top view of the surface of GlnK that interacts with the AmtB and the threefold axis of
the GlnK trimer. PDB accession code: 2NS1.

Introduction
Camila Hernández
29
3.3.4 Multiplicity of Amt proteins
Often, several copies of amt genes can be found in the genome of one organism. This
is the case with the hyperthermophilic archaeon A. fulgidus where three homologues
of Amt proteins are present. Other organisms like S. cerevisiae (Ludewig et al.,
2001), Methanococcus acetivorans (Galagan J. E., 2002) or the tomato plant,
Lycopersicum sculentum (Ludewig et al., 2002), also have three amt genes within
their genome. In addition, the presence of six copies of amt genes in Arabidopsis
thaliana (Gazzarrini et al., 1999; von Wiren et al., 2000) and even twelve in rice,
Oryza sativa (Bao-zhen et al., 2009) have been reported.
Among the different At-Amt proteins, different substrate affinity rates were
estimated using 14C-labelled methylammonium, indicating different affinities,
transport rates and regulation of the transcription levels of these proteins in
response to the availability of nitrogen supply, photosynthetic products and diurnal
change (Gazzarrini et al., 1999). Consequently, the presence of multiple copies of
these genes may suggest distinct affinities and modes of regulation for Amt proteins.
“Ca. Kuenenia stuttgartiensis” also holds several copies of amt genes. Precisely, five
copies of amt genes (amt1-5) were identified in the genome, located in separate loci.
All five genes present homologies to the amtB and in some cases, for amt1 and amt2,
these genes are followed directly by a gene for a PII nitrogen regulatory protein. The
amt1, amt2 and amt3 genes are present in the same loci. The amt3 however, is
followed by an uncharacterized gene sequence. The amt4 and amt5 genes are
located in two separate loci and present different characteristics than the other amt
genes identified in “Ca. K. stuttgartiensis”. The amt4 encodes for an Amt protein
with the presence of an N-terminal -D-xylosidase domain. The amt5 is transcribed
in the opposite direction to amt1-4. It possesses 2037 base pairs (locus tag:
kuste3690) and encodes for an Amt protein fused with a histidine kinase protein.
This study will be focused on the Ks-Amt5 protein encoded by the amt5 gene which

Introduction
Camila Hernández
30
will be described in the following section.
3.3.5 The Amt protein Ks-Amt5 from “Ca. Kuenenia stuttgartiensis”
The Ks-Amt5 is composed of 679 amino acids with a calculated molecular weight of
74.45 kDa (ProtParam; Gasteiger et al., 2005). A remarkable characteristic of Ks-
Amt5 is the presence of two domains, an N-terminal integral membrane domain and
a C-terminal domain. Based on protein sequence analysis, the protein presents
homologies to Amt proteins for the N-terminal domain (M1-A408) and to a histidine
kinase protein (F413-K679) for the C-terminal domain (Figure 10).
Figure 10: Schematic domain organization of Ks-Amt5.
As typical for the Amt protein family, topology predictions show the presence of
eleven transmembrane helices for the N-terminal domain (Figure 11). The C-
terminal domain referred to as Ks-Kin from here on, contains 266 amino acids with
a calculated molecular weight of 30 kDa (ProtParam; Gasteiger et al., 2005),
constituting approximately one-third of the full-length protein. This domain is
predicted to be entirely cytoplasmatic and possesses a histidine phosphorylation
site and an ATP binding site.

Introduction
Camila Hernández
31
Figure 11: Secondary structure topology prediction for Ks-Amt5. The N-terminus shows
the integral membrane domain (Amt) containing eleven transmembrane helices (I-XI). The
C-terminal region shows the histidine kinase domain located at the intracellular side. The
topology was predicted with TMHMM (Sonnhammer et al., 1998; Krogh et al., 2001) and
schematically plotted with the macro package TEXtopo for Latex (Beizt, 2000).
Despite these interesting features of Ks-Amt5, the localization of the protein is so far
unknown as well as its function within the metabolism of “Ca. Kuenenia
stuttgartiensis”.
3.4 Histidine kinases
Protein phosphorylation is an important process in the regulation of cell function
and a relevant type of post-translational modification of proteins (Stock et al., 2000).
Studies on phosphorylation processes have been specially focused on serine,
threonine and tyrosine phosphorylation. However, histidine phosphorylation also
plays a crucial role in cellular control and regulation especially in prokaryotes
(Besant & Attwood, 2010).

Introduction
Camila Hernández
32
Histidine kinases are signal transduction proteins that control different complex
processes in many organisms. Commonly, histidine kinases are part of the “Two
component signal transduction system” (TCS). TCS are elegant modular systems,
which connect extra-cellular stimuli, such as oxygen or nitrogen levels, to regulatory
events important for adaptation to environmental changes (Klumpp & Krieglstein,
2002). These signal transduction systems are characteristic for prokaryotes
although some studies have mentioned their occurrence in eukaryotes, such as
Arabidopsis and S. cereviseae (Chang et al., 1993; Ota et al., 1993; Maeda et al., 1994).
The most frequent signal transduction mechanism involves two conserved proteins:
a sensor histidine kinase (HK) and an effector response regulator (RR) that are
phosphorylated at a conserved histidine and aspartate residues, respectively
(Casino & Marina, 2009).
The TCS pathway consists mainly of four steps (Figure 12). First, upon a detected
stimulus by a sensor domain of the HK protein an ATP-dependent reaction is carried
out, in which a histidine residue of the HK protein is autophosphorylated.
Subsequently, the phosphoryl group from the phosphohistidine is transferred to an
aspartate residue of a corresponding RR protein. The phosphorylation of the RR
activates an effector domain of the cognate protein that can then interact with
targets, such as genes or other proteins, generating a downstream cellular response.
Finally, the signaling pathway ceases with the dephosphorylation of the RR protein
by an innate or HK-induced autophosphatase activity (Stock et al., 2000; Klumpp &
Krieglstein, 2002).

Introduction
Camila Hernández
33
Figure 12: Two-component signal transduction pathway showing a schematic representation of the
domain organization in histidine kinases and their response regulator proteins. Adapted from Dutta
et al., 1999; Stock et al., 2000; West & Stock, 2001 and Klumpp & Krieglstein, 2002.
3.4.1 Characteristic sequence motifs and function
Histidine kinases exhibit a characteristic modular arquitecture; besides the sensor
region of the protein, the kinase core is constituted by two separate domains, a
Dimerization and Histidine phosphotransfer domain (DHp) and a Catalytic and ATP-
binding domain (CA) (Dutta et al., 1999; Stock et al., 2000; Marina et al., 2005).
Based on amino acid sequence similarity, all histidine kinases additionally present
five unique motifs (boxes), named by their characteristic residues H, N, G1, F and G2,
involved in the binding of ATP and kinase autophosphorylation (Parkinson &
Kofoid, 1992).
The DHp domain includes the H-box, which contains the conserved histidine residue
and thus the site of autophosphorylation. The N, G1, F and G2 boxes are commonly
adjacent to each other and positioned in the CA domain and demarcate the

Introduction
Camila Hernández
34
nucleotide-binding and cleavage site (Stock et al., 2000) (Figure 12). The N-box
contains an asparagine residue and can present a variable length from 5 to 45
residues. The G1 and G2 boxes are glycine-rich portions with DXGXGX and GXGXGX
sequence motifs respectively (Stock et al., 1989). The F-box contains a conserved
phenylalanine residue and it is located between the G1 and G2 boxes (Parkinson &
Kofoid, 1992). Structural and biochemical evidence revealed that HKs function as
dimers, where the mode of autophosphorylation occurs in trans orientation.
Consequently, ATP bound to the CA domain of one monomer transfers its -
phosphoryl group to the histidine residue located in the DHp domain of the other
monomer (Cai & Inouye, 2003; Casino et al., 2009).
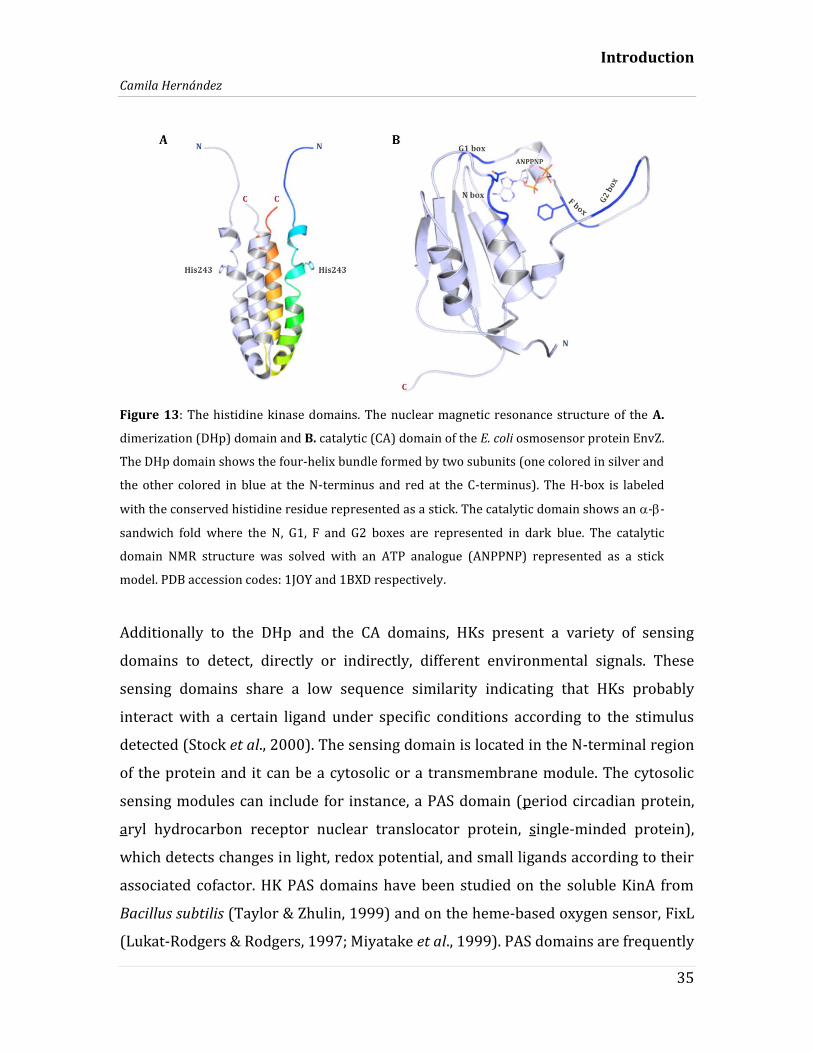
Structurally, the H-box is located in a long -hairpin that forms an antiparallel four-
helix bundle with the neighbor DHp domain (Figure 13A). The catalytic domain
presents an --sandwich fold that consists in three -helices and five anti-parallel
-strands (Figure 13B) (Stock et al., 2000). The N and F boxes are located toward
the -strand regions whereas G1 and G2 boxes are forming unstructured segments
or loops. The segment that connects the F and G2 boxes can adopt different
conformations due to its flexibility, thus it is called ATP lid (Bilwes et al., 2001;
Marina et al., 2001). These structural features of the catalytic domain are
homologous to ATPase domains of other proteins like the type II topoisomerase,
Gyrase B, the DNA mismatch repair protein MutL, and the human chaperone Hsp90
(Tanaka et al., 1998; Bilwes et al., 1999).
The different enzymatic activities of HKs (autokinase, phosphotransfer and
phosphatase) entail the contribution of one or both of the DHp and CA domains. This
fact implies the existence of different conformational states of both domains with
respect to one another upon reaction to a certain stimulus (Tanaka et al., 1991;
Hsing et al., 1998). Therefore, recent studies have focused on the structural
characterization of these different states in order to elucidate mechanisms of
reaction and subsequent signaling pathways.
Introduction
Camila Hernández
35
Figure 13: The histidine kinase domains. The nuclear magnetic resonance structure of the A.
dimerization (DHp) domain and B. catalytic (CA) domain of the E. coli osmosensor protein EnvZ.
The DHp domain shows the four-helix bundle formed by two subunits (one colored in silver and
the other colored in blue at the N-terminus and red at the C-terminus). The H-box is labeled
with the conserved histidine residue represented as a stick. The catalytic domain shows an --
sandwich fold where the N, G1, F and G2 boxes are represented in dark blue. The catalytic
domain NMR structure was solved with an ATP analogue (ANPPNP) represented as a stick
model. PDB accession codes: 1JOY and 1BXD respectively.
Additionally to the DHp and the CA domains, HKs present a variety of sensing
domains to detect, directly or indirectly, different environmental signals. These
sensing domains share a low sequence similarity indicating that HKs probably
interact with a certain ligand under specific conditions according to the stimulus
detected (Stock et al., 2000). The sensing domain is located in the N-terminal region
of the protein and it can be a cytosolic or a transmembrane module. The cytosolic
sensing modules can include for instance, a PAS domain (period circadian protein,
aryl hydrocarbon receptor nuclear translocator protein, single-minded protein),
which detects changes in light, redox potential, and small ligands according to their
associated cofactor. HK PAS domains have been studied on the soluble KinA from
Bacillus subtilis (Taylor & Zhulin, 1999) and on the heme-based oxygen sensor, FixL
(Lukat-Rodgers & Rodgers, 1997; Miyatake et al., 1999). PAS domains are frequently

Introduction
Camila Hernández
36
found in HKs and so far several structures of such domains have been solved. In CitA
the PAS domain consists of a five-stranded -sheet and five -helices forming a
central cavity where the ligand, citrate, can bind (Reinelt et al., 2003). Structural
comparison of this domain in the presence and absence of ligand revealed that
citrate binding produces a considerable contraction of the domain. This contraction
was proposed to act as the molecular switch that activates the transmembrane
signaling (Sevvana et al., 2008).
However, in the transmembrane HKs, the sensing domain is attached to the kinase
core through a transmembrane helix and a cytoplasmatic linker. This
transmembrane helix can be variable in length and sequence but it usually includes
a structural element termed HAMP (histidine kinase, adenyl cyclase, methyl-
accepting chemotaxis proteins and phosphatase) or P-type linker (Aravind &
Ponting, 1999; Williams & Steward, 1999). These linkers are variable in length from
40 to 180 residues and present a predicted topology of an -helical, coiled-coil like
motif. Furthermore, it has been suggested that these linkers may be involved in the
transmission of signals between the sensing domain and the kinase core (Fabret et
al., 1999; Williams & Steward, 1999).
3.4.2 Classification of histidine kinase proteins
According to their domain organization, histidine kinases can be separated into two
major classes (Figure 14) (Bilwes et al., 1999). Class I HKs are mostly homodimeric,
where the H-box is directly contiguous to the CA domain and present the above-
mentioned structural organization. Examples of this class are the osmosensor EnvZ
from E. coli (Tanaka et al., 1998; Tomomori et al., 1999) and the sensor histidine-
kinase TM083 from Thermotoga maritima (Marina et al., 2005).

Introduction
Camila Hernández
37
Figure 14: Classification of histidine kinase proteins according to the domain
organization. Class I is represented on top, showing the dimerization domain (DHp)
with the H-box and the ATP-binding domain or catalytic domain (CA) with the N, G1,
F and G2 boxes. Class II (bottom), shows the P1-P5 domains as described for CheA.
Adapted from Dutta et al., 1999; Stock et al., 2000; West & Stock, 2001; and Klumpp
& Krieglstein, 2002.
Class II histidine kinases, exemplified by the chemotaxis protein CheA (Bilwes et al.,
1999), possess five domains P1-P5 from N-terminus to C-terminus. In this type of
kinases, the H-box is located in the His-containing phosphotransfer (Hpt) domain or
P1 domain, which is separate and distinct from the dimerization domain (P3) and
the catalytic domain (P4). The P2 domain, unlike other HKs, is a separate domain
that participates in the recognition and binding of the RRs. Further, the P5 domain is
involved in the interaction of CheA with the chemotaxis receptors and a coupling
protein, CheW (Bilwes et al., 1999; West & Stock, 2001).

Introduction
Camila Hernández
38
3.4.3 Structure of the cytoplasmatic portion of the sensor histidine-kinase TM083 from Thermotoga maritima
As mentioned, Ks-Amt5 exhibits homologies with histidine kinases and in particular
it shares a high degree of similarity with the histidine kinase TM083 from
Thermotoga maritima. The TM083 represented the first crystal structure of the
complete cytoplasmatic region of a sensor histidine kinase revealing previously
unidentified functions for several conserved amino acids and showing for the first
time the disposition of both dimerization and catalytic domains.
The 1.9 Å resolution X-ray crystal structure comprises the cytoplasmatic portion
(residues 233-489) of the sensor histidine kinase TM083. The corresponding
fragment, HK853-CD, confirmed a homodimeric structure with a two-fold symmetry
(Marina et al., 2005). Each HK853-CD subunit contains two domains, an N-terminal
helical-hairpin domain with two anti-parallel helices (1 and 2), and a C-terminal
- domain that contains the characteristic five -strands and three -helices from
the CA domain (Figure 15).
In the overall structure, helices 1 and 2 are connected by a nine-residue turn,
residues S279-T287. The 1 helix, presents a twist induced by a proline residue
(P265) that separates it into two parts, 1a and 1b. The conserved histidine auto-
phosphorylation site is located in 1a (H260), while the 1b helix forms a helix-
bundle with helices 2 and 2’ (symmetry mates).
The catalytic domain exhibits an - sandwich fold with two layers. The first layer is
almost orthogonal to the helical-hairpin domain and includes a mixed five-strands
-sheet formed by strands B, and D-G. The second layer is then formed by three
-helices (3-5). Moreover, some additional components were observed such as a
short pair of anti-parallel strands (A and C) and a disulfide bridge between two
cysteine residues, C330 and C359, that link a segment of helix 3 and the -strand
C.

Introduction
Camila Hernández
39
Figure 15: Crystal structure of the cytoplasmatic portion HK853-CD of the sensor histidine
kinase TM083. A. Dimer representation. One monomer is colored in silver; the second monomer
is colored in rainbow with blue at the N-terminus and red at the C-terminus. B. Details of the
monomer structure, the dimerization (DHp) domain and catalytic (CA) domain are labeled. The
autophosphorylation site shows the conserved histidine residue (His260) represented as a stick
model coordinated by a sulfate ion. The catalytic domain (90° tilt) shows the - sandwich fold.
The protein was crystallized in the presence of an ATP analogue (AMPPNP) that was hydrolyzed to
ADPN represented as a stick. PDB accession code: 2C2A
The knowledge of the HK853-CD structure has given insights into the catalysis and
regulation of class I HKs. As already mentioned, signal transduction pathways begin
with a stimulus that induces a change in the sensor domain of the HK. These
conformational changes are then transferred through the four-helix bundle into the
cytoplasmatic kinase core, hence, influencing the kinase and/or phosphatase
activities carried out by the DHp and CA domains. So far two transduction models

Introduction
Camila Hernández
40
have been described: (1) induced by a rotational movement of the helices with
respect to one another (Cochran & Kim, 1996) and (2) due to a piston-like
movement of one or two helices with respect to the other helices present in the
bundle (Falke & Hazelbauer, 2001). The second transduction model has been more
accepted due to the prevalent evidence from chemotactic receptors. Further, the
linker domains formed by coiled-coil motifs transmit the signal between domains
and possibly modulate and amplify these movements (Marina et al., 2005).
Conclusively, the HK853-CD structure supported the previous knowledge on
histidine classification and catalytic mechanism. However, the major contribution is
the characterization of the first model of interdomain connection between the DHp
and the CA domain of a sensor HK protein.
3.5 Aims of this work
Ks-Amt5 protein is one of the five ammonium transport proteins encoded in the
genome of the anammox bacteria “Candidatus Kuenenia stuttgartiensis”. It presents
remarkable and unusual characteristics that make it an interesting target for
structural biology studies. The presence of two distinct domains, an Amt and a
histidine kinase, identifies it as a novel Amt type and a two component signal-
transduction protein.
The Amt domain of Ks-Amt5 shares characteristic topological similarities with other
Amt proteins. Thus, it is assumed that this domain is likely to preferably form a
stable trimer. The conserved trimeric state of the Amt proteins leads to the question
of how the structural arrangement between the Amt and the HK domain in Ks-Amt5
may look, since so far, histidine kinases have only been described as functioning as
dimers. Besides the structural characteristics, Ks-Amt5 presents a different and not
yet described molecular mechanism by which ammonium sensing could be
integrated as a signal to modulate the phosphorylation state of the histidine kinase
domain as a first step for a signal-transduction pathway. These properties of Ks-

Introduction
Camila Hernández
41
Amt5 may confer a unique biochemical role and function in the metabolism of
“Candidatus Kuenenia stuttgartiensis”.
The aim of this work is to determine the structure of the novel Amt protein, Ks-
Amt5, from the anammox bacteria “Candidatus Kuenenia stuttgartiensis” and
thereby foster comprehension of its ammonium transport mechanism.
Consequently, X-ray crystallography studies were designed to gain insight into the
structural aspects of the transport mechanism. For this, the amt5 gene from “Ca. K.
stuttgartiensis” was cloned and heterologously overexpressed in different E. coli
strains. In addition, different variants of the amt5 have been designed in order to
produce the cytoplasmatic histidine kinase domain of Ks-Amt5. The overproduced
Ks-Amt5 and variants were purified by affinity and size exclusion chromatography.
Subsequently, crystallization trials were carried out to obtain well-diffracting
crystals followed by the determination of the three-dimensional molecular
structure. Moreover, functional studies were performed using different biochemical
methods, such as isothermal titration calorimetry and phosphorylation assays, in
order to relate the activity of both Amt and histidine kinase domains.

Materials and Methods
Camila Hernández
42
4 Materials and Methods
Unless stated otherwise, standard techniques were employed for all experiments.
4.1 Materials
4.1.1 Chemicals
All standard chemicals used were of analytical purity grade (p.a). These chemicals
were obtained from the following companies: Applichem (Darmstadt, Germany), BD
(Heidelberg, Germany) Merck (Darmstadt, Germany), Perkin-Elmer (Rodgau,
Germany), Roth (Karlsruhe, Germany) and Sigma-Aldrich (Deisenhofen, Germany).
4.1.2 Detergents
For the extraction from the membranes and in order to stabilize the membrane
proteins in solution, detergents of very high purity grade were used. These
detergents were purchased from Affymetrix-Anatrace (Maumee, USA).
4.1.3 DNA and Protein Weight Markers
The size of cloned DNA fragments was calculated using 1 kb DNA ladder (MBI
Fermentas, St. Leon-Rot, Germany). For the evaluation of protein size bands in SDS-
PAGE and Western blot membranes, unstained protein molecular weight marker
and Page-RulerTM pre-stained plus protein ladder (MBI Fermentas, St. Leon-Rot,
Germany) were used, respectively.
4.1.4 Enzymes
Enzymes used for molecular biology were obtained from MBI Fermentas (St. Leon-
Rot, Germany), peqlab (Erlangen, Germany), Stratagene (La Jolla, USA), and in the

Materials and Methods
Camila Hernández
43
case of Taq polymerase, a home-made laboratory stock was used. Table 1 lists the
various enzymes used in this work.
Table 1: Enzymes used for molecular biology work on Ks-Amt5
Enzyme Classification Function and application DpnI Restriction endonuclease Digestion of methylated DNA (mutagenesis) NdeI Restriction endonuclease Digestion of restriction sites (cloning) XhoI Restriction endonuclease Digestion of restriction sites (cloning) KAPA HiFiTM Hot Start Polymerase Synthesis of dsDNA (PCR) Pfu Polymerase Synthesis of dsDNA (PCR) PfuTurbo® Polymerase Synthesis of dsDNA (PCR) Taq Polymerase Synthesis of dsDNA (PCR) T4 DNA Ligase Ligase DNA ligation (cloning)
4.1.5 Bacterial strains
Bacteria are able to incorporate extracellular DNA through their cell walls. This
ability can be artificially enhanced by chemical or electric procedures to produce
competent cells that can multiply or overexpress desired plasmidic constructs. In
this work different E. coli strains were used for this purpose.
E. coli strains XL 10 Gold (Stratagene, USA) and XL 1 Blue (Bullock et al., 1987) were
used for amplification of plasmidic DNA. Heterologous overproduction of Ks-Amt5
and variants was performed using chemically competent E. coli C43 (DE3), a variant
of BL21 (DE3) (Studier & Moffatt, 1986) (Novagen, Darmstadt, Germany), tailored
for the expression of membrane proteins (Miroux & Walker, 1996). E. coli BL21
(DE3) was used for the overproduction of the cytosolic domain (Ks-Kin). Table 2
summarizes the different genotypes of the E. coli strains mentioned above.
Table 2: Genotypes of the different E. coli strains used in this work.
E. coli strain Genotype
XL 10 Gold Tetr∆(mcrA)183 ∆(mcrCB-hsdSMR-mrr)173 endA1 supE44 thi-1 recA1 gyrA96 relA1 lac Hte F proAB lacIqZ∆M15 Tn10 (Tetr) Amy Tn5 (Kanr)]
XL1 blue recA1 endAI gyrA96 thi-1 hsdR17 supE44 relA1 lac [F’ proAB lacIqZ∆M15 Tn10 (Tetr)] BL21 (DE3) F- ompT hsdSB (rB- mB-) gal dcm λ (DE3 [lacI lacUV5-T7 gene 1 ind1 sam7 nin5]) C43 (DE3) F- ompT hsdSB (rB- mB-) gal dcm λ (DE3) and two uncharacterized mutations

Materials and Methods
Camila Hernández
44
4.1.6 DNA oligonucleotides
DNA oligonucleotides were obtained under high purity salt free (HPSF) conditions
from Eurofins MWG Operon (Ebersberg, Germany) and Invitrogen (Darmstadt,
Germany). The identification of cleavable signal peptides in amt5 was carried out
before primer design (Table 3) with SignalP v 3.0 server (Bendtsen et al., 2004) as
well as codon usage variations towards E. coli.
Table 3: Primer sequences for all constructs and variants made in this work. Restriction sites
are highlighted in orange (NdeI) and green (XhoI). Point mutations are shown in blue.
Gene Primer sequence: forward (F) and reverse (R). Length (bp) Tm (˚C) amt5 F: 5’ AGA TAT ACA TAT GGA AAA CAT ACA AAT 3’ 27 54.3
R: 5’ ATT CTC GAG CTT GTT CAC TGG ATT TAT GG 3’ 29 63.9 kin F: 5’ AAA TAC ACA TAT GCT TGA AAA AAG GGT 3’ 28 59.3
R: 5’ ATT CTC GAG CTT GTT CAC TGG ATT TAT GGC 3’ 30 65.4 kin_H460A F: 5’ CAA CAA TGT CAG CTG AGC TGC GCA C 3’ 25 66.3
R: 5’ GTG CGC AGC TCA GCT GAC ATT GTT G 3’ 25 66.3 kin_I612W F: 5’ GAT ACC GGC ATT GGT TGG AAG CCT GAA GAC AAA G 3’ 34 61
R: 5’ CTT TGT CTT CAG GCT TCC AAC CAA TGC CGG TAT C 3’ 34 61 kin_S666W F: 5’ CCT TTG GAA AAG GAT GGA CCT TCT TTT TTA TCT TGC 3’ 36 57
R: 5’ GCA AGA TAA AAA AGA AGG TCC ACT CTT TTC CAA AGG 3’ 36 57 kinS F: 5’ GAC AGC AGA CCT TCA TAT GGC AAA TGT TGC 3’ 30 61.6
R: 5’ GCA ACA TTT GCC ATA TGA AGG TCT GCT GTC 3’ 30 61.6
4.1.7 Plasmids: The pET vector system
All plasmids (pET21a, pET28a and pET15dT) used for the heterologous production
of Ks-Amt5, Ks-Kin and variants in E. coli (4.2.2.4), belong to the pET vector system
(Merck-Novagen, Darmstadt, Germany). These vectors contain a lacI gene that codes
for a lac repressor protein, a T7 promoter specific to T7 RNA polymerase, a lac
operator that can block transcription, a multiple cloning site, a f1 origin of
replication that enables the production of single-stranded DNA under appropriate
conditions and a conventional origin of replication. The expression of the target
gene is controlled by the T7 promoter and the lac operon and can be induced by the
addition of an allolactose-mimicking compound such as isopropyl-β-D-
thiogalactopyranoside (IPTG). The plasmids used differ in the type of protease

Materials and Methods
Camila Hernández
45
cleavage site, antibiotic resistance and position of the affinity tag. In particular, the
pET21a vector carries a C-terminal His6-Tag sequence and a –lactamase gene that
conveys ampicillin resistance to the host cell and can be used as a selectable marker.
The pET28a vector carries an N-terminal His6-Tag/thrombin/T7-Tag configuration
plus a C-terminal His6-Tag sequence with a kanR gene that transfers kanamycin
resistance to the host cell. The pET15dT vector is a modified version of the pET15b
plasmid. It also contains a –lactamase gene for ampicillin resistance. However, it
carries an N-terminal His10-Tag sequence instead of a His6-tag and an additional TEV
protease cleavage site between the NdeI restriction site and the N-terminal H10-Tag.
The vector charts for pET21a, pET28a and pET15dT are shown in Figure 16.
The gene encoding the full-length wild type protein (Ks-Amt5) was cloned by
GenScript (Piscataway, USA) into the pET21a vector. The portion of the amt5 gene
encoding for the cytosolic domain (Ks-Kin) was cloned into pET28a and pET15dT
vectors. All target genes were introduced into the plasmids through the NdeI and
XhoI restriction sites. Variants of the wild type genes (full length and cytosolic
region) were obtained by site-directed mutagenesis (4.2.1.2) with the original
plasmids.

Materials and Methods
Camila Hernández
46
Figure 16: Vector charts of the three pET plasmids used for the expression of amt5, kin and
variants. The restriction sites used are indicated in blue, affinity tags are marked in grey and the
protease cleavage sites in magenta. Additional features displayed are: f1 origin of replication,
pBR322 origin of replication, T7 prom (T7 promoter), T7 term (t7 terminator), lacI reg (lac
repressor), lacO reg (lac orperator), amp prom (ampicillin resistance promoter), amp marker
(ampicillin resistance gene) and kan2 marker (kanamycin resistance gene). Plasmid charts were
drawn using PlasMapper (Dong et al., 2004).

Materials and Methods
Camila Hernández
47
4.2 Methods
4.2.1 Molecular biology
4.2.1.1 Polymerase Chain Reaction (PCR)
The Polymerase Chain Reaction (PCR) was used for the amplification of DNA
fragments as well as for mutagenesis experiments (4.2.1.2). This method is
comprised of three basic steps: denaturation, annealing and extension. In each cycle
of PCR, the three steps are repeated to increase the concentration of the desired
DNA fragments in solution. Initially, the DNA is denatured at a high temperature
(above 90 ˚C) to break the double helix. The denaturation step is followed by the
annealing of the primers that complement and flank the DNA region to be amplified.
At this stage, the temperature is decreased to a value close to the melting
temperature (Tm) of the designed oligonucleotides allowing them to anneal to the
DNA matching sequence providing a starting point for DNA polymerase extension of
the template. Due to the high temperatures used during PCR cycles, the DNA
polymerases need to be stable and for this reason they are obtained from
hyperthermophilic organisms such as Thermus aquaticus (Taq) or Pyrococcus
furiosos (Pfu).
Generally, a PCR mixture contains DNA template (DNA fragment containing the gene
of interest to be amplified), a forward primer, a reverse primer, four desoxy-
ribonucleotides (d TP’s), a polymerase, and a buffer for the polymerase activity.
Table 4 shows the PCR mixtures used for the amplification of the target constructs
and the temperatures for the touchdown PCR program used.

Materials and Methods
Camila Hernández
48
Table 4: PCR mixture composition and touchdown PCR program
PCR mixture 2 µl Reaction buffer (10X)
0.4 µl dNTPs (10 mM) 0.6 µl Forward primer (10 µM) 0.6 µl Reverse primer (10 µM)
5-100 ng DNA template 0.5 µl DNA polymerase
Add ddH2O to 20 µl Initial stock concentrations shown in brackets.
Touchdown PCR program Step Temperature (˚C) Time (s)
Initial denaturation 98 120 1st cycle (1X) Denaturation 98 30
Primer annealing 70 60 Extension 72 270
2nd cycle (1X) Denaturation 98 30 Primer annealing 66 60 Extension 72 270
3rd cycle (1X) Denaturation 98 30 Primer annealing 63 60 Extension 72 270
4th cycle (1X) Denaturation 98 30 Primer annealing 60 60 Extension 72 270
5th cycle (20X) Denaturation 98 30 Primer annealing 55 60 Extension 72 270
Final extension 72 600 Storage 4-8
The PCR mixture and touchdown temperature cycle program shown in Table 4 were
used to amplify the designed constructs as well as to screen and confirm positive
colonies after ligation (4.2.1.4) into the desire plasmid. The PCR products were
purified using the QIAquick purification kit (Qiagen, Hilden, Germany) and analyzed
by agarose gel electrophoresis (4.2.1.5). The quality of the PCR products was
evaluated by UV-Vis spectrometry. Correct PCR products were sent for sequence
analysis as a final confirmation of the integrity of their DNA sequence (4.2.1.7).

Materials and Methods
Camila Hernández
49
4.2.1.2 Site-directed mutagenesis
Site-directed mutagenesis is a technique used to modify template DNA, by the
controlled exchange of base pair(s) and deletion or insertion of fragment(s) of DNA.
Primers for mutagenesis must contain the desired mutation in both strand
directions, forward and reverse, and also complement the desired target sequence.
In order to improve annealing to the template DNA the desired mutation is usually
placed in the middle of the primer. To adjust the annealing temperature of the PCR,
the primers melting temperature was calculated using the following formula:
Tm = 81.5 + 0.41(%GC)-675/N-%mismatch
Where N represents the primer length (in bases), %GC stands for the percentage of
guanine and cytosine and %mismatch denotes the percentage of non-aligned bases.
Here, variants of amt5 and kin were made by site-directed mutagenesis using
Quickchange mutagenesis protocol (Stratagene, Cedar Creek, USA).
4.2.1.3 DNA digestion with restriction endonucleases
Restriction endonucleases are present in bacteria and archaea and are found to be
involved in the protection of these organisms from viruses. These enzymes cleave
single stranded or double stranded DNA at a specific sequence called a restriction
site. This recognition sequence is unique for each restriction enzyme and it has
usually has a length of 4-6 nucleotides. Cleavage takes place following the hydrolysis
between two sugar-phosphate backbones of the DNA double helix. Restriction
enzymes can produce blunt or cohesive (sticky) ends, according to their specific
cleavage position. This property is of special interest for molecular biology
techniques such as cloning of a gene into a host vector.
In this work, different restriction enzymes (NdeI, XhoI and DpnI) were used to
specifically digest PCR products for cloning but also for the digestion of methylated,

Materials and Methods
Camila Hernández
50
parental DNA after site-directed mutagenesis PCR. The typical reaction mixtures
used contained 1 µl of the desired restriction enzyme (10 U.µl-1), 5 µl of reaction
buffer (10X) and 10-30 µl DNA to a final volume of 50 µl. The digestion reaction was
carried out at 37 ˚C for 1-4 hours.
4.2.1.4 DNA ligation
Ligation, in molecular biology, refers to the process where an enzyme, the DNA
ligase, covalently links two ends of DNA or RNA fragments. The ligase joins
fragments by the formation of a phosphodiester bond between the blunt or cohesive
ends of double stranded DNA or RNA. In this study, the T4 ligase (isolated from T4
bacteriophage) was used. The ligation procedure was carried out at 16-22˚C for 16-
18h using the reaction mixture shown in Table 5.
Table 5: Reaction mixture for DNA ligation
2 µl Reaction T4 ligase buffer (10x) 1 µl ATP (50 mM) 1 µl PEG 4000 (50%) 1 µl T4 ligase (5 U. µl-1) * µl Vector pET21a, pET15dT, or pET28a, previously digested with NdeI and XhoI * µl DNA insert, previously digested with NdeI and XhoI
Add ddH2O to20µl * Tested ratios: 10:1; 20:1; 40:1; 100:1 (vector:insert) Initial stocks concentrations are shown in brackets.
4.2.1.5 Agarose gel electrophoresis
Agarose gel electrophoresis is a biochemical technique used to separate mixtures of
DNA or RNA fragments according to size by applying an electric field. Since DNA is
negatively charged due to its phosphate backbone, fragments migrate to the positive
anode through an agarose gel matrix. In principle, separation is based on retention
times relative to the size of the particles: smaller fragments migrate further than
larger fragments throughout the agarose gel. The separation range is thus
determined by the pore sizes of the agarose matrix, which are directly correlated to
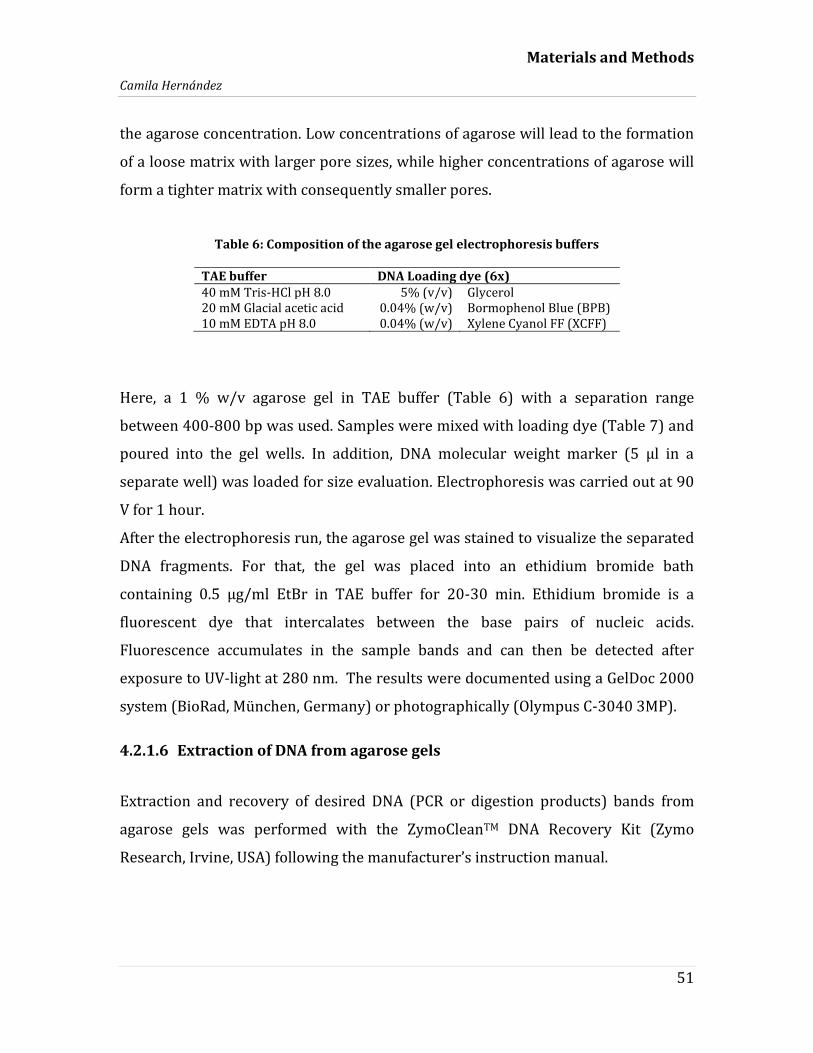
Materials and Methods
Camila Hernández
51
the agarose concentration. Low concentrations of agarose will lead to the formation
of a loose matrix with larger pore sizes, while higher concentrations of agarose will
form a tighter matrix with consequently smaller pores.
Table 6: Composition of the agarose gel electrophoresis buffers
TAE buffer DNA Loading dye (6x) 40 mM Tris-HCl pH 8.0 5% (v/v) Glycerol 20 mM Glacial acetic acid 0.04% (w/v) Bormophenol Blue (BPB) 10 mM EDTA pH 8.0 0.04% (w/v) Xylene Cyanol FF (XCFF)
Here, a 1 % w/v agarose gel in TAE buffer (Table 6) with a separation range
between 400-800 bp was used. Samples were mixed with loading dye (Table 7) and
poured into the gel wells. In addition, DNA molecular weight marker (5 µl in a
separate well) was loaded for size evaluation. Electrophoresis was carried out at 90
V for 1 hour.
After the electrophoresis run, the agarose gel was stained to visualize the separated
DNA fragments. For that, the gel was placed into an ethidium bromide bath
containing 0.5 µg/ml EtBr in TAE buffer for 20-30 min. Ethidium bromide is a
fluorescent dye that intercalates between the base pairs of nucleic acids.
Fluorescence accumulates in the sample bands and can then be detected after
exposure to UV-light at 280 nm. The results were documented using a Gel oc 2000
system (Bio ad, u nchen, Germany) or photographically (Olympus C-3040 3MP).
4.2.1.6 Extraction of DNA from agarose gels
Extraction and recovery of desired DNA (PCR or digestion products) bands from
agarose gels was performed with the ZymoCleanTM DNA Recovery Kit (Zymo
esearch, Irvine, USA) following the manufacturer’s instruction manual.

Materials and Methods
Camila Hernández
52
4.2.1.7 DNA Sequence Analysis
Confirmation of positives clones or variants of amt5 and kin was performed by DNA
sequence analysis using the T7 forward and reverse primers (Figure 18). For this,
samples were sent to the GATC Biotech AG (Konstanz, Germany). Sequence
chromatograms were analyzed with Chromas (version 2.01, Technelesium Pty, Ltd)
and the resulting forward and reverse sequences aligned with the amt5 gene
sequence for comparison using ClustalW2 (Larkin et al., 2007).
4.2.2 Microbiological methods
4.2.2.1 Escherichia coli cultivation
E. coli strains were cultivated in Luria-Bertani medium (Bertani, 1951). This
medium is composed of 1 % (w/v) tryptone, 0.5 % yeast extract and 1 % sodium
chloride. It was sterilized by autoclaving prior to usage.
Cultures for DNA preparation and pre-cultures for protein production were
incubated overnight at 37˚C. For heterologous expression of the different constructs
in E. coli C43 (DE3) or BL21 (DE3), LB medium was supplemented with 100 µg/ml
ampicillin (pET21a, pET15dt) or 100 µg/ml kanamycin (pET28a). See details in
(4.2.2.4)
4.2.2.2 Production and transformation of E. coli competent cells
Chemically competent cells were prepared under sterile conditions by the
inoculation of a chosen colony of the desired E. coli strain in 500 ml LB medium
supplemented with antibiotics whenever adequate. Cells were grown at 37 ˚C until
OD600= 0.5-0.7. At this point, cells were harvested by centrifugation (10 min at 4000
x g, 4 ˚C). The cell pellet was kept on ice and resuspended in 150 ml cold TBF1 buffer
(Table 7) and chilled for 5 min. After a second centrifugation step (10 min at 4000 x

Materials and Methods
Camila Hernández
53
g, 4 ˚C) the new cell pellet was finally resuspended in 5 ml cold TBF2 buffer (Table
7) and aliquoted into 50 µl samples that were further frozen in liquid nitrogen and
stored at -80 ˚C.
Table 7: Buffer composition for the production of chemically competent E. coli cells.
TBF1 buffer: pH 5.8 with acetic acid TBF2 buffer: pH 6.5 with 1M NaOH 30 mM Potassium acetate pH 7.0 10 mM NaMOPS pH 7.2 50 mM MnCl2 75 mM CaCl2 10 mM CaCl2 10 mM RbCl
100 mM RbCl 15% (v/v) Glycerol 15% (v/v) Glycerol
In order to incorporate extra-chromosomal DNA plasmids into such chemically
competent cells, a heat shock treatment was performed (Hanahan, 1983). For this, a
50 µl competent cell aliquot was thawed on ice followed by the inoculation of 0.5 µl
of DNA (50-100 ng) under sterile conditions and further incubation on ice for 30
min. The heat shock step was performed at 42 ˚C for 45 sec to enable the passive
permeation of the extra-chromosomal DNA though the cell membrane.
Subsequently, the cells were chilled on ice for 2 min prior to the addition of 300 µl
LB medium and incubated at 37 ˚C for 1 hour with shaking at 750 rpm. The last
incubation step allows the cells to assimilate the inoculated plasmids and the
development of antibiotic resistance. After transformation the cells were inoculated
or plated in selective medium supplemented or not with antibiotics.
4.2.2.3 Plasmid preparation
XL 10 Gold or XL 1Blue E. coli strains were transformed and grown in 5 ml LB
medium supplemented with the respective antibiotic, in order to obtain analytical
amounts of plasmid DNA. Isolation and preparation of plasmidic DNA was then
carried out with the ZyppyTM Plasmid MiniPrep Kit (Zymo Research, Irvine, USA)
according to the instructions manual. However, the elution step was done with 10
m Tris‐HCl pH 8.0 instead of the elution buffer (which contains E TA) included in

Materials and Methods
Camila Hernández
54
the kit to avoid chelation of the magnesium ions that are required for sequencing
reactions.
Pure plasmid was quantified by UV-absorption at 260 nm with a GeneQuantTM 1300
spectrophotometer (GE Healthcare, Munich, Germany). For that, 1 µl of the isolated
DNA plasmid solution was placed in the TrayCell nanodrop cuvette (Hellma
Analytics, Müllheim, Germany) and measured against the elution buffer (blank).
4.2.2.4 Protein production in E. coli
Expression cultures were made in baffled Erlenmeyer flasks. Therefore, 5-10 ml
pre-culture (4.2.2.1) were inoculated in 500ml LB-Medium (supplemented with the
respective antibiotic) and incubated at 180 rpm. Production of Ks-Amt5 was
induced at 20 ˚C for 18 h while production of Ks-Kin and its variants was achieved at
30 ˚C after 2-3 h of induction.
Induction of expression was performed by adding IPTG to a final concentration of
0.4 mM when the cultures reached an optical density, measured at 600 nm, between
0.5–0.7 Au. For the production of Ks-Amt5, cell cultures were incubated on ice for
10-20 min before IPTG induction (cold induction) after which growth proceeded at
20 ˚C. For each expression culture, generally 18 (1 L) baffled Erlenmeyer flasks
(containing 500 ml LB-medium) were inoculated.
Eventually, cell cultures were harvested by centrifugation at 6000 g (rotor JLA-
8.100) for 15 min at 4°C. The cell pellets were collected and the wet cell mass was
determined. Before storage at -20 ˚C, the samples were shock frozen in liquid
nitrogen.
4.2.3 Protein biochemistry
4.2.3.1 Cell disruption and preparation of purification samples
In order to start the protein purification process, cells containing the over-produced
target protein must be disrupted. Subsequently it is necessary to perform a series of

Materials and Methods
Camila Hernández
55
centrifugation steps to get rid of undesired cell content and separate the cytosolic
and membrane components. For this, the cell pellets were thawed and resuspended
by constant stirring at 4˚C for 1 h with the addition of 3 ml lysis buffer (20 m Tris-
HCl pH 8.0, 40 mM Imidazole pH 8.0, 500 mM NaCl and plus 10 % v/v glycerol only
for the cells containing over-produced Ks-Amt5) per gram of cells. One pill of EDTA-
free Complete Protease Inhibitor Cocktail (Roche Diagnostics, Basel, Switzerland)
per 50 ml cell suspension was added in order to avoid protease activity and
consequent protein degradation. The homogeneous cell suspension was
mechanically disrupted by passing it four times though a micro fluidizer (M-110P,
Microfluidics, Newton, USA). Disruption occurs due to the high sheer-forces
resulting from the nearly instant and severe pressure differences.
For Ks-Amt5 purification, the broken cell suspension was consequently centrifuged
at 30’000 g for 30 min at 4˚C (rotor: JA-25.50) to separate and eliminate the cell
debris. The supernatant was kept and further ultracentrifuged at 300’000 g for 1 h
at 4˚C (rotor: Ti70) in order to obtain the membrane fraction. The membrane pellet
was carefully resuspended on ice with lysis buffer in a ratio of 10 ml buffer per gram
of wet-membranes. For Ks-Kin purification, the supernatant was readily obtained
after centrifuging the broken cell suspension at 108’800 g for 1 h at 4˚C (rotor: JA-
30.50). The supernatant was used after filtration with a 0.45 nm filter.
4.2.3.2 Solubilization of membranes
Solubilization of membrane proteins involves the use of detergents. Detergents are
lipid-like molecules and as such interact with both hydrophobic and non-
hydrophobic residues. They are essential for the extraction of membrane proteins
from the lipid-bilayer environment. For this purpose, the detergent concentration
used has to be above the critical micelle concentration (CMC), which refers to the
minimum concentration in which molecules of detergents form micelles in solution.
The CMC is temperature-dependent and varies with the salt concentration and pH

Materials and Methods
Camila Hernández
56
values. Since the CMC is specific for each detergent, solubilization trials have to be
performed to determine the best conditions for the extraction of the maximum
amount possible of target protein. Therefore, to optimize the solubilization step,
different detergent types with variations in size and nature of the hydrophobic
chains as well as the hydrophilic groups must be tested. For successful membrane
protein purification, a detergent has, preferably to be able to, extract the target
protein out of the lipid bilayer and stabilize it. Thus, it must not cause the
denaturation of the protein.
The optimal detergent for the recovery of Ks-Amt5 from the membrane was a non-
ionic and mild detergent, n-dodecyl--D-maltopyranoside (DDM).
Table 8: Chemical characteristics and concentrations of the detergents used in this work. Source: www.affymetrix.com
Detergent name Abb. CMC
(% in H2O) Conc.
used (%) Chemical structure
n-Nonyl-β-D-Maltopyranoside D9M 0.2800 0.650
C21H40O11 (Non-ionic) n-Decyl-β-D-Maltopyranoside D10M 0.0870 0.200
C22H42O11 (Non-ionic) n-Undecyl-β-D-Maltopyranoside D11M 0.0290 0.065
C23H44O11 (Non-ionic) n-Dodecyl-β-D-Maltopyranoside DDM 0.0087 0.030
C24H46O11 (Non-ionic) n-Tridecyl-β-D-Maltopyranoside D13M 0.0017 0.005
C25H48O11 (Non-ionic) n-Octyl-β-D-Glucopyranoside OGP 0.5300 0.800
C14H28O6 (Non-ionic)
n-Dodecyl-N,N-Dimethylamine-N-Oxide
LDAO 0.0230 0.050
C14H31NO (Zwitterionic)

Materials and Methods
Camila Hernández
57
In practice, thus, when the membrane fraction (4.2.3.1) was fully resuspended, DDM
was added drop-wise to a final concentration of 1% (w/v), during a continuous slow
stirring at 4˚C. After this, the solution was stirred further at 4˚C for 1h and then
centrifuged at 108’800 g for 45 min, 4˚C (rotor: JA-30-50). This centrifugation step
allows the separation of the solubilized membranes from the insoluble fraction. The
supernatant was kept on ice for further use in affinity chromatography.
4.2.3.3 Affinity chromatography
As a purification technique, affinity chromatography is designed to isolate a
particular target protein. This technique makes use of reversible chemical
interactions, such as ionic or van der Waals-based receptor and ligand binding, to
separate and purify the target from the sample mixture in a chromatographic
matrix. For the purification of recombinant proteins, the most popular affinity
chromatography is IMAC (immobilized metal ion affinity chromatography). IMAC is
based on the covalent interactions of protein residues, especially histidine, to metal
ions, such as nickel, cobalt, or copper. The target protein (with a specific tag) can
then be selectively retained in a chelating resin material (e.g. Ni-Sepharose), which
contains immobilized metal ions. To elute the target protein, different methods can
be used, like changes of pH or by addition of a competitive molecule that can
strongly interact with the resin (e.g. Imidazole).
In this work, a Ni-HisTrap affinity column (HisTrapTM FF Column, GE Healthcare,
Munich, Germany) was used. Ni-HisTrap column retains poly-histidine-tagged
proteins. The affinity of the histidine residues to the Ni2+ ions results in a
coordination complex with the imidazole rings. After the target protein is bound,
contaminants with low and non-specific affinity can be washed with a buffer
containing a low concentration of imidazole (20-40 mM). At higher concentrations,
imidazole competes with the His-tagged protein for the Ni2+ binding sites on the
column leading to the displacement and elution of the target protein from the
column.

Materials and Methods
Camila Hernández
58
The protocol for the purification of Ks-Amt5 and Ks-Kin is schematized in table 13.
All IMAC purifications were performed at 4˚C using an A KTAprimeTM plus system
(GE Healthcare, Munich, Germany). Solubilized membranes (Ks-Amt5) or soluble
cytosolic fractions (Ks-Kin) were loaded onto a pre-equilibrated 5 ml HisTrap
column with a loading buffer containing 20 mM Tris-HCl pH 8.0, 40 mM Imidazole
pH 8.0, 500 mM NaCl and in the case of Ks-Amt5 an extra 10 % v/v glycerol and a
detergent concentration above the CMC (Table 8). The various proteins were eluted
with an elution buffer that was of the same composition as the loading buffer but
contained a higher imidazole concentration (500 mM). The purification was
followed by the protein absorption at 280 nm. After elution, protein fractions were
pooled and concentrated to 500-1000 µl by ultrafiltration using a Vivaspin 20 ml
concentrator (Sartorius-Stedim Biotech, Go ttingen, Germany) at 4’000 g and 4˚C.
The concentrator’s molecular weight cut off ( WCO) used was according to the
estimated protein size by SDS-PAGE (4.2.3.6), 10 kDa for Ks-Kin and its variants, and
50 kDa for Ks-Amt5 and its variants. The concentrated protein was subsequently
used for size exclusion chromatography. Table 9 shows the standard protocol
employed for the affinity chromatography.
Table 9: Stardard protocol for the purification of Ks-Amt5 and Ks-Kin
Volume (column volume) Step Buffer Fraction size (ml)
Flow rate (ml/min)
6X Equilibration Loading buffer - 2 Amount of sample depending on the purification
Loading of sample Loading buffer 10 0.5-1
6X or until stable baseline Washing #1 Loading buffer - 1-2 6X or until stable baseline Washing #2 5% Elution buffer 5 1-2 3-4X or until stable baseline Elution of protein 50% Elution buffer 3 1-2 5X Washing #3 100% Elution buffer - 2
4.2.3.4 Size exclusion chromatography (SEC)
Size exclusion chromatography (or gel filtration) allows the separation of molecules
according to the difference in their size and it is usually used as the final step in the

Materials and Methods
Camila Hernández
59
purification of proteins. Applications of this method include the separation of
different oligomeric states of proteins from aggregated proteins, as well as the
estimation of molecular size.
SEC involves the use of chromatographic columns packed with a gel filtration
medium. The medium consists of a porous matrix, which is inert and chemically and
physically stable. Samples are eluted isocratically, without a gradient and, thus, with
the use of a single buffer; this fact renders this technique to be one of the most
straightforward chromatographic methods. Separation occurs according to the
molecular weight as the sample passes through the porous matrix. Smaller
molecules can diffuse into the pores of the gel filtration medium and thus interact
with a larger surface area. This leads to greater retention times for smaller particles.
Any molecules larger than the pore size of the matrix cannot diffuse into the pores
and pass right through the column. As a result, molecules are eluted with decreasing
molecular weight.
To estimate the molecular weight of the target protein samples, a calibration curve
was made for two column models (SuperdexTM 200 10/300 GL and SuperdexTM 200
26/60 HiLoad; GE Healthcare, Munich, Germany) using a HMW Calibration Kit (GE
Healthcare, Fairfield, USA). For this purpose, 50-100 µl of the mixture was injected
onto the column. The mixture contained different proteins of known sizes:
Thyroglobulin (669 kDa), Ferritin (440 kDa), Aldolase (158 kDa),
Conalbumin (75 kDa) and Ovalbumin (43 kDa). The molecular weight can then be
calculated by plotting the logarithm of the molecular weight of the standard
proteins relative to their retention volume on the column and a subsequent linear
regression analysis.
In the present work, SEC was additionally used as a refinement step after the
purification by affinity chromatography to obtain homogeneous samples of the
different proteins (Ks-Amt5 and Ks-Kin) for crystallization experiments. For Ks-
Amt5 the SuperdexTM 200 10/300 GL column was used while for Ks-Kin the
SuperdexTM 200 26/60 HiLoad was used. The columns differ in volume size (23.62

Materials and Methods
Camila Hernández
60
ml and 300 ml respectively) and were chosen according to their separation
properties and to the volume of sample to inject.
The concentrated proteins previously obtained from the affinity chromatography
step were injected onto the column with the respective SEC buffer (20 mM Tris-HCl
pH 8.0, 100 mM NaCl and for Ks-Amt5 and additional 10 % v/v glycerol plus a
detergent concentration above the CMC, Table 8) at a flow rate of 0.4 ml/min (S200
10/300) or 1 ml/min (S200 26/60). Fractions containing the trimer of Ks-Amt5 and
dimer of Ks-Kin were collected and concentrated to a volume of 200–100 µl in
100,000 and 30,000 MWCO concentrators, respectively. Concentrated protein (Ks-
Amt5 or Ks-Kin) was kept on ice until the concentration was estimated. Samples that
reached high enough concentration levels (5-10 mg/ml) were further used for
crystallization experiments and functionality studies. Afterwards, the samples were
aliquoted in small amounts, frozen in liquid nitrogen and stored at -80 ˚C.
4.2.3.5 Protein concentration determination
Protein concentration was determined by the Bicinchoninic acid assay (BCA) (Smith
et al., 1985). It measures the reduction of Cu2+ to Cu+ in alkaline conditions. The
reduction is caused by the interaction of copper and BCA with peptide bonds and
protein residues like cysteine, tryptophan and tyrosine. The interaction of Cu2+ and
BCA leads to the formation of a green complex that upon reduction of the copper
develops a purple color. The reaction can be followed and quantified by UV-vis
spectroscopy, at a wavelength of 562 nm, which is the maximum of absorption for
the resulting purple complex, the production of which is proportional to the protein
concentration.
The high sensitivity (protein amounts from 0.5 µg/ml), negligible susceptibility to
common buffers or substances, stability, and compatibility with a wide range of
detergents, make BCA a good choice for the determination of protein concentration.
For protein determination, a calibration curve was drawn using various
concentrations of bovine serum albumin (BSA) standards prepared in 100 µl ddH2O

Materials and Methods
Camila Hernández
61
each (25, 50, 100, 150, 200 and 250 μg/mL). Concentrated protein samples were
diluted with 100 µl ddH2O in different ratios (1:50 and 1:100). For the BCA assay, a
solution of 50:1 ratio BCATM Protein Assay Reagent A (Thermo Fisher Scientific,
Waltham, USA) and 4% (w/v) CuSO4 was prepared. Subsequently, 1ml of this
mixture was added to each BSA standard, protein sample and blank sample
(containing only water). All samples were incubated at 60˚C for 30 min. Absorbance
was measured with a GeneQuantTM 1300 Spectrophotometer (GE Healthcare,
Fairfield, USA) at 562 nm. The protein concentration was calculated according to the
calibration curve. All measurements were performed in duplicate for statistical
accuracy.
4.2.3.6 SDS PAGE electrophoresis
SDS-PAGE stands for Sodium Dodecyl Sulphate PolyAcrylamide Gel Electrophoresis.
It is a widely used technique for the separation of protein mixtures according to
their electrophoretic mobility and for the qualitative analysis of protein samples. It
is commonly used as a purity checkpoint after protein purification.
The use of SDS, a strong anionic detergent, leads to the unfolding and denaturation
of the protein samples by binding to the hydrophobic parts of the protein in a ratio
of 1:1.4 μg protein/μg S S ( eynolds & Tanford, 1970). By doing so, the protein
sample acquires a net negative charge, which is proportional to the length of the
polypeptide chain. Therefore, separation of protein mixtures by SDS-PAGE is
achieved according to their electrophoretic mobility (Laemmli, 1970).
SDS-PAGE gels consist of two parts (a stacking gel and a separating gel), which
characterize the technique as a discontinuous electrophoresis. The polyacrylamide
gel is formed by the polymerization of an acrylamide molecule crosslinked by , ’-
methylene-bisacrylamide (bis-acrylamide). For that, ammonium persulfate (APS)
needs to be added in order to initiate the reaction which is then catalyzed by the
amide base , , ’, ’-tetramethylenediamine (TEMED). Differences in ionic strength

Materials and Methods
Camila Hernández
62
and pH between the stacking gel and the separating gel, lead to a voltage
discontinuity when a current is applied.
The upper gel, called stacking gel, has a lower percentage of acrylamide (4-5%) and
a low pH, making it less cross-linked with lower ionic strength. The lower ionic
strength creates a high electrical resistance, making low and average molecular
weight proteins (negatively charged by the bound of SDS) migrate faster towards
the separating gel when an electric current is applied. Due to the gradient field
intensity, the protein molecules form a stack according to their electrophoretic
motility. In addition, glycine and Cl- ions from the running buffer contribute to the
stacking effect. The small and motile Cl- ions form a polar running front in the
stacking gel, dampening the effective force of the current for the SDS-enveloped
sample and slowing them down. At the same time, the slower moving zwitterionic
glycine molecules, with a neutral charge at pH 6.8, unshield nearby SDS-protein
samples and increase their mobility.
Once the stacked protein bands reach the frontier of the stacking gel and the
separating gel, the higher degree of polymerization of the separating gel, leads to the
separation of the protein molecules according to their molecular weight.
Table 10: SDS-PAGE stacking gel and separating gel compositions. The percentages of the separating gel were chosen for different separation qualities.
Stacking gel (5%) Separating gel (7.5 %/ 12.5 %)
0.75 ml Stock I 0.5 M Tris-HCL pH 6.8 1.875 ml Stock II 0.5 M Tris-HCL pH 8.8 0.4 % (w/v) SDS 0.4 % (w/v) SDS
0.405 ml Bis-acrylamide (30% w/v) 1.875/3.12 ml Bis-acrylamide (30% w/v) 1.83 ml ddH2O 3.72/2.46 ml ddH2O
15 µl APS (10% w/v) 37.5 µl APS (10% w/v) 3 µl TEMED 3.75 µl TEMED
Initial stock concentrations are braketed
Table 11: Composition of the SDS-PAGE buffers.
5X Loading buffer Running buffer 125 mM Tris-HCl pH 6.8 25 mM Tris
20% (v/v) Glycerol 192 mM Glycine 5% (w/v) SDS 1% (w/v) SDS
0.2% (w/v) BPB 1% (v/v) -mercaptoethanol

Materials and Methods
Camila Hernández
63
The SDS-PAGE was carried out in a Hoefer miniVE vertical electrophoresis system
(GE Healthcare, Fairfield, USA). The gel solutions (Table 10) were poured into the
SDS-PAGE gel unit and polymerized. For Ks-Kin only 12.5 % separating gels were
used, while for Ks-Amt5 both 7.5 % and 12.5 % resolving gels were used for
phosphorylation assays and analysis of protein purification, respectively. Prior to
loading, the samples were mixed with 5 µl 5X loading buffer (Table 11) and injected
to the gel. In parallel to the samples, 5-7 µl of molecular weight marker was loaded
as a reference to evaluate the size of the resulting protein bands. Generally,
Unstained Protein Ladder (Fermentas/Thermo Fisher Scientific, Waltham, USA) was
used as a marker, although, for SDS gels analyzed by Western blotting, PageRulerTM
Plus Prestained Protein Ladder was used. The SDS ran in a running buffer bath
(Table 11) at a constant current of 45 mA per gel and a voltage of 300 V for
approximately 1 hour. For the visualization of protein bands, SDS gels were
incubated with freshly made Coomassie staining solution (4.2.3.7).
4.2.3.7 Coomasie Brilliant Blue (CBB) staining
Coomassie staining solutions consist of a mixture of two triphenylmethane
compounds, CBB G-250 and CBB R-250. These compounds exhibit unspecific
binding to cationic, hydrophobic and non-polar amino acids, resulting in a protein-
dye complex with an intense blue color that can be visually detected. The Coomassie
staining is commonly used in analytical biochemistry as a staining method for
protein bands on gels after SDS-PAGE electrophoresis (Fazekas de St Groth et al.,
1963; Meyer & Lamberts, 1965).
Table 12: Composition of the Coomassie solutions.
Staining solution Destaining solution 10 % (v/v) Ethanol 10 % (v/v) Ethanol
5 % (v/v) Acetic acid 0.002 % (v/v) CBB (G-250/R-250 4:1)

Materials and Methods
Camila Hernández
64
After separating the protein samples by SDS-PAGE electrophoresis, gels were
incubated in 50 ml of Coomassie staining solution (Table 12) by continuous shaking
until the molecular weight marker bands appeared. In order to reduce the
background, gels were incubated overnight in 50 ml destaining solution (Table 12),
scanned and documented.
4.2.3.8 Phosphorylation assay
The method used to analyze histidine phosphorylation was based on Marina et al.
(2001). The method is based on the autophosphorylation reaction that occurs when
the kinase protein in question is incubated with ATP. In this reaction, the kinase
covalently incorporates a phosphate group (PO4-) from the ATP to an amino acid
with a free hydroxyl group (in the case of Ks-Amt5, a histidine residue), resulting in
phosphorylated protein and ADP. In order to visualize the autophosphorylation
reaction, radiolabeled ATP-[-32P] (PerkinElmer, Rodgau, Germany) was used. The
isotope phosphorous-32 is widely used in life sciences to label biological molecules,
such as nucleic acids and phosphoproteins. It has a high emission energy (1.7 MeV),
which confers high sensitivity and a half-life of 14.2 days. The beta radiation emitted
by this isotope can be easily detected by liquid scintillation counting or by digital
autoradiography (phosphorimaging).
In this work, phosphorylated protein bands on SDS-PAGE gels were detected by
digital autoradiography. With this technique, radioactive samples (in a gel, filter
paper, or blotting membrane) are exposed to an image plate that contains a thin
layer of a phosphorescent material composed by crystals of barium fluorobromide
and bivalent europium as luminescence center (BaFBr:Eu2+) and protected by a
moisture-proof coating. The ionizing radiation emitted by the samples is absorbed
and stored by the BaFBr:Eu2+ crystals. Throughout the process, the bivalent cation
Eu2+ is oxidized to Eu3+ and the released electron is then trapped in the BaFBr
crystal lattice. After exposure, the image plate is scanned in an imaging system that
uses a helium-neon laser to release the trapped electron from the image plate, thus

Materials and Methods
Camila Hernández
65
reducing Eu3+ to Eu2+. The stored energy is re-emitted in the form of blue light,
which is detected by a photomultiplier. The intensity of the blue light is proportional
to the amount of radioactivity in the sample; thus, the data is stored as a digital
image that contains the locations and intensities of the radioactivity in the samples.
Furthermore, the resulting digital image can be analyzed by image analysis
software, which allows the quantification of signal intensity differences.
Samples of Ks-Amt5 and Ks-Kin were incubated with radioactive ATP-[-32P] (10-50
µCi at >5000 Ci/mmol specific activity) (PerkinElmer, Rodgau, Germany) for 1 h at
30˚C. The working buffer was composed of 20 mM Tris-HCl pH 8.0, 100 mM NaCl, 50
mM MgCl2, and 50 mM MnCl2; in the case of Ks-Amt5 10 % of glycerol was also
added. Additionally, the effect of different concentrations of non-radioactive ATP,
magnesium chloride, manganese chloride or ammonium chloride as well as times of
reactions were evaluated. The standard mixtures for the phosphorylation reaction
are shown in Table 13.
Table 13: Standard phosphorylation reaction mixtures.
For Ks-Amt5 For Ks-Kin 10 µl ATP-[-32P] (250 µCi) 2 µl ATP-[-32P] (250 µCi)
2 µl Non-radioactive ATP (10 mM) 2 µl Non-radioactive ATP (10 mM) 30 µM Ks-Amt5 10 µM Ks-Kin 1-5 µl NH4Cl (10 mM – 2 M)
Reactions were prepared to a 20 µl final volume Initial stock concentrations are bracketed
After the reaction, the samples were mixed with 7 µl SDS-PAGE sample buffer and
loaded into an SDS gel and subjected to SDS-PAGE (4.2.3.6), with a separating gel of
7.5% for Ks-Amt5 and 12.5% for Ks-Kin. Subsequently, the gels were fixed with a
solution of 40% methanol and 20% acetic acid for 5-10 min and were dried in a
BioRad Gel Dryer (BioRad,) for 45-60 min. Bands of phosphorylated protein were
detected by digital autoradiography with a StormTM imager system (GE healthcare,
Munich, Germany) and documented.

Materials and Methods
Camila Hernández
66
All radioactive experiments were carried out in the Department of Prof. Dr. Nikolaus
Pfanner at the Institute of Biochemistry and Molecular Biology, University of
Freiburg.
4.2.3.9 Western blot
The Western blot (Burnette, 1981) or protein immunoblotting is a common and
highly specific analytical technique used to identify or localize specific proteins from
a mixture sample by the use of antibodies. The protein sample is first separated by
SDS-PAGE electrophoresis. Afterwards, the protein bands can be transferred from
the gel onto a membrane made of nitrocellulose or polyvinyliden difluoride (PVDF),
in order to detect the target protein specifically (Renart et al., 1979; Towbin et al.,
1979). The transfer can be achieved by capillarity action, bringing the protein
solution into the membrane or by applying an electric current, which drags the
protein to the membrane. After the transfer is completed, the membrane is blocked
with a protein-rich solution such as BSA, casein or milk to saturate the free binding
spaces on the membrane and to avoid unspecific interactions of the antibodies.
Detection is carried out by exposing the membrane to antibodies that specifically
recognize and bind to the target protein, either by a specific motive or by an affinity
tag within the protein. A first antibody binds directly and specifically to the target
protein. A secondary antibody, linked to a reporter enzyme carrying alkaline
phosphatase or peroxidase activity, binds to the antigenic primary antibody. Once
the secondary antibody is bound, the reporter enzyme can convert a substrate
soluble dye into an insoluble dye that precipitates onto the membrane so that the
bands, which contain the protein target, can be stained.
This technique was used to identify His-tagged proteins (Ks-Amt5 and Ks-Kin) by
the use of a tetra-his antibody (as a primary antibody) and an alkaline phosphatase
conjugated antibody (as a secondary antibody). For the detection of the protein
bands, the substrates for the alkaline phosphatase conjugated antibody, 5-Bromo-4-
Chloro-3-indolyl phosphate (BCIP) and Nitro-blue tetrazodium (NBT) were used as

Materials and Methods
Camila Hernández
67
staining reagents. The results were documented by scanning the stained
membranes. Tables 14 and 15 show the solutions used.
The following protocol for blotting was used. The starting point of the blotting
protocol is the activation of the PDVF membrane by incubation in methanol for 5
min. Both the gel, after SDS-PAGE (4.2.3.6), and the PDVF membrane were
equilibrated with transfer buffer by incubating them separately twice for 5 min.
The equilibrated gel and PDVF membrane were placed into a wet blotting system
(miniVE System Blot Module, GE Healthcare) filled with transfer buffer.
Electroblotting was carried out at 25 V for 1.5-2 h. Once the transfer was completed,
the membrane was incubated with blocking buffer for 1 h by continuous shaking.
After the blocking step, the membrane was rinsed 3 times with TBS T/T buffer and
incubated with the primary antibody (mouse anti-4His antibody 1:2000 in blocking
buffer) over night at 4˚C. In a subsequent washing step, the membrane was rinsed 3
times with TBS T/T buffer, incubated with blocking buffer for 5 min during
continuous shaking, and rinsed again 3 times with TBS T/T. These steps were
repeated after 1 hour incubation with the secondary antibody (goat anti-mouse
Alkaline Phosphatase conjugated antibody 1:10000 in blocking buffer). Detection
Table 14: Compositions of the Western blot buffers.
Transfer buffer TBS Tween/Triton buffer (TBS T/T) Blocking buffer 25 mM Tris-HCl pH 7.5 20 mM Tris-HCl pH 7.5 5% (w/v) dry skim milk
in TBS T/T buffer 192 mM Glycine 0.5 M NaCl
0.1% (w/v) SDS 0.05% (v/v) Tween 20
20% (v/v) Methanol 0.1% (v/v) Triton X-100
Table 15: Compositions of the Western blot staining solutions.
Staining buffer Staining solution (per PDVF membrane)
100 mM Tris-HCl pH 9.5 10 ml Staining buffer
100 mM NaCl 33 µl BCiP (5% BCiP in 100% dimethylformamide)
5mM MgCl2 66 µl NBT (5% NBT in 70% dimethylformamide)

Materials and Methods
Camila Hernández
68
was performed by incubation of the PBDF membrane in staining solution until the
protein bands or a faint background appeared. To stop the reaction, the membrane
was immediately rinsed with ddH2O to avoid further overexposure to reagents.
4.2.3.10 Blue Native PAGE (BN-PAGE)
Similar to the SDS-PAGE, the BN-PAGE is based on a polymerized acrylamide matrix
that separates proteins according to their molecular size. However, BN-PAGE does
not denature the protein sample, but uses instead the Coomassie Brilliant Blue dye
to provide the negative charges to the protein complexes to allow separation by
electrophoresis (Scha gger & von Jagow, 1991; Wittig et al., 2006). Therefore, this
technique can be used to isolate protein complexes, identify protein-protein
interactions and to determine native protein size and oligomeric states.
In this work, BN-PAGE was used to confirm the SEC results regarding the molecular
size and oligomeric state of the Ks-Amt5 protein. The protocol used was made from
a combination of two different protocols ( o gtle et al., 2010; Wittig et al., 2006) and
was adapted to the Hoefer miniVE vertical electrophoresis system (GE Healthcare,
Fairfield, USA).
Samples of Ks-Amt5 (8µl of 5-20µg protein + 2µl 5X loading dye, Table 16) were
loaded onto a 9% (v/v) acrylamide separating gel cast with a 4% (v/v) acrylamide
stacking gel (gel compositions in Table 17). Native Mark (Invitrogen, Carlsbad, USA)
and the HMW Native Marker (GE Healthcare, Fairfield, USA) were used as molecular
weight standards. BN-PAGE was carried out at 4 ˚C (buffers in Table 18). The gel
was run at 100 V for the first 15 min and at 15 mA for 2-4 hours. After
electrophoresis, the gel was fixed and destained overnight in fixing solution (Table
19). Finally, the gel was stained using the CBB protocol for SDS-PAGE (4.2.3.7).
Table 16: Composition of the gel buffer and loading dye for BN-PAGE.
3X gel buffer (pH 7.0) Loading dye 150 mM Bis-Tris/HCl 0.05% (w/v) Ponceau S 220 mM -Amino n-caproic acid 25% (w/v) Glycerol

Materials and Methods
Camila Hernández
69
Table 17: Composition of the BN-PAGE gels (initial stocks concentrations are bracketed).
Stacking gel (4%) Separating gel (9%) 0.4 ml 30 % acrylamide with 8% (w/v) bis-
acrylamide 2.7 ml 30 % acrylamide with 8% (w/v) bis-
acrylamide 1 ml 3X gel buffer 3 ml 3X gel buffer
1.6 ml ddH2O to a final vol. 3ml 1.8 ml Glycerol 100% (v/v) 20 µl APS (10% w/v) 1.5 ml ddH2O to a final vol. 9ml
2 µl TEMED 30 µl APS (10% w/v) 3 µl TEMED
Table 19: Composition of the Fixing solution for BN-PAGE.
4.2.3.11 Isothermal titration calorimetry
Isothermal tritation calorimetry (ITC) is a thermodynamic technique used to
measure biomolecular interactions, such as protein-protein or protein-ligand
interactions (Pierce et al., 1999). ITC can directly measure the heat released and
absorbed due to a binding event. This allows the determination of binding
parameters such as binding affinity constant (Ka), reaction stoichiometry (n),
enthalpy changes (H) and entropy changes (S). Thereafter, Gibbs energy changes
(G) can be calculated according to the following relation:
Table 18: Buffer compositions for BN-PAGE.
Cathode buffer (10X) pH 7.0 (upper buffer) Anode buffer (10X) (lower buffer) 500 mM Tricine 500 mM Bis-Tris/HCl pH 7.0 150 mM Bis-Tris/HCl
0.2% (w/v) Coomassie G250
Fixing solution 50% (v/v) Methanol 10% (v/v) Acetic acid
100 mM Ammonium acetate

Materials and Methods
Camila Hernández
70
As a result, an ITC experiment provides thermodynamic information on molecular
interactions that are useful in elucidating function and mechanisms of complex
formation or protein-ligand binding.
In an ITC experiment, a solution of one type of biomolecule (ligand) is titrated into a
second solution of a different biomolecule (binding partner) at a precise and
constant temperature. If the macromolecules interact, the heat (H) that is absorbed
or released is measured over time. H stands in a direct relation to the grade of
binding. When the system reaches saturation, the heat signal decreases until the
background heat of dilution is observed. Consequently, a binding curve is obtained
from the measured heat of every injection against the ratio of ligand and binding
partner. Subsequently, upon analysis of the binding curve with an appropriate
binding model, the thermodynamic parameters mentioned above can be
determined. Figure 17 shows a schematic representation of an ITC instrument.
For an ITC experiment, the precision of the initial concentrations of ligand and
binding partner are important; therefore, they have to be determined with a high
accuracy. Other parameters that need to be considered before running an ITC
experiment are the injection number and volume. A unitless value c (Wiseman et al.,
1989) can be used to choose the optimal conditions for the experiment. This c value
is the product of the binding constant Ka, the initial concentration of the
macromolecule M, and the stoichiometry of the reaction, n:
The value of c defines the shape of the binding isotherm. High c values prevent the
determination of the binding constant Ka due to the fact that it would indicate a very
sudden transition between the no saturation state and the saturation state. As a
result, only a few points define the expected binding curve that would in fact exhibit
a rectangular shape. On the other hand, at low c values (c ≤ 0.1) the isotherm loses
the characteristic sigmoidal shape and reaches linearity due to the wide transitions

Materials and Methods
Camila Hernández
71
between the turning points. Hence, the determination of the binding constant and
the enthalpy changes becomes inaccurate. Nevertheless, the c value can be changed
by modifying the concentration of the titrant solution. For an optimal determination
of the binding constant, the c value should be between 1 and 1000 (Wiseman et al.,
1989).
Figure 17: Scheme of the VP-ITC device (GE Healthcare). The protein solution is loaded into the
sample cell while the ligand or titrant is loaded into the syringe. During titration, the syringe rotates
in place to stir the solution and the plunger (computer-controlled) injects precise volumes of ligand.
The reference cell is kept at a constant temperature. Temperature differences between the reference
cell and the sample cell (T1) are measured during the experiment and a feedback power (or
differential power) is applied to maintain both cells at the same temperature. For that, a second
temperature difference (T2) between the cells and the inner shield (adiabatic jacket) is measured.

Materials and Methods
Camila Hernández
72
Moreover, the selection of buffers is also important in an ITC experiment. In a
complex formation, protons can be caught or liberated, thus an equivalent number
of protons will be also caught or liberated by the buffer. In order to determine
accurately the enthalpy changes due to the molecular interaction, both ligand and
binding partner solution should be prepared in the same buffer to reduce errors
deriving from dissimilar buffer components.
Additionally, the number, volume and time length of the injections are important
parameters for the quality of the data. They define the baseline region for the
determination of the enthalpy of binding and the equivalence region given by the
concentration range to determine the binding constant. Therefore, it is also
important that the concentration range selected allows an equilibrium between
measurable amounts of free and bound ligand within the titration zone, which is
defined by the titrant injections.
4.2.3.11.1 ITC experiments with Ks-Kin
In order to determine the binding parameters for Ks-Kin all ITC experiments were
performed at 20 ˚C using the P-ITC microcalorimeter (GE Healthcare, Munich,
Germany). The protein (Ks-Kin) and ligands (ATP, ATPS, ADP, GTP) were prepared
in working buffer containing 50 mM Tris-HCl pH 8.0, 100 mM NaCl and 1 mM MgCl2.
The protein concentration used was 100 µM with a ligand stock initial concentration
of 1.3 mM. Before measuring, all solutions were degassed and brought to working
temperature. Additionally, the sample cell and the injection syringe were cleaned
with water and equilibrated with working buffer. For all experiments, 1.4 ml of
protein solution was filled into the sample cell avoiding the formation of air bubbles
and the ligand solution was loaded into the injection syringe (282 µl).
Titrations were run with 21 injections, a first injection of 2 µl and the remaining
twenty of 14 µl each. The data point given by the first injection was removed from
the resulting data before the curve-fitting. The initial injection is generally inexact

Materials and Methods
Camila Hernández
73
due to the interval of time that the injection syringe is in the cell during temperature
equilibration. The blank or reference titrations were performed under the same
conditions, however without protein in the sample cell. The resulted heat of dilution
was subtracted from the experimental data during data evaluation.
All obtained data were processed with the program Origin 7.0 using one set of
binding site model to fit the data and the standard Levenberg-Marquardt algorithm
(Levenberg, 1944; Marquardt, 1963).
4.3 Protein crystallography
4.3.1 Crystallization
The determination of three-dimensional protein structures by X-ray diffraction
experiments requires well-ordered crystals of the protein of interest. Crystallization
is a thermodynamically favored process, in which molecules in solution form a
three-dimensional solid block with high long-range order: crystals. The process of
crystal formation is driven by the loss of the ordered hydration shell from the
protein molecules, which leads to a gain of entropy in the system.
Several techniques exist to promote protein crystallization. Vapor diffusion is the
most common and widely used method to obtain protein crystals (McPherson,
1982). In this method, the protein solution is lead to supersaturation by the
equilibration of a drop containing a mixture of protein and a precipitant solution
through a gas phase against the reservoir solution in a closed environment (Figure
18A). Equilibrium between the drop and the reservoir is reached by the gradual
evaporation of water in the droplet. This leads to an increase in the concentration of
protein and precipitant. If the supersaturation of the sample is too high, the
precipitation phase is reached, resulting in aggregates of the protein sample in the
drop. Ideally, the protein solution should reach a nucleation state during the
supersaturation process while the precipitant concentration increases to a suitable

Materials and Methods
Camila Hernández
74
level to allow the formation of crystalline nuclei and therefore crystallization. The
nucleation state is required for crystal growth (Figure 18B).
Figure 18: Protein crystallization technique and phase diagram. A. Schematic representation of
the sitting-drop vapor diffusion method. In a closed environment, a drop containing a mixture of
protein and reservoir (precipitant) solution equilibrates through the evaporation of water from the
drop, with a reservoir solution. In this process, the concentration of protein and precipitant increase
until equilibrium is reached. Under optimal conditions protein crystallization can occur. B. Protein
crystallization phase diagram. Nucleation in the supersaturation zone is essential for crystal
formation (grey). Crystal growth occurs after the formation of the nuclei (dark blue). Under
unsaturated (white) or precipitation (light blue) phases the crystallization process cannot occur.
4.3.2 Crystallization of Ks-Amt5
For all crystallization trials, the sitting drop vapor diffusion technique was used.
Crystallization experiments were performed manually or using the OryxNano
Protein Crystallization Robot (Douglas Instruments, East Garston, UK). Generally,
0.3-1 µl of protein solution with concentrations from 4-20 mg/ml were mixed with
0.3-1 µl of reservoir solution (50-300µl). Commercially available screens from

Materials and Methods
Camila Hernández
75
different companies (Hampton research, Aliso Viejo, USA; Jena Biosciences, Jena,
Germany) as well as laboratory-made screens Membrane screen (Stura, 1999),
Footprint I-III (Stura et al., 1992, Stura et al., 1994) were used for initial sparse
matrix sampling. As crystallization plates, 96-well sitting drop Intelli-plates (Art
Robbins Instruments, Sunnyvale, USA) and 24-well sitting drop Cryschem 24-1 SBS
plates (Hampton Research, Aliso Viejo, USA) were used. After the setup, the sealed
crystallization plates were stored at a constant temperature (4 ˚C, 20 ˚C, 25 ˚C, 30 ˚C
or 37 ˚C). The crystallization process was followed by observation via microscope at
regular time intervals and documented.
4.3.3 Finescreens
As initial crystals appeared, optimization of the initial condition was achieved by
varying parameters such as protein concentration, pH, buffer type, salt or
precipitant concentration. Additionally, different drop sizes and protein-reservoir
ratios were tested. These optimization screens, finescreens, were carried out to
improve size and quality of the crystals and were usually designed for 24-well
sitting drop Cryschem 24‐1 SBS plates (Hampton esearch, Aliso iejo, USA).
Co-crystallization experiments were also performed with ATP and non-hydrolyzable
ATP analogues, such as AppCp, ATPS or ATPS, by adding these solutions directly
to the protein-reservoir drop or by incubation of the protein with these solutions to
a final concentration from 0.1-2 mM. In addition to the co-crystallization
experiments, already obtained crystals of Ks-Amt5 were immersed for different
incubation times (1-5 min) to a mixture of the corresponding reservoir solution and
ATP or non-hydrolyzable ATP analogues to a final concentration of 1 mM.
Soaking experiments with Ks-Amt5 crystals were also performed with heavy atoms
solutions. For this 0.2 µl of the heavy atom solution was added to a crystallization
drop where crystals were observed. The crystallization plates were further sealed
and incubated at a constant temperature (20 ˚C) for 24 to 48 hours. Crystals in these
conditions were tested for MAD experiments.

Materials and Methods
Camila Hernández
76
4.3.4 Structure determination by X-ray crystallography
The determination of protein structures on an atomic level requires a high-
resolution technique that can analyze atomic distances between single atoms, such
as, C, H, N, O, S covalent bonds in the range of 1.0-1.8 Å, or more precisely carbon-
carbon -bonds (1.54 Å). X-rays are a type of electromagnetic radiation with a
wavelength range between 0.1-100 Å. This wavelength interval lies within the
proper spectral range to resolve macromolecular structures. However, it is of
relevance that the intensity of diffraction by a single protein molecule is too low to
be detected. Therefore, for protein structure determination by X-ray diffraction
experiments crystals are needed. The molecules forming crystals are highly ordered
in a regular lattice, this three-dimensional arrangement produces an enhanced
diffraction by means of a constructive interference of the diffracted photons whose
intensities can be then detectable and measured in an X-ray detection setup.
4.3.5 Crystal arrangement
Crystals are three-dimensional blocks of regular repeats of molecules. This regular
and systematic order of atoms is defined as a crystal lattice. The smallest repeating
component of a crystal that forms the whole lattice by translation is the unit cell. It
describes the arrangement of atoms in the crystal by its lattice parameters that
consist of the lengths of the cell edges (constants: a, b, c) and the angles between
them (, , ). The most basic structural element of the unit cell is the asymmetric
unit, which can be rotated and translated to form the whole content of the unit cell
using crystallographic symmetry operators.
The geometry and symmetry of the unit cell defines the space group of the crystal.
For chiral molecules such as proteins, only 65 enantiomorphic space groups are
suitable. These space groups are distributed in seven crystal systems: triclinic,
monoclinic, tetragonal, trigonal, hexagonal and cubic. The correct identification of
the space group is essential for the interpretation of the diffraction data obtained by

Materials and Methods
Camila Hernández
77
X-ray diffraction experiments and, therefore, for the determination of the protein
crystal structure.
4.3.6 X-ray diffraction by protein crystals
X-rays described as electromagnetic waves, interact with the atoms in a crystal,
especially with the atom’s electrons. This interaction causes the scattering of the X-
ray waves. In case of X-ray beams, incoherent and coherent scattering occurs.
Incoherent scattering happens if an electron interacts with its atom producing
transitions that result in emission of photons of lower energy which eventually
leads to radiation damage. Under coherent scattering, an X-ray photon induces the
oscillation of an atom’s electron with the same frequency as the incident radiation
leading the electron to emit radiation in a random direction but with the same
frequency as the incident X-ray beam. The re-emitted waves can experience a
physical phenomenon called interference. When single scattered X-ray waves have a
phase shift of 180˚, they subtract from each other causing destructive interference.
However, when the scattered waves have the same phase, they can overlap adding
to each other and producing constructive interference. The constructive
interferences produce a diffraction pattern that is fulfilled by the correct orientation
and corresponding positions of all electrons in the unit cells. Further, the diffracted
X-rays on the real crystal lattice create another three-dimensional lattice of
diffraction maxima with inverse geometric properties called a reciprocal lattice
(Figure 19A).
The diffraction of electrons in a crystal lattice that undergo constructive
interference is known as Bragg diffraction and it follows the condition given by the
Bragg’s Law (Bragg, 1913) (Figure 19B):

Materials and Methods
Camila Hernández
78
Where n is an integer, λ is the wavelength of the incident X-ray beam, d is the
distance between the scattering lattice planes identified by the Miller indices h, k, l
and θ is the angle of the incident wave with respect to the lattice plane. Thus, the
specific directions identified by Bragg’s Law appearing as spots on a diffraction
pattern are called reflections.
Figure 19: Reciprocal lattice planes and Bragg’s law. A. Lattice planes that divide the unit cell
sides into a number of integer fractions allow constructive interference of diffracted waves. The
number of fractions is used to index the planes. In the representation above, the set of planes have
the Miller indices (4 2 3) B. Graphic representation of the Bragg’s law. Two waves reflected by two
adjacent and parallel lattice planes with distance d have a difference in path length of 2dsin.
Constructive interference occurs when this difference in path length is an integer n multiple of the
wavelength used: 2d sin = n.
A geometric tool that demonstrates the relation between the wave vector of the
incident and diffracted X-ray beams, the diffraction angle for a given reflection and
the reciprocal lattice of the crystal, according to Bragg’s law is known as the Ewald
sphere and it is used in X-ray crystallography to construct the reciprocal lattice
points (Ewald, 1969).
The Ewald sphere (Figure 20) is constructed with a radius of 1/λ that passes
through the origin O of the reciprocal lattice considering the crystal in its centre.
The origin of the reciprocal lattice (0,0,0) lies in the transmitted beam at the edge of

Materials and Methods
Camila Hernández
79
the sphere and opposite to the point S0 where the incident beam enters the sphere.
Thus, the Ewald sphere represents in reciprocal space, all the possible points where
reflections satisfy Bragg’s law.
Figure 20: The Ewald sphere. In reciprocal space, a crystal (C) (orange) is placed in the center of
the Ewald sphere, in this two-dimensional representation, a circle, with a radius of 1/. The entrance
of an incident beam (blue arrows) S0 is opposite to the origin of the reciprocal lattice O. For a given
orientation of the crystal and the corresponding reciprocal lattice (blue points), diffraction
conditions will be satisfied by the reciprocal lattice points that intersect the Ewald sphere (purple
points). The rotation of the crystal and thus the rotation of the reciprocal lattice will lead to the
intersection of different reciprocal lattice points with the Ewald sphere and therefore more
diffraction spots.
The rotation of the crystal implies the rotation of the reciprocal lattice. Therefore, by
every rotation, different reciprocal lattice points intersect the sphere giving a
detectable reflection that represents one lattice plane (h, k, l). These diffraction
spots can be then recorded on an X-ray detector.

Materials and Methods
Camila Hernández
80
The measurement of the position and intensity of every diffraction spot or reflection
(h,k,l) gives the primary knowledge of an X-ray data collection experiment. This
information is then used to infer the geometry of the crystal, the content and
dimensions of the unit cell and the space group.
4.3.7 The electron density function
The result of a crystallographic experiment is a map of the distribution of electrons
in a molecule, an electron density map. Electrons are generally tightly localized
around the nuclei of the atoms; therefore, an electron density map gives a good
picture of the molecule structure.
The scattering amplitude of the X-ray waves by an isolated atom is measured by the
atomic form factor, or atomic scattering factor. Due to the different number of
electrons present in distinct atoms, the atomic scattering factor increases with the
atomic number, Z, of the atoms in a molecule and thus varies for each element of the
periodic table. Assuming a spherically symmetric distribution of the electron shell,
the atomic scattering factor (f0) is defined as:
The atomic scattering factor is independent on the direction of the incident beam.
However, the phase difference for photons diffracted at different positions in the
electron shell increases with the diffraction angle that is directly coupled via
Bragg’s law to the resolution. Hence, at higher diffraction angles the increase in the
phase difference due to the atoms size will lead to destructive interference, thus,
limiting the diffraction power.
Another attenuation of the X-ray scattering with the increase of the angle is caused
by the thermal motion of the atoms. The factor that describes these attenuations is
referred as the Debye-Waller temperature factor or B-factor. This factor is
incorporated to the atomic scattering factor as an additional exponential term:

Materials and Methods
Camila Hernández
81
For protein structures, the B-factors can be interpreted as indicators of the
flexibility of different parts of the structure, hence, atoms with low B-factors belong
to the well-ordered parts and atoms with high B-factors exhibit a higher vibrational
motion thus belonging to the flexible parts of the structure.
Every atom in the unit cell contributes to every single reflection (h,k,l) according to
its chemical properties and to its relative position. Therefore, the scattering of all
atoms in the asymmetric unit is the sum of all atomic scattering factors (fj). Thus this
summation is a function of all atoms in the unit cell, known as the structure
factor Fhkl:
Further, the structure factor Fhkl is a wave function that can be divided into two
parts, the amplitude |Fhkl| and the phase angle ei(hkl).
The reciprocal lattice is a Fourier transform and a sum of the structure factors
representing the electron distribution in the crystal. Thus, by means of an inverse
Fourier transformation the electron density function ρ(x,y,z) can be determined for
every point (x,y,z) in real space:
The electron density function is then formed by the sum of all reflection amplitudes
and phases. However in an X-ray experiment, only the intensity of the reflections

Materials and Methods
Camila Hernández
82
can be measured. The intensity for every reflection (h,k,l) is proportional to the
square of the amplitudes:
The structure factor amplitudes can be derived from the intensities measured as
indicated. However, the information regarding the phase angle is lost during the X-
ray experiment. As a result, without the correct phase angles, the electron density
function cannot be directly estimated. This issue is referred to as the “phase
problem” of crystallography.
Nevertheless, different experimental methods have been developed to indirectly
obtain the phase information for macromolecules: molecular replacement (MR)
(Rossmann & Blow, 1962; Huber, 1965); single/multiple isomorphous replacement
(SIR/MIR) (Green et al., 1954; Perutz, 1956); single/multiple anomalous dispersion
(SAD/MAD) (Hendrickson et al., 1988; Dauter et al., 2002; Dodson, 2003);
combination of isomorphous replacement and anomalous dispersion:
single/multiple isomorphous replacement with anomalous scattering
(SIRAS/MIRAS); radiation induced phasing (RIP) (Banumathi et al., 2004) and direct
methods. In this study, the phase information for the Ks-Amt5 structural model was
obtained by MR.
4.3.8 Molecular replacement
Molecular replacement is one of the techniques used for the determination of
protein structures and frequently applied to the solution of the phase problem. It
requires a previously solved homologous structural model, from which the phases
can be derived. This phase information is then used as the initial phases for the
unknown protein structure (Rossmann & Blow, 1962).
The method relies on the fact that proteins sharing a high degree of sequence
homologies will have a similar structure. Therefore, it is very important that the

Materials and Methods
Camila Hernández
83
sequence identity between the phasing model and the target is high. By rule of
thumb, the amino acid sequences must be at least 25% identical and the r.m.s
deviation of the C-carbons less than 2 Å (Taylor, 2003).
In order to obtain the phase information, the search model must be correctly
oriented and positioned into the unit cell from the target crystal in such a way that
the resulting theoretical diffraction pattern is equivalent to the experimental
pattern. For this purpose, the molecular replacement process is divided into two
steps: a rotational search and a translational search. During these steps and for each
molecule, six parameters that describe how the search model is placed into the unit
cell of the target model are calculated: three rotational to indicate orientation and
three translational to indicate position. For both search and target models a
Patterson map is calculated. If the sequence identity shared by these models is high
enough, the Patterson maps will look similar and therefore correlate upon the
orientation and position of the molecules within the unit cell (Fujinaga & Read,
1987).
The Patterson maps are based on the Patterson function (Patterson, 1934), which is
similar to the electron density function (4.3.7). However, it uses the square of the
absolute value of the structure factor |Fhkl|2, thus the intensities that are measured
for every single reflection (4.3.7). Consequently, no phase information is required to
obtain the Patterson function:
The Patterson map is a vector map that contains information about the structure as
a sum of all interatomic distance vectors (intramolecular and intermolecular), which
indicate length and direction but not the location of the atoms. This fact is important
for the rotation function (RFn) (Rossmann & Blow, 1962) that relies on the precise
relative position of the atoms within the molecule indicated by the intramolecular
vectors, which depend only on molecular rotation.

Materials and Methods
Camila Hernández
84
The rotation function (RFn) is the product of the observed crystal Patterson
(Pobserved (u)) and the rotated model Patterson (Pmodel (R,u)) integrated over all
points u in the Patterson space within a sphere of radius rmax centered on the origin
and excluding the origin peak out to a radius rmin. The highest values for RFn are
obtained when the crystal Patterson and the rotated model Patterson coincide,
giving then the correct spatial orientation (Evans & McCoy, 2008).
Once the correct orientation of the model is obtained, the translational search by
means of a translation function estimates the correct position of the model in space.
The translation function correlates the observed intensities and the Patterson cross-
vectors of the symmetry-related molecules of the model upon movement in the unit
cell. When the correct position is found, the peak values of the translation function
correspond to the translation vectors between the symmetry-related molecules.
According to the RFn described above, which matches the intramolecular vectors in
the Patterson map, the translation function finds the best equivalent intermolecular
vectors dependent on the correct molecular position as well as the correct
orientation (Crowther & Blow, 1967).
There are different forms of translation function, the standard Patterson based T-
function (showed above) measures the similarity between the observed and
calculated Pattersons over the entire asymmetric unit. Another variant of this
function subtracts the known intramolecular vector component considering the
whole symmetry of the model. A conceptually simpler method compares the R-
factor and the correlation coefficient of Fobs and Fcalc at every point of the

Materials and Methods
Camila Hernández
85
translational search. In this case, the R-factor is used as a statistical measure to
compare the differences between the observed structure factor amplitudes |Fobs| of
the measured data, with the calculated structure factor amplitudes |Fcalc| for the
search model.
The purpose of this function is to minimize the difference between the structure
factor amplitudes thus decreasing the value of the R-factor. A lower value of the R-
factor indicates that a good solution was found; a perfect solution would give an R-
factor value of zero, however, experimentally a good solution generally gives R-
factor values around 0.3-0.4 (Rhodes, 2006).
Consequently, if the correct orientation and position of the search model are found,
the initial phases of the model can be calculated. This initial phase information
biased by the homologous structure model is then combined with the target
structure factor amplitudes obtained from the X-ray diffraction experiments in
order to calculate the electron density map.
4.3.9 Structure determination of Ks-Amt5
4.3.9.1 Cryo-cooling
It is commonly observed that protein crystals exhibit radiation damage when
exposed to X-rays leading to e.g. decay in the crystal diffraction. Radiation damage
occurs due to the production of water radicals that react with the protein destroying
the crystal lattice. In order to avoid this, protein crystals are usually flash-frozen in
liquid nitrogen and then exposed to X-rays by cooling them at 100 K with a constant
flush of nitrogen gas during the measurement. However, the process of freezing can
lead to the formation of ice crystals that can mask the diffraction pattern of the
protein by the presence of ice rings. Thus, it is important to find a cryoprotectant

Materials and Methods
Camila Hernández
86
that preserves the physical state of the protein crystal, prevents the formation of ice
crystals and also ensures optimal data quality (Garman & Owen, 2006).
For Ks-Amt5 crystals, PEG 400 with a final concentration of 20% (v/v) was
successfully used as cryoprotectant.
4.3.9.2 Data collection and processing
Crystal diffraction was tested in-house at CuK-radiation of =1.5418 Å, using a
rotating copper anode (Micromax 007 HF, Rigaku, Tokyo, Japan) with a Saturn 944+
CCD-detector (Rigaku, Tokyo, Japan) or with a Mar345 image plate (Marresearch,
Norderstedt, Germany). In order to obtain higher resolution data, well-diffracting
crystals were stored and used for further data collection at a synchrotron.
iffraction data were collected with rotation angles of 0.5˚-1˚ per image for 360˚
using X-rays with 1.0 Å wavelength. Data was collected at the X06SA and X06DA
beamlines from the Swiss Light Source (Paul Scherrer Institute, Villingen,
Switzerland) using a Pilatus 6M or a MX-225 CCD detector, respectively.
The collected data sets were indexed and integrated using iMOSFLM (Leslie, 1992).
Additional symmetry elements were determined with POINTLESS (Evans, 2006).
Integrated data was scaled using SCALA (Evans, 2006) from the CCP4 software suite
(Collaborative Computational Project Number 4, 1994).
4.3.9.3 Structure solution
The structure of Ks-Amt5 was solved by molecular replacement. MR was performed
using the MOLREP program (Vangin & Teplyakov, 1997) of the CCP4 software suite
(Collaborative Computational Project Number 4, 1994). For the initial data set, the
initial models used were chosen according to sequence similarity: the Af-Amt1
protein model of A. fulgidus (Andrade et al., 2005) sharing a 34% sequence identity
with Ks-Amt5 for the membrane domain and the cytoplasmatic portion of the sensor
histidine kinase from T. maritima (Marina et al., 2005) (32% sequence identity) for

Materials and Methods
Camila Hernández
87
the cytoplasmatic domain. Both models were obtained from the protein data bank
under the PDB accession codes 2B2H and 2C2A, respectively.
The resulting refined structure of Ks-Amt5 was later used as model for further
molecular replacement in data sets at higher resolution.
4.3.9.4 Model building and refinement
The Ks-Amt5 structural model was built into the electron density map obtained after
rigid-body refinement with REFMAC5 (CCP4 software suite; Murshudov et al., 1997)
using the program COOT (Emsley & Cowtan, 2004; Emsley et al., 2010). Further, the
structural model was improved in cycles of alternate building and restrained
refinement with REFMAC5. The final model was validated with the program
PROCHECK (Laskowski et al., 1993).
4.4 Graphical representations
Illustrations of the protein structures were made using PyMOL (DeLano, 2002;
Schödinger LLC, 2009). Electrostatic surface potentials were calculated using
DELPHI (Honig and Nicholls, 1995; Rocchia et al., 2001) assuming standard charges
for amino acids. Sequence alignments were carried out with CLUSTALW (Thompson
et al., 2002) and plotted with CLC sequence viewer (CLC bio, 2005).

Results and discussion
Camila Hernández
88
5 Results and discussion
The increase in available genome sequences has facilitated the study of interesting
proteins involved in relevant processes in cells. Searches for amt sequences show
interesting and totally undescribed proteins with extramembraneous domains with
variable functions. In this work one of these proteins (Ks-Amt5) was chosen from
“Ca. Kuenenia stuttgartiensis”, an anammox bacteria member of an ecologically and
environmentally important group of microorganisms, which play a crucial role in
the removal of undesired ammonium from municipal and industrial waste water.
5.1 Sequence analysis of Ks-Amt5
Sequence analyses were carried out in order to gain insight into the amino acid
composition and to identify conserved residues and motifs described for Amt
proteins and histidine kinases. The sequence alignment of Ks-Amt5 was performed
with ClustalW2 (Larkin et al., 2007) and includes the Af-Amt1 and Ec-AmtB proteins
with known crystal structures and five other members of the Amt/Rh family chosen
from a BLAST search. Topology predictions were carried out with TMHMM
(Sonnhammer et al., 1998; Krogh et al., 2001) in order to identify secondary
structure features for the Amt domain of Ks-Amt5. Based on these results, the Amt
domain (residues M1-D412) of Ks-Amt5 presents eleven transmembrane helices
(Figure 21). In contrast to Ec-AmtB, the Ks-Amt5 sequence does not contain a
cleavable signal peptide and consequently the N-terminus of the protein forms part
of the first transmembrane helix that crosses the membrane. The conserved amino
acids presumably involved in the translocation of ammonium are located in
transmembrane helices 3, 4, 5, 6 and 10 of Ks-Amt5. In the predicted recruitment
site W144 (W137 in Af-Amt1) and S227 (S208) residues are present, as well as the

Results and discussion
Camila Hernández
89
F103 and F223 (F96 and F204) for the phenylalanine gate and the twin-his pair
H171 and H326 (H157 and H305) (Andrade et al., 2005) (Figure 21).
Figure 21: Multiple sequence alignment of the transmembrane domain of Ks-Amt5 with
Amt/Rh proteins. Ks: “Ca. Kuenenia stuttgartiensis”; Af: Archaeoglobus fulgidus; Ec: Echerichia coli;
At: Arabidopsis thaliana; Le: Lycopersicum esculentum; Ne: Nitrosomonas europaea. Transmembrane
helices, shown in blue (TM1-TM11), are indicated according to the Ks-Amt5 structure. Conserved
residues are shown in black. The orange boxes depict the highly conserved amino acids supposed to
be involved in the ammonium transport.

Results and discussion
Camila Hernández
90
The C-terminal domain (Ks-Kin) of Ks-Amt5, regarding residues F413 to K679,
exhibits a high similarity to various histidine kinases from the two-component
signal transduction pathway (Figure 13). In particular, it shares 32 % sequence
homology with the cytoplasmatic portion of a sensor histidine kinase with known
crystal structure, TM083 from the thermophile Thermotoga maritima, previously
described in section (3.4.3). The alignment result is clear with regards to the
presence of all characteristic motifs, H, N, F and G boxes in the DHp and CA domains
of histidine kinases and indicates H460 as the phosphorylation site.
In addition, secondary structure predictions were carried out using PSIPRED (Jones,
1999; Bryson et al., 2005) and the predicted topology was compared with the
secondary structure elements found for the TM083 structure. The results indicate
the presence of the conserved structural features for the DHp domain (alpha helix 1
from R415 to I480 and alpha helix 2 from K486 to E518) and CA domain (five -
strands and three -helices)(Figure 22).
Figure 22: Multiple sequence alignment of Ks-Amt5 cytoplasmic domain with other histidine
kinases. Ks: “Ca. Kuenenia stuttgartiensis”; TM: Thermotoga maritima; Ty: Thermodesulfovibrio
yellowstonii; Mb: Methanoccocoides burtonii; Mm: Methanosarcina mazei. Conserved amino acid
residues are shown in black. Secondary topology predictions for Ks-Amt5 are shown in orange (-
helices) and green (-sheets). The histidine kinase characteristic motifs are marked in blue boxes and
the phosphorylation site (H469) is highlighted in blue. The sequence alignment was truncated
according to the sequence of Ks-Amt5.

Results and discussion
Camila Hernández
91
Interestingly, Ks-Amt5 is a previously undescribed and entirely new member of the
Amt family containing a histidine kinase extra-membrane domain with about 30
kDa (residues F413-K679) and a typical Amt transmembrane domain with eleven
transmembrane helices (residues M1-A408). From the sequence analysis and
topology predictions it is evident that the structure of the Amt domain of Ks-Amt5
resembles the structure of other Amt proteins like Ec-AmtB and Af-Amt1. Due to the
presence of the conserved residues W144 and S227 suggested to form the
recruitment site for ammonium as well as other residues involved in the transport
mechanism, it seems likely that Ks-Amt5 can bind and translocate ammonium across
the membrane besides the histidine kinase activity as a signal-transduction protein.
5.2 Cloning and mutagenesis of Ks-Amt5
All constructs used in this work were cloned via NdeI and XhoI restriction sites into
pET21a and pET28a or pET15dT vectors. To produce the full-length protein (Ks-
Amt5) containing both the Amt domain (Amtdom) and the histidine kinase domain,
the complete amt5 gene (2036 bp) was cloned into the pET21a vector. Shorter
constructs were also designed for the production of the histidine kinase protein
(residues F413-K679) in the absence of the integral membrane domain and vice
versa (Amtdom, residues M1-D412). For this, the amt5 gene was truncated in the
region encoding for the amino acids D412-F413 using PCR with appropriate primers
and inserted into the respective plasmids (pET21a, pET28a, pET15dT).
A shorter version of the Ks-Kin construct (Ks-KinS) was also designed. For this
purpose, 26 amino acids at the N-terminal part of the protein were cut resulting in
the construct M439-K679 (Figure 23). Using site-directed mutagenesis a new NdeI
restriction site was inserted into the pET28a::kin at a position that encodes for
M439. Upon restriction digestion with NdeI and XhoI the truncated version of the kin
gene was subsequently isolated and ligated into the pET21a vector.

Results and discussion
Camila Hernández
92
For functional studies, variants of Ks-Kin were designed and obtained by site-
directed mutagenesis experiments in the original constructs. For pET15dT::kin, the
histidine residue H460 identified as the phosphorylation site was mutated to a non-
polar amino acid, alanine, in order to create a variant that would function as a non-
functional blank in phosphorylation experiments. Another variant for pET15dT::kin
resulted from a double mutation (I612W/S66W) in the ATP binding pocket and was
designed to sterically prevent ATP binding.
Figure 23: Constructs used for protein production. For the variants of Ks-Kin the site-directed
mutagenesis experiments were carried out using the original plasmids. The amino acids considered
for mutations are indicated as H460 (phosphorylation site) and I612/S666 (ATP-binding site).
All constructs with the exception of pET21a::amtdom were successfully expressed
and purified.
5.3 Protein production
Ks-Amt5 and Ks-Kin proteins holding a C-terminal His6-tag, both N- and C-terminal
His6-tag or a N-terminal His10-tag could be produced in E. coli C43 (DE3) or E. coli

Results and discussion
Camila Hernández
93
BL21 (DE3) cells. Test expressions with different media (LB, TB, auto-inducing,
minimal media) and temperatures (18, 20, 30, 37 ˚C) were performed in order to
find the best expression conditions for all constructs. Subsequently, western blots of
whole cell fractions were carried out after harvesting the cells and resuspending
them in water with 20 µl of water added per 0.1 Au of OD600. In the case of Ks-Amt5,
the protein was overproduced by cold induction with 0.4 mM IPTG after which
grown continued at 20 ˚C for 18 hours. The overproduction of Ks-Kin, Ks-KinS and
variants was generally high, resulting in high protein yields. Generally cultures were
grown at 30 ˚C and gene expression was induced with 0.4 mM IPTG. For all protein
productions, LB medium was chosen for large-scale expression.
Figure 24: Ks-Amt5 and Ks-Kin production detected in western blots. Results of experiments
showing the expression of pET21a::ks-amt5 and pET15dT::ks-kin in E. coli C43 (DE3) and BL21 (DE3)
cells respectively. Sample T0 was taken right after induction with IPTG, T1 after 1 hour (for Ks-Amt5,
18 hours) and T2 after 2 hours of induction. The PageRuler Plus Prestained Protein Ladder
(Fermentas) was used as molecular weight marker (MW).
After optimizing the expression conditions for the constructs, western blots were
also performed to track the level of production of the His-tagged proteins (Figure
24). Generally, samples were collected at the time of induction (T0), one hour after

Results and discussion
Camila Hernández
94
induction (T1), two hours after induction (T2) and for Ks-Amt5 after 18 hours. The
cultures reached the beginning of the growth stationary phase at about T1 for Ks-
Amt5 and T2 for Ks-Kin and its variants.
The expression levels under the conditions mentioned yielded sufficient amounts of
protein, which was further used in crystallization trials and functional assays.
5.4 Protein purification
Protein purification followed established methods for the Amt homolog, Af-Amt1
(Andrade et al., 2005b) with modifications in buffer compositions (4.2.3.3 and
4.2.3.4). As an improvement for the protocol an additional 40 mM imidazole pH 8.0
was added to the loading buffer for IMAC.
5.4.1 Ks-Amt5
The purification of Ks-Amt5 did not show a significant dependence on the
detergents used. Ks-Amt5 was successfully purified using a variety of detergents
including non-ionic detergents such as maltosides (D9M to D13M) and OGP and a
zwitterionic detergent, LDAO. In addition to dilutions of a single detergent type,
D9M, D10M, D11M, DDM, D13M, LDAO and OGP, 1:1 mixtures of two different
detergents were tested (concentrations are shown in Table 8). All of the screened
detergent solutions were able to stabilize the protein and resulted in monodisperse
samples. Based on previously solubilization tests, DDM was identified as the best
detergent for the solubilization of Ks-Amt5. Consequently, the solubilization of
membranes was performed with DDM at a final concentration of 1 %. Since all
purifications of Ks-Amt5 were very similar, only the purification with a mixture of
0.65 % D9M plus 0.03 % DDM is discussed.
The solubilized E. coli C43 (DE3) membranes containing Ks-Amt5 were purified via
IMAC as described previously (4.2.3.3). Affinity chromatography (Figure 25A and

Results and discussion
Camila Hernández
95
25B) yielded highly pure Ks-Amt5 (Figure 25D). The fractions obtained and
containing Ks-Amt5 protein were pooled and concentrated to 300-500 µl by
ultrafiltration using a 50 kDa MWCO concentrator. The concentrated protein was
further purified by SEC (4.2.3.4) to obtain a homogenous and monodisperse sample.
The SEC profile obtained from a Superdex S200 10/300 column showed a high
elution peak for the Ks-Amt5 with a smaller peak that presented minimal
absorbance at the exclusion volume probably due to oligomeric aggregates (Figure
25C). The retention volume of the Ks-Amt5 peak (VEl = 10 ml) corresponds to a
molecular size of approximately 282 kDa according to the calibration curve, log
(MW) = - 0.2055 * VEl + 4.5054, R2 = 0.982. The theoretical molecular weight of a
single Ks-Amt5 monomer including the His6-tag is about 75.2 kDa. Ks-Amt5 is
expected to form a trimer and furthermore to exhibit a higher molecular weight due
to the formation of a protein-detergent complex with the detergent molecules
present in the purification buffers (aggregation numbers of D9M and DDM are ~ 25
and ~78-149 respectively; VanAken et al., 1986). Therefore, the 282 kDa mass can
be interpreted as the molecular weight for the trimeric form of Ks-Amt5 (75.2 x 3=
225.6 kDa) including detergent molecules (± 56.4 kDa).
Subsequently, the Ks-Amt5 protein was further concentrated to ~7-10 mg/ml
(determined by a BCA test, 4.2.3.5) by ultrafiltration using a 100 kDa MWCO
concentrator. Generally, the yields obtained were about 0.1-0.3 mg protein from 1 L
culture. Crystallization trials were immediately performed with freshly purified
protein. For long-term storage the protein was flash frozen in liquid nitrogen and
stored at -80 ˚C.
In addition to SEC, blue-native PAGE experiments were carried out to determine the
oligomeric states of the Ks-Amt5 protein. BN-PAGE experiments (4.2.3.10) were
carried out using purified protein after size exclusion chromatography. The results
of BN-PAGE confirmed the assumption that the Ks-Amt5 is a trimer in solution
(Figure 25E). One distinct band was observed at 232 kDa corresponding to the
already estimated MW for the trimeric form of Ks-Amt5. In addition, higher

Results and discussion
Camila Hernández
96
oligomeric aggregates, hexamer and dodecamer, were detected. This might explain
the presence of the low intensity exclusion volume peak obtained in the SEC profile.
Figure 25: Purification of Ks-Amt5 in a 1:1 mixture of 0.65 % D9M + 0.03 % DDM. A. Ks-Amt5
IMAC purification showing the overall chromatogram of the His-trap run. B. Detail of the two elution
steps (5 % and 50 %) represented by the imidazole gradient (green line). C. Ks-Amt5 SEC
chromatogram. The Ks-Amt5 peak is labeled with the corresponding retention volume. D. SDS-PAGE
analysis of pure Ks-Amt5. Lanes include the unstained protein marker (MW) (Fermentas) and the
protein samples after affinity (HT) and size exclusion chromatography (GF). The Ks-Amt5 monomer
migrates with an apparent molecular mass of about 60 kDa, smaller than its calculated molecular
weight of 75.2 kDa. These differences in SDS-PAGE band migration are characteristic for membrane
proteins. E. BN-PAGE results indicate that Ks-Amt5 is a trimer in solution. The visible bands can be
designated to different oligomerization states (dodecamer, hexamer and trimer). The protein native
marker is indicated as MW (HMW Native marker, GE Healthcare).

Results and discussion
Camila Hernández
97
5.4.2 Ks-Kin and variants
Since the Ks-Kin is a soluble cytosolic protein, detergents were not needed for
protein purification. Despite the difference in length as well as the position of the
affinity tag in the kin constructs, all purifications of Ks-Kin and variants closely
resemble each other in terms of their experimental execution and profiles. Thus,
only the purification of the Ks-Kin (pET28a::kin construct) is shown and discussed
exemplarily.
The cytosolic fraction, containing overproduced Ks-Kin, was obtained by
centrifugation of the disrupted E. coli BL21 (DE3) cells and purified via IMAC
(4.2.3.3). High amounts of pure protein were obtained after affinity chromatography
(Figures 26A, 26B and 26D). The fractions containing Ks-Kin protein were pooled
and concentrated to 500-1000 µl by ultrafiltration using a 10 kDa MWCO
concentrator. The concentrated protein was further submitted to a size exclusion
chromatography to evaluate the homogeneity the sample. SEC was carried out using
a Superdex S200 10/300 or S200 26/60 according to the amount of protein to be
injected and following the protocol as previously described (4.2.3.4). Generally, a
single symmetric peak was observed (Figure 26C) indicating a homogeneous
protein sample with no apparent sign of aggregation. After SEC, the Ks-Kin protein
was concentrated to ~10-30 mg/ml (determined by a BCA test, 4.2.3.5) by
ultrafiltration using a 30 kDa MWCO concentrator. High yields of pure protein were
obtained (Figure 26C) in amounts of 3-6 mg from 1 L culture. Crystallization trials
were performed directly afterwards with freshly purified protein. For long-term
storage, the protein was aliquoted and flash frozen in liquid nitrogen and stored at -
80 ˚C.

Results and discussion
Camila Hernández
98
The molecular weight of Ks-Kin was deduced from the SEC results. The protein
eluted at a volume of 196.95 ml from a Superdex S200 26/60 column (Figure 26B),
which corresponds to a molecular weight of 61.9 kDa according to the calibration
curve, log (MW) = - 0.0155 * VE + 7.8445, R2 = 0.985.
The theoretical molecular weight of a single Ks-Kin monomer including the
purification tags (N and C terminal His6-tag, in this example) is 31.7 kDa.
Accordingly, the calculated molecular weight of 61.9 kDa corresponds to a Ks-Kin
dimer. In addition, BN-PAGE analyses (4.2.3.10) were performed to corroborate the
oligomerization state of Ks-Kin. Although it was difficult to obtain a good native gel
for the cytosolic domain, it was possible to visualize a protein band at about 62 kDa,
which indicates the presence of a dimeric form of Ks-Kin in solution. This result
agrees with experimental data obtained for other histidine kinases such as Tm-
CheA, and TM083 (Bilwes et al., 1999; Marina et al., 2005) where SEC results
indicate the presence of a protein dimer. The difference in the oligomerization
behavior of the full-length protein (Ks-Amt5) and the cytosolic domain (Ks-Kin)
further poses the question of how the cytosolic domain is organized in the full-
length protein and moreover, how it might function. We aim to answer these
questions by solving the molecular structure of Ks-Amt5 by means of X-ray
crystallography in various functional states.

Results and discussion
Camila Hernández
99
Figure 26: Purification of Ks-Kin. A. Ks-Kin IMAC purification showing the overall chromatogram of
the His-trap run. B. Detail of the two elution steps (5 % and 50 %) represented by the imidazole
gradient (green line). C. Ks-Kin SEC chromatogram. The Ks-Kin peak is labeled with the
corresponding retention volume. D. SDS-PAGE analysis of pure Ks-Kin. The Ks-Kin monomer
migrates with an apparent molecular mass of about 31 kDa. A higher weaker band at about 64 kDa
corresponds to the dimer. Lanes include the unstained protein marker (MW) (Fermentas) and the
protein samples after affinity (HT) and size exclusion chromatography (GF). E. BN-PAGE results
indicate that Ks-Kin is a dimer in solution. The visible bands can be designated to different
oligomerization states (hexamer, tetramer and dimer). The protein native marker is indicated as MW
(HMW Native marker, GE Healthcare).

Results and discussion
Camila Hernández
100
5.5 Crystallization of Ks-Amt5
Although a significant leap forward could be observed in the last couple of years
based on the number of new membrane protein structures published in the Protein
Data Bank, the determination of membrane protein structures by X-ray
crystallography still presents a challenge and confronts the experimenter with many
difficulties (Lacapère et al., 2007). As membrane proteins are surrounded by lipids,
they have to be extracted from the lipid environment in order to purify them. For
this, specific detergents are required. Consequently, the optimal choice of detergents
used for the extraction and purification of membrane proteins is very important
since they must maintain the native folding of the protein and stabilize it without
compromising its functional state (Newby et al., 2009). Generally, a longer chain
detergent works best to extract the protein from the membrane. As a consequence,
these detergents may recover higher amounts of the membrane protein from the
lipid bilayer. On the other hand, shorter chain detergents are better suited to
facilitate protein-protein contacts and thus crystallization. Moreover, the use of
detergent mixtures might be helpful for the crystallization of membrane proteins. A
mixed detergent micelle containing multiple detergents is potentially able to
significantly ameliorate protein stabilization and crystallization. This was
successfully demonstrated for G protein-coupled receptors and bacteriorhodopsin
where protein purified in bicelles, composed of two detergents and/or lipids, was
used for the final structure determination (Faham et al., 2002; Chiu et al., 2008).
In the case of Ks-Amt5, crystals could only be obtained after purification based on a
1:1 detergent mixture (D9M+DDM, D10M+DDM, DDM+D13M or D10M+LDAO)
(concentrations used are shown in Table 8). Initial crystals appeared after 10-15
days in an Index crystallization screen condition (Hampton research, Aliso Viejo,
USA) composed of 25 % PEG 3350 and 0.1 M HEPES buffer pH 7.5 and stored at 20
˚C (Figures 27A and 27B). Under this condition the original crystals could be
reproduced with a suitable size for X-rays experiments. Crystals were further
obtained in a variety of PEG 3350 concentrations (25-32 %) and HEPES buffer pH

Results and discussion
Camila Hernández
101
7.5 concentrations (0.1-0.15 M) (Figures 27C and 27D). Under other conditions of
the Index screen such as 30 % PEG 2000 plus 0.1 M potassium thiocyanate (Figure
27E) and 30 % PEG 2000 plus 0.15 M potassium bromide (Figure 27F) single
crystals appeared, although in these cases crystals were not reproducible.
Additional crystallization trials using detergent screens, additive screens (Hampton
research) and microseeding were performed in order to optimize and improve the
crystal diffraction quality. Conditions including different additives led to the
formation of crystals, however, the best crystals were obtained in finescreens (4.3.3)
by simply changing the buffer type and pH and slightly reducing the PEG
concentration. The crystallization condition which produced generally well-
diffracting crystals of Ks-Amt5 purified in 0.65 % D9M + 0.03 % DDM, was 24 % PEG
3350 and 0.1 M MES pH 7.0 (Figures 27G and 27H). Crystals presented a hexagonal
prism shape and in some cases with a pointy edge. The crystal form was similar in
all crystallization trials and only variations in width and length were observed.
In addition, crystals of Ks-Amt5, purified in 0.65 % D9M + 0.03 % DDM and obtained
in 24 % PEG 3350 + 0.1 M MES pH 7.0, were further used for soaking experiments.
For this, a mixture containing the corresponding reservoir and an ATP or non-
hydrolyzable ATP solution (AppCp, ATPS or ATPS) to a final concentration of
1 mM was prepared. Crystals were soaked in this solution for 1-5 min aiming for the
introduction of an ATP molecule to the binding pocked of the histidine kinase
domain. By means of these experiments it was expected to observe different
conformations of the protein after structure determination.

Results and discussion
Camila Hernández
102
Figure 27: Ks-Amt5 crystals. A and B. Initial hit for Ks-Amt5 crystals with protein purified in 0.2 %
D10M + 0.03 % DDM and 0.65 % D9M + 0.03 % DDM respectively. C and D. Crystals of Ks-Amt5 in
different concentrations of PEG 3350, 26 % and 32 %, with protein purified in 0.65 % D9M+ 0.03 %
DDM. E and F. Non-reproducible crystals of Ks-Amt5 in 30 % PEG 2000 plus potassium thiocyanate
and potassium bromide, respectively. The protein was purified in 0.2 % D10M+ 0.03 % DDM. G and H.
Best crystallization condition for Ks-Amt5 with protein purified in 0.65 % D9M + 0.03 % DDM.
Crystals obtained diffracted up to 2.1 Å.
5.6 Crystallization of Ks-Kin
For the crystallization of the cytosolic domain of Ks-Amt5 all different constructs of
Ks-Kin were used, in all cases with the affinity tag present (Figure 23).
Crystallization trials included a variety of initial crystallization screens (Footprint,
Index screen, Natrix screen, Crystal screen, Morpheus screen, JB screens and PEG
Grid screens) and a variety of temperatures 4 ˚C, 20 ˚C, 25 ˚C, 30 ˚C and 37 ˚C for the
storage of the crystal plates. However, no protein crystals appeared. As mentioned
before, the cytosolic domain presents a DHp plus a CA domain which contains an
ATP binding site. Aims to achieve a higher homogeneous sample, that is in only one
conformational state, co-crystallization trials with ATP and non-hydrolysable ATP
analogues (AppCp, ATPS, ATPS) were performed using different concentrations

Results and discussion
Camila Hernández
103
(0.1 mM – 2mM) of this as additive, either in the drop or pre-incubated (for 30 min –
1 h) with the protein solution containing 5-10 mg/ml protein, 20 mM Tris-HCl, 100
mM NaCl and 1 mM MgCl2. Despite this, no crystals were obtained. In continuation
of these efforts, a second construct with a shorter α1-helix, Ks-KinS (residues
M439-K679) was designed in order to truncate a possible flexible region that might
interfere with the crystallization process. With this construct, however
crystallization screens and conditions, as well as co-crystallization trials with ATP
and non-hydrolysable ATP analogues did not lead to the growth of crystals.
Parallel experiments using the Ks-Kin construct (pET28a::kin) were carried out with
another structural technique to determine the overall structure of this domain
(5.11).
5.7 Data collection and processing
Initial crystals of Ks-Amt5 diffracted only to a maximum resolution of 11-8 Å and
usually showed an anisotropic diffraction pattern. In modern X-ray crystallography,
the choice of cryoprotectants is crucial for the collection of good quality data. High
molecular PEGs have been proven to be good cryoprotectants (Berejnov et al.,
2006). However, they have to be in a suitable concentration generally above 25 % to
avoid the formation of water crystals that interfere (superimpose) with the X-ray
diffraction of the protein crystal. Therefore, before mounting the crystals in cryo
loops (Hampton research, Aliso Viejo, USA), the crystallization drop was exposed to
air for 5-10 min to slightly increase the original PEG 3350 concentration (24 %) in
the drop through the evaporation of water. Contrary to the use of 24 % PEG 3350 as
cryoprotectant, this procedure improved the diffraction limit of the Ks-Amt5
crystals from 8 Å to 3.5 Å. Consequently, this allowed the collection of the first
diffraction data set of Ks-Amt5 crystals at 3.5 Å resolution. Additionally,
commercially available additive and detergent screens (Hampton research, Aliso
Viejo, USA) were used in order to improve the crystal diffraction quality.

Results and discussion
Camila Hernández
104
Furthermore, other cryoprotectant solutions, such as 10 % (v/v) glycerol and
10 % (v/v) (R,R)-2,3-Butanediol were tested. However, these cryoprotectants did
not show an improvement in thecrystal diffraction. For Ks-Amt5 crystals the best
cryoprotectant turned out to be PEG 400. The used of PEG 400 as cryoprotectant
was earlier described to improve the lattice order and stability of crystals (Xiao &
Gamblin, 1996). In practice, a small amount of the reservoir solution was mixed with
PEG 400 at a final concentration of 20 %. Subsequently, Ks-Amt5 crystals were
soaked in this mixture (1-2 min) before freezing in liquid nitrogen. As a result, the
diffraction limit was further improved from 3.5 Å to 2.1 Å. At this so far maximum
resolution (2.1 Å), a data set was collected at the X06SA beamline at the Swiss Light
Source (Villingen, Switzerland) at 100 K. The diffraction data was processed and
analyzed as previously described (4.3.9.2). Like Ec-AmtB crystals (Khademi et al.,
2004; Zheng et al., 2004), the space group of the Ks-Amt5 crystals was determined
to be P63 with cell parameters a = b = 99.77 Å, c = 89.08 Å, = = 90˚, = 120˚ and a
Mathews coefficient of VM = 2.68 Å3/Da that corresponds to a 53.71 % solvent
content (Matthews, 1968; Matthews, 1976). The details of data collection and
processing statistics are summarized in Table 20.
5.8 Overall structure and crystal packing
The first crystal structure of Ks-Amt5 was solved at 3.5 Å by molecular replacement
with the Af-Amt1 structure (PDB code: 2B2H) as a search model. Afterwards, the
structure of Ks-Amt5 at higher resolution (2.1 Å) was solved as well by MR with the
3.5 Å Ks-Amt5 structure as the search model. In X-ray protein crystallography the
resolution limits are important, while the lower resolution diffraction spots allow
the determination of the overall structure, the higher resolution spots enable the
visualization of details that are generally crucial to the description of the
functionality of the protein. The structural model of Ks-Amt5 that will be further
discussed is based on the diffraction data set at a maximum resolution of 2.1 Å.

Results and discussion
Camila Hernández
105
Table 20: X-ray data processing and refinement statistics for Ks-Amt5. Data set recorded at X06SA at the Swiss Light Source PSI, Villingen, Switzerland). Values in parentheses indicate the
highest resolution shell.
Data processing and refinement statistics for Ks-Amt5 Wavelength (Å) 1.000 Space group P63 Unit cell parameters a,b,c (Å); ,, (˚) 99.772, 99.772, 89.084; 90, 90, 120 Resolution limit (Å) 2.1 Resolution range (Å) 62.02-2.1 Number of reflections, unique 29455 (4272) Completeness overall (%) 99.84 (99.7) Multiplicity (%) 10.2 (10.1) Rmerge overall
1 9.1 (70.8) Rpim
2 3 (23.2)
Rvalue overall3(%) 16.07
Rvalue free 4(%) 20.09
Mean I/Sig (I) 21.5 (3.7) Cruickshank’s PI (Å)5 0.1681 R.m.s. deviations from ideal values r.m.s.d bond lengths (Å) 0.0194 r.m.s.d bond angles (˚) 2.1163
Average B values (Å2)
Protein main chain atoms 32.490 Protein all atoms 34.594
, angle distribution for residues6
In favored regions (%) 92.3 In allowed regions (%) 4.3 In outlier regions (%) 3.4 1 Rmerge = hkl [(i |Ii - <I>|)/ iIj] 2 Rpim = hkl N/N-1 [(i |Ii - <I>|)/ iIj] (Weiss et al., 2001) 3 Rvalue = hkl ||Fobs| - |Fcalc|| / hkl|Fobs| 4 Rfree is the cross-validation R factor computed for the test set of 5 % of unique reflections (Brünger, 1993) 5 DPI: Diffraction precision indicator (Cruickshank, 1999) 6 Ramachandran (Ramachandran & Sasisekharan, 1968) statistics as defined by PROCHECK (Laskowski et al., 1993)
As mentioned before, in all cases, crystals belonged to the hexagonal space group
P63 with one Ks-Amt5 monomer per asymmetric unit. The crystal packing is
determined by the side contacts between the periplasmatic and cytoplasmatic loops
of the integral membrane domains (Figure 28). Consequently, each Amt monomer
forms crystal contacts through interactions between residues of loops 2, 5, 7 and 10.
The symmetrically related Amt monomers form trimers that are oriented in a three-
fold axis with the N-terminal regions facing the C-terminal regions of a neighbor
trimer (Figure 28A). Each monomer extends ~ 52.8 Å parallel to the three-fold axis

Results and discussion
Camila Hernández
106
and the trimer has an overall diameter of ~ 82 Å in the plane of the membrane
(Figure 28B).
Figure 28: Crystal packing of Ks-Amt5. Each asymmetric unit contains a Ks-Amt5 trimer. A. Overall
view of the P63 crystal packing. The trimers are intercalated with the N-terminal side facing the C-
terminal side of the neighbor trimers. The empty region below the Amt domain was expected to
reveal the position for the histidine kinase domain. The crystal contacts are indicated with a circle. B.
View of the three-fold symmetry of the trimer.
Below each trimer molecule there is an empty space, which corresponds to the
position of the cytosolic domain not visible in the structure (Figure 28A). During the
molecular replacement search it was not possible to localize the homologous
structural model TM083 (PDB code: 2C2A, Marina et al., 2005) of the Ks-Kin.
Therefore, MR searches were carried out with truncated versions of the original
model (model A residues E240-R317 and model B residues E325-R480) in order to
localize particular domains of the histidine kinase protein such as the catalytic and
the dimerization domains. Despite the different search model, the high-resolution

Results and discussion
Camila Hernández
107
data (2.1 Å) and the data completeness (99.84 %), the histidine kinase domain was
not visible in any of the data sets analyzed. Some electron density was observed in
the C-terminal part of each monomer; even so, it was not sufficient to reconstruct
the histidine kinase domain of the Ks-Amt5.
5.9 Ks-Amt5 monomer
As predicted, the Ks-Amt5 monomer consists of residues M1-A408 forming eleven
transmembrane helices, TM1-11 (Figure 29A). As seen in other Amt proteins, the
monomer of Ks-Amt5 presents an internal pseudo two-fold symmetry with an axis
in the membrane plane. It consists of two halves comprised of TM1-TM5 on one side
and TM6-TM10 on the other. As is the case with Ec-AmtB and Af-Amt1, the two
pseudo-symmetric halves of the Amt5 monomer are held and stabilized by the
remaining transmembrane helix TM11 (Figure 29B).
For each momomer, three detergent molecules of DDM were identified on the
protein membrane surface between TM2-TM4, TM5-TM10 and TM4-TM11. Its
hydrophobic tails appear to surround the transmembrane helices while the
hydrophilic head groups point to the cytoplasm or to the periplasm respectively
(data not shown). The location of the detergent molecules in the structure of Ks-
Amt5 gives an additional indication of the position occupied by lipid molecules in
the real cell membrane.
B-factor analysis of the Ks-Amt5 model was performed to identify flexible regions.
The B-factor values are indicators of the attenuation in the X-ray scattering due to
thermal motion of the atoms (4.3.7). Thus, low B-factors indicate well-ordered parts
in the structure and high B-factors represent flexible portions. Overall, the Amt
transmembrane domain of Ks-Amt5 is well-ordered with average low B-factors in
the range of 10-40 Å (Figure 29C). Moderate flexibility was observed for the loops
involved in the crystal packing (loops, 2, 5, 7 and 10) with slightly higher B-factor
values (50-70 Å). On the other hand, the C-terminal extension composed by amino

Results and discussion
Camila Hernández
108
acids E403 to A408, shows high B-factor values (up to 112 Å) (Figure 29D). The
flexibility of this region might explain the lack of a structural model for the
cytoplasmatic domain in Ks-Amt5.
In the current Ks-Amt5 model, the extramembrane HK domain at the C-terminal
part of the Amt domain appears to be positioned in close proximity to loop 5 and
blocks the cytoplasmic exit channel of the neighbor monomer (Figure 29D) . This
loop region in other Amt proteins such as Ec-AmtB, is involved in the interaction
with nitrogen regulatory proteins like GlnK (Conroy et al., 2007). Andrade et al.,
2005, suggested that movements in this loop region, which showed elevated B-
factor values for Af-Amt1, could permit conformational changes during transport if
they occur. In Ks-Amt5 loop 5 is rather ordered in the structure. However, an
interaction with the C-terminal extension of the neighboring monomer might
indicate cooperativity with regard to the histidine kinase domain activity.
Nonetheless, as of yet this is a hyphothesis, as the structure of Ks-Amt5 lacks the
complete cytoplasmatic domain and the C-terminal extension is highly flexible.

Results and discussion
Camila Hernández
109
Figure 29: Structural details of Ks-Amt5 and B-factors analysis. A.The Ks-Amt5 monomer is
rainbow-colored with the N-terminus in blue and the C-terminus in red. The transmembrane (TM)
helices are indicated. B. 90 ˚C top view of A showing the pseudo two-fold symmertry of the Ks-Amt5
monomer. The two halves formed by TM1-TM5 and TM6-TM10 are indicated. C. B-factor putty
representation of the Ks-Amt5 monomer. Warm colors indicate high B-factor values. Loops 2, 7 and
10, which are involved in the crystal packing, present a moderate flexibility. The higher B-factor
values were obtained for the C-terminal region. D. C-terminal view of the Ks-Amt5 trimer in B-factor
putty representation. The flexibility of the C-terminus could be a reason for the disorder of the
histidine kinase domain, which is not visible in the structure.

Results and discussion
Camila Hernández
110
Calculations of the Ks-Amt5 electrostatic surface potentials showed neutral
electrostatic potentials within the membrane plane, which could be interpreted as
an indication of the hydrophobic regions of the protein (Figure 30). The periplasmic
and cytoplasmic side of the Ks-Amt5 trimer present regions of negative and positive
electrostatic potentials, respectively, which agrees with the positive-inside rule for
membrane proteins (von Heijne & Gavel, 1988). Interestingly, although the
periplasmic entrance of the ammonium channel does not present a significant
charge, the cytoplasmic exit of the channel is slightly negative, suggesting the
transport of the charged species (NH4+) in Ks-Amt5.
Figure 30: Trimeric structure of Ks-Amt5 and electrostatic surface potentials. From left to right,
different views on the trimeric Ks-Amt5 model as seen from the N-terminal side, membrane plane
and C-terminal side, respectively. Top: representation of the electrostatic surface potential. Bottom:
carton representation.

Results and discussion
Camila Hernández
111
In order to obtain a structural model for the histidine kinase domain, additional
experiments were performed to seek to improve the disorder conjugated from
conformational flexibility of the HK domain. It is known that ATP binding by the CA
domain of the histidine kinase protein induces conformational changes that lead to
trans-phosphorylation and interaction between the monomers, which may acquire a
tighter conformation (Marina et al., 2005). For that purpose, co-crystallization and
soaking experiments with ATP and non-hydrolysable ATP analogues were
performed in order to try and lock the protein into a fixed and homogeneous
conformation and to reduce the degree of disorder of the HK domain. No crystals
were obtained by the co-crystallization experiments, however, soaking experiments
with Ks-Amt5 crystals obtained in 24 % PEG 3350 + 0.1 M MES pH 7.0 lead to good
quality data collection. Regardless of that, the data collected and processed in such
crystals did not show any difference and, as it was previously described, the
histidine kinase domain was not visible. Other attempts included soaking of the Ks-
Amt5 crystals with heavy atom solutions (for MAD structure solution) (4.3.7).
However, the diffraction power of the Ks-Amt5 crystals was reduced to 8-9 Å and no
heavy atom signal for Hg, Pb, Ta, Pt, or Au was detected.
5.10 Structural comparison of Ks-Amt5 with other Amt proteins
Stuctural comparison of the integral membrane domain of Ks-Amt5 and those of the
available Amt protein structures (Ec-AmtB and Af-Amt1) revealed strong
homologies in the transmembrane region of all proteins (Figure 31A). The root
mean-squared deviations of all atoms positions without the C-terminal extension of
Ks-Amt5 are 1.08 Å between Ks-Amt5 and Ec-AmtB and 1.17 Å between Ks-Amt5
and the Af-Amt1 protein. The structural alignment shows no major differences.
However, Ks-Amt5 differs in the extension of the C-terminal with 17 amino acid
residues more than Af-Amt1 and the length of the loop 5 with 20 amino acid
residues in comparison to 13 in E. coli and 12 in Af-Amt1. In Ks-Amt5 loop 5 could be

Results and discussion
Camila Hernández
112
involved in the interaction between monomers as mentioned. Therefore it is likely
that the length of the loop increases the possibility of contact between the loop and
the C-terminal extension.
All three structures, show two vestibules, one extracellular and one intracellular,
corresponding to the position of the recruitment site and the exit of the channel,
respectively (Figure 31C). In the extracellular vestibule of Ks-Amt5, conserved
residues W144 and S227 suggested as forming the recruitment of ammonium are
present in almost identical conformations as in Ec-AmtB and Af-Amt1 (Figure 31B).
Two additional MES molecules were identified in the extracellular vestibule at the
entrance of the hydrophobic pore, eventually blocking the substrate passage by the
formation of electrostatic interactions with the surrounding amino acids Q100,
L147, F164, L228, L229, Y345 and including W144 and S227 (Figures 32A and 32B).
In both the structures Ec-AmtB and Af-Amt1, the hydrophobic pore was visible
however, in the Ks-Amt5 it was closed. Ks-Amt5 presents two non-conserved
phenylalanine residues (F27 and F31 from helix TM1) that were found towards the
hydrophobic pore possibly blocking the channel due to steric impositions. This fact,
in addition to the side chain of an aspartate residue (D406) located at the C-
terminus, which seems to obstruct the cytoplasmic exit of the channel, could explain
the discontinuity in the hydrophobic pore (Figure 33).

Results and discussion
Camila Hernández
113
Figure 31: Structural comparison of Ks-Amt5 with Ec-AmtB and Af-Amt1 Amt proteins. Ks-
Amt5 is represented in silver, Af-Amt1 in blue and Ec-AmtB in orange. A. The overall core of Ks-Amt5
is highly conserved to Af-Amt1 (r.m.s.d 1.17 Å) and Ec-AmtB (r.m.s.d 1.08 Å). B. Detailed side view of
the protein lumen in the aligned structures shown in A. The amino acids supposedly involved in
ammonium translocation are numbered according to the Ks-Amt5 sequence. These amino acids
represent slight variations, His-pair is shifted 1.5 Å in respect to Af-Amt1 and Phe103 presents a 40˚
tilt respect to the same residue in Af-Amt1. C. Surface representation revealing the overall protein
shape and the hydrophobic substrate passages that in Ks-Amt5 appears closed, although the
structures are highly similar, the hydrophobic substrate passage in Ks-Amt5 is closed. Additional
features of the structure are the presence of two MES molecules in the periplasmic vestibule and two
phenylalanines not conserved in Af-Amt1 and Ec-AmtB. The membrane is represented in grey.

Results and discussion
Camila Hernández
114
Figure 32: Top view of the periplasmic vestibule of the Ks-Amt5 structure. A. Two MES
molecules (represented as sticks) were found blocking the entrance of the hydrophobic pore. The
surface of the protein is represented in light-blue. B. Detail of A without surface representation. The
entrance to the hydrophobic pore is blocked in Ks-Amt5 due to the interaction of the MES molecules
with the surrounding amino acids including the conserved W144 and S227 of the recruitment site.
Figure 33: Interaction between two Ks-Amt5 monomers. The cytoplasmic exit of the hydrophobic
channel of monomer A is blocked by the C-terminal extension of monomer B. The residue D406 is
shown as a red surface and faces the exit of the channel.

Results and discussion
Camila Hernández
115
5.11 Small Angle X-ray Scattering
Small angle X-ray scattering (SAXS) is a technique that provides high-precision
information with respect to size and shape of molecules (Neylon, 2008). Small-angle
solution scattering does not provide information on atomic coordinates as in X-ray
crystallography, thus it is often described as a low-resolution technique. In SAXS the
rotational averaging of the molecules in solution is what limits the information
content of small-angle scattering more than the resolution limits of the experiment.
The resolution limits in a SAXS experiment are referred to in terms of the smallest
angles for which data can be measured. For the accurate interpretation of scattering
data in terms of structural parameters, it is necessary that the scattering signal is
measured from a sample composed by monodisperse and identical particles
(Jacques & Trewhella, 2010). Therefore, the sample preparation is crucial.
SAXS is generally used to study protein complexes. In addition, this technique is also
informative when one component of a protein complex is expected to undergo a
conformational change upon binding. Due to the fact that small-angle scattering
uses molecules in solution, the data are time and ensemble-averaged (Jacques &
Trewhella, 2010). Therefore, SAXS can be also used to study flexible systems.
In collaboration with Prof. Dmitri Svergun (EMBL-DESY Hamburg, Germany), small
angle X-ray scattering (SAXS) experiments were carried out with the Ks-Amt5
(pET21a::amt5) and the Ks-Kin (pET28a::kin) proteins in solution in order to obtain
a lower resolution structure with the overall shape of the protein. For both proteins,
preliminary data was obtained. However, in the case of Ks-Amt5 the scattering data
was not processable due to the interference of the detergent molecules that are
present in the buffer solution and which are necessary to stabilize the protein. On
the other hand, SAXS data for Ks-Kin was further processable and indicated two
different oligomeric states for this domain in the presence or absence of non-
hydrolysable ATP analogues (AppCp, ATPS, ATPS). Ks-Kin in absence of ATP
presented a dimeric form as it was observed with SEC and which corresponds to the
oligomerization state of other histidine kinase homologues. In the presence of the

Results and discussion
Camila Hernández
116
non-hydrolysable ATP analogues (AppCp, ATPS, ATPS) tested, the Ks-Kin protein
showed a monomeric state that might indicate different conformations of the
protein upon binding of ATP. However, without the Amt domain it is not straight
forward to explain how these differences occur. Therefore, further optimizations
regarding sample preparation, especially for the full length protein, are needed.
5.12 Functional studies
5.12.1 Thermodynamic characterization of Ks-Kin
It is known that histidine kinases use ATP as a nucleotide. The affinity of these
proteins to ATP appears to be conserved with KD values in the range of 100 and
200 µM (Krell et al. 2010). In order to characterize the ligand binding properties of
Ks-Amt5 isothermal tritration calorimetry (ITC) experiments were carried out.
Due to the large amounts of protein required for a single ITC experiment, only the
histidine kinase domain (Ks-Kin) was tested. Different ligands were evaluated, these
included ATP, a non-hydrolysable ATP analogue (ATPS), ADP and GTP. For each
ligand and Ks-Kin variant, two independent experiments were performed and the
standard deviations were calculated for the binding constants (Ka or Kd), the
enthalpy changes (H) and the entropy changes (S). Since only one ATP binding
site was identified on the sequence, the stoichiometry of the reaction (n) is not
shown. Table 21 summarizes the results obtained.

Results and discussion
Camila Hernández
117
Figure 33: Titration curve of Ks-Kin with various ligands and simulation profiles. For all ITC
experiments, 282 µl ATP (1.3 mM stock) were titrated to 1.4 ml Ks-Kin (0.1 mM stock) in 21
injections at 20 ˚C. The reference titration was carried out by titrating ATP to buffer without protein
under the same conditions. The data was fit in Origin using the one set of sites model after
subtracting the reference data. A. Binding of ATP. B. No binding of GTP. C. Low affinity for ADP with
no detectable binding parameters.
Table 21: Thermodynamic parameters of different ligands with Ks-Kin wild type and variants
Protein Ligand Ka [mM-1] Kd [µM] H [kcal/mol] S
[cal/mol/K] Ks-Kin ATP 123.00 7.48 8.13 0.13 -8.29 0.97 -4.98 Ks-Kin ATPS 61.00 11.00 16.39 0.09 -1.26 0.58 -21.20 Ks-Kin ADP nd nd nd nd Ks-Kin GTP nd nd nd nd
Ks-KinH460A ATP 12.64 1.08 79.11 0.93 -8.63 0.42 -16.40 Ks-KinH460A ATPS 33.60 1.09 29.76 0.92 -10.89 0.13 -10.70
Ks-KinI612W/S666W ATP nd nd nd nd
The binding of ATP to Ks-Kin is described as an exothermic reaction with an
association constant (Ka) of 123 mM-1 (Figure 33A). It was expected that the affinity
for ATP is higher than for other ligands due to the fact that ATP is the preferred

Results and discussion
Camila Hernández
118
substrate of protein histidine kinases defined by the phenylalanine and glycine
residues of the F and G-boxes present in the binding pocket.
The binding affinity for ATPS was lower than for ATP ( Ka = 63 mM-1). This could be
explained by the weaker electronegativity of the sulfur atom in the gamma position
of the phosphate group and that non-hydrolysable properties of this ligand lead to a
weaker interaction of the ATPS to the binding pocket.
The results of ICT experiments showed non-detectable binding for GTP (Figure
33B). This result confirms that Ks-Kin as other histidine kinases like CheA or EnvZ
does not bind other nucleotides such as GTP and strongly supports the substrate
specificity of Ks-Kin like other histidine kinases for ATP. Interestingly Ks-Amt5
exhibits a very low affinity for ADP (Figure 33C) in contrast to other kinases like
CheA with a KD of 90 µM (Tawa & Steart, 1994). The ITC profile showed small
changes in the curve, with a small increase of H upon titration. It is feasible that
under these conditions, the binding was non-detectable, due to the lower
concentration of protein used (0.1 mM). However, to study this further, it is
required to increase the concentration and the protein-ligand ratio in order to
obtain suitable data for ITC simulations.
In the case of Ks-KinH460A a ten times lower binding affinity for ATP was observed.
This result suggests that the ATP binding event is strongly related to the presence of
the phosphorylation site in Ks-Am5. Furthermore, using ITC experiments the double
mutant of Ks-Kin I612W/S666W was proven to sterically interfere with the ATP
binding. The binding of ATP to Ks-Kin I612W/S666W was undetectable as well.
5.12.2 Phosphorylation analysis of kinase activity of Ks-Amt5
In addition to the ATP binding properties of Ks-Amt5, the autophosphorylation
activity was evaluated. Ks-Amt5 presents a histidine phosphorylation site identified
as H460 according to sequence analysis (5.1). In order to demonstrate the activity of
the protein, a radioactive assay was performed (4.2.3.8). For the detection of

Results and discussion
Camila Hernández
119
radioactive signals due to protein phosphorylation, different optimization steps
were carried out. First attempts using Ks-Amt5 purified in the original SEC buffer
containing 0.03 % of DDM and incubation with radioactive [ -32P]-ATP showed no
distinguishable bands on the SDS gels. Therefore, detergent-free buffer was used for
subsequent experiments.
In order to optimize the radioactive assay, different variables were examined. For
both proteins, common parameters tested included the concentration ratio of
radioactive [ -32P]-ATP against protein, the concentration of non-radioactive ATP,
which is used to complement the overall ATP concentration and avoid overexposure
to radioactive material, and the concentrations of magnesium or manganese used as
a cofactor to stabilize the ATP molecules. Other parameters were considered such as
the concentration of ammonium in the case of Ks-Amt5 and the time of reaction for
Ks-Kin.
In the case of Ks-Kin the phosphorylation signal was not affected by the
concentration of [ -32P]-ATP or the protein concentration (Figure 34A). However,
the concentrations of non-radioactive ATP and magnesium or manganese influenced
the intensity of the signal (Figures 34B and 34C). The best phosphorylation signal
was obtained with 10 µM protein (calculated as a monomer), 50 µCi of [ -32P]-ATP
(> 3000 Ci/mmol specific activity), 1 mM of non-radioactive ATP and 50 mM of a
mixture of MgCl2 and MnCl2. This condition was then used to observe the duration of
the phosphorylation event. For this, the Ks-Kin protein was incubated at different
time periods and then further analyzed by SDS-PAGE and digital autoradiography
(4.2.3.6 and 4.2.3.8). The first phosphorylated bands were observed after 1 min of
reaction. The signal was further accumulated in time with a maximum intensity
detected upon three hours of reaction (Figure 34D). As two-component signal
transduction proteins, histidine kinases are involved in a complex signaling cascade
that includes the association to a response regulator protein (Casino et al., 2010).
Upon reception of a certain stimulus, the histidine kinase is activated leading to the
phosphorylation of the histidine residue. This event triggers the activation or

Results and discussion
Camila Hernández
120
deactivation of other proteins, which functions as a response regulator that
interacts with the histidine kinase in order to transmit the signal further into the
transduction pathway (Casino et al., 2010). In the case of Ks-Kin the accumulation of
phosphorylation signals upon reaction with ATP (up to 3 hours) could be explained
due to the fact that in the performed in vitro assay the response regulator protein
was not incorporated. This protein would be in charge of the dephosphorylation of
the histidine kinase in order to reverse its activity.
Figure 35: Phosphorylation of Ks-Kin. The different steps for the optimization of the assay are
shown in A, B, and C. All reactions were incubated at 30 °C with buffer containing 20 mM Tris-HCl pH
8.0 plus 100 mM NaCl. A. Reactions with 1 mM MgCl2 in buffer and 200 µM ATP. B. Reactions with 50
µCi [ -32P]-ATP, 10 µl protein (calculated as monomer) and 1 mM MgCl2 in buffer. C. Reactions with
50 µCi [ -32P]-ATP, 10 µl protein (calculated as monomer) and 1 mM ATP. The best condition for the
detection of phosphorylated protein bands was further used for the determination of the reaction
time. D. Reactions with 50 µCi [ -32P]-ATP, 10 µl protein (calculated as monomer), 1 mM ATP and a
mixture of 50 mM MgCl2 + 50 mM MnCl2 in buffer. Accumulation of phosphorylated protein was
observed up to 3 hours of incubation.
The phosphorylation activity of the full-length protein (Ks-Amt5) was also analyzed.
In order to detect phospho-protein bands of Ks-Amt5, it was required to eliminate
the presence of detergents in the reaction buffer, which seemed to interfere with the
distribution of the radioactive labeled phosphate groups as only smeared bands
were obtained (data not shown). Furthermore, the size of the polymerization matrix

Results and discussion
Camila Hernández
121
for SDS-PAGE was decreased from 12.5 % to 7.5 % polyacrylamide gels (4.2.3.6).
Upon incubation with [ -32P]-ATP, the protein aggregated. As a consequence, the
samples did not migrate in the 12.5 % resolving gel, which was generally used for
the analysis of purified Ks-Amt5.
The phosphorylation analysis of Ks-Amt5 required greater amounts of [ -32P]-ATP
and protein (figure 37A) in comparison to Ks-Kin. Further, the concentration of non-
radioactive ATP as well as magnesium and manganese played a role in the intensity
of the signal. Although high radiation intensity was detected for 50 µM ATP, 10 mM
MgCl2, and 10 mM MgCl2 + MnCl2 the protein band looked smeared and not defined
(Figures 37B and 37C). Therefore, the best condition for the detection of
phosphorylation activity for Ks-Amt5 was chosen as 30 µM protein (calculated as
monomer), 250 µCi of [ -32P]-ATP (> 3000 Ci/mmol specific activity), 1 mM of non-
radioactive ATP and 50 mM of a mixture of MgCl2 and MnCl2. This condition was
further used for the evaluation of the differences in ammonium concentration.
Ks-Amt5 was phosphorylated in the absence of ammonium and at low
concentrations of ammonium in the range of 0.5 mM to 10 mM. The phosphorylation
activity was greatly diminished at high concentrations (50 mM) and almost
completely ceased at 500 mM of ammonium (Figure 37D). These results indicate
that the concentration of ammonium influences the degree of phosphorylation of
the histidine kinase. In the absence and at lower concentrations of ammonium Ks-
Amt5 appears phosphorylated and the signal is enhanced upon the increase in the
concentration of ammonium up to 10 mM. At this point the increment in the
intensity of the signal might be explained due to the absence of a response regulator
that would acquire the phosphoryl group from the histidine kinase and as a
consequence transmits a signal further into the transduction pathway. However, the
phosphorylation signal intensity decays at higher concentrations of ammonium (50
mM and 500 mM). This fact suggests an inhibition of the Amt domain. By means of
this inhibition, the signal is no longer transmitted to the histidine kinase domain and
therefore ATP is no longer required, thus, the signaling pathway is inactivated.

Results and discussion
Camila Hernández
122
However, since the Ks-Kin shows phosphorylation in the absence of ammonium this
is an indication that these results are artifacts of the assay and require further
evaluation.
Figure 36: Phosphorylation of Ks-Amt5. The different steps for the optimization of the assay are
shown in A, B, and C. All reactions were incubated at 30 °C with buffer containing 20 mM Tris-HCl pH
8.0, 100 mM NaCl and 10 % (v/v) glycerol. A. Reactions with 1 mM MgCl2 in buffer and 200 µM ATP.
B. Reactions with 250 µCi [ -32P]-ATP, 30 µl protein (calculated as monomer) and 1 mM MgCl2 in
buffer. C. Reactions with 250 µCi [ -32P]-ATP, 30 µl protein (calculated as monomer) and 1 mM ATP.
The best condition for the detection phosphorylated protein bands was further used for the
determination of the reaction time. D. Reactions with 250 µCi [ -32P]-ATP, 30 µl protein (calculated
as monomer), 1 mM ATP and a mixture of 50 mM MgCl2 + 50 mM MnCl2 in buffer. Upon increase in
nitrogen concentration the phosphorylation signal is enhanced, however at higher concentrations, 50
mM and 500mM, the kinase activity is diminished.
5.13 Remarks on the possible mechanism of transport for Ks-Amt5
Generally an autophosphorylation reaction requires the presence of ATP and an
external stimulus, which is detected by the sensor domain of a kinase protein. For
Ks-Amt5, the sensor domain is thought to be the integral membrane part

Results and discussion
Camila Hernández
123
characterized as an Amt protein and whose structure was determined (5.8). As in
other Amt proteins, Ks-Amt5 has the expected amino acid residues supposed to be
involved in and required to translocate ammonium under lower nitrogen level
conditions and fulfill metabolic requirements in the cell. When extracellular
ammonium concentrations are low, ammonium could enter the cell through Ks-
Amt5 triggering a conformational change in the linker between the Amt domain and
the histidine kinase domain. Thus, the signal given by the Amt protein would induce
the activation of the histidine kinase domain, which in the presence of ATP is
phosphorylated. Upon phosphorylation of the histidine kinase domain, transport of
ammonium occurs and a signal is further transmitted to a response regulator. When
the extracellular concentrations of ammonium are high, the sensing function of the
Amt domain ceases and the histidine kinase is dephosphorylated. As a result,
transport of ammonium is inactivated as well as the signal transduction cascade. On
the other hand, the phosphorylated histidine residue could be dephosphorylated
upon interaction with a response regulator protein involved in the transmission of
the signal to the transduction pathway. The dephosphorylation event should then be
the deactivation step of the ammonium transport and thus, the key for the
regulation of the Amt protein. By means of this mechanism and due to the presented
data, Ks-Amt5 can be active only in the presence of ATP and therefore, ammonium
transport requires energy.
Since the localization of this particular protein in the cell is unknown and there are
four other Amt proteins encoded in the genome of “Ca. K. sttutgartiensis”, the real
function of the protein cannot be clarified in the present study. It is likely that the
ammonium transport mechanism is conserved since the molecular structure
obtained for the Amt domain exhibits strong homologies to its counterparts Ec-
AmtB and Af-Amt1. However, the Ks-Amt5 structure obtained was derived from
crystals in the absence of ATP. In the Ks-Amt5 structure the hydrophobic channel is
closed. This observation, in combination with the phosphorylation studies, agrees
with the fact that this particular Amt will transport ammonium only when the
histidine kinase domain is phosphorylated.

Results and discussion
Camila Hernández
124
5.14 Future perspectives
As of yet, many structural, functional and regulatory details of the Amt/Rh protein
family have still to be revealed. Besides the transport features, evidence also shows
these proteins as ammonium sensors. It is still unclear how the signal is transferred
and which are the factors that regulate their activity. In Ec-AmtB the complex
formation with the PII protein GlnK plays a crucial role in the regulation of the
ammonium transport. Other processes that could also regulate the activity of these
proteins involve allosteric changes in the C-terminal region and phosphorylation
events. The structure of Ks-Amt5 strongly supports the similarities between the
members of the Amt family. In addition, it suggests the conservation of the
ammonium transport mechanism among the members of this protein family.
However, it is likely that in Ks-Amt5 the phosphorylation of the histidine kinase is
required for transport.
Despite the high resolution structure and the indication of the existence of a kinase
activity by Ks-Amt5, the obtained results do not explain how both domains are
organized together. The lack of a molecular structure model for the Ks-Kin domain
leads to more questions regarding possible rearrangements that might promote
transport or inactivation of the Amt sensor domain. So far, the presented results
indicate that the Ks-Kin domain works like any other kinase in the presence of ATP.
The Ks-Kin is an active protein able to bind ATP and to carry out an
autophosphorylation reaction. A change in the extracellular ammonium
concentration that can be detected by the Amt domain is thought to be the real
stimulus for the occurrence of phosphorylation. However, in the current study, the
phosphorylation of Ks-Kin occurs regardless of an external stimulus. Therefore, it
will be necessary to design new experiments to answer this problem. Experiments
with the protein reconstituted into proteoliposomes could be an alternative to
evaluate the transport activity of Ks-Amt5; nevertheless, they must be carried out

Results and discussion
Camila Hernández
125
under conditions where the kinase activity can also be monitored. Moreover, based
on the structural knowledge of Ks-Amt5, additional constructs could be designed for
crystallization trials. In this case, mutational studies could also assess the problem
of flexibility. Double mutants for the phosphorylation site in combination with the
ATP binding site or variants completely lacking kinase activity, could be more
suitable for crystallization due to a decrease in the potential conformational changes
related to the ATP binding and phosphorylation reaction. Additional experiments
could include the optimization of samples for SAXS experiments for the full-length
protein. By means of these experiments knowledge on the overall shape of the
protein could be gained. In conclusion, the study of this interesting protein is still
open to further analysis and debate.

Appendix
Camila Hernández
126
6 Appendix
6.1 Abbreviations
2-OG 2-oxoglutarate ADP Adenosine diphosphate Amt Ammonium transport protein AppCp Adenosine-5’-[(β,γ)-methyleno]triphosphate, Sodium salt APS Ammonium persulfate ATP Adenosine triphosphate ATPS Adenosine-5’-O-(3-thio triphosphate) ATPαS Adenosine-5'-(α-thio)-triphosphate BCA Bicinchoninic acid BCIP 5-bromo-4chloro-3-indolylphosphate Bis-tris Bis(2-hydroxyethyl)-amino-tris(hydroxymethyl)-methane BN-PAGE Blue native polyacrylamide gel electrophoresis bp Base pairs CA catalytic domain of a histidine kinase CBB Coomasie brilliant blue CF 5-carboxyfluorescein CMC Critical micellar concentration ddH2O Double deionized water D9M n-nonyl-β-D-maltopyranoside D10M n-decyl-β-D-maltopyranoside D11M n-undecyl-β-D-maltopyranoside DDM n-dodecyl-β-D-maltopyranoside D13M n-tridecyl-β-D-maltopyranoside DESY Deutsches Elektronen-Synchrotron DHp Dimerization domain of a histidine kinase d TP’s deoxy-nucleoside-triphosphate DNA Deoxyribonucleic acid EDTA (Ethylenedinitrilo)tetraacetic acid EMBL European Molecular Biology Laboratory GC base pair of guanine paired with cytosine GTP Guanosine triphosphate HEPES 4-(2-hydroxyethyl)-1-piperazineethanesulfonic acid HK Histidine kinase protein ITC Isothermal titration calorimetry IPTG isopropyl β-D-1-thiogalactopyranoside LDAO lauryl dimethylamine n-oxide LB Luria-Bertani

Appendix
Camila Hernández
127
MA methylamine MAD multiwavelength anomalous dispersion MES 2-(N-morpholino)ethanesulfonic acid MR Molecular replacement NBT nitrotetrazolium blue OD600nm optical density at a wavelength of 600 nm OGP n-octyl-beta-D-glucopyranoside PCR Polymerase chain reaction PDB The RCSB Protein Data Bank PEG polyethylene glycol PDVF polyvinylidendifluoride r.m.s.d. root-mean-square deviation Rh Rhesus protein RNA ribonucleic acid SDS sodium dodecyl sulfate SDS-PAGE sodium dodecyl sulfate polyacrylamide gel electrophoresis
SEC Size exclusion chromatography
TAE Tris-acetate-EDTA TCS Two-component signal transduction system TEMED N,N,N`,N`-Tetramethylethylenediamine Tris tris(hydroxymethyl)aminomethane UV ultraviolet v/v Volume per volume w/v Weight per volume x g Times gravity
6.2 Units
% percentage *g multiple of gravitational acceleration ° degree °C degree Centigrade A ampere Å Angstrom (1 Å = 10-10 m) Au absorption unit Da Dalton g gram h hour L liter M molarity m meter min minute

Appendix
Camila Hernández
128
psi pounds per square inch (1 psi ≈ 0.07 bar) s second V volt
6.3 Prefixes
k kilo (103) c centi (10-2) m mili (10-3) μ micro (10-6) n nano (10-9) p pico (10-12)
6.4 Amino acids
A Ala alanine M Met methionine C Cys cysteine N Asn asparagine D Asp aspartate P Pro proline E Glu glutamate Q Gln glutamine F Phe phenylalanine R Arg arginine G Gly glycine S Ser serine H His histidine T Thr threonine I Ile isoleucine V Val valine K Lys lysine W Trp tryptophane L Leu leucine Y Tyr tyrosine

Appendix
Camila Hernández
129
6.5 Ks-Amt5 DNA sequence
1 ATGGAAAACATACAAATAAATATTAACCATTTGTGGGTGATTATGGCGGC 50
51 CTGCATGGTATTCTTGATGCAGTTGGGTTTTACCTCTTACGAAACCGGAT 100
101 TTTCCCAGTCCAAAAATGCCATCAGTATTGCATTGAGAAATCTCGTAGAT 150
151 ACCCTTATCTCATCACTCGTTTTTTTCAGTGTGGGCTTTGGGTTCATGTT 200
201 TGGCAAAAGCTACATGGGATTGATCGGAATAGATCTTTTCTTCGCAAATG 250
251 ATTTGGCATTGCATCCCAATACGTTATCGTATTCATTCTTTTTTTTCCAA 300
301 ATGGTCTTTGCATCCACAGCCGCCACAATATTAACAGGCGCCATAGCAGA 350
351 ACGCTCCGGTTTTATTCCCAATATAGCAGGTACCGCATTTATTGTTGCCA 400
401 TTATCTATCCAATCTTCGGGCACTGGGCATGGGGCAATCTCTTTTCCCCT 450
451 GATCAAACCGGCTGGTTAAAAGAATTGGGTTTTATTGATTTTGCAGGTGC 500
501 AACGGTAGTACATTCCATCGGCGGCTGGTTTGCCATGGCGGCGGCTATAA 550
551 TGGTAGGGCCAAGAATAGACAAATACAATCCTGACGGATCTTCTAACCGG 600
601 ATTGGGTTACATAATGTACCACTAGCCACATTAGGCACTTTTTTTCTGTG 650
651 GTTTGGTTGGTTTGGTTTTAACGGCGGAAGTCTTTTGAGAGTGAGCGTAA 700
701 ATATCGGATTGGTAATCCTGAATACGAACATGGCCGCCGCCTCTGCCGGG 750
751 GTTTCCGCCCTCATATTTATTTATGCAACAAGAAAAAGGATCGAAGCAGG 800
801 AAGTCTCTTCACTGCGATACTTGCCGGATTAGTTGCCATAACGGCAAGTT 850
851 CAAATATGGTTACCCCAGTCAGCGCAGTAGCTATCGGCCTCATTACCGGC 900
901 ATACTGGCAATCATTGCAGAAGGTTTTATTGAAAAGACTTTGAAAATCGA 950
951 CGACCCCGTAAGCGCCATTGCCGTGCACGGAGTCGGCGGGGTAATAGGTA 1000
1001 CGCTCTGCGTCGCAATATTTGCGCAAAAATCGTATCTTCTTGCGGAAAAC 1050
1051 GGAAGCAGAATGCATCAGTTAGGCATACAGGCGTTAGGCGTTATCGTCGC 1100
1101 CTTTTCATGGTCATTCGGGCTGGGCATGCTTTTCTTCTTGTGCCTAAAGA 1150
1151 AAGTAAAGAGATTACGGGTAACCCCTGAAGAAGAAAAGAGAGGACTGAAT 1200
1201 GTCGCCGAATATGAAGACGTTGCGTCGTGGCTTGATTTTATAAGAATAAC 1250
1251 ACGGCTGCAGGATATAAATACAATACTTGAAAAAAGGGTGCAGGAAAAGA 1300
1301 CAGCAGACCTTCAAATGGCAAATGTTGCTTTAGAAAAGGCAAACAGGCTG 1350
1351 AAATCTGAATTCCTGACAACAATGTCACATGAGCTGCGCACTCCTTTAAA 1400
1401 CGCAATCATTGGATTCGCAGAAGTCTTACGCGACGAAATCGCCGGTTCTC 1450
1451 TCAGCAAAGACCAAAAAGAATACGTAACCGATATTCACAGCAGCGGCCAT 1500
1501 CATCTGCTTGATATGATTAACAACATATTGGACCTTTCAAAAATTGAAAC 1550
1551 GGGGAAAATGCATCTTCAATACGAGGAATTTTGCATTGAAGATGCAATTA 1600
1601 ATGACACACTGACAATTATAAACGCATCCGCCAACAATAAAGGAATTTCC 1650
1651 GTTCATACAAATATACAGGATAACACGCCACTGCTATCCGCTGACAAAAC 1700
1701 AAAATTCAGGCAGATTCTTTATAATTTGCTATCAAATGCAGTGAAATTTA 1750
1751 CCCCTGAAAATGGCAAAATTACTATAAACGTTTTCCAAAAAGACAACTCT 1800
1801 CTGCAATTTGAAATAGTTGATACCGGCATTGGTATAAAGCCTGAAGACAA 1850
1851 AGAGAAATTATTCGAAGCATTTCACCAGGCAGATGCATCGCTTACAAGAG 1900
1901 AATATGAGGGTACAGGGCTTGGATTGCATCTGACAAAACGTCTTGTAGAA 1950
1951 TTACATGGTGGCAAGATATGGGCAGAAAGTACCTTTGGAAAAGGAAGCAC 2000
2001 CTTCTTTTTTATCTTGCCCATAAATCCAGTGAACAAG 2037

Appendix
Camila Hernández
130
6.6 Ks-Amt5 amino acid sequence
The C-terminal histidine kinase domain is highlighted in blue
1 MENIQININHLWVIMAACMVFLMQLGFTSYETGFSQSKNAISIALRNLVD 50
51 TLISSLVFFSVGFGFMFGKSYMGLIGIDLFFANDLALHPNTLSYSFFFFQ 100
101 MVFASTAATILTGAIAERSGFIPNIAGTAFIVAIIYPIFGHWAWGNLFSP 150
151 DQTGWLKELGFIDFAGATVVHSIGGWFAMAAAIMVGPRIDKYNPDGSSNR 200
201 IGLHNVPLATLGTFFLWFGWFGFNGGSLLRVSVNIGLVILNTNMAAASAG 250
251 VSALIFIYATRKRIEAGSLFTAILAGLVAITASSNMVTPVSAVAIGLITG 300
301 ILAIIAEGFIEKTLKIDDPVSAIAVHGVGGVIGTLCVAIFAQKSYLLAEN 350
351 GSRMHQLGIQALGVIVAFSWSFGLGMLFFLCLKKVKRLRVTPEEEKRGLN 400
401 VAEYEDVASWLDFIRITRLQDINTILEKRVQEKTADLQMANVALEKANRL 450
451 KSEFLTTMSHELRTPLNAIIGFAEVLRDEIAGSLSKDQKEYVTDIHSSGH 500
501 HLLDMINNILDLSKIETGKMHLQYEEFCIEDAINDTLTIINASANNKGIS 550
551 VHTNIQDNTPLLSADKTKFRQILYNLLSNAVKFTPENGKITINVFQKDNS 600
601 LQFEIVDTGIGIKPEDKEKLFEAFHQADASLTREYEGTGLGLHLTKRLVE 650
651 LHGGKIWAESTFGKGSTFFFILPINPVNK 679

References
Camila Hernández
131
7 References
Andrade, S.L.A., Dickmanns, A., Ficner, R. & Einsle, O. (2005). “Crystal structure of the archaeal ammonium transporter Amt-1 from Archaeoglobus fulgidus”. Proc. Natl. Acad. Sci. USA. 102: 14994–14999. Andrade, S.L.A., Dickmanns, A., Ficner, R. & Einsle, O. (2005b). “Expression, purification and crystallization of the ammonium transporter Amt-1 from Archaeoglobus fulgidus”. Acta. Cryst. F. 61: 861-863. Andrade, S.L.A. & Einsle, O. (2007). “The Amt/ ep/ h family of ammonium transport proteins”. Mol. Membr. Biol. 24: 357–365. Aravind, L. & Ponting, C.P. (1999). “The cytoplasmic helical linker domain of receptor histidine kinase and methyl-accepting proteins is common to many prokaryotic signalling proteins”. FEMS Microbiol. Lett. 176: 111–116. Arcondéguy, T., Jack, . & errick, . (2001). “PII signal transduction proteins, pivotal players in microbial nitrogen control”. Microbiol. Mol. Biol. Rev. 65: 80–105. Arp, . J., Chain, P.S.G. & Klotz, .G. (2007). “The Impact of Genome Analyses on Our Understanding of Ammonia-Oxidizing Bacteria”. Annu. Rev. Microbiol. 61: 503–528. Banumathi, S., Zwart, P.H., Ramagopal, U.A., Dauter, M. & Dauter, Z. (2004). “Structural effects of radiation damage and its potential for phasing”. Acta Cryst. D. 60: 1085-1093. Bao-zhen, L., Merrick, M., Su-mei, L., Hong-ying, L., Shu-wen, Z., Wei-ming, S. and Yan-hua, S. (2009). “ olecular Basis and egulation of Ammonium Transporter in ice”. Rice Sci. 16: 314-322. Beizt, E. (2000). “TeXtopo: shaded membrane protein topology plots in LaTeX2e,” Bioinformatics. 16: 1050-1051. Bendtsen, J. D., Nielsen, H., von Heijne, G. and Brunak, S. (2004). “Improved prediction of signal peptides: SignalP 3.0”. J. Mol. Biol. 340: 783-795. Berejnov, V., Husseini, N.S., Alsaied, O.A. & .E. Thorne. (2006). “Effects of cryoprotectant concentration and cooling rate on vitrification of aqueous solutions”. J. Appl. Cryst. 39: 244-251. Bertani, G. (1951). “Studies on lysogenesis. I. The mode of phage liberation by lysogenic Escherichia coli”. J. Bacteriol., 62: 293‐300.

References
Camila Hernández
132
Besant, P.G. & Attwood, P. . (2010). “Histidine phosphorilation in histones and in other mammalian proteins”. Methods Enzymol. 471: 403-426. Bilwes, A. ., Alex, L.A., Crane, B. . & Simon, .I. (1999). “Structure of CheA, a signal-transducing histidine kinase”. Cell. 96: 131–141. Bilwes, A. ., Quezada, C. ., Croal, L. ., Crane, B. . & Simon, .I. (2001). “ ucleotide binding by the histidine kinase CheA”. Nat. Struct. Biol. 8: 353–360. Blakey, D., Leech, A., Thomas, G. H., Coutts, G., Findlay, K. & Merrick, M. (2002). “Purification of the Escherichia coli ammonium transporter AmtB reveals a trimeric stoichiometry”. Biochem. J. 364: 527-535. Bostick, .L. & Brooks, C.L. (2007). “ eprotonation by dehydration: the origin of ammonium sensing in the AmtB channel”. PLoS Comput. Biol. 3: 0231-0246. Bragg, W.L. (1913) “The iffraction of Short Electromagnetic Waves by a Crystal”. Proc. Cam. Phil. Soc. 17: 43-57. Broach, J., eumann, C. & Kustu, S. (1976). “ utant strains (nit) of Salmonella typhimurium with a pleiotropic defect in nitrogen metabolism”. J. Bact. 128: 86-98. Bryson, K., McGuffin, L.J., Marsden, R.L., Ward, J.J., Sodhi, J.S. & Jones, D.T. (2005). “Protein structure prediction servers at University College London”. Nucl. Acids Res. 33: W36-W38. Brünger, A.T. (1993). “Assessment of phase accuracy by cross validation: the free value. ethods and applications”. Acta Cryst. D. 49: 24-36. Bullock, W. O., Fernandez, J. . & Short, J. . (1987). “XL1-Blue: A high efficiency plasmid transforming recA- E. coli strain with β-galactosidase selection”. Bio- Techniques 5: 376. Burnette, W. N. (1981). "Western blotting: electrophoretic transfer of proteins from sodium dodecyl sulfate polyacrylamide gels to unmodified nitrocellulose and radiographic detection with antibody and radioiodinated protein A”. Anal. Biochem., 112: 195‐203. Cai, S.J. & Inouye, . (2003). “Spontaneous subunit exchange and biochemical evidence for trans-autophosphorylation in a dimer of Escherichia coli histidine kinase (EnvZ). J. Mol. Biol. 329: 495-503.

References
Camila Hernández
133
Casino, P., ubio, . & arina, A. (2009). “Structural Insight into Partner Specificity and Phosphoryl Transfer in Two-Component Signal Transduction”. Cell. 139: 325-336. Casino, P., Rubio, V. & arina, A. (2010). “The mechanism of signal transduction by two-component systems”. Curr. Op. Struct. Biol. 20: 763-771. Chang, C., Kwok, S.F., Bleecker, A.B. & eyerowitz, E. . (1993). “Arabidopsis ethylene-response gene ETR1: similarity of product to two-component regulators”. Science. 262: 539–544. Chiu, M.L., Tsang, C., Grihalde, N. & MacWilliams, M.P. (2008). “Over-expression, solubilization, and purification of G protein-coupled receptors for structural biology”. Comb. Chem. High Throughput Screen. 11: 439-462. CLC bio A/S. (2005). “CLC sequence viewer”. www.clcbio.com. Cochran, A.G. & Kim, P.S. (1996). “Imitation of Escherichia coli aspartate receptor signaling in engineered dimers of the cytoplasmic domain”. Science. 271: 1113–1116. Collaborative Computational Project umber 4. (1994). “The CCP4 suite: programs for protein crystallography”. Acta Cryst, Sec. D. 50: 760-763. Conroy, M.J., Durand, A., Lupo, D., Li, X.D., Bullough, P.A., Winkler, F.K. & Merrick, M. (2007). “The crystal structure of the Escherichia coli AmtB-GlnK complex reveals how GlnK regulates the ammonia channel”. Proc. Natl. Acad. Sci. USA. 104: 1213-1218. Crowther, .A. & Blow, . . (1967). “A method of positioning a known molecule in an unknown crystal structure”. Acta Cryst. 23: 544-548. Cruickshank, .W. (1999). “ emarks about protein structure precision”. Acta Cryst. D. 55: 583-601 Dauter, Z., Dauter, M. & odson, E. (2002) “Jolly SA ”. Acta Cryst. D. 58: 494-506. eLano, W.L. (2002). “The Py OL olecular Graphics System”. http://www.pymol.org. ixon, . & Kahn . (2004). “Genetic regulation of biological nitrogen fixation”. Nature Rev. Microbiol. 2: 621-631. Dodson, E. (2003). “Is it jolly SA ?”. Acta Cryst. D. 59: 1958-1965.

References
Camila Hernández
134
ong, X., Stothard, P., Forsythe, I.J. & Wishart, .S. (2004). “Plas apper: a web server for drawing and auto-annotating plasmid maps”. Nucleic Acids Res. 32: W660-W664. utta, ., Qin, L. & Inouye, . (1999). “Histidine kinase: diversity of domain organization”. Mol. Microbiol. 34: 633–640. Einsle, O. & Kroneck, P.M.H. (2004). “Structural basis of denitrification”. Biol. Chem. 385: 875–883. Emsley, P. & Cowtan, K. (2004). “Coot: model building tools for molecular graphics” Acta Cryst. D. 60: 2126-2132. Emsley, P., Lohkamp, B., Scott, W.G. & Cowtan, K. (2010). “Features and development of Coot”. Acta Cryst. D. 66: 486-501. Evans, P. (2006). “Scaling and assessment of data quality”. Acta Cryst. D. 62: 72-82. Evans, P. & cCoy, A. (2008). “An introduction to molecular replacement”. Acta Cryst. D. 64: 1-10. Ewald, P. (1969). “Introduction to the dynamical theory of X-ray diffraction”. Acta Cryst. Sec. A. 25: 203-208. Fabret, C., Feher, V.A. & Hoch, J.A. (1999). “Two-component signal transduction in Bacillus subtilis: how one organism sees its world”. J. Bacteriol. 181: 1975–1983. Faham, S. & Bowie, J.U. (2002). “Bicelle crystallization: a new method for crystallizing membrane proterins yields a monomeric bacteriorhodopsin structure”. J. Mol. Biol. 316: 1-6. Falke, J.J. & Hazelbauer, G.L. (2001). “Transmembrane signaling in bacterial chemoreceptors”. Trends Biochem. Sci. 26: 257–265. Falkowski, P.G., Barber, .T. & Smetacek, . (1998). “Biogeochemical Controls and Feedbacks on Ocean Primary Production”. Science. 281: 200-206. Fazekas de St Groth, S., Webster, R. G. & Datyner, A. (1963). “Two new staining procedures for quantitative estimation of proteins on electrophoretic strips”. Biochim. Biophys. Acta., 71: 377-391.

References
Camila Hernández
135
Fong, . ., Kim, K.S., Yoshihara, C., Inwood, W.B. & Kustu, S. (2007). “The W148L substitution in the Escherichia coli ammonium channel AmtB increases flux and indicates that the substrate is an ion”. Proc. Natl. Acad. Sci. USA. 104: 18706–18711. Forchhammer, K. (2004). “Global carbon/nitrogen control by PII signal transduction in cyanobacteria: from signals to targets”. FEMS Microbiol. Rev. 28: 319–333. Forchhammer, K. (2008). “PII signal transducers: novel functional and structural insights”. Trends Microbiol. 16: 65-72. Fujinaga, . & ead, .J. (1987). “Experiences with a new translation function program”. J. App. Cryst. 20: 517-521. Galagan, J.E., Nusbaum, C., Roy, A., Endrizzi, M.G., MacDonald, P., FritzHugh, W., Calvo, S., Engels, R., Smirnov, S., Atmoor, D., Brown, A., Allen, N., Naylor, J., Stange-Thormann, N., DeArcellano, K., Johnson, R., Linton, L., McEwan, P., McKernan, K., Talamas, J., Tirrell, A., Ye, W., Zimmer, A., Barber, R.D., Cann, I., Graham, D.E., Graham, D.A., Guss, A.M., Hedderich, R., Ingram-Smith, C., Kuettner, H.C., Krzycki, J.A., Leigh, J.A., Li, W., Liu, J., Mukhopadhyay, B., Reeve, J.N., Smith, K., Springer, T.A., Umayam, L.A., White, O., White, R.H., Conway de Macario, E., Ferry, J.G., Jarrell, K.F., Jing, H., Macario, A.J., Paulsen, I., Pritchett, M., Sowers, K.R., Swanson, R.V., Zinder, S.H., Lander, E., etcalf, W.W. & Birren, B. (2002). “The genome of . acetivorans reveals extensive metabolic and physiological diversity”. Genome Res. 12: 532-542. Garman, E. & Owen, .L. (2006). “Cryocrystallography of macromolecules: practice and optimization”. Methods Mol. Biol. 364: 1-18. Gasteiger, E., Hoogland, C., Gattiker, A., Duvaud, S., Wilkins, M. R., Appel ,R. D. & Bairoch A. (2005). “Protein Identification and Analysis Tools on the ExPASy Server”. The Proteomics Protocols Handbook. Humana Press. 571-607. Gazzarrini, S., Lejay, L., Gojon, A., Ninnemann, O., Frommer, W.B. & von Wiren, N. (1999). “Three functional transporters for constitutive, diurnally regulated, and starvation-induced uptake of ammonium into Arabidopsis roots”. Plant Cell. 11: 937-948. Green, .W., Ingram, . . & Perutz, .F. (1954). “The structure of hemoglobin. IV. Sign determination by the isomorphous replacement method”. Proc. Roy. Soc. A. 225: 287-307. Gruswitz, F., O’Connell, J. & Stroud, . . (2007). “Inhibitory complex of the transmembrane ammonia channel, AmtB, and the cytosolic regulatory protein, GlnK, at 1.96 Å”. Proc. Natl. Acad. Sci. USA. 104: 42–47.

References
Camila Hernández
136
Gruswitz, F., Chaudhary, S., Ho, J.D., Schlessinger, A., Pezeshki, B., Ho, C.M., Sali, A., Westhoff, C.M. & Stroud R.M. (2010). “Function of human h based on structure of hCG at 2.1 Å”. Proc. Natl. Acad. Sci. USA. 107: 9638–9643. Hanahan, D. (1983). “Studies on transformation of Escherichia coli with plasmids”. J. Mol. Biol., 166: 557‐580. Hendrickson, W.A., Smith, J.L., Phizackerley, R.P. & Merrit, E.A. (1988). “Crystallographic structure analysis of lamprey hemoglobin from anomalous dispersion of synchrotron radiation”. Proteins. 4: 77-88. Hess, D.C., Lu, W., Rabinowitz, J.D. & Botstein, D. (2006). “Ammonium toxicity and potassium limitation in yeast”. PloS Biol. 4: 2012-2023. Honig, B. & icholls, A. (1995). “Classical electrostatics in biology and chemistry”. Science. 268: 1144-1149. Hsing, W., usso, F. ., Bernd, K.K. & Silhavy, T.J. (1998). “ utations that alter the kinase and phosphatase activities of the two-component sensor EnvZ”. J. Bacteriol. 180: 4538–4546. Huber, . (1965). “ ie automatisierte Faltmoleku lmethode”. Acta Cryst. 19: 353-356. Javelle, A., Severi, E., Thornton, J. & errick, . (2004). “Ammonium sensing in Escherichia coli. Role of the ammonium transporter AmtB and AmtB-GlnK complex formation”. J. Biol. Chem. 279: 8530–8538. Javelle, A. & errick, . (2005). “Complex formation between AmtB and GlnK: an ancestral role in prokaryotic nitrogen control”. Biochem. Soc. Trans. 33: 170-172. Javelle, A., Lupo, D., Zheng, L., Li, X.D., Winkler, F.K. & Merrick, M. (2006). “An unusual twin-his arrangement in the pore of ammonia channels is essential for substrate conductance”. J. Biol. Chem. 281: 39492–39498. Javelle, A., Lupo, D., Li, X.D., Merrick, M., Chami, M., Ripoche, P. & Winkler, F.K. (2007). “Structural and mechanistic aspects of Amt/ h proteins”. J. Struct. Biol. 158: 472–481. Javelle, A., Lupo, D., Ripoche, P., Fulford, T., Merrick, M. & Winkler, F.K. (2008). “Substrate binding, deprotonation and selectivity at the periplasmic entrance of the E. coli ammonia channel AmtB”. Proc. Natl. Acad. Sci. USA. 105: 5040-5045. Jetten, M.S.M., Schmid, M., Schmidt, I., Wubben, M., van Dongen, U., Abma, W., Sliekers, O., Revsbech, N.P., Beaumont, H.J.E., Ottosen, L., Volcke, E., Laanbroek, H.J.,

References
Camila Hernández
137
Campos-Gomez, J.L., Cole, J., van Loosdrecht, M., Mulder, J.W., Fuerst, J., Richardson, D., van de Pas, K., Mendez-Pampin, R., Third, K., Cirpus, I., van Spanning, R., Bollmann, A., Nielsen, L.P., Op den Camp, H., Schultz, C., Gundersen, J., Vanrolleghem, P., Strous, ., Wagner, . & Kuenen, J.G. (2002). “Improved nitrogen removal by application of new nitrogen-cycle bacteria”. Rev. Environ. Sci. Biotechnol. 1: 51-63. Jetten, M.S., Cirpus, I., Kartal, B. et al. (2005a). “1994–2004: 10 years of research on the anaerobic oxidation of ammonium”. Biochem. Soc. Trans. 33: 119–133. Jetten, ., Schmid, ., van de Pas-Schoonen, K., Sinninghe- amste, J.S. & Strous, M. (2005b). “Anammox Organisms: Enrichment, Cultivation, and Environmental Analysis”. Methods. Enzymol. 397: 34-57. Jetten, M.S.M., Niftrik, L., Strous, M., Kartal, B., Keltjens, J.T., Op den Camp, H.J. (2009). “Biochemistry and molecular biology of anammox bacteria”. Crit. Rev. Biochem. Mol. Biol. 44: 1-20. Jiang, P. & Ninfa, A.J. (2007). “Escherichia coli PII signal transduction protein controlling nitrogen assimilation acts as a sensor of adenylate energy charge in Vitro”. Biochemistry. 46: 12976–12986. Jones, .T. (1999). “Protein secondary structure prediction based on position-specific scoring matrices”. J. Mol. Biol. 292: 195-202. Kartal, B., Rattray, J., van Niftrik, L., van de Vossenberg, J., Schmid, M., Webb, R.I., Schouten, S., Fuerst, J.A., Sinninghe- amste, J.S., Jetten, M.S.M. & Strous, M. (2007). “Candidatus Anammoxoglobus propionicus” gen. nov., sp. nov., a new propionate oxidizing species of anaerobic ammonium oxidizing bacteria”. Syst. Appl. Microbiol. 30: 39–49. Kartal, B., van Niftrik, L., Rattray, J., van de Vossenberg, J., Schmid, M.C., Damste, J.S.S., Jetten, M.S.M. & Strous, M. (2008). “Candidatus Brocadia fulgida”: an autofluorescent anaerobic ammonium oxidizing bacterium”. FEMS Microbiol. Ecol. 63: 46–55. Khademi, S., O’Connell, J., emis, J., obles-Colmenares, Y., Miercke, L. J. & Stroud, R. . (2004). “ echanism of ammonia transport by Amt/ EP/ h: structure of AmtB at 1.35 Å”. Science 305: 1587–1594. Khademi, S. & Stroud, . . (2006). “The Amt/ EP/ h Family: Structure of AmtB and the echanism of Ammonia Gas Conduction”. Physiology. 21: 419–429. Kleiner, . (1985a). “Bacterial ammonium transport”. FEBS Microbiol. Rev. 32: 87–100.

References
Camila Hernández
138
Kleiner, . (1985). “Energy expenditure for cyclic retention of H3/NH4+ during N2 fixation by Klebsiella pneumoniae”. FEBS Lett. 187: 237–239. Klotz, .G. & Stein, L.Y. (2008). “ itrifier genomics and evolution of the nitrogen cycle”. FEMS Microbiol. Lett. 278: 146–156. Klumpp, S., & Krieglstein, J. (2002). “Phosphorylation and dephosphorylation of histidine residues in proteins”. Eur. J. Biochem. 269: 1067–1071. Knepper, .A. (1991). “ H4+ transport in the kidney” Kidney Int. Suppl. 33: S95-S102. Krell, T., Lacal, J., Busch, A., Silva-Jimenez, H., Guazzaroni, M.E. & Ramos, J.L. (2010). “Bacterial sensor kinases: iversity in the recognition of environmental signals”. Annu.Rev.Microbiol. 64: 539-559. Krogh, A., Larsson, B., von Heijne, G. & Sonnhammer, E.L.L. (2001). “Predicting transmembrane protein topology with a hidden Markov model: Application to complete genomes”. J. ol. Biol. 305:567-580. Kuenen, J.G. (2008). “Anammox bacteria: from discovery to application”. Nature Rev. Microbiol. 6: 320-326. Kuenen, J.G. & Jetten, M.S.M. (2001). “Extraordinary anaerobic ammonium oxidizing bacteria”. A.S.M. News. 67: 456-463. Kuypers, M.M.M., Sliekers, A.O, Lavik, G., Schmid, M., Jørgensen, B.B., Kuenen, J.G., Sinninghe- amste, J.S., Strous, . & Jetten, .S. . (2003). “Anaerobic ammonium oxidation by anammox bacteria in the Black Sea”. Nature. 422: 608-611. Lacapère, J.J., Pebay-Peyroula, E., Neumann, J.M. & Etchebest, C. (2007). “ etermining membrane protein structures: still a challenge!”. TRENDS Biochem. Sci. 32: 259-270. Laemmli, U. K. (1970). “Cleavage of structural proteins during the assembly of the head of bacteriophage T4”. Nature, 227: 680-685. Lamoureux, G., Javelle, A., Baday, S., Wang, S. & Berneche, S. (2010). “Transport mechanisms in the ammonium transporter family”. Transfus. Clin. Biol. 17: 168-175. Lande, M.B., Donovan, J.M. & Zeidel, M.L. (1995). “The relationship between membrane fluidity and permeabilities to water, solutes, ammonia, and protons”. J. Gen. Physiol. 106: 67–84.

References
Camila Hernández
139
Larkin, M.A., Blackshields, G., Brown, N.P., Chenna, R., McGettigan, P.A., McWilliam, H., Valentin, F., Wallace, I.M., Wilm, A., Lopez, R., Thompson, J.D., Gibson, T.J. & Higgins, .G. (2007). “Clustal W and Clustal X version 2.0”. Bioinformatics. 23: 2947-2948. Laskowski, R.A., MacArthur, M.W., Moss, D.S. & Thornton, J.M. (1993). “Procheck: a program to check the stereochemical quality of protein structures”. J.Appl.Cryst. 26: 283-291. Leslie, A.G.W. (1992). “ ecent changes to the OSFL package for processing film and image plate data”. Joint CCP4 + ESF-EAMCB Newsletter Prot. Cryst. 26. Levenberg, K. (1994). “A ethod for the Solution of Certain Problems in Least Squares”. Quart. Appl. Math. 2: 164-168. Li, X., Jayachandran, S., Nguyen, H.H. & Chan, M.K. (2007). “Structure of the Nitrosomonas europaea h protein”. Proc. Natl. Acad. Sci. USA. 104: 19279–19284. Loque , D., Lalonde, S., Looger, L.L., von Wirén, N., & Frommer, W.B. (2007). “A cytosolic trans-activation domain essential for ammonium uptake”. Nature. 446: 195-198. Loque , ., ora, S.I., Andrade, S.L.A., Pantoja, O. Frommer W.B. (2009). “Pore Mutations in Ammonium Transporter AMT1 with Increased Electrogenic Ammonium Transport Activity”. J. Biol. Chem. 284: 24988–24995. Ludewig, U., von Wirén, N., Rentsch, D. & Frommer W.B. (2001). “ hesus factors and ammonium: a function in efflux?”. Genome Biol. 2: 1010.1-1010.5. Ludewig, U., von Wire n, N. & Frommer, W.B. (2002). “Uniport of H4+ by the root hair plasma membrane ammonium transporter LeA T1;1”. J. Biol. Chem. 277: 13548–13555. Ludewig, U., Wilken, S., Wu, B., Jost, W., Obrdlik, P., El Bakkoury, M., Marini, A.M., Andre, B., Hamacher, T., Boles, E., von Wiren, . & Frommer, W.B. (2003). “Homo- and hetero-oligomerization of AMT1 NH4+-uniporters”. J. Biol. Chem. 278: 45603-45610. Ludewig, U. (2006). “Ion transport versus gas conduction: function of A T/ h- type proteins”. Transfus. Clin. Biol. 13: 111–116. Lukat- odgers, G.S., & odgers, K. . (1997). “Characterization of Ferrous FixL− itric Oxide Adducts by Resonance aman Spectroscopy”. Biochemistry. 36: 4178-4187.

References
Camila Hernández
140
Lupo, D., Li, X.D., Durand, A., Tomizaki, T., Cherif-Zahar, B., Matassi, G., Merrick, M. & Winkler, F.K. (2007). “The 1.3-Å resolution structure of Nitrosomonas europaea Rh50 and mechanistic implications for NH3 trasnport by hesus family proteins”. Proc. Natl. Acad. Sci. USA. 104: 19303–19308. Maeda, T., Wurgler- urphy, S. . & Saito, H. (1994). “A two- component system that regulates an osmosensing AP kinase cascade in yeast”. Nature. 369: 242–245. Marina, A., Mott, C., Auyzenberg, A., Hendrickson, W.A. & Waldburger, C.D. (2001). “Structural and utational Analysis of the PhoQ Histidine Kinase Catalytic omain”. J. Biol. Chem. 276: 41182-41190. Marina, A., Waldburger, C.D. & Hendrickson, W.A (2005). “Structure of the entire cytoplasmic portion of a sensor histidine-kinase protein”. EMBO J. 24: 4247-4259. arini, A. ., issers, S., Urrestarazu, A. & André, B. (1994). “Cloning and expression of the MEP1 gene encoding an ammonium transporter in Saccharomyces cerevisiae”. EMBO J. 13: 3456-3463. Marini, A.M., Soussi-Boudekou, S., issers, S., & André, B. (1997). “A family of ammonium transporters in Saccharomyces cerevisiae”. Mol. Cell. Biol. 17: 4282-4293. Marini, A.M., Boeckstaens, M., Benjelloun, F., Cheri f-Zahar, B. & André, B. (2006). “Structural involvement in substrate recognition of an essential aspartate residue conserved in Mep/Amt and Rh-type ammonium transporters”. Curr. Gent. 49: 364-374. arquardt, . (1963). “An Algorithm for Least-Squares Estimation of Nonlinear Pa- rameters”. SIAM J. Appl. Math. 11: 431-441. atthews, B.W. (1968). “Solvent content of protein crystals”. J. Mol. Biol. 33: 491-497. atthews, B.W. (1976). “X-ray Crystallographic Studies of Proteins”. Ann. Rev. Phys. Chem. 27: 493-493. ayer, . & Ludewig, U. (2006). “ ole of A T1;1 in H4+ acquisition in Arabidopsis thaliana. Plant Biol. 8: 522-528. McPherson, A. (1982). “Preparation and analysis of protein crystals”. ew York: Wiley & Sons.

References
Camila Hernández
141
Meyer, T. S. & Lamberts, B. L. (1965). “Use of coomassie brilliant blue 250 for the electrophoresis of microgram quantities of parotid saliva proteins on acrylamide gel strips. Biochim. Biophys. Acta., 107: 144‐145. iroux, B. & Walker, J. E. (1996). “Over-production of proteins in E. coli: Mutant Hosts that allow Synthesis of some Membrane Proteins and Globular Proteins at High Levels”. J. Mol. Biol. 260: 289-298. Miyatake, H., Mukai, M., Adachi, S., Nakamura, H., Tamura, K., Iizuka, T., Shiro, Y., Strange, R.W. & Hasnain, S.S. (1999). “Iron coordination structures of oxygen sensor FixL characterized by Fe K-edge extended x-ray absorption fine structure and resonance aman spectroscopy”. J. Biol. Chem. 274: 23176–23184. Mouro-Chanteloup, I., Cochet, S., Chami, M., Genetet, S., Zidi-Yahiaoui, N., Engel, A., Colin, Y., Bertrand, O. & ipoche, P. (2010). “Functional reconstitution into liposomes of purified human hCG ammonia channel”. PLoS One. 5: 1-7. urshudov, G. ., agin, A.A. & obson, E.J. (1997). “ efinement of macromolecular structures by the maximum-likelihood method”. Acta Cryst. D. 53: 240-255. Nakhoul, N.L., Dejong, H., Abdulnour-Nakhoul, S.M., Boulpaep, E.L., Hering-Smith, K. & Hamm, L.L. (2005). “Characteristics of renal hbg as an H4+ transporter”. Am. J. Physiol. Ren. Physiol. 288: F170-F181. ewby, Z.E. ., O’connell III, J. ., Gruswitz, F., Hays, F.A., Harries, W.E.C., Harwood, I. ., Ho, J. ., Lee, J.K., Savage, .F., iercke, L.J.W. & Stroud, . . (2009). “A general protocol for the crystallization of membrane proteins for X-ray structural investigation”. Nature protocols. 4: 619-637. eylon, C. (2008). “Small angle neutron and X-ray scattering in structural biology: recent examples from the literature”. Eur. Biophys. J. Biophys. Lett. 37: 531-541. infa, A.J. & Atkinson . . (2000). “PII signal transduction proteins”. Trends Microbiol. 8: 172-179. infa, A.J. & Jiang, P. (2005). “PII signal transduction proteins: sensors of alpha-ketoglutarate that regulate nitrogen metabolism”. Curr. Opin. Microbiol. 8: 168–173. Ninnemann, O., Jauniaux, J.C. & Frommer, W.B. (1994). “Identification of a high affinity NH4+ transporter from plants”. EMBO J. 13: 3464-3471. u hse, T.S., Stensballe, A., Jensen, O.N. & Peck, S.C. (2004). “Phosphoproteomics of the arabisopsis plasma membrane and a new phosphorylation site database”. Plant Cell. 16: 2394-2405.

References
Camila Hernández
142
ygaard, T.P., ovira, C., Peters, G.H. & Jensen, .Ø. (2006). “Ammonium recruitment and ammonia transport by E. coli ammonia channel AmtB”. Biophys. J. 91: 4401–4412. Ota, I. . & arshavsky, A. (1993). “A yeast protein similar to bacterial two-component regulators”. Science. 262: 566–569. Parkinson, J.S. & Kofoid, E.C. (1992). “Communication modules in bacterial signaling proteins”. Annu. Rev. Genet. 26: 71–112. Patterson, A.L. (1934). “A Fourier Series ethod for the etermination of the Com- ponents of Interatomic istances in Crystals”. Phys. Rev. 46: 372-376. Perutz, . (1956). “Isomorphous replacement and phase determination in non-centrosymmetric space groups”. Acta Cryst. 9: 867-873. Pierce, . ., aman, C.S. & all, B.T. (1999). “Isothermal Titration Calorimetry of Protein-Protein Interactions”. Methods. 19: 213-221. Purich, .L. (1998). “Advances in the enzymology of glutamine synthesis”. In: Purich, D.L. (ed) Amino Acid Metabolism, pp 9-42. John Wiley &Sons, New York. Quan, Z.X., Rhee, S.K., Zuo, J.E., Yang, Y., Bae, J.W., Park, J.R., Lee, S.T. & Park, Y.H. (2008). “ iversity of ammonium-oxidizing bacteria in a granular sludge anaerobic ammonium-oxidizing (anammox) reactor”. Environ. Microbiol. 10: 3130–3139. Ramachandran, G.N. & Sasisekharan, V. (1968). “Conformation of polypeptides and Proteins”. Adv. Prot. Chem. 23: 283-438. ees, .C. & Howard, J.B. (2000). “ itrogenase: standing at the crossroads”. Curr. Opin. Chem. Biol. 4: 559-566. Rees, D. C., Tezcan, F. A., Haynes, C. A., Walton, M. Y., Andrade, S., Einsle, O. & Howard, J. B. (2005). “Structural basis of biological nitrogen fixation”. Philos. Trans. R. Soc. London. 363: 971–984. Reinelt., S., Hofmann, E., Gerharz, T., Bott, M. & Madden, D.R. (2003). “The structure of the periplasmic ligand-binding domain of the sensor histidine kinase CitA reveals the first extracellular PAS domain”. J. Biol. Chem. 278: 39189-39196. eitzer, L. (2003). “ itrogen assimilation and global regulation in Escherichia coli”. Annu. Rev. Microbiol. 57: 155–176.

References
Camila Hernández
143
Renart, J., Reiser, J. & Stark, G. R. (1979). “Transfer of proteins from gels to diazobenzyloxymethyl paper and detection with antisera: a method for studying antibody specificity and antigen structure”. Proc. Natl. Acad. Sci. USA, 76: 3116-3120. eynolds, J.A. & Tanford, C. (1970). “The gross conformation of protein-sodium dodecyl sulfate complexes”. J. Biol. Chem. 245: 5161-5165. Ripoche, P., Bertrand, O., Gane, P., Birkenmeier, C., Colin, Y. & Cartron, J.P. (2004). “Human hesus-associated glycoprotein mediates facilitated transport of NH3 into red blood cells”. Proc. Natl. Acad. Sci. USA. 101: 17222–17227. occhia, W., Alexov, E. & Honig, B. (2001). “Extending the applicability of the nonlinear Poisson-Boltzmann equation: multiple dielectric constants and multivalent ions”. J. Phys. Chem. B. 105: 6754. hodes, G. (2006). “Crystallography made crystal clear: a guide for users of macromolecular models”. Amsterdam, Oxford Academic. Rossmann, M. G. & Blow, D. M. (1962). “The detection of subunits within the crystallographic asymmetric unit”. Acta Cryst. 15: 24-31. Sakai, H., Wang, H.F., Takemoto-Hori, C., Kaminishi, T., Yamaguchi, H., Kamewari, Y., Terada, T., Kuramitsu, S., Shirouzu, . & Yokoyama, S. (2005). “Crystal structures of the signal transducing protein GlnK from Thermus thermophilus Hb8”. J. Struct. Biol. 149: 99– 110. Schägger, H. & Jagow, G. (1991). "Blue native electrophoresis for isolation of membrane protein complexes in enzymatically active form". Anal. Biochem., 199 (2): 223-231. Schmid, M., Twachtmann, U., Klein, M., Strous, M., Juetschko, S., Jetten, M., Metzger, J.W., Schleifer, K.H. & Wagner, M. (2000). “ olecular Evidence for Genus Level Diversity of Bacteria Capable to Catalyze Anaerobic Ammonium-Oxidation”. System. Appl. Microbiol. 23: 93-106 Schmid, ., Walsh, K., Webb, ., ijpstra, W.I.C., van de Pas‐Schoonen, K.T., Verbruggen, M.J., Hill, T., Moffett, B., Fuerst, J., Schouten, S., Damste, J.S.S., Harris, J., Shaw, P., Jetten, .S. ., and Strous, . (2003). “Candidatus Scalindua brodae’’, sp. nov., Candidatus Scalindua wagneri’’, sp. nov., two new species of anaerobic ammonium oxidizing bacteria”. Syst. Appl. Microbiol. 26: 529–538. Schmid, M.C., Risgaard-Petersen, N., van de Vossenberg, J., Kuypers, M.M.M., Lavik, G., Petersen, J., Hulth, S., Thamdrup, B., Canfield, D., Dalsgaard, T., Rysgaard, S., Seir,

References
Camila Hernández
144
M.K., Strous, M., Op den Camp, H.J. . & Jetten, .S. . (2007). “Anaerobic ammonium-oxidizing bacteria in marine environments: widespread occurrence but low diversity”. Environ. Microbiol. 9: 1476-1484. Schmidt, I., Bock, E. & Jetten, M.S.M. (2001). “Ammonia oxidation by itrosomonas eutropha with O2 as oxidant is not inhibited by acetylene”. Microbiology 147: 2247–2253. Schrödinger, LLC. (2009). “The Py OL olecular Graphics System, ersion 1.2r3pre”. http://www.pymol.org. Sevvana, M., Vijayan, V., Zweckstetter, M., Reinelt, S. & Madden, D.R. (2008). “A ligand-induced switch in the periplasmic domain of the sensor histidine kinase CitA”. J. Mol. Biol. 377: 512-523. Sinninghe- amste , J.S., Rijpstra, W.I.C., Strous, M., Jetten, M.S.M., David, O.R.P., Geenevasen, J.A.J. & van aarseveen, J.H. (2004). “A mixed ladderane/n-alkyl glycerol diether membrane lipid in an anaerobic ammonium-oxidizing bacterium”. Chem. Commun. 22: 2590–2591. Smith, P. K., Krohn, R. I., Hermanson, R. I., Mallia, A. K., Gartner, F. H., Provenzano, M. ., Fujimoto, E. K., Goeke, . ., Olson, B. J. & Klenk, . C. (1985). “ easurement of protein using bicinchoninic acid”. Anal. Biochem., 150: 75-85. Sonnhammer, E.L.L, von Heijne, G. & Krogh, A. (1998). “A hidden Markov model for predicting transmembrane helices in protein sequences”. In J. Glasgow, T. Littlejohn, F. Major, R. Lathrop, D. Sankoff, and C. Sensen, editors, Proceedings of the Sixth International Conference on Intelligent Systems for Molecular Biology, pages 175-182, Menlo Park, CA, 1998. AAAI Press. Soupene, E., He, L., Yan, . & Kustu, S. (1998). “Ammonia acquisition in enteric bacteria: physiological role of the ammonium/methylammonium transport B (AmtB) protein”. Proc. Natl. Acad. Sci. USA. 95: 7030-7034. Soupene, E., Lee, H. & Kustu, S. (2002). “Ammonium/methylammonium transport (Amt) proteins facilitate diffusion of NH3 bidirectionally”. Proc. Natl. Acad. Sci. USA. 99: 3926-3931. Stock, J.B., infa, A., & Stock, A. . (1989). “Protein phosphorylation and regulation of adaptive responses in bacteria”. Microbiol. Rev. 53: 450-490. Stock, A. ., obinson, .L., & Goudreau, P. . (2000). “Two-component signal transduction”. Annu. Rev. Biochem. 69: 183–215.

References
Camila Hernández
145
Strous, M., Heijnen, J.J., Kuenen, J.G. & Jetten, M.S.M. (1998). The sequencing batch reactor as a powerful tool for the study of slowly growing anaerobic ammonium-oxidizing microorganisms”. Appl. Microbiol. Biotechnol. 50: 589-596. Strous, M., Fuerst, J.A., Kramer, E.H.M., Logemann, S., Muyzer, G., van de Pas-Schoonen, K.T., Webb, ., Kuenen, J.G. and Jetten, .S. . (1999). “ issing lithotroph identified as new planctomycete”. Nature. 400: 446–449. Strous, M., Pelletier, E., Mangenot, S., Rattei, T., Lehner, A., Taylor, M.W., Horn, M., Daims, H., Bartol-Marvel, D., Wincker, P., Barbe, V., Fonknechten, N., Vallenet, D., Segurens, B., Schenowitz-Truong, C., Médigue, C., Collingro, A., Snel, B., Dutilh, B.E., et al. (2006). “ eciphering the evolution and metabolism of an anammox bacterium from a community genome”. Nature. 440: 790-794. Studier, F. W. & Moffatt, B. A. (1986). “Use of bacteriophage T7 RNA polymerase to direct selective high level expression of cloned genes”. J. Mol. Biol., 189: 113-130. Stura, E. A. (1999). “ everse screening. In: Crystallization of proteins: Techniques, strategies and tips”. A laboratory manual (Bergfors T.). 113–124. Internaltional university line Stura, E. A., emerow, G. . & Wilson, I. A. (1992). “Strategies in the crystallization of glycoproteins and protein complexes”. J. Cryst. Growth. 122: 273–285. Stura, E. A., Sattertwaith, A. C., Calvo, J. C., Kaslow, D. C. & Wilson, I. A. (1994). “ everse screening”. Acta Cryst. D50: 448–455. Szczerba, M.W., Britto, D.T., Ali, S.A., Balkos, K. . & Kronzucker, H.J. (2008). “ H4+ stimulated and inhibited components of K+ transport in rice (Oryza sativa)”. J. Exp. Bot. 59: 3415-3423. Tanaka, T., Kawata, . & ukai, K. (1991). “Altered phosphorylation of Bacillus subtilis DegU caused by single amino acid changes in egS”. J. Bacteriol. 173: 5507–5515. Tanaka, T., Saha, S.K., Tomomori, C., Ishima, R., Liu, D., Tong, K.I., Park, H., Dutta, R., Swindells, M.B., Yamazaki, T., Ono, A.M., Kainosho, M., Inouye, M. & Ikura, M. (1998).“NMR structure of the histidine kinase domain of the E. coli osmosensor EnvZ”. Nature. 396: 88–92. Tawa, P. & Steart, .C. (1994). “Kinetics of CheA autophosphorylation and dephosphorylation reactions”. Biochem. 33: 7917-7924.

References
Camila Hernández
146
Taylor, B.L. & Zhulin, I.B. (1999). “PAS domains: internal sensors of oxygen, redox potential, and light.”. Microbiol. Mol. Biol. Rev. 63: 479-506. Taylor, G. (2003). “The phase problem”. Acta Cryst. D. 59: 1881-1890. Thomas, G.H., ullings, J.G.L. & errick, . (2000a). “ embrane topology of the ep/Amt family of ammonium transporters”. Mol. Microbiol. 37: 331-344. Thomas, G., Coutts, G. & errick, . (2000b). “The glnKamtB operon. A conserved gene pair in prokaryotes”. Trends Genet. 16: 11–14. Thompson, J.D., Gibson, T.J. & Higgins, .G. (2002). “ ultiple sequence alignment using ClustalW and ClustlX”. Curr. Prot. Bioinfo. Chapter 2: Unit 2.3. Tomomori, C., Tanaka, T., Dutta, R., Park, H., Saha, S.K., Zhu, Y., Ishima, R., Liu, D., Tong, K.I., Kurokawa, H., Qian, H., Inouye, M. & Ikura, M. (1999). “Solution structure of the homodimeric core domain of Escherichia coli histidine kinase EnvZ”. Nat. Struct. Biol. 6: 729–734. Towbin, H., Staehelin, T. & Gordon, J. (1979). “Electrophoretic transfer of proteins from polyacrylamide gels to nitrocellulose sheets: procedure and some applications”. Proc. Natl. Acad. Sci. USA, 76: 4350‐4354. Tremblay, P.L. & Hallenbeck, P.C. (2008). “Of blood, brains and bacteria, the Amt/ h transporter family: emerging role of Amt as a unique microbial sensor”. Mol. Microbiol. 71: 12–22. agin, A. & Teplyakov, A. (1997). “ OL EP: an automated program for molecular replacement”. J. Appl. Cryst. 30: 1022-1025. VanAken, T., Foxall-VanAken, S., Castleman, S. and Ferguson-Miller, S. (1986). “Alkyl glycoside detergents: synthesis and applications to the study of membrane proteins”. Methods Enzymol. 125: 27-35 van de ossenberg, J., attray, J.E., Geerts, W., Kartal, B., van iftrik, L., van onselaar, E.G., Sinninghe- amste , J.S., Strous, M. & Jetten, M.S.M. (2008). “Enrichment and characterization of marine anammox bacteria associated with global nitrogen gas production”. Environ. Microbiol. 10: 3120–3129. van Dommelen, A., de Mot, R. & Vanderleyden, J. (2001). “Ammonium transport: unifying concepts and unique aspects”. Aust. J. Plant Physiol. 28: 959-967.

References
Camila Hernández
147
van Niftrik, L.A., Fuerst, J.A., Damste, J.S.S., Kuenen, J.G., Jetten, M.S.M. & Strous, M. (2004). “The anammoxosome: an intracytoplasmic compartment in anammox bacteria”. FEMS Microbiol. Lett. 233: 7-13. van Niftrik, L.A., Geerts, W.J.C., van Donselaar, E.G., Humbel, B.M., Webb, R.I., Fuerst, J.A., erkleij, A.J., Jetten, .S. . & Strous, . (2008). “Linking Ultrastructure and Function in Four Genera of Anaerobic Ammonium-Oxidizing Bacteria: Cell Plan, Glycogen Storage, and Localization of Cytochrome c Proteins”. J. Bact. 190: 708-717. o gtle, F.N., Schmidt, O., Chacinska, A., Pfanner, N. & Meisinger, C. (2010). “ ative techniques for analysis of mitochondrial protein import. Methods Mol. Biol. 619: 425-436. von Heijine, G. & Gavel, Y. (1988). “Topogenic signals in integral membrane proteins” Eur. J. Biochem. 174: 671-678. von Wirén, N., Gazzarrini, S., Gojont, A. & Frommer, W.B. (2000). “The molecular physiology of ammonium uptake and retrieval”. Curr. Opin. Plant Biol., 3: 254-261. Weiss, M.S., Sicker, T., Djinovic-Carugo, K. & Hilgenfeld, R. (2001). “On the routine use of soft X‐rays in macromolecular crystallography”. Acta Cryst. D. 57: 689-695. West, A.H. & Stock, A.M. (2001). “Histidine kinases and response regulator proteins in two-component signaling systems”. Trends Biochem. Sci. 26: 369-376. Williams, S.B. & Stewart, . (1999). “Functional similarities among two-component sensors and methyl-accepting chemotaxis proteins suggest a role for linker region amphipathic helices in transmembrane signal transduction”. Mol. Microbiol. 33: 1093–1102. Wiseman, T., Williston, S., Brandts, J. & in, L. (1989). “ apid measurement of binding constants and heats of binding using a new titration calorimeter”. Anal. Biochem. 179: 131-137. Wittig, I., Braun, H.P. & Schägger, H. (2006). "Blue native PAGE". Nat. Protoc. 1 (1): 418-428. Xiao, B. & Gamblin, S.J. (1996). “The effects of cryoprotectant on crystal stability”. J. Cryst. Growth. 168: 244-247. Xu, Y.B., Cheah, E., Carr, P.D., van Heeswijk, W.C., Westerhoff, H.V., Vasudevan, S.G. & Ollis, .L. (1998). “GlnK, a PII-homologue: structure reveals ATP binding site and indicates how the T-loop may be involved in molecular recognition”. J. Mol. Biol. 282: 149–165.

References
Camila Hernández
148
Ye, .W. & Thomas, S. . (2001). “ icrobial nitrogen cycles: physiology, genomics and applications”. Curr. Op. Microbiol. 4: 307-312. Yildiz, O., Kalthoff, C., aunser, S. & Ku hlbrandt, W. (2007). “Structure of GlnK1 with bound effectors indicates regulatory mechanism for ammonia uptake”. EMBO J. 26: 589–599. Zheng, L., Kostrewa, D., Berneche, S., Winkler, F. K. & Li, X. D. (2004). “The mechanism of ammonia transport based on the crystal structure of AmtB of Escherichia coli”. Proc. Natl. Acad. Sci. USA. 101: 17090–17095. Zumft, W. G. (1997). “Cell biology and molecular basis of denitrification”. Microbiol. Mol. Biol. Rev. 61: 533–616.

Acknowledgements – Danksagung - Agradecimientos
Camila Hernández
149
8 Acknowledgements – Danksagung – Agradecimientos
This work was carried out in the Department of Molecular and Structural Biology of the
University of Göttingen and the Department of Biochemistry of the University of Freiburg
with the financial support of the German Academic Exchange Service (DAAD – Deutscher
Akademischer Austausch Dienst) to Camila Hernández.
When people read the thesis acknowledgements of someone they know, they just want to see
their names written there. I must admit that everybody has an influence during the time of
your work one way or the other, although some others have an influence just always. In my
case the list of people that I would like to thank is enormous and for that I am really grateful. I
will try to mention them all but I apologize in advance if I forgot your name…
First of all I want to thank my supervisor Dr. Susana Andrade for giving me the opportunity
to start with this challenging topic without any previous experience. Thank you for the all
the interesting discussions and the support throughout the whole process. I want to thank
Prof. Oliver Einsle for taking the position as co-supervisor and for all the good ideas and
discussions regarding this work. In addition I want to thank you both for all the good times
outside and inside the lab, thank you for your advice and the knowledge that you gave me.
I would also like to thank Prof. Andreas Bechthold for accepting the position as my third
examiner.
My deepest and sincere gratitude goes to LiWi for caring support all over my time in
Freiburg. You are like my second mother. Thank you for taking care of me and for giving me
many nice advices at any time. You are an extraordinary person and I am deeply in your
gratitude.
Martita, gracias and thank you for all the good times, for listening whenever needed and for
being yourself. It was a very nice experience to share very funny times with you and I hope
that we still have many, many more.
I would like to thank Sanjana for all the help in the radioactive lab. Thank you for the tricks
as well for the quick chats and talks in the lab which made it nice working atmosphere.
I want to thank my former colleagues Daniel C and Volodimir for all the good times in the
lab and help in the lab. Especially to Volodimir I want to thank for introducing me into the
field of radioactivity. To Heng Keat and Sohail I want to thank for the nice conversations and
times expend in the lab.
Fur alles dass ich in diesem vier Jahre gelernt habe, will ich Euch auf Deutsch danken.
Besonderen Dank geht an Frau Metje, für immer dabei sein und für die Hilfe wegen mein
DAAD Stipendium.

Acknowledgements – Danksagung - Agradecimientos
Camila Hernández
150
Von meiner Zeit in Göttingen danke ich alle Leute von der Arbeitskreis von Prof. Ralf Ficner,
Kristina, Sarah H., Anette, Angela und besonderen dank gilt hierbei Chrissoula für die
schöne gemeinsame Zeit.
Mein besonderer Dank gilt an alle meine Mitarbeitenpranktikanten, Emmanuel, Anika, Maid,
Melanie und Oliver. Danke für die nette Zeit im Labor, ich habe von euch auch gelernt.
Ein herzlichen Danke geht an meine lieben Tobis, (Tobi P und Tobi W), nicht nur für die
schöne Zeit im Labor, sondern auch für eure immer gute Laune und die vielen interessanten
Diskussionen und Hilfestellungen und netten Ratschläge.
Herzlicher Dank geht an alle leute in der AG Andrade, AG Einsle und AG Friedrich, Paula,
Phillip, Andrea, Sergej. Eva, Lisa, Anja W, Florian, Daniel S., Nikola, Stefan S, Marius, Heiko,
Katarina, Klaudia, für die freundliche und gute Arbeitsatmosphäre. Ein besonderes
Dankeschön gilt Wohli, für die Tips und Tricks bei verschiedenen Äkta-Problemen und für
die nette Zeit in and außerhalb des Labors. Vor allem Frau Weiser, Elke, Toni, Christiane,
Angelika möchte ich ganz speziell danken, für eure Hilfe zu jeder Zeit.
Ich danke auch an allen ehemalige Mitarbeiter dass ich kennen gelernt habe, David, Ed, Jan,
Felix, Sarah M, Daniel B, Antonia, ins besonderes an Daniel H für die Tips, Tricks und
allegemeine Zeit, Herr Hamacher, Claudia für die schöne Zeit im Labor und allgemein für die
netten freundlichen Diskussionen.
Stefan, CHICO!!! Du allein solltest 100 Seiten hier bekommen. Ohne dich wäre diese Arbeit
nicht möglich. Danke für die Tips und Tricks im Labor und für deine stetige Hilfe. Ich danke
dir sehr für alle Momente im Labor und außerhalb der Arbeit und für dein Verständnis
allermöglichen Dinge. GRACIAS.
Ein GANZ HERZLICHER und besonders LIEBER Dank geht an meine Freunde Anja, Ramona,
Peer, Wei, Juan, Julian, Thomas, Bianca, Sandra H - ohne euch wäre diese Arbeit niemals
fertig. Danke für die Ratschläge, für die Tips, Tricks und vor ALLEM die vielen besonderen
und unvergesslichen Momenten. Ich liebe euch sehr.
Ein herzlicher und extrem LIEBER Dank geht an D für die Korrektur dieser Arbeit, für alle
Diskussionen und Ratschläge. Auch für die Tolle Musik und die nette und schöne Zeit
während der Schreibphase und mancher Insomnia. Du weisst schon was es bedeutet -
Fünftausendmal r a w r.
Y como dicen por allí, los últimos siempre serán los primeros…
Gracias a todos los miembros de la familia gárgola (Hortensia, Gerardo, Fabián, Sandra,
Vivian, Elkin, Olga, Otto, Marisa, Alex, Paco, MariJuli y Johnny) por todos los buenos
momentos compartidos y en especial por el apoyo en las buenas y en las malas, por los
consejos, por escuchar y por estar presentes en los momentos de añoranza. Los quiero
mucho.

Acknowledgements – Danksagung - Agradecimientos
Camila Hernández
151
Carlos, gracias por todo tu apoyo y por todos estos años que compartimos juntos. Sin tí no
hubiera llegado hasta donde estoy hoy. Nuevamente mil gracias, fue una grandiosa e
inolvidable experiencia.
A mi familia y en especial a todos mis tíos y tías quienes siempre estuvieron de alguna
manera pendientes. En particular, gracias a José Frank y Loida por todo el cariño y apoyo.
Los quiero un montón.
A todos mis amigos que a pesar de la distancia siempre estuvieron allí pendientes de mí,
Isis, Hector, Ariany, Lorena, Marialex, Carolina, Yornayser, Hermes, Gaby, Mauro. Los quiero
y extraño un monton.
Madre, no tengo palabras suficientes para agradecerte todo lo que haz hecho por mí. Gracias
por estar allí en todo momento, por ser mi amiga y consejera, por tu paciencia y sobre todo
por las buenas vibraciones que llegaron a mí cuando más lo necesitaba. A mi padre y mi
hermano, quienes a pesar de la distancia estuvieron siempre conmigo, gracias por el cariño,
apoyo y por el ánimo para seguir adelante. Los amo muchísimo, sin ustedes esto no hubiera
sido posible.
To all – vor allem – para todos
THANK YOU – DANKE SCHÖN – MUCHAS GRACIAS

Curriculum Vitae
Camila Hernández
152
9 Curriculum Vitae
Personal information Name: Camila José Hernández Frederick Date of birth: March 20th, 1984 Place of birth: Caracas, Venezuela
Education Oct 2008 - Oct 2011 Continuation of the Ph. D. studies at the Albert-Ludwigs-Universität
Freiburg. Supervisor: Dr. Susana Andrade. Co-supervisor: Prof. Dr. Oliver Einsle
Oct 2007 - Oct 2008 Ph. D. studies, Georg-August-Universität Göttingen. Supervisor: Dr. Susana Andrade, Co-supervisor: Prof. Dr. Oliver Einsle
Sep 2004 - Dec 2005 Diploma thesis "Phylogenetic divergence estimated with mtDNA molecular clock in vectors of Venezuelan Equine Encephalitis Virus: Culex (Melanoconion) taeniopus and Cx. (Mel) cedecei ( iptera: Culicidae)”. Universidad Central de Venezuela. Supervisor: Dr Juan Carlos Navarro
Sep 2000 - Dec 2005 Studies in Biology, Universidad Central de Venezuela. Caracas, Venezuela Sep 1994 - Jul 2000 High school studies, Colegio Antonio Ortega Ordoñez, San Antonio de los
Altos, Venezuela
Awards Apr 2008 - present DAAD Scholarship (Deutscher Akademischer Austausch Dienst/German
Academic Exchange Service) for Doctoral studies in Germany. Dec 2005 Graduation Special award: Honor Degree (Biology Graduates “First
position” 1 of 35). Facultad de Ciencias. Universidad Central de enezuela (UCV). Caracas-Venezuela.
Work experience Oct 2007-Apr 2008 Research scientist, Georg-August-Universität Göttingen/Department of
Molecular Structural Biology Dec 2005–Jul 2007 Research scientist, Universidad Central de Venezuela /Instituto de
Zoología Tropical, Laboratorio de Biología de Vectores Caracas, Venezuela Oct 2004–July 2007 Teaching assistant Universidad Central de Venezuela /Instituto de
Zoología Tropical Caracas, Venezuela