Implementation of Barcode Technology to Logistics Processes ...
20
Citation: Kubá ˇ nová, J.; Kubasáková, I.; ˇ Culík, K.; Štítik, L. Implementation of Barcode Technology to Logistics Processes of a Company. Sustainability 2022, 14, 790. https:// doi.org/10.3390/su14020790 Academic Editors: Ján Ližbetin and Ondrej Stopka Received: 18 November 2021 Accepted: 6 January 2022 Published: 11 January 2022 Publisher’s Note: MDPI stays neutral with regard to jurisdictional claims in published maps and institutional affil- iations. Copyright: © 2022 by the authors. Licensee MDPI, Basel, Switzerland. This article is an open access article distributed under the terms and conditions of the Creative Commons Attribution (CC BY) license (https:// creativecommons.org/licenses/by/ 4.0/). sustainability Article Implementation of Barcode Technology to Logistics Processes of a Company Jaroslava Kubá ˇ nová, Iveta Kubasáková, Kristián ˇ Culík* and Lukáš Štítik Department of Road and Urban Transport, University of Žilina, 01026 Žilina, Slovakia; [email protected] (J.K.); [email protected] (I.K.); [email protected] (L.Š.) * Correspondence: [email protected]; Tel.: +421-41-513-3540 Abstract: The article focuses on expanding the use of barcodes in selected logistics activities in a company. Our study discusses the application of barcode technology to selected logistics activities in the company in order to address the error rate in these activities and to control ownership of this technology in other logistics activities within the company during the COVID-19. The priority of the testing phase was to point out the elimination of errors in the original versus the newly proposed solution for the company on 10 products. In the test phase, the 10 products with the highest turnover in the company were used to point out the elimination of errors in various logistics activities, especially the time saved compared to the work of human personnel in the company. The company has this technology at its disposal, in the parent company as well as in the subsidiary. It was only a matter of expanding the use and applicability of this technology as well as other possibilities for research hypotheses, which we outlined at the end of the article. In this article, we focus on RFID and barcode technologies, since the company initially considered using RFID technology, however, chose the use of barcodes because it was an already known work technology. The current situation affected with COVID-19 disease requires many advantages and disadvantages of both technologies. Keywords: RFID technology; barcode; comparison; company; production 1. Introduction The RFID (Radio Frequency Identification) technologies arose after 2003. They improve the effectiveness of many processes. Thanks to automatization, it is possible to save a lot of time. These technologies also have some vulnerabilities that we should consider during their application. By its very nature, automated identification has the potential to expose its subject to privacy and security risks. Literature [1] identifies these specific vulnerabilities associated with barcodes and RFID technologies and discusses ways to address such risks. To supplement the theoretical knowledge in the literature on these two technologies, we have used a study by the University of Bristol entitled “A Comparison of Barcoding and RFID Technologies in Practice.” This study compares RFID technology and barcode technology used by an unnamed company in their refrigerated warehouse. The company currently provides a comprehensive supply chain solution for several companies in the EU. The Marks & Spencer Company contacted this unnamed company and requested RFID technology introduction into its food supply chain. This chosen system replaced the existing barcode system. After the RFID technology implementation in one of the refrigerated warehouses, it was possible to prepare a comprehensive study [2]. The paper describes the information gathered from the company, the method of collecting data, then the evaluation of the information obtained by the test phase of the barcode implementation and the start of the test phase on the ten cables. We described the results of the measurements and the error rate in the Results section of the paper. The discussion and conclusion include evaluation, other possible measurements, and answering the hypotheses. Sustainability 2022, 14, 790. https://doi.org/10.3390/su14020790 https://www.mdpi.com/journal/sustainability
-
Upload
khangminh22 -
Category
Documents
-
view
0 -
download
0
Transcript of Implementation of Barcode Technology to Logistics Processes ...

�����������������
Citation: Kubánová, J.; Kubasáková,
I.; Culík, K.; Štítik, L. Implementation
of Barcode Technology to Logistics
Processes of a Company.
Sustainability 2022, 14, 790. https://
doi.org/10.3390/su14020790
Academic Editors: Ján Ližbetin and
Ondrej Stopka
Received: 18 November 2021
Accepted: 6 January 2022
Published: 11 January 2022
Publisher’s Note: MDPI stays neutral
with regard to jurisdictional claims in
published maps and institutional affil-
iations.
Copyright: © 2022 by the authors.
Licensee MDPI, Basel, Switzerland.
This article is an open access article
distributed under the terms and
conditions of the Creative Commons
Attribution (CC BY) license (https://
creativecommons.org/licenses/by/
4.0/).
sustainability
Article
Implementation of Barcode Technology to Logistics Processes ofa CompanyJaroslava Kubánová, Iveta Kubasáková, Kristián Culík * and Lukáš Štítik
Department of Road and Urban Transport, University of Žilina, 01026 Žilina, Slovakia;[email protected] (J.K.); [email protected] (I.K.); [email protected] (L.Š.)* Correspondence: [email protected]; Tel.: +421-41-513-3540
Abstract: The article focuses on expanding the use of barcodes in selected logistics activities in acompany. Our study discusses the application of barcode technology to selected logistics activitiesin the company in order to address the error rate in these activities and to control ownership ofthis technology in other logistics activities within the company during the COVID-19. The priorityof the testing phase was to point out the elimination of errors in the original versus the newlyproposed solution for the company on 10 products. In the test phase, the 10 products with the highestturnover in the company were used to point out the elimination of errors in various logistics activities,especially the time saved compared to the work of human personnel in the company. The companyhas this technology at its disposal, in the parent company as well as in the subsidiary. It was onlya matter of expanding the use and applicability of this technology as well as other possibilities forresearch hypotheses, which we outlined at the end of the article. In this article, we focus on RFID andbarcode technologies, since the company initially considered using RFID technology, however, chosethe use of barcodes because it was an already known work technology. The current situation affectedwith COVID-19 disease requires many advantages and disadvantages of both technologies.
Keywords: RFID technology; barcode; comparison; company; production
1. Introduction
The RFID (Radio Frequency Identification) technologies arose after 2003. They improvethe effectiveness of many processes. Thanks to automatization, it is possible to save a lot oftime. These technologies also have some vulnerabilities that we should consider duringtheir application. By its very nature, automated identification has the potential to expose itssubject to privacy and security risks. Literature [1] identifies these specific vulnerabilitiesassociated with barcodes and RFID technologies and discusses ways to address such risks.
To supplement the theoretical knowledge in the literature on these two technologies,we have used a study by the University of Bristol entitled “A Comparison of Barcodingand RFID Technologies in Practice.” This study compares RFID technology and barcodetechnology used by an unnamed company in their refrigerated warehouse. The companycurrently provides a comprehensive supply chain solution for several companies in theEU. The Marks & Spencer Company contacted this unnamed company and requestedRFID technology introduction into its food supply chain. This chosen system replacedthe existing barcode system. After the RFID technology implementation in one of therefrigerated warehouses, it was possible to prepare a comprehensive study [2].
The paper describes the information gathered from the company, the method ofcollecting data, then the evaluation of the information obtained by the test phase of thebarcode implementation and the start of the test phase on the ten cables. We describedthe results of the measurements and the error rate in the Results section of the paper. Thediscussion and conclusion include evaluation, other possible measurements, and answeringthe hypotheses.
Sustainability 2022, 14, 790. https://doi.org/10.3390/su14020790 https://www.mdpi.com/journal/sustainability

Sustainability 2022, 14, 790 2 of 20
The study focuses on the operational performance of the technologies as scan cycletime and device failure. Data were collected in the refrigerated warehouse using time andmotion studies of employees using RFID and barcode technology to scan products shippedin stackable plastic trays. Operator uptime was measured using a stopwatch for eachscan cycle. The cycle began by activating the scanning device and ended by successfullyscanning a stack of plastic trays. Measurements lasted during the morning shift between7:00 and 9:00 on Sunday, Monday, and Tuesday. As part of the sample size selection,20 warehouse employees were selected. These fully trained employees performed barcodeand RFID scanning. Their age ranged from 21 to 48 years [2].
The following table (Table 1) shows scan cycle times measured over the monitoreddays divided according to the used technology.
Table 1. Results of scan cycle times for monitored days. Source: [2].
Day and Used Technology Number ofScanning Min. Value (s) Max. Value (s) Average (s)
Sunday—RFID 80 5.0 15.7 9.520Sunday—barcode 80 18.4 35.4 24.895Monday—RFID 60 5.2 15.7 9.182
Monday—barcode 60 15.3 31.2 24.167Tuesday—RFID 60 5.0 16.8 10.357
Tuesday—barcode 60 18.5 32.6 24.237
Based on the measurement results, we can say that the average time of one cycle whenoperating with RFID technology was 9.669 s and, when using barcode technology, 24.479 s.
Observations of time and motion studies have revealed that many problems affect thetiming of RFID and barcodes that have been difficult to predict. The difficulties of RFIDtechnology were the following [2]:
• non-functional RFID equipment and tags;• usage errors related to the RFID antenna;• errors when scanning the entire stack of plastic trays;• incorrect identifiers in the tray (it leads to a warning sound then the operator looks at
the screen and stops scanning).
The issues found with the barcodes were [2]:
• missing labels on the outside of the plastic tray;• illegible labels on a plastic tray;• non-functional scanning device;• a usage error in which the operator scans the barcode incorrectly or slowly.
It is clear from the previous figures that different errors occurred with both technolo-gies. As part of the monitoring, 200 measurements were performed. There were 91 errorsin barcode scanning. It means that the error rate for barcodes was 45.5%. With RFIDtechnology, the error rate was 46.5%, which represents 93 errors. It suggests that RFID isprone to more errors during the scanning process [2].
The study [2] shows that RFID technology more has more user errors than barcodes.In comparison, the RFID had 29 errors; barcode technology only had five errors. Perhapsthis suggests the maturity of the barcodes that the company used several years before.
This study provides a comparative analysis of RFID and barcode technology in anorganization with a refrigerated warehouse. The findings support the most current researchabout RFID. It can provide faster scan times than barcode scanning. On the other hand,RFID scanning is prone to failures of device and usage errors. Improvement of employeetraining can partially eliminate these failures [2].
Figure 1 shows the error rate when using RFID technology and Figure 2 includes theerror rate of barcode technology.

Sustainability 2022, 14, 790 3 of 20
Figure 1. Error rate of RFID technology [2].
Figure 2. Error rate of barcode technology [2].
In article [3], the authors explain the change from the use of barcodes to radio fre-quency identification (RFID) in manufacturing logistics and point out the importance ofbarcodes for the future implementation of RFID. Based on two projects, they prove theinterconnection of the use of barcodes and the RFIN system. The study mentions thepotential consequences for future activities related to the introduction of an RFID system inproduction logistics [3].
This study [4] presented the application of RFID technology to increase the efficiencyand effectiveness of warehouse management. The RFID system can quickly and simultane-ously read multiple tags compared to sequential barcode reading with a handy barcodescanner for manual operations. Significant improvement was observed in preliminary ex-periments. The number of pallets and items processed by each operator per day increasedby 425% and 438%, respectively. Data processing time in revenue and transport docks hasbeen reduced by more than 90%. With RFID technology, it is possible to reduce the numberof operators while maintaining the current capacity of services in the warehouse understudy [4].
Radio Frequency IDentification (RFID) technology is a well-known wireless appli-cation for traceability, logistics and access control. It has become ubiquitous in industryand in our daily lives (ticket sales, payments, passports, car keys, etc.). RFID is now astandardized technology; its inherent benefits, which are unity, identification, or wirelesscommunication, provide it with decisive practical benefits that drive new developments inconcepts and applications. This trend is largely confirmed by the market forecast, but also

Sustainability 2022, 14, 790 4 of 20
its implementation in the field of health (smart hospital), assistance to people, as well as itsperspective in terms of new paradigms of distributed environmental intelligence and theInternet of Things [5].
Currently, several RFID systems are commercially available for a number of applica-tions, such as management control, transportation, supply chain, etc. However, the poolingof RFID tags and sensors could provide many new solutions to develop, in particular, greenprojects, such as more efficient energy production in chains, better waste control, recyclingand other environmental challenges. In addition, the development of these new solutionsrequires the resolution of several technical issues addressed by the authors in Article [6].
The bar-code system currently in use on the market has a weakness in that identifi-cation is only carried out when the bar-code is visible. Unlike a barcode system, an RFIDsystem uses radio frequency technology that allows for more accurate and faster identifica-tion of objects than a barcode system. RFID is a method of identifying object data usingradio frequency technology by affixing a tag to identifying objects to be monitored. Recently,active research has been carried out and many attempts have been made to introduce RFIDtechnology in the logistics and manufacturing sector. In Article [7], the authors presenta method of checking the exact number of cells loaded in a truck using RFID technology.This research concerns the method by which an RFID reader and middleware are used toaccurately and quickly count the number of RFID-tagged articles in real time. When thetagged articles reach the reader area, the information read by the reader is delivered to themiddleware. The middleware then identifies the number of tags and displays the results tothe user [7].
The RFID system has also found application in the rail transport of goods. Basedon RFID technology and the proposed problems, the authors in Article [8] propose awell-functioning platform for managing railway package information. This platform canprovide fast, highly efficient, intelligent, secure and stable solutions. The platform consistsof five systems, which are a manual terminal system, a sorting system, a warehousemanagement system, a tracking system and a railway package management system. Theimplementation on the platform shows that it not only reduces the package transport cycle,but also improves the stability and security of the logistics management system. Multipleverification shows that the proposed platform has a very good practicality.
Although the RFID system is expanding and gradually replacing the use of barcodes, itwill certainly not be limited. On the contrary, the need for barcodes is likely to increase dueto their universal acceptance and ease of use with the low cost of barcode production (e.g., itis usually included in the cost of printing labels or packaging materials on products) [9]. Asthe population grows, so does the need to streamline and increase the safety of workplacesand their environment. Barcodes are used in supply chain management (SCM) applicationsin healthcare. The use of barcodes in healthcare facilities allows hospitals to save spaceand reduce overstocking by ordering necessary supplies on a daily basis [10]. In retail,barcodes are becoming part of smartphones with applications. Consumers can purchaseand scan items through their phones. This makes it easy for the retailer to track consumerspending. Most manufacturing companies also turn to the barcode system. The use ofbarcodes in production plants helps to speed up and streamline the production process.However, as Table 2 shows, important advantages and disadvantages need to be consideredfor barcodes, as with all IT-intensive technologies [10].
Table 2. Selected advantages and disadvantages of barcoding as a part of identification technologies.Source: [10].
Advantages Disadvantages
Inventory Control (through tracking andessentially error-free readings)
Costs (associated equipment and replacementcosts)
Accuracy (2D, 3D Barcodes), Error reduction Accuracy (especially with linear barcode)Time savings Limitations by line of sight scanningEasy-to-use Security issues, as they are easily read

Sustainability 2022, 14, 790 5 of 20
Discussing the benefits of RFID technology only makes sense if compared to bar-codes [11]. Important advantages of RFID over barcodes include the following [9,12,13]:
1. Speed—because an RFID reader can read tags faster than a normal barcode scannercan scan barcodes. For example, RFID readers designed for supply chain operationscan perform up to 1500 read operations per second;
2. Reading distance—because it is common to read RFID tags at a distance of at leastthree meters between the tag and the antenna. Reading sizes and ranges are alsocompared with different RFID chips and the longest reading range in Article [14] is14.6 m for a metal mounting antenna. Their passive UHF RFID tag had a range of 26m for reading using the Higgs 4 RFID chip manufactured by Alien Tech.
3. Simultaneous instead of sequential scanning—because RFID readers can identifymultiple tags in a reading field;
4. Direct view—because radio waves can penetrate most materials depending on thefrequency used;
5. Durability—as RFID tags can work in extremely demanding working conditionsand can be packaged in plastic packaging or even embedded directly into finishedproducts [10,15,16].
However, barcodes can be easily printed or applied directly to products, and involveextremely accurate reading speed and very low cost [17–22].
Many authors compare the technology of using barcodes and RFID technology in themedical environment, specifically in the handling of medicines. In recent years, referencetechnology has moved to forensic techniques and systems that can transmit unique vali-dated information over a distribution line to the point of delivery to a patient. Barcodes,2D data matrix codes, tags and radio frequency identification (RFID) enable instant remoteauthentication, making it significantly more difficult for counterfeit products to enter thesupply chain. These systems rely on a scanning and sending system, which means that,unlike the markings on the packaging, there is no interpretation of the information bythe user; the remote device does all the work. Technology is relatively young and oftenexpensive, and the reliability of some of its systems is still questionable, but it offers a signif-icant opportunity to reduce the spread of counterfeit products if government agencies andmedicine manufacturers adopt deviations from these strategies. They concluded that themedical tracking system is better in terms of safety when using RFID technology [23–26].
The effectiveness of bar-codes and RFID is also compared by other authors. Barcodingis an advanced technology of automatic identification (auto-ID), used in supply chainmanagement (SCM) for several decades now. It enjoys free governance widespread appli-cation, especially in retail. Recently, however, radio frequency identification (RFID) hasbeen considered a competitive technology that is excellent in its ability to store and updateinstant information as well as its non-line-of-sight (nLoS) reading ability. However, RFID ismore expensive and, even if more convenient than barcoding, the current barcode is stillthe most widespread and widely used standard in the world. However, analyses havefound that the need for barcodes in the supply chain will never really go away. What isbeing observed, rather, is a model of convergence, which suggests the need to integrateboth technologies into the supply chain, all of which serve a common goal [27–30].
There are many discussions about the costs and benefits of implementing RFID insupply chains. As a result, researchers are finding an opportunity in the green field toexplore how organizations can use technology in the context of the supply chain. Theauthors explore the potential benefits and limitations of RFID in a storage environment intwo ways. First, it discusses issues related to pallet-level labelling and case-level labelling bycreating a decision framework. Second, the knowledge from the framework is used to definean object-oriented modelling framework that facilitates warehouse simulation of RFID vs.interoperability barcode [31,32]. This simulation is used to examine some of the trade-offsbetween price and performance associated with six implementation strategies. The variousstrategies make important cost trade-offs and evaluate the statistical significance of thedifferences [33–35].

Sustainability 2022, 14, 790 6 of 20
The unique features offered by radio frequency identification (RFID) technology dis-tinguish it from other technologies, such as the Internet and EDI, and require furtherinvestigation, in particular related to its adoption. RFID is a wireless automatic iden-tification and data acquisition (AIDC) technology [36] used to track shipments. RFIDcaught the attention of the media when giant retailers such as Walmart, Tesco, Targetand Albertsons announced their intention to adopt RFID to streamline supply chain op-erations and demanded that their suppliers be RFID compliant. The literature on theadoption and use of RFID has demonstrated the high operational and strategic value ofthis technology [37]. Nonetheless, many potential adopters have not opted for RFID due toits implementation problems, including: infrastructure costs; environmental shocks; topmanagement concerns; second-order organizational training; resource commitment; andorganizational transformation. Most vendors have had difficulty adopting and using RFIDtechnology cost-effectively for competitive advantage [35]. In addition, while previousRFID adoption studies have highlighted the importance of adoption mandates, especiallyin the early stages of exploring the potential of the technology, the importance of thesemandates decreases over time, as perceived benefits and risks related to this technology areassessed [38].
Thus, the fact is that the adoption of RFID technology has been slower than expected,mainly because the hype associated with any new information technology (IT) [39] gaveunrealistic expectations to researchers and practitioners [40]. Therefore, it is importantto deepen our understanding of the various factors that determine the adoption of RFIDtechnology by companies [35].
Although RFID technology brings many advantages over barcoding, it is necessary tolook at its disadvantages. In Article [1], the authors identify a number of risks associatedwith the use of RFID, such as the risk of personal data protection and security. Theyconsider the specific vulnerabilities associated with barcoding and RFID to identify relatedattack scenarios and discuss ways to address these risks and attacks [1].
As mentioned in the previous article, in this article [41] the authors are interested in allaspects of the introduction of RFID technology in business. However, any decision to adoptan RFID system without a clear and objective analysis of its effectiveness in an uncertainbusiness environment carries serious risks. This article presents a tool for statistical analysisof the effectiveness of RFID compared to barcodes [41].
Despite the fact that RFID is making an impact on the world, for this technology’ssustainability, it is necessary to think about reducing its price tag. Toward this end, scientistsfrom around the world are working on chip-free RFID systems, though their use is notappropriate for every sector, as mentioned by the authors in Article [42]. For the purposesof conducting an examination of the possible application of the barcode and RFID system,this study focuses on the Thai timber industry, aiming to identify the most favourabletraceability technology as well. The results suggest that RFID is a more advantageousidentification method in terms of efficiency and user acceptability. However, the cost ofan RFID tag should be reduced. Barcodes are not suitable for wood products, at least inthe context of the Thai wood industry, even if they are used for other purposes. RFID, onthe other hand, provides several advantages throughout the supply chain compared tobarcodes and other conventional identification systems [42–44].
The Fourth Industrial Revolution significantly changed the traditional way of man-aging supply chains. Applications of Industry 4.0 (I4.0) technologies, such as the Internet ofThings (IoT) and artificial intelligence (AI) in various supply chain processes, have helpedcompanies improve their performance. Procurement can be considered a critical processin supply chain management, as it can provide new opportunities for supply chains toimprove their efficiency and effectiveness. However, I4.0 applications can be ex-pensiveand may not be reasonably available [45].
Procurement digitization can provide significant opportunities for excellence in ren-ovation operations. This article [46] focuses on Procurement Resources 4.0 for front-endapplications and core technologies. Based on Resource Based View theory, this research

Sustainability 2022, 14, 790 7 of 20
examines the role of resources influencing procurement 4.0 to increase productivity inrenovation operations and the performance of the circular economy. Survey data for thisresearch was collected from working professionals in South Africa, and the results showthat technological resources are needed in procurement 4.0, which in turn can increaseproductivity in refurbishment operations.
The findings of this empirical study [47] suggest that Procurement Strategy 4.0 posi-tively influences buyer intent to optimize business processes. Second, Procurement Per-formance Control 4.0 positively affects buyer intent to optimize business processes. Third,the ability to process information mitigates the impact of Procurement Performance Control4.0 on buyer intent to optimize business processes. Finally, buyer intention to optimizebusiness processes plays a key role in improving the performance of the circular economy.The simulation results demonstrate the potential benefits of Industry 4.0 appli-cations inthe circular economy procurement function.
In this research [48], the authors provide an overview of the system architecture andalso define a protocol and a smart contract at each stage that stores data in a blockchaincenter. They implemented a decentralized database and authentication system that usesblockchain and smart contract technology; each protocol at each stage was designed toachieve data integrity and undeniable reporting. Their system is more flexible in terms oftransport, more secure in the communication protocol and more difficult to manipulateand falsify data.
Blockchain technology is basically a decentralized database managed by a team. It hasthe characteristics of high reliability and high confidentiality and has good prospects foran effective solution to the problem of trust between the two parties. In short, block-chaininformation will be publicly verifiable and will not be manipulated, which provides solu-tions for traditional logistics. The proposed scheme also achieves data integrity, resilience,forward and backward secrecy, undeniability and mutual authentication [49,50].
2. Materials and Methods
The goal of our proposal is to expand the use of barcodes in the unnamed company.Barcodes facilitate the process of item ordering (cables) that consists of several activities.Employees use barcodes when picking cables for production and identification of correctproduction positions. It affects the entire ordering process.
We will use the current method for receiving cables to the warehouse and storing themin a specific position on the slotted angle racks. Figure 3 shows the main changes in theactivities of the proposed method.
Figure 3. Sequence of activities in the proposed method of ordering cables. Source: processedby authors.

Sustainability 2022, 14, 790 8 of 20
The process begins by ordering an item from production, where the production workerwrites down the needed material in the specified table. Each material (cable) position in thefactory has such a table. Warehouse workers check the entered requirements in productionaccording to the schedule. They write down these requirements on a document, accordingto which they knows which cable to pick. In the warehouse, they first find the position ofthe item in the slotted rack and then load it onto a prepared pallet. Before being ready forproduction, workers must scan prepared cables with a scanning device. First, they scantheirpersonal barcodes, located on their ID cards. Then they scan the barcode of the workplaceand the movement they want to make with the cable. For example, they scan the barcodelabeled “STORAGE OUT” when picking up the cable. This barcode is in various places inthe warehouse. It is also on a forklift to speed up the work of the warehouse employees.They then scan the barcode located on the cable reel label. This label is adhered to the cablewhen it is received at the warehouse. After scanning the barcode, workers still enter theamount of cable on the spool. This quantity is indicated on the packaging. Figure 4 showsthe spool label with the barcode.
Figure 4. Scanned barcode on a spool of cable. Source: authors.
Then the employees can move the cable to the specified position in the factory. Beforeplacing the cable in the correct place, they must scan the cable again. Each position in thefactory has barcode labels. When employees stock an item, they must scan the positionand movement barcode. At the end of the work shift, employees gives the scanner passesto the warehouse support manager. This person exports the collected data to a prepareddatabase in Excel and performs a quick check of the data in the database with the help ofpreset macros. Based on the data from the database, it is possible to update the data inthe SAP system. The SAP system then automatically evaluates the need to order cables,which reduces workload. Operational purchasing employees check the generated orders,set the date, and send them to the customer. We analyzed the main errors that arose duringordering cables. We also measured the duration of individual activities in the process. Weused this data to design a new way of ordering.
With the current state of the cable ordering process, problems arose, especially withmulti-stage manual recording, checking the current cable balance in the warehouse, andcreating orders. They occurred due to an incorrectly entered balance from the warehouseor an incorrect quantity order. Based on the analysis of the error rate, we can highlight themost common errors:
• incorrectly entered balance from the warehouse;• ordering the wrong quantity;• error when entering data manually;• differences between the actual stock balance and the stock level in the SAP system.
Many errors were connected with the incorrect amount of delivered material. Em-ployees recorded information to the error record table. This information included the date,the material number of the cable, the number of unnecessary coils, the responsible person,and notes.

Sustainability 2022, 14, 790 9 of 20
Warehouse support managers always send a table with the cables prepared for pro-duction before the end of the shift. They also write the balance of the item in this table.Errors can occur when warehouse managers check the cable balance on the rack. They canmake a mistake when rewriting the table to Excel. In this case, the operational purchasingdepartment has incorrect inputs. The second case can occur if the correct cable balance instock is sent for an operational purchase, but an error occurs when evaluating the need foran order.
Another case is errors that occur when rewriting data in Excel. Employees do notrecord these errors anywhere. An error can occur in production, in the warehouse, andduring its recording to Excel. Usually, an error occurs when the material number is incor-rect. The operational purchasing department usually finds it. Subsequently, warehouseemployees solve the problem; they find out what kind of cable it was.
The current method allows making a difference between the actual cable balance inthe warehouse and the stock level in the SAP system. Responsible employees solve thisproblem by checking the stocks once a month and downloading the current state of thecables in the warehouse and the SAP system. They select the 20 most expensive cableswith differences. According to the physical check of the cables, they adjust the data in theSAP system.
2.1. Measuring the Duration of Individual Activities in the Process
After analyzing the most common errors in the current method, the time of individualactivities within the cable ordering process was measured. Before the measurement itself,it was necessary to determine appropriate activities that will be measured in time. Thefollowing activities were selected for measurement:
• registration of a request for documentation;• picking cables for production
# picking cables on a pallet;# cable transport;# placing cables;# checking (OK);
• rewriting the material for ordering and sending the list for operational purchase;• copying the list to the cable order and evaluating the order;• issuing an order in the SAP system.
The measurement was divided into three parts, according to who performed theindividual activities. In the first part, the recording of requirements for documentationfor production and the time of picking cables for production were measured. Due to theaccuracy and usability of the results, the measurement of cable picking into productionwas divided into four separate activities, which were measured separately. These activitiesare handled by a warehouse workers who write the documentation requirements severaltimes a day and prepare the cables for production. The measurement lasted for two daysand a total of 4 measurements were performed.
In the second part, the activity of warehouse support managers, who are in charge ofrewriting the material for ordering and sending the list for operational purchasing, wasmeasured. This measurement was always performed at the end of the work shift withinfive days, with five measurements made.
The last part of the measurement was focused the work of operational purchasing.Four measurements were made over a period of four days. The measurement data wereentered into a pre-prepared form, and then transcribed into and evaluated in Excel. Table 3shows processed data from the whole measurement of individual activities in the cableordering process.

Sustainability 2022, 14, 790 10 of 20
Table 3. Measured data of current activities in the cable ordering process.
ResponsibleWorkplace Activity
Number ofCables(in Pcs)
Durationof the
Activity
TimeRequired for
1 Cable
AverageDuration ofActivity *
Warehouse
Registration of arequest for
documentation26 5 min 43 s 13 s -
Pallet picking 36 50 min 8 s 1 min 24 s -Cable transport - - - 1 min 11 s
Cabledocumentation 36 63 min 30 s 1 min 46 s -
Enrollment (OK) 41 4 min 48 s 7 s -Rewriting thematerial for
ordering andsending the listfor operational
purchase
91 11 min 16 s 8 s -
Operationalpurchasing
Copy the list tothe cable order
and evaluate theorder
74 18 min 15 s -
Issuing an orderin the SAP
system44 47 min 1 min 4 s -
Note: (*) The average duration of an activity is the time calculated as the arithmetic mean of several measurementsof the activity. This activity does not depend on the number of cables.
The measured values are added up for individual days and then model-converted toone cable. The measured value of cable transport is expressed as the arithmetic averageof the duration of 15 measured cable transports. This activity cannot be expressed on asingle cable because the warehouse workers transport multiple cables at one time. Thenumber of cables per carriage depends on the size of the cable reel that is placed on thepallet. The special activities in picking up the cable for production will be the same in theproposed way. Therefore, after performing the measurement on the proposed method, themeasured data of these activities were added up. The data for these activities are thereforemore accurate and will not affect the results when comparing the current and the proposedmethod. Measured data of these activities in Table 4 are expressed over a period of fivedays, taking a total of 11 measurements.
Table 4. Conversion of measured data of current activities on one cable.
ResponsibleWorkplace Activity Number of Cables
(in Pcs)Duration of
Activity
WarehouseRegistration of a request for
documentation1 13 s
Picking cables for production 1 4 min 28 sRewriting the material for
ordering and sending the listfor operational purchase
1 8 s
Operationalpurchasing
Copy the list to the cable orderand evaluate the order
1 15 s
Issuing an order in the SAPsystem 1 1 min 4 s
The total time of the cable ordering process 1 6 min 8 s

Sustainability 2022, 14, 790 11 of 20
In Table 4, the converted data per cable were recorded as well as the total time of thesingle cable ordering process.
The process of picking cables for production shown in Table 4 was divided into severalactivities for more detailed data. In Table 5 these activities were converted to one cable andadded together. Finally, the total time of the process for ordering one cable was expressed,which is six minutes and eight seconds.
Table 5. Measured values in the proposed method. Source: processed by authors.
ResponsibleDepartment Activity
Numberof Cables (pcs)
ActivityDuration (s)
Necessary Timeper One Cable (s)
ActivityDuration * (s)
Warehouse
Registration of a request 26 5 min 43 s 13 s -Preparation of cables for
production36 50 min 8 s 1 min 24 s -
Scanning (warehouse) 20 7 min 57 s 24 s -Cable transport - - - 1 min 11 s
Scanning (production) 20 7 min 21 s -Cable unloading 36 63 min 30 s 1 min 46 s -
Writing (OK) 41 4 min 48 s 7 s -Download from the scanner
and copy to database- - - 57 s
Working with the database 70 1 min 41 s 2 s -Record in the SAP system - - - 30 s
Operationalpurchasingdepartment
Sending an order in the SAPsystem - - - 3 min 30 s
* The average duration of an activity is the time calculated as the arithmetic mean of several measurements. Thisactivity does not depend on the number of cables.
2.2. Methodology for Time Measurements
We wanted to evaluate time savings when the factory used the proposed method ofordering cables. Therefore, we measured the duration of activities and then comparedthese values to those measured with the previous method. This measuring consisted ofseveral parts, each representing different activity.
The first part of measurement focused on the work of warehouse employees. As in theoriginal method, they prepare the cable for production based on production requirements.We performed seven measurements for operations carried out by warehouse employeesover twenty-three days. Their activities were the same as in the original method, making itpossible to put the results together and calculate one value from 11 measurements over fivedays. This can also ensure more accurate results. The proposed method adds scanning tothe work of warehouse employees, which affects the cable preparation for production.
The second part of the measurement focused on the work of warehouse supportmanagers. They download data from the scanner and update the database at the end ofeach shift. They check the data in the database and write down the values from the SAPsystem. We measured their activities over six days, with the measured data differing fromthe original measurement due to the activity changes of warehouse support managers.
We performed the last part of the measurement in the department of operationalpurchasing. Before the changes, its employees evaluated the stocked cables and placedorders accordingly. With the proposed method, all this is done by the SAP system. Itautomatically evaluates the need to order cables after usage in production. Employees onlyconfirm the automatically generated orders, and sets the date. Then workers can send theorder to the customer. This operation differs from the original method and, when we weremeasuring this activity, a problem arose during the test phase on ten selected cables withinthe monitored period. All these items were unnecessary in production.
Table 5 shows the measured values of the activities within the ordering of cables inthe proposed method.

Sustainability 2022, 14, 790 12 of 20
In our proposal, we added some tasks to the work of warehouse employees. They mustscan cables during preparation as well as after sending the cables to a specific position inproduction. The cable transport duration remains the same as in the previous measurement.When evaluating the results of measuring the work of the warehouse support managers,we found that there are activities that do not depend on the number of cables. For example,the steps of downloading from the scanner, copying the data to the database, and workingwith the SAP system take as long for one item as for twenty cables. It is a similar case foroperational purchasing, where the ordering in the SAP system does not depend on thenumber of items.
For a better comparison, Table 6 shows a model of recalculated data of activities in theproposed method for one cable.
Table 6. Measured values in the proposed method. Source: processed by authors.
ResponsibleDepartment Activity Number of Cables (pcs) Activity Duration (s)
Warehouse
Registration of a request 1 13 sPreparation of cables for production 1 5 min 13 s
Download from the scanner and copyto database
1 57 s
Working with the database 1 2 sRecord in the SAP system 1 30 s
Operational purchasingdepartment Sending an order in the SAP system 1 3 min 30 s
Total ordering time (proposal) 1 10 min 25 s
We then recalculated the measured data per cable. We found that the duration of theproposed method is four minutes and seventeen s longer than the original method. In theproposed method, consisting of three new activities does not depend on the number ofcables. This means that, with more cables, it is possible the proposed method will be muchmore efficient.
3. Results
This part of the paper compares the original method of ordering cables to the proposal,a comparison made through error analysis and time measurement.
Probably the biggest problem with the original way of ordering cables was the emerg-ing differences between the actual stock balance and the stock level in the SAP system. Inthe original method, warehouse workers wrote down the remaining amount of materialafter preparing the cable for production. Then the operational purchasing departmentreceived the data of consumption and material balance. After that, they could order thenew material according to the balance in the warehouse. Problems arose when employeeseither entered the wrong stock balance or ordered the incorrect quantities based on thecorrect stock balance. Another problem was that the multiple manual entries of dataled toa high risk of mistakes.
In order to reduce the rate of error in their operations, the factory aimed to introduceentirely new technology into their procedures. Our proposal introduced a new method ableto eliminate the mentioned errors, involving the cable having two positions, storage andproduction, and the warehouse support managers writing down the remaining amount ofcables at the end of the shift. The latter is to ensure that the stock level in the SAP systemis equal to the actual stock balance. During the phase of testing if and how the proposedmethod would work, and to reveal any unanticipated errors before implementation, em-ployees still used manual data entry (using ten cables for testing). Starting the test phaseon a single cable consisted of several steps. The scanning device is not connected to theSAP system, it is necessary to create a simple database in Excel, for the obtained data to be

Sustainability 2022, 14, 790 13 of 20
stored. Based on this database, the cables will be depreciated from the SAP system andused to check the correctness of the scan. Based on the data from the database downloadedfrom the SAP system, a cable with the sample material number 0612201 is selected for theturnover testing phase. This cable has the highest turnover. It was ordered 19 times in theprevious year, while the preset amount of cable in one order is 15 000 m. Sometimes theremay be another quantity in the order, usually in cases where the need is higher and thecable needs to be reordered. In the last step, the barcode scan itself started in the cableordering process. When required to provide proof of the selected test cable, the storekeepermust pick up the cable on a pallet and scan the barcode on the package using a scanner.Other cables are prepared for production in the original way. Subsequently, before the endof the change, the head of the support department transfers the data from the scanner tothe computer, copies of the data to the database and writes the given cable from the SAPsystem. All other cables will work in the original way. The process of ordering cables usinga barcode is functional, but very impractical, because the storekeeper must be careful not toforget to select the selected cable. Therefore, this phase will not last long and the processwill be extended to ten selected cables. Testing on ten cables is the last stage before thedesign of all cables used. The purpose of this testing is to fine-tune all activities so thatthey are ready to run fully. The reason for this between steps is to reveal shortcomingsand problems that were not found when testing on a single cable as well as to resolveinconsistencies from the previous phase. The actual procedure for starting the test phasewill be similar to one cable and will also consist of several steps.
For the test phase, it is necessary to select the other nine cables that have the highestannual turnover. The last step is to start the test phase on ten selected cables. In fact, it is asharp test before applying the design to all available cables. The warehouse workers willscan all cables, regardless of which ones have been selected for testing. After downloadingthe data from the scanner, the warehouse managers will distinguish which cables need tobe sent for the operational purchase and which need to be written off from the SAP system.In the testing phase, it is necessary to monitor the progress of the entire process and recordall errors and problems that occur during the process. These will be the basis for furtherdesign development in the cable ordering process.
Due to the lack of data in the original method, we could not compare the error ratewith our proposal. During testing after technological changes, only seven errors occurred.The test process took six days (142 performed scans). The error rate after the first six daysof use was 4.93%.
We have divided the measurement of the individual activities into three parts. Someactivities are the same in both methods, which means that the introduction of our proposaldoes not change them. Therefore, we have calculated an average value. In the proposedprocess, scanning has been added to the duties of warehouse workers. It was necessary tomeasure this activity. However, there are activities that no longer depend on the number ofcables. We have expressed the duration of these activities as the average time from severalmeasurements.
We have recalculated the measured data to one cable. On average, the factory uses17 cable spools in one day. Table 7 compares the values of the original cable orderingmethod and the proposed method.
Table 7 shows values recalculated to one cable. The duration of the proposed methodis longer by 4 min and 17 s. The right side of the table shows values of the processing of17 cables (the average number per day). We have measured the time of transportation andother preparation activities separately. It is not possible to recalculate the time of transportto one cable. Warehouse workers can transport several cables at once. The number of cablesper carriage depends on the size of the cable spool. Warehouse workers usually transports6 to 10 cable spools at a time. In our calculations, we have supposed that they transportonly six cable spools during one transport. It means that 17 cables need three rides. Theaverage cable transport takes 1 min 11 s. The recalculation of the picking of 17 cables forproduction was therefore as follow:

Sustainability 2022, 14, 790 14 of 20
• original method = (3 min 17 s × 17) + (1 min 11 s × 3) = 59 min 23 s• proposed method = (4 min 2 s × 17) + (1 min 11 s × 3) = 1 h 12 min 7 s
The calculation of the average number of picked cables per day shows a time saving of6 min and 23 s per day. This time saving arises thanks to the activities that do not dependon the number of cables. The proposed method of ordering cables is valuable with largerorders. If the production needs 17 cables per day, we can calculate timesaving for:
• one week 31 min and 55 s;• one month 2 h, 7 min, and 40 s.
Table 7. Comparison of measured data of the original and the proposed method. Source: processedby authors.
Ordering Method ResponsibleDepartment
Activity Duration1 Cable 17 Cables
Original
WarehouseRegistration of a request 13 s 3 min 41 s
Preparation of cables for production 4 min 28 s 59 min 22 sDownload data from the scanner and
sending to operational purchasedepartment
8 s 2 min 16 s
Operational purchasingdepartment
Copying data list to order and orderevaluation 15 s 4 min 15 s
Sending an order in the SAP system 1 min 4 s 18 min 8 sTotal time of cable ordering process 6 min 8 s 1 h 27 min 42 s
ProposedWarehouse
Registration of a request 13 s 3 min 41 sPreparation of cables for production 5 min 13 s 1 h 12 min 7 s
Download from the scanner and copy todatabase 57 s 57 s
Working with the database 2 s 34 sRecord in the SAP system 30 s 30 s
Operational purchasingdepartment Sending an order in the SAP system 3 min 30 s 3 min 30 s
Total time of cable ordering process 10 min 25 s 1 h 21 min 19 s
We propose to increase the use of barcodes in the company. This company has alreadyestablished barcode technology, but intelligent solutions can ensure the modernization andfurther development of the company. The proposal elaborates the process of changes, erroranalysis, and measurement of the duration of individual activities. Barcode technologywas implemented into the process gradually, using two test phases.
We have performed the first phase on a single cable after thorough preparation. First,we created a simple database in Excel to store the data collected from the scanner. It wasalso necessary to prepare technical equipment. The company bought a scanning device tocollect the scanned data. It was also important to mark the warehouse workplace with abar code. The last task was to flip the selected cable to two positions in the SAP system. Wealso performed the second testing phase on another nine spools of cable. Again, severalpreparatory steps were necessary. We modified the database due to the larger data volume.Macros and other functions in Excel make this step faster. Due to increased inspection, wehave marked each position in production with a barcode. Subsequently, we have flippedselected cables into two positions in the SAP system. This test was the last stage beforeimplementing the proposed method on all available items. During the test, warehouseworkers scanned all cables when picking. Subsequently, warehouse support managers hadto distinguish two types of items. The first group was cables ordered via SAP system, andthe second was cables sent for operative purchasing (original method).
We also prepared a detailed analysis of the error rate and duration of activities in thefactory. Then we could compare the original way of ordering cables with our proposal.We have eliminated almost all mistakes and problems that arose in the original method

Sustainability 2022, 14, 790 15 of 20
with barcode technology. Flipping the cables to two positions in the SAP system resolvedthe emerging differences between the actual stock balance and the stock level in the SAPsystem. Our proposal partially resolved multiple manual data entries with a high risk oferror. For some activities, however, warehouse workers must still manually enter the datainto the prepared form. In the future, we can also resolve this problem by introducing thepull-out principle from production via the SAP system. We could not express the exacterror rate in the original method due to a lack of data. However, we can determine the errorrate in the proposed process. During the six days after the test phase, employees performed142 scans with seven errors. Errors occurred due to incorrect scanning and subsequentincorrect database settings. The error rate after the first six days of use was 4.93%.
After the introduction of the proposed method of ordering cables, the error ratewas also monitored, which was recorded and evaluated every day. The error rate waschecked every day after downloading data from the scanner in the database. Data are onlyavailable for the first six days of use to prepare and evaluate the analysis. In the company,monitoring and evaluation of error rates will continue, as this is one of the basic indicatorswhen introducing a new proposal. When monitoring the error rate, errors were formulatedthat occurred or may still occur in this way. The following basic errors were made:
• scan error—incorrectly entered length;• scanning error—writing in the wrong field;• scan error—no input or output scan;• scanning error—the same operation scanned 2 times;• incorrectly ordered cable quantity;• database error.
When checking the data in the database, it may happen that there is a differencebetween the agreed and the actual amount of cables. The reason is that the company thatsupplies the cables does not always send the exact and agreed amount of cable on the spool.In this case, the storekeeper enters the quantity that is on the package during the scan, andduring the subsequent check in the database, the difference between the quantity actuallyscanned and the quantity that was agreed upon is marked. The agreed number of cablesfrom the SAP system is generated in the database for inspection. This difference will not beconsidered a mistake, as this problem also occurred in the original way and is not related tothe introduction of barcode technology into the process. The reason for this error may alsobe an incorrectly ordered amount of cable. Since only 10 cables are currently being testedunder the proposed method, the other cables are ordered in the old way. This means thatthe need to order a cable must be evaluated in an operational purchase. Once the proposedmethod has been implemented on all cables, this error will no longer occur because theneed to order a cable will be automatically generated by the SAP system. Excel databaseerrors can also be a problem. Some macros and formulas may not always work correctly,or some material numbers may not have an agreed number of cables. This means that thecontrol will not work.
Another group of errors are warehousing errors when scanning barcodes on cables.Warehouse workers may enter the wrong cable length or inadvertently scan the data intoanother field. Warehouse workers scan the cables when picking them up for production,but also before documenting the cables in the specified position. Just by double-scanningthe cables, this error rate could be minimized. Nevertheless, the warehouse workers mayforget to scan the cables, either when picking or documenting the cables for production.Alternatively, it accidentally scans the cable twice.
First, we measured individual activities with the original method. We performed13 measurements in 11 days. After the introduction of the proposed method, we performedanother 13 measurements for nine days. The measurement data were then processed andevaluated in tables. For better comparison, we calculated the time required for one cable. Itwas necessary to determine the average number of used cables per day to find out howmuch time the company will save per day. On average, production sends 17 cables per day.We calculated with 17 cables and then compared time savings (Table 8).
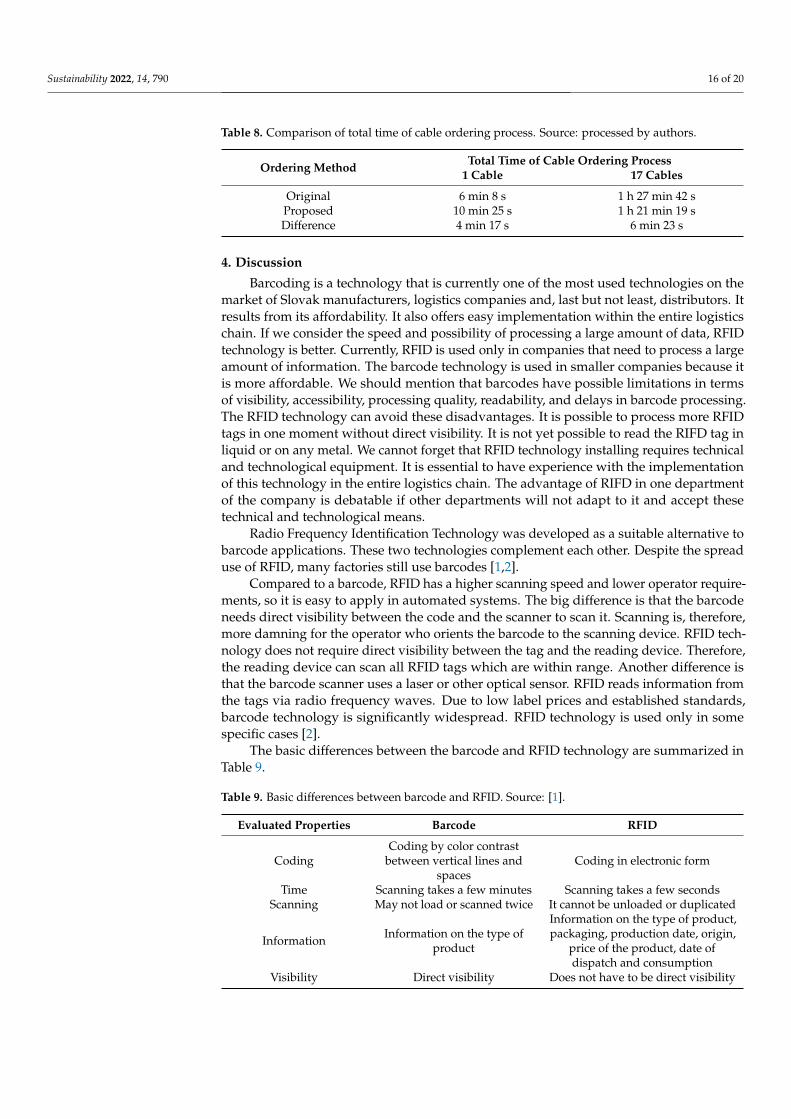
Sustainability 2022, 14, 790 16 of 20
Table 8. Comparison of total time of cable ordering process. Source: processed by authors.
Ordering Method Total Time of Cable Ordering Process1 Cable 17 Cables
Original 6 min 8 s 1 h 27 min 42 sProposed 10 min 25 s 1 h 21 min 19 sDifference 4 min 17 s 6 min 23 s
4. Discussion
Barcoding is a technology that is currently one of the most used technologies on themarket of Slovak manufacturers, logistics companies and, last but not least, distributors. Itresults from its affordability. It also offers easy implementation within the entire logisticschain. If we consider the speed and possibility of processing a large amount of data, RFIDtechnology is better. Currently, RFID is used only in companies that need to process a largeamount of information. The barcode technology is used in smaller companies because itis more affordable. We should mention that barcodes have possible limitations in termsof visibility, accessibility, processing quality, readability, and delays in barcode processing.The RFID technology can avoid these disadvantages. It is possible to process more RFIDtags in one moment without direct visibility. It is not yet possible to read the RIFD tag inliquid or on any metal. We cannot forget that RFID technology installing requires technicaland technological equipment. It is essential to have experience with the implementationof this technology in the entire logistics chain. The advantage of RIFD in one departmentof the company is debatable if other departments will not adapt to it and accept thesetechnical and technological means.
Radio Frequency Identification Technology was developed as a suitable alternative tobarcode applications. These two technologies complement each other. Despite the spreaduse of RFID, many factories still use barcodes [1,2].
Compared to a barcode, RFID has a higher scanning speed and lower operator require-ments, so it is easy to apply in automated systems. The big difference is that the barcodeneeds direct visibility between the code and the scanner to scan it. Scanning is, therefore,more damning for the operator who orients the barcode to the scanning device. RFID tech-nology does not require direct visibility between the tag and the reading device. Therefore,the reading device can scan all RFID tags which are within range. Another difference isthat the barcode scanner uses a laser or other optical sensor. RFID reads information fromthe tags via radio frequency waves. Due to low label prices and established standards,barcode technology is significantly widespread. RFID technology is used only in somespecific cases [2].
The basic differences between the barcode and RFID technology are summarized inTable 9.
Table 9. Basic differences between barcode and RFID. Source: [1].
Evaluated Properties Barcode RFID
CodingCoding by color contrast
between vertical lines andspaces
Coding in electronic form
Time Scanning takes a few minutes Scanning takes a few secondsScanning May not load or scanned twice It cannot be unloaded or duplicated
Information Information on the type ofproduct
Information on the type of product,packaging, production date, origin,
price of the product, date ofdispatch and consumption
Visibility Direct visibility Does not have to be direct visibility

Sustainability 2022, 14, 790 17 of 20
5. Conclusions
By introducing barcode technology into the cable ordering process, the company usedits potential and used the already established technology. Figure 5 shows the benefits ofthe proposed method and its comparison with the original process. Our proposal madethe process simpler and faster. Barcode technology also can reduce the error rate in theprocess. In addition, there is a possibility of further development and modernization of thecompany. But other opportunities arise from the introduction of technology into the cableordering process. These possible benefits of the proposal in the future may are:
• extending the proposed method to all available items;• implementation of the data on the length of the cable on the spool into the barcode;• setting up a regular inventory;• introducing cable scanning also when receiving cables;• regular monitoring and analysis of error rates;• automating the database and its checking;• introduction of the pulling principle from production.
Figure 5. Evaluation of the proposed method and future benefits. Source: processed by authors.
By extending the proposed method to all available cables, the activities in the processwill be unified and clear. Then the employee will no longer use two different ways ofpicking cables. The factory extended our proposed method to all available items after onemonth of testing. Measured data from the testing phase can help with the identification ofopportunities for further improvement. We can also implement the cable length informationfrom the spool into the barcode. It will also reduce the time necessary for preparing cablefor production. Negotiations are currently underway with the cable supplier to put thisoption into use.
The advantage of the proposed method is the simplification of the work of employeesin the warehouse and on operational purchasing. Another advantage is the reductionof mistakes in the process. Moreover, the proposal also eliminated problems with cablebalances in the database and in the warehouse. The main benefits include: no manual entry,minimal risk of mistakes, use of barcode technology, greater time savings and simplificationof activities.
Furthermore, the company will introduce the regular cable inventory, based on whichthe company will have information about stock level. The idea of scanning barcodes couldalso be an improvement when receiving materials. It would require another database ofreceived cables linked to the current cable database.
It also will be necessary to monitor and evaluate the errors that have occurred. Thiscomprehensive information helps to prevent further mistakes. We have analyzed the errorrate for 16 days (six day start phase, 10 day test phase on 10 cables). We found that themost errors occurred due to a poorly set up database. Therefore, it is necessary to continueto check the database and try to automate the work in it as much as possible. Automating

Sustainability 2022, 14, 790 18 of 20
work in the database can result in additional time savings. The introduction of the pullingprinciple from production can bring a positive change to the whole process. Managementconsidered this option already during the test phase. The operation principle is quitesimple. Production workers will scan the barcode on the empty cable spool they want toprovide. The scanning device will have a direct connection with the SAP system. It wouldwork in the so-called online mode. Warehouse workers would no longer have to go toproduction and check the requirements in the table. As part of the daily schedule, theywould check production requirements in the SAP system. After scanning the cable whenpreparing for production, this requirement would disappear in the system. The pullingprinciple requires a thorough preparation of the information system and the acquisitionof new scanning devices. However, it can bring significant simplification of work andsave time.
The verification of the result consists of the elaboration of our study on one example ofa cable harness for the subsequent launch of the test phase of the implementation of barcodetechnology at all workplaces with cable harnesses. The company expressed satisfactionwith the measured values and maybe only time will tell the correctness of the barcodeimplementation. The limitation may be the use of only 10 other workplaces, as the researchfocused on only one workplace and on the most ordered cable harness in the company.The high turnover of the given cable harness at the workplace where the test phase started,which is where orders for this type of cable placed, renders sufficient verification of thecorrectness of the procedure. Of course, only time can verify the correctness of the barcodetechnology used, as trends in this area are constantly changing, mainly during the COVID-19 pandemic. Furthermore, the company’s headquarters uses bar codes, and the subsidiarywanted to go in the same direction; therefore, using this technology would also makeseveral logistics operations easier. Nevertheless, in the conditions of the Slovak Republic,greater satisfaction with 2D codes is currently being demonstrated, as many products aretoo small and have problems with the placement of the bar code and the RFID chip. Wecan substantiate this statement by communicating with the company’s representative withKolarovszki Peter (GS Slovakia).
Author Contributions: Conceptualization, I.K. and J.K.; methodology, I.K. and J.K.; validation, I.K.,J.K. and K.C.; formal analysis, I.K., L.Š. and K.C.; investigation, I.K. and L.Š.; resources, I.K., J.K.; datacuration, I.K., J.K. and L.Š.; writing—original draft preparation, I.K.; K.C. and L.Š.; writing—reviewand editing, I.K., J.K. and K.C.; visualization, L.Š. and K.C.; supervision, I.K.; project administra-tion, I.K.; funding acquisition, I.K. All authors have read and agreed to the published version ofthe manuscript.
Funding: This publication was created thanks to support under the Operational Program IntegratedInfrastructure for the project: Identification and possibilities of implementation of new technologicalmeasures in transport to achieve safe mobility during a pandemic caused by COVID-19 (ITMS code:313011AUX5), co-financed by the European Regional Development Fund.
Institutional Review Board Statement: Not applicable.
Informed Consent Statement: Not applicable.
Data Availability Statement: Not applicable.
Conflicts of Interest: The authors declare no conflict of interest.
References1. Tu, Y.-J.; Zhou, W.; Piramuthu, S. Critical risk considerations in auto-ID security: Barcode vs. RFID. Decis. Support Syst. 2020,
142, 113471. [CrossRef]2. White, G.R.; Gardiner, G.; Prabhakar, G.; Razak, A.A. A Comparison of Barcoding and RFID Technologies in Practice. J. Inf. Inf.
Technol. Organ. (Years 1–3) 2007, 2, 119–132. [CrossRef]3. Schmidt, M.; Thoroe, L.; Schumann, M. RFID and Barcode in Manufacturing Logistics: Interface Concept for Concurrent
Operation. Inf. Syst. Manag. 2013, 30, 100–115. [CrossRef]4. Chen, J.C.; Cheng, C.H.; Wang, K.J.; Huang, P.T.B.; Chang, C.C.; Huang, C.J.; Ting, T.C. Application of RFID to Warehouse
Management. Key Eng. Mater. 2011, 486, 297–300. [CrossRef]

Sustainability 2022, 14, 790 19 of 20
5. Duroc, Y.; Tedjini, S. RFID: A key technology for Humanity. Comptes Rendus Phys. 2018, 19, 64–71. [CrossRef]6. Duroc, Y.; Kaddour, D. RFID Potential Impacts and Future Evolution for Green Projects. Energy Procedia 2012, 18, 91–98. [CrossRef]7. Joo, H.-J.; Cho, M.-T.; Jeong, H.-Y. RFID-based scale model freight car system allowing realtime quantity checking. Multimedia
Tools Appl. 2015, 76, 5985–6002. [CrossRef]8. Yao, Z.M.; Liu, X.O.; Liu, W. RFID Technology-Based the Railway Package Management Platform Design. Adv. Mater. Res. 2013,
774–776, 1653–1656. [CrossRef]9. Harrop, P. HF RFID—The Great Leap Forward. Available online: http://www.rfidwizards.com.html (accessed on 4 Febru-
ary 2010).10. Smith-Ditizio, A.A.; Smith, A.D. Barcodes vs. RFID and Its Continued Success in Manufacturing and Services. In Encyclopedia of
Information Science and Technology, Fourth Edition; Khosrow-Pour, D.B.A.M., Ed.; IGI Global: Hershey, PA, USA, 2018; pp. 5273–5284.11. Green, H.; Khermouch, G. Bar Codes Better Watch Their Backs BusinessWeek. Available online: http://www.businessweek.com/
magazine/content/03_28/b3841063.htm (accessed on 8 January 2016).12. Smith, A.D. Reverse logistics programs: Gauging their effects on CRM and online behavior. VINE 2005, 35, 166–181. [CrossRef]13. Smith, A.D. Evolution and acceptability of medical applications of RFID implants among early users of technology. Health Mark.
Q. 2008, 24, 121–155. [CrossRef]14. Byondi, F.K.; Chung, Y. Longest-Range UHF RFID Sensor Tag Antenna for IoT Applied for Metal and Non-Metal Objects. Sensors
2019, 19, 5460. [CrossRef] [PubMed]15. Choi, Y.; Ha, H.; Park, H.; Kim, H.; NamGung, K. The RFID Effectiveness Statistical Analysis Tool (RESAT) for Comparing
RFID and Barcode in Logistics Operations. In Convergence and Hybrid Information Technology; Lee, G., Howard, D., Slezak, D.,Hong, Y.S., Eds.; ICHIT 2012. Communications in Computer and Information Science, Volume 310; Springer: Berlin/Heidelberg,Germany, 2012. [CrossRef]
16. Kaakkurivaara, N. Possibilities of using barcode and RFID technology in Thai timber industry. Maejo Int. J. Sci. Technol. 2019, 13,29–41.
17. Štefancová, V.; Škorupa, M.; Kendra, M. Utilization of six sigma methodology in terms of reducing train delays. In Proceedings ofthe International Conference Transport Means, Juodkrante, Lithuania, 20–22 September 2017; pp. 373–376.
18. Jain, V.; Benyoucef, L.; Deshmukh, S.G. What’s the buzz about moving from ‘lean’ to ‘agile’ integrated supply chains? A fuzzyintelligent agent-based approach. Int. J. Prod. Res. 2008, 46, 6649–6677. [CrossRef]
19. Kennedy, F.A.; Widener, S.K. A control framework: Insights from evidence on lean accounting. Manag. Account. Res. 2008, 19,301–323. [CrossRef]
20. Scherrer-Rathje, M.; Boyle, T.A.; Deflorin, P. Lean, take two! Reflections from the second attempt at lean implementation. Bus.Horizons 2009, 52, 79–88. [CrossRef]
21. Smith, A.D.; Offodile, O.F. Gauging web portals impact on supply chain management concepts. Int. J. Logist. Manag. 2008, 4,184–206. [CrossRef]
22. Smith, A.D.; Offodile, O.F. The perceived importance of major RFID-related technology initiatives among retail store managers.Int. J. Serv. Oper. Manag. 2009, 5, 520–547. [CrossRef]
23. Mackey, T.K.; Nayyar, G. A review of existing and emerging digital technologies to combat the global trade in fake medicines.Expert Opin. Drug Saf. 2017, 16, 587–602. [CrossRef]
24. Lefebvre, E.; Romero, A.; Lefebvre, L.A.; Krissi, C. Assessing the relatively effectiveness of technological strategies for fightingcounterfeit medicines Communication and Management in Technological Innovation and Academic Globalization. In Proceed-ings of the 2010 International Conference on Communication and Management in Technological Innovation and AcademicGlobalization, Tenerife, Spain, 30 November–2 December 2010; pp. 62–67, ISBN 978-960-474-254-7.
25. Wang, C.N. RFID Technology Applied in Medicine Distribution Center. Appl. Mech. Mater. 2014, 651–653, 2040–2044. [CrossRef]26. Yao, W.; Chu, C.-H.; Li, Z. The use of RFID in healthcare: Benefits and barriers. In Proceedings of the 2010 IEEE International
Conference on RFID-Technology and Applications, Guangzhou, China, 17–19 June 2010; pp. 128–134. [CrossRef]27. McCathie, L.; Michael, K. Is it the End of Barcodes in Supply Chain Management? 2005. Available online: https://ro.uow.edu.au/
infopapers/380 (accessed on 27 August 2020).28. Want, R. Enabling ubiquitous sensing with RFID. Computer 2004, 37, 84–86. [CrossRef]29. Krombholz, K.; Frühwirt, P.; Kieseberg, P.; Kapsalis, I.; Huber, M.; Weippl, E. QR Code Security. In Lecture Notes in Computer
Science; Tryfonas, T., Askoxylakis, I., Eds.; Human Aspects of Information Security, Privacy, and Trust. HAS 2014; Springer: Cham,Switzerland, 2014; Volume 8533, pp. 79–90.
30. Ibrahim, A.; Dalkiliç, G. Review of different classes of RFID authentication protocols. Wirel. Networks 2017, 25, 961–974. [CrossRef]31. Ross, A.D.; Twede, D.; Clarke, R.H.; Ryan, M. A Framework for Developing Implementation Strategies for a Radio Frequency
Identification (Rfid) System in a Distribution Center Environment. J. Bus. Logist. 2009, 30, 157–183. [CrossRef]32. Chanchaichujit, J.; Balasubramanian, S.; Charmaine, N.S.M. A systematic literature review on the benefit-drivers of RFID
implementation in supply chains and its impact on organizational competitive advantage. Cogent Bus. Manag. 2020, 7, 1818408.[CrossRef]
33. Rao, S.; Ellis, S.C.; Goldsby, T.J.; Raju, D. On the “Invisible Inventory Conundrum” in RFID-Equipped Supply Chains: A DataScience Approach to Assessing Tag Performance. J. Bus. Logist. 2019, 40, 339–358. [CrossRef]

Sustainability 2022, 14, 790 20 of 20
34. Bhattacharya, M.; Wamba, S.F. A Conceptual Framework. In Technology Adoption and Social Issues: Concepts, Methodologies, Tools,and Applications Information Resources Management Association; IGI Global: Hershey, PA, USA, 2018; pp. 69–102.
35. Bhattacharya, M. Impact of RFID on the Retail Value Chain: An Exploratory Study Using a Mixed Method Approach. J. Technol.Manag. Innov. 2012, 7, 36–49. [CrossRef]
36. Wu, C.; Wang, X.; Chen, M.; Kim, M.J. Differential received signal strength based RFID positioning for construction equipmenttracking. Advanced Engineering Informatics. 2019, 42, 100960. [CrossRef]
37. Ngai, E.W.; Cheung, B.K.; Lam, S.; Ng, C.T. RFID value in aircraft parts supply chains: A case study. Int. J. Prod. Econ. 2014, 147,330–339. [CrossRef]
38. Wang, Y.-M.; Wang, Y.-S.; Yang, Y.-F. Understanding the determinants of RFID adoption in the manufacturing industry. Technol.Forecast. Soc. Chang. 2010, 77, 803–815. [CrossRef]
39. Bendavid, Y.; Wamba, S.F.; Barjis, J. Special Issue on RFID—Towards Ubiquitous Computing and the Web of Things: GuestEditors’ Introduction. J. Theor. Appl. Electron. Commer. Res. 2013, 8, 15–16. [CrossRef]
40. Keating, B.W.; Coltman, T.R.; Fosso-Wamba, S.; Baker, V. Unpacking the RFID Investment Decision. Proc. IEEE 2010, 98, 1672–1680.[CrossRef]
41. Wu, X.-D.; Wang, Y.-F.; Bai, J.-B.; Wang, H.-Y.; Chu, C.-H. RFID application challenges and risk analysis. In Proceedings of the2010 IEEE 17Th International Conference on Industrial Engineering and Engineering Management, Xiamen, China, 29–31 October2010; pp. 1086–1090.
42. Costa, F.; Genovesi, S.; Borgese, M.; Michel, A.; Dicandia, F.; Manara, G. A Review of RFID Sensors, the New Frontier of Internetof Things. Sensors 2021, 21, 3138. [CrossRef] [PubMed]
43. RFID Forecasts, Players and Opportunities 2018–2028: IDTechEx. Available online: https://www.idtechex.com/en/research-report/rfid-forecasts-players-and-opportunities-2018-2028/642 (accessed on 27 August 2020).
44. Cui, L.; Zhang, Z.; Gao, N.; Meng, Z.; Li, Z. Radio Frequency Identification and Sensing Techniques and Their Applications-AReview of the State-of-the-Art. Sensors 2019, 19, 4012. [CrossRef] [PubMed]
45. Jahani, N.; Sepehri, A.; Vandchali, H.; Tirkolaee, E. Application of Industry 4.0 in the Procurement Processes of Supply Chains: ASystematic Literature Review. Sustainability 2021, 13, 7520. [CrossRef]
46. Bag, S.; Dhamija, P.; Gupta, S.; Sivarajah, U. Examining the role of procurement 4.0 towards remanufacturing operations andcircular economy. Prod. Plan. Control. 2020, 32, 1368–1383. [CrossRef]
47. Bienhaus, F.; Haddud, A. Procurement 4.0: Factors influencing the digitisation of procurement and supply chains. Bus. ProcessManag. J. 2018, 24, 965–984. [CrossRef]
48. Chen, C.-L.; Lim, Z.-Y.; Liao, H.-C.; Deng, Y.-Y.; Chen, P. A Traceable and Verifiable Tobacco Products Logistics System with GPSand RFID Technologies. Appl. Sci. 2021, 11, 4939. [CrossRef]
49. Chen, C.-L.; Deng, Y.-Y.; Weng, W.; Zhou, M.; Sun, H. A blockchain-based intelligent anti-switch package in tracing logisticssystem. J. Supercomput. 2021, 77, 7791–7832. [CrossRef]
50. Kubasáková, I.; Šulgan, M. Logistika pre Zasielatel’stvo a Cestnú Dopravu, 1st ed.; EDIS—Vydavatel’stvo ŽU, Žilinská univerzita vŽiline: Žilina, Slovakia, 2013.