IMPACT OF IRRIGATION COST SUPPORT BY BANGLADESH GOVERNMENT IN RICE PRODUCTION THROUGH AGRICULTURAL...
13
BANGLADESH RESEARCH PUBLICATIONS JOURNAL ISSN: 1998-2003, Volume: 6, Issue: 4, Page: 380-392, March - April, 2012 IMPACT OF IRRIGATION COST SUPPORT BY BANGLADESH GOVERNMENT IN RICE PRODUCTION THROUGH AGRICULTURAL CASH SUBSIDY SYSTEM Tanvir Mahmud Bin Hossain*, M. A. Monayem Miah, Md. Sadique Rahman, and Sahadat Hossain Tanvir Mahmud Bin Hossain, M. A. Monayem Miah, Md. Sadique Rahman and Sahadat Hossain (2012). Impact of Irrigation Cost Support by Bangladesh Government in Rice Production through Agricultural Cash Subsidy System. Bangladesh Res. Pub. J. 6(4): 380-392. Retrieve from http://www.bdresearchpublications.com/admin/journal/upload/09305/09305.pdf Abstract The study for evaluation of cash subsidy system and its contribution in Boro rice production was carried out in selected areas of four districts of Bangladesh taking 400 samples by 100 from each district. This study exposed that based on the subsidised farmer’s outlook, the cash subsidy system is a very good efficient system. The average cash amount Tk. 839 as cash subsidy for irrigation contributes 5% of the irrigation cost and 1% of the total cost for rice production in the study areas. Though the production cost is almost same but the yield and gross return varies significantly between the subsidised farmer and non-subsidised farmer of the study area. Return to cash subsidy in Boro production is Tk. 1980. It is originated that the subsidised farmers are more technically efficient than non- subsidised rice farmers. The most important inefficient factors of the cash subsidy system are late payment of money and small amount of money. Government should continue this cash support system. But to make it more efficient the government must have to ensure the payment in proper time, increase the amount of money and also increase number of farmer under this support. Key Words: Diesel cost, Boro rice, Farmer’s support, Technical efficiency. Introduction Agriculture acts as a key structure of Bangladesh economy. Government support to the farmer, farm and agri-economy is essential for Bangladesh to keep the economy at sustainable level and to secure the food insecurity. The farm economy of the country is still at the subsistence level. The farm productivity of any crop is significantly hampered due to lack of sufficient capital. The distortion of crop production affects the food security status of the country. To ensure the food security and bring out the farmer from poverty level government of Bangladesh is providing the agriculture cash subsidy to the farmer of the country. Because alternative food and oil price subsidy distort the market price and have a pro-rich bias but cash transfer program is an efficiency way to finance the development goal and it helps to break the vicious cycle of poverty (Oschinski, 2008). Direct cash subsidy was first introduced in the year 2007-08 by the caretaker government regime of the country. At that year the government has disbursed about Tk. 250 crore (Tk. 2.5 billion) to the 65.93 lakh (6.6 Million) farmers as cash subsidy for diesel cost that is required for irrigation in Boro season. The government of Bangladesh introduced the agriculture subsidy through the Agri- input Assistance Card and Cash Assistance programme. As cash subsidy, the government provided cash to different categories of farmers through banks to
Transcript of IMPACT OF IRRIGATION COST SUPPORT BY BANGLADESH GOVERNMENT IN RICE PRODUCTION THROUGH AGRICULTURAL...
BANGLADESH RESEARCH PUBLICATIONS JOURNAL
ISSN: 1998-2003, Volume: 6, Issue: 4, Page: 380-392, March - April, 2012
IMPACT OF IRRIGATION COST SUPPORT BY BANGLADESH GOVERNMENT IN RICE PRODUCTION THROUGH AGRICULTURAL
CASH SUBSIDY SYSTEM
Tanvir Mahmud Bin Hossain*, M. A. Monayem Miah, Md. Sadique Rahman, and Sahadat Hossain
Tanvir Mahmud Bin Hossain, M. A. Monayem Miah, Md. Sadique Rahman and Sahadat Hossain (2012). Impact of Irrigation Cost Support by Bangladesh Government in Rice Production through Agricultural Cash Subsidy System. Bangladesh Res. Pub. J. 6(4): 380-392. Retrieve from http://www.bdresearchpublications.com/admin/journal/upload/09305/09305.pdf
Abstract The study for evaluation of cash subsidy system and its contribution in Boro rice production was carried out in selected areas of four districts of Bangladesh taking 400 samples by 100 from each district. This study exposed that based on the subsidised farmer’s outlook, the cash subsidy system is a very good efficient system. The average cash amount Tk. 839 as cash subsidy for irrigation contributes 5% of the irrigation cost and 1% of the total cost for rice production in the study areas. Though the production cost is almost same but the yield and gross return varies significantly between the subsidised farmer and non-subsidised farmer of the study area. Return to cash subsidy in Boro production is Tk. 1980. It is originated that the subsidised farmers are more technically efficient than non-subsidised rice farmers. The most important inefficient factors of the cash subsidy system are late payment of money and small amount of money. Government should continue this cash support system. But to make it more efficient the government must have to ensure the payment in proper time, increase the amount of money and also increase number of farmer under this support.
Key Words: Diesel cost, Boro rice, Farmer’s support, Technical efficiency.
Introduction Agriculture acts as a key structure of Bangladesh economy. Government
support to the farmer, farm and agri-economy is essential for Bangladesh to keep the economy at sustainable level and to secure the food insecurity. The farm economy of the country is still at the subsistence level. The farm productivity of any crop is significantly hampered due to lack of sufficient capital. The distortion of crop production affects the food security status of the country. To ensure the food security and bring out the farmer from poverty level government of Bangladesh is providing the agriculture cash subsidy to the farmer of the country. Because alternative food and oil price subsidy distort the market price and have a pro-rich bias but cash transfer program is an efficiency way to finance the development goal and it helps to break the vicious cycle of poverty (Oschinski, 2008).
Direct cash subsidy was first introduced in the year 2007-08 by the caretaker government regime of the country. At that year the government has disbursed about Tk. 250 crore (Tk. 2.5 billion) to the 65.93 lakh (6.6 Million) farmers as cash subsidy for diesel cost that is required for irrigation in Boro season. The government of Bangladesh introduced the agriculture subsidy through the Agri-input Assistance Card and Cash Assistance programme. As cash subsidy, the government provided cash to different categories of farmers through banks to
Impact of Irrigation Cost in Rice Production
http://www.bdresearchpublications.com/journal/
381
buy diesel for diesel-run power pumps in boro season. The marginal farmer (0.02-0.19 ha) and small farmer (0.2-1 ha) has got 800 taka and medium farmer (1.01 to 3.03 ha) has gotten 1000 taka as cash subsidy. In the FY 2009-10, government distributed 1 crore 82 lakh agricultural input cards among the farmers. Agricultural cash subsidy with an amount of 750 crore (7.5 billion) (US$107 million) taka was distributed to 91 lakh (9.1 million) farmer for diesel operated irrigation. The policy makers hoped that this new type of subsidy would streamline service delivery, enable automatic cash transfers and reduce misappropriation. Government has covered 50% of the total farmer (18.2 million) through providing the cash subsidy in every corner of the country. In the country, 87% of the water pumps are diesel driven. About 800 million litres of diesel are used in running 1.2 million irrigation pumps engaged for irrigation in Boro season. The cost of lifting per cubic litre of water is Tk.1.09 for electricity driven pumps and Tk. 2.0 for diesel irrigation pump. It is estimated that 35 litres of diesel is needed for irrigation in one bigha of land. The government has given Tk. 5.0/litre as cash subsidy for diesel irrigation. Government also provide 20% incentives for electricity-run irrigation pumps.
There are not enough studies to evaluate the agriculture subsidy systems explicitly this cash incentive system. For further improvement of the subsidy system it is important to evaluate the pros and cons of the system and achievement of the system for farmers support and proper utilization. Following the need for evaluation of national agriculture subsidy policy and implementation, this study has taken initiative to evaluate the performance of cash incentive system and its impact on the farm Boro rice production economy and identify more options of government support to the farmer.
Methodology The field survey of the study was conducted in the FY 2010-11 to evaluate
the contribution of the cash subsidy in rice production (boro season) of the FY 2009-10. The study areas were selected purposively from the Boro rice growing areas of Bangladesh. The selected study areas were located in the sadar upazila of Panchagarh, Satkhira, Habiganj district, and Hathazari upazila of Chittagong district. From each of the study area (extension block) of the respective upazila of each district, 50 subsidised and 50 non-subsidised farmers were purposively selected who has diesel engine operated irrigated land in Boro cultivation. A total of 400 samples were collected to achieve the objectives of this study. The farmers are grouped according the farm size of the sample farmer, which are classified as marginal (< 0.19 ha), small (< 1 ha), medium (< 3.03 ha) and large (> 3.03 ha). Table 1 represents the sample distribution according to the farm size category.
Test the Difference of the Sample Mean To verify the mean difference between the variable of the subsidised
farmer and non-subsidised farmer group t-test was conducted for the independent group of sample. For the t-test the null hypothesis (H0) is there is no difference between the population mean of subsidised farmer and population mean of non-subsidised farmer. The alternative hypothesis is (Ha) the population mean of subsidised farmer is not equal to the population mean of non-subsidised farmer. The hypothesis are H0 : µs - µns = 0 and Ha : µs - µns ≠ 0 and the formula for t-test was applied:
Where the mean of the subsidised farmer sample is is the mean of
the non-subsidised farmer. The µs is the population mean of the subsidised farmer and µns was population mean of non subsidised farmer assuming that H0 is true.

Hossain et. al.
http://www.bdresearchpublications.com/journal/
382
And is the standard error of the difference between subsidised farmer and non-subsidised farmer mean.
Method to Calculate Efficiency of Cash Subsidy System Let us presume that there are N number of farmers population in the study
area from where n number of samples are collected for this study who are denoted as i, where i = 1,2,3…. n number of respondents. The n farmer is asked Qijk
questions where j represents 1,2……m number of questions. The answer of question is coded with the number which is detonated as k and where k = 1,2…. p. There are some questions which answer can be more than one code. The
value of coded answer of each question is summed and get where R is the value of the each question answered by the respondents. Then value of all
answer of the question is summed and get the Yi is the total knowledge estimated of each respondents. It need to be remember that each and every answer of question must have maximum value of code and by adding all the
maximum value of the answer code of the questions we can get , and it should be Zi ≥ Yi. To assess the level of efficiency it needs to be estimated the percentage of efficiency level EFi of every respondent. The EFi can be
estimated as where estimated EFi of every respondents opinion are then grouped which represents the efficiency level. The measurement of efficiency quality category of cash subsidy system was group by the formula {ml ≤ EFi ≤ (ml+9)} where ml is the minimum efficiency level of the cash subsidy system and minimum efficiency level of each efficiency quality group.
Estimation of Technical Efficiency of Rice Farmer Technical efficiency simple means that doing the best job by possible of
combining resources to make a good. A farmer is technically efficient when he produce a good at the lower possible opportunity cost. Technical efficiency of a farm indicates the ability of a firm to achieve maximum possible output with available resources. The stochastic Cobb-Douglas production frontier model was used for estimating technical efficiency of rice producer in the study areas. This method is widely used in different literatures (Idiong, 2007, Bifarin et. al., 2010, Onumah, et. al. 2010, Salau et. al. 2012) to estimate the technical efficiency of agricultural crop. The model specification is given below:
ln Yi = β0 + β1 ln X1i + β2 ln X2i + .............. + βn ln Xni + Vi - Ui
Where, ln represents the natural logarithm; the subscript i represents the i-th farmer in the sample, Y represents the quantity of rice harvest in Kilogram, Xi represents the variable factors of production, βi unknown parameters to be estimated, Vi assumed to be independently and identically distributed (i) random errors, having N (0, σv2) distribution, ui are non-negative one sided random variables, called technical inefficiency effects, associated with the technical inefficiency of production of the farmers involved. It is assumed that the inefficiency effects are independently distributed with a half normal distribution (U ~ | N (0, σv2)|).
To examine the role of relevant farm specific variables in efficiency, the production inefficiency effect model can be written as follow: Ui = δ0 + δ1 Z1i + δ2 Z2i + ….. + δn Zni + Wi, Where, Zi represents the farm specific inefficiency variable factors of production, δi unknown parameters to be estimated, Wi unobservable

Impact of Irrigation Cost in Rice Production
http://www.bdresearchpublications.com/journal/
383
random variables, which are assumed to be independently distributed with a positive half normal distribution.
The empirical Cobb-Douglas stochastic frontier production function with double log form can be expressed as:
iiiiiii X nl X ln X ln X ln X ln X ln Y ln 6655443322110 βββββββ ++++++=
iX ln 77β+ ii uv −+ (1)
Where, ln = Natural logarithm, Y = Yield of Rice of the i-th farm (kg/ha), X1 = Land preparation cost used by the i-th farm (Tk/ha), X2 = Seed used by the i-th farm (kg/ha), X3 = Human labour used by the i-th farm (man-days/ha), X4= Irrigation (Tk/ha), X5 = Inorganic Nutrient (Fertilizers) used by the i-th farm (kg/ha), X6 = Organic Nutrient (Manure) used by the i-th farm (kg/ha), X7 = Insecticides cost used by the i-th farm (Tk/ha), β’s and η’s are unknown parameters to be estimated, vi - ui = error term. Vi are assumed to be independently and identically
distributed random errors, having N (0, ) distribution. 2vσ
Technical Inefficiency Effect Model The ui’s in equation (1) are non-negative random variables, called
technical inefficiency effects, assumed that to be independently distributed such that the technical inefficiency effects for the ith farmer, ui, are obtained by truncation normal distribution with mean zero and variance , such that 2
uσ
iiiiiiii Wzzzzzzu +++++++= 6655443322110 δδδδδδδ (2)
Where, Z1 = Farm size of the i-th farm operator (ha), Z2 = Age of the i-th farm operator (years), Z3 = Education of the i-th farm operator (year of schooling), Z4 = Experience in rice farming of the i-th farm operator (year), Z5= Agricultural knowledge level of the i-th farmer (index number), Z6 = Family size of the rice growers of i-th farm operator (number), δ’s are unknown parameters to be estimated and Wi are unobservable random variable or classical disturbance term, which are assumed to be independently distributed, obtained by truncation of the normal distribution with mean zero and unknown variance , such that u2σ i is non-negative.
The β, η and δ coefficients are unknown parameters to be estimated, together with the variance parameters which are expressed in term of
222vu σσσ += (3)
and (4) 22 /σσγ u=
γ is the ratio of variance of farm specific technical efficiency to the total variance of output and has a value between zero and one. The estimates for all parameters of the stochastic frontier (1) and inefficiency model (2) were estimated in a single stage by using the Maximum Likelihood (ML) method. The econometric computer software package FRONTIER 4.1 (Coelli, 1996) was applied to estimate the parameters of stochastic frontier models using the ML.

Hossain et. al.
http://www.bdresearchpublications.com/journal/
384
Result and discussions Performance of Cash Subsidy System
The average money received by the 200 farmers from the cash subsidy system was Tk. 839 (Table 1). Among farm category, large and medium farm received Tk. 880 and small and marginal farm received Tk. 816 and Tk. 800 respectively. Among the subsidised farmer of all four districts, 80.5% of them were Tk. 800 receiver and 19.5% of farmers were Tk. 1000 receiver. A highest 53% of small farmer get cash subsidy by an amount of Tk. 800.
Table 1. Information of cash subsidy provided to the farmer of all study areas
Farm category Avg. Amount (Tk)
Subsidised (%)
Subsidised (%) Tk.800
Subsidised (%) Tk.1000
Marginal Farm 800 5 5 0 Small Farm 816 57.5 53 4.5
Medium Farm 880 35 21 14 Large Farm 880 2.5 1.5 1
All area 839 100 80.5 19.5
Perception of Farmer about Cash Subsidy Farmer’s perception about the various issues of the cash subsidy and
government support was revealed in this study. It is perceptible that in the study areas 99.5% of the subsidised farmer knew who gave the money as cash subsidy to them. 65.33% of the farmer answered that government was cash subsidy provider. It is identified that 97% of the farmer knew purpose of cash subsidy and among them 86.6% of farmer knew it was for diesel cost of irrigation. The study revealed that 54.5% of the farmer spent the cash subsidy money for irrigation expenditure purpose through paying the due diesel cost. This also indicated that farmers felt free to inform the real information of cash subsidy utilization by them.
Efficiency of Cash Subsidy The cash subsidy system was very new in Bangladesh. So this system may
have some shortcomings which are important to identify for improving the system. As farmers are the main user and beneficiaries of this system so it is a better idea to measure the level of efficiency from the farmer’s point of view through their opinion, assessment and experience. Farmers of the study areas gave their comments and opinions about disbursement system of cash subsidy. Farmer remarked about the issue of account opening system in the bank, timely distribution of money, time consumption of taking money, sufficiency of the amount of subsidy, system of farmer’s name collection for subsidy. All the comments were coded, summed and finally made an efficiency score. The efficiency (EF) score are then grouped in to five ranks of quality. The quality of the efficiency are grouped as poor (0.1≤EF≤ 0.29), fair (0.3≤EF≤ 0.49), good (0.5≤EF≤ 0.69), very good (0.7≤EF≤0.89) and excellent (0.9≤EF≤1). The efficiency of the cash subsidy system is presented in Table 3. The cash subsidy system was very good system assessed by 66% farmer of all four districts. Rest of 6% farmer mentioned that it was an excellent system, 26% farmer remarked it as good system and 2% farmer mentioned it as a fair system (Table 2).

Impact of Irrigation Cost in Rice Production
http://www.bdresearchpublications.com/journal/
385
Table 2. Percentage of farmer’s opinion about the efficiency of Cash Subsidy system
Efficiency (EF) category Poor Fair Good Very good Excellent
Farm category
(0.1≤0.29) (0.3≤0.49) (0.5≤0.69) (0.7≤0.89) (0.9≤1) All area 2 26 66 6 Marginal Farm 1 3.5 0.5 Small Farm 2 16 35.5 4 Medium Farm 7.5 26 1.5 Large Farm 1.5 1 0
Drawbacks of the Cash Subsidy Initiative The most important shortcoming of the cash subsidy initiative was
insufficiency of money. According to the farmer’s opinion, the amount of money given to the farmer was not enough for irrigation expenditure. 83% farmer of all four districts study area mentioned that the money gave to the farmer was not enough to support the whole amount of irrigation cost. Farmer’s suggested that Tk. 2230 can be a satisfactory cash support for irrigation which is 14% higher than the support already given to the farmers. The study exposed that one of the vital shortcomings of the cash subsidy initiative was that it was given lately at the harvesting time in spite of given at peak irrigation time. 77% of the farmer of all four districts a whole mentioned that the money was not given in proper time.
Farmer’s Suggestion to Improve the System Farmers of the study area suggested some options to improve this system.
A highest percentage of farmers (28.5%) suggested including more farmers in the list and giving money to those farmers (Table 3). Following this issue 20% farmer suggested to increasing the amount of money. 19% of the farmer suggested giving money or any kind of support at proper time. Keeping this in mind government or the respective authority must have to take initiative to provide support to the farmer in a right time. The farmer of the study area (24%) requested to give money according to per unit of land that a farmer own for cultivation. So that they can spend the given money for each and every piece of land they use for cultivation. Farmers (8.5%) also requested to make an easy account creation system in the bank.
Table 3. Percentage of farmer’s opinion to increase the performance of cash subsidy system
Recommendation options Farm category Increase number
of farmer
Increase Money
Timely supply
Make easy to open
account in bank
Cash subsidy according to
land cultivation
All area 28.5 20 19 8.5 24 Marginal Farm 3 1 1 0 0 Small Farm 16 12 9 5.5 15 Medium Farm 8 6.5 9 3 8.5 Large Farm 1.5 0.5 0 0 0.5

Hossain et. al.
http://www.bdresearchpublications.com/journal/
386
Contribution of Diesel Cost in Rice Production Economy Cost Analysis of Rice Cultivation
The amount of average input use of all four districts is presented in the Table 4. The subsidised farmer used human labour 153 man-days/ha and non-subsidised farmer used 147 man-days/ha of human labour. There was a significant difference between human labour use of these two farmer groups (t=4.67, p=0.00<0.5). Both the subsidised farmer and non-subsidised farmer applied seed rate of 42 kg/ha. The subsidised farmer applied urea of 229 kg/ha and non-subsidised farmer applied 230 kg/ha. There was no significant difference between the urea application of the two groups (t = -0.419, p = 0.676 >0.1). This urea application rate was little higher than that the BRRI recommended doze (220 kg/ha) for short duration modern variety rice like BR-28 (135 days) and little lower (270 kg/ha) that the recommended dose for long duration rice like BR-29 (150 days). The difference of TSP application between these two groups were significant (t = 3.148, p = 0.002<0.01). The MoP application difference was not significant between the two groups of farmer. (t = 1.296, p = 0.196> 0.1). Both category of farmers also used Gypsum, Zinc Sulphate (ZnSo4) and manure for Boro rice cultivation.
Table 4. Comparative quantity of cultivation practices by subsidised and non subsidised farmers of all study area
All Study Area Expenditure Items Subsidised Non-Subsidised
Human Labour (Man-day/ha) 153 147 Family labour 37 37 Hired labour 116 111 Seed (Kg/ha) 42 42 Fertilizer Applied (Kg/ha) 0 0 Urea 229 230 TSP 75 73 MoP 64 63 Gypsum 23 21 Zinc Sulphate 2 2 Manure (Kg/ha) 3430 4084
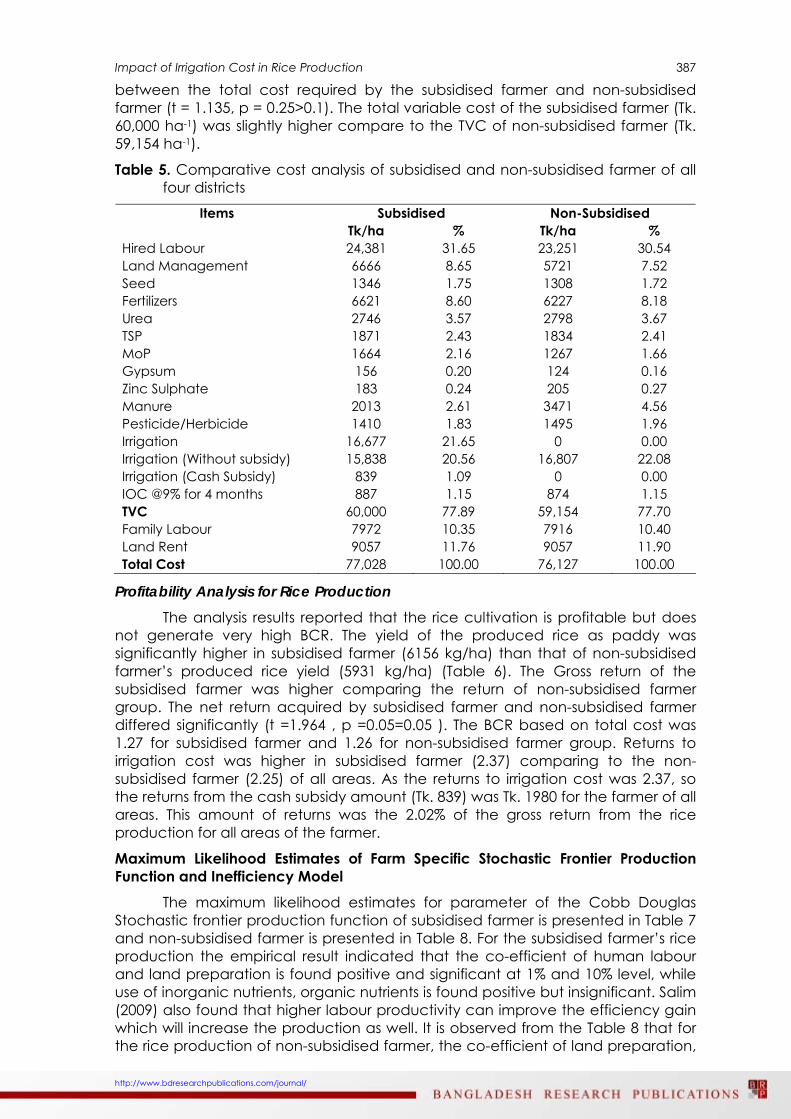
Table 5 represents comparative cost analysis report for subsidised farmer and non-subsidised farmer of all study areas. There was no significant difference between the hired labour cost of subsidised farmer and non-subsidised farmer group (t= 1.442, p = 0.15>0.1). The share of irrigation cost in the total production cost was higher in case of non-subsidised farmer (22.08%) compare to the share of subsidised farmer group (21.65%). For the subsidised farmer, the amount of irrigation cost without cash subsidy was Tk. 15,838 ha-1 and the amount of cash subsidy was an average of Tk. 839. The share of irrigation cost without subsidy was 20.56% and the share of the cash subsidy was 1.09% of the total cost. The share of cash subsidy in irrigation cost was 5.03%. The total irrigation cost was higher in non-subsidised farmer (Tk. 16,807 ha-1) comparing to the non-subsidised farmer’s (Tk. 16,677 ha-1) irrigation cost. There was significant difference in irrigation expenditure between two farmer group (t = -3.551, p = 0.0<0.01). There was significant difference between the fertilizer cost for subsidised farmer and non-subsidised farmer group (t = 0.257, p = 0.00 <0.1). The difference between the insecticide/pesticide use cost of subsidised farmer and non-subsidised farmer was not significant (t =-0.879, p = 0.38 > 0.1). The total cost of rice cultivation was higher in subsidised farmer (Tk. 77,028 ha-1) comparing to the total cost of non-subsidised farmer group (Tk. 76,127 ha-1). There was no significant difference
Impact of Irrigation Cost in Rice Production
http://www.bdresearchpublications.com/journal/
387
between the total cost required by the subsidised farmer and non-subsidised farmer (t = 1.135, p = 0.25>0.1). The total variable cost of the subsidised farmer (Tk. 60,000 ha-1) was slightly higher compare to the TVC of non-subsidised farmer (Tk. 59,154 ha-1).
Table 5. Comparative cost analysis of subsidised and non-subsidised farmer of all four districts
Subsidised Non-Subsidised Items Tk/ha % Tk/ha %
Hired Labour 24,381 31.65 23,251 30.54 Land Management 6666 8.65 5721 7.52 Seed 1346 1.75 1308 1.72 Fertilizers 6621 8.60 6227 8.18 Urea 2746 3.57 2798 3.67 TSP 1871 2.43 1834 2.41 MoP 1664 2.16 1267 1.66 Gypsum 156 0.20 124 0.16 Zinc Sulphate 183 0.24 205 0.27 Manure 2013 2.61 3471 4.56 Pesticide/Herbicide 1410 1.83 1495 1.96 Irrigation 16,677 21.65 0 0.00 Irrigation (Without subsidy) 15,838 20.56 16,807 22.08 Irrigation (Cash Subsidy) 839 1.09 0 0.00 IOC @9% for 4 months 887 1.15 874 1.15 TVC 60,000 77.89 59,154 77.70 Family Labour 7972 10.35 7916 10.40 Land Rent 9057 11.76 9057 11.90 Total Cost 77,028 100.00 76,127 100.00
Profitability Analysis for Rice Production The analysis results reported that the rice cultivation is profitable but does
not generate very high BCR. The yield of the produced rice as paddy was significantly higher in subsidised farmer (6156 kg/ha) than that of non-subsidised farmer’s produced rice yield (5931 kg/ha) (Table 6). The Gross return of the subsidised farmer was higher comparing the return of non-subsidised farmer group. The net return acquired by subsidised farmer and non-subsidised farmer differed significantly (t =1.964 , p =0.05=0.05 ). The BCR based on total cost was 1.27 for subsidised farmer and 1.26 for non-subsidised farmer group. Returns to irrigation cost was higher in subsidised farmer (2.37) comparing to the non-subsidised farmer (2.25) of all areas. As the returns to irrigation cost was 2.37, so the returns from the cash subsidy amount (Tk. 839) was Tk. 1980 for the farmer of all areas. This amount of returns was the 2.02% of the gross return from the rice production for all areas of the farmer.
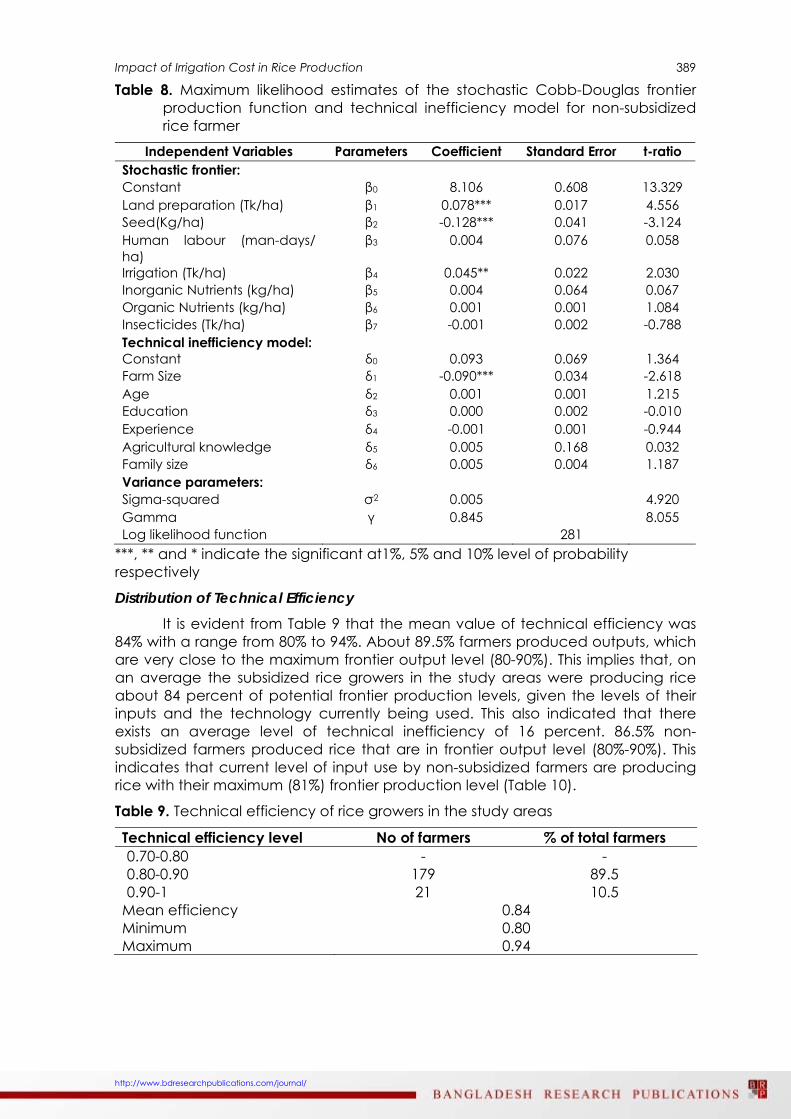
Maximum Likelihood Estimates of Farm Specific Stochastic Frontier Production Function and Inefficiency Model The maximum likelihood estimates for parameter of the Cobb Douglas Stochastic frontier production function of subsidised farmer is presented in Table 7 and non-subsidised farmer is presented in Table 8. For the subsidised farmer’s rice production the empirical result indicated that the co-efficient of human labour and land preparation is found positive and significant at 1% and 10% level, while use of inorganic nutrients, organic nutrients is found positive but insignificant. Salim (2009) also found that higher labour productivity can improve the efficiency gain which will increase the production as well. It is observed from the Table 8 that for the rice production of non-subsidised farmer, the co-efficient of land preparation,

Hossain et. al.
http://www.bdresearchpublications.com/journal/
388
seed and irrigation is found positive and significant at 1% and 5% level. In the technical in-efficiency model, the co-efficient of subsidised farmer’s farm size is negative and significant at 1% level. It means that technical inefficiency in rice production decreases with the increase in farmer’s farm size. The negative coefficient is also observed in education and experience. Similar observation was found in various earlier studies (Coelli and Battese, 1996, Sharif and Dhar 1996, and Seyoum et al. 1998). In the technical in-efficiency model the co-efficient of non-subsidised farmer’s farm size is negative and significant at 1% level.
Table 6. Profitability estimation and comparison between subsidised and non-subsidised farmer of all four study areas
Items Subsidised Non-Subsidised Rice Yield (Kg/ha) 6156 5931 Gross return (GR) (Tk/ha): 97249 95125 Paddy 93402 91417 Straw 3847 3707 TC (Tk/ha) 77028 76127 TVC (Tk/ha) 60000 59154 Net Return (Tk/ha) 20221 18997 RAVC (Tk/ha) 37249 35970 BCR on TC 1.27 1.26 Return to Labour cost 1.67 1.66 Return to Irrigation cost 2.37 2.25 Returns from subsidy 1980 - % of subsidy return in GR 2.02 -
Table 7. Maximum likelihood estimates of the stochastic Cobb-Douglas frontier production function and technical inefficiency model for subsidized rice farmer
Independent Variables Parameters Coefficient Standard Error t-ratio Stochastic frontier: Constant β0 0.714 0.511 13.961 Land preparation (Tk/ha) β1 0.095*** 0.018 5.393 Seed(kg/ha) β2 -0.011 0.039 -0.277 Human labour (man-days/ ha)
β3 0.115* 0.060 1.920
Irrigation (Tk/ha) β4 -0.012 0.017 -0.721 Inorganic Nutrients (kg/ha) β5 0.067 0.053 1.261 Organic Nutrients (kg/ha) β6 0.000 0.000 0.720 Insecticides (Tk/ha) β7 -0.002 0.001 -1.356 Technical inefficiency model: Constant δ0 -0.007 0.091 -0.081 Farm Size δ1 -0.116** 0.053 -2.166 Age δ2 0.001 0.001 1.137 Education δ3 -0.002 0.003 -0.555 Experience δ4 -0.001 0.002 -0.797 Agricultural knowledge δ5 0.170 0.190 0.898 Family size δ6 0.001 0.002 0.478 Variance parameters: Sigma-squared σ2 0.06 3.535 Gamma γ 0.731 6.787 Log likelihood function 291
***, ** and * indicate the significant at1%, 5% and 10% level of probability respectively
Impact of Irrigation Cost in Rice Production
http://www.bdresearchpublications.com/journal/
389
Table 8. Maximum likelihood estimates of the stochastic Cobb-Douglas frontier production function and technical inefficiency model for non-subsidized rice farmer
Independent Variables Parameters Coefficient Standard Error t-ratio Stochastic frontier: Constant β0 8.106 0.608 13.329 Land preparation (Tk/ha) β1 0.078*** 0.017 4.556 Seed(Kg/ha) β2 -0.128*** 0.041 -3.124 Human labour (man-days/ ha)
β3 0.004 0.076 0.058
Irrigation (Tk/ha) β4 0.045** 0.022 2.030 Inorganic Nutrients (kg/ha) β5 0.004 0.064 0.067 Organic Nutrients (kg/ha) β6 0.001 0.001 1.084 Insecticides (Tk/ha) β7 -0.001 0.002 -0.788 Technical inefficiency model: Constant δ0 0.093 0.069 1.364 Farm Size δ1 -0.090*** 0.034 -2.618 Age δ2 0.001 0.001 1.215 Education δ3 0.000 0.002 -0.010 Experience δ4 -0.001 0.001 -0.944 Agricultural knowledge δ5 0.005 0.168 0.032 Family size δ6 0.005 0.004 1.187 Variance parameters: Sigma-squared σ2 0.005 4.920 Gamma γ 0.845 8.055 Log likelihood function 281
***, ** and * indicate the significant at1%, 5% and 10% level of probability respectively
Distribution of Technical Efficiency It is evident from Table 9 that the mean value of technical efficiency was
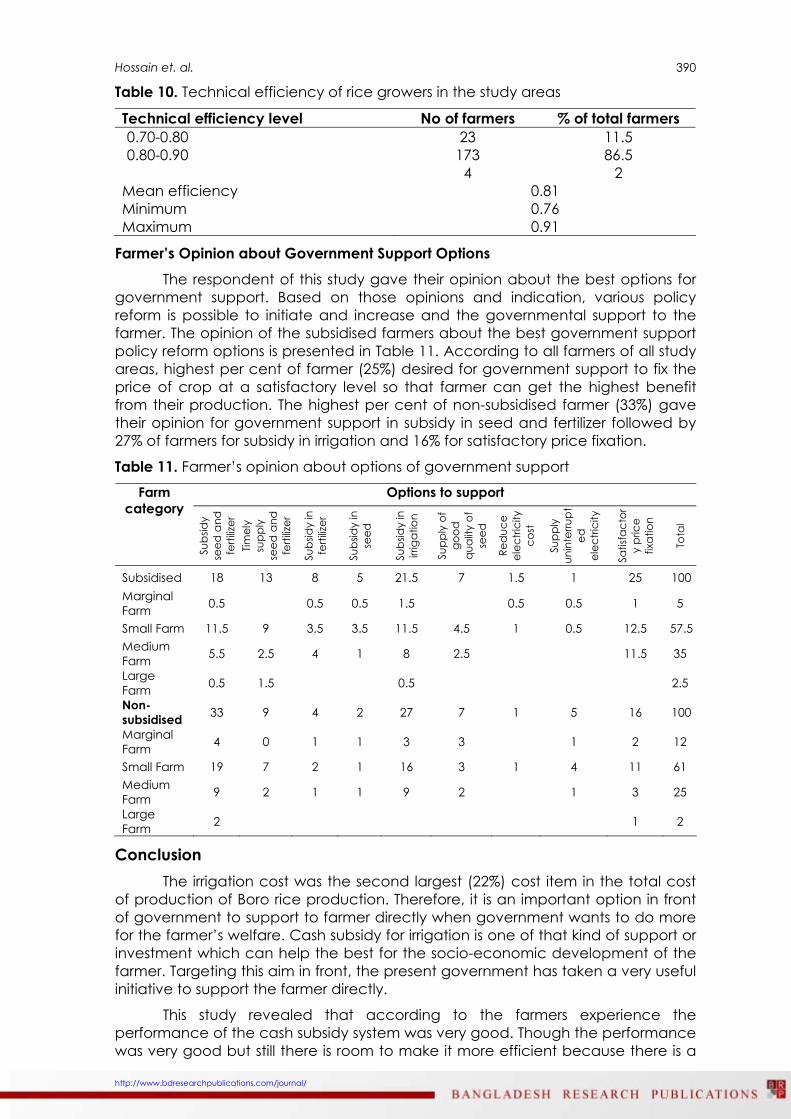
84% with a range from 80% to 94%. About 89.5% farmers produced outputs, which are very close to the maximum frontier output level (80-90%). This implies that, on an average the subsidized rice growers in the study areas were producing rice about 84 percent of potential frontier production levels, given the levels of their inputs and the technology currently being used. This also indicated that there exists an average level of technical inefficiency of 16 percent. 86.5% non-subsidized farmers produced rice that are in frontier output level (80%-90%). This indicates that current level of input use by non-subsidized farmers are producing rice with their maximum (81%) frontier production level (Table 10).
Table 9. Technical efficiency of rice growers in the study areas
Technical efficiency level No of farmers % of total farmers 0.70-0.80 - - 0.80-0.90 179 89.5 0.90-1 21 10.5
Mean efficiency 0.84 Minimum 0.80 Maximum 0.94
Hossain et. al.
http://www.bdresearchpublications.com/journal/
390
Table 10. Technical efficiency of rice growers in the study areas
Technical efficiency level No of farmers % of total farmers 0.70-0.80 23 11.5 0.80-0.90 173 86.5
4 2 Mean efficiency 0.81 Minimum 0.76 Maximum 0.91
Farmer’s Opinion about Government Support Options The respondent of this study gave their opinion about the best options for
government support. Based on those opinions and indication, various policy reform is possible to initiate and increase and the governmental support to the farmer. The opinion of the subsidised farmers about the best government support policy reform options is presented in Table 11. According to all farmers of all study areas, highest per cent of farmer (25%) desired for government support to fix the price of crop at a satisfactory level so that farmer can get the highest benefit from their production. The highest per cent of non-subsidised farmer (33%) gave their opinion for government support in subsidy in seed and fertilizer followed by 27% of farmers for subsidy in irrigation and 16% for satisfactory price fixation.
Table 11. Farmer’s opinion about options of government support Options to support Farm
category
Subs
idy
seed
and
fe
rtiliz
er
Timel
y su
pply
se
ed a
nd
ferti
lizer
Subs
idy
in
ferti
lizer
Subs
idy
in
seed
Subs
idy
in
irrig
atio
n
Supp
ly o
f go
od
qua
lity
of
seed
Red
uce
elec
trici
ty
cost
Supp
ly
unin
terru
pt
ed
elec
trici
ty
Satis
fact
ory
pric
e fix
atio
n
Tota
l
Subsidised 18 13 8 5 21.5 7 1.5 1 25 100 Marginal Farm 0.5 0.5 0.5 1.5 0.5 0.5 1 5
Small Farm 11.5 9 3.5 3.5 11.5 4.5 1 0.5 12.5 57.5 Medium Farm 5.5 2.5 4 1 8 2.5 11.5 35
Large Farm 0.5 1.5 0.5 2.5
Non-subsidised 33 9 4 2 27 7 1 5 16 100
Marginal Farm 4 0 1 1 3 3 1 2 12
Small Farm 19 7 2 1 16 3 1 4 11 61 Medium Farm 9 2 1 1 9 2 1 3 25
Large Farm 2 1 2
Conclusion The irrigation cost was the second largest (22%) cost item in the total cost
of production of Boro rice production. Therefore, it is an important option in front of government to support to farmer directly when government wants to do more for the farmer’s welfare. Cash subsidy for irrigation is one of that kind of support or investment which can help the best for the socio-economic development of the farmer. Targeting this aim in front, the present government has taken a very useful initiative to support the farmer directly.
This study revealed that according to the farmers experience the performance of the cash subsidy system was very good. Though the performance was very good but still there is room to make it more efficient because there is a

Impact of Irrigation Cost in Rice Production
http://www.bdresearchpublications.com/journal/
391
need to increase the amount of money and number of farmer. The most important option to increase farmer’s satisfaction is to provide it in a proper time. Proper utilization of the cash subsidy is also concerning issue for the government side. The study found that more than half of the subsidised farmer utilized the money by giving the due payment of the irrigation cost. The contribution of irrigation subsidy to the total cost was 1.09% and of the irrigation cost was 5.03%. The returns to cash subsidy was Tk. 1980 in the study area. The study concluded that though there was no significant difference in the total cost of the rice production by subsidised farmer and non-subsidised farmer but the there was significant difference in gross return as well as net return of the two farmers group. The higher yield of the subsidised farmer also indicated higher technical efficiency of the farmer at the study area. Both the farmer groups highly suggested to the government for supporting them through a satisfactory level of price fixation, more subsidy in seed and fertilizer and more amount of money as cash subsidy in irrigation. In concluding this study it can be highly recommendable that government should continue direct support to the farmer whether it is cash or kind. Because the direct support through the input assistance card reduces the inefficiency of the government support system to the farmer. Target oriented support as cash subsidy can help the farmer directly through reducing the leakage of the supporting system and increase the satisfaction of the farmer. Because efficient supporting system can only help the farmer to lift them up from the subsistence level and from the poverty level.
References Bifarin, J.O., Alimi, T. , Baruwa, O. I., and Ajewole, O. C. (2010) Determinant of
Technical, Allocative and Economic Efficiencies in the Plantain (Musa spp.) Production Industry, Ondo State, Nigeria, Proc. IC on Banana & Plantain in Africa, Eds.: T. Dubois et al., Acta Hort. 879, ISHS 2010. Pg. 199-210.
Coelli, T. (1996) A Guide to FRONTIER Version 4.1: A Computer Program for Stochastic Frontier Production and Cost Function Estimation, Centre for Efficiency and Productivity Analysis, University of New England. CEPA Working Paper 96/0.
Coelli, Tt. and Battese, G., (1996). Identification of Factors which Influence the Technical Inefficiency of Indian Farmers. Australian Journal of Agricultural Economics, 40(2): 103-128.
Idiong, I.C. (2007) Estimation of Farm Level Technical Efficiency in Smallscale Swamp Rice Production in Cross River State of Nigeria: A Stochastic Frontier Approach, IDOSI Publications, World Journal of Agricultural Sciences 3 (5): 653-658, 2007, Pg. 653-658.
Onumah, E. E., Brümmer, B., Hörstgen- Schwark, G. (2010) Productivity of hired and family labour and determinants of technical inefficiency in Ghana’s fish, Farms, Agric. Econ. – czEch, 56, 2010 (2): 79–88
Oschinsk. M (2008). Financing for development series: Are cash transfer a suitable alternative to energy and food subsidies?, Briefing paper 11/2008, German Development Institute (Die).
Rahman, S. M. and Takeda, J. (2007) Measuring the Costs of Production Based on Sizes of Farm Operation: A Study on Rice Farmers in Jessore District of Bangladesh , Science Publications, American Journal of Applied Sciences 4 (5): 274-283, 2007, ISSN 1546-9239.
Salau, S.A., Adewumi, M.O. and Omotesho, O.A. (2012) Technical efficiency and its determinants at different levels of intensification among maize-based
Hossain et. al.
http://www.bdresearchpublications.com/journal/
392
farming households in southern guinea savanna of Nigeria, Ethiopian Journal of Environmental Studies and Management EJESM Vol. 5 No. 2 2012, Pg. 195-206, DOI: http://dx.doi.org/10.4314/ejesm.v5i2.11
Selim, S. (2009). Labour Productivity and Rice Production in Bangladesh: A Stochastic Frontier Approach, Cardiff Economics, Cardiff Business School, Cardiff University, Working Papers E2007/10.
Seyoum, E.T., Battese, G.E. and Fleming, E.M. (1998). Technical Efficiency and Productivity of Maize Producers in Eastern Ethiopia: A study of Farmers within and outside the Sasakawa-Global 2000 project, Agricultural Economics, 19(3): 341-348.
Sharif, N. R. and Dar, A.A. (1996). Stochastic Frontiers and Technical Efficiency Distributions: An Analysis Based on Rice Farming Data for Bangladesh. Canadian Journal of Economics, 29 (Special Issue): 582-586.