Illness Mapping: a time and cost effective method to estimate healthcare data needed to establish...
11
Illness Mapping: a time and cost effective method to estimate healthcare data needed to establish community-based health insurance Binnendijk et al. Binnendijk et al. BMC Medical Research Methodology 2012, 12:153 http://www.biomedcentral.com/1471-2288/12/153
-
Upload
microinsuranceacademy -
Category
Documents
-
view
4 -
download
0
Transcript of Illness Mapping: a time and cost effective method to estimate healthcare data needed to establish...

Illness Mapping: a time and cost effective methodto estimate healthcare data needed to establishcommunity-based health insuranceBinnendijk et al.
Binnendijk et al. BMC Medical Research Methodology 2012, 12:153http://www.biomedcentral.com/1471-2288/12/153

Binnendijk et al. BMC Medical Research Methodology 2012, 12:153http://www.biomedcentral.com/1471-2288/12/153
RESEARCH ARTICLE Open Access
Illness Mapping: a time and cost effective methodto estimate healthcare data needed to establishcommunity-based health insuranceErika Binnendijk1, Meenakshi Gautham1, Ruth Koren2 and David M Dror1,3*
Abstract
Background: Most healthcare spending in developing countries is private out-of-pocket. One explanation for lowpenetration of health insurance is that poorer individuals doubt their ability to enforce insurance contracts.Community-based health insurance schemes (CBHI) are a solution, but launching CBHI requires obtaining accuratelocal data on morbidity, healthcare utilization and other details to inform package design and pricing. Wedeveloped the “Illness Mapping” method (IM) for data collection (faster and cheaper than household surveys).
Methods: IM is a modification of two non-interactive consensus group methods (Delphi and Nominal GroupTechnique) to operate as interactive methods. We elicited estimates from “Experts” in the target community onmorbidity and healthcare utilization. Interaction between facilitator and experts became essential to bridge literacyconstraints and to reach consensus.The study was conducted in Gaya District, Bihar (India) during April-June 2010. The intervention included the IMand a household survey (HHS). IM included 18 women’s and 17 men’s groups. The HHS was conducted in 50villages with1,000 randomly selected households (6,656 individuals).
Results: We found good agreement between the two methods on overall prevalence of illness (IM: 25.9% ±3.6;HHS: 31.4%) and on prevalence of acute (IM: 76.9%; HHS: 69.2%) and chronic illnesses (IM: 20.1%; HHS: 16.6%). Wealso found good agreement on incidence of deliveries (IM: 3.9% ±0.4; HHS: 3.9%), and on hospital deliveries (IM:61.0%. ± 5.4; HHS: 51.4%). For hospitalizations, we obtained a lower estimate from the IM (1.1%) than from the HHS(2.6%). The IM required less time and less person-power than a household survey, which translate into reducedcosts.
Conclusions: We have shown that our Illness Mapping method can be carried out at lower financial and humancost for sourcing essential local data, at acceptably accurate levels. In view of the good fit of results obtained, weassume that the method could work elsewhere as well.
Keywords: India, Community based health insurance (CBHI), Micro health insurance, Illness prevalence, Incidence ofhospitalization, Illness Mapping
* Correspondence: [email protected] of Health Policy and Management, Erasmus University Rotterdam,P.O. Box 1738, Rotterdam 3000 DR, the Netherlands3Micro Insurance Academy, 52B Okhla Industrial Estate Phase III, New Delhi110020, IndiaFull list of author information is available at the end of the article
© 2012 Binnendijk et al.; licensee BioMed Central Ltd. This is an Open Access article distributed under the terms of theCreative Commons Attribution License (http://creativecommons.org/licenses/by/2.0), which permits unrestricted use,distribution, and reproduction in any medium, provided the original work is properly cited.

Binnendijk et al. BMC Medical Research Methodology 2012, 12:153 Page 2 of 10http://www.biomedcentral.com/1471-2288/12/153
BackgroundA large part of health care spending in developing coun-tries is private and out of pocket (OOP). India is typical:70% of spending is private, of which 86% is OOP [1,2].Moreover, private insurance rates remain below 5% [3].The dearth of insurance is surprising, given the high fre-quency and cost of borrowing from moneylenders evenfor outpatient care and maternity [4] in addition to in-patient care [4,5], and the inability of rural poor to payfor non-communicable diseases [6] even as the preva-lence of NCDs increases in low-income countries [7,8].One possible explanation for low insurance penetrationis that poorer individuals in the informal sector doubttheir ability to enforce contracts with insurance com-panies. A solution to the problem is community-basedhealth insurance schemes (CBHI) [9-12]. These schemesare owned and run locally, at village level [12,13]. One ofthe hurdles to launching CBHI schemes is obtaining rele-vant information on local morbidity, healthcare utilizationand other information that would inform the design andpricing of a relevant and affordable insurance package. Anumber of experiments with micro health insurancehave relied on household surveys to obtain reliable localactuarial estimates and other information required forpackage design and pricing [14-16]. Obtaining accuratelocal data is essential both because the income of CBHIis often limited and because of significant differencesacross locations in the number and type of illness epi-sodes [17-19]. However, household surveys are both ex-pensive and time consuming. Thus a faster and cheapermethod would be instrumental in promoting the expansionof micro health insurance.Our study is located in Gaya district, Bihar state, India.
The main source of data on incidence/prevalence ofillnesses and hospitalisations is the Indian NationalSample Survey (NSS) [20]. The NSS however providesinformation only at state level and not at district orblock level, which are the more relevant units forCBHI. In addition, the most recent edition of NSS withinformation on morbidity and healthcare utilizationdates to 2004 [20] with an earlier survey in 1995/96[21]. And, health information sourced from local med-ical record-keeping does not provide sufficiently accur-ate location-specific data.This paper contains a description of a cheaper and
faster method to derive quantitative estimates of health-care events through qualitative approaches [22]. The ex-periment we conducted is inspired by previousmethodologies aiming to achieve similar objectives. Forinstance, Auray and Fonteneau [23] suggested possiblegroup methods using consensus-building techniques,notably the Delphi and the Nominal Group Technique(NGT), to derive estimates from expert opinions onprevalence of hospitalizations, incidence of illness etc.
In the Delphi method, individual experts that are notin contact with each other first provide their quantitativeestimate to a query; then, each expert is informed aboutother experts’ replies, and invited to adjust the value(but each expert does so alone, without interacting withthe others); this process can be repeated several iterationsuntil consensus is reached [22,24]. In the NGT, expertsthat are assembled in the same place at the same timeindividually write down their views on the topic inquestion and present one idea to the facilitator which isrecorded. There is a group discussion to clarify andevaluate each idea and following this discussion eachparticipant privately ranks each idea. This ranking istabulated and presented. The group then discusses theoverall ranking to reach consensus [22,25,26]. It isnoted that while there is some interaction betweenNGT group members to discuss or clarify ideas, othermajor group processes, such as idea generation andfinal rankings, are conducted silently and individually[26]. So, while both the Delphi and NGT are methodsto reach consensus, both unfold among non-interactinggroups (participants do not interact and discuss with eachother during the group process) [26,27]. In interactinggroups on the other hand, participants are allowed tointeract and discuss with each other at each step of theprocess (generation of information, ideas, views, evaluationand final consensus) [27]. Interacting groups are usuallyunstructured (participants have complete freedom tothink, review and synthesize together); examples are Brain-storming discussions and Focus Group Discussions [28].Non-interacting groups however, are usually structured(participants receive systematic procedural guidance)[24,26].Research in the 1960s and 70s compared non-
interacting groups with interacting groups [26,27,29,30].Delphi and NGT have been found superior to interact-ing groups for finding solutions to problems [26], butwhen group interactions were structured to enhanceexchanges among the participants during thinking, visu-alizing and estimating, results were better than with un-structured interactions [31,32]. Moreover, Van de Venand Delbecq [27] found that the most optimal groupprocesses occurred when a structured procedure entailedinteractive discussions after the initial exposé of ideas/views. Bouchard [30] found that group-results wereenhanced when the groups consisted of carefully selectedindividuals who had some prior knowledge of each otherand some practice of working or being together (wheredifferences that might inhibit group effectiveness wereminimized).Our study entailed a variation of an interactive group
technique, inspired by the non-interactive group techni-ques. We elicited expert opinion in which our expertswere members of the target community that knew each

Binnendijk et al. BMC Medical Research Methodology 2012, 12:153 Page 3 of 10http://www.biomedcentral.com/1471-2288/12/153
other, whose opinions were obtained in a structured,interactive group situation. The purpose of the inquiryhas been to derive estimates of healthcare data neededto establish micro health insurance. We call this method“Illness Mapping”. With the view to verifying robustnessof results of the Illness Mapping method, we comparedthem to household survey data from the same locationsand period. Our working assumption was that if the Ill-ness Mapping delivered useful comparator data in thiscase, this method could be used elsewhere as an alter-native to household surveys for faster and cheaper re-sourcing of the context-relevant essential data.
MethodsSetting and samplingThe study was conducted in Gaya District of Bihar state,India. Gaya district is subdivided into 24 blocks. Weselected 7 contiguous blocks purposively because this iswhere a local partner Non-governmental Organization(NGO) intended to implement a micro health insurancescheme. The intervention included two exercises: the IllnessMapping and a household survey. Both activities wereconducted during April-June 2010.For the Illness Mapping, we divided the 7 blocks into
3 clusters (northern, middle and southern) and selected6 villages in each cluster based on distance from thenearest government primary health centre (0–5 kms;5.1-8 kms; and more than 8 kms). Our total sampleincluded 18 villages, (7 villages in the 0–5 kms category;6 villages in the 5.1-8 kms category; and 5 villages in the>8 kms category). In consultation with the field partner,we selected a male group and a female group in eachvillage, each with about 10 participants. The groupswere gender homogenous to enable participants tospeak freely on the given subject. There were 18women’s groups (263 participants) and 17 men’s groups(147 participants).The household survey was conducted in 50 villages
across Gaya district, selected randomly (using census listof villages) from all 24 blocks in the district, proportionalto the number of villages in each block. Within eachvillage, we interviewed 20 households, selected randomlyby applying the “four winds technique”, or “line sampling”(selecting households according to a predetermined stag-gering e.g. every second/third household starting from thecentre of the village and progressing in the four cardinaldirections) [33]. In total, 1,000 households were interviewed,representing 6,656 individuals.Verbal informed consent was obtained from respondents
of the household survey at the beginning of the interviews,and from participants of the Illness Mapping before thediscussions began. 100% of the interviewed sample wasrural.
Illness mappingThe Illness Mapping technique is an adaptation of twonon-interactive consensus group methods (Delphi processand Nominal Group Technique – NGT) operated in aninteractive manner. The adaptation was necessary becauseit was impossible to apply the Delphi and NGT as is (i.e.sending our experts a questionnaire and/or requestingeach to write ideas individually) due to the limited literacyof the population. Rather, interaction between the facilitatorand the group members became essential, especially asthe option of reaching decisions by vote was discarded,in light of the finding in one of our previous studies in Indiathat rural participants preferred to reach a consensus [34].Like the Delphi and NGT techniques, Illness Mapping
relies on the knowledge of experts. Prior to the selectionof the experts, our research team met with key informantsin the village [health/development workers such as theAccredited Social Health Activist (ASHA), AanganwadiWorker (AWW) or Auxiliary Nurse Midwife (ANM),representatives of Self Help Groups, etc.] to get an overviewof the village, its size, social segmentation, and a generalimpression of its socio-economic status. Using this know-ledge, we selected our experts by applying the followingcriteria:
1. They should be living in different parts of the village.2. They should be sociable, outgoing and interactingfrequently with their neighbours, so that they wouldbe knowledgeable about people and events in thevillage. Not surprisingly, participants with higherinterpersonal skills have been found to performbetter in group discussions [30].
3. Group members should reflect similar social orincome groups.
In the Illness Mapping facilitators (of the same genderas the participants) guided group meetings to enhancerecall of the parameters needed for the calculation of theprevalence of illnesses and utilization of health services.Such facilitated recall procedure does not occur either inthe Delphi or the NGT, but publications suggested thatcompared to unstructured interventions, participants recallthe relevant parameters better when procedures are struc-tured during the thinking, visualizing and estimating stageof the interaction with the facilitator [31,32]. Consideringthat people with motivation or training have been reportedto perform better in group interactions [30], we motivatedour participants by explaining that they were selected forthis discussion from the entire village, and that the infor-mation they provided would help develop the right kind ofhealth insurance benefits for them and the entire village.With each group, we first obtained a rough estimate of
the number of households in different parts of the village,the rough household size (i.e. number of family members

Binnendijk et al. BMC Medical Research Methodology 2012, 12:153 Page 4 of 10http://www.biomedcentral.com/1471-2288/12/153
that ate from the same pot), and the total population ofthe village. Then we asked the number of persons whohad been sick over the last one month, and the nature oftheir illness. We then asked every participant to name,one after the other, all the illnesses they could remember.To facilitate recall, the facilitator prompted periodically byasking about specific illnesses by name, both common andnot so common ones. We also enquired about incidence ofhospitalizations and deliveries (during the last 12 months)including information whether the delivery occurred athome or in an institute.Consensus was reached through a structured group
discussion of the final tallies, similar to the final roundof the NGT. We presented to each group the final talliesof the main illness categories and frequencies of illnesses,hospitalizations and deliveries, and asked for feedback onthe illness tallies (presented both as a number and as apercentage of the total village population). Usually partici-pants chose to increase the final cumulative percentage. Inthe few instances where the group was not able to arrive ata single estimate, we noted the different estimates (usually2–3 different estimates) and averaged them.Similar to the Delphi method, our facilitator combined
all responses and fed those back to the experts, whothen ranked all opinions/solutions to obtain a new“agreed value”, which was again combined and distributed.Like in the Delphi, the experts can re-evaluate theirranking and possibly change their original opinions/solutions [22].As in NGT, our Illness Mapping process occurs in a
meeting. And, like NGT interaction is limited in the firstpart of the process when each expert gives their responseto the facilitator (in NGT this is done in writing). A groupdiscussion follows, to clarify and evaluate responses, andreach consensus (in NGT, unlike our Illness Mapping,before discussion to reach consensus each expert ranksresponses separately, and the ranking is tabulated andpresented) [22,25].Data obtained in group discussions were recorded on
pre-designed data sheets; a second person, other than thefacilitator recorded the responses. Names and frequenciesof illnessesi were recorded; we classified the illnesses reportedas acute, chronic, accidents, and undefined. 18 groupsfrom 14 villages provided 8 or more names of illnesses;only these groups were retained for the analysis of illnesstypes. Hospitalizations and deliveries were counted andpresented separately.
Household surveyThe household survey questionnaire included questions ongeneral demographics (age, gender, education, economicactivity), socio-economic status (queried through questionson many items of household expenditures) and health sta-tus of household members. Following the method of the
Indian National Sample Survey Organization [35], weconsider the monthly per capita consumer expenditureexcluding healthcare costs as a proxy for income.Respondents were asked about illness episodes in thehousehold during the month preceding the survey. Usingthe replies regarding the illness (related to symptoms,length of illness, recurrence, medication etc.), we classifiedillnesses into four categories: acute, chronic, accidents andundefined. Respondents were asked about hospital admis-sions in the year preceding the survey and deliveries in thetwo years preceding the survey including where the deliverytook place (home or hospital). The household surveyquestionnaire was translated into Hindi (the local language),back translated for validation, and pre-tested among 80households in the area. Surveyors who spoke the locallanguage fluently conducted the survey.
Data presentation and statistical analysisWe used Stata (version 11) for a descriptive analysis ofthe household survey. We used MS Excel (version 2003)for the Illness Mapping data tabulation and analysis.The incidence of illness and health care utilization
derived from the household survey are represented inpercentages by dividing the number of cases by the over-all number of members of the sampled households. Theestimates derived from the Illness Mapping are presentedas the mean and standard error of the mean (SEM) of allthe group estimates arrived through consensus (male/female groups separately and all groups). We comparedinformation obtained from male vs. female groups toascertain that familiarity with local illnesses was com-parable, and significance of this difference was assessedby Student’s t-test. When comparing the results fromthe Illness Mapping with the results from the house-hold survey we considered as “good fit” results of theIllness Mapping that were less than two SEM of thehousehold survey data and as “very good fit” the resultsthat were less than one SEM.
FindingsSocioeconomic and demographic profile of the sampledpopulationThe information on socioeconomic and demographicstatus of the sampled population in Gaya (one of the dis-tricts of Bihar state) is summarized in Table 1. As can beseen, the population is resource-poor (income is aboutPPP$ 1.53 per person per day), poorly educated (44%with no schooling whatsoever), and the main source ofearning is daily wage labour (60%) and self-employedin agriculture (24%). As a comparison, monthly percapita consumer expenditure (not including medicalexpenditures) was INR 753 in rural Bihar according toNSS (=PPP$ 1.39 per person per day) [36].
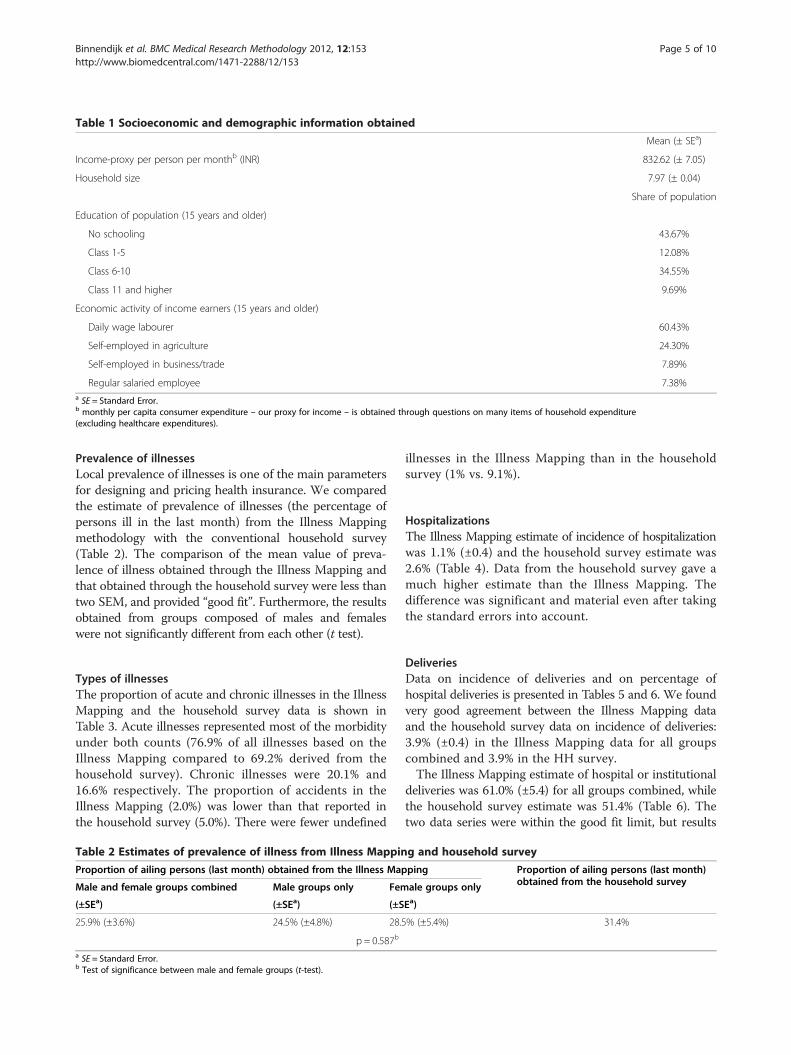
Table 1 Socioeconomic and demographic information obtained
Mean (± SEa)
Income-proxy per person per monthb (INR) 832.62 (± 7.05)
Household size 7.97 (± 0.04)
Share of population
Education of population (15 years and older)
No schooling 43.67%
Class 1-5 12.08%
Class 6-10 34.55%
Class 11 and higher 9.69%
Economic activity of income earners (15 years and older)
Daily wage labourer 60.43%
Self-employed in agriculture 24.30%
Self-employed in business/trade 7.89%
Regular salaried employee 7.38%a SE = Standard Error.b monthly per capita consumer expenditure – our proxy for income – is obtained through questions on many items of household expenditure(excluding healthcare expenditures).
Binnendijk et al. BMC Medical Research Methodology 2012, 12:153 Page 5 of 10http://www.biomedcentral.com/1471-2288/12/153
Prevalence of illnessesLocal prevalence of illnesses is one of the main parametersfor designing and pricing health insurance. We comparedthe estimate of prevalence of illnesses (the percentage ofpersons ill in the last month) from the Illness Mappingmethodology with the conventional household survey(Table 2). The comparison of the mean value of preva-lence of illness obtained through the Illness Mapping andthat obtained through the household survey were less thantwo SEM, and provided “good fit”. Furthermore, the resultsobtained from groups composed of males and femaleswere not significantly different from each other (t test).
Types of illnessesThe proportion of acute and chronic illnesses in the IllnessMapping and the household survey data is shown inTable 3. Acute illnesses represented most of the morbidityunder both counts (76.9% of all illnesses based on theIllness Mapping compared to 69.2% derived from thehousehold survey). Chronic illnesses were 20.1% and16.6% respectively. The proportion of accidents in theIllness Mapping (2.0%) was lower than that reported inthe household survey (5.0%). There were fewer undefined
Table 2 Estimates of prevalence of illness from Illness Mappin
Proportion of ailing persons (last month) obtained from the Illness Map
Male and female groups combined Male groups only Fem
(±SEa) (±SEa) (±S
25.9% (±3.6%) 24.5% (±4.8%) 28.5
p = 0.587b
a SE = Standard Error.b Test of significance between male and female groups (t-test).
illnesses in the Illness Mapping than in the householdsurvey (1% vs. 9.1%).
HospitalizationsThe Illness Mapping estimate of incidence of hospitalizationwas 1.1% (±0.4) and the household survey estimate was2.6% (Table 4). Data from the household survey gave amuch higher estimate than the Illness Mapping. Thedifference was significant and material even after takingthe standard errors into account.
DeliveriesData on incidence of deliveries and on percentage ofhospital deliveries is presented in Tables 5 and 6. We foundvery good agreement between the Illness Mapping dataand the household survey data on incidence of deliveries:3.9% (±0.4) in the Illness Mapping data for all groupscombined and 3.9% in the HH survey.The Illness Mapping estimate of hospital or institutional
deliveries was 61.0% (±5.4) for all groups combined, whilethe household survey estimate was 51.4% (Table 6). Thetwo data series were within the good fit limit, but results
g and household survey
ping Proportion of ailing persons (last month)obtained from the household surveyale groups only
Ea)
% (±5.4%) 31.4%

Table 3 Estimates of types of illness from Illness Mapping and household survey
Illness types as share of illnesses:
Acute Chronic Accidents Undefined
Data obtained from the Illness Mapping 76.9% 20.1% 2.0% 1.0%
Data obtained from the household survey 69.2% 16.6% 5.0% 9.1%
Note: The above percentages for illness types were calculated for all groups together. Standard errors for these values are therefore not available.
Binnendijk et al. BMC Medical Research Methodology 2012, 12:153 Page 6 of 10http://www.biomedcentral.com/1471-2288/12/153
reported by the female groups were in closer agreement(very good fit).
Cost and time comparison between household surveyand Illness MappingTable 7 gives a record of the time and human resourcesrequired for the household survey of 1,000 householdscompared to the Illness Mapping for 35 groups. Thecomparison is limited to the core activities related to thetwo methods, since the exact related costs could pre-sumably be context dependent (salaries, traveling condi-tions, accommodations, will be different in differentlocations). The table shows that Illness Mapping repre-sented a reduction of 59% in work-days, i.e. requires lesstime and less costs than conducting a household survey.
DiscussionIn this study we set out to develop a reliable methodthat may in future enable us to access the necessary datafor the establishment of a micro health insurance in lowincome rural communities where data would not beavailable otherwise. The objective before us was to find away to overcome the two constraints associated withdata sourcing through household survey, namely, thecost and time required. The Illness Mapping method wedescribe here seems to meet this objective. The informa-tion given in Table 7 illustrates the advantage of the IllnessMapping method in terms of human resources and timerequired, which obviously translate into differences incosts (e.g. salaries, travel, accommodation etc.).The design of an insurance product requires estimates
of the prevalence/incidence of the events covered by theinsurance. Our previous studies showed that: (i) the inci-dence of illness episodes, and prevalence of hospitaliza-tions and delivery is strongly context-dependent andvaries across locations even in the same country [19]making it necessary to obtain local data. (ii) Prospective
Table 4 Estimates of incidence of hospitalization from Illness
Percentage of hospitalized persons (last year) obtained from the Illness
Male and female groups combined Male groups only Female
(±SEa) (±SEa) (±SEa)
1.1% (±0.4%) 1.6% (±0.8%) 0.5% (±
p = 0.213b
a SE = Standard Error.b Test of significance between male and female groups (t-test).
clients of health insurance in rural India are exposed tohardship financing not only in cases of hospitalizationsbut also in cases of outpatient treatment and in deliveries[4]. In fact, this is even more pronounced in case ofchronic illnesses [6]. (iii) When expressing their prioritiesregarding benefits that should be covered by insurance,prospective clients expressed a clear wish to include bothinpatient and outpatient benefits [34,37]. It is thus clearthat the information obtained through Illness Mappingregarding the prevalence/incidence of prioritized costgenerating events is essential for the design and pricingof context-relevant health insurance.We followed a strategy of soliciting local information
from groups rather than from individuals. We wereinspired by group techniques, assuming that the smallcosmos of a village community could be captured throughharvesting the knowledge that is readily available to itsinhabitants free of charge. Having failed to find a ready-made suitable method in the published literature, weopted to utilize a combination of established methods andadapt them to our settings. Group approaches such as theDelphi and NGT have been used successfully and withhigh accuracy for business forecasting as well as for publicpolicy [38,39]. We adopted the criteria for resourcingquantitative information from qualitative non-interactinggroups such as Delphi and NGT [22,26], and modifiedthose to take account of the advantages of interactivegroup situations in which the discussions are moderatedand facilitated rather than left to chance (as often happensin exploratory brainstorming groups or focus groups [28]).Such structured group methods are based on the principleof collective intelligence [40], or group intelligence thatemerges through managed consensus decision making [31].Our method was based on small group discussions
with people who were marginally literate and numerate,but nonetheless experts or valid representatives of theirvillage communities. They were chosen (with the help of
Mapping and household survey
Mapping Percentage of hospitalized persons (last year)obtained from the household surveygroups only
0.1%) 2.6%

Table 5 Estimates of incidence of deliveries from Illness Mapping and household survey
Number of deliveries per 100 persons (last year) obtained from the Illness Mapping Number of deliveries per 100 persons (last year)obtained from the household surveybMale and female groups combined Male groups only Female groups only
(±SEa) (±SEa) (±SEa)
3.9% (±0.4%) 4.4% (±0.7%) 3.4% (±0.6%) 3.9%
p = 0.293c
a SE = Standard Error.b Based on the reported number of children less than or equal to 1 year in the household.c test of significance between male and female groups (t-test).
Binnendijk et al. BMC Medical Research Methodology 2012, 12:153 Page 7 of 10http://www.biomedcentral.com/1471-2288/12/153
our partner NGO staff who had prior access to the village)for their social attributes and their knowledge of house-holds in their own neighbourhood in the village. In eachvillage we carefully identified such participants and facili-tated their interaction to obtain estimates for the preva-lence of illness for the entire village. Other key contacts inthe village such as teachers, village head, and health workerscould also be recruited to provide similar information ifthere were no prior links with the village.We organized gender homogenous groups in each village
to ensure that both men and women would be able toexpress themselves freely. We thought that women,who are usually caregivers, might be more familiar withillnesses than men. However we found no statistical dif-ference between the estimates given by men’s andwomen’s groups. We found it more difficult to assemblemen’s groups as men were usually away during the day.From this experience we infer that Illness Mappingcould be extracted from interactions with either genderof respondents, and that women’s groups are likely tobe easier to assemble than men.Our method had to be adjusted to the field reality of
low literacy which meant that written consensus andvoting was not the best option and so we employed astrategy which involved everyone in a sequential andstructured interaction. Our structure emerged from themotivation, explanations, and facilitation techniques thatwe used to encourage accurate recall and steer discus-sions towards final consensus.We examined the potential of our new Illness Mapping
method by comparing the results obtained with thosederived through a household survey. We compared threeparameters which are important for implementation ofmicro health insurance: (i) prevalence of illness for acute
Table 6 Estimates of percentage of hospital deliveries from Il
Percentage of hospital deliveries obtained from the Illness Mapping
Male and female groups combined Male groups only Fem
(±SEa) (±SEa) (±S
61.0% (±5.4%) 67.3% (±7.8%) 55.4
P=0.275b
a SE = Standard Error.b Test of significance between male and female groups (t-test).
and chronic illnesses, both of which entail cost implicationswhich can be much higher in the case of chronic illnesses[18], (ii) incidence of hospitalization, as this cost is includedin most health insurance programmes, and (iii) incidenceof deliveries, especially hospital deliveries. We found verygood agreement between the two methods on incidence ofdeliveries, and good agreement on prevalence of illnesses(in the last one month) and on prevalence of acute andchronic illnesses, as well as on the share of deliveries inhospital.We obtained a lower estimate of incidence of hospitalization
from the Illness Mapping than from the household sur-vey (1.1% (±0.4) from the first source versus 2.6% fromthe second source). This discrepancy could be the resultof two types of memory effects that can lead to erroneousreporting by respondents: errors of omission and of tele-scoping [41]. While omission means forgetting or omittingto report an episode entirely, telescoping works in theopposite direction, i.e. the respondent remembers andreports an event as having occurred more recently thanit actually had. The telescoping effect increases the totalnumber of events reported in a given period. It has alsobeen found that telescoping may be greater in face toface interviews as the presence of an interviewer andthe face to face interaction may prod the respondent togive “too much rather than too little information” [41].It is possible that the telescoping effect may have resultedin an overestimation of hospitalizations in our householdsurvey. In contrast, hospitalizations may have been under-estimated in the Illness Mapping method as the groupmembers may have only been aware of the longer durationhospitalizations in their communities and those due tomajor procedures such as surgeries. They may haveomitted the shorter and less severe hospitalizations. This
lness Mapping and household survey
Percentage of hospital deliveries obtainedfrom the household surveyale groups only
Ea)
% (±7.3%) 51.4%
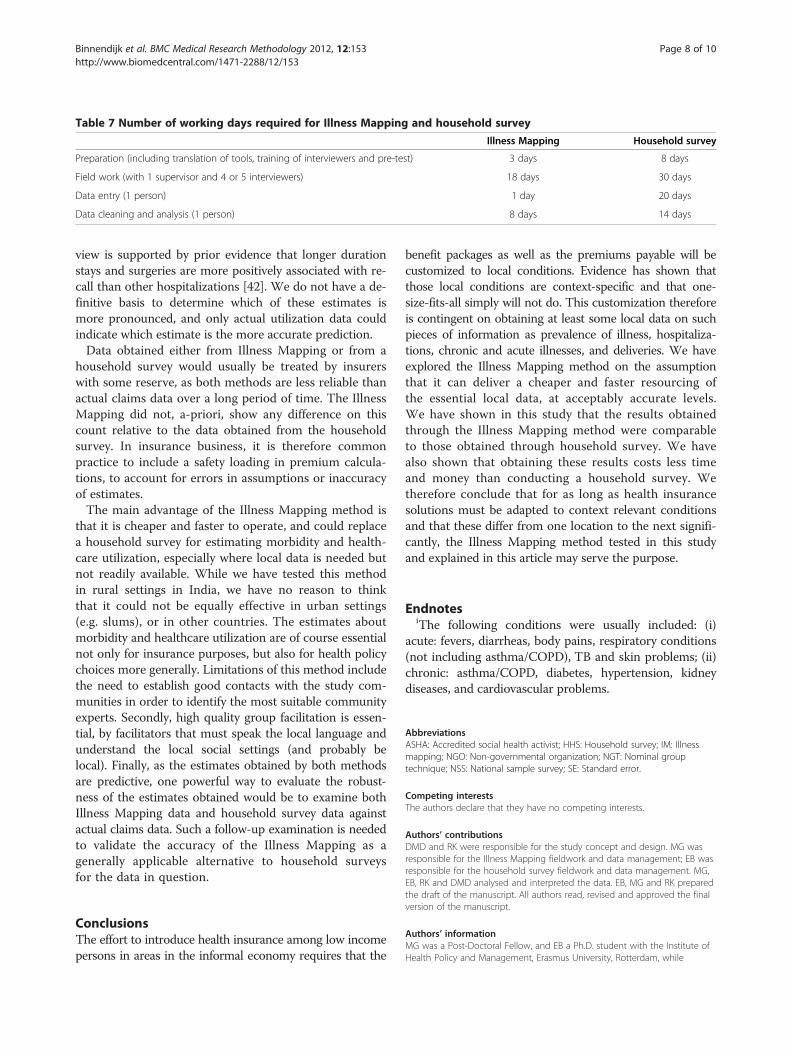
Table 7 Number of working days required for Illness Mapping and household survey
Illness Mapping Household survey
Preparation (including translation of tools, training of interviewers and pre-test) 3 days 8 days
Field work (with 1 supervisor and 4 or 5 interviewers) 18 days 30 days
Data entry (1 person) 1 day 20 days
Data cleaning and analysis (1 person) 8 days 14 days
Binnendijk et al. BMC Medical Research Methodology 2012, 12:153 Page 8 of 10http://www.biomedcentral.com/1471-2288/12/153
view is supported by prior evidence that longer durationstays and surgeries are more positively associated with re-call than other hospitalizations [42]. We do not have a de-finitive basis to determine which of these estimates ismore pronounced, and only actual utilization data couldindicate which estimate is the more accurate prediction.Data obtained either from Illness Mapping or from a
household survey would usually be treated by insurerswith some reserve, as both methods are less reliable thanactual claims data over a long period of time. The IllnessMapping did not, a-priori, show any difference on thiscount relative to the data obtained from the householdsurvey. In insurance business, it is therefore commonpractice to include a safety loading in premium calcula-tions, to account for errors in assumptions or inaccuracyof estimates.The main advantage of the Illness Mapping method is
that it is cheaper and faster to operate, and could replacea household survey for estimating morbidity and health-care utilization, especially where local data is needed butnot readily available. While we have tested this methodin rural settings in India, we have no reason to thinkthat it could not be equally effective in urban settings(e.g. slums), or in other countries. The estimates aboutmorbidity and healthcare utilization are of course essentialnot only for insurance purposes, but also for health policychoices more generally. Limitations of this method includethe need to establish good contacts with the study com-munities in order to identify the most suitable communityexperts. Secondly, high quality group facilitation is essen-tial, by facilitators that must speak the local language andunderstand the local social settings (and probably belocal). Finally, as the estimates obtained by both methodsare predictive, one powerful way to evaluate the robust-ness of the estimates obtained would be to examine bothIllness Mapping data and household survey data againstactual claims data. Such a follow-up examination is neededto validate the accuracy of the Illness Mapping as agenerally applicable alternative to household surveysfor the data in question.
ConclusionsThe effort to introduce health insurance among low incomepersons in areas in the informal economy requires that the
benefit packages as well as the premiums payable will becustomized to local conditions. Evidence has shown thatthose local conditions are context-specific and that one-size-fits-all simply will not do. This customization thereforeis contingent on obtaining at least some local data on suchpieces of information as prevalence of illness, hospitaliza-tions, chronic and acute illnesses, and deliveries. We haveexplored the Illness Mapping method on the assumptionthat it can deliver a cheaper and faster resourcing ofthe essential local data, at acceptably accurate levels.We have shown in this study that the results obtainedthrough the Illness Mapping method were comparableto those obtained through household survey. We havealso shown that obtaining these results costs less timeand money than conducting a household survey. Wetherefore conclude that for as long as health insurancesolutions must be adapted to context relevant conditionsand that these differ from one location to the next signifi-cantly, the Illness Mapping method tested in this studyand explained in this article may serve the purpose.
EndnotesiThe following conditions were usually included: (i)
acute: fevers, diarrheas, body pains, respiratory conditions(not including asthma/COPD), TB and skin problems; (ii)chronic: asthma/COPD, diabetes, hypertension, kidneydiseases, and cardiovascular problems.
AbbreviationsASHA: Accredited social health activist; HHS: Household survey; IM: Illnessmapping; NGO: Non-governmental organization; NGT: Nominal grouptechnique; NSS: National sample survey; SE: Standard error.
Competing interestsThe authors declare that they have no competing interests.
Authors’ contributionsDMD and RK were responsible for the study concept and design. MG wasresponsible for the Illness Mapping fieldwork and data management; EB wasresponsible for the household survey fieldwork and data management. MG,EB, RK and DMD analysed and interpreted the data. EB, MG and RK preparedthe draft of the manuscript. All authors read, revised and approved the finalversion of the manuscript.
Authors’ informationMG was a Post-Doctoral Fellow, and EB a Ph.D. student with the Institute ofHealth Policy and Management, Erasmus University, Rotterdam, while

Binnendijk et al. BMC Medical Research Methodology 2012, 12:153 Page 9 of 10http://www.biomedcentral.com/1471-2288/12/153
developing this article. This work represents part of the requirements for thePhD thesis of EB at Erasmus University.DMD, in addition to acting as principal investigator on this grant within hisposition as hon. Professor at Erasmus University Rotterdam, also acted assupervisor of MG in the Post-Doctoral fellowship and EB in the PhD studies.He is also the Chairman of the Micro Insurance Academy.
AcknowledgementsThe authors gratefully acknowledge funding support from the NetherlandsOrganization for Scientific Research (NWO), under WOTRO IntegratedProgramme grant No. W01.65.309.00. The sponsors had no influence or rolein study design, in the collection, analysis and interpretation of data; in thewriting of the article; and in the decision to submit the article forpublication.The authors gratefully acknowledge logistical and research support from theMicro Insurance Academy New Delhi, and logistical support from the BASIXUnits at Gaya and Patna. Last but not least, we acknowledge all therespondents for their participation in the study.
Author details1Institute of Health Policy and Management, Erasmus University Rotterdam,P.O. Box 1738, Rotterdam 3000 DR, the Netherlands. 2Felsenstein MedicalResearch Centre, Tel Aviv University Sackler Faculty of Medicine, Ramat Aviv,Tel Aviv, Israel. 3Micro Insurance Academy, 52B Okhla Industrial Estate PhaseIII, New Delhi 110020, India.
Received: 3 April 2012 Accepted: 19 September 2012Published: 9 October 2012
References1. World Development Indicators:: ; Retrieved 09/13, 2012 from
[http://data.worldbank.org/data-catalog/world-development-indicators].2. Karan AK, Selvaraj S: Why publicly-financed health insurance schemes are
ineffective in providing financial risk protection. Econ Polit Wkly 2012,47(11):61.
3. Ma S, Sood N: A comparison of the health systems in China and India. SantaMonica, USA: Rand Corporation, Center for Asia Pacific Policy; 2008.
4. Binnendijk E, Koren R, Dror DM: Hardship financing of healthcare amongrural poor in Orissa. India. BMC health services research 2012, 12(1):23.
5. Peters DH, Yazbeck AS, Sharma RP, Ramana GNV, Pritchett LH, Wagstaff A:Better health systems for India’s poor: Findings, analysis and options.Washington (DC): World Bank; 2002.
6. Binnendijk E, Koren R, Dror DM: Can the rural poor in India afford to treatnon-communicable diseases. Tropical Medicine & International Health 2012,doi: 10.1111/j.1365-3156.2012.03070.x. [Epub ahead of print]
7. Lopez AD, Mathers CD, Ezzati M, Jamison DT, Murray CJ: Global andregional burden of disease and risk factors, 2001: Systematic analysis ofpopulation health data. Lancet 2006, 367(9524):1747–1757.
8. World Health Organization: Global status report on noncommunicablediseases 2011. Geneva, Switzerland: World Health Organization; 2010.
9. Ahuja R: Health insurance for the poor in India. New Delhi, India: Workingpaper No. 123, Indian Council for research on International EconomicRelation (ICRIER); 2004.
10. Ahuja R: Health insurance for the poor in India: An analytical study. NewDelhi, India: Working Paper No. 161, Indian Council for Research onInternational Economic Relations (ICRIER); 2005.
11. Bhat R, Jain N: Factoring affecting the demand for health insurance in a microinsurance scheme. Ahmedabad: IIMA Working Papers WP2006-07-02, IndianInstitute of Management; 2006.
12. National Commission on Macroeconomics and Health: Financing anddelivery of health care services in India. New Delhi: National Commission onMacroeconomics and Health Background Papers, Ministry of Health andFamily Welfare, Government of India; 2005.
13. Dror DM, Radermacher R, Khadilkar SB, Schout P, Hay FX, Singh A, Koren R:Microinsurance: Innovations in low-cost health insurance. Health Aff(Millwood) 2009, 28(6):1788–1798.
14. Doyle C, Panda P, Van de Poel E, Radermacher R, Dror DM: Reconcilingresearch and implementation in micro health insurance experiments inIndia: Study protocol for a randomized controlled trial. Trials 2011,12(1):224.
15. Dong H, Mugisha F, Gbangou A, Kouyate B, Sauerborn R: The feasibility ofcommunity-based health insurance in Burkina Faso. Health Policy 2004,69(1):45–53.
16. AC Nielsen ORG-MARG Pvt Ltd: Needs and demands for healthcare andhealth insurance amng landless agriculture laborers in Burdwan district, WestBengal. Kolkota, India: Final Report submitted to GTZ Technical AssistanceTeam, Health Sector Support, Kolkata, AC Nielsen ORG-MARG Pvt Ltd; 2001.
17. Dror DM: Why “one-size-fits-all” health insurance products are unsuitablefor low-income persons in the informal economy in India. Asian EconomicReview 2007, 49(1):47–56.
18. Dror DM, van Putten-Rademaker O, Koren R: Cost of illness: Evidence froma study in five resource-poor locations in India. Indian J Med Res 2008,127(4):347–361.
19. Dror DM, van Putten-Rademaker O, Koren R: Incidence of illness amongresource-poor households: Evidence from five locations in India. Indian JMed Res 2009, 130(2):146–154.
20. National Sample Survey Organization: Morbidity, health care and thecondition of the aged. 2006, Report No. 507 (60th round January-June:National Sample Survey Organization, Ministry of Statistics and ProgrammeImplementation. New Delhi: Government of India; 2004.
21. National Sample Survey Organization: Morbidity and treatment of ailments.1998, Report No. 441 (52th round July 1995-June: National Sample SurveyOrganization, Ministry of Statistics and Programme Implementation. NewDelhi: Government of India; 1996.
22. Jones J, Hunter D: Consensus methods for medical and health servicesresearch. BMJ 1995, 311(7001):376–380.
23. Aurey JP, Fonteneau R: Local consensus and estimates of medical risk. InSocial Reinsurance, A new approach to sustainable community healthfinancing. Edited by Dror DM, Preker AS. Geneva: The World Bank and theInternational Labour Organisation; 2002:187–222.
24. Woudenberg F: An evaluation of Delphi. Technol Forecast Soc Chang 1991,40(2):131–150.
25. Sample JA, Nominal Group Technique: An alternative to brainstorming. JExt 1984, 22(2): accessed at: http://www.joe.org/joe/1984March/iw2.php.
26. Van de Ven AH, Delbecq AL: The effectiveness of nominal, Delphi, andinteracting group decision making processes. Acad Manag J 1974,17(4):605–621.
27. Van de Ven AH, Delbecq AL: Nominal versus interacting group processesfor committee decision-making effectiveness. Acad Manag J 1971,14(2):203–212.
28. Kitzinger J: Qualitative research: Introducing focus groups. BMJ 1995,311(7000):299–302.
29. Bouchard TJ: Personality, problem-solving procedure, and performance insmall groups. J Appl Psychol 1969, 53(1 (supplement 1):1–29.
30. Bouchard TJ: Training, motivation, and personality as determinants of theeffectiveness of brainstorming groups and individuals. J Appl Psychol1972, 56(4):324–331.
31. Hart S, Boroush M, Enk G, Hornick W: Managing complexity throughconsensus mapping: Technology for the structuring of group decisions.Acad Manag Rev 1985, 10(3):587–600.
32. Lowry PB: Research on process structure for distributed, asynchronouscollaborative writing groups. Dallas: Proceedings of the 8th Annual AmericasConference on Information Systems; 2002:2172–2179.
33. Som RK: Practical sampling techniques. 2nd edition. New York: MarcelDekker; 1996.
34. Danis M, Binnendijk E, Vellakkal S, Ost A, Koren R, Dror DM: Eliciting healthinsurance benefit choices of low income groups. Econ Polit Wkly 2007,42(32):3331–3339.
35. National Sample Survey Organization: Household Consumer Expenditure inIndia, 2006–07. New Delhi: Report No. 527, National Sample SurveyOrganization, Ministry of Statistics and Programme Implementation,Government of India; 2008.
36. National Sample Survey Organization: Level and pattern of consumerexpenditure, 2009–2010. New Delhi: Report No. 538, National Sample SurveyOrganization, Ministry of Statistics and Programme Implementation,Government of India; 2011.
37. Dror DM, Koren R, Ost A, Binnendijk E, Vellakkal S, Danis M: Healthinsurance benefit packages prioritized by low-income clients in India:three criteria to estimate effectiveness of choice. Soc Sci Med 2007,64(4):884–896.

Binnendijk et al. BMC Medical Research Methodology 2012, 12:153 Page 10 of 10http://www.biomedcentral.com/1471-2288/12/153
38. Basu S, Schroeder RG: Incorporating judgments in sales forecasts:Application of the Delphi method at American Hoist & Derrick. Interfaces1977, 7(3):18–27.
39. Hilbert M, Miles I, Othmer J: Foresight tools for participative policy-making in inter-governmental processes in developing countries:Lessons learned from the eLAC Policy Priorities Delphi. Technol ForecastSoc Chang 2009, 76(7):880–896.
40. Surowiecki J: The wisdom of crowds. USA: Double Day (Random House Inc);2004.
41. Sudman S, Bradburn NM: Effects of time and memory factors on responsein surveys. J Am Stat Assoc 1973, 68(344):805–815.
42. Harlow SD, Linet MS: Agreement between questionnaire data andmedical records: The evidence for accuracy of recall. Am J Epidemiol 1989,129(2):233–248.
doi:10.1186/1471-2288-12-153Cite this article as: Binnendijk et al.: Illness Mapping: a time and costeffective method to estimate healthcare data needed to establishcommunity-based health insurance. BMC Medical Research Methodology2012 12:153.
Submit your next manuscript to BioMed Centraland take full advantage of:
• Convenient online submission
• Thorough peer review
• No space constraints or color figure charges
• Immediate publication on acceptance
• Inclusion in PubMed, CAS, Scopus and Google Scholar
• Research which is freely available for redistribution
Submit your manuscript at www.biomedcentral.com/submit