BLISS: An Agent for Collecting Spoken Dialogue Data about ...

International Journal of Communication 8(2014), 2561–2577 1932–8036/20140005
Copyright © 2014 (Alberto Posso & Meg Elkins). Licensed under the Creative Commons Attribution Non-
commercial No Derivatives (by-nc-nd). Available at http://ijoc.org.
Ignorance Is Bliss!
Internet Usage and Perceptions of Corruption
in a Panel of Developing Countries
ALBERTO POSSO
MEG ELKINS1
RMIT University, Australia
In a world of open-ended access to social media, the ability of governments to control
information is slipping away. It is plausible in countries with limited Internet access for
citizens to remain ignorant of the true amount of corruption. We built a cross-country
panel of 124 developing nations to analyze the effect of Internet usage on perceptions of
corruption from 1996 to 2009. We find that, ceteris paribus, the information citizens
receive from the World Wide Web leads to deteriorating views of the state of corruption
in their country. Greater perceptions of government effectiveness are unsurprisingly
found to negatively and significantly decrease perceptions of corruption within countries.
Keywords: corruption perceptions, Internet usage, panel data, developing countries
Introduction
Press freedom and open access to Internet are powerful tools that can be used to reduce
corruption. Brunetti and Weder (2003) argue that in the presence of a free media, journalists have
incentives to uncover any wrongdoing by government. In turn, by creating awareness of these wrongful
acts, a free press, perhaps inadvertently, increases the risk associated with engaging in corrupt activities
(Chowdhury, 2004; Freille et al., 2007.2 The rise of the Internet and social media is an effective,
important and growing mechanism by which these wrongdoings can be widely publicized. Persistently,
corruption is linked to countries with a low GDP per capita and lower levels of freedom (Svensson,
2005;Treisman, 2007). This study focuses solely on how developing countries’ perceptions of corruption
are being altered by the rise in access to the Internet.
Alberto Posso: [email protected]
Meg Elkins: [email protected]
Date submitted: 2013–10–03
1 The authors wish to thank Tim R. L. Fry, Simon Feeny, Lisa Farrell, Abelardo Posso Serrano, Aaron
Soans, Martin Byford, and two anonymous referees for valuable comments on earlier drafts. All remaining
errors are ours. 2 Vaidya (2005) refutes the link between press freedom and corruption by establishing a theoretical
possibility of collusive behavior between media sources and the government, potentially creating perverse
incentives to act together to weaken attempts to control corruption.
2562 Alberto Posso & Meg Elkins International Journal of Communication 8(2014)
As the media landscape changes across the world, anyone with access to YouTube, Facebook,
Twitter, Google+, blogs, and live-video streaming can become an investigative journalist or whistle-
blower. In corrupt societies, the rise of free social media is likely to lead to increased awareness of
government officials’ wrongful acts (Treisman, 2007). In fact, using Google and Yahoo searches of
“corruption,” Goel, Michael, Naretta, and Michael (2012) find that increased online awareness of
corruption is associated with overall decreased corruption across countries. Using a cross-section of
countries in 2009 and 2011, their study suggests that countries that are better at monitoring corruption
through the Internet tend to be less corrupt. Goel et al. (2012) argue that the Internet has made
government controls of the media less effective, allowing for an increase in the supply of information
about corruption. Their premise is that a more informed population will be better able to counter corrupt
acts and be more aware of their rights.
The hypothesis posed in this study is slightly different. We agree that the Internet has made
government controls of the media less effective, allowing for an increase in the supply of information
about corruption. However, this increased supply of information has resulted in increased perceptions of
corruption. That is, Goel et al. (2012) look at how more online awareness of corruption is associated with
lower levels of corruption across countries. On the other hand, we argue that the Internet is an important
medium by which awareness of corruption increases through time within countries. This, in turn, can have
destabilizing effects as people in corrupt societies begin to push for improved political conditions. Most
recently, the experiences in Egypt, Tunisia, Libya, and Yemen illustrated this point. In these countries,
cyber-connectedness was crucial for shedding light on corruption scandals and government misbehavior,
culminating in widespread social revolt (Anderson, 2011; Eltantawy & Weist, 2011). So, the catalyst for
any ensuing social change resulting in a decrease in actual corruption will be increased perceptions of
corruption over time within countries.
Examining a panel of developing countries from 1996 to 2009, this study shows that perceptions
of corruption increased alongside a rise in access to the Internet. Moreover, unlike previous studies, the
use of panel data techniques allowed us to control for potential endogeneity, which can lead to biased and
inconsistent results. Therefore, we conclude that a rise in Internet access causes increased perceptions of
corruption. It is this mechanism that has allowed for social disharmony and injustice to gain a voice that is
no longer constrained by the government or monopolized by media outlets.
Our focus is on the developing world, where corruption scandals are more frequent than
elsewhere (Svensson, 2004). Moreover, corruption in these countries is particularly important because it
has long been regarded as a hindrance to economic growth and investment and ultimately to development
(Bardhan, 1997; Mauro, 1995). For instance, Mo (2001) finds that a 1% increase in corruption reduces
GDP growth by approximately 0.7%. This is mainly because corruption increases political instability.
Similarly, Pellegrini and Gerlagh (2004) find that corruption decreases economic growth by adversely
affecting investments, trade, human capital, and political stability. Furthermore, and perhaps of more
importance to the developing world, the World Bank (2001) argues that the burden of corruption falls
disproportionately on the poor. The report argues that corruption biases government spending away from
socially valuable goods such as education and health. Additionally, it diverts public resources from
infrastructure investments that could benefit the poor. A cross-country econometric evaluation by Gupta,
International Journal of Communication 8(2014) Ignorance is Bliss! 2563
Davoodi, and Alonso-Terme (2002) finds that corruption increases both poverty and inequality. Likewise,
O’Higgins (2006) argues that corruption increases poverty and inequality while distorting markets,
resource allocations, and incentives. She notes that this results in a loss of productive infrastructure
investment as funds are diverted to support corrupt activities.
A comprehensive review of literature on corruption in developing countries by Olken and Pande
(2011) highlights a number of reasons why corruption can propagate underdevelopment. For example,
they find evidence to suggest that corruption in the form of bribes paid to bureaucrats increases the cost
of doing business. Moreover, these added costs can serve as a deterrent to firms and investors, as some
countries or sectors become marginally more expensive and less attractive. Additionally, corruption raises
the marginal costs of public funds, making some government projects economically unviable. This
efficiency loss arises when projects that would be cost effective at the true costs are no longer cost
effective once the costs of corruption are included. Finally, corruption also lowers the ability of
governments to correct externalities. Olken and Pande (2011) argue that, for example, if someone can
bribe a member of the judiciary instead of paying an official fine, the marginal cost of breaking the law is
reduced from the official fine to the amount of the bribe. Furthermore, if a police officer extracts a bribe
regardless of whether the person has broken the law, the marginal cost of breaking the law falls to zero,
and the law ceases to be a disincentive altogether. Not surprisingly, these costs generate larger burdens
on those with less money and fewer connections (World Bank, 2001).
This article is structured as follows: The next section presents the data. The third section
presents the econometric methodology. The fourth section discusses our results, and the fifth section
presents our conclusions.
Data
We built a cross-country panel of 124 developing nations from 1996 to 2009 to analyze the
effects of Internet usage on perceptions of corruption.3 There are two widely used composite international
measures of corruption available for econometric analysis: Transparency International’s (TI) “Corruption
Perceptions Index” and Kaufmann, Kraay and Mastruzzi (2009) “Control of Corruption” (cc). We focus on
the latter measure in this study for four reasons. First, cc includes household-survey-based data sources,
and TI does not.4 It is important to include household-level information when examining whether a rise in
Internet usage can affect the general public’s perception of a country’s corruption. This is particularly
important because cc taps the perceptions of populations directly, whereas TI does not because
respondents to those surveys are drawn from groups whose membership is not necessarily representative
of the population.5 Second, cc provides measures on over 200 countries, whereas TI only covers 177
3 Developing nations are defined following the classification used by the World Bank. Countries are
determined to be “developing” if GNI per capita was less than $12,746 in 2013. 4 The indicator is an index combining up to 22 different assessments and surveys, depending on
availability, each of which receives a different weight depending on its estimated precision and country
coverage. 5 The Kaufmann et al. (2009) index includes data from household surveys such as the Afro-barometer
Survey, the Latino-barometro, and the Vanderbilt University Americas Barometer. Note, however, that
2564 Alberto Posso & Meg Elkins International Journal of Communication 8(2014)
nations. As a result, cc gave us a more complete picture of the perceptions of corruption across
developing countries. Third, cc weights available sources according to the precision of the individual data
sources; in contrast, TI weights all available sources equally. Finally, Kaufmann et al.’s (2009)
methodology provides margins of error for their estimates.
We echo Treisman (2007) and note that time-series analysis using cc may be problematic
because the authors have altered the set of sources used in successive years, so changes in the index
could reflect changes in sources, not in perceptions. Importantly, TI also suffers from this problem. Having
said that, Kaufmann et al. (2006) convincingly argue that while changes in corruption over short periods
of time are difficult to measure, changes in the cc index over longer periods follow significant trends in
governance in a number of countries. Moreover, TI suffers from two additional problems that affect its
reliability. First, TI has changed the methodology employed for constructing its measure over the years;
therefore, changes in the index may have nothing to do with changes in corruption perceptions. Second,
TI has sometimes reused the same survey responses in successive years, automatically reducing year-to-
year variation.
Control of corruption is defined as the extent to which public power is perceived to be exercised
for private gain, including both petty and grand forms of corruption and capture of the state by elites and
private interests. For ease of interpretation, we rank the data in percentiles ranging from 0 to 100, where
a higher rank indicates that the country is perceived to be less corrupt. Our key independent variable is
Internet users (people with access to the worldwide network), measured per 100 people. These data are
readily available from the World Bank’s World Development Indicators.
To explain movements in a country’s perception of corruption, we also used the following
variables in our econometric specification: (a) real GDP per capita measured in U.S. dollars from the year
2000, because of the causal relationship between economic development and corruption (Mauro, 1995);
(b) CPI inflation, to test the effect of macroeconomic instability on perceptions of corruption; (c) trade,
defined as exports plus imports on GDP, to test whether developing economies with greater access to the
outside world can have a relatively higher perception of the amount of corruption in a given country; (d)
population density, because it is possible that societies where people live in close proximity have stronger
community networks with greater levels of interaction and are therefore more likely to be critical of
government activity; (e) primary school enrollment (percent of gross), because a country’s level of
education can similarly create a more critical population; and (f) telephone lines per 100 people, to
examine whether general levels of communication among individuals can generate changes in perceptions
of corruption. These variables were sourced from the World Bank’s World Development Indicators.
We also employed the following variables to test whether perceptions of corruption within a
country can be affected by alternate governance indicators: (g) government effectiveness, which
measures perceptions of the quality of public services, the bureaucracy, and the credibility of the
other surveys included, such as the Political Economic Risk Consultancy Corruption in Asia Survey, only
focus on expatriates working in these nations and may not necessarily reflect common perceptions of
corruption within these countries.

International Journal of Communication 8(2014) Ignorance is Bliss! 2565
government’s commitment to policy; (h) voice and accountability, which measures perceptions of the
extent to which a country’s citizens are able to participate in selecting their government and also
measures freedom of expression, freedom of association, and free media; (i) political stability, which
measures the perceptions of the likelihood that the government will be destabilized or overthrown by
unconstitutional or violent means; (j) regulatory quality, which measures perceptions of the government’s
ability to implement policies that promote private-sector development; (k) rule of law, which measures
perceptions about the quality of contract enforcement, property rights, the police, the courts, and the
likelihood of crime and violence. These variables are measured in the same way as control of corruption
and are also available from Kaufmann et al. (2009).
Finally, we included measures of (l) democracy and (m) freedom of the press to explain
movements in corruption. Our measure of democracy uses the Polity score from Marshall, Jaggers, and
Gurr (2010), which captures a regime’s authority on a 21-point scale ranging from –10 (hereditary
monarchy) to +10 (consolidated democracy).6 Freedom of the press is a composite non-negative index
ranging from 0. The variable encompasses freedom in print, broadcast, and Internet media sources. The
variable is readily available from Freedom House. Table 1 presents the summary statistics.
Table 1. Summary Statistics.
Variable Observations Mean SD Min. Max.
Control of corruption 1033 42.29 22.69 0 100
Internet 1033 11.45 15.57 0 80.91
GDP per capita 1033 3261.24 4881.26 83.09 35745.25
Inflation 1033 8.07 10.74 –9.80 168.62
Trade 1033 86.21 38.41 21.47 220.41
Voice & accountability 1033 41.86 22.66 0 100
Political stability 1033 39.36 22.65 0 100
Government effectiveness 1033 43.94 22.90 0 100
Regulatory quality 1033 45.37 22.62 0 100
Rule of law 1033 41.30 22.02 0 100
Government expenditure 1033 14.83 5.70 2.66 48
Cell phone 1033 35.08 38.48 0 188.30
Population density 1033 105.91 151.33 1.50 1384.68
Primary school enrollment 1033 101.07 17.32 27.85 160.38
Telephone 1033 13.34 13.01 0 58.15
Democracy 1033 3.41 6.11 –10 10
Freedom of press 1033 50.37 21.80 14 330
6 We control for the type of political regime, as it has been found to significantly affect the way media
relate to political outcomes (Whitten-Woodring & James, 2012).

2566 Alberto Posso & Meg Elkins International Journal of Communication 8(2014)
Econometric Methodology
The dependent variable, control of corruption, is censored from 0 to 100. There are two options
available for dealing with this type of variable in econometric analysis. The first option (presented in
Tables 2 and 3) is to fit a Tobit model for panel data. Columns 1 and 4 in each table fit random-effects
Tobit models. Columns 2 and 5 include year-fixed effects, whereas columns 3 and 6 include both year-
and country-fixed effects. Note, however, that the maximum likelihood estimator in Tobit panel-data
models with fixed effects can be biased and inconsistent when the length of the panel is small and fixed.7
As a result, the second option (see Table 4) is to follow Cameron and Trivedi (2005) and transform the
corruption variable (cc) to an unbounded variable (ccʹ) in the following manner:
. (1)
The regressor ( ) computed from using ccʹ as the dependent variable must consequently be transformed
as follows prior to interpretation:
, (2)
where b is analogous to a regressor obtained from a simple Tobit regression model. The variable ccʹ is
used to fit two-way fixed effects and generalized method of moments (GMM) regressions in Columns 1–4
and Columns 5–6 of Table 4, respectively.8
It is possible that a number of the explanatory variables introduced in the previous section are
endogenous with the dependent variable. This is particularly true for those variables that are also
measured as perceptions of the quality of governance, which come from the same surveys. Durbin-Wu-
Hausman tests found that voice and accountability, government effectiveness, regulatory quality, and rule
of law are endogenous at the 5% level of significance. In the absence of natural instruments, we used two
different methods to account for this problem. First, Table 3 uses one-year-lagged values of the
endogenous variables to ensure that causality goes in the right direction. We use a similar method in
Columns 3–4 of Table 4 with the unbounded variable as the dependent variable.
In Columns 5–6 of Table 4, we also use difference GMM, which handles the estimation of endogenous
panels using internal instruments (our preferred specification). The AR(2) tests at the bottom of the table
show that the first-differenced error term is not serially correlated. AR(1) values are not reported, as they
are expected to reject the null hypothesis of no serial correlation when using first-differenced equations.
The Hansen statistic at the end of the table shows that the instruments are exogenous as a group. This
statistic is preferred to the Sargan test when standard errors are robust to heteroscedasticity and to serial
correlation, as in this case.
7 The implications of this for the current study are discussed below. 8GMM is our preferred specification as it addresses within country changes in Internet usage and its effect
on corruption perceptions while adequately addressing issues of endogeneity.
International Journal of Communication 8(2014) Ignorance is Bliss! 2567
Following Bertrand, Dufloand, and Mullainathan (2004), the standard errors in Table 4 are
clustered by country, as this allows for arbitrary error correlations among country-year observations
within each country, as these specify standard errors that are asymptomatically robust to serial
correlation. Heteroscedastically robust standard errors are also computed. Note that all specifications
employ time-period dummies.
Results
Tables 2 and 3 present the results from the Tobit models, and Table 4 presents the results from
the fixed-effects and GMM models using the unbounded dependent variable. The tables show a positive
and significant relationship between the rise of Internet usage and perceived corruption. The Tobit models
with and without year-fixed effects in Table 2 (Columns 1, 2, 4, and 5) show that if an additional 10 out of
every 100 people in a developing country (in our sample) obtain access to the Internet, then the control of
corruption index will decrease 0.85 points. The coefficient estimates from the two-way fixed effects model
are found to be negative but statistically insignificant (p values in Columns 3 and 6 are 0.18 and 0.34,
respectively). The insignificance of these coefficient estimates, however, is likely to stem from the fact
that fitting unconditional fixed effects in Tobit models generates biased likelihood estimators. The
coefficient estimates from Table 3, which addresses potential endogeneity issues, are consistent with
those found in Table 2. Moreover, the effect of Internet usage on cc is robust to the inclusion of two-way
fixed effects in that case.
As above, the coefficient estimates for the effect of Internet usage on the uncensored corruption
index (ccʹ) are found to be statistically significant only when we attempt to address the aforementioned
endogeneity problem. In Columns 1 and 2 of Table 4, the effect of Internet usage is found to be negative
and marginally insignificant (the p values corresponding to the coefficient estimates are 0.14 and 0.22,
respectively). The two-way fixed effects with lagged endogenous variables and the GMM models indicate
that if Internet usage increases by an additional 10 percent of the population, then cc will decrease by
approximately 0.5 points.9 Overall, these results suggest that the information the average citizen in a
developing country is receiving from the World Wide Web results in a deteriorating view of the state of
corruption in their country, ceteris paribus.
In discussing the remaining variables, we focus on our preferred specification, the GMM models of
Table 4. However, the results from these models are consistent with those found in Tables 2 and 3.
Greater perceptions of government effectiveness are unsurprisingly found to negatively and significantly
decrease perceptions of corruption within countries. The GMM models suggest that an increase in
perceptions of government effectiveness by 1 standard deviation (26 index points) is associated with a 13-
index-point increase in control of corruption. Similar results are obtained from Tables 2 and 3.
An improvement in perceptions of regulatory quality is found to significantly decrease perceptions
of corruption within countries. The GMM models in Table 4 suggest that a 1-standard-deviation increase in
the regulatory quality index (23 index points) is associated with an 11.5 point increase in the cc index,
9 This is calculated using the methodology described in Equation (2).
2568 Alberto Posso & Meg Elkins International Journal of Communication 8(2014)
ceteris paribus. These coefficient estimates could not be replicated in the fixed-effects and Tobit models,
however, and must therefore be interpreted with caution.
Results from Internet usage in Column 6 of Table 4 also suggest that greater communication
among individuals in the form of telephone calls can increase perceptions of corruption. The results show
that if an additional 10 out of 100 people get access to telephone lines, then the control of corruption
index will decrease by 0.5 points. Note, however, that this result could not be replicated in the fixed-
effects and Tobit models. One possibility behind this inconsistency may be due to the collinearity between
telephone and Internet usage (correlation coefficient is 0.67). Telephone infrastructure in developing
countries is a necessary condition for Internet usage.10
The remaining explanatory variables are found to be insignificant in the GMM models. However,
as expected, voice and accountability, rule of law, political stability, and government expenditure are also
found to be positive and significant in Tables 2 and 3. Table 3, for instance, indicates that an increase in
voice and accountability in the previous year by 1 standard deviation (26 index points) will result in an
increase in control of corruption perceptions by 5 index points. Not surprisingly, an increase in rule of law
by 1 standard deviation (25 index points) is found to increase the control of corruption index by 7.5
points. Similarly, an increase in political stability by one standard deviation (27 index points) is found to
increase the control of corruption index by approximately 2 points. Finally, note that Tables 2 and 3 also
show that an increase in government expenditure by one standard deviation (6% of GDP) will result in a
rise of the control of corruption index by 3 points. This may result from the government being seen as
active in the promotion of public goods and services to the public.
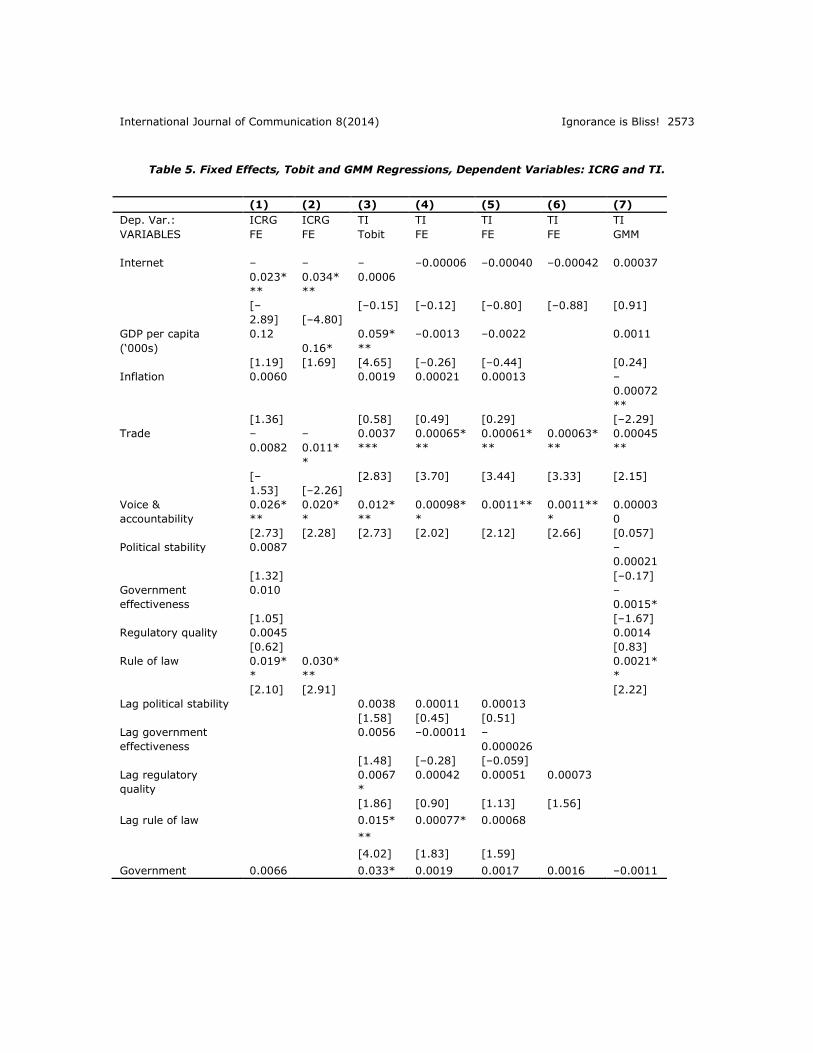
The data section of this article argues that cc is our preferred measure of perceptions of
corruption but that this is not the only available measure. Therefore, Table 5 presents the results of a set
of robustness exercises using the aforementioned TI measure and the well-known political corruption
component of the Political Risk Index used for the International Country Risk Guide rating (ICRG). The
Political Risk index is based on 100 points, ranging from 0 to 100—the higher the measure, the lower the
risk. Note that this measure is solely used as a robustness exercise, as it is a measure of political
instability caused by corruption, not an index of perceptions of corruption. Hence, cc and the ICRG
measure could be potentially very different—the correlation coefficient between cc and the ICRG index is
0.76 and significant at the 1% level (Graf Lambsdorff, 2005).
10 For a discussion of this issue in Africa, see Roycroft and Anatho (2003).
International Journal of Communication 8(2014) Ignorance is Bliss! 2569
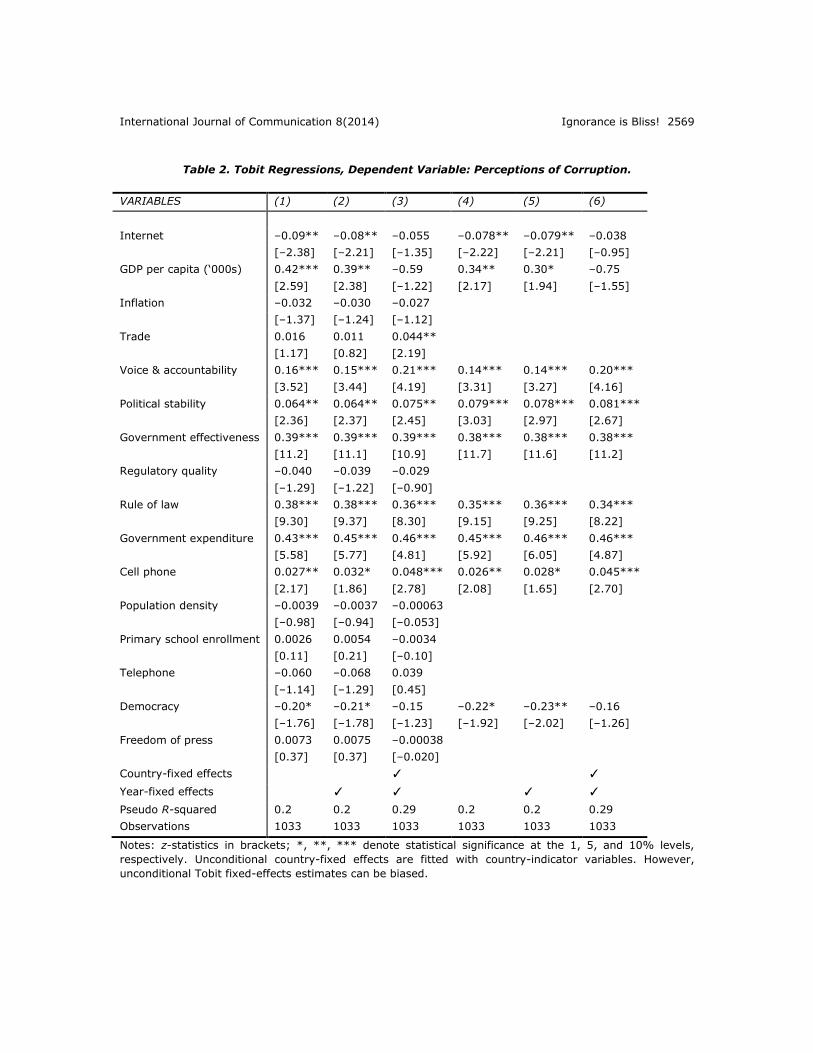
Table 2. Tobit Regressions, Dependent Variable: Perceptions of Corruption.
VARIABLES (1) (2) (3) (4) (5) (6)
Internet –0.09** –0.08** –0.055 –0.078** –0.079** –0.038
[–2.38] [–2.21] [–1.35] [–2.22] [–2.21] [–0.95]
GDP per capita (‘000s) 0.42*** 0.39** –0.59 0.34** 0.30* –0.75
[2.59] [2.38] [–1.22] [2.17] [1.94] [–1.55]
Inflation –0.032 –0.030 –0.027
[–1.37] [–1.24] [–1.12]
Trade 0.016 0.011 0.044**
[1.17] [0.82] [2.19]
Voice & accountability 0.16*** 0.15*** 0.21*** 0.14*** 0.14*** 0.20***
[3.52] [3.44] [4.19] [3.31] [3.27] [4.16]
Political stability 0.064** 0.064** 0.075** 0.079*** 0.078*** 0.081***
[2.36] [2.37] [2.45] [3.03] [2.97] [2.67]
Government effectiveness 0.39*** 0.39*** 0.39*** 0.38*** 0.38*** 0.38***
[11.2] [11.1] [10.9] [11.7] [11.6] [11.2]
Regulatory quality –0.040 –0.039 –0.029
[–1.29] [–1.22] [–0.90]
Rule of law 0.38*** 0.38*** 0.36*** 0.35*** 0.36*** 0.34***
[9.30] [9.37] [8.30] [9.15] [9.25] [8.22]
Government expenditure 0.43*** 0.45*** 0.46*** 0.45*** 0.46*** 0.46***
[5.58] [5.77] [4.81] [5.92] [6.05] [4.87]
Cell phone 0.027** 0.032* 0.048*** 0.026** 0.028* 0.045***
[2.17] [1.86] [2.78] [2.08] [1.65] [2.70]
Population density –0.0039 –0.0037 –0.00063
[–0.98] [–0.94] [–0.053]
Primary school enrollment 0.0026 0.0054 –0.0034
[0.11] [0.21] [–0.10]
Telephone –0.060 –0.068 0.039
[–1.14] [–1.29] [0.45]
Democracy –0.20* –0.21* –0.15 –0.22* –0.23** –0.16
[–1.76] [–1.78] [–1.23] [–1.92] [–2.02] [–1.26]
Freedom of press 0.0073 0.0075 –0.00038
[0.37] [0.37] [–0.020]
Country-fixed effects ✓ ✓
Year-fixed effects ✓ ✓ ✓ ✓
Pseudo R-squared 0.2 0.2 0.29 0.2 0.2 0.29
Observations 1033 1033 1033 1033 1033 1033
Notes: z-statistics in brackets; *, **, *** denote statistical significance at the 1, 5, and 10% levels,
respectively. Unconditional country-fixed effects are fitted with country-indicator variables. However,
unconditional Tobit fixed-effects estimates can be biased.

2570 Alberto Posso & Meg Elkins International Journal of Communication 8(2014)
Table 3. Tobit Regressions with Lagged Dependent Variables, Dependent Variable:
Perceptions of Corruption.
VARIABLES (1) (2) (3) (4) (5) (6)
Internet –0.09** –0.1** –0.1** –0.055** –0.096** –0.084*
[–2.16] [–2.22] [–2.13] [–1.96] [–2.55] [–1.95]
GDP per capita (‘000s) 0.68*** 0.70*** –0.10 0.71*** 0.72*** –0.083
[4.07] [4.12] [–0.18] [4.53] [4.56] [–0.15]
Inflation 0.011 0.0055 0.0063
[0.25] [0.11] [0.13]
Trade 0.0072 0.0068 0.018
[0.49] [0.46] [0.79]
Voice & accountability 0.22*** 0.22*** 0.24*** 0.16*** 0.16*** 0.24***
[3.67] [3.68] [3.94] [4.55] [4.73] [4.42]
Lag political stability 0.1*** 0.1*** 0.1*** 0.1*** 0. 1*** 0.11***
[2.86] [2.90] [3.15] [3.20] [3.20] [3.28]
Lag government effectiveness 0.3*** 0.29*** 0.23*** 0.30*** 0.31*** 0.24***
[5.80] [5.86] [4.40] [6.93] [7.12] [5.24]
Lag regulatory quality 0.020 0.028 0.059
[0.44] [0.61] [1.19]
Lag rule of law 0.3*** 0.29*** 0.15*** 0.29*** 0.29*** 0.17***
[5.92] [5.85] [2.92] [6.14] [6.19] [3.46]
Government expenditure 0.54*** 0.54*** 0.50*** 0.54*** 0.54*** 0.51***
[6.42] [6.36] [4.92] [6.48] [6.49] [5.14]
Cell phone 0.015 0.0023 0.0060
[1.17] [0.13] [0.34]
Population density –0.0026 –0.0028 0.0025
[–0.65] [–0.70] [0.21]
Primary school enrollment 0.038 0.030 –0.0035
[1.19] [0.91] [–0.073]
Telephone –0.024 –0.0081 –0.11
[–0.39] [–0.13] [–0.97]
Democracy –0.071 –0.075 0.065
[–0.54] [–0.56] [0.45]
Freedom of press 0.063 0.061 0.037
[1.12] [1.09] [0.50]
Pseudo R-squared 0.23 0.23 0.35 0.22 0.22 0.35
Country-fixed effects ✓ ✓
Year-fixed effects ✓ ✓ ✓ ✓
Observations 676 676 676 676 676 676
Notes: z-statistics in brackets; *, **, *** denote statistical significance at the 1, 5, and 10% levels,
respectively. Endogenous variables are lagged by one year. Columns 1 and 2 estimate random-effects
Tobit regressions. Columns 3–4 show estimates from Tobit regressions with fixed effects. Columns 5–6
show estimates with country- and year-fixed effects. Note, however, that unconditional Tobit fixed-effects
estimates can be biased.
International Journal of Communication 8(2014) Ignorance is Bliss! 2571
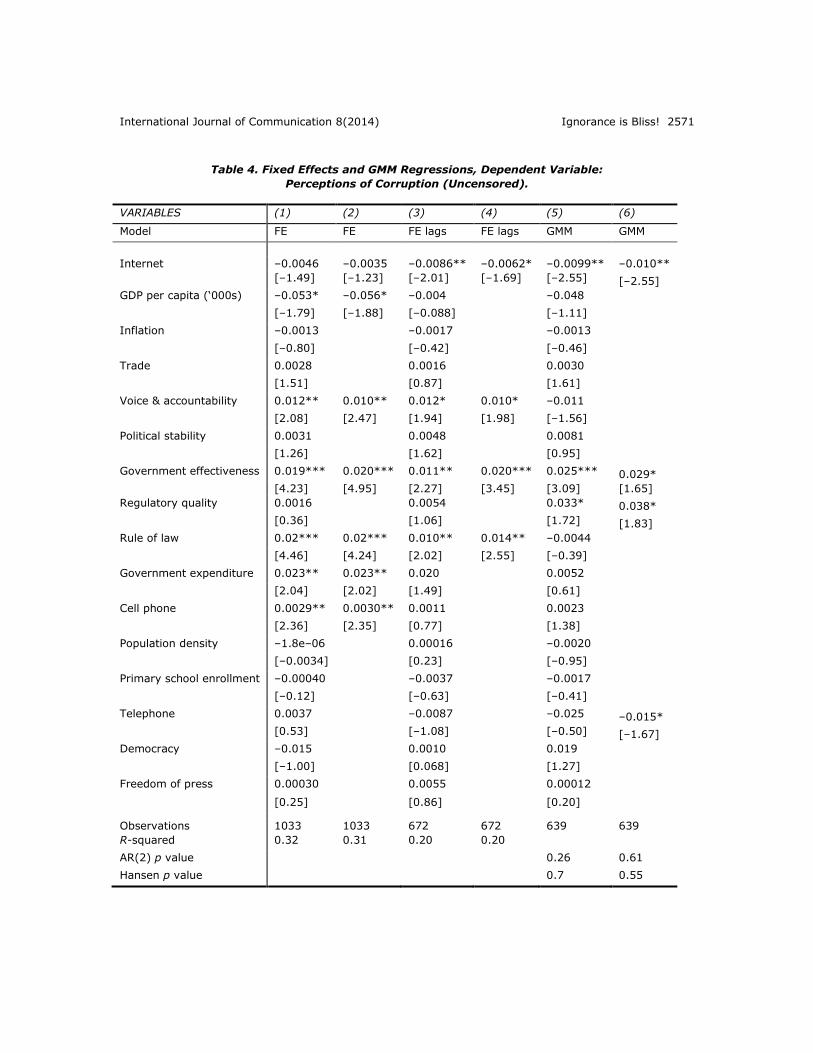
Table 4. Fixed Effects and GMM Regressions, Dependent Variable:
Perceptions of Corruption (Uncensored).
VARIABLES (1) (2) (3) (4) (5) (6)
Model FE FE FE lags FE lags GMM GMM
Internet –0.0046 –0.0035 –0.0086** –0.0062* –0.0099** –0.010**
[–1.49] [–1.23] [–2.01] [–1.69] [–2.55] [–2.55]
GDP per capita (‘000s) –0.053* –0.056* –0.004 –0.048
[–1.79] [–1.88] [–0.088] [–1.11]
Inflation –0.0013 –0.0017 –0.0013
[–0.80] [–0.42] [–0.46]
Trade 0.0028 0.0016 0.0030
[1.51] [0.87] [1.61]
Voice & accountability 0.012** 0.010** 0.012* 0.010* –0.011
[2.08] [2.47] [1.94] [1.98] [–1.56]
Political stability 0.0031 0.0048 0.0081
[1.26] [1.62] [0.95]
Government effectiveness 0.019*** 0.020*** 0.011** 0.020*** 0.025*** 0.029*
[4.23] [4.95] [2.27] [3.45] [3.09] [1.65]
Regulatory quality 0.0016 0.0054 0.033* 0.038*
[0.36] [1.06] [1.72] [1.83]
Rule of law 0.02*** 0.02*** 0.010** 0.014** –0.0044
[4.46] [4.24] [2.02] [2.55] [–0.39]
Government expenditure 0.023** 0.023** 0.020 0.0052
[2.04] [2.02] [1.49] [0.61]
Cell phone 0.0029** 0.0030** 0.0011 0.0023
[2.36] [2.35] [0.77] [1.38]
Population density –1.8e–06 0.00016 –0.0020
[–0.0034] [0.23] [–0.95]
Primary school enrollment –0.00040 –0.0037 –0.0017
[–0.12] [–0.63] [–0.41]
Telephone 0.0037 –0.0087 –0.025 –0.015*
[0.53] [–1.08] [–0.50] [–1.67]
Democracy –0.015 0.0010 0.019
[–1.00] [0.068] [1.27]
Freedom of press 0.00030 0.0055 0.00012
[0.25] [0.86] [0.20]
Observations 1033 1033 672 672 639 639
R-squared 0.32 0.31 0.20 0.20
AR(2) p value 0.26 0.61
Hansen p value 0.7 0.55

2572 Alberto Posso & Meg Elkins International Journal of Communication 8(2014)
Notes: Robust Huber-White corrected t-statistics in brackets; *, **, *** denote statistical significance at
the 1, 5, and 10% levels, respectively. Control of corruption is unbounded following Cameron and Trivedi
(2005). Fixed-effects regressions include country- and year-fixed effects. GMM regressions are differenced
and include year-fixed effects. Voice and accountability, political stability, government effectiveness,
regulatory quality, and rule of law are lagged by one period in Columns 3 and 4.
The econometric techniques presented in Table 5 closely mirror those presented in previous
tables. Columns 1 and 2 show a fixed-effects model with the ICRG as the dependent variable. We were
able to run a simple fixed-effects model because the index is not censored for any of these countries, and
none of the explanatory variables were found to be statistically endogenous. Columns 3–7 show the
results using the TI index as the explanatory variable. Column 3 presents a simple Tobit model. Columns
4–6 show variations of fixed-effects models. Note that endogenous variables are lagged by one year in
Columns 3–6. Finally, Column 7 presents the GMM results.
Overall, our regression results are consistent with the results in the previous tables. Using the
ICRG measure as the dependent variable reveals that greater access to the Internet increases political risk
due to corruption in these developing countries. Perhaps this reflects the possibility that large corruption
scandals become more widely publicized, leading to an increased probability of political instability.
Columns 3–7 show that Internet access does not have a statistically significant effect on the TI measure of
corruption, although Columns 3–6 reveal that the sign of the coefficient is negative. However, the TI
measure does not include household surveys. Moreover, the methodology used to construct this measure
has changed over time so that changes in the index may not represent changes in corruption perceptions
(Treisman, 2007). Therefore, rather than casting doubt on our previous results, these findings suggest
that household-level and popular perceptions of corruption have increased over time as a result of the rise
in Internet access in developing countries.
International Journal of Communication 8(2014) Ignorance is Bliss! 2573
Table 5. Fixed Effects, Tobit and GMM Regressions, Dependent Variables: ICRG and TI.
(1) (2) (3) (4) (5) (6) (7)
Dep. Var.: ICRG ICRG TI TI TI TI TI
VARIABLES FE FE Tobit FE FE FE GMM
Internet –
0.023*
**
–
0.034*
**
–
0.0006
–0.00006 –0.00040 –0.00042 0.00037
[–
2.89] [–4.80]
[–0.15] [–0.12] [–0.80] [–0.88] [0.91]
GDP per capita
(‘000s)
0.12
0.16*
0.059*
**
–0.0013 –0.0022 0.0011
[1.19] [1.69] [4.65] [–0.26] [–0.44] [0.24]
Inflation 0.0060
0.0019 0.00021 0.00013 –
0.00072
**
[1.36]
[0.58] [0.49] [0.29] [–2.29]
Trade –
0.0082
–
0.011*
*
0.0037
***
0.00065*
**
0.00061*
**
0.00063*
**
0.00045
**
[–
1.53] [–2.26]
[2.83] [3.70] [3.44] [3.33] [2.15]
Voice &
accountability
0.026*
**
0.020*
*
0.012*
**
0.00098*
*
0.0011** 0.0011**
*
0.00003
0
[2.73] [2.28] [2.73] [2.02] [2.12] [2.66] [0.057]
Political stability 0.0087
–
0.00021
[1.32]
[–0.17]
Government
effectiveness
0.010
–
0.0015*
[1.05]
[–1.67]
Regulatory quality 0.0045
0.0014
[0.62]
[0.83]
Rule of law 0.019*
*
0.030*
**
0.0021*
*
[2.10] [2.91] [2.22]
Lag political stability
0.0038 0.00011 0.00013
[1.58] [0.45] [0.51]
Lag government
effectiveness
0.0056 –0.00011 –
0.000026
[1.48] [–0.28] [–0.059]
Lag regulatory
quality
0.0067
*
0.00042 0.00051 0.00073
[1.86] [0.90] [1.13] [1.56]
Lag rule of law
0.015*
**
0.00077* 0.00068
[4.02] [1.83] [1.59]
Government 0.0066
0.033* 0.0019 0.0017 0.0016 –0.0011

2574 Alberto Posso & Meg Elkins International Journal of Communication 8(2014)
expenditure **
[0.35]
[3.60] [1.54] [1.40] [1.34] [–0.88]
Cell phone –
0.0021
0.0002
5
0.00013 –
0.000056
0.00002
8
[–
0.89]
[0.26] [1.00] [–0.30] [0.13]
Population density –
0.0027
7.1e–
06
–
0.000098
**
–
0.00012*
**
–
0.00011*
**
0.00004
1
[–
1.08]
[0.023] [–2.14] [–2.79] [–3.97] [0.31]
Primary school
enrollment
–
0.0026
0.0003
4
–7.4e–06 –0.00031 0.00057
*
[–
0.52]
[0.13] [–0.021] [–0.76] [1.74]
Telephone –
0.063*
**
–
0.063*
**
–
0.0007
6
–0.0019 –0.0021 –0.0022* –
0.00037
[–
3.34] [–3.58]
[–0.14] [–1.43] [–1.60] [–1.75] [–0.34]
Democracy –
0.063*
*
–
0.063*
*
–
0.0091
–
0.000043
–0.00024 0.0013*
*
[–
2.45] [–2.45]
[–0.90] [–0.074] [–0.43] [2.44]
Freedom of press 0.0002
8
0.0047 0.00015 7.5e–06 –
0.00005
4
[0.14]
[1.15] [0.39] [0.018] [–0.69]
Constant
0.33
[0.75]
R-Squared 0.34 0.30 0.16 0.18 0.16
AR(2) p value
0.26
Hansen p value
0.62
Observations 685 685 420 420 420 420 350
Notes: Robust Huber-White corrected t statistics in brackets; *, **, *** denote statistical significance at
the 1, 5, and 10% levels, respectively. TI is unbounded following Cameron and Trivedi (2005) in Columns
4–6. Fixed-effects regressions include country- and year-fixed effects. The GMM regression is differenced
and includes year-fixed effects.

International Journal of Communication 8(2014) Ignorance is Bliss! 2575
Conclusion
This study investigates whether a relationship exists between Internet access and perceptions of
corruption. We find evidence that access to the Internet has significantly influenced the populace in
developing countries to generalize a perhaps ongoing dissatisfaction with government. This is not to say
that these citizens were not otherwise aware of existing corruption but that the Internet has allowed
people to harness their collective voices to incite action. As a caveat, this study measures only Internet
access and not social media access, though there is a clear relationship between the two.
We may now expect some governments to react to this growing dissatisfaction in the virtual
world through additional censorship and political violence. However, the Arab Spring has highlighted that
information repression may not be a viable or sustainable option. Social movements via the Internet are
catalysts for significant social change and lessened government repression for citizens in the developing
world.

2576 Alberto Posso & Meg Elkins International Journal of Communication 8(2014)
References
Anderson, L. (2011). Demystifying the Arab Spring: Parsing the differences between Tunisia, Egypt, and
Libya. Foreign Affairs, 90(2).
Bardhan, P. (1997). Corruption and development: A review of the issues. Journal of Economic Literature
35, 155–194.
Bertrand, M., Dufloand, E., & Mullainathan, S. (2004). How much should we trust differences-in-
differences estimates? Quarterly Journal of Economics, 119(1), 249–275.
Brunetti, A., & Weder, B. (2003). A free press is bad news for corruption. Journal of Public Economics, 87,
1801–1824
Cameron, A. C., & Trivedi, P. K. (2005). Supplement to microeconometrics: Methods and applications.
New York, NY: Cambridge University Press.
Chowdhury, S. K. (2004). The effect of democracy and press freedom on corruption: An empirical test.
Economic Letters, 85, 1020–1046.
Eltantawy, N. & Weist, J. B. (2011). Social media in the Egyptian revolution: Reconsidering mobilization
theory. International Journal of Communication, 5, 1207–1224
Freille S., Haque, M. E., & Kneller, R. (2007). A contribution to the empirics of press freedom and
corruption. European Journal of Political Economy, 27, 586–599
Graf Lambsdorff, J. (2005). Consequences and causes of corruption: What do we know from a cross-
section of countries? 34(5). Passauer Diskussionspapiere: Volkswirtschaftliche Reihe.
Goel, R. K., Michael, N., Naretta, A., & Michael, A. (2012). The Internet as an indicator of corruption
awareness. European Journal of Political Economy, 28, 64–75.
Gupta, S., Davoodi, H., & Alonso-Terme, R. (2002). Does corruption affect income inequality and poverty?
Economics of Governance, 3(1), 23–45.
Kaufmann, D., Kraay, A., & Mastruzzi, M. (2006). Measuring governance using cross-country perceptions
data. In S. Rose-Ackerman (Ed.), International Handbook on the Economics of Corruption,
Cheltenham, UK: Edward Elgar.
Kaufmann, D., Kraay, A., & Mastruzzi, M. (2009). Governance matters VIII: Aggregate and individual
governance indicators, 1996–2008. World Bank Policy Research Working Paper No. 4978.
International Journal of Communication 8(2014) Ignorance is Bliss! 2577
Marshall, M. G., Jaggers, K., & Gurr, T. R. (2010). Polity IV: Political regime characteristics and
transitions, 1800–2010. Retrieved from http://www.systemicpeace.org/polity/polity4.htm
Mauro, P. (1995). Corruption and growth. Quarterly Journal of Economics, 110(3), 681–712.
Mo, P. H. (2001). Corruption and economic growth. Journal of Comparative Economics, 29(1), 66–79.
O’Higgins, E. R. (2006). Corruption, underdevelopment, and extractive resource industries. Business
Ethics Quarterly, 16(2), 235–254.
Olken, B. A., & Pande, R. (2011). Corruption in developing countries, NBER Working Paper No. 17398.
Pellegrini, L., & Gerlagh, R. (2004). Corruption’s effect on growth and its transmission
channels. Kyklos, 57(3), 429–456.
Roycroft, T. R., & Anatho, S. (2003). Internet subscription in Africa: Policy for a dual digital
divide. Telecommunications Policy, 27(1), 61–74.
Svensson, J. (2004). Eight questions about corruption. Journal of Economic Perspectives, 19(5), 19–42.
Treisman, D. (2007). What have we learnt about the causes of corruption from 10 years of cross-national
empirical research? Annual Review of Political Science, 10, 211–244
Vaidya, S. (2005). Corruption in the media’s gaze. European Journal of Political Economy, 21, 667–687.
Whitten-Woodring, J., & James, P. (2012). Fourth estate or mouthpiece? A formal model of media,
protest, and government repression. Political Communication, 29(2), 113–136.
World Bank. (2001). World Development Report 2000/2001: Attacking Poverty. Oxford, NY: Oxford
University Press.
Copyright © 2022 FDOKUMEN