Identifying stimuli of different perceptual categories in pure and mixed blocks of trials: evidence...
21
Journal of Experimental Psychology: Human Perception and Performance 1999, Vol. 25, No. 1,3-23 Copyright 1999 by the American Psychological Association, Inc. 0096-1523/99/S3.00 Identifying Stimuli of Different Perceptual Categories in Mixed Blocks of Trials: Evidence for Cost in Switching Between Computational Processes Sander A. Los Vrije Universiteit Responding to stimuli of different perceptual categories is usually faster when the categories are presented isolated from each other, in pure blocks, than when they are presented intermixed, in mixed blocks. According to criterion models, these perceptual mixing costs result from the use of a less conservative response criterion in pure than in mixed blocks. According to alternate processing models, mixing costs result from time-consuming switching in mixed blocks between different computational processes called on by the different perceptual categories. In 5 experiments, participants had to identify number stimuli of different categories. The results showed clear mixing costs whenever these categories differed in their assumed computational processing requirements but not when they differed on features that seemed trivial from a computational viewpoint. The results favor the alternate processing conception. In the pure/mixed design, the levels of an independent variable are presented both in isolation, in pure blocks, and intermixed across trials, in mixed blocks. The common finding is that people respond slower to either level of the variable in mixed blocks than in pure blocks, a difference referred to as mixing costs. Mixing costs have been reported for a large number of variables, including stimulus intensity, stimulus quality, stimulus-response compatibility, fore- period, and task set (see Los, 1996, for a review). In this article I focus on perceptual mixing costs, which are found when a perceptual variable is presented in the pure/mixed design. For instance, Van Duren and Sanders (1988) and Los (1994) had participants identify intact and degraded digits (i.e., two levels of the variable "stimulus quality") both in pure and mixed blocks of trials. In those studies, both intact and degraded digits showed mixing costs in that they were more slowly identified in mixed blocks than in pure blocks. Mixing costs have recently evoked interest among psy- chologists because they provide insights into human control of action. I discuss two issues: (a) the source of mixing costs and (b) the mechanism underlying mixing costs. This article is mainly concerned with the second issue, but for the sake of completeness I begin by addressing the first issue in some detail. The Source of Mixing Costs According to the endogenous view, mixing costs reflect the fact that pure blocks enable the participant to prepare I am grateful to Andries Sanders, Gordon Baylis, Rob van der Lubbe, and an anonymous reviewer for helpful comments on earlier versions of this article. Correspondence concerning this article should be addressed to Sander A. Los, Department of Psychonomics, Vrije Universiteit, De Boelelaan 1111, 1081 HV Amsterdam, The Netherlands. Electronic mail may be sent to [email protected]. better for forthcoming events than do mixed blocks. This view developed from studies that used mixed blocks in which the levels of the variable were randomized across trials (hereinafter referred to as "randomly mixed blocks"). In these blocks, participants cannot predict which level will be presented on a trial. The uncertainty thus induced is assumed to restrain participants from effectively preparing for forthcoming events and accordingly to reduce their performance relative to that in pure blocks. In this view, the participant's preparatory activity proceeds from an internal source, possibly a central executive (Baddeley, 1986) or a supervisory attentional system (Norman & Shallice, 1986), and so the theoretically important implication is that mixing costs are endogenous in nature. Consequently, mechanisms accounting for mixing costs on the basis of uncertainty indicate where and how endogenous preparation enhances the anticipated flow of information (e.g., Grice, 1968; Stoffels, 1996; Van Duren & Sanders, 1988). The endogenous view used to be dominant in the litera- ture of mixing costs; witness the common use of variable labels such as "stimulus uncertainty" or "event uncertainty" (Grice, 1968; Sperling & Dosher, 1986; Van Duren & Sanders, 1988), with the levels "low" and "high," instead of the more neutral label of "block type," with the levels "pure" and "mixed," respectively. This is unfortunate because block type manipulates more than uncertainty per se. This is perhaps most notable in studies on task switching, in which participants carry out two tasks, isolated from each other (i.e., in pure blocks) as well as in a perfectly predictable order across trials of mixed blocks. In spite of the resulting equal predictability of events in pure and mixed blocks, researchers using this design have reported mixing costs almost without exception (e.g., Allport, Styles, & Hsieh, 1994; Jersild, 1927; Meiran, 1996; Rogers & Mon- sell, 1995; Spector & Biederman, 1976). The results of those studies suggest that the mere difference in intertrial variabil-
Transcript of Identifying stimuli of different perceptual categories in pure and mixed blocks of trials: evidence...
Journal of Experimental Psychology:Human Perception and Performance1999, Vol. 25, No. 1,3-23
Copyright 1999 by the American Psychological Association, Inc.0096-1523/99/S3.00
Identifying Stimuli of Different Perceptual Categories in MixedBlocks of Trials: Evidence for Cost in Switching
Between Computational Processes
Sander A. LosVrije Universiteit
Responding to stimuli of different perceptual categories is usually faster when the categoriesare presented isolated from each other, in pure blocks, than when they are presentedintermixed, in mixed blocks. According to criterion models, these perceptual mixing costsresult from the use of a less conservative response criterion in pure than in mixed blocks.According to alternate processing models, mixing costs result from time-consuming switchingin mixed blocks between different computational processes called on by the differentperceptual categories. In 5 experiments, participants had to identify number stimuli ofdifferent categories. The results showed clear mixing costs whenever these categories differedin their assumed computational processing requirements but not when they differed onfeatures that seemed trivial from a computational viewpoint. The results favor the alternateprocessing conception.
In the pure/mixed design, the levels of an independentvariable are presented both in isolation, in pure blocks, andintermixed across trials, in mixed blocks. The commonfinding is that people respond slower to either level of thevariable in mixed blocks than in pure blocks, a differencereferred to as mixing costs. Mixing costs have been reportedfor a large number of variables, including stimulus intensity,stimulus quality, stimulus-response compatibility, fore-period, and task set (see Los, 1996, for a review). In thisarticle I focus on perceptual mixing costs, which are foundwhen a perceptual variable is presented in the pure/mixeddesign. For instance, Van Duren and Sanders (1988) and Los(1994) had participants identify intact and degraded digits(i.e., two levels of the variable "stimulus quality") both inpure and mixed blocks of trials. In those studies, both intactand degraded digits showed mixing costs in that they weremore slowly identified in mixed blocks than in pure blocks.
Mixing costs have recently evoked interest among psy-chologists because they provide insights into human controlof action. I discuss two issues: (a) the source of mixing costsand (b) the mechanism underlying mixing costs. This articleis mainly concerned with the second issue, but for the sakeof completeness I begin by addressing the first issue in somedetail.
The Source of Mixing Costs
According to the endogenous view, mixing costs reflectthe fact that pure blocks enable the participant to prepare
I am grateful to Andries Sanders, Gordon Baylis, Rob van derLubbe, and an anonymous reviewer for helpful comments onearlier versions of this article.
Correspondence concerning this article should be addressed toSander A. Los, Department of Psychonomics, Vrije Universiteit,De Boelelaan 1111, 1081 HV Amsterdam, The Netherlands.Electronic mail may be sent to [email protected].
better for forthcoming events than do mixed blocks. Thisview developed from studies that used mixed blocks inwhich the levels of the variable were randomized acrosstrials (hereinafter referred to as "randomly mixed blocks").In these blocks, participants cannot predict which level willbe presented on a trial. The uncertainty thus induced isassumed to restrain participants from effectively preparingfor forthcoming events and accordingly to reduce theirperformance relative to that in pure blocks. In this view, theparticipant's preparatory activity proceeds from an internalsource, possibly a central executive (Baddeley, 1986) or asupervisory attentional system (Norman & Shallice, 1986),and so the theoretically important implication is that mixingcosts are endogenous in nature. Consequently, mechanismsaccounting for mixing costs on the basis of uncertaintyindicate where and how endogenous preparation enhancesthe anticipated flow of information (e.g., Grice, 1968;Stoffels, 1996; Van Duren & Sanders, 1988).
The endogenous view used to be dominant in the litera-ture of mixing costs; witness the common use of variablelabels such as "stimulus uncertainty" or "event uncertainty"(Grice, 1968; Sperling & Dosher, 1986; Van Duren &Sanders, 1988), with the levels "low" and "high," instead ofthe more neutral label of "block type," with the levels"pure" and "mixed," respectively. This is unfortunatebecause block type manipulates more than uncertainty perse. This is perhaps most notable in studies on task switching,in which participants carry out two tasks, isolated from eachother (i.e., in pure blocks) as well as in a perfectlypredictable order across trials of mixed blocks. In spite ofthe resulting equal predictability of events in pure and mixedblocks, researchers using this design have reported mixingcosts almost without exception (e.g., Allport, Styles, &Hsieh, 1994; Jersild, 1927; Meiran, 1996; Rogers & Mon-sell, 1995; Spector & Biederman, 1976). The results of thosestudies suggest that the mere difference in intertrial variabil-
4 LOS
ity between pure and mixed blocks is a sufficient conditionfor mixing costs to occur. Consequently, within the task-switching tradition, mixing costs are usually attributed to theneed of the mental system to adjust to different demandswhen the level of the variable alternates on subsequent trials.Such "switch costs" necessarily translate into mixing costsbecause switching between the levels of a variable occursonly in mixed blocks, but not in pure blocks. The theoreti-cally important implication of this view is that mixing costsare exogenous in nature, as they are assumed to reflect thedegree to which current mental activities are supported orimpeded by preceding ones.
Even in the case of an equally low uncertainty in mixedblocks as in pure blocks (as realized in the task-switchingparadigm), the finding of mixing costs does not provideunequivocal support for the exogenous view, however.Alternatively, mixing costs could reflect block differences inmental load, in the sense that participants must maintainreadiness for either level of the variable in mixed blocks, butonly for one level in pure blocks. As a result, less capacity isavailable for processes called on in mixed blocks than forthese processes in pure blocks, thus reducing processingefficiency. The key feature of this conception of mental loadis its static character, because it assumes that the participantcontinuously maintains preparedness for all possible eventsthat may occur in a given block of trials. Therefore, evenwhen participants know on each trial of a mixed block whichlevel of the independent variable is forthcoming, mixingcosts are still predicted by a mental load account becausereadiness for the alternative level of the variable should bemaintained for the benefit of later trials (e.g., Ilan & Miller,1994).
The list given so far may not be exhaustive, but it capturesthe main theoretical positions regarding the source of mixingcosts. In a previous review (Los, 1996) I examined thesource of mixing costs for several variables that load stagesvarying from early perceptual processing to late motoradjustment, as revealed by additive factors research (e.g.,Sanders, 1990). Regarding the perceptual level, I discussedtwo lines of evidence indicating that mixing costs occurringhere are predominantly exogenous in nature. The first linederives from studies that deconfounded uncertainty andintertrial variability. These studies have used mixed blocksthat combine the high intertrial variability of randomlymixed blocks and the low uncertainty of pure blocks. This isachieved either by presenting the stimulus categories (i.e.,the levels of a perceptual variable) in a fixed order (e.g.,AABBAABB, etc.), such as in studies on task switching, orby informing the participant in advance of each trial of theforthcoming stimulus category. For several perceptual vari-ables, it has been shown that performance in these blockswas still clearly poorer than that in pure blocks and not muchdifferent from that in randomly mixed blocks (Los, 1994,1997; Maljkovic & Nakayama, 1994; Sanocki, 1988). Thus,the level of uncertainty per se appears to be a poor predictorof perceptual mixing costs, which argues strongly against anendogenous source. A second line of evidence derives fromthe study of sequential effects in mixed blocks, in whichperformance is separately analyzed for category repetition
•*»••
(c)
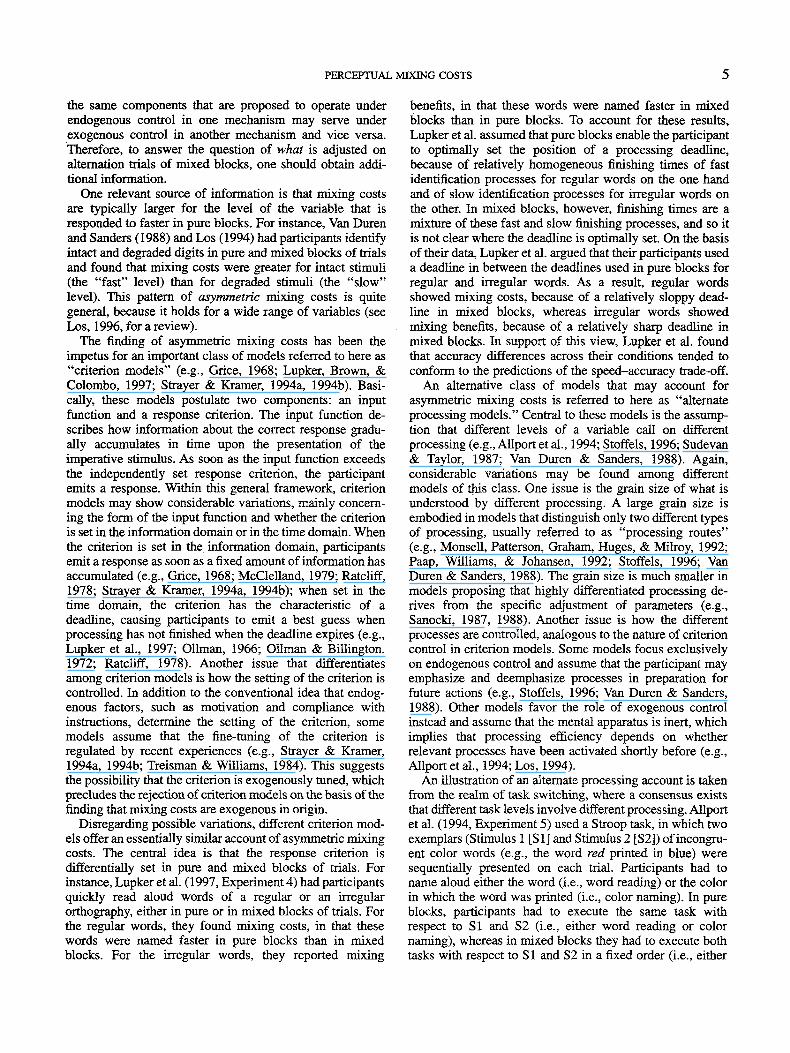
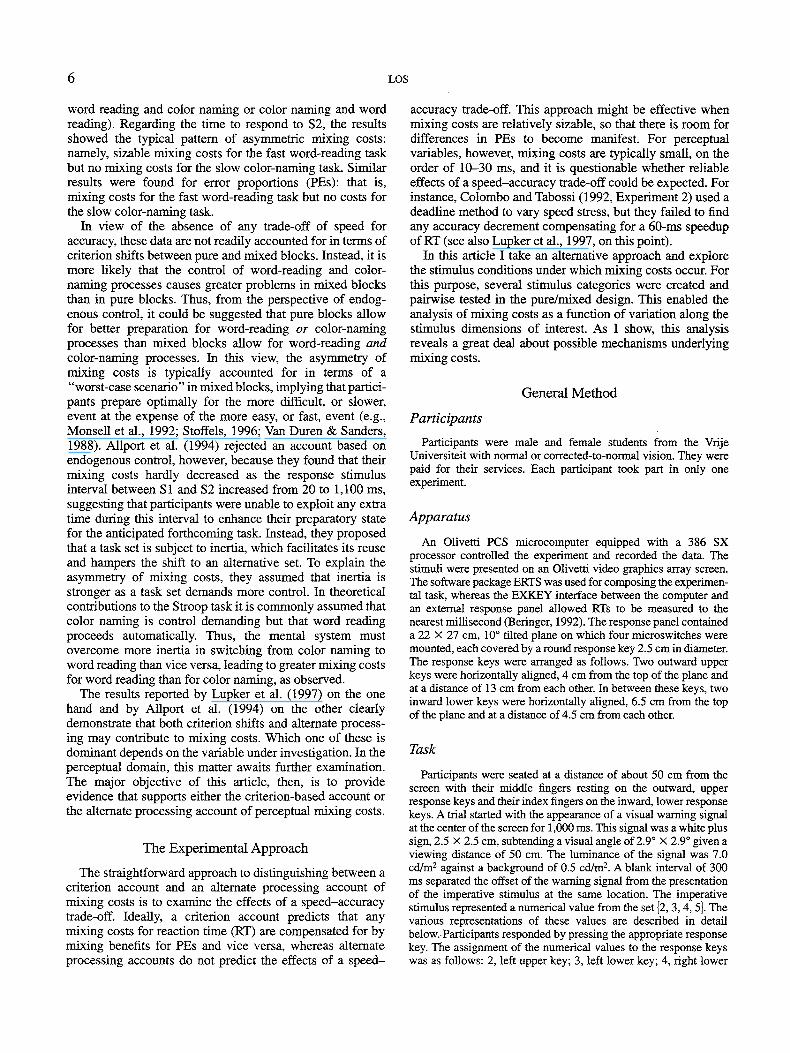
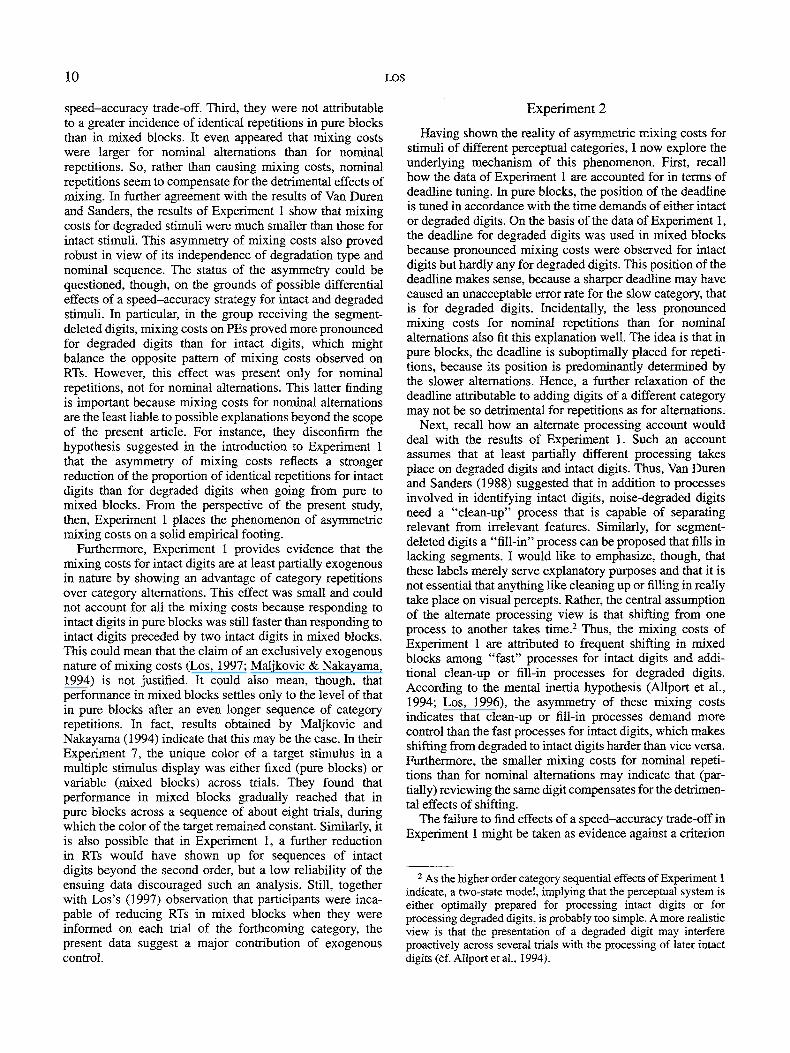
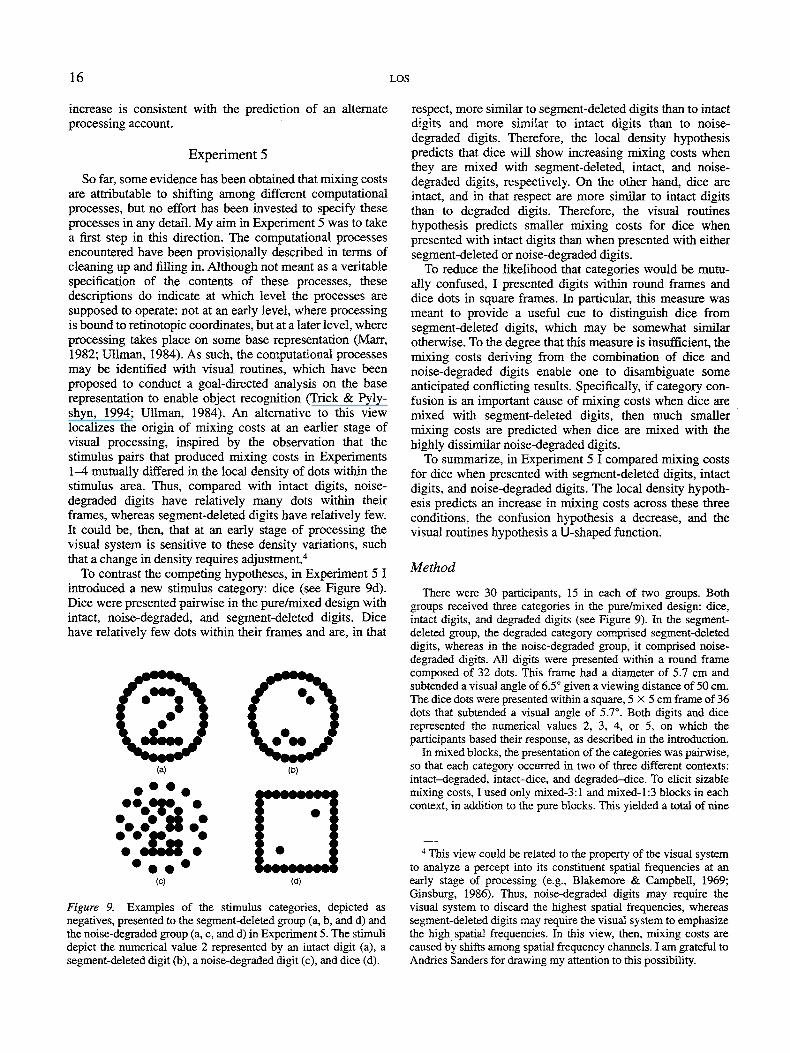
Figure 1. Examples of the stimulus categories, depicted asnegatives, occurring in Experiments 1-4. All examples representthe digit 2: the intact category (a), the noise-degraded category with12 noise dots within a rectangular frame (b), the noise-degradedcategory with 8 noise dots within a rectangular frame (c), thenoise-degraded category with 12 noise dots within a round frame(d), and the segment-deleted category (e). All stimuli are composedof an equal number of dots.
trials (i.e., trials on which the stimulus category of thepreceding trial is repeated) and category alternation trials(i.e., trials on which the stimulus category is different fromthat of the preceding trial). Results of these studies haverevealed that perceptual mixing costs are relatively large onalternation trials and relatively small or even absent onrepetition trials (Los, 1997; Maljkovic & Nakayama, 1994).The dynamic character of these sequential effects is particu-larly hard to reconcile with a mental load account, whichconceives mixing costs as resulting from a difference instatic load between pure and mixed blocks.1
Elsewhere (Los, 1997), I confirmed these results for thestimulus categories used in the present research (see Fig-ure 1). Together, the results provide strong support for theexogenous nature of perceptual mixing costs. According tothis view, mixing costs are a derivative of switch costs,which are autonomous and escape the influence of anendogenous preparatory mechanism.
Mechanisms Explaining Mixing Costs
Although clearly constraining possible explanatory mecha-nisms, the finding that mixing costs have an exogenoussource is not diagnostic about the components of which amechanism should consist. As will become apparent later,
1 Note that this finding of sequential effects is also at leastslightly problematic for the endogenous view. To account for thisfinding, this view has to assume that participants adopt a strategy ofusing the event that occurred on the last trial as a point of referencefor current preparation. Although this view has been defended inthe literature (e.g., Kirby, 1980), empirical data generally supportthe opposite view that in a two-choice task, people are inclined toprepare for an alternation of events (i.e., the gambler's fallacy;Jarvik, 1951; Soetens, Boer, & Hueting, 1985).
PERCEPTUAL MIXING COSTS
the same components that are proposed to operate underendogenous control in one mechanism may serve underexogenous control in another mechanism and vice versa.Therefore, to answer the question of what is adjusted onalternation trials of mixed blocks, one should obtain addi-tional information.
One relevant source of information is that mixing costsare typically larger for the level of the variable that isresponded to faster in pure blocks. For instance, Van Durenand Sanders (1988) and Los (1994) had participants identifyintact and degraded digits in pure and mixed blocks of trialsand found that mixing costs were greater for intact stimuli(the "fast" level) than for degraded stimuli (the "slow"level). This pattern of asymmetric mixing costs is quitegeneral, because it holds for a wide range of variables (seeLos, 1996, for a review).
The finding of asymmetric mixing costs has been theimpetus for an important class of models referred to here as"criterion models" (e.g., Grice, 1968; Lupker, Brown, &Colombo, 1997; Strayer & Kramer, 1994a, 1994b). Basi-cally, these models postulate two components: an inputfunction and a response criterion. The input function de-scribes how information about the correct response gradu-ally accumulates in time upon the presentation of theimperative stimulus. As soon as the input function exceedsthe independently set response criterion, the participantemits a response. Within this general framework, criterionmodels may show considerable variations, mainly concern-ing the form of the input function and whether the criterionis set in the information domain or in the time domain. Whenthe criterion is set in the information domain, participantsemit a response as soon as a fixed amount of information hasaccumulated (e.g., Grice, 1968; McClelland, 1979; Ratcliff,1978; Strayer & Kramer, 1994a, 1994b); when set in thetime domain, the criterion has the characteristic of adeadline, causing participants to emit a best guess whenprocessing has not finished when the deadline expires (e.g.,Lupker et al., 1997; Oilman, 1966; Oilman & Billington,1972; Ratcliff, 1978). Another issue that differentiatesamong criterion models is how the setting of the criterion iscontrolled. In addition to the conventional idea that endog-enous factors, such as motivation and compliance withinstructions, determine the setting of the criterion, somemodels assume that the fine-tuning of the criterion isregulated by recent experiences (e.g., Strayer & Kramer,1994a, 1994b; Treisman & Williams, 1984). This suggeststhe possibility that the criterion is exogenously tuned, whichprecludes the rejection of criterion models on the basis of thefinding that mixing costs are exogenous in origin.
Disregarding possible variations, different criterion mod-els offer an essentially similar account of asymmetric mixingcosts. The central idea is that the response criterion isdifferentially set in pure and mixed blocks of trials. Forinstance, Lupker et al. (1997, Experiment 4) had participantsquickly read aloud words of a regular or an irregularorthography, either in pure or in mixed blocks of trials. Forthe regular words, they found mixing costs, in that thesewords were named faster in pure blocks than in mixedblocks. For the irregular words, they reported mixing
benefits, in that these words were named faster in mixedblocks than in pure blocks. To account for these results,Lupker et al. assumed that pure blocks enable the participantto optimally set the position of a processing deadline,because of relatively homogeneous finishing times of fastidentification processes for regular words on the one handand of slow identification processes for irregular words onthe other. In mixed blocks, however, finishing times are amixture of these fast and slow finishing processes, and so itis not clear where the deadline is optimally set. On the basisof their data, Lupker et al. argued that their participants useda deadline in between the deadlines used in pure blocks forregular and irregular words. As a result, regular wordsshowed mixing costs, because of a relatively sloppy dead-line in mixed blocks, whereas irregular words showedmixing benefits, because of a relatively sharp deadline inmixed blocks. In support of this view, Lupker et al. foundthat accuracy differences across their conditions tended toconform to the predictions of the speed-accuracy trade-off.
An alternative class of models that may account forasymmetric mixing costs is referred to here as "alternateprocessing models." Central to these models is the assump-tion that different levels of a variable call on differentprocessing (e.g., Allport et al., 1994; Stoffels, 1996; Sudevan& Taylor, 1987; Van Duren & Sanders, 1988). Again,considerable variations may be found among differentmodels of this class. One issue is the grain size of what isunderstood by different processing. A large grain size isembodied in models that distinguish only two different typesof processing, usually referred to as "processing routes"(e.g., Monsell, Patterson, Graham, Huges, & Milroy, 1992;Paap, Williams, & Johansen, 1992; Stoffels, 1996; VanDuren & Sanders, 1988). The grain size is much smaller inmodels proposing that highly differentiated processing de-rives from the specific adjustment of parameters (e.g.,Sanocki, 1987, 1988). Another issue is how the differentprocesses are controlled, analogous to the nature of criterioncontrol in criterion models. Some models focus exclusivelyon endogenous control and assume that the participant mayemphasize and deemphasize processes in preparation forfuture actions (e.g., Stoffels, 1996; Van Duren & Sanders,1988). Other models favor the role of exogenous controlinstead and assume that the mental apparatus is inert, whichimplies that processing efficiency depends on whetherrelevant processes have been activated shortly before (e.g.,Allport et al., 1994; Los, 1994).
An illustration of an alternate processing account is takenfrom the realm of task switching, where a consensus existsthat different task levels involve different processing. Allportet al. (1994, Experiment 5) used a Stroop task, in which twoexemplars (Stimulus 1 [SI] and Stimulus 2 [S2]) of incongru-ent color words (e.g., the word red printed in blue) weresequentially presented on each trial. Participants had toname aloud either the word (i.e., word reading) or the colorin which the word was printed (i.e., color naming). In pureblocks, participants had to execute the same task withrespect to SI and S2 (i.e., either word reading or colornaming), whereas in mixed blocks they had to execute bothtasks with respect to SI and S2 in a fixed order (i.e., either
LOS
word reading and color naming or color naming and wordreading). Regarding the time to respond to S2, the resultsshowed the typical pattern of asymmetric mixing costs:namely, sizable mixing costs for the fast word-reading taskbut no mixing costs for the slow color-naming task. Similarresults were found for error proportions (PEs): that is,mixing costs for the fast word-reading task but no costs forthe slow color-naming task.
In view of the absence of any trade-off of speed foraccuracy, these data are not readily accounted for in terms ofcriterion shifts between pure and mixed blocks. Instead, it ismore likely that the control of word-reading and color-naming processes causes greater problems in mixed blocksthan in pure blocks. Thus, from the perspective of endog-enous control, it could be suggested that pure blocks allowfor better preparation for word-reading or color-namingprocesses than mixed blocks allow for word-reading andcolor-naming processes. In this view, the asymmetry ofmixing costs is typically accounted for in terms of a"worst-case scenario" in mixed blocks, implying that partici-pants prepare optimally for the more difficult, or slower,event at the expense of the more easy, or fast, event (e.g.,Monsell et al., 1992; Stoffels, 1996; Van Duren & Sanders,1988). Allport et al. (1994) rejected an account based onendogenous control, however, because they found that theirmixing costs hardly decreased as the response stimulusinterval between SI and S2 increased from 20 to 1,100 ms,suggesting that participants were unable to exploit any extratime during this interval to enhance their preparatory statefor the anticipated forthcoming task. Instead, they proposedthat a task set is subject to inertia, which facilitates its reuseand hampers the shift to an alternative set. To explain theasymmetry of mixing costs, they assumed that inertia isstronger as a task set demands more control. In theoreticalcontributions to the Stroop task it is commonly assumed thatcolor naming is control demanding but that word readingproceeds automatically. Thus, the mental system mustovercome more inertia in switching from color naming toword reading than vice versa, leading to greater mixing costsfor word reading than for color naming, as observed.
The results reported by Lupker et al. (1997) on the onehand and by Allport et al. (1994) on the other clearlydemonstrate that both criterion shifts and alternate process-ing may contribute to mixing costs. Which one of these isdominant depends on the variable under investigation. In theperceptual domain, this matter awaits further examination.The major objective of this article, then, is to provideevidence that supports either the criterion-based account orthe alternate processing account of perceptual mixing costs.
The Experimental Approach
The straightforward approach to distinguishing between acriterion account and an alternate processing account ofmixing costs is to examine the effects of a speed-accuracytrade-off. Ideally, a criterion account predicts that anymixing costs for reaction time (RT) are compensated for bymixing benefits for PEs and vice versa, whereas alternateprocessing accounts do not predict the effects of a speed-
accuracy trade-off. This approach might be effective whenmixing costs are relatively sizable, so that there is room fordifferences in PEs to become manifest. For perceptualvariables, however, mixing costs are typically small, on theorder of 10-30 ms, and it is questionable whether reliableeffects of a speed-accuracy trade-off could be expected. Forinstance, Colombo and Tabossi (1992, Experiment 2) used adeadline method to vary speed stress, but they failed to findany accuracy decrement compensating for a 60-ms speedupof RT (see also Lupker et al., 1997, on this point).
In this article I take an alternative approach and explorethe stimulus conditions under which mixing costs occur. Forthis purpose, several stimulus categories were created andpairwise tested in the pure/mixed design. This enabled theanalysis of mixing costs as a function of variation along thestimulus dimensions of interest. As I show, this analysisreveals a great deal about possible mechanisms underlyingmixing costs.
General Method
Participants
Participants were male and female students from the VrijeUniversiteit with normal or corrected-to-normal vision. They werepaid for their services. Each participant took part in only oneexperiment.
Apparatus
An Olivetti PCS microcomputer equipped with a 386 SXprocessor controlled the experiment and recorded the data. Thestimuli were presented on an Olivetti video graphics array screen.The software package ERTS was used for composing the experimen-tal task, whereas the EXKEY interface between the computer andan external response panel allowed RTs to be measured to thenearest millisecond (Beringer, 1992). The response panel containeda 22 X 27 cm, 10° tilted plane on which four micros witches weremounted, each covered by a round response key 2.5 cm in diameter.The response keys were arranged as follows. Two outward upperkeys were horizontally aligned, 4 cm from the top of the plane andat a distance of 13 cm from each other. In between these keys, twoinward lower keys were horizontally aligned, 6.5 cm from the topof the plane and at a distance of 4.5 cm from each other.
Task
Participants were seated at a distance of about 50 cm from thescreen with their middle fingers resting on the outward, upperresponse keys and their index fingers on the inward, lower responsekeys. A trial started with the appearance of a visual warning signalat the center of the screen for 1,000 ms. This signal was a white plussign, 2.5 X 2.5 cm, subtending a visual angle of 2.9° X 2.9° given aviewing distance of 50 cm. The luminance of the signal was 7.0cd/m2 against a background of 0.5 cd/m2. A blank interval of 300ms separated the offset of the warning signal from the presentationof the imperative stimulus at the same location. The imperativestimulus represented a numerical value from the set (2, 3,4, 5}. Thevarious representations of these values are described in detailbelow. Participants responded by pressing the appropriate responsekey. The assignment of the numerical values to the response keyswas as follows: 2, left upper key; 3, left lower key; 4, right lower
PERCEPTUAL MIXING COSTS
key; and 5, right upper key. The imperative stimulus disappeared assoon as the participants responded or when a maximum time of1,500 ms had expired. A blank interval of 200 ms separated themoment of the offset of the imperative stimulus from the onset ofthe warning signal of the next trial.
Stimuli
All imperative stimuli used in the first four experiments of thepresent study were digits, representing the numerical values 2, 3,4,and 5 (see Figure 1). The size of the digits was 3.5 X 2.5 cm, andthey subtended a visual angle of 4.0° X 2.9° given a viewingdistance of 50 cm. The digits were surrounded either by arectangular frame of 5.5 X 4.5 cm, subtending a visual angle of6.3° X 5.2°, or by a round frame 5.7 cm in diameter, subtending avisual angle of 6.5°. The digits and their surrounding frames werecomposed of 42 white dots 0.5 mm in diameter with a luminance of7.0 cd/m2 against a black background of 0.5 cd/m2. Figure 1 showsan example of the digit 2 for each stimulus category used inExperiments 1-4. The main categories comprised intact stimuli(Figure la), noise-degraded stimuli (Figures Ib, Ic, and Id), andsegment-deleted stimuli (Figure le). Intact stimuli contained a digitcomposed of 14 dots and a surrounding rectangular frame of 28dots. The dots in the frame were adjacent, except for eight 0.5-mmopenings, two at each side of the frame (cf. Figure la). Noise-degraded and segment-deleted digits were derived from the intactprimitives. In the noise-degraded condition, dots were symmetri-cally deleted from the frame and pseudorandomly dispersed aroundthe digit. The number of noise dots was either 12 (Figure Ib) or 8(Figure Ic). In one condition, digits degraded by 12 noise dots weresurrounded by the round frame composed of 16 regularly distrib-uted dots (Figure Id). Finally, in the segment-deleted condition, 8dots were pseudorandomly deleted from the intact digit andinserted in the open spaces of the frame, yielding a complete frame(Figure le).
There were four different instances of each noise-degraded andsegment-deleted digit, constituted by different noise patterns andsegment deletions, respectively. Consequently, each noise-degraded and segment-deleted category (i.e., Figures Ib-le)comprised a set of 16 instances, constituted of four instances ofeach of four digits. The category of intact digits (i.e., Figure la)comprised a set of only four instances, one of each digit. The 12-and 8-dot noise patterns in the noise-degraded condition (FiguresIb and Ic) did not have any systematic overlap, but the noisepatterns of the 12-dot noise conditions that were surrounded by therectangular frame and the round frame (Figures Ib and Id) werealmost identical. In the latter case, only the noise dots that occurredat coordinates within the rectangular frame that had no analogwithin the round frame (i.e., at and near the corners of therectangular frame) were transferred to coordinates where this wasreversed (i.e., to the left and right sides of the circle). Furthermore,the noise-degraded and segment-deleted stimuli were composed insuch a way that the digits remained unambiguously identifiable.For the noise-degraded stimuli, this meant that no conspicuousalternative digit emerged from a combination of the digit at issueand some dots of the noise pattern. For the segment-deleted stimuli,this meant that the distinguishing features of each digit remainedrelatively unaffected.
Block Type
Blocks of trials varied in the proportion of occurrence of eitherof two stimulus categories. In pure blocks, only one categoryoccurred. In mixed blocks, the following proportions were used (a)
1:1, indicating an equal probability of occurrence of either categoryon each trial and (b) 1:3/3:1, indicating a 75% probability ofoccurrence of one category, the "frequent" category, and a 25%probability of occurrence of the other, "infrequent" category oneach trial.
Each task-relevant alternative (i.e., the value of the digit) had anequal (.25) probability of being presented on a trial across allblocks and experiments. To ensure that each (task-irrelevant)instance of each digit also had an equal probability of beingpresented across blocks, I used a balancing procedure in Experi-ments 2-4. In these experiments, categories of degraded stimuliwere used, of which each digit had four different instances. Thisenabled the creation of a set of 16 instances for each block, fromwhich the imperative stimuli were randomly drawn. In a pureblock, this set contained all 16 instances of the category at issue. Ina mixed-1:1 block, eight instances of either category were includedin the set, two instances of each digit. The remaining eightinstances of either category occurred in a complementary mixed-1:1 block, presented at another moment in the experiment. Ananalogous procedure was followed formixed-3:l blocks. Here a setwas created by including four instances of the infrequent category,one instance of each digit, and excluding four instances of thefrequent category, one instance of each digit. This set was adjustedfor subsequent mixed-3:1 blocks, such that across four blocks, eachinstance of the infrequent category was included precisely once andeach instance of the frequent category was excluded precisely once.Finally, for each mixed-3:1 block, a mixed-1:3 counterpart wascreated containing all complementary instances.
Design and Procedure
Stimulus category and block type were factorially combined asindependent variables, and the resulting conditions were counterbal-anced across participants. Individual RTs and PEs were thedependent variables.
Participants came to the laboratory for about 2 hr. As a firstintroduction to the stimuli, all instances of the degraded digitsoccurring in an experiment were presented on the screen in randomorder. Participants had to name aloud the values these stimulirepresented, and they were corrected by the experimenter ifnecessary. This acquaintance procedure continued until all alterna-tives could be correctly named. In the task instruction, speed andaccuracy were equally emphasized. Each block of trials waspreceded by a text on the screen for 10 s that informed participantswhich stimulus categories would occur in that block and in whatproportion. This block information was replaced by a text for 5 sthat summoned participants to position their fingers on the responsekeys, whereupon a block started. Participants received one or twoblocks of practice in each condition depending on the stability oftheir performance. During practice, participants received feedbackon RTs and PEs after each block of trials. After practice, there werefour (Experiments 1-4) or two (Experiment 5) consecutive experi-mental sessions. A session comprised all pure and mixed blocks,which were presented in alternation as much as possible. Thenumber of blocks presented within a session and the contents ofeach block are described in the Method sections of the specificexperiments. Sessions differed from each other only in the order inwhich the blocks were presented. Within a session, no breaks weregiven, nor did participants receive any feedback on their perfor-mance. Thus, the completion of a block was immediately followedby the block information preceding the next block. Betweensessions, breaks of about 5 min were given, during which theparticipant received feedback on mean RTs and mean PEs.
LOS
Data Analysis
Data were pooled across sessions. The first two trials of eachblock were discarded, as were RTs deriving from trials on whichthe participant did not respond correctly. Condition means ofRTs and PEs were subjected to separate analyses of variance(ANOVAs). The multivariate solution is reported whenever itdeviated from the univariate solution, with F values correspondingto Wilks's lambda (e.g., Stevens, 1992).
Experiment 1
Experiment 1 served to establish the phenomenon ofasymmetric mixing costs by replicating and extendingresults reported by Van Duren and Sanders (1988). VanDuren and Sanders presented intact and noise-degradeddigits for speeded identification in the pure/mixed designand observed mixing costs that were larger for Intact digitsthan for degraded digits. Apart from attempting to replicatethis result, I examined three issues. First, I examinedwhether the finding of asymmetric mixing costs generalizesto another context in which noise-degraded digits arereplaced by segment-deleted digits. Second, I assessed theeffects of the speed-accuracy trade-off, which Van Durenand Sanders failed to report. Third, I analyzed two types ofsequential effects: nominal and category. Regarding thenominal sequence, a trial was classified as a repetition whenthe digit on that trial was the same as that on the precedingtrial (regardless of the correspondence of the stimuluscategory) and as an alternation otherwise. Regarding thecategory sequence, a trial was classified as a repetition whenthe stimulus category on that trial was the same as that on thepreceding trial (regardless of the correspondence of thedigit) and as an alternation otherwise.
I examined category sequence to verify the exogenousnature of mixing costs, as discussed in the introduction. Iexamined nominal sequence for the following reason: It is awell-established finding that responding is faster to nominalrepetitions than to nominal alternations (e.g., Bertelson,1961; Campbell & Proctor, 1993; Kornblum, 1973; Pashler& Baylis, 1991). Pashler and Baylis (1991, Experiments 4and 5) demonstrated that the size of this effect is larger whenconsecutive stimuli are not only nominally the same but alsophysically the same (i.e., when the stimuli are identical). Forinstance, they found that identical letters showed a largeradvantage of repetition than letters that were nominally thesame but differed in case or color. An illustration of how thisdifferential effect might contribute to asymmetric mixingcosts can be found in the design used by Van Duren andSanders (1988). They used four alternative digits, with oneinstance for each intact digit and three instances for eachdegraded digit, constituted by different noise patterns. Itfollows that the probabilities of an identical repetition (i.e.,the repetition of an instance) in the pure intact, puredegraded, mixed intact, and mixed degraded conditionswere (1:4=) .25, [1:(4 X 3)=] .083, (.25/2=) .125, and(.083/2=) .0415, respectively. Therefore, the proportion ofidentical repetitions showed a greater drop from pure tomixed blocks for intact digits (from .25 to .125) than fordegraded digits (from .083 to .0415), which might well
underlie the greater mixing costs for intact than for degradeddigits. This plausible mechanism would considerably reducethe theoretical significance of asymmetric mixing costs andtherefore deserves closer examination.
Method
There were 24 participants, 12 in each of two groups. One groupwas presented with intact versus noise-degraded digits (Figure lavs. Figure Ib) in the pure/mixed design, whereas the other groupwas presented with intact versus segment-deleted digits (Figure lavs. Figure le). Each block contained 64 trials. In each of the fourconsecutive sessions, four blocks were presented, two pure blocksof either stimulus category and two randomly mixed blocks, bothwith a 1:1 ratio of occurrence of either stimulus category. Thenumber of instances occurring within blocks was not equatedacross blocks. That is, 4, (4 X 4=) 16, and (16 + 4=) 20 instancesoccurred in the pure intact, pure degraded, and mixed blocks,respectively. In all other aspects, the method was the same as thatdescribed in the General Method section.
Results
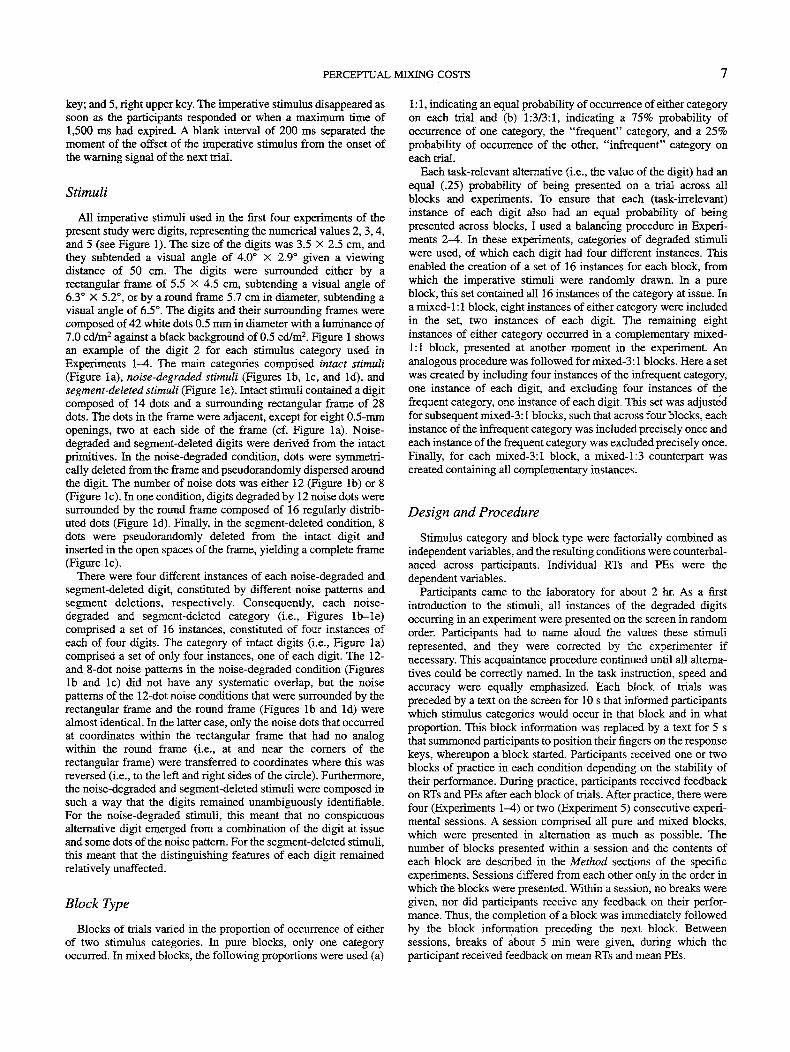
Figure 2 shows the mean RTs and mean PEs as a functionof the between-subjects factor of context (noise degraded orsegment deleted) and the within-subjects factors of stimuluscategory (intact or degraded), block type (pure or mixed),and nominal sequence (repetition or alternation). The ANOVAon RTs indicated that there were no significant effectsinvolving context. With respect to the within-subjects fac-tors, the ANOVA yielded the following results: Mixing costsoccurred in that responding was faster in pure blocks than inmixed blocks (526 vs. 536 ms), F(l, 22) = 13.43, MSB =398.03, p < .01. Furthermore, responses were faster forintact digits than for degraded digits (494 vs. 568 ms), F(l,22) = 152.20, MSB = 1,720.70, p < .001, and for nominalrepetitions than for nominal alternations (511 vs. 551 ms),F(l, 22) = 54.29, MSB = 1,430.24, p < .001. Two 2-wayinteractions were found. First, an interaction between theeffects of block type and nominal sequence, F(l, 22) =9.741, MSB = 173.11,;? < .01, indicated that mixing costswere greater for alternations (16 ms) than for repetitions(5 ms). Second, an interaction between the effects ofcategory and block type, F(\, 22) = 12.32, MSB = 325.07,p < .01, indicated that mixing costs were more pronouncedfor intact digits (20 ms) than for degraded digits (1 ms). Thisinteraction did not depend on nominal sequence (F < 1).When the ANOVA was conducted only on nominal alterna-tions, mixing costs were still much larger for intact digits(25 ms) than for degraded digits (8 ms), F(l, 22) = 11.33,MSE= 139.08, p<. 01.
The ANOVA performed on PEs showed that more errorsoccurred in the noise-degraded group than in the segment-deleted group (4.28% vs. 2.89%), F(l, 22) = 7.16, MSB =12.90, p < .05. Furthermore, more errors occurred fordegraded digits than for intact digits (4.61% vs. 2.56%),F(l, 22) = 23.35, MSB = 8.65, p < .001, as well as foralternations than for repetitions (3.98% vs. 3.18%), F(l,22) =-6.84, MSB = 4.48, p < .05. More errors occurred inmixed blocks than in pure blocks (3.83% vs. 3.33%), but
PERCEPTUAL MIXING COSTS
560
•5T 520
k 480
440<
E 5«o
UJ o
NOISE-DEGRADED SEGMENT-DELETED
degraded
intact
560
•5- 520E
480
degraded
intact
pure mixed
Block type
pure mixed
Block type
Figure 2. Mean reaction times (RTs) and mean error proportions in Experiment 1 as a function ofstimulus category, block type, and nominal sequence, presented separately for the noise-degradedand the segment-deleted groups. Solid lines represent nominal intertrial repetitions; dashed linesrepresent nominal intertrial alternations.
these mixing costs failed to reach significance, F(l, 22) =2.09, MSB = 5.64, p = .16. Finally, there was a significantfour-way interaction involving all factors, F(l, 22) = 5.47,MSB = 3.1S,p < .05. To examine this complex interaction, Iperformed separate ANOVAs on repetitions and alterna-tions, with block type and stimulus category as within-subject factors and context as a between-subjects factor. TheANOVA on alternations did not yield any significant interac-tion. The ANOVA on repetitions showed a significantthree-way interaction involving all factors, F(l, 22) = 6.48,MSB = 6.48 p < .05. This interaction indicated that forrepetitions in the noise-degraded group, mixing costs werestronger for intact digits (0.87%) than for degraded digits(—1.23%), whereas this was reversed for repetitions in thesegment-deleted group (-0.30% and 2.15% for intact anddegraded digits, respectively).
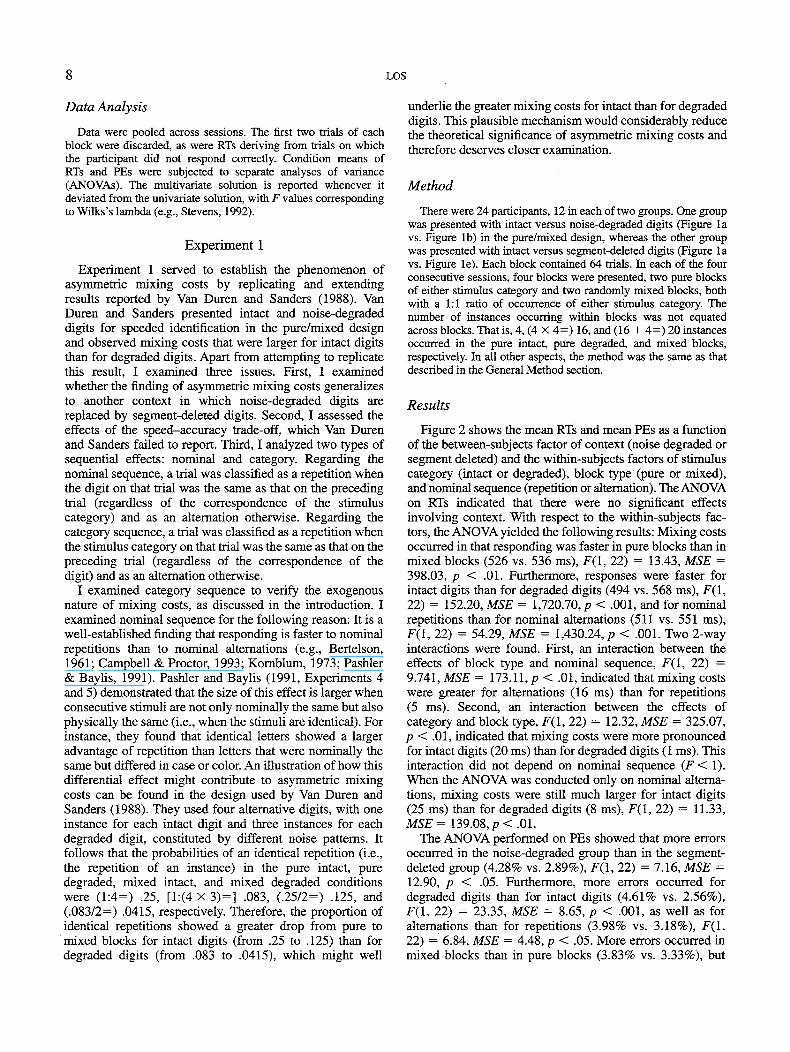
Finally, category sequential effects were analyzed for theintact category in mixed blocks. For this purpose, each trial nin mixed blocks on which an intact digit occurred wascategorized as follows: (a) second-order repetition, if thedigits on trials n — 1 and n — 2 were both intact; (b)first-order repetition, if the digit on trial n — 1 was intact andthat on trial n — 2 was degraded; (c) first-order alternation, ifthe digit on trial n — 1 was degraded and that on trial n - 2was intact; and (d) second-order alternation, if the digits ontrials n — 1 and n — 2 were both degraded. Figure 3 showsmean RTs and mean PEs as a function of category sequence.The negative and positive signs of the labels on the ;t-axisdenote alternation and repetition, respectively, whereas thedigit denotes the sequential order. An ANOVA on RTs, withcategory sequence as a within-subjects factor and degrada-tion type as a between-subjects factor, revealed that theeffect of category sequence was significant, F(3,20) = 4.04,p < .05. Polynomial analysis of this effect revealed a stronglinear component, F(l, 22) = 12.4, MSB = 3,364.09, p <.01, indicating that RTs gradually decreased from second-order alternation to second-order repetition. However, a
paired t test showed that RTs for intact stimuli in pure blockswere still significantly shorter than RTs for second-orderrepetitions in mixed blocks, ?(23) = 2.95, p < .01. AnANOVA on PEs, with the same factor structure as that onRTs, did not show any significant effect.
Discussion
Experiment 1 replicated the finding reported by VanDuren and Sanders (1988) of substantial mixing costs forintact stimuli when presented with degraded stimuli in thepure/mixed design. Three additional findings showed thatthese mixing costs were robust. First, these mixing costswere insensitive to the context constituted by the type ofdegradation. Second, they were not explicable in terms of a
"tn
1
gs.o
UJ
530
520
510
500
490
<
5
0
I
^N^—^ .̂
A
-
>
-2 -1 +1 +2 pure
Category sequence
Figure 3. Mean reaction times (RTs) and mean error proportionsfor intact digits in Experiment 1 as a function of the intertrialsequence of stimulus category. On the x-axis, —2 and —1 denotesecond- and first-order alternations, respectively, and +1 and +2denote first- and second-order repetitions, respectively.
10 LOS
speed-accuracy trade-off. Third, they were not attributableto a greater incidence of identical repetitions in pure blocksthan in mixed blocks. It even appeared that mixing costswere larger for nominal alternations than for nominalrepetitions. So, rather than causing mixing costs, nominalrepetitions seem to compensate for the detrimental effects ofmixing. In further agreement with the results of Van Durenand Sanders, the results of Experiment 1 show that mixingcosts for degraded stimuli were much smaller than those forintact stimuli. This asymmetry of mixing costs also provedrobust in view of its independence of degradation type andnominal sequence. The status of the asymmetry could bequestioned, though, on the grounds of possible differentialeffects of a speed-accuracy strategy for intact and degradedstimuli. In particular, in the group receiving the segment-deleted digits, mixing costs on PEs proved more pronouncedfor degraded digits than for intact digits, which mightbalance the opposite pattern of mixing costs observed onRTs. However, this effect was present only for nominalrepetitions, not for nominal alternations. This latter findingis important because mixing costs for nominal alternationsare the least liable to possible explanations beyond the scopeof the present article. For instance, they disconfirm thehypothesis suggested in the introduction to Experiment 1that the asymmetry of mixing costs reflects a strongerreduction of the proportion of identical repetitions for intactdigits than for degraded digits when going from pure tomixed blocks. From the perspective of the present study,then, Experiment 1 places the phenomenon of asymmetricmixing costs on a solid empirical footing.
Furthermore, Experiment 1 provides evidence that themixing costs for intact digits are at least partially exogenousin nature by showing an advantage of category repetitionsover category alternations. This effect was small and couldnot account for all the mixing costs because responding tointact digits in pure blocks was still faster than responding tointact digits preceded by two intact digits in mixed blocks.This could mean that the claim of an exclusively exogenousnature of mixing costs (Los, 1997; Maljkovic & Nakayama,1994) is not justified. It could also mean, though, thatperformance in mixed blocks settles only to the level of thatin pure blocks after an even longer sequence of categoryrepetitions. In fact, results obtained by Maljkovic andNakayama (1994) indicate that this may be the case. In theirExperiment 7, the unique color of a target stimulus in amultiple stimulus display was either fixed (pure blocks) orvariable (mixed blocks) across trials. They found thatperformance in mixed blocks gradually reached that inpure blocks across a sequence of about eight trials, duringwhich the color of the target remained constant. Similarly, itis also possible that in Experiment 1, a further reductionin RTs would have shown up for sequences of intactdigits beyond the second order, but a low reliability of theensuing data discouraged such an analysis. Still, togetherwith Los's (1997) observation that participants were inca-pable of reducing RTs in mixed blocks when they wereinformed on each trial of the forthcoming category, thepresent data suggest a major contribution of exogenouscontrol.
Experiment 2
Having shown the reality of asymmetric mixing costs forstimuli of different perceptual categories, I now explore theunderlying mechanism of this phenomenon. First, recallhow the data of Experiment 1 are accounted for in terms ofdeadline tuning. In pure blocks, the position of the deadlineis tuned in accordance with the time demands of either intactor degraded digits. On the basis of the data of Experiment 1,the deadline for degraded digits was used in mixed blocksbecause pronounced mixing costs were observed for intactdigits but hardly any for degraded digits. This position of thedeadline makes sense, because a sharper deadline may havecaused an unacceptable error rate for the slow category, thatis for degraded digits. Incidentally, the less pronouncedmixing costs for nominal repetitions than for nominalalternations also fit this explanation well. The idea is that inpure blocks, the deadline is suboptimally placed for repeti-tions, because its position is predominantly determined bythe slower alternations. Hence, a further relaxation of thedeadline attributable to adding digits of a different categorymay not be so detrimental for repetitions as for alternations.
Next, recall how an alternate processing account woulddeal with the results of Experiment 1. Such an accountassumes that at least partially different processing takesplace on degraded digits and intact digits. Thus, Van Durenand Sanders (1988) suggested that in addition to processesinvolved in identifying intact digits, noise-degraded digitsneed a "clean-up" process that is capable of separatingrelevant from irrelevant features. Similarly, for segment-deleted digits a "fill-in" process can be proposed that fills inlacking segments. I would like to emphasize, though, thatthese labels merely serve explanatory purposes and that it isnot essential that anything like cleaning up or filling in reallytake place on visual percepts. Rather, the central assumptionof the alternate processing view is that shifting from oneprocess to another takes time.2 Thus, the mixing costs ofExperiment 1 are attributed to frequent shifting in mixedblocks among "fast" processes for intact digits and addi-tional clean-up or fill-in processes for degraded digits.According to the mental inertia hypothesis (Allport et al.,1994; Los, 1996), the asymmetry of these mixing costsindicates that clean-up or fill-in processes demand morecontrol than the fast processes for intact digits, which makesshifting from degraded to intact digits harder than vice versa.Furthermore, the smaller mixing costs for nominal repeti-tions than for nominal alternations may indicate that (par-tially) reviewing the same digit compensates for the detrimen-tal effects of shifting.
The failure to find effects of a speed-accuracy trade-off inExperiment 1 might be taken as evidence against a criterion
2 As the higher order category sequential effects of Experiment 1indicate, a two-state model, implying that the perceptual system iseither optimally prepared for processing intact digits or forprocessing degraded digits, is probably too simple. A more realisticview is that the presentation of a degraded digit may interfereproactively across several trials with the processing of later intactdigits (cf. Allport et al., 1994).
PERCEPTUAL MIXING COSTS 11
account of mixing costs, but, as argued before, this may havebeen due to the small size of mixing costs or the unreliabilityof the accuracy measure. Experiment 2, therefore, provideda test for the proposed mechanisms whereby evidence isreflected in RTs. For this purpose, the noise-degraded andsegment-deleted digits were presented in the pure/mixeddesign. Because the data of Experiment 1 showed almostequal RTs for these stimulus categories, a single deadlineshould satisfy either category. Hence, according to a dead-line account, RTs for noise-degraded and segment-deleteddigits should be insensitive to manipulations of block typebecause these categories are subject to a single criterionacross blocks. By contrast, an alternate processing accountstill predicts the occurrence of mixing costs because noise-degraded and segment-deleted categories are assumed to callon different processing. In addition, in Experiment 2 Iexamined more generally than in Experiment 1 the influenceof different numbers of instances occurring in pure andmixed blocks. One group of participants (the "unbalanced"group) received in mixed blocks all noise-degraded andsegment-deleted instances, yielding twice as many instancesin mixed blocks than in pure blocks, whereas another group(the "balanced" group) received as many instances in mixedblocks as in pure blocks. If the number of instancessomehow contributes to mixing costs, the unbalanced groupshould show greater mixing costs than the balanced group.
Method
There were 40 participants, 20 in each of two groups. Oneparticipant exceeded a fixed maximal PE of 15% in severalconditions and was therefore replaced by another participant. Allparticipants received noise-degraded and segment-deleted digits(i.e., Figure Ib vs. Figure le) presented in the pure/mixed design.Each block contained 64 trials. In each of the four sessions, fourblocks were presented: two pure blocks of either category and twomixed blocks, both with a 1:1 ratio of occurrence of either category.The unbalanced group received (4 X 4=) 16 instances in each pureblock and (16+ 16=) 32 instances in each mixed block, whereasthe balanced group received 16 instances in all blocks using the
balancing procedure described in the General Method sectionunder Block Type. All other details were as described in the GeneralMethod section.
Results
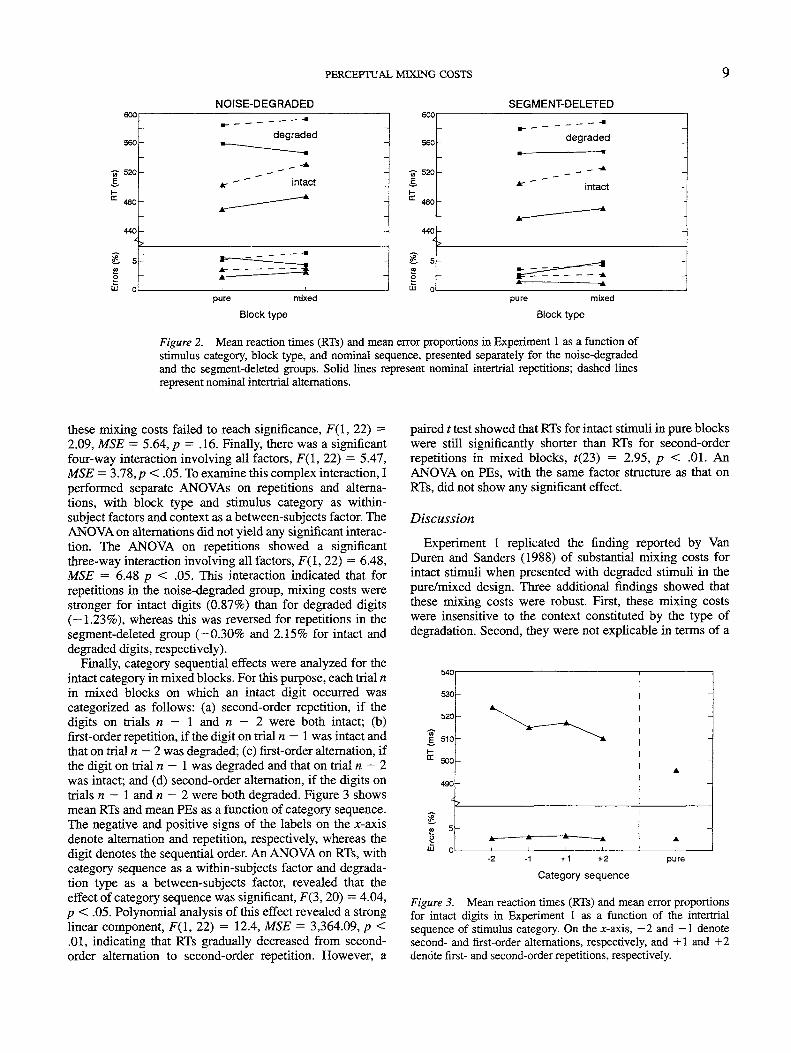
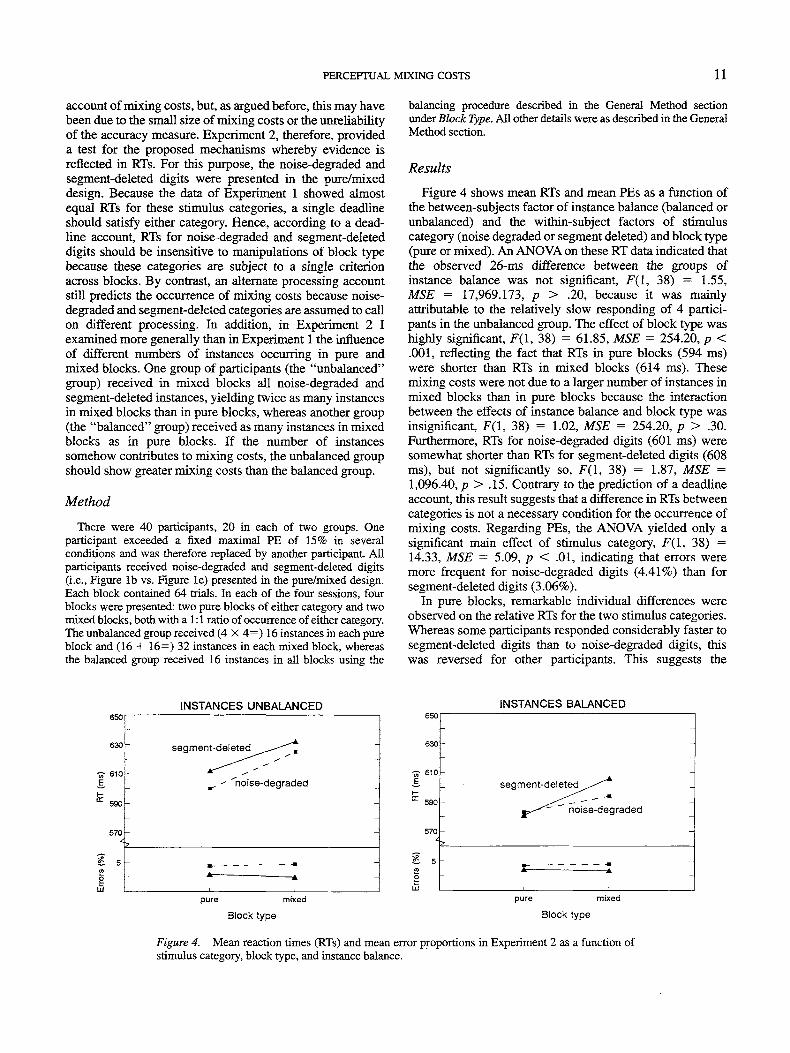
Figure 4 shows mean RTs and mean PEs as a function ofthe between-subjects factor of instance balance (balanced orunbalanced) and the within-subject factors of stimuluscategory (noise degraded or segment deleted) and block type(pure or mixed). An ANOVA on these RT data indicated thatthe observed 26-ms difference between the groups ofinstance balance was not significant, F(l, 38) = 1.55,MSB = 17,969.173, p > .20, because it was mainlyattributable to the relatively slow responding of 4 partici-pants in the unbalanced group. The effect of block type washighly significant, F(l, 38) = 61.85, MSB = 254.20, p <.001, reflecting the fact that RTs in pure blocks (594 ms)were shorter than RTs in mixed blocks (614 ms). Thesemixing costs were not due to a larger number of instances inmixed blocks than in pure blocks because the interactionbetween the effects of instance balance and block type wasinsignificant, F(l, 38) = 1.02, MSB = 254.20, p > .30.Furthermore, RTs for noise-degraded digits (601 ms) weresomewhat shorter than RTs for segment-deleted digits (608ms), but not significantly so, F(l, 38) = 1.87, MSB =1,096.40, p > .15. Contrary to the prediction of a deadlineaccount, this result suggests that a difference in RTs betweencategories is not a necessary condition for the occurrence ofmixing costs. Regarding PEs, the ANOVA yielded only asignificant main effect of stimulus category, F(l, 38) =14.33, MSB = 5.09, p < .01, indicating that errors weremore frequent for noise-degraded digits (4.41%) than forsegment-deleted digits (3.06%).
In pure blocks, remarkable individual differences wereobserved on the relative RTs for the two stimulus categories.Whereas some participants responded considerably faster tosegment-deleted digits than to noise-degraded digits, thiswas reversed for other participants. This suggests the
INSTANCES UNBALANCED
630
V 610
570-
segment-deleted
^ -- 'noise-degraded
pure mixed
Block type
INSTANCES BALANCED
«• 610segment-deleted
^^"~noise-degraded
pure mixed
Block type
Figure 4. Mean reaction times (RTs) and mean error proportions in Experiment 2 as a function ofstimulus category, block type, and instance balance.
12 LOS
100
80
|- 60
ooO) 20c"x5 0
-20
-40
segment-deleted
r = -.67
100
80
| 60
~ 40
O) 20
-20 -
-40
noise-degraded
r = .54
"-120 -80 -40 0 40 80 120 -120 -80 -40 0 40 80
Pure-block RT-difference (ms): segment-deleted - noise-degraded
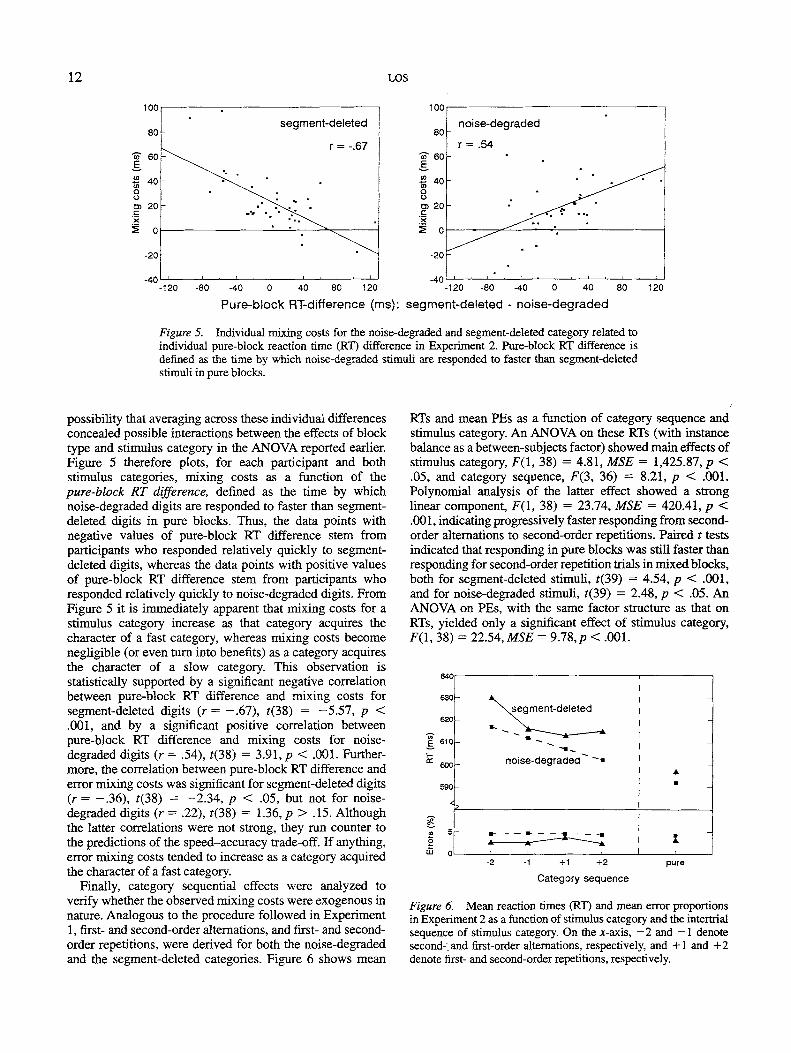
Figure 5. Individual mixing costs for the noise-degraded and segment-deleted category related toindividual pure-block reaction time (RT) difference in Experiment 2. Pure-block RT difference isdefined as the time by which noise-degraded stimuli are responded to faster than segment-deletedstimuli in pure blocks.
120
possibility that averaging across these individual differencesconcealed possible interactions between the effects of blocktype and stimulus category in the ANOVA reported earlier.Figure 5 therefore plots, for each participant and bothstimulus categories, mixing costs as a function of thepure-block RT difference, denned as the time by whichnoise-degraded digits are responded to faster than segment-deleted digits in pure blocks. Thus, the data points withnegative values of pure-block RT difference stem fromparticipants who responded relatively quickly to segment-deleted digits, whereas the data points with positive valuesof pure-block RT difference stem from participants whoresponded relatively quickly to noise-degraded digits. FromFigure 5 it is immediately apparent that mixing costs for astimulus category increase as that category acquires thecharacter of a fast category, whereas mixing costs becomenegligible (or even turn into benefits) as a category acquiresthe character of a slow category. This observation isstatistically supported by a significant negative correlationbetween pure-block RT difference and mixing costs forsegment-deleted digits (r = -.67), f(38) = -5.57, p <.001, and by a significant positive correlation betweenpure-block RT difference and mixing costs for noise-degraded digits (r = .54), f(38) = 3.91, p < .001. Further-more, the correlation between pure-block RT difference anderror mixing costs was significant for segment-deleted digits(r = -.36), f(38) = -2.34, p < .05, but not for noise-degraded digits (r = .22), r(38) = 1.36, p > .15. Althoughthe latter correlations were not strong, they ran counter tothe predictions of the speed-accuracy trade-off. If anything,error mixing costs tended to increase as a category acquiredthe character of a fast category.
Finally, category sequential effects were analyzed toverify whether the observed mixing costs were exogenous innature. Analogous to the procedure followed in Experiment1, first- and second-order alternations, and first- and second-order repetitions, were derived for both the noise-degradedand the segment-deleted categories. Figure 6 shows mean
RTs and mean PEs as a function of category sequence andstimulus category. An ANOVA on these RTs (with instancebalance as a between-subjects factor) showed main effects ofstimulus category, F(\, 38) = 4.81, MSE = 1,425.87, p <.05, and category sequence, F(3, 36) = 8.21, p < .001.Polynomial analysis of the latter effect showed a stronglinear component, F(l, 38) = 23.74, MSE = 420.41, p <.001, indicating progressively faster responding from second-order alternations to second-order repetitions. Paired t testsindicated that responding in pure blocks was still faster thanresponding for second-order repetition trials in mixed blocks,both for segment-deleted stimuli, f(39) = 4.54, p < .001,and for noise-degraded stimuli, r(39) = 2.48, p < .05. AnANOVA on PEs, with the same factor structure as that onRTs, yielded only a significant effect of stimulus category,F(l, 38) = 22.54, MSE = 9.78,p < .001.
630
620
1 61°
fe 600
590
<i> 5g
UJ 0
^segment-deleted
noise-degraded
-1 +1 +2
Category sequence
pure
Figure 6. Mean reaction times (RT) and mean error proportionsin Experiment 2 as a function of stimulus category and the intertrialsequence of stimulus category. On the jc-axis, —2 and —1 denotesecond-, and first-order alternations, respectively, and +1 and +2denote first- and second-order repetitions, respectively.
PERCEPTUAL MIXING COSTS 13
Discussion
The results of Experiment 2 show that the number ofinstances occurring in a block is probably not an importantdeterminant of mixing costs. In the unbalanced group, twiceas many instances occurred in mixed blocks as in pureblocks, but the mixing costs were hardly any larger than inthe balanced group, where the number of instances wasequated across blocks. This confirms the conclusion ofExperiment 1 that mixing costs constitute a robust phenom-enon that is not an artifact of a higher probability of instancerepetitions in pure blocks than in mixed blocks.
More important was the demonstration that clear mixingcosts occurred even though noise-degraded and segment-deleted digits showed about equal average RTs in pureblocks. I anticipated that this rinding would disconfirm adeadline account of mixing costs, reasoning that participantswould use the same deadline in mixed blocks as in pureblocks. This logic was weakened, however, by the unex-pected individual differences in the relative pure-block RTsfor noise-degraded and segment-deleted digits, due to whichmany participants featured a fast category and a slow one.Taking this into account, the pattern of mixing costs inExperiment 2 proved highly similar to that in Experiment 1:The fast stimulus category showed clear mixing costs, butthe slow category showed hardly any. As argued before, thispattern of data fits a deadline account quite well.
On closer examination, at least two observations argueagainst a deadline account, however. First, a criterionaccount predicts that mixing costs do not occur when twostimulus categories need about equal processing times inpure blocks. However, Figure 4 shows that the pure-blockRT differences close to 0 ms, say from -20 ms to 20 ms, arealmost without exception associated with mixing costsregardless of stimulus category. This is also expressed by thefact that the best-fitting regression lines in Figure 4 intersectthe JE-axis remotely from the origin. Second, there was aclear trend for mixing costs on RTs to be positivelycorrelated with mixing costs on accuracy. At the very least,this means that the extra processing time used by the fastcategory in mixed blocks relative to pure blocks could not beused to acquire a higher precision, as predicted by a criterionaccount.
Regarding category sequential effects, these results repli-cate those of Experiment 1, showing progressively fasterresponding with a decreasing order of category alternationand an increasing order of category repetition. As wasargued in the Discussion section in Experiment 1, this effectis consistent with the view that the observed mixing costshave an exogenous source.
Experiment 3
The results of Experiment 2 rendered some, but not yetconvincing, support for an alternate processing account ofthe mixing costs under examination. My goal in Experiment3 was to obtain more direct evidence. This experiment used3:1 and 1:3 proportions of occurrence of noise-degraded andsegment-deleted digits in mixed blocks, in addition to the
1:1 proportion used in Experiment 2. This resulted in fourconditions of category frequency: (a) 100% for eithercategory in pure blocks, (b) 75% for the frequent category inthe mixed-3:l and mixed-l:3 blocks, (c) 50% for eithercategory in the mixed-l:l blocks, and (d) 25% for theinfrequent category in the mixed-1:3 and mixed-3:l blocks.In effect, category frequency manipulated the intertrialvariability of a block.3 That is, as a category is presented lessfrequently in a block, the trials on which that categoryoccurs are more often preceded by trials on which the othercategory occurs. According to an alternate processing view,the present mixing costs are attributable to a time loss inswitching between processes such as cleaning up and fillingin. Therefore, this account predicts that mixing costs in-crease in accordance with the proportion of alternation trials.By contrast, accounts that deny the involvement of differen-tial processing do not so readily predict that RT is affectedby the proportion of alternation trials. Although Experiment2 showed that deadline tuning may account for mixing costswhen there is a difference in pure-block RT, there is noreason to predict a further relaxation of the deadline for amixed-3:1 block as compared with a mixed-1:1 block.
Method
There were 12 participants, 1 of whom failed to respond withinthe fixed maximum of 1,500 ms on at least 10% of the trials ofseveral conditions and was therefore replaced by another partici-pant. As in Experiment 2, noise-degraded and segment-deleteddigits (Figure Ib vs. Figure le) were presented in the pure/mixeddesign. Block type had four levels: pure, mixed-3:l, mixed-l:l,and mixed-1:3. In all blocks, 16 instances occurred with an equalprobability of being presented on each trial (cf. the instancebalancing procedure described in the General Method section).Participants were tested in four consecutive sessions, each compris-ing five blocks: two pure blocks of either stimulus category andthree mixed blocks with 3:1,1:1, and 1:3 proportions of occurrenceof either category. Each block contained 48 trials. In all otherrespects, the method adhered to the details described in the GeneralMethod section.
Results
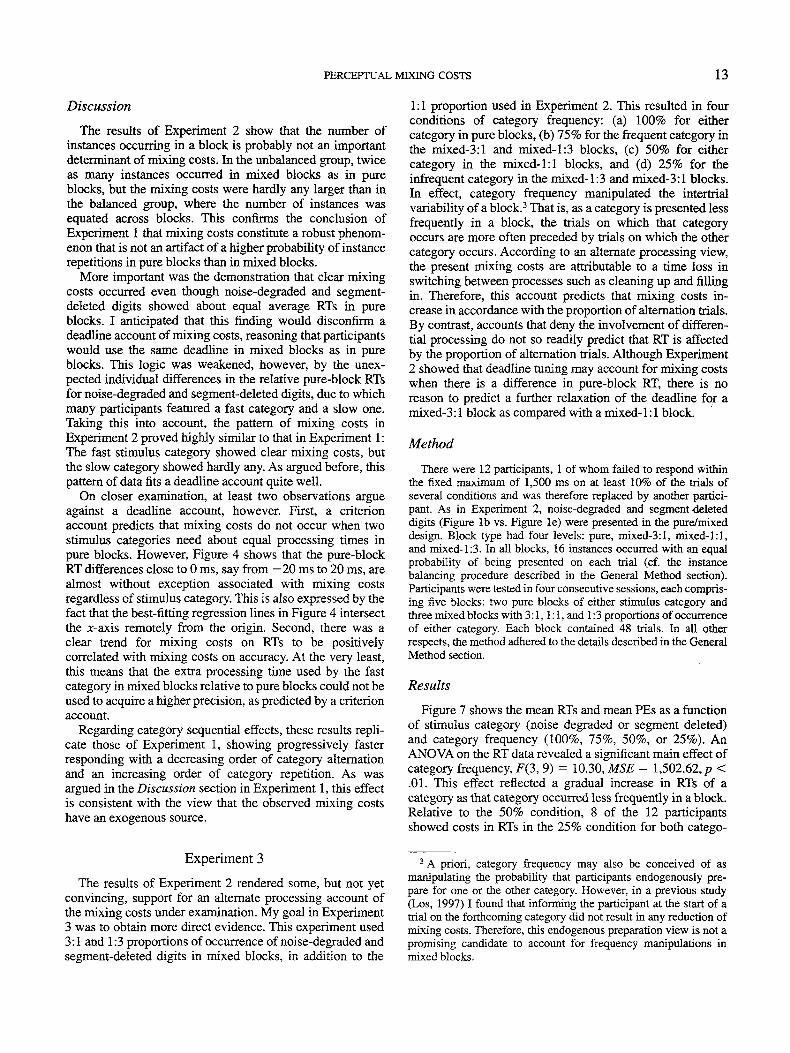
Figure 7 shows the mean RTs and mean PEs as a functionof stimulus category (noise degraded or segment deleted)and category frequency (100%, 75%, 50%, or 25%). AnANOVA on the RT data revealed a significant main effect ofcategory frequency, F(3, 9) = 10.30, MSB = 1,502.62, p <.01. This effect reflected a gradual increase in RTs of acategory as that category occurred less frequently in a block.Relative to the 50% condition, 8 of the 12 participantsshowed costs in RTs in the 25% condition for both catego-
3 A priori, category frequency may also be conceived of asmanipulating the probability that participants endogenously pre-pare for one or the other category. However, in a previous study(Los, 1997) I found that informing the participant at the start of atrial on the forthcoming category did not result in any reduction ofmixing costs. Therefore, this endogenous preparation view is not apromising candidate to account for frequency manipulations inmixed blocks.
14 LOS
segment-deleted.
560
noise-degraded
100 75 50 25
Category frequency (%)
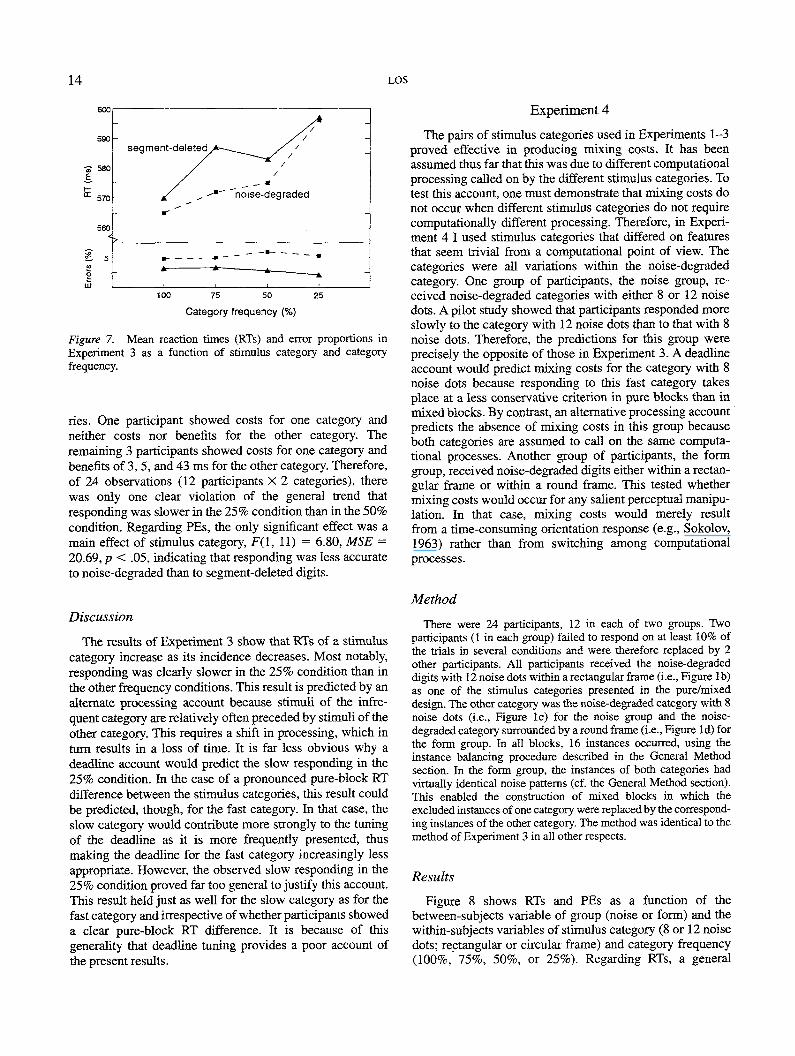
Figure 7. Mean reaction times (RTs) and error proportions inExperiment 3 as a function of stimulus category and categoryfrequency.
ries. One participant showed costs for one category andneither costs nor benefits for the other category. Theremaining 3 participants showed costs for one category andbenefits of 3, 5, and 43 ms for the other category. Therefore,of 24 observations (12 participants X 2 categories), therewas only one clear violation of the general trend thatresponding was slower in the 25% condition than in the 50%condition. Regarding PEs, the only significant effect was amain effect of stimulus category, F(l, 11) = 6.80, MSB =•20.69, p < .05, indicating that responding was less accurateto noise-degraded than to segment-deleted digits.
Discussion
The results of Experiment 3 show that RTs of a stimuluscategory increase as its incidence decreases. Most notably,responding was clearly slower in the 25% condition than inthe other frequency conditions. This result is predicted by analternate processing account because stimuli of the infre-quent category are relatively often preceded by stimuli of theother category. This requires a shift in processing, which inturn results in a loss of time. It is far less obvious why adeadline account would predict the slow responding in the25% condition. In the case of a pronounced pure-block RTdifference between the stimulus categories, this result couldbe predicted, though, for the fast category. In that case, theslow category would contribute more strongly to the tuningof the deadline as it is more frequently presented, thusmaking the deadline for the fast category increasingly lessappropriate. However, the observed slow responding in the25% condition proved far too general to justify this account.This result held just as well for the slow category as for thefast category and irrespective of whether participants showeda clear pure-block RT difference. It is because of thisgenerality that deadline tuning provides a poor account ofthe present results.
Experiment 4
The pairs of stimulus categories used in Experiments 1-3proved effective in producing mixing costs. It has beenassumed thus far that this was due to different computationalprocessing called on by the different stimulus categories. Totest this account, one must demonstrate that mixing costs donot occur when different stimulus categories do not requirecomputationally different processing. Therefore, in Experi-ment 4 I used stimulus categories that differed on featuresthat seem trivial from a computational point of view. Thecategories were all variations within the noise-degradedcategory. One group of participants, the noise group, re-ceived noise-degraded categories with either 8 or 12 noisedots. A pilot study showed that participants responded moreslowly to the category with 12 noise dots than to that with 8noise dots. Therefore, the predictions for this group wereprecisely the opposite of those in Experiment 3. A deadlineaccount would predict mixing costs for the category with 8noise dots because responding to this fast category takesplace at a less conservative criterion in pure blocks than inmixed blocks. By contrast, an alternative processing accountpredicts the absence of mixing costs in this group becauseboth categories are assumed to call on the same computa-tional processes. Another group of participants, the formgroup, received noise-degraded digits either within a rectan-gular frame or within a round frame. This tested whethermixing costs would occur for any salient perceptual manipu-lation. In that case, mixing costs would merely resultfrom a time-consuming orientation response (e.g., Sokolov,1963) rather than from switching among computationalprocesses.
Method
There were 24 participants, 12 in each of two groups. Twoparticipants (1 in each group) failed to respond on at least 10% ofthe trials in several conditions and were therefore replaced by 2other participants. All participants received the noise-degradeddigits with 12 noise dots within a rectangular frame (i.e., Figure Ib)as one of the stimulus categories presented in the pure/mixeddesign. The other category was the noise-degraded category with 8noise dots (i.e., Figure Ic) for the noise group and the noise-degraded category surrounded by a round frame (i.e., Figure Id) forthe form group. In all blocks, 16 instances occurred, using theinstance balancing procedure described in the General Methodsection. In the form group, the instances of both categories hadvirtually identical noise patterns (cf. the General Method section).This enabled the construction of mixed blocks in which theexcluded instances of one category were replaced by the correspond-ing instances of the other category. The method was identical to themethod of Experiment 3 in all other respects.
Results
Figure 8 shows RTs and PEs as a function of thebetween-subjects variable of group (noise or form) and thewithin-subjects variables of stimulus category (8 or 12 noisedots; rectangular or circular frame) and category frequency(100%, 75%, 50%, or 25%). Regarding RTs, a general
PERCEPTUAL MIXING COSTS 15
NOISE FORM
»- 560
540
520-
lii 0
12-dots
8-dots
u _^ __ rectangle
circle
*=-=-
100 75 50 25
Category frequency (%)
100 75 50 25
Category frequency (%)
Figure 8. Mean reaction times (RTs) and error proportions in Experiment 4 as a function of stim-ulus category and category frequency, presented separately for the noise group and the form group.
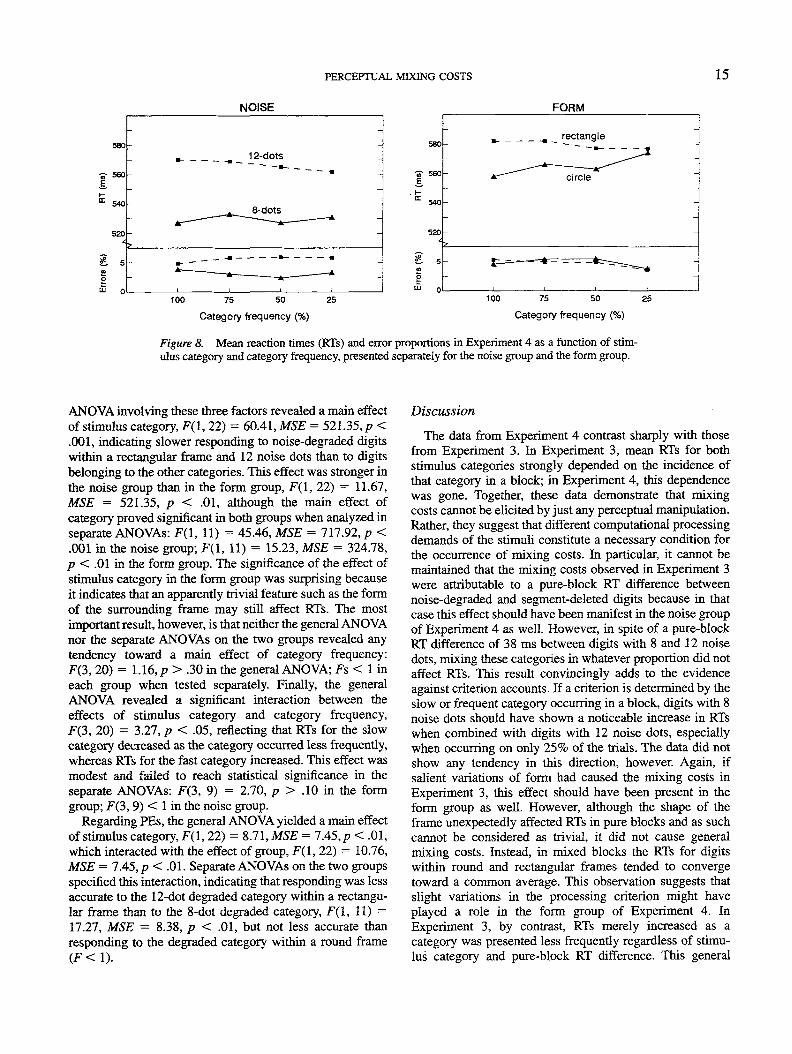
ANOVA involving these three factors revealed a main effectof stimulus category, F(l, 22) = 60.41, MSB = 521.35, p<.001, indicating slower responding to noise-degraded digitswithin a rectangular frame and 12 noise dots than to digitsbelonging to the other categories. This effect was stronger inthe noise group than in the form group, F(l, 22) = 11.67,MSE = 521.35, p < .01, although the main effect ofcategory proved significant in both groups when analyzed inseparate ANOVAs: F(l, 11) = 45.46, MSE = 717.92, p <.001 in the noise group; F(l, 11) = 15.23, MSE = 324.78,p < .01 in the form group. The significance of the effect ofstimulus category in the form group was surprising becauseit indicates that an apparently trivial feature such as the formof the surrounding frame may still affect RTs. The mostimportant result, however, is that neither the general ANOVAnor the separate ANOVAs on the two groups revealed anytendency toward a main effect of category frequency:F(3, 20) = 1.16, p > .30 in the general ANOVA; Fs < 1 ineach group when tested separately. Finally, the generalANOVA revealed a significant interaction between theeffects of stimulus category and category frequency,F(3, 20) = 3.27, p < .05, reflecting that RTs for the slowcategory decreased as the category occurred less frequently,whereas RTs for the fast category increased. This effect wasmodest and failed to reach statistical significance in theseparate ANOVAs: F(3, 9) = 2.70, p > .10 in the formgroup; F(3,9) < 1 in the noise group.
Regarding PEs, the general ANOVA yielded a main effectof stimulus category, F(l, 22) = &.71,MSE = 7.45, p < .01,which interacted with the effect of group, F(l, 22) = 10.76,MSE = 7.45, p < .01. Separate ANOVAs on the two groupsspecified this interaction, indicating that responding was lessaccurate to the 12-dot degraded category within a rectangu-lar frame than to the 8-dot degraded category, F(l, 11) =17.27, MSE = 8.38, p < .01, but not less accurate thanresponding to the degraded category within a round frame
Discussion
The data from Experiment 4 contrast sharply with thosefrom Experiment 3. In Experiment 3, mean RTs for bothstimulus categories strongly depended on the incidence ofthat category in a block; in Experiment 4, this dependencewas gone. Together, these data demonstrate that mixingcosts cannot be elicited by just any perceptual manipulation.Rather, they suggest that different computational processingdemands of the stimuli constitute a necessary condition forthe occurrence of mixing costs. In particular, it cannot bemaintained that the mixing costs observed in Experiment 3were attributable to a pure-block RT difference betweennoise-degraded and segment-deleted digits because in thatcase this effect should have been manifest in the noise groupof Experiment 4 as well. However, in spite of a pure-blockRT difference of 38 ms between digits with 8 and 12 noisedots, mixing these categories in whatever proportion did notaffect RTs. This result convincingly adds to the evidenceagainst criterion accounts. If a criterion is determined by theslow or frequent category occurring in a block, digits with 8noise dots should have shown a noticeable increase in RTswhen combined with digits with 12 noise dots, especiallywhen occurring on only 25% of the trials. The data did notshow any tendency in this direction, however. Again, ifsalient variations of form had caused the mixing costs inExperiment 3, this effect should have been present in theform group as well. However, although the shape of theframe unexpectedly affected RTs in pure blocks and as suchcannot be considered as trivial, it did not cause generalmixing costs. Instead, in mixed blocks the RTs for digitswithin round and rectangular frames tended to convergetoward a common average. This observation suggests thatslight variations in the processing criterion might haveplayed a role in the form group of Experiment 4. InExperiment 3, by contrast, RTs merely increased as acategory was presented less frequently regardless of stimu-lus category and pure-block RT difference. This general
16 LOS
increase is consistent with the prediction of an alternateprocessing account.
Experiment 5
So far, some evidence has been obtained that mixing costsare attributable to shifting among different computationalprocesses, but no effort has been invested to specify theseprocesses in any detail. My aim in Experiment 5 was to takea first step in this direction. The computational processesencountered have been provisionally described in terms ofcleaning up and filling in. Although not meant as a veritablespecification of the contents of these processes, thesedescriptions do indicate at which level the processes aresupposed to operate: not at an early level, where processingis bound to retinotopic coordinates, but at a later level, whereprocessing takes place on some base representation (Marr,1982; Ullman, 1984). As such, the computational processesmay be identified with visual routines, which have beenproposed to conduct a goal-directed analysis on the baserepresentation to enable object recognition (Trick & Pyly-shyn, 1994; Ullman, 1984). An alternative to this viewlocalizes the origin of mixing costs at an earlier stage ofvisual processing, inspired by the observation that thestimulus pairs that produced mixing costs in Experiments1-4 mutually differed in the local density of dots within thestimulus area. Thus, compared with intact digits, noise-degraded digits have relatively many dots within theirframes, whereas segment-deleted digits have relatively few.It could be, then, that at an early stage of processing thevisual system is sensitive to these density variations, suchthat a change in density requires adjustment.4
To contrast the competing hypotheses, in Experiment 5 Iintroduced a new stimulus category: dice (see Figure 9d).Dice were presented pairwise in the pure/mixed design withintact, noise-degraded, and segment-deleted digits. Dicehave relatively few dots within their frames and are, in that
(b)
•••••••••1
i •
(c)
Figure 9. Examples of the stimulus categories, depicted asnegatives, presented to the segment-deleted group (a, b, and d) andthe noise-degraded group (a, c, and d) in Experiment 5. The stimulidepict the numerical value 2 represented by an intact digit (a), asegment-deleted digit (b), a noise-degraded digit (c), and dice (d).
respect, more similar to segment-deleted digits than to intactdigits and more similar to intact digits than to noise-degraded digits. Therefore, the local density hypothesispredicts that dice will show increasing mixing costs whenthey are mixed with segment-deleted, intact, and noise-degraded digits, respectively. On the other hand, dice areintact, and in that respect are more similar to intact digitsthan to degraded digits. Therefore, the visual routineshypothesis predicts smaller mixing costs for dice whenpresented with intact digits than when presented with eithersegment-deleted or noise-degraded digits.
To reduce the likelihood that categories would be mutu-ally confused, I presented digits within round frames anddice dots in square frames. In particular, this measure wasmeant to provide a useful cue to distinguish dice fromsegment-deleted digits, which may be somewhat similarotherwise. To the degree that this measure is insufficient, themixing costs deriving from the combination of dice andnoise-degraded digits enable one to disambiguate someanticipated conflicting results. Specifically, if category con-fusion is an important cause of mixing costs when dice aremixed with segment-deleted digits, then much smallermixing costs are predicted when dice are mixed with thehighly dissimilar noise-degraded digits.
To summarize, in Experiment 5 I compared mixing costsfor dice when presented with segment-deleted digits, intactdigits, and noise-degraded digits. The local density hypoth-esis predicts an increase in mixing costs across these threeconditions, the confusion hypothesis a decrease, and thevisual routines hypothesis a U-shaped function.
Method
There were 30 participants, 15 in each of two groups. Bothgroups received three categories in the pure/mixed design: dice,intact digits, and degraded digits (see Figure 9). In the segment-deleted group, the degraded category comprised segment-deleteddigits, whereas in the noise-degraded group, it comprised noise-degraded digits. All digits were presented within a round framecomposed of 32 dots. This frame had a diameter of 5.7 cm andsubtended a visual angle of 6.5° given a viewing distance of 50 cm.The dice dots were presented within a square, 5 X 5 cm frame of 36dots that subtended a visual angle of 5.7°. Both digits and dicerepresented the numerical values 2, 3, 4, or 5, on which theparticipants based their response, as described in the introduction.
In mixed blocks, the presentation of the categories was pairwise,so that each category occurred in two of three different contexts:intact-degraded, intact-dice, and degraded-dice. To elicit sizablemixing costs, I used only mixed-3:l and mixed-l:3 blocks in eachcontext, in addition to the pure blocks. This yielded a total of nine
4 This view could be related to the property of the visual systemto analyze a percept into its constituent spatial frequencies at anearly stage of processing (e.g., Blakemore & Campbell, 1969;Ginsburg, 1986). Thus, noise-degraded digits may require thevisual system to discard the highest spatial frequencies, whereassegment-deleted digits may require the visual system to emphasizethe high spatial frequencies. In this view, then, mixing costs arecaused by shifts among spatial frequency channels. I am grateful toAndries Sanders for drawing my attention to this possibility.
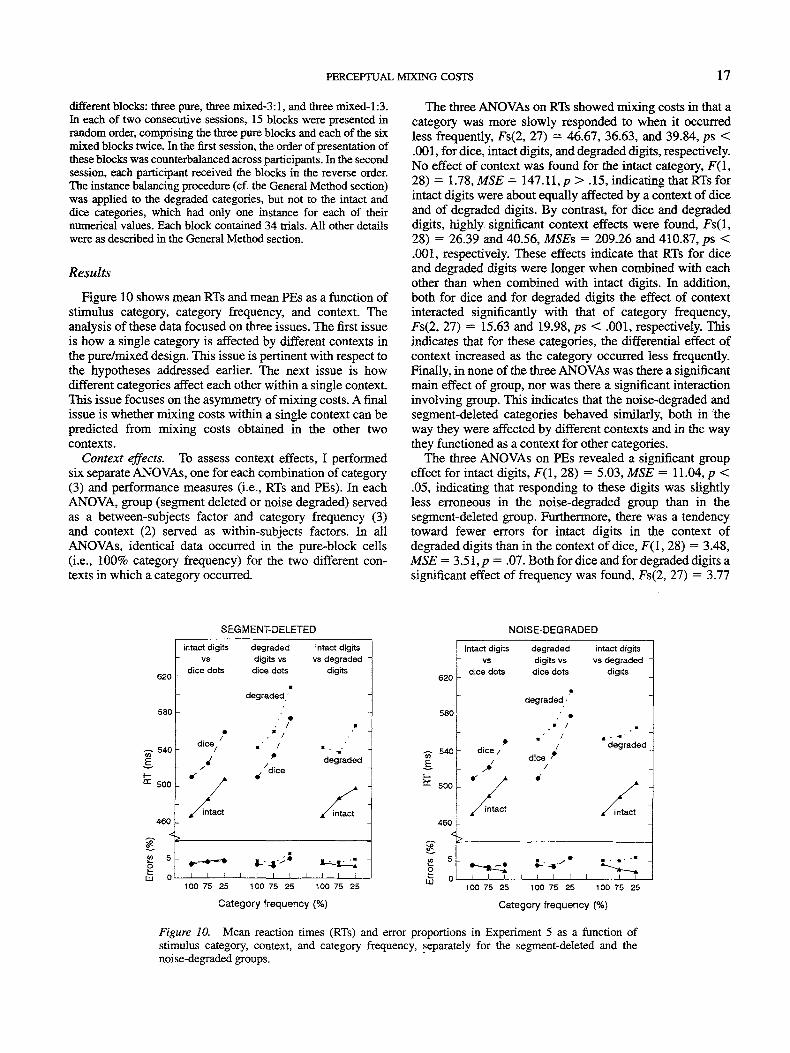
PERCEPTUAL MIXING COSTS 17
different blocks: three pure, three mixed-3:l, and three mixed-l:3.In each of two consecutive sessions, 15 blocks were presented inrandom order, comprising the three pure blocks and each of the sixmixed blocks twice. In the first session, the order of presentation ofthese blocks was counterbalanced across participants. In the secondsession, each participant received the blocks in the reverse order.The instance balancing procedure (cf. the General Method section)was applied to the degraded categories, but not to the intact anddice categories, which had only one instance for each of theirnumerical values. Each block contained 34 trials. All other detailswere as described in the General Method section.
Results
Figure 10 shows mean RTs and mean PEs as a function ofstimulus category, category frequency, and context. Theanalysis of these data focused on three issues. The first issueis how a single category is affected by different contexts inthe pure/mixed design. This issue is pertinent with respect tothe hypotheses addressed earlier. The next issue is howdifferent categories affect each other within a single context.This issue focuses on the asymmetry of mixing costs. A finalissue is whether mixing costs within a single context can bepredicted from mixing costs obtained in the other twocontexts.
Context effects. To assess context effects, I performedsix separate ANOVAs, one for each combination of category(3) and performance measures (i.e., RTs and PEs). In eachANOVA, group (segment deleted or noise degraded) servedas a between-subjects factor and category frequency (3)and context (2) served as within-subjects factors. In allANOVAs, identical data occurred in the pure-block cells(i.e., 100% category frequency) for the two different con-texts in which a category occurred.
The three ANOVAs on RTs showed mixing costs in that acategory was more slowly responded to when it occurredless frequently, Fs(2, 27) = 46.67, 36.63, and 39.84, ps <.001, for dice, intact digits, and degraded digits, respectively.No effect of context was found for the intact category, F(l,28) = 1.78, MSB = 147.11, p > .15, indicating that RTs forintact digits were about equally affected by a context of diceand of degraded digits. By contrast, for dice and degradeddigits, highly significant context effects were found, Fs(l,28) = 26.39 and 40.56, MSEs = 209.26 and 410.87, ps <.001, respectively. These effects indicate that RTs for diceand degraded digits were longer when combined with eachother than when combined with intact digits. In addition,both for dice and for degraded digits the effect of contextinteracted significantly with that of category frequency,Fs(2, 27) = 15.63 and 19.98, ps < .001, respectively. Thisindicates that for these categories, the differential effect ofcontext increased as the category occurred less frequently.Finally, in none of the three ANOVAs was there a significantmain effect of group, nor was there a significant interactioninvolving group. This indicates that the noise-degraded andsegment-deleted categories behaved similarly, both in theway they were affected by different contexts and in the waythey functioned as a context for other categories.
The three ANOVAs on PEs revealed a significant groupeffect for intact digits, F(l, 28) = 5.03, MSB = 11.04, p <.05, indicating that responding to these digits was slightlyless erroneous in the noise-degraded group than in thesegment-deleted group. Furthermore, there was a tendencytoward fewer errors for intact digits in the context ofdegraded digits than in the context of dice, F(l, 28) = 3.48,MSE =3.5l,p= .07. Both for dice and for degraded digits asignificant effect of frequency was found, Fs(2, 27) = 3.77
SEGMENT-DELETED NOISE-DEGRADED
620
580
^540
H<Z 500
460
<
w 5o
intact digits degraded intact digitsvs digits vs vs degraded -
dice dots dice dots digits
degraded '
'
. dice/ .' /
J degraded
/ X "- / / -/intact /intact
J>
1 1 1 1 1 1 1 I i 1 1
100 75 25 100 75 25 100 75 25
Category frequency {%)
620
580
--- 540
500
460 -
intact digits degraded intact digits
vs digits vs vs degradeddice dots dice dots digits
degraded •
. . .dice "
•=>
degraded
intact
100 75 25 100 75 25 100 75 25
Category frequency (%)
Figure 10. Mean reaction times (RTs) and error proportions in Experiment 5 as a function ofstimulus category, context, and category frequency, separately for the segment-deleted and thenoise-degraded groups.
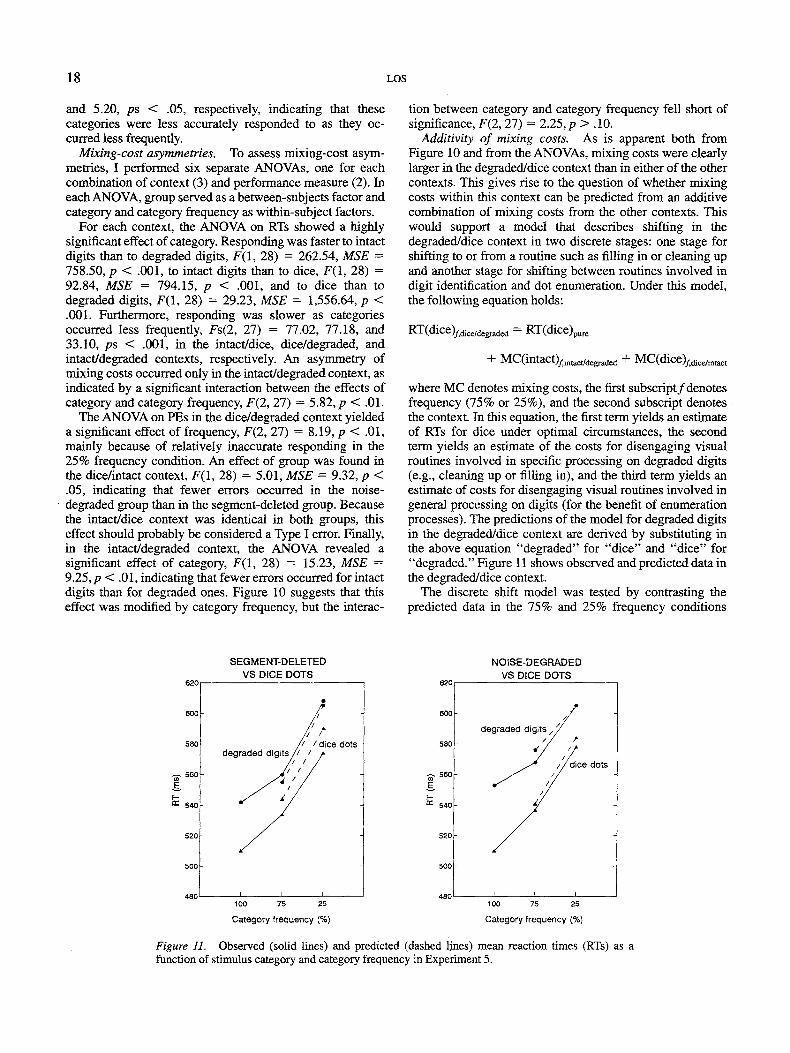
18 LOS
and 5.20, ps < .05, respectively, indicating that thesecategories were less accurately responded to as they oc-curred less frequently.
Mixing-cost asymmetries. To assess mixing-cost asym-metries, I performed six separate ANOVAs, one for eachcombination of context (3) and performance measure (2). Ineach ANOVA, group served as a between-subjects factor andcategory and category frequency as within-subject factors.
For each context, the ANOVA on RTs showed a highlysignificant effect of category. Responding was faster to intactdigits than to degraded digits, F(l, 28) = 262.54, MSB =758.50, p < .001, to intact digits than to dice, F(l, 28) =92.84, MSB = 794.15, p < .001, and to dice than todegraded digits, F(l, 28) = 29.23, MSB = 1,556.64, p <.001. Furthermore, responding was slower as categoriesoccurred less frequently, Fs(2, 27) = 77.02, 77.18, and33.10, ps < .001, in the intact/dice, dice/degraded, andintact/degraded contexts, respectively. An asymmetry ofmixing costs occurred only in the intact/degraded context, asindicated by a significant interaction between the effects ofcategory and category frequency, F(2, 27) = 5.82, p < .01.
The ANOVA on PEs in the dice/degraded context yieldeda significant effect of frequency, F(2, 27) = 8.19, p < .01,mainly because of relatively inaccurate responding in the25% frequency condition. An effect of group was found inthe dice/intact context, F(l, 28) = 5.01, MSB = 9.32, p <.05, indicating that fewer errors occurred in the noise-degraded group than in the segment-deleted group. Becausethe intact/dice context was identical in both groups, thiseffect should probably be considered a Type I error. Finally,in the intact/degraded context, the ANOVA revealed asignificant effect of category, F(l, 28) = 15.23, MSB =9.25, p < .01, indicating that fewer errors occurred for intactdigits than for degraded ones. Figure 10 suggests that thiseffect was modified by category frequency, but the interac-
tion between category and category frequency fell short ofsignificance, F(2, 27) = 2.25, p > .10.
Additivity of mixing costs. As is apparent both fromFigure 10 and from the ANOVAs, mixing costs were clearlylarger in the degraded/dice context than in either of the othercontexts. This gives rise to the question of whether mixingcosts within this context can be predicted from an additivecombination of mixing costs from the other contexts. Thiswould support a model that describes shifting in thedegraded/dice context in two discrete stages: one stage forshifting to or from a routine such as filling in or cleaning upand another stage for shifting between routines involved indigit identification and dot enumeration. Under this model,the following equation holds:
RT(dice)/>dice/degraded = RT(dice)pure
MC(dice)/idice/intact
where MC denotes mixing costs, the first subscript/denotesfrequency (75% or 25%), and the second subscript denotesthe context. In this equation, the first term yields an estimateof RTs for dice under optimal circumstances, the secondterm yields an estimate of the costs for disengaging visualroutines involved in specific processing on degraded digits(e.g., cleaning up or filling in), and the third term yields anestimate of costs for disengaging visual routines involved ingeneral processing on digits (for the benefit of enumerationprocesses). The predictions of the model for degraded digitsin the degraded/dice context are derived by substituting inthe above equation "degraded" for "dice" and "dice" for"degraded." Figure 11 shows observed and predicted data inthe degraded/dice context.
The discrete shift model was tested by contrasting thepredicted data in the 75% and 25% frequency conditions
SEGMENT-DELETEDVS DICE DOTS
580
-5-560
11 540
degraded/ dice dots -
100 75 25
Category frequency (%)
620
600
580
NOISE-DEGRADEDVS DICE DOTS
degraded digits
dice dots
100 75 25
Category frequency (%)
Figure 11. Observed (solid lines) and predicted (dashed lines) mean reaction times (RTs) as afunction of stimulus category and category frequency in Experiment 5.
PERCEPTUAL MIXING COSTS 19
with the data actually obtained in these conditions. Thecontrast fell far short of significance, F(l, 28) = 1.06,MSE = 1,185.07,;? > .30, indicating that the fit of the modelwas fairly good. In fact, as Figure 11 indicates, the onlyserious deviations from the model were found for dice whencombined with segment-deleted digits, where the predic-tions exceeded the mixing costs actually found. However,even here the deviation of the data from the predictionwas no more than a trend, F(l, 14) = 3.97, MSE = 2,499.78,p = .07.
Discussion
The most important result from Experiment 5 was thatmixing costs for dice were smaller in the context of intactdigits than in the context of degraded digits regardless of thetype of degradation. This result indicates that mixing costswere not caused by differences among the digit categories asto how the dots were distributed in the central region of thestimuli. If that were the case, the mixing costs for diceshould have shown an increase when mixed with segment-deleted digits, intact digits, and noise-degraded digits,respectively. Again, an account of mixing costs for dice interms of confusion is also highly unlikely because thesemixing costs were just as large when dice were combinedwith presumably highly similar segment-deleted digits aswhen dice were combined with presumably highly dissimi-lar noise-degraded digits. Note, finally, that the data are alsonot consistent with a criterion account. This is most obviousfor the mixing costs for degraded digits when combined withdice. Even though degraded digits showed the longest RTs inpure blocks, their mixing costs were among the largest inExperiment 5, even exceeding 50 ms in the 25% condition.This is a particularly strong example because the frequencyof occurrence of each instance of the degraded category wasas large in mixed blocks as in pure blocks because of theapplication of the instance balancing procedure.
By contrast, the results of Experiment 5 are generallyconsistent with the view that mixing costs proceed fromshifting among computational processes taking place on anestablished base representation. In the General Discussionsection I elaborate this view on the basis of the observedadditivity and asymmetry of mixing costs.
General Discussion
The objective of this research was to explore the nature ofprocessing underlying perceptual mixing costs. The ap-proach to this issue was to present several stimulus catego-ries pairwise into the pure/mixed design and to interpret thesize of the resulting mixing costs in light of the dimensionson which the categories mutually differed. This way it waspossible to segregate dimensions that were relevant for theoccurrence of mixing costs from those that were irrelevant.In turn, the relevant dimensions provided helpful insightsinto the mechanism underlying mixing costs.
By means of this approach, the present study providedconsiderable evidence against criterion models for percep-tual mixing costs. Conceiving of the criterion as a deadline,
such a model predicts mixing costs to the extent thatstimulus categories show different RTs in pure blocks (e.g.,Lupker et al., 1997). The present study showed, however,that a pure-block RT difference was neither a necessary nor asufficient condition for the occurrence of perceptual mixingcosts. In particular, Experiments 2 and 3 showed pronouncedmixing costs for categories that did not show a clearpure-block RT difference, whereas Experiment 4 showed anabsence of mixing costs for categories that showed a clearpure-block RT difference. These findings, together with theobservation that no shifts in the speed-accuracy trade-offoccurred, show that criterion models cannot adequatelyaccount for the present mixing costs.
One could object that these findings argue only against adeadline model (e.g., Lupker et al., 1997), not against acriterion model that assumes that the criterion is set in theinformation domain (e.g., Grice, 1968; Strayer & Kramer,1994a, 1994b). Under the latter model, the finding thatdifferent stimulus categories have equal pure-block RTs doesnot allow the inference that their response criteria occupiedequal positions in the information domain. Alternatively, arelatively slow accumulation of information over time maybe compensated for by the use of a less conservativecriterion, resulting in about equal RTs for categories in pureblocks, with a higher level of accuracy for the category withthe faster accumulation of information. This could have beenthe case in the present study, where in pure blocks segment-deleted digits were more accurately responded to thannoise-degraded digits, whereas their mean RTs were aboutequal. Still, it seems that this account cannot predict typicalpatterns of mixing costs. Consider two hypothetical cases, inwhich one category, A, has a lower rate of informationaccumulation over time but is responded to at a lessconservative criterion in pure blocks than the other category,B. First, on the basis of pure-block RTs, Category A turns outto be the slow category because its less conservativecriterion does not fully compensate for its lower accumula-tion rate. In this case, responding at a common criterion inmixed blocks should result in larger mixing costs for theslow Category A than for the fast Category B (cf. Grice,1968), which is opposite to the typical asymmetry of mixingcosts as presently found in Experiments 1,2, and 5. Second,Category A turns out to be the fast category because its loweraccumulation rate is overcompensated for by its less conser-vative criterion. This bizarre case correctly predicts theasymmetry of mixing costs, but it makes the prediction thatthe fast Category A becomes the slow category whenresponding occurs at a common criterion in mixed blocks. Ido not know of any research reporting this reversal.
At least two more findings from the literature argueagainst a criterion mechanism for perceptual mixing costs.First, Sanocki (1988, Experiment 2) used accuracy insteadof RT as a dependent measure in a task requiring theparticipant to identify letters occurring in briefly presentedstrings. In pure blocks, the type font of the letters wasinvariant across trials, but in mixed blocks, two highlydistinct type fonts alternated on successive trials. The resultsshowed that letter identification was less accurate in mixedblocks than in pure blocks. Because of the absence of speed
20 LOS
stress in this task, these mixing costs cannot be interpreted interms of a criterion model and therefore show reducedsensitivity of the perceptual system to font-specific character-istics in mixed blocks. Second, in a previous study (Los,1997) I manipulated the response criterion directly bycomparing a condition of high speed stress to a controlcondition of normal speed stress. I used the same task as inthe present study, which required participants to identifynoise-degraded and segment-deleted digits in pure, mixed-1:3, and mixed-3:l blocks. The results showed that mixingcosts were just as large under high speed stress as in thecontrol condition. Again, this result disconfirms the predic-tion of a criterion model that mixing costs critically dependon the position of the criterion, as has been shown by Strayerand Kramer (1994b, Experiment 5).
Instead, the results of the present study suggest thatperceptual mixing costs occur whenever stimulus categoriesrequire different computational processing. This view is notreadily supported because stimulus categories that seem torequire different computational processing typically alsodiffer on dimensions that seem trivial from a computationalpoint of view but may still contribute to mixing costs. Thepresent study aimed at isolating several of these dimensionsso as to assess their contribution to mixing costs. Thus, itwas possible to show that there was no contribution tomixing costs from dimensions such as the form of the framesurrounding the digit (Experiment 4), the distribution of dotsacross the stimulus area (Experiment 5), and global percep-tual similarity (Experiment 5). These findings, then, lendcredibility to an alternate processing view. In the final part ofthis article, I elaborate this view.
Mixing Costs and the Nature of Processing
Ullman (1984) envisaged a visual routine as an assemblyof elemental visual operations. Within the assembly, theelemental operations work together in a coordinate way asthey are applied to a base representation. The base represen-tation results from early visual processing in a fully bot-tom-up way, that is, in a way completely determined by theinput. "Visual routines are top-down applied to selected partsof the base representation, so as to obtain information onobjects and relations among objects for further analysis.
In the introduction to Experiment 5, I proposed thatperceptual mixing costs may reflect shifting among visualroutines. This proposal could be vindicated from a computa-tional point of view by an analysis of what it takes to identifya stimulus belonging to a certain category. Thus, there isgood reason to assume that digits and dice dots, the majorstimulus categories used in Experiment 5, call on differentvisual routines. Ullman (1984; see also Trick & Pylyshyn,1994) proposed a visual routine for the enumeration ofelements (e.g., dice dots) composed of two elementaloperations: "indexing," the process of shifting the process-ing focus to selected locations in the base representation, and"marking," the process of indicating those locations in thebase representation where the processing focus has beenbefore. In its simplest form, enumeration could then bedescribed as a process of initializing a counter at zero,
followed by the cycle of indexing an element, increasing thecounter by one, and marking the element, until all elementsare marked. For the identification of intact digits, theelemental operations of indexing and "boundary tracing"could make up a visual routine (Ullman, 1984). Boundarytracing is the process of tracking a contour in the baserepresentation. Ullman (1984, p. 144) suggested that thisprocess enables the decomposition of a digit at points ofmaxima in curvature. The resulting constituent strokes maythen enable identification. In a similar vein, different visualroutines may be proposed for the identification of intact,noise-degraded, and segment-deleted digits. It seems reason-able to assume that boundary tracing plays an important rolein the identification of all these types of digits. But whereasthis operation may directly enable the detection of the pointsof maxima in curvature for intact digits, for degraded digitsit may be necessary first to infer the correct contours fromamong several possibilities. For this purpose, additionalclean-up and fill-in operations should be postulated. Thisanalysis, then, suggests that perceptual mixing costs arecaused by switching among visual routines.5
A major challenge to this view comes from the additivityof perceptual mixing costs found in Experiment 5. Thisadditivity is particularly interesting because it was not foundby Allport et al. (1994) in the realm of task switching. Astraightforward interpretation of additive mixing costs isthat switching takes place during separate stages, analogousto the interpretation of additivity in the additive factorsmethod (Sternberg, 1969). Indeed, if switching amongvisual routines occurs during a single stage, it is not obviouswhy the mixing costs in the dice/degraded context would bethe sum of the mixing costs in the intact/degraded anddice/intact contexts.
An alternative view may therefore be preferred in whichswitching among processes called on by digits of differentperceptual categories occurs at a different stage of process-ing than switching among processes called on by digits anddice. For instance, the mixing costs in the dice/intact digitscontext may occur at the level of visual routines, as assumedbefore, but the mixing costs for different types of digits mayoccur at an earlier stage. In this respect it is interesting toconsider the principle of fine-tuning of processing param-eters, as embodied in Sanocki's (1987,1988, 1991) descrip-tions model. With it, Sanocki (1988) accounted for themixing costs he observed when participants identified letters
5 The feasibility of this view is called into question by theparadox that mixing costs are exogenous in origin (as pointed out inthe introduction and as moderately supported by Experiments 1 and2), whereas visual routines are applied to the base representation ina top-down way. In fact, in a previous study (Los, 1997) I foundthat participants cannot reduce their mixing costs when they areinformed at the start of a trial of the forthcoming stimulus category,which they should be capable of doing if mixing costs are mediatedby visual routines that are under complete top-down control. Theparadox may be resolved, however, by proposing that the top-downselection of a visual routine is possible only after a stimulus hasbeen presented, and not in the absence of stimulus material. Thisseems a viable possibility, even though it implies a limitation of thetop-down applicability of visual routines.
PERCEPTUAL MIXING COSTS 21
of different font types that were presented in the pure/mixeddesign. A font type can be characterized by certain abstractregularities, such as the ratio of letter bodies and theirterminating lines, which are shared by letters of the samefont type but are not likely to be shared by letters of differentfont types. The descriptions model makes use of theseregularities by saving font-specific parameters across differ-ent string presentations. These parameters enable an efficienttranslation from an actual letter instance to a "deep" letterrepresentation. If the font type of letter strings shifts fromone presentation to the next, the font-specific parametersmay fail to carry out the translation and require a time-consuming adjustment. In a similar vein, it could be thatswitching among digits of a different type of degradationalso requires time-consuming parameter adjustments. Whenthese adjustments occur at a different stage than switchingamong visual routines, their entailing switch costs may welladd to those of switching among visual routines.
From this discussion it should be clear that the precisenature of the processing required for the identification of thevarious stimulus categories cannot be established on thebasis of the present results. The additivity of mixing costs isintriguing, though, and may provide a valuable tool forfuture research once its interpretation derives from a firmlyestablished theory.
Mixing Costs and the Nature of Switching
I have collected evidence that perceptual mixing costs areattributable to switching among perceptual processes, but Ihave left untouched the important question of how theseprocesses interact. I would like to conclude by suggestingtwo principles that may govern this interaction. The firstprinciple is that within a given processing stage, theactivation of one process implies the suppression of otherprocesses. One way this could be achieved is by assumingthat the processes are organized in a competitive framework,realized by inhibitory mutual connections. So, a switch ofprocessing involves the activation of processes that havebeen inhibited shortly before. In line with this principle isthe observation that mixing costs are typically not evenlydistributed across the trials of mixed blocks but are morepronounced on alternation trials (as observed in Experiments1 and 2; see also Los, 1997; Maljkovic & Nakayama, 1994).The second principle holds that the period during which aprocess is active determines the amount of inhibitiontransferred to other processes of the same stage. That is, thelonger a process operates, the greater the suppression ofother processes. This principle provides the basis for explain-ing the asymmetry of mixing costs—namely, that mixingcosts are larger for the fast level of a variable than for theslow level (as observed in Experiments 1, 2, and 5; see alsoLos, 1996). The asymmetry follows directly from the secondprinciple because processes analyzing the slow level of avariable are assumed to be active during a longer period thanare processes analyzing the fast level. Thus, the system mustovercome more inhibition when switching from the slowlevel to the fast level than vice versa, thereby incurringstronger mixing costs when analyzing the fast level.6
There are at least two good reasons to prefer a mechanismbased on these two principles over an apparently simplermechanism assuming that a repeated routine takes advantageof residual activation left over from the previous trial. First,a mechanism emphasizing the virtue of residual activationhas difficulties explaining that mixing costs are generallylarger for the category that is responded to faster in pureblocks. In fact, such a mechanism would rather predict theopposite result, because the presumably elaborate computa-tions required for the slow category leave more room forimprovement than the simpler computations required for thefast category. Second, a mechanism emphasizing the virtueof residual activation would qualify the term mixing costs asbeing inferior to the alternative term blocking benefits. In aprevious study (Los, 1994), I addressed this issue by relatingthe effects of mixing costs to a baseline. In the experimentalcondition of that study, participants identified an intact ordegraded visual digit (S2) briefly after they identifiedanother intact or degraded visual digit (SI). In the baselinecondition, participants identified the same intact or degradedS2 as in the experimental condition but did so briefly afterthey identified the pitch of a nondegraded pure tone. Thus,on trials in the baseline condition, participants did notengage in visual processing before S2 was presented. Thedependent variable of interest was RT2, the time taken toidentify S2. Relative to the baseline, the results of theexperimental condition showed one clear deviation: RT2was relatively long when an intact S2 was preceded by adegraded SI. Thus, that study yielded powerful evidence formixing costs for the fast intact category and thereby clearlyfavors a mechanism based on the above two principles overa mechanism emphasizing the virtue of residual activation.
More generally, it may be noted that the functionalsignificance of the inhibitory control proposed here is tostabilize ongoing activity by preventing other activity frominterfering. This is not a new function, because it isembedded in several control mechanisms proposed for taskswitching (Allport et al., 1994), access to working memory(Hasher & Zacks, 1988), and interference in negativepriming paradigms (Driver & Tipper, 1989; Tipper, 1985).
6 This interpretation of asymmetric mixing costs may provide anadditional argument against the idea that switching in the context ofintact and degraded digits takes place at the level of visual routines.As was suggested in the previous section, the identification of anintact digit can be exhaustively described by a subset of elementaloperations involved in the identification of degraded digits. In thatcase, though, it is not clear how a mechanism of lateral inhibitioncan account for the mixing costs for intact digits without additionalassumptions because not one elemental operation involved in theidentification of intact digits is suppressed during the processing ofa degraded digit. I am grateful to Steven Yantis for bringing thispoint to my attention.
References
Allport, A., Styles, E. A., & Hsieh, S. (1994). Shifting intentionalset: Exploring the dynamic control of tasks. In C. UmiltA & M.Moscovitch (Eds.), Attention and performance XV: Conscious
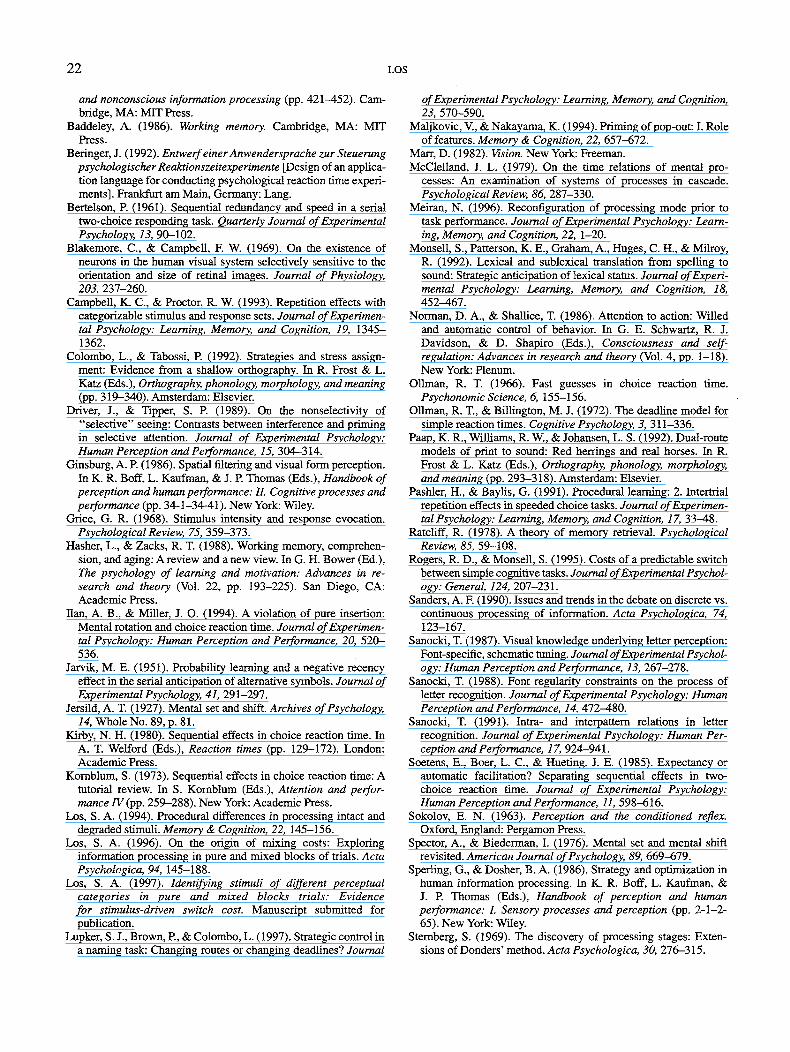
22 LOS
and nonconscious information processing (pp. 421-452). Cam-bridge, MA: MIT Press.
Baddeley, A. (1986). Working memory. Cambridge, MA: MITPress.
Beringer, J. (1992). Entwerf einer Anwendersprache zur SteuerungpsychologischerReaktionszeitexperimente [Design of an applica-tion language for conducting psychological reaction time experi-ments]. Frankfurt am Main, Germany: Lang.
Bertelson, P. (1961). Sequential redundancy and speed in a serialtwo-choice responding task. Quarterly Journal of ExperimentalPsychology, 13, 90-102.
Blakemore, C., & Campbell, F. W. (1969). On the existence ofneurons in the human visual system selectively sensitive to theorientation and size of retinal images. Journal of Physiology,203, 237-260.
Campbell, K. C., & Proctor, R. W. (1993). Repetition effects withcategorizable stimulus and response sets. Journal of Experimen-tal Psychology: Learning, Memory, and Cognition, 19, 1345-1362.
Colombo, L., & Tabossi, P. (1992). Strategies and stress assign-ment: Evidence from a shallow orthography. In R. Frost & L.Katz (Eds.), Orthography, phonology, morphology, and meaning(pp. 319-340). Amsterdam: Elsevier.
Driver, J., & Tipper, S. P. (1989). On the nonselectivity of"selective" seeing: Contrasts between interference and primingin selective attention. Journal of Experimental Psychology:Human Perception and Performance, 15, 304-314.
Ginsburg, A. P. (1986). Spatial filtering and visual form perception.In K. R. Boff, L. Kaufman, & J. P. Thomas (Eds.), Handbook ofperception and human performance: II. Cognitive processes andperformance (pp. 34-1-34-41). New York: Wiley.
Grice, G. R. (1968). Stimulus intensity and response evocation.Psychological Review, 75, 359-373.
Hasher, L., & Zacks, R. T. (1988). Working memory, comprehen-sion, and aging: A review and a new view. In G. H. Bower (Ed.),The psychology of learning and motivation: Advances in re-search and theory (Vol. 22, pp. 193-225). San Diego, CA:Academic Press.
Han, A. B., & Miller, J. O. (1994). A violation of pure insertion:Mental rotation and choice reaction time. Journal of Experimen-tal Psychology: Human Perception and Performance, 20, 520-536.
Jarvik, M. E. (1951). Probability learning and a negative recencyeffect in the serial anticipation of alternative symbols. Journal ofExperimental Psychology, 41, 291-297.
Jersild, A. T. (1927). Mental set and shift. Archives of Psychology,M Whole No. 89, p. 81.
Kirby, N. H. (1980). Sequential effects in choice reaction time. InA. T. Welford (Eds.), Reaction times (pp. 129-172). London:Academic Press.
Kornblum, S. (1973). Sequential effects in choice reaction time: Atutorial review. In S. Komblum (Eds.), Attention and perfor-mance IV (pp. 259-288). New York: Academic Press.
Los, S. A. (1994). Procedural differences in processing intact anddegraded stimuli. Memory & Cognition, 22, 145-156.
Los, S. A. (1996). On the origin of mixing costs: Exploringinformation processing in pure and mixed blocks of trials. ActaPsychologica, 94, 145-188.
Los, S. A. (1997). Identifying stimuli of different perceptualcategories in pure and mixed blocks trials: Evidencefor stimulus-driven switch cost. Manuscript submitted forpublication.
Lupker, S. J., Brown, P., & Colombo, L. (1997). Strategic control ina naming task: Changing routes or changing deadlines? Journal
of Experimental Psychology: Learning, Memory, and Cognition,23, 570-590.
Maljkovic, V., & Nakayama, K. (1994). Priming of pop-out: I. Roleof features. Memory & Cognition, 22, 657-672.
Marr, D. (1982). Vision. New York: Freeman.McClelland, J. L. (1979). On the time relations of mental pro-
cesses: An examination of systems of processes in cascade.Psychological Review, 86, 287-330.
Meiran, N. (1996). Reconfiguration of processing mode prior totask performance. Journal of Experimental Psychology: Learn-ing, Memory, and Cognition, 22, 1-20.
Monsell, S., Patterson, K. E., Graham, A., Huges, C. H., & Milroy,R. (1992). Lexical and sublexical translation from spelling tosound: Strategic anticipation of lexical status. Journal of Experi-mental Psychology: Learning, Memory, and Cognition, 18,452-467.
Norman, D. A., & Shallice, T. (1986). Attention to action: Willedand automatic control of behavior. In G. E. Schwartz, R. J.Davidson, & D. Shapiro (Eds.), Consciousness and self-regulation: Advances in research and theory (Vol. 4, pp. 1-18).New York: Plenum.
Oilman, R. T. (1966). Fast guesses in choice reaction time.Psychonomic Science, 6, 155-156.
Oilman, R. T., & Billington, M. J. (1972). The deadline model forsimple reaction times. Cognitive Psychology, 3, 311-336.
Paap, K. R., Williams, R. W, & Johansen, L. S. (1992). Dual-routemodels of print to sound: Red herrings and real horses. In R.Frost & L. Katz (Eds.), Orthography, phonology, morphology,and meaning (pp. 293-318). Amsterdam: Elsevier.
Pashler, H., & Baylis, G. (1991). Procedural learning: 2. Intertrialrepetition effects in speeded choice tasks. Journal of Experimen-tal Psychology: Learning, Memory, and Cognition, 17, 33^4-8.
Ratcliff, R. (1978). A theory of memory retrieval. PsychologicalReview, 85, 59-108.
Rogers, R. D., & Monsell, S. (1995). Costs of a predictable switchbetween simple cognitive tasks. Journal of Experimental Psychol-ogy: General, 124, 207-231.
Sanders, A. F. (1990). Issues and trends in the debate on discrete vs.continuous processing of information. Acta Psychologica, 74,123-167.
Sanocki, T. (1987). Visual knowledge underlying letter perception:Font-specific, schematic tuning. Journal of Experimental Psychol-ogy: Human Perception and Performance, 13, 267-278.
Sanocki, T. (1988). Font regularity constraints on the process ofletter recognition. Journal of Experimental Psychology: HumanPerception and Performance, 14, 472—480.
Sanocki, T. (1991). Intra- and interpattern relations in letterrecognition. Journal of Experimental Psychology: Human Per-ception and Performance, 17, 924-941.
Soetens, E., Boer, L. C., & Hueting, J. E. (1985). Expectancy orautomatic facilitation? Separating sequential effects in two-choice reaction time. Journal of Experimental Psychology:Human Perception and Performance, 11, 598-616.
Sokolov, E. N. (1963). Perception and the conditioned reflex.Oxford, England: Pergamon Press.
Spector, A., & Biederman, I. (1976). Mental set and mental shiftrevisited. American Journal of Psychology, 89, 669-679.
Sperling, G., & Dosher, B. A. (1986). Strategy and optimization inhuman information processing. In K. R. Boff, L. Kaufman, &J. P. Thomas (Eds.), Handbook of perception and humanperformance: I. Sensory processes and perception (pp. 2-1—2-65). New York: Wiley.
Stemberg, S. (1969). The discovery of processing stages: Exten-sions of Donders' method. Acta Psychologica, 30, 276-315.
PERCEPTUAL MIXING COSTS 23
Stevens, J. (1992). Applied multivariate statistics for the socialsciences. Hillsdale, NJ: Erlbaum.
Stoffels, E. J. (1996). Uncertainty and processing routes in theselection of a response: An S-R compatibility study. ActaPsychologica, 94, 227-252.
Strayer, D. L., & Kramer, A. F. (1994a). Strategies and automatic-ity: I. Basic findings and conceptual framework. Journal ofExperimental Psychology: Learning, Memory, and Cognition,20, 318-341.
Strayer, D. L., & Kramer, A. F. (1994b). Strategies and automatic-ity: II. Dynamic aspects of strategy adjustment. Journal ofExperimental Psychology: Learning, Memory, and Cognition,20, 342-365.
Sudevan, P., & Taylor, D. A. (1987). The cuing and priming ofcognitive operations. Journal of Experimental Psychology:Human Perception and Performance, 13, 89-103.
Tipper, S. P. (1985). The negative priming effect: Inhibitory effects
of ignored primes. Quarterly Journal of Experimental Psychol-ogy: Human Experimental Psychology, 37A, 591-611.
Treisman, M, & Williams, T. C. (1984). A theory of criterionsetting with an application to sequential dependencies. Psycho-logical Review, 91, 68-111.
Trick, L. M., & Pylyshyn, Z. W. (1994). Why are small and largenumbers enumerated differently? A limited-capacity preattentivestage in vision. Psychological Review, 101, 80-102.
Ullman, S. (1984). Visual routines. Cognition, 18, 97-159.Van Duren, L. L., & Sanders, A. F. (1988). On the robustness of the
additive factors stage structure in blocked and mixed choicereaction designs. Acta Psychologica, 69, 83-94.
Received November 23,1993Revision received September 23,1997
Accepted October 27,1997
New Editors Appointed, 2000-2005
The Publications and Communications Board of the American Psychological Associa-tion announces the appointment of three new editors for 6-year terms beginning in 2000.
As of January 1,1999, manuscripts should be directed as follows:
• For Experimental and Clinical Psychopharmacology, submit manuscripts toWarren K. Bickel, PhD, Department of Psychiatry, University of Vermont, 38Fletcher Place, Burlington, VT 05401-1419.
• For the Journal of Counseling Psychology, submit manuscripts to Jo-Ida C.Hansen, PhD, Department of Psychology, University of Minnesota, 75 EastRiver Road, Minneapolis, MN 55455-0344.
• For the Journal of Experimental Psychology: Human Perception and Perfor-mance, submit manuscripts to David A. Rosenbaum, PhD, Department of Psy-chology, Pennsylvania State University, 642 Moore Building, University Park,PA 16802-3104.
Manuscript submission patterns make the precise date of completion of the 1999 volumesuncertain. Current editors, Charles R. Schuster, PhD; Clara E. Hill, PhD; and Thomas H.Carr, PhD, respectively, will receive and consider manuscripts through December 31,1998. Should 1999 volumes be completed before that date, manuscripts will be redirectedto the new editors for consideration in 2000 volumes.