ICE CREAM JAMES Co HAMILTON MASTER OF SCIENCE
50
A CONSUMER PREFERENCE STUDY OF VARIOUS VANILLA FLAVORS1AND ! OF TEXTURES I~ ICE CREAM By JAMES Co HAMILTON q Bachelor of Science Oklahoma State University Stillwater, Oklahoma 1943 Submitted to the faculty of the Graduate School of the Oklahoma State University in partial fulfillment of the requirements for the degree of MASTER OF SCIENCE ' May, 1961
-
Upload
khangminh22 -
Category
Documents
-
view
3 -
download
0
Transcript of ICE CREAM JAMES Co HAMILTON MASTER OF SCIENCE

A CONSUMER PREFERENCE STUDY OF
VARIOUS VANILLA FLAVORS1AND !
OF TEXTURES I~ ICE CREAM
By
JAMES Co HAMILTON q
Bachelor of Science
Oklahoma State University
Stillwater, Oklahoma
1943
Submitted to the faculty of the Graduate School of the Oklahoma State University
in partial fulfillment of the requirements for the degree of MASTER OF SCIENCE
' May, 1961

A CONSUMER PREFERENCE STUDY OF VARIOUS VANILLA
FLAVORS AND OF TEXTURES IN ICE CREAM
Thesis Approved:
Dean of the Graduate School
ii

TABLE OF CONTENTS
Chapter
I. INTRODUCTION o o o o e 0 0 0 0 0 e O O 4t
II. REVIEW OF LITERATURE. . . . D00000
. . • • 0
OKU\HOMA STATE UNIVERSITY
LIBRARY
JAN 2 1962
Page
0 • 1
eooooeo 2
III. EXPERIMENTAL PROCEDURE ••• o o G • o e o o ooooeoo 6
6 6 8 8
A. Preparation of Samples . • • • . • • • 1. Samples for Flavor Preference • • • 2. Samples for Texture Preference . •
B. Selection of Respondents 0 • . • • • c. Examination Procedure • • • • • • . • • 1. First Flavor Preference Survey • • 2. Second Flavor Survey and Texture
Preference Survey • • • 0 • • 0 . D. Determination of Consumer Preferences •
1. Consumer Score ., . 000,~0a\O""Gi">0"'0'"0,_0
2. Preference Significance • 0 • • • 0
• • • • . • 0 • • . • 0 • • . . . • . • . • 0 • • 0 • • . • • 0 • 0
• • 0 0 . o-,o~o~o~o
• 0 • • •
10 10
10 13 13 13
IV. EXPERIMENTAL RESULTS AND DI,~USSION ooooeooeooo 15
A. Consumer Preference for Various Types of Vanilla Flavors in Ice Cream • • • • • • • • • • • • • 15
1. First Survey • • • • • • • • • • • • • • • • 15 2. Second Survey • • • • • • • • • • • • • 17
B. Reasons Given for Preference for Types of Vanilla Flavored Ice Cream by Consumers. • • • • • • • 25
C. Preference for Various Textures in Vanilla Flavored Ice Cream • • • • • • • • • • • • • • 28
D. Reasons Given for Preference for Textures • • • • 34 E. Consumers 1 Opinions Regarding Frozen Desserts • • 37
v. smtHARY AND C ONO LU SION s o o o e o o • o o o e ~ o o o o 6 41
VI. LITERATURE CITED o • e o o o o t o o o • o o o e e o e o 44
4:81.132
iH

Lisr OF TABLES
Table Page
I. Preference for Various Types of Vanilla Flavors in Ice Cream by Adults and Juveniles in First Survey • • • 16
IL Preference for Various Types of Vanilla Flavors in Ice Cream by All Respondents in First Survey • 0 • • 0 • 18
III. Preference for Various Types of Vanilla Flavors in Ice Cream by Juveniles in Second Survey • • • • • • 0 • 19
IV. Preference for Various Types of Vanilla Flavors in Ice Cream by Adults in Second Survey • • • • • • • 0 • • 21
v. Preference for Various Types of Vanilla Flavors in Ice Cream by All Respondents in Second furvey • • • • • 2.3
VI. Reasons Given for Preference for Various Types of Vanilla Flavored Ic~ Cream by Consumers • • • • • • • • 26
VII. Preference for Various Textures in Ice Cream by Juveniles 0 • • • • • • • 0 • • • • • • • 0 • • • • • • 29
VIII. Preference for Various Textures in Ice Cream by Adults • 0 • • • • 0 • 0 0 • • 0 • • 0 • 0 • • • 0 0 0 • .30
IX. Preference for Various Textures in Ice Cream by All Respondents . • • 0 • • 0 • • • . • • 0 0 0 • • 0 • .32
X. Reasons Given for Preferences for Textures in Ice Cream by Consumers ••••••••• • • eeoeoe .35
iv

ACKNOWLEDGEMENT
The author wishes to express his sincere appreciation to:
Dr. Harold C. Olson, for his assistance, advice and encouragement in
the development of this study and the preparation of this report.
Mr. C. N. Dotson and Mr. B •. L. Stewart, of the Glencliff Dairy
Products Company, for their cooperation and assistance in storing and
caring for the ice cream samples used in this study. Mr. W. Leroy
Tharp and Mrs. Myra May for their cooperation and assistance in the
Tulsa Public School survey. The Beck Vanilla Products Company for
furnishing the flavoring materials for the vanilla flavor surveys.
My wife, Willie Belle Hamilton, and my son, James Paul, for their
moral support, patience, encouragement and understanding during the
development and preparation of this report.
V

INTRODUCTION
Consumer preference surveys used to determine the likes and dis
likes of the public are not new. In commercial practice the decision
as to the acceptability of a particular flavor of ice cream may be left
to one individual without recognition that this opinion may not be in
accord with the opinions of a cross section of the consuming public.
Ice cream is popular with people of all ages. Nationally, vanilla
flavored ice cream makes up about half of the total production of all
ice cream. Pure vanilla extract is widely used for flavoring by many
ice cream manufacturers and is considered by most experts to be the
best. A considerable amount of pure vanilla extract fortified with
vanillin is being used by ice cream manufacturers and artificial van
illa flavoring is also being used. The cost p~~ g~llon: fb~: flavoring_
ice cream with pure vanilla extract is greater than with either the
fortified or the artificial product.
Very little research has been done on consumer preferences for
various vanilla flavors and for textures of ice cream. This study was
condu-cted to determine consam-er pr·eferen-e-es ··fur (1) ·various typ-es of
vanilla flavoring in ice cream and (2) various textures of ice cream.
1

REVIEW OF LITERATURE
, Ver-y little information can be found concerning consumer preference
studies on textures and types of flavors in vanilla ice cream. Woods
(9) stated that ice cream consumption doubled in the 1920 1s and again in
the 1940 1s. Since 1950, there ~as been a slight increase in the amount
of ice cream consumed practically every year. She further states that
over 200 different flavors of ice cream are in use today, but that van-
illa is by far the most popular flavor. She points out that in 1956,
52 percent of all ice cream sold was vanilla, with chocolate flavor
rating second and strawberry third.
The .American Dairy Association (1) reported, in a survey of public
attitudes and uses of dairy products, th~t ice cream has wide usage
among all age groups, all income groups an~ in all sections of the coun-'
try. This public attitudes survey covered 3,915 interviews with indi=·
viduals 15 years and older and 695 interviews with children 6 to 14
years of age. The survey shows that children eat ice cream more often
than do adults, and that the amount of ice cream kept on hand increases
with increases in income. The survey revealed that an estimated 47,000 1
000 Americans eat ice cream every day and, nationally, vanilla is the
favorite of about 50 percent of consumers. The survey also pointed out
that consumers judge ice cream quality mainly by~
1. Texture--high quality ice cream is described as "creamy," "smoo~, 11 "velvety. 11 Poor quality ice cream is described as "gritty," "grainy," "poor taste," 11icy. 11
2. Taste--described as "good flavor," 11 rich 11 or "sweet."
2

3
Blakley, McMullin and Boggs (2) intervie~ed a random 1 percent of
the Oklahoma City population in a dairy products and services survey in
1955. The study showed that 40 percent of the families interviewed re
ported· using an average of 2.9 pints of lee cream each week. The pro
portion of families using lee cream was directly related to family in
come. .About one-fourth of the lower income families reportE,,d using ice
cream~ and this proportion increased with income up to one-~lf for the
highest income families.
Eckles 1 Combs and Macy (4) stated that ice cream is not graded on
the market since it is sold by the manufacturer directly to the retail
er or conslliller. The ~ualities that constitute a good ice cream are left
more or less to the judgment of the individual manufacturer and his
ability to judge the preference of the public. They further stated
that the defects in ice cream commonly referred to are those of flavor,
body and texture 9 and color.
In some research on various factors affecting consumer preferences
for lee cream9 Crowe (3) compared pure vanilla and fortified vanilla in
dlff erent concentrations. He used three basic flavors: pure vanilla P
pure vanilla fortified with 5 ounces of. vanillin1 and pure vanilla for
tified with 10 ounces of vanlllino The amounts of each of these flavors
used per 5 gallons of mix were 1/2 ounce and 1 ounce. He ran consumer
preference determinations on 9 combinations of these flavors. In only
3 out of the 9 comparisons were the differences significant as follows:
1. One ounce of pure vanilla extract fortified with 10 ounces of van
illin was preferred to 1/2 ounce of pure vanilla.. The preference was
slight but significant. 2. One oqnce of pure vanilla fortified with
10 ounces of vanillin was preferred to 1/2 ounce of pure vanilla

4
fortified with 10 ounces of vanillin. The consumer preference was
slight but significant. J. One ounce of pure vanilla fortified with
5 ounces of vanillin was highly preferred over 1 ounce of pure vanilla.
In this latter comparison the difference appeared to be highly
significant. From these results it may be inferred that the fortified
vanilla was preferred over the pure vanilla. It also appeared from the
data presented that a high level of flavor was desirable because the one
ounce of flavoring used in each of these comparisons in which there was
a significant preference was twice the level recommended by the
manufacturer.
Schlotterer (8) reported that the chief use of vanilla in the
United S.tates of America is for the manufacture of ice cream. He point
ed out that out of some 100 varieties of ice cream sold, the consumers 1
preference is for vanilla, in the proportion of 55 percent. He further
stated that it is estimated that 15% of ice cream firms now use some
pure vanilla, 15% use straight artificial flavor, and 70% stretch out
their flavor mostly with synthetic vanillins and very little pure
vanilla.
England (5) reported that operation of the freezer is very impor
tant from the standpoint of texture of the finished ice cream. Sharp
blades, fast freezing and a stiff, dry ice cream are practically a must,
and he highly recommends putting the ice cream in a hardening room
immediately after freezing so the texture will not be affected by
letting ice crystals melt.
Hovanesian (6) reported that the hardening phase of ice cream pro
duction has not kept abreast of advancements in mix making, freezing
and packaging of this product. Proper hardening is, however, of utmost

5
importance in obtaining quality ice cream. Differences in hardening
time and temperature variations during the hardening process have a dis
tinct effect on the body and texture of the final product. He further
pointed out_that quick hardening produces smaller ice crystals and
smoother texture than is obtained with slower hardening, and that varia
tions in hardening temperatures result in larger crystals and coarser
texture.

EXPERIMENTAL PROCEDURE
A. PREPARATION OF SAMPLES
1. Samples for flavor preference. The samples used for the deter-
mination of vanilla ice cream flavor preference were manufactured by the
Dairy Department of Oklahoma State University. The mix, other than the
various kinds and amounts of vanilla flavors used in the samples, was
the same. The mix was composed of 12% butterfat, 11% serum solids, 15%
sucrose, .18% stabilizer and .07% emulsifier. The stabilizer used was 0
sodium alginate. The mix was pasteurized at 160 F. for .30 minutes and
homogenized at 1,750 pounds pressure with a Creamery Package homogenizer.
Prior to making the ice cream samples for the consumer preference
test, the amount of each flavor required to give approximately the same
degree of flavor was determined. This was done by adding various amounts
of the flavoring material to good quality ice cream mix and having sev-
eral experienced ice cream judges evaluate the various samples. On the
basis of the judges' opinions, the amounts needed for uniformly distinct
vanilla flavor were determined.
In the first flavor preference survey, the three types of vanilla
flavors used were: A, Artificial vanilla flavor--a commercial product
for use in ice cream containing 11vanillin, ethyl vanillin, vanilla,
esters, aldehydes, water, alcohol and glycerin." The artificial flavor
was used at the rate of 75 ml per 5 gallons of ice cream.mix. ~. Pure
6

7
vanilla extract--double-strength extract of 1/2 Mexican and 1/2 Bourbon
beans, used at the rate of 48 ml to each 5 gallons of ice cream mix.
Q. Fortified vanilla--extract of 1/2 Mexican and 1/2 Bourbon beans for
tified with 8 ounces of vanillin per gallon, used at the rate of 16 ml
per 5 gallons of mix.
In the second flavor preference survey, the three types of vanilla
flavors used were as follows: ,!. Artificial vanilla flavor containing
"extractive matter from vanilla beans, vanillin, alcohol, propylene
glycol, sugar and water," used at the rate of 7/8 ounce for each 5 gal
lons of ice cream mix. ],. Fortified vanilla--double-strength pure
vanilla extract of 1/2 Mexican and 1/2 Bourbon beans and fortified with
2 ounces of methyl vanillin per gallon, used at the rate of 7/8 ounce
for each 5 gallons of ice cream mix. Q. Pure vanilla--double-strength
pure vanilla extract of 1/2 Mexican and 1/2 Bourbon beans, used at the
rate of 11/2 ounces for each 5 gallons of mix.
The three types of vanilla flavoring used in the second flavor
study were furnished by the Beck Vanilla Products Company of Ea.st St.
Louis, Illinois. The amount of flavoring used in each sample was in
accord with the recommendations of the manufacturer, as printed on the
container.
The samples in both flavor studies were marked with identification
letters on the outside of the gallon containers and stored in the hard
ening room at the Dairy Department of Oklahoma State University for 3
days before being moved to Tulsa by the author. The identifying letters
were selected randomly and the keys to the identities were not revealed
to the author until the surveys had been completed and the data analyzed.
The samples were stored in a well insulated ice cream packer with 5

8
pounds of dry ice to keep them frozen solid enroute to Tulsa by auto
mobile, a period of about 11/2 hours. On arrival in Tulsa, the samples
were removed from the ice cream packer for inspection by the author and
no thawing or so~ening had taken place. The samples were immediately
put back in the ice cream packer and stored in the sharp-freeze room at
the Glencliff Dairy Products Company until they were needed for the
survey.
2. Samples for texture preference. The ice cream samples used for
the determination of texture·preference were.manufactured by the Dairy
Department of Oklahoma State University, :using the same mix as was prev
iously explained for the flavor preference samples.
One sample, classified as coarse texture, was drawn rather soft and
then placed in the hardening room. Another sample, medium texture, was
drawn rather soft and then stored on an upper shelf in a deep-freezer.
A third sample, fine texture, was drawn firm and stored on the bottom
shelf in the deep-freezer. The gallon contai!}ers of the texture samples
were marked with identification letters on the outside of the cartons
before being stored. The three texture samples were classified as fine,
medium and coarse by two experienced ice cream judges. The samples were
stored at tlie previously mentioned places for three days before being
moved to Tulsa by the author. The three texture samples were handled
and stored in the same manner as· previously described for the flavor·
samples.
B. SELECTION OF RESPONDENTS
In both flavor preference surveys, approximately one-half of the
respondents were tested in the Tulsa Secondary Schools and one-half in

I
supermarket_ foo¢ stores- in-Tulsa, Oklahoma. _During the entire course
of this study, juveniles were considered to be students below high
school graduation leve11 and adults were considered above high school
graduation level.
Mr. W. Leroy Tharp, Director of Secondary Education in the Tulsa
Public Schools, gave his approval for the school surveys and selected
9
the foods classes at the Nathan Hale High School in Tulsa as the repre-
sentative group to participate in the study. Average family income and
interest in foods were the two main factors taken into consideration in
selecting this group as average. No respondent participated in more
than one comparison in either survey.
Three supermarket food store managers in different economic areas
of Tulsa granted permission to the. author to interview consumers in
their stores as the consumers passed the ice cream counter. The respon-
dents in the stores were selected at random. When the preference sample
rank was completed and the preference chart or questionnaire filled out
on the respondent, the next consumer passing the ice cream section was
asked to make the ice cream preference test. If a consumer did not wish
to make the taste test, the next person passing the ice cream section in
the store was asked to participate.
During each of the consumer preference surveys, only the two or
three samples of ice cream being tested were removed from the sharp-
freeze storage at one time and then for not more than one-half of-a day
at a time. During the school surveys, the ice cream was taken out of a
deep-freezer at school only long enough to dip the samples being tested.
While the preference surveys were being made at the food stores, the ice
cream samples were placed in the ice cream freezer case and dipped as

10
needed for the respondents. In both schools and food stores, the ice
cream was frozen firmly enough at all times that it was difficult to dip.
C. EXAMINATION PROCEDURE
1. First flavor .Qreference survey. Each respondent in the first
flavor preference study was given a plastic spoon and a paper plate on
which about a tablespoon of each of three samples of ice cream had been
placed. The paper plate had previously been marked off in three equal
sections and nUill,bered with identification letters to match the three
flavor samples. The respondents were first asked to taste the three
samples of ice· cream and rank them according to their taste preference '
for vanilla flavored ice cream. After the three samples of vanilla ice
cream had been ranked according to preference, ten questions on a ques
tionnaire were read verbatim to each respondent. If any explanation was
needed the interviewer attempted to give this in such a way so as not to
bias the answer given by the respondent. A copy of the questionnaire is
shown on page 11.
2. Second flavor §.Urvey and texture preference survey_. A prefer
ence sheet used in this survey was patterned after the one used in a
consumer preference study made by Crowe (3). The preference sheet in
cluded terms that most nearly described the respondents reactions to the
samples being tested. The sheet was modified to include both flavor and
texture reactions, with a blank space at the top to be filled in either
with the word 11texture 11 or "flavor," depending on the preference test
being made. A copy of the preference sheet used is shown on page 12.
Each respondent, in both groups of the preference survey on flavor
and texture, was tested in essentially the same manner as previously

Sample No.
A
B
C
Rank
ICE CREAM SURVEY VANILLA FLAVOR
Age: A J __ _
Sex: M F __ _
Occupation ____ _
Criticisms
•..
OPINIONS REGARDING FROZEN DESSERTS
1. Do you know the differences between ice cream, ice milk and mellorine? Yes No -----
2. How does ice milk differ from ice cream?
11
3, How does Mellorine differ from ice milk? ------------4, How often do you serve ice orea.mi ·-per week? ------------
5, Do you generally serve the ice cream as it comes from the con-tainer? Yes No If not, how do you change it? ___
6. Has the ice cream you have been purchasing recently been satis-factory? Yes No
7. What criticisms do you have regarding the quality of ice cream?
8. Why do you include ice cream in your menus?
9. Why don't you use more ice cream?
10. Which do you consider the better: Home-made ice cream-------
Commercial ice cream -----Why?----------------------------------------

CONSUMER ICE CREAM PREFERENCE STUDY
Factor Studied ------Date Age: Adult Juvenile
Name Sex: Male Female
Circle sample preferred: A B C
Difference between samples: Slight Moderate
· Quality of sample you chose: Good Fair Poor
Criticisms of sample:
Reasons for preference:
Better flavor ____ _ Better body ____ _
More flavor Better texture ---Richer taste ----- Others -------
12
Great

explained in the first flavor survey, except that only two samples of
ice cream were compared at a time.
13
The respondents were first asked to examine the two samples of ice
cream and rank them according"to their preference for flavor and texture,
depending on what was being compared. The preference sheet lists
Samples A, Band C. The sample not being tested was marked out before
two samples were compared by the respondents.
·. After the samples had been ranked according to preference, the
ite~s listed on the sheet were read to the respondents verbatim and they
selected the term most nearly describing their reactions to each sample.
One or more reasons for preference on ice cream flavor and texture were
selected by each, ,respondent.,_ If any explanation was needed, the au,.thor
attempted to give.this in such a;way so.as not to bias the.answer. given_
by the respondent. All respondents were able to answer all the ques
tions on the preference data sheet.
D. DETERMINATION OF CONSUMER PREFERENCES
1. Consumer Score. The procedure used for calculating the results
for the first survey on consumer flavor preferences is one described by
Olson and Strozier (7). In these trials, three samples were employed
and the consumer score was calculated for each sample by multiplying the
number of times it placed first by 3, second by 2 and third by 1, and
totalling these sums.
2. Preference Significance. The procedure for calculating the re
sults for the second flavor and texture survey is described by Crowe
(3). The results were tested for significance by the calculation:
2X-N, where X equals the number of preferences for a particular sample

14
and N equals the nuxnper of opinions. This result w~s compared with 1.96
times the square root of N. If 2X-N is greater than 1.96 times the
square root of N, then the preference is considered to be significant. 0
EXPERIMENTAL RESULTS AND DISCUSSION
A. CONSUMER PREFERENCE FOR VARIOUS TYPES OF VANILLA FLAVORS IN ICE CREAM
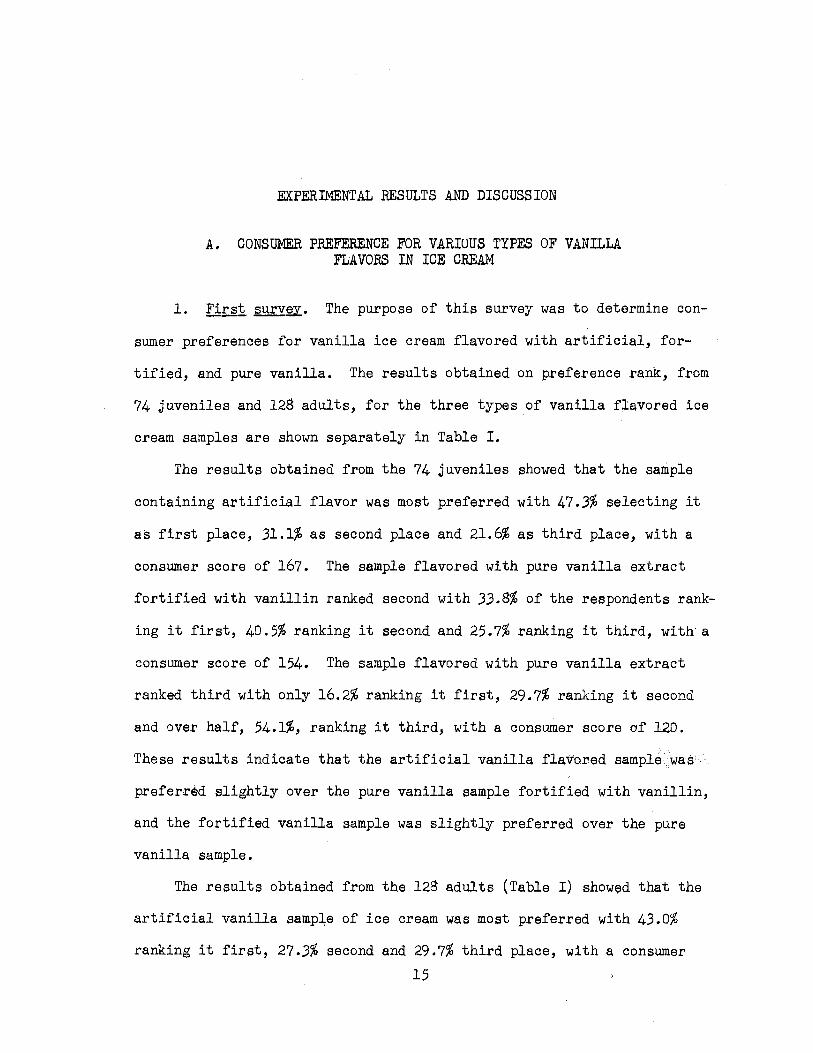
1. Fi~i surv§X.. The purpose of this survey was to determine con-
sumer preferences for vanilla ice cream flavored with artificial, for-
tified, and pure vanilla. The results obtained on preference rank, from
74 juveniles and 128 adults, for the three types of vanilla flavored ice
cream samples are shown separately in Table I.
The results obtained from the 74 juveniles showed that the sample
containing artificial flavor was most preferred with 47.3% selecting it
as first place, 31,1% as second place and 21.6% as third place, with a
consumer score of 167. The sample flavored with pure vanilla extract
fortified with vanillin ranked second with 33.8% of the respondents rank-
ing it first, 40,5% ranking it second and 25.7% ranking it third, with a
consumer score of 154, The sample flavored with pure vanilla extract
ranked third with only 16.2% ranking it first, 29.7% ranking it second
and over half, 54,1%, ranking it third, with a consumer score of 120.
These results indicate that the artificial vanilla flavored sampie·was'
preferrM slightly over the pure vanilla sample fortified with vanillin,
and the fortified vanilla sample was slightly preferred over the pure
vanilla sample.
The results obtained from the 128 adults (Table I) showed that the
artificial vanilla sample of ice cream was most preferred with 43.0%
ranking it first, 27,3% second and 29.7% third place, with a consumer
15

Placing
First Second l'.'- ~
Total
First Second T'-~
Total
First Second
Total
TABLE I
PREFERENCE FOR VARIOUS TYPES OF VANILLA FLAVORS IN ICE CREAM BY ADULTS AND JUVENIIES IN FIRSI' SURVEY
74 Juveniles and 128 Adults
Juvenile Preference Adult Preference
No. I % I Score* I · Rank No. I % I Score* I Rank
35 23
74
12 22
Q
74
25 30
74_
47.3 3Ll
10000
16.2 29.7
100.0
3308 40.5
100.0
105 46
167
36 44
120
75 60
154
Artificial Vanilla
1
55 35
128
Pure Vanilla
2
45 42
128
Fortified Vanilla
2
29 51
128
43.0 27o3
100.0
35.2 32.8
100.0
22.7 39.8
100.0
165 70 a
273
135 84
260
87 102
a 2'j7
1
2
3
*See method for calculating consumer score.
~ 0--

17
score of 273. The adults showed a slight preference for the pure van-
illa sample over the fortified sample with 35.2% ran.king the pure van
illa sample first,·32.8% second and 32.0% third, with a consumer score
of 260. The fortified sample was the least preferred by the adults with
only 22.7% ranking it first place,· 39.8% second and 37.5% third, with a
consumer score of 237. The total scores for the adults showed a slight
preference for the artificial vanilla sample over the pure sample and a
slight preference for the pure over the fortified vanilla sample.
The results obtained from all respondents, 74 juveniles and 128
adults, are shown in Table II. The results show that the artificial
vanilla sample was most preferred with 44.6% ran.king it first place,
28.7% second and 26.7% third, with a consumer score of 440. The forti
fied vanilla sample ranked second with 26.7% ranking it first place,
40.0% second and 33.3% third place, with a consumer score of 391. The
sample flavored with pure vanilla was ranked third or last place with
28.2% ranking it first place, 31.8% second and 40.0% third place, with a
consumer score of 380. The data indicates a slight preferen~e by all
respondents for the artificial vanilla sample over the fortified sample,
and a slight preference for the fortified over the pure vanilla sample.
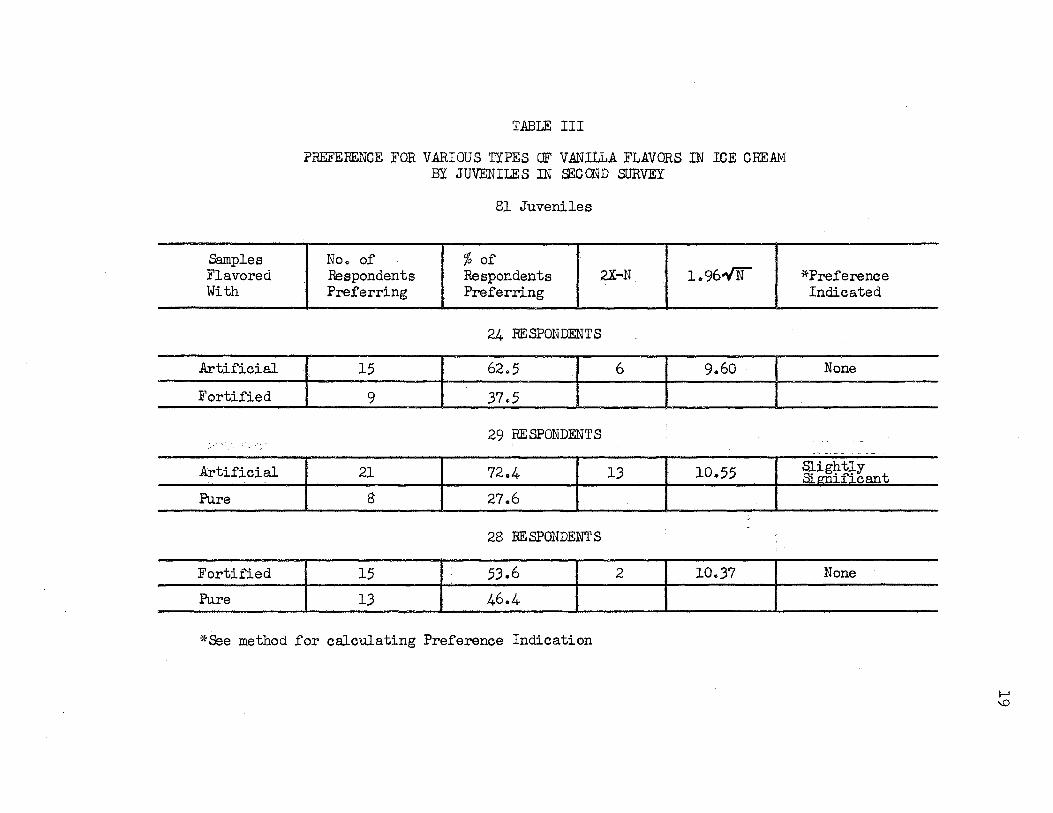
2. Second survey. A second survey was run on consumer preference
for vanilla flavors, using a slightly different examination procedure
and applying mathematical determinations for significance. In this sur
vey only two samples were examined by each re~pondent and the respondent
was asked to designate the better of the two samples. Results obtained
from 144 respondents, composed of 81 juveniles and 63 adults, are pre
sented in Table III.
The data shows that when the artificial vanilla sample was

Placing
First
Second
'I'hird
Total
Score
Rank
TABLE II
PRE.FERENCE FOR VARIOUS TYPES OF VANILLA FLAVORS IN ICE CREAM BY ALL RESPONDENTS IN Fmsr SURVEY
- -
202 Respondents
TYPE OF VANILLA FLAVOR
Artificial Vanilla Pure Vanilla Fortified Vanilla Respondents Respondents Respondents
No. 'I, No. % No. %
90 44.6 57 28.2 54 26.7
58 28.7 64 31.8 81 40.0 - -· ~ -- ' - - .--- - --
54 2.6.7 81 4Q._O_- 67 33.3
202 • 100.0 202 100.0 202 100.0
440 380 391 ' -.
1 3 2
I-"-' 00
Samples Flavored With
Artificial
Fortified
Artificial
Pure
Fortified
Pure
TABLE III
PREFERENCE FOR VARIOUS TYPES OF VANILLA FLAVORS IN ICE CREAM BY JUVENILES IN Sl:COND SURVEY
81 Juveniles
Noo of % of Respondents Respondents 2X-N 1.96../N Preferring Preferring
24 RESPONDENTS
15 62.5 6 9.60 .
9 37o5
29 RESPONDENTS
21 72.4 1.3 10.55
8 27.6
28 RESPONDENTS
15 ' 5.3.6 2 10 .. 37
13 46.4
*See method for calculating Preference Indication
*Preference Indicated
None
Sl.i htl Sl~ifi~ant
None
I-'
'°

20
compared with the fortified sample, 15 or 62.5% of the 24 respondents
preferred the artificial vanilla sample and only 9 or 37.5% preferred
the fortified vanilla sample. The results from this percentage indi
cated there was a slight preference for the artificial vanilla sample
over the fortified sample, but when the re~ults were tested for signif
icance by the calculation on page 12, no significant preference was
shown.
When the sample flavored with the fortified vanilla was compared
with that flavored with the pure vanilla, 15 or 53.6% of the 28 respond
ents preferred the fortified and 13 or 46.4% preferred the pure vanilla
sample. The results indicated a very slight preference for the forti
fied over the pure vanilla sample, but the calculation for significance
showed there was no significant preference.
The results obtained from 63 adults in the second flavor preference
survey are shown in Table IV. The results show that when the artificial
vanilla sample was compared with the fortified vanilla sample, 16 or
72.7% of the 22 respondents preferred the artificial and only 6 or 27.3%
preferred the fortified vanilla sample. This comparison indicated a
definite preference for the artificial over the fortified vanilla sample
and the calculation for significance showed there was a slightly signifi-
cant preference. .,
The results obtained in Table IV showed that when the sam..ples fla
vored with the artificial vanilla were compared with those flavored with
the pure vanilla, 16 or 84.2% of the 19 respondents preferred the art~
ficial and only 3 or 15.8% preferred the pure vanilla sample. The com
parison indicated a preference for the artificial over the pure vanilla
sample and a slightly significant preference was shown by calculation.

TABLE IV
PREFERENCE FOR VARIOUS TYPES OF VANILLA FLAVORS IN ICE CREAM
BY ADULTS IN ~ OND SJRVEY
63 Adults
Samples No. of % of Flavored Respondents Respondents 2X ... N 1.96..{if" Preference With Preferring Preferring Indicated
22 RESPONlENT S
Art,_ificial --
16 Slightly 72 .. 7 10 9.19 ~ cm-i f'-i ,..ant
Fortified 6 27.3 I
19 RESPONDENTS
Artificial . 16 84.2 13 8 .. 54 Slightly Simi.; fi~ant
Pure 3 15.8
22 RESPONDENTS
~ F-:-~i~ed r. ~··i2-- . ·~r-----,4~5-- ~--,~- 2 ~ l 9.19 - -, None
Pure r~ .. 10 -- --r--4-5.5 - r · · · 1 · -r ~

22
When the fortified sample was compared with the pure vanilla
sample by 22 adult respondents, the results obtained showed that 12 or
54.5% preferred the fortified and 10 or 45.5% preferred the pure vanilla
sample. This comparison indicated a slight preference for the fortified
over the pure vanilla sample, but the calculation for significance showed
there was no significant preference.
The results obtained on the second flavor preference survey from
all respondents, 81 juveniles and 63 adults, are shown in Table V.
These results showed that when the samples flavored with the artificial
vanilla were compared with those flavored with fortified vanilla, 31 or
67.4% of the 46 respondents preferred the artificial and 15 or 32.6%
preferred the fortified vanilla sample. This comparison indicated a
preference for the artificial over the fortified vanilla samples and the
calculation for significance also showed a slightly significant
preference.
When the samples flavored with the artificial vanilla were compared
with those flavored with the pure vanilla, 37 or 77.1% of the 48 respond
ents preferred the artificial and 11 or 22.9% preferred the pure !anilla . '
samples. This comparison indicated the artificial was highJ.y preferred
over the pure vanilla samples and a highly significant preference was
also shown by calculation.
When the 13amples flavored :with the fortit'ied vanilla were compared·.,
with those flavored. with pure vanilla, 27 or 54.0% of the 50 respondents
preferred the fortified and 23 or 46.0% preferred the pure vanilla sam-
ples.. This comparison indicated a very slight preference for the forti-
fied over the pure vanilla samples, but the calculation for significance
test showed there was no significant preference.

Samples . Flavored With
Artificial
Fortified
Artificial
Pure
Fortified
Pure
TABLE V
PREFERENCE FOR VARIOUS TYPES OF VANIIJ..A FLAVORS IN ICE CREAM
BY ALL RESPONDENTS IN ::EC OND SURVEY
81 Juveniles and 6.3 Adults
No. of % of Respondents Respondents 2X-:N 1.96,/N Preference Preferring Preferring Indicated
46 RE SPOODENT S
.31 67.4 16 1.3.29 Slightly ,q; D'l'li fi cant
15 .32.6
48 RESPOODENTS
.37 77.1 26 1.3.58 Highly . .Cli ani f'.; nqnt.
ll 22.9
50 IESPCNDENTS
27 54.0 4 1.3.86 None
2.3 46.0
l\) \.,.)
24
A total of 346 respondent$ participated in the two flavor prefer-
ence surveys. The combined results obtained in the two surveys, where
each two samples were compared 6 times, showed that the artificial van-
illa s.ample was preferred by the largest number of consumers. The re-
sults showed that the artificial was preferred over the pure vanilla
sample in each of the 6 comparisons. The results from the first flavor
survey showed that the artificial was moderately preferred over the
pure vanilla sample. When the data were subjected to calculation for
significance, the preference for the samples flavored with artificial
vanilla over those flavored with pure vanilla was slight for the juve-
niles, moderate for the adults, and highly significant for the combined
group ..
The results showed that the artificial was preferred over the for-
tified vanilla sample in each of the 6 comparisons in the two flavor
surveys. The artificial was slightly preferred over the fortified van-'
ill.a. sample in each of the 3 comparisons in the first flavor survey.
The data obtained from the second flavor survey showed a_ slight prefer
ence by calculation for the artificial over the fortified vanilla sample
by adults, and a percentage preference of 62.5% to 37.5% for the arti
ficial,over the-fortified sample by the juveniles.
The fortified sample was preferred over the pure vanilla sample in
5 .of the 6 times they were compared in the two flavor surveyse The re-
sults obtained from the adults in the first survey showed that they
slightly preferred the pure over the fortified vanilla sample. In each
of the other 5 comparisons, the fortffied was slightly preferred over
the pure vanilla: sample·but-·not to a de~ree that any preference for sig-
nificance was shown by calculation.
25
B. REASONS GIVEN FOR PREFERENCE FOR TYPES OF VANILLA FLAVORED ICE CREAM BY CONSUMERS
A questionnaire was used in the second flavor survey that included
terms most nearly describing the respondents reactions to the samples
being tested. The questionnaire included both flavor and texture re-
actions, and the respondents making the flavor test checked one or more
of the four flavor terms listed. The check terms for flavor preference
were ''better flavor, 11 11more flavor, 11 '.'richer taste" and 11 others. 11 Such
a small number gave 11 others 11 for a reason that this term was eliminated
in the results in Table VI. The questionnaire provided space for the
respondents to check whether they considered the difference in the two
samples being tested to be "slight, u "moderate'' or 11great 11 and whether
the sample preferred was considered ''good, 11 ''fair" or "poor. 11 A space
was also provided for criticisms of the samples not chosen.
The data obtained from the 144 respondents, 81 juveniles and 63
adults, is shown in Table VI. The results show that, of the 31 respond-
ents preferring the artificial over the fortified vanilla sample, 16 or
51.6% considered the difference between samples to be moderate, and 7 or
46.6% of the 15 respondents preferring the fortified over the artificial
sample thought the difference to be moderate. Of the 37 respondents
preferring the artificial over the pure vanilla sample, 17 or 46.0% con
sidered the difference to be slight and 15 or 40.5% to be moderate. The
data shows that 5 or 45.4% of the 11 respondents preferring the pure
over the artificial vanilla sample considered the difference between
samples to be-moderate. Of the 27 respqndents preferring the fortified
over the pure vanilla sample, 16 or 59.3% thought the difference between
samples was slight, and 15 or 65.2% of the 23 respondents preferring the

Ol Q)
g Prepared Q)
H Vanilla Q)
C+--t
Ice Cream Q)
J: Samples C+--t 0
• 0 z
Artificial 31 over Fn'T't.i f'ipn % 67o4 Fortified over 115 A. 'T't,i f'i rd ., , % ~?J) Artificial 37 over Pure % 77.0 Pure over 11
A-..+.i f'i ~; <>l % ·21.0 Fortified 27 over Pnre % 'il..0
Pure ··-over 2'3 Forti f'i Ari % =1.f....q
TOTAL 11..l % , no.o
TABLE VI
ffiASONS GIVEN FOR PREFERENCE FOR VARIOUS TYPES OF VAN ILLA FLAVORED ICE CREAM BY C 00 SUMERS
81 Juveniles and 63 Adults Difference Reasons for Between Preference Samples :
Q) .p
.p al H H H H
iii H .p Q) 0 0 Q) Q)
~ al ~ :> f ~ ..c: .p •rl Q) .p al C) Ol
@ 0 H Q) rl 0 rl iE~ ~ c.:, c:Q J:r.t ~P'-1
8 16 7 20 17 14
25.8 5lo6 22.6 64.5 54.8 45.2
l. 7 l. 8 '3 8 ?f...7 l.f....6 ?f...7 s·:L 15 20.0 . 15'L 15
17 15 5 22 19 22
1....6.0 l.O" 15 J1L15 15g. 15 t;l • l. 159. 15
1 15 ~ 8 1 15 I
Quality of Sample Chosen
'O H 0 ·2 0
c.:, P'-1
29 2
9306 6.4
11. 1
g·L '3 6.7
36 1
97.3 2o7
11
27.1 J,t:.,.J.. 27.1 72.7 ' g_ 1 1..15.1.. 1.00.0
16 6 5 ; 20 11 18 25 2 ,;q.1 ?? .. 2 18. S 7l .1 l0.7 f..f...7 g2.6 7 .LL
7 1 t; 1 lh 11 q ?l 2 '30 .l. h'i.2 l..l. . 69.6 t;A.5 1q.1 Ql. 1 6.7
1515 61.. 215 QI. 61.. 76 I l1f... 8 '38.2 1.1. .• l. 17.l. 6'>.2 I.I .• l. t;?.8 QI. I. "i.6
a Q) Ol 0
C+--t ..c: oo fll~ a o t0 a
•rl C) Q)
•rl rl .p p.
]l 5
16ol
2 l'L1
5
l3o5
5 r
l.t;.l.
5 18. 15
2 fi.7 '2J.
l f... 7 l\) O"

27
pur~ over the fortified vanilla sample cons~dered the difference between
samples to be moderateo It seemed from these·results that a large ma
jority of the respondents considered the difference b~tween the two
samples being tested each time to be slight or moderate. Only 25 or
17.4% of the 144 respondents making the comparisons considered the dif
ference to be great between samples.
The reasons given for preference by the 144 respondents show that
94 or 65.2% listed better flavor as a preference reason, 76 or 52.8%
listed richer taste, and 64 or 44.4% listed more flavor. These results
indicate that the kind of flavor, or better flavor, was considered a
greater preference factor than more flavor or richer taste by the 144
respondents making the test.
The data in Table VI shows that 136 or 94.4% of the 144 respond
ents making the vanilla ice cream flavor test considered the quality of
the samples chosen each time to be good, and only 8 or 5.6% fair. All
11 of the respondents preferring the pure vanilla over the artificial
vanilla sample thought the quality of the sample preferred to be good.
It seemed from these results that the 11 respondents recognized pure
vanilla and therefore indicated a great preference for it over the arti
ficial or fortified products. Of these 11 respondents, 5 or 45.4% gave
criticisms of the sample not chosen, by far the largest percentage of
any group making the comparisons. Only 24 or 16.7% of the 144 respond
ents making the flavor comparisons gave criticisms of the samples not
chosen.

C. PREFERENCE FOR VARIOUS TEXTURES IN VANILLA FLAVORED ICE CREAM
Results were obtained from 152 respondents, 71 juveniles and 81
28
adults, in the ice cream texture preference survey. The results obtained
from the 71 juveniles are shown in Table VII. The data showed that 16
or 76.2% of the 21 respondents preferred the medium textured sample over
the coarse and only 5 or 23.8% the coarse textured sample over the med-·
ium. The results from this comparison .indicated a strong majority pref-
erence for th~·medium over the coarse textured sample and when the re
sults were tested for significance by calculation, a slightly significant
preference was shown.
The results obtained showed that when the coarse textured sample
was compared with the fine textured ice cream sample, 11 or 61.1% of' the
18 juvenile respondents preferred the fine textured sample and 7 or 38.9%
the coarse textured sample. The results from this percentage comparison
indicated a slight preference for the fine over the coarse textured sam-
ple, but when the results were tested for significance by calculation,
no significant preference was indicated.
The results obtained in Table VII showed that when the fine textured
sample of ice cream was compared with t.he medium textured sample, 18 or
56.2% of the 32 respondents making the test preferred the fine and 14 or
43.8% the medium textured sample. The results from this percentage com-
parison indicated the respondents preferences were about equal for the
fine and medium textured samples, and when the results were checked for
significance by calculation, no significant preference was indicated.
The data obtained from 81 adults in the ice cream texture pref e!'-T·
ence survey is shown in Table VIII. The results showed that when the

TABLE VII
PREFERENCE FOR VARIOUS TEXTURES IN ICE CREAM
BY JUVENILES
71 Respondents
--- -Texture % of No .. of
of Respondents Respondents 2X-N lo96,/N Preference Samples Preferring Preferring Indicated
21 RESPONDENTS
Coarse 5 23 .. 8
Medium 16 76 .. 2 11 8 .. 98 Slightly ffi O'YI; f'i l"'R'Ylt
18 RESPONDENTS
Coarse r- 7 -- ~1 - -38 .. 9 ~~---1 _-~-- r ---- -----~ =r - ---- --
Fine r---i;_~-_I ___ 61 .. ~~~-i -4 - I s:31~-J None
32_RESP0NDENTS
Medium r -14 I 43 .. s I I I Fine - -, --- is ~-- - r--56o~ ,~ - 4- --- , ·1L08- J · None
l\)
'°

TABLE VIII
PREFERENCE FOR VARIOUS TEXTURES IN ICE CREAM
BY ADULTS
81 Respondents
% of - -·- -- - . -
Texture No. of of Respondents Respondents 2X-N L96-/N Preference
Samples Preferring Preferring Indicated
31 RESPONDENTS
Coarse C - 17 - -- --- 1 - 54.s · 1 4 I - 1~.23 -- -- t None
Medium r----- 14 J ---45.2 -~I----~-, --- -- -l
30 IESPONDENT S
Coarse ,---- -;;---------J~-43~3-~ l ------ I - --- J
Fin;·--r---i;-··- -r---56.7 ] - 4 ,-~-- 10.23 --r-- None
20 IESPONDENTS
~di.um _I 6 J 30.0 t ~-~----- - --~l_-Fine L 14 I 70-.0 r 8 r - 8. 76--] None
\.,J 0

31
coarse textured ice cream sample was compared with the medium textured
sample, 17 or 5408% of the 31 respondents making the test preferred the
coarse textured sample and 14 or 45o2% preferred the medium textured
sample. This percentage comparison indicated a slight consumer prefer,-,,
ence for the coarse textured sample, but when the results were checked
for significance by calculation, no significant preference was indicated.
The data in Table VIII shows that when the fine textured ice cream
sample was compared with the coarse textured sample, 17 or 56.7% of the
30 respondents preferred the fine textured sample and 13 or 43.3% pre-
ferred the coarse textured sample. The percentage comparison indicated
there was very little if any preference shown in the comparison between
the coarse and fine textured samples and when the results were tested
for significance by calculation, no significant preference was indicated.
The results showed that when,_the fine textured sample was compared
with the medium textured sample by adults, 14 or 70.0% of the 20 respond-,
ents preferred the fine textured sample and only 6 or 30.0% preferred
the medium textured sample. The results from this percentage comparison
indicated that a large majority of the respondents preferred the fine
textured sample over the medium textured sample, but when the results
were tested for significance by calculation, no significant preference
was indicated.
The data obtained from all respondents, 71 juveniles and 81 adults,
in the ice cream texture preference survey is shown in Table IX. The
results show that when the coarse textured sample was compared with the
medium textured sample, JO or 57.7% of the 52 respondents preferred the
medium textured sample and 22 or 42.3% preferred the coarse textured
sample. This percentage comparison shows a slight consumer preference

Texture of
Samples
Noo of
TABLE IX
PREFERENCE FOR V,AJ_UOUS TEXTURES IN ICE CREAM
BY ALL RESPONDENTS
71 Juveniles and 81 Adults
% of Respondents Respondents 2X-N 1.96-V'N' Preferring Preferring .
52 BE SPONDENT S
Coarse [ 22 I 42°3 J ~····. I ~-- ~- ~ ~,
Preference Indicated
Medium I .30 57 .. 7 '-~ 8 I ~4.n ... · 1 None
48 RESPONDENTS
Coarse l 20 I 41 .. 7 I I · · I Fine I 28 I 58.,.3 I 8 I 1.3~~8- T - None
52 RESPONDENTS
~mum I 20 I 38.5 I 1 I Fine · : 32 : 6.1.5 : 12 14,13 : None
\.,.) l\)

.3.3
for the medium over the coarse textured sample, but when the results
were tested for significance for calculation, no significant preference
was indicated.
The results in Table IX show that when the fine textured sample was
compared with the coarse textured sample of ice cream by all respondents,
28 or 58 . .3% of the 48 respondents preferred the fine textured sample and
20 or 4l.7% preferred the coarse textured sample. These percentage re-
sults indicated a slight consumer preference for the fine over the coarse
textured sample, but when the results were tested for significance by
calculation, no significant preference was indicated.
The results show that when the fine textured sample of ice cream was
compared with the medium textured sample, .32 or 61.5% of the 52 respond
ents preferred the fine textured sample and 20 or 38.5% preferred the I·
medium textured sample. '.l'he percentage results indicated a slight con-
sumer preference for the fine over the medium textured sample, but when
the results were tested for significance by calculation, no significant
preference was indio,ated.
The results obtained from the 152 consumers who participated in the
ice cream texture preference survey indicated that most consumers can
detect fine, medium, and coarse textures in ice cream. The results ob-
tained indicated ·a slight preference for the fine textured sample over
the medium texture'tl sample and a slight preference for the medium tex-
tured sample over the coarse textured sample .. Only one time during the
nine texture comparisons was there an exception to the above indication.
The one exception was when the coarse textured sample was preferred over
the medium textured sample by .31 adults as shown in Table VIII by a per=
centage comparison of 54.8 to 45.2. In only one comparison was any

34
preference for significance indicated by calculation, and this was shown
in the results obtained from 21 juveniles who preferred the medium tex
tured sample over the coarse textured sample by a calculation for signif
icance of 11 to 8098.
D. BEAOON S GIVEN FOR PREFERENCE FOR TEXTURES
A preference sheet was used in the ice cream texture preference sur
vey that included terms most nearly describing the respondents reactions
to the samples being tested. The sheet included both flavor and texture
reactions and the respondents making the texture test checked one or more
of the flavor terms which were "more flavor," "better flavor" and "richer
taste." The respondents also checked one or more of the texture terms
which were "better body," "better texture" and 11 others. 11 Such a small
number listed 11 others 11 for a reason that this term was eliminated in
Table X. The sheet also provided space for the respondents to check
whether they considered the difference between the two samples being test
ed to be "slight, 11 ''moderate" or "great," and whether the· sample preferred
was considered "good, 11 11fair 11 or "poor." All of the respondents checked
all three samples as good or fair, so the 11 poor 11 column has been elimi
nated in Table X. The sheet also provided a space for the respondents
to list criticisms for the samples not preferred.
The data obtained from the 152 respondents, 71 juveniles and 81
adults, is shown in Table X. The results show that 92 or 60.5% of the
152 respondents making the texture preference test conside.red the differ
ence between samples to be slight. All except one group making the com
bination comparisons considered the difference between samples to be
slight at least 50% of the time. The exception was when 9 or 45.0% of

u~ Q)
g Texture ~
Q)
Preference Ci-t Q)
Samples H P-t
Ci-t 0
• 0 z
Coarse 22 over M.,.,.,.;,,m % 1 •. 2.?. Medium 30 >' ..
over CrH:>'r'CI<> 'fa &;? .,?
Coarse 20 over Fi YlA % /.1 .,? Fine 28" over Qn.:i'r'a<> 'fa &;8., 1 Medium. 20 over Fi YlA % '38 .. '5 Fine. 32 over Mo,di 11m % 61.'5 TOTAL 1 'i?
<fo 1 ()().,0
TABLE X
REASONS GIVEN FOR PREFElENCES FOR TEXTURES IN IDE CREAM BY CONSUMERS
71 Juveniles and 81 Adults Difference - Reasons for Between Preference Samples -
-
$ Q)
.p cl1 J.t J.t H H J..t ~ ~ th H 1d CD 0 0 Q) Q) !~ ,8 ~ ti l!! ~ .cl .p .p .p
.,; G) () Vl ~ ta 61 j S-t CD r--1 :Sf;! if! t? (I) 0 0 JqJ:q 11:i 11:i t:Q E-t
18 4 16 5 4 7 15
RL8 18-2 72~7 22.,7 18 .. 2 ?.1 .. 8 68.2
18 7 5 .18 5 20 6 24
h0-0 ?_?,_?, 16-? I.fl 0 , 1.,_ 7 66.,7 ?() () ·80-0
9 3 8 15 6 11 2 17 J.li.O 1-5:.0 .l.0-0 7S-0 30.0 ,:;,:;_Q lQ.,O gi:;.,o
20 7 1 23 3 7 7 21
?Li.. 2,:; n ?,_f.. ~-,- ]Q.,? 2'5.,0 2'5.,Q ?'5-0
10 9 1 14 3 5 ll 6
i:;n .o i.,:;_o ,;_n 70.0 1-5 .. 0 2,:;_o ,:;,:;_o ?,Q.,o
17 13 2 19 ll 10 9 22
'5'3 .. 1 .l.0-h f.,_?, 'iCLJ. ?,l.,J, ?,1 A '3 28.1 68.q Q? 1,.-=i 17 lQ'i ?,?, 'i? 1? 10'5 -
h/').,,:; 28. '3 -,, _? 6Q.l ?l .? 1? .. '5 27 .. 6 69.1
Quality of Sample , Chosen
"O H 0 ..-l 0 (lj
0 ""'
22
100 .. 0
29 l
g6.,7 '3-'1
20 100.,Q
28
100 .. 0
17 3 ~,:; Q 1,:; -0
31 l qf.._g '3 1
1 /,? ,:; af...7 1. j..
s:: .Q) Vl 0
-ft-I .cl oo Ul .p 1:1 0 Ul A
•r-i () Q)
..-l r--1
.p J -~ 0
8 ?,I=,.,?,
9
10-0
0
0-0
5 1?.g
3 1 '5.Q
6
18-8 ?,1
20-1, v.) Vt

.36
the 20 respondents preferring the coarse over the fine textured sample
considered the difference between samples to be slight, .3 or 15.0% mod
erate and 8 or 40.0% great. These results indicate that a majority of
the 152 respondents making the texture tests considered the difference
between samples to be slighto
The results in Table X show that, of the 152 respondents making
the texture preference tests, 105 or 69.1% listed better flavor and 105
or 69.1% listed better texture as reasons for their preferenceso A
majority of each group of respondents making the texture tests consid
ered better flavor as a reason for preference and only one combination
group failed to list better texture as a preference reason at least 50%
of the time. Only 6 or J0.0% of the 20 respondents preferring the med
ium over the fine textured sample considered better texture as a reason
for preference. Since each respondent was allowed to give more than one
reason for preference, the total reasons equal more than 100% for the
number of people. Only 33 or 21.7% of the 152 respondents gave more
flavor as a reason for preference, 57 or 37.5% richer taste and 42 or
27.6% better body. Since better flavor and better texture was each
considered reasons for preference by 105 or 69.1% of the respondents,
the results indicate that they were the two most important reasons for
making the texture preference decisions by the 152 respondents.
The results in Table X show that 147 or 960?% of ~ge 152 respond=
ents making the ice cream texture preference test.considered the quality
of the samples preferred each time to be good. The medium textured
sample was considered a fair quality sample by four of the respondents
who preferred it over the coarse and fine textured samples and one re=
spondent considered the fine textured sample to be fair quality when it

37
was preferred over the medium textured sample. These results indicate
that a large majority of the 152 respondents who participated in the
texture preference test considered the quality of the samples preferred
in each of the texture combinations to be good.
The results in Table X show that the medium textured sample was
criticized by 8 or 36o3% of the 22 respondents preferring the coarse
over the medium textured sample and by 6 or 18.8% of the 32 respondents
preferring the fine over.the medium textured sample. The coarse tex-
tured sample was criticized by 9 or 30.0% of the 30 respondents prefer
ring the medium over the coarse textured sample and by 5 or 17 o 9% of the
28 respondents preferring the fine over the coarse textured sample. The
fine.textured sample was criticized by 3 Or 15.0% of the 20 respondents
preferring the. medium over the fine textured sample and no criticisms
were given for the fine textured sample by the 20 respondents who pre
ferred the coarse over the fine textured sample. It appears from these
results that a goodly number of respondents recognized the fine textured
sample and indicated a definite preference for it over the medium and
coarse textured samples.
E. CONSJMERSv OPINIONS REGARDING FROZEN DESSERTS
A questionnaire was prepared and included as a part of the first
flavor preference survey. The 202 respondents participating in the sur
vey were read each question and their answers recorded. The questions
asked and the .responses received are given in the order in which they
appeared on the questionnaire.
1. l}.Q ~ Q1Qli ~ Qif'ference between ~ cream, ic.e. milk .m:lll
Mellarine? In answer to this question, 82 or 40.6% of the respondents ,.

38
answered "yesll and 120 or 59.4% answered "no. 11
2. JiQli ~ ~ milk differ .t:m.m ~ cream? In answer te> this
question, 72 or 87.8% of the 82 respondents indicating that they knew the
difference stated that ice milk was lower in fat content, 8 or 9.6%
stated that all the butterfat had been removed £ram the ice milk, 4 or
4.9% that milk was used instead of cream in the ice milk and .3 or 3.7%
that there were fewer calories in the ice milk. More than one differ
ence was listed by 5 of the 82 respondents that indicated they knew the
difference in ice milk and ice cream.
3. JiQli ~ Mellorine differ fJ::Qm ~ milk? In answer to this
question, 71 or 86.6% of the 82 respondents indicating that they knew
the difference stated that the difference was the fat source used in the
manufacture of the product, 5 or 6.1% that they didn 1 t know the differ
ence, .3 or 3.7% that the butterfat had been removed from the Mellorine,
2 or 2.4% that Mellorine was higher in fat and 1 or 1.2% that Mellorine
was made with cream.
4. Jimi ·~ ~ l.Q.U ~ ~ c.i;:e.am ~ ~? Two of the 202 re
spondents reported that they never serve or eat ice cream. Of the re
maining 200 respondents, 58 or 29.0% stated that they served ice cream
7 times a week, 2 or 1% said 6 times, 11 or 5.5% said 5 times, 16 or 8%
said 4 times, 35 or 17 .5% said .3 times; .30 or 15% said 2 times, 41 or
20.5% said l time a week, .3 or 1.5% said 2 times monthly and 5 or 2.5%
r~ported 1 time monthly.
5. 1& ~ ~enerNlY serve .th.e. ~ cream .a.a il comes fi.om. .:the. Q.Qll::
tainer? In answer to this question, 146 or 73.0% of the 200 respondents
answered 11yes 11 and 54 or 27.0% answered "no."
lf LW.t, hm:l .d,Q rn chan~e il? Of the 54 respondents answering 11no 11

39
to the first part of the question, 48 or 88.9% stated that they add syrup
or nuts to the ice cream.
6. li&a .:thi. ic.a g;r;:eam, ™ hl:m ~ puraha,sini ;r;:epefJtly :bun satis
taatgz:y? In answer to this question, 197 or 98.5% oi' the 200 respondents
answered "yes" and 3 or 1.5% answered ."no. n·
7 • jba,t, cd,tigisms °'1Q ™ ha.D. Nia,rdini .tAI. qµa,lity ,gt W cna,m?
In ~swer to this question, 190 or 95.0% of the 200 responden.ts answered
"none:;" 5 or 2.5% said 11poor quality'' and 5 or 2.5% said "it contains
too much air. 11
8. ~ .d'2 ™ include ic.a c;r;:ea,m 1n rn men;i.s? In answer to this
question, 157 or 78.5% of the 200 respondents who use ice cream stated
they included ice cream in their menus because their families like it,
3.3 or 16.5% beo·a:use it is nutritious, 29 or 14.5% said it is easy to pre
pare and serve, 16 or 8% stated it makes a good dessert, 5 or 2.5% said
because of medical reasons and 4 or 2% because it is economical. Several
oi' the respondents gave more than one reason.
9. ~ don I t ™ use. m,gm ic.a g;r;:eem? In answer to this question,
77 or 38.5% of the 200 respondents reported that they didn't desire ,ice
cream more often, 29 or 14.5% said because oi' high calorie count, 23 or '
ll. 5% because it was not available at home, 14 or 7% didn I t know why, 20'
or 10% said it was too cold to eat in winter months, 9 or 4.5% reported
beC:liU.Se of a lack of storage space, l or O • 5% said his storage space was
unhandy and required too much energy to get the ice cream and 27 or 13.3%
of the respondents reported that it was too expensive.
10. Which ,gg, YAll ggnsider .:thi. better, hpme-m,a,de icJl g;r;:eam, ~ ggmme:r::
. cial ice cream? In answer to this question, 101 or 50 •. 5% of the 202 re
spondents said "commercial" ice cream, 97 or 48.5% reported 11home-maden

40
ice cream and 4 or 2% had no preference.
~? In answer to the second part of this question, 38 or 37.6% of
the 101 respondents who stated they preferred the commercial ice cream
said it was easier, to prepare and serve, 34 or 33. 7% because it was
better quality consistently, 31 or J..0.7% said it had a better flavor, 14
or 13. 9% reported 11be t ter texture, 11 7 or 6. 9% said 1 ower cost and 7 or
6.9% reported more varieties available.
Of the 97 respondents preferring home-made ice cream, 75 or 77.3%
stated they liked it better because it had a better flavor, 38 or 39.2%
because it was richer, 4. or 4.1% b~cause it contained less calories and
3 or 3.1% because it contained less air.

SUMMARY AND CONCLUSIONS
A study was conducted to determine consumer preferences for var
ious vanilla flavors and of textures in ice creamo
The respondents participating in this study consisted of students
enrolled in foods classes at the Nathan Hale High School and adult food
shoppers in three super market food stores in Tulsa, Oklahoma.
The samples of ice cream used for this study were prepared in the
dairy plant at Oklahoma State University. They were submitted to the
respondents for flavor and texture preference. Additional information
was gained by interviewing the participants in the first flavor survey
regarding their opinions of frozen desserts and the participants in the
second survey on flavor and texture for their reasons for preferences.
A total of 346 respondents participated in the two flavor prefer
ence surveys. The results obtained in the two flavor preference sur
veys, where each two samples were compared 6 times, showed that the
artificial vanilla samples were preferred over the pure vanilla sam
ples in each of the 6 comparisons. The results obtained from the first
flavor survey showed that the artificial was moderately preferred over
the pure vanilla sample. The results obtained in the second flavor
survey showed a slight preference for significance by calculation for
the artificial over the pure vanilla sample by juveniles, a moderate
.preference by calculation by adults and a strong preference by calcu
lation by all respondents.
The results obtained showed that the artificial samples were
41

42
preferred over the fortified vanilla samples in each of the 6 comparisons
in the two flavor surveys. The artificial was slightly preferred over
the fortified samples in each of the 3 comparisons in the first flavor
survey. The results obtained from the second flavor survey showed a
slight preference for significance by calculation for the artificial over
the fortified sample by adults, a slight preference by calculation for
all respondents and a preference of 62.5% to 37.5% for the artificial
over the fortified vanilla sample by the juveniles.
The results obtained in the two flavor surveys further showed that
the fortified samples were preferred over the pure vanilla samples in
5 of the 6 comparisons. The results obtained from the adults in the
' first flavor survey showed that the adults slightly preferred the pure \
over the fd~tified vanilla sample. In each of the 5 other comparisons,
the fortified ~am.plea were slightly preferred over the pure vanilla \
I
\ sampl es but not t o a degree that any preference for significance by cal-
' culation was shown. \
The general resul.ts in the flavor preference studies indicated that
consumers ranked the ice ,cream flavors in the order: artificial, first,
fortified, second and pure ~anilla, third.
The results obtained from. the 152 respondents that participated in
the ice cream texture preference survey indicated that many consumers
can detect fine, medium and coarse textures in ice cream and prefer the
fine over the medium or coarse. The results obtained in the ice cream
texture survey showed a slight consumer preference by percentage for the
fine textured over the medium textured sample and a slight preference
for the medium over the coarse textured sample. Only once, during the
nine texture comparisons was there an exception to the above results.

43
The one exception was when the coarse textured sample was preferred over
the medium textured sample by 31 adults by a percentage comparison of
5408 to 45.2. In only one comparison was any preference for significance
by calculation indicated; and this was shown in the results obtained from
21 juveniles who preferred the medium over the coarse textured sample by
a calculation for significance preference of 11 to 8.98.
The consumers opinions regarding frozen desserts indicated a high re
gard for ice cream. The principal reasons given for using ice cream were
because their families like it, high nutritive value, easy to prepare and
serve, and because it makes a good dessert. Of the 200 respondents
stating that they serve ice cream in the home, 64.5% served ice cream 3
or more times each week and 73.0% generally serve the ice cream as it
comes from the container. In regard to purchasing ice cream, 98.5% said
that the ice cream they have been buying has been satisfactory and 50.0%
preferred commercial ice cream over home-made ice cream.
The reasons for flavor preference given by the respondents showed
that 65.2% listed 11better flavor" as a reason for preference, 44.4%
"more flavor'' and 52,8% 11 richer taste. 11 Also, 94.4% considered the sam
ple chosen to be 11 good. 11 Only 16. 7% of the respondents gave any cri ti
ci sms for the samples preferred. For texture preference reasons, 69.1%
of the 144 respondents listed "better flavor" and 69~1% listed "better
texture."

LITERATURE CITED
1. .American Dairy Association. Highlights From a Study of Public Attitudes and Uses of Dairy Products by .Alfred Politz Besearch, Inc. 1959.
- .. . - -
2. Blakl~y, Leo V., L. Don ~Mullin and Kenneth B. Boggs. Consumer Preferences for Dairy Products and Services in Oklahoma City, Olc:Lahoma. Okl_e.._. A.g:r.. Exp. $ta. Bul. B-494. 1955. '-
1· ••
3. Crow~ -·1. K. ·11 Resui ts Obtained··w1 th a Panel Preference Evaluation o;f.' _I~e_ Cream." lw1 Cream FieJi.d. 6:19-2.?.. 1960.
4. Eckles, C. H~; ·w. B. Combs· -and Harold Macy. Milk and Milk Product,s. McGraw-Hill Boole Company, Inc.;:_ 276-,.295. 194~.
5. England,- ·c. ·-w. - 11 Quali ty Control in Ice Cream Manufacture. 11
~ Cree,m Field. 5:19-40. 1960.
6. Hovanesian, J. D. "Quick Hardening of Ice Cream by Liquid Immersioll." .k!a Cream, Review. 4:98-104. 1960. ·
7. Olson, H. C. and Dorothy Stroder~ Cc;>nsumer Preference studies op. Cott~g~ Cheese. Okla.~ Agr. Exp. __ Sta. Bul. ~"'."555_. 1960.
8. Sohlo·tterer, R. c. "This Vanilla Problem. 11 lsa Cream Rayiew. 6,:lQQ-103. 1960._ ..
9. Woods, Betty. Extension Food Marketing Handbook on Ice Cream. Cooperative Extension Service, Cornell U:niverlility. 1958.
44

VITA
James C • Hamil ton
Candidate for the Degree of
Master of Science
Thesis: A CONSUMER PREFERENCE SI'UDY OF VARIOUS VANILLA FLAVORS AND OF TEXTURES IN ICE CREAM
Major Field: Rural Adult Education
Biographical:
Born: October 6, 1920, Fort Cobb, Oklahoma.
Undergraduate Study: Oklahoma State University, 19.39-194.3.
Graduate Study: Oklahoma state University, 1954-1960.
Experience: Oklahoma Veterans Agricultural Program, Oklahoma Agricultural Extension and United States Army.
Member of: Oklahoma County Agricultural Agents Association, National County Agricultural Agents Association, Masonry, Consistor,, Member of Baptist Church.