Frame and Burst Acquisition in TDMA Satellite Communication Networks with Transponder Hopping
Upload
independentCategory
view
0download
0
Tellus (2008), 60B, 432–469 C© 2008 The AuthorsJournal compilation C© 2008 Blackwell Munksgaard
Printed in Singapore. All rights reservedT E L L U S
Hygroscopic properties of submicrometer atmosphericaerosol particles measured with H-TDMA instruments
in various environments—a review
By E. SWIETLICKI 1∗, H . -C . HANSSON 2, K. HAMERI 3, B . SVENNINGSSON 4,A. MASSLING 5, G . MCFIGGANS 6, P. H . MCMURRY 7, T. PETAJ A 3,8, P. TUNVED 2,
M. GYSEL 9, D . TOPPING 6,10, E . WEINGARTNER 9, U . BALTENSPERGER 9, J . RISSLER 1,A . WIEDENSOHLER 5 and M. KULMALA 3, 1Division of Nuclear Physics, Lund University, PO Box 118,S-22100 Lund, Sweden; 2Department of Applied Environmental Science, Stockholm University, S-10691 Stockholm,Sweden; 3Division of Atmospheric Sciences, PO Box 64, FI-00014 University of Helsinki, Finland; 4Department ofPhysical Geography and Ecosystems Analysis, Lund Univ., PO Box 118, S-221 00 Lund, Sweden; 5Department ofPhysics, Leibniz-Institute for Tropospheric Research, D-04318 Leipzig, Germany; 6Atmospheric Sciences Group,
SEAES, Univ. of Manchester, Oxford Road, Manchester, M13 9PL, UK; 7University Minnesota, Department ofMechanical Engineering, 111 Church St SE, Minneapolis, MN 55455, USA; 8Earth and Sun Systems Laboratory,
Atmospheric Chemistry Division, National Center for Atmospheric Research, PO Box 3000, Boulder, CO 80307-5000,USA; 9Laboratory of Atmospheric Chemistry, Paul Scherrer Institut, 5232, Villigen PSI, Switzerland; 10NCAS, SEAES,
University of Manchester, Oxford Road, Manchester, M13 9PL, UK
(Manuscript received 16 November 2007; in final form 29 February 2008)
ABSTRACTThe hygroscopic properties play a vital role for the direct and indirect effects of aerosols on climate, as well as thehealth effects of particulate matter (PM) by modifying the deposition pattern of inhaled particles in the humid humanrespiratory tract. Hygroscopic Tandem Differential Mobility Analyzer (H-TDMA) instruments have been used in fieldcampaigns in various environments globally over the last 25 yr to determine the water uptake on submicrometre particlesat subsaturated conditions. These investigations have yielded valuable and comprehensive information regarding theparticle hygroscopic properties of the atmospheric aerosol, including state of mixing. These properties determine theequilibrium particle size at ambient relative humidities and have successfully been used to calculate the activation ofparticles at water vapour supersaturation. This paper summarizes the existing published H-TDMA results on the size-resolved submicrometre aerosol particle hygroscopic properties obtained from ground-based measurements at multiplemarine, rural, urban and free tropospheric measurement sites. The data is classified into groups of hygroscopic growthindicating the external mixture, and providing clues to the sources and processes controlling the aerosol. An evaluationis given on how different chemical and physical properties affect the hygroscopic growth.
1. Introduction
Aerosol particles affect the radiation balance of the atmosphere ina number of ways. They scatter and absorb incoming shortwaveradiation and absorb outgoing long-wave radiation (the ‘directaerosol climate effect’). Aerosol particles that act as cloud con-densation nuclei cause changes in droplet number affecting thealbedo and persistence of clouds; the latest IPCC report refer
∗Corresponding author.e-mail: [email protected]: 10.1111/j.1600-0889.2008.00350.x
to these respectively as the cloud albedo and the cloud lifetimeaerosol indirect climate effects (Randall et al., 2007). The hygro-scopic properties of atmospheric aerosol particles are vital for aproper description of these effects, since they describe how theparticles interact with water vapour both at sub and supersatu-rated conditions (e.g. McFiggans et al., 2006). They are thus ofmajor importance in describing the life cycle of the aerosol andthe related direct and indirect effects on climate.
The hygroscopic properties can be measured in great detailusing Hygroscopic Tandem Differential Mobility Analyzers in-struments (H-TDMA). Based on the pioneering work of Liuet al. (1978) a wide variety of designs exist, which are described
432 Tellus 60B (2008), 3
HTDMA REVIEW 433
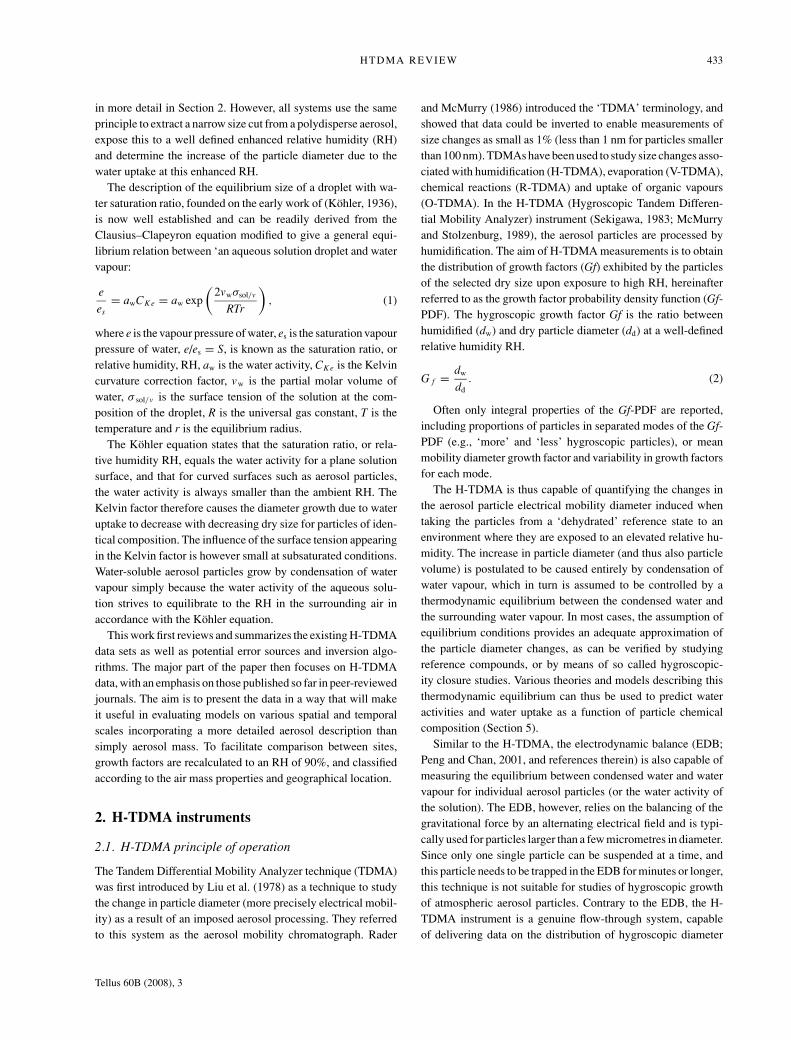
in more detail in Section 2. However, all systems use the sameprinciple to extract a narrow size cut from a polydisperse aerosol,expose this to a well defined enhanced relative humidity (RH)and determine the increase of the particle diameter due to thewater uptake at this enhanced RH.
The description of the equilibrium size of a droplet with wa-ter saturation ratio, founded on the early work of (Kohler, 1936),is now well established and can be readily derived from theClausius–Clapeyron equation modified to give a general equi-librium relation between ‘an aqueous solution droplet and watervapour:
ees
= awCK e = aw exp
(2vwσsol/v
RTr
), (1)
where e is the vapour pressure of water, es is the saturation vapourpressure of water, e/es = S, is known as the saturation ratio, orrelative humidity, RH, aw is the water activity, CK e is the Kelvincurvature correction factor, vw is the partial molar volume ofwater, σ sol/v is the surface tension of the solution at the com-position of the droplet, R is the universal gas constant, T is thetemperature and r is the equilibrium radius.
The Kohler equation states that the saturation ratio, or rela-tive humidity RH, equals the water activity for a plane solutionsurface, and that for curved surfaces such as aerosol particles,the water activity is always smaller than the ambient RH. TheKelvin factor therefore causes the diameter growth due to wateruptake to decrease with decreasing dry size for particles of iden-tical composition. The influence of the surface tension appearingin the Kelvin factor is however small at subsaturated conditions.Water-soluble aerosol particles grow by condensation of watervapour simply because the water activity of the aqueous solu-tion strives to equilibrate to the RH in the surrounding air inaccordance with the Kohler equation.
This work first reviews and summarizes the existing H-TDMAdata sets as well as potential error sources and inversion algo-rithms. The major part of the paper then focuses on H-TDMAdata, with an emphasis on those published so far in peer-reviewedjournals. The aim is to present the data in a way that will makeit useful in evaluating models on various spatial and temporalscales incorporating a more detailed aerosol description thansimply aerosol mass. To facilitate comparison between sites,growth factors are recalculated to an RH of 90%, and classifiedaccording to the air mass properties and geographical location.
2. H-TDMA instruments
2.1. H-TDMA principle of operation
The Tandem Differential Mobility Analyzer technique (TDMA)was first introduced by Liu et al. (1978) as a technique to studythe change in particle diameter (more precisely electrical mobil-ity) as a result of an imposed aerosol processing. They referredto this system as the aerosol mobility chromatograph. Rader
and McMurry (1986) introduced the ‘TDMA’ terminology, andshowed that data could be inverted to enable measurements ofsize changes as small as 1% (less than 1 nm for particles smallerthan 100 nm). TDMAs have been used to study size changes asso-ciated with humidification (H-TDMA), evaporation (V-TDMA),chemical reactions (R-TDMA) and uptake of organic vapours(O-TDMA). In the H-TDMA (Hygroscopic Tandem Differen-tial Mobility Analyzer) instrument (Sekigawa, 1983; McMurryand Stolzenburg, 1989), the aerosol particles are processed byhumidification. The aim of H-TDMA measurements is to obtainthe distribution of growth factors (Gf) exhibited by the particlesof the selected dry size upon exposure to high RH, hereinafterreferred to as the growth factor probability density function (Gf-PDF). The hygroscopic growth factor Gf is the ratio betweenhumidified (dw) and dry particle diameter (dd) at a well-definedrelative humidity RH.
G f = dw
dd. (2)
Often only integral properties of the Gf-PDF are reported,including proportions of particles in separated modes of the Gf-PDF (e.g., ‘more’ and ‘less’ hygroscopic particles), or meanmobility diameter growth factor and variability in growth factorsfor each mode.
The H-TDMA is thus capable of quantifying the changes inthe aerosol particle electrical mobility diameter induced whentaking the particles from a ‘dehydrated’ reference state to anenvironment where they are exposed to an elevated relative hu-midity. The increase in particle diameter (and thus also particlevolume) is postulated to be caused entirely by condensation ofwater vapour, which in turn is assumed to be controlled by athermodynamic equilibrium between the condensed water andthe surrounding water vapour. In most cases, the assumption ofequilibrium conditions provides an adequate approximation ofthe particle diameter changes, as can be verified by studyingreference compounds, or by means of so called hygroscopic-ity closure studies. Various theories and models describing thisthermodynamic equilibrium can thus be used to predict wateractivities and water uptake as a function of particle chemicalcomposition (Section 5).
Similar to the H-TDMA, the electrodynamic balance (EDB;Peng and Chan, 2001, and references therein) is also capable ofmeasuring the equilibrium between condensed water and watervapour for individual aerosol particles (or the water activity ofthe solution). The EDB, however, relies on the balancing of thegravitational force by an alternating electrical field and is typi-cally used for particles larger than a few micrometres in diameter.Since only one single particle can be suspended at a time, andthis particle needs to be trapped in the EDB for minutes or longer,this technique is not suitable for studies of hygroscopic growthof atmospheric aerosol particles. Contrary to the EDB, the H-TDMA instrument is a genuine flow-through system, capableof delivering data on the distribution of hygroscopic diameter
Tellus 60B (2008), 3
434 E. SWIETLICKI ET AL.
growth for a large number of submicrometre aerosol particlesfor each particle dry diameter and RH. The H-TDMA is there-fore well suited for field studies of the hygroscopic properties ofatmospheric aerosol particles.
EDB instruments have nevertheless produced valuable wateractivity data in numerous laboratory studies of both inorganicsalts and water-soluble organic compounds (Kanakidou et al.,2005). These laboratory EDB measurements can be directly in-corporated into thermodynamic models and mixing rules de-scribing the hygroscopic properties because those models oftenexpress water uptake on a mole fraction basis. Such data havebeen used extensively to validate the performance of H-TDMAinstruments. The two instruments also give complementary dataas the EDB provides information about mass increase due to wa-ter uptake and the H-TDMA data represent diameter (volume)changes. A combination of both will thus give information abouteffective density.
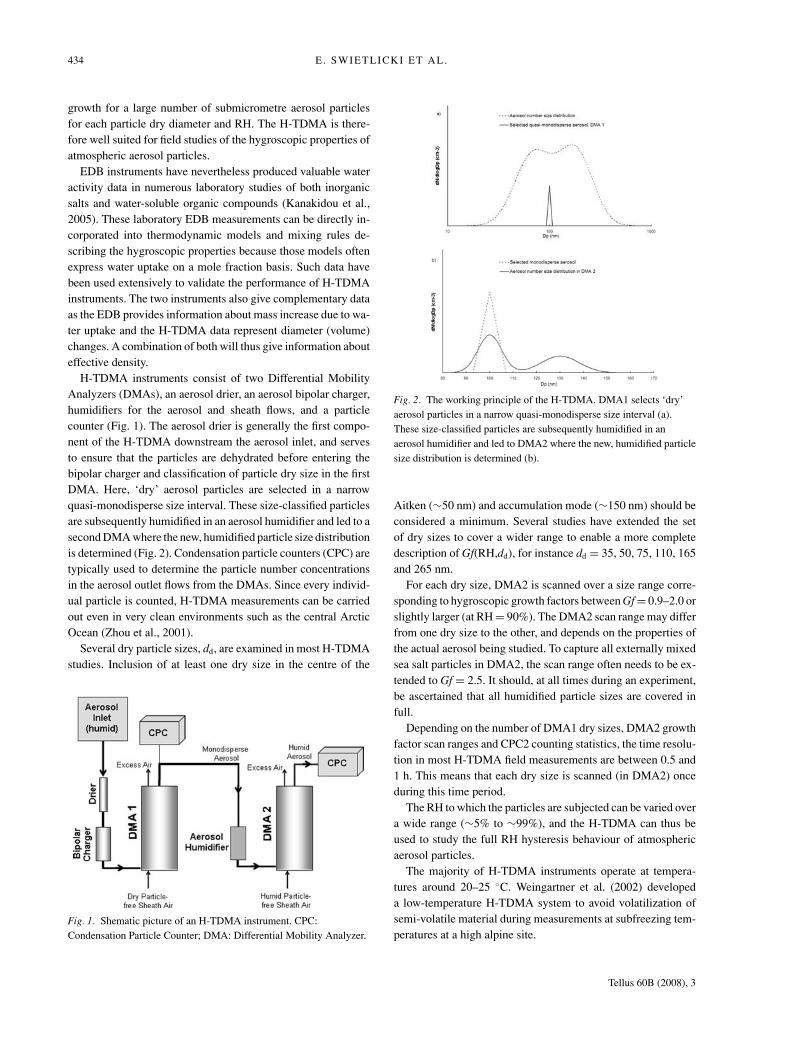
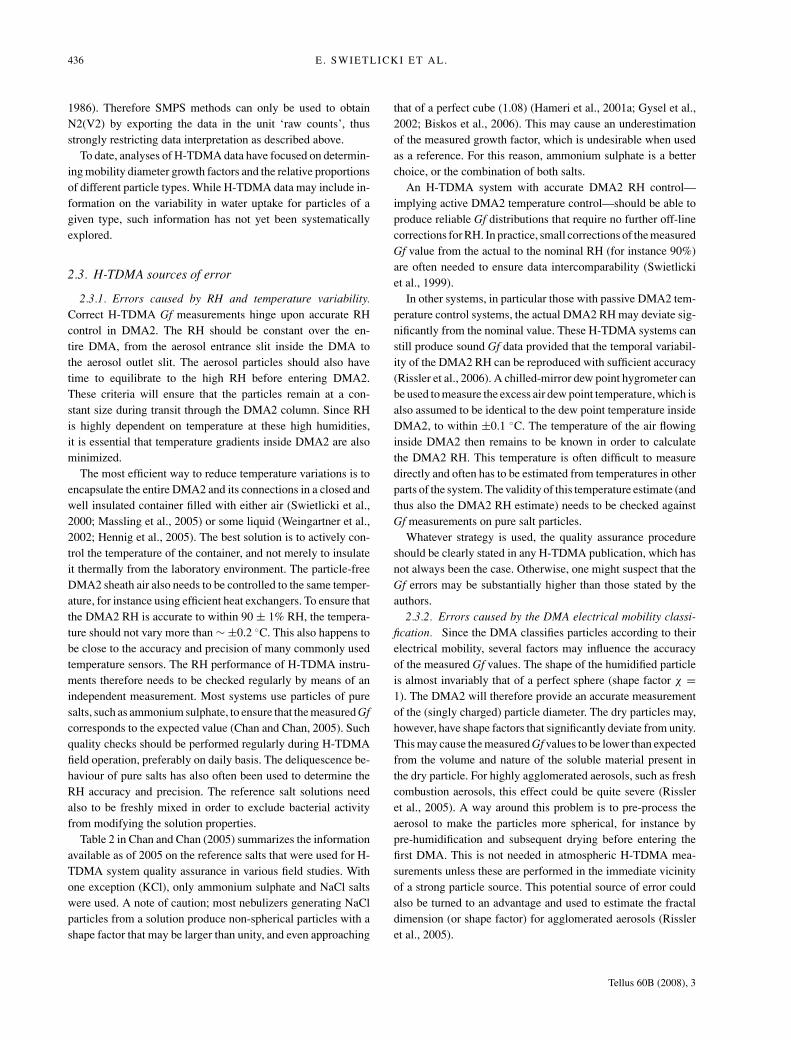
H-TDMA instruments consist of two Differential MobilityAnalyzers (DMAs), an aerosol drier, an aerosol bipolar charger,humidifiers for the aerosol and sheath flows, and a particlecounter (Fig. 1). The aerosol drier is generally the first compo-nent of the H-TDMA downstream the aerosol inlet, and servesto ensure that the particles are dehydrated before entering thebipolar charger and classification of particle dry size in the firstDMA. Here, ‘dry’ aerosol particles are selected in a narrowquasi-monodisperse size interval. These size-classified particlesare subsequently humidified in an aerosol humidifier and led to asecond DMA where the new, humidified particle size distributionis determined (Fig. 2). Condensation particle counters (CPC) aretypically used to determine the particle number concentrationsin the aerosol outlet flows from the DMAs. Since every individ-ual particle is counted, H-TDMA measurements can be carriedout even in very clean environments such as the central ArcticOcean (Zhou et al., 2001).
Several dry particle sizes, dd, are examined in most H-TDMAstudies. Inclusion of at least one dry size in the centre of the
Fig. 1. Shematic picture of an H-TDMA instrument. CPC:Condensation Particle Counter; DMA: Differential Mobility Analyzer.
Fig. 2. The working principle of the H-TDMA. DMA1 selects ‘dry’aerosol particles in a narrow quasi-monodisperse size interval (a).These size-classified particles are subsequently humidified in anaerosol humidifier and led to DMA2 where the new, humidified particlesize distribution is determined (b).
Aitken (∼50 nm) and accumulation mode (∼150 nm) should beconsidered a minimum. Several studies have extended the setof dry sizes to cover a wider range to enable a more completedescription of Gf(RH,dd), for instance dd = 35, 50, 75, 110, 165and 265 nm.
For each dry size, DMA2 is scanned over a size range corre-sponding to hygroscopic growth factors between Gf = 0.9–2.0 orslightly larger (at RH = 90%). The DMA2 scan range may differfrom one dry size to the other, and depends on the properties ofthe actual aerosol being studied. To capture all externally mixedsea salt particles in DMA2, the scan range often needs to be ex-tended to Gf = 2.5. It should, at all times during an experiment,be ascertained that all humidified particle sizes are covered infull.
Depending on the number of DMA1 dry sizes, DMA2 growthfactor scan ranges and CPC2 counting statistics, the time resolu-tion in most H-TDMA field measurements are between 0.5 and1 h. This means that each dry size is scanned (in DMA2) onceduring this time period.
The RH to which the particles are subjected can be varied overa wide range (∼5% to ∼99%), and the H-TDMA can thus beused to study the full RH hysteresis behaviour of atmosphericaerosol particles.
The majority of H-TDMA instruments operate at tempera-tures around 20–25 ◦C. Weingartner et al. (2002) developeda low-temperature H-TDMA system to avoid volatilization ofsemi-volatile material during measurements at subfreezing tem-peratures at a high alpine site.
Tellus 60B (2008), 3

HTDMA REVIEW 435
At present, there are no commercially available H-TDMA in-struments, and all existing instruments are constructed and oper-ated by the various aerosol research groups. The specific designstherefore vary between instruments, although the working prin-ciple and main parts are common to all H-TDMA instruments.In particular, H-TDMA users have chosen different solutions forthe humidity control of the quasi-monodisperse aerosol and theparticle-free sheath air entering the second DMA.
The primary parameters measured with an H-TDMA as a func-tion of dry particle diameter, and derived from the Gf-PDF, are(i) the hygroscopic growth factor (Gf); (ii) the number fraction(AF) of particles belonging to each of the observed and separablegroups of hygroscopic growth and (iii) the spread of diametergrowth factors around the arithmetic mean Gf value (σ Gf ). Al-ternatively, the H-TDMA measurements can also be presentedas distributions of hygroscopic growth factors for each given dryparticle diameter (representations of Gf-PDF).
An aerosol is said to be externally mixed when particles of agiven (dry) size have different chemical composition. In a per-fect internal mixture, all particles have identical composition.The H-TDMA is one of very few aerosol instruments capableof providing on-line and in situ information regarding the extentof external versus internal mixing of the atmospheric aerosol,since the H-TDMA determines the hygroscopic growth of in-dividual aerosol particles. The H-TDMA instrument separatesparticles (of a particular dry size) into groups of similar hygro-scopic properties (water uptake). Although this state of mixingstrictly refers only to the hygroscopic properties, it neverthelessimplies the extent of chemical mixing of the aerosol. However,it needs to be pointed out that externally mixed particles of sim-ilar hygroscopic growth cannot be separated using H-TDMAinstruments.
2.2. TDMA data inversion
As already described, TDMA measurements involve selectingparticles of a given mobility size with DMA1, processing thoseparticles in an ‘aerosol conditioner,’ and measuring the con-centration of those particles (N2) downstream of DMA2 with acondensation particle counter for a sequence of DMA2 classi-fying voltages (V2). In H-TDMA systems, aerosol conditioninginvolves adjusting the relative humidity of the sampled aerosol,which leads to size changes for hygroscopic particles. The de-pendence of concentration on voltage, N2(V2), is obtained bystepping or scanning DMA2.
N2(V2) is then analyzed to obtain information on the Gf-PDF.However, N2(V2) is only a smoothed and skewed image of theGf-PDF because the DMA’s transfer function has a finite widthand because the total transfer probability depends on V2, respec-tively. Mean diameter growth factors and relative proportions ofparticles in separated groups derived from N2(V2) are generallybiased, except for samples exhibiting uniform growth with littlespread. Only coarse information on the variability of behaviour
for particles of a given type is obtained from N2(V2) becauseof the smoothing. Therefore a data inversion algorithm is re-quired to derive the key properties of the Gf-PDF from N2(V2)accurately.
One class of approaches to invert TDMA data takes the Ker-nel function of the full TDMA system into account, thus retriev-ing the true Gf-PDF as close as possible within the limitationsimposed by the inversion algorithm and the measurement un-certainties. The TDMAFit algorithm developed by Stolzenburgand McMurry (1988) allows for the existence of multiple groupsof particles with distinctly different hygroscopic behaviour. Thegroups in the Gf-PDF are assumed to follow a normal distribution(Gaussian shape) with variable standard deviation, thus allow-ing for the possibility that particles of a given type are not allidentical, but rather grow to varying extents due to small differ-ences in composition. The only disadvantage of this approach isthat convergence of fitting multiple groups is not very robust fornearby, overlapping groups. Furthermore, determining whetheror not groups can be resolved is subjective. Cubison et al. (2005)adapted the optimal estimation method of Rodgers (1976, 1990)to H-TDMA data inversion. This approach uses a quasi-inversematrix of the TDMA kernel function in order to retrieve the val-ues of the Gf-PDF at discrete bin positions. This method returnsunambiguous results for given retrieval bins and objectively de-termines the minimum group separation that can be resolved,while it is less effective at evaluating the growth spread factorfor particles of a given type. Gysel et al. (2007) developed aninversion algorithm, which represents the inverted Gf-PDF asa piecewise linear function. This algorithm provides equivalentinformation to TDMAfit, with the advantage that convergenceof the inversion is robust and independent of the initial guess,even for complex asymmetric and multimodal Gf-PDFs. In ad-dition this method objectively determines the minimum groupseparation that can be resolved.
In an alternative class of approaches, only the sizing donewith DMA2 is inverted in order to retrieve the Gf-PDF. In do-ing so it is crucial to account for the narrow size distributionentering DMA2. DMA inversion algorithms that properly invertnarrow size distributions have been developed by, for example,Stratmann et al. (1997) and Voutilainen et al. (2000). A Gf-PDFobtained in this way is somewhat smoothed compared to the trueGf-PDF because the size cut selected by DMA1 is not perfectlymonodisperse. The mean diameter growth factors and relativeproportions of particles in separated groups are accurately de-termined, while the smoothing has a small effect on the growthdispersion within a group.
Some investigators have applied SMPS (Scanning MobilityParticle Sizer) data analysis methods (e.g. Wang and Flagan,1990) to invert N2(V2) data from TDMA systems. However,SMPS methods assume that the mobility distribution enteringDMA2 is invariant across the DMA2 mobility window and theyinclude corrections for charging probability, both of which arenever valid for TDMA measurements (Rader and McMurry,
Tellus 60B (2008), 3
436 E. SWIETLICKI ET AL.
1986). Therefore SMPS methods can only be used to obtainN2(V2) by exporting the data in the unit ‘raw counts’, thusstrongly restricting data interpretation as described above.
To date, analyses of H-TDMA data have focused on determin-ing mobility diameter growth factors and the relative proportionsof different particle types. While H-TDMA data may include in-formation on the variability in water uptake for particles of agiven type, such information has not yet been systematicallyexplored.
2.3. H-TDMA sources of error
2.3.1. Errors caused by RH and temperature variability.Correct H-TDMA Gf measurements hinge upon accurate RHcontrol in DMA2. The RH should be constant over the en-tire DMA, from the aerosol entrance slit inside the DMA tothe aerosol outlet slit. The aerosol particles should also havetime to equilibrate to the high RH before entering DMA2.These criteria will ensure that the particles remain at a con-stant size during transit through the DMA2 column. Since RHis highly dependent on temperature at these high humidities,it is essential that temperature gradients inside DMA2 are alsominimized.
The most efficient way to reduce temperature variations is toencapsulate the entire DMA2 and its connections in a closed andwell insulated container filled with either air (Swietlicki et al.,2000; Massling et al., 2005) or some liquid (Weingartner et al.,2002; Hennig et al., 2005). The best solution is to actively con-trol the temperature of the container, and not merely to insulateit thermally from the laboratory environment. The particle-freeDMA2 sheath air also needs to be controlled to the same temper-ature, for instance using efficient heat exchangers. To ensure thatthe DMA2 RH is accurate to within 90 ± 1% RH, the tempera-ture should not vary more than ∼ ±0.2 ◦C. This also happens tobe close to the accuracy and precision of many commonly usedtemperature sensors. The RH performance of H-TDMA instru-ments therefore needs to be checked regularly by means of anindependent measurement. Most systems use particles of puresalts, such as ammonium sulphate, to ensure that the measured Gfcorresponds to the expected value (Chan and Chan, 2005). Suchquality checks should be performed regularly during H-TDMAfield operation, preferably on daily basis. The deliquescence be-haviour of pure salts has also often been used to determine theRH accuracy and precision. The reference salt solutions needalso to be freshly mixed in order to exclude bacterial activityfrom modifying the solution properties.
Table 2 in Chan and Chan (2005) summarizes the informationavailable as of 2005 on the reference salts that were used for H-TDMA system quality assurance in various field studies. Withone exception (KCl), only ammonium sulphate and NaCl saltswere used. A note of caution; most nebulizers generating NaClparticles from a solution produce non-spherical particles with ashape factor that may be larger than unity, and even approaching
that of a perfect cube (1.08) (Hameri et al., 2001a; Gysel et al.,2002; Biskos et al., 2006). This may cause an underestimationof the measured growth factor, which is undesirable when usedas a reference. For this reason, ammonium sulphate is a betterchoice, or the combination of both salts.
An H-TDMA system with accurate DMA2 RH control—implying active DMA2 temperature control—should be able toproduce reliable Gf distributions that require no further off-linecorrections for RH. In practice, small corrections of the measuredGf value from the actual to the nominal RH (for instance 90%)are often needed to ensure data intercomparability (Swietlickiet al., 1999).
In other systems, in particular those with passive DMA2 tem-perature control systems, the actual DMA2 RH may deviate sig-nificantly from the nominal value. These H-TDMA systems canstill produce sound Gf data provided that the temporal variabil-ity of the DMA2 RH can be reproduced with sufficient accuracy(Rissler et al., 2006). A chilled-mirror dew point hygrometer canbe used to measure the excess air dew point temperature, which isalso assumed to be identical to the dew point temperature insideDMA2, to within ±0.1 ◦C. The temperature of the air flowinginside DMA2 then remains to be known in order to calculatethe DMA2 RH. This temperature is often difficult to measuredirectly and often has to be estimated from temperatures in otherparts of the system. The validity of this temperature estimate (andthus also the DMA2 RH estimate) needs to be checked againstGf measurements on pure salt particles.
Whatever strategy is used, the quality assurance procedureshould be clearly stated in any H-TDMA publication, which hasnot always been the case. Otherwise, one might suspect that theGf errors may be substantially higher than those stated by theauthors.
2.3.2. Errors caused by the DMA electrical mobility classi-fication. Since the DMA classifies particles according to theirelectrical mobility, several factors may influence the accuracyof the measured Gf values. The shape of the humidified particleis almost invariably that of a perfect sphere (shape factor χ =1). The DMA2 will therefore provide an accurate measurementof the (singly charged) particle diameter. The dry particles may,however, have shape factors that significantly deviate from unity.This may cause the measured Gf values to be lower than expectedfrom the volume and nature of the soluble material present inthe dry particle. For highly agglomerated aerosols, such as freshcombustion aerosols, this effect could be quite severe (Rissleret al., 2005). A way around this problem is to pre-process theaerosol to make the particles more spherical, for instance bypre-humidification and subsequent drying before entering thefirst DMA. This is not needed in atmospheric H-TDMA mea-surements unless these are performed in the immediate vicinityof a strong particle source. This potential source of error couldalso be turned to an advantage and used to estimate the fractaldimension (or shape factor) for agglomerated aerosols (Rissleret al., 2005).
Tellus 60B (2008), 3
HTDMA REVIEW 437
Another potential problem relating to the sizing of the parti-cles in DMA1 is the possibility that they may actually not beperfectly dehydrated at the prevailing DMA1 RH. Particles con-taining some compounds may escape efflorescence and retainsmall amounts of particle-bound water when dried. Sulphuricacid is a classic example, but the same may be true for commonatmospheric salts such as ammonium bisulphate and ammoniumnitrate (Mikhailov et al., 2004; Svenningsson et al., 2006a), andmixtures of organic compounds (Marcolli et al., 2004). For thisreason, it is desirable to maintain the DMA1 RH as low as pos-sible, at least <15% RH. The ambient aerosol should also bedried before entering DMA1, preferably also before charging, inorder to minimize the number fraction of multiply charged par-ticles. The unknown shape and phase of the particles in DMA1should be considered as a potential source of error in laboratoryexperiments and closure studies.
In principle, it would be possible to correct for multiplecharges in the TDMA inversion algorithm. The multiple chargecorrection requires knowledge of the (dry) aerosol size distri-bution from the smallest DMA1 dry size to at least twice thelargest dry size. The H-TDMA instrument itself could be usedto generate such data, and if not, parallel size distribution mea-surements using a Differential (or Scanning) Mobility ParticleSizer (DMPS or SMPS) are required. As far as we are aware,H-TDMA multiple charge correction has never been done foratmospheric aerosols. The error introduced by ignoring multiplecharges is probably small in most cases, since the H-TDMA op-erates in a size interval where the fraction of multiple chargedparticles is fairly small (dry sizes < 400 nm). Furthermore, ob-served atmospheric Gf values typically vary rather little betweendiameters corresponding to singly and doubly charged particlesfor a given DMA1 electrical mobility. An impactor may also beplaced between the aerosol drier and DMA1 to at least elimi-nate the supermicrometre sized particles. However, care shouldbe taken when selecting the impactor cut-off diameter since theconversion from equivalent aerodynamic to mobility diametersdepends on particle density, which is often unknown for atmo-spheric aerosols. Nevertheless, multiple charges might be of im-portance when examining the hygroscopic properties of particleswith sizes below the number median diameter of a narrow sizedistribution, which is often the case in laboratory studies. Wetherefore recommend that the effect of multiple charges on themeasured Gf values should be investigated further.
2.3.3. Errors caused by particle non-equilibrium conditionsin DMA2. A basic assumption in H-TDMA measurements isthat the particles in DMA2 are observed when in equilibrium withthe surrounding water vapour. While this is correct for nearly allinorganic salt particles, Chan and Chan (2005) and Kerminen(1997) have pointed out that this is not necessarily true for allatmospheric particles, especially for some organic compounds,very viscous particles, and particles with low accommodationcoefficients. Residence times of a few seconds at the elevatedDMA2 RH or slightly below [as is typically the case in most
H-TDMA systems; Table 2 in Chan and Chan (2005)] may not beenough for such particles to attain their equilibrium humidifiedsize (Sjogren et al., 2007b). This was also observed to be thecase for a small number fraction (<3%) of particles in a study inMexico city (Chuang, 2003). More references on this subject aregiven in Chan and Chan (2005), who also recommended that theresidence time for humidification in H-TDMA studies should bereported.
Evaporation losses of volatile compounds between DMA1and DMA2, for instance for ammonium nitrate particles, mayalso cause problems in H-TDMA measurements. It is difficult toestimate the influence that evaporation may have had on reportedatmospheric Gf values.
2.3.4. Conclusions regarding the accuracy of the publishedH-TDMA data. Considering the possible sources of error in H-TDMA field measurements, it is relevant to ask how reliable theexisting data actually are. Are the data intercomparable? Canthey be used as input data for closure studies? We will limitour discussion to the reliability of the most important primaryparameter derived from the Gf-PDF, namely the hygroscopicgrowth factor (Gf).
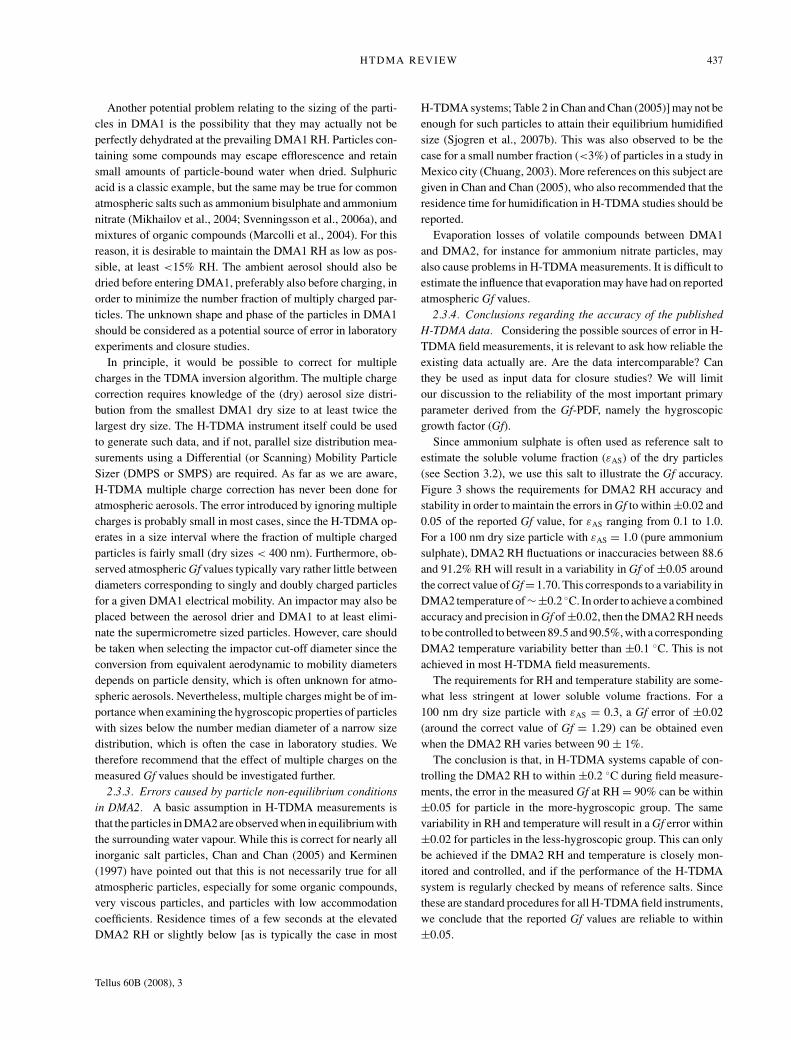
Since ammonium sulphate is often used as reference salt toestimate the soluble volume fraction (εAS) of the dry particles(see Section 3.2), we use this salt to illustrate the Gf accuracy.Figure 3 shows the requirements for DMA2 RH accuracy andstability in order to maintain the errors in Gf to within ±0.02 and0.05 of the reported Gf value, for εAS ranging from 0.1 to 1.0.For a 100 nm dry size particle with εAS = 1.0 (pure ammoniumsulphate), DMA2 RH fluctuations or inaccuracies between 88.6and 91.2% RH will result in a variability in Gf of ±0.05 aroundthe correct value of Gf = 1.70. This corresponds to a variability inDMA2 temperature of ∼±0.2 ◦C. In order to achieve a combinedaccuracy and precision in Gf of ±0.02, then the DMA2 RH needsto be controlled to between 89.5 and 90.5%, with a correspondingDMA2 temperature variability better than ±0.1 ◦C. This is notachieved in most H-TDMA field measurements.
The requirements for RH and temperature stability are some-what less stringent at lower soluble volume fractions. For a100 nm dry size particle with εAS = 0.3, a Gf error of ±0.02(around the correct value of Gf = 1.29) can be obtained evenwhen the DMA2 RH varies between 90 ± 1%.
The conclusion is that, in H-TDMA systems capable of con-trolling the DMA2 RH to within ±0.2 ◦C during field measure-ments, the error in the measured Gf at RH = 90% can be within±0.05 for particle in the more-hygroscopic group. The samevariability in RH and temperature will result in a Gf error within±0.02 for particles in the less-hygroscopic group. This can onlybe achieved if the DMA2 RH and temperature is closely mon-itored and controlled, and if the performance of the H-TDMAsystem is regularly checked by means of reference salts. Sincethese are standard procedures for all H-TDMA field instruments,we conclude that the reported Gf values are reliable to within±0.05.
Tellus 60B (2008), 3
438 E. SWIETLICKI ET AL.
Fig. 3. The effect of variability in RH on themeasured Gf value for ammonium sulphateparticles with 100 nm dry size. The figuresshows the RH required in order to limit theGf value to stay within ±0.05 and ±0.02 ofthe correct value for a range of solublevolume fractions (AS: ammonium sulphateused as model reference salt)
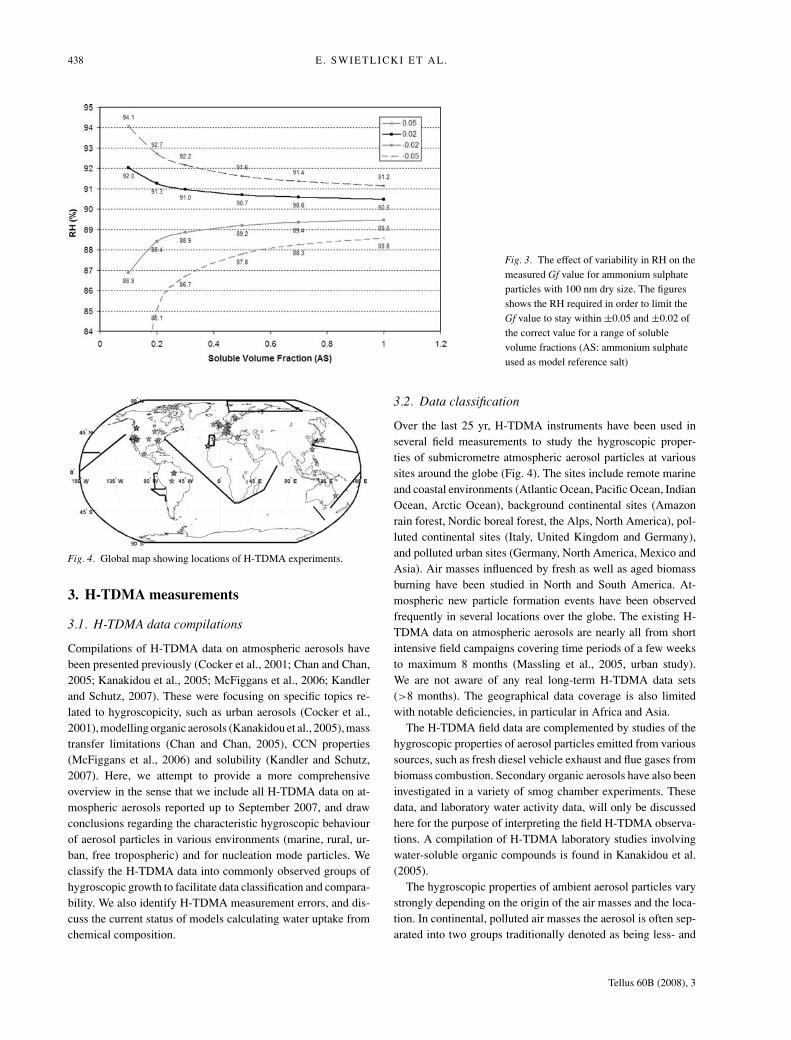
Fig. 4. Global map showing locations of H-TDMA experiments.
3. H-TDMA measurements
3.1. H-TDMA data compilations
Compilations of H-TDMA data on atmospheric aerosols havebeen presented previously (Cocker et al., 2001; Chan and Chan,2005; Kanakidou et al., 2005; McFiggans et al., 2006; Kandlerand Schutz, 2007). These were focusing on specific topics re-lated to hygroscopicity, such as urban aerosols (Cocker et al.,2001), modelling organic aerosols (Kanakidou et al., 2005), masstransfer limitations (Chan and Chan, 2005), CCN properties(McFiggans et al., 2006) and solubility (Kandler and Schutz,2007). Here, we attempt to provide a more comprehensiveoverview in the sense that we include all H-TDMA data on at-mospheric aerosols reported up to September 2007, and drawconclusions regarding the characteristic hygroscopic behaviourof aerosol particles in various environments (marine, rural, ur-ban, free tropospheric) and for nucleation mode particles. Weclassify the H-TDMA data into commonly observed groups ofhygroscopic growth to facilitate data classification and compara-bility. We also identify H-TDMA measurement errors, and dis-cuss the current status of models calculating water uptake fromchemical composition.
3.2. Data classification
Over the last 25 yr, H-TDMA instruments have been used inseveral field measurements to study the hygroscopic proper-ties of submicrometre atmospheric aerosol particles at varioussites around the globe (Fig. 4). The sites include remote marineand coastal environments (Atlantic Ocean, Pacific Ocean, IndianOcean, Arctic Ocean), background continental sites (Amazonrain forest, Nordic boreal forest, the Alps, North America), pol-luted continental sites (Italy, United Kingdom and Germany),and polluted urban sites (Germany, North America, Mexico andAsia). Air masses influenced by fresh as well as aged biomassburning have been studied in North and South America. At-mospheric new particle formation events have been observedfrequently in several locations over the globe. The existing H-TDMA data on atmospheric aerosols are nearly all from shortintensive field campaigns covering time periods of a few weeksto maximum 8 months (Massling et al., 2005, urban study).We are not aware of any real long-term H-TDMA data sets(>8 months). The geographical data coverage is also limitedwith notable deficiencies, in particular in Africa and Asia.
The H-TDMA field data are complemented by studies of thehygroscopic properties of aerosol particles emitted from varioussources, such as fresh diesel vehicle exhaust and flue gases frombiomass combustion. Secondary organic aerosols have also beeninvestigated in a variety of smog chamber experiments. Thesedata, and laboratory water activity data, will only be discussedhere for the purpose of interpreting the field H-TDMA observa-tions. A compilation of H-TDMA laboratory studies involvingwater-soluble organic compounds is found in Kanakidou et al.(2005).
The hygroscopic properties of ambient aerosol particles varystrongly depending on the origin of the air masses and the loca-tion. In continental, polluted air masses the aerosol is often sep-arated into two groups traditionally denoted as being less- and
Tellus 60B (2008), 3

HTDMA REVIEW 439
more-hygroscopic particles. At high wind speeds, remote marineaerosols typically show an external mixture with a ubiquitoussulphate-rich more-hygroscopic particle group and a sea-saltgroup displaying even higher hygroscopic growth. In urban air,nearly hydrophobic particles originating from combustion areobserved in mixtures with long-range transported backgroundaerosol particles that are less- and more-hygroscopic.
Owing to these frequent observations of externally mixedaerosols, the H-TDMA data is often presented as averages ofthe hygroscopic growth factor (Gf) and the number fraction (AF)for each group of hygroscopic growth. In addition, some studiesreport also the spread of diameter growth factors around the aver-age Gf, frequency of occurrence of each hygroscopic group, andfrequency of occurrence of external mixtures. The presentationsof H-TDMA data are not entirely consistent and directly compa-rable, in particular regarding number fractions and frequenciesof occurrence.
Here, we adhere to the traditional nomenclature aiming todescribe the various particle groups of hygroscopic growth.The available field H-TDMA data is thus separated intonearly hydrophobic particles, less-hygroscopic particles, more-hygroscopic particles, and finally sea-salt particles. This coversthe entire range of observed Gf ranging from Gf ≈ 1–2.3 (atRH = 90%).
Since the Kelvin curvature correction results in decreasingGf for decreasing particle size (for particles of identical chem-ical composition and dehydrated shape), the classification ofGf data is more consistent when this curvature effect is takeninto account. A straight-forward and often used way to do thisis to apply the concept of soluble particle volume fraction, ε
(Svenningsson et al., 1994; Swietlicki et al., 1999). The solu-ble volume fraction ε can also be considered a proxy for thechemical composition. A reference compound or chemical com-position has to be used when calculating ε from H-TDMA data.For ammonium sulphate, εAS is calculated according to
εAS = G f 3 − 1
G f 3AS − 1
. (3)
Here, Gf is the measured diameter growth factor, GfAS is thegrowth factor of a fully soluble particle composed entirely of thesame solute material, in this case ammonium sulphate (εAS =1), for the same humidified size and RH as for the observedparticle. GfAS is often calculated from water activity data givenby Tang and Munkelwitz (1994), which properly accounts forthe non-ideal behaviour of the ammonium sulphate solution. Thecurvature of the wetted particle surface has to be considered byusing the Kelvin factor to calculate the water activity aw of thesolution as given in eq. (1). The growth factor Gf(aw, dd, ε), beinga function of aw, dd and ε, (as discussed in Section 5) can thenbe translated into Gf(RH, dd, ε).
Frequent misconceptions are that this εAS can be interpretedas the real soluble volume fractions of the aerosol particles, oras if only ammonium sulphate were responsible for the water
uptake. We strongly emphasize that this is not the case. The εAS
should rather be interpreted as a model representation of a par-ticle containing the same number of soluble ions or molecules(same Raoult’s term in the Kohler equation, see Section 5.1.1),and accordingly having the same hygroscopic growth, as a parti-cle of the same dry size with the volume fraction ε of the modelsalt.
We thus give boundaries for the ε-values for each group ofhygroscopic growth, instead of Gf. The following values of ε
could be used for most data sets to separate the hygroscopicgroups (Gf values are for 100 nm dry size particles at RH =90%):
nearly hydrophobic particles: εAS = 0.0–0.10 (Gf = 1.0–1.11);less-hygroscopic particles: εAS = 0.10–0.35 (Gf = 1.11–1.33);more-hygroscopic particles: εAS > 0.35 (Gf > 1.33);sea-salt particles (in marine air masses): εNaCl > 0.45 (Gf >
1.85)Ammonium sulphate (AS) or NaCl were used as reference
salts to calculate soluble volume fractions (εAS and εNaCl). Notethat Gf = 1.70 for εAS = 1.0 (dd = 100 nm, RH = 90%). Par-ticles in the Aitken mode size range (20–80 nm dry diameter)tend to have somewhat lower values of εAS than particles in theaccumulation mode size range (80–∼500 nm dry diameter), sothe values given above are only for guidance.
Most of the H-TDMA data was acquired at RH = 90%, butfor some data sets, the reported RH in DMA2 was as low as80%. To facilitate the intercomparison between the various ob-servations, all Gf values were recalculated to RH = 90% usingammonium sulphate as model salt, as described by Swietlickiet al. (1999). While these corrected Gf values are rather insen-sitive to the choice of model salt, they may still be somewhatlower than the Gf values that would have been observed had themeasurements actually been carried out at RH = 90%. This un-derestimation would occur if a significant volume fraction of theparticle material goes into solution gradually between the actualDMA2 RH and RH = 90%.
Only a few field studies have performed scans in RH to explorethe aerosol deliquescence and efflorescence behaviour and wa-ter uptake at low RH (McMurry and Stolzenburg, 1989; Zhanget al., 1993; Berg et al., 1998b; Dick et al., 2000; Santarpia etal., 2004; Sjogren et al., 2007a).
The figures with H-TDMA Gf data show the average Gf valuesfor each data set, and are also those listed in the tables. Thevariability in Gf within each data set is not depicted in thesefigures.
3.3. Marine environments
Hygroscopic characteristics of particles in marine environmentshave been studied rather extensively in the past decade (Berget al., 1998b; Swietlicki et al., 2000; Zhou et al., 2001; Vakevaet al., 2002a, b; Dusek et al., 2003; Massling et al., 2003;Massling et al., 2006; Tomlinson et al., 2007). These field studies
Tellus 60B (2008), 3

440 E. SWIETLICKI ET AL.
Fig. 5. Marine H-TDMA hygroscopicdiameter growth factors Gf corrected toRH = 90%, when needed. ‘epsABS’ meansthat the soluble volume fraction wascalculated using ammonium bisulphate asmodel reference salt; ‘epsNaCl’ is similar forNaCl. LH: less-hygroscopic group; MH:more-hygroscopic group; SS: sea salt group.
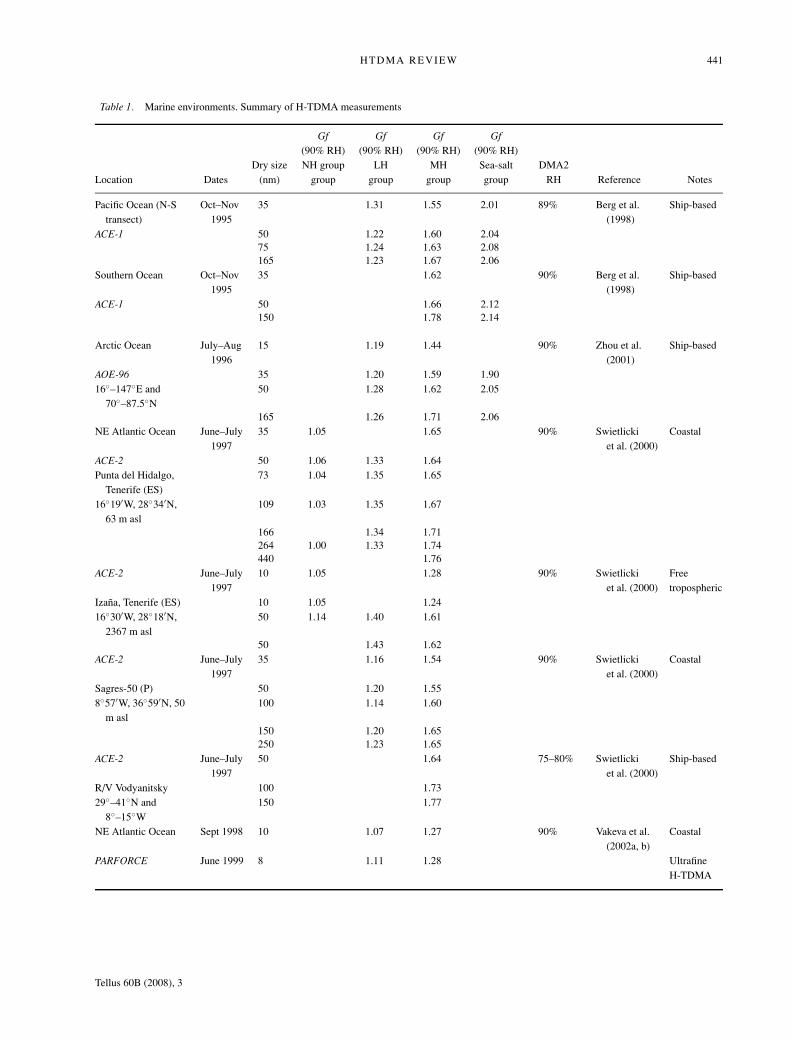
cover several of the major oceans (Atlantic Ocean, Pacific Ocean,Indian Ocean, Arctic Ocean), although each of them is often rep-resented in the H-TDMA data set by one single cruise track (Fig.4). In general, authors describe the appearance of one to four dif-ferent hygroscopic particle groups, depending on air mass origin(Fig. 5, Table 1). A more-hygroscopic particle group is describedas being ubiquitous. Growth factors of this particle group wereobserved to be larger than those found in urban or rural environ-ments, and sometimes even larger than those for pure ammoniumsulphate, implying that partly non-neutralized sulphate is a maincomponent of this particle group. As an example, for 100 nmparticle dry size at RH = 90%, G f = 1.70 for pure ammoniumsulphate (εAS = 1.0), while G f = 1.79 for pure ammoniumbisulphate (εABS = 1.0). Oxidized sulphuric components deriv-ing from emissions of dimethyl sulphide (DMS) from oceanicbiota are typically only partly neutralized by ammonia in remotemarine air masses. The more-hygroscopic particles are by farthe most frequent, appearing in nearly 100% of all observations.During most of the time it is also the only hygroscopic particlegroup observed in remote marine environments in air masseswith no land contact for the last five days.
Externally mixed sea salt particles with growth factorsG f > 1.85 (εNaCl > 0.45) are often observed at high wind speedsin marine environments. Laboratory studies of the number sizedistribution of freshly generated sea salt particles (Martenssonet al., 2003) show a peak in the sea salt particle number flux ataround 100 nm in dry diameter, with significant contributionsto the number fluxes extending down to 20 nm and probablybeyond. Some H-TDMA studies in remote marine air masseshave also reported such sea salt particles down to 35 nm in drysize (Berg et al., 1998b; Zhou et al., 2001). The source strengthof sea salt particles is a very strong function of wind speed (seeMartensson et al. (2003) and references therein) and is in generalonly important at wind speeds >∼6 m s−1.
Although most of the wind-induced sea salt particle mass isfound in the coarse fraction (>1 μm in diameter), by far thelargest number concentrations are generated in the submicrome-tre size region. Considering that both the direct and indirect ef-
fects of aerosols on climate depend more strongly on the par-ticle number concentration than on the mass concentration, theH-TDMA growth factor measurements in marine environmentsare highly relevant.
The calculated soluble volume fraction for particles in the sea-salt group is rather low, or εNaCl ≈ 0.55, when using pure NaCl asthe reference salt. Applying the parametrization of water activityfor filtered sea water samples (SW) by Tang et al. (1997) on theremote marine hygroscopic growth data yields soluble volumefractions significantly closer to unity, or εSW ≈ 1.0.
H-TDMA growth factors measured in the laboratory on sam-ples of sea water taken in the Baltic Sea (1–2 m) and At-lantic deep water (∼3000 m) show G f ≈ 2.1 for 100 nmdry size particles (Nilsson, 2007), in agreement with the EDBsea water (SW) water activity parametrization of Tang et al.(1997).
For the ubiquitous more-hygroscopic particle group, the cor-responding soluble volume fraction is εABS ≈ 0.85, and variable.The question arises what comprises the remaining particle vol-ume in this the most frequently occurring remote marine aerosolparticle group. The available chemical composition data (for in-stance (Ming and Russell, 2001; O’Dowd et al., 2004; Quinnand Bates, 2005; Kaku et al., 2006) indicate that organic com-pounds may make up a considerable mass fraction in some ma-rine aerosol, in particular those influenced by marine biogenicactivity.
Several studies noted that the appearance of externally mixedsea salt particles was far too limited in time to be entirely ac-countable to local wind speed fluctuations (Berg et al., 1998b;Swietlicki et al., 1999; Zhou et al., 2001). It has been suggestedthat this behaviour is caused by an uptake of sulphuric acid andsubsequent release of hydrochloric acid, converting some of thesodium chloride to sodium sulphate, particles of which has aG f of only 1.66 at 90% RH (Svenningsson et al., 2007). Thisformation of sodium sulphate salts will result in a significantdrop in G f to more resemble that of ammonium bisulphate. Ob-servations of excess nonsea-salt sulphate on sea-salt particles(Andreae et al., 1986) support this idea. The short life time of
Tellus 60B (2008), 3
HTDMA REVIEW 441
Table 1. Marine environments. Summary of H-TDMA measurements
Gf Gf Gf Gf(90% RH) (90% RH) (90% RH) (90% RH)
Dry size NH group LH MH Sea-salt DMA2Location Dates (nm) group group group group RH Reference Notes
Pacific Ocean (N-Stransect)
Oct–Nov1995
35 1.31 1.55 2.01 89% Berg et al.(1998)
Ship-based
ACE-1 50 1.22 1.60 2.0475 1.24 1.63 2.08165 1.23 1.67 2.06
Southern Ocean Oct–Nov1995
35 1.62 90% Berg et al.(1998)
Ship-based
ACE-1 50 1.66 2.12150 1.78 2.14
Arctic Ocean July–Aug1996
15 1.19 1.44 90% Zhou et al.(2001)
Ship-based
AOE-96 35 1.20 1.59 1.9016◦–147◦E and
70◦–87.5◦N50 1.28 1.62 2.05
165 1.26 1.71 2.06NE Atlantic Ocean June–July
199735 1.05 1.65 90% Swietlicki
et al. (2000)Coastal
ACE-2 50 1.06 1.33 1.64Punta del Hidalgo,
Tenerife (ES)73 1.04 1.35 1.65
16◦19′W, 28◦34′N,63 m asl
109 1.03 1.35 1.67
166 1.34 1.71264 1.00 1.33 1.74440 1.76
ACE-2 June–July1997
10 1.05 1.28 90% Swietlickiet al. (2000)
Freetropospheric
Izana, Tenerife (ES) 10 1.05 1.2416◦30′W, 28◦18′N,
2367 m asl50 1.14 1.40 1.61
50 1.43 1.62ACE-2 June–July
199735 1.16 1.54 90% Swietlicki
et al. (2000)Coastal
Sagres-50 (P) 50 1.20 1.558◦57′W, 36◦59′N, 50
m asl100 1.14 1.60
150 1.20 1.65250 1.23 1.65
ACE-2 June–July1997
50 1.64 75–80% Swietlickiet al. (2000)
Ship-based
R/V Vodyanitsky 100 1.7329◦–41◦N and
8◦–15◦W150 1.77
NE Atlantic Ocean Sept 1998 10 1.07 1.27 90% Vakeva et al.(2002a, b)
Coastal
PARFORCE June 1999 8 1.11 1.28 UltrafineH-TDMA
Tellus 60B (2008), 3

442 E. SWIETLICKI ET AL.
Table 1. Cont’d.
Gf Gf Gf Gf(90% RH) (90% RH) (90% RH) (90% RH)
Dry size NH group LH MH Sea-salt DMA2Location Dates (nm) group group group group RH Reference Notes
Mace Head (IRL) 10 1.10 1.33 During nucleationbursts
53◦20′N, 9◦54′W 20 1.11 1.43Atlantic Ocean (N-S
transect)Jan–Feb
199950 1.47 1.71 90% Massling
et al.(2003)
Ship-based
Aerosols-99 150 1.46 1.88250 1.35 1.93
Indian Ocean Feb–Mar1999
50 1.48 1.71 90% Masslinget al.(2003)
Ship-based
INDOEX 150 1.64 1.86250 1.64 1.91
Sea of Japan, EastChina Sea
Mar–Apr2001
50 1.58 90% Masslinget al.(2006)
Ship-based
ACE-Asia 150 1.82Around southern
Japan250 1.83 2.03
350 1.86 2.1150 1.42 1.61150 1.46 1.72250 1.47 1.71350 1.6450 1.20 1.52150 1.29 1.61250 1.26 1.65350 1.28 1.7150 1.59 1.77150 1.59 1.83250 1.62 1.88350 1.73 1.9650 1.62150 1.55 1.73250 1.12 1.49 1.75350 1.10 1.37 1.75
Southeastern PacificOcean
Nov 2003 13 1.51 85% Tomlinsonet al.(2007)
Ship-based
Stratus 2003 25 1.49 RH(DMA1) = 17%50 1.50100 1.52200 1.57300 1.59450 1.67600 1.68
85% Tomlinsonet al.(2007)
Ship-based
Tellus 60B (2008), 3
HTDMA REVIEW 443
Table 1. Cont’d.
Gf Gf Gf Gf(90% RH) (90% RH) (90% RH) (90% RH)
Dry size NH group LH MH Sea-salt DMA2Location Dates (nm) group group group group RH Reference Notes
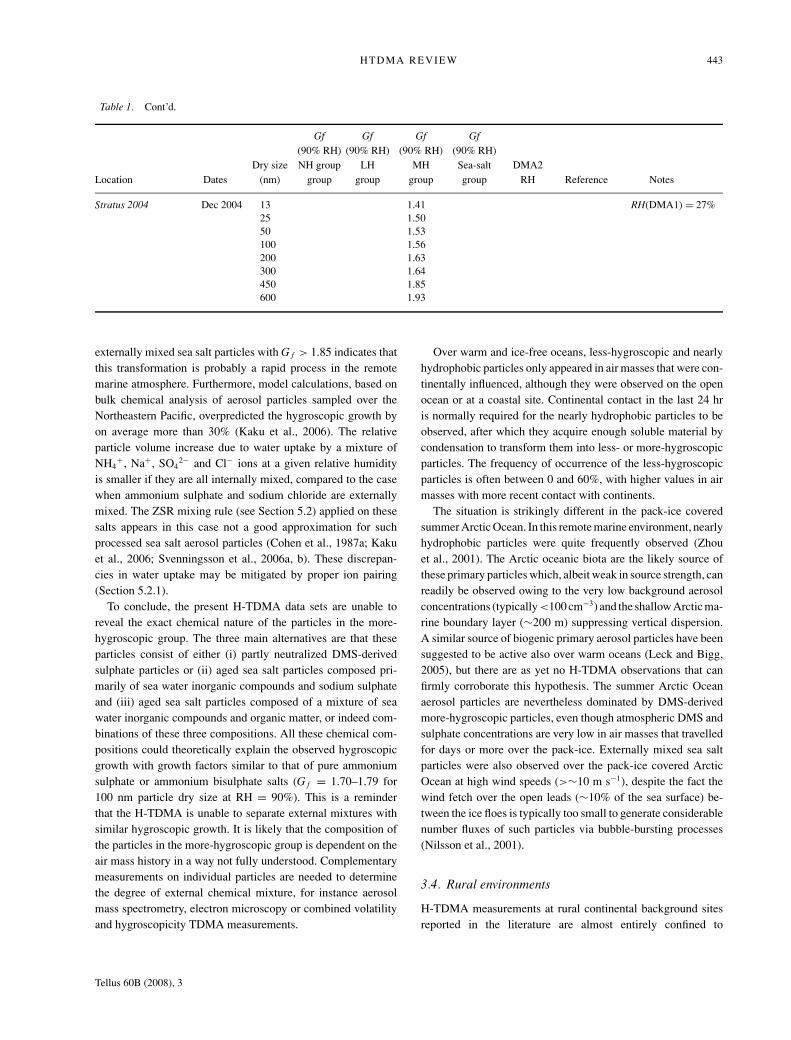
Stratus 2004 Dec 2004 13 1.41 RH(DMA1) = 27%25 1.5050 1.53100 1.56200 1.63300 1.64450 1.85600 1.93
externally mixed sea salt particles with G f > 1.85 indicates thatthis transformation is probably a rapid process in the remotemarine atmosphere. Furthermore, model calculations, based onbulk chemical analysis of aerosol particles sampled over theNortheastern Pacific, overpredicted the hygroscopic growth byon average more than 30% (Kaku et al., 2006). The relativeparticle volume increase due to water uptake by a mixture ofNH4
+, Na+, SO42− and Cl− ions at a given relative humidity
is smaller if they are all internally mixed, compared to the casewhen ammonium sulphate and sodium chloride are externallymixed. The ZSR mixing rule (see Section 5.2) applied on thesesalts appears in this case not a good approximation for suchprocessed sea salt aerosol particles (Cohen et al., 1987a; Kakuet al., 2006; Svenningsson et al., 2006a, b). These discrepan-cies in water uptake may be mitigated by proper ion pairing(Section 5.2.1).
To conclude, the present H-TDMA data sets are unable toreveal the exact chemical nature of the particles in the more-hygroscopic group. The three main alternatives are that theseparticles consist of either (i) partly neutralized DMS-derivedsulphate particles or (ii) aged sea salt particles composed pri-marily of sea water inorganic compounds and sodium sulphateand (iii) aged sea salt particles composed of a mixture of seawater inorganic compounds and organic matter, or indeed com-binations of these three compositions. All these chemical com-positions could theoretically explain the observed hygroscopicgrowth with growth factors similar to that of pure ammoniumsulphate or ammonium bisulphate salts (G f = 1.70–1.79 for100 nm particle dry size at RH = 90%). This is a reminderthat the H-TDMA is unable to separate external mixtures withsimilar hygroscopic growth. It is likely that the composition ofthe particles in the more-hygroscopic group is dependent on theair mass history in a way not fully understood. Complementarymeasurements on individual particles are needed to determinethe degree of external chemical mixture, for instance aerosolmass spectrometry, electron microscopy or combined volatilityand hygroscopicity TDMA measurements.
Over warm and ice-free oceans, less-hygroscopic and nearlyhydrophobic particles only appeared in air masses that were con-tinentally influenced, although they were observed on the openocean or at a coastal site. Continental contact in the last 24 hris normally required for the nearly hydrophobic particles to beobserved, after which they acquire enough soluble material bycondensation to transform them into less- or more-hygroscopicparticles. The frequency of occurrence of the less-hygroscopicparticles is often between 0 and 60%, with higher values in airmasses with more recent contact with continents.
The situation is strikingly different in the pack-ice coveredsummer Arctic Ocean. In this remote marine environment, nearlyhydrophobic particles were quite frequently observed (Zhouet al., 2001). The Arctic oceanic biota are the likely source ofthese primary particles which, albeit weak in source strength, canreadily be observed owing to the very low background aerosolconcentrations (typically<100 cm−3) and the shallow Arctic ma-rine boundary layer (∼200 m) suppressing vertical dispersion.A similar source of biogenic primary aerosol particles have beensuggested to be active also over warm oceans (Leck and Bigg,2005), but there are as yet no H-TDMA observations that canfirmly corroborate this hypothesis. The summer Arctic Oceanaerosol particles are nevertheless dominated by DMS-derivedmore-hygroscopic particles, even though atmospheric DMS andsulphate concentrations are very low in air masses that travelledfor days or more over the pack-ice. Externally mixed sea saltparticles were also observed over the pack-ice covered ArcticOcean at high wind speeds (>∼10 m s−1), despite the fact thewind fetch over the open leads (∼10% of the sea surface) be-tween the ice floes is typically too small to generate considerablenumber fluxes of such particles via bubble-bursting processes(Nilsson et al., 2001).
3.4. Rural environments
H-TDMA measurements at rural continental background sitesreported in the literature are almost entirely confined to
Tellus 60B (2008), 3
444 E. SWIETLICKI ET AL.
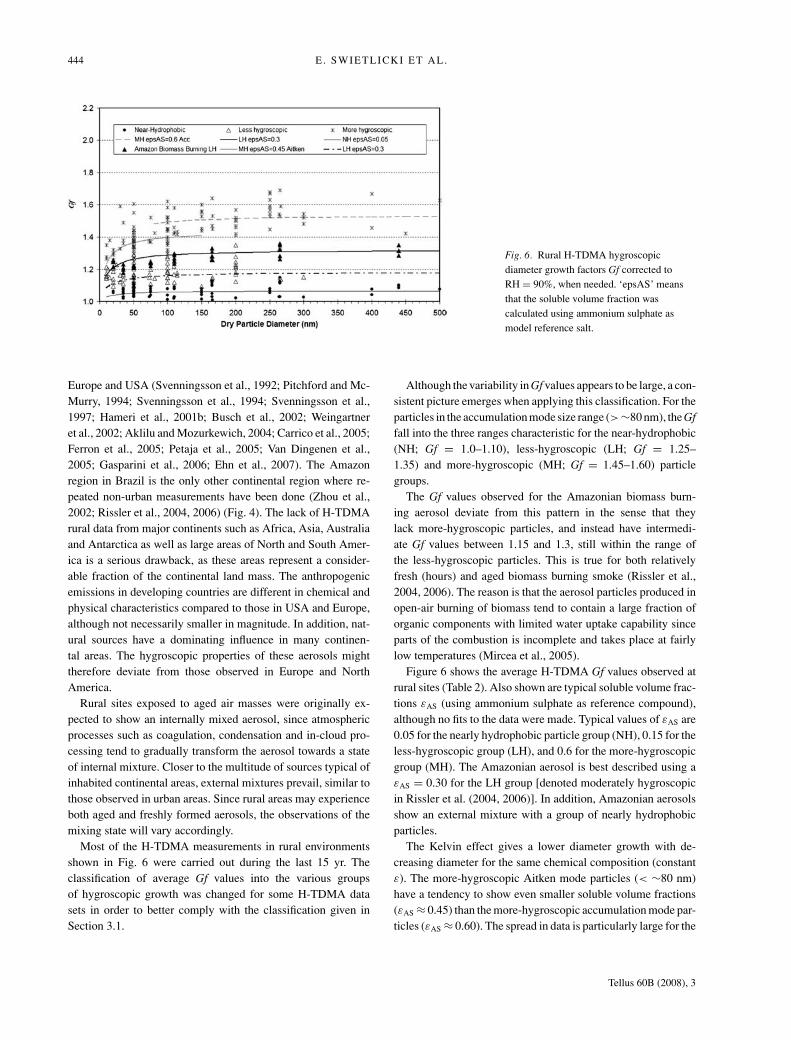
Fig. 6. Rural H-TDMA hygroscopicdiameter growth factors Gf corrected toRH = 90%, when needed. ‘epsAS’ meansthat the soluble volume fraction wascalculated using ammonium sulphate asmodel reference salt.
Europe and USA (Svenningsson et al., 1992; Pitchford and Mc-Murry, 1994; Svenningsson et al., 1994; Svenningsson et al.,1997; Hameri et al., 2001b; Busch et al., 2002; Weingartneret al., 2002; Aklilu and Mozurkewich, 2004; Carrico et al., 2005;Ferron et al., 2005; Petaja et al., 2005; Van Dingenen et al.,2005; Gasparini et al., 2006; Ehn et al., 2007). The Amazonregion in Brazil is the only other continental region where re-peated non-urban measurements have been done (Zhou et al.,2002; Rissler et al., 2004, 2006) (Fig. 4). The lack of H-TDMArural data from major continents such as Africa, Asia, Australiaand Antarctica as well as large areas of North and South Amer-ica is a serious drawback, as these areas represent a consider-able fraction of the continental land mass. The anthropogenicemissions in developing countries are different in chemical andphysical characteristics compared to those in USA and Europe,although not necessarily smaller in magnitude. In addition, nat-ural sources have a dominating influence in many continen-tal areas. The hygroscopic properties of these aerosols mighttherefore deviate from those observed in Europe and NorthAmerica.
Rural sites exposed to aged air masses were originally ex-pected to show an internally mixed aerosol, since atmosphericprocesses such as coagulation, condensation and in-cloud pro-cessing tend to gradually transform the aerosol towards a stateof internal mixture. Closer to the multitude of sources typical ofinhabited continental areas, external mixtures prevail, similar tothose observed in urban areas. Since rural areas may experienceboth aged and freshly formed aerosols, the observations of themixing state will vary accordingly.
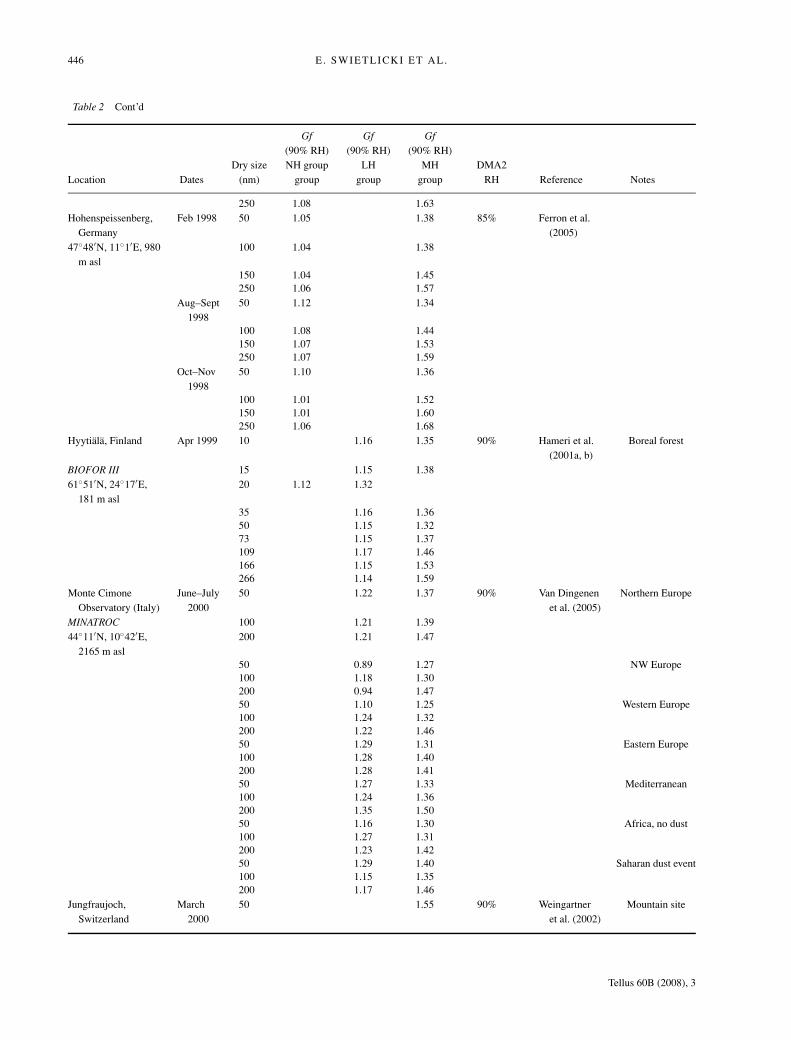
Most of the H-TDMA measurements in rural environmentsshown in Fig. 6 were carried out during the last 15 yr. Theclassification of average Gf values into the various groupsof hygroscopic growth was changed for some H-TDMA datasets in order to better comply with the classification given inSection 3.1.
Although the variability in Gf values appears to be large, a con-sistent picture emerges when applying this classification. For theparticles in the accumulation mode size range (>∼80 nm), the Gffall into the three ranges characteristic for the near-hydrophobic(NH; Gf = 1.0–1.10), less-hygroscopic (LH; Gf = 1.25–1.35) and more-hygroscopic (MH; Gf = 1.45–1.60) particlegroups.
The Gf values observed for the Amazonian biomass burn-ing aerosol deviate from this pattern in the sense that theylack more-hygroscopic particles, and instead have intermedi-ate Gf values between 1.15 and 1.3, still within the range ofthe less-hygroscopic particles. This is true for both relativelyfresh (hours) and aged biomass burning smoke (Rissler et al.,2004, 2006). The reason is that the aerosol particles produced inopen-air burning of biomass tend to contain a large fraction oforganic components with limited water uptake capability sinceparts of the combustion is incomplete and takes place at fairlylow temperatures (Mircea et al., 2005).
Figure 6 shows the average H-TDMA Gf values observed atrural sites (Table 2). Also shown are typical soluble volume frac-tions εAS (using ammonium sulphate as reference compound),although no fits to the data were made. Typical values of εAS are0.05 for the nearly hydrophobic particle group (NH), 0.15 for theless-hygroscopic group (LH), and 0.6 for the more-hygroscopicgroup (MH). The Amazonian aerosol is best described using aεAS = 0.30 for the LH group [denoted moderately hygroscopicin Rissler et al. (2004, 2006)]. In addition, Amazonian aerosolsshow an external mixture with a group of nearly hydrophobicparticles.
The Kelvin effect gives a lower diameter growth with de-creasing diameter for the same chemical composition (constantε). The more-hygroscopic Aitken mode particles (< ∼80 nm)have a tendency to show even smaller soluble volume fractions(εAS ≈ 0.45) than the more-hygroscopic accumulation mode par-ticles (εAS ≈ 0.60). The spread in data is particularly large for the
Tellus 60B (2008), 3

HTDMA REVIEW 445
Table 2. Rural environments. Summary of H-TDMA measurements
Gf Gf Gf(90% RH) (90% RH) (90% RH)
Dry size NH group LH MH DMA2Location Dates (nm) group group group RH Reference Notes
San Pietro diCapofiume, Italy
Nov 1989 30 1.12 1.59 85% Svenningssonet al. (1992)
Po Valley
44◦39′N, 11◦37′E, 11m asl
50 1.13 1.61
100 1.15 1.58150 1.10 1.55200 1.12 1.57
Grand Canyon,Arizona, USA
1990 50 1.15 1.38 89% Pitchford et al.(1994)
Navajo GeneratingStation Visibility
100 1.18 1.45
35◦16′N, 113◦57′W 200 1.18 1.52300 1.15 1.54400 1.08 1.46
Kleiner Feldberg,Germany
Oct–Nov1990
50 1.14 1.43 85% Svenningssonet al. (1994)
50◦12′N, 8◦24′E, 825m asl
150 1.06 1.44
300 1.03 1.48Great Dun Fell, UK Apr–May
199350 1.06 1.34 90% Svenningsson
et al. (1997)EUROTRAC-GCE 75 1.06 1.3754◦42′N, 2◦30′W, 430
m asl110 1.03 1.43
165 1.03 1.47265 1.03 1.53
Great Dun Fell, UK Mar–May1995
35 1.11 1.38 90% Swietlicki etal. (1999)
Pennine ridge, England
EUROTRAC-2PROCLOUD
50 1.12 1.44 Ground-basedcloudexperiment
54◦42′N, 2◦30′W, 430m asl
75 1.11 1.52
110 1.12 1.58165 1.14 1.64265 1.15 1.69
Balbina, Brazil Mar–Apr1998
35 1.05 1.17 1.49 90% Zhou et al.(2002)
Amazon rain forest
CLAIRE-98 50 1.05 1.16 1.38 125 km NE of Manaus, Brazil−1◦55.2′S,
59◦28.1′W73 1.03 1.17 1.38 Wet season, clean air
109 1.02 1.22 1.42166 1.01 1.26 1.45264 1.03 1.32 1.54
SE of Berlin,Germany
July–Aug1998
50 1.12 1.43 90% Busch et al.(2002)
80 km SE Berlin
LACE 98 100 1.12 1.4952◦13′N, 14◦7′E, 98
m asl150 1.08 1.56
Tellus 60B (2008), 3
446 E. SWIETLICKI ET AL.
Table 2 Cont’d
Gf Gf Gf(90% RH) (90% RH) (90% RH)
Dry size NH group LH MH DMA2Location Dates (nm) group group group RH Reference Notes
250 1.08 1.63Hohenspeissenberg,
GermanyFeb 1998 50 1.05 1.38 85% Ferron et al.
(2005)47◦48′N, 11◦1′E, 980
m asl100 1.04 1.38
150 1.04 1.45250 1.06 1.57
Aug–Sept1998
50 1.12 1.34
100 1.08 1.44150 1.07 1.53250 1.07 1.59
Oct–Nov1998
50 1.10 1.36
100 1.01 1.52150 1.01 1.60250 1.06 1.68
Hyytiala, Finland Apr 1999 10 1.16 1.35 90% Hameri et al.(2001a, b)
Boreal forest
BIOFOR III 15 1.15 1.3861◦51′N, 24◦17′E,
181 m asl20 1.12 1.32
35 1.16 1.3650 1.15 1.3273 1.15 1.37109 1.17 1.46166 1.15 1.53266 1.14 1.59
Monte CimoneObservatory (Italy)
June–July2000
50 1.22 1.37 90% Van Dingenenet al. (2005)
Northern Europe
MINATROC 100 1.21 1.3944◦11′N, 10◦42′E,
2165 m asl200 1.21 1.47
50 0.89 1.27 NW Europe100 1.18 1.30200 0.94 1.4750 1.10 1.25 Western Europe100 1.24 1.32200 1.22 1.4650 1.29 1.31 Eastern Europe100 1.28 1.40200 1.28 1.4150 1.27 1.33 Mediterranean100 1.24 1.36200 1.35 1.5050 1.16 1.30 Africa, no dust100 1.27 1.31200 1.23 1.4250 1.29 1.40 Saharan dust event100 1.15 1.35200 1.17 1.46
Jungfraujoch,Switzerland
March2000
50 1.55 90% Weingartneret al. (2002)
Mountain site
Tellus 60B (2008), 3
HTDMA REVIEW 447
Table 2. Cont’d.
Gf Gf Gf(90% RH) (90% RH) (90% RH)
Dry size NH LH MH DMA2Location Dates (nm) group group group RH Reference Notes
46.33◦N, 7.59◦E,3580 m asl
100 1.62 Examples ofdata
250 1.67Balbina, Brazil July 2001 35 1.02 1.14 90% Rissler et al.
(2004)Clean period
CLAIRE-2001 50 1.07 1.17 Amazon rainforest125 km NE ofManaus, Brazil
110 1.08 1.25165 1.05 1.28265 1.15 1.3335 1.03 1.18 Recent
Biomassburning
50 1.04 1.2175 1.07 1.25110 1.09 1.30165 1.12 1.33265 1.12 1.3635 1.02 1.21 Aged Biomass
burning50 1.03 1.2175 1.04 1.24110 1.08 1.29165 1.13 1.31265 1.15 1.35
Golden Ears, USA Aug 2001 81 1.14 1.43 80% Aklilu andMozurkewich(2004)
Pacific 2002 114 1.16 1.4349◦12′53′′N,
122◦34′55′′W, 203m asl
Eagle Ridge, USA Aug 2001 50 1.17 1.40 80% Aklilu andMozurkewich(2004)
Pacific 2002 81 1.1449◦3′8′′N,
122◦14′45′′W, 300m asl
114 1.18 1.42
Yosemite Valley,California, USA
July–Sept2002
100 1.19 1.45 90% Carrico et al.(2005)
YACS 200 1.21 1.5137◦42′N, 119◦42′W,
1615 m aslNear Ouro Preto,
Rondonia, BrazilSept–Nov
200220 1.07 1.25 90% Rissler et al.
(2006)FazendaNossa SenhoraAparecida
Tellus 60B (2008), 3
448 E. SWIETLICKI ET AL.
Table 2. Cont’d.
Gf Gf Gf(90% RH) (90% RH) (90% RH)
Dry size NH LH MH DMA2Location Dates (nm) group group group RH Reference Notes
LBA-SMOCC 35 1.06 1.20 Dry period10◦ 45′44′ ′S,
62◦21′27′ ′W, 315m asl
50 1.07 1.23 Biomass burning
75 1.07 1.22110 1.08 1.24165 1.10 1.26265 1.12 1.26440 1.10 1.2920 1.07 1.26 Transition period35 1.07 1.23 Biomass burning50 1.07 1.2275 1.08 1.24110 1.09 1.26165 1.10 1.26265 1.12 1.28440 1.10 1.3220 1.06 1.22 Wet period35 1.08 1.2150 1.09 1.2175 1.09 1.24110 1.09 1.27165 1.11 1.29265 1.13 1.32440 1.09 1.35
Hyytiala, Finland Mar–Apr2003
10 1.14 89% Petaja et al.(2005)
Before nucleation
QUEST 20 1.09 Clean Artic airmasses
61◦51′N, 24◦17′E,181 m asl
50 1.10
10 1.15 Arctic and Estonia20 1.2150 1.2410 1.22 Arctic Kola20 1.2550 1.4610 1.17 Right after nucle-
ationoccurring
20 1.19 Clean Arctic50 1.2210 1.27 Arctic and Estonia20 1.2950 1.3410 1.28 Arctic Kola20 1.2650 1.44
ARM SGP,Oklahoma, USA
May 2003 12 1.20 85% Gasparini etal. (2006)
36◦37′N, 97◦30′W,315 m asl
25 1.23
Tellus 60B (2008), 3
HTDMA REVIEW 449
Table 2. Cont’d.
Gf Gf Gf(90% RH) (90% RH) (90% RH)
Dry size NH LH MH DMA2Location Dates (nm) group group group RH Reference Notes
50 1.29100 1.40200 1.51300 1.52450 1.42600 1.35
Hyytiala, Finland Apr–May2005
20 1.14 88% Ehn et al.(2007)
Boreal forest, night
QUEST 30 1.1661◦51′N, 24◦17′E,
181 m asl50 1.20
20 1.30 Boreal forest, midday30 1.3350 1.34
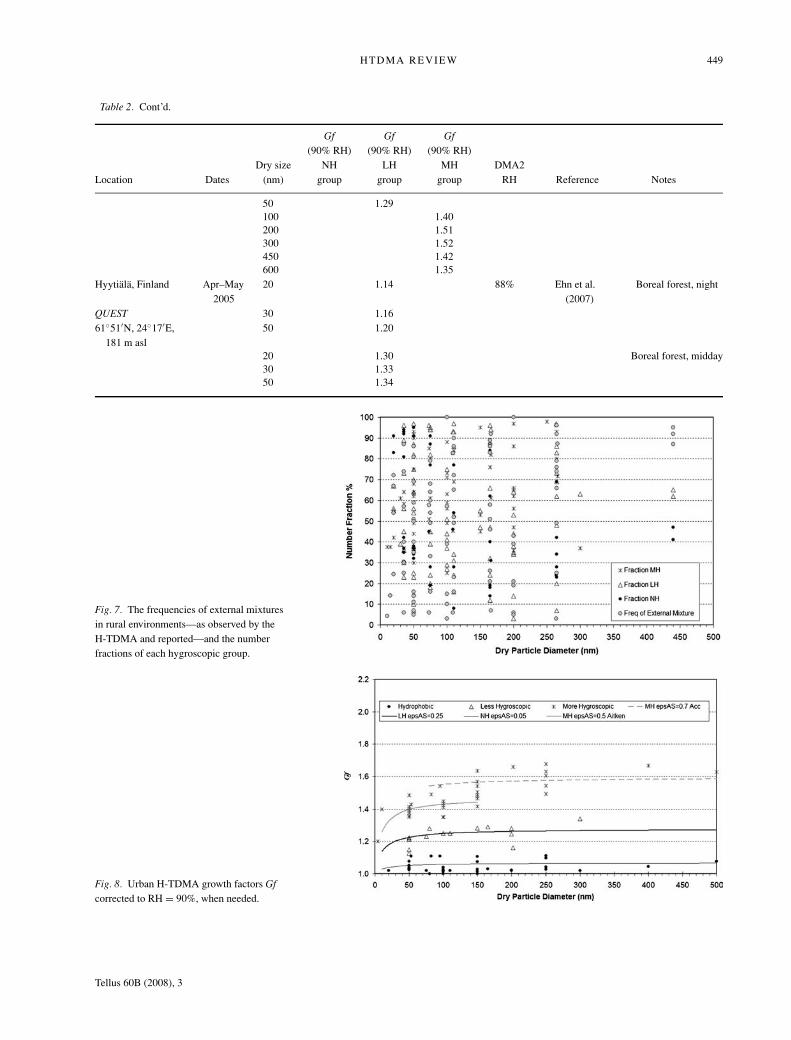
Fig. 7. The frequencies of external mixturesin rural environments—as observed by theH-TDMA and reported—and the numberfractions of each hygroscopic group.
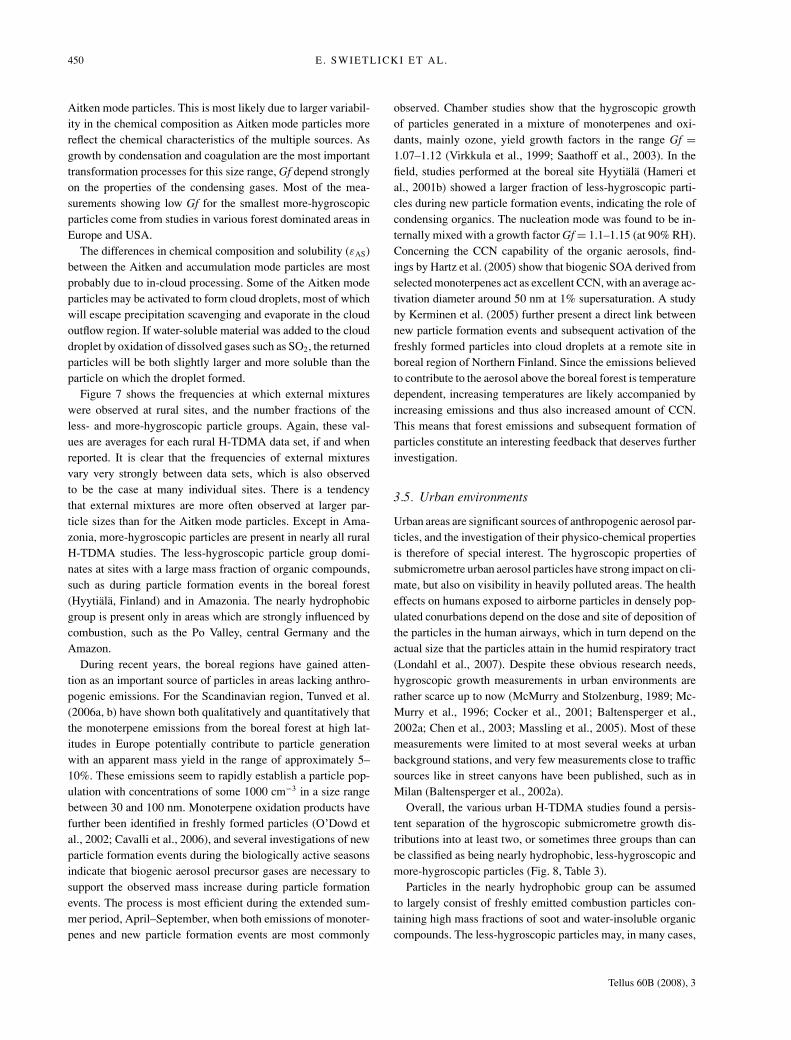
Fig. 8. Urban H-TDMA growth factors Gfcorrected to RH = 90%, when needed.
Tellus 60B (2008), 3
450 E. SWIETLICKI ET AL.
Aitken mode particles. This is most likely due to larger variabil-ity in the chemical composition as Aitken mode particles morereflect the chemical characteristics of the multiple sources. Asgrowth by condensation and coagulation are the most importanttransformation processes for this size range, Gf depend stronglyon the properties of the condensing gases. Most of the mea-surements showing low Gf for the smallest more-hygroscopicparticles come from studies in various forest dominated areas inEurope and USA.
The differences in chemical composition and solubility (εAS)between the Aitken and accumulation mode particles are mostprobably due to in-cloud processing. Some of the Aitken modeparticles may be activated to form cloud droplets, most of whichwill escape precipitation scavenging and evaporate in the cloudoutflow region. If water-soluble material was added to the clouddroplet by oxidation of dissolved gases such as SO2, the returnedparticles will be both slightly larger and more soluble than theparticle on which the droplet formed.
Figure 7 shows the frequencies at which external mixtureswere observed at rural sites, and the number fractions of theless- and more-hygroscopic particle groups. Again, these val-ues are averages for each rural H-TDMA data set, if and whenreported. It is clear that the frequencies of external mixturesvary very strongly between data sets, which is also observedto be the case at many individual sites. There is a tendencythat external mixtures are more often observed at larger par-ticle sizes than for the Aitken mode particles. Except in Ama-zonia, more-hygroscopic particles are present in nearly all ruralH-TDMA studies. The less-hygroscopic particle group domi-nates at sites with a large mass fraction of organic compounds,such as during particle formation events in the boreal forest(Hyytiala, Finland) and in Amazonia. The nearly hydrophobicgroup is present only in areas which are strongly influenced bycombustion, such as the Po Valley, central Germany and theAmazon.
During recent years, the boreal regions have gained atten-tion as an important source of particles in areas lacking anthro-pogenic emissions. For the Scandinavian region, Tunved et al.(2006a, b) have shown both qualitatively and quantitatively thatthe monoterpene emissions from the boreal forest at high lat-itudes in Europe potentially contribute to particle generationwith an apparent mass yield in the range of approximately 5–10%. These emissions seem to rapidly establish a particle pop-ulation with concentrations of some 1000 cm−3 in a size rangebetween 30 and 100 nm. Monoterpene oxidation products havefurther been identified in freshly formed particles (O’Dowd etal., 2002; Cavalli et al., 2006), and several investigations of newparticle formation events during the biologically active seasonsindicate that biogenic aerosol precursor gases are necessary tosupport the observed mass increase during particle formationevents. The process is most efficient during the extended sum-mer period, April–September, when both emissions of monoter-penes and new particle formation events are most commonly
observed. Chamber studies show that the hygroscopic growthof particles generated in a mixture of monoterpenes and oxi-dants, mainly ozone, yield growth factors in the range Gf =1.07–1.12 (Virkkula et al., 1999; Saathoff et al., 2003). In thefield, studies performed at the boreal site Hyytiala (Hameri etal., 2001b) showed a larger fraction of less-hygroscopic parti-cles during new particle formation events, indicating the role ofcondensing organics. The nucleation mode was found to be in-ternally mixed with a growth factor Gf = 1.1–1.15 (at 90% RH).Concerning the CCN capability of the organic aerosols, find-ings by Hartz et al. (2005) show that biogenic SOA derived fromselected monoterpenes act as excellent CCN, with an average ac-tivation diameter around 50 nm at 1% supersaturation. A studyby Kerminen et al. (2005) further present a direct link betweennew particle formation events and subsequent activation of thefreshly formed particles into cloud droplets at a remote site inboreal region of Northern Finland. Since the emissions believedto contribute to the aerosol above the boreal forest is temperaturedependent, increasing temperatures are likely accompanied byincreasing emissions and thus also increased amount of CCN.This means that forest emissions and subsequent formation ofparticles constitute an interesting feedback that deserves furtherinvestigation.
3.5. Urban environments
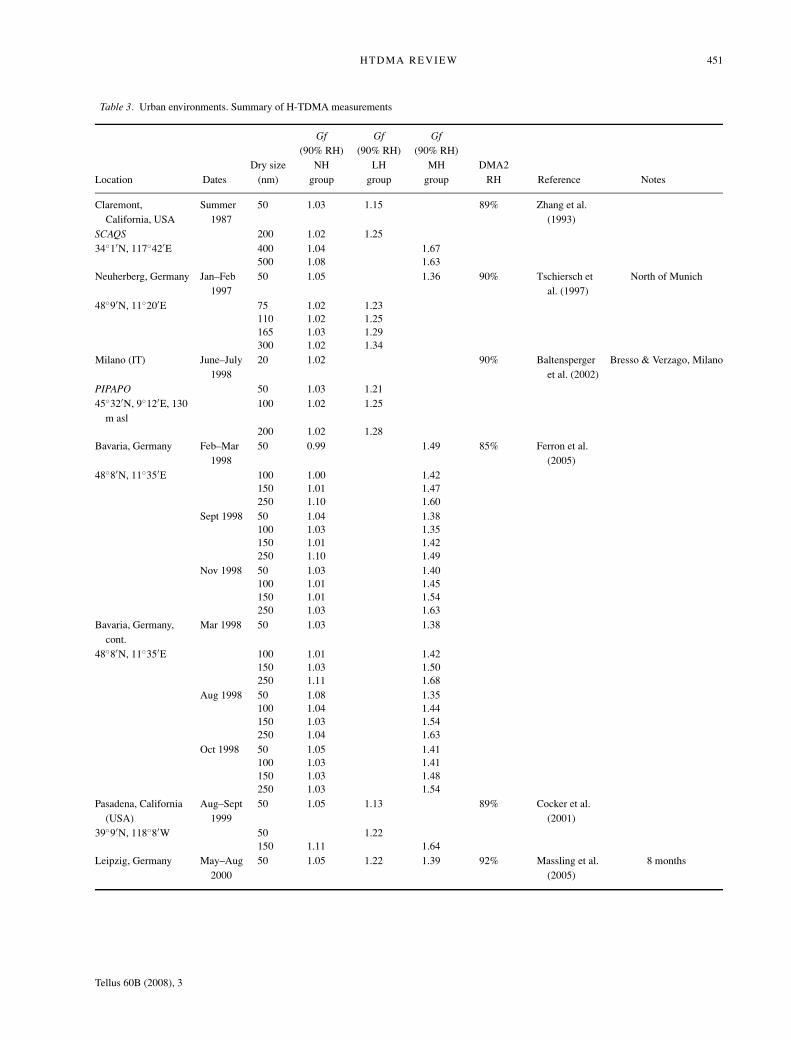
Urban areas are significant sources of anthropogenic aerosol par-ticles, and the investigation of their physico-chemical propertiesis therefore of special interest. The hygroscopic properties ofsubmicrometre urban aerosol particles have strong impact on cli-mate, but also on visibility in heavily polluted areas. The healtheffects on humans exposed to airborne particles in densely pop-ulated conurbations depend on the dose and site of deposition ofthe particles in the human airways, which in turn depend on theactual size that the particles attain in the humid respiratory tract(Londahl et al., 2007). Despite these obvious research needs,hygroscopic growth measurements in urban environments arerather scarce up to now (McMurry and Stolzenburg, 1989; Mc-Murry et al., 1996; Cocker et al., 2001; Baltensperger et al.,2002a; Chen et al., 2003; Massling et al., 2005). Most of thesemeasurements were limited to at most several weeks at urbanbackground stations, and very few measurements close to trafficsources like in street canyons have been published, such as inMilan (Baltensperger et al., 2002a).
Overall, the various urban H-TDMA studies found a persis-tent separation of the hygroscopic submicrometre growth dis-tributions into at least two, or sometimes three groups than canbe classified as being nearly hydrophobic, less-hygroscopic andmore-hygroscopic particles (Fig. 8, Table 3).
Particles in the nearly hydrophobic group can be assumedto largely consist of freshly emitted combustion particles con-taining high mass fractions of soot and water-insoluble organiccompounds. The less-hygroscopic particles may, in many cases,
Tellus 60B (2008), 3
HTDMA REVIEW 451
Table 3. Urban environments. Summary of H-TDMA measurements
Gf Gf Gf(90% RH) (90% RH) (90% RH)
Dry size NH LH MH DMA2Location Dates (nm) group group group RH Reference Notes
Claremont,California, USA
Summer1987
50 1.03 1.15 89% Zhang et al.(1993)
SCAQS 200 1.02 1.2534◦1′N, 117◦42′E 400 1.04 1.67
500 1.08 1.63Neuherberg, Germany Jan–Feb
199750 1.05 1.36 90% Tschiersch et
al. (1997)North of Munich
48◦9′N, 11◦20′E 75 1.02 1.23110 1.02 1.25165 1.03 1.29300 1.02 1.34
Milano (IT) June–July1998
20 1.02 90% Baltenspergeret al. (2002)
Bresso & Verzago, Milano
PIPAPO 50 1.03 1.2145◦32′N, 9◦12′E, 130
m asl100 1.02 1.25
200 1.02 1.28Bavaria, Germany Feb–Mar
199850 0.99 1.49 85% Ferron et al.
(2005)48◦8′N, 11◦35′E 100 1.00 1.42
150 1.01 1.47250 1.10 1.60
Sept 1998 50 1.04 1.38100 1.03 1.35150 1.01 1.42250 1.10 1.49
Nov 1998 50 1.03 1.40100 1.01 1.45150 1.01 1.54250 1.03 1.63
Bavaria, Germany,cont.
Mar 1998 50 1.03 1.38
48◦8′N, 11◦35′E 100 1.01 1.42150 1.03 1.50250 1.11 1.68
Aug 1998 50 1.08 1.35100 1.04 1.44150 1.03 1.54250 1.04 1.63
Oct 1998 50 1.05 1.41100 1.03 1.41150 1.03 1.48250 1.03 1.54
Pasadena, California(USA)
Aug–Sept1999
50 1.05 1.13 89% Cocker et al.(2001)
39◦9′N, 118◦8′W 50 1.22150 1.11 1.64
Leipzig, Germany May–Aug2000
50 1.05 1.22 1.39 92% Massling et al.(2005)
8 months
Tellus 60B (2008), 3
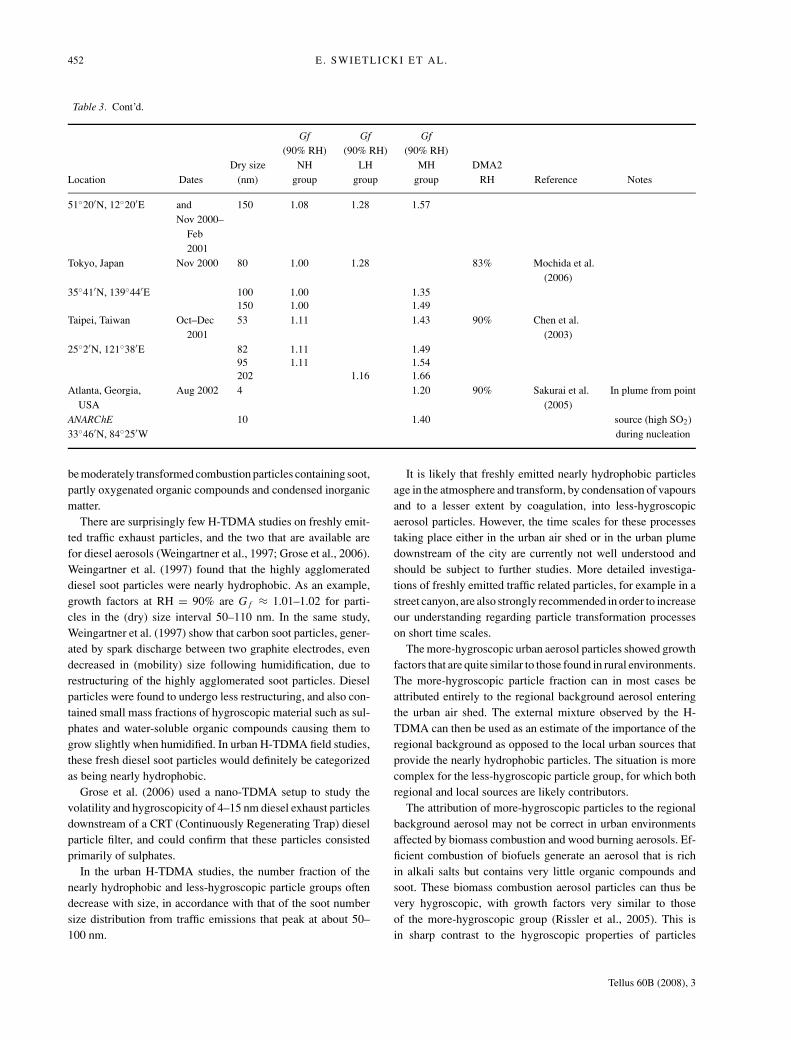
452 E. SWIETLICKI ET AL.
Table 3. Cont’d.
Gf Gf Gf(90% RH) (90% RH) (90% RH)
Dry size NH LH MH DMA2Location Dates (nm) group group group RH Reference Notes
51◦20′N, 12◦20′E and 150 1.08 1.28 1.57Nov 2000–
Feb2001
Tokyo, Japan Nov 2000 80 1.00 1.28 83% Mochida et al.(2006)
35◦41′N, 139◦44′E 100 1.00 1.35150 1.00 1.49
Taipei, Taiwan Oct–Dec2001
53 1.11 1.43 90% Chen et al.(2003)
25◦2′N, 121◦38′E 82 1.11 1.4995 1.11 1.54202 1.16 1.66
Atlanta, Georgia,USA
Aug 2002 4 1.20 90% Sakurai et al.(2005)
In plume from point
ANARChE 10 1.40 source (high SO2)33◦46′N, 84◦25′W during nucleation
be moderately transformed combustion particles containing soot,partly oxygenated organic compounds and condensed inorganicmatter.
There are surprisingly few H-TDMA studies on freshly emit-ted traffic exhaust particles, and the two that are available arefor diesel aerosols (Weingartner et al., 1997; Grose et al., 2006).Weingartner et al. (1997) found that the highly agglomerateddiesel soot particles were nearly hydrophobic. As an example,growth factors at RH = 90% are G f ≈ 1.01–1.02 for parti-cles in the (dry) size interval 50–110 nm. In the same study,Weingartner et al. (1997) show that carbon soot particles, gener-ated by spark discharge between two graphite electrodes, evendecreased in (mobility) size following humidification, due torestructuring of the highly agglomerated soot particles. Dieselparticles were found to undergo less restructuring, and also con-tained small mass fractions of hygroscopic material such as sul-phates and water-soluble organic compounds causing them togrow slightly when humidified. In urban H-TDMA field studies,these fresh diesel soot particles would definitely be categorizedas being nearly hydrophobic.
Grose et al. (2006) used a nano-TDMA setup to study thevolatility and hygroscopicity of 4–15 nm diesel exhaust particlesdownstream of a CRT (Continuously Regenerating Trap) dieselparticle filter, and could confirm that these particles consistedprimarily of sulphates.
In the urban H-TDMA studies, the number fraction of thenearly hydrophobic and less-hygroscopic particle groups oftendecrease with size, in accordance with that of the soot numbersize distribution from traffic emissions that peak at about 50–100 nm.
It is likely that freshly emitted nearly hydrophobic particlesage in the atmosphere and transform, by condensation of vapoursand to a lesser extent by coagulation, into less-hygroscopicaerosol particles. However, the time scales for these processestaking place either in the urban air shed or in the urban plumedownstream of the city are currently not well understood andshould be subject to further studies. More detailed investiga-tions of freshly emitted traffic related particles, for example in astreet canyon, are also strongly recommended in order to increaseour understanding regarding particle transformation processeson short time scales.
The more-hygroscopic urban aerosol particles showed growthfactors that are quite similar to those found in rural environments.The more-hygroscopic particle fraction can in most cases beattributed entirely to the regional background aerosol enteringthe urban air shed. The external mixture observed by the H-TDMA can then be used as an estimate of the importance of theregional background as opposed to the local urban sources thatprovide the nearly hydrophobic particles. The situation is morecomplex for the less-hygroscopic particle group, for which bothregional and local sources are likely contributors.
The attribution of more-hygroscopic particles to the regionalbackground aerosol may not be correct in urban environmentsaffected by biomass combustion and wood burning aerosols. Ef-ficient combustion of biofuels generate an aerosol that is richin alkali salts but contains very little organic compounds andsoot. These biomass combustion aerosol particles can thus bevery hygroscopic, with growth factors very similar to thoseof the more-hygroscopic group (Rissler et al., 2005). This isin sharp contrast to the hygroscopic properties of particles
Tellus 60B (2008), 3
HTDMA REVIEW 453
emitted from low-temperature incomplete combustion of bio-fuels, as discussed already for Amazonian biomass burningaerosols.
Using ammonium sulphate as reference salt, the soluble vol-ume fractions of the more-hygroscopic group are grouped aroundεAS ≈ 0.7 for the accumulation mode size range, and εAS ≈0.5 for the Aitken mode size range. This in an indication thatthe more-hygroscopic particles may have been processed duringtransport in the regional background air, resulting in a highersoluble fraction for the larger particles.
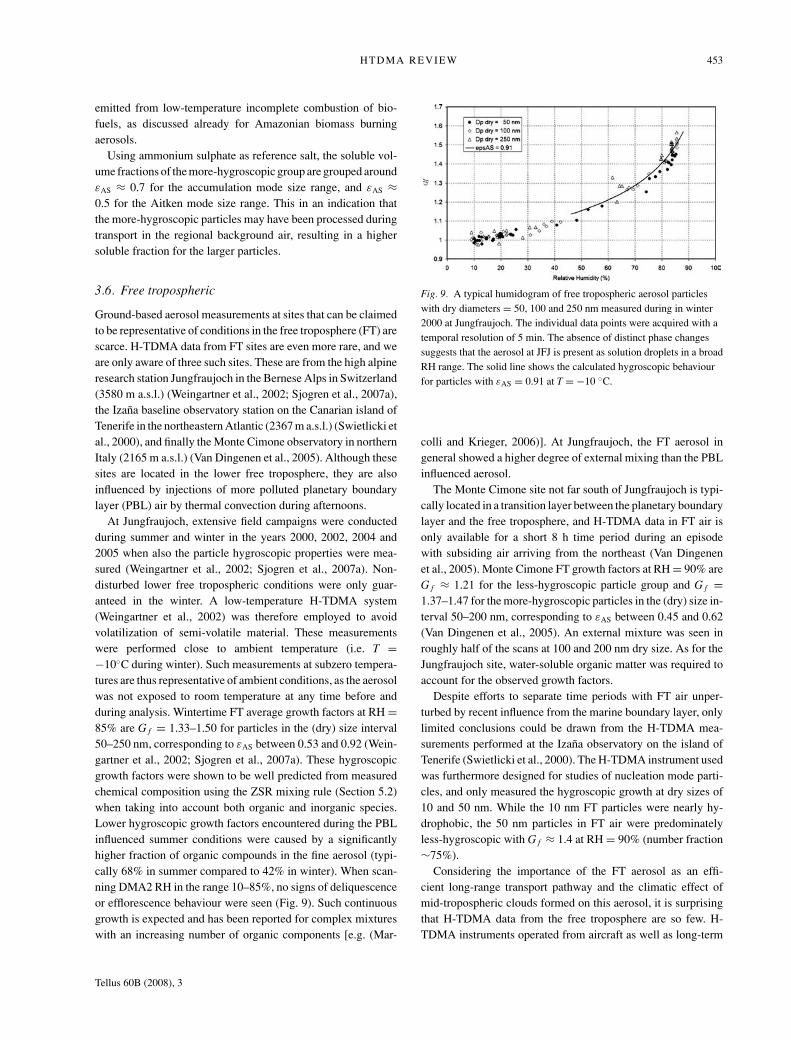
3.6. Free tropospheric
Ground-based aerosol measurements at sites that can be claimedto be representative of conditions in the free troposphere (FT) arescarce. H-TDMA data from FT sites are even more rare, and weare only aware of three such sites. These are from the high alpineresearch station Jungfraujoch in the Bernese Alps in Switzerland(3580 m a.s.l.) (Weingartner et al., 2002; Sjogren et al., 2007a),the Izana baseline observatory station on the Canarian island ofTenerife in the northeastern Atlantic (2367 m a.s.l.) (Swietlicki etal., 2000), and finally the Monte Cimone observatory in northernItaly (2165 m a.s.l.) (Van Dingenen et al., 2005). Although thesesites are located in the lower free troposphere, they are alsoinfluenced by injections of more polluted planetary boundarylayer (PBL) air by thermal convection during afternoons.
At Jungfraujoch, extensive field campaigns were conductedduring summer and winter in the years 2000, 2002, 2004 and2005 when also the particle hygroscopic properties were mea-sured (Weingartner et al., 2002; Sjogren et al., 2007a). Non-disturbed lower free tropospheric conditions were only guar-anteed in the winter. A low-temperature H-TDMA system(Weingartner et al., 2002) was therefore employed to avoidvolatilization of semi-volatile material. These measurementswere performed close to ambient temperature (i.e. T =−10◦C during winter). Such measurements at subzero tempera-tures are thus representative of ambient conditions, as the aerosolwas not exposed to room temperature at any time before andduring analysis. Wintertime FT average growth factors at RH =85% are G f = 1.33–1.50 for particles in the (dry) size interval50–250 nm, corresponding to εAS between 0.53 and 0.92 (Wein-gartner et al., 2002; Sjogren et al., 2007a). These hygroscopicgrowth factors were shown to be well predicted from measuredchemical composition using the ZSR mixing rule (Section 5.2)when taking into account both organic and inorganic species.Lower hygroscopic growth factors encountered during the PBLinfluenced summer conditions were caused by a significantlyhigher fraction of organic compounds in the fine aerosol (typi-cally 68% in summer compared to 42% in winter). When scan-ning DMA2 RH in the range 10–85%, no signs of deliquescenceor efflorescence behaviour were seen (Fig. 9). Such continuousgrowth is expected and has been reported for complex mixtureswith an increasing number of organic components [e.g. (Mar-
Fig. 9. A typical humidogram of free tropospheric aerosol particleswith dry diameters = 50, 100 and 250 nm measured during in winter2000 at Jungfraujoch. The individual data points were acquired with atemporal resolution of 5 min. The absence of distinct phase changessuggests that the aerosol at JFJ is present as solution droplets in a broadRH range. The solid line shows the calculated hygroscopic behaviourfor particles with εAS = 0.91 at T = −10 ◦C.
colli and Krieger, 2006)]. At Jungfraujoch, the FT aerosol ingeneral showed a higher degree of external mixing than the PBLinfluenced aerosol.
The Monte Cimone site not far south of Jungfraujoch is typi-cally located in a transition layer between the planetary boundarylayer and the free troposphere, and H-TDMA data in FT air isonly available for a short 8 h time period during an episodewith subsiding air arriving from the northeast (Van Dingenenet al., 2005). Monte Cimone FT growth factors at RH = 90% areG f ≈ 1.21 for the less-hygroscopic particle group and G f =1.37–1.47 for the more-hygroscopic particles in the (dry) size in-terval 50–200 nm, corresponding to εAS between 0.45 and 0.62(Van Dingenen et al., 2005). An external mixture was seen inroughly half of the scans at 100 and 200 nm dry size. As for theJungfraujoch site, water-soluble organic matter was required toaccount for the observed growth factors.
Despite efforts to separate time periods with FT air unper-turbed by recent influence from the marine boundary layer, onlylimited conclusions could be drawn from the H-TDMA mea-surements performed at the Izana observatory on the island ofTenerife (Swietlicki et al., 2000). The H-TDMA instrument usedwas furthermore designed for studies of nucleation mode parti-cles, and only measured the hygroscopic growth at dry sizes of10 and 50 nm. While the 10 nm FT particles were nearly hy-drophobic, the 50 nm particles in FT air were predominatelyless-hygroscopic with G f ≈ 1.4 at RH = 90% (number fraction∼75%).
Considering the importance of the FT aerosol as an effi-cient long-range transport pathway and the climatic effect ofmid-tropospheric clouds formed on this aerosol, it is surprisingthat H-TDMA data from the free troposphere are so few. H-TDMA instruments operated from aircraft as well as long-term
Tellus 60B (2008), 3
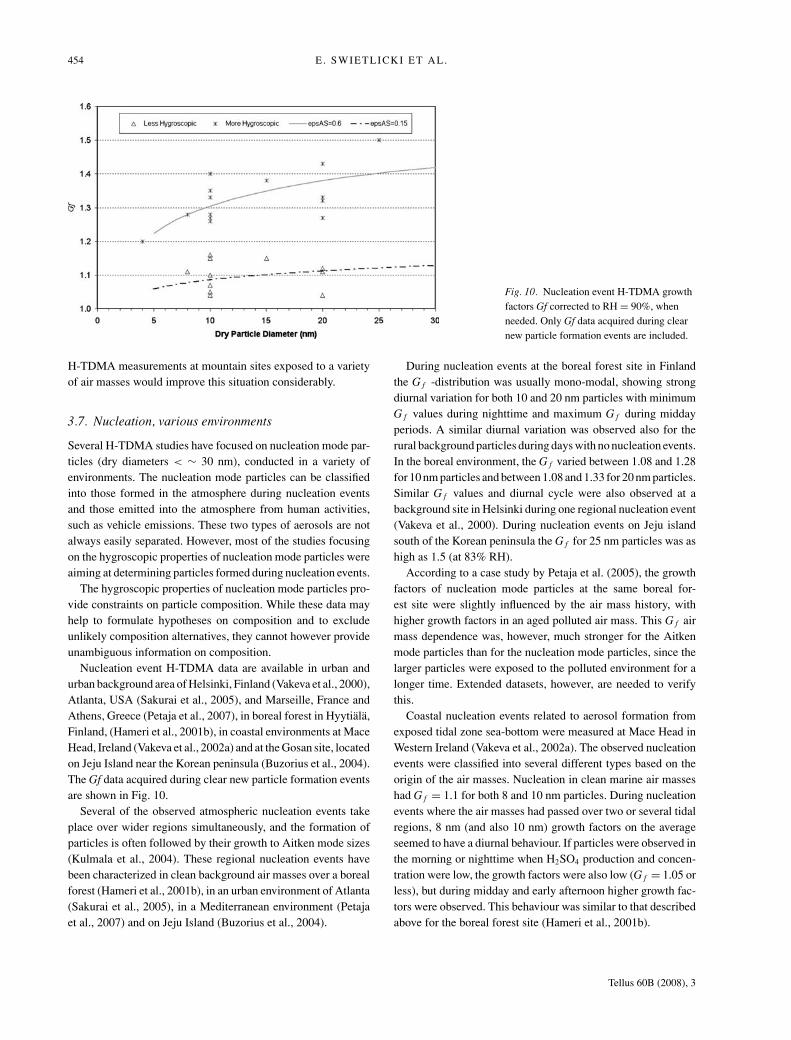
454 E. SWIETLICKI ET AL.
Fig. 10. Nucleation event H-TDMA growthfactors Gf corrected to RH = 90%, whenneeded. Only Gf data acquired during clearnew particle formation events are included.
H-TDMA measurements at mountain sites exposed to a varietyof air masses would improve this situation considerably.
3.7. Nucleation, various environments
Several H-TDMA studies have focused on nucleation mode par-ticles (dry diameters < ∼ 30 nm), conducted in a variety ofenvironments. The nucleation mode particles can be classifiedinto those formed in the atmosphere during nucleation eventsand those emitted into the atmosphere from human activities,such as vehicle emissions. These two types of aerosols are notalways easily separated. However, most of the studies focusingon the hygroscopic properties of nucleation mode particles wereaiming at determining particles formed during nucleation events.
The hygroscopic properties of nucleation mode particles pro-vide constraints on particle composition. While these data mayhelp to formulate hypotheses on composition and to excludeunlikely composition alternatives, they cannot however provideunambiguous information on composition.
Nucleation event H-TDMA data are available in urban andurban background area of Helsinki, Finland (Vakeva et al., 2000),Atlanta, USA (Sakurai et al., 2005), and Marseille, France andAthens, Greece (Petaja et al., 2007), in boreal forest in Hyytiala,Finland, (Hameri et al., 2001b), in coastal environments at MaceHead, Ireland (Vakeva et al., 2002a) and at the Gosan site, locatedon Jeju Island near the Korean peninsula (Buzorius et al., 2004).The Gf data acquired during clear new particle formation eventsare shown in Fig. 10.
Several of the observed atmospheric nucleation events takeplace over wider regions simultaneously, and the formation ofparticles is often followed by their growth to Aitken mode sizes(Kulmala et al., 2004). These regional nucleation events havebeen characterized in clean background air masses over a borealforest (Hameri et al., 2001b), in an urban environment of Atlanta(Sakurai et al., 2005), in a Mediterranean environment (Petajaet al., 2007) and on Jeju Island (Buzorius et al., 2004).
During nucleation events at the boreal forest site in Finlandthe G f -distribution was usually mono-modal, showing strongdiurnal variation for both 10 and 20 nm particles with minimumG f values during nighttime and maximum G f during middayperiods. A similar diurnal variation was observed also for therural background particles during days with no nucleation events.In the boreal environment, the G f varied between 1.08 and 1.28for 10 nm particles and between 1.08 and 1.33 for 20 nm particles.Similar G f values and diurnal cycle were also observed at abackground site in Helsinki during one regional nucleation event(Vakeva et al., 2000). During nucleation events on Jeju islandsouth of the Korean peninsula the G f for 25 nm particles was ashigh as 1.5 (at 83% RH).
According to a case study by Petaja et al. (2005), the growthfactors of nucleation mode particles at the same boreal for-est site were slightly influenced by the air mass history, withhigher growth factors in an aged polluted air mass. This G f airmass dependence was, however, much stronger for the Aitkenmode particles than for the nucleation mode particles, since thelarger particles were exposed to the polluted environment for alonger time. Extended datasets, however, are needed to verifythis.
Coastal nucleation events related to aerosol formation fromexposed tidal zone sea-bottom were measured at Mace Head inWestern Ireland (Vakeva et al., 2002a). The observed nucleationevents were classified into several different types based on theorigin of the air masses. Nucleation in clean marine air masseshad G f = 1.1 for both 8 and 10 nm particles. During nucleationevents where the air masses had passed over two or several tidalregions, 8 nm (and also 10 nm) growth factors on the averageseemed to have a diurnal behaviour. If particles were observed inthe morning or nighttime when H2SO4 production and concen-tration were low, the growth factors were also low (G f = 1.05 orless), but during midday and early afternoon higher growth fac-tors were observed. This behaviour was similar to that describedabove for the boreal forest site (Hameri et al., 2001b).
Tellus 60B (2008), 3
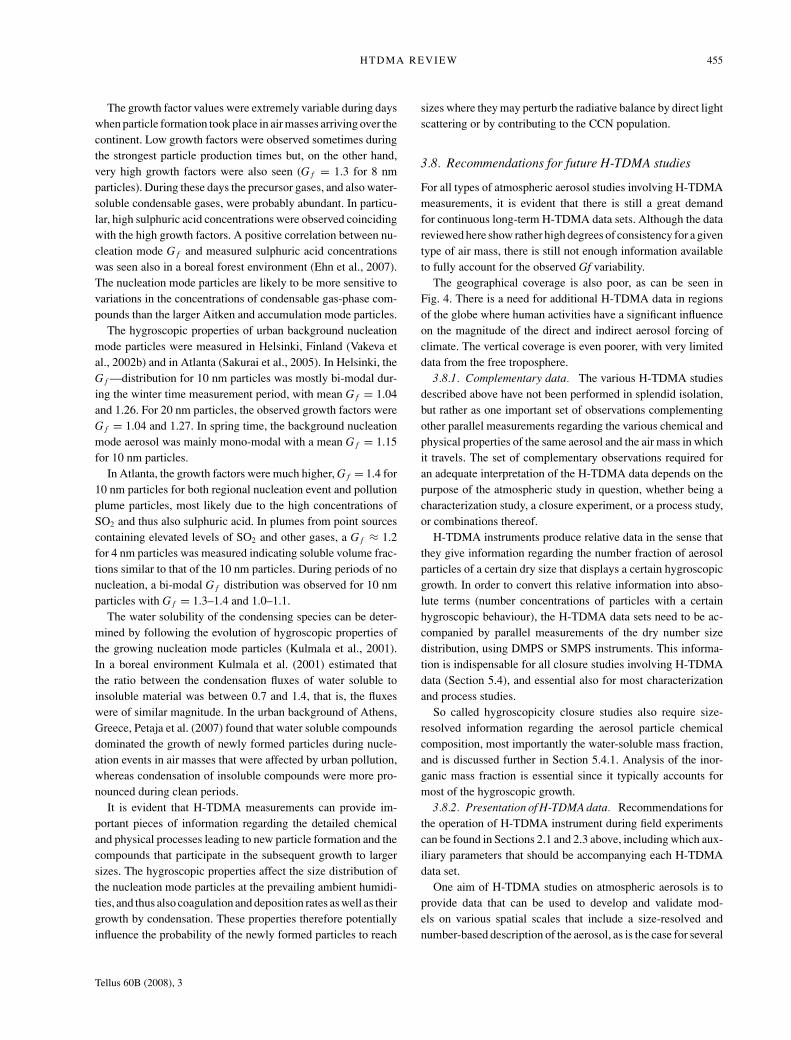
HTDMA REVIEW 455
The growth factor values were extremely variable during dayswhen particle formation took place in air masses arriving over thecontinent. Low growth factors were observed sometimes duringthe strongest particle production times but, on the other hand,very high growth factors were also seen (G f = 1.3 for 8 nmparticles). During these days the precursor gases, and also water-soluble condensable gases, were probably abundant. In particu-lar, high sulphuric acid concentrations were observed coincidingwith the high growth factors. A positive correlation between nu-cleation mode G f and measured sulphuric acid concentrationswas seen also in a boreal forest environment (Ehn et al., 2007).The nucleation mode particles are likely to be more sensitive tovariations in the concentrations of condensable gas-phase com-pounds than the larger Aitken and accumulation mode particles.
The hygroscopic properties of urban background nucleationmode particles were measured in Helsinki, Finland (Vakeva etal., 2002b) and in Atlanta (Sakurai et al., 2005). In Helsinki, theG f —distribution for 10 nm particles was mostly bi-modal dur-ing the winter time measurement period, with mean G f = 1.04and 1.26. For 20 nm particles, the observed growth factors wereG f = 1.04 and 1.27. In spring time, the background nucleationmode aerosol was mainly mono-modal with a mean G f = 1.15for 10 nm particles.
In Atlanta, the growth factors were much higher, G f = 1.4 for10 nm particles for both regional nucleation event and pollutionplume particles, most likely due to the high concentrations ofSO2 and thus also sulphuric acid. In plumes from point sourcescontaining elevated levels of SO2 and other gases, a G f ≈ 1.2for 4 nm particles was measured indicating soluble volume frac-tions similar to that of the 10 nm particles. During periods of nonucleation, a bi-modal G f distribution was observed for 10 nmparticles with G f = 1.3–1.4 and 1.0–1.1.
The water solubility of the condensing species can be deter-mined by following the evolution of hygroscopic properties ofthe growing nucleation mode particles (Kulmala et al., 2001).In a boreal environment Kulmala et al. (2001) estimated thatthe ratio between the condensation fluxes of water soluble toinsoluble material was between 0.7 and 1.4, that is, the fluxeswere of similar magnitude. In the urban background of Athens,Greece, Petaja et al. (2007) found that water soluble compoundsdominated the growth of newly formed particles during nucle-ation events in air masses that were affected by urban pollution,whereas condensation of insoluble compounds were more pro-nounced during clean periods.
It is evident that H-TDMA measurements can provide im-portant pieces of information regarding the detailed chemicaland physical processes leading to new particle formation and thecompounds that participate in the subsequent growth to largersizes. The hygroscopic properties affect the size distribution ofthe nucleation mode particles at the prevailing ambient humidi-ties, and thus also coagulation and deposition rates as well as theirgrowth by condensation. These properties therefore potentiallyinfluence the probability of the newly formed particles to reach
sizes where they may perturb the radiative balance by direct lightscattering or by contributing to the CCN population.
3.8. Recommendations for future H-TDMA studies
For all types of atmospheric aerosol studies involving H-TDMAmeasurements, it is evident that there is still a great demandfor continuous long-term H-TDMA data sets. Although the datareviewed here show rather high degrees of consistency for a giventype of air mass, there is still not enough information availableto fully account for the observed Gf variability.
The geographical coverage is also poor, as can be seen inFig. 4. There is a need for additional H-TDMA data in regionsof the globe where human activities have a significant influenceon the magnitude of the direct and indirect aerosol forcing ofclimate. The vertical coverage is even poorer, with very limiteddata from the free troposphere.
3.8.1. Complementary data. The various H-TDMA studiesdescribed above have not been performed in splendid isolation,but rather as one important set of observations complementingother parallel measurements regarding the various chemical andphysical properties of the same aerosol and the air mass in whichit travels. The set of complementary observations required foran adequate interpretation of the H-TDMA data depends on thepurpose of the atmospheric study in question, whether being acharacterization study, a closure experiment, or a process study,or combinations thereof.
H-TDMA instruments produce relative data in the sense thatthey give information regarding the number fraction of aerosolparticles of a certain dry size that displays a certain hygroscopicgrowth. In order to convert this relative information into abso-lute terms (number concentrations of particles with a certainhygroscopic behaviour), the H-TDMA data sets need to be ac-companied by parallel measurements of the dry number sizedistribution, using DMPS or SMPS instruments. This informa-tion is indispensable for all closure studies involving H-TDMAdata (Section 5.4), and essential also for most characterizationand process studies.
So called hygroscopicity closure studies also require size-resolved information regarding the aerosol particle chemicalcomposition, most importantly the water-soluble mass fraction,and is discussed further in Section 5.4.1. Analysis of the inor-ganic mass fraction is essential since it typically accounts formost of the hygroscopic growth.
3.8.2. Presentation of H-TDMA data. Recommendations forthe operation of H-TDMA instrument during field experimentscan be found in Sections 2.1 and 2.3 above, including which aux-iliary parameters that should be accompanying each H-TDMAdata set.
One aim of H-TDMA studies on atmospheric aerosols is toprovide data that can be used to develop and validate mod-els on various spatial scales that include a size-resolved andnumber-based description of the aerosol, as is the case for several
Tellus 60B (2008), 3
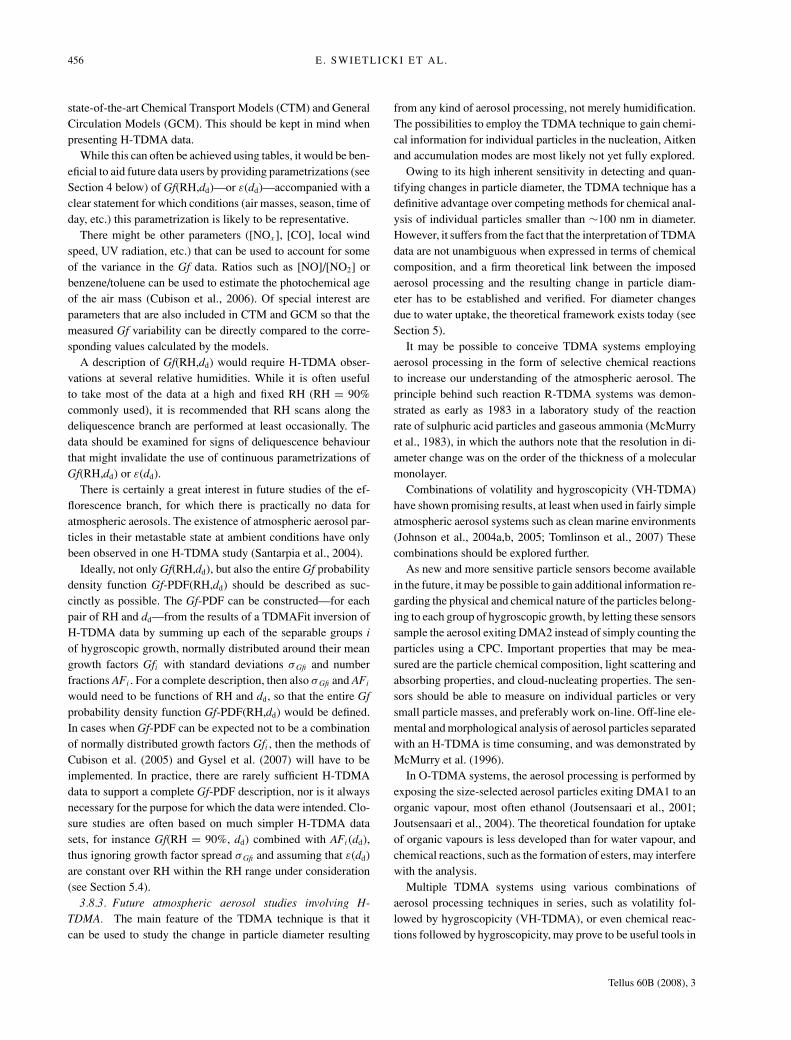
456 E. SWIETLICKI ET AL.
state-of-the-art Chemical Transport Models (CTM) and GeneralCirculation Models (GCM). This should be kept in mind whenpresenting H-TDMA data.
While this can often be achieved using tables, it would be ben-eficial to aid future data users by providing parametrizations (seeSection 4 below) of Gf(RH,dd)—or ε(dd)—accompanied with aclear statement for which conditions (air masses, season, time ofday, etc.) this parametrization is likely to be representative.
There might be other parameters ([NOx ], [CO], local windspeed, UV radiation, etc.) that can be used to account for someof the variance in the Gf data. Ratios such as [NO]/[NO2] orbenzene/toluene can be used to estimate the photochemical ageof the air mass (Cubison et al., 2006). Of special interest areparameters that are also included in CTM and GCM so that themeasured Gf variability can be directly compared to the corre-sponding values calculated by the models.
A description of Gf(RH,dd) would require H-TDMA obser-vations at several relative humidities. While it is often usefulto take most of the data at a high and fixed RH (RH = 90%commonly used), it is recommended that RH scans along thedeliquescence branch are performed at least occasionally. Thedata should be examined for signs of deliquescence behaviourthat might invalidate the use of continuous parametrizations ofGf(RH,dd) or ε(dd).
There is certainly a great interest in future studies of the ef-florescence branch, for which there is practically no data foratmospheric aerosols. The existence of atmospheric aerosol par-ticles in their metastable state at ambient conditions have onlybeen observed in one H-TDMA study (Santarpia et al., 2004).
Ideally, not only Gf(RH,dd), but also the entire Gf probabilitydensity function Gf-PDF(RH,dd) should be described as suc-cinctly as possible. The Gf-PDF can be constructed—for eachpair of RH and dd—from the results of a TDMAFit inversion ofH-TDMA data by summing up each of the separable groups iof hygroscopic growth, normally distributed around their meangrowth factors Gfi with standard deviations σ Gfi and numberfractions AFi . For a complete description, then also σ Gfi and AFi
would need to be functions of RH and dd, so that the entire Gfprobability density function Gf-PDF(RH,dd) would be defined.In cases when Gf-PDF can be expected not to be a combinationof normally distributed growth factors Gfi , then the methods ofCubison et al. (2005) and Gysel et al. (2007) will have to beimplemented. In practice, there are rarely sufficient H-TDMAdata to support a complete Gf-PDF description, nor is it alwaysnecessary for the purpose for which the data were intended. Clo-sure studies are often based on much simpler H-TDMA datasets, for instance Gf(RH = 90%, dd) combined with AFi (dd),thus ignoring growth factor spread σ Gfi and assuming that ε(dd)are constant over RH within the RH range under consideration(see Section 5.4).
3.8.3. Future atmospheric aerosol studies involving H-TDMA. The main feature of the TDMA technique is that itcan be used to study the change in particle diameter resulting
from any kind of aerosol processing, not merely humidification.The possibilities to employ the TDMA technique to gain chemi-cal information for individual particles in the nucleation, Aitkenand accumulation modes are most likely not yet fully explored.
Owing to its high inherent sensitivity in detecting and quan-tifying changes in particle diameter, the TDMA technique has adefinitive advantage over competing methods for chemical anal-ysis of individual particles smaller than ∼100 nm in diameter.However, it suffers from the fact that the interpretation of TDMAdata are not unambiguous when expressed in terms of chemicalcomposition, and a firm theoretical link between the imposedaerosol processing and the resulting change in particle diam-eter has to be established and verified. For diameter changesdue to water uptake, the theoretical framework exists today (seeSection 5).
It may be possible to conceive TDMA systems employingaerosol processing in the form of selective chemical reactionsto increase our understanding of the atmospheric aerosol. Theprinciple behind such reaction R-TDMA systems was demon-strated as early as 1983 in a laboratory study of the reactionrate of sulphuric acid particles and gaseous ammonia (McMurryet al., 1983), in which the authors note that the resolution in di-ameter change was on the order of the thickness of a molecularmonolayer.
Combinations of volatility and hygroscopicity (VH-TDMA)have shown promising results, at least when used in fairly simpleatmospheric aerosol systems such as clean marine environments(Johnson et al., 2004a,b, 2005; Tomlinson et al., 2007) Thesecombinations should be explored further.
As new and more sensitive particle sensors become availablein the future, it may be possible to gain additional information re-garding the physical and chemical nature of the particles belong-ing to each group of hygroscopic growth, by letting these sensorssample the aerosol exiting DMA2 instead of simply counting theparticles using a CPC. Important properties that may be mea-sured are the particle chemical composition, light scattering andabsorbing properties, and cloud-nucleating properties. The sen-sors should be able to measure on individual particles or verysmall particle masses, and preferably work on-line. Off-line ele-mental and morphological analysis of aerosol particles separatedwith an H-TDMA is time consuming, and was demonstrated byMcMurry et al. (1996).
In O-TDMA systems, the aerosol processing is performed byexposing the size-selected aerosol particles exiting DMA1 to anorganic vapour, most often ethanol (Joutsensaari et al., 2001;Joutsensaari et al., 2004). The theoretical foundation for uptakeof organic vapours is less developed than for water vapour, andchemical reactions, such as the formation of esters, may interferewith the analysis.
Multiple TDMA systems using various combinations ofaerosol processing techniques in series, such as volatility fol-lowed by hygroscopicity (VH-TDMA), or even chemical reac-tions followed by hygroscopicity, may prove to be useful tools in
Tellus 60B (2008), 3
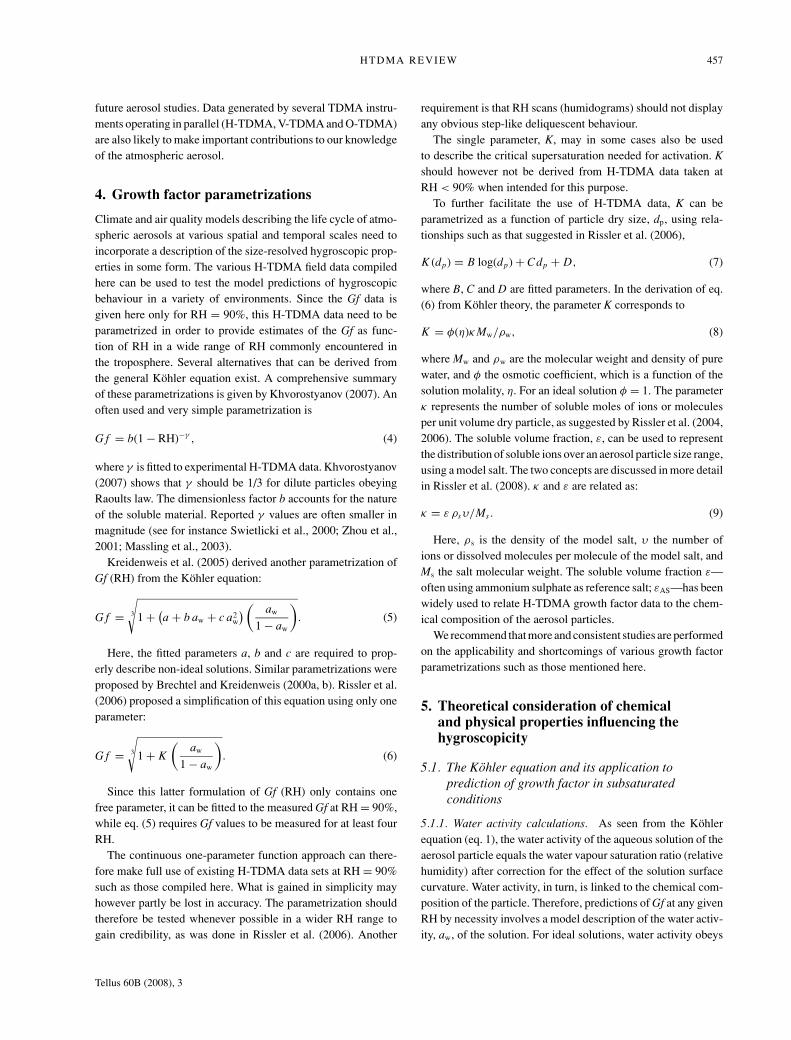
HTDMA REVIEW 457
future aerosol studies. Data generated by several TDMA instru-ments operating in parallel (H-TDMA, V-TDMA and O-TDMA)are also likely to make important contributions to our knowledgeof the atmospheric aerosol.
4. Growth factor parametrizations
Climate and air quality models describing the life cycle of atmo-spheric aerosols at various spatial and temporal scales need toincorporate a description of the size-resolved hygroscopic prop-erties in some form. The various H-TDMA field data compiledhere can be used to test the model predictions of hygroscopicbehaviour in a variety of environments. Since the Gf data isgiven here only for RH = 90%, this H-TDMA data need to beparametrized in order to provide estimates of the Gf as func-tion of RH in a wide range of RH commonly encountered inthe troposphere. Several alternatives that can be derived fromthe general Kohler equation exist. A comprehensive summaryof these parametrizations is given by Khvorostyanov (2007). Anoften used and very simple parametrization is
G f = b(1 − RH)−γ , (4)
where γ is fitted to experimental H-TDMA data. Khvorostyanov(2007) shows that γ should be 1/3 for dilute particles obeyingRaoults law. The dimensionless factor b accounts for the natureof the soluble material. Reported γ values are often smaller inmagnitude (see for instance Swietlicki et al., 2000; Zhou et al.,2001; Massling et al., 2003).
Kreidenweis et al. (2005) derived another parametrization ofGf (RH) from the Kohler equation:
G f = 3
√1 + (
a + b aw + c a2w
) (aw
1 − aw
). (5)
Here, the fitted parameters a, b and c are required to prop-erly describe non-ideal solutions. Similar parametrizations wereproposed by Brechtel and Kreidenweis (2000a, b). Rissler et al.(2006) proposed a simplification of this equation using only oneparameter:
G f = 3
√1 + K
(aw
1 − aw
). (6)
Since this latter formulation of Gf (RH) only contains onefree parameter, it can be fitted to the measured Gf at RH = 90%,while eq. (5) requires Gf values to be measured for at least fourRH.
The continuous one-parameter function approach can there-fore make full use of existing H-TDMA data sets at RH = 90%such as those compiled here. What is gained in simplicity mayhowever partly be lost in accuracy. The parametrization shouldtherefore be tested whenever possible in a wider RH range togain credibility, as was done in Rissler et al. (2006). Another
requirement is that RH scans (humidograms) should not displayany obvious step-like deliquescent behaviour.
The single parameter, K, may in some cases also be usedto describe the critical supersaturation needed for activation. Kshould however not be derived from H-TDMA data taken atRH < 90% when intended for this purpose.
To further facilitate the use of H-TDMA data, K can beparametrized as a function of particle dry size, dp, using rela-tionships such as that suggested in Rissler et al. (2006),
K (dp) = B log(dp) + Cdp + D, (7)
where B, C and D are fitted parameters. In the derivation of eq.(6) from Kohler theory, the parameter K corresponds to
K = φ(η)κ Mw/ρw, (8)
where Mw and ρw are the molecular weight and density of purewater, and φ the osmotic coefficient, which is a function of thesolution molality, η. For an ideal solution φ = 1. The parameterκ represents the number of soluble moles of ions or moleculesper unit volume dry particle, as suggested by Rissler et al. (2004,2006). The soluble volume fraction, ε, can be used to representthe distribution of soluble ions over an aerosol particle size range,using a model salt. The two concepts are discussed in more detailin Rissler et al. (2008). κ and ε are related as:
κ = ε ρsυ/Ms . (9)
Here, ρs is the density of the model salt, υ the number ofions or dissolved molecules per molecule of the model salt, andMs the salt molecular weight. The soluble volume fraction ε—often using ammonium sulphate as reference salt; εAS—has beenwidely used to relate H-TDMA growth factor data to the chem-ical composition of the aerosol particles.
We recommend that more and consistent studies are performedon the applicability and shortcomings of various growth factorparametrizations such as those mentioned here.
5. Theoretical consideration of chemicaland physical properties influencing thehygroscopicity
5.1. The Kohler equation and its application toprediction of growth factor in subsaturatedconditions
5.1.1. Water activity calculations. As seen from the Kohlerequation (eq. 1), the water activity of the aqueous solution of theaerosol particle equals the water vapour saturation ratio (relativehumidity) after correction for the effect of the solution surfacecurvature. Water activity, in turn, is linked to the chemical com-position of the particle. Therefore, predictions of Gf at any givenRH by necessity involves a model description of the water activ-ity, aw, of the solution. For ideal solutions, water activity obeys
Tellus 60B (2008), 3
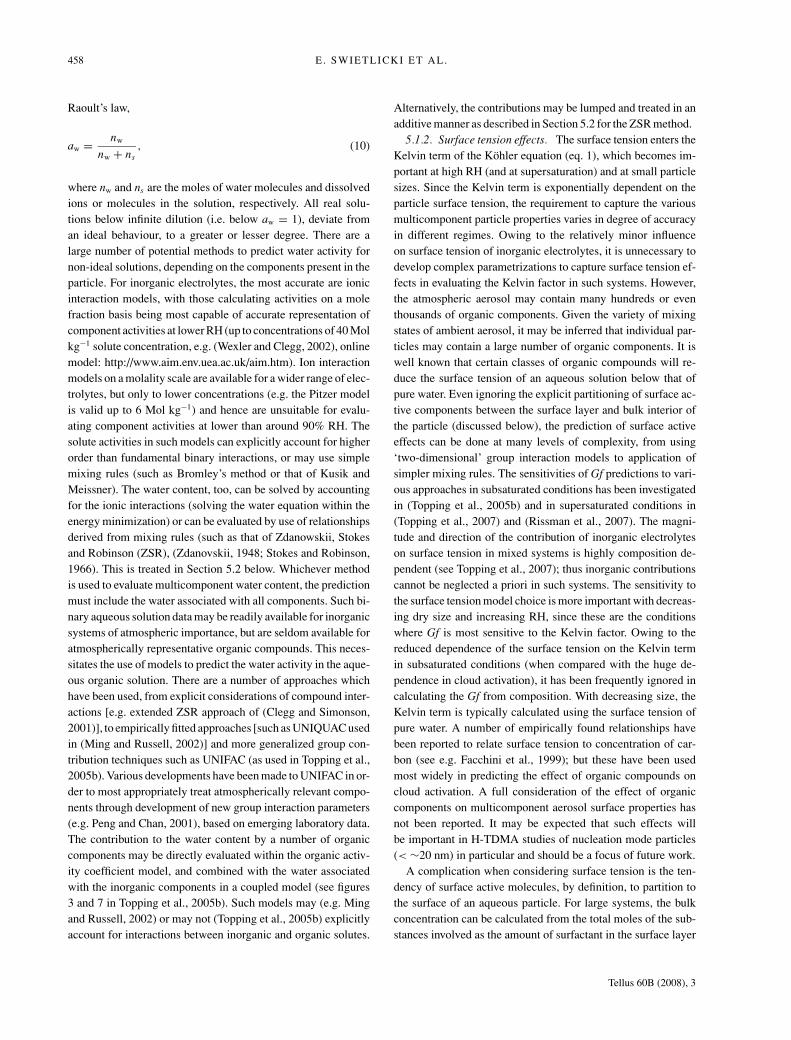
458 E. SWIETLICKI ET AL.
Raoult’s law,
aw = nw
nw + ns, (10)
where nw and ns are the moles of water molecules and dissolvedions or molecules in the solution, respectively. All real solu-tions below infinite dilution (i.e. below aw = 1), deviate froman ideal behaviour, to a greater or lesser degree. There are alarge number of potential methods to predict water activity fornon-ideal solutions, depending on the components present in theparticle. For inorganic electrolytes, the most accurate are ionicinteraction models, with those calculating activities on a molefraction basis being most capable of accurate representation ofcomponent activities at lower RH (up to concentrations of 40 Molkg−1 solute concentration, e.g. (Wexler and Clegg, 2002), onlinemodel: http://www.aim.env.uea.ac.uk/aim.htm). Ion interactionmodels on a molality scale are available for a wider range of elec-trolytes, but only to lower concentrations (e.g. the Pitzer modelis valid up to 6 Mol kg−1) and hence are unsuitable for evalu-ating component activities at lower than around 90% RH. Thesolute activities in such models can explicitly account for higherorder than fundamental binary interactions, or may use simplemixing rules (such as Bromley’s method or that of Kusik andMeissner). The water content, too, can be solved by accountingfor the ionic interactions (solving the water equation within theenergy minimization) or can be evaluated by use of relationshipsderived from mixing rules (such as that of Zdanowskii, Stokesand Robinson (ZSR), (Zdanovskii, 1948; Stokes and Robinson,1966). This is treated in Section 5.2 below. Whichever methodis used to evaluate multicomponent water content, the predictionmust include the water associated with all components. Such bi-nary aqueous solution data may be readily available for inorganicsystems of atmospheric importance, but are seldom available foratmospherically representative organic compounds. This neces-sitates the use of models to predict the water activity in the aque-ous organic solution. There are a number of approaches whichhave been used, from explicit considerations of compound inter-actions [e.g. extended ZSR approach of (Clegg and Simonson,2001)], to empirically fitted approaches [such as UNIQUAC usedin (Ming and Russell, 2002)] and more generalized group con-tribution techniques such as UNIFAC (as used in Topping et al.,2005b). Various developments have been made to UNIFAC in or-der to most appropriately treat atmospherically relevant compo-nents through development of new group interaction parameters(e.g. Peng and Chan, 2001), based on emerging laboratory data.The contribution to the water content by a number of organiccomponents may be directly evaluated within the organic activ-ity coefficient model, and combined with the water associatedwith the inorganic components in a coupled model (see figures3 and 7 in Topping et al., 2005b). Such models may (e.g. Mingand Russell, 2002) or may not (Topping et al., 2005b) explicitlyaccount for interactions between inorganic and organic solutes.
Alternatively, the contributions may be lumped and treated in anadditive manner as described in Section 5.2 for the ZSR method.
5.1.2. Surface tension effects. The surface tension enters theKelvin term of the Kohler equation (eq. 1), which becomes im-portant at high RH (and at supersaturation) and at small particlesizes. Since the Kelvin term is exponentially dependent on theparticle surface tension, the requirement to capture the variousmulticomponent particle properties varies in degree of accuracyin different regimes. Owing to the relatively minor influenceon surface tension of inorganic electrolytes, it is unnecessary todevelop complex parametrizations to capture surface tension ef-fects in evaluating the Kelvin factor in such systems. However,the atmospheric aerosol may contain many hundreds or eventhousands of organic components. Given the variety of mixingstates of ambient aerosol, it may be inferred that individual par-ticles may contain a large number of organic components. It iswell known that certain classes of organic compounds will re-duce the surface tension of an aqueous solution below that ofpure water. Even ignoring the explicit partitioning of surface ac-tive components between the surface layer and bulk interior ofthe particle (discussed below), the prediction of surface activeeffects can be done at many levels of complexity, from using‘two-dimensional’ group interaction models to application ofsimpler mixing rules. The sensitivities of Gf predictions to vari-ous approaches in subsaturated conditions has been investigatedin (Topping et al., 2005b) and in supersaturated conditions in(Topping et al., 2007) and (Rissman et al., 2007). The magni-tude and direction of the contribution of inorganic electrolyteson surface tension in mixed systems is highly composition de-pendent (see Topping et al., 2007); thus inorganic contributionscannot be neglected a priori in such systems. The sensitivity tothe surface tension model choice is more important with decreas-ing dry size and increasing RH, since these are the conditionswhere Gf is most sensitive to the Kelvin factor. Owing to thereduced dependence of the surface tension on the Kelvin termin subsaturated conditions (when compared with the huge de-pendence in cloud activation), it has been frequently ignored incalculating the Gf from composition. With decreasing size, theKelvin term is typically calculated using the surface tension ofpure water. A number of empirically found relationships havebeen reported to relate surface tension to concentration of car-bon (see e.g. Facchini et al., 1999); but these have been usedmost widely in predicting the effect of organic compounds oncloud activation. A full consideration of the effect of organiccomponents on multicomponent aerosol surface properties hasnot been reported. It may be expected that such effects willbe important in H-TDMA studies of nucleation mode particles(< ∼20 nm) in particular and should be a focus of future work.
A complication when considering surface tension is the ten-dency of surface active molecules, by definition, to partition tothe surface of an aqueous particle. For large systems, the bulkconcentration can be calculated from the total moles of the sub-stances involved as the amount of surfactant in the surface layer
Tellus 60B (2008), 3
HTDMA REVIEW 459
is a negligible fraction of its total amount in the system. How-ever, for small systems with a high surface-to-volume ratio thesituation is different, and depending on the degree of surfaceactivity of the component, the partitioning of the surfactant be-tween the bulk and the surface has to be accounted for whencalculating the bulk concentration from given total numbers ofmoles. The effect on cloud activation predictions by considera-tion of the equilibrium of water vapour with growing aerosolparticles was explored first by Li et al. (1998) who demon-strated that, while critical supersaturation Scrit was lowered bythe surface tension in pure sodium dodecyl sulphate (SDS) par-ticles, in NaCl/SDS particles, Scrit was raised by replacement ofsmall NaCl with larger SDS molecules. Sorjamaa et al. (2004)demonstrated that consideration of surface to volume partition-ing should be included in the Raoult term and that the resultingScrit could be higher than just considering the surface tension ofwater. Kokkola et al. (2006) demonstrated that this was also truefor atmospherically representative organic compounds. Toppinget al. (2005a), further extended this approach to consider multi-ple surfactant species. It is currently unclear whether the consid-eration of surface partitioning improves agreement in all cases(Rissman et al., 2007). Furthermore, a systematic comparison ofthe effects of surface partitioning in the calculation of subsatu-rated growth factor with measured values has not been reported.Such impacts under the lower water concentration (and corre-spondingly high surfactant concentration) conditions should beexplored.
5.1.3. Other Parameters (partial molar volume, solution den-sity, dry density). By inspection of the Kohler equation, it isclear that parameters other than water activity and surface ten-sion also play a part in the growth of particles in the humidatmosphere.
5.1.3.1. Partial molar volume. It can be seen in the Kohlerequation that the Kelvin term is exponentially dependent on thepartial molar volume of water (νw) in the growing particle. Shul-man et al. (1996) and Chylek and Wong (1998) both substitutedνw with the quotient of the molecular weight of water (Mw) andthe solution density (ρsol). Kreidenweis et al. (2005) demon-strated how this leads to inaccurately low νw. The formal expres-sion of partial molar volume of water contains a term describingthe derivative of solution density with respect to mass fractionof solute (dρsol/dx). However, it was demonstrated by Brechteland Kreidenweis (2000b), that the volume additivity assumption(partial molar volume equals the molar volume) introduces in-significant errors in νw through droplet activation such that theνw may be replaced with the quotient of the Mw and the waterdensity (ρw) with negligible error. When using this approxima-tion under more concentrated solutions (i.e. under subsaturatedconditions) significant deviation can be introduced even for inor-ganic salt solutions. Insufficient data exist to calculate the partialmolar volume for most atmospherically realistic particles and it
is necessary to systematically investigate the errors introducedby the volume additivity assumption for multicomponent inor-ganic/organic solutions for which there are data.
5.1.3.2. Solution density. Although the solution density doesnot enter into the Kohler equation through the partial molar vol-ume (see Section 5.1.3.1), it is needed to calculate particle wetvolume and hence growth factor. There are a number of mixingrules and approximations that can be used. Simple combinationrules have been reviewed in the literature (e.g. Tang, 1997) andit has been found that mixed solution density can be calculatedusing only the binary solution data using the following rule:
1
ρsol=
∑i
Xi
ρo,i, (11)
where Xi is the dry solute mass fraction for compound i andρoi, is the binary solution density for compound ‘i’ at the soluteconcentration of the mixture. The mass fraction mixing rule, alsoconsistent with the assumption of volume additivity, has beenfound to be more accurate than replacing the mass fraction bythe mole fraction for a number of inorganic systems; though thishas not been demonstrated for organic systems. For inorganicsystems, the growth factor difference associated with the twoseparate mixing rules is likely to be within any experimentaluncertainty associated with the H-TDMA.
For inorganic solutions the binary data is available in the liter-ature (e.g. Cohen et al., 1987b, c; Tang, 1997; Jacobson, 1999).When binary organic data is not available it can be calculatedusing the same rule given above. While some studies in the lit-erature use the solid organic density for this purpose, it is possi-ble to calculate the supercooled liquid density of the organiccomponent using the Yens-Wood method (Yens and Woods,www.pirika.com).
5.1.3.3. Dry density. As with the solution density, the particlecomponent dry density does not enter into the Kohler equationbut is necessary to calculate growth factor. It is necessary toassume the physical state of the dry particle when calculating thedry density. A sensitivity analysis of the assumptions for someinorganic systems is presented in (Topping et al., 2005b) and fororganic systems in (Topping et al., 2005a). In certain cases thesensitivity should be resolvable using H-TDMA instruments.
5.2. The applicability of the ZSR mixing rule
Atmospheric aerosol particles each contain a multitude of chem-ical compounds, which is manifested also in their hygroscopicproperties as measured by H-TDMA instruments. Consideringthe complexity of ion interaction models and the difficulties toadequately characterize the fully size-resolved aerosol chemicalcomposition, there is a need for simpler model approaches that
Tellus 60B (2008), 3

460 E. SWIETLICKI ET AL.
can be implemented more easily on atmospheric aerosol datasets.
The ZSR mixing rule is based on the assumption that the watercontent from individual components are additive, so that the totalamount of water contained in an aerosol particle can be estimatedby summing the water taken up by all components as if they weretotally independent of each other. One formulation of the ZSRmethod mixing rule is therefore
masswater tot =∑
i
masswater i , (12)
where masswater tot is the mass of water in the mixture at the givenwater activity and masswater i is the mass of water that would havebeen associated with the amount of the single electrolyte i presentin the mixed particle at the same water activity.
In recent years there has been considerable interest in usingsimplifying assumptions to predict hygroscopic growth factors.The most widely used treatment was that pioneered by Malmand Kreidenweis (1997), which sought to express the growthfactor of particles in terms of the growth factor of individualcomponents all at the same water activity by making use of theZSR assumption. The convenient form of the ZSR mixing ruleexpressed in terms of Gf is:
G fmixed (aw) ={
n∑i=1
εi [G fi (aw)]3
}1/3. (13)
The individual component growth factors Gfi (aw) may eitherbe directly measured in laboratory experiments or predicted fromappropriate models. It is then possible, by making appropriateassumptions about mixing state and the multicomponent par-ticle density, to use measurements of aerosol component massto calculate the component volume fractions, εi, and evaluatethe mixed particle growth factors, Gfmixed. Insoluble particle vol-ume fractions are treated using Gf = 1. The terms are all eval-uated at the same water activity, aw, approximated by conduct-ing the measurements/calculations at the same RH. The size-dependence of Gf enters in applying the Kelvin curvature correc-tion when calculating aw from RH. The Gfmixed values may thenbe compared with directly measured growth factors to quantifythe understanding of the system behaviour. Such hygroscopicclosure studies will be discussed in Section 5.4 below.
There has been no systematic comparison between particlewater content calculated using explicit thermodynamic modelsand by use of ‘additivity’ assumptions. In general, this is dif-ficult since insufficient fundamental data exist to construct thethermodynamic relationships to model multicomponent aerosol(with particular regard for inorganic/organic interactions). It is,however, possible to compare predicted water content for lim-ited systems where such data are available. One such compar-ison between a thermodynamic model and the ZSR methodfor electrolyte solutions containing NH4
+, Na+, H+, SO42−,
NO3− and Cl− (neglecting the effects of curvature) is given in
(Topping et al., 2005a) (their Table 3). As one might expect,when moving away from ideality with reducing RH the discrep-ancy increases, since the ZSR assumption ignores solute/soluteinteractions. For the ternary electrolyte solutions the deviation isnot usually greater than 2% and will result in a Gf difference of0.01 or so—well within the uncertainty of H-TDMA instruments.However, for the four electrolyte solutions, the discrepancy canbe higher than a Gf difference of 0.05 and should be detectable byH-TTDMA measurements. In the real atmosphere, the aerosolparticles are likely to contain a very high number of componentsso reliance on mixing rules which depend solely on binary datais not guaranteed to be sufficiently accurate. For mixed systems,Choi and Chan (2002a, b) found that the effects of glycerol andof malonic, succinic, glutaric and citric acids on the water cycleof NaCl and (NH4)2SO4 was reasonably well explained usingthe ZSR assumption. Svenningsson et al. (2006b), on the otherhand, observed large deviations from the ZSR mixing rule fortheir MIXSEA mixture of NaCl, (NH4)2SO4, succinic acid andfulvic acid.
This is an example of the fact that the choice of the binarysystem for input to the mixing rule can affect the ZSR predictions,as was discussed for similar systems in Section 3.3 above. Here,the ZSR predictions of water uptake hinge upon whether the drystate of the inorganic compounds is defined as being a mixtureof NaCl–(NH4)2SO4 or NH4Cl–Na2SO4. The dry density of theparticles—and thereby dry particle volume—may also dependon the type of salts formed during crystallization. While theexplicit thermodynamic models will handle the water uptakeappropriately once all ions are in solution, they still suffer froma poorly defined dry state when used to predict volume-basedgrowth factors as measured by the H-TDMA. See Section 5.2.1below.
Other studies have used the ZSR technique to explain wateruptake in solutions of carboxylic, dicarboxylic and multifunc-tional acids with one electrolyte with varying success (Hanssonet al., 1998; Cruz and Pandis, 2000; Hameri et al., 2002; Chanand Chan, 2003). Topping et al. (2005b) find that the use of theZSR assumption for mixtures of five carboxylic acids and eachof three separate inorganic electrolytes resulted in very goodagreement at high relative humidities but, at low RH (∼40%),underpredicted water content in NH4NO3-containing solutionswhile overpredicting water content in the mixed solutions con-taining either NaCl or (NH4)2SO4. Ming and Russell (2002)briefly investigated the discrepancy between the ZSR assump-tion and explicit thermodynamic calculation of water contentin a number of mixed inorganic/organic systems. In general thedifference was not usually greater than 3%, but for systems in-cluding highly soluble organic acids the deviation could be ashigh as 10%. It should be noted that the extrapolation of inter-action parameters between systems can be worse than assumingadditivity, and use of the ZSR assumption may predict valuescloser to those measured than inappropriate estimation of soluteinteractions.
Tellus 60B (2008), 3
HTDMA REVIEW 461
It would be desirable to conduct a systematic comparison ofdifferent degrees of complexity of modelling approaches againstmeasurements for a range of mixtures for which there are fun-damental data to construct explicit thermodynamic models.
5.2.1. Correct ion pairing when using the ZSR assumption.Obviously the water content per unit mass of material predictedby the ZSR mixing rule may be sensitive to the electrolytesresulting from the chosen ion pairing if their dry or solutionproperties are sufficiently different to produce significantly dif-ferent pure component growth factors. It is necessary to choosean appropriate methodology for ion pairing before applicationof the ZSR mixing rule to inorganic electrolytes. Such an ion-pairing algorithm defining appropriate equivalent concentrationsof electrolytes is reported in Reilly and Wood (1969), and hasbeen reported by Clegg and Simonsen (2001), Clegg et al. (2003)and Topping et al. (2005b) as an appropriate and recommendedmethod for ion pairing when using the ZSR technique in pre-dicting aerosol water. Use of equivalent concentration providesa thermodynamically defensible method for ion-pairing whichan arbitrary pairing cannot.
An alternative technique was reported by Gysel et al. (2007).In this study the goal of ion pairing was to find a set of neutralsalts, with as little computational effort as possible, such thatthe corresponding ZSR prediction gives best possible agreementwith a full thermodynamic model prediction of water uptake forgiven numbers of anions and cations. Since the compositionsas a function of size were well determined in this study, theion pairing choice could be constrained in a computationally ef-ficient tractable manner. In the absence of such compositionalconstraint, it is recommended that the Reilly and Wood (1969)scheme is used when applying the ZSR assumption in atmo-spheric applications.
5.3. The effects of deliquescence
Pure compounds such as inorganic salts are well known to dis-play an RH hysteresis behaviour. When increasing RH from alow value, the aerosol particles remain in a dehydrated state—where only the particle surface is wetted—until the RH (wateractivity) is reached at which the solubility of the compound al-lows for the formation of a saturated aqueous solution. This isthe RH of deliquescence (DRH) and is readily observed as anabrupt increase in particle diameter. Increasing the RH furtherwill cause the particle to take up more water and grow in ac-cordance with the Kohler equation (eq. 1). When decreasingRH below the point of deliquescence, the solution will in manycases become supersaturated with respect to the solute and attaina metastable state which can only exist in the suspended aerosolparticles. Only at a much lower RH—the RH of efflorescence—asolid phase will again form causing the particle to shrink to itsoriginal dehydrated size.
For particles consisting of compounds with different DRH,the less soluble compound will gradually dissolve in the aque-
ous solution provided by the more soluble compound, resultingin a smooth diameter growth with increasing RH instead of astepwise deliquescence behaviour. In its extreme, the gradualdissolution of a multitude of compounds (Marcolli et al., 2004)will smear out all deliquescence behaviour and result in a smoothand continuous particle water uptake with changing RH, both forincreasing and decreasing RH.
Indications of deliquescence behaviour with increasing RHhas been observed in only a few H-TDMA studies of atmo-spheric aerosols (Berg et al., 1998b; Santarpia et al., 2004), whileothers find an apparent lack of deliquescence (Pitchford andMcMurry, 1994; Zhou et al., 2001; Rissler et al., 2006; Sjogrenet al., 2007a). We are only aware of one H-TDMA study thathas observed the full RH hysteresis behaviour in atmosphericaerosols (Santarpia et al., 2004). The authors used an intricatehumidification system to enable them to demonstrate the ex-istence of metastable particles. There is a clear need for moreH-TDMA studies characterizing the water uptake in a wide rangeof RH, since this is of utmost importance for the direct effect ofaerosol on climate and visibility reduction.
Theoretical treatment of deliquescence is straightforward forinorganic electrolytes and their mixtures for which data areavailable, with prediction of stepped deliquescence of com-plex salts readily possible (see fig. 4 in Topping et al., 2005b).The predicted size dependence of deliquescence is also read-ily predictable and should be detectable with H-TDMA in-struments. Biskos et al. (2006) demonstrated that H-TDMA-measured growth factors of NaCl particles between 6 and 60 nmdiameter steadily decreased within detection limit for dry sizesbelow 40 nm with an increase in the DRH with decreasing drysize. It has yet to be shown whether this behaviour can be re-solved for other salts and mixed salts.
It is the norm to consider the transition from an uncoated dryaerosol to a dissolved salt droplet. However, several studies haveshown that it may be more suitable to consider the transition froma wetted particle to a dissolved droplet (Ghosal and Hemminger,1999; Weis and Ewing, 1999; Finlayson-Pitts and Hemminger,2000). Mirabel et al. (2000) developed a model to predict theprompt deliquescence, and its dependence on particle size, fora generic crystal with an ideal solution. More recently, Russelland Ming (2002) developed a similar model for treating wet-ted particles and non-ideal effects. Topping et al. (2005a) foundthat while the lack of any change in DRH for the sub 100 nm(NH4)2SO4 aerosol studied by Hameri et al. (2000) is an interest-ing result, both ADDEM (Topping et al., 2005a, b) and the modelof Russell and Ming (2002) predict an increase should occur. Thelatter authors probed the sensitivity to the calculated DRH pointfor various values of the surface tensions of the solid–vapour andsolid–liquid interface. They found that it is possible that a wet-ted particle may be more stable than the aqueous solution, thusincreasing the DRH point. Unfortunately, knowledge of surfacetensions of crystalline structures is limited and it is unlikely thatdata is available for mixed inorganic/organic particles.
Tellus 60B (2008), 3
462 E. SWIETLICKI ET AL.
Suppression of solid phase precipitation in detailed modelscan be used to calculate metastable solutions for direct compar-ison with the ZSR curves. Following this ‘efflorescence arm’ ofthe particle is possible for H-TDMA systems and predictions canbe tested by such measurements.
It is also possible to predict the RH at which dissolution willoccur for organic compounds for which the solid energy of for-mation is known. Fig. 2 in Topping et al. (2005b) demonstratessuch prediction for multiple carboxylic acids in solution. Thesituation is more complex for mixtures of inorganic electrolyteswith organic compounds resulting from the lack of experimen-tal data. Consideration of atmospherically representative mixedaerosol is therefore not possible. Efflorescence (the onset of crys-tallization) is a stochastic process that can be predicted by variousnucleation theories with differing degrees of success. The theo-retical methodology exists for a more complete H-TDMA studyof the effects of deliquescence and efflorescence.
5.4. Reconciliation of H-TDMA measurements withcomposition and cloud activation behaviour
A number of ‘closures’ between particle hygroscopicity andother measured properties are possible. Such studies involvequantification of the degree of reconciliation of the measuredgrowth factor at a given humidity (or at a range of humidi-ties) with the measured property of interest using explicit orparametrized relationships (Quinn et al., 1996). The most usefuland widely attempted closure studies fall into two classes:
(1) The prediction of growth factor from measured compo-sition for comparison with H-TDMA-measured growth factor,and
(2) The prediction of cloud activation properties from H-TDMA-measured growth factor for comparison with criticalsupersaturation (Scrit), activated fraction (FA) or diameter ofparticle at which 50% of the aerosol population are activated(D50) measured using a cloud condensation nucleus (CCN)counter.
Both classes of study can be conducted in the laboratory or inthe ambient atmosphere, with the former providing a more con-strained set of conditions and consequently greater ability to testthe method used to attain closure. The degree of external versusinternal mixture must be taken into account in these studies. Itis not the intention to review all possible closure studies, only toillustrate the variety of techniques employed.
5.4.1. Composition/hygroscopicity closure on field data.There are a large number of methods which can be used toestablish the composition and mixing state of a population ofaerosol particles with a wide variation in the information avail-able. Using an appropriate choice of the techniques describedabove it is then possible to attempt to compare the Gf predictedfrom these measurements with that measured by H-TDMA in-struments. The most straightforward closure is that which relies
on the least detailed compositional information. Broad measure-ments of aerosol composition are available online from mod-ern instrumentation such as the Aerodyne Aerosol Mass Spec-trometer (AMS). Such instruments can provide high temporalresolution of size segregated composition, but with little de-tailed chemical information, particularly for the organic com-ponents. By making simplifying assumptions about the physicalbehaviour of the various fractions, it is possible to use water con-tent mixing rules such as the ZSR assumption to predict the Gf atany RH for which individual component Gf is known or can beapproximated.
The earliest attempts at composition/hygroscopic closure usedimpactor measurements of composition and limited offline anal-yses. H-TDMA and impactor data from Grand Canyon and LosAngeles were used by Saxena et al. (1995) to infer that or-ganic material affected ambient aerosol hygroscopic properties;organic components in freshly produced aerosol particles hin-dering water uptake, while those in aged air masses increas-ing growth. Swietlicki et al. (1999) used Berner impactor/ion-chromatography determinations of inorganic ions to predict H-TDMA-measured hygroscopicity at Great Dun Fell, in 1995.The hypothesized model used water activity data for ammoniumsulphate to calculate soluble volume fraction and hence predictthe number of ions in the appropriate impactor size fraction.It was found that the inorganic components measured in 0.17–0.53 μm diameter particles could explain the measured water up-take within measurement and model uncertainties for all casesbut one, for which the contribution of organic oxygenated sub-stances to water uptake was invoked.
The first more tangible evidence that organic compounds con-tribute significantly to the water uptake of atmospheric aerosolswas presented by Dick et al. (2000). They observed higher hy-groscopic Gf using an H-TDMA than predicted by the inorganiccompounds and applying the ZSR mixing rule. The discrepancybetween observed and predicted water uptake clearly increasedwith increasing organic aerosol mass fraction. Water uptake atlow RH, which is often observed for atmospheric particles, wasattributed primarily to organics.
Gysel et al. (2004) conducted an investigation into the im-pacts of the less hygroscopic fraction (ISOM) of the water-soluble organic matter (WSOM) in rural ambient samples fromK-puszta, Hungary. The ISOM, which constitutes the major frac-tion of WSOM, deliquesced between 30 and 60% RH, and hygro-scopic growth factors at 90% RH ranged from 1.08 to 1.17. Thehygroscopic behaviour of investigated fulvic and humic acidshad similarities to ISOM, but hygroscopic growth factors wereslightly smaller and deliquescence was observed at higher RH(75–85% and 85–95% RH for fulvic acid and humic acid, re-spectively). The hygroscopicity of the smaller remaining massof the ‘most’ hydrophilic organic matter (MHOM) was used as atuner in the closure (using the ZSR assumption) with H-TDMAmeasurements, but remained the largest uncertainty in the mod-elling exercise. Good agreement between model prediction and
Tellus 60B (2008), 3
HTDMA REVIEW 463
measured water uptake was observed only by inclusion of thewater associated with the MHOM.
Mircea et al. (2005), using a modified form of the Kohlerequation, demonstrated that, in order to predict Gf of wet anddry season Amazonian samples which are dominated by organiccomponents, it is necessary to know the solubility of WSOC (thiscontrasts with the ability to predict CCN behaviour which didnot require such information).
McFiggans et al. (2005) used a detailed thermodynamic modelto predict the Gf of aerosol sampled in polluted continental airusing compositional measurements provided by mapping thedetailed speciation of inorganic and organic components fromimpactors onto highly size-resolved aerosol mass spectrometermass distributions. It was found that very good agreement withH-TDMA-measured Gf when appropriate sample averaging wascarried out, and when measured Gf did not vary significantlyacross each impactor sampling period. In addition, it was foundthat there was a relative insensitivity to the representation ofthe organic fraction. The organic components had a Gf close to1.1 at 90% RH irrespective of air mass history. The particle hy-groscopicity variability was dominated by the inorganic:organicratio.
Aklilu et al. (2006), used highly time- and size-resolved AMSdata from the Pacific 2001 field study and obtained reasonableagreement with H-TDMA measurements under conditions whenthe dominant inorganic component was sulphate, with pooreragreement under nitrate-rich conditions. Their claim is that ‘. . .the ZSR mixing rule fails for nitrate’. It is unlikely that the mix-ing rule is at fault and it may be more appropriate to state thatan attribution of AMS-observed nitrate to NH4NO3 in ZSR cal-culations may be incorrect. Alternatively, such observations areconsistent with the observation reported in (Swietlicki et al.,1999) that nitrate evaporation in DMA1 was possible for acidicaerosol as has been reported in (Berg et al., 1998a). The possi-bility of such a nitrate artefact was also evident in the closurestudy of Gysel et al. (2002).
Recommendations: For composition—hygroscopicity clo-sure, measurements of composition and mixing state need tobe made at the same time resolution as the comparison Gf mea-surements so that they may be compared with the Gf predictions.It would be useful to make predictions of the multicomponentparticle Gf as a function of RH for comparison with humido-grams over the same time period. It is difficult to identify howcompositional measurements can be made available at a suffi-cient level of specificity for detailed thermodynamic modellingat the resolution of the H-TDMA measurements. In such cases,composition and hygroscopicity should be sampled or averagedappropriately with a sufficient uncertainty analysis. There is en-couraging closure obtained in recent studies using simple addi-tivity mixing rules. A thorough comparison should be conductedbetween such simplifications and more detailed predictive meth-ods prior to recommending widespread adoption, but use of suchtools could prove to be a valuable and efficient route forward.
5.4.2. Hygroscopicity—CCN closure. There are a number ofstudies that have aimed to quantify the subset of aerosol parti-cles acting as cloud condensation nuclei (CCN) and relate theseto the aerosol hygroscopic properties. Some of those that haveemployed H-TDMA measurements are summarized in table 6of McFiggans et al. (2006). Recently there have been significantdevelopments in the theoretical tools to link measurements madein the sub and supersaturated regimes. This Section focuses onseveral closure studies which have employed such approaches.
Brechtel and Kreidenweis (2000b) presented a theoreticalframework to predict critical supersaturation by inserting twoparameters (Y f and β0,f ) fitted to H-TDMA measurements intoa simplified functional form for the osmotic coefficient in theKohler equation. They found that three diameter/RH data pairsbetween 80 and 92% RH were capable of giving the same accu-racy in prediction of Scrit as ten data pairs over the same regionfor inorganic electrolytes. The model was applied to laboratoryand ambient data in (Brechtel and Kreidenweis, 2000a). It wasfound that single salt H-TDMA measurement-derived Scrit andtheoretical values differed on average by –13% but that com-parisons with CCN counter derived measurements on ambientparticles of unknown composition were in greater error (–6 to–65%).
Dusek et al. (2003) used a simplified form of the Kohler equa-tion to calculate CCN spectra from H-TDMA measurementsmade during the ACE 2 project. Their model approach overesti-mated the measured CCN concentrations by 30%.
Vestin et al. (2007) achieved closure between predicted andmeasured CCN concentrations over a range of supersaturations,within the combined errors of model and measurements (slightunderprediction by 15–20%). The predictions were based on theH-TDMA Gf data at RH = 90% from which the single parameterK (eqs. 6 and 8) was determined.
Kreidenweis et al. (2005) and Koehler et al. (2006) reportedthe development of the three-parameter form of the so-calledκ-Kohler theory referred to in Section 4 (eq. 5) for inorganic-only and organic-containing aerosol, respectively. Reasonablecomparisons with critical supersaturation and critical dry diam-eter made using other models and directly with measurementsfor NaCl and (NH4)2SO4 were achieved, provided H-TDMA-derived aw was ‘corrected’ or adjusted adequately for the Kelvinterm and the dry particle shape factor was adequately treated. H-TDMA-measurement derived critical dry diameters at between0.2 and 1% supersaturation were within experimental error ofpreviously reported measured values for glutaric, malonic andoxalic acids and levoglucosan.
In hygroscopicity—CCN closure studies where the objectiveis to extrapolate the hygroscopic behaviour to supersaturation,the H-TDMA should be operated at a RH that is as high aspossible without endangering Gf accuracy and precision (RH =90% or higher). In composition—hygroscopicity closure studies,it may be more relevant to study also the hygroscopic propertiesat humidities lower than RH = 90% in order to capture the
Tellus 60B (2008), 3
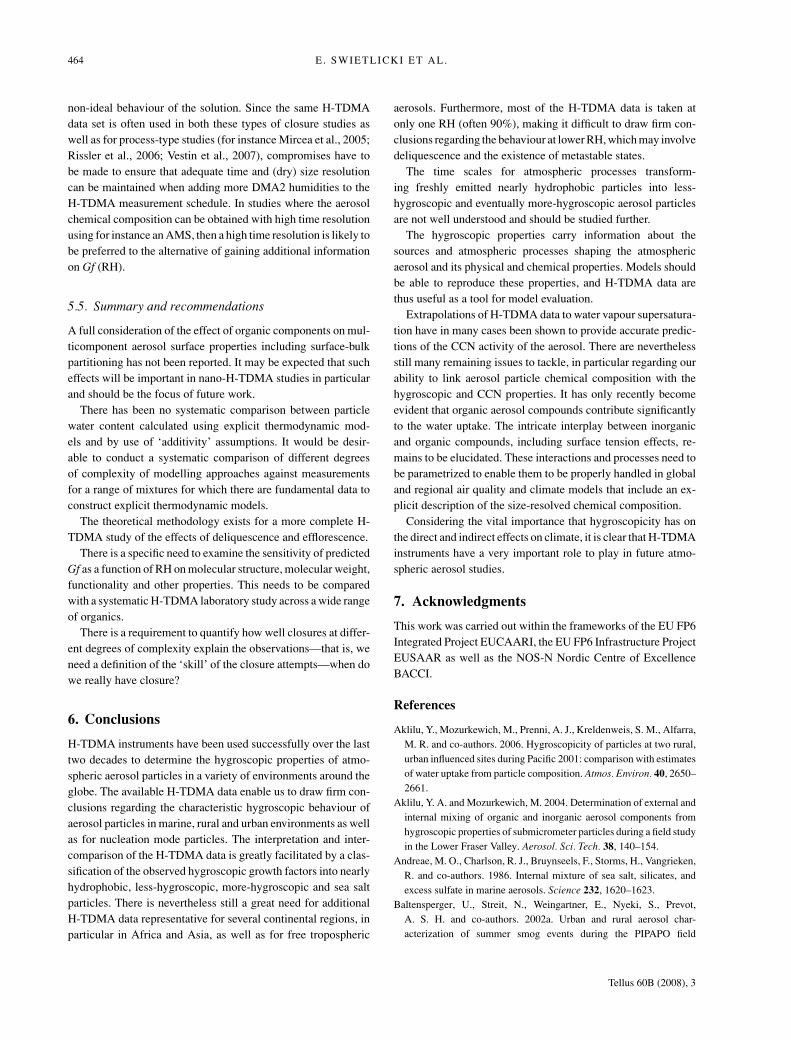
464 E. SWIETLICKI ET AL.
non-ideal behaviour of the solution. Since the same H-TDMAdata set is often used in both these types of closure studies aswell as for process-type studies (for instance Mircea et al., 2005;Rissler et al., 2006; Vestin et al., 2007), compromises have tobe made to ensure that adequate time and (dry) size resolutioncan be maintained when adding more DMA2 humidities to theH-TDMA measurement schedule. In studies where the aerosolchemical composition can be obtained with high time resolutionusing for instance an AMS, then a high time resolution is likely tobe preferred to the alternative of gaining additional informationon Gf (RH).
5.5. Summary and recommendations
A full consideration of the effect of organic components on mul-ticomponent aerosol surface properties including surface-bulkpartitioning has not been reported. It may be expected that sucheffects will be important in nano-H-TDMA studies in particularand should be the focus of future work.
There has been no systematic comparison between particlewater content calculated using explicit thermodynamic mod-els and by use of ‘additivity’ assumptions. It would be desir-able to conduct a systematic comparison of different degreesof complexity of modelling approaches against measurementsfor a range of mixtures for which there are fundamental data toconstruct explicit thermodynamic models.
The theoretical methodology exists for a more complete H-TDMA study of the effects of deliquescence and efflorescence.
There is a specific need to examine the sensitivity of predictedGf as a function of RH on molecular structure, molecular weight,functionality and other properties. This needs to be comparedwith a systematic H-TDMA laboratory study across a wide rangeof organics.
There is a requirement to quantify how well closures at differ-ent degrees of complexity explain the observations—that is, weneed a definition of the ‘skill’ of the closure attempts—when dowe really have closure?
6. Conclusions
H-TDMA instruments have been used successfully over the lasttwo decades to determine the hygroscopic properties of atmo-spheric aerosol particles in a variety of environments around theglobe. The available H-TDMA data enable us to draw firm con-clusions regarding the characteristic hygroscopic behaviour ofaerosol particles in marine, rural and urban environments as wellas for nucleation mode particles. The interpretation and inter-comparison of the H-TDMA data is greatly facilitated by a clas-sification of the observed hygroscopic growth factors into nearlyhydrophobic, less-hygroscopic, more-hygroscopic and sea saltparticles. There is nevertheless still a great need for additionalH-TDMA data representative for several continental regions, inparticular in Africa and Asia, as well as for free tropospheric
aerosols. Furthermore, most of the H-TDMA data is taken atonly one RH (often 90%), making it difficult to draw firm con-clusions regarding the behaviour at lower RH, which may involvedeliquescence and the existence of metastable states.
The time scales for atmospheric processes transform-ing freshly emitted nearly hydrophobic particles into less-hygroscopic and eventually more-hygroscopic aerosol particlesare not well understood and should be studied further.
The hygroscopic properties carry information about thesources and atmospheric processes shaping the atmosphericaerosol and its physical and chemical properties. Models shouldbe able to reproduce these properties, and H-TDMA data arethus useful as a tool for model evaluation.
Extrapolations of H-TDMA data to water vapour supersatura-tion have in many cases been shown to provide accurate predic-tions of the CCN activity of the aerosol. There are neverthelessstill many remaining issues to tackle, in particular regarding ourability to link aerosol particle chemical composition with thehygroscopic and CCN properties. It has only recently becomeevident that organic aerosol compounds contribute significantlyto the water uptake. The intricate interplay between inorganicand organic compounds, including surface tension effects, re-mains to be elucidated. These interactions and processes need tobe parametrized to enable them to be properly handled in globaland regional air quality and climate models that include an ex-plicit description of the size-resolved chemical composition.
Considering the vital importance that hygroscopicity has onthe direct and indirect effects on climate, it is clear that H-TDMAinstruments have a very important role to play in future atmo-spheric aerosol studies.
7. Acknowledgments
This work was carried out within the frameworks of the EU FP6Integrated Project EUCAARI, the EU FP6 Infrastructure ProjectEUSAAR as well as the NOS-N Nordic Centre of ExcellenceBACCI.
References
Aklilu, Y., Mozurkewich, M., Prenni, A. J., Kreldenweis, S. M., Alfarra,M. R. and co-authors. 2006. Hygroscopicity of particles at two rural,urban influenced sites during Pacific 2001: comparison with estimatesof water uptake from particle composition. Atmos. Environ. 40, 2650–2661.
Aklilu, Y. A. and Mozurkewich, M. 2004. Determination of external andinternal mixing of organic and inorganic aerosol components fromhygroscopic properties of submicrometer particles during a field studyin the Lower Fraser Valley. Aerosol. Sci. Tech. 38, 140–154.
Andreae, M. O., Charlson, R. J., Bruynseels, F., Storms, H., Vangrieken,R. and co-authors. 1986. Internal mixture of sea salt, silicates, andexcess sulfate in marine aerosols. Science 232, 1620–1623.
Baltensperger, U., Streit, N., Weingartner, E., Nyeki, S., Prevot,A. S. H. and co-authors. 2002a. Urban and rural aerosol char-acterization of summer smog events during the PIPAPO field
Tellus 60B (2008), 3

HTDMA REVIEW 465
campaign in Milan, Italy. J. Geophys. Res.-Atmos. 107, 8193,doi:8110.1029/2001JD001292.
Berg, O. H., Swietlicki, E., Frank, G., Martinsson, B. G., Cederfelt,S.-I. and co-authors. 1998a. Comparison of observed and modeledhygroscopic behaviour of atmospheric particles. Contr. Atmos. Phys.71, 47–64.
Berg, O. H., Swietlicki, E. and Krejci, R. 1998b. Hygroscopic growthof aerosol particles in the marine boundary layer over the Pacific andSouthern Oceans during the First Aerosol Characterization Experi-ment (ACE 1). J. Geophys. Res.-Atmos. 103, 16535–16545.
Biskos, G., Malinowski, A., Russell, L. M., Buseck, P. R. and Martin, S.T. 2006. Nanosize effect on the deliquescence and the efflorescenceof sodium chloride particles. Aerosol. Sci. Tech. 40, 97–106.
Brechtel, F. J. and Kreidenweis, S. M. 2000a. Predicting particle crit-ical supersaturation from hygroscopic growth measurements in thehumidified TDMA. Part II: laboratory and ambient studies. J. Atmos.Sci. 57, 1872–1887.
Brechtel, F. J. and Kreidenweis, S. M. 2000b. Predicting particle criticalsupersaturation from hygroscopic growth measurements in the humid-ified TDMA. Part I: theory and sensitivity studies. J. Atmos. Sci. 57,1854–1871.
Busch, B., Kandler, K., Schutz, L. and Neususs, C. 2002. Hygroscopicproperties and water-soluble volume fraction of atmospheric particlesin the diameter range from 50 nm to 3.8 μm during LACE 98. J.Geophys. Res.-Atmos. 107, 8119, doi: 8110.1029/2000JD000228.
Buzorius, G., McNaughton, C. S., Clarke, A. D., Covert, D. S.,Blomquist, B. and co-authors. 2004. Secondary aerosol formation incontinental outflow conditions during ACE-Asia. J. Geophys. Res.-Atmos. 109, D24203, doi:10.21029/22004JD004749.
Carrico, C. M., Kreidenweis, S. M., Malm, W. C., Day, D. E., Lee, T.and co-authors. 2005. Hygroscopic growth behaviour of a carbon-dominated aerosol in Yosemite National Park. Atmos. Environ. 39,1393–1404.
Cavalli, F., Facchini, M. C., Decesari, S., Emblico, L., Mircea, M. andco-authors. 2006. Size-segregated aerosol chemical composition at aboreal site in southern Finland, during the QUEST project. Atmos.Chem. Phys. 6, 993–1002.
Chan, M. N. and Chan, C. K. 2003. Hygroscopic properties of two modelhumic-like substances and their mixtures with inorganics of atmo-spheric importance. Environ. Sci. Technol. 37, 5109–5115.
Chan, M. N. and Chan, C. K. 2005. Mass transfer effects in hygroscopicmeasurements of aerosol particles. Atmos. Chem. Phys. 5, 2703–2712.
Chen, L. Y., Jeng, F. T., Chen, C. C. and Hsiao, T. C. 2003. Hygroscopicbehaviour of atmospheric aerosol in Taipei. Atmos. Environ. 37, 2069–2075.
Choi, M. Y. and Chan, C. K. 2002a. Continuous measurements of the wa-ter activities of aqueous droplets of water-soluble organic compounds.J. Phys. Chem. A 106, 4566–4572.
Choi, M. Y. and Chan, C. K. 2002b. The effects of organic species on thehygroscopic behaviours of inorganic aerosols. Environ. Sci. Technol.36, 2422–2428.
Chuang, P. Y. 2003. Measurement of the timescale of hygroscopicgrowth for atmospheric aerosols. J. Geophys. Res.-Atmos. 108, 4282,doi:4210.1029/2002JD002757.
Chylek, P. and Wong, J. G. D. 1998. Erroneous use of the modifiedKohler equation in cloud and aerosol physics applications. J. Atmos.Sci. 55, 1473–1477.
Clegg, S. L. and Simonson, J. M. 2001. A BET model of the thermody-namics of aqueous multicomponent solutions at extreme concentra-tion. J. Chem. Thermodyn. 33, 1457–1472.
Clegg, S. L., Seinfeld, J. H. and Edney, E. O. 2003. Thermodynamicmodelling of aqueous aerosols containing electrolytes and dissolvedorganic compounds. II: an extended Zdanovskii-Stokes-Robinson ap-proach. J. Aerosol. Sci. 34, 667–690.
Cocker, D. R., Whitlock, N. E., Flagan, R. C. and Seinfeld, J. H. 2001.Hygroscopic properties of Pasadena, California aerosol. Aerosol. Sci.Tech. 35, 637–647.
Cohen, M. D., Flagan, R. C. and Seinfeld, J. H. 1987a. Studies of con-centrated electrolyte solutions using the electrodynamic balance. 2:water activities for mixed-electrolyte solutions. J. Phys. Chem. 91,4575–4582.
Cohen, M. D., Flagan, R. C. and Seinfeld, J. H. 1987b. Studies of con-centrated electrolyte-solutions using the electrodynamic balance. 2:water activities for mixed-electrolyte solutions. J. Phys. Chem.-Us.91, 4575–4582.
Cohen, M. D., Flagan, R. C. and Seinfeld, J. H. 1987c. Studies of con-centrated electrolyte-solutions using the electrodynamic balance. 1:water activities for single-electrolyte solutions. J. Phys. Chem.-Us.91, 4563–4574.
Cruz, C. N. and Pandis, S. N. 2000. Deliquescence and hygroscopicgrowth of mixed inorganic-organic atmospheric aerosol. Environ. Sci.Technol. 34, 4313–4319.
Cubison, M. J., Coe, H. and Gysel, M. 2005. A modified hygroscopictandem DMA and a data retrieval method based on optimal estimation.J. Aerosol. Sci. 36, 846–865.
Cubison, M. J., Alfarra, M. R., Allan, J., Bower, K. N., Coe, H. and co-authors. 2006. The characterisation of pollution aerosol in a changingphotochemical environment. Atmos. Chem. Phys. 6, 5573–5588.
Dick, W. D., Saxena, P. and McMurry, P. H. 2000. Estimation of wa-ter uptake by organic compounds in submicron aerosols measuredduring the Southeastern Aerosol and Visibility Study. J. Geophys.Res.-Atmos. 105, 1471–1479.
Dusek, U., Covert, D. S., Wiedensohler, A., Neususs, C., Weise, D. andco-authors. 2003. Cloud condensation nuclei spectra derived fromsize distributions and hygroscopic properties of the aerosol in coastalsouth-west Portugal during ACE-2. Tellus 55B, 35–53.
Ehn, M., Petaja, T., Aufmhoff, H., Aalto, P., Hameri, K. and co-authors.2007. Hygroscopic properties of ultrafine aerosol particles in the bo-real forest: diurnal variation, solubility and the influence of sulphuricacid. Atmos. Chem. Phys. 7, 211–222.
Facchini, M. C., Mircea, M., Fuzzi, S. and Charlson, R. J. 1999. Cloudalbedo enhancement by surface-active organic solutes in growingdroplets. Nature 401, 257–259.
Ferron, G. A., Karg, E., Busch, B. and Heyder, J. 2005. Ambient particlesat an urban, semi-urban and rural site in Central Europe: hygroscopicproperties. Atmos. Environ. 39, 343–352.
Finlayson-Pitts, B. J. and Hemminger, J. C. 2000. Physical chemistry ofairborne sea salt particles and their components. J. Phys. Chem. A 49,11463–11477.
Gasparini, R., Li, R. J., Collins, D. R., Ferrare, R. A. and Brackett, V. G.2006. Application of aerosol hygroscopicity measured at the Atmo-spheric Radiation Measurement Program’s Southern Great Plains siteto examine composition and evolution. J. Geophys. Res.-Atmos. 111,D05S12, doi:10.1029/2004JD005448.
Tellus 60B (2008), 3
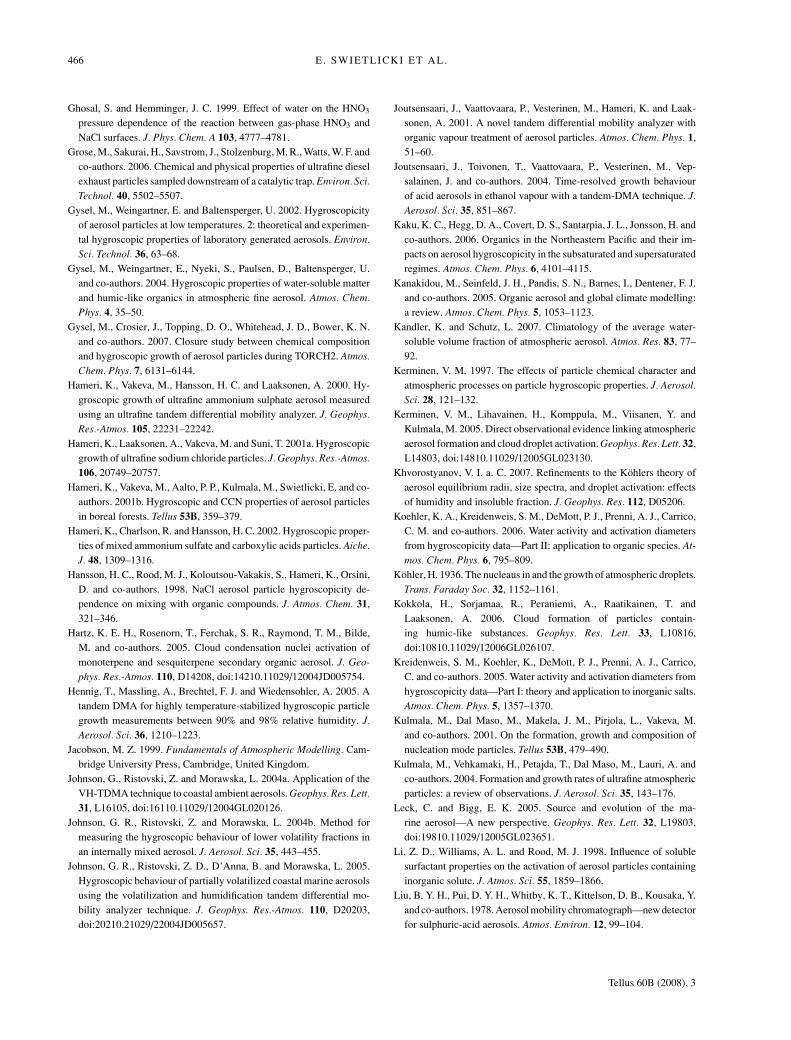
466 E. SWIETLICKI ET AL.
Ghosal, S. and Hemminger, J. C. 1999. Effect of water on the HNO3
pressure dependence of the reaction between gas-phase HNO3 andNaCl surfaces. J. Phys. Chem. A 103, 4777–4781.
Grose, M., Sakurai, H., Savstrom, J., Stolzenburg, M. R., Watts, W. F. andco-authors. 2006. Chemical and physical properties of ultrafine dieselexhaust particles sampled downstream of a catalytic trap. Environ. Sci.Technol. 40, 5502–5507.
Gysel, M., Weingartner, E. and Baltensperger, U. 2002. Hygroscopicityof aerosol particles at low temperatures. 2: theoretical and experimen-tal hygroscopic properties of laboratory generated aerosols. Environ.Sci. Technol. 36, 63–68.
Gysel, M., Weingartner, E., Nyeki, S., Paulsen, D., Baltensperger, U.and co-authors. 2004. Hygroscopic properties of water-soluble matterand humic-like organics in atmospheric fine aerosol. Atmos. Chem.Phys. 4, 35–50.
Gysel, M., Crosier, J., Topping, D. O., Whitehead, J. D., Bower, K. N.and co-authors. 2007. Closure study between chemical compositionand hygroscopic growth of aerosol particles during TORCH2. Atmos.Chem. Phys. 7, 6131–6144.
Hameri, K., Vakeva, M., Hansson, H. C. and Laaksonen, A. 2000. Hy-groscopic growth of ultrafine ammonium sulphate aerosol measuredusing an ultrafine tandem differential mobility analyzer. J. Geophys.Res.-Atmos. 105, 22231–22242.
Hameri, K., Laaksonen, A., Vakeva, M. and Suni, T. 2001a. Hygroscopicgrowth of ultrafine sodium chloride particles. J. Geophys. Res.-Atmos.106, 20749–20757.
Hameri, K., Vakeva, M., Aalto, P. P., Kulmala, M., Swietlicki, E. and co-authors. 2001b. Hygroscopic and CCN properties of aerosol particlesin boreal forests. Tellus 53B, 359–379.
Hameri, K., Charlson, R. and Hansson, H. C. 2002. Hygroscopic proper-ties of mixed ammonium sulfate and carboxylic acids particles. Aiche.J. 48, 1309–1316.
Hansson, H. C., Rood, M. J., Koloutsou-Vakakis, S., Hameri, K., Orsini,D. and co-authors. 1998. NaCl aerosol particle hygroscopicity de-pendence on mixing with organic compounds. J. Atmos. Chem. 31,321–346.
Hartz, K. E. H., Rosenorn, T., Ferchak, S. R., Raymond, T. M., Bilde,M. and co-authors. 2005. Cloud condensation nuclei activation ofmonoterpene and sesquiterpene secondary organic aerosol. J. Geo-phys. Res.-Atmos. 110, D14208, doi:14210.11029/12004JD005754.
Hennig, T., Massling, A., Brechtel, F. J. and Wiedensohler, A. 2005. Atandem DMA for highly temperature-stabilized hygroscopic particlegrowth measurements between 90% and 98% relative humidity. J.Aerosol. Sci. 36, 1210–1223.
Jacobson, M. Z. 1999. Fundamentals of Atmospheric Modelling. Cam-bridge University Press, Cambridge, United Kingdom.
Johnson, G., Ristovski, Z. and Morawska, L. 2004a. Application of theVH-TDMA technique to coastal ambient aerosols. Geophys. Res. Lett.31, L16105, doi:16110.11029/12004GL020126.
Johnson, G. R., Ristovski, Z. and Morawska, L. 2004b. Method formeasuring the hygroscopic behaviour of lower volatility fractions inan internally mixed aerosol. J. Aerosol. Sci. 35, 443–455.
Johnson, G. R., Ristovski, Z. D., D’Anna, B. and Morawska, L. 2005.Hygroscopic behaviour of partially volatilized coastal marine aerosolsusing the volatilization and humidification tandem differential mo-bility analyzer technique. J. Geophys. Res.-Atmos. 110, D20203,doi:20210.21029/22004JD005657.
Joutsensaari, J., Vaattovaara, P., Vesterinen, M., Hameri, K. and Laak-sonen, A. 2001. A novel tandem differential mobility analyzer withorganic vapour treatment of aerosol particles. Atmos. Chem. Phys. 1,51–60.
Joutsensaari, J., Toivonen, T., Vaattovaara, P., Vesterinen, M., Vep-salainen, J. and co-authors. 2004. Time-resolved growth behaviourof acid aerosols in ethanol vapour with a tandem-DMA technique. J.Aerosol. Sci. 35, 851–867.
Kaku, K. C., Hegg, D. A., Covert, D. S., Santarpia, J. L., Jonsson, H. andco-authors. 2006. Organics in the Northeastern Pacific and their im-pacts on aerosol hygroscopicity in the subsaturated and supersaturatedregimes. Atmos. Chem. Phys. 6, 4101–4115.
Kanakidou, M., Seinfeld, J. H., Pandis, S. N., Barnes, I., Dentener, F. J.and co-authors. 2005. Organic aerosol and global climate modelling:a review. Atmos. Chem. Phys. 5, 1053–1123.
Kandler, K. and Schutz, L. 2007. Climatology of the average water-soluble volume fraction of atmospheric aerosol. Atmos. Res. 83, 77–92.
Kerminen, V. M. 1997. The effects of particle chemical character andatmospheric processes on particle hygroscopic properties. J. Aerosol.Sci. 28, 121–132.
Kerminen, V. M., Lihavainen, H., Komppula, M., Viisanen, Y. andKulmala, M. 2005. Direct observational evidence linking atmosphericaerosol formation and cloud droplet activation. Geophys. Res. Lett. 32,L14803, doi:14810.11029/12005GL023130.
Khvorostyanov, V. I. a. C. 2007. Refinements to the Kohlers theory ofaerosol equilibrium radii, size spectra, and droplet activation: effectsof humidity and insoluble fraction. J. Geophys. Res. 112, D05206.
Koehler, K. A., Kreidenweis, S. M., DeMott, P. J., Prenni, A. J., Carrico,C. M. and co-authors. 2006. Water activity and activation diametersfrom hygroscopicity data—Part II: application to organic species. At-mos. Chem. Phys. 6, 795–809.
Kohler, H. 1936. The nucleaus in and the growth of atmospheric droplets.Trans. Faraday Soc. 32, 1152–1161.
Kokkola, H., Sorjamaa, R., Peraniemi, A., Raatikainen, T. andLaaksonen, A. 2006. Cloud formation of particles contain-ing humic-like substances. Geophys. Res. Lett. 33, L10816,doi:10810.11029/12006GL026107.
Kreidenweis, S. M., Koehler, K., DeMott, P. J., Prenni, A. J., Carrico,C. and co-authors. 2005. Water activity and activation diameters fromhygroscopicity data—Part I: theory and application to inorganic salts.Atmos. Chem. Phys. 5, 1357–1370.
Kulmala, M., Dal Maso, M., Makela, J. M., Pirjola, L., Vakeva, M.and co-authors. 2001. On the formation, growth and composition ofnucleation mode particles. Tellus 53B, 479–490.
Kulmala, M., Vehkamaki, H., Petajda, T., Dal Maso, M., Lauri, A. andco-authors. 2004. Formation and growth rates of ultrafine atmosphericparticles: a review of observations. J. Aerosol. Sci. 35, 143–176.
Leck, C. and Bigg, E. K. 2005. Source and evolution of the ma-rine aerosol—A new perspective. Geophys. Res. Lett. 32, L19803,doi:19810.11029/12005GL023651.
Li, Z. D., Williams, A. L. and Rood, M. J. 1998. Influence of solublesurfactant properties on the activation of aerosol particles containinginorganic solute. J. Atmos. Sci. 55, 1859–1866.
Liu, B. Y. H., Pui, D. Y. H., Whitby, K. T., Kittelson, D. B., Kousaka, Y.and co-authors. 1978. Aerosol mobility chromatograph—new detectorfor sulphuric-acid aerosols. Atmos. Environ. 12, 99–104.
Tellus 60B (2008), 3
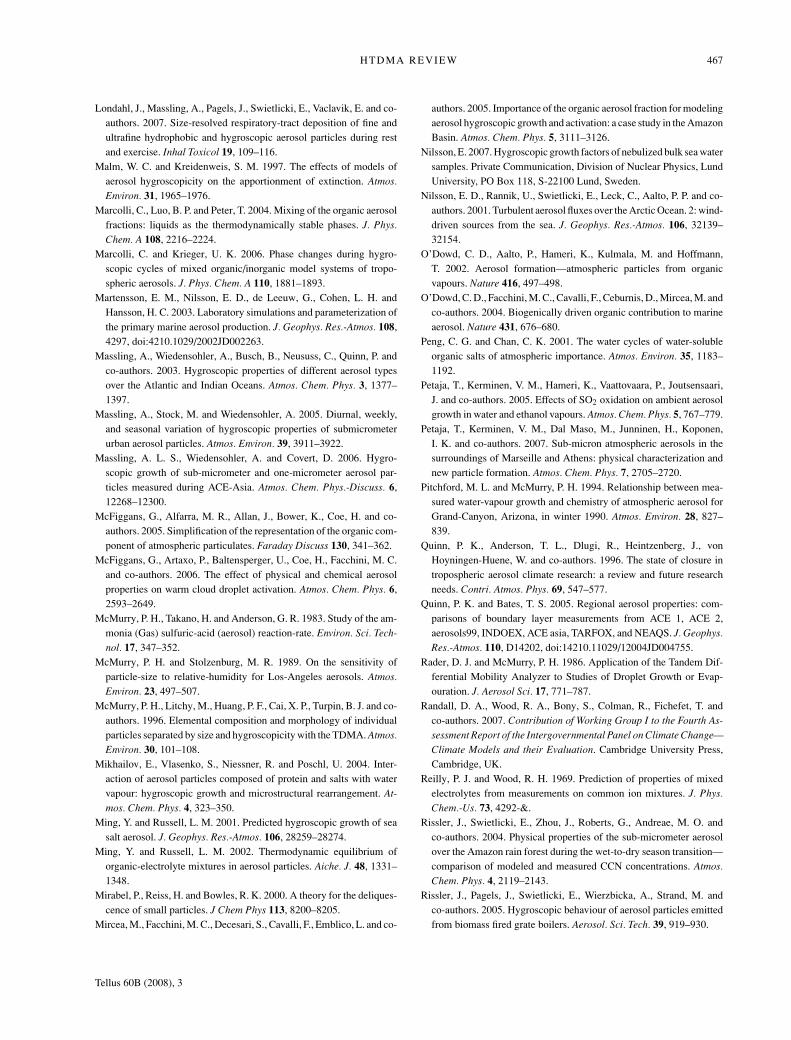
HTDMA REVIEW 467
Londahl, J., Massling, A., Pagels, J., Swietlicki, E., Vaclavik, E. and co-authors. 2007. Size-resolved respiratory-tract deposition of fine andultrafine hydrophobic and hygroscopic aerosol particles during restand exercise. Inhal Toxicol 19, 109–116.
Malm, W. C. and Kreidenweis, S. M. 1997. The effects of models ofaerosol hygroscopicity on the apportionment of extinction. Atmos.Environ. 31, 1965–1976.
Marcolli, C., Luo, B. P. and Peter, T. 2004. Mixing of the organic aerosolfractions: liquids as the thermodynamically stable phases. J. Phys.Chem. A 108, 2216–2224.
Marcolli, C. and Krieger, U. K. 2006. Phase changes during hygro-scopic cycles of mixed organic/inorganic model systems of tropo-spheric aerosols. J. Phys. Chem. A 110, 1881–1893.
Martensson, E. M., Nilsson, E. D., de Leeuw, G., Cohen, L. H. andHansson, H. C. 2003. Laboratory simulations and parameterization ofthe primary marine aerosol production. J. Geophys. Res.-Atmos. 108,4297, doi:4210.1029/2002JD002263.
Massling, A., Wiedensohler, A., Busch, B., Neususs, C., Quinn, P. andco-authors. 2003. Hygroscopic properties of different aerosol typesover the Atlantic and Indian Oceans. Atmos. Chem. Phys. 3, 1377–1397.
Massling, A., Stock, M. and Wiedensohler, A. 2005. Diurnal, weekly,and seasonal variation of hygroscopic properties of submicrometerurban aerosol particles. Atmos. Environ. 39, 3911–3922.
Massling, A. L. S., Wiedensohler, A. and Covert, D. 2006. Hygro-scopic growth of sub-micrometer and one-micrometer aerosol par-ticles measured during ACE-Asia. Atmos. Chem. Phys.-Discuss. 6,12268–12300.
McFiggans, G., Alfarra, M. R., Allan, J., Bower, K., Coe, H. and co-authors. 2005. Simplification of the representation of the organic com-ponent of atmospheric particulates. Faraday Discuss 130, 341–362.
McFiggans, G., Artaxo, P., Baltensperger, U., Coe, H., Facchini, M. C.and co-authors. 2006. The effect of physical and chemical aerosolproperties on warm cloud droplet activation. Atmos. Chem. Phys. 6,2593–2649.
McMurry, P. H., Takano, H. and Anderson, G. R. 1983. Study of the am-monia (Gas) sulfuric-acid (aerosol) reaction-rate. Environ. Sci. Tech-nol. 17, 347–352.
McMurry, P. H. and Stolzenburg, M. R. 1989. On the sensitivity ofparticle-size to relative-humidity for Los-Angeles aerosols. Atmos.Environ. 23, 497–507.
McMurry, P. H., Litchy, M., Huang, P. F., Cai, X. P., Turpin, B. J. and co-authors. 1996. Elemental composition and morphology of individualparticles separated by size and hygroscopicity with the TDMA. Atmos.Environ. 30, 101–108.
Mikhailov, E., Vlasenko, S., Niessner, R. and Poschl, U. 2004. Inter-action of aerosol particles composed of protein and salts with watervapour: hygroscopic growth and microstructural rearrangement. At-mos. Chem. Phys. 4, 323–350.
Ming, Y. and Russell, L. M. 2001. Predicted hygroscopic growth of seasalt aerosol. J. Geophys. Res.-Atmos. 106, 28259–28274.
Ming, Y. and Russell, L. M. 2002. Thermodynamic equilibrium oforganic-electrolyte mixtures in aerosol particles. Aiche. J. 48, 1331–1348.
Mirabel, P., Reiss, H. and Bowles, R. K. 2000. A theory for the deliques-cence of small particles. J Chem Phys 113, 8200–8205.
Mircea, M., Facchini, M. C., Decesari, S., Cavalli, F., Emblico, L. and co-
authors. 2005. Importance of the organic aerosol fraction for modelingaerosol hygroscopic growth and activation: a case study in the AmazonBasin. Atmos. Chem. Phys. 5, 3111–3126.
Nilsson, E. 2007. Hygroscopic growth factors of nebulized bulk sea watersamples. Private Communication, Division of Nuclear Physics, LundUniversity, PO Box 118, S-22100 Lund, Sweden.
Nilsson, E. D., Rannik, U., Swietlicki, E., Leck, C., Aalto, P. P. and co-authors. 2001. Turbulent aerosol fluxes over the Arctic Ocean. 2: wind-driven sources from the sea. J. Geophys. Res.-Atmos. 106, 32139–32154.
O’Dowd, C. D., Aalto, P., Hameri, K., Kulmala, M. and Hoffmann,T. 2002. Aerosol formation—atmospheric particles from organicvapours. Nature 416, 497–498.
O’Dowd, C. D., Facchini, M. C., Cavalli, F., Ceburnis, D., Mircea, M. andco-authors. 2004. Biogenically driven organic contribution to marineaerosol. Nature 431, 676–680.
Peng, C. G. and Chan, C. K. 2001. The water cycles of water-solubleorganic salts of atmospheric importance. Atmos. Environ. 35, 1183–1192.
Petaja, T., Kerminen, V. M., Hameri, K., Vaattovaara, P., Joutsensaari,J. and co-authors. 2005. Effects of SO2 oxidation on ambient aerosolgrowth in water and ethanol vapours. Atmos. Chem. Phys. 5, 767–779.
Petaja, T., Kerminen, V. M., Dal Maso, M., Junninen, H., Koponen,I. K. and co-authors. 2007. Sub-micron atmospheric aerosols in thesurroundings of Marseille and Athens: physical characterization andnew particle formation. Atmos. Chem. Phys. 7, 2705–2720.
Pitchford, M. L. and McMurry, P. H. 1994. Relationship between mea-sured water-vapour growth and chemistry of atmospheric aerosol forGrand-Canyon, Arizona, in winter 1990. Atmos. Environ. 28, 827–839.
Quinn, P. K., Anderson, T. L., Dlugi, R., Heintzenberg, J., vonHoyningen-Huene, W. and co-authors. 1996. The state of closure intropospheric aerosol climate research: a review and future researchneeds. Contri. Atmos. Phys. 69, 547–577.
Quinn, P. K. and Bates, T. S. 2005. Regional aerosol properties: com-parisons of boundary layer measurements from ACE 1, ACE 2,aerosols99, INDOEX, ACE asia, TARFOX, and NEAQS. J. Geophys.Res.-Atmos. 110, D14202, doi:14210.11029/12004JD004755.
Rader, D. J. and McMurry, P. H. 1986. Application of the Tandem Dif-ferential Mobility Analyzer to Studies of Droplet Growth or Evap-ouration. J. Aerosol Sci. 17, 771–787.
Randall, D. A., Wood, R. A., Bony, S., Colman, R., Fichefet, T. andco-authors. 2007. Contribution of Working Group I to the Fourth As-sessment Report of the Intergovernmental Panel on Climate Change—Climate Models and their Evaluation. Cambridge University Press,Cambridge, UK.
Reilly, P. J. and Wood, R. H. 1969. Prediction of properties of mixedelectrolytes from measurements on common ion mixtures. J. Phys.Chem.-Us. 73, 4292-&.
Rissler, J., Swietlicki, E., Zhou, J., Roberts, G., Andreae, M. O. andco-authors. 2004. Physical properties of the sub-micrometer aerosolover the Amazon rain forest during the wet-to-dry season transition—comparison of modeled and measured CCN concentrations. Atmos.Chem. Phys. 4, 2119–2143.
Rissler, J., Pagels, J., Swietlicki, E., Wierzbicka, A., Strand, M. andco-authors. 2005. Hygroscopic behaviour of aerosol particles emittedfrom biomass fired grate boilers. Aerosol. Sci. Tech. 39, 919–930.
Tellus 60B (2008), 3
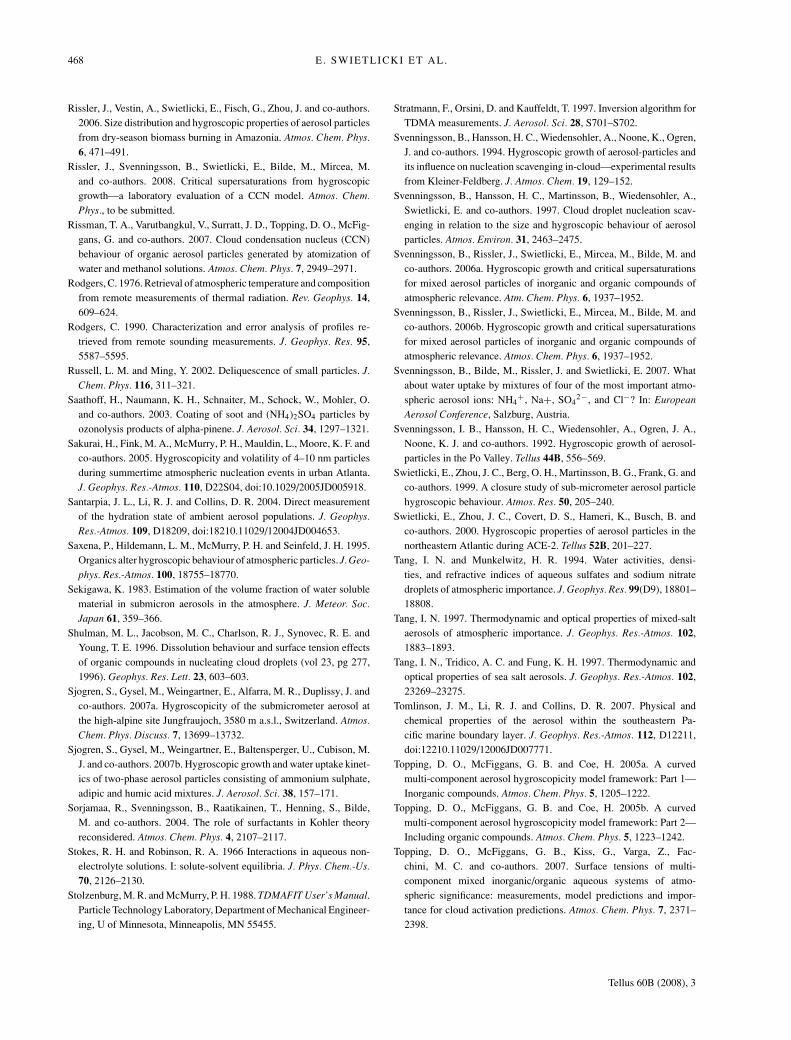
468 E. SWIETLICKI ET AL.
Rissler, J., Vestin, A., Swietlicki, E., Fisch, G., Zhou, J. and co-authors.2006. Size distribution and hygroscopic properties of aerosol particlesfrom dry-season biomass burning in Amazonia. Atmos. Chem. Phys.6, 471–491.
Rissler, J., Svenningsson, B., Swietlicki, E., Bilde, M., Mircea, M.and co-authors. 2008. Critical supersaturations from hygroscopicgrowth—a laboratory evaluation of a CCN model. Atmos. Chem.Phys., to be submitted.
Rissman, T. A., Varutbangkul, V., Surratt, J. D., Topping, D. O., McFig-gans, G. and co-authors. 2007. Cloud condensation nucleus (CCN)behaviour of organic aerosol particles generated by atomization ofwater and methanol solutions. Atmos. Chem. Phys. 7, 2949–2971.
Rodgers, C. 1976. Retrieval of atmospheric temperature and compositionfrom remote measurements of thermal radiation. Rev. Geophys. 14,609–624.
Rodgers, C. 1990. Characterization and error analysis of profiles re-trieved from remote sounding measurements. J. Geophys. Res. 95,5587–5595.
Russell, L. M. and Ming, Y. 2002. Deliquescence of small particles. J.Chem. Phys. 116, 311–321.
Saathoff, H., Naumann, K. H., Schnaiter, M., Schock, W., Mohler, O.and co-authors. 2003. Coating of soot and (NH4)2SO4 particles byozonolysis products of alpha-pinene. J. Aerosol. Sci. 34, 1297–1321.
Sakurai, H., Fink, M. A., McMurry, P. H., Mauldin, L., Moore, K. F. andco-authors. 2005. Hygroscopicity and volatility of 4–10 nm particlesduring summertime atmospheric nucleation events in urban Atlanta.J. Geophys. Res.-Atmos. 110, D22S04, doi:10.1029/2005JD005918.
Santarpia, J. L., Li, R. J. and Collins, D. R. 2004. Direct measurementof the hydration state of ambient aerosol populations. J. Geophys.Res.-Atmos. 109, D18209, doi:18210.11029/12004JD004653.
Saxena, P., Hildemann, L. M., McMurry, P. H. and Seinfeld, J. H. 1995.Organics alter hygroscopic behaviour of atmospheric particles. J. Geo-phys. Res.-Atmos. 100, 18755–18770.
Sekigawa, K. 1983. Estimation of the volume fraction of water solublematerial in submicron aerosols in the atmosphere. J. Meteor. Soc.Japan 61, 359–366.
Shulman, M. L., Jacobson, M. C., Charlson, R. J., Synovec, R. E. andYoung, T. E. 1996. Dissolution behaviour and surface tension effectsof organic compounds in nucleating cloud droplets (vol 23, pg 277,1996). Geophys. Res. Lett. 23, 603–603.
Sjogren, S., Gysel, M., Weingartner, E., Alfarra, M. R., Duplissy, J. andco-authors. 2007a. Hygroscopicity of the submicrometer aerosol atthe high-alpine site Jungfraujoch, 3580 m a.s.l., Switzerland. Atmos.Chem. Phys. Discuss. 7, 13699–13732.
Sjogren, S., Gysel, M., Weingartner, E., Baltensperger, U., Cubison, M.J. and co-authors. 2007b. Hygroscopic growth and water uptake kinet-ics of two-phase aerosol particles consisting of ammonium sulphate,adipic and humic acid mixtures. J. Aerosol. Sci. 38, 157–171.
Sorjamaa, R., Svenningsson, B., Raatikainen, T., Henning, S., Bilde,M. and co-authors. 2004. The role of surfactants in Kohler theoryreconsidered. Atmos. Chem. Phys. 4, 2107–2117.
Stokes, R. H. and Robinson, R. A. 1966 Interactions in aqueous non-electrolyte solutions. I: solute-solvent equilibria. J. Phys. Chem.-Us.70, 2126–2130.
Stolzenburg, M. R. and McMurry, P. H. 1988. TDMAFIT User’s Manual.Particle Technology Laboratory, Department of Mechanical Engineer-ing, U of Minnesota, Minneapolis, MN 55455.
Stratmann, F., Orsini, D. and Kauffeldt, T. 1997. Inversion algorithm forTDMA measurements. J. Aerosol. Sci. 28, S701–S702.
Svenningsson, B., Hansson, H. C., Wiedensohler, A., Noone, K., Ogren,J. and co-authors. 1994. Hygroscopic growth of aerosol-particles andits influence on nucleation scavenging in-cloud—experimental resultsfrom Kleiner-Feldberg. J. Atmos. Chem. 19, 129–152.
Svenningsson, B., Hansson, H. C., Martinsson, B., Wiedensohler, A.,Swietlicki, E. and co-authors. 1997. Cloud droplet nucleation scav-enging in relation to the size and hygroscopic behaviour of aerosolparticles. Atmos. Environ. 31, 2463–2475.
Svenningsson, B., Rissler, J., Swietlicki, E., Mircea, M., Bilde, M. andco-authors. 2006a. Hygroscopic growth and critical supersaturationsfor mixed aerosol particles of inorganic and organic compounds ofatmospheric relevance. Atm. Chem. Phys. 6, 1937–1952.
Svenningsson, B., Rissler, J., Swietlicki, E., Mircea, M., Bilde, M. andco-authors. 2006b. Hygroscopic growth and critical supersaturationsfor mixed aerosol particles of inorganic and organic compounds ofatmospheric relevance. Atmos. Chem. Phys. 6, 1937–1952.
Svenningsson, B., Bilde, M., Rissler, J. and Swietlicki, E. 2007. Whatabout water uptake by mixtures of four of the most important atmo-spheric aerosol ions: NH4
+, Na+, SO42−, and Cl−? In: European
Aerosol Conference, Salzburg, Austria.Svenningsson, I. B., Hansson, H. C., Wiedensohler, A., Ogren, J. A.,
Noone, K. J. and co-authors. 1992. Hygroscopic growth of aerosol-particles in the Po Valley. Tellus 44B, 556–569.
Swietlicki, E., Zhou, J. C., Berg, O. H., Martinsson, B. G., Frank, G. andco-authors. 1999. A closure study of sub-micrometer aerosol particlehygroscopic behaviour. Atmos. Res. 50, 205–240.
Swietlicki, E., Zhou, J. C., Covert, D. S., Hameri, K., Busch, B. andco-authors. 2000. Hygroscopic properties of aerosol particles in thenortheastern Atlantic during ACE-2. Tellus 52B, 201–227.
Tang, I. N. and Munkelwitz, H. R. 1994. Water activities, densi-ties, and refractive indices of aqueous sulfates and sodium nitratedroplets of atmospheric importance. J. Geophys. Res. 99(D9), 18801–18808.
Tang, I. N. 1997. Thermodynamic and optical properties of mixed-saltaerosols of atmospheric importance. J. Geophys. Res.-Atmos. 102,1883–1893.
Tang, I. N., Tridico, A. C. and Fung, K. H. 1997. Thermodynamic andoptical properties of sea salt aerosols. J. Geophys. Res.-Atmos. 102,23269–23275.
Tomlinson, J. M., Li, R. J. and Collins, D. R. 2007. Physical andchemical properties of the aerosol within the southeastern Pa-cific marine boundary layer. J. Geophys. Res.-Atmos. 112, D12211,doi:12210.11029/12006JD007771.
Topping, D. O., McFiggans, G. B. and Coe, H. 2005a. A curvedmulti-component aerosol hygroscopicity model framework: Part 1—Inorganic compounds. Atmos. Chem. Phys. 5, 1205–1222.
Topping, D. O., McFiggans, G. B. and Coe, H. 2005b. A curvedmulti-component aerosol hygroscopicity model framework: Part 2—Including organic compounds. Atmos. Chem. Phys. 5, 1223–1242.
Topping, D. O., McFiggans, G. B., Kiss, G., Varga, Z., Fac-chini, M. C. and co-authors. 2007. Surface tensions of multi-component mixed inorganic/organic aqueous systems of atmo-spheric significance: measurements, model predictions and impor-tance for cloud activation predictions. Atmos. Chem. Phys. 7, 2371–2398.
Tellus 60B (2008), 3
HTDMA REVIEW 469
Tunved, P., Hansson, H. C., Kerminen, V. M., Strom, J., Dal Maso, M. andco-authors. 2006a. High natural aerosol loading over boreal forests.Science 312, 261–263.
Tunved, P., Korhonen, H., Strom, J., Hansson, H. C., Lehtinen, K. E. J.and co-authors. 2006b. Is nucleation capable of explaining observedaerosol integral number increase during southerly transport over Scan-dinavia? Tellus 58B, 129–140.
Vakeva, M., Hameri, K., Puhakka, T., Nilsson, E. D., Hohti, H. and co-authors. 2000. Effects of meteorological processes on aerosol particlesize distribution in an urban background area. J. Geophys. Res.-Atmos.105, 9807–9821.
Vakeva, M., Hameri, K. and Aalto, P. P. 2002a. Hygroscopic proper-ties of nucleation mode and Aitken mode particles during nucleationbursts and in background air. J. Geophys. Res.-Atmos. 107, 8104,doi:8110.1029/2000JD000176.
Vakeva, M., Kulmala, M., Stratmann, F. and Hameri, K. 2002b. Fieldmeasurements of hygroscopic properties and state of mixing of nucle-ation mode particles. Atmos. Chem. Phys. 2, 55–66.
Van Dingenen, R., Putaud, J. P., Martins-Dos Santos, S. and Raes, F.2005. Physical aerosol properties and their relation to air mass origin atMonte Cimone (Italy) during the first MINATROC campaign. Atmos.Chem. Phys. 5, 2203–2226.
Vestin, A., Rissler, J., Swietlicki, E., Frank, G. P. and An-dreae, M. O. 2007. Cloud-nucleating properties of the Amazo-nian biomass burning aerosol: cloud condensation nuclei mea-surements and modeling. J. Geophys. Res.-Atmos. 112, D14201,doi:14210.11029/12006JD008104.
Virkkula, A., Van Dingenen, R., Raes, F. and Hjorth, J. 1999. Hy-groscopic properties of aerosol formed by oxidation of limonene,alpha-pinene, and beta-pinene. J. Geophys. Res.-Atmos. 104, 3569–3579.
Voutilainen, A., Stratmann, F. and Kaipio, J. P. 2000. A non-
homogeneous regularization method for the estimation of narrowaerosol size distributions. J. Aerosol. Sci. 31, 1433–1445.
Wang, S. C. and Flagan, R. C. 1990. Scanning electrical mobility spec-trometer. Aerosol Sci. Tech. 13, 230–240.
Weingartner, E., Burtscher, H. and Baltensperger, U. 1997. Hygroscopicproperties of carbon and diesel soot particles. Atmos. Environ. 31,2311–2327.
Weingartner, E., Gysel, M. and Baltensperger, U. 2002. Hygroscopicityof aerosol particles at low temperatures. 1. New low-temperature H-TDMA instrument: setup and first applications. Environ. Sci. Technol.36, 55–62.
Weis, D. D. and Ewing, G. E. 1999. Water content and morphologyof sodium chloride aerosol particles. J. Geophys. Res.-Atmos. 104,21275–21285.
Wexler, A. S. and Clegg, S. L. 2002. Atmospheric aerosol mod-els for systems including the ions H+, NH4
+, Na+, SO42−,
NO3−,Cl−, Br−, and H2O. J. Geophys. Res.-Atmos. 107, 4207,
doi:4210.1029/2001JD000451.Zdanovskii, A. 1948. New methods for calculating solubilities of elec-
trolytes in multicomponent systems. Zhur. Fiz. Khim. 22, 1475–1485.Zhang, X. Q., McMurry, P. H., Hering, S. V. and Casuccio, G. S. 1993.
Mixing characteristics and water-content of submicron aerosols mea-sured in Los-Angeles and at the Grand-Canyon. Atmos. Environ. PartA-General Topics 27, 1593–1607.
Zhou, J. C., Swietlicki, E., Berg, O. H., Aalto, P. P., Hameri, K. andco-authors. 2001. Hygroscopic properties of aerosol particles over thecentral Arctic Ocean during summer. J. Geophys. Res.-Atmos. 106,32111–32123.
Zhou, J. C., Swietlicki, E., Hansson, H. C. and Artaxo, P. 2002. Sub-micrometer aerosol particle size distribution and hygroscopic growthmeasured in the Amazon rain forest during the wet season. J. Geophys.Res.-Atmos. 107, 8055, doi:8010.1029/2000JD000203.
Tellus 60B (2008), 3
Copyright © 2022 FDOKUMEN