HOW TO WRITE RESEARCH PROPOSAL
34
HOW TO WRITE RESEARCH PROPOSAL BY PROF DR. NIK MAHERAN NIK MUHAMMAD BY PROF DR. NIK MAHERAN NIK MUHAMMAD
-
Upload
universitimalaysiakelantan -
Category
Documents
-
view
8 -
download
0
Transcript of HOW TO WRITE RESEARCH PROPOSAL

HOW TO WRITE RESEARCH PROPOSALBY PROF DR. NIK MAHERAN NIK MUHAMMADBY PROF DR. NIK MAHERAN NIK MUHAMMAD

THE FORMATTHE FORMAT• CHAPTER 1
•Introduction•Background of the study•Problem statement•Objective of the study•Research questions•Definition of Terms•Significant of the study•Conclusion

CHAPTER 1CHAPTER 1• Introduction
•Explain the focus of the study (your dependent variables)
•How it relates to your other factors/variables (independent variables, moderating variables or mediating variables)
•Explain the overall purpose/objective of the study
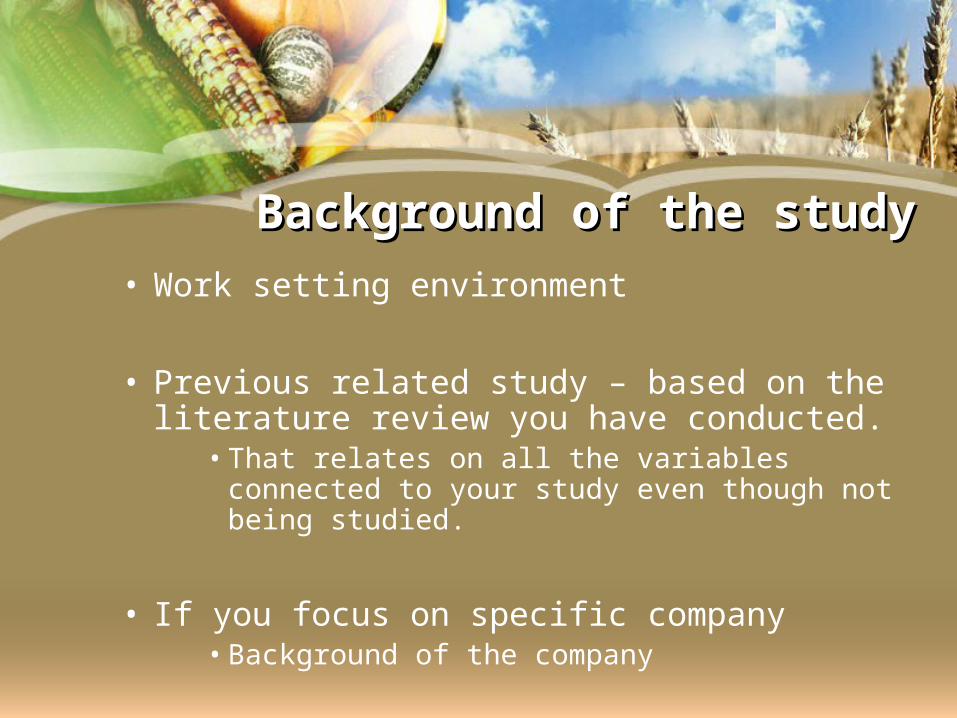
Background of the studyBackground of the study• Work setting environment
• Previous related study – based on the literature review you have conducted.
•That relates on all the variables connected to your study even though not being studied.
• If you focus on specific company •Background of the company

Problem statementProblem statement• Why this research is needed.• What are the problem that need to be solved?• What are the questions that need to be answered?
• Problem can be identified based on 2 perspective:– Practical perspective– Theoretical perspective
– Gap Identification» Area that is not yet studied» Variables that is not yet tested» Methodology that has never being used

Objective of the studyObjective of the study• What do u want to achieve at the end of the day.
– The objective must be:• understandable• logical

Research QuestionsResearch Questions• Related to the objective• But more specific• detail

Definition of TermDefinition of Term
• Concise
• Only for the key terms:– that is important to the study– Can be conceptualize differently in different context.

Significance of the Significance of the studystudy
• Theoretical significant•Gap identification•Contribution to the body of knowledge
• Practical significance•How the study will help in improving work-setting environment
•Contribution to the practitioners.

ConclusionConclusion
• Summarize the purpose of the study
• The contribution of your study•Why should you conduct this study•What is the different between your study with the previous one

CHAPTER 2CHAPTER 2LITERATURE REVIEW
– What are the previous study looked at in the similar area of yours…
– Why yours is different from the previous one.

How to write literature How to write literature reviewreview
• Review not summarize
• Important information in the literature review
•Variables used• their findings•The methodology used

How to write literature How to write literature reviewreview
• Start from general to specific– Discuss on the general area of the study
•E.g. finance, strategic management, accounting etc.
– Discuss on the related theory
– Specifically discuss on the specific variables used in the study

THEORETICAL FRAMEWORKTHEORETICAL FRAMEWORK• Based on the literature review, theoretical framework can be formed.
• Explain what are:•The construct;•The concept;•The dimension;•The element; in your framework

HYPOTHESES DEVELOPMENTHYPOTHESES DEVELOPMENT
• You can’t just hypothesize based on your assumption…
• It must be supported by a short preamble
• Your hypotheses must be justified…. WHY???

CHAPTER 3CHAPTER 3RESEARCH METHODOLOGY
1. Research design2. Variable and measurement3. Questionnaire design4. Population and sample5. Data collection method6. Data analysis method7. Conclusion

1.1. Research DesignResearch Design• Exploratory • Descriptive• Hypothesis testing• Case study

Exploratory ResearchExploratory Research•Qualitative study•Data are collected through observation, interviews, focus group
•Explore new areas of organizational research
•Undertaken when little is known about the situation – preliminary information
•E.g. Study on quality of life office romance Islamic financing

Descriptive ResearchDescriptive Research
•To describe the characteristics of the variable of interest in the situation
•To learn about and describe the characteristics of a group of employees – e.g age, educational level, job status, etc.

Hypotheses testingHypotheses testing• Explain the nature of certain relationships
• Establish the differences among groups
• Explain the variance in the dependent variable or to predict organizational outcomes

Case studyCase study• Gathering in-depth information on a single entity
• Involve contextual analyses of similar situation in other organizations.
• Qualitative in nature

Type of investigationType of investigation• Clarification
•Exploratory/descriptive study• Correlation
•At least two variables move simultaneously
•Hypotheses testing method• Causal
•One variable causes a movement in another variable

Time HorizonTime Horizon• Cross-sectional studies
•Data are gathered just once– A period of days, week, months
• Longitudinal studies•Across over period of time•Study individual or phenomena at more than one point in time.
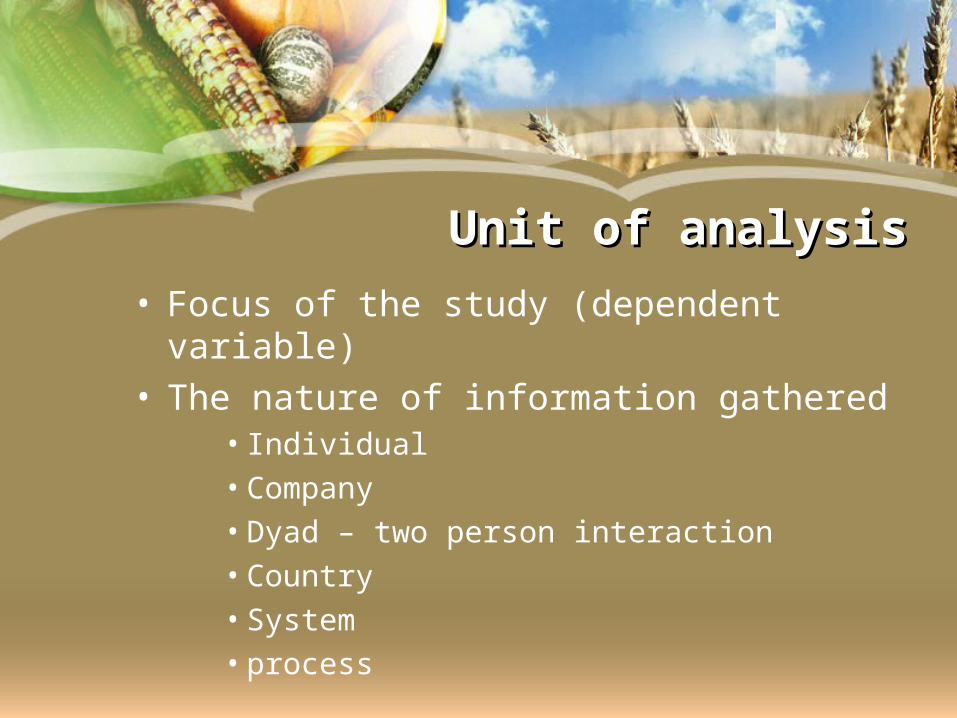
Unit of analysisUnit of analysis• Focus of the study (dependent variable)
• The nature of information gathered•Individual•Company•Dyad – two person interaction•Country•System•process
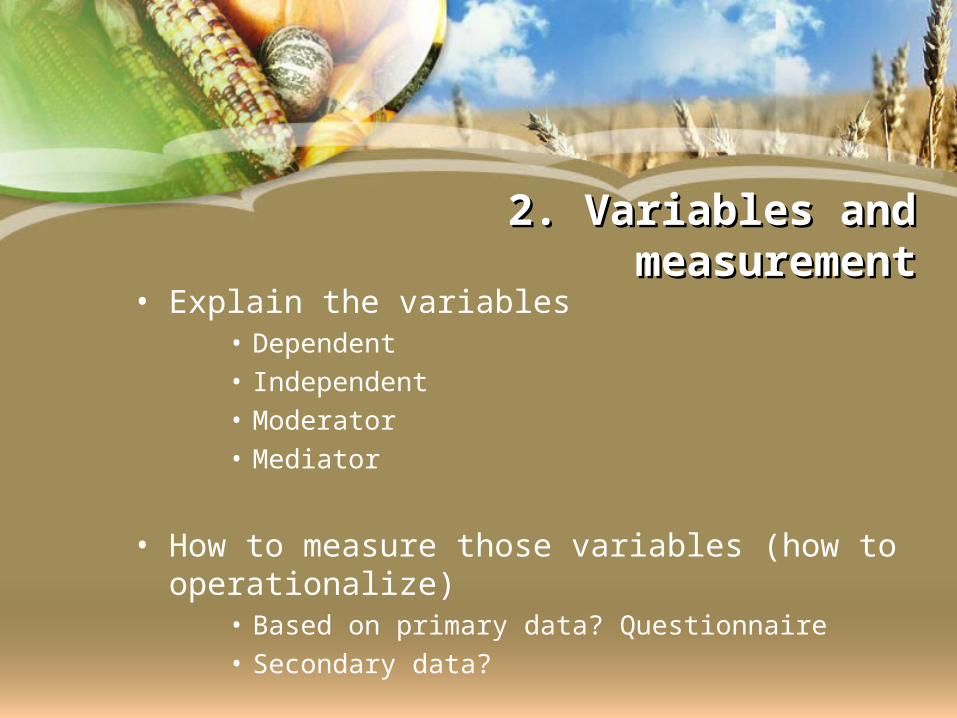
2. Variables and 2. Variables and measurementmeasurement
• Explain the variables• Dependent• Independent• Moderator• Mediator
• How to measure those variables (how to operationalize)
• Based on primary data? Questionnaire• Secondary data?

3. Questionnaire design3. Questionnaire design• Adapted?• Adopted?• Self constructed?• How it is design? What are the measurement scale
•Nominal data•Ordinal data?•Interval data?
– Likert-like scale

4. Population and 4. Population and SampleSample
• Population – entire group of people
• Sampling frame – a listing of all the elements in the population
• Sample – subset of the population
• Sample size

SamplingSampling• Process of selecting number of elements from the population
• Probability vs. non-probability sampling
Probability:1. Simple random sampling2. Stratified random sampling3. Cluster sampling
Non-probability1. Convenience sampling2. Purposive sampling

Data analysis methodData analysis method• Statistical tools used
• What are the analysis obtained•Goodness of data•Inferential analysis

Goodness of DataGoodness of Data• Representativeness of the data
•Response rate•Non-response bias•Validity•reliability

Inferential analysisInferential analysis• Descriptive analysis
• Test of differences
• Correlation analysis
• Regression analysis

Table 4.13: Descriptive statistics of Independent Variables
Decision N=118
Variables MeanStd.
Deviation
X1: Extent of scanning Technology Economic/financial Competition
3.3693.3713.392
.985
.988
.936
X2: Method of scanning Technology Economic/financial Competition
3.4133.4693.405
1.046.848.752
X3: Source of scanning (Personal/Impersonal) Technology Economic/financial Competition
2.9132.9893.068
.743
.863
.767
X4: Source of scanning (External/Internal) Technology Economic/financial Competition
2.8663.0472.867
.779
.917
.747
Notes: X1 scale range: 1(not at all) to 5 (great amount)
X2 scale range:1 (informal) to 5 (formal)X3 scale range: 1(impersonal) to 5 (personal)X4 scale range: 1(external) to 5 (internal)
Findings presentation and Findings presentation and InterpretationInterpretation

Table 4.21: ANOVA results - Other variables (Decision Quality, IPC, Nature of Decision) by demographic profile
DEMOGRAPHIC Dependent variable
Moderating variable
Control variable
Decision quality
IPC Nature of Decision
F-value
p-value
F-value
p-value
F-value
p-value
Respondent’s profile: Position Education level Field of expertise Years in the industry Years in the current firm Years in current position
.538
2.992
.445
.681
.619
.108
.585
.054
.642
.565
.604
.897
2.784
.3802.45
3.584.9191.17
3
.066
.685
.091
.627
.434
.313
.3902.82
7.0582.8571.93
2.156
.678
.063
.943
.040
.128
.855
Company’s profile: Type of industry Years in operation Size of company-No. of employees- Average revenue
1.795.582.046.536
.183.628.955.587
1.4721.400.8981.402
.227
.247
.410
.251
1.3602.655.0251.885
.246.052.976.157
Decision’s profile: Type of decision Size of investment
1.097
1.013
.354
.390
1.689
.800
.173
.496.4572.09
7
.713
.105

Table 4.25: Model summary of multiple regression analysis
Model 1(control variable)
Model2(independe
nt variables)
Model3(moderatin
g variable)
Model4(Interacti
on variables)
F value .040 2.579*** 3.535*** 3.112***R square .000 .258 .343 .506Adjusted R square
-.010 .158 .246 .343
R square change
.000 .258 .085 .163
F change .040 2.809*** 11.401*** 2.086***
***significant at the 0.01 level, ** significant at the 0.05 level, * significant at the 0.1 level