How To Create Satisfaction Customer Satisfaction in Business-to-Business Relationships Date for...
44
HOW TO CREATE SATISFACTION? Customer Satisfaction in Business-to-Business Relationships Date for ventilation: 2009-05-28 Bachelor Thesis Uppsala University Authors: Business Department Tomas Henriksson Supervisor: Christina Hultbom Carolin Westman Wall
-
Upload
independent -
Category
Documents
-
view
4 -
download
0
Transcript of How To Create Satisfaction Customer Satisfaction in Business-to-Business Relationships Date for...

HOW TO CREATE SATISFACTION?
Customer Satisfaction in Business-to-Business Relationships
Date for ventilation: 2009-05-28 Bachelor Thesis
Uppsala University Authors:
Business Department Tomas Henriksson
Supervisor: Christina Hultbom Carolin Westman Wall

1
ABSTRACT
This thesis aims to increase the understanding for how customer satisfaction is created in
business-to-business relationships in the copying machine and IT sector. A second objective
is to contribute to the small, yet growing literature on the topic of satisfaction in business-to-
business settings. In order to accomplish this, one company in the copying machine and IT
sector has been used as a base and its customers have been the focus of the study. The results
show that if the expectations the customers have of the product are met, the customers are
likely to be satisfied. Furthermore, parts that have a high influence on customer satisfaction
are technical support, the products’ quality, the product’s user-friendliness and availability of
the staff. The part that contributed the most to customer satisfaction was how the staff treated
the customers. The parts which contributed the least were selection of products, handling of
invoices and delivery times.
2
TABLE OF CONTENTS
1. INTRODUCTION 3
1.1 PROBLEM FORMULATION 4 1.1.1 BACKGROUND OF THE STUDIED COMPANY AND THEIR RELATIONSHIP WITH CLIENTS 4 1.2 PURPOSE AND RESEARCH QUESTION 5
2. A FOUNDATION FOR CUSTOMER SATISFACTION 6
2.1 WHY IS CUSTOMER SATISFACTION IMPORTANT? 6 2.2 WHAT AFFECTS CUSTOMER SATISFACTION? 6 2.2.1 EXPECTATIONS AND HOW THEY ARE MET 7 2.2.2 DIFFERENT PARTS OF AN OFFER 8 2.2.3 SUBJECTIVITY 8 2.3 DIFFERENCES IN CUSTOMER SATISFACTION IN B2B RELATIONSHIPS 9 2.4 MODEL DEVELOPED FOR THE STUDY 11
3. RESEARCH STRATEGY 13
3.1 RESEARCH APPROACH 13 3.2 DATA COLLECTION 13 3.2.1 SURVEY TOOLS 13 3.2.2 SURVEY QUESTIONS AND RESPONSE FORMAT 14 3.2.3 DATA PROCESSING 15 3.3 POPULATION AND SAMPLE 15 3.4 VALIDITY AND RELIABILITY 15
4. CUSTOMERS’ VIEWS ON SATISFACTION 17
5. HOW CUSTOMER SATISFACTION IS AFFECTED 22
5.1 EXPECTATIONS AND HOW THEY ARE MET 22 5.2 DIFFERENT PARTS OF AN OFFER 23 5.3 SUBJECTIVITY 25 6.1 IDENTIFIED FACTORS AFFECTING CUSTOMER SATISFACTION 27 6.2 PROPOSALS FOR FUTURE RESEARCH 28
7. REFERENCES 30
APPENDIX I: QUESTIONNAIRE 33
APPENDIX II: RESULTS 39
APPENDIX III: HYPOTHESIS TESTING FOR CORRELATION BETWEEN HOW
EXPECTATIONS WERE MET AND GRADES 43
3
1. INTRODUCTION
The economy during the first half of the twentieth century was different from what it is today.
Companies tended to be concentrated on manufacturing and productivity. Wealth was created
by selling large quantities of goods to the mass market. What customers needed and wanted
was neglected (Fornell, 2007, p.17). A general assumption was, and to some extent still is,
that if a company becomes more productive, many benefits such as economic growth will
follow. However, this is not always the case. There is a strong negative relationship between
company productivity and customer satisfaction. According to Fornell (2007), many
companies have too much focus on productivity. For example, service companies often see
themselves as manufacturers instead of service providers. But why then can a strong focus on
productivity be harmful for companies? Productivity is basically about doing more with fewer
resources and it is difficult to maintain the same quality and service. This is especially
difficult for service companies. Unlike companies that produce pure goods, services are co-
produced by seller and buyer. The interaction between the seller and buyer and the
performance of the seller is what determines the value and quality of the service. If companies
reduce their workforce in order to increase productivity, the service quality is likely to
decline.
“Declining customer satisfaction reduces demand and sets in motion a vicious circle
of effects that includes erosion of firms’ economic value, labor uncertainty, and,
ultimately, slower economic growth” (Fornell, 2007, p. 14).
Today, the market has changed. Customers have more choice and more power against
suppliers. As a result of this, profit and financial growth are less dependent on tangible goods
and assets and more dependent on relationships with customers (ibid, p. 17). An increasing
amount of companies have realized the importance of satisfying their customers; therefore,
customer satisfaction has become a focal point for companies. One of the most important
reasons for this new focus is the relation between customer satisfaction and other variables.
Companies expect satisfied customers to return and repurchase, i.e. be profitable customers.
Satisfied customers may also speak in positive terms about the company with their family,
friends and colleagues. Thus, satisfied customers can be seen as marketers for the company
through word-of-mouth (Söderlund, 1997, pp. 10-11).
4
1.1 Problem Formulation
As customer satisfaction has become more important, there has been a lot of research done in
this area in business-to-consumer (B2C) markets. In these cases, the consumer is seen as a
private person consuming goods. However, literature on business-to-business (B2B)
relationships has mostly been focusing on the purchase process. Post-purchase outcomes and
customer satisfaction have, until recently, been neglected within this segment (Cronin, 1989;
Molinari et al. 2008; Rossomme, 2003). This is despite the importance of the B2B segment.
As stated in the previous section, customer satisfaction is crucial for a supplier company’s
success. Just producing without listening to the customer is not a viable option these days.
Paying attention to what the customer wants and adapting to it is of great importance. Many
supplier companies have realized this and the creation of fruitful relationships between client
and supplier companies have increased in the past years. Academic literature on B2B has also
acknowledged these relationships and networks (O’Donnell, 2000; Andersson et al., 2002;
Gummesson, 1998). But, as stated earlier, work on customer satisfaction is sparse. This leaves
a need for more research on customer satisfaction in B2B relationships. What is customer
satisfaction in business markets? What creates customer satisfaction in B2B relationships? Is
there any difference between customer satisfaction in business markets compared to B2C
markets?
1.1.1 Background of the Studied Company and Their relationship With Clients
One supplier company that operates in B2B settings has been chosen to be the focus of this
study. The company will be referred to under the pseudonym IT© to protect the
company. IT© has recently become more interested in what their customers feel. The
company was founded eight years ago and is now a part of a group, which has affiliates
spread throughout Sweden. The group offers its clients custom-made IT solutions as well as
the possibility to buy single products such as copy machines and office supplies. A large part
of their operation is to continually provide service to their customers. The staff of IT©
has in the past two years grown from three to 24 employees. Their five year goal is to increase
their staff to a total of 60 employees and increase their turnover to 125 million SEK. One risk
with their growth strategy is that too much attention could be directed towards the financial
numbers and that the value they create for customers could be neglected. What is not
specified in the goals can easily be forgotten (Merchant & Van der Stede, 2007, pp. 25-35).
Therefore, it is of great importance that IT© is aware of what makes their customers
satisfied. Up until now, no customer satisfaction survey has been executed. For this reason, it

5
is interesting to examine which factors affect IT©’s customers’ satisfaction.
When buying a product, the buyer in a company faces many decisions depending, on the type
of buying situation. In B2B, there are three main buying situations: straight rebuy, modified
rebuy, and new task (Kotler et al, 1999, p. 283). The company and customers used for this
study mainly operate in straight rebuy situations. The other two situations occur as well, but
as these are less common, they will not be the focus of this study. In straight rebuy situations,
customers reorder a product without modifications. The situation is handled by the purchasing
department, usually on a routine basis. In many cases, the buying process is automatic to save
time and money for both buyers and suppliers (ibid.). When B2B is mentioned in the text, it
refers to this buying situation. Additionally, B2B in this study refers to companies who are
buying consumption goods from a supplier company. This is because IT©’s customers
are purchasing goods for their own consumption, not goods which are used in their
production.
1.2 Purpose and Research Question
The aim of this study is to increase the understanding of how customer satisfaction is created
in B2B relationships in the copy machine and IT-solutions market from the customer’s point
of view. Through this, an ambition is to denote indicators which increase customer value. A
single company, IT©, will be used as a platform and their customers will be the target of
the study. A final aspiration with this study is to contribute to the small, but growing literature
on the topic of customer satisfaction in B2B settings. To fulfill the purpose of this study, the
following questions have been formulated:
� Which factors affect customer satisfaction in a business-to-business relationship with
IT©?
� Out of the factors affecting customer satisfaction, which factors have a bigger versus
smaller impact on customer satisfaction?
6
2. A FOUNDATION FOR CUSTOMER SATISFACTION
In order to answer the research questions and to fulfill the purpose of the thesis, a theoretical
framework is needed to define factors that affect customer satisfaction. Furthermore, a model
will be developed from the theoretical framework, which will allow an analysis of the
empirical study.
2.1 Why is Customer Satisfaction Important?
The key to business performance is the ability to satisfy and retain customers (Johnson &
Gustafsson, 2000). Customer satisfaction is important because it says something about the
company’s current condition. But even more importantly, customer satisfaction says
something about the company’s future. It reveals if customers will return to the company in
the future (Fornell, 2007, p. 45). It does not matter how productive a company is if their
customers are not satisfied with their offerings. They will simply take their business
elsewhere. Satisfied customers, on the other hand, are more likely to return in the future.
Customer satisfaction and thus customer consumption are the center of business. All parts of
business (employment, prices, profits, production, economic growth etc.) are dependent on
customers consuming products (Fornell, 2007; Johnson & Gustafsson, 2000).
“Satisfied customers are not only the sum total of the value of all other company
assets – virtually all costs and revenues have some relationship, however weak or
indirect, to customer acquisition and customer retention” (Fornell, 2007, p. 66).
To create long-term profit and shareholder value, companies need to think of customers as
investors and an economic asset. It is the customers that bring financial revenue to companies.
Hence, customers are companies’ greatest asset (ibid.).
2.2 What Affects Customer Satisfaction?
Many things can affect customer satisfaction. The three areas chosen for this study are the
individuals’ expectations and how well these expectations are met, the offer’s various parts as
well as the individuals’ subjectivity. These areas affect customer satisfaction both in B2B and
B2C relationships.
7
2.2.1 Expectations and How They Are Met
One important aspect of customer satisfaction is what expectations the customers have of the
product. One definition of expectations made by Sheth (1973, p. 52) is:
“Expectations refer to the perceived potential of alternative suppliers and brands to
satisfy a number of explicit and implicit objectives in any particular buying
decision.”
These objectives can be product quality, delivery time, quantity, service, price, etc. Different
individuals tend to have different expectations of products. The reasons for this are the
background of the individuals, the amount of information he/she has and seeks, and the
amount of satisfaction with past purchases (Sheth, 1973, pp. 52-53). There is also a point in
differentiating between varying levels of expectations. These different levels are a buyer’s
ideal expectation level, deserved level (where benefits is equal to costs), minimum tolerable
level and anticipated level (Cronin, 1989, pp. 41-42).
The dominant model in literature on customer satisfaction is called the disconfirmation model
and it deals with how well expectations are met (Rossomme, 2003; Churchill & Surprenant,
1982). The disconfirmation of expectations can either be positive or negative (Molinari, 2008,
p. 364). If the perceived product exceeds the customers’ expectations, the customer
satisfaction will be very high. If the product meets the customers’ expectations, the customers
will be satisfied. And finally, if the perceived product does not meet the customers’
expectations, the result will be an unsatisfied customer (Kotler, 2000; Churchill & Surprenant,
1982). This means that if a customer has unrealistically high expectations, the customer will
be disappointed even though the product was of good quality (Grönroos, 2007, pp. 76-81).
There are four stages that the customer goes through in the disconfirmation model. In the first
stage, the customer has a predetermined product standard in mind. Then the customer
experiences the post-consumption performance of the product. In the third stage, the customer
compares this performance with their predetermined standard and positive or negative
disconfirmation is formed. In the last stage, the customer forms a summary of their
satisfaction for the overall experience. This is based on both personal and often subjective
reasons as well as rational reasons (Rossomme, 2003, pp. 185-186).
8
2.2.2 Different Parts of an Offer
Söderlund (1997) states that a product can be seen as different parts, which individually create
satisfaction. The customer can be satisfied with some parts of the offer and dissatisfied with
others. The different parts of an offer can be divided into a variety of groups. Examples of the
parts are perceived service, treatment from the supplier, delivery time, reliability, etc. (Seth,
1973; Söderlund, 1997). The customer can also view the product as a compound of the
different parts and create an overall satisfaction (Söderlund, 1997, pp. 42-43).
Another way to look at the various parts of an offer is the classic 4P model; the marketing
mix. This model consists of product, price, place and promotion. The product1 is tangible in
form of goods or intangible in form of services. The price is the amount a customer pays for
the product. The place is the distribution channel where the product can be purchased. The
promotion represents all communication that a company or a marketer may use in the
marketplace. This communication can be advertising, public relations or word-of-mouth
(Jobber & Fahy, 2003).
Studies regarding services show that some parts of the offer affect satisfaction more than
others. The part that has the strongest critical effect on satisfaction and often causes
dissatisfaction is core-service failure. Core-service failure consists of service mistakes, such
as contracts that are filled incorrectly; service catastrophes, in which the service provider
actually causes damage to the customer; and billing errors. The second most critical part is
service encounter failures, in which failure happens in the interaction between the service
provider and the customer. The third most critical part is pricing, which does not necessarily
have to do with a high price but rather with a price that the customer feels is not legitimate in
relation to the product quality (Richman, 1996, p. 9).
2.2.3 Subjectivity
According to Söderlund (2000), customer satisfaction can be seen as an attitude that is based
on experiences and subjectivity. Customer satisfaction is a state of mind that the customer has
(Söderlund 1997; 2000). This state of mind is a result of being exposed to offers and taking
part of transactions with suppliers. It can be described as an emotional reaction connected to
the customer’s own experiences (Söderlund, 1997, pp. 37-40). Furthermore, customer
satisfaction is subjective in the sense that it is the customer who subjectively evaluates his/her
1 A product consists of both goods and services (Grönroos, 2007)
9
state of mind, regardless of what is “correct” from an objective point of view (Söderlund,
1997; 2000). That customer satisfaction is a customer’s subjective evaluation means that how
customers view satisfaction differ from each other. The customers’ view of their purchase is
colored by their biased interpretation of their purchasing experience. Also, customers as a
group view satisfaction differently than suppliers (Söderlund, 1997, pp. 38-40).
2.3 Differences in Customer Satisfaction in B2B Relationships
The areas just discussed affect satisfaction both in B2B and B2C settings. However, customer
satisfaction in B2B relationships is different compared to B2C relationships in many ways. It
is also regarded as being more challenging to measure. Five major differences have been
identified:
1. Satisfaction of an entire company is measured.
2. Many people are involved in the procurement and use of the product.
3. Different people have different expectations.
4. A variety of situational and relational factors affect customer satisfaction in B2B
relationships.
5. More rational objectives are included in the satisfaction evaluation.
The first difference deals with measuring the satisfaction of an entire company. Traditional
customer satisfaction is measured on an individual level, as one person evaluates his/her
satisfaction with a product. A company cannot “feel” satisfied; it is the combined satisfaction
of the people within the company that constructs the satisfaction (Rossomme, 2003, pp. 180-
181).
The second divergence is in which people are involved in the purchase process and which
people use the product. Purchasing can be an autonomous act, i.e. it can be delegated to one
party, or even a single person in a company. It can also be a joint purchase decision where
several parties from within the company are represented (Sheth, 1973, p. 54). A related topic
is which people in the organization affect the purchase decision. Rossomme (2003, pp. 183-
184) describes five distinctive roles. (1) Deciders have power to approve final suppliers. (2)
Gatekeepers control the flow of information to the rest of the company. (3) Influencers
provide information and define specifications for the product. (4) Buyers have authority to
select suppliers and arrange purchase agreements. (5) Lastly, users utilize the product and
10
may have wishes regarding quality and user-friendliness. Who will affect the purchase
decision varies from organization to organization and tends to be situation-specific. Different
people can also come in contact with the product in different stages. One person can decide
which product to buy, a second person can take care of the purchasing process and a final
person can use the product. This means that one single person in a company does not
necessarily go through the traditional purchase-usage-satisfaction stages. Furthermore, all
employees within an organization will not come in contact with the product and even fewer
people will use it (ibid. pp. 180-184).
The third difference is that the various people who come in contact with the product tend to
have different expectations on the product they are buying. Section 2.2.1, which discussed
expectations and the disconfirmation process, stated that people have different expectations
on products. Different people in the company, such as buyers and users, tend to value various
parts of a product differently and have different expectations on them. The users usually look
for fast delivery, proper installation and good service. Buyers appreciate competitive prices
and value for money. The difficulty with customer satisfaction in B2B relationships is to
satisfy these different individuals at the same time (Sheth, 1973, pp. 52-53).
A fourth reason as to why customer satisfaction is different in B2B versus B2C situations is
situational and relational factors. The initial purchase is influenced by situational factors such
as economic conditions, strikes, organizational changes, etc. (ibid. p. 56). Situational
determinants also affect B2B relationships and thus customer satisfaction. Examples of such
determinants are availability of alternatives, dynamism of supply market, importance of
supply and complexity of supply. These in turn affect B2B relationships in regard to
information exchange, operational linkages, legal bonds, cooperation and adaptation. Closer
relationships with a high degree of adaptation are not necessarily correlated with a higher
level of customer satisfaction. Studies show that client firms do not want close ties with all
their suppliers since this requires time to build the relationship. However, many close
relationships also result in customer satisfaction (Cannon, 1999; Goodman et al., 1995).
Whether it is positive or not, relationships in B2B contexts tend to be more complex and
characterized by interdependence (Molinari et al., 2008, p. 363).
The fifth and last difference is that companies do not only base satisfaction on personal and
psychological experiences: they also incorporate concrete, rational objectives in their

11
satisfaction judgment process to a larger extent than private consumers do (Rossomme, 2003,
pp. 180-181).
2.4 Model Developed for the Study
To have a roadmap for this study, a model has been created (Figure 1) based on the literature
presented above. The model has also been adjusted to fit the study object: IT©’s
customers. The main areas that affect customer satisfaction are expectations of the product
and experience of the product, which is how the expectations are met (i.e. disconfirmation).
These two areas also affect each other. Which experience the customers have had with
IT&Copy will affect which expectations they have and vice versa. Both of these are
influenced by subjectivity and the different parts of an offer.
Figure 1: Model of What Affects Customer Satisfaction in B2B Relationships
Customer
Satisfaction
Expectations
of products
Experience
of products
o Subjectivity
o Different parts of an offer
o Subjectivity
o Different parts of an offer
(Source: Own processing)
Subjectivity consists of a number of parts. Most of the differences between customer
satisfaction in B2B relationship versus B2C relationships fall under this category. However,
not all of the differences are included in the model. One difference has been chosen to be
included in the model. This is the different roles people have in companies, which is said
affect their point of views. It might also have an impact on which expectations they have. On
the grounds that it is difficult to separate the various roles from each other, only buyers and
users are covered in the model. As many of the client customers are small companies where
12
an employee can be a buyer and a user, three groups have been formed: (1) buyers, (2) users
and (3) buyers and users.
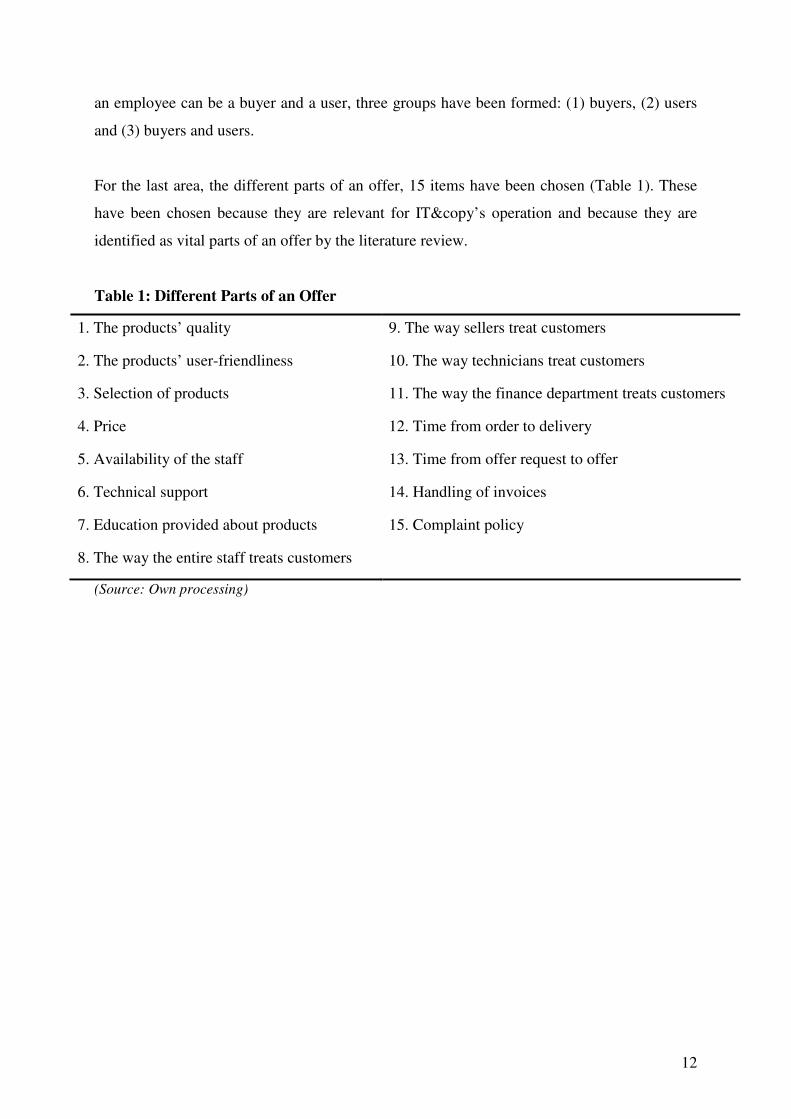
For the last area, the different parts of an offer, 15 items have been chosen (Table 1). These
have been chosen because they are relevant for IT©’s operation and because they are
identified as vital parts of an offer by the literature review.
Table 1: Different Parts of an Offer
1. The products’ quality 9. The way sellers treat customers
2. The products’ user-friendliness 10. The way technicians treat customers
3. Selection of products 11. The way the finance department treats customers
4. Price 12. Time from order to delivery
5. Availability of the staff 13. Time from offer request to offer
6. Technical support 14. Handling of invoices
7. Education provided about products 15. Complaint policy
8. The way the entire staff treats customers
(Source: Own processing)
13
3. RESEARCH STRATEGY
3.1 Research Approach
To answer the questions “Which factors affect customer satisfaction in a business-to-business
relationship with IT©?” and “Out of the factors affecting customer satisfaction, which
factors have a bigger versus smaller impact on customer satisfaction?” a quantitative study
was chosen. One reason for this is that questionnaires are useful when descriptive research is
conducted (Saunders et al. 2003, pp. 281-283). Surveys allow a large sample in an economical
manner and easy comparison is allowed if the questions are standardized. Issues with this
method can be a low response rate and poorly filled in surveys. Creating the survey itself is
also a dilemma since it is important that the right questions are asked as there is no possibility
for follow-up questions (ibid. pp. 92). In order to promote a high response rate, the invitation
to take the survey was sent out by the CEO of IT©, which hopefully increases the
importance of the survey for the customers. The dual purpose of the survey has also been
emphasized: to use as a base for this paper as well as a part of an improvement process for
IT©. To decrease the risk of poor answers, the survey was designed to be relatively easy
to understand and fast for the respondents to fill in. The survey consists of six questions. To
ensure that the “right” questions were asked, two people from IT©’s board of directors
and a lector at Uppsala University gave feedback to the survey. See Appendix I for the
survey.
3.2 Data Collection
3.2.1 Survey Tools
An online self-administered questionnaire is a good choice if the respondents are computer-
literate and if the sample size is large. It is also a relatively fast and cost-effective way of
conducting a survey. Additionally, there is a high confidence that the right person answers the
survey, as e-mails are typically read on a personal computer (Saunders et al., 2003, pp. 282-
284). For these reasons, this type of questionnaire was chosen. There are, however, a number
of implications of this choice. Besides the drawbacks of questionnaires discussed in Section
3.1, online questionnaires are also typically restricted to shorter questions (ibid. pp. 282-285).
Because of this reason, the questions have been designed with the aim to keep them concise.
14
The website chosen for creating the survey was www.surveyconsole.com. This site was
chosen because it allowed unlimited respondents and gave the possibility of creating a unique
Internet address. It also has basic statistical functions for analyzing the results.
3.2.2 Survey Questions and Response Format
The survey has been created based on the model presented in Figure 1. First, the respondents
were asked to rank and state the importance of the items under the different parts of an offer.
Then the respondents were asked to judge how well IT© had met their expectations in
the same categories. Lastly, the customers were asked to grade IT© using the same
categories once again. The reason for this method was to first reveal what expectations the
customers had and then see how their expectations were met. It was also possible to see if a
category got good ratings because the expectations were low or because IT© actually
performed well. Regarding subjectivity, questions were asked to find out if the respondent
was a buyer and/or user and which product they bought. As stated previously, customer
satisfaction is an individual’s own subjective view of his/her state of mind. Based on this, it is
impossible to ask an individual to state how satisfied a company is. Therefore, all questions
were designed to only ask the individual to evaluate their own opinions.
The response format in the survey is an important part of the survey since it determines how
the data can be used. The widely used five-point Likert scale was chosen for a majority of the
questions. This scale is designed to allow customers to respond in varying degrees to a
statement, i.e. they are not only able to state that they are satisfied/dissatisfied, but also to
which degree (Hayes, 1997, pp. 67-71). In addition to the Likert scale, a “do not know”
option was affixed as buyers versus users might feel that they do not have enough knowledge
to answer all questions. To complement the Likert scale, customers were also asked to rank
the importance of different components of the product/service offering as mentioned
previously. A liability is that ranking more than eight items is said to take too much effort
(Saunders et al., 2003, p. 296). Therefore, the 15 different parts of an offer were narrowed
down to 10 parts. However, as this is too many, there is still a risk of generating poor answers
or non-responses. It was nevertheless concluded that these items were important to rank.
15
3.2.3 Data Processing
The website, surveyconsole.com, used for the online survey has basic analytical tools and was
therefore the main instrument for statistical calculations. Means, standard deviations and
variance were calculated using this tool. Excel was used for doing a correlation analysis.
3.3 Population and Sample
The population of the research was IT©’s contracted customers who regularly receive
invoices. As IT&Copy’s operations revolve around the continuous service they provide to
their customers, all customers fall under this category. However, as these customers have an
on-going relationship with the company, this will have an effect on their expectations of the
company. Another option could have been to focus on new clients, but as these were few in
numbers and might have difficulties in grading IT&Copy in different categories, it was
decided to survey IT&Copy’s contracted customers. Due to the relatively small population,
900 companies, the entire population has been chosen as the sample. This type of sampling is
called census sampling and it is a good option if the company wants input from all customers.
It can, however, be quite costly and time-consuming (Hayes, 1998, p. 85). The customers are
all found in the same geographical region, but they vary in size and are found in wide range of
industries.
3.4 Validity and Reliability
Out of the 900 companies that were asked to participate, 148 companies completed the
survey. This is a response rate of 16.44 % and thus the same amount of the population has
participated in the survey. This can affect the validity of the survey as many customers failed
to respond. Furthermore, the customers that did respond might share some characteristics,
which the population does not have. This can for instance be that they are more satisfied or
more dissatisfied than the average. However, the average response rate for this type of survey
is 10-30 % (Hayes, 1998, p. 85). Therefore, with a response rate of 16.44 %, the study has
been assessed as reliable. Furthermore, as a relatively high percentage of the population
participated in the survey, the results are regarded as fair indicators of the population’s
opinions.
One thing to keep in mind when reading the results of this study is that the results show the
respondents’ subjective evaluation of their satisfaction. This can be tainted by their
personality, background or even the mood they were in when filling in the survey. Therefore,

16
it is difficult to judge satisfaction, which is a constant dilemma when measuring customer
satisfaction (Goodman, 1995; Molinari et al., 2008; Rossomme, 2003).
17
4. CUSTOMERS’ VIEWS ON SATISFACTION
In this section, the result of each question in the survey will be presented one by one. The
results for questions four to six are presented as means. The “do not know” option is not
included in these means. For more in-depth results, see Appendix II.
1. Which products does the company you represent purchase?
Most of the client companies, 69.40 %, are purchasing only copying machines. 21.55 % are
purchasing both copying machines and IT solutions. The remaining percent, 9.05 %, are
purchasing IT solutions.
2. In your relationship with IT©, how would you like to describe your role?
Out of the respondents, 48.50 % are both purchasers and users. 45.92 % are only users and the
remaining, 5.58 %, are only purchasers.
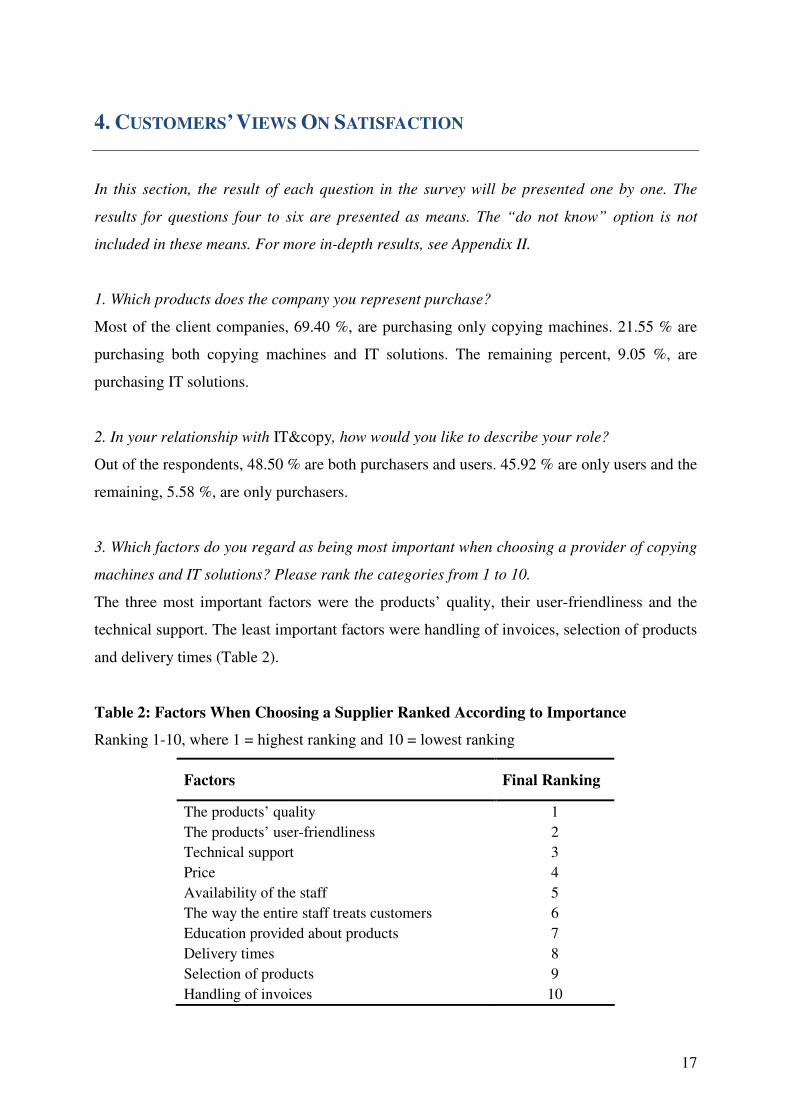
3. Which factors do you regard as being most important when choosing a provider of copying
machines and IT solutions? Please rank the categories from 1 to 10.
The three most important factors were the products’ quality, their user-friendliness and the
technical support. The least important factors were handling of invoices, selection of products
and delivery times (Table 2).
Table 2: Factors When Choosing a Supplier Ranked According to Importance
Ranking 1-10, where 1 = highest ranking and 10 = lowest ranking
Factors Final Ranking
The products’ quality 1
The products’ user-friendliness 2
Technical support 3
Price 4
Availability of the staff 5
The way the entire staff treats customers 6
Education provided about products 7
Delivery times 8
Selection of products 9
Handling of invoices 10
18
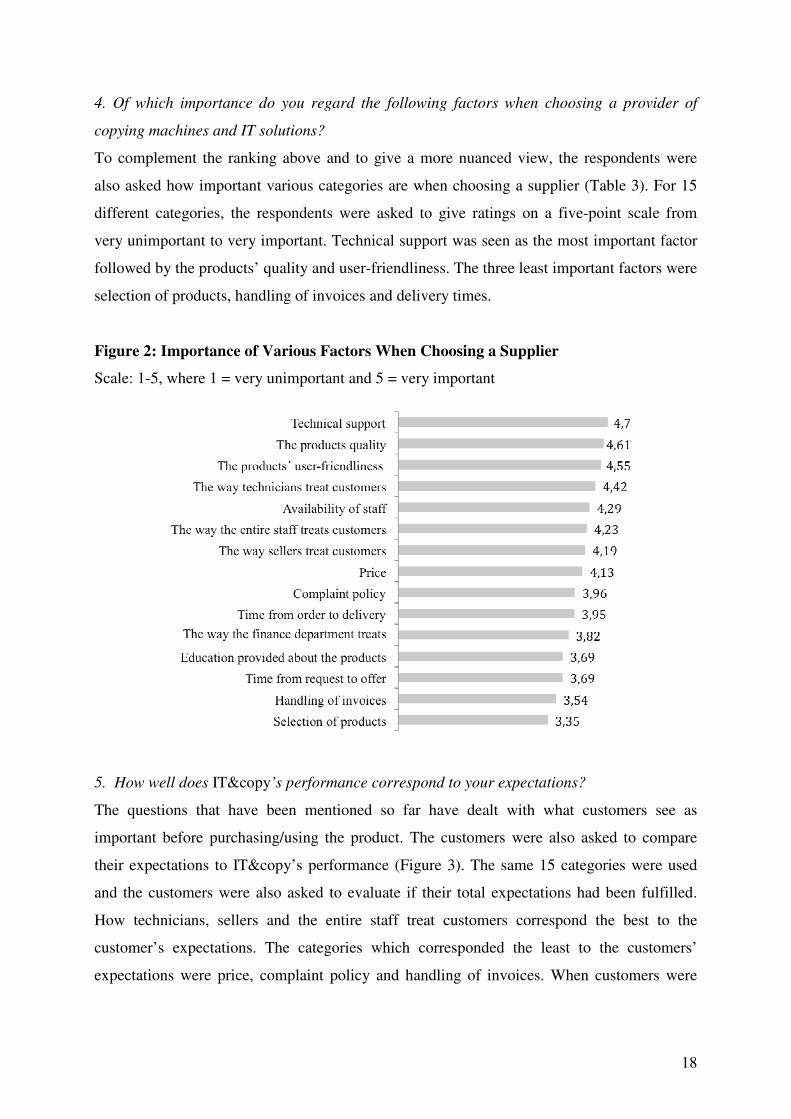
4. Of which importance do you regard the following factors when choosing a provider of
copying machines and IT solutions?
To complement the ranking above and to give a more nuanced view, the respondents were
also asked how important various categories are when choosing a supplier (Table 3). For 15
different categories, the respondents were asked to give ratings on a five-point scale from
very unimportant to very important. Technical support was seen as the most important factor
followed by the products’ quality and user-friendliness. The three least important factors were
selection of products, handling of invoices and delivery times.
Figure 2: Importance of Various Factors When Choosing a Supplier
Scale: 1-5, where 1 = very unimportant and 5 = very important
5. How well does IT©’s performance correspond to your expectations?
The questions that have been mentioned so far have dealt with what customers see as
important before purchasing/using the product. The customers were also asked to compare
their expectations to IT©’s performance (Figure 3). The same 15 categories were used
and the customers were also asked to evaluate if their total expectations had been fulfilled.
How technicians, sellers and the entire staff treat customers correspond the best to the
customer’s expectations. The categories which corresponded the least to the customers’
expectations were price, complaint policy and handling of invoices. When customers were
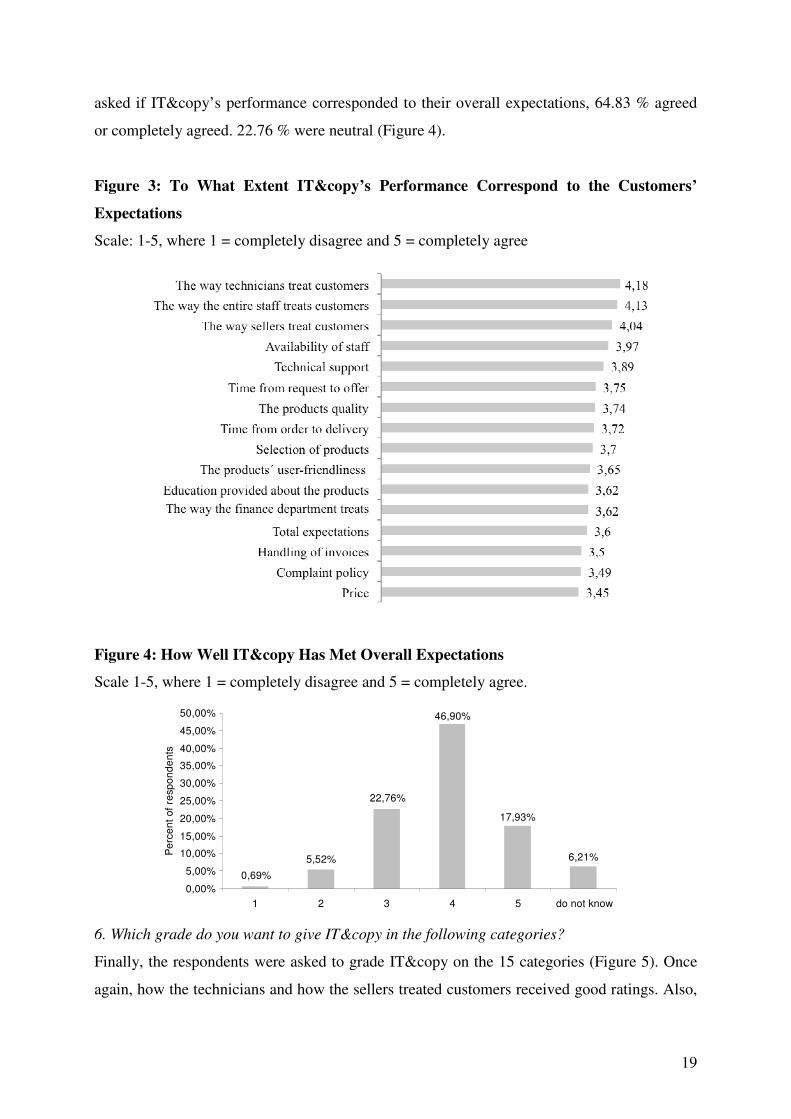
19
asked if IT©’s performance corresponded to their overall expectations, 64.83 % agreed
or completely agreed. 22.76 % were neutral (Figure 4).
Figure 3: To What Extent IT©’s Performance Correspond to the Customers’
Expectations
Scale: 1-5, where 1 = completely disagree and 5 = completely agree
Figure 4: How Well IT© Has Met Overall Expectations
Scale 1-5, where 1 = completely disagree and 5 = completely agree.
6,21%
17,93%
46,90%
22,76%
5,52%
0,69%
0,00%
5,00%
10,00%
15,00%
20,00%
25,00%
30,00%
35,00%
40,00%
45,00%
50,00%
1 2 3 4 5 do not know
Pe
rce
nt
of
resp
on
de
nts
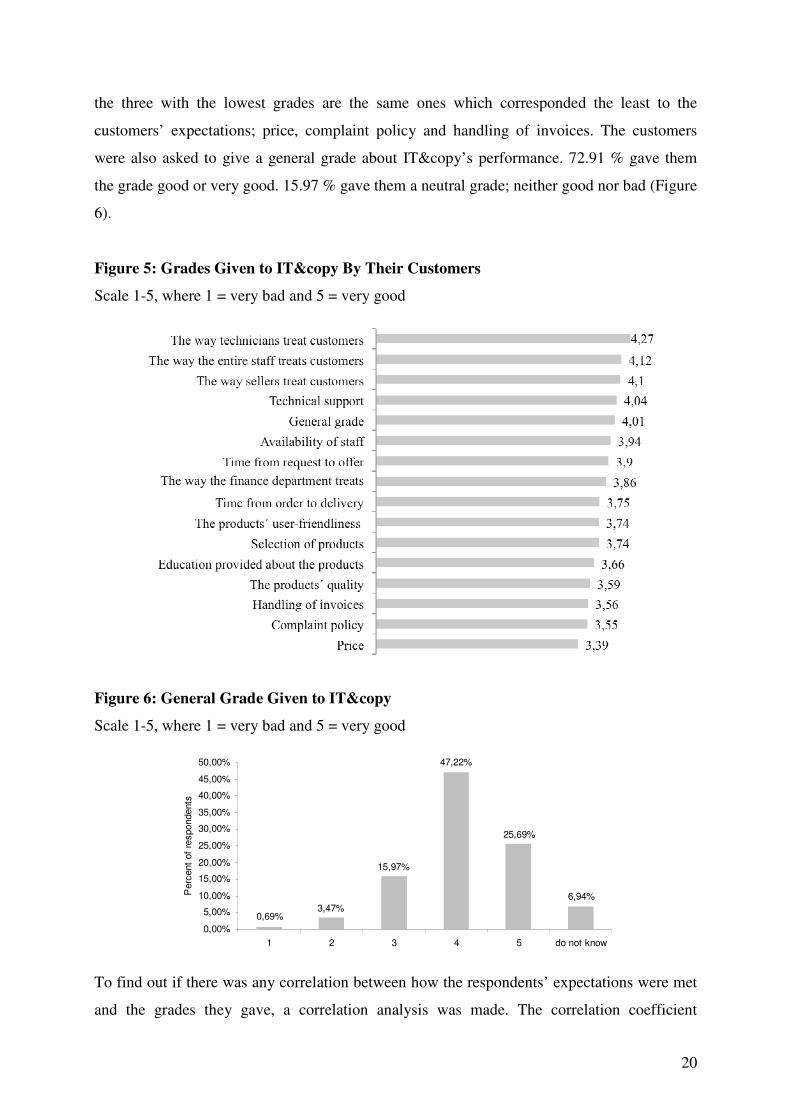
6. Which grade do you want to give IT© in the following categories?
Finally, the respondents were asked to grade IT© on the 15 categories (Figure 5). Once
again, how the technicians and how the sellers treated customers received good ratings. Also,
20
the three with the lowest grades are the same ones which corresponded the least to the
customers’ expectations; price, complaint policy and handling of invoices. The customers
were also asked to give a general grade about IT©’s performance. 72.91 % gave them
the grade good or very good. 15.97 % gave them a neutral grade; neither good nor bad (Figure
6).
Figure 5: Grades Given to IT© By Their Customers
Scale 1-5, where 1 = very bad and 5 = very good
Figure 6: General Grade Given to IT©
Scale 1-5, where 1 = very bad and 5 = very good
6,94%
25,69%
47,22%
15,97%
3,47%0,69%
0,00%
5,00%
10,00%
15,00%
20,00%
25,00%
30,00%
35,00%
40,00%
45,00%
50,00%
1 2 3 4 5 do not know
Perc
ent
of
respondents
To find out if there was any correlation between how the respondents’ expectations were met
and the grades they gave, a correlation analysis was made. The correlation coefficient
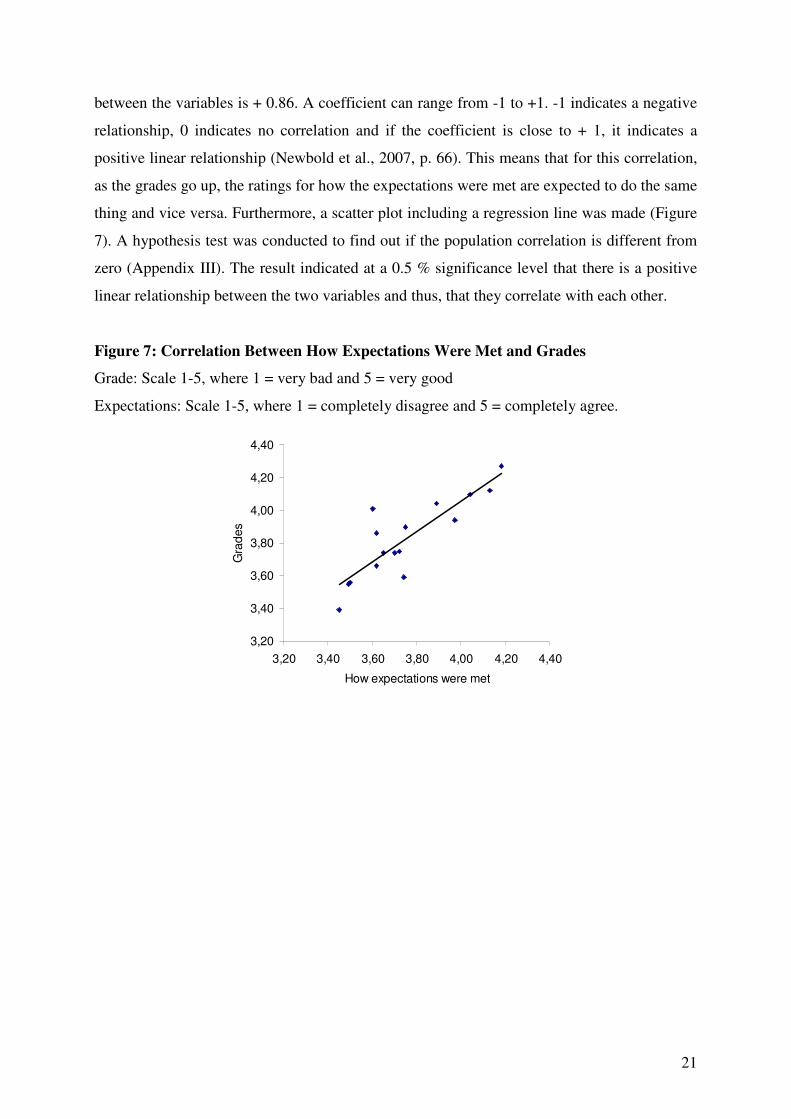
21
between the variables is + 0.86. A coefficient can range from -1 to +1. -1 indicates a negative
relationship, 0 indicates no correlation and if the coefficient is close to + 1, it indicates a
positive linear relationship (Newbold et al., 2007, p. 66). This means that for this correlation,
as the grades go up, the ratings for how the expectations were met are expected to do the same
thing and vice versa. Furthermore, a scatter plot including a regression line was made (Figure
7). A hypothesis test was conducted to find out if the population correlation is different from
zero (Appendix III). The result indicated at a 0.5 % significance level that there is a positive
linear relationship between the two variables and thus, that they correlate with each other.
Figure 7: Correlation Between How Expectations Were Met and Grades
Grade: Scale 1-5, where 1 = very bad and 5 = very good
Expectations: Scale 1-5, where 1 = completely disagree and 5 = completely agree.
3,20
3,40
3,60
3,80
4,00
4,20
4,40
3,20 3,40 3,60 3,80 4,00 4,20 4,40
How expectations were met
Gra
des
22
5. HOW CUSTOMER SATISFACTION IS AFFECTED
In this section, the results from the survey will be discussed. The three central factors
(expectations, different part of an offer, subjectivity) presented earlier in the paper will be
discussed one by one.
5.1 Expectations and How They Are Met
As mentioned previously in this paper, how well expectations are met is said to be a key
indicator for how satisfied customers are. In this study, the results show that a number of
expectations were met and that others were not met to the same degree. In this section,
expectations about all the 15 parts of an offer used in the survey and the overall performance
of IT© are discussed. The literature review stated that if the expectations are met, the
customer is satisfied. For this reason, how well the expectations were met will be compared to
which grade the parts received.
Overall, there is a high correlation between how well the expectations were met compared to
which grades the parts were given as the correlation analysis showed. The three parts that
received the highest and lowest ratings for how well the expectations were met were the same
as the parts which received the highest and lowest grades. When it came to how well the
expectations were met (Figure 3), the highest ratings were given to the way technicians treat
customers with 4.18, the way the entire staff treats customers with 4.13 and the way sellers
treat customers was awarded a rating of 4.03. This indicates that the respondents to a very
high degree either agreed or completely agreed that their expectations were met for these
categories. Concerning the grades (Figure 5), the way technicians treat customers got 4.27,
the way the entire staff treats customers received 4.12 and the way sellers treat customers
earned a grade of 4.10. As the theory predicted, the respondents gave high grades, which
signals that they are satisfied with these categories. The parts which received the lowest
ratings when the respondents judged how well their expectations were met were price with
3.45, complaint policy with 3.49 and handling of invoices with 3.50. The same categories
earned the lowest grades with 3.39, 3.55 and 3.56 respectively in the same order as above.
Notable is that although these categories received the lowest ratings, the means are still on the
positive side of the spectrum. The survey indicates that the respondents feel to a certain extent
23
that their expectations were met in these parts and that the grades they want to give are
somewhere in between average and good.
A few categories deviate a bit from the linear correlation described previously. For a majority
of the categories, the ratings for how the expectations were met and the grades they were
given were very similar in numerical terms. Note that although these ratings were similar,
they mean different things. Three categories do not quite fit into this pattern. The first is the
products’ quality which was given a rating of 3.74 in terms of how the expectations were met
and a grade of 3.59. These results suggest that the grade is lower than expected. A second
category is how the finance department treats customers. How the expectations were met was
rated 3.62 and the grade was 3.86. Here the reversed happened; the grade is higher than
expected. A last category which showed unexpected results was IT©’s overall
performance. How well IT© fulfilled the respondents’ total expectation was given a
rating of 3.60 and the general grade given to IT© was 4.01. Other categories with similar
ratings for the expectations part received considerable lower grades than the general grade.
When it comes to IT©’s total performance, 64.83 % of the respondents state that they
agree or completely agree to the statement that IT© has met their overall expectations.
The grades show that a slightly larger percentage, 72.91 %, thinks that IT© is doing a
good or very good job. It is noteworthy that about 8 % did not feel that their expectations
were met, yet they think that IT© is doing a good job. This is contradictory to what the
literature says. Furthermore, when IT©’s performance versus the total expectations was
evaluated, 12 other categories were regarded as having met the expectations better. However,
when the general grade was given, only four categories received higher grades.
5.2 Different Parts of an Offer
How well the expectations of the different parts of an offer were met was discussed in the
previous section and this part will build upon the different parts of an offer. In order to find
out how important the different parts of an offer are, the respondents were asked both to rank
and rate various parts. The three most important parts according to the ranking (Table 2) was
the products’ quality, user-friendliness and technical support. The rating (Figure2) showed the
same three at the top, although technical support jumped up to first place. Also, the three
bottom parts are similar. The ranking has handling of invoices, selection of products and
delivery times at the bottom. The rating shows a slightly different order with selection of
24
products as the lowest rating followed by handling of invoices and time from offer request to
offer.
For the sake of determining which of these parts are more and less influential on customer
satisfaction, the scores of importance were used as a base. All parts which received a score of
4 or higher on a scale from 1-5 can be seen as very influential parts. This score means that a
majority of the respondents gave the category the grade good or very good. A total of eight
parts received a score that high: technical support; the products’ quality and user-friendliness;
the way technicians, sellers and the entire staff treat customers; availability of the staff; and
price. Complaint policy and time from order to deliver were very close to receiving a score
that high. Instead, they fall under the group which received a score that was lower than 4. The
parts falling under this group, besides the two already mentioned, are: the way the finance
department treat customers, education about products, time from offer request to offer,
handling of invoices and selection of products.
The group with high importance can be assumed to have a big impact on the total customer
satisfaction. The question is if this is the case. When the grades that the respondents gave out
are examined, how the technicians, the entire staff and the sellers treat customers and
technical support receive a higher grade than the general grade at 4.01. One can therefore
state that these should have a positive impact on the general grade. Availability of the staff
received a grade almost up to par to the general grade at 3.94. The product’s quality, user-
friendliness and price received significantly lower grades. As these very important parts
received a low grade, the general grade should have been affected negatively according to the
theory. It might be that this had a slight negative impact, but the general grade is still quite
high. This makes it difficult to say if these parts had a negative effect or not.
As previously stated, one of the main reasons for dissatisfaction was pricing failures, where
the client felt that the price was too high in comparison with the product. Even though the
price received the lowest grade of all parts, the general grade is still fairly high. This result
thus contradicts the theory about pricing failures. One reason why the general grade is as high
as it is can be that personal relationships are more important than the respondents recognize.
Another possible reason can be that since many of the respondents were users, they might not
need to consider the price. To have an ill-functioning relationship; to commit a service-
encounter failure; is said to be a key reason to dissatisfaction. Here the reverse becomes
25
evident; that good relationships can increase customer satisfaction. How the staff behaved
towards the customers had a very big impact on customer satisfaction. Furthermore, another
denotation can be that in B2B situations, when relationships are very important, other parts,
such as quality, user-friendliness and price become less relevant in comparison. The third big
failure mentioned in the theory was core-service failure, which included incorrect contracts
and billing errors. As the grades given for handling of invoices and the way the finance
department received more average grades, there is a chance that this type of failure has been
committed to some degree. However, as the general grade is fairly high, it does not seem that
this failure had an extensive effect on the overall satisfaction.
5.3 Subjectivity
As stated earlier, subjectivity is a difficult part to measure when doing a study on customer
satisfaction. This is because of the fact that subjectivity is an emotional reaction and a state of
mind. In this study the respondents were divided in three groups: buyers; users; buyers and
users. Most of the participants categorized themselves as both buyers and users (48.50 %) or
users only (45.92 %). As so few respondents were only buyers, it was not possible to see if
the opinions differed between buyers and users. This is because a correlation analysis could
not be done with significance. It was also not possible to notice any differences between
clients who bought IT-solutions versus those who bought copying machines as very few
respondents purchased IT-solutions. No significant analysis could be made here either.
It was however possible to discuss the results from other aspect. User-friendliness and product
quality are said to be important for user since they are the ones using the products. This study
strengthens this assumption. The two most important factors were product quality and user-
friendliness. Technical support was a factor that also was seen as important. The grades
(Figure 5) given to IT© in the three most important categories were 3.59 for product
quality, 3.74 for user-friendliness and 4.04 for technical support. All these are fairly high
grades, but not quite spectacular. The overall satisfaction was graded 4.01, which is a high
grade considering the fact that the grades for the most important categories were not that high.
According to the literature, other factors that users look for is fast delivery time. This category
was ranked as number eight and received an average importance rating of 3.95. The fact that
delivery time only ranked as number eight is contradictive to the theory. However, this
category’s average importance rating indicates that it still is an important factor. Many of the
respondents also stated that they were buyers. These are said to value competitive prices.
26
Price was ranked as number four in importance and received an average importance rating of
4.13. This is in agreement with what the literature review states.
27
6. CONCLUSIONS
The main factors affecting customer satisfaction in B2B relationships are presented below.
Also, the factors which were shown in this study to have a big versus small impact on
customer satisfaction are listed.
6.1 Identified Factors Affecting Customer Satisfaction
From the literature review, three main areas were found to influence customer satisfaction.
These were how well the supplier company’s performance corresponded to the customers’
expectations, the different parts of an offer (eg. quality, price, user-friendliness etc.) and the
customers’ subjectivity. Based on this, a model was created where the different parts of an
offer and subjectivity affect the expectations customers have on the product and how they
experience it. These in turn create the customer satisfaction.
How expectations were met was proven to have a strong correlation with how satisfied the
customer is with the product, or the different parts of the product. If the expectations are met,
the customer is satisfied. Thus, this study gives additional support to one of the main
satisfaction theories there are; the dissatisfaction model. However, not all categories that were
measured followed this pattern. The largest divergence from the linear correlation was how
the total expectations were met and its corresponding variable, the general grade. The general
grade was considerably higher than the rating of how the total expectations were met
suggested. This indicates that although the total expectations were not quite met, the
customers still think that IT© is doing a good job. It is noteworthy that it was the general
grade which diverted from the linear pattern.
When the customers rated which parts of an offer were most important, eight had an average
rating which indicated that the parts were seen as important or very important. These were:
technical support; the products’ quality and user-friendliness; the way technicians, sellers and
the entire staff treat customers; availability of the staff; and price. Nevertheless, all of these
did not appear to have the same impact on the general grade that was given. When the
customers graded the different parts of an offer and IT©’s overall performance, the
variables which appeared to have a strong impact on customer satisfaction were how the
technicians, sellers and entire staff treated the customers and the technical support offered.
Thus, one conclusion is that in B2B settings, how the staff treats customers is a variable
28
which plays a vital role in creating customer satisfaction. It might even be the most important
factor. One factor which seemed to have a smaller impact on customer satisfaction was price.
IT&Copy received a high general grade even though the customers expressed that they were
not completely satisfied with IT&Copy’s prices. Reasons for this can be that many of the
respondents were users and thus did not need to care about the price or perhaps other
variables such as how the staff treats customers were seen as being more valuable.
The parts of an offer which the respondents stated as least important were selection of
products, handling of invoices and time from order to delivery. Other parts of less importance
were complaint policy, how the finance department treats customers, education about the
products and time from offer request to offer. Many of these received low grades, yet the
general grade given to IT©’s overall performance was quite high. Therefore, these items
listed can be said to have a smaller impact on customer satisfaction. However, based on the
study it appears that few of the respondents come in contact with invoices and IT©’s
finance department. Therefore, this list might have been different if they came in contact with
these areas.
As for the subjectivity part of the research model, the respondents’ subjective point of view
when assessing their own feelings must be taken into consideration when the results are
analyzed. Most of the respondents stated that they either were users or both users and buyers
and what they stated as being important parts of an offer reflected their roles in the
companies. Users typically value technical support, quality and user-friendliness and this
survey confirmed this as these parts were stated as being most important. However, although
they stated these as being important parts, when the respondents gave out grades, it appeared
that how they were treated by the staff mattered the most.
6.2 Proposals for Future Research
There are limitations with this study and many interesting points of views that were left out.
As this study only to a very limited degree investigated how the different roles people have
affect their satisfaction level, a first suggestion for future research is to investigate more in-
depth how people in the different roles are satisfied. Another related area to examine is how
the various roles influence the purchase and the company’s overall customer satisfaction. This
can be useful for marketers in order to know who in the companies to focus on. A second
suggestion related to the same area is how subjectivity and objectivity come into play for
29
creating satisfaction in a company. Subjectivity and objectivity are very tough to measure, but
this would be an interesting area to investigate further. A third suggestion is to do more
research on how satisfaction differs in B2B and B2C settings. An example can be that private
individuals and people working in a company consuming the same product are studied. The
product would be something that both private individuals and companies use. The study could
then explore what creates satisfaction for the two groups and see what differences there are. A
last suggestion for future research is to study how relationships affect customer satisfaction.
This study has suggested that how the staff treats customers was the most influential factor
affecting satisfaction, however why this is and how this works was not explained.
Furthermore, relationships do not only include how people behave around each other,
variables such as how much businesses adapt to each other and the intensity of the
relationships are also necessary to include.

30
7. REFERENCES
Andersson, U., Forsgren, M. & Holm, U. 2002. “The Strategic Impact of External Networks:
Subsidiary Performance and Competence Development in the Multinational Corporation”.
Strategic Management Journal, Vol. 23, no. 11, pp. 979-996.
Cannon, J. & Perreault, W. 1999. “Buyer-Seller Relationships in Business Markets”. Journal
of Marketing Research, Vol. 36, November, pp. 439-460.
Churchill, G. A. Jr & Surprenant, C. 1982. “An Investigation into the Determinants of
Customer Satisfaction”. Journal of Marketing Research, Vol. XIX, November, pp. 491-503.
Cronin, J. & Morris, M. 1989. “Satisfying Customer Expectations: The Effect on Conflict and
Repurchase in Industrial Marketing Channels”. Journal of the Academy of Marketing Science,
Vol. 17, no. 1, pp. 41-49.
Fornell, C. 2007. The Satisfied Customer – Winners and Losers in the Battle for Buyer
Preference. New York: Palgrave Macmillan.
Goodman, P., Fichman, M., Lerch, J. & Snyder, P. 1995. “Customer-Firm Relationships,
Involvement and Customer Satisfaction”. The Academy of Management Journal, Vol. 38, no.
5, pp. 1310-1324.
Grönroos, C. 2007. Service Management and Marketing: Customer Management in Service
Competition. Chichester, United Kingdom: John Wiley & Sons Ltd. 3rd
edition.
Gummesson, E. 1998. Relationsmarknadsföring: Från 4P till 30R. Malmö, Sweden: Liber
Ekonomi.
Hayes, B. 1998. Measuring Customer Satisfaction: survey design, use, and statistical analysis
methods. Milwaukee, USA: ASQ Quality Press, 2nd
edition.
31
Jobber, D. & Fahy, J. 2002. Foundations of Marketing. Maidenhead, United Kingdom:
McGraw-Hill Education.
Johnson, M. D. & Gustafsson, A. 2000. Improving Customer Satisfaction, Loyalty, and
Profit: An Integrated Measurement and Management System. San Francisco, California:
Jossey-Bass Inc.
Kotler, P. 2000. Marketing Management. Upper Saddle River: Prentice Hall
International Inc.
Merchant, K. & Van der Stede, W. 2007. Management Control Systems – Performance
Measurement, Evaluation and Incentives. Harlow, United Kingdom: Pearson Education
Limited.
Molinari, L., Abratt, R. & Dion, P. 2008. “Satisfaction, quality and value and effects on
repurchase and positive word of mouth behavioral intentions in a B2B services context”.
Journal of Services Marketing, Vol. 22, no. 5, pp. 363-373.
Newbold, P., Carlson, W. & Thorne, B. 2007. Statistics for Business and Economics. Upper
Saddle River: Pearson Prentice Hall. 6th
edition.
O’Donnell, SW, 2000. “Managing Foreign Subsidiaries: Agents of Headquarters or an
Interdependent Network?”. Strategic Management Journal, Vol. 21, no. 5, pp. 525-548.
Richman, T. 1996. “Service Industries: Why Customers Leave”. Harvard Business Review,
January-February, Vol. 74, no. 1 pp. 9-10.
Rossomme, J. 2003. “Customer Satisfaction Measurement in a Business-to-Business Context:
a conceptual framework”. Journal of Business & Industrial Marketing, Vol. 18, no. 2, pp.
179-195.
Saunders, M., Lewis, P., &Thornhill, A. 2003. Research Methods for Business Students.
Harlow, United Kingdom: Prentice Hall. 3rd
edition.

32
Sheth, J. 1973. “A Model of Industrial Buyer Behavior”. Journal of Marketing, Vol. 37,
October, pp. 50-56.
Söderlund, M. 1997. Den nöjda kunden. Kundtillfredsställelse – orsaker och effekter.
Malmö, Sweden: Liber Ekonomi.
Söderlund, M. (red). 2000. I huvudet på kunden, EFI:s Årsbok 2000. Malmö, Sweden: Liber
Ekonomi.
33
APPENDIX I: QUESTIONNAIRE
(Own translation from Swedish)
Customer Satisfaction Survey – IT© Uppsala
Dear Customer,
As our customer, you mean a lot to us at IT© and we are therefore working on
developing our business to be able to meet your needs in the best possible way. In order to be
successful in this matter we need your help and we therefore ask you to fill in a customer
satisfaction survey. The survey is being done in cooperation with two students from Uppsala
University, whose focus of study is customer satisfaction. The survey will be used as a base
for the improvement process that will take place at IT©, as well as a foundation for a
thesis that is being written at Uppsala University about customer satisfaction.
Your answers will be treated with strict confidentiality and will be kept anonymous.
Estimated response time is 15 minutes. Please note, in order to receive correct answers, we
ask you to finish the survey you have started filling in. This means that it is not possible to
start filling in the survey and then finishing it at another time.
We appreciate if you fill in the survey no later than Wednesday April 29th.
Thank you!
34
1. Which products does the company you represent purchase?
(Please choose one alternative)
IT solutions
Copying machines
IT solutions & copying machines
2. In your relationship with IT©, how would you like to describe your role?
(Please choose one alternative)
Purchaser of product/service
User of product/service
Purchaser & user of product/service
3. Which factors do you regard as being most important when choosing a provider of
copying machines and IT solutions?
Please rank the following categories from 1 to 10 (1 = most important, 10 = least important)
The products’ quality
The products’ user-friendliness
Selection of products
Price
Availability of the staff
Technical support
Education provided about the products
The way the provider’s staff treats customers
Delivery times
Handling of invoices
35
4. Of which importance do you regard the following factors when choosing a provider of
copying machines and IT-solutions?
1: Not at all important
2: Not important
3: Neither important nor not important
4: Important
5: Very important
DNK: Do not know
1 2 3 4 5 DNK
The products’ quality
The products’ user-friendliness
Selection of products
Price
Availability of the staff
Technical support
Education provided about products
The way the entire staff treats customers
The way sellers treat customers
The way technicians treat customers
The way the finance department treats customers
Time from order to delivery
Time from offer request to offer
Handling of invoices
Complaint policy
36
5. How well does IT©’s performance correspond to your expectations?
A number of statements are presented below. Please check the box which matches your views
most closely.
1: Completely disagree
2: Disagree
3: Neutral
4: Agree
5: Completely agree
DNK: Do not know
1 2 3 4 5 DNK
The quality of IT©’s products correspond
to my expectations
The user-friendliness of IT©’s products
correspond to my expectations
IT©’s selection of products/services
correspond to my expectations
IT©’s price level correspond to my
expectations
The availability of IT©’s staff correspond
to my expectations
The technical support IT© offers correspond
to my expectations
The education IT© offers for their products

37
correspond to my expectations
The way IT©’s entire staff has treated me
corresponds to my expectations
The way IT©’s sellers have treated me corresponds
to my expectations
The way IT©’s technicians have treated me
corresponds to my expectations
The way IT©’s finance department has treated me
corresponds to my expectations
The delivery time from when I order a product until I
receive it corresponds to my expectations
The time from when I request an offer until I receive
it corresponds to my expectations
IT©’s way of handling invoices corresponds to my
expectations
IT©’s complaint policy corresponds to my
expectations
Overall, IT© has fulfilled my expectations
38
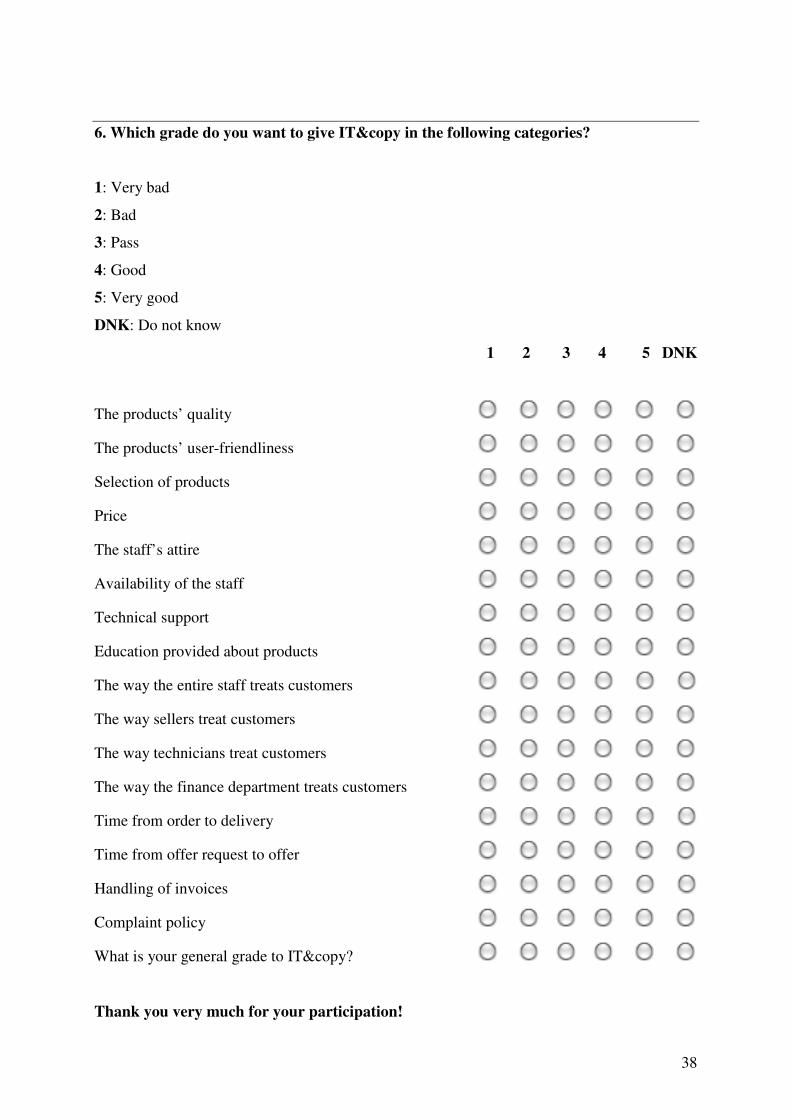
6. Which grade do you want to give IT© in the following categories?
1: Very bad
2: Bad
3: Pass
4: Good
5: Very good
DNK: Do not know
1 2 3 4 5 DNK
The products’ quality
The products’ user-friendliness
Selection of products
Price
The staff’s attire
Availability of the staff
Technical support
Education provided about products
The way the entire staff treats customers
The way sellers treat customers
The way technicians treat customers
The way the finance department treats customers
Time from order to delivery
Time from offer request to offer
Handling of invoices
Complaint policy
What is your general grade to IT©?
Thank you very much for your participation!
39
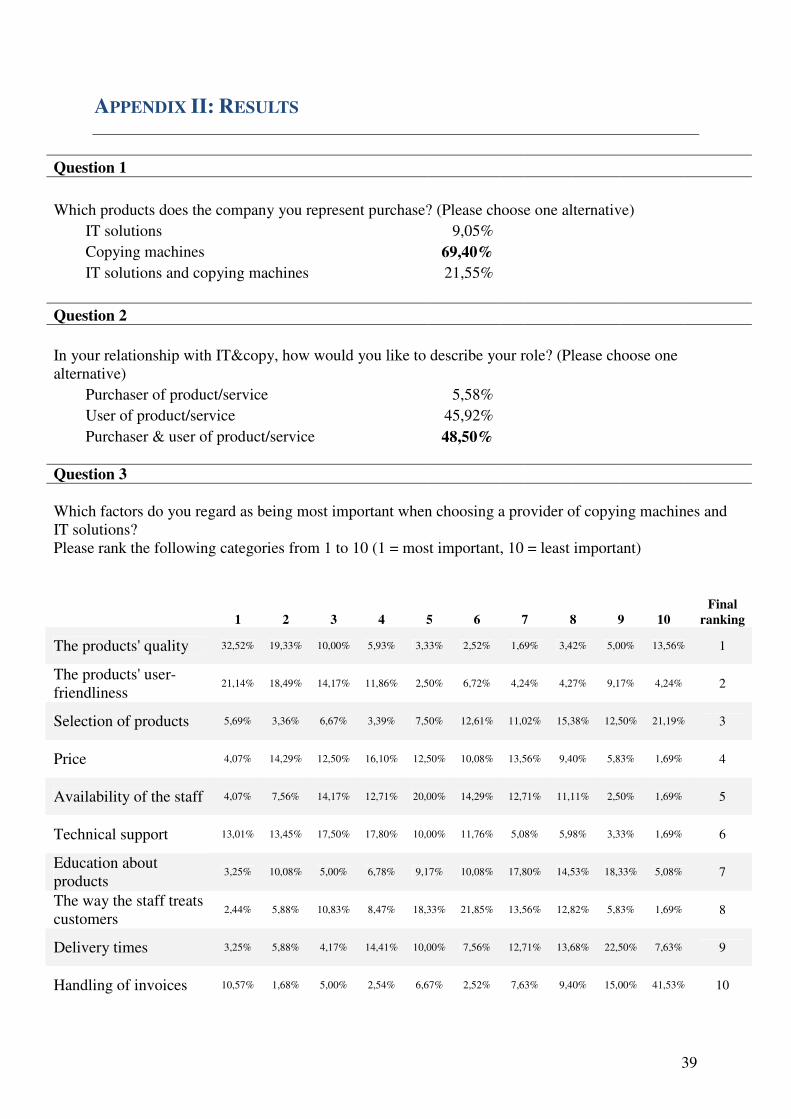
APPENDIX II: RESULTS
Question 1
Which products does the company you represent purchase? (Please choose one alternative)
IT solutions 9,05%
Copying machines 69,40%
IT solutions and copying machines 21,55%
Question 2
In your relationship with IT©, how would you like to describe your role? (Please choose one
alternative)
Purchaser of product/service 5,58%
User of product/service 45,92%
Purchaser & user of product/service 48,50%
Question 3
Which factors do you regard as being most important when choosing a provider of copying machines and
IT solutions?
Please rank the following categories from 1 to 10 (1 = most important, 10 = least important)
1 2 3 4 5 6 7 8 9 10
Final
ranking
The products' quality 32,52% 19,33% 10,00% 5,93% 3,33% 2,52% 1,69% 3,42% 5,00% 13,56% 1
The products' user-
friendliness 21,14% 18,49% 14,17% 11,86% 2,50% 6,72% 4,24% 4,27% 9,17% 4,24% 2
Selection of products 5,69% 3,36% 6,67% 3,39% 7,50% 12,61% 11,02% 15,38% 12,50% 21,19% 3
Price 4,07% 14,29% 12,50% 16,10% 12,50% 10,08% 13,56% 9,40% 5,83% 1,69% 4
Availability of the staff 4,07% 7,56% 14,17% 12,71% 20,00% 14,29% 12,71% 11,11% 2,50% 1,69% 5
Technical support 13,01% 13,45% 17,50% 17,80% 10,00% 11,76% 5,08% 5,98% 3,33% 1,69% 6
Education about
products 3,25% 10,08% 5,00% 6,78% 9,17% 10,08% 17,80% 14,53% 18,33% 5,08% 7
The way the staff treats
customers 2,44% 5,88% 10,83% 8,47% 18,33% 21,85% 13,56% 12,82% 5,83% 1,69% 8
Delivery times 3,25% 5,88% 4,17% 14,41% 10,00% 7,56% 12,71% 13,68% 22,50% 7,63% 9
Handling of invoices 10,57% 1,68% 5,00% 2,54% 6,67% 2,52% 7,63% 9,40% 15,00% 41,53% 10
40
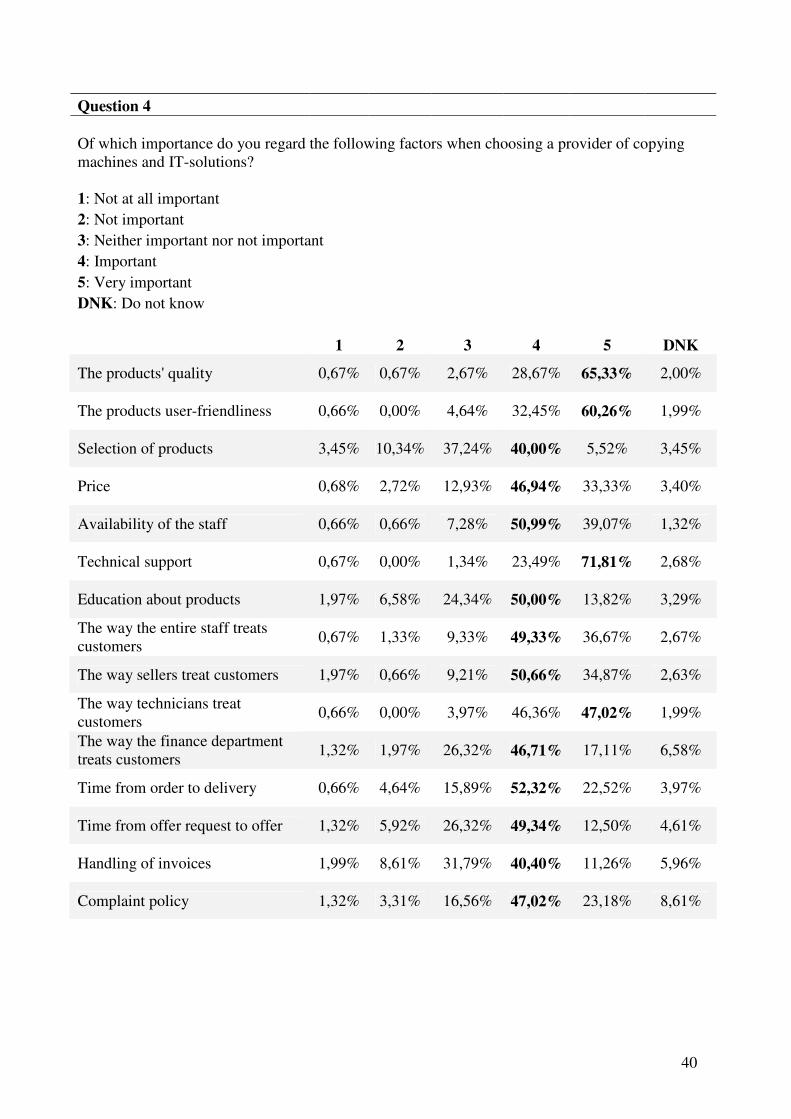
Question 4
Of which importance do you regard the following factors when choosing a provider of copying
machines and IT-solutions?
1: Not at all important
2: Not important
3: Neither important nor not important
4: Important
5: Very important
DNK: Do not know
1 2 3 4 5 DNK
The products' quality 0,67% 0,67% 2,67% 28,67% 65,33% 2,00%
The products user-friendliness 0,66% 0,00% 4,64% 32,45% 60,26% 1,99%
Selection of products 3,45% 10,34% 37,24% 40,00% 5,52% 3,45%
Price 0,68% 2,72% 12,93% 46,94% 33,33% 3,40%
Availability of the staff 0,66% 0,66% 7,28% 50,99% 39,07% 1,32%
Technical support 0,67% 0,00% 1,34% 23,49% 71,81% 2,68%
Education about products 1,97% 6,58% 24,34% 50,00% 13,82% 3,29%
The way the entire staff treats
customers 0,67% 1,33% 9,33% 49,33% 36,67% 2,67%
The way sellers treat customers 1,97% 0,66% 9,21% 50,66% 34,87% 2,63%
The way technicians treat
customers 0,66% 0,00% 3,97% 46,36% 47,02% 1,99%
The way the finance department
treats customers 1,32% 1,97% 26,32% 46,71% 17,11% 6,58%
Time from order to delivery 0,66% 4,64% 15,89% 52,32% 22,52% 3,97%
Time from offer request to offer 1,32% 5,92% 26,32% 49,34% 12,50% 4,61%
Handling of invoices 1,99% 8,61% 31,79% 40,40% 11,26% 5,96%
Complaint policy 1,32% 3,31% 16,56% 47,02% 23,18% 8,61%
41
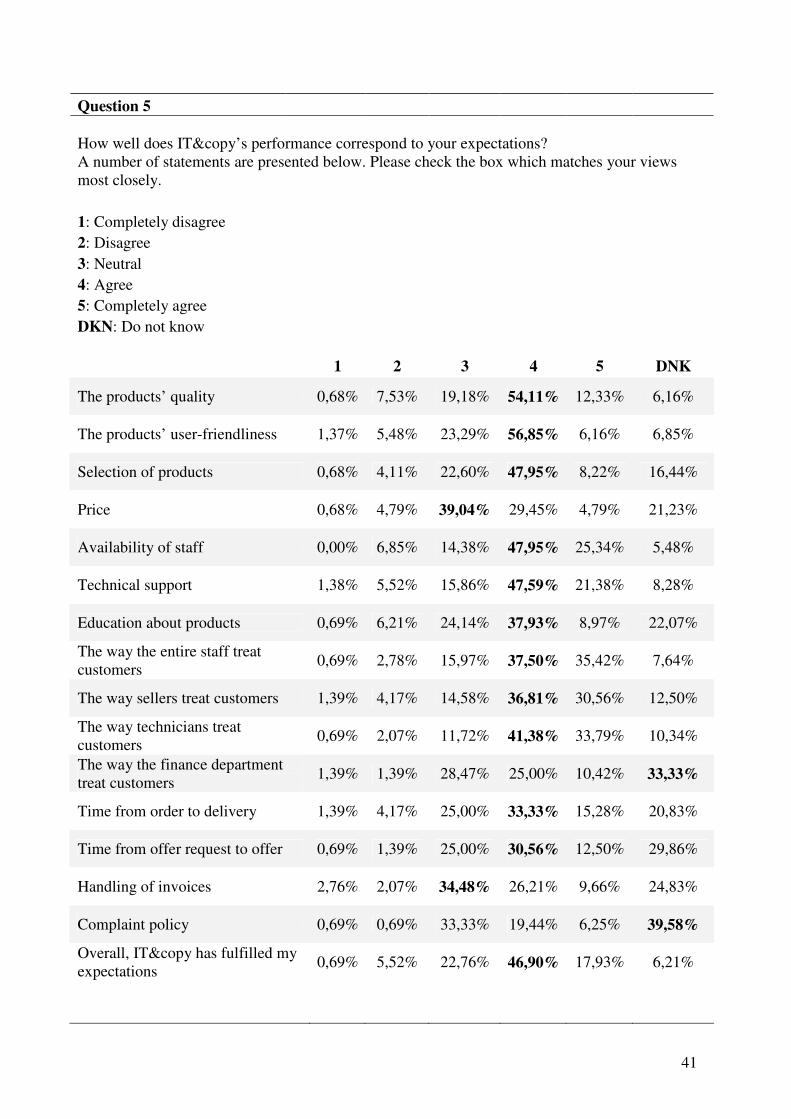
Question 5
How well does IT©’s performance correspond to your expectations?
A number of statements are presented below. Please check the box which matches your views
most closely.
1: Completely disagree
2: Disagree
3: Neutral
4: Agree
5: Completely agree
DKN: Do not know
1 2 3 4 5 DNK
The products’ quality 0,68% 7,53% 19,18% 54,11% 12,33% 6,16%
The products’ user-friendliness 1,37% 5,48% 23,29% 56,85% 6,16% 6,85%
Selection of products 0,68% 4,11% 22,60% 47,95% 8,22% 16,44%
Price 0,68% 4,79% 39,04% 29,45% 4,79% 21,23%
Availability of staff 0,00% 6,85% 14,38% 47,95% 25,34% 5,48%
Technical support 1,38% 5,52% 15,86% 47,59% 21,38% 8,28%
Education about products 0,69% 6,21% 24,14% 37,93% 8,97% 22,07%
The way the entire staff treat
customers 0,69% 2,78% 15,97% 37,50% 35,42% 7,64%
The way sellers treat customers 1,39% 4,17% 14,58% 36,81% 30,56% 12,50%
The way technicians treat
customers 0,69% 2,07% 11,72% 41,38% 33,79% 10,34%
The way the finance department
treat customers 1,39% 1,39% 28,47% 25,00% 10,42% 33,33%
Time from order to delivery 1,39% 4,17% 25,00% 33,33% 15,28% 20,83%
Time from offer request to offer 0,69% 1,39% 25,00% 30,56% 12,50% 29,86%
Handling of invoices 2,76% 2,07% 34,48% 26,21% 9,66% 24,83%
Complaint policy 0,69% 0,69% 33,33% 19,44% 6,25% 39,58%
Overall, IT© has fulfilled my
expectations 0,69% 5,52% 22,76% 46,90% 17,93% 6,21%
42
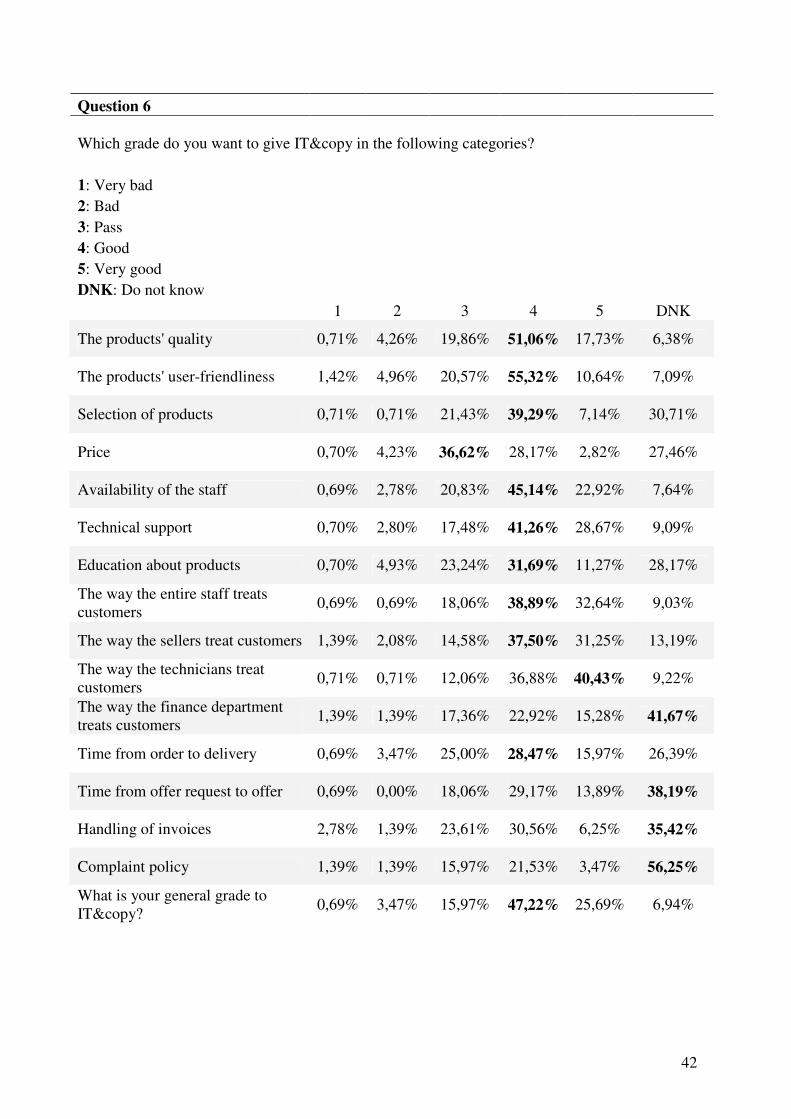
Question 6
Which grade do you want to give IT© in the following categories?
1: Very bad
2: Bad
3: Pass
4: Good
5: Very good
DNK: Do not know
1 2 3 4 5 DNK
The products' quality 0,71% 4,26% 19,86% 51,06% 17,73% 6,38%
The products' user-friendliness 1,42% 4,96% 20,57% 55,32% 10,64% 7,09%
Selection of products 0,71% 0,71% 21,43% 39,29% 7,14% 30,71%
Price 0,70% 4,23% 36,62% 28,17% 2,82% 27,46%
Availability of the staff 0,69% 2,78% 20,83% 45,14% 22,92% 7,64%
Technical support 0,70% 2,80% 17,48% 41,26% 28,67% 9,09%
Education about products 0,70% 4,93% 23,24% 31,69% 11,27% 28,17%
The way the entire staff treats
customers 0,69% 0,69% 18,06% 38,89% 32,64% 9,03%
The way the sellers treat customers 1,39% 2,08% 14,58% 37,50% 31,25% 13,19%
The way the technicians treat
customers 0,71% 0,71% 12,06% 36,88% 40,43% 9,22%
The way the finance department
treats customers 1,39% 1,39% 17,36% 22,92% 15,28% 41,67%
Time from order to delivery 0,69% 3,47% 25,00% 28,47% 15,97% 26,39%
Time from offer request to offer 0,69% 0,00% 18,06% 29,17% 13,89% 38,19%
Handling of invoices 2,78% 1,39% 23,61% 30,56% 6,25% 35,42%
Complaint policy 1,39% 1,39% 15,97% 21,53% 3,47% 56,25%
What is your general grade to
IT©? 0,69% 3,47% 15,97% 47,22% 25,69% 6,94%
43
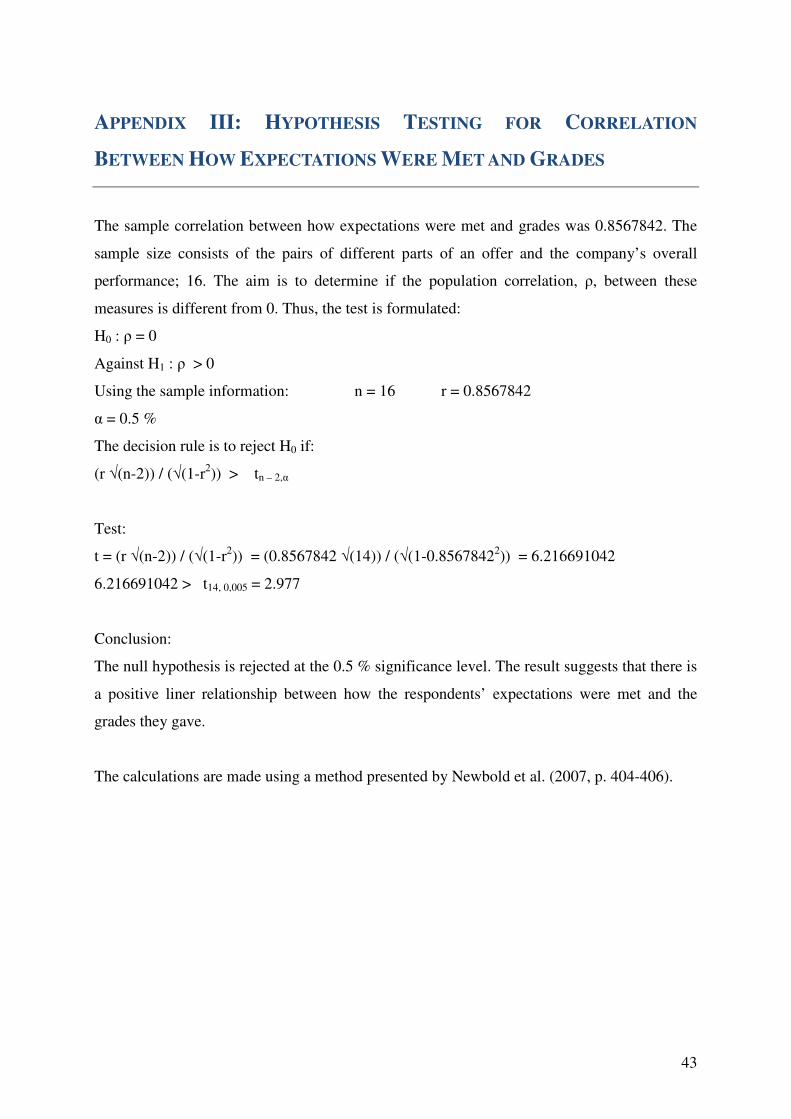
APPENDIX III: HYPOTHESIS TESTING FOR CORRELATION
BETWEEN HOW EXPECTATIONS WERE MET AND GRADES
The sample correlation between how expectations were met and grades was 0.8567842. The
sample size consists of the pairs of different parts of an offer and the company’s overall
performance; 16. The aim is to determine if the population correlation, ρ, between these
measures is different from 0. Thus, the test is formulated:
H0 : ρ = 0
Against H1 : ρ > 0
Using the sample information: n = 16 r = 0.8567842
α = 0.5 %
The decision rule is to reject H0 if:
(r √(n-2)) / (√(1-r2)) > tn – 2,α
Test:
t = (r √(n-2)) / (√(1-r2)) = (0.8567842 √(14)) / (√(1-0.8567842
2)) = 6.216691042
6.216691042 > t14, 0,005 = 2.977
Conclusion:
The null hypothesis is rejected at the 0.5 % significance level. The result suggests that there is
a positive liner relationship between how the respondents’ expectations were met and the
grades they gave.
The calculations are made using a method presented by Newbold et al. (2007, p. 404-406).