How Is Suicide Different in Japan
34
CIRJE Discussion Papers can be downloaded without charge from: http://www.e.u-tokyo.ac.jp/cirje/research/03research02dp.html Discussion Papers are a series of manuscripts in their draft form. They are not intended for circulation or distribution except as indicated by the author. For that reason Discussion Papers may not be reproduced or distributed without the written consent of the author. CIRJE-F-526 How Is Suicide Different in Japan? Joe Chen University of Tokyo Yun Jeong Choi University of Tokyo Yasuyuki Sawada University of Tokyo November 2007
Transcript of How Is Suicide Different in Japan
CIRJE Discussion Papers can be downloaded without charge from:
http://www.e.u-tokyo.ac.jp/cirje/research/03research02dp.html
Discussion Papers are a series of manuscripts in their draft form. They are not intended for
circulation or distribution except as indicated by the author. For that reason Discussion Papers may
not be reproduced or distributed without the written consent of the author.
CIRJE-F-526
How Is Suicide Different in Japan?Joe Chen
University of Tokyo
Yun Jeong ChoiUniversity of Tokyo
Yasuyuki SawadaUniversity of Tokyo
November 2007
How Is Suicide Different in Japan?*
Joe Chen Faculty of Economics University of Tokyo
Yun Jeong Choi Faculty of Economics University of Tokyo
Yasuyuki Sawada Faculty of Economics University of Tokyo
November 2007
Abstract In this study, we analyze suicide rates among OECD countries with a particular effort made to gain insight into how suicide in Japan is different from suicides in other OECD countries. Several findings emerged from fixed effect panel regressions with country specific time-trend. First, the impacts of socioeconomic variables vary across different age-gender groups. Second, in general, better economic conditions such as high level of income and higher economic growth reduce suicide rate while income inequality increases suicide rate. Third, suicide rate is more sensitive to the economic factors captured by real GDP per capita, growth rate of real GDP per capita, and Gini indexthan to the social factors represented by divorce rate, birth rate, female labor participation rate, and alcohol consumption. Fourth, female and elderly generation suicides are more difficult to be accounted for. Finally, in accordance to the general belief, the suicide problem in Japan is very different from those of the other OECD countries. The impact of socioeconomic variables is greater in Japan than in other OECD countries. Moreover, the empirical result of significant Gini index in Japan is consistent with individuals’ aversion to inequality and relative deprivation discussed in the recent literature.
*Address: 7-3-1 Hongo, Bunkyo-ku, Tokyo, 113-0033, Japan. This research is supported financially by the Research Center for the Relationship between Market Economy and Non-market Institutions (CEMANO), the 21st Century Center of Excellence (COE) Program of the Graduate School of Economics at the University of Tokyo. We would like to thank Yoichi Goto and Kohta Mori for their excellent research assistance.
1
1. Introduction
62 years old Toshikatsu Matsuoka, the sitting Minister of Agriculture, Forestry
and Fisheries of Japan and a successively 6 times elected member of the House of
Representatives, hanged himself on 28 May 2007, hours before he was to face
questioning in the Diet over a series of scandals in his political career. Mr. Matsuoka’s
death underscored the grim fact that in Japan; since 1998, more than 30,000 people killed
themselves each year.1 This rash of suicides starts from mid-1990s, amid a prolonged
period of economic recession. In particular, from 1997 to 1998, the number of suicides
jumped by 34.73 percent.2 Despite the recent economic recovery, suicide rate remains all
time high. In response, Japanese insurance companies extended the suicide exemption
period from the century-old industrial norm of one year to two or three years starting
from 2000. As the latest step of the government’s effort to reduce suicide rate, the ‘Basic
Law of Suicide Prevention’ was enacted in June 2006, and the Cabinet Office outlined a
comprehensive suicide-prevention guidelines in June 2007, setting up a reduction target
of at least 20 percent by 2016.
Based on the data published by the Japanese Ministry of Health, Labour and
Welfare, the total number of death by suicides in Japan hits record high in year 2003, and
the numbers remain dismal in the following years.3 Looking across the cause-of-death
categorization, in year 2006, suicide is ranked the sixth, higher than the number of people
died of aging, short of the number of people died of accidents. Looking at death statistics
1 In 2006, Japan has a total population of 127.77 million. The suicide numbers used here are published by the National Police Agency; they are slightly higher than those published by the Ministry of Health, Labour and Welfare.
2 According to the National Police Agency, the total number of suicides is 24,391 in 1997, and 32,863 in 1998.
3 The number of suicides published by the Ministry of Health, Labour and Welfare is 32,109 in year 2003, 30,247 in 2004, 30,553 in 2005, and 29,921 in 2006. For comparison, numbers of
2
by age groups, in year 2003, suicide is the number one cause of death for the five (four)
groups of males (females) aged from 20 to 44 (15 to 34), and number two for the two
(three) groups of males (females) aged from 15 to 19 and from 45 to 49 (35 to 49).4
Nonetheless, the sense of crisis has only been brought out strongly in recent years by
incidences of group suicides arranged among strangers over the internet, and by stories
of elementary and junior high school students killing themselves because of bullying on
campuses.
It has been argued that Japan has a tradition of suicide. Some sociologists argued
that the unique “value orientations” of the Japanese culture such as monism, groupism,
accommodationism, and authoritarian familism contribute to the unusually high suicide
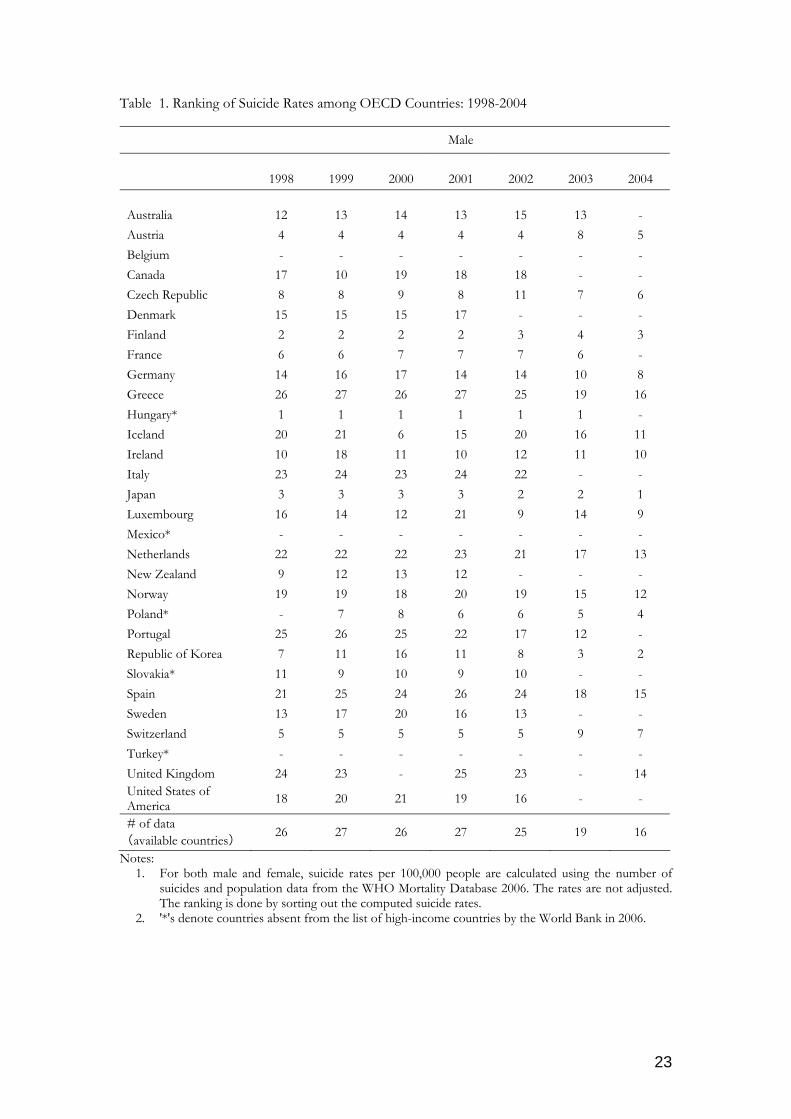
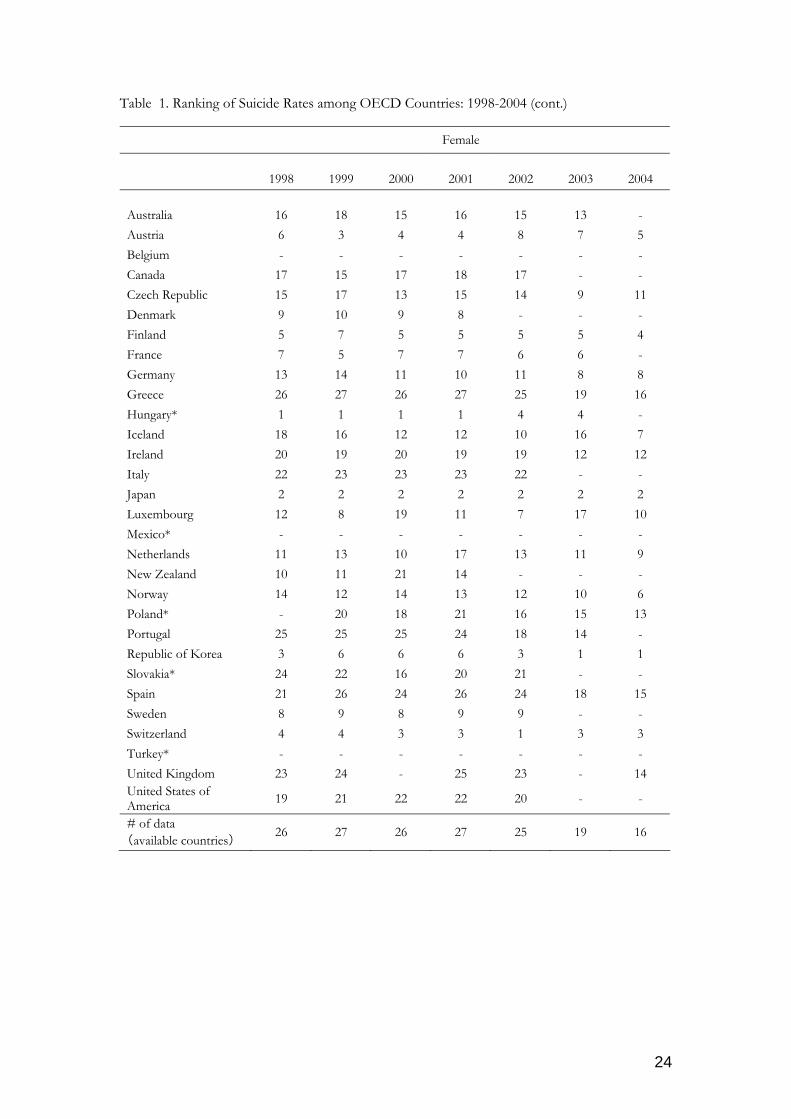
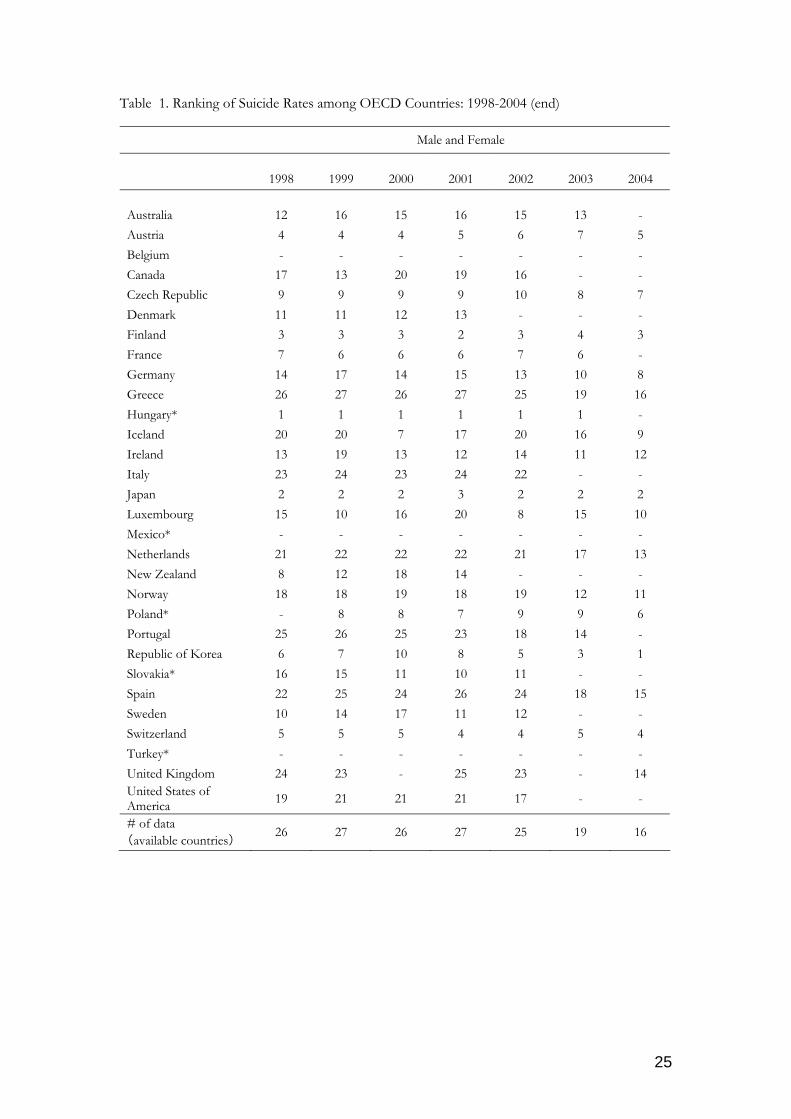
rates among industrialized countries.5 Table 1 presents the ranking of suicide rates per
100,000 people among OECD member countries from 1998 to 2004.6 Among the 25
high-income OECD countries, the male (female) suicide rate of Japan ranked the second
highest (the highest) from 1998 to 2001, and the highest (the second highest) from 2002
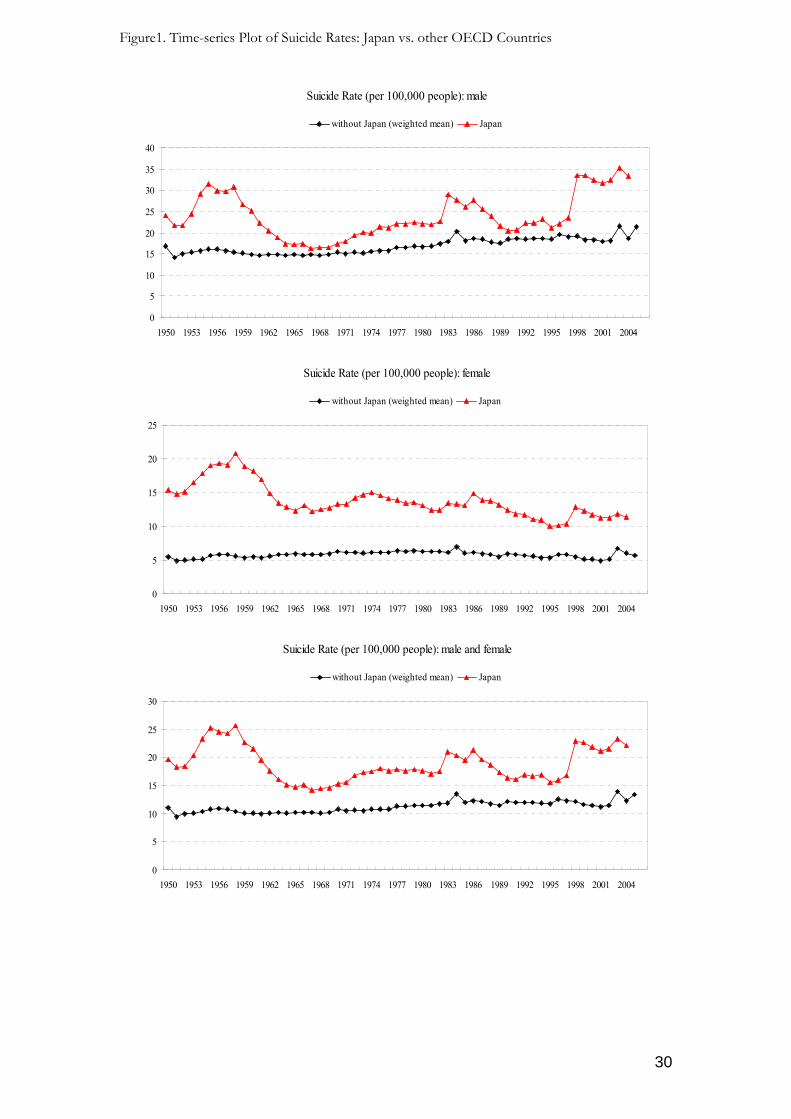
to 2004.7 Figure 1 presents the time series plots of suicide rates of Japan versus the
weighted average suicide rates of other OECD countries from 1950 to 2004. The graphs
show that suicide rates in Japan are stubbornly higher than the average of other OECD
death by homicides in 2003, 2004, 2005, and 2006, are 705, 655, 600, and 580 respectively.
4 According to 2003 Vital Statistics’ special report on suicides issued by the Japanese Ministry of Health, Labour and Welfare, 32.8% (25.2%) total death of males (females) aged 20 to 49 are due to suicides.
5 See, for example, Pinguet (1993) and Iga (1986).
6 The numbers are calculated based on the WHO mortality database 2006. Only two countries’ data are available in 2005; we exclude year 2005.
7 For male suicide rates, among the 25 high-income OECD countries, Finland ranked the highest from 1998 to 2001. For female suicide rates, Switzerland is the highest in 2002; Republic of Korea ranked the highest in 2003 and 2004. For both male and female, from 1998 to 2004, Greece had the lowest suicide rates.
3
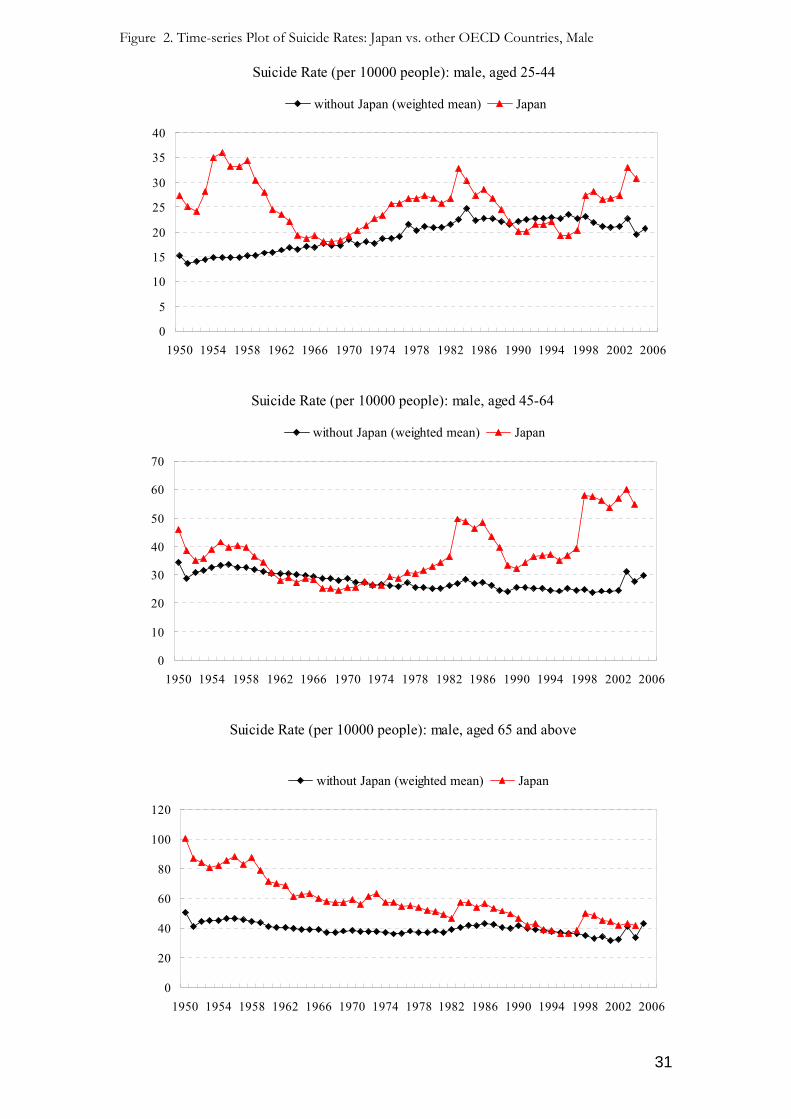
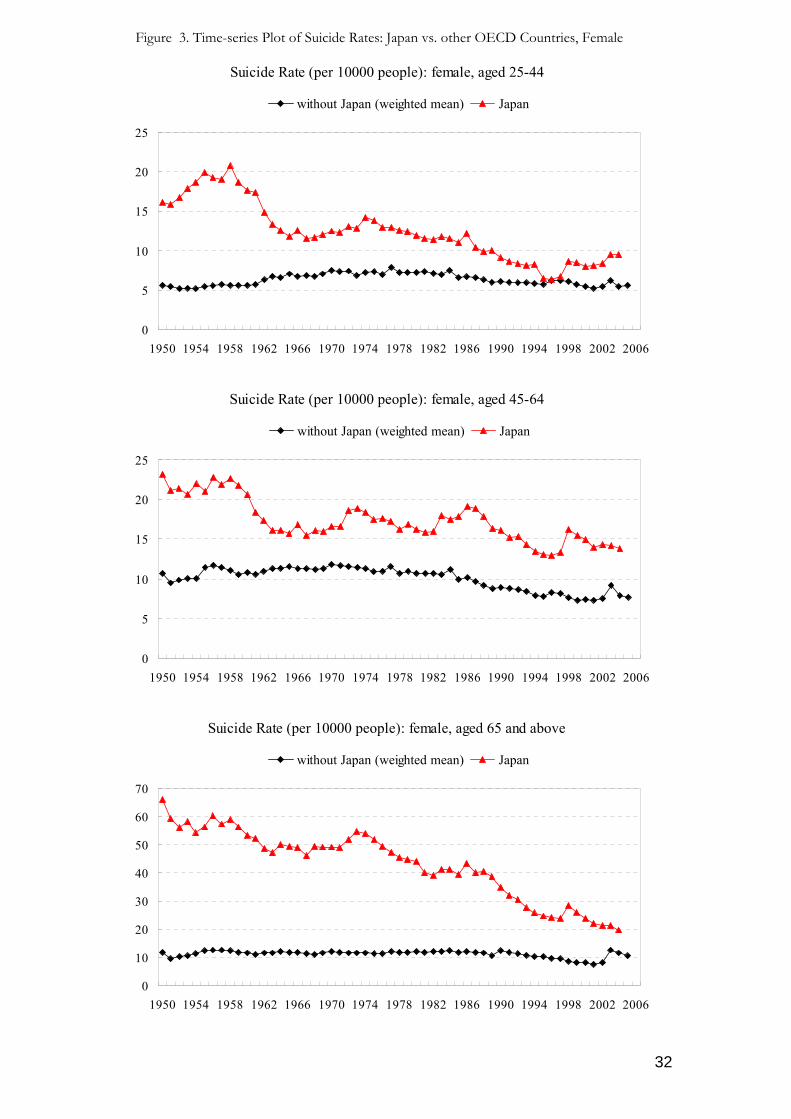
countries with a sharp increase after 1998.8 The breakdown of suicide rates by age
groups in Figures 2 and 3 suggests the recent rash of suicide rates in Japan is mainly due
to the jump in suicide rates of males under age 65; for both elderly male and female aged
65 and above, the suicide rates have a converging trend towards the weighted average of
other OECD countries.
Despite the oddity, we have not yet seen studies that explain how and to what
extent suicide in Japan is different from suicides in other countries. In this study, we
analyze suicide rates among OECD countries with a particular effort made to gain insight
into how suicide in Japan is different from suicides in other OECD countries. While the
idea of utilizing cross-country variations in socioeconomic variables to explain suicide
rates is not a novelty, this study is the first one that uses recent data from all OECD
member countries and that provides insight into how suicide in Japan is different from
suicides in other OECD countries. To take into account a peculiar situation of Japan and
to answer the difference of suicide between Japan and the rest OECD countries, we
employ a cross-country regression framework which allows Japan to have a different set
of regression coefficients for the explanatory variables.
Several findings emerged from our analysis. First, the impacts of socioeconomic
variables vary across different age-gender groups. Second, in general, better economic
conditions such as high level of income and higher economic growth reduce suicide rate
while income inequality increases suicide rate. Third, suicide rate is more sensitive to the
economic factors captured by real GDP per capita, growth rate of real GDP per capita,
and Gini index than to the social factors represented by divorce rate, birth rate, female
8 Although the female suicide of Japan is consistently higher than the weighted average of other OECD countries, the male suicide rate of Japan is not always as high. For a few years in mid 60’s and at the beginning of 70’s, the male suicide rate of Japan is close to the OECD weighted average. This “closing gap” of male suicide rate also happens temporarily at the end of 80’s and in mid 90’s.
4
labor participation rate, and alcohol consumption.9 Fourth, female and elderly generation
suicides are more difficult to be accounted for. Finally, in accordance to the general belief,
the suicide problem in Japan is very different from those of the other OECD countries.
The impact of socioeconomic variables is greater in Japan than in other OECD countries.
Moreover, the empirical result of significant Gini index especially in Japan suggests
individuals’ aversion to inequality and relative deprivation discussed in the recent
literature (Frey and Stutzer, 2002; Easterlin, 2001; Luttmer, 2005; Fafchamps and Shilpi,
2007).
In Japan, suicides have traditionally been attributed to mental health illnesses. To
combat the rising suicide rate, the government has aimed at improving mental health
status and medical services, e.g., through guidelines and provisions for the management
of depression issued by the Ministry of Health, Welfare and Labor. Our empirical results,
the significant correlation of suicide rates with a wide variety of socioeconomic variables,
suggest that such an attention may not be sufficient to prevent suicide effectively. In fact,
the recently enacted ‘Basic Law of Suicide Prevention’ calls for comprehensive suicide
prevention measures; the empirical results of this paper support such a policy direction in
Japan.
The rest of this paper is organized as follows. Section 2 briefly describes the
related studies and empirical models employed in the literature. An estimation model and
data used in this study are described in Section 3; In Section 4, empirical results and
analysis are presented. Section 5 shows concluding remarks.
9 The term “economic factors” or “economic variables” used throughout this paper refers to real
5
2. Literature Review
While sociologist Durkheim’s Le Suicide (1897) had spawned numerous
sociological theories and empirical studies to explain suicides, it had not attracted
economists’ attention until Hamermesh and Soss (1974), who christened an economic
theory of suicides. Despite many psychologists and doctors consider suicide as an
irrational behavior, Hamermesh and Soss, and most (if not all) economic models that
followed, consider suicide as a rational behavior to maximize individual’s discounted
expected lifetime utility. Nevertheless, Yang (1989, 1992), as one of the first attempts to
integrate economic and sociological approaches, shows that social factors such as age,
religion, and divorce rates also affect suicide rates (Chuang and Huang, 2003). These
early empirical studies demonstrate that suicide cannot be explained away as irrational
behavior and establish the link between socioeconomic factors and suicide rates. As
more detail data became available, recent work extends to show that there is much
variation among suicide patterns of different gender and age groups in the response to
these factors.
2.1. Factors affecting suicide
Hamermesh and Soss’ economic theory on suicide predicts that the level of
income has a negative effect on suicide rate while unemployment rate has a positive
effect on suicide rate. Using their framework, let V(a,YP,Z) represent the discounted
expected lifetime utility of an individual with utility function U(a,YP,Z) at age a and
permanent income YP and other attributes Z. An individual commits suicide when the
GDP per capita, growth rate of real GDP per capita, and Gini index; the term “social factors’’ refers to divorce rate, birth rate, female labor participation rate, and alcohol consumption.
6
discounted expected lifetime utility falls below some threshold level. Then Hamermesh
and Soss formulated a decision rule under which an individual commits suicide if and
when V(a,YP,Z) + b ≤ 0 where b is a random variable representing an individual’s taste
for living, or conversely, her/his distaste for suicide. Then the fraction of individuals in
the cohort born at time (t-a) who commit suicide at age a is:
S(a) = F [-V(a,YP,Z)], (1)
where F (•) is the cumulative density function of b. Unemployment can be introduced as
a predictor of future disposable income, and therefore, it signals changes in permanent
income. The model then predicts that suicide decreases with income and increases with
unemployment and age because high income level and low unemployment rate increase
expected life-time utility and decrease the benefit of committing suicide. Many empirical
studies support this view (Brainerd, 2001; Neumayer, 2003; Chuang and Huang, 1997,
2003; Andres, 2005). However, Durkheim (1897) hypothesizes that higher income levels
increase independence (opposite to social integration) and leads to higher suicide rate.
Along this line, Lester (1996) and Unnithan et al. (1994) state that economic development
increases rates of suicide; Jungeilges and Kirchgassner (2002) point out that economic
growth may reduce happiness and general welfare and therefore leads to higher suicide
rates. Despite the dispute on the effect of the level of income on suicides, researchers
agree on that income inequality leads to higher suicide rates. Relatively deprived
individuals may feel more stress, leading to bad health conditions, and ending up with
suicide directly or indirectly through alcohol abuse or smoking (Wilkinson, 1997; Stack,
2000s, 2000b; Andres, 2005). Nonetheless, most empirical studies fail to find statistically
significant relationship between income inequality and suicide rate (Neumayer, 2004;
Andres, 2005). In order to verify the nexus between inequality and suicide, we
7
incorporate a measure of income inequality as one of the other attributes Z of equation
(1). An inclusion of inequality in utility function implies that people derive utility not
only from their own income or consumption but also from faring better than their peers
possibly due to individuals’ inherent aversion to inequality and relative deprivation
(Fafchamps and Shilpi, 2007). Indeed there is a plenty of supportive evidence of
inequality aversion in experimental and empirical economics and psychology (Frey and
Stutzer, 2002; Easterlin, 2001; Luttmer, 2005; Fafchamps and Shilpi, 2007).
From Durkheim’s point of view, followed by Yang (1989, 1992), Chuang and
Huang (1997), Brainerd (2001), and Neumayer (2003), individuals are integrated into a
social group, regulated by its norms and conventions. Therefore, marriage and birth rates,
as factors that strengthen family ties and social integration, are expected to have negative
effects on suicide rates. On the other hand, the divorce rate and alcohol consumption,
which represent lack of such integration, are expected to have positive effects on suicide
rates. Meanwhile, the impact of female labor participation on suicide rate is less clear. If
female labor participation reduces family ties, it has a positive effect on suicide rate.
However, if working women enjoy social integration as well as financial benefits through
their careers, it reduces suicide rate (Stack, 1998). The net effect of female labor
participation on suicide rate has being unclear (mixed signs) in empirical studies (Yang,
1992; Chuang and Huang, 1997; Neumayer, 2003; Andres, 2005). 10 Following the
Beckerian tradition, we may integrate theses social factors, not only the divorce rate, but
also the birth rate and female labor participation, into an individual’s utility function in
equation (1) to enrich the Hamermesh and Soss’ theoretical model.”
10 In Yang (1992), female labor force participation rate is (significantly) negative for both white and non-white female suicide rates, but positive for non-white male suicide rate and insignificant for white male suicide rate. In Chuang and Huang (1997), the effect is negative for total population, but insignificant for both male and female groups. In Neumayer (2003), the effect is positive in small sample, but insignificant in large sample. In Andres (2005), the effect is insignificant.
8
2.2. Studies focused on Japan
The bulk of existing researches focused on suicides in Japan are conducted in the
fields of epidemiology and psychiatry. Among the existing studies on suicides in Japan,
Watanabe et al. (2006) and Koo and Cox (2006) are conducted from an economic
viewpoint and are closed related to this study. Watanabe et al. (2006) shows that
unemployment and personal bankruptcy are the decisive factors behind the male suicide
rate. Koo and Cox (2006), using time series data from Japan to investigate the
relationship between the suicide cycle and the unemployment cycle, find that the
relationship between the suicide rate and the unemployment rate is significantly positive
for both males and females. Also related to this study, Akechi et al. (2006) finds that there
is a U-shaped association between alcohol consumption and subsequent suicide;
analyzing prefecture-level data between 1953 and 1986, Motonishi (1991) finds that the
frequency of suicide is associated with the unemployment rate; and Stack (1996) shows
that news on suicide has a significant correlation with national level suicide rate.
Yet, both prefecture-level panel analysis of Watanabe et al. (2006) and the time
series analysis by Koo and Cox (2006) cannot provide an insight on how suicide of Japan
is different from suicides of the other OECD countries and what factors may lead to that
difference. Unless a careful cross-country empirical study is undertaken, the peculiarity of
suicides in Japan cannot be accounted for.
2.3. Data and empirical methods in the literature
Many studies use country-specific time series data to study the effects of
socioeconomic factors on suicide rates (Hamermesh and Soss, 1974; Kreitman and Platt,
9
1984; Yang, 1992; Neumayer, 2004; Koo and Cox, 2006). In comparison, Jungeilges and
Kirchgassner (2002) use 1975 data from 30 countries to estimate the effects of
socioeconomic factors and civil liberty on male and female suicide rates across different
age groups. More recent studies are using panel data sets (Yang and Lester, 1995;
Brainerd, 2001; Neumayer, 2003; Andres, 2005). The advantage of using panel data is the
ability to control for unobserved country-specific heterogeneities as well as unobserved
time-specific factors to avoid spurious regression results. Both fixed effect and random
effect models have been experimented (Chuang and Huang, 1997; Neumayer, 2003;
Andres, 2005). In addition, since different countries may have different trends in suicide
rates, unobserved country-specific and/or time-specific variables may generate omitted
variable bias. In order to mitigate this problem, time-varying country-specific factors can
be further controlled using a country-specific time trend variable as in Andres (2005).
3. Empirical Model and Data
3.1. Empirical Model
We estimate the following fixed effects regression equation using panel data from
OECD countries:
log Sit = Xitγ + αi + βt + δiT + εit, (2)
where i and t index countries and years respectively. The dependent variable, log Sit, is the
natural log of the suicide rate and Xit is a set of proxy variables for permanent income
and other attributes including income inequality in equation (1). We postulated that Xit is
a vector of socioeconomic factors that includes: real GDP per capita, growth rate of real
10
GDP per capita, Gini coefficient, female labor participation rate, birth rate, divorce rate,
and per capita alcohol consumption. The regression controls for unobserved country-
specific and time-specific fixed effects by adding αi and βt respectively. In addition, it
controls for unobserved country-specific but time-varying effects by allowing country-
specific coefficient, δi, for the linear time trend, T. The final term, εit, is an error term.
Estimations are carried out separately for both male and female groups. For each
sex, additional estimations are carried out for three different age groups: age 25-44, 45-64,
and 65 years old and above. Furthermore, to compare suicide patterns between Japan
and the rest of the OECD countries, we allow a Japan dummy variable to interact with
socioeconomic factors and compare the fitness of these two settings. Finally, the random
effect counterpart of the regression equation is also estimated.
3.2. Data
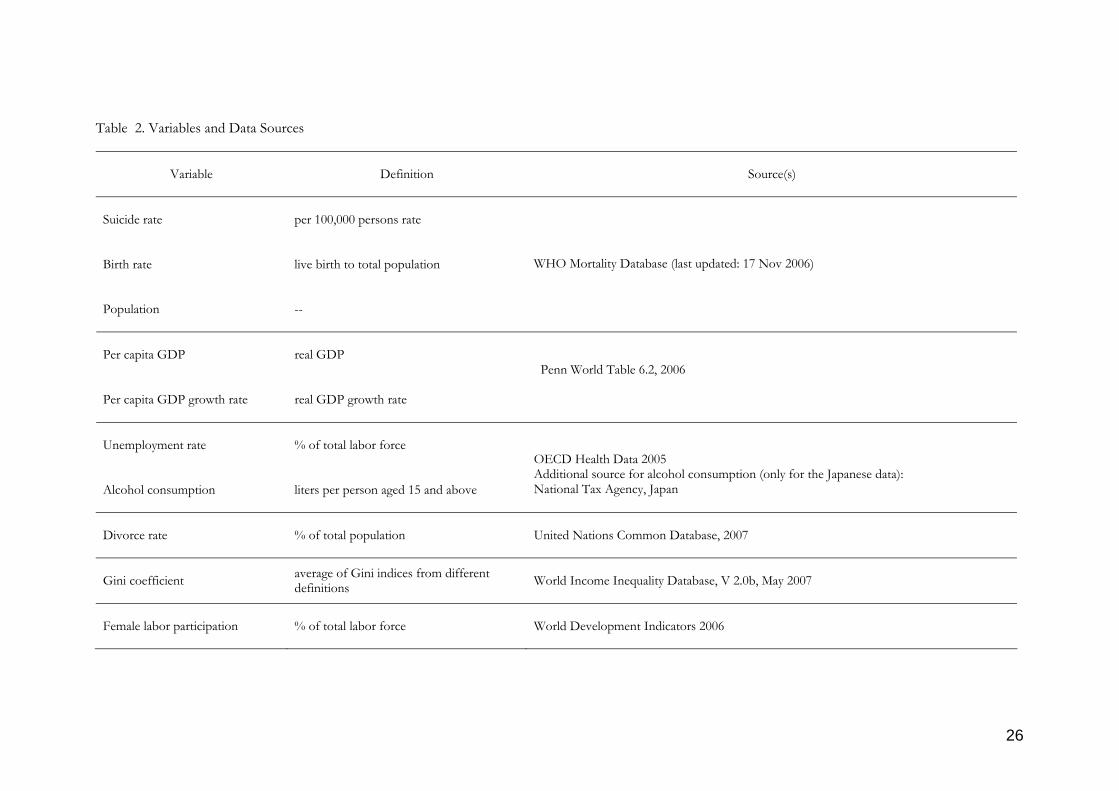
The data set covers all OECD countries over the period of 1980-2003. Table 2
lists the definitions of variables and their sources used in this study. Raw numbers of
suicide and population by gender and age groups were taken from the World Health
Organization Mortality Database. The suicide rate per 100,000 inhabitants for a specific
gender-age is calculated by the ratio of the number of suicides to the population of the
specific gender-age group. Furthermore, for both total male and total female groups (not
separated by age), suicide rates are converted into age standardized suicide rates per
100,000 inhabitants using the world standard population figures published by WHO.11
By conducting this adjustment, differences in age structure across countries and over
11 Unadjusted suicide rates give the equal weight to each suicide while adjusted suicide rates give different weights to suicide rates of each age group based on the world standardized age structure. This reduces the influence of country-specific age structure on total population suicide rate.
11
time can be controlled by the age-standardized suicide rates. In other words, there is not
need to include the share of specific age-groups in the analysis (Neumayer, 2003).
The economic variable real GDP per capita was taken from the Penn World
Table 6.2 and growth rates are calculated based on real GDP per capita. Unemployment
rate was taken from the OECD Health data. As a proxy for income inequality, Gini
coefficients based on different definitions are taken from the United Nations University’s
World Income Inequality Database (WIID), and the average of available Gini coefficients
of each country is used as one single index.12 As to social variables, birth rates measured
as the ratio of live birth to total population are taken from the WHO Mortality Database.
The divorce rate, measured by the ratio of the number of divorce to the total population,
was taken from the United Nations Common Database. Female labor participation rate,
measured as a percentage of females out of total labor force, was taken from the World
Development Indicators of the World Bank. For alcohol consumption, the sales data of
pure alcohol in liters per person over 15 years old are taken from the OECD Health
Data. However, Japanese alcohol consumption data have many missing observations, so
we recalculate it using annual alcohol sales data from the Japanese National Tax Agency.
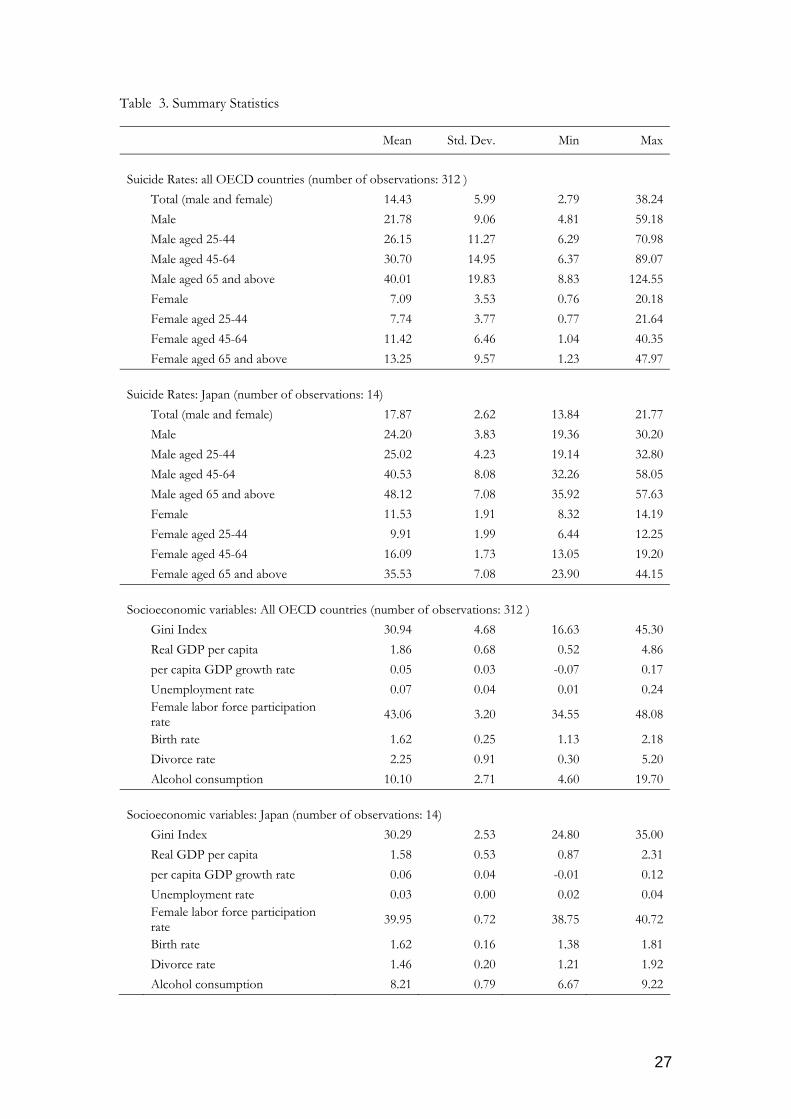
Table 3 presents the summary statistics of suicide rates and socioeconomic
variables.13 The average male suicide rates are around two times of the average female
suicide rates in Japan while it is around three times in all OECD countries. Across all the
gender/age groups, the average suicide rates of Japan are higher than those of all the
12 UN/WIDER WIID provides multiple series of Gini coefficients for each country, depending on the different definitions of income, area coverage, and unit of measurement (Andres, 2005; WIID, 2007). This research uses the average of these multiple series as a proxy for income inequality. Although this approach has been quite widely used in the empirical literature-, not only in the suicide literature but also in many other economic studies,- and the WIID is the most well complied data for the Gini index, it may still lead to biased estimate due to noises and mis-measurement problems. This may also be the reason that some empirical studies have reported mixed results on the effect of income inequality on suicides.
13 Due to missing data, out of 30 OECD member countries, three countries: Iceland, Mexico,
12
OECD countries. For both Japan and all OECD countries, male and female suicide rates
increase in age. Regarding economic variables, the average of real GDP per capita is
lower for Japan than for all OECD countries while the average growth rate for Japan is
slightly higher and the Gini index is roughly the same. The average unemployment for
Japan is much lower than for all OECD countries. Regarding social variables, the
averages of female labor force participation rate, divorce rate and alcohol consumption
are lower for Japan while the average birth rate is the same.
4. Estimation Results
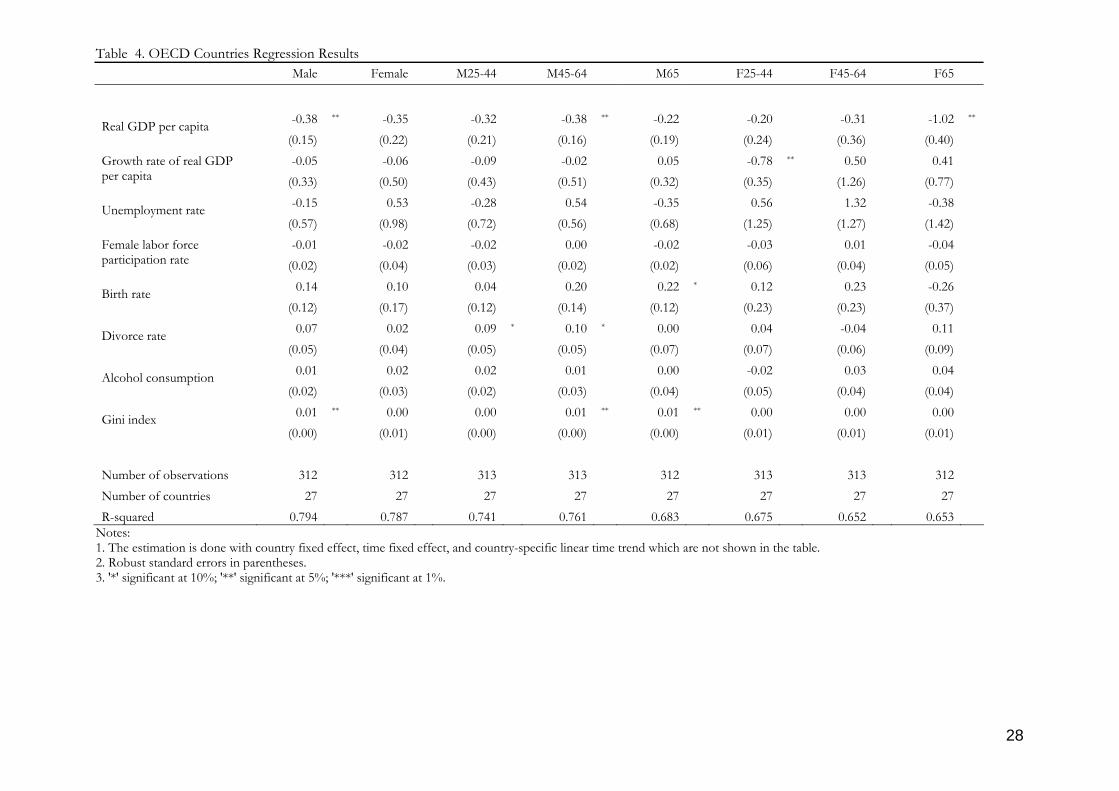
The estimation results of the fixed effects model with country-specific time trend
using data from all OECD countries are shown in Table 4. Note that the estimation in
Table 4 restricts all the socioeconomic factors to have the same marginal effects on
suicide rates (same regression coefficients) for all OECD countries. Then Table 5 shows
the estimation results of the fixed effects model with country-specific time trend and
allowing for a different set of regression coefficients for Japan. Hence, the estimation
results in Table 4 can be considered as a restricted version of those in Table 5.
Comparing the overall performance of these two regressions, adding Japan interaction
terms improves the fitness of the model, quantified by R2, across all gender/age groups.
F tests reject the null hypothesis that socioeconomic factors affect suicide rates of
different countries equally for the male group, male aged 25-44 and male aged 45-64.14
This confirms the common belief that suicide in Japan is an oddity among industrialized
countries.
and Turkey, dropped out in the estimation. Furthermore, the data covers only up to 2003.
14 F statistics are 4.68, 2.56 and 4.12, respectively, for the male group, male aged 25-44 and male aged 45-64. The null hypothesis is rejected at the 95 (F statistics =1.84) and 99 percentiles (F statistics =2.51).
13
For all OECD countries, real GDP per capita is negatively associated with suicide
rate for the male group, male aged 45-64, and female aged 65 and above. The growth rate
of real GDP per capita is negatively associated with suicide rate only for the group of
female aged 25-45. The Gini index, as a proxy for income inequality, is positively
associated with suicide rate for the male group, male aged 45-64, and male aged 65 and
above. These results support that better economic conditions such as high level of
income and higher economic growth reduce suicide rate while income inequality
increases suicide rate. However, the unemployment rate is statistically insignificant. This
is consistent with the result in Andres (2005) where data from 15 European countries
were used.15 The significance and magnitudes of real GDP per capita, growth rate of
real GDP per capita, Gini index, and unemployment rate are similar whether the Japan
interaction terms were added or not.
Meanwhile, the divorce rate is positively associated with suicide rate for male
aged 24-44 and male aged 45-64, but becomes statistically insignificant as the Japan
interaction terms are included in the regression. This suggests the positive signs of these
two male groups may have been overestimated (biased) due to the strong effect of one
specific country, Japan. The birth rate is positively associated with suicide rate for male
aged 65 and above when the Japan interaction terms are not included in the estimation.
This is inconsistent with the existing theory that birth improves family ties and social
integration, and leads to a lower suicide rate. It may suggest intergenerational transfer in
the burden of child-bearing. Nonetheless, this positive sign of the birth rate becomes
statistically insignificant when the Japan interaction terms are added. Hence, the positive
result of birth rate may have captured the effect of some omitted variables. Finally,
15 Some potential explanations for the insignificance of the unemployment rate are: first, it is a consequence of multi-collinearity of economic variables, second, it can be a bias due to omitted variable problem, and third, unemployment rate is indeed insignificant (e.g., well-designed unemployment insurance).
14
female labor participation rate and alcohol consumption appear to be statistically
insignificant.
The above discussion suggests the effects of socioeconomic factors vary
depending on gender and age. Overall, there exists much variation in female suicide rates
and suicide rates of elderly male and female that the model fails to account for.
Furthermore, suicide rate is more sensitive to the economic factors such as real GDP per
capita, growth rate of real GDP per capita, and Gini index than to the social factors such
as the divorce rate, the birth rate, female labor participation rate, and alcohol
consumption.
Turning to case of Japan, we summarize the estimated coefficients of Japan
interaction terms. Real GDP per capita is negatively associated with suicide rate across all
groups especially in Japan. The growth rate is negatively associated with suicide rate
across all age/gender groups except female aged 45-64 and female aged 65 and above.
The Gini index is positively correlated with suicide rate across all gender/age groups
except male aged 25-44 and female aged 65 and above. The empirical result of significant
Gini index in Japan supports a view of individuals’ aversion to inequality and relative
deprivation widely discussed in the recent literature (Frey and Stutzer, 2002; Easterlin,
2001; Luttmer , 2005; Fafchamps and Shilpi, 2007).
Meanwhile, the female labor participation rate is positively associated with suicide
rate for all gender/age groups. More likely, in Japan, the decrease in family ties and the
additional stress from outside jobs, when women participate in the labor market, out-
weighs the beneficial effect of increasing social integration. Nonetheless, one should be
noted that this effect is only marginal. The financial benefit (higher income) of women’s
participation in the labor market can offset this impact and lower suicide rates. The birth
rate is negative for Japan except for male and female aged 45-64 (insignificant) while it is
not significant for other OECD countries. This implies that social integration and family
15
ties through the presence of children reduce the suicide rate in Japan, and the effect is
stronger in female than in male, and in younger and older generations (aged 25-44 and
aged 65 and above) than in the middle-age generation (aged 45-64). This makes sense
because male and the middle-age generation face the majority of the cost of child-bearing.
The divorce rate is positively associated with suicide rate only for male aged 25-44,
suggesting that men are vulnerable to the stress arising from divorce. Alcohol
consumption is positively associated with suicide rate for the male group, and male aged
65 and above. The negative relationship between the suicide rate of female aged 65 and
above and alcohol consumption is somewhat surprising. Whether it is indeed real or
spurious due to some omitted variable requires more detailed data to clarify.
The above findings suggest the suicide problem in Japan is very different from
those of the other OECD countries. Overall, the suicide rate in Japan is more responsive
to economic factors such real GDP per capita, growth rate of real GDP per capita, and
Gini index. Moreover, the impacts from social factors, such as the divorce rate, the birth
rate, female labor participation rate, and alcohol consumption, on the suicide rate in
Japan are noticeably different from the impacts of the same factors on suicide rates in
other OECD countries.
Since the empirical results show that the suicide rate in Japan is significantly
correlated with a wide variety of socioeconomic variables, effective suicide prevention
requires comprehensive measures against downside risk originated from associated
socioeconomic problems. Such measures may include a review of the current
unemployment insurance scheme, an update to the credit insurance and subsidized loan
programs for small and medium-size enterprises which are vulnerable to recessions, and
a general expansion of livelihood protection and income support programs.
16
5. Conclusion
In this study, we analyze suicide rates among OECD countries with a particular
effort made to gain insight into how suicide in Japan is different from suicides in other
OECD countries. The results suggest the effects of socioeconomic factors on suicide
rate vary depending on gender and age. In general, better economic conditions such as
high level of income and higher economic growth reduce suicide rate while income
inequality increases suicide rate. Unlike existing studies, the effect of unemployment rate
on the suicide rate is statistically insignificant. Moreover, suicide rate is more sensitive to
the economic factors such as real GDP per capita, growth rate of real GDP per capita,
and Gini index than to the social factors captured by divorce rate, birth rate, female labor
participation rate, and alcohol consumption. We also find that female and elderly
generation suicides are more difficult to be accounted for.
In accordance to the general belief, the suicide problem in Japan is very different
from those of the other OECD countries. The suicide rate in Japan is more responsive to
economic factors. Moreover, the impacts of social factors on suicide rates are
insignificant in other OECD countries, while in Japan, the marginal effect of female
labor participation rate is positively associated with suicide rate in Japan (insignificant in
other OECD countries); birth rate is negative (insignificant in other OECD countries);
divorce rate is positively associated with suicide rate only for middle-age (aged 25-44)
males; alcohol consumption is positively associated with suicide rate for males and the
effect is strongest for elderly males (aged 65 and above).
Amidst all the myth and folklore about suicides in Japan, the empirical results
show that socioeconomic variables explain the Japanese suicide incidence well. Indeed, it
has been hypothesized that the recent suicide epidemic mentioned at the beginning is
related to the economic recession in the so-called lost decade of Japan in the 1990’s after
17
the burst of the bubble (Koo and Cox, 2006). Further, the collapse of mega-banks in
1997 caused a crisis in the domestic financial sector which is often referred to as a typical
example of “credit crunch” (Woo, 2003). Existing studies show that the negative impact
of the credit crunch in Japan damaged small firms disproportionately leading to debt
insolvencies and personal bankruptcies of many small business owners. Indeed, the
number of applications for personal bankruptcies jumped from 43,545 in 1993 to
122,741 in 1999 (Sawada et al.,. 2007). The social stigma and mental depression associated
with debt overhang and personal bankruptcies led to the dramatic increase in suicides.
Along this line, West (2003) suggests that it is crucial for suicide prevention to build an
efficient and socially acceptable insolvency mechanism. In fact, the recently enacted
‘Basic Law of Suicide Prevention’ calls for a comprehensive measure for suicide
prevention. It is yet to be seen how comprehensive the implementation of the law will be,
this paper supports such a policy direction in Japan.
Finally, this study re-emphasizes the heterogeneities of suicides by gender and
across different age groups as pointed out by Andres (2005). Moreover, it highlights the
heterogeneity in suicide patterns in different countries. The regression results
demonstrate that fixed effect coefficients alone are not enough in picking up the
differences in social structures, and calls for readers’ attention in interpreting empirical
results utilizing aggregated cross-country data. In light of this limitation, future research
on the determinants of suicides requires disaggregated, preferably individual-level, data
on suicides. An ongoing project surveying family members of suicide victims, conducted
by the joint effort of a Tokyo-based non-for-profit organization Lifelink and the authors,
provides an unprecedented opportunity in the field of suicide study. Some preliminary
results are available in Chen, Choi, and Sawada (2007).
18
References
Akechi, T., M. Iwasaki, Y. Uchitomi and S. Tsugane., 2006. Alcohol Consumption and
Suicide among Middle-aged Men in Japan, British Journal of Psychiatry, 188, 231-236.
Andres, A. R.., 2005. Income Inequality, Unemployment, and Suicide: A Panel Data
Analysis of 15 European Countries, Applied Economics, 37, 439-451.
Brainerd, E., 2001. Economic Reform and Mortality in the Former Soviet Union: A
Study of the Suicide Epidemic in the 1990s, European Economic Review, 45(4–6), 1007–
19.
Chen, J., Y. Choi, and Y. Sawada., 2007. One Thousand Suicides Study, Midterm
Progress Report, Symposium on Suicides, Sep. 10, 2007, Lifelink, Tokyo.
Chuang, W. L. and W. C. Huang., 2003. Suicide and Unemployment: Is There a
Connection? An Empirical Analysis of Suicide Rates in Taiwan, Working Paper 0217E,
Department of Economics, National Tsing Hua University.
Chuang, W. L. and W. C. Huang., 1997. Economic and Social Correlates of Regional
Suicide Rates: A pooled Cross-section and Time-series Analysis, Journal of Socio-
Economics, 26(3), 277-289.
Durkheim, E., 1897. Le Suicide: etude de sociologie, Paris: Alcan, (Translated by J. A.
Spaulding, J. A. and G. Simpson, Suicide: A Study in Sociology, New York:Free Press,
1951).
19
Easterlin, R. A., 2001. Income and Happiness: Towards a Unified Theory. Economic
Journal 111, 465-84.
Fafchamps, M. and F. Shilpi, 2007. Subjective Welfare, Isolation, and Relative
Consumption, forthcoming, Journal of Development Economics.
Frey, B. S. and A. Stutzer, 2002.What Can Economists Learn from Happiness Research?.
Journal of Economic Literature XL, 402-435.
Hamermesh, D. S. and N. M. Soss., 1974. An Economic Theory of Suicide, Journal of
Political Economy, 82, 83-98.
Iga, M., 1986. The Thorn in the Chrysanthemum: Suicide and Economic Success in
Japan, University of California Press, Berkeley.
Jungeilges, J. and G. Kirchgassner., 2002. Economic Welfare, Civil Liberty, and Suicide:
An Empirical Investigation, Journal of Socio-Economics, 31, 215-231.
Kreitman, N. and S. Platt., 1984. Suicide, Unemployment and Domestic Gas
Detoxification in Great Britain, Journal of Epidemiology and Community Health, 38, 1-6.
Koo, J. and W. M. Cox., 2006. An Economic Interpretation of Suicide Cycles in Japan,
Research Department Working Paper 0603, Federal Reserve Bank of Dallas.
20
Lester, D., 1996. Patterns of Suicide and Homicide in the World, Nova Science
Publishers, New York.
Luttmer, E.F.P., 2005. Neighbors as Negatives: Relative Earnings and Well-Being,
Quarterly Journal of Economics 120 (3), 963-1002.
Motohashi, Y., 1991. Effects of Socioeconomic Factors on Secular Trends in Suicide in
Japan 1953-1986, Journal of Biosocial Science, 23, 221-227.
Neumayer, E., 2004. Recessions Lower (Some) Mortality Rates: Evidence from Germany,
Social Science and Medicine, 58 (6), 1037–1047.
Neumayer, E., 2003. Socioeconomic Factors and Suicide Rates at Large Unit Aggregate
Levels: A comment, Urban Studies, 40, 2769–76.
OECD., 2005. OECD Health Data: Statistics and Indicator for 30 Countries,
Organization for Economic Cooperation and Develepoment, Paris.
Penn World Table., 2006. Penn World Table 6.2., Center for International Comparisons
of Production, Income and Prices at the University of Pennsylvania.
Pinguet, M., 1993. Voluntary Death in Japan, Polity Press, Cambridge.
Sawada, Y., K. Nawata, M. Ii, and J. J. Lee., 2007. Did the Credit Crunch in Japan Affect
Household Welfare? An Augmented Euler Equation Approach Using Type 5 Tobit
21
Model, CIRJE Discussion Papers F-Series CIRJE-F-498, CIRJE, Faculty of Economics,
University of Tokyo.
Stack, S., 1998. The relationship of female labor force participation to suicide: a
comparative analysis, Archives of Suicide Research, 4, 249-261.
Stack, S., 2000a. Suicide: A 15-year Review of the Sociological Literature, Part I: Cultural
and Economic Factors, Suicide and Life-threatening Behavior, 30(2), 145−62.
Stack, S., 2000b. Suicide: A 15-year Review of the Sociological Literature, Part II:
Modernization and Social Integration Perspectives, Suicide and Life-threatening Behavior,
30(2), 163−76.
United Nations., 2007. UN/WIDER World Income Inequality Database, Version 2.0b,
WIDER, Finland.
United Nations,. 2007. United Nations Common Database, Finland.
Unnithan, N. P., L. Huff-Corzine, J. Corzine, and H. P. Whitt., 1994. The Currents of
Lethal Violence: An Integrated Model of Suicide and Homicide, State University of New
York Press, Albany, New York.
Watanabe, R., M. Furukawa, R. Nakamura, and Y. Ogura., 2006. Analysis of the
Socioeconomic Difficulties Affecting the Suicide Rate in Japan, Kyoto Institute of
Economic Research Discussion Paper No. 626.
22
West, M., 2003. Dying to get out of debt: consumer insolvency law and suicide in Japan,
The John M. Olin Center for Law& Economics Working Paper Series 21, University of
Michigan Law School.
Wilkinson, R. G., 1997. Health Inequalities: Relative or Absolute Material Standards?,
British Medical Journal, 314, 591-5.
Woo, D., 2003. In Search of “Credit Crunch”: Supply Factors behind the Credit
Slowdown in Japan. Journal of Money, Credit and Banking 35(6), 1091-1038.
WHO., 2006. WHO Mortality Database, last updated 17 November 2006, World Health
Organization, Geneva, Switzerland.
World Bank., 2006. World Development Indicators CD-Romm, The World Bank,
Washington, DC.
Yang, B., 1989. A Real Income Hypothesis of Suicide: a Cross-sectional Study of the
United States in 1980, Paper presented at the 15th Annual Convention of the Eastern
Economic Association.
Yang, B., 1992. The Economy and Suicide: A Time-Series Study of the U.S.A., American
Journal of Economics and Sociology, 51(1), 87-99.
Yang, B., and D. Lester, 1995. Suicide, Homicide, and Unemployment, Applied
Economics Letters, 2, 278–279.
23
Table 1. Ranking of Suicide Rates among OECD Countries: 1998-2004
Male 1998 1999 2000 2001 2002 2003 2004 Australia 12 13 14 13 15 13 - Austria 4 4 4 4 4 8 5 Belgium - - - - - - - Canada 17 10 19 18 18 - - Czech Republic 8 8 9 8 11 7 6 Denmark 15 15 15 17 - - - Finland 2 2 2 2 3 4 3 France 6 6 7 7 7 6 - Germany 14 16 17 14 14 10 8 Greece 26 27 26 27 25 19 16 Hungary* 1 1 1 1 1 1 - Iceland 20 21 6 15 20 16 11 Ireland 10 18 11 10 12 11 10 Italy 23 24 23 24 22 - - Japan 3 3 3 3 2 2 1 Luxembourg 16 14 12 21 9 14 9 Mexico* - - - - - - - Netherlands 22 22 22 23 21 17 13 New Zealand 9 12 13 12 - - - Norway 19 19 18 20 19 15 12 Poland* - 7 8 6 6 5 4 Portugal 25 26 25 22 17 12 - Republic of Korea 7 11 16 11 8 3 2 Slovakia* 11 9 10 9 10 - - Spain 21 25 24 26 24 18 15 Sweden 13 17 20 16 13 - - Switzerland 5 5 5 5 5 9 7 Turkey* - - - - - - - United Kingdom 24 23 - 25 23 - 14 United States of America 18 20 21 19 16 - -
# of data (available countries) 26 27 26 27 25 19 16
Notes: 1. For both male and female, suicide rates per 100,000 people are calculated using the number of
suicides and population data from the WHO Mortality Database 2006. The rates are not adjusted. The ranking is done by sorting out the computed suicide rates.
2. '*'s denote countries absent from the list of high-income countries by the World Bank in 2006.
24
Table 1. Ranking of Suicide Rates among OECD Countries: 1998-2004 (cont.)
Female 1998 1999 2000 2001 2002 2003 2004 Australia 16 18 15 16 15 13 - Austria 6 3 4 4 8 7 5 Belgium - - - - - - - Canada 17 15 17 18 17 - - Czech Republic 15 17 13 15 14 9 11 Denmark 9 10 9 8 - - - Finland 5 7 5 5 5 5 4 France 7 5 7 7 6 6 - Germany 13 14 11 10 11 8 8 Greece 26 27 26 27 25 19 16 Hungary* 1 1 1 1 4 4 - Iceland 18 16 12 12 10 16 7 Ireland 20 19 20 19 19 12 12 Italy 22 23 23 23 22 - - Japan 2 2 2 2 2 2 2 Luxembourg 12 8 19 11 7 17 10 Mexico* - - - - - - - Netherlands 11 13 10 17 13 11 9 New Zealand 10 11 21 14 - - - Norway 14 12 14 13 12 10 6 Poland* - 20 18 21 16 15 13 Portugal 25 25 25 24 18 14 - Republic of Korea 3 6 6 6 3 1 1 Slovakia* 24 22 16 20 21 - - Spain 21 26 24 26 24 18 15 Sweden 8 9 8 9 9 - - Switzerland 4 4 3 3 1 3 3 Turkey* - - - - - - - United Kingdom 23 24 - 25 23 - 14 United States of America 19 21 22 22 20 - -
# of data (available countries) 26 27 26 27 25 19 16
25
Table 1. Ranking of Suicide Rates among OECD Countries: 1998-2004 (end)
Male and Female 1998 1999 2000 2001 2002 2003 2004 Australia 12 16 15 16 15 13 - Austria 4 4 4 5 6 7 5 Belgium - - - - - - - Canada 17 13 20 19 16 - - Czech Republic 9 9 9 9 10 8 7 Denmark 11 11 12 13 - - - Finland 3 3 3 2 3 4 3 France 7 6 6 6 7 6 - Germany 14 17 14 15 13 10 8 Greece 26 27 26 27 25 19 16 Hungary* 1 1 1 1 1 1 - Iceland 20 20 7 17 20 16 9 Ireland 13 19 13 12 14 11 12 Italy 23 24 23 24 22 - - Japan 2 2 2 3 2 2 2 Luxembourg 15 10 16 20 8 15 10 Mexico* - - - - - - - Netherlands 21 22 22 22 21 17 13 New Zealand 8 12 18 14 - - - Norway 18 18 19 18 19 12 11 Poland* - 8 8 7 9 9 6 Portugal 25 26 25 23 18 14 - Republic of Korea 6 7 10 8 5 3 1 Slovakia* 16 15 11 10 11 - - Spain 22 25 24 26 24 18 15 Sweden 10 14 17 11 12 - - Switzerland 5 5 5 4 4 5 4 Turkey* - - - - - - - United Kingdom 24 23 - 25 23 - 14 United States of America 19 21 21 21 17 - -
# of data (available countries) 26 27 26 27 25 19 16
26
Table 2. Variables and Data Sources
Variable Definition Source(s)
Suicide rate per 100,000 persons rate
Birth rate live birth to total population
Population --
WHO Mortality Database (last updated: 17 Nov 2006)
Per capita GDP real GDP
Per capita GDP growth rate real GDP growth rate
Penn World Table 6.2, 2006
Unemployment rate % of total labor force
Alcohol consumption liters per person aged 15 and above
OECD Health Data 2005 Additional source for alcohol consumption (only for the Japanese data): National Tax Agency, Japan
Divorce rate % of total population United Nations Common Database, 2007
Gini coefficient average of Gini indices from different definitions World Income Inequality Database, V 2.0b, May 2007
Female labor participation % of total labor force World Development Indicators 2006
27
Table 3. Summary Statistics
Mean Std. Dev. Min Max
Suicide Rates: all OECD countries (number of observations: 312 ) Total (male and female) 14.43 5.99 2.79 38.24 Male 21.78 9.06 4.81 59.18 Male aged 25-44 26.15 11.27 6.29 70.98 Male aged 45-64 30.70 14.95 6.37 89.07 Male aged 65 and above 40.01 19.83 8.83 124.55 Female 7.09 3.53 0.76 20.18 Female aged 25-44 7.74 3.77 0.77 21.64 Female aged 45-64 11.42 6.46 1.04 40.35 Female aged 65 and above 13.25 9.57 1.23 47.97 Suicide Rates: Japan (number of observations: 14) Total (male and female) 17.87 2.62 13.84 21.77 Male 24.20 3.83 19.36 30.20 Male aged 25-44 25.02 4.23 19.14 32.80 Male aged 45-64 40.53 8.08 32.26 58.05 Male aged 65 and above 48.12 7.08 35.92 57.63 Female 11.53 1.91 8.32 14.19 Female aged 25-44 9.91 1.99 6.44 12.25 Female aged 45-64 16.09 1.73 13.05 19.20 Female aged 65 and above 35.53 7.08 23.90 44.15 Socioeconomic variables: All OECD countries (number of observations: 312 ) Gini Index 30.94 4.68 16.63 45.30 Real GDP per capita 1.86 0.68 0.52 4.86 per capita GDP growth rate 0.05 0.03 -0.07 0.17 Unemployment rate 0.07 0.04 0.01 0.24
Female labor force participation rate 43.06 3.20 34.55 48.08
Birth rate 1.62 0.25 1.13 2.18 Divorce rate 2.25 0.91 0.30 5.20 Alcohol consumption 10.10 2.71 4.60 19.70 Socioeconomic variables: Japan (number of observations: 14) Gini Index 30.29 2.53 24.80 35.00 Real GDP per capita 1.58 0.53 0.87 2.31 per capita GDP growth rate 0.06 0.04 -0.01 0.12 Unemployment rate 0.03 0.00 0.02 0.04
Female labor force participation rate 39.95 0.72 38.75 40.72
Birth rate 1.62 0.16 1.38 1.81 Divorce rate 1.46 0.20 1.21 1.92 Alcohol consumption 8.21 0.79 6.67 9.22
28
Table 4. OECD Countries Regression Results Male Female M25-44 M45-64 M65 F25-44 F45-64 F65
-0.38 ** -0.35 -0.32 -0.38 ** -0.22 -0.20 -0.31 -1.02 **Real GDP per capita
(0.15) (0.22) (0.21) (0.16) (0.19) (0.24) (0.36) (0.40) -0.05 -0.06 -0.09 -0.02 0.05 -0.78 ** 0.50 0.41 Growth rate of real GDP
per capita (0.33) (0.50) (0.43) (0.51) (0.32) (0.35) (1.26) (0.77) -0.15 0.53 -0.28 0.54 -0.35 0.56 1.32 -0.38 Unemployment rate
(0.57) (0.98) (0.72) (0.56) (0.68) (1.25) (1.27) (1.42) -0.01 -0.02 -0.02 0.00 -0.02 -0.03 0.01 -0.04 Female labor force
participation rate (0.02) (0.04) (0.03) (0.02) (0.02) (0.06) (0.04) (0.05) 0.14 0.10 0.04 0.20 0.22 * 0.12 0.23 -0.26 Birth rate
(0.12) (0.17) (0.12) (0.14) (0.12) (0.23) (0.23) (0.37) 0.07 0.02 0.09 * 0.10 * 0.00 0.04 -0.04 0.11 Divorce rate
(0.05) (0.04) (0.05) (0.05) (0.07) (0.07) (0.06) (0.09) 0.01 0.02 0.02 0.01 0.00 -0.02 0.03 0.04 Alcohol consumption
(0.02) (0.03) (0.02) (0.03) (0.04) (0.05) (0.04) (0.04) 0.01 ** 0.00 0.00 0.01 ** 0.01 ** 0.00 0.00 0.00 Gini index
(0.00) (0.01) (0.00) (0.00) (0.00) (0.01) (0.01) (0.01) Number of observations 312 312 313 313 312 313 313 312 Number of countries 27 27 27 27 27 27 27 27 R-squared 0.794 0.787 0.741 0.761 0.683 0.675 0.652 0.653
Notes: 1. The estimation is done with country fixed effect, time fixed effect, and country-specific linear time trend which are not shown in the table. 2. Robust standard errors in parentheses. 3. '*' significant at 10%; '**' significant at 5%; '***' significant at 1%.
29
Table 5. OECD Countries Regression Results with Japan Dummy Male Female M25-44 M45-64 M65 F25-44 F45-64 F65
-0.31 ** -0.32 -0.26 -0.31 * -0.16 -0.17 -0.28 -1.00 ** Real GDP per capita (0.15) (0.24) (0.21) (0.15) (0.19) (0.26) (0.37) (0.42) -1.50 *** -1.20 *** -1.21 *** -1.39 *** -1.57 *** -1.26 ** -1.07 * -0.96 (Japan effect) (0.18) (0.35) (0.26) (0.29) (0.49) (0.51) (0.52) (0.78) 0.09 -0.10 0.05 0.17 0.07 -0.81 ** 0.47 0.32 per capita GDP growth rate (0.35) (0.53) (0.46) (0.54) (0.35) (0.38) (1.32) (0.81)
-5.33 *** -5.14 ** -2.87 *** -5.62 ** -5.24 ** -8.79 ** -2.35 -1.95 (Japan effect) (1.38) (2.35) (0.98) (2.08) (1.97) (4.26) (2.67) (2.64) -0.04 0.50 -0.17 0.72 -0.39 0.52 1.34 -0.43 Unemployment rate (0.60) (1.01) (0.77) (0.55) (0.70) (1.28) (1.32) (1.44) 24.93 ** 24.98 14.77 21.02 39.05 *** 52.36 * -1.25 6.61 (Japan effect) (9.21) (16.43) (8.72) (13.14) (13.62) (29.73) (18.51) (17.96) -0.01 -0.02 -0.02 0.00 -0.02 -0.03 0.01 -0.04 Female labor force participation rate (0.02) (0.04) (0.03) (0.02) (0.02) (0.06) (0.04) (0.05) 0.33 *** 0.49 *** 0.34 *** 0.18 ** 0.56 *** 0.75 *** 0.24 * 0.34 ** (Japan effect) (0.06) (0.11) (0.07) (0.08) (0.11) (0.17) (0.14) (0.15) 0.05 0.11 -0.05 0.08 0.18 0.13 0.22 -0.25 Birth rate (0.09) (0.20) (0.11) (0.11) (0.12) (0.24) (0.27) (0.38)
-1.60 *** -2.57 ** -1.60 *** 0.25 -3.04 *** -4.24 ** -0.43 -2.51 ** (Japan effect) (0.48) (0.98) (0.55) (0.59) (0.76) (1.61) (1.17) (1.04) 0.04 0.02 0.06 0.07 -0.01 0.04 -0.05 0.11 Divorce rate (0.04) (0.04) (0.04) (0.04) (0.07) (0.07) (0.06) (0.09)
-0.01 -0.43 0.54 *** -0.30 -0.14 -0.73 -0.17 -0.12 (Japan effect) (0.25) (0.43) (0.16) (0.39) (0.35) (0.66) (0.43) (0.49) 0.02 0.01 0.03 0.01 0.01 -0.02 0.02 0.05 Alcohol consumption (0.02) (0.03) (0.02) (0.04) (0.04) (0.06) (0.04) (0.04) 0.10 * 0.01 0.04 0.15 * 0.09 0.07 0.01 -0.14 ** (Japan effect) (0.05) (0.07) (0.03) (0.08) (0.06) (0.12) (0.11) (0.06) 0.01 ** 0.00 0.00 0.01 ** 0.01 * 0.00 0.00 0.00 Gini index (0.00) (0.01) (0.00) (0.00) (0.00) (0.01) (0.01) (0.01) 0.01 *** 0.02 *** 0.01 0.00 0.02 ** 0.02 ** 0.02 *** 0.01 (Japan effect) (0.00) (0.01) (0.01) (0.00) (0.01) (0.01) (0.01) (0.01)
Number of observations 312 312 313 313 312 313 313 312 Number of countries 27 27 27 27 27 27 27 27 R-squared 0.824 0.792 0.763 0.792 0.694 0.681 0.655 0.654
Notes: 1. The estimation is done with country fixed effect, time fixed effect, and country-specific linear time trend which are not shown in the table. 2. Robust standard errors in parentheses. 3. '*' significant at 10%; '**' significant at 5%; '***' significant at 1%. 4. (Japan effect) represents the coefficient for the interaction term between a Japan dummy variable and each explanatory variable.
30
Figure1. Time-series Plot of Suicide Rates: Japan vs. other OECD Countries
Suicide Rate (per 100,000 people): male
0
5
10
15
20
25
30
35
40
1950 1953 1956 1959 1962 1965 1968 1971 1974 1977 1980 1983 1986 1989 1992 1995 1998 2001 2004
without Japan (weighted mean) Japan
Suicide Rate (per 100,000 people): female
0
5
10
15
20
25
1950 1953 1956 1959 1962 1965 1968 1971 1974 1977 1980 1983 1986 1989 1992 1995 1998 2001 2004
without Japan (weighted mean) Japan
Suicide Rate (per 100,000 people): male and female
0
5
10
15
20
25
30
1950 1953 1956 1959 1962 1965 1968 1971 1974 1977 1980 1983 1986 1989 1992 1995 1998 2001 2004
without Japan (weighted mean) Japan
31
Figure 2. Time-series Plot of Suicide Rates: Japan vs. other OECD Countries, Male
Suicide Rate (per 10000 people): male, aged 25-44
0
5
10
15
20
25
30
35
40
1950 1954 1958 1962 1966 1970 1974 1978 1982 1986 1990 1994 1998 2002 2006
without Japan (weighted mean) Japan
Suicide Rate (per 10000 people): male, aged 45-64
0
10
20
30
40
50
60
70
1950 1954 1958 1962 1966 1970 1974 1978 1982 1986 1990 1994 1998 2002 2006
without Japan (weighted mean) Japan
Suicide Rate (per 10000 people): male, aged 65 and above
0
20
40
60
80
100
120
1950 1954 1958 1962 1966 1970 1974 1978 1982 1986 1990 1994 1998 2002 2006
without Japan (weighted mean) Japan
32
Figure 3. Time-series Plot of Suicide Rates: Japan vs. other OECD Countries, Female
Suicide Rate (per 10000 people): female, aged 25-44
0
5
10
15
20
25
1950 1954 1958 1962 1966 1970 1974 1978 1982 1986 1990 1994 1998 2002 2006
without Japan (weighted mean) Japan
Suicide Rate (per 10000 people): female, aged 45-64
0
5
10
15
20
25
1950 1954 1958 1962 1966 1970 1974 1978 1982 1986 1990 1994 1998 2002 2006
without Japan (weighted mean) Japan
Suicide Rate (per 10000 people): female, aged 65 and above
0
10
20
30
40
50
60
70
1950 1954 1958 1962 1966 1970 1974 1978 1982 1986 1990 1994 1998 2002 2006
without Japan (weighted mean) Japan