High-frequency wave propagation in the uppermost mantle
12
JOURNAL OF GEOPHYSICAL RESEARCH, VOL. 104, NO. B5, PAGES 10,655-10,666, MAY 10, 1999 High-frequency wave propagation in the uppermost mantle T. Ryberg GeoForschungsZentrum, Potsdam, Germany F. Wenzel GeophysicalInstitute, Karlsruhe, Germany Abstract. Short-period,three-component recordings of the seismic w•ve field of peaceful nuclear explosions recorded on deepseismic sounding profiles (Quartz •nd Ruby-I, collected in 1984•nd 1988, respectively) in northernRussi• •re used to constrainthe n•ture of the high-frequency teleseismic P• phase,which c•n be observed for receiverdistances of >3000 km. We suggest that this phaseis caused by velocity fluctuationsin the upper m•ntle •cting •s scatterers. To test this hypothesis and to determine the propertiesof the upper mantle scatterers, the elastic reflectivity method(one-dimensional isotropic models) w•s used to model the cod• of the high-frequency teleseismic P• phase. Both the observed d•t• •nd the synthetic record sections were analyzed by examining the coda decay rates of the teleseismic Pn phase at 5 Hz. Synthetic seismograms are computed for differentmodelsb•sed on the global model IASP91 with •n •dded zone of r•ndomly distributed velocity fluctuations (l•mell•e) just below the crust-m•ntleboundary. These models m•y be characterized by the thickness of the scattering l•yer L, the vertical heterogeneity correlation length a, and the heterogeneity standard deviation er. The numerical simulation of the wave propagation in these models generated a high-frequency teleseismic Pn phase with a well-pronounced, long coda. A comparison of the modeling results with the observations shows clearly that a velocity model containingfluctuationsin the upper mantle can easily explain the presence of a high-frequency teleseismic Pn. Comparing the coda decay rates of syntheticseismograms with the observation, we tried to constrain the propertiesof the velocity fluctuations in the upper mantle, L, a, and •. In the distance range of the uninterfered high-frequency teleseismic Pn phase beyond 1300 km, the coda decay rates for our best fitting model are similar to the observed ones. This model has a 75 km thick zone of scatterersbelow the Moho, containing lamellae with an average thickness of 2 km and a RMS velocity perturbation of 5%. The modeling results showalsothat two other possible models, the whispering gallery phase along the crust-mantle boundary and scattering in the lower crust, taken alone are not able to explain the coda propertiesof the high-frequency teleseismic Pn phase. 1. Introduction Mantle P• and $•. phases with unusually high fre- quenciesand long codas from earthquakes and other sources have been observedin many different areas of the world [e.g., Li•ehan, 1940; Molnar and Oliver, 1969; Walker,1977] asearly as 1935. These phases are called oceanic Pn, Po and long range or teleseismicP•, and are characterized by gro'up velocities of •8.0 km/s. It is remarkable that these high-frequency signals (typically Copyright 1999 by the American Geophysical Union. Paper number 1999JB900067. 0148-0227 / 99 / 1999 J B900067509.00 >15 Hz, occasionally ashigh as 35 Hz) are reported for both continental and oceanic paths, and while travel- ing efficientlythroughout different tectonic provinces of the world like continental shieldsand deep-ocean basins [Molnar and Oliver, 1969], they appear to be inter- rupted only by major plate tectonic boundaries, such as mid-ocean ridges, island arc structures, and subduc- tion zones. Although many theories have been advanced to ex- plain these waves, no commonly accepted waveguide mechanismfor their efficient propagation exists. Sev- eral explanationsfor high-frequency teleseismic P• and Sn have been proposed:whisperinggallery wavesmul- tiply reflected at the crust-mantle boundary; transmis- sion in a high-velocity layer beneath the Moho and 10,655
Transcript of High-frequency wave propagation in the uppermost mantle

JOURNAL OF GEOPHYSICAL RESEARCH, VOL. 104, NO. B5, PAGES 10,655-10,666, MAY 10, 1999
High-frequency wave propagation in the uppermost mantle
T. Ryberg GeoForschungsZentrum, Potsdam, Germany
F. Wenzel
Geophysical Institute, Karlsruhe, Germany
Abstract. Short-period, three-component recordings of the seismic w•ve field of peaceful nuclear explosions recorded on deep seismic sounding profiles (Quartz •nd Ruby-I, collected in 1984 •nd 1988, respectively) in northern Russi• •re used to constrain the n•ture of the high-frequency teleseismic P• phase, which c•n be observed for receiver distances of >3000 km. We suggest that this phase is caused by velocity fluctuations in the upper m•ntle •cting •s scatterers. To test this hypothesis and to determine the properties of the upper mantle scatterers, the elastic reflectivity method (one-dimensional isotropic models) w•s used to model the cod• of the high-frequency teleseismic P• phase. Both the observed d•t• •nd the synthetic record sections were analyzed by examining the coda decay rates of the teleseismic Pn phase at 5 Hz. Synthetic seismograms are computed for different models b•sed on the global model IASP91 with •n •dded zone of r•ndomly distributed velocity fluctuations (l•mell•e) just below the crust-m•ntle boundary. These models m•y be characterized by the thickness of the scattering l•yer L, the vertical heterogeneity correlation length a, and the heterogeneity standard deviation er. The numerical simulation of the wave propagation in these models generated a high-frequency teleseismic Pn phase with a well-pronounced, long coda. A comparison of the modeling results with the observations shows clearly that a velocity model containing fluctuations in the upper mantle can easily explain the presence of a high-frequency teleseismic Pn. Comparing the coda decay rates of synthetic seismograms with the observation, we tried to constrain the properties of the velocity fluctuations in the upper mantle, L, a, and •. In the distance range of the uninterfered high-frequency teleseismic Pn phase beyond 1300 km, the coda decay rates for our best fitting model are similar to the observed ones. This model has a 75 km thick zone of scatterers below the Moho, containing lamellae with an average thickness of 2 km and a RMS velocity perturbation of 5%. The modeling results show also that two other possible models, the whispering gallery phase along the crust-mantle boundary and scattering in the lower crust, taken alone are not able to explain the coda properties of the high-frequency teleseismic Pn phase.
1. Introduction
Mantle P• and $•. phases with unusually high fre- quencies and long codas from earthquakes and other sources have been observed in many different areas of the world [e.g., Li•ehan, 1940; Molnar and Oliver, 1969; Walker, 1977] as early as 1935. These phases are called oceanic Pn, Po and long range or teleseismic P•, and are characterized by gro'up velocities of •8.0 km/s. It is remarkable that these high-frequency signals (typically
Copyright 1999 by the American Geophysical Union.
Paper number 1999JB900067. 0148-0227 / 99 / 1999 J B 900067509.00
>15 Hz, occasionally as high as 35 Hz) are reported for both continental and oceanic paths, and while travel- ing efficiently throughout different tectonic provinces of the world like continental shields and deep-ocean basins [Molnar and Oliver, 1969], they appear to be inter- rupted only by major plate tectonic boundaries, such as mid-ocean ridges, island arc structures, and subduc- tion zones.
Although many theories have been advanced to ex- plain these waves, no commonly accepted waveguide mechanism for their efficient propagation exists. Sev- eral explanations for high-frequency teleseismic P• and Sn have been proposed: whispering gallery waves mul- tiply reflected at the crust-mantle boundary; transmis- sion in a high-velocity layer beneath the Moho and
10,655

10,656 RYBERG AND WENZEL: UPPER MANTLE WAVE PROPAGATION
above a low-velocity channel; "lid" and normal modes; tunneling of low-frequency waves through thin high- velocity layers; models with reverberations in the litho- sphere, crust, and water column; transmission through a low-velocity zone below the Moho. For a detailed overview and alternative models see [Sereno and Or- curt, 1985, 1987; Brandsd6ttir and Menke, 1988; Mallick and Frazer, 1990; Mantovani et al., 1977; Gettrust and Frazer, 1981; Menke and Richards, 1980; Sutton and Walker, 1972; Stephens and Isacks, 1977]. Models with random velocity heterogeneities in the crust or upper mantle have been suggested and studied by Menke and Chen [1984], Richards and Menke [1983], Mallick and Frazer [1990] and Tittgemeyer et al. [1996]. Simula- tions of wave propagation by model seismics [Menke and Richards, 1983] show that scattering effects in the upper mantle could explain the coda phenomenon of the teleseismic P, phase.
It is commonly accepted that scattering at small-scale heterogeneities in the crust and upper mantle associ- ated with two- and three-dimensional velocity and den- sity fluctuations is responsible for most of the seismic coda. With long-range nuclear-seismic profiles from the former Soviet Union becoming available, a unique con- trolled source database can be accessed to study re- lated questions. The goal of this study is to investigate whether or not scatterers in the uppermost mantle are able to generate a high-frequency teleseismic Pn phase with properties comparable to those observed along the deep seismic sounding profile Quartz and Ruby-I in northern Eurasia (Russia)[Mechie et al., 1993]. We will compare quantitatively synthetic record sections cal- culated for different one-dimensional scattering models with observations along the profiles, similar to Mallick and Frazer [1990]. By varying the parameters of scat- tering models we will try to estimate the properties of the scattering zone.
Because the body of theoretical literature concerning supercritical wave propagation in random elastic struc- tures is amazingly scarce, we have to rely on numer- ical modeling techniques. The one-dimensional verti- cal incidence case has been treated by O'Doherty and Anstey [1971] and is considered a classical result in ex- ploration seismology. Little progress has been achieved for nonvertical incidence elastic propagation. Virtually nothing is known about supercritical long-range propa- gation. We think that especially for supercritical wave propagation, multiple scattering becomes an nonnegli- gible issue.
While most past studies concentrate on the oceanic P• and S• phases, we will i0cus on P• propagating below the Eurasian continent. Although this appears to be a limitation, we think that the wave propaga- tion mechanism along a continental path is the same as for an oceanic path. Thus our findings can be taken to explain a global phenomenon. Our goal is to study the high-frequency P• quantitatively, whereas other au- thors [Mallick and Frazer, 1990; Tittgemeyer et al., 1996] and Enderle et al. [1997] compared synthetic seis- mograms with the observations in a more qualitative sense. The amplitudes of both phases, the first P arrival and the high-frequency t. eleseismic P•, are influenced by several factors, i.e., the local velocity structure, intrin- sic Q, scattering of energy, the source spectrum, the receiver transfer function, site effects, and coupling of source and receiver to the subsurface. Most of these fac-
tors are difficult to determine reliably from the data. To study the properties of the high-frequency teleseismic P•, we decided to choose the coda properties instead of amplitudes because we think that the coda properties most likely reflect the velocity fluctuations of the upper mantle scatterers and are not too much influenced by other factors.
2. Seismic Data
The data analyzed for the high-frequency teleseismic P• phase belong to the system of long-range deep seis- mic sounding profiles carried out by Russian scientists from 1971 to 1990. Peaceful nuclear explosions (PNE) and numerous chemical explosions were used as power- ful seismic sources. These studies investigated the ve- locity structure of the crust and upper mantle lEgorkin and Pavlenkova, 1981; Egorkin and Chernyshov, 1983; Pavlenkova and Egorkin, 1983; Egorkin et al., 1987]. In particular, the seismic data from the Quartz and Ruby-I profiles, located in northern Eurasia (Figure 1), were used to investigate the high-frequency teleseismic P• [Ryberg et al., 1995]. About 400 short-period (1- 2 Hz) three-component, analog recording systems were deployed to record the ground motion resulting in max- imum observation distances of 3145 kin. The average station spacing of about 10 km along the profiles pro- vided a data density not previously available for studies of the high-frequency teleseismic Pn.
The recorded wave field of the shots on the Quartz and Ruby-I profiles shows distinct phases that are as- sociated with the large-scale velocity structure of the
Figure 1. (opposite) High-pass-filtered (corner frequency f = 5 Hz) vertical component record sections on (top) long-range seismic profile Quartz for shot point (SP) 323N recorded to the northwest and (bottom) Ruby-I for shot point SP 89 recorded to the southeast. The record sections are individually normalized to maximum trace amplitude, a reductioff velocity of 8 km/s and the area-fill display method was applied. The marked, strong band traveling with a group velocity of V = 8.1 km/s is the high-frequency teleseismic Pn phase. The start of the digitization of the traces is ---3-5 s before the first arrival. The map of northern Eurasia shows the location of the sources (SP 323N, SP 89) and the receivers (dots) along the profiles.

RYBERG AND WENZEL- UPPER MANTLE WAVE PROPAGATION 10,657
60 SE NW
50
40
30
.•. 20 o
• lO i
i:- o
-lO
-20
-30
-40
60 NW
½•o •o o 8oo•oo ø
lOOO
Distance [km]
i
2000 i
3000
SE
50
40
30
• 10 i
E i.7-. o
-lO
-20
-30
-40
sP
la
1000
[rkut• 50 ø ,
Distance [kin]
i
2000 i
3000

10,658 RYBERG AND WENZEL: UPPER MANTLE WAVE PROPAGATION
crust and upper mantle. Recently, studies of the ve- locity structure below northern Eurasia show a remark- ably inhomogeneous velocity structure of the crust and upper mantle [Egorkin. and Mikhaltsev, 1990; Mechie et al., 1993; Ryberg et al., 1996; Thybo and Perchuc, 1907].
In addition to these distinct phases the high-frequen- cy part of the wave field from shots recorded along the Quartz and Ruby-I profiles differs strongly from the corresponding low-frequency constituent. As shown by Ryberg et al. [1995], it is clearly dominated by the well- known high-frequency teleseismic P•. This phase trav- els with a group velocity of about 8.1 km/s and has no sharp first onset. At distances greater than 1300 km it arrives after the wave which dives through the upper mantle. It contains only high-freqfiency energy in the band of 5-12 Hz and is characterized by a long, incoher- ent coda. In addition to its characteristic group velocity, the coda decay rate Q is a parameter which properly de- scribes the high-frequency teleseismic P• phase. Note the absence of phases corresponding to the mantle trip- lications. This is probably caused by intrinsic damping in upper mantle (low Q channel).
3. Coda Decay Rate Estimates
For quantification purposes the coda properties (coda decay rates) for the vertical component of the teleseis- mic P• are estimated. We will use a very simple method to estimate the coda decay rate. We do not attempt to separate intrinsic and scattering Q, or to invoke a so-
phisticated inversion method for coda Q. We are aware of the limitation of our simple coda Q estimates. In addition to the determination of the coda decay rate Q at a single location we study its distance dependence. Instead of analyzing seismograms recorded at short off- sets [Sereno and Orcutt, 1987; Brandsd6ttir and Menke, 1988; Mallick and Frazer, 1990], we will focus our coda studies to seismograms recorded at distance >1300 km where the high-frequency P, is a phase clearly sepa- rated from the P phase diving deeper into the mantle.
As described by Ryberg et al. [1995], the rough proce- dure of band-pass filtering, Hilbert transformation, and least squares fitting the envelopes to a t -2e -wt/Q func- tion [Aki and Chouet, 1975] was used to estimate coda decay rates and their standard deviations or. As an ex- ample, Figure 2 shows the coda estimates at 5 Hz of the vertical component of the record section from shot point (SP) 323 recorded along Quartz and from shot point SP 89 recorded along Ruby-I. In addition to the individual coda estimates, the individual Q values were averaged over distance with a spatial moving window of 500 km. Three different distance ranges can be separated. At distances <500 km the determination of the coda de-
cay rate is biased by the quasi-P a phase traveling with an apparent velocity of 6 km/s. Thus the coda values of up to 2000 are not representative for the teleseismic P• phase. Between 500 km and •1200 km, both the high-frequency teleseismic P• and the common P are present and overlap each other. Both phases travel as the first arrival and arrive at the receivers at approx- imately the same timeø Therefore the coda values of
10 4
0 10 3
o o
10 2
I , I I I
o o
ß o ß o
o o ß o s
o ß øe ß o o ß ee eø • ß o oe
ß o ß o• o ß o •o•_2'1; • • o ... .; ;.:o• ß
•o o ..oo• ß .. o ß .• '. ß .
o e• o ß o o O o ß ß ß øø• ß ee ß
o
ß -- Quartz
o-- Ruby-I
o o'oo ioo o'oo s'00 o'oo Distance [km]
Figure 2. Coda Q estimates of the teleseismic P• phase of the vertical component of the record sections along the profiles Quartz and Ruby-I at the frequency of 5 Hz. In addition to the individual coda Q estimates the lines show the coda Q versus distance averaged in a moving distance window of 500 km. Note the general trend to larger Q with increased observation distances > 1300 km.

RYBERG AND WENZEL: UPPER MANTLE WAVE PROPAGATION 10,659
•1500 are strongly influenced by the P phase traveling as a diving wave through the uppermost mantle. Start- ing with the distance of 1300 km the high-frequency teleseismic P• is a secondary arrival. Here the coda es- timates correspond to the high-frequency teleseismic P• only. The decay rates range from 1000 to 2000 at 5 Hz, in agreement with Brandsd6ttir and Menke [1988]. We have chosen one specific frequency band for several rea- sons: the recorded signal is relatively band limited, at the frequency of 5 Hz the free surface reverberations are negligible, and at the same time there is still sufficient energy in the teleseismic P• [Ryberg et al., 1995]. When analyzing the coda decay rates at lower frequencies, one has to face the problem that several surface reverbera- tions and upper mantle phases (410 and 660 km discon- tinuities) interfere with the wave field, while at higher frequencies the signal-to-noise ratio is very low. The tendency of increasing coda Q with increasing distance >1300 km is clearly visible, although there is a slight decrease beyond 2600 km. In the further discussion we will focus on this distance range because here the high- frequency teleseismic P• is virtually unaffected by other seismic phases.
4. Model
Ryberg et al. [1995] presents a qualitative velocity model containing a waveguide in the lithospheric man- tle that preferentially propagates high-frequency en- ergy over large distances. A layer where randomly distributed velocity fluctuations are superimposed on a smooth velocity gradient acts as a waveguide where high-frequency energy becomes localized and gradually backscattered to the surface. These random velocity fluctuations can be described by their statistical prop- erties, such as distribution type, mean, and standard deviation values.
To better understand the generation of high-frequen- cy teleseismic P• coda, we performed a numerical in- vestigation of the propagation of waves through var- ious velocity models containing heterogeneities in the uppermost mantle. We computed synthetic seismo- grams to investigate scattering effects for elastic mod- els. Computers are currently inadequate to simulate the full high-frequency elastic wave propagation of the tele- seismic P• phase in realistically large models (• 5000,X x 400,X at 10 Hz) using two- or three-dimen- sional finite difference (FD) techniques within reason- able CPU times. Therefore we limited our studies to the
analysis of synthetic seismograms calculated for one- dimensional models with randomly distributed velocity lamellae in the uppermost mantle. Most of the energy traveling to large distances will be multiply reflected and/or converted, an effect similar to multiple forward scattering. We would also expect energetic arrivals due to guided phases traveling in the zone containing the scatterers. The limitation to one-dimensional models
can lead to incorrect conclusions about the waveguide properties because in the real Earth the scatterers will surely not be one-dimensional.
A measure of the two and three dimensionality of the scatterers could be the spatial incoherence of the ob- served coda. However, the actual degree of spatial co- herency is not easily determined from the data because site effects may render a spatially coherent wave pattern incoherent, particularly in the high-frequency range of the signal. On the other hand, if the velocity fluctu- ations exhibit a lateral continuity on the scale of sev- eral Fresnel zones the difference between one- and three-
dimensional models should vanish as far as the amount
of transmitted and backscattered energy is concerned. Thus modeling the observed coda lengths with one- dimensional (l-D) structures implies the assumption of velocity fluctuations that vary vertically on a much shorter scale than horizontally. With this assumption we can demonstrate that key features of the data can be explained quantitatively by one-dimensional models. Under the constraints discussed, we speculate that our parameters also hold for laterally variable fluctuations of the medium, provided the lateral correlation length exceeds the Fresnel zone. The advantage of the limita- tion to one-dimensional models is that we can relatively easily test wave propagation in a large number of dif- ferent models. It appears physically plausible that the waveguide effect is strongest if the models are strictly 1-D. The results of the 1-D computations will be biased toward strong waveguide propagation.
5. Synthetics
It was the goal of the coda analysis of the synthetic data to reveal the relationship between the parame- ters describing the scattering models and the coda de- cay rate. We expect that the frequency content and the coda generation for the high-frequency teleseismic P• in seismograms computed using these models is strongly controlled by the correlation length of the het- erogeneities a. The "strength" of the scattering process will be influenced by both the thickness L of the scat- tering layer and the standard deviation rr of the velocity perturbations.
The record sections of synthetic seismograms for com- parison with the Quartz data are generated in a two step process: model generation and seismogram calcu- lation. First, we generate one-dimensional models by overlaying a background model with velocity fluctua- tions. The background model uses the P and S wave ve- locities, the density and damping factors of the IASP91 model [Kennctt and Engdahl, 1991]. Because the high- frequency teleseismic P• wave is a globally observed phenomenon, we used the IASP91 model as our back- ground model instead of taking a local fine tuned model
In the sub-Moho zone we randomized the P velocity, and the S wave velocity was assumed to be correlated

10,660 RYBERG AND WENZEL: UPPER MANTLE WAVE PROPAGATION
50
ß
lOO
15o
Vp [km/s] Vp [km/s] 6 7 8 9 5 6 7 8 9 I • I , I ,
5 6 7 8 9 5 6 7 8 9
a) b) Figure 3. One-dimensionM P wave velocity-depth functions for different models studied (only the uppermost part of the models is displayed). (a) The global IASP91 model [Kennett and En9dahl, 1991]. (b) One of the final models based on the IASP91 model with velocity fluctuations in the upper mantle. The thickness of the scattering zone is 75 km, the correlation length is 2 km, and the RMS velocity fluctuation is 5% of the background model. (c) Model based on IASP91 with velocity fluctuations (5ø-/0) in the lower crust.
Vp [km/s] 5 6 7 8 9
5 6 7 8 9
c)
by the widely used ratio of --• x/•. Because of the small effect of the density on the synthetics we assumed no density fluctuations for our calculations. The spatial distribution of the velocity perturbations is computed in the wavenumber domain by filtering a series of ran- dom numbers with a filter operator chosen to generate a random velocity field with a Gaussian distribution. This random number field is scaled and superimposed on the background model. We generated a large number of models, each characterized by a unique description in terms of scattering layer thickness L, heterogeneity cor- relation length a, and heterogeneity standard deviation or. The velocity fluctuations have a zero mean, and the standard deviation cr is taken relative to the background model. To perform a simple grid search, we varied these parameters in a systematic manner to scan a specific range of scattering layer thickness L, heterogeneity cor- relation length a, and heterogeneity standard deviation or. Figure 3 show the velocity-depth functions of the background and typical upper mantle and lower crust scattering models.
In the second step, synthetic seismograms are calcu- lated using the reflectivity method [Fuchs and M(iller, 1971]. The continuous one-dimensional velocity func- tion was approximated adaptively by a steplike func- tion, so that the region containing the fluctuations (35 km < z < 110 km) consists of 500 constant veloc- ity sublayers. The entire number of constant velocity sublayers was >1000. The Earth-flattening transfor- mation was applied prior to the calculations. A P wave point source was located at a depth of 800 m. The source time function is a relatively broadband source wavelet with a dominant frequency of 4 Hz. The re- sulting complete vertical component seismograms con- tain multiples (except the multiples at Earth's surface), converted phases, whispering gallery phases, and guided and tunneling phases. The coda properties of the syn- thetics are analyzed using the same technique and pa- rameters as described above. In all the synthetics the teleseismic Pn phase is present and travels with a group velocity of about 8 km/s. Synthetic seismograms were obtained from five different scattering models with the
RYBERG AND WENZEL. UPPER MANTLE WAVE PROPAGATION 10,661
10 4
o (1• 10 3
o
Quartz profile, SP 323 N ........ best fitting model <Q>
102 • data points
0 0'00 100 0'00 i00 0'00 Distance [kin]
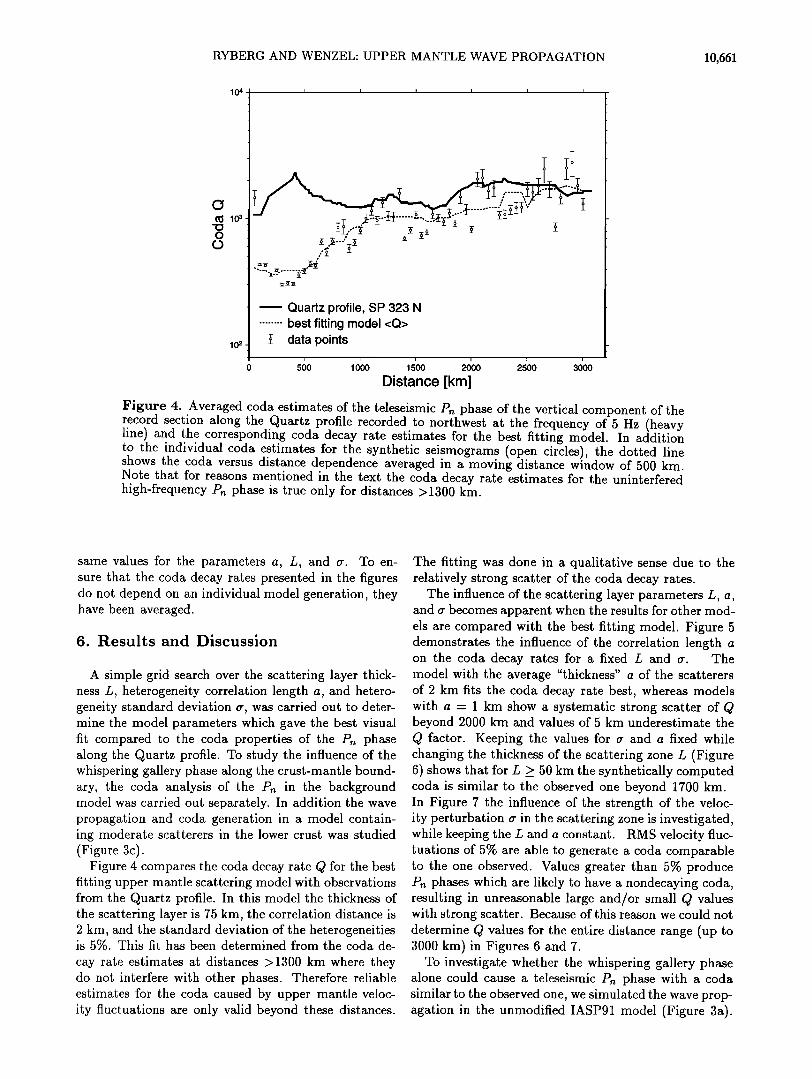
Figure 4. Averaged coda estimates of the teleseismic P,• phase of the vertical component of the record section along the Quartz profile recorded to northwest at the frequency of 5 Hz (heavy line) and the corresponding coda decay rate estimates for the best fitting model. In addition to the individual coda estimates for the synthetic seismograms (open circles), the dotted line shows the coda versus distance dependence averaged in a moving distance window of 500 km. Note that for reasons mentioned in the text the coda decay rate estimates for the uninterfered high-frequency P,• phase is true only for distances >1300 km.
same values for the parameters a, L, and rr. To en- sure that the coda decay rates presented in the figures do not depend on an individual model generation, they have been averaged.
6. Results and Discussion
A simple grid search over the scattering layer thick- ness L, heterogeneity correlation length a, and hetero- geneity standard deviation rr, was carried out to deter- mine the model parameters which gave the best visual fit compared to the coda properties of the P, phase along the Quartz profile. To study the influence of the whispering gallery phase along the crust-mantle bound- ary, the coda analysis of the P,• in the background model was carried out separately. In addition the wave propagation and coda generation in a model contain- ing moderate scatterers in the lower crust was studied (Figure 3c).
Figure 4 compares the coda decay rate O for the best fitting upper mantle scattering model with observations from the Quartz profile. In this model the thickness of the scattering layer is 75 km, the correlation distance is 2 km, and the standard deviation of the heterogeneities is 5%. This fit has been determined from the coda de-
cay rate estimates at distances >1300 km where they do not interfere with other phases. Therefore reliable estimates for the coda caused by upper mantle veloc- ity fluctuations are only valid beyond these distances.
The fitting was done in a qualitative sense due to the relatively strong scatter of the coda decay rates.
The influence of the scattering layer parameters L, a, and rr becomes apparent when the results for other mod- els are compared with the best fitting model. Figure 5 demonstrates the influence of the correlation length a on the coda decay rates for a fixed L and rr. The model with the average thickness a of the scatterers of 2 km fits the coda decay rate best, whereas models with a - 1 km show a systematic strong scatter of Q beyond 2000 km and values of 5 km underestimate the Q factor. Keeping the values for rr and a fixed while changing the thickness of the scattering zone L (Figure 6) shows that for L _> 50 km the synthetically computed coda is similar to the observed one beyond 1700 km. In Figure 7 the influence of the strength of the veloc- ity perturbation rr in the scattering zone is investigated, while keeping the L and a constant. RMS velocity fluc- tuations of 5% are able to generate a coda comparable to the one observed. Values greater than 5% produce P,• phases which are likely to have a nondecaying coda, resulting in unreasonable large and/or small Q values with strong scatter. Because of this reason we could not determine Q values for the entire distance range (up to 3000 km) in Figures 6 and 7.
To investigate whether the whispering gallery phase alone could cause a teleseismic P,• phase with a coda similar to the observed one, we simulated the wave prop- agation in the unmodified IASP91 model (Figure 3a).

10,662 RYBERG AND WENZEL: UPPER MANTLE WAVE PROPAGATION
0 10 3
o
10 2
Quartz profile, SP 323 N a=lkm
a=2km
a=5km
o o'oo ioo o'oo ioo o'oo Distance [km]
Figure 5. Comparison of the coda decay rates of the P• phase along the Quartz profile (heavy line) and the decay rate estimates for different models with velocity fluctuations in the upper mantle. While the thickness L - 75 km and the standard deviation of the heterogeneities rr = 5% are kept constant, the influence of the correlation length a on the coda generation is demonstrated (dashed lines). It is clearly visible that for a = 2 km the coda rate for the scattering P• phase is similar to the observations along the Quartz profile.
Although it is unlikely that the scattering properties of the crust are uniform over thousands of kilometers, we also studied the effect of scatterers (randomly dis- tributed lamellae with 5% velocity variations and i km correlation distance in the lowermost 15 kin) in the
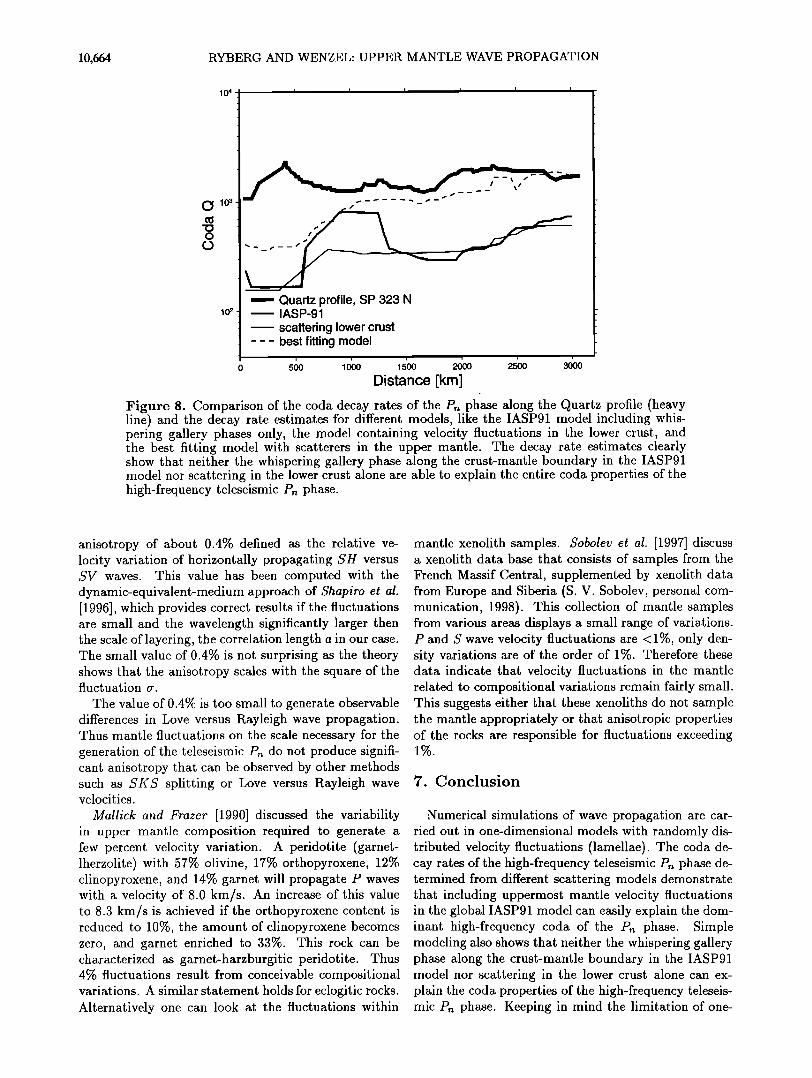
lower crust [Enderle et al., 1997]. Figure 8 presents the coda decay rate Q for the Quartz line (SP 323N), the best fitting upper mantle scattering model, the back- ground model without' any scatterers (but with the whispering gallery phase), and the lower crust scatter-
0 10 3
o
10 2
// ß I t-t
Quartz profile, SP 323 N ..... L = 20 kn•
L = 50 km
L=75km
5•0 10'00 15'00 20'00 25'00 30'00 Distance [km]
Figure 6. As for Figure 5 except that, the correlation length a - 2 km and the standard deviation of the heterogeneities rr - 5% are kept constant and the influence of the thickness of the scattering zone L on the coda generation is studied (dashed lines). Note that for L - 75 km the coda rate for the scattering P• phase is similar to the observations along the Quartz profile, although the effect is not very pronounced. For L _< 50 km it is not possible to compute decay rates at large distances because the P• phase seems to be have an undamped coda.

RYBERG AND WENZEL: UPPER MANTLE WAVE PROPAGATION 10,663
10 4
0 10 3
o
10 2
!
• I ß o ** " "' * ø - ø
Quartz profile, SP 323 N ..... o=2%
•=5%
•= 10%
o o'oo 'oo o'oo 3o'oo Distance [km]
Figure 7. As for Figure 5 except that, the thickness L - 75 km and the correlation length a - 2 km are kept constant and the influence of the standard deviation of the heterogeneities •r on the coda generation is studied (dashed lines). It is clearly visible that for •r - 5% the coda rate for the scattering P• phase is similar to the observations along the Quartz profile. Again,. for •r >10% it is not possible to compute decay rates because the P• phase seems to be have an undamped codaø
ing model. Neither the background model containing only whispering gallery phase nor the lower crust scat- tering model are able to explain the entire coda of the high-frequency teleseismic P•; of course, we can not ex- clude that they cause minor parts of the energy in the coda.
Finally, Figure 9 presents the vertical component record section of the best fitting scattering model. Again, a high-pass filter was applied to the synthetic data. The comparison with the corresponding record section recorded along Quartz (Figure 1) shows a sim- ilar behavior of the high-frequency teleseismic P• be- yond the distance of an uninterfered P• propagation of 1300 km. We stress that the existence of a P• phase and the properties of this phase are by no means trivial to understand. The seismograms prove that the ran- dom fluctuation of velocities around a mean value gen- erates a phase that propagates with an apparent veloc- ity lower than the average value. In other words, the random fluctuations with their low-velocity constituents act as a waveguide. The refracted phase, which dives through the mantle below the layered random lamel- lae, becomes visible as a first onset at a distance of 1300 km. This diving wave is characterized by low fre- quencies which can tunnel through the random high- velocity layers. As the high frequencies cannot tun- nel to the same extent, they necessarily contribute to the backscattered wavefield and thus sustain the high- frequency characteristics of the P• phase. An excep- tion is the slightly different group velocity of the syn- thetic high-frequency teleseismic P•. This is because
the background model (IASP91) represents a globally averaged model and should be adjusted to the local con- ditions beneath northern Eurasia. An adjustment of the group velocity of the high-frequency teleseismic P• by slightly changing the velocity of the background model will, of course, by no means influence the general behav- ior of this phase. A prominent difference between the two record sections is the presence of two strong phases traveling with apparent velocities of 5.8 and 6.5 km/s. These phases can be observed in the synthetics over great distances mainly because of the simple crustal structure of the IASP91 model. A more realistic crustal
structure as a base model would inhibit the propagation of these phases during modeling, especially at high fre- quencies.
All our estimates of the properties of the lamel- lae in the scattering zone are strongly correlated to the frequencies of the seismic waves used to analyze them. Thus seismic waves with dominant frequencies at about 5 Hz will probe the properties of the scat- terers only in a specific part of their spectrum in the spatial wavenumber domain. Additionally, the limi- tation to one-dimensional velocity structures instead of two-dimensional or even more realistically, three- dimensional velocity fluctuations probably gives a dis- torted image of the scatterers, so that their properties have to be replaced by their "true" three-dimensional values.
A stack of layers with thicknesses small compared to the wavelength makes the medium transverse aniso- tropic. Our best model is associated with transverse
10,664 RYBERG AND WENZEL: UPPER MANTLE WAVE PROPAGATION
104
O 103
o
102 ---- Quartz profile, SP 323 N
IASP-91
scattering lower crust best fitting model
o lO'OO liOO o'oo ioo o'oo Distance [km]
Figure 8. Comparison of the coda decay rates of the P• phase along the Quartz profile (heavy line) and the decay rate estimates for different models, like the IASP91 model including whis- pering gallery phases only, the model containing velocity fluctuations in the lower crust, and the best fitting model with scatterers in the upper mantle. The decay rate estimates clearly show that neither the whispering gallery phase along the crust-mantle boundary in the IASP91 model nor scattering in the lower crust alone are able to explain the entire coda properties of the high-frequency teleseismic P,• phase.
anisotropy of about 0.4% defined as the relative ve- locity variation of horizontally propagating •qH versus •qV waves. This value has been computed with the dynamic-equivalent-medium approach of Shapiro et al. [1996], which provides correct results if the fluctuations are small and the wavelength significantly larger then the scale of layering, the correlation length a in our case. The small value of 0.4% is not surprising as the theory shows that the anisotropy scales with the square of the fluctuation
The value of 0.4% is too small to generate observable differences in Love versus Rayleigh wave propagation. Thus mantle fluctuations on the scale necessary for the generation of the teleseismic Pn do not produce signifi- cant anisotropy that can be observed by other methods such as •qK•q splitting or Love versus Rayleigh wave velocities.
Mallick and Frazer [1990] discussed the variability in upper mantle composition required to generate a few percent velocity variation. A peridotire (garnet- lherzolite) with 57% olivine, 17% orthopyroxene, 12% clinopyroxene, and 14% garnet will propagate P waves with a velocity of 8.0 km/s. An increase of this value to 8.3 km/s is achieved if the orthopyroxene content is reduced to 10%, the amount of clinopyroxene becomes zero, and garnet enriched to 33%. This rock can be characterized as garnet-harzburgitic peridotire. Thus 4% fluctuations result from conceivable compositional variations. A similar statement holds for eclogitic rocks. Alternatively one can look at the fluctuations within
mantle xenolith samples. Sobolev et al. [1997] discuss a xenolith data base that consists of samples from the French Massif Central,-supplemented by xenolith data from Europe and Siberia (S. V. Sobolev, personal com- munication, 1998). This collection of mantle samples from various areas displays a small range of variations. P and $ wave velocity fluctuations are <1%, only den- sity variations are of the order of 1%. Therefore these data indicate that velocity fluctuations in the mantle related to compositional variations remain fairly small. This suggests either that these xenoliths do not sample the mantle appropriately or that anisotropic properties of the rocks are responsible for fluctuations exceeding 1%.
7. Conclusion
Numerical simulations of wave propagation are car- ried out in one-dimensional models with randomly dis- tributed velocity fluctuations (lamellae). The coda de- cay rates of the high-frequency teleseismic P,• phase de- termined from different'scattering models demonstrate that including uppermost mantle velocity fluctuations in the global IASP91 model can easily explain the dom- inant high-frequency coda of the P• phase. Simple modeling also shows that neither the whispering gallery phase along the crust-mantle boundary in the IASP91 model nor scattering in the lower crust alone can ex- plain the coda properties of the high-frequency teleseis- mic P• phase. Keeping in mind the limitation of one-

RYBERG AND WENgEL: UPPER MANTLE WAVE PROPAGATION 10,665
6O
5O
4O
30-
.•. 20 o
lO !
E o
-lO
-2o
-3o
-4o I ' I
1000 2000
Distance [km]
3000
Figure 9. High-pass-filtered (corner frequency f = 5 Hz) vertical component synthetic record section for one of our best fitting model (see Figure 3b) with scatterers in the upper mantle. Note the similar behavior of the high-frequency teleseismic P, (marked by an arrow) in the corresponding record section recorded along Quartz and Ruby-I profiles (Figure 1), except for the slightly different group velocity and its coherency. For display purposes only, the two quasi- Pa phases have been partially muted for small distances. Some low-amplitude numerical phases arriving earlier than the phases from the mantle transition are visible. Similar to the Quartz data, there is almost no energy corresponding to the mantle triplications.
dimensional velocity models, the best fit to the simu- lated high-frequency teleseismic P• coda was obtained for a model containing a scattering zone below the Moho of 75 km thickness, with lamellae of 2 km average thick- ness and a RMS velocity perturbation of 5%. These models will reflect real Earth properties if the lateral extent of the velocity fluctuations (lamellae) are in the range of several Fresnel zones. The relatively high value for the velocity fluctuation of about 5% in the mantle lithosphere is in agreement with hypothesized petrolog- ical models of the upper mantle; it disagrees, however, with findings from xenolith data.
There are several options to modify the value of 5% fluctuations: uncorrelated P and S wave velocity fluctu- ations, intrinsic attenuation, and two and three dimen- sionality of the scatterers. Exploration of these possi- bilities will be a topic of future work.
Acknowledgments. We appreciate critical remarks on this manuscript from M. Hellweg and J. Mechie. For the first author this research was supported by the Deutscher Akademischer Austauschdienst (DAAD, Germany). The digital data for the Quartz profile were generously made available by the GEON/Russian Geological Committee with- in the EUROPROBE cooperation agreement. The Ministry of Research and Technology of Germany (BMFT) supported the digitization of the PNE data at GEON. The numerical calculations of the synthetic seismograms were carried out on the C3820 of the GeoForschungsZentrum, Potsdam.
References
Aki, K., and B. Chouet, Origin of coda waves: sources, at- tenuation, and scattering effects, J. Geophys. Res., 80, 3.322-3.342, 1975.
Brandsd6ttir, B., and W. H. Menke, Measurements of coda buildup and decay rates of western Pacific P, Po, and So

10,666 RYBERG AND WENZEL: UPPER MANTLE WAVE PROPAGATION
phases and their relevance to lithospheric scattering, J. Geophys. Res., 9,9, 10.541-10.559, 1988.
Egorkin, A. V., and N.M. Chernyshov, Peculiarities of man- tle waves from long-range profiles, J. Geophys., 5J, 30-34, 1983.
Egorkin, A. V., and A. V. Mikhaltsev, The result of seis- mic investigations along geotraverses, in Super-Deep Con- tinental Drilling and Deep Geophysical Sounding, edited by K. Fuchs et al., pp. 111-119, Springer Verlag, New York, 1990.
Egorkin, A. V., and N. I. Pavlenkova, Studies of mantle structure of U.S.S.R. territory on long-range seismic pro- files, Phys. Earth Planet. Inter., 25, 12-26, 1981.
Egorkin, A. V., S. K. Zuganov, N. I. Pavlenkova, and N.M. Chernyshov, Results of lithospheric studies from long-range profiles in Siberia, Tectonophysics, 1gO, 29- 47, 1987.
Enderle, U., M. Tittgemeyer, M. Itzin, C. Prodehl, and K. Fuchs, Scales of structure in the lithosphere - Images of processes, Tectonophysics, 275, 165-198, 1997.
Fuchs, K., and G. Mfiller, Computation of synthetic seismo- grams with the reflectivity method and comparison with observations, Geophys.. J. R. Astron. Soc., 2,9, 417-433, 1971.
Gettrust, J. F., and L. N. Frazer, A computer model study of the propagation of long-range Pn phase, Geophys. Res. Lett., 8,749-752, 1981.
Kennett, B. L. N., and E. R. Engdahl, Traveltimes for global earthquake location and phase identification, Geophys. J. Int., 105,429-465, 1991.
Linehan, D., Earthquakes in the West Indian region, EOS Trans. Am. Geophys. Union, 21,229-232, 1940.
Mallick, S., and L. N. Frazer, Po/So synthetics for a variety of oceanic models and their implications for the structure of the oceanic lithosphere, Geophys. J. Int., 100,235-253, 1990.
Mantovani, E., F. Schwab, H. Liao, and L. Knopoff, Tele- seismic Sn: A guided wave in the mantle, Geophys. J. R. A stroh. SOC., 51, 709-726, 1977.
Mechie, J., A. V. Egorkin, K. Fuchs, T. Ryberg, L. Solodilov, and F. Wenzel, p-wave mantle velocity structure beneath northern Eurasia from long-range recordings along the profile Quartz, Phys. Earth Planet. Inter., 79, 269-286, 1993.
Menke, W. H., and R. Chen, Numerical studies of the coda falloff rate of multiply-scattered waves in randomly lay- ered media, Bull. Seisrnol. Soc. Am., 7d, 1.605-1.621, 1984.
Menke, W. H., and P. G. Richards, Crust-mantle whisper- ing gallery phases: A deterministic model of teleseismic P• wave propagation, J. Geophys. Res., 85, 5.416-5.422, 1980.
Menke, W. H., and P. G. Richards, The horizontal propaga- tion of P waves through scattering media: Analog model studies relevant to long range P• propagation, Bull. Seis- rnol. Soc. Am., 73, 125-142, 1983.
Molnar, P., and J. Oliver, Lateral variations of attenuation in the upper mantle and discontinuities in the lithosphere, J. Geophys. Res., 7d, 2.648-2.682, 1969.
O'Doherty, R. F., and N. A. Anstey, Reflections on ampli- tudes, Geophys. Prospect., 19,430-458, 1971.
Pavlenkova, N. I., and A. V. Egorkin, Upper mantle hetero- geneity in northern part of Eurasia, Phys. Earth Planet. Inter., 33,180-193, 1983.
Richards, P. G., and W. H. Menke, The apparent attenua- tion of a scattering medium, Bull. Seisrnol. Soc. Am., 73, 1.005-1.021, 1983.
Ryberg, T., K. Fuchs, A. V. Egorkin, and L. Solodilov, Ob- servation of high-frequency teleseismic P• waves on the long-range Quartz profile across northern Eurasia, J. Geo- phys. Res., 100, 18.151-18.163, 1995.
Ryberg, T., F. Wenzel, J. Mechie, A. V. Egorkin, K. Fuchs, and L. Solodilov, 2d-velocity structure beneath northern Eurasia derived from the super long-range seismic profile Quartz, Bull. Seisrnol. Soc. Am., 86,857-867, 1996.
Sereno, T. J., and J. A. Orcutt, Synthesis of realistic oceanic P• wave trains, J. Geophys. Res., 90, 12.755-12.776, 1985.
Sereno, T. J., and J. A. Orcutt, Synthetic Pn and S• phases and the frequency dependence of Q of oceanic lithosphere, J. Geophys. Res., 92, 3.541-3.566, 1987.
Shapiro, S. A., P. Hubral, and B. Ursin, Refiectiv- ity/transmissivity for one-dimensional inhomogeneous random elastic media: Dynamic-equivalent-medium ap- proach, Geophys. J. Int., 126,184-196, 1996.
Sobolev, S. V., H. Zeyen, M. Granet, U. Achauer, C. Bauer, Fo Werling, R. Altherr, and K. Fuchs, Upper mantle tem- peratures and lithosphere-asthenosphere system beneath the French Massif Central constrained by seismic, grav- ity, petrologic and thermal observations, Tectonophysics, 275, 143-164, 1997.
Stephens, C., and B. L. Isacks, Toward an understanding of S•: Normal modes of Love waves in an oceanic structure, Bull. Seisrnol. Soc. Am., 67, 69-78, 1977.
Sutton• G. H., and D. A. Walker, Oceanic mantle phases recorded on seismographs in the northwestern Pacific at distances between 7 ø and 40 ø, Bull. Seisrnol. Soc. Am., 62,631-655, 1972.
Thybo, H., and E. Perchuc, The seismic 8 ø discontinuity and partial melting in continental mantle, Science, 275, 1.626-1.629, 1997.
Tittgemeyer, M., F. Wenzel, K. Fuchs, and T. Ryberg, Wave propagation in a multiple-scattering upper mantle - Ob- servations and modelling, Geophys. J. Int., 127,492-502, 1996.
Walker, D. A., High-frequency P• and S• phases recorded in the western Pacific, J. Geophys. Res., 82, 3.350-3.360, 1977.
T. Ryberg, GeoForschungsZentrum, Telegrafenberg, 14473 Potsdam, Germany. ([email protected])
F. Wenzel, Geophysical Institute University Karls- ruhe, Hertz Str. 16, 76187 Karlsruhe, Germany. ([email protected]).
(Received June 1, 1998; revised January 22, 1999; accepted February 16, 1999.)