Helping End Users Understand the Health of Distributed ...
12
The Doctor Is In: Helping End Users Understand the Health of Distributed Systems Paul Dourish ? , Daniel C. Swinehart, and Marvin Theimer ?? Xerox Palo Alto Research Center 3333 Coyote Hill Road, Palo Alto, CA 94304 Email: [email protected] Abstract. Users need know nothing of the internals of distributed ap- plications that are performing well. However, when performance flags or fails, a depiction of system behavior from the user’s point of view can be invaluable. We describe a robust architecture and a suite of presentation and visualization tools that give users a clearer view of what is going on. Keywords: distributed systems, visualization, diagnostics, management. 1 Introduction Ideally, users should not have to concern themselves with the internal workings of an application. But most modern personal computer applications are composed from distributed networks of computation, many systems working together to cause the effects the user sees. As complexity and geographic scope increase, it becomes increasingly difficult to answer the questions: “What’s happening here?” and “What should or can I do in response?” Current systems typically try to mask faults and performance slowdowns, but leave the user hanging helplessly when they do not fully succeed. System administrators possess all manner of tools to reveal the behavior of hardware and software systems. The information these tools present is gener- ally focused on the individual components of the system (disks, servers, routers, processes, etc.), and on measures that evaluate the overall health of the environ- ment, rather than end-to-end user applications, distributed services, and the like. Moreover, the information provided by these tools is typically detailed technical information, such as dropped packet counts, throughput characteristics, CPU load and so forth. We believe that the behavioral information that these tools measure could be of considerable value to end users as well. If presented in a focused context and in a way users can comprehend, such information can go far in distributed settings to explain the relationship between system action and the user’s immediate tasks. ? Current affiliation: Dept Information and Computer Science, University of California Irvine, Irvine, CA 92697. Email: [email protected] ?? Current affiliation: Microsoft Research, One Microsoft Way, Redmond WA 98052. Email: [email protected]
-
Upload
khangminh22 -
Category
Documents
-
view
3 -
download
0
Transcript of Helping End Users Understand the Health of Distributed ...

The Doctor Is In: Helping End UsersUnderstand the Health of Distributed Systems
Paul Dourish?, Daniel C. Swinehart, and Marvin Theimer??
Xerox Palo Alto Research Center3333 Coyote Hill Road, Palo Alto, CA 94304
Email: [email protected]
Abstract. Users need know nothing of the internals of distributed ap-plications that are performing well. However, when performance flags orfails, a depiction of system behavior from the user’s point of view can beinvaluable. We describe a robust architecture and a suite of presentationand visualization tools that give users a clearer view of what is going on.Keywords: distributed systems, visualization, diagnostics, management.
1 Introduction
Ideally, users should not have to concern themselves with the internal workings ofan application. But most modern personal computer applications are composedfrom distributed networks of computation, many systems working together tocause the effects the user sees. As complexity and geographic scope increase, itbecomes increasingly difficult to answer the questions: “What’s happening here?”and “What should or can I do in response?” Current systems typically try tomask faults and performance slowdowns, but leave the user hanging helplesslywhen they do not fully succeed.
System administrators possess all manner of tools to reveal the behavior ofhardware and software systems. The information these tools present is gener-ally focused on the individual components of the system (disks, servers, routers,processes, etc.), and on measures that evaluate the overall health of the environ-ment, rather than end-to-end user applications, distributed services, and the like.Moreover, the information provided by these tools is typically detailed technicalinformation, such as dropped packet counts, throughput characteristics, CPUload and so forth. We believe that the behavioral information that these toolsmeasure could be of considerable value to end users as well. If presented in afocused context and in a way users can comprehend, such information can gofar in distributed settings to explain the relationship between system action andthe user’s immediate tasks.? Current affiliation: Dept Information and Computer Science, University of California
Irvine, Irvine, CA 92697. Email: [email protected]?? Current affiliation: Microsoft Research, One Microsoft Way, Redmond WA 98052.
Email: [email protected]

Consider a commonplace example: ordering books online from home. At somepoint, the process abruptly stops cold. What caused the failure? The local ma-chine, the modem, the phone line, the ISP or backbone router, or the vendor’sserver? How can an end user understand enough of what is going on to make aninformed decision about how to proceed or which customer support line to call?(Depending on the nature of a problem, system administrators may be eitherunaware of it or unconcerned about the severity of an isolated anomaly, unlessalerted by a well-informed user.)
Although particularly noticeable, failures are not necessarily the most valu-able behaviors to unravel for users. In particular, properly-functioning but over-loaded systems can mimic actual failures, but the most appropriate user response(wait out the rendering of a web page, select a less loaded printer or file mirrorsite, or simply come back later) is entirely different. If accurate completion es-timates can be obtained, a user can make even better decisions. In other words,it is lamentable but true that users continually need to understand system be-havior and adjust their own activity to match it. How can we develop systemsand tools that can supply these kinds of insights to end users?
This is the question we have addressed in our “Systems Health” project.Its goal is to create an infrastructure for collecting, processing, distributing andpresenting to end users information about the ongoing “health” of individual dis-tributed applications: their current status, their overall performance, historicalpatterns of activity, and their likely future state.
This goal presents a number of challenges. Traditional monitoring tools show“vertical” slices through the system, showing one component in considerabledetail and “drilling down” to see more specifics. They collect information thatboth notifies administrators of an individual problem and provides them withenough information to solve it.
Our concerns are somewhat different. End users need specific, relevant, con-textualized information about the components they are actually using and howthese components combine to accomplish their tasks. As we have discussed, theremay not actually be a “problem” to be solved; the goal may instead be simplyto assess the system’s state, providing the user with options. For example, a useris likely to be more interested in locating an alternate functioning printer thanin knowing how to restore a failed printer to operation.
Making sense of the current state of a system often requires access to histor-ical information. Often, the only way to adequately assess some information isin terms of its variations over time.
In a distributed application, the needed information does not reside in oneplace. To characterize the behavior of a user’s ”job” may require gathering re-mote server performance information, end-to-end network congestion informa-tion, and data about local workstation activities, then presenting the informationin a form that does not directly match the system’s actual structure.
The last thing a user needs is diagnostic tools whose robustness is inferior tothe systems they are evaluating. Since many health components will of necessityoperate on the same equipment as the observed systems, It is critical that these

components operate with minimal impact on the underlying applications, thatthey fail significantly less often, and that they continue to operate even whenmajor parts of the system have failed.
In summary, our system must possess a number of characteristics:
1. User-centered. Our primary concern is to give information relevant to theneeds of a system’s end users and expressed in terms they understand.
2. End-to-end. Most real work tasks involve a variety of components throughoutthe system. We must describe all those components acting in concert.
3. Adjustable. Users need ways to take different routes through this information,and the system must respond to changes in user concerns. Gathering theneeded data should be an automatic consequence of user interest.
4. Historical. Since some situations can only be understood in context, we needto be able to provide information about the past as well as the present.
5. Robust. The system is intended to help users understand problems that maydisturb their work. It is critical that those problems do not also interferewith the functioning of the health system. We refer to this criterion as “faillast/fail least”; it drives a considerable amount of our design.
2 Related work
Software tools to monitor system and application behavior developed in a ratherad hoc fashion, as commands to extract information collected by the modulesthat make up a software system. The introduction of the “/proc” virtual filesys-tem in Eighth Edition UNIX [8] was an early attempt to systematize access toactive system information.
SNMP, the Simple Network Management Protocol, introduced a coherentmechanism for structuring and accessing management information across a net-work [13]. SNMP tools remotely query and control hierarchical stores of manage-ment information (Management Information Bases, or MIBs). SNMP underliesmany integrated tools for distributed system monitoring and management, suchas Unicenter [2]; recent enhancements extend to the inner workings of host sys-tems, services and processes. Similar mechanisms, now operating under the um-brella of the Desktop Management Task Force [3] include Web-Based EnterpriseManagement, the Desktop Management Interface, and Windows ManagementInstrumentation. Simpler, if less ambitious, freeware or shareware systems in-clude Big Brother [9] and Pulsar [5], designed to monitor an enterprise andinform administrators of problematic conditions. NetMedic [7] does cater to theend user, using passive analysis of Internet traffic to provide explanations forsome performance mysteries of Web browsing.
Planet MBone [10] is a research effort to provide visualizations of diagnosticinformation, simplifying understanding of the Internet’s multicast infrastructure.Similarly, software visualization (e.g. [14]) and algorithm animation [1] proto-types apply graphical techniques to provide diagnostic views of the structureand behavior of software systems.

Dourish [4] has argued the value of visualizations as an aspect of normal in-teraction with software systems, to provide “accounts” of their operation similarto the physical embodiments of everyday objects. Here, a view into a program’sbehavior is not provided for debugging, but rather to support the ongoing man-agement of user activity. One implication of this perspective is that a system’saccount of its current behavior should meaningfully reflect the user’s tasks ratherthe system’s structure, echoing our end-to-end “horizontal slice” approach.
3 Architecture
Our health system must satisfy both the interactional needs of the system andthe need to provide explanations to end-users. The architecture we have designedto meet these requirements is three-tiered. At the top, a variety of health appli-cations both collect and display information about the system’s health. In themiddle is the Health Blackboard System, the abstract model to which applica-tions are written; the blackboard is in turn supported by the Health Repository,a storage layer tailored to our specific needs.
3.1 Health Blackboard System
Our architecture begins with a relatively conventional agent/database approach.A common information store, the blackboard, acts as an indirect, persistent com-munication channel among any number of individual processing elements, oragents. Agents produce or consume information by writing to or reading fromthe blackboard. Our architecture (Fig. 1) is built around three different sorts ofagents: gatherers, hunters and transducers.
hunterBlackboardgatherer
Fig. 1. Hunter and gatherer processes add, remove health data from a blackboard
Gatherer agents are responsible for gathering different pieces of informationfrom the distributed environment and keeping it up-to-date, by adding or re-placing items on the blackboard. Running on or near the computers where the

information is generated, gatherers enter onto the blackboard information froma variety of sources: SNMP interfaces, application management interfaces, orsystem-specific performance queries, allowing the remainder of the system to beindependent of the precise collection mechanisms. Proxy gatherers can be de-ployed to gather data, using other protocols, from hosts that are not able tofully participate in our architecture, and record the results in the blackboard.
Hunters are the components within presentation applications by which in-formation flows out of the system again. Hunter agents consult the blackboardfor health information to process and present in some sort of visualization to auser. They function either by searching explicitly for the desired information orby scheduling notification events for new information matching their interests.
Transducers act both as hunters and as gatherers. A transducer is createdto process or summarize raw data into items of greater value to the user. Itextracts relevant items from the blackboard, adding new items representing thehigher-level account of the system’s behavior.
Permanently deployed gatherers monitor specific system components on eachparticipating host, in order to maintain a historical record of base level perfor-mance information. Most, however, are created when the information they gatheris needed. When a hunter asks for information about, say, a particular serverload, a Gatherer Factory process on the server host creates a gatherer for thatinformation; the hunter either waits for the first results or schedules future no-tifications. The blackboard will request the removal of a non-persistent gathererwhen there is no longer any hunter interested in that information.
Thus, health data enters the system via gatherers, flows via the blackboardthrough some number of transducers before playing a part in the reports of oneor more hunters. (Data representing the load on a network link might be used togenerate reports for the many applications that make use of that particular link.)Multiple timestamped items may be inserted concerning the same measuredquantity in order to produce a historical record, where needed. Throughout theprocess, the blackboard controls the dynamics of the system, presents a uniformmodel for the collection and management of health information, and connectsinformation providers with information seekers.
Our blackboard is implemented as a tuple-space, not unlike that providedby the widely available JavaSpaces [6]. For consistent interoperation betweenhunters and gatherers, we employ a conventional structure for tuples. Each dataobject is accompanied by the host, system, subsystem and component that gen-erated it, a timestamp, a name and optional parameters. The data can be anyserializable Java object, permitting the system to store and manage informationfrom a wide range of sources, information whose form may change over time.
As a simple example, consider a hunter that maintains a server’s load averagegraph. The hunter initially indicates its interest in this information by puttingonto the blackboard a request tuple of the form <server1, system, cpu, *,load, *>, thus registering its interest. Any matching tuple is delivered imme-diately to the hunter; otherwise, the blackboard directs the GathererFactoryon server1 to create a new instance of the LoadGatherer class which is regis-

tered as a supplier of cpu load data. The new gatherer periodically adds serverload records to the blackboard, generating events that will waken any waitinghunters, including the original one, which now can extract the load informationand present it to the user. If the LoadGatherer instance cannot directly generatethe information, it may serve as a transducer, recursively extracting additionalblackboard tuples to produce its result. Should this hunter go away or becomeunreachable, the blackboard will delete the pattern record. Periodically, anotherprocess garbage-collects gatherers whose information is no longer needed.
This example highlights several aspects of our approach. The blackboard sep-arates the collection of information (gatherers) from the routing of informationto interested processes (hunters). This indirection allows us to interpose otheragents that process low-level records into higher-level information by combininginformation on the blackboard. It also allows us to limit the network traffic andprocessor load involved in collecting and collating information. Finally, healthsystem components persist in the system only while they are needed.
We have stated that historical information is often of considerable importancein understanding the state of a system. Retaining data records for extended pe-riods can provide the same vital function that conventional system logs achieve,with the added advantage that the resulting tuples can be organized throughvarious structured queries. In our current prototype, historical records can beretained by adding multiple timestamped tuples matching the same search spec-ification to the blackboard. Further, through an extensible “hints” mechanism,clients can specify degrees of liveness of the information they require, “time tolive” hints for information that is added, and so forth. While this does not yetaddress all the historical requirements, it provides enough flexibility to allowbasic management of the temporality of near-live data.
3.2 Health Repository
Although the Blackboard abstraction can be supported by very simple, central-ized, in-memory information stores, our robustness requirements create addi-tional criteria for a storage layer. First, health information must be availablewith low overhead. Since not only error states but also ongoing performanceinformation must be presented to the user on a continuing basis, we must avoidserver bottlenecks and the overhead of synchronous network requests to fetchand store data. Second, the health system must not itself appear to fail as aconsequence of other problems. For example, in the case of a network partition,the system must continue to function as best it can. Third, logging requirementsargue for storage of diagnostic information beyond the capacities of individualworkstations or application servers. Finally, health reports from a large enter-prise could overwhelm a centralized server.
These criteria suggest the use of a replicated data store. By storing health in-formation in persistent, replicated repositories, gatherers may collect and reporttheir findings to local replicas, confident that the data will eventually reach thosethat need it, even in the face of network congestion or partitioning. Similarly,hunters can report the latest information they were able to receive; they can use

discontinuities in timestamps to identify the approximate point of failure alonga broken network path. We can present the appearance of a system with verylow probability of total failure.
But a fully replicated store will also not scale. This argues for partial repli-cation, where information is replicated only where needed, according to the pat-terns of information requests. Ideally, local replicas should be readily availableboth to the gatherers that create the information and to the hunters that useit. Furthermore, for information that is of longer term value, long-lived replicasshould be retained by servers charged with maintaining historical data. Addi-tional replicas can be designated for further protection against information loss.This approach implies that some amount of data inconsistency can be tolerated,if necessary, in order to keep functioning. For system health information, we needdata to be accurate when possible, but slightly out of date information is betterthan none and can be tolerated when the latest values are unavailable.
Based on these considerations, we chose to adapt the Bayou system [17] asour repository layer. Bayou is a weakly-consistent replicated database, developedoriginally to support ubiquitous computing environments, where mobile devicesroutinely experience unpredictable connectivity. Bayou provides mechanisms fordealing with network disconnection and carrying on processing, including sessionguarantees (customizable degrees of consistency management) and mergeprocs(application specific code to resolve conflicts after reconnection) [16].
Bayou’s replication supports our requirements for high availability. Its weakconsistency adequately supports continued operation in the face of temporaryfailures and network partitions. However, its fully general algorithm for resolv-ing update conflicts is more heavyweight than we need. Health information hasspecific dynamic patterns of information generation and modification, which wecan exploit in designing a replication update scheme. We developed a variant ofthe original implementation, enhanced for rapid (sub-second) dissemination ofupdates to all replicas, to underlie our blackboard abstraction.
3.3 Infrastructure Implementation
We have built both sorts of gatherers. Simple permanent gatherers use systemtools such as SNMP probes or such as the Unix commands vmstat, iostat, netstator ps to extract host-level statistics. More sophisticated ones address commonconcerns. For instance, we use a version of the Unix df command, modified toreport information about NFS connections with gingerly probes that do notcause an NFS wait if a server is dead. We have also built very specific gatherers,launched as needed to monitor locally produced applications, such as a largeinfrastructure for managing scanned documents.
The Health System is written almost entirely in Java. Added to the approx-imately 12000 lines of Java code, a few thousand lines of C is used in dataextractors. The system employs both a basic centralized repository for testingpurposes, and our Bayou-based replicated repository. The Bayou port, writtenin java, uses MySQL as its relational database component. A designed approachto partial replication awaits implementation.

4 A Web-Based Approach: Checkup
We turn now to a description of the most extensive application we have devel-oped to demonstrate the health architecture, a web application called Checkup.Checkup provides a coherent interface to a wide range of information, replacingthe bag of complex software tools that a user might employ on different platformsto determine what is going on.
Figure 2 excerpts snippets from four dynamically-generated Checkup pages1,beginning with the root page for the host AlicesHost, then progressing throughthe (bold-faced) links to additional views. The root page (Fig. 2, panel 1) is atop-level view of that host’s overall state, wrapping the output of such standardUnix performance tools as pstat, vmstat, and fs into HTML presentations. Thispage includes links that, when invoked dynamically, produce more detailed per-formance analyses. For instance, following the ”mounted file server” links willdynamically create root pages for those related hosts. Similarly, clicking a ”per-process” link creates the page of (Fig. 2, panel 2), a table listing attributes ofall running processes sorted into a user-specified order. A link from each processyields a detailed account of that process’s performance and resource use: names,open local and remote files, and open network connections (not shown). Finally,one can invoke a net path analysis tool (Fig. 2, panel 3), by clicking on one ofthe open connections. This tool encapsulates many behavioral parameters thatthe user would otherwise need to supply by hand, then combines the resultsfrom both hosts into a presentation that is far more comprehensible than directoperation of the underlying UNIX tool.
This approach has several advantages over previous tools. The use of HTMLhyperlinks to annotate the output of standard monitoring commands means thatthe Web pages define a space of information with a high degree of branching,encouraging the user to explore specific features of interest, rather than buildingup a general picture. The path that a user follows to a particular leaf nodecan contextualize the way in which the tool appearing there is used. Finally, aserendipitous advantage is that Checkup pages can readily be created with linksto other web-based diagnostic, monitoring, and repair tools, extending the scopeof the system with little effort.
4.1 Checkup Implementation
Checkup (see Fig. 3) is based on Java servlets, server-based objects that cre-ate Checkup pages on demand as links are followed, through the auspices of amechanism similar to Java Server Pages [15]. To the Health Blackboard, servletsare hunters, collecting information from the blackboard to be reported back tothe user. As usual, these hunter requests lead to the on-demand launch of thenecessary gatherer agents, whose results are posted to satisfy the user requests.The implementation includes mechanisms for retaining (for a brief time within a
1 Full-resolution color versions of all user examples are available athttp://www.parc.xerox.com/csl/projects/systemhealth/md/examples.

Fig. 2. A sequence of Checkup web pages, generated by servlet hunters.
session) time-consuming computations, such as the top-level attributes of all ofa host’s processes. Servlets that create related pages can use such cached infor-mation to increase responsiveness. Some pages, such as the one depicted in Fig.2 panel 3, issue multiple requests for information provided by multiple hosts.
Servlets annotate their web pages with dynamically computed informationand with hyperlinks to more detailed analyses. For example, the root page servletchecks what other systems a host depends on for its file service, and for each,either indicates that the corresponding server is not running or provides a linkto the root page for that server.
Web browsers
Checkup Blackboard
hunterservlets
Fig. 3. Checkup is a servlet-based Health application for standard Web browsers
4.2 Application Helpers
We can use the same infrastructure both to evaluate and inform a specific ap-plication, by linking the application to the health system via a small “HealthHelper” program.
As an example, we have built a Health-enabled variant of emacs, a text editoravailable on many platforms. We chose emacs because it is widely used, depen-

dent on many components in the environment, and highly customizable throughprovided APIs. When emacs is started, a small “emacs helper” is also startedto provide bidirectional communications between emacs and the blackboard.Acting as a gatherer, this program posts specific performance information, in-cluding details of memory and CPU usage that other applications can use tohelp them coexist with this large, cycle-hungry application. Acting as a hunter,the helper can supply emacs with information that can improve its robustness.For example, emacs can divert an attempt to download library code from anunresponsive server to one that is available; similarly, emacs can determine thatthere is insufficient room to save the next version in the current location, in timeto prevent an attempt that could result in failure or lost work.
A Checkup page could be created to present to the user the detailed emacsperformance information provided by the helper program. Thus, users do nothave to learn a new application to monitor this application, but can use methodsthey are already familiar with.
5 Visualizing System State
Finally, we have been exploring the presentation of system health informationthrough visualization tools. Visualization enables the movement of activity fromthe cognitive system to the perceptual system [11], making patterns and corre-lations in the blackboard data directly perceptible. Visualization through ani-mation of system data [12] directly supports our intuition that patterns of sig-nificance to the user occur all the time, not only in the face of failure. Since weassert that systems health depends both on individual components and on theinteractions and relationships between them, we believe a successful approachwill convey these relationships as well as the more objective data. Further, weseek a presentation that minimizes the technical knowledge required to interpretit, which argues for a perceptual rather than a cognitive approach.
We have prototyped a series of simple visualizations. The Ping Radar visu-alizes the performance of a network, as seen from a particular host. In Fig. 4,columns represent hosts. Rows are snapshots at successive instants. The color ofa cell estimates a round trip time to that host. The radar ”beam” replaces rowscyclically at fixed intervals, giving us a picture of recent activity. Over time,patterns reveal the reliability of each connection, periods of network downtime,etc. We can see that one host appears to be down (black column), that hosts onthe left are closer to us than those on the right, and that network response todistant hosts is quite variable.
Similarly, we built a Process Map that depicts the processes on a single host,using the position and color of data boxes to represent the memory each hasconsumed, their run times, and their current states. Readily perceived sepa-rations emerge between temporary small processes (simple commands), long-running processes (servers) and anomalous processes (runaway computations).These tools are blackboard clients, permitting exploration of different ways toorganize and visualize relevant information.
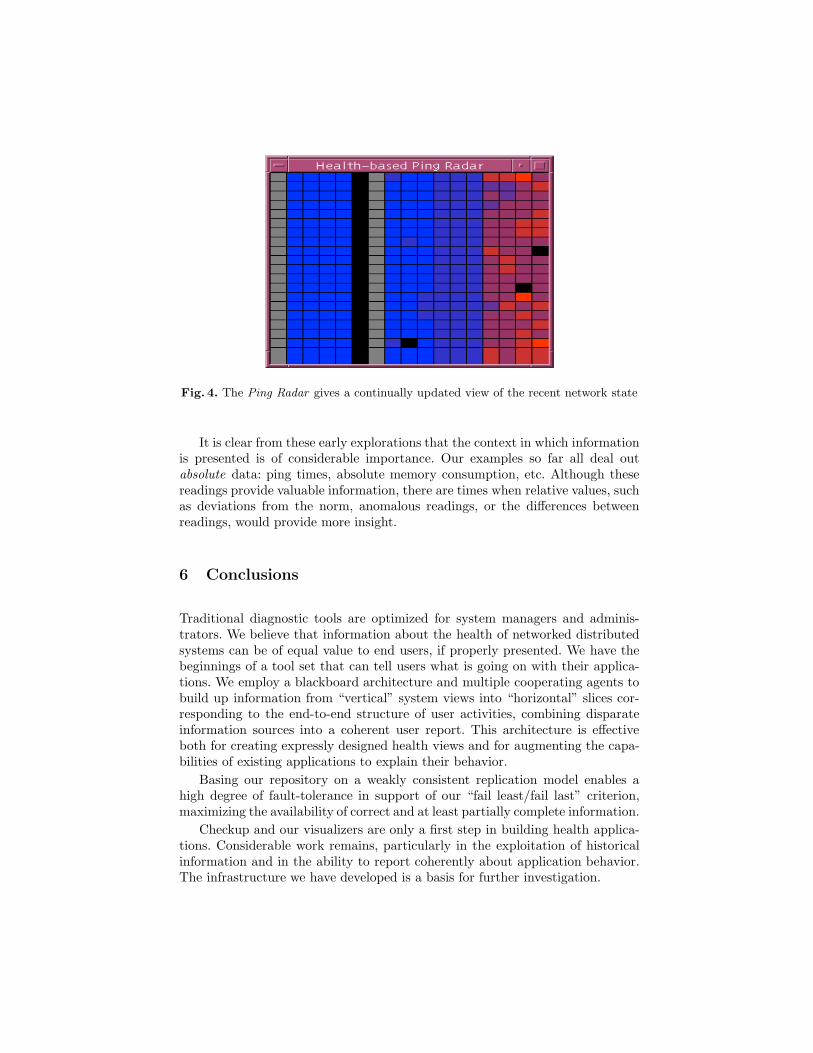
Fig. 4. The Ping Radar gives a continually updated view of the recent network state
It is clear from these early explorations that the context in which informationis presented is of considerable importance. Our examples so far all deal outabsolute data: ping times, absolute memory consumption, etc. Although thesereadings provide valuable information, there are times when relative values, suchas deviations from the norm, anomalous readings, or the differences betweenreadings, would provide more insight.
6 Conclusions
Traditional diagnostic tools are optimized for system managers and adminis-trators. We believe that information about the health of networked distributedsystems can be of equal value to end users, if properly presented. We have thebeginnings of a tool set that can tell users what is going on with their applica-tions. We employ a blackboard architecture and multiple cooperating agents tobuild up information from “vertical” system views into “horizontal” slices cor-responding to the end-to-end structure of user activities, combining disparateinformation sources into a coherent user report. This architecture is effectiveboth for creating expressly designed health views and for augmenting the capa-bilities of existing applications to explain their behavior.
Basing our repository on a weakly consistent replication model enables ahigh degree of fault-tolerance in support of our “fail least/fail last” criterion,maximizing the availability of correct and at least partially complete information.
Checkup and our visualizers are only a first step in building health applica-tions. Considerable work remains, particularly in the exploitation of historicalinformation and in the ability to report coherently about application behavior.The infrastructure we have developed is a basis for further investigation.
7 Acknowledgments
Mark Spiteri and Karin Petersen built the Bayou-based blackboard repository.We would like to thank Anthony Joseph, Ron Frederick, and Bill Fenner for theiradvice and assistance, and the reviewers for many useful insights.
References
1. Brown, M. and Najork, M.: Algorithm Animation using 3D Interactive Graphics.Proc. Sixth ACM Symp. User Interface Software and Tech. Atlanta (1993) 93-100
2. Unicenter TNG Product Description. Computer Associates International, Inc., Is-landia, NY 11788 (1998) URL: http://www.cai.com/products/unicenter
3. Distributed Management Task Force (2000) URL: http://www.dmtf.org/4. Dourish, P.: Accounting for System Behaviour: Representation, Reflection and Re-
sourceful Actions. In Kyng and Mattiassen (eds), Computers and Design in Con-text, Cambridge: MIT Press (1997)
5. Finkel, R.: Pulsar: An Extensible Tool for Monitoring Large UNIX Sites. SoftwarePractice and Experience, 27(10) (1997) 1163-1176
6. Freeman, E., Hupfer, S., and Arnold, K.:JavaSpaces Principles, Patterns, and Prac-tice. Addison-Wesley, Reading MA 01867 (1999) 344 pp. ISBN 0-201-30955-6
7. Net.Medic: Your Remedy for Poor Online Performance. Lucent Network Care,Sunnyvale, CA 94089, (2000)URL: http://www.lucent-networkcare.com/software/medic/datasheet/
8. Killian, T.: Processes as Files. Proc. USENIX Summer Conf. Salt Lake City (1984)203-207
9. Big Brother: Monitoring and Notification for Systems and Networks. The Mac-Lawran Group., Montreal (1998) URL: http://maclawran.ca
10. Munzer, T., Hoffman, E., Claffy, K., and Fenner, B.: Visualizing the Global Topol-ogy of the MBone. Proc. IEEE Symp. Info. Vis. San Francisco (1996) 85-92
11. Robertson, G., Card, S., and Mackinlay, J.: The Cognitive Coprocessor Archi-tecture for Interactive User Interfaces. Proc. ACM SIGGRAPH Symp. on UserInterface Software and Tech (1989) 10-18
12. Robertson, G., Card, S., and Mackinlay, J.: Information Visualization using 3DInteractive Animation. Comm. ACM, 36(4), (1993) 56-71
13. Schoffstall, M., Fedor, M., Davin, J., and Case, J. A.: Simple Network ManagementProtocol. RFC 1098, SRI Network Info. Ctr., Menlo Park (1989)
14. Stasko, J., Domingue, J., Brown, M. and Price, B.: Software Visualization: Pro-gramming as a Multimedia Experience. Cambridge MA MIT Press (1998)
15. Java Server Pages Technical Specification. Sun Microsystems, Palo Alto, CA (2000)URL:http://www.javasoft.com/products/jsp/
16. Terry, D., Demers, A., Petersen, K., Spreitzer, M., Theimer, M. and Welch, B.:Session Guarantees for Weakly Consistent Replicated Data. Proc. IEEE Intl. Conf.Parallel and Distributed Info. Syst. Austin (1994) 140-149
17. Terry, D., Theimer, M., Petersen, K., Demers, A., Spreitzer, M., and Hauser, C.:Managing Update Conflicts in Bayou, a Weakly Connected Replicated StorageSystem. Proc. ACM Symp. on Oper. Syst. Principles (1995) 172-182