Heineken N.V. Annual Report 2020
179
Heineken N.V. Annual Report 2020
-
Upload
khangminh22 -
Category
Documents
-
view
1 -
download
0
Transcript of Heineken N.V. Annual Report 2020

Heineken N.V. Annual Report 2020
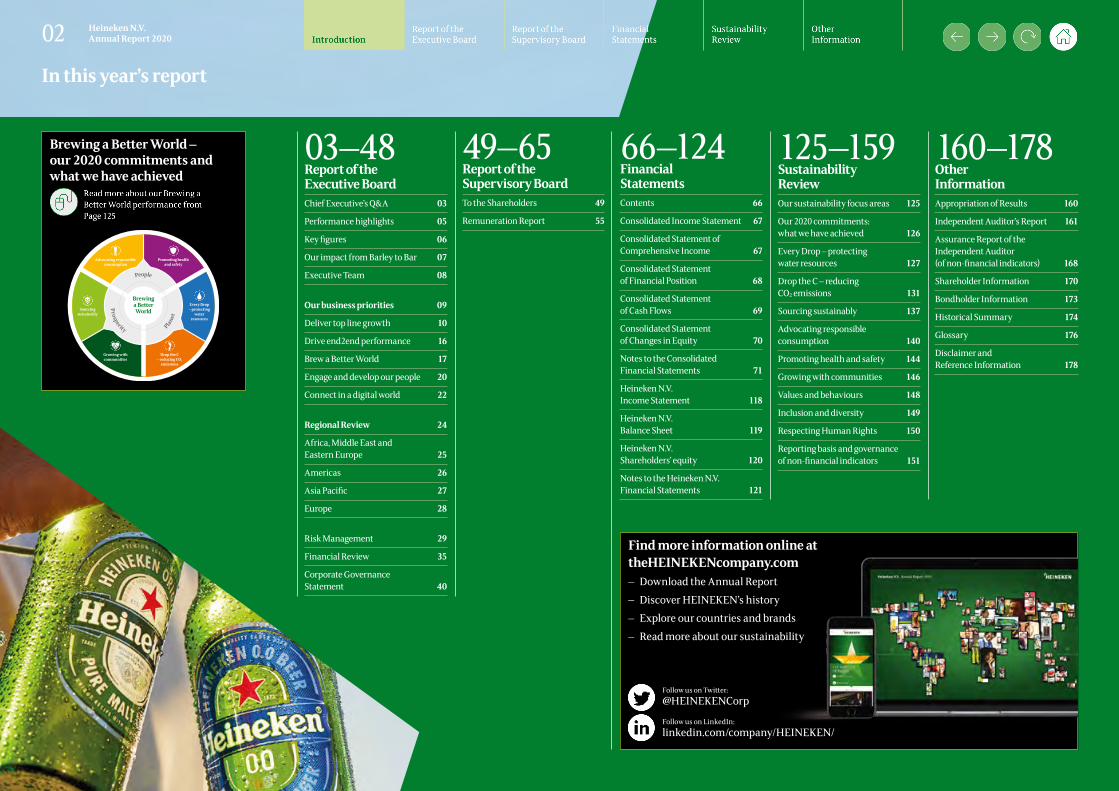
Find more information online at theHEINEKENcompany.com
– Download the Annual Report – Discover HEINEKEN’s history – Explore our countries and brands – Read more about our sustainability
Follow us on LinkedIn: linkedin.com/company/HEINEKEN/
Follow us on Twitter: @HEINEKENCorp
Brewing a Better World – our 2020 commitments and what we have achieved
Brewing
World
People
Prosperity Planet
Promoting health and safety
Growing with communities
Sourcing sustainably
Advocating responsibleconsumption
Every Drop – protecting
water resources
Drop the C – reducing CO2
emissions
03–48Report of the Executive BoardChief Executive’s Q&A 03
Performance highlights 05
Key figures 06
Our impact from Barley to Bar 07
Executive Team 08
Our business priorities 09
Deliver top line growth 10
Drive end2end performance 16
Brew a Better World 17
Engage and develop our people 20
Connect in a digital world 22
Regional Review 24
Africa, Middle East and Eastern Europe 25
Americas 26
Asia Pacific 27
Europe 28
Risk Management 29
Financial Review 35
Corporate Governance Statement 40
49–65Report of the Supervisory BoardTo the Shareholders 49
Remuneration Report 55
66–124Financial StatementsContents 66
Consolidated Income Statement 67
Consolidated Statement of Comprehensive Income 67
Consolidated Statement of Financial Position 68
Consolidated Statement of Cash Flows 69
Consolidated Statement of Changes in Equity 70
Notes to the Consolidated Financial Statements 71
Heineken N.V. Income Statement 118
Heineken N.V. Balance Sheet 119
Heineken N.V. Shareholders’ equity 120
Notes to the Heineken N.V. Financial Statements 121
125–159Sustainability ReviewOur sustainability focus areas 125
Our 2020 commitments: what we have achieved 126
Every Drop – protecting water resources 127
Drop the C – reducing CO2 emissions 131
Sourcing sustainably 137
Advocating responsible consumption 140
Promoting health and safety 144
Growing with communities 146
Values and behaviours 148
Inclusion and diversity 149
Respecting Human Rights 150
Reporting basis and governance of non-financial indicators 151
160–178Other InformationAppropriation of Results 160
Independent Auditor’s Report 161
Assurance Report of the Independent Auditor (of non-financial indicators) 168
Shareholder Information 170
Bondholder Information 173
Historical Summary 174
Glossary 176
Disclaimer and Reference Information 178
02 Heineken N.V. Annual Report 2020
In this year’s report

QHow would you describe your first months as CEO of HEINEKEN?It’s been an honour to follow in the footsteps of Jean-François van Boxmeer and lead this very special 156-year-old company. My new role brought me and my family back to the Netherlands after fifteen years of living abroad in Africa, the U.S., Mexico and Singapore. It feels good to be back home, especially in times of crisis.
Since my first day as CEO in June, my focus has been to “navigate the crisis while building the future”. My priority has been the health and wellbeing of our people. Throughout the COVID-19 pandemic, there’s been nothing more important than taking care of our people, taking care of our customers, taking care of our suppliers, and taking care of our communities. There’s also been a lot of day-to-day crisis management, much of which is being led by our outstanding country managers in 80 operating companies around the world.
While the pandemic continues to create turbulence, we’re very much focused on ensuring we emerge stronger from the crisis. Over the past months, we’ve welcomed seven new Executive Team members and together with all our employees around the world, we’ve come together in a uniquely HEINEKEN way—bottom-up, inclusive, welcoming all voices— to co-create a new strategy that will ensure we successfully write our next growth chapter. We call this programme EverGreen and it will guide us for many years to come.
QCan you provide a summary of the 2020 financial year?In a year of unprecedented disruption and transition, our teams rose to the occasion and quickly adapted while not losing sight of the need to continue investing for the future. The impact of the pandemic on our business was amplified by our on-trade and geographic exposure. We took diligent cost mitigation actions balanced with continued investment behind our growth platforms. We gained share in most of our key operations, a testimony to our ability to adapt and stay close to our customers and consumers in these turbulent times. The Heineken® brand was a bright star, with a continued outstanding performance in Brazil. I applaud the dedication and resilience of our employees and their commitment to support each other, our customers and communities over the past year.
QWhat was the effect of COVID-19 on HEINEKEN and how did the business respond?The effects of COVID-19 have been felt deeply across HEINEKEN. Our employees are hurting, our customers are hurting, and the world is hurting. We made sure that our response was swift and that we always kept people at the centre.
Our first priority was, and remains, our employees. It was critical that they could do their jobs safely, establish the ability to work from home where possible, social distance and receive adequate personal protective equipment. Our global task force meets regularly to monitor and address employee health and wellbeing.
Second, we stepped up to offer financial support to our customers and suppliers who were impacted by the pandemic. Our Back to Bars initiative raised over €10 million to support 50,000 outlets across 21 countries and we waived close to €50 million in rental payments.
“Throughout the COVID-19 pandemic, there’s been nothing more important than taking care of our people,
taking care of our customers, taking care of our suppliers, and taking care of our communities.”
Dolf van den Brink Chairman Executive Board and CEO
Navigating the crisis while building the future
Chief Executive’s Q&A
03 Heineken N.V. Annual Report 2020
Our third priority in responding to COVID-19 was cost. We took quick and decisive measures to safeguard the continuity of our business. As the impact of COVID-19 is still being felt, we have kept up our efforts around cost mitigation and cash preservation to protect our future.
QUnder your leadership, how will HEINEKEN build on its success?HEINEKEN is a 156-year-old company. Leading this company means standing on the shoulders of the incredible leaders that came before me. While I am humbled by this remarkable legacy, I know that we can’t rest on the laurels of our past success. It’s not the biggest or strongest that survive, but the most adaptable. The reason the organisation has thrived for such a long time is because it has continuously renewed and revitalised itself. We must increase our ability to respond and adapt while always staying true to the values of our company to create a cycle of permanent renewal. We are at our core a growth company and we’ll always remain hungry to seek out new opportunities for growth.
QWhere are the opportunities for HEINEKEN as a growth company?We have a solid foundation for growth based on a strong geographical footprint and powerful brand portfolio. However, we can do more to be even closer to our consumers and customers making sure we deeply understand their needs. We can do more to stretch and go beyond beer with new drinks. We need to have a greater focus on productivity to free up resources and reinvest in growth. We can be bolder with our technology agenda and tackle the digitization of our business faster, and with more urgency.
QWhy is now the right time to embark on a more ambitious sustainability and responsibility agenda?We completed the first 10 years of our Brewing a Better World programme in 2020. We’ve made some great strides over the last decade and accomplished a lot but we know we need to do more. As our responsibility to contribute positively to society and the environment continues to rise, we’re excited to step-up our ambitions. To ensure our organisation is unwavering in serving the needs of all stakeholders, we’ve added sustainability and responsibility to our new Green Diamond model, which is now the guiding principle to measure company performance.
QHow does the culture need to evolve to meet your EverGreen ambitions?There is a lot about our culture to be proud of and a lot of good to nurture. We have a culture of pride and passion. Ours is a “we” culture; we are very collaborative. We rank in the top 10% of companies in terms of organisational health. That said, there are also areas for improvement, especially in the EverGreen context. We need to draw upon our courage to act with greater speed and agility. We need to dream big and be disciplined in delivery. We need to tap into the wealth of knowledge that lies within our organisation and accelerate collective learning. We can be more externally focused, more consumer and customer-centric. We can adapt faster to new opportunities and challenges as we began doing in 2020. Evolving in these cultural aspects is something that is already part of EverGreen.
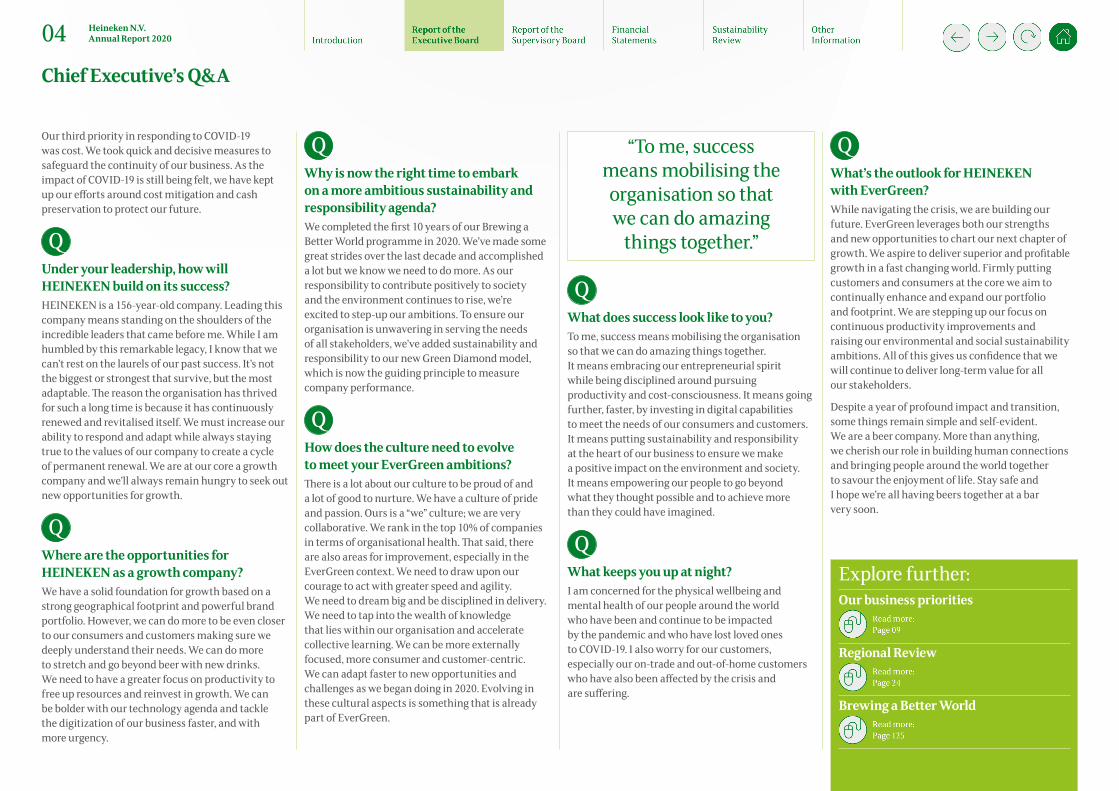
QWhat does success look like to you?To me, success means mobilising the organisation so that we can do amazing things together. It means embracing our entrepreneurial spirit while being disciplined around pursuing productivity and cost-consciousness. It means going further, faster, by investing in digital capabilities to meet the needs of our consumers and customers. It means putting sustainability and responsibility at the heart of our business to ensure we make a positive impact on the environment and society. It means empowering our people to go beyond what they thought possible and to achieve more than they could have imagined.
QWhat keeps you up at night? I am concerned for the physical wellbeing and mental health of our people around the world who have been and continue to be impacted by the pandemic and who have lost loved ones to COVID-19. I also worry for our customers, especially our on-trade and out-of-home customers who have also been affected by the crisis and are suffering.
QWhat’s the outlook for HEINEKEN with EverGreen?While navigating the crisis, we are building our future. EverGreen leverages both our strengths and new opportunities to chart our next chapter of growth. We aspire to deliver superior and profitable growth in a fast changing world. Firmly putting customers and consumers at the core we aim to continually enhance and expand our portfolio and footprint. We are stepping up our focus on continuous productivity improvements and raising our environmental and social sustainability ambitions. All of this gives us confidence that we will continue to deliver long-term value for all our stakeholders.
Despite a year of profound impact and transition, some things remain simple and self-evident. We are a beer company. More than anything, we cherish our role in building human connections and bringing people around the world together to savour the enjoyment of life. Stay safe and I hope we’re all having beers together at a bar very soon.
Explore further: Our business priorities
Regional Review
Brewing a Better World
“To me, success means mobilising the organisation so that we can do amazing
things together.”
Chief Executive’s Q&A
04 Heineken N.V. Annual Report 2020
Community support during COVID-19
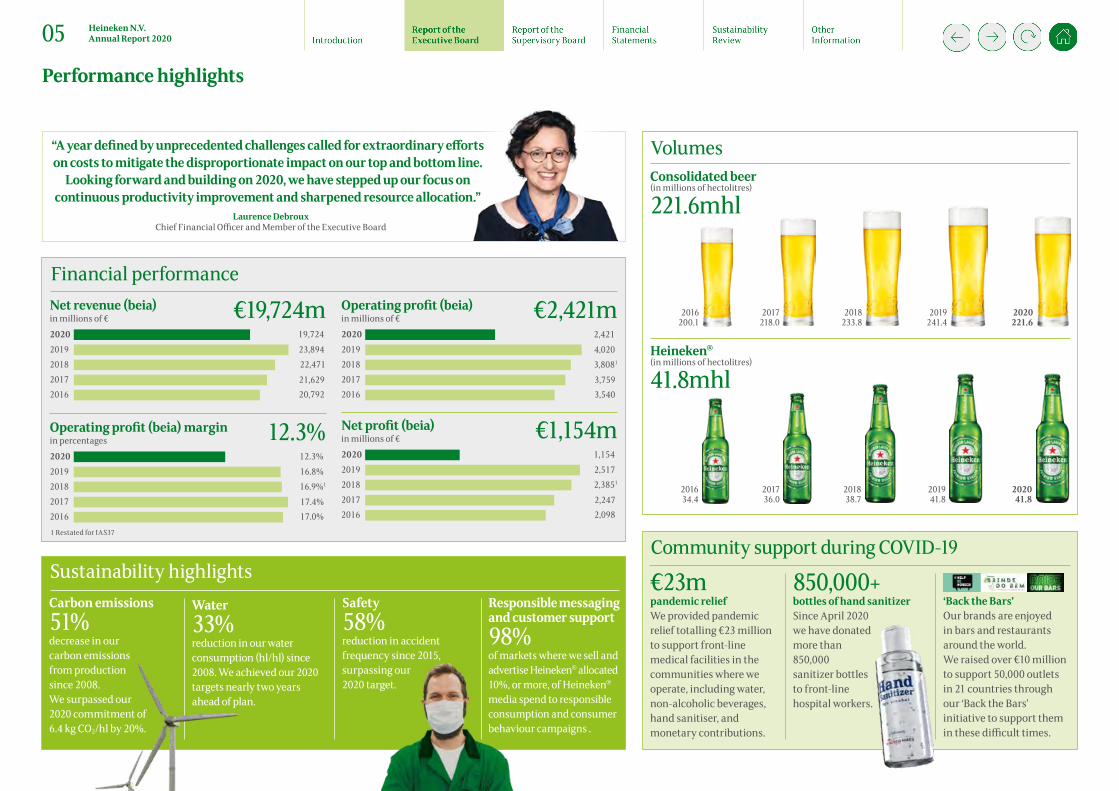
VolumesConsolidated beer (in millions of hectolitres)
221.6mhl
Heineken®
(in millions of hectolitres)
41.8mhl
2016 200.1
2017 218.0
2018 233.8
2020 221.6
2019 241.4
2016 34.4
2017 36.0
2018 38.7
2020 41.8
2019 41.8
€23mpandemic relief We provided pandemic relief totalling €23 million to support front-line medical facilities in the communities where we operate, including water, non-alcoholic beverages, hand sanitiser, and monetary contributions.
‘Back the Bars’ Our brands are enjoyed in bars and restaurants around the world. We raised over €10 million to support 50,000 outlets in 21 countries through our ‘Back the Bars’ initiative to support them in these difficult times.
Sustainability highlightsCarbon emissions51%decrease in our carbon emissions from production since 2008. We surpassed our 2020 commitment of 6.4 kg CO2/hl by 20%.
Water33%reduction in our water consumption (hl/hl) since 2008. We achieved our 2020 targets nearly two years ahead of plan.
Safety58%reduction in accident frequency since 2015, surpassing our 2020 target.
Responsible messaging and customer support98%of markets where we sell and advertise Heineken® allocated 10%, or more, of Heineken® media spend to responsible consumption and consumer behaviour campaigns .
850,000+bottles of hand sanitizer Since April 2020 we have donated more than 850,000 sanitizer bottles to front-line hospital workers.
Net revenue (beia)in millions of € €19,724m20202019201820172016
19,72423,89422,47121,62920,792
Operating profit (beia) marginin percentages 12.3%20202019201820172016
12.3%16.8%16.9%1
17.4%17.0%
Operating profit (beia)in millions of € €2,421m20202019201820172016
2,4214,0203,8081
3,7593,540
Net profit (beia)in millions of € €1,154m20202019201820172016
1,1542,5172,3851
2,2472,098
Financial performance
“A year defined by unprecedented challenges called for extraordinary efforts on costs to mitigate the disproportionate impact on our top and bottom line.
Looking forward and building on 2020, we have stepped up our focus on continuous productivity improvement and sharpened resource allocation.”
Laurence Debroux Chief Financial Officer and Member of the Executive Board
1 Restated for IAS37
Performance highlights
05 Heineken N.V. Annual Report 2020
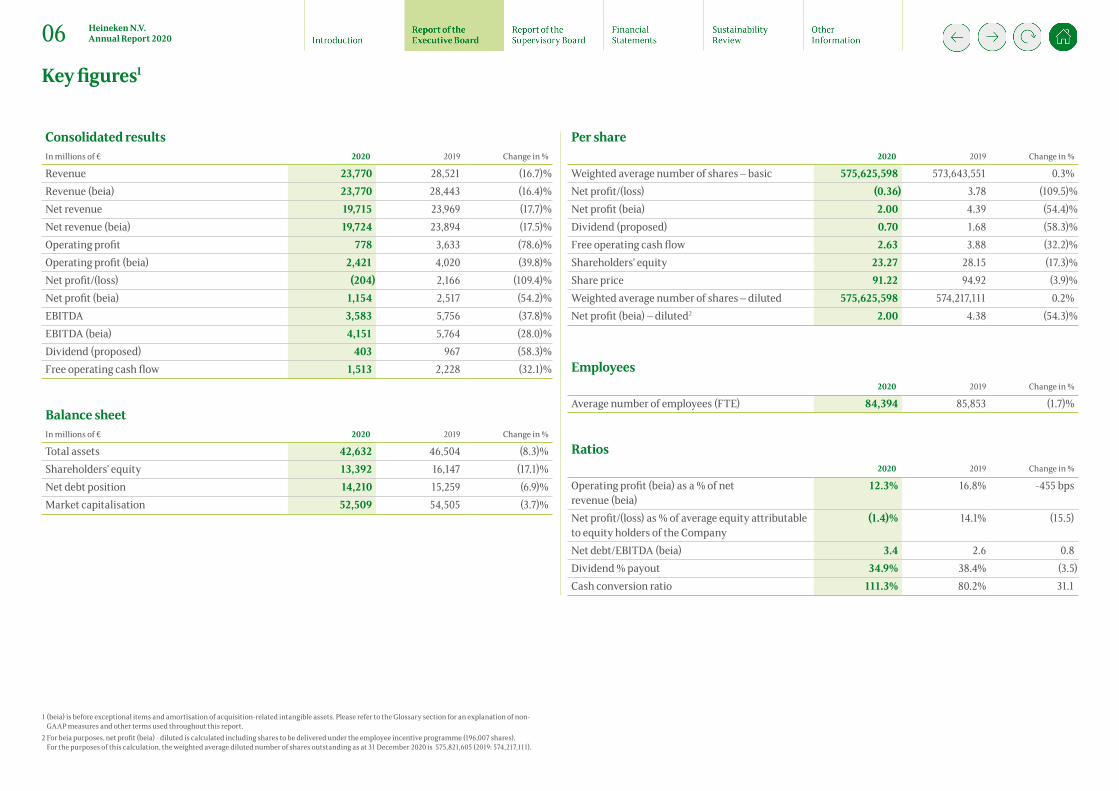
Consolidated resultsIn millions of € 2020 2019 Change in %
Revenue 23,770 28,521 (16.7)%Revenue (beia) 23,770 28,443 (16.4)%Net revenue 19,715 23,969 (17.7)%Net revenue (beia) 19,724 23,894 (17.5)%Operating profit 778 3,633 (78.6)%Operating profit (beia) 2,421 4,020 (39.8)%Net profit/(loss) (204) 2,166 (109.4)%Net profit (beia) 1,154 2,517 (54.2)%EBITDA 3,583 5,756 (37.8)%EBITDA (beia) 4,151 5,764 (28.0)%Dividend (proposed) 403 967 (58.3)%Free operating cash flow 1,513 2,228 (32.1)%
Balance sheetIn millions of € 2020 2019 Change in %
Total assets 42,632 46,504 (8.3)%Shareholders’ equity 13,392 16,147 (17.1)%Net debt position 14,210 15,259 (6.9)%Market capitalisation 52,509 54,505 (3.7)%
Employees2020 2019 Change in %
Average number of employees (FTE) 84,394 85,853 (1.7)%
Ratios2020 2019 Change in %
Operating profit (beia) as a % of net revenue (beia)
12.3% 16.8% -455 bps
Net profit/(loss) as % of average equity attributable to equity holders of the Company
(1.4)% 14.1% (15.5)
Net debt/EBITDA (beia) 3.4 2.6 0.8Dividend % payout 34.9% 38.4% (3.5)Cash conversion ratio 111.3% 80.2% 31.1
Per share2020 2019 Change in %
Weighted average number of shares – basic 575,625,598 573,643,551 0.3% Net profit/(loss) (0.36) 3.78 (109.5)%Net profit (beia) 2.00 4.39 (54.4)%Dividend (proposed) 0.70 1.68 (58.3)%Free operating cash flow 2.63 3.88 (32.2)%Shareholders’ equity 23.27 28.15 (17.3)%Share price 91.22 94.92 (3.9)%Weighted average number of shares – diluted 575,625,598 574,217,111 0.2%Net profit (beia) – diluted2 2.00 4.38 (54.3)%
1 (beia) is before exceptional items and amortisation of acquisition-related intangible assets. Please refer to the Glossary section for an explanation of non-GAAP measures and other terms used throughout this report.
2 For beia purposes, net profit (beia) - diluted is calculated including shares to be delivered under the employee incentive programme (196,007 shares). For the purposes of this calculation, the weighted average diluted number of shares outstanding as at 31 December 2020 is 575,821,605 (2019: 574,217,111).
Key figures1
06 Heineken N.V. Annual Report 2020

We brew enjoyment of life for consumers, customers and our people. Over the past decade, we have built a solid foundation that ensures we make a positive impact on the environment, local communities and society as a whole. Today, Brewing a Better World is integral to our business strategy and drives our contribution to the UN Sustainable Development Goals.
AgricultureWe brew beer and make cider from natural ingredients. By supporting sustainable agriculture, 58% of our raw materials now come from sustainable sources. Our new low carbon agriculture programme will support 500 pilot farms to reduce CO2 emissions. We continue our efforts towards local sourcing in Africa.
BrewingWe operate 166 breweries, malteries, cider plants and other facilities around the world. All have contributed to surpassing our global water consumption targets. We are reducing emissions by shifting to more efficient processes and work on low carbon innovations.
PackagingWe aim for our packaging designs to be distinctive and visible without burdening the environment. By investing in design and innovation, we develop sustainably sourced, low carbon and circular solutions. We are working closely with our suppliers to share our knowledge in order to accelerate the decarbonisation of their sectors.
DistributionMost of our products are produced in the countries where they are consumed. To reduce the environmental impacts of distribution and drive down emissions, we aim to optimise routes, support suppliers to adopt low carbon technologies and shift to fuel-efficient transport.
CustomersOur drinks are sold in bars, restaurants and through retailers around the world. Our Green Cooling programme has resulted in 100% of newly purchased fridges meeting low carbon footprint standards emitting over 55% less carbon than those 10 years ago.
ConsumersWe pay special attention to advocating for moderation and use our advertising and sponsorship platforms to campaign against harmful drinking. Expanding our low- and no-alcohol portfolio is an important part of our business strategy.
EmployeesThe ingenuity of our people is integral to Brewing a Better World. We keep them safe, healthy, motivated and engaged.
SuppliersOur suppliers sustain our resilient business. We partner with them to set and achieve shared sustainability goals.
CommunitiesWe seek to make a positive contribution to local communities through our core business and by working together to develop targeted initiatives.
Brewing a Better World supports the following SDGs:
Sourcing sustainably
Our impact from Barley to Bar
Drop the C: Reducing CO2 emissions
Every Drop: Protecting water resources
Promoting health and safety
Growing with communities
Advocating responsible consumption
07 Heineken N.V. Annual Report 2020
9 6
2710 1 11 3
8 4 5
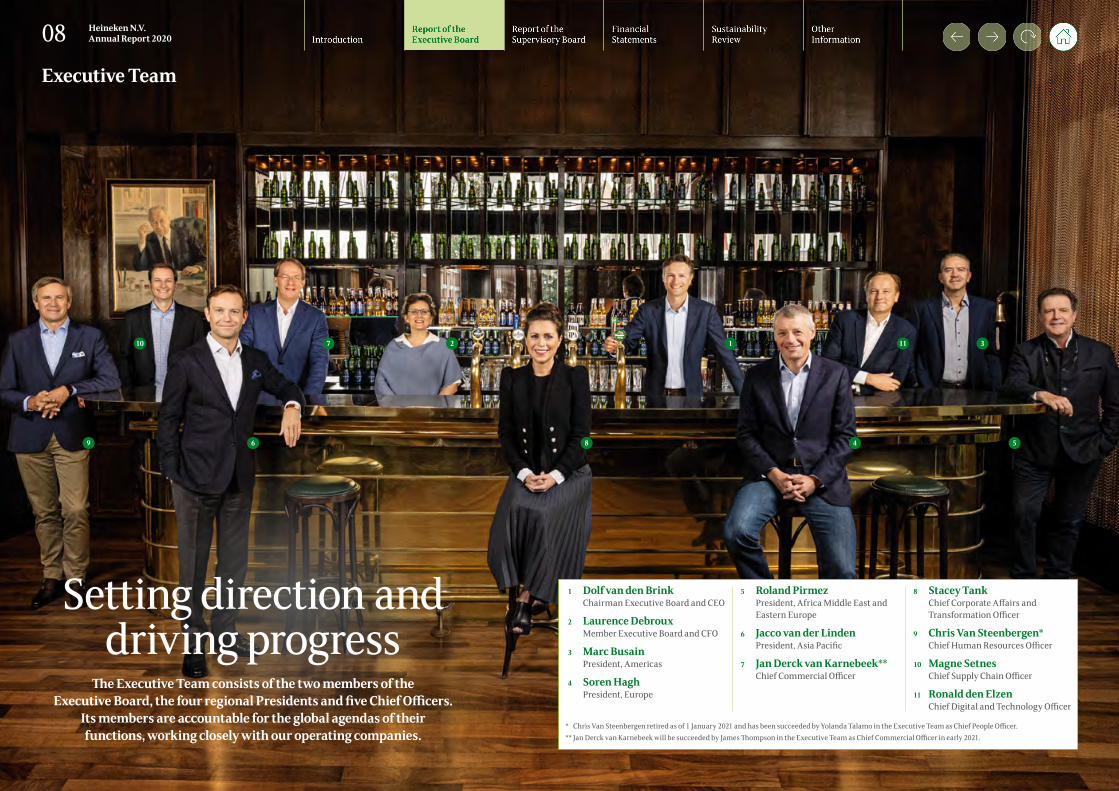
Setting direction and driving progress
The Executive Team consists of the two members of the Executive Board, the four regional Presidents and five Chief Officers.
Its members are accountable for the global agendas of their functions, working closely with our operating companies.
1 Dolf van den Brink Chairman Executive Board and CEO
2 Laurence Debroux Member Executive Board and CFO
3 Marc Busain President, Americas
4 Soren Hagh President, Europe
5 Roland Pirmez President, Africa Middle East and
Eastern Europe
6 Jacco van der Linden President, Asia Pacific
7 Jan Derck van Karnebeek** Chief Commercial Officer
8 Stacey Tank Chief Corporate Affairs and
Transformation Officer
9 Chris Van Steenbergen* Chief Human Resources Officer
10 Magne Setnes Chief Supply Chain Officer
11 Ronald den Elzen Chief Digital and Technology Officer
* Chris Van Steenbergen retired as of 1 January 2021 and has been succeeded by Yolanda Talamo in the Executive Team as Chief People Officer.** Jan Derck van Karnebeek will be succeeded by James Thompson in the Executive Team as Chief Commercial Officer in early 2021.
08 Heineken N.V. Annual Report 2020
Executive Team

Sustainable, long-term value
creationIn 2020, we reported against our
five business priorities. These priorities combined to form our strategy, which
was designed to enable us to win in the marketplace, connect in a digital world and ensure the long-term sustainability
of our business to create value for stakeholders.
We continue to consider our effect on the wider society, communities,
and the environment.
09 Heineken N.V. Annual Report 2020
Our business priorities
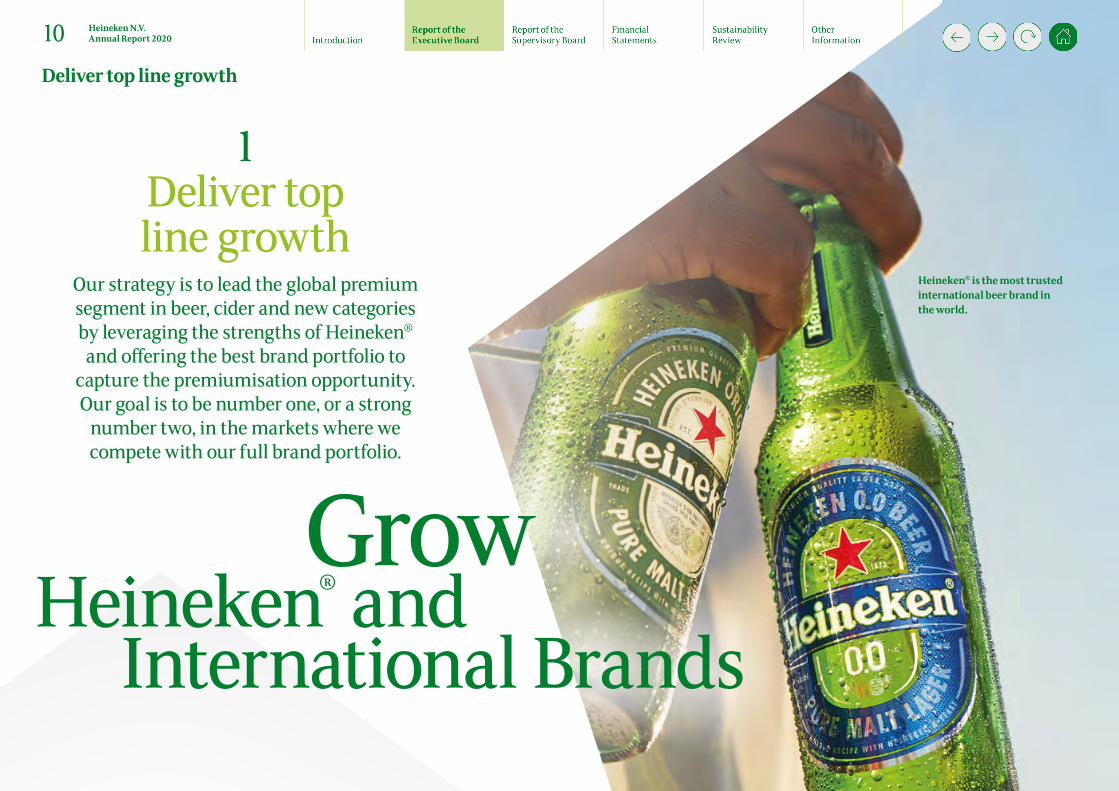
1Deliver top line growth
Our strategy is to lead the global premium segment in beer, cider and new categories by leveraging the strengths of Heineken® and offering the best brand portfolio to
capture the premiumisation opportunity. Our goal is to be number one, or a strong
number two, in the markets where we compete with our full brand portfolio.
Heineken® is the most trusted international beer brand in the world.
International BrandsGrow
Heineken® and
Deliver top line growth
10 Heineken N.V. Annual Report 2020
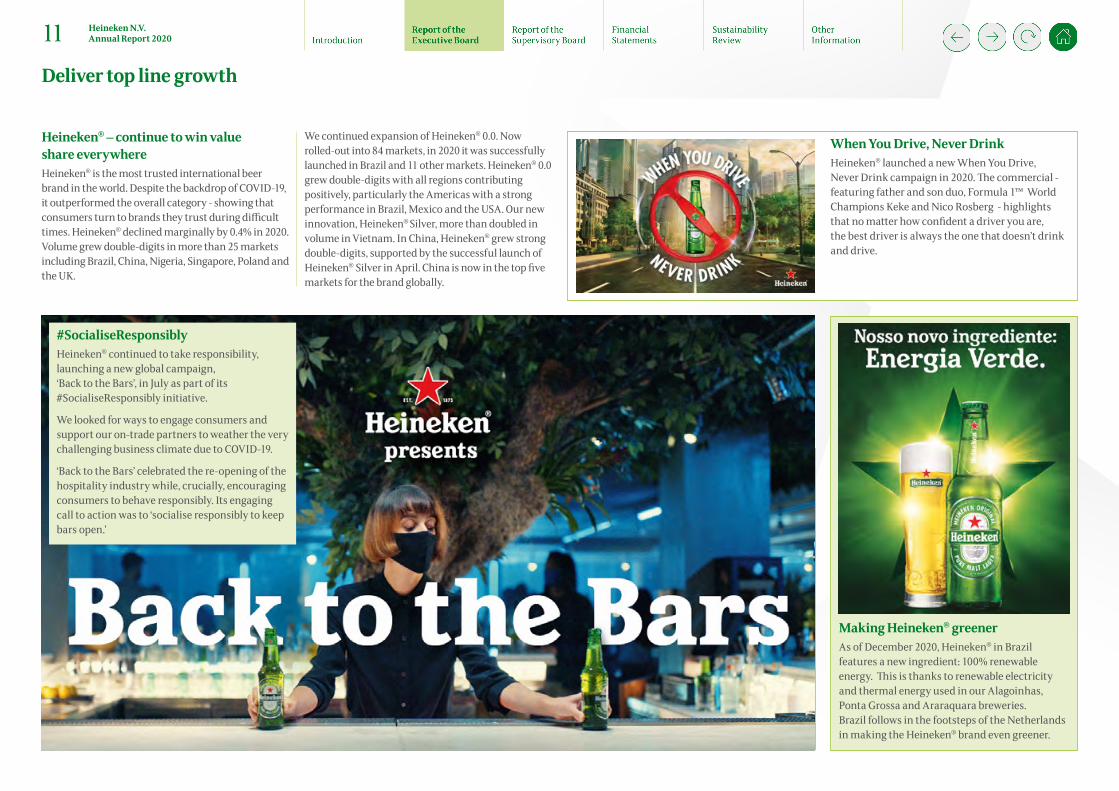
Heineken® – continue to win value share everywhereHeineken® is the most trusted international beer brand in the world. Despite the backdrop of COVID-19, it outperformed the overall category - showing that consumers turn to brands they trust during difficult times. Heineken® declined marginally by 0.4% in 2020. Volume grew double-digits in more than 25 markets including Brazil, China, Nigeria, Singapore, Poland and the UK.
We continued expansion of Heineken® 0.0. Now rolled-out into 84 markets, in 2020 it was successfully launched in Brazil and 11 other markets. Heineken® 0.0 grew double-digits with all regions contributing positively, particularly the Americas with a strong performance in Brazil, Mexico and the USA. Our new innovation, Heineken® Silver, more than doubled in volume in Vietnam. In China, Heineken® grew strong double-digits, supported by the successful launch of Heineken® Silver in April. China is now in the top five markets for the brand globally.
When You Drive, Never Drink Heineken® launched a new When You Drive, Never Drink campaign in 2020. The commercial - featuring father and son duo, Formula 1™ World Champions Keke and Nico Rosberg - highlights that no matter how confident a driver you are, the best driver is always the one that doesn’t drink and drive.
Making Heineken® greenerAs of December 2020, Heineken® in Brazil features a new ingredient: 100% renewable energy. This is thanks to renewable electricity and thermal energy used in our Alagoinhas, Ponta Grossa and Araraquara breweries. Brazil follows in the footsteps of the Netherlands in making the Heineken® brand even greener.
#SocialiseResponsiblyHeineken® continued to take responsibility, launching a new global campaign, ‘Back to the Bars’, in July as part of its #SocialiseResponsibly initiative.
We looked for ways to engage consumers and support our on-trade partners to weather the very challenging business climate due to COVID-19.
‘Back to the Bars’ celebrated the re-opening of the hospitality industry while, crucially, encouraging consumers to behave responsibly. Its engaging call to action was to ‘socialise responsibly to keep bars open.’
Deliver top line growth
11 Heineken N.V. Annual Report 2020

Affligem – Almost 1000 years of Brewing ExpertiseAffligem, our certified Abbey Beer, has an historical connection to the existing Affligem abbey. The recipes have been handed down unchanged since 1074, and all our beers share our signature smooth and rich taste. Affligem Blond was also crowned world’s best “Belgian Style Blond” at the World Beer Awards and won 16 additional awards, of which seven medals at the European Beer Challenge. In the Netherlands Affligem launched its first campaign ‘Make beer, not war’, to further build the brand.
Tiger Beer marks 88 years with a new look and the same bold tasteIn 2020, Tiger - Asia’s No.1 international premium lager celebrated its 88th Anniversary introducing a powerful new Global brand campaign “Yet here I am” supported with a fresh new packaging look, whilst keeping the same bold taste that has won worldwide acclaim throughout its history. During the pandemic, Tiger beer rallied people to support local pubs, restaurants, coffee shops and food courts throughout Asia with its Support Our Streets initiative.
Birra Moretti – sharing the Italian way of lifeA rich lager with substance, consumers see Birra Moretti as a premium, crafty lager, a great beer to be enjoyed in good company over good food – like Italians do. It is the result of a brewing process that has remained almost unchanged since 1859. As the number one beer in Italy, Birra Moretti is expanding fast internationally, spreading the Italian way of life to consumers and customers. The Birra Moretti range is complemented by Birra Moretti 0.0, a great-tasting zero alcohol beer that is perfect to be enjoyed with food, over lunch and beyond.
Amstel celebrates 150-years of friendship with launch in China Amstel is now enjoyed in 116 countries around the world. To mark 150 years of beer and friendship, Amstel launched in select provinces across Southern and Eastern China. The brand saw strong performance in South America, with volume growth in the Americas region. In Brazil, double digit growth positioned the country as the #1 market for Amstel in the world.
Deliver top line growth
12 Heineken N.V. Annual Report 2020

Desperados – moving beyond Europe and igniting the party spirit onlineDesperados celebrated strong growth and stepped beyond high energy occasions with Desperados Lime and its newest innovation, Desperados Virgin 0.0%. Launched in France in 2020, it will expand to further markets in 2021. With local brewing in Ivory Coast and the launch in Nigeria in December, the brand is moving beyond Europe.
Desperados used its experimental DNA to adapt to the new reality in 2020. It quickly shifted to a digital-first strategy to bring the party safely into peoples’ homes with a clear message: #partyonpartysafe. A series of virtual events ignited the party spirit for consumers around the world. We organised our first VR event pushing the boundaries of experimentation.
Leading the cider categoryHEINEKEN is the world’s leading cider producer. We continue to shape the development of the category, engaging consumers to discover a taste for cider through our global and local brand portfolios. Cider volume grew double-digits in Russia and Mexico. We launched the first ciders under Strongbow’s new Premium Blends Selection in Romania, targeting more premium drinking occasions and new consumers. HEINEKEN acquired Strongbow cider in Australia, reuniting it with the global Strongbow portfolio after 17 years.
Sol – inspired by the sunSince April 2020, Sol brewed at Zoeterwoude brewery in the Netherlands has been produced using renewable energy from solar power. The move reaffirms the brand’s sun-inspired heritage and marks an important milestone in the journey to reduce its carbon footprint.
Following the installation of 9,212 solar panels at Zoeterwoude, Sol launched the new sustainability approach on its packaging - Brewed with Solar Energy.
This initiative has been expanded to Brazil where the brand is also brewed with Solar energy.
Sol is sold in over 50 countries, including Mexico, Brazil, UK, New Zealand, South Africa, China and the Netherlands.
Deliver top line growth
13 Heineken N.V. Annual Report 2020

Innovation is embedded in everything we do at HEINEKEN. We continuously use our expertise to create new and exciting taste
experiences for consumers.
to consumer trendsand behaviours
Adapt
“There is a growing consumer market for low-calorie, alcoholic beverage alternatives which led to the rapid
growth of the hard seltzer category. Pure Piraña offers a way for us to meet consumers’ evolving needs and
explore a new growth opportunity for our business.”Jan Derck van Karnebeek
Chief Commercial Officer at HEINEKEN
Entering the hard seltzer category We entered the hard seltzer category globally with the launch of Pure Piraña in Mexico and New Zealand in 2020. Containing fewer than 100 calories and made with carbonated mineral water and all-natural fruit flavourings, the drink is aimed at today’s modern generation of consumers who are increasingly conscious of consumption and lifestyle choices. HEINEKEN Mexico announced the launch of Amstel Ultra® Seltzer following the success of Amstel Ultra, launched in 2018. It is available from January 2021. HEINEKEN USA and Hornell Brewing Company, an affiliated entity of AriZona Beverages, will launch AriZona SunRise Hard Seltzer in the first quarter of 2021.
Deliver top line growth
Bringing Edelweiss wheat beer to AsiaBorn in the heights of the Alps in 1646, Edelweiss is a premium wheat beer brewed using all-natural ingredients and a unique blend of mountain herbs: sage, coriander and elderflower. The ambition is to grow our premium wheat beer and provide consumers with a taste of the Alps. Especially in the Asian beer market where we are seeing a rapid rise in popularity of non-lager beers. Since its launch in South Korea in 2018, the introduction of Edelweiss in eight new markets marks our first brand expansion in the wheat beer segment. It has allowed us to meet consumer demand and offer a new taste experience. Beyond regular Wheat beer, consumers can also enjoy Edelweiss 0.0%, Edelweiss Red Berries and Edelweiss Peach.
14 Heineken N.V. Annual Report 2020
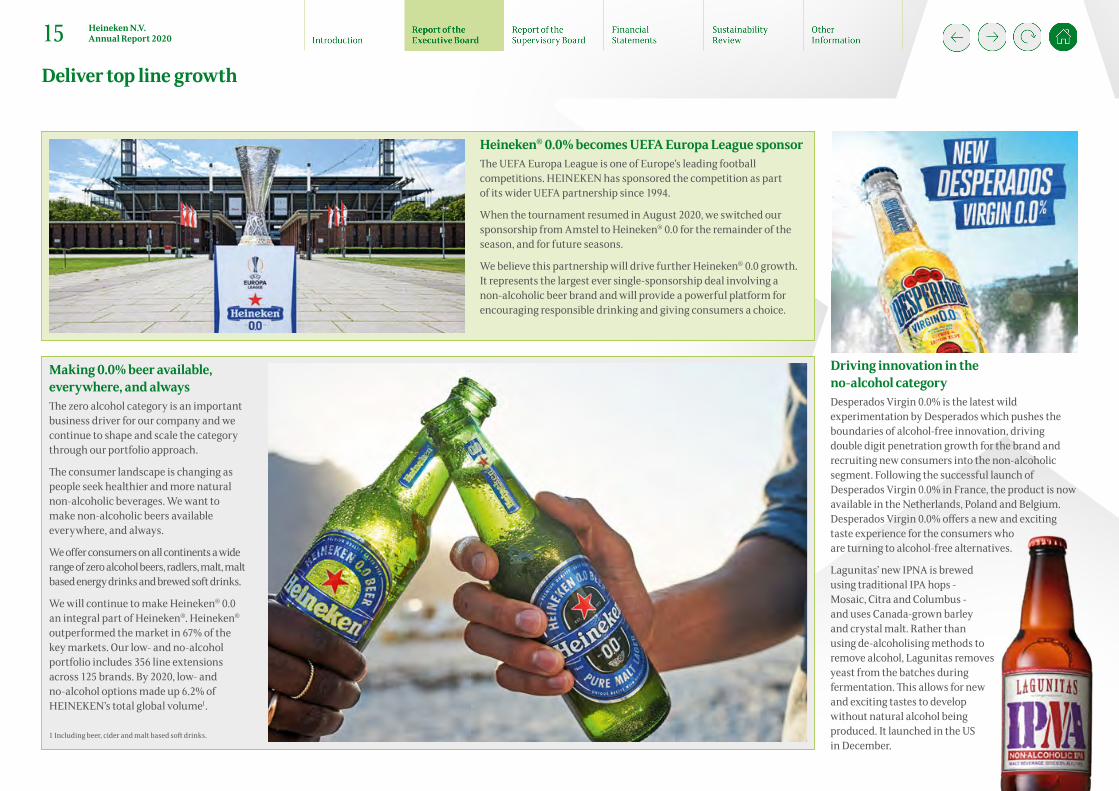
Driving innovation in the no-alcohol categoryDesperados Virgin 0.0% is the latest wild experimentation by Desperados which pushes the boundaries of alcohol-free innovation, driving double digit penetration growth for the brand and recruiting new consumers into the non-alcoholic segment. Following the successful launch of Desperados Virgin 0.0% in France, the product is now available in the Netherlands, Poland and Belgium. Desperados Virgin 0.0% offers a new and exciting taste experience for the consumers who are turning to alcohol-free alternatives.
Lagunitas’ new IPNA is brewed using traditional IPA hops - Mosaic, Citra and Columbus - and uses Canada-grown barley and crystal malt. Rather than using de-alcoholising methods to remove alcohol, Lagunitas removes yeast from the batches during fermentation. This allows for new and exciting tastes to develop without natural alcohol being produced. It launched in the US in December.
Making 0.0% beer available, everywhere, and alwaysThe zero alcohol category is an important business driver for our company and we continue to shape and scale the category through our portfolio approach.
The consumer landscape is changing as people seek healthier and more natural non-alcoholic beverages. We want to make non-alcoholic beers available everywhere, and always.
We offer consumers on all continents a wide range of zero alcohol beers, radlers, malt, malt based energy drinks and brewed soft drinks.
We will continue to make Heineken® 0.0 an integral part of Heineken®. Heineken® outperformed the market in 67% of the key markets. Our low- and no-alcohol portfolio includes 356 line extensions across 125 brands. By 2020, low- and no-alcohol options made up 6.2% of HEINEKEN’s total global volume1.
1 Including beer, cider and malt based soft drinks.
Heineken® 0.0% becomes UEFA Europa League sponsorThe UEFA Europa League is one of Europe’s leading football competitions. HEINEKEN has sponsored the competition as part of its wider UEFA partnership since 1994.
When the tournament resumed in August 2020, we switched our sponsorship from Amstel to Heineken® 0.0 for the remainder of the season, and for future seasons.
We believe this partnership will drive further Heineken® 0.0 growth. It represents the largest ever single-sponsorship deal involving a non-alcoholic beer brand and will provide a powerful platform for encouraging responsible drinking and giving consumers a choice.
Deliver top line growth
15 Heineken N.V. Annual Report 2020

Expanding in developing marketsWe continue to reallocate resources and make strategic investments in emerging markets. Heineken® Silver and Amstel are now produced locally in China by our partner, China Resources Beer, and there is local production of Heineken® in DRC and Desperados in Ivory Coast. Major capacity extensions have been made in South Africa, Rwanda, France, Cambodia and Brazil. Our BASE programme continues to make HEINEKEN more agile and efficient by standardising core business processes in Finance, Procurement, Production, Logistics and Sales. We continued to deploy BASE in 2020 with eight go-lives and the roll-out is due to be completed in 2021. The new BASE deployments were all done remotely.
Transforming our transactionsWe have accelerated transformation of transactional processes in Europe with the launch of the SHARP-X programme. It went live in Hungary, Greece, Belgium, Croatia and France in 2020. The new Unified Data Model is another step towards bringing greater simplicity and consistency to our European finance operations.
2Drive end2end performance
Connected breweriesOur growing number of connected breweries use state-of-the-art equipment to provide real-time data about brewery performance. By analysing and comparing data on a global scale, we gain valuable insights to drive continuous improvement in brewery performance. We have continued to invest in automation and process and operations efficiency through the testing and tactical deployment of new tools and technologies. This is supporting increased remote assistance from our worldwide network of experts, facilitating quick access to best expertise through virtual presence, central analytics and latest technology 3D printing of spare parts where needed. This strategy paid off during the pandemic to keep our operations running without the need to fly in experts or spare parts.
Developing a consumer and customer mindsetDriving end2end performance enables us to collaborate faster and at scale, both internally and with our customers. End2end means embracing a consumer and customer mindset at every stage – from concept to solution. This sets us up to adapt quickly and flexibly to changing consumer needs, while aiming for excellence in our operations.
Optimising our global footprint We are working continuously to optimise our global footprint by balancing the trade-offs between local investment and imports, adjusting volume allocations and strategically investing in our global operations. Most of our products are produced in the countries where they are consumed. To reduce the environmental impacts of distribution and drive down emissions, we aim to optimise routes, support suppliers to adopt low carbon technologies and we are shifting to fuel efficient transport
Continuous improvementContinuous cost improvement is also at the core of our supply chain management culture. In 2020, we increased the digital capabilities of connected breweries with applications that focus on performance management and energy saving. Despite lower volumes and big shifts in our portfolio due to the COVID-19 pandemic, we improved performance in productivity, water usage and thermal electricity. The Worldwide Centres of Excellence bring together experts from across our global businesses to collaborate and share knowledge and best practices in brewing, packaging, logistics and innovation.
We use our global scale to drive efficiency from end2end – saving costs and fuelling future growth
through strategic investments and initiatives.
“The health, safety and trust of our people was of paramount
importance in 2020. Our breweries stayed open as
far it was allowed by authorities and our resilient and agile supply
chain reacted quickly to meet fluctuations in demand.
This enabled us to support the shift from on-trade to off-trade and
maintain our customer-centric mindset throughout the year.”
Magne Setnes Supply Chain Officer
We continue to invest in the digitization of our end2end supply chain. Our Connected Brewery platform is at the core of this, creating scale benefit in our global and close to market brewery network.
Utilities Connected worker
Robotics
Infrastructure
Analytics
Packaging
Brewing
Control room
Drive end2end performance
16 Heineken N.V. Annual Report 2020

Being the most international brewer with operations around the world, we have a responsibility and an ambition to brew a better world from barley to bar, from global to local.
We believe in working with others to achieve shared goals, to limit our negative impacts and scale our positive contribution.
Raising the Bar for 20302020 was a pivotal year as we navigated the crisis posed by COVID-19 and reached the end of our 10-year Brewing a Better World strategy.
We considered the lessons learnt and looked at how the world has changed during this time in close alignment with our external and internal stakeholders.
In the decade of action, we are increasing our ambition with revised focus areas and new commitments in the spirit of ‘Raising the Bar’.
Accelerating our climate strategyThe pandemic shone a spotlight on the need to maintain focus on long-term issues, such as climate change. Revising our carbon strategy, Drop the C, has been a key focus in 2020.
We accelerated our efforts to shift to renewable energy with flagship initiatives such as Heineken® brewed with 100% renewable electricity and thermal energy in the Netherlands and Brazil.
13 European operations are set to be powered with green electricity, enabled through a cross-border deal.
3Brew a
Better WorldOver the last 10 years, Brewing a Better World has become integral to our business strategy. It has driven us to innovate and collaborate to protect the environment, support local
communities and make a positive contribution to society – all with a focus on supporting delivery of the UN Sustainable
Development Goals.
Brew a Better World
17 Heineken N.V. Annual Report 2020

Standing solid with local communities The pandemic showed the importance of growing with communities and tackling social inequality. Given the impacts on people and local economies, we focused on ensuring the safety and wellbeing of our employees, maintaining business continuity and supporting local communities.
We donated €15 million to the International Federation of Red Cross and Red Crescent Societies (IFRC) to support the most vulnerable communities in Africa, Asia and Latin America. Moreover, more than 60 of our operating companies supported their local communities and the front line COVID-19 response in 2020. Vacuum distillation networks were put to work repurposing alcohol for sanitiser, donations of water and non-alcoholic drinks and financial support towards safety equipment were at the heart of our actions.
Sharing messages of hope and moderationAgainst the backdrop of COVID-19, we expanded the scope of our responsible consumption campaigns beyond alcohol moderation to include behaviour moderation. Support for our on-trade partners in a very challenging business climate was a key driver.
Brands such as Amstel introduced the Practice makes Perfect campaign – capturing the much-practiced at home moment of getting ready to return to your favourite bar.
In addition, many of our brands, such as Heineken®’s #SocialiseResponsibly initiative, Tiger throughout Asia Pacific, and Amstel Ultra in Mexico, invested in creative campaigns to promote social distancing.
We launched a 10-year low carbon agriculture programme in close collaboration with key suppliers. It will involve 500 pilot farms in 8 countries to drive down emissions from farming.
Our focus on developing innovative and sustainable packaging solutions has laid the foundations of a new circularity strategy that will be developed in the course of 2021 – from barley to bar.
Every Drop in actionOur Every Drop 2030 strategy looks beyond traditional water efficiency metrics to put the health of local watersheds front and centre. Over the past decade, we have reduced water consumption by more than a third and set additional commitments for our breweries in water-stressed areas.
In 2020, 10 sites in Mexico, Spain and Egypt have replenished more water in their respective watersheds than their annual beverage production volume. This means they are more than 100% water balanced.
Please read more about our Brewing a Better World results from page 125
Brew a Better World
18 Heineken N.V. Annual Report 2020
Brew a Better World
A strong heritage and sustainable cultureThroughout the years, our company has been led by the desire to create a successful, sustainable business that wasn’t just financially prosperous but which also made a positive contribution to society as a whole. The simple blueprint established over 155 years ago was to hire passionate people, use the freshest ingredients, constantly innovate, never compromise on quality and then to reinvest in society and the communities. All these principles are foundational to us as a company today and are reflected in our Brewing a Better World programme.
Reflecting on Brewing a Better WorldOur aim by Brewing a Better World was, by definition, to limit our potential negative impacts on the world and maximise our positive contribution.
Since its launch, Brewing a Better World has come to be embedded in everything we do.
We have embraced our responsibility and set out to constantly learn how we can create more shared value – from the moment the barley seed is planted to the second the empty glass is set down on the bar.
We also strive to have a meaningful impact by measuring progress in terms of our external impact and contribution to the UN Sustainable Development Goals.
A global strategy that meets local needsOur global strategy must be able to seamlessly adapt to meet local needs of consumers, customers and communities around the world. Each market is unique and understanding and adapting to local context creates new business opportunities and improves our relationships.
It also enables us to address global priorities by empowering operating companies to address local issues – supporting healthy watersheds in water-stressed areas being an example of a global priority which has a crucial local impact.
Celebrating our achievements...We have many achievements to be proud of – from the first carbon neutral brewery in the world in Austria; to halving our CO2 emissions in our breweries since 2008; to the 33% cut in our average water consumption since 2008; to the fact that today 58% of our agricultural raw materials are sustainably sourced.
We’ve seen momentum build with new innovations – for example sustainable packaging innovations such as the ‘green grip’ in the UK – and campaignsthat have stood the test of time like ‘When You Drive, Never Drink’ which has reached millions of consumers around the world over the past years.
But perhaps the biggest achievement is how we have come together as one team to transform our global business. Brewing a Better World has united our over 84,000 employees and become an integral part of our business strategy - delivering on our commitments in a truly cross-functional way across the entire value chain.
...and learning some hard lessonsWe did not achieve all our Brewing a Better World commitments and in other areas we now know we need to accelerate progress.
Although we have significantly reduced the accident frequency in our operations, we still see fatalities as a result of our business. We must continue to do our utmost to ensure a safe working environment for our people. We have launched a new global strategy to drive further progress and ‘Put Safety First!’ has become our number one company behaviour.
In others areas, we have learned the hard way by failing to meet our targets – such as falling short on our local sourcing commitment in Africa which proved more complex and time consuming than we had envisaged.
Our vocal critics have helped us reflect on and address key issues, like the role of brand promoters or third-party labour standards. This constructive criticism is invaluable to our efforts to become a better company.
One of the biggest lessons we have learnt along the way is the power of being bold. We must challenge the status quo and never stop innovating to make a meaningful difference. We must also be flexible and continuously adapt to the world around us as it changes at ever increasing pace - a need the past year has demonstrated like no other.
Raising the barBrewing a Better World has created a strong foundation on which to build in a world that is facing challenges that demand strong, decisive and collective action. Reversing climate change, addressing water scarcity and creating a more equal and fair society – we are determined to help address these challenges because we understand that our company can only thrive if the planet and communities we depend on are thriving.
This is why we are raising the bar with our revised strategy for the next decade. It will raise our ambitions on climate action. We will accelerate our efforts to support the social agenda and will be ambitious and bold in promoting moderate consumption of alcohol. Building brands that deliver our sustainability agenda will remain a fundamental priority for the decade ahead.
We would like to thank everyone who has supported us over this incredible journey. It has been profoundly complex, sometimes difficult, but utterly rewarding. We will continue to work together as a team, every day moving a step closer towards our renewed ambitions.
To learn more about what we have achieved by 2020, please go to page 125
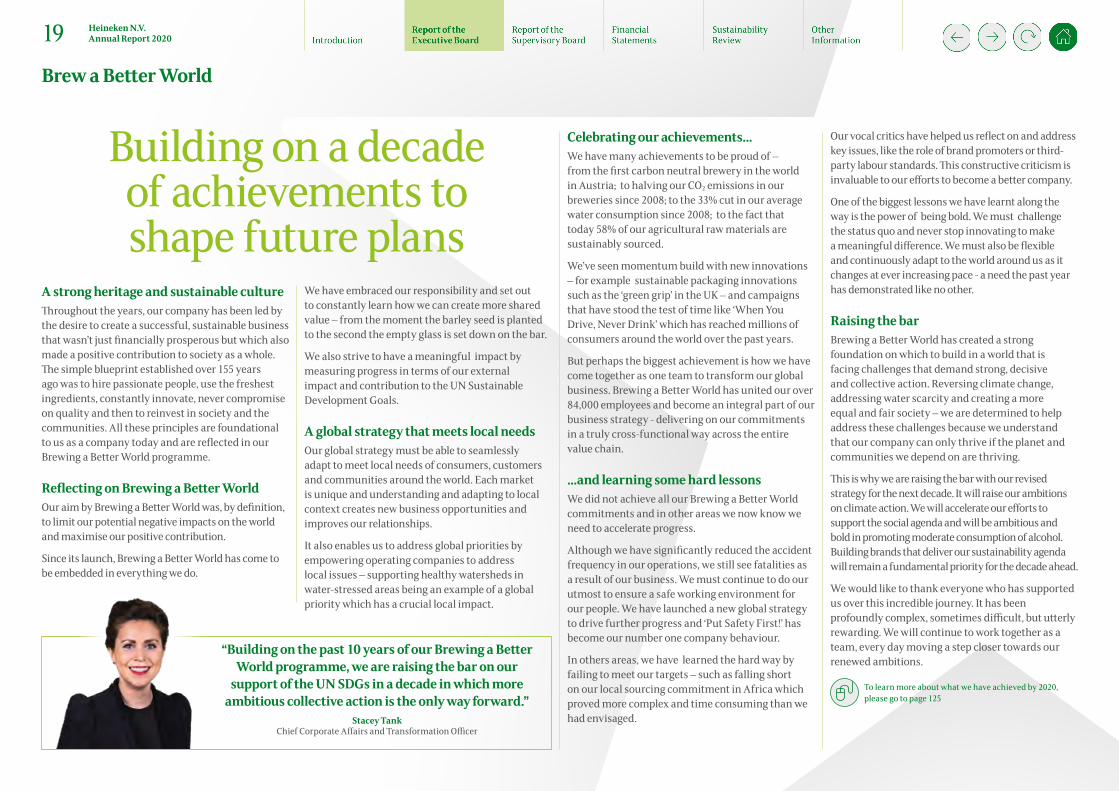
“Building on the past 10 years of our Brewing a Better World programme, we are raising the bar on our
support of the UN SDGs in a decade in which more ambitious collective action is the only way forward.”
Stacey Tank Chief Corporate Affairs and Transformation Officer
Building on a decade of achievements to shape future plans
19 Heineken N.V. Annual Report 2020

“This year was all about putting our people first. We immediately put all measures in place to keep them safe, healthy, motivated and engaged while developing the future building blocks of success.”
Yolanda Talamo Chief People Officer
4 Engage and develop
our peopleNever before have we seen more rapid and
impactful change to global society. We stepped up to support the business in a year of constantly
shifting priorities – at all times putting people first. We acted quickly and decisively when the pandemic emerged, setting up a global COVID-19 task force and
regional crisis teams to implement global health, hygiene and wellbeing measures.
Putting people firstWe introduced travel restrictions, a work from home policy for office workers and a COVID-19 response guideline. This defined measures to be adopted in each market, taking local context into account, and activities to be performed at different phases of the pandemic.
Our operating companies were able to take immediate action to enable a safe working environment. We supplied materials and equipment (including masks, personal protection equipment (PPE) and COVID-19 tests) to countries with lower levels of healthcare.
Engage and develop our people
20 Heineken N.V. Annual Report 2020

Focusing on mental and emotional healthWith health and wellbeing a priority, we focused on supporting peoples’ mental health and emotional resilience. Our employees around the world faced diverse personal challenges, work situations and lockdown scenarios, with the uncertainty of the developing pandemic being a source of additional stress.
We made confidential mental health coaching freely available to all employees globally via a COVID-19 Hotline.
We also shared resources with operating companies and global teams to raise awareness of the importance of mental health. They included blogs, online resource lists, webinars and instructions for digital talks by local, regional and global leaders.
Finally, we created online development programmes focused on building resilience, staying connected and raising morale to protect and support front line workers.
Leveraging digital learningWith new technologies changing how we live, work and shop at an ever increasing pace, the COVID-19 crisis has accelerated our digital transformation.
Many of our employees had to adapt to working remotely overnight. To support their continued development, we created and launched an online learning platform, MyLearning. Developed with a leading digital learning agency, it enables every employee to access on-demand training via their PC or mobile whenever and wherever is convenient.
In addition to a global database of content provided by external digital learning experts, we launched ‘DIGIFIT’, our own digital upskilling initiative.
Over 20,000 employees have started their on-line learning journeys and over 10,000 hours have been completed on LinkedIn Learning courses alone.
Listening to our employeesListening to our employees was crucial to keep them engaged and motivated. To understand their changing needs, we introduced COVID-19 ‘pulse check surveys’ in over 60 markets. The results found people considered health and wellbeing as being crucial to their performance.
This insight was immediately actioned by all leadership teams with an increased focus on mental health and wellbeing alongside more flexible working arrangements.
Our annual Climate survey went ahead in October to understand how people experience working for us. More than 76,000 employees from 81 operating companies shared feedback – a 92% response rate, up from 91% in 2019.
Both the Global Employee Engagement and Performance Enablement scores increased or stayed the same across all global operating companies compared to 2019, at levels significantly higher than the global norm.
Points of improvement included a desire for a better work/life balance and we launched a number of wellbeing initiatives for employees in response.
We also realised the need for more effective collaboration between departments and teams. This will be one of the key initiatives between management and their teams going forward.
Keeping people working on TAPWe experimented with the HEINEKEN Temporary Assignment Platform (TAP) at Head Office as a way to redistribute employee resources during the initial phase of the pandemic. It allowed employees experiencing a reduced workload to take on temporary assignments to support other teams.
As well as supporting the business, employees gained experience in a different role or function, preparing them for future career growth and development.
In its first four weeks, the platform reallocated 4612 hours of work involving around 10% of the Head Office population.
Building a bright futureWhile navigating the crisis, we have maintained our focus on developing the building blocks we need to create a bright future, beyond the pandemic.
‘Inclusive vitamins’ for all employeesInclusion and Diversity is one of our core building blocks. We focused on upskilling our leaders and employees to develop inclusive leadership practices. 1,000 leaders have now attended the Inclusive Leadership training programme.
We also wanted to increase awareness on inclusive behaviours among all employees. To achieve it, we developed and launched global online Inclusive Practices training, easily accessible via our new learning platform.
We have seen a strong focus on inclusion, gender balance, racial inclusion and LGBT+ across our global functions and operating companies throughout the year.
For more information, see page 149
A seamless digital employee experience We are now in the final phase of the global EMPOWER programme, which started in 2018 to bring one HR system (MyHR) to all of our employees worldwide.
MyHR provides the foundation for a seamless employee experience. It provides reliable global people data to the business and greater end-to-end productivity within HR. With European operating companies due to go live in summer 2021, we will reap the full benefits of the programme in the coming year.
Engaging and attracting talentEven during unprecedented challenging times, being seen as a desirable employer matter. Talent with digital expertise remains hard to attract as demand for these skills increases.
We continue to drive engagement with our employer brand via social media. Engagement has increased across many regional and local channels.
Social media has proven the most effective channel for direct conversations and access to potential talent. Operating companies have amplified local activity to keep talent engaged and our global company LinkedIn page achieved 1 million followers, a 32% increase on 2019.
Engage and develop our people
21 Heineken N.V. Annual Report 2020

The world’s most connected brewerWe want to be the best connected, most relevant brewer for consumers living in the digital age. This means building seamless digital interactions across the entire value chain.
We place digital at the core of our business to connect and win with online consumers, retailers and fragmented trade.
2020 was a year of tremendous change as the impact of COVID-19 spanned the globe. With more people staying at home, the trend towards digitalisation accelerated.
The practicality of online shopping provided a welcome convenience for consumers. As a result, e-commerce made a 10 year leap in just 10 weeksat the start of the year.
HEINEKEN found new ways to engage, entertain and provide convenience to consumers. Our efforts to build personalized connections with consumers flourished as Individualized Data Driven Marketing (iDDM) was deployed in nearly 30 markets.
We increased investments in video and audio streaming platforms, found new ways to bring sponsorships into the virtual world and doubled down on e-commerce investments.
5Connect in a digital world
HEINEKEN is always looking for innovative ways to bring people together.
Today, we use the opportunities of digitalisation to connect with consumers
and customers, as we have done throughout our history.
Tiger Street Food Campaign The Tiger Street Food Campaign in Malaysia is an example of exemplary agile thinking in a time of crisis. We organised the world’s first fully immersive, 3D virtual street food festival, offering an escape for those under lock down orders. It delivered a virtual experience and access to 88 local street food vendors offering e-commerce and delivery services. The campaign clearly fulfilled a consumer need as it drove 2511 meal deliveries.
Connect in a digital world
22 Heineken N.V. Annual Report 2020

A truly customer-centric way of working At HEINEKEN we always aim to minimise customer effort and maximise customer experience and value. Our sales reps have developed close relationships with outlet owners and our digital business-to-business platforms build on these connections and provide a better and faster service to customers.
We continuously develop and deploy new digital functionalities to drive value, while creating data-driven insights to grow our business and the business of our customers.
Our B2B platforms are now operational in 25 markets, including key markets such as Brazil, Mexico, South-Africa and Nigeria. By the end of 2020, the number of connected customers in traditional channels had increased to more than 100,000. Across the on- and off-trade, electronic point of sales systems enable us to connect with more customers and consumers with better and broader value-added services.
The best in beer – delivered to your doorDigitalisation accelerated during the year as consumers changed shopping patterns and customers adapted to lockdowns. As a result, our e-commerce platforms showed strong growth.
Beerwulf is our business-to-consumer platform in Europe where consumers can order over 1,000 different beers. It had more than 10 million visitors in 2020, 49% of them new. It grew revenues in the high-double-digits. All markets grew strongly, most notably in the UK where revenues tripled.
Our direct-to-consumer platforms, Beerwulf, Six2Go and Drinkies tripled the number of orders from consumers in the year.
Enabling customer self-service Our online self-service platform in many markets, including Mexico, Brazil, Vietnam, Nigeria and the Netherlands, gives customers a direct and easy way to order our products. They can use it to explore data and find their order history, discover new products and offers, and contact our sales support department.
“The world is changing fast, with tremendous opportunities for the beer industry and HEINEKEN.
Consumers, customers and employees expect a seamless digital experience when they interact with
our brands and our company.”Ronald den Elzen
Chief Digital and Technology Officer
Connect in a digital world
23 Heineken N.V. Annual Report 2020

A balanced geographic footprint.
Wherever you are in the world, you can enjoy one of our brands.
We own, market and sell more than 300 brands in 190 countries.
24 Heineken N.V. Annual Report 2020
Regional Review

“Despite the many challenges of 2020, the long term future for the region remains bright. We believe in the dynamism,
resilience and entrepreneurial spirit of the Africa, Middle East and Eastern Europe region and are committed as a long term
partner for recovery and growth.”Roland Pirmez
President, Africa, Middle East and Eastern Europe
Key brands: Heineken® Primus Amstel Mutzig Goldberg
A partner for recovery 39.6mhlConsolidated beer volume(2019: 43.7mhl)
€2,782mNet revenue (beia)(2019: €3,370m)
17.9%Consolidated beer volume as % of total(2019: 18.1%)
€264mOperating profit (beia)(2019: €408m)
5.6mhlHeineken® volume(2019: 7.2mhl)
10.1%1
Operating profit (beia) as % of total(2019: 9.9%)1
Governments across the region reacted quickly to the COVID-19 pandemic with border closures and strict lockdowns in force. In addition to the public health crisis, the social and economic impact has been significant. South Africa saw the greatest impact with two separate bans on alcohol sales, while restrictions on hospitality, retail and catering were introduced in many markets led to a challenging trading environment. Meanwhile in Ethiopia, a 300% excise increase contributed to a decline in the beer market.
Besides taking all necessary measures to protect our employees from COVID-19, many operating companies reached out to help their local communities respond to the pandemic. In Egypt, over 2,000 families received hygiene kits with disinfectant soap and hygiene information. HEINEKEN South Africa supported #HealtcareHeroes, providing personal protective equipment for healthcare workers and refreshments for hospital kitchens. HEINEKEN Russia joined efforts with selected partners and provided over 6,000 hot meals to hospital staff. The total amount of community support in the Africa, Middle East and Eastern Europe region exceeded €2 million.
Despite the challenges of operating during a global pandemic, major projects were completed successfully, bringing Heineken® local production to Mozambique and DRC for the first time. These investments will further accelerate the growth of the Heineken® brand, which continued to outperform the category supported by strong COVID-19 relevant communications, global platforms and improved affordability.
Our strong commitment to Brewing a Better World remains a priority. We continued to reduce water consumption and carbon emissions in production stabilised at their lowest historical level per hectolitre produced, achieved by implementing good practices. We made significant progress in our local sourcing partnerships in Burundi and Ethiopia.
The ban on the sale of alcohol announced by the South African government put our customers in a dire situation. HEINEKEN South Africa and industry partners helped our customers to re-open their businesses safely and responsibly. Support was provided to educate, train staff, provide personal protective equipment and point of sale safety equipment as well as an innovative e-commerce ‘Click & Collect’ solution to support social distancing and avoid long queues at outlets.
Maltina is growing, reinforcing its credentials with the launch of the two new flavours to appeal to the dynamic taste of Nigerians.
In South Africa, Heineken® 0.0 achieved its position as market leader within the category, supported by increased retail and online availability. In August, Ivory Coast became the first country in Africa to locally brew Desperados taking the number of locally brewed brands in Brassivoire to eight. In Ethiopia, the premium portfolio continued to deliver double-digit growth driven by Bedele Special.
In Russia, cider grew double-digit driven by Mister Lis, a Russian version of Orchard Thieves.
Ivoire brand was back to growth in 2020 thanks to strong performance of Ivoire Black in Ivory Coast.
1 Excluding Head Office & Eliminations
Africa, Middle East and Eastern Europe
25 Heineken N.V. Annual Report 2020

“Our people have shown great resilience throughout the crisis, and together we have delivered strong growth in premium beer
led by Heineken®, launched successful innovations, and with significant cost mitigations continued our profitable growth.”
Marc Busain President, Americas
Key brands: Heineken® Lagunitas Dos Equis Tecate Schin
Strong growth in premium beer
In Ecuador, we launched Heineken® and Amstel and commissioned a canning line at our Guayaquil brewery.
Water shortages are a recurrent issue in Panama s suburbs, an ongoing challenge to basic needs compounded by COVID-19. This is why during the peak of the dry season Cerveza Panamá launched the initiative “Apoyando a Nuestra Gente” delivering drinking water to communities in need, such as San Miguelito, Tocumen, Chilibre.
In the US, Heineken® performed well driven by strong growth of Heineken® 0.0, now the number one non-alcoholic brand in the market with a premium positioning.
In September, we entered the Peruvian beer market with the acquisition of local beer brand, Tres Cruces, and the incorporation of its local operating team in Lima.
We aim to build a diverse portfolio in Peru consisting of local beer brands complemented with our range of leading international brands.
To support Brazil’s bars and restaurants, we initiated the “Brinde do Bem” campaign. HEINEKEN pledged to double the funds raised through the platform to support bars and restaurants impacted by COVID-19.
In November, we extended our partnership with Molson Coors in Canada, signing a new multi-year agreement to manage distribution and sales of Heineken®, Heineken®0.0, Sol, Strongbow, Birra Moretti, Tecate, Dos Equis, Murphy’s Stout and Newcastle Brown Ale until 2025.
In Mexico, the temporary ban on alcohol production in April and May due to COVID-19 had a negative impact on the business.
Customers rebuilt inventories in June but further restrictions were imposed by the Mexican government in July. In September, we launched our new hard seltzer brand, Pura Piraña, in Mexico. It is a refreshing mix of carbonated pure mineral water and a dash of natural fruit flavours with 5% alcohol.
The result is a hard seltzer that is low in carbs, low in sugar, low in calories and vegan-friendly.
In Brazil, Mexico and the US, Heineken® 0.0 had a strong performance in 2020.
79.1mhlConsolidated beer volume(2019: 85.6mhl)
€6,319mNet revenue (beia)(2019: €7,429m)
35.7%Consolidated beer volume as % of total(2019: 35.5%)
€1,045mOperating profit (beia)(2019: €1,204m)
15.9mhlHeineken® volume(2019: 13.4mhl)
39.8%1
Operating profit (beia) as % of total(2019: 29.1%)1
1 Excluding Head Office & Eliminations
Americas
26 Heineken N.V. Annual Report 2020
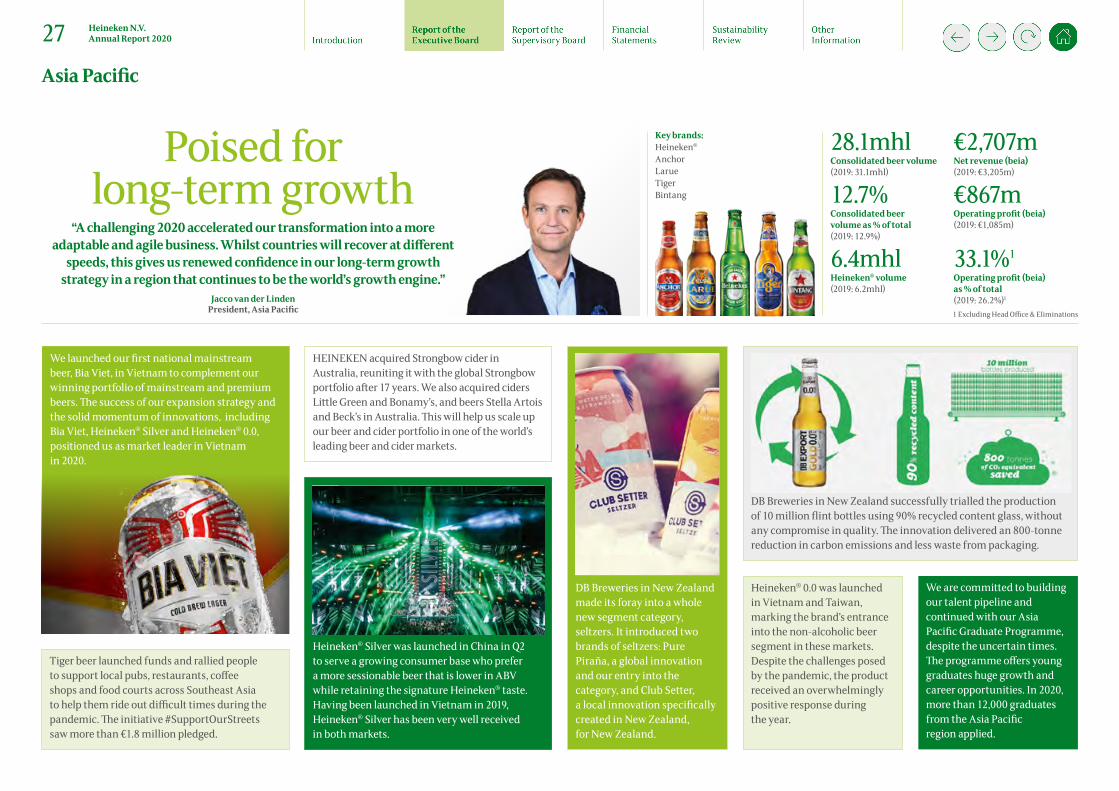
“A challenging 2020 accelerated our transformation into a more adaptable and agile business. Whilst countries will recover at different
speeds, this gives us renewed confidence in our long-term growth strategy in a region that continues to be the world’s growth engine.”
Jacco van der Linden President, Asia Pacific
Key brands: Heineken® Anchor Larue Tiger Bintang
Poised for long-term growth
We launched our first national mainstream beer, Bia Viet, in Vietnam to complement our winning portfolio of mainstream and premium beers. The success of our expansion strategy and the solid momentum of innovations, including Bia Viet, Heineken® Silver and Heineken® 0.0, positioned us as market leader in Vietnam in 2020.
Heineken® Silver was launched in China in Q2 to serve a growing consumer base who prefer a more sessionable beer that is lower in ABV while retaining the signature Heineken® taste. Having been launched in Vietnam in 2019, Heineken® Silver has been very well received in both markets.
We are committed to building our talent pipeline and continued with our Asia Pacific Graduate Programme, despite the uncertain times. The programme offers young graduates huge growth and career opportunities. In 2020, more than 12,000 graduates from the Asia Pacific region applied.
HEINEKEN acquired Strongbow cider in Australia, reuniting it with the global Strongbow portfolio after 17 years. We also acquired ciders Little Green and Bonamy’s, and beers Stella Artois and Beck’s in Australia. This will help us scale up our beer and cider portfolio in one of the world’s leading beer and cider markets.
Tiger beer launched funds and rallied people to support local pubs, restaurants, coffee shops and food courts across Southeast Asia to help them ride out difficult times during the pandemic. The initiative #SupportOurStreets saw more than €1.8 million pledged.
DB Breweries in New Zealand successfully trialled the production of 10 million flint bottles using 90% recycled content glass, without any compromise in quality. The innovation delivered an 800-tonne reduction in carbon emissions and less waste from packaging.
Heineken® 0.0 was launched in Vietnam and Taiwan, marking the brand’s entrance into the non-alcoholic beer segment in these markets. Despite the challenges posed by the pandemic, the product received an overwhelmingly positive response during the year.
DB Breweries in New Zealand made its foray into a whole new segment category, seltzers. It introduced two brands of seltzers: Pure Piraña, a global innovation and our entry into the category, and Club Setter, a local innovation specifically created in New Zealand, for New Zealand.
28.1mhlConsolidated beer volume(2019: 31.1mhl)
€2,707mNet revenue (beia)(2019: €3,205m)
12.7%Consolidated beer volume as % of total(2019: 12.9%)
€867mOperating profit (beia)(2019: €1,085m)
6.4mhlHeineken® volume(2019: 6.2mhl)
33.1%1
Operating profit (beia) as % of total(2019: 26.2%)1
1 Excluding Head Office & Eliminations
Asia Pacific
27 Heineken N.V. Annual Report 2020

“The health and safety of our people and partners was the first priority. This focus allowed us to ensure business continuity.
With the implementation of strong plans, we were able to gain value share in most markets.”
Soren Hagh President, Europe
Key brands: Heineken® Ichnusa Birra Moretti Desperados Strongbow
Share gain in a volatile environment
Heineken® continued to outperform the market despite the challenging backdrop. Even more consumers enjoyed a Heineken® 0.0, now available in 33 markets in Europe.
Our premium portfolio also featured success stories, in particular through Desperados and Birra Moretti.
In late February, the first COVID-19 outbreaks and subsequent lockdowns forced us to reset priorities and change the governance of our businesses in Europe. Management Teams across the region and all operating companies moved into crisis mode – ensuring the safety and health of employees and partners, continuity of operations and minimising financial impacts.
Taking care of our on-trade partners became a fundamental priority. We supported hundreds of thousands of customers via trading and credit terms. We partnered with trade associations and others to develop engaging and collaborative platforms through which consumers and business players could show their solidarity with the sector.
The temporary closure of on-trade outlets and subsequent pressure on top-line performance led to a significant negative impact in this channel. Through the collective efforts of operating companies, the adverse bottom line impact was absorbed by reducing commercial and fixed expenses.
In December, HEINEKEN, Nouryon, Philips and Signify formed the first consortium to sign a Pan-European green energy deal securing additional renewable electricity for Europe. The four companies have a shared vision to reduce CO2 emissions in support of the UN Paris Agreement and the European Green Deal objectives. HEINEKEN will source renewable electricity for an additional 28 of its European production sites.
We continued to selectively invest in local craft brewers and acquired Texelse Bierbrouwerij, which will complement our brand portfolio in the Netherlands.
Our pubs business in the UK, Star Pubs & Bars, supported licensees with rent reductions, help with business continuity, restocking and practical advice on creating a safe environment for consumers.
After a solid third quarter, the re-emergence of the pandemic in October resulted in new local and national lockdowns and widespread restrictions. This primarily affected, but was not limited to, on-trade operations. The negative impact from the on-trade closures was accentuated as in certain markets we own beverage wholesalers and pubs.
Total beer volumes fell high-single digits, marked by the unprecedented channel shift to take-home in the midst of lockdown measures. Markets less exposed to the on-trade, such as Poland and Romania, successfully offset volume losses in hospitality through strong performance in off-trade.
All markets, especially the UK, France, Spain, Ireland, the Netherlands and Italy, saw strong off-trade volume developments as consumer occasions shifted to their homes. This resulted in significant value market-share gains in most European markets, supported through strong supply chains and commercial plans. The latter supported winning share in the premium segment, driven by strong international brands and local jewels such as Ichnusa in Italy.
74.8mhlConsolidated beer volume(2019: 81.0mhl)
€8,631mNet revenue (beia)(2019: €10,629m)
33.7%Consolidated beer volume as % of total(2019: 33.6%)
€447mOperating profit (beia)(2019: €1,436m)
13.9mhlHeineken® volume(2019: 14.9mhl)
17.0%1
Operating profit (beia) as % of total(2019: 34.8%)1
1 Excluding Head Office & Eliminations
Europe
28 Heineken N.V. Annual Report 2020
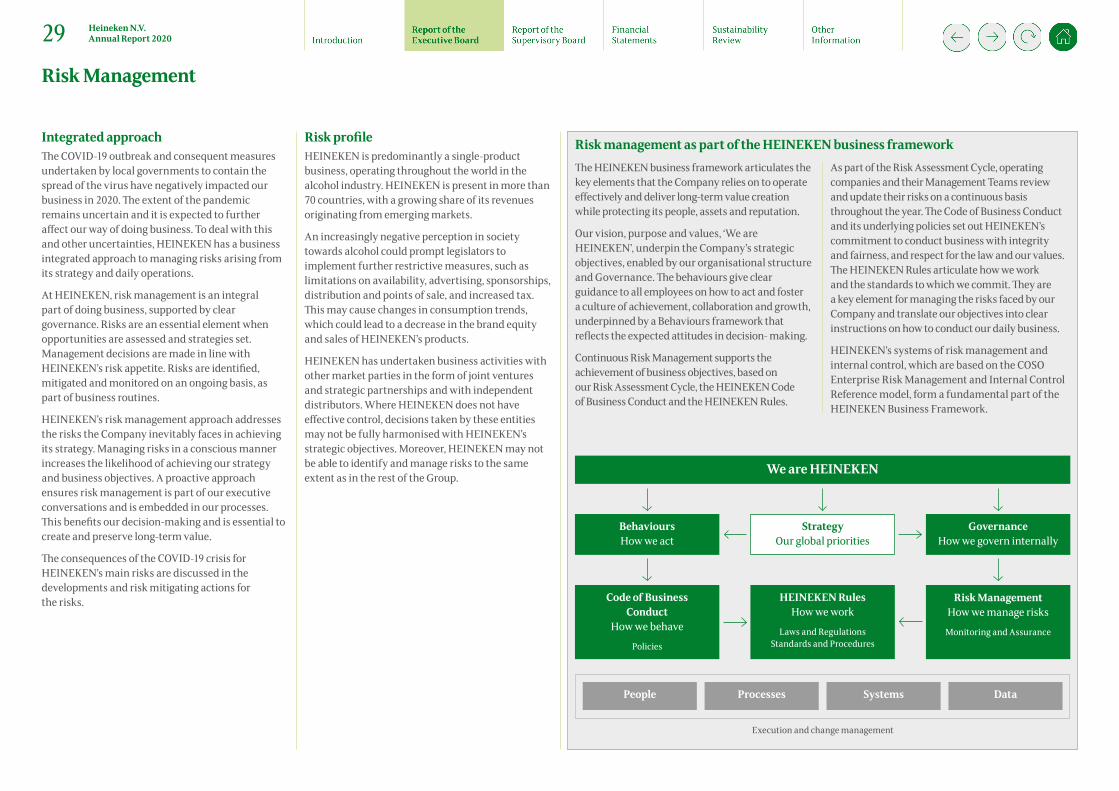
Execution and change management
People Processes Systems Data
Code of Business Conduct
How we behave
Policies
Behaviours How we act
We are HEINEKEN
HEINEKEN Rules How we work
Laws and Regulations Standards and Procedures
Strategy Our global priorities
Risk Management How we manage risks
Monitoring and Assurance
Governance How we govern internally
Integrated approachThe COVID-19 outbreak and consequent measures undertaken by local governments to contain the spread of the virus have negatively impacted our business in 2020. The extent of the pandemic remains uncertain and it is expected to further affect our way of doing business. To deal with this and other uncertainties, HEINEKEN has a business integrated approach to managing risks arising from its strategy and daily operations.
At HEINEKEN, risk management is an integral part of doing business, supported by clear governance. Risks are an essential element when opportunities are assessed and strategies set. Management decisions are made in line with HEINEKEN’s risk appetite. Risks are identified, mitigated and monitored on an ongoing basis, as part of business routines.
HEINEKEN’s risk management approach addresses the risks the Company inevitably faces in achieving its strategy. Managing risks in a conscious manner increases the likelihood of achieving our strategy and business objectives. A proactive approach ensures risk management is part of our executive conversations and is embedded in our processes. This benefits our decision-making and is essential to create and preserve long-term value.
The consequences of the COVID-19 crisis for HEINEKEN’s main risks are discussed in the developments and risk mitigating actions for the risks.
Risk profileHEINEKEN is predominantly a single-product business, operating throughout the world in the alcohol industry. HEINEKEN is present in more than 70 countries, with a growing share of its revenues originating from emerging markets.
An increasingly negative perception in society towards alcohol could prompt legislators to implement further restrictive measures, such as limitations on availability, advertising, sponsorships, distribution and points of sale, and increased tax. This may cause changes in consumption trends, which could lead to a decrease in the brand equity and sales of HEINEKEN’s products.
HEINEKEN has undertaken business activities with other market parties in the form of joint ventures and strategic partnerships and with independent distributors. Where HEINEKEN does not have effective control, decisions taken by these entities may not be fully harmonised with HEINEKEN’s strategic objectives. Moreover, HEINEKEN may not be able to identify and manage risks to the same extent as in the rest of the Group.
Risk management as part of the HEINEKEN business frameworkThe HEINEKEN business framework articulates the key elements that the Company relies on to operate effectively and deliver long-term value creation while protecting its people, assets and reputation.
Our vision, purpose and values, ‘We are HEINEKEN’, underpin the Company’s strategic objectives, enabled by our organisational structure and Governance. The behaviours give clear guidance to all employees on how to act and foster a culture of achievement, collaboration and growth, underpinned by a Behaviours framework that reflects the expected attitudes in decision- making.
Continuous Risk Management supports the achievement of business objectives, based on our Risk Assessment Cycle, the HEINEKEN Code of Business Conduct and the HEINEKEN Rules.
As part of the Risk Assessment Cycle, operating companies and their Management Teams review and update their risks on a continuous basis throughout the year. The Code of Business Conduct and its underlying policies set out HEINEKEN’s commitment to conduct business with integrity and fairness, and respect for the law and our values. The HEINEKEN Rules articulate how we work and the standards to which we commit. They are a key element for managing the risks faced by our Company and translate our objectives into clear instructions on how to conduct our daily business.
HEINEKEN’s systems of risk management and internal control, which are based on the COSO Enterprise Risk Management and Internal Control Reference model, form a fundamental part of the HEINEKEN Business Framework.
Risk Management
29 Heineken N.V. Annual Report 2020

Risk appetiteHEINEKEN’s risk appetite is the result of its wide geographical spread, prudent financial management and commitment to long-term value creation. Risks are taken consciously, assessing their impact on HEINEKEN’s objectives. The level of risk HEINEKEN is willing to take depends on the type of objective it impacts (reputational, financial or business continuity related).
ReputationalHEINEKEN is reliant on the reputation of its brands and the protection of its intellectual property rights. Reputation management is of utmost importance to HEINEKEN. We have invested considerable effort in protecting our brands, including the registration of trademarks and domain names. We aim to reduce the risks that could negatively impact our reputation to the furthest extent possible, accepting that this may come at a cost.
FinancialHEINEKEN is keen on pursuing commercial opportunities to deliver top line growth, accepting uncertainties linked to its strategic choices and the context of the individual markets in which it operates.
Business continuityHEINEKEN makes the availability of its brands a priority, accepting only minimal disruptions to its operations. In addition, HEINEKEN continuously invests to make the organisation future-proof and ensure the sustainability of the business.
Internal controlHEINEKEN’s internal control activities aim to provide reasonable assurance as to the accuracy of financial information, non-financial disclosures, the Company’s compliance with applicable laws and internal policies, and the effectiveness of internal processes.
Internal controls have been defined at operating entity level (HEINEKEN Rules, comprising all mandatory standards and procedures) and at process level (Process and Control Standards) for key processes, including financial reporting, IT and Tax.
Compliance with company policies is periodically assessed. Deviations from the defined standards are included in the global monitoring and follow-up processes, supporting management in addressing these deviations. Management is responsible for definition and timely implementation of action plans to remediate any deficiency identified as part of these assessments. The results are reported to the Executive Board.
The Company Rules, policies and controls are periodically updated to reflect both the Company key risks and the extent to which the Company is willing and able to mitigate them.
Risk CommitteeThe Executive Board of HEINEKEN is accountable for risk management, risk oversight and the protection of HEINEKEN’s reputation, value of assets and brands.
The Board is assisted by the Risk Committee, chaired by the CFO, in regular reviews of the Group risk assessment cycle that summarises the Company’s key risks, associated mitigating actions and monitoring activities. These reviews consider the level of risk that HEINEKEN is willing to take and the type of HEINEKEN’s objectives it impacts.
The Risk Committee identifies changes to the Company’s risk exposure and proposes interventions if required.
OrganisationFor the organisation of risk management activities, HEINEKEN applies a ‘three lines of defence’ model. First and most important is the quality and behaviour of operational management, the first line of defence. They have the ownership, responsibility and accountability for assessing and mitigating risks.
Operational management is supported by the second line of defence functions that oversee compliance with HEINEKEN’s policies, processes and controls, facilitate the implementation of risk management practices and drive continuous improvements of internal controls.
As third line of defence, the internal audit function (‘Global Audit’) is mandated to perform Group-wide reviews of key processes, projects and systems, based on HEINEKEN’s strategic priorities and most significant risk areas. Global Audit provides independent and objective assurance and consultancy services. It employs a systematic and disciplined approach to evaluate and improve the organisation’s governance and risk management process including reliability of information, compliance with laws, regulations and procedures, and efficient and effective use of resources. The methodology followed by Global Audit is in accordance with the standards of the Institute of Internal Auditors.
To support the Executive Board’s external representations, a formal bi-annual Letter of Representation (LoR) process is in place. It requires management to take responsibility and covers financial and non-financial reporting disclosures, financial reporting controls, compliance with the Code of Conduct and other HEINEKEN Rules, as well as fraud and irregularities.
ProcessesHEINEKEN’s risk management activities seek to identify and appropriately address any significant threat to the achievement of the Company’s strategy and business objectives, its reputation and the continuity of its operations.
HEINEKEN’s risk management system enables management to identify, assess, prioritise and manage risks on a continuous and systematic basis, and covers all subsidiaries across regions, countries, markets and corporate functions. Ongoing identification and assessment of risks, including new risks arising from changes in the global or local business environment, are part of HEINEKEN’s planning, performance and risk management cycles. Risk assessments are performed by every subsidiary and all global functions. The implementation of responses and progress of risk mitigating measures is monitored on a quarterly basis.
Risk assessment outcomes are aggregated at a global level and serve as basis for determining HEINEKEN’s risk exposure and risk management priorities by the Risk Committee. Accountability for mitigating, monitoring and reporting on the most significant risks is assigned to functional directors who report on progress and residual risk levels three times per year to the Risk Committee.
HEINEKEN continues to invest in the further improvement of risk management in the Company. Built on the basis of the existing risk and controls mechanisms, several improvements have been implemented. These are aimed at driving business ownership of risks, increasing business involvement in risk management and expanding the integrated view of risks and controls.
Risk Management
30 Heineken N.V. Annual Report 2020

The following risk overview highlights the main risks that could hinder HEINEKEN in achieving its strategy and business objectives.
We recognise that this is not a full overview of all risks and uncertainties that may affect the Company. As new risks emerge and existing immaterial risks evolve, timely discovery and accurate evaluation of risks are at the core of HEINEKEN’s risk management system.
– Financial risks are reported separately in note 11.5 to the Financial Statements on page 105.
– The Statement of the Executive Board is included in the Corporate Governance Statement on page 48.
– The way we manage our Responsible Consumption, Business Conduct and Human Rights risks are further detailed in the Sustainability Review section of our Annual Report on pages 125-159.
Regulatory changes related to alcohol
What could happen?The topic of alcohol and health is under scrutiny in many markets. This may prompt regulators to take further measures limiting HEINEKEN’s freedom to operate, such as restrictions or bans on advertising and marketing, sponsorship, availability of products, adding health warnings to labels, increased taxes and duties or the imposition of minimum unit pricing. These could lead to lower overall consumption or to consumers switching to different product categories.
Recent developmentsRestrictive measures on alcohol consumption and sales continue to be taken by authorities and regulators across all four regions.Many governments have responded to the COVID-19 pandemic with measures that directly or indirectly impact alcohol producers. In particular, measures impacting breweries, bars, restaurants, hotels and other locations where people come together have become a frequent tool for governments trying to mitigate infection rates. These policies restrict the availability of our products and can have a negative impact on our business in affected markets.
What we are doing to manage this risk?HEINEKEN strongly believes in the importance of reducing alcohol related harm and responsible consumption is one of the priorities of HEINEKEN’s Brewing a Better World sustainability programme. Using the power and reach of its brands through campaigns like the award-winning When You Drive Never Drink, HEINEKEN strives to make responsible consumption aspirational for all consumers.The Company works closely with local governments, NGOs and specialists to prevent and reduce harm caused by abuses such as underage drinking or drinking and driving. We are expanding consumer choice for those who choose not to drink alcohol by providing low- and no-alcohol brands. With respect to COVID-19, we have proactively communicated with our operating companies around the world to share best practices for adapting to unexpected restrictions and mitigating negative consequences.
Explore Further: Advocating responsible consumptions, pages 140-143
Economic and political environment
What could happen?Throughout the world, local or regional economic and political uncertainties could impact our business and that of our customers. In particular, the risk of an economic recession, change of law, trade restrictions, inflation, fluctuations in exchange rates, devaluation, nationalisation, financial crisis or social unrest could adversely affect our revenues and profits.
Recent developmentsCOVID-19 has forced major containment measures, diminished economic activity and required drastic fiscal and monetary actions to protect jobs and markets. More structural shifts could happen and lead to a prolonged recession of the global economy, with increasing risk of bankruptcies and the potential failure of certain sectors to fully recover, despite the unprecedented response from governments. As a consequence, structural unemployment – especially for youth – is likely to surge with knock-on effects on consumer demand. Public debt, the disruption of global value chains and barriers to the cross-border movement of people and goods round out the key risks.Agility has become a priority to enable businesses to navigate subsequent changes in laws, currency movements, import restrictions, scarcity of hard currencies, commodity pricing and their impact on the Company’s profit.
What are we doing to manage this risk?HEINEKEN has set up various tools to limit the impact of such events on its business. They include supplier management, short-term liquidity management, tight foreign exchange monitoring, prudent balance sheet measures and scenario planning in respect to resource allocation. We have monitoring mechanisms in place globally and locally to allow us to monitor, report and engage proactively on political risks. For events which could threaten the continuity of the business, contingency plans are in place. We continuously review our costs base to increase operating leverage.
Environmental legislation
What could happen?HEINEKEN not being able to respond to the impact of environment-related changes on our operations in a timely manner. If new environmental legislation is introduced, this could lead to legal claims, increased compliance costs, restrictions on production, packaging, distribution, selling and marketing of our products, reputation damage, and limits on our licence to operate resulting in negative business impact.
Recent developmentsSpeed and scope of environment-related changes on our operations are increasing. Markets need to be prepared to timely respond and adapt to these changes to prevent restrictions in all areas of the value chain and significant costs to ensure compliance.
What are we doing to manage this risk?Environmental sustainability is one of the priorities of HEINEKEN’s Brewing a Better World sustainable development strategy. HEINEKEN continuously monitors existing and emerging environmental issues and regulations across the globe to ensure awareness and compliance and to prepare the business for future changes. Beyond this, HEINEKEN closely works with experts such as NGOs, universities, governmental organisations and suppliers across the value chain. It also co-operates with peer companies in international and national organisations such as Brewers of Europe, Beverage Industry Environmental Roundtable and the Dutch Sustainable Growth Coalition.
Risk ManagementMain Risks
31 Heineken N.V. Annual Report 2020

Leadership, talent and capabilities
What could happen?HEINEKEN relies on the skills and capabilities of its people to deliver its strategic ambitions. If HEINEKEN is not successful in attracting, developing and retaining diverse and talented people and leaders with the required capabilities, it may jeopardise its capacity to execute its strategy and achieve the targeted returns.
Recent developmentsWe accelerated the launch of our global learning experience platform to enable continuous development and support all employees to develop the skills, knowledge and mind-set to succeed in a digital age. Across our global functions and operating companies, there is a strong focus on inclusion with many different initiatives globally, regionally and locally.
What are we doing to manage this risk?We focus on striking the right balance between building internal capabilities/upskilling our employees and external talent acquisition. We continue to grow leaders who are focused on developing the business, their teams and themselves and we will update our Leadership Expectations so our leaders embrace changes required to deliver our strategy and bring these to life in their teams.Capability building is key. We will revamp our capability building approach to further support the business via identifying and developing companywide critical capabilities and harmonizing our capability framework across the organisation.We will refresh our Talent Management philosophy to be more leader-led. This includes a targeted approach in talent acquisition amongst key talent groups. Our Inclusion and Diversity strategy will be updated to include transparent ambitions and metrics.
Explore Further: Engage and develop our people, pages 20-21 Values and behaviours, page 148 Inclusion and diversity, page 149
Industry consolidation
What could happen?Consolidation in the alcoholic beverage industry may affect existing market dynamics due to competitive disadvantage with suppliers and increased competition on commercial spend and customer acquisition strategies.
Recent developmentsDespite recent market consolidation, beer remains a very local industry with respective country shares more relevant than global share. Further impact could come from consolidation on the customer side.
What are we doing to manage this risk?HEINEKEN is constantly working to improve its cost efficiency while rolling out a strategy to maintain and develop its competitive advantages, in particular in the premium and cider markets.Through a number of acquisitions, HEINEKEN has evolved its footprint to reach an optimal balance of higher growth developing markets and more stable developed markets and to build an extensive and complementary brand portfolio, alongside its flagship Heineken® brand. HEINEKEN is actively cooperating with local craft brewers, participating in capital and sharing knowledge to keep the beer category attractive and relevant for consumers. To continue winning on the customer side, HEINEKEN explores and implements news ways of working and new channels, including digital/e-commerce platforms.
Explore Further: Deliver top line growth, pages 10-15 Drive end2end performance, page 16
Health and Safety
What could happen?HEINEKEN aims to provide a safe workplace for all employees and contractors. Despite the controls in place, HEINEKEN employees, contractors and visitors may be impacted by uncontrolled events in the brewery, supply chain, in the route-to-market or in our offices, which could lead to illness, serious injuries or fatalities.
Recent developmentsDespite our continuous efforts to provide safe working conditions, several fatal accidents have occurred, underlining the importance of realising further improvements in the area of safety. Since its outbreak in the first quarter of 2020, COVID-19 has evolved into a global pandemic. HEINEKEN set as its first priority the health and safety of its people. The lack of quality (emergency) health care in general remains a challenge in all developing countries for our national and international employees and their family members.
What are we doing to manage this risk?HEINEKEN has established ‘Put Safety First’ as a key behaviour for employees at all levels. Health and safety is a priority of its Brewing a Better World programme. Throughout the entire supply chain, the HEINEKEN Life Saving Rules target the activities that carry the greatest safety risks to employees and contractors. Special focus areas with dedicated support include road safety, contract safety and leadership and development. We provide medical care, including HIV and emergency care. This is continuously being supported and monitored by Global Health. Operating companies facing epidemics or other natural disasters receive specific support when needed.HEINEKEN has responded in a coordinated manner to the COVID-19 pandemic. A global crisis coordination structure was put in place early on. Global measures, guidelines and policies were set to protect our employees, their family members and ensure business continuity. These measures were updated and adapted in response to the evolution of the pandemic.
Explore Further: Promoting Health and Safety, pages 144-145 Engage and develop our people, pages 20-21
Changing consumer preferences
What could happen?Consumers’ preferences and behaviours are evolving, shaping an increasingly complex and fragmented beer and broader beverages category. This requires HEINEKEN to constantly adapt its product offering, innovate and invest to maintain the relevance and strength of its brands. Failure to do so would, in the longer term, affect our revenues, market share and, possibly, our brand equity.
Recent developmentsThe popularity of craft beer and the rise of low- and no-alcohol products have been the most noticeable changes in consumer tastes in recent years. In particular, there is an increased consumer focus on health and well-being resulting in a growing interest in low-alcohol, low-calorie and low-carb propositions. The seltzer category has also grown significantly, representing both risk and opportunity.
What are we doing to manage this risk?HEINEKEN has fully embraced these recent developments, with a focused craft and variety strategy as well as increasing investment in the zero alcohol category, beyond Heineken®. We are increasing our portfolio, launching Zero Zones and have multiple propositions in flavoured drinks (including cider and seltzers). While expanding into adjacent categories, we focus on natural credentials similar to brewing and maintain a focus on adult and refreshing products.
Explore Further: Deliver top line growth, pages 10-15 Advocating responsible consumption, pages 140-143
Risk Management
32 Heineken N.V. Annual Report 2020
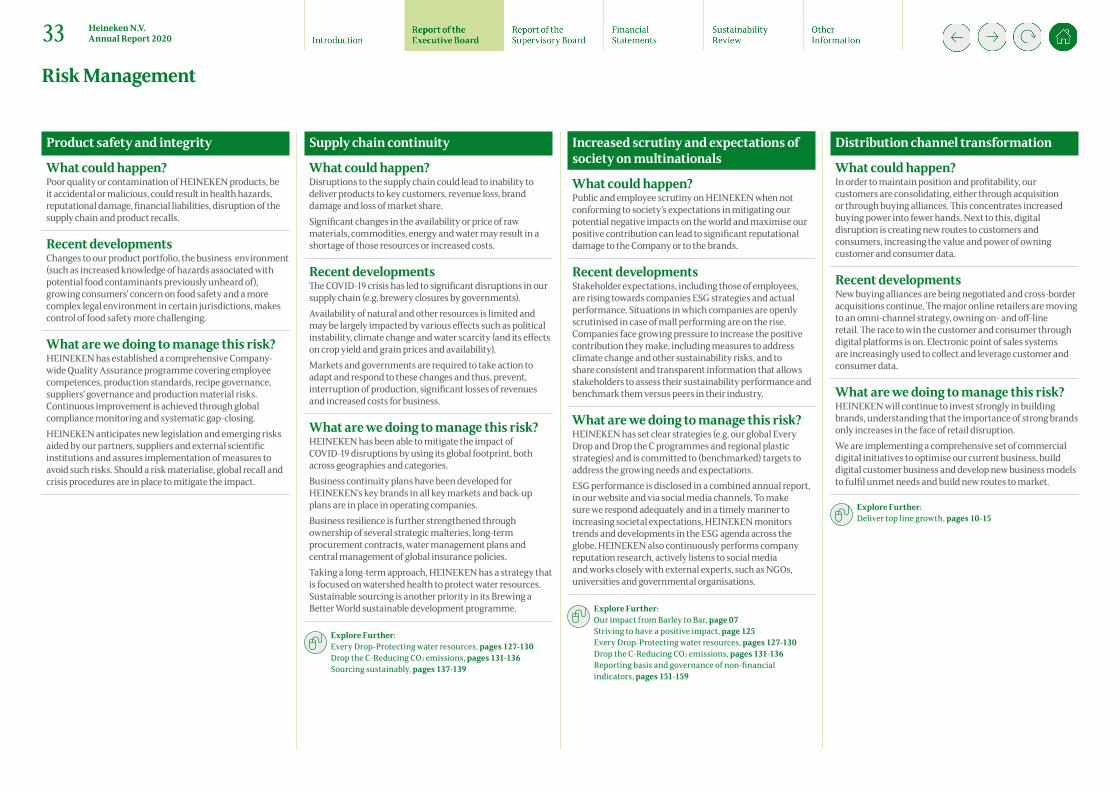
Supply chain continuity
What could happen?Disruptions to the supply chain could lead to inability to deliver products to key customers, revenue loss, brand damage and loss of market share. Significant changes in the availability or price of raw materials, commodities, energy and water may result in a shortage of those resources or increased costs.
Recent developmentsThe COVID-19 crisis has led to significant disruptions in our supply chain (e.g. brewery closures by governments). Availability of natural and other resources is limited and may be largely impacted by various effects such as political instability, climate change and water scarcity (and its effects on crop yield and grain prices and availability). Markets and governments are required to take action to adapt and respond to these changes and thus, prevent, interruption of production, significant losses of revenues and increased costs for business.
What are we doing to manage this risk?HEINEKEN has been able to mitigate the impact of COVID-19 disruptions by using its global footprint, both across geographies and categories. Business continuity plans have been developed for HEINEKEN’s key brands in all key markets and back-up plans are in place in operating companies. Business resilience is further strengthened through ownership of several strategic malteries, long-term procurement contracts, water management plans and central management of global insurance policies. Taking a long-term approach, HEINEKEN has a strategy that is focused on watershed health to protect water resources. Sustainable sourcing is another priority in its Brewing a Better World sustainable development programme.
Explore Further: Every Drop-Protecting water resources, pages 127-130 Drop the C-Reducing CO2 emissions, pages 131-136 Sourcing sustainably, pages 137-139
Increased scrutiny and expectations of society on multinationals
What could happen?Public and employee scrutiny on HEINEKEN when not conforming to society’s expectations in mitigating our potential negative impacts on the world and maximise our positive contribution can lead to significant reputational damage to the Company or to the brands.
Recent developmentsStakeholder expectations, including those of employees, are rising towards companies ESG strategies and actual performance. Situations in which companies are openly scrutinised in case of mall performing are on the rise. Companies face growing pressure to increase the positive contribution they make, including measures to address climate change and other sustainability risks, and to share consistent and transparent information that allows stakeholders to assess their sustainability performance and benchmark them versus peers in their industry.
What are we doing to manage this risk?HEINEKEN has set clear strategies (e.g. our global Every Drop and Drop the C programmes and regional plastic strategies) and is committed to (benchmarked) targets to address the growing needs and expectations. ESG performance is disclosed in a combined annual report, in our website and via social media channels. To make sure we respond adequately and in a timely manner to increasing societal expectations, HEINEKEN monitors trends and developments in the ESG agenda across the globe. HEINEKEN also continuously performs company reputation research, actively listens to social media and works closely with external experts, such as NGOs, universities and governmental organisations.
Explore Further: Our impact from Barley to Bar, page 07 Striving to have a positive impact, page 125 Every Drop-Protecting water resources, pages 127-130 Drop the C-Reducing CO2 emissions, pages 131-136 Reporting basis and governance of non-financial indicators, pages 151-159
Distribution channel transformation
What could happen?In order to maintain position and profitability, our customers are consolidating, either through acquisition or through buying alliances. This concentrates increased buying power into fewer hands. Next to this, digital disruption is creating new routes to customers and consumers, increasing the value and power of owning customer and consumer data.
Recent developmentsNew buying alliances are being negotiated and cross-border acquisitions continue. The major online retailers are moving to an omni-channel strategy, owning on- and off-line retail. The race to win the customer and consumer through digital platforms is on. Electronic point of sales systems are increasingly used to collect and leverage customer and consumer data.
What are we doing to manage this risk?HEINEKEN will continue to invest strongly in building brands, understanding that the importance of strong brands only increases in the face of retail disruption. We are implementing a comprehensive set of commercial digital initiatives to optimise our current business, build digital customer business and develop new business models to fulfil unmet needs and build new routes to market.
Explore Further: Deliver top line growth, pages 10-15
Product safety and integrity
What could happen?Poor quality or contamination of HEINEKEN products, be it accidental or malicious, could result in health hazards, reputational damage, financial liabilities, disruption of the supply chain and product recalls.
Recent developmentsChanges to our product portfolio, the business environment (such as increased knowledge of hazards associated with potential food contaminants previously unheard of), growing consumers’ concern on food safety and a more complex legal environment in certain jurisdictions, makes control of food safety more challenging.
What are we doing to manage this risk?HEINEKEN has established a comprehensive Company-wide Quality Assurance programme covering employee competences, production standards, recipe governance, suppliers’ governance and production material risks. Continuous improvement is achieved through global compliance monitoring and systematic gap-closing. HEINEKEN anticipates new legislation and emerging risks aided by our partners, suppliers and external scientific institutions and assures implementation of measures to avoid such risks. Should a risk materialise, global recall and crisis procedures are in place to mitigate the impact.
Risk Management
33 Heineken N.V. Annual Report 2020
Execution and change management
What could happen?In recent years, HEINEKEN has engaged in several significant business transformation programmes. Our large number of operating companies and fragmented data and technology landscape represent specific challenges to these programmes. These strategic transformation programmes may not deliver the expected benefits or may incur significant cost or time overruns.
Recent developmentsAs the world becomes more digital, data is more and more an asset for a company and technological developments quickly follow each other. HEINEKEN will need to continue to develop in this area to not lose the battle for the customer and consumer and ensure it is efficient as possible.
What are we doing to manage this risk?Via our portfolio management approach, we apply a consistent project and programme methodology and governance, placing ownership of the whole portfolio at top management level. HEINEKEN aims to prioritise and optimise resource allocation across its major programmes to ensure they deliver on their objectives and proactively mitigate the programme risks. The new Data & Technology department, with representation on the Executive Team, will further drive standardisation and harmonisation of our data and technical landscape over our operating companies.
Reporting
What could happen?Historically, HEINEKEN has grown its footprint organically and through mergers and acquisitions, leading to a diverse landscape of processes and systems and a low level of centralisation. Deviations from the common accounting and reporting processes and related controls could impair the accuracy of financial and non-financial data used for Group reporting and external communications.
Recent developmentsEnhanced techniques and technology have become available to strengthen the control environment and to deliver more efficient and robust financial and non-financial data.As a result of the COVID-19 pandemic, the importance of estimates has increased. Given the uncertainty of the impact of the COVID-19 pandemic, providing reliable estimates has inherently become more difficult and greater judgement is involved.
What are we doing to manage this risk?HEINEKEN is utilising enhanced techniques and technology to continue to drive the improvement and standardisation of its accounting and reporting processes and controls and to harmonise its system landscape. HEINEKEN has implemented a common framework across its operating companies which includes Internal Control over Financial Reporting, Common Accounting Policies, Standard Chart of Accounts and periodic mandatory trainings. Relating to the COVID-19 pandemic, specific accounting guidance has been shared with HEINEKEN’s operating companies. The assurance model includes active monitoring of control execution, critical access and segregation of duties. HEINEKEN continues to strengthen the governance around non-financial data to further improve the quality of the data reported under its Brewing a Better World programme.
Explore Further: Reporting basis governance of non-financial indicators, pages 151-159Notes to the Consolidated Financial Statements pages 71-117
Non-compliance
What could happen?Changes in the legal and regulatory environment tend to increase the risk of non-compliance with local and global laws and regulations. Failure to comply with applicable laws and regulations could lead to claims, enforcement and reputational damage. Recent health trends may lead to an increased risk of consumers making claims.
Recent developmentsAcross many geographies, law enforcement has increased over the past years, in particular with regard to anti-bribery and corruption, competition and data privacy laws, and human rights. This leads to increased risk of allegations of violations of laws and regulations by law enforcers as well as by private parties.
What are we doing to manage this risk?HEINEKEN is constantly looking to enhance its internal compliance system and resilience to adapt to changes in the legal environment. HEINEKEN has embedded legal compliance in its risk and controls system and has established processes and governance to drive implementation and compliance with the Company Rules and the HEINEKEN Code of Business Conduct.
Explore Further: Values and behaviours, page 148Corporate Governance Statement, pages 40-48
Information Security
What could happen?HEINEKEN’s business increasingly relies on IT, both in the office environment and in the industrial control domain of its breweries. Failure of systems or cyber security incidents could lead to business disruption, loss of confidential information, access and availability to our data, breach of data privacy regulations, and financial or reputational damage.
Recent developmentsWe are more connected than ever and HEINEKEN increasingly relies on technology, both in our office environment as well as in the industrial control domain of our breweries. Online threats keep growing and becoming more sophisticated with potential consequences are more punitive and destructive in nature. Exposure to cybercrime is increasing and regulations place stricter security requirements on data processing.
What are we doing to manage this risk?Cyber security is a top priority within HEINEKEN. Our cybersecurity program, which is evaluated regularly, is executed to address IT and Industrial Control Systems security globally. Our Cyber Defence Operations monitors cyber-attacks 24/7 globally. We use a global cybersecurity framework to address confidentiality, integrity and availability risks. It is focused on enhancing the resilience of our IT and Industrial Control Systems and increasing employee security awareness.
Risk Management
34 Heineken N.V. Annual Report 2020
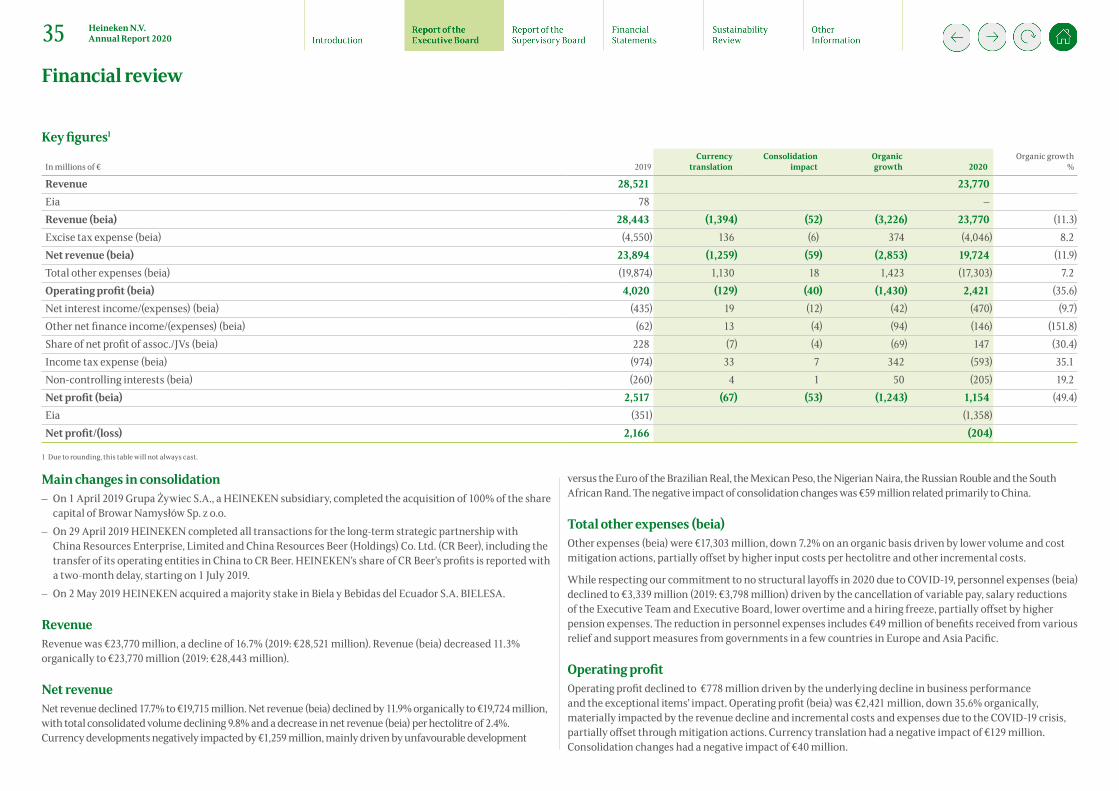
Main changes in consolidation – On 1 April 2019 Grupa Żywiec S.A., a HEINEKEN subsidiary, completed the acquisition of 100% of the share
capital of Browar Namysłów Sp. z o.o. – On 29 April 2019 HEINEKEN completed all transactions for the long-term strategic partnership with
China Resources Enterprise, Limited and China Resources Beer (Holdings) Co. Ltd. (CR Beer), including the transfer of its operating entities in China to CR Beer. HEINEKEN’s share of CR Beer’s profits is reported with a two-month delay, starting on 1 July 2019.
– On 2 May 2019 HEINEKEN acquired a majority stake in Biela y Bebidas del Ecuador S.A. BIELESA.
Revenue Revenue was €23,770 million, a decline of 16.7% (2019: €28,521 million). Revenue (beia) decreased 11.3% organically to €23,770 million (2019: €28,443 million).
Net revenue Net revenue declined 17.7% to €19,715 million. Net revenue (beia) declined by 11.9% organically to €19,724 million, with total consolidated volume declining 9.8% and a decrease in net revenue (beia) per hectolitre of 2.4%. Currency developments negatively impacted by €1,259 million, mainly driven by unfavourable development
versus the Euro of the Brazilian Real, the Mexican Peso, the Nigerian Naira, the Russian Rouble and the South African Rand. The negative impact of consolidation changes was €59 million related primarily to China.
Total other expenses (beia) Other expenses (beia) were €17,303 million, down 7.2% on an organic basis driven by lower volume and cost mitigation actions, partially offset by higher input costs per hectolitre and other incremental costs.
While respecting our commitment to no structural layoffs in 2020 due to COVID-19, personnel expenses (beia) declined to €3,339 million (2019: €3,798 million) driven by the cancellation of variable pay, salary reductions of the Executive Team and Executive Board, lower overtime and a hiring freeze, partially offset by higher pension expenses. The reduction in personnel expenses includes €49 million of benefits received from various relief and support measures from governments in a few countries in Europe and Asia Pacific.
Operating profitOperating profit declined to €778 million driven by the underlying decline in business performance and the exceptional items’ impact. Operating profit (beia) was €2,421 million, down 35.6% organically, materially impacted by the revenue decline and incremental costs and expenses due to the COVID-19 crisis, partially offset through mitigation actions. Currency translation had a negative impact of €129 million. Consolidation changes had a negative impact of €40 million.
Key figures1
In millions of € 2019Currency
translationConsolidation
impact Organic growth 2020
Organic growth%
Revenue 28,521 23,770 Eia 78 – Revenue (beia) 28,443 (1,394) (52) (3,226) 23,770 (11.3)Excise tax expense (beia) (4,550) 136 (6) 374 (4,046) 8.2 Net revenue (beia) 23,894 (1,259) (59) (2,853) 19,724 (11.9)Total other expenses (beia) (19,874) 1,130 18 1,423 (17,303) 7.2 Operating profit (beia) 4,020 (129) (40) (1,430) 2,421 (35.6)Net interest income/(expenses) (beia) (435) 19 (12) (42) (470) (9.7)Other net finance income/(expenses) (beia) (62) 13 (4) (94) (146) (151.8)Share of net profit of assoc./JVs (beia) 228 (7) (4) (69) 147 (30.4)Income tax expense (beia) (974) 33 7 342 (593) 35.1 Non-controlling interests (beia) (260) 4 1 50 (205) 19.2 Net profit (beia) 2,517 (67) (53) (1,243) 1,154 (49.4)Eia (351) (1,358)Net profit/(loss) 2,166 (204)
1 Due to rounding, this table will not always cast.
Financial review
35 Heineken N.V. Annual Report 2020
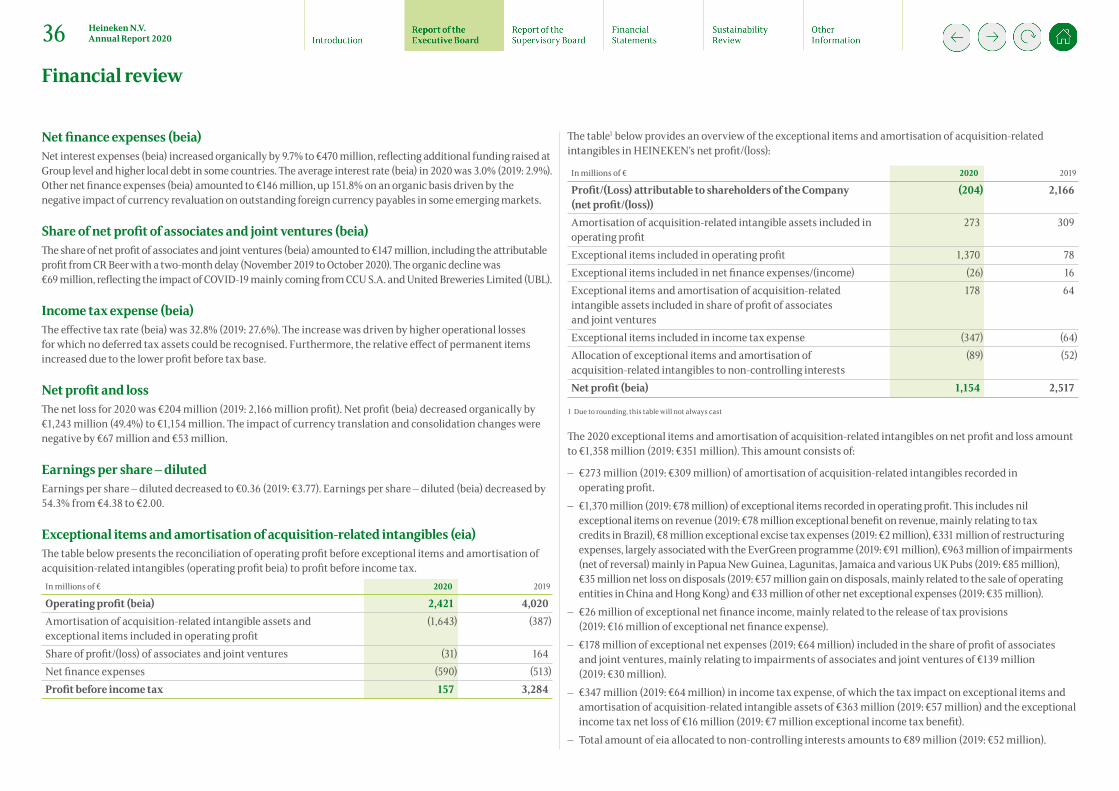
Net finance expenses (beia)Net interest expenses (beia) increased organically by 9.7% to €470 million, reflecting additional funding raised at Group level and higher local debt in some countries. The average interest rate (beia) in 2020 was 3.0% (2019: 2.9%). Other net finance expenses (beia) amounted to €146 million, up 151.8% on an organic basis driven by the negative impact of currency revaluation on outstanding foreign currency payables in some emerging markets.
Share of net profit of associates and joint ventures (beia)The share of net profit of associates and joint ventures (beia) amounted to €147 million, including the attributable profit from CR Beer with a two-month delay (November 2019 to October 2020). The organic decline was €69 million, reflecting the impact of COVID-19 mainly coming from CCU S.A. and United Breweries Limited (UBL).
Income tax expense (beia)The effective tax rate (beia) was 32.8% (2019: 27.6%). The increase was driven by higher operational losses for which no deferred tax assets could be recognised. Furthermore, the relative effect of permanent items increased due to the lower profit before tax base.
Net profit and lossThe net loss for 2020 was €204 million (2019: 2,166 million profit). Net profit (beia) decreased organically by €1,243 million (49.4%) to €1,154 million. The impact of currency translation and consolidation changes were negative by €67 million and €53 million.
Earnings per share – diluted Earnings per share – diluted decreased to €0.36 (2019: €3.77). Earnings per share – diluted (beia) decreased by 54.3% from €4.38 to €2.00.
Exceptional items and amortisation of acquisition-related intangibles (eia)The table below presents the reconciliation of operating profit before exceptional items and amortisation of acquisition-related intangibles (operating profit beia) to profit before income tax.
In millions of € 2020 2019
Operating profit (beia) 2,421 4,020 Amortisation of acquisition-related intangible assets and exceptional items included in operating profit
(1,643) (387)
Share of profit/(loss) of associates and joint ventures (31) 164Net finance expenses (590) (513)Profit before income tax 157 3,284
The table1 below provides an overview of the exceptional items and amortisation of acquisition-related intangibles in HEINEKEN’s net profit/(loss):
In millions of € 2020 2019
Profit/(Loss) attributable to shareholders of the Company (net profit/(loss))
(204) 2,166
Amortisation of acquisition-related intangible assets included in operating profit
273 309
Exceptional items included in operating profit 1,370 78 Exceptional items included in net finance expenses/(income) (26) 16 Exceptional items and amortisation of acquisition-related intangible assets included in share of profit of associates and joint ventures
178 64
Exceptional items included in income tax expense (347) (64)Allocation of exceptional items and amortisation of acquisition-related intangibles to non-controlling interests
(89) (52)
Net profit (beia) 1,154 2,517
1 Due to rounding, this table will not always cast
The 2020 exceptional items and amortisation of acquisition-related intangibles on net profit and loss amount to €1,358 million (2019: €351 million). This amount consists of:
– €273 million (2019: €309 million) of amortisation of acquisition-related intangibles recorded inoperating profit.
– €1,370 million (2019: €78 million) of exceptional items recorded in operating profit. This includes nil exceptional items on revenue (2019: €78 million exceptional benefit on revenue, mainly relating to tax credits in Brazil), €8 million exceptional excise tax expenses (2019: €2 million), €331 million of restructuring expenses, largely associated with the EverGreen programme (2019: €91 million), €963 million of impairments(net of reversal) mainly in Papua New Guinea, Lagunitas, Jamaica and various UK Pubs (2019: €85 million), €35 million net loss on disposals (2019: €57 million gain on disposals, mainly related to the sale of operating entities in China and Hong Kong) and €33 million of other net exceptional expenses (2019: €35 million).
– €26 million of exceptional net finance income, mainly related to the release of tax provisions(2019: €16 million of exceptional net finance expense).
– €178 million of exceptional net expenses (2019: €64 million) included in the share of profit of associatesand joint ventures, mainly relating to impairments of associates and joint ventures of €139 million (2019: €30 million).
– €347 million (2019: €64 million) in income tax expense, of which the tax impact on exceptional items and amortisation of acquisition-related intangible assets of €363 million (2019: €57 million) and the exceptionalincome tax net loss of €16 million (2019: €7 million exceptional income tax benefit).
– Total amount of eia allocated to non-controlling interests amounts to €89 million (2019: €52 million).
Financial review
36 Heineken N.V. Annual Report 2020

Reported to beia1
In millions of €Reported
2020Eia
2020Beia
2020Reported
2019Eia
2019Beia 2019
Revenue 23,770 – 23,770 28,521 (78) 28,443 Excise tax expense (4,055) 8 (4,046) (4,552) 2 (4,550)Net revenue 19,715 8 19,724 23,969 (75) 23,894 Other income 56 (56) – 95 (95) – Total other expenses (18,993) 1,690 (17,303) (20,431) 557 (19,874)Operating profit 778 1,643 2,421 3,633 387 4,020 Share of profit/(loss) of associates and joint ventures (31) 178 147 164 64 228 Net interest income/(expenses) (447) (23) (470) (454) 19 (435)Other net finance expenses (143) (3) (146) (59) (3) (62)Income tax expense (245) (347) (593) (910) (64) (974)Non-controlling interests (116) (89) (205) (208) (52) (260)Net profit/(loss) (204) 1,358 1,154 2,166 351 2,517
1 Due to rounding, this table will not always cast.
Capital expenditure and cash flowIn millions of € 2020 2019
Cash flow from operations before changes in working capital and provisions
3,674 5,669
Total change in working capital 347 8 Change in provisions and post-retirement obligations 211 (121)Cash flow from operations 4,232 5,556 Cash flow related to interest, dividend and income tax (1,096) (1,219)Cash flow from operating activities 3,136 4,337 Cash flow (used in)/from operational investing activities (1,623) (2,109)Free operating cash flow 1,513 2,228 Cash flow (used in)/from acquisitions and disposals 185 (2,764)Cash flow (used in)/from financing activities 1,238 (1,016)Net cash flow 2,936 (1,552)
Cash conversion ratio 111% 80%
Capital expenditure related to property, plant and equipment and intangible assets amounted to €1,640 million in 2020 (2019: €2,101 million) including payments for projects in 2020 for CAPEX realised in 2019. The investments of the year amounted to €1,389 million (2019: 2,215 million), reducing 37% as most non-committed CAPEX was suspended as from late March, unless necessary for safety and business continuity. The investments in 2020 include capacity expansions in Brazil and refurbishment of pubs in the UK.
Free operating cash flow amounted to €1,513 million (2019: €2,228 million) mainly due to lower cash flow from operating activities.
Financial structure and liquidityIn millions of € 2020 % 2019 %
Total equity 14,392 34 17,311 37 Deferred tax liabilities 999 2 1,422 3 Post-retirement obligations 938 2 1,189 3 Provisions 1,104 3 940 2 Gross debt 18,196 43 17,052 37 Other liabilities 7,003 16 8,590 18 Total equity and liabilities 42,632 100 46,504 100
Financial review
37 Heineken N.V. Annual Report 2020

Shareholders’ equity decreased by €2,755 million to €13,392 million, mainly driven by net loss of €204 million, dividends paid out of €597 million and a negative comprehensive income of €1,923 million, mainly related to translational differences.
Total gross debt amounted to €18,196 million (2019: €17,052 million). Net debt decreased to €14,210 million (2019: €15,259 million) as the sum of positive free operating cash flow, inflow from divestments and positive foreign currency impact on debt exceeded the cash outflow for dividends.
The pro-forma 12 month rolling net debt/EBITDA (beia) ratio was 3.4x on 31 December 2020 (2019: 2.6x). HEINEKEN is committed to return to the Company’s long-term target net debt/EBITDA (beia) ratio of below 2.5x.
The table below presents the reconciliation from operating profit to EBITDA (beia). In millions of € 2020 2019
Operating profit 778 3,633 Share of profit/(loss) of associates and joint ventures (31) 164Depreciation and impairments of property, plant and equipment 1,981 1,540 Amortisation and impairment of intangible assets 855 419 EBITDA 3,583 5,756 Exceptional items 568 8 EBITDA (beia) 4,151 5,764
Heineken N.V. was assigned solid investment grade credit ratings by Moody’s Investor Service and Standard & Poor’s in 2012. Moody’s lastly reaffirmed the Baa1/P-2 ratings with stable outlook on 17th July 2020. Standard & Poor’s reaffirmed the BBB+/A-2 ratings, but revised the outlook on these ratings to negative, given the expected COVID-19 related business disruption, on 27 April 2020.
Currency split of net debtThis currency breakdown includes the effect of derivatives, which are used to hedge intercompany lending denominated in currencies other than Euro. Of total net interest-bearing debt, 64% is denominated in Euro, 18% in US Dollar and US Dollar proxy currencies and 11% in British Pound. This is including the effect of cross-currency interest rate swaps and lease liabilities under IFRS 16. The fair value of the cross-currency interest rate swaps form part of net debt.
Total equityas a percentage of total assets
2020201920181
20172016
33.8%37.2%37.3%35.4%37.1%
Net debt/EBITDA (beia) ratio
2020201920181
20172016
3.42.62.32.52.3
Currency split of net debt repayments
EUR USD + USD proxy GBP Other
64%7%
11%
18%
Bond maturity profile (incl. the currency effect of cross-currency interest rate swaps)
1,6681,0001,100
896982800750500930
1,862
9601,011
8771,200
202520262027202820292030203120322033
>2034
2024202320222021
1 Restated for IAS 37.
Financial review
38 Heineken N.V. Annual Report 2020
Average number of sharesHEINEKEN has 576,002,613 shares in issue. In the 2020 basic EPS calculation, the weighted average number of shares outstanding was 575,625,598 (31 December 2019: 573,643,551).
In the calculation of 2020 diluted EPS (beia), shares to be delivered under the employee incentive programme (196,007 shares) are added to the weighted average shares outstanding. The weighted average diluted number of shares outstanding was 575,821,605 (2019: 574,217,111). In the calculation of diluted EPS on IFRS measures, shares to be delivered under the employee incentive programme are excluded as these have an anti-dilutive impact given the reported net loss.
Total dividend for 2020The Heineken N.V. dividend policy is to pay a ratio of 30% to 40% of full year net profit (beia). For 2020, payment of a total cash dividend of €0.70 per share, representing a decrease of 58.3% (2019: €1.68), will be proposed to the Annual General Meeting on 22 April 2021 (“2021 AGM”). The payout ratio was set at 34.9% in the middle of the range of our policy. If approved, the full dividend will be paid on 6 May 2021, as no interim dividend was paid during 2020. The payment will be subject to a 15% Dutch withholding tax. Due to the reported net loss in 2020, the proposed dividend will be paid out of the equity reserves. The ex-dividend date for Heineken N.V. shares will be 26 April 2021.
Financial review
39 Heineken N.V. Annual Report 2020
IntroductionHeineken N.V. (the ‘Company’) is a public company with limited liability incorporated under the laws of the Netherlands. Its shares are listed on the Amsterdam Stock Exchange, Euronext Amsterdam.
The Company’s management and supervision structure is organised in a so-called two-tier system, consisting of an Executive Board (made up of two executive members) and a Supervisory Board (made up of 10 non-executive members).
The Supervisory Board supervises the Executive Board and ensures external experience and knowledge are embedded in the Company’s way of operating. The two Boards are independent of one another and accountable to the Annual General Meeting (AGM).
The Company complies with, among other regulations, the Dutch Corporate Governance Code of 8 December 2016 (the ‘Code’). Deviations from the Code are explained in this report in accordance with the Code’s ‘comply or explain’ principle.
This report also includes the information that the Company is required to disclose pursuant to the Dutch governmental decree on Article 10 Takeover Directive and the governmental decree on Corporate Governance. Substantial changes in the Company’s corporate governance structure and in the Company’s compliance with the Code, if any, will be submitted to the AGM for discussion under a separate agenda item.
Executive Board
GeneralThe role of the Executive Board is to manage the Company. This means, among other things, that it is responsible for setting and achieving the operational and financial objectives of the Company, the strategy to achieve these objectives, the parameters to be applied in relation to the strategy (for example, in respect of the financial ratios), the Company culture aimed at long-term value creation, the associated risk profile, the development of results and corporate social responsibility issues that are relevant to the Company.
The Executive Board is accountable to the Supervisory Board and to the AGM.
In discharging its role, the Executive Board shall be guided by the interests of the Company and its affiliated enterprises, taking into consideration the interests of the Company’s stakeholders.
The Executive Board is responsible for complying with all primary and secondary legislation, for managing the risks associated with the Company’s activities and for financing the Company.
The Company has four operating regions: Africa Middle East & Eastern Europe, Americas, Asia Pacific and Europe. Each region is headed by a President.
The two members of the Executive Board and the four Presidents, together with five functional Chief Officers (i.e. Commercial, Corporate Affairs and Transformation, People, Supply Chain and Digital & Technology), jointly form the Executive Team. The decision to work with an Executive Team is to ensure effective implementation of key priorities and strategies across the organisation.
Throughout the year, members of the Executive Team were invited to give presentations to the Supervisory Board. A two-day meeting was also held between the Supervisory Board and the Executive Team to discuss the Company’s strategic priorities and main risks in light of its long-term value creation and Company culture. During this meeting strategic review efforts were discussed, focused on shaping the Company to emerge stronger from the COVID-19 crisis.
Executive Board members are appointed by the AGM from a non-binding nomination drawn up by the Supervisory Board. The Supervisory Board appoints one of the Executive Board members as Chairman/CEO. The AGM can dismiss members of the Executive Board by a majority of votes cast if the subject majority at least represents one-third of the issued capital.
In 2020, the AGM approved a proposal to appoint Mr. Dolf van den Brink for the maximum term of four years to the Executive Board.
Mr. Dolf van den Brink succeeded Jean-François van Boxmeer who handed over to him his responsibilities as Chairman of the Executive Board and CEO of Heineken N.V. on 1 June 2020.
Composition of the Executive BoardThe Executive Board consists of two members, Chairman/CEO Dolf (R.G.S.) van den Brink and CFO Laurence (L.M.) Debroux. Information on these Executive Board members is provided below.
Dolf (R.G.S.) van den Brink1973 Dutch nationality Male
Initial appointment in 2020*; Four-year term ends in 2024
Profession: Chairman/CEO (since 1 June 2020)
No supervisory board seats (or non-executive board memberships) in Large Dutch Entities**
No other positions***:
Laurence (L.M.) Debroux1969 French nationality Female
Initial appointment in 2015; Reappointment in 2019*; Four-year term ends in 2023
Profession: CFO (since 2015)
Supervisory board seats (or non-executive board memberships) in Large Dutch Entities**:EXOR Holding N.V., the Netherlands
Other positions***:Novo Nordisk, Denmark; HEC (Ecole des Hautes Etudes Commerciales) Paris, France
* For the maximum period of four years.** Large Dutch Entities are Dutch N.V.s, B.V.s or Foundations (that are
required to prepare annual accounts pursuant to Chapter 9 of Book 2 of the Dutch Civil Code or similar legislation) that meet two of the following criteria (on a consolidated basis) on two consecutive balance sheet dates:(i) The value of the assets (according to the balance sheet with
the explanatory notes and on the basis of acquisition and manufacturing costs) exceeds €20 million;
(ii) The net turnover exceeds €40 million;(iii) The average number of employees is at least 250.
*** Under ‘Other positions’, other functions are mentioned that may be relevant to performance of the duties of the Executive Board.
Corporate Governance statement
40 Heineken N.V. Annual Report 2020

Best practice provision 2.2.1 of the Code recommends that an Executive Board member is appointed for a maximum period of four years and that a member may be reappointed for a term of not more than four years at a time.
In compliance with this best practice provision, the Supervisory Board has drawn up a rotation schedule to avoid, as much as possible, a situation in which Executive Board members retire at the same time.
Members of the Executive Board are not allowed to hold more than two supervisory board memberships or non-executive directorships in a Large Dutch Entity. Acceptance of such external supervisory board memberships or non-executive directorships by members of the Executive Board is subject to approval by the Supervisory Board, which has delegated this authority to the Selection & Appointment Committee.
DiversityHEINEKEN strives to embrace diversity in everything we do, as recognised by the Company and described in the Diversity Policy for the Supervisory Board, Executive Board and Executive Team. This policy considers the elements of a diverse composition in terms of nationality, gender, age and background, including expertise and experience. It is the aim of the Company to reflect this in its compositions.
The Company gives appropriate weight to the diversity policy in the selection and appointment process, while taking into account the overall profile and selection criteria for the appointments of suitable candidates to the Executive Board.
Currently, the Executive Board is composed of one male and one female member.
Conflict of InterestThe Articles of Association and the Code prescribe how to deal with (apparent) conflicts of interest between the Company and members of the Executive Board.
A member of the Executive Board shall not take part in any discussion or decision-making that involves a subject or transaction in relation to which he has a personal conflict of interest with the Company.
Decisions to enter into transactions under which members of the Executive Board have conflicts of interest that are of material significance to the Company and/or the relevant member(s) of the Executive Board require the approval of the Supervisory Board.
Any such decision shall be published in the Annual Report for the relevant year, along with a reference to the conflict of interest and a declaration that the relevant best practice provisions of the Code have been complied with.
In 2020, no transactions were reported under which a member of the Executive Board had a conflict of interest that was of material significance.
RemunerationIn line with the remuneration policy adopted by the AGM, the remuneration of members of the Executive Board is determined by the Supervisory Board, upon recommendation of the Remuneration Committee.
The remuneration policy and the elements of the remuneration of Executive Board members are set out in the Remuneration Report and Notes 6.5 and 13.3 to the Financial Statements.
The main elements of the service agreements with Mr. Van den Brink and Mrs. Debroux are available on our website.
Supervisory Board
GeneralThe role of the Supervisory Board is to supervise the management of the Executive Board and the general affairs of the Company and its affiliated enterprises, as well as to assist the Executive Board by providing advice.
In discharging its role, the Supervisory Board shall be guided by the interests of the Company and its affiliated enterprises and shall take into account the relevant interest of the Company’s stakeholders.
The supervision of the Executive Board by the Supervisory Board includes the achievement of the Company’s objectives, the corporate strategy and the risks inherent in the business activities, the design and effectiveness of the internal risk and control system, the financial reporting process, compliance with primary and secondary legislation, the Company-shareholder relationship and corporate social responsibility issues that are relevant to the Company.
The Supervisory Board evaluates at least once a year the corporate strategy and main risks to the business, the result of the assessment by the Executive Board of the design and effectiveness of the internal risk management and control system, and any significant changes thereto.
Supervisory Board members are appointed by the AGM from a non-binding nomination drawn up by the Supervisory Board.
The AGM can dismiss members of the Supervisory Board by a majority of the votes cast, if the subject majority at least represents one-third of the issued capital.
Composition of the Supervisory BoardThe Supervisory Board consists of 10 members: Jean-Marc Huët (Chairman), José Antonio Fernández Carbajal (Vice-Chairman), Maarten Das, Michel de Carvalho, Christophe Navarre, Javier Astaburuaga Sanjinés, Pamela Mars Wright, Marion Helmes, Helen Arnold and Rosemary Ripley.
The Supervisory Board endorses the principle that the composition of the Supervisory Board shall be such that its members are able to act critically and independently of one another and of the Executive Board and any particular interests. Each Supervisory Board member is capable of assessing the broad outline of the overall strategy of the Company and its businesses and carrying out its duties properly.
Given the structure of the Heineken Group, the Company is of the opinion that, in the context of preserving the continuity of the Heineken Group and ensuring a focus on long-term value creation, it is in its best interest and that of its stakeholders that the Supervisory Board includes a fair and adequate representation of persons who are related by blood or affinity in the direct line descent to the late Mr. A.H. Heineken (former Chairman of the Executive Board), or who are members of the Board of Directors of Heineken Holding N.V., even if those persons would not, formally speaking, be considered ‘independent’ within the meaning of best practice provision 2.1.8 of the Code.
Currently, the majority of the Supervisory Board (i.e. six of its ten members) qualify as ‘independent’ as per best practice provision 2.1.8 of the Code. There are four members who in a strictly formal sense do not meet the applicable criteria for being ‘independent’ as set out in the Code: Mr. de Carvalho (who is the spouse of Mrs. C.L. de Carvalho-Heineken, the daughter of the late Mr. A.H. Heineken, and who is also an executive director of Heineken Holding N.V.), Mr. Das (who is the Chairman of the Board of Directors of Heineken Holding N.V.),
Corporate Governance statement
41 Heineken N.V. Annual Report 2020

Mr. Fernández Carbajal (who is a non-executive director of Heineken Holding N.V. and representative of FEMSA) and Mr. Astaburuaga Sanjinés (who is a representative of FEMSA). However, the Supervisory Board has ascertained that Mr. de Carvalho, Mr. Das, Mr. Fernández Carbajal and Mr. Astaburuaga Sanjinés in fact act critically and independently. Since Mr. de Carvalho, Mr. Das, Mr. Fernández Carbajal and Mr. Astaburuaga Sanjinés are representing or are affiliated with Heineken Holding N.V. and/or FEMSA, who (in)directly hold more than 10 percent of the shares in our Company, the maximum of one representative or affiliate per such shareholder of best practice provision 2.1.7 sub iii of the Code is not complied with. As a consequence, the Company also does not comply with best practice provision 2.1.10 of the Code, to the extent that this provision provides that the Supervisory Board report shall state that best practice provision 2.1.7 through 2.1.9 has been fulfilled.
In line with the belief that the focus on long term value creation is best ensured by a fair and adequate representation of persons who are related by blood or affinity in the direct line descent to the late Mr. A.H. Heineken (former Chairman of the Executive Board), or who are members of the Board of Directors of Heineken Holding N.V., best practice provision 2.2.2 of the Code, which provides that a person may be appointed to the Supervisory Board for a maximum of two four-year terms, followed by two terms of two years each with an explanation in the Corporate Governance Statement, is not applied to Mr. de Carvalho, Mr. Das and Mr. Fernández Carbajal.
In the interest of preserving the core values and the structure of the Heineken Group, the Company does not apply the maximum appointment period to members who are related by blood or affinity in the direct line descent to Mr. A.H. Heineken or who are members of the Board of Directors of Heineken Holding N.V.
The Supervisory Board has drawn up a rotation schedule to avoid, as far as possible, a situation in which many Supervisory Board members retire at the same time. The rotation schedule is available on our corporate website.
Profile and DiversityThe Supervisory Board has prepared a profile of its size and composition, taking account of the nature of the business, its activities and the desired expertise and background of the Supervisory Board members. The profile deals with the aspects of diversity in the composition of the Supervisory Board that are relevant to the Company and states what specific objective is pursued by the Supervisory Board in relation to diversity.
At least one member of the Supervisory Board shall be a financial expert with relevant knowledge and experience of financial administration and accounting for listed companies or other large legal entities. The composition of the Supervisory Board shall be such that it is able to carry out its duties properly. The profile is available on our corporate website.
The importance of diversity is described in the Diversity Policy for the Supervisory Board, Executive Board and Executive Team, which considers the elements of a diverse composition in terms of nationality, gender, age and background including expertise and experience. With respect to gender, pending Dutch law stipulates that supervisory boards of large Dutch public companies, such as the Company, are deemed to have a balanced composition if they consist of at least one-third female and one-third male members. The Supervisory Board currently consists of 10 members, six male (60%) and four female (40%) members. The Supervisory Board will also take the balanced composition requirements into account when nominating and selecting new candidates for the Supervisory Board.
The Supervisory Board notes that, in its opinion, gender is only one element of diversity, and that experience, background, knowledge, skills and insight are equally important and relevant criteria in selecting new members as is also reflected in its profile.
Regulations of the Supervisory BoardThe tasks, responsibilities and internal procedural matters for the Supervisory Board are addressed in the Regulations of the Supervisory Board and are available on our corporate website.
The Supervisory Board appoints from its members a Chairman (currently Mr. Huët). The Chairman of the Supervisory Board may not be a former member of the Executive Board. The Chairman of the Supervisory Board determines the agenda, chairs the meetings of the Supervisory Board, ensures the proper functioning of the Supervisory Board and its Committees, arranges for the adequate provision of information to its members and acts on behalf of the Supervisory Board as the main contact for the Executive Board and for shareholders regarding the functioning of the Executive Board and the Supervisory Board members. The Chairman also ensures the orderly and efficient conduct of the AGM.
The Chairman of the Supervisory Board is assisted in his role by the Company Secretary. All members of the Supervisory Board have access to the advice and services of the Company Secretary. The Company Secretary is responsible for ensuring that procedures are followed and that the Supervisory Board acts in accordance with its statutory obligations as well as its obligations under the Articles of Association.
The Supervisory Board appoints from its members a Vice-Chairman (currently Mr. Fernández Carbajal). The Vice-Chairman of the Supervisory Board acts as deputy for the Chairman. The Vice-Chairman acts as contact for individual Supervisory Board members and Executive Board members concerning the functioning of the Chairman of the Supervisory Board.
The Supervisory Board can only adopt resolutions in a meeting if the majority of its members is present or represented at that meeting. In such meetings, resolutions must be adopted by absolute majority of the votes cast. In addition, approval of a resolution by the Supervisory Board, as referred to in Article 8 paragraph 6 under a, b and c of the Articles of Association, requires the affirmative vote of the delegated member.
Induction and trainingAfter appointment to the Supervisory Board, members receive an induction programme drawn up by the Company in consultation with the Chairman of the Supervisory Board.
The programme includes a general information package in respect of the Company and its corporate governance and meetings with members of the Executive Team and other senior management leaders.
The Executive Board provides regular updates to the Supervisory Board on the Company’s operations, legal matters, corporate governance, accounting and compliance.
Corporate Governance statement
42 Heineken N.V. Annual Report 2020

Conflict of InterestThe Articles of Association and the Regulations of the Supervisory Board prescribe how to deal with (apparent) conflicts of interest between the Company and members of the Supervisory Board.
A member of the Supervisory Board shall not take part in any discussion or decision-making that involves a subject or transaction in relation to which he has a personal conflict of interest with the Company.
Decisions to enter into transactions under which Supervisory Board members have conflicts of interest that are of material significance to the Company and/or the relevant member(s) of the Supervisory Board require the approval of the Supervisory Board.
Any such decision shall be published in the Annual Report for the relevant year, along with a reference to the conflict of interest and a declaration that the relevant best practice provisions of the Code have been complied with. Note 13.3 of the 2020 Financial Statements sets out related party transactions in 2020.
RemunerationSupervisory Board members receive a fixed annual remuneration fee determined by the AGM.
More information on the remuneration of Supervisory Board members can be found in Note 13.3 to the 2020 Financial Statements.
Resolutions subject to Supervisory Board approvalCertain resolutions of the Executive Board are subject to the approval of the Supervisory Board. Examples are resolutions concerning the operational and financial objectives of the Company, the strategy designed to achieve the objectives, the parameters to be applied in relation to the strategy (for example, in respect of the financial ratios) and corporate social responsibility issues that are relevant to the Company.
Also, decisions to enter into transactions under which Executive Board or Supervisory Board members would have conflicts of interest that are of material significance to the Company and/or to the relevant Executive Board member/Supervisory Board member require the approval of the Supervisory Board.
Further reference is made to Article 8 paragraph 6 of the Articles of Association, which contains a list of resolutions of the Executive Board that require Supervisory Board approval.
Delegated MemberThe AGM may appoint one of the Supervisory Board members as Delegated Member. Mr. Das currently acts as the Delegated Member. The delegation to the Delegated Member does not extend beyond the duties of the Supervisory Board and does not comprise the management of the Company. It intends to effect a more intensive supervision and advice and more regular consultation with the Executive Board.
The Delegated Member has a veto right concerning resolutions of the Supervisory Board to approve the resolutions of the Executive Board referred to in Article 8 paragraph 6 under a, b and c of the Articles of Association of the Company.
The role of Delegated Member is consistent with best practice provision 2.3.8 of the Code, except insofar that the delegation is not temporary but is held for the term for which the member concerned is appointed by the AGM.
The Company is of the opinion that the position of Delegated Member, which has been in existence since 1952, befits the structure of the Company.
CommitteesThe Supervisory Board has five committees: the Preparatory Committee, the Audit Committee, the Remuneration Committee, the Selection & Appointment Committee, the Americas Committee until December 2020, and since December 2020, the Sustainability & Responsibility Committee. The function of these committees is to prepare the decision-making of the Supervisory Board.
The Supervisory Board has drawn up regulations for each committee, setting out the role and responsibility of the committee concerned, its composition and the manner in which it discharges its duties. These regulations are available on our corporate website.
In 2020, more than half of the members of the Audit Committee were independent within the meaning of best practice provision 2.1.8 of the Code.
For the Remuneration Committee and the Selection & Appointment Committee the independence criteria of best practice provision 2.3.4 are not met.
The Report of the Supervisory Board states the composition of the committees, the number of committee meetings and the main items discussed.
Preparatory CommitteeThe Preparatory Committee prepares decision- making of the Supervisory Board on matters not already handled by any of the other committees, such as in relation to acquisitions and investments.
Audit CommitteeThe Audit Committee may not be chaired by the Chairman of the Supervisory Board or by a former member of the Executive Board. At least one member of the Audit Committee shall be a financial expert with relevant knowledge and experience of financial administration and accounting for listed companies or other large legal entities.
The Audit Committee focuses on supervising the activities of the Executive Board with respect to: (i) the operation of the internal risk management and control systems, including the enforcement of the relevant primary and secondary legislation and supervising the operation of codes of conduct;(ii) the provision of financial information by the Company; (iii) compliance with recommendations and observations of internal and external auditors;(iv) the role and functioning of Global Audit, the internal audit function; (v) the policy of the Company on tax risk management; (vi) relations with the external auditor, including, in particular, its independence, remuneration and any non-audit services for the Company; (vii) the financing of the Company; and (viii) the applications of informationand communication technology.
The Audit Committee acts as the principal contact for the external auditor if the external auditor discovers irregularities in the content of the financial reporting. The Audit Committee meets with the external auditor as often as it considers necessary, but at least once a year, without the Executive Board members being present.
Corporate Governance statement
43 Heineken N.V. Annual Report 2020
Remuneration CommitteeThe Remuneration Committee may not be chaired by the Chairman of the Supervisory Board or by a former member of the Executive Board. However, given the structure of the Heineken Group and the character of the Board of Directors of Heineken Holding N.V., the regulations of the Remuneration Committee permit that the Remuneration Committee is chaired by a Supervisory Board member who is a member of the Board of Directors of Heineken Holding N.V.
The current Chairman of the Remuneration Committee, Mr. M. Das, is a Non-Executive Director (and Chairman) of Heineken Holding N.V.
The Remuneration Committee, inter alia, makes the proposal to the Supervisory Board for the remuneration policy for the Executive Board and Supervisory Board to be pursued, and makes a proposal for the remuneration of the individual members of the Executive Board for adoption by the Supervisory Board.
Selection and Appointment CommitteeThe Selection & Appointment Committee, inter alia: (i) draws up selection criteria and appointment procedures for Supervisory Board members and Executive Board members; (ii) periodically assesses the size and composition of the Supervisory Board and the Executive Board, and makes a proposal for a composition profile of the Supervisory Board as well as a diversity policy; (iii) periodically assesses the functioning of individual Supervisory Board members and Executive Board members and reports on this to the Supervisory Board; (iv) makes proposals for appointments and reappointments; (v) supervises the policy of the Executive Board on the selection criteria and appointment procedures for senior management; and (vi) decides on a requestfrom Executive Board members to accept a board membership of a Large Dutch Entity (as defined above) or foreign equivalent.
Americas CommitteeThe Americas Committee advises the Supervisory Board on the overall strategic direction of the Americas Region and reviews and evaluates the performance, the organisation and the management in the Americas Region.
In December 2020, the Supervisory Board decided to discontinue and absorb the responsibilities of the Americas Committee and as a result will supervise all regions alike.
Sustainability & Responsibility CommitteeIn December 2020, the Supervisory Board installed a Sustainability & Responsibility Committee to increase the focus on sustainability and responsibility going forward. The purpose of this Committee will include oversight of the overall Company strategy and performance in relation to the environment, social sustainability and responsibility.
General MeetingAnnually, within six months after the end of the financial year, the AGM shall be held, in which, inter alia, the following items shall be brought forward: (i) the discussion of the management report; (ii) the adoption of the Executive Board’s and Supervisory Board’s remuneration policy insofar as adjustments to those policies lead to a new policy or four years after adoption; (iii) the remuneration report of the members of the Executive Board and members of the Supervisory Board; (iv) the discussion and adoption of the financial statements; (v) discharge of the membersof the Executive Board for their management; (vi) discharge of the members of the Supervisory Board for their supervision on the management; and(vii) appropriation of profits.
According to the articles of association, the AGM shall be held in Amsterdam. Due to COVID-19 and in accordance with the Dutch Emergency Act, the AGM 2020 was held fully virtual.
ConvocationPursuant to the law, the Executive Board or the Supervisory Board shall convene the AGM with a convocation period of at least 42 days (excluding the date of the meeting, but including the convocation date).
The Executive Board and the Supervisory Board are obliged to convene an AGM upon request of shareholders individually or collectively owning at least 10% of the shares issued. Such meeting shall be held within eight weeks of the request and shall deal with the subjects as stated by those who wish to hold the meeting.
Right to include items on the agendaIf the Executive Board has been requested in writing not later than 60 days prior to the date of the AGM to deal with an item by one or more shareholders who solely or jointly represent at least 1% of the issued capital, the item will be included in the convocation or announced in a similar way.
A request of a shareholder for an item to be included on the agenda of the AGM needs to be substantiated. The principles of reasonableness and fairness may allow the Executive Board to refuse the request.
The Code provides the following in best practice provision 4.1.6: “A shareholder should only exercise the right to put items on the agenda after they have consulted with the management board on this. If one or more shareholders intend to request that an item be put on the agenda that may result in a change in the Company’s strategy, for example as a result of the dismissal of one or several management board or supervisory board members, the management board should be given the opportunity to stipulate a reasonable period in which to respond (the response time)”.
The opportunity to stipulate the response time should also apply to an intention as referred to above for judicial leave to call an AGM pursuant to Section 2:110 of the Dutch Civil Code. The relevant shareholder should respect the response time stipulated by the management board, within the meaning of best practice provision 4.1.7.
If the Executive Board invokes a response time, such period shall not exceed 180 days from the moment the Executive Board is informed by one or more shareholders of their intention to put an item on the agenda to the day of the AGM at which the item is to be dealt with. The Executive Board shall use the response time for further deliberation and constructive consultation. This shall be monitored by the Supervisory Board. The response time shall be invoked only once for any given AGM and shall not apply to an item in respect of which the response time has been previously invoked.
Record dateFor each AGM, Dutch law provides a record date for the exercise of the voting rights and participation in the meeting, which record date shall be the 28th day prior to the date of the meeting. The record date shall be included in the convocation notice, as well as the manner in which those entitled to attend and/or vote in the meeting can be registered and the manner in which they may exercise their rights.
Only persons who are shareholders on the record date may participate and vote in the AGM.
Corporate Governance statement
44 Heineken N.V. Annual Report 2020

Participation in person, by proxy or through electronic communicationEach shareholder is entitled, either personally or by proxy authorised in writing, to attend the AGM, to address the meeting and to exercise his or her voting rights.
The Executive Board may determine that the powers set out in the previous sentence may also be exercised by means of electronic communication.
If a shareholder wants to exercise his or her rights by proxy authorised in writing, the written power of attorney must be received by the Company no later than on the date indicated for that purpose in the convocation notice. Through its corporate website, the Company generally facilitates that shareholders can give electronic voting instructions.
Attendance listEach person entitled to vote or otherwise entitled to attend a meeting, or such person’s representative, shall have to sign the attendance list, stating the number of shares and votes represented by such person.
Chairman of the AGMThe AGM shall be presided over by the Chairman or the Vice-Chairman of the Supervisory Board or, in his absence, by one of the Supervisory Board members present at the meeting, to be designated by them in mutual consultation. If no members of the Supervisory Board are present, the meeting shall appoint its own chairman.
VotingAll resolutions of the AGM shall be adopted by an absolute majority of the votes cast, except for those cases in which the law or the Articles of Association prescribe a larger majority.
Each share confers the right to one vote. Blank votes shall be considered as not having been cast.
The Executive Board may determine in the convocation notice that any vote cast prior to the AGM by means of electronic communication shall be deemed to be a vote cast in the AGM. Such a vote may not be cast prior to the record date. A shareholder who has cast his or her vote prior to the AGM by means of electronic communication remains entitled, whether or not represented by a holder of a written power of attorney, to participate in the AGM.
MinutesThe proceedings in the AGM shall be recorded in minutes taken by a secretary to be designated by the chairman of the meeting. Upon request, the record of the proceedings of the AGM shall be submitted to shareholders, ultimately within three months after the conclusion of the meeting.
Resolutions to be adopted by the AGM The AGM has authority to adopt resolutions concerning, inter alia, the following matters:
– Issue of shares by the Company or rights on shares (and to authorise the Executive Board to resolve that the Company issues shares or rights on shares)
– Authorisation of the Executive Board to resolvethat the Company acquires its own shares
– Cancellation of shares and reduction ofshare capital
– Appointment of Executive Board members – The remuneration policy for Executive
Board members – Suspension and dismissal of Executive
Board members – Appointment of Supervisory Board members
– The remuneration policy for Supervisory Board members
– The remuneration of Supervisory Board members – Suspension and dismissal of Supervisory
Board members – Appointment of the Delegated Member of the
Supervisory Board – Adoption of the financial statements – Granting discharge to Executive and Supervisory
Board members – Dividend distributions – A material change in the corporate
governance structure – Appointment of the external auditor – Amendment of the Articles of Association, and – Liquidation.
Resolutions on a major change in the identity or character of the Company or enterprise shall be subject to the approval of the AGM. This would at least include (a) the transfer of the enterprise or the transfer of practically the entire enterprise of the Company to a third party, (b) the entering into or the termination of a lasting co-operation of the Company or a subsidiary with another legal entity or company or a fully liable partner in a limited partnership or general partnership, if such co-operation or termination is of fundamental importance to the Company and (c) acquiring or disposing of a participation in the capital of a company by the Company or a subsidiary amounting to at least one-third of the amount of assets according to the Company’s consolidated balance sheet plus explanatory notes as laid down in the last adopted financial statements of the Company.
Article 10 of the EU Take-Over Directive DecreeSharesThe issued capital of the Company amounts to €921,604,180.80, consisting of 576,002,613 shares of €1.60 each. Each share carries one vote. The shares are listed on Euronext Amsterdam.
All shares carry equal rights and are freely transferable (unless provided otherwise below).
Shares repurchased by the Company for the share- based Long-Term Incentive Plan (LTIP) or for any other purpose do not carry any voting rights and dividend rights.
Shareholders who hold shares on a predetermined record date are entitled to attend and vote at the AGM. The record date for the AGM of 22 April 2021 is 28 days before the AGM, i.e. on 25 March 2021.
Law on the Conversion of Bearer SharesAs of 1 July 2019, the Dutch Law on the Conversion of Bearer Shares (Wet omzetting aandelen aan toonder) has entered into effect. All (bearer) shares in the Company’s authorised capital have already been registered as per earlier amendment of the Articles of Association. However, there still are certificates for bearer shares circulating which are eligible for submission with the Company.
Pursuant to Dutch law, the Company received 12,037 certificates for bearer shares without consideration on 31 December 2020.
Any holder of certificates for bearer shares submitting its share certificates with the Company before 2 January 2026, shall receive a corresponding amount of registered shares by the Company as per the transitory provisions laid down in Article 18 of the Articles of Association.
Corporate Governance statement
45 Heineken N.V. Annual Report 2020
Substantial shareholdingsPursuant to the Financial Supervision Act (Wet op het financieel toezicht) and the Decree on Disclosure of Major Holdings and Capital Interests in Issuing Institutions (Besluit melding zeggenschap en kapitaalbelang in uitgevende instellingen), the Netherlands Authority for the Financial Markets has been notified about the following substantial shareholdings regarding the Company:
– Mrs. C.L. de Carvalho-Heineken (indirectly 50.005%; the direct 50.005% shareholder is Heineken Holding N.V.).
– Voting Trust (FEMSA) (indirectly 8.63%).
Restrictions related to shares held by FEMSAUpon completion (on 30 April 2010) of the acquisition of the beer operations of Fomento Económico Mexicano, S.A.B. de C.V. (FEMSA), CB Equity LLP (belonging to the FEMSA Group) received Heineken N.V. shares (and Heineken Holding N.V. shares). Pursuant to the Corporate Governance Agreement of 30 April 2010 concluded between the Company, Heineken Holding N.V., L’Arche Green N.V., FEMSA and CB Equity LLP the following applies:
– Subject to certain exceptions, FEMSA, CB Equity LLP, and any member of the FEMSA Group shall not increase its shareholding in Heineken Holding N.V. above 20% and shall not increase its holding in the Heineken Group above a maximum of 20% economic interest (such capped percentages referred to as the ‘Voting Ownership Cap’).
– Subject to certain exceptions, FEMSA, CB Equity LLP and any member of the FEMSA Group may not exercise any voting rights in respect of any shares beneficially owned by it, if and to the extent that such shares are in excess of the applicable Voting Ownership Cap.
– Unless FEMSA’s economic interest in the HeinekenGroup were to fall below 14%, the current FEMSA control structure were to change or FEMSA were to be subject to a change of control, FEMSA is entitled to have two representatives on the Company’s Supervisory Board, one of whom will be Vice-Chairman, who also serves as the FEMSA representative on the Board of Directors of Heineken Holding N.V.
Share plansThere is a share-based Long-Term Incentive Plan (‘LTIP’) for both the Executive Board members and senior management. Eligibility for participation in the LTIP by senior management is based on objective criteria.
Each year, performance shares are awarded to the participants. Depending on the fulfilment of certain predetermined performance conditions during a three-year performance period, the performance shares will vest and the participants will receive Heineken N.V. shares.
Shares received by Executive Board members upon vesting under the LTIP are subject to a holding period of five years as from the date of award of the respective performance shares, which is approximately two years from the vesting date.
Under the Short-Term Incentive Plan (STIP) for the Executive Board, Executive Board members are entitled to receive a cash bonus subject to the fulfilment of predetermined performance conditions.
Executive Board members are obliged to invest at least 25% of their STIP payout in Heineken N.V. shares (investment shares) to be delivered by the Company; the maximum they can invest in Heineken N.V. shares is 50% of their STIP payout (at their discretion).
The investment shares (which are acquired by the Executive Board members in the year after the year over which the STIP payout is calculated) are subject to a holding period of five years as from 1 January of the year in which the investment shares are acquired.
Executive Board members are entitled to receive one additional Heineken N.V. share (a matching share) for each investment share held by them at the end of the respective holding period.
The entitlement to receive matching shares shall lapse upon the termination by the Company of the employment agreement (in respect of Mr. Van Boxmeer), or service agreement (in respect of Mr. Van den Brink and Mrs. Debroux), as the case may be, for an urgent reason (‘dringende reden’) within the meaning of the law or in case of dismissal for cause (‘ontslag met gegronde redenen’) whereby the cause for dismissal concerns unsatisfactory functioning of the Executive Board member.
Due to impact of the COVID-19 pandemic on HEINEKEN’s business, and as announced on 22 April 2020, there will be no STIP pay-outs (including the part related to achievement of individual objectives) for 2020 for Executive Board members and senior management, no LTI vesting for Executive Board members and, as a message of solidarity with the Company and its employees who are affected by this crisis, the Executive Board and Executive Team have collectively agreed to a 20% reduction in base salaries from May 2020 to December 2020.
In exceptional situations, extraordinary share entitlements may be awarded by the Executive Board to employees. These share entitlements are usually non-performance-related and the employees involved are usually entitled to receive Heineken N.V. shares after the expiry of a period of time.
The shares required for the LTIP, the STIP and the extraordinary share entitlements will be acquired by the Company on the basis of an authorisation granted by the AGM and subject to approval of the Supervisory Board of the Company.
Change of controlThere are no important agreements to which the Company is a party and that will automatically come into force, be amended or be terminated under the condition of a change of control over the Company as a result of a public offer.
However, the contractual conditions of most of the Company’s important financing agreements and notes issued (potentially) entitle the banks and noteholders respectively to claim early repayment of the amounts borrowed by the Company in the situation of a change of control over the Company (as defined in the respective agreement).
Also, some of HEINEKEN’s important joint venture agreements provide that in case of a change of control over HEINEKEN (as defined in the respective agreement), the other party to such agreement may exercise its right to purchase HEINEKEN’s shares in the joint venture, as a result of which the respective joint venture agreement will terminate.
Corporate Governance statement
46 Heineken N.V. Annual Report 2020
Appointment and dismissal of Supervisory and Executive Board membersMembers of the Supervisory Board and the Executive Board are appointed by the AGM on the basis of a non-binding nomination by the Supervisory Board.
The AGM can dismiss members of the Supervisory Board and the Executive Board by a majority of the votes cast, if the subject majority at least represents one-third of the issued capital.
Amendment of the Articles of AssociationThe Articles of Association can be amended by resolution of the AGM in which at least half of the issued capital is represented and exclusively either at the proposal of the Supervisory Board or at the proposal of the Executive Board that has been approved by the Supervisory Board, or at the proposal of one or more shareholders representing at least half of the issued capital.
Acquisition of own sharesOn 23 April 2020, the AGM authorised the Executive Board (for the statutory maximum period of 18 months) to acquire own shares subject to the following conditions and with due observance of the law and the Articles of Association (which require the approval of the Supervisory Board):
The maximum number of shares which may be acquired is 10% of the issued capital of the Company as per 23 April 2020.
Transactions must be executed at a price between the nominal value of the shares and 110% of the opening price quoted for the shares in the Official Price List (Officiële Prijscourant) of Euronext Amsterdam on the date of the transaction or, in the absence of such a price, the latest price quoted therein.
Transactions may be executed on the stock exchange or otherwise.
The authorisation may be used in connection with the LTIP and the STIP for the members of the Executive Board and the LTIP for senior management, but may also serve other purposes, such as acquisitions. A new authorisation will be submitted for approval at the next AGM on 22 April 2021.
Issue of sharesOn 23 April 2020, the AGM authorised the Executive Board (for a period of 18 months) to issue shares or grant rights to subscribe for shares and to restrict or exclude shareholders’ pre-emption rights, with due observance of the law and Articles of Association (which require the approval of the Supervisory Board).
The authorisation is limited to 10% of the Company’s issued capital as per 23 April 2020.
The authorisation may be used in connection with the LTIP and the STIP for the members of the Executive Board and the LTIP for senior management, but may also serve other purposes, such as acquisitions.
A new authorisation will be submitted for approval to the AGM at 22 April 2021.
Compliance with the CodeOn 8 December 2016, the current Code was published, which came into effect on 1 January 2017.
The Code can be downloaded at http://www.mccg.nl.
As stated in the Code, there should be a basic recognition that corporate governance must be tailored to the company-specific situation and, therefore, that non-application of individual provisions by a company may be justified.
HEINEKEN, in principle, endorses the Code’s principles and applies virtually all best practice provisions. However, given the structure of the Heineken Group and, specifically, the relationship between the Company and its controlling shareholder Heineken Holding N.V., the Company does not (fully) apply the following best practice provisions:
– 2.1.7, 2.1.8, 2.1.10 and 2.3.4:Number of independent Supervisory Board members as well as number of independent members of the Remuneration and Selection & Appointment Committees; in that light the Supervisory Board report does not state that best practice provisions 2.1.7 through 2.1.9 havebeen fulfilled;
– 2.2.2: Maximum terms of appointment Supervisory Board members; and
– 2.3.8: Temporary nature of appointing a delegatedSupervisory Board member.
Furthermore, HEINEKEN has not fully applied best practice provision 3.2.3 (severance payment Executive Board members and notably the one-year salary limit for such payments) to Mr. Van Boxmeer, in view of his long-standing employment relationship (over 25 years in service) with the Company.
Mr. Van Boxmeer had an employment agreement as from 1984 which was honoured when the best practice provision 3.2.3 came into existence. In connection with his end of service, Mr. Van Boxmeer has been treated in accordance with HEINEKEN’s approved remuneration policy as disclosed in our previous annual reports, as well as the terms of his employment agreement which dates from before the current Dutch Governance Code publication.
The agreement with Mr. Van den Brink and Mrs. Debroux with regards to their terms comply with the Code.
For more information please see the Remuneration Report.
Corporate Governance statement
47 Heineken N.V. Annual Report 2020

Other best practice provisions which are not applied relate to the fact that these principles and/ or best practice provisions are not applicable to the Company:
1.3.6: HEINEKEN has an internal audit function;
2.8.1: This best practice provision situation has not arisen;
3.1.2 sub vii: HEINEKEN does not grant options on shares;
4.1.5: This best practice provision relates to shareholders;
4.2.6: HEINEKEN has no anti-takeover measures;
4.3.1: This best practice provision relates to shareholders;
4.3.4: HEINEKEN has no financing preference shares;
4.3.5 and 4.3.6: This best practice provision relates to institutional investors;
4.4: HEINEKEN has no depositary receipts of shares, nor a trust office; and
4.3.3 and 5.1: HEINEKEN does not have a one-tier management structure.
In respect of transactions with related parties as disclosed in note 13.3, best practice provisions 2.7.3, 2.7.4 and 2.7.5 of the Code have been observed.
Statement of the Executive BoardThis Report of the Executive Board, together with pages 121–157 of the Sustainability Review, serves as the management report for the purpose of Section 391, Book 2 of the Dutch Civil Code.
In accordance with best practice provision 1.4.3 of the Code, we are of the opinion that:
– this report provides sufficient insights into anyfailings in the effectiveness of the internal risk management and control systems;
– the aforementioned systems provide reasonableassurance that the financial reporting does not contain any material inaccuracies;
– based on the current state of affairs, it is justified that the financial reporting is prepared on a goingconcern basis; and
– this report states those material risks and uncertainties that are relevant to the expectation of the Company’s continuity for the period of twelve months after the preparation of this report.
It should be noted that the foregoing does not imply that these systems and these procedures provide absolute assurance as to the realisation of operational and strategic business objectives, or that they can prevent all misstatements, inaccuracies, errors, fraud and non-compliance with legislation, rules and regulations.
For a detailed description of the risk management system and the principal risks identified, please refer to the Risk Management section.
In accordance with Article 5:25c paragraph 2 sub c of the Financial Markets Supervision Act, we confirm that, to the best of our knowledge:
– the financial statements in this Annual Report 2020 give a true and fair view of our assets and liabilities, our financial position at 31 December2020, and the results of our consolidated operations for the financial year 2020; and
– the Report of the Executive Board includes a fair review of the position at 31 December 2020 and the development and performance during the financial year 2020 of Heineken N.V. and the undertakings included in the consolidation takenas a whole, and describes the principal risks that Heineken N.V. faces.
This statement cannot be construed as a statement in accordance with the requirements of Section 404 of the US Sarbanes-Oxley Act, which Act is not applicable to Heineken N.V.
Executive BoardR.G.S. van den Brink L.M. Debroux
Amsterdam, 9 February 2021
Corporate Governance statement
48 Heineken N.V. Annual Report 2020
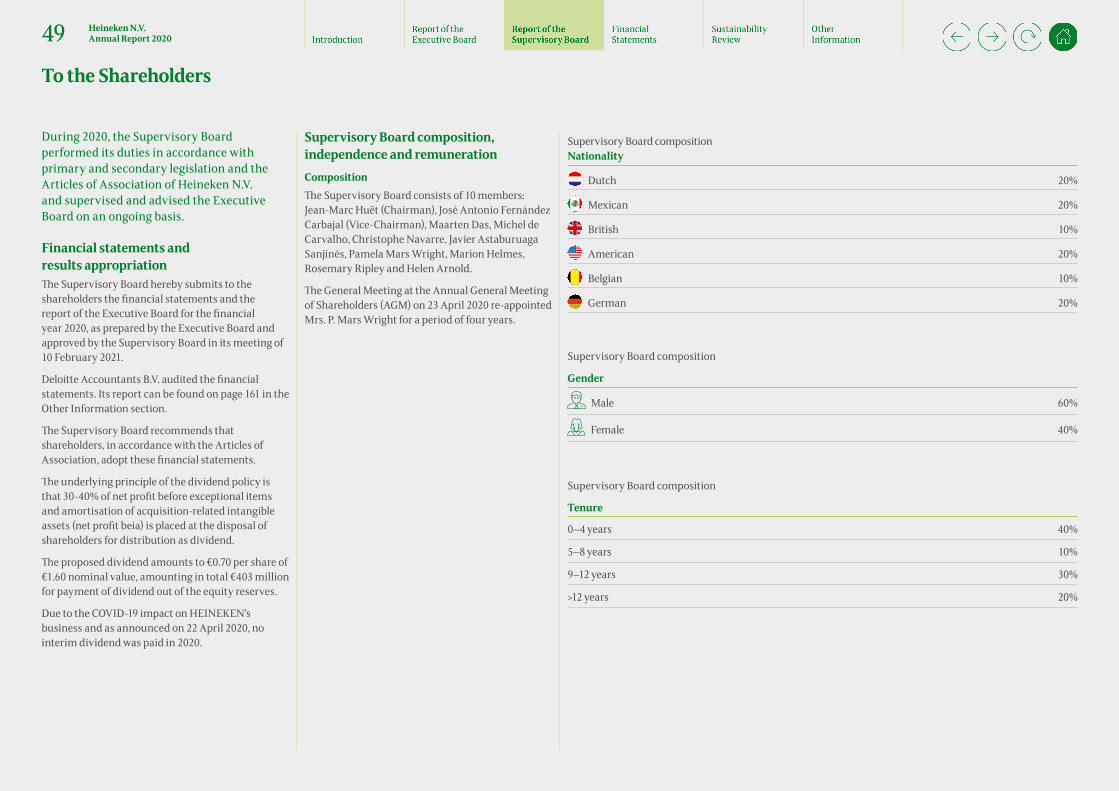
During 2020, the Supervisory Board performed its duties in accordance with primary and secondary legislation and the Articles of Association of Heineken N.V. and supervised and advised the Executive Board on an ongoing basis.
Financial statements and results appropriationThe Supervisory Board hereby submits to the shareholders the financial statements and the report of the Executive Board for the financial year 2020, as prepared by the Executive Board and approved by the Supervisory Board in its meeting of 10 February 2021.
Deloitte Accountants B.V. audited the financial statements. Its report can be found on page 161 in the Other Information section.
The Supervisory Board recommends that shareholders, in accordance with the Articles of Association, adopt these financial statements.
The underlying principle of the dividend policy is that 30-40% of net profit before exceptional items and amortisation of acquisition-related intangible assets (net profit beia) is placed at the disposal of shareholders for distribution as dividend.
The proposed dividend amounts to €0.70 per share of €1.60 nominal value, amounting in total €403 million for payment of dividend out of the equity reserves.
Due to the COVID-19 impact on HEINEKEN’s business and as announced on 22 April 2020, no interim dividend was paid in 2020.
Supervisory Board composition, independence and remunerationCompositionThe Supervisory Board consists of 10 members: Jean-Marc Huët (Chairman), José Antonio Fernández Carbajal (Vice-Chairman), Maarten Das, Michel de Carvalho, Christophe Navarre, Javier Astaburuaga Sanjinés, Pamela Mars Wright, Marion Helmes, Rosemary Ripley and Helen Arnold.
The General Meeting at the Annual General Meeting of Shareholders (AGM) on 23 April 2020 re-appointed Mrs. P. Mars Wright for a period of four years.
Supervisory Board compositionNationality
Dutch 20%
Mexican 20%
British 10%
American 20%
Belgian 10%
German 20%
Supervisory Board composition
Gender
Male 60%
Female 40%
Supervisory Board composition
Tenure
0–4 years 40%
5–8 years 10%
9–12 years 30%
>12 years 20%
To the Shareholders
49 Heineken N.V. Annual Report 2020

* For the maximum period of four years. ** Large Dutch Entities are Dutch N.V.s, B.V.s or Foundations (that are required to prepare annual accounts pursuant to Chapter 9 of Book 2 of the Dutch Civil Code or similar legislation)
that meet two of the following criteria (on a consolidated basis) on two consecutive balance sheet dates:(i) The value of the assets (according to the balance sheet with the explanatory notes and on the basis of acquisition and manufacturing costs) exceeds €20 million;(ii) The net turnover exceeds €40 million;(iii) The average number of employees is at least 250.
*** Under ‘Other positions’, other functions are mentioned that may be relevant to performance of the duties of the Supervisory Board.
Jean-Marc (J.M.) Huët
José Antonio (J.A.) Fernández Carbajal
Maarten (M.) Das
Michel (M.R.) de Carvalho
Christophe (V.C.O.B.J.) Navarre
1969 Dutch nationality Male 1954 Mexican nationality Male 1948 Dutch nationality Male 1944 British nationality Male 1958 Belgian nationality Male
Appointed in 2014; Chairman (as of 2019); latest reappointment in 2018*
Appointed in 2010; latest reappointment in 2018*Vice-Chairman (as of 2010)
Appointed in 1994; latest reappointment in 2017*Delegated Member (1995)
Appointed in 1996; latest reappointment in 2019* Appointed in 2009; latest reappointment in 2017*
Profession:Company Director
Profession:Executive Chairman Fomento Económico Mexicano S.A.B. de C.V. (FEMSA)
Profession:Lawyer
Profession:Chairman Capital Generation Partners
Profession:Chairman of Neptune International
Supervisory board seats (or non-executive board memberships) in Large Dutch Entities**: Vermaat Groep B.V.
Supervisory board seats (or non-executive board memberships) in Large Dutch Entities**.Heineken Holding N.V.
Supervisory board seats (or non-executive board memberships) in Large Dutch Entities**: Heineken Holding N.V. (Chairman)
No supervisory board seats (or non-executive board memberships) in Large Dutch Entities**
No supervisory board seats (or non-executive board memberships) in Large Dutch Entities**
Other positions***:Canada Goose Incorporated; Bridgepoint
Other positions***:Coca-Cola Femsa S.A.B. de C.V. (Chairman); Tecnológico de Monterrey (Chairman); participates on the Boardof Industrias Peñoles S.A.B. de C.V.; Term Member of the MIT Corporation
Other positions***:L’Arche Green N.V. (Chairman); L’Arche Holding B.V.
Other positions***:Heineken Holding N.V. (Executive Director), L’Arche Green N.V.
No other positions***
Javier (J.G.) Astaburuaga Sanjinés
Pamela (P.) Mars Wright
Marion (M.) Helmes
Rosemary (R.L.) Ripley
Helen (I.H.) Arnold
1959 Mexican nationality Male 1960 American nationality Female 1965 German nationality Female 1954 American nationality Female 1968 German nationality Female
Appointed in 2010; latest reappointment in 2018* Appointed in 2016; latest reappointment in 2020* Appointed in 2018* Appointed in 2019* Appointed in 2019*
Profession:Senior Vice President Corporate Development Fomento Económico Mexicano S.A.B. de C.V. (FEMSA)
Profession:Company Director
Profession:Company Director
Profession:Managing Director at NGEN
Profession:President Data Network at SAP
No supervisory board seats (or non-executive board memberships) in Large Dutch Entities**
Supervisory board seats (or non-executive board memberships) in Large Dutch Entities**:SHV Holdings N.V.
No supervisory board seats (or non-executive board memberships) in Large Dutch Entities**
No supervisory board seats (or non-executive board memberships) in Large Dutch Entities**
No supervisory board seats (or non-executive board memberships) in Large Dutch Entities**
Other positions***:Board member of Fomento Económico Mexicano S.A.B. de C.V. (FEMSA), Coca-Cola Femsa S.A.B. de C.V., and Acosta Verde, S.A. de C.V.
Other positions***:Johns Hopkins International Medicine
Other positions***:British American Tobacco; Prosiebensat.1 Media, Siemens Healthineers AG
Other positions***:Zevia LLC; HYLA, Inc; Nlyte Softwarde Lt.d.; Livingston Ripley Waterfowl Conservancy, advisory board of the Yale Center for Business and the Environment;
Other positions***: TUI AG
To the Shareholders
50 Heineken N.V. Annual Report 2020

The Supervisory Board has a diverse composition in terms of experience, gender, nationality and age. Four out of 10 members are women and eight out of 10 members are non-Dutch. There are six nationalities (American, Belgian, British, Dutch, German and Mexican) and age ranges between 51 and 76.
The Supervisory Board is of the opinion that a diversity of experience and skills is represented on its board. The elements of a diverse composition of the Supervisory Board are laid down in the Diversity Policy of the Supervisory Board, Executive Board and Executive Team as per best practice provision 2.1.5 of the Dutch Corporate Governance Code of 8 December 2016 (the ‘Code’).
The profile of the Supervisory Board and the Diversity Policy state that the Supervisory Board shall pursue that at least 30% of the seats shall be held by men and at least 30% by women. Currently, 40% (i.e. four out of ten) of the Supervisory Board members are female.
Diversity and gender are important drivers in the selection process. With reference thereto, the Supervisory Board is committed to retain an active and open attitude as regards selecting female candidates.
The Supervisory Board notes that gender is a construct and is, in the opinion of the Board, only one element of diversity. The Supervisory Board is keen to embrace diversity at large and considers gender, experience, background, nationality, knowledge, skills and insight are equally important and relevant criteria in selecting new members.
Mr. Das will have completed his four- year appointment term per the end of the AGM on 22 April 2021. A non-binding nomination for reappointment of Mr. Das. as member of the Supervisory Board shall be submitted to the 2021 AGM. Pursuant to best practice provision 2.1.8 of the Code, Mr. Das does not qualify as ‘independent’.
However, the Supervisory Board has ascertained that Mr. Das in fact acts critically and independently.
A reappointment of Mr. Das for a period of four years is not within the maximum appointment term of best practice provision 2.2.2 of the Code. However, in the interest of preserving the core values and the structure of the Heineken Group, the Company does not apply the maximum appointment period to members who are related by blood or affinity in the direct line descent to Mr. A.H. Heineken or who are members of the Board of Directors of Heineken Holding N.V.
In addition, Mr. Navarre will have completed his four-year appointment per the end of the AGM on 22 April 2021. In accordance with the company’s articles of association and best practice provision 2.2.2 of the Code, Mr. Navarre will not be nominated for reappointment as he has reached the maximum tenure of 12 years.
The Supervisory Board is grateful for Mr. Navarre’s commitment and meaningful contribution to the Supervisory Board and its Americas Committee over the past 12 years.
A non-binding nomination will be submitted to the 2021 AGM to appoint Mr. N. Paranjpe as member of the Supervisory Board as of 22 April 2021 for a period of four years.
IndependenceThe Supervisory Board endorses the principle that the composition of the Supervisory Board shall be such that its members are able to act critically and independently of one another and of the Executive Board and any particular interests.
Given the structure of the Heineken Group, the Company is of the opinion that, in the context of preserving the continuity of the Heineken Group and ensuring a focus on long-term value creation, it is in its best interest and that of its stakeholders
that the Supervisory Board includes a fair and adequate representation of persons who are related by blood or affinity in the direct line of descent to the late Mr. A.H. Heineken (former Chairman of the Executive Board), or who are members of the Board of Directors of Heineken Holding N.V., even if those persons would not, formally speaking, be considered ‘independent’ within the meaning of best practice provision 2.1.8 of the Code.
Currently, the majority of the Supervisory Board (i.e. six of its ten members) qualify as ‘independent’ as per best practice provision 2.1.8 of the Code.
There are four members who in a strictly formal sense do not meet the applicable criteria for being ‘independent’ as set out in the Code:
Mr. de Carvalho (who is the spouse of Mrs. C.L. de Carvalho-Heineken, the daughter of the late Mr. A.H. Heineken, and who also is an executive director of Heineken Holding N.V.), Mr. Das (who is the Chairman of the Board of Directors of Heineken Holding N.V.), Mr. Fernández Carbajal (who is a non-executive director of Heineken Holding N.V. and also is a representative of FEMSA) and Mr. Astaburuaga Sanjinés (who is a representative of FEMSA). However, the Supervisory Board has ascertained that Mr. de Carvalho, Mr. Das, Mr. Fernández Carbajal and Mr. Astaburuaga Sanjinés in fact act critically and independently.
RemunerationThe AGM determines the remuneration of the members of the Supervisory Board.
In 2020, a remuneration policy for members of the Supervisory Board was approved by the general meeting on 23 April 2020 to comply with the Dutch law implementing the European Shareholders Rights Directive.
Meetings and activities of the Supervisory BoardDuring 2020, the Supervisory Board held seven meetings with the Executive Board.
Due to the COVID-19 pandemic and the CEO transition, the agenda regularly included subjects such as the impact of COVID-19 and mitigating measures, and the development of the Company’s strategy aimed at determining how best to sustain growth and success in a fast changing world.
In addition, the agenda for the Supervisory Board included long-term value creation as well as the manner in which the Executive Board implements the Company’s strategy, the Company’s culture to ensure proper monitoring by the Supervisory Board, the Company’s financial position, the results of the Regions and Operating Companies, acquisitions, large investment proposals, the yearly budget, management changes and the internal risk management and control system.
The external auditor attended the meeting in which the annual results were discussed.
In 2020, specific attention was given to the transition to a new Chairman and CEO of the Executive Board per 1 June 2020 and the impact of COVID-19, including mitigating measures.
As a result, the Chairman of the Supervisory Board met more frequently with the CEO and kept the Supervisory Board informed.
The Supervisory Board had a two-day meeting with the Executive Team to discuss the Company’s strategic priorities in a fast changing world. During this meeting strategic review efforts were discussed, focused on shaping the company to emerge stronger from the COVID-19 crisis.
To the Shareholders
51 Heineken N.V. Annual Report 2020
During the year, several representatives of senior management and the Executive Team were invited to give presentations to the Supervisory Board.
In 2020, the following subjects were presented in more detail:
– The succession of the CEO, for which a thoroughsuccession process has been conducted.
– Impact of COVID-19 and measures, amongst others, to ensure the health and safety of employees, support suppliers, commitment to no structural layoffs until the end of 2020 as a consequence of COVID-19, secure financing, establish a crisis governance through a Global Task Force installed to respond to COVID-19 and pro-actively take business measures and mitigations (including cost reductions, suspending all travel, a hiring freeze, suspending all non-committed CAPEX, and implementing remunerationrelated measures affecting the Executive Board as further described in the Remuneration Report).
– Building the Executive Team including the appointment of a Chief Digital & Technology Officer, and the succession and appointment of the Chief Supply Chain Officer, Chief Corporate Affairs and Transformation Officer, the RegionalPresident Asia Pacific, the Regional President Europe, as well as successors for the Chief Commerce Officer and Chief People Officer.
– Navigating the COVID-19 pandemic while building a bright future including the state of thebusiness and the strategic response to the fast changing world.
Regular Executive Sessions were held without the Executive Board being present. The purpose of these sessions was to evaluate the Supervisory Board meetings and, where relevant, further reflect on particular subjects discussed at the meetings.
One Executive Session was dedicated to the evaluation of the Supervisory Board relating to the performance, working methods, procedures and functioning of the
Supervisory Board, its committees and its individual members as well as the functioning of the Executive Board and its individual members. These evaluations were conducted on the basis of individual interviews of the Supervisory Board members with the Chairman. The conversations covered topics such as the composition and expertise of the Supervisory Board, access to information, frequency and quality of the meetings, leadership developments, quality and timeliness of the meeting materials, and the nature of the topics discussed during meetings. The responses provided by the Supervisory Board members indicated that the Board continues to be a well-functioning team.
CommitteesThe Supervisory Board has five Committees: the Preparatory Committee, the Audit Committee, the Selection & Appointment Committee, the Remuneration Committee and, since December 2020, the Sustainability & Responsibility Committee (instead of the Americas Committee). The terms of reference for the Committees are available on the Company’s website.
Preparatory CommitteeComposition: Mr. Huët (Chairman), Mr. de Carvalho, Mr. Das and Mr. Fernández Carbajal. The Preparatory Committee met seven times. The Committee prepares decision-making by the Supervisory Board on matters not already handled by any of the other Committees, such as in relation to acquisitions and investments. The Chairman of the Executive Board also attends the Preparatory Committee meetings.
Audit CommitteeComposition: Mrs. Helmes (Chairperson), Mr. Huët, Mr. Astaburuaga Sanjinés and Mrs. Arnold. The Audit Committee met four times. The members collectively have the experience and financial expertise to supervise the Executive Board in its activities in relation to the publication of financial statements and
operation of the internal risk management and control systems, including the risk profile of the Company.
The Executive Board attended all meetings, and so did the external auditor, the Executive Director Global Audit, as well as the Senior Director Global Accounting and Risk Management. The Senior Director Global Finance Process and Services attended three out of four meetings.
The Executive Director Global Audit has direct access to the Audit Committee, primarily through its Chairperson. During the year, the Audit Committee met once with the external auditors and once with the Executive Director Global Audit, in both instances without management being present. In addition, the Chairperson of the Audit Committee and the Executive Director Global Audit held regular update meetings during the year.
The Committee supervises the activities of the Executive Board with respect to the publication of financial information. The Committee reviews, in the presence of the Executive Board and the external auditor, the appropriateness of the half-year reporting and the annual financial statements, focusing on:
– The decisions made on the selection andapplication of accounting policies.
– The reliability and completeness of disclosures. – Compliance with financial, non-financial and
other reporting requirements. – Significant judgements, estimates and assumptions
used in preparing the reports in respect of, among others, accounting for acquisitions and divestments, the annual impairment test and determining the level of provisions.
At the beginning of the year, the Committee reviews and approves the audit plans of the external auditor as well as Global Audit. The Committee focuses mainly on the scoping, key risks, staffing and budget.
During the year, the Committee reviews the reports of the external auditor and Global Audit.
The Chairperson of the Audit Committee held regular update meetings with the CFO and other senior executives to monitor the business impact of COVID-19 and measures taken to mitigate its impact. This included:
– Measures taken to avoid liquidity risks. – Establishing crisis governance through a Global
Task Force installed to respond to COVID-19 and pro-actively take business measures and mitigations (including suspending all travel, a hiring freeze, suspending all non-committed CAPEX, cancellation of STI and LTI and a 20% voluntary base salary cut by the Executive Boardand the Executive Team),
– Reviewing financial results and financing needs. – Responding to securing financing and getting
ready for post-COVID-19 developments
Furthermore, the Committee in 2020 discussed recurring topics, such as:
– The effectiveness and the outcome of the internalcontrol and risk management systems, as well as changes made and improvements planned to these systems.
– (Functional) Updates in respect of Global Procurement, Global Digital & Technology, Global Treasury & Insurance and Global Tax, Pensions, Business Conduct and Global Legal Affairs, as well as Risk Management.
– Updates in respect of Global Digital & Technologyregarding information security in the office domain and the process control domain within the brewery.
– HEINEKEN’s governance, risk and compliance(GRC) activities, including the HEINEKEN Company Rules and the HEINEKEN Code of Business Conduct.
To the Shareholders
52 Heineken N.V. Annual Report 2020

– Post investment reviews of large investments. – The outcome of the Global Audit activities. – The outcome of the annual Letter of
Representation process and the report from theIntegrity Committee related to fraud reporting and Speak Up policy.
– The evaluation of the external auditor, DeloitteAccountants B.V.
In addition, a Technology and Data working session was held with the Committee to discuss a data-driven transformation of the business. The Chairperson of the Audit Committee informed the Supervisory Board of the discussions held in the Audit Committee in respect of these recurring topics and in particular the impact of and measures taken in respect of COVID-19.
Selection & Appointment Committee Composition: Mr. Huët (Chairman), Mr. de Carvalho, Mr. Das, Mr. Fernández Carbajal and Mrs. Mars Wright. The Selection & Appointment Committee met five times.
In 2020, the following subjects were on the agenda:
– The succession of the CEO, which has been a thorough and robust process. The Chief HR Officerand an external advisor have been extensively involved throughout the process.
– The appointment of a Chief Digital & TechnologyOfficer, and the succession and appointment of the Chief Supply Chain Officer, Chief Corporate Affairs and Transformation Officer, the Regional President Asia Pacific, the Regional President Europe, as well as successors for the Chief Commerce Officer and Chief People Officer.
– The composition and rotation schedule of the Supervisory Board and its Committees includingthe succession of Mr. Navarre.
Remuneration CommitteeComposition: Mr. Das (Chairman), Mr. de Carvalho, Mr. Huët and Mrs. Ripley. The Remuneration Committee met four times in 2020.
The Committee made recommendations to the Supervisory Board on 2020 target setting and 2019 payout levels for the STIP and LTIP awards to the Executive Board, all of which were endorsed by the Supervisory Board. As part of the recommendations, the Remuneration Committee took note of the Executive Board member’s views with regard to the amount and structure of their own remuneration.
The Remuneration Committee also received a report on status and trends in executive remuneration and executive remuneration governance in order to fulfil its remuneration governance responsibilities. The report aimed, among other things, to review alignment of HEINEKEN’s remuneration practices with its remuneration principles, to provide an overview of HEINEKEN’s competitive remuneration positioning versus the market, to assess the relation between actual remuneration and performance, and to update the Committee on executive compensation trends, regulatory developments and views of investors, external stakeholders including public opinion.
In the context of the significant impact of the COVID-19 crisis on the Company, remuneration related measures affecting the Executive Board have been implemented for 2020. These are explained in the Remuneration Report.
Americas CommitteeComposition: Mr. Fernández Carbajal (Chairman), Mr. de Carvalho, Mr. Navarre, and Mrs. Mars Wright. The Committee did not meet in 2020 as all matters relating to the Americas region were absorbed by the Supervisory Board as a whole. In December 2020, the Supervisory Board decided to discontinue and absorb the responsibilities of the Americas Committee and as a result will supervise all regions alike.
Sustainability & Responsibility CommitteeComposition: Mr. Fernández Carbajal (Chairman), Mr. de Carvalho, Mrs. Mars Wright, Mrs. Ripley and Mr. Paranjpe (as observer until his appointment by the Annual General Meeting of Shareholders in 2021). The Committee was installed by the Supervisory Board in December 2020 and met once in 2020.
In 2020, the following subjects were on the agenda:
– The scope of the Committee. – The Brewing a Better World strategy and current environmental footprint, responsible consumption
and social sustainability topics.
AttendanceThe Supervisory Board confirms that all Supervisory Board members have adequate time available to give sufficient attention to the concerns of the Company. In 2020, the attendance rate was 97% for the Supervisory Board meetings and 97% including the Committee meetings. In case of absence, members are fully informed in advance, enabling them to provide input for the meeting, and they are also updated on the meeting outcome.
The table below provides an overview of the attendance record of the individual members of the Supervisory Board. Attendance is expressed as a number of meetings attended out of the number eligible to attend.
Evaluation of the Supervisory Board and the Executive Board.
Supervisory Board
Preparatory Committee
Audit Committee
Selection & Appointment
Committee
Remune- ration
CommitteeAmericas
Committee
Sustain-ability &
Responsi-bility
Committee
Mr. Huët 7/7 7/7 4/4 4/4 4/4Mr. Fernández Carbajal 7/7 7/7 4/4 0/0 1/1Mr. Das 7/7 7/7 4/4 4/4Mr. de Carvalho 7/7 7/7 4/4 4/4 0/0 1/1Mr. Navarre 5/7 0/0Mr. Astaburuaga Sanjinés 7/7 4/4Mrs. Mars Wright 7/7 4/4 0/0 1/1Mrs. Helmes 7/7 4/4Mrs. Ripley 7/7 4/4 1/1Mrs. Arnold 7/7 4/4
To the Shareholders
53 Heineken N.V. Annual Report 2020
Executive Board composition and remunerationCompositionBest practice provision 2.2.1 of the Code recommends that an Executive Board member is appointed for a period of four years and that a member may be reappointed for a term of not more than four years at a time.
In compliance with this best practice provision, the Supervisory Board has drawn up a rotation schedule to avoid, as much as possible, a situation in which Executive Board members retire at the same time.
Mr. Jean-François van Boxmeer was initially appointed for an indefinite term in 2001 and was reappointed for a period of four years in 2017.
Mr. Dolf van den Brink, who was appointed for a period of four years during the AGM in 2020, succeeded Mr. Jean-François van Boxmeer as Chairman and CEO of the Executive Board on 1 June 2020.
Mrs. Laurence Debroux was reappointed for a period of four years in 2019.
RemunerationThe AGM approved the current remuneration policy for the Executive Board in 2011 and approved amendments in 2014, 2017 and 2020.
Details of the policy and its implementation are described in the Remuneration Report.
AppreciationThe Supervisory Board wishes to express its gratitude to the members of the Executive Board and all HEINEKEN employees for their hard work and dedication in 2020.
Supervisory Board Heineken N.V.Huët Astaburuaga Sanjinés Fernández Carbajal Mars Wright Das Helmes de Carvalho Ripley Navarre Arnold
Amsterdam, 9 February 2021
To the Shareholders
54 Heineken N.V. Annual Report 2020
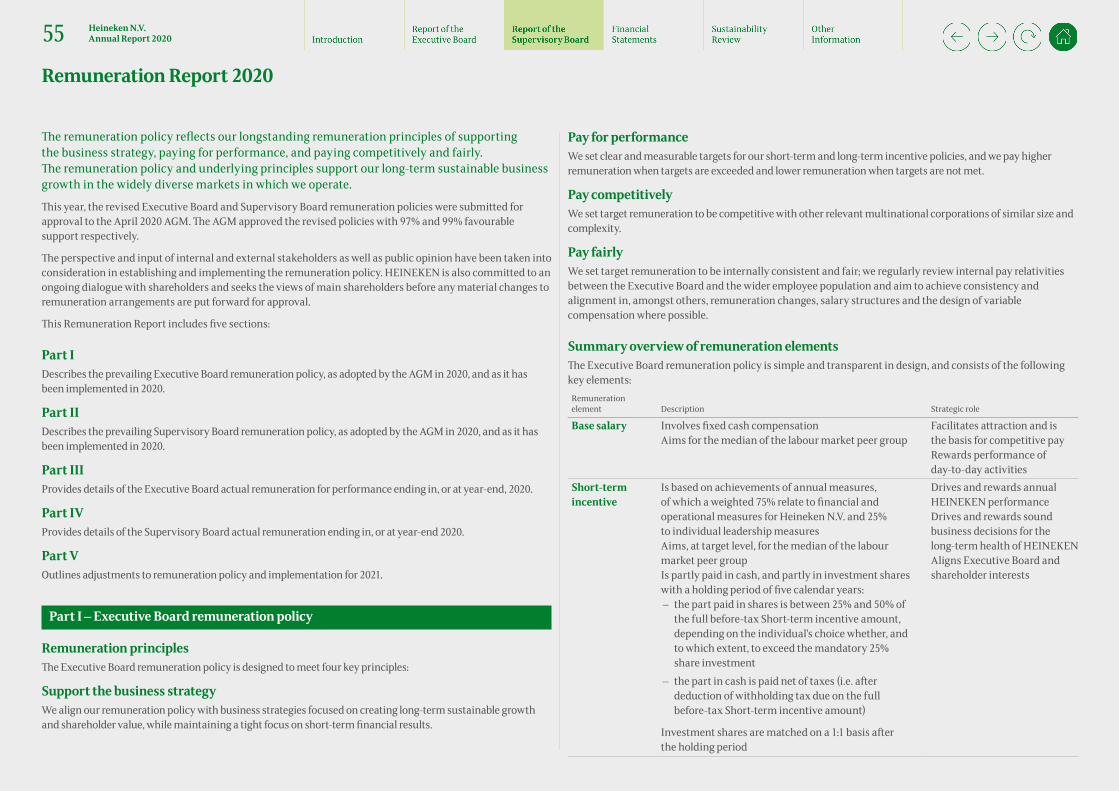
The remuneration policy reflects our longstanding remuneration principles of supporting the business strategy, paying for performance, and paying competitively and fairly. The remuneration policy and underlying principles support our long-term sustainable business growth in the widely diverse markets in which we operate.
This year, the revised Executive Board and Supervisory Board remuneration policies were submitted for approval to the April 2020 AGM. The AGM approved the revised policies with 97% and 99% favourable support respectively.
The perspective and input of internal and external stakeholders as well as public opinion have been taken into consideration in establishing and implementing the remuneration policy. HEINEKEN is also committed to an ongoing dialogue with shareholders and seeks the views of main shareholders before any material changes to remuneration arrangements are put forward for approval.
This Remuneration Report includes five sections:
Part I Describes the prevailing Executive Board remuneration policy, as adopted by the AGM in 2020, and as it has been implemented in 2020.
Part II Describes the prevailing Supervisory Board remuneration policy, as adopted by the AGM in 2020, and as it has been implemented in 2020.
Part IIIProvides details of the Executive Board actual remuneration for performance ending in, or at year-end, 2020.
Part IVProvides details of the Supervisory Board actual remuneration ending in, or at year-end 2020.
Part VOutlines adjustments to remuneration policy and implementation for 2021.
Part I – Executive Board remuneration policy
Remuneration principles The Executive Board remuneration policy is designed to meet four key principles:
Support the business strategy We align our remuneration policy with business strategies focused on creating long-term sustainable growth and shareholder value, while maintaining a tight focus on short-term financial results.
Pay for performance We set clear and measurable targets for our short-term and long-term incentive policies, and we pay higher remuneration when targets are exceeded and lower remuneration when targets are not met.
Pay competitively We set target remuneration to be competitive with other relevant multinational corporations of similar size and complexity.
Pay fairly We set target remuneration to be internally consistent and fair; we regularly review internal pay relativities between the Executive Board and the wider employee population and aim to achieve consistency and alignment in, amongst others, remuneration changes, salary structures and the design of variable compensation where possible.
Summary overview of remuneration elementsThe Executive Board remuneration policy is simple and transparent in design, and consists of the following key elements:
Remuneration element Description Strategic role
Base salary Involves fixed cash compensation Aims for the median of the labour market peer group
Facilitates attraction and is the basis for competitive payRewards performance of day-to-day activities
Short-term incentive
Is based on achievements of annual measures, of which a weighted 75% relate to financial and operational measures for Heineken N.V. and 25% to individual leadership measures Aims, at target level, for the median of the labour market peer group Is partly paid in cash, and partly in investment shares with a holding period of five calendar years:
– the part paid in shares is between 25% and 50% of the full before-tax Short-term incentive amount, depending on the individual’s choice whether, andto which extent, to exceed the mandatory 25% share investment
– the part in cash is paid net of taxes (i.e. after deduction of withholding tax due on the fullbefore-tax Short-term incentive amount)
Investment shares are matched on a 1:1 basis after the holding period
Drives and rewards annual HEINEKEN performance Drives and rewards sound business decisions for the long-term health of HEINEKEN Aligns Executive Board and shareholder interests
Remuneration Report 2020
55 Heineken N.V. Annual Report 2020
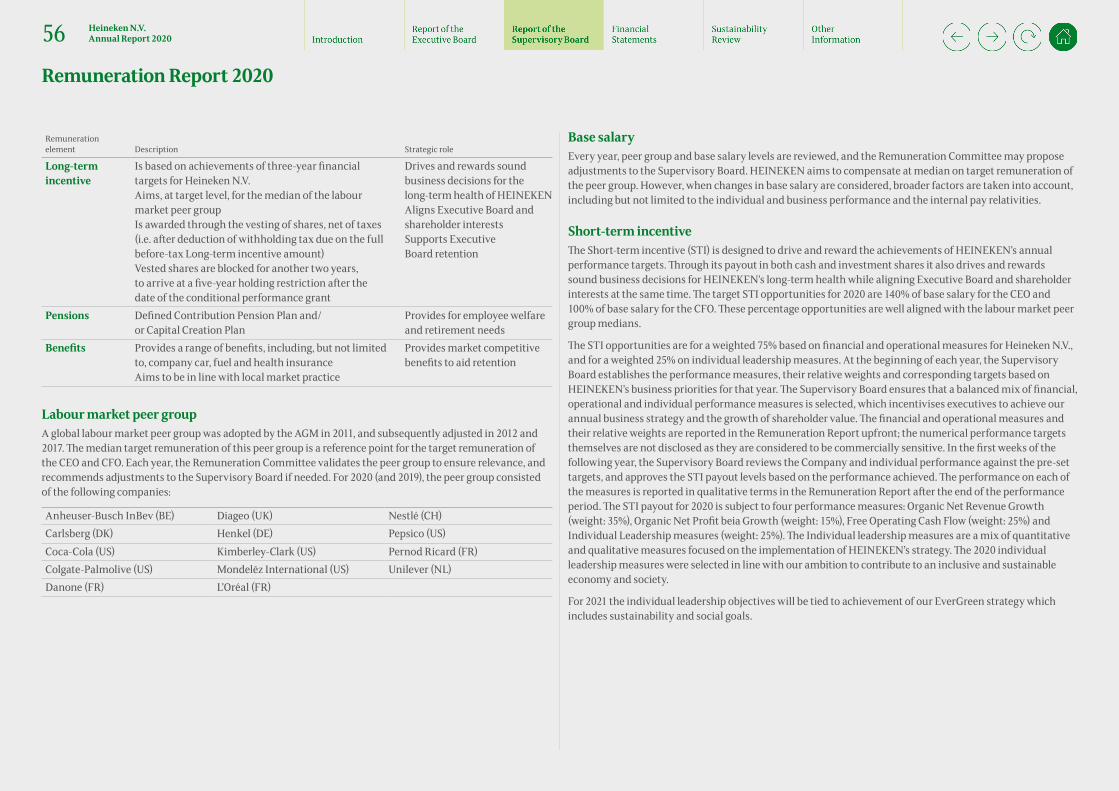
Remuneration element Description Strategic role
Long-term incentive
Is based on achievements of three-year financial targets for Heineken N.V. Aims, at target level, for the median of the labour market peer groupIs awarded through the vesting of shares, net of taxes (i.e. after deduction of withholding tax due on the full before-tax Long-term incentive amount)Vested shares are blocked for another two years, to arrive at a five-year holding restriction after the date of the conditional performance grant
Drives and rewards sound business decisions for the long-term health of HEINEKENAligns Executive Board and shareholder interestsSupports Executive Board retention
Pensions Defined Contribution Pension Plan and/ or Capital Creation Plan
Provides for employee welfare and retirement needs
Benefits Provides a range of benefits, including, but not limited to, company car, fuel and health insuranceAims to be in line with local market practice
Provides market competitive benefits to aid retention
Labour market peer group A global labour market peer group was adopted by the AGM in 2011, and subsequently adjusted in 2012 and 2017. The median target remuneration of this peer group is a reference point for the target remuneration of the CEO and CFO. Each year, the Remuneration Committee validates the peer group to ensure relevance, and recommends adjustments to the Supervisory Board if needed. For 2020 (and 2019), the peer group consisted of the following companies:
Anheuser-Busch InBev (BE) Diageo (UK) Nestlé (CH)Carlsberg (DK) Henkel (DE) Pepsico (US)Coca-Cola (US) Kimberley-Clark (US) Pernod Ricard (FR)Colgate-Palmolive (US) Mondelēz International (US) Unilever (NL)Danone (FR) L’Oréal (FR)
Base salaryEvery year, peer group and base salary levels are reviewed, and the Remuneration Committee may propose adjustments to the Supervisory Board. HEINEKEN aims to compensate at median on target remuneration of the peer group. However, when changes in base salary are considered, broader factors are taken into account, including but not limited to the individual and business performance and the internal pay relativities.
Short-term incentiveThe Short-term incentive (STI) is designed to drive and reward the achievements of HEINEKEN’s annual performance targets. Through its payout in both cash and investment shares it also drives and rewards sound business decisions for HEINEKEN’s long-term health while aligning Executive Board and shareholder interests at the same time. The target STI opportunities for 2020 are 140% of base salary for the CEO and 100% of base salary for the CFO. These percentage opportunities are well aligned with the labour market peer group medians.
The STI opportunities are for a weighted 75% based on financial and operational measures for Heineken N.V., and for a weighted 25% on individual leadership measures. At the beginning of each year, the Supervisory Board establishes the performance measures, their relative weights and corresponding targets based on HEINEKEN’s business priorities for that year. The Supervisory Board ensures that a balanced mix of financial, operational and individual performance measures is selected, which incentivises executives to achieve our annual business strategy and the growth of shareholder value. The financial and operational measures and their relative weights are reported in the Remuneration Report upfront; the numerical performance targets themselves are not disclosed as they are considered to be commercially sensitive. In the first weeks of the following year, the Supervisory Board reviews the Company and individual performance against the pre-set targets, and approves the STI payout levels based on the performance achieved. The performance on each of the measures is reported in qualitative terms in the Remuneration Report after the end of the performance period. The STI payout for 2020 is subject to four performance measures: Organic Net Revenue Growth (weight: 35%), Organic Net Profit beia Growth (weight: 15%), Free Operating Cash Flow (weight: 25%) and Individual Leadership measures (weight: 25%). The Individual leadership measures are a mix of quantitative and qualitative measures focused on the implementation of HEINEKEN’s strategy. The 2020 individual leadership measures were selected in line with our ambition to contribute to an inclusive and sustainable economy and society.
For 2021 the individual leadership objectives will be tied to achievement of our EverGreen strategy which includes sustainability and social goals.
Remuneration Report 2020
56 Heineken N.V. Annual Report 2020

For each performance measure, a threshold, target and maximum performance level is set with the following STI payout, as a percentage of target payout:
Threshold performance50% of target payout
Target performance100% of target payout
Maximum performance200% of target payout.
For each measure, payout in between these performance levels is on a straight-line basis; below threshold performance the payout is zero, whereas beyond maximum performance it is capped at 200% of payout at target.
In line with policy, 25% of the STI payout is paid out in shares, referred to as investment shares. At their discretion, the Executive Board members have the opportunity to indicate before the end of the performance year whether they wish to receive up to another 25% of their STI payout in additional investment shares. All investment shares thus received are then blocked and cannot be sold under any circumstance, including resignation, for five calendar years to link the value of the investment shares to long-term Company performance. Withholding tax on the investment shares and on the cash part of the STI payout is settled with the cash part at the time of payout. After the blocking period is completed after five calendar years, the Company will match the investment shares 1:1 in the first weeks of the following year, i.e. one matching share is granted for each investment share. As from then, there are no holding requirements on these investment shares anymore, and there are no holding requirements on the resulting matching shares that remain after withholding tax on these shares. According to plan rules, matching entitlements will be forfeited in case of dismissal by the Company for an urgent reason within the meaning of the law (‘dringende reden’), or in case of dismissal for cause (‘gegronde reden’), whereby the cause for dismissal concerns unsatisfactory functioning of the Executive Board member. With this ‘deferral-and-matching’ proposition a significant share ownership by the Executive Board is ensured, creating an increased alignment with the interests of shareholders. The Supervisory Board has the power to revise the amount of the STI payout to an appropriate amount if the STI payout that would have been payable in accordance with the agreed payment schedule would be unacceptable according to standards of reasonableness and fairness. The Supervisory Board is entitled to claw back all or part of the STI payout (in cash, investment shares or matching shares) insofar as it has been made on the basis of incorrect information about achieving the performance conditions.
Long-term incentiveThe Long-term incentive (LTI) is designed to drive and reward sound business decisions for HEINEKEN’s long-term health, and to align the Executive Board with shareholder interests by linking rewards to HEINEKEN’s share price performance. The target LTI opportunities for 2020 are 150% of base salary for the CEO and 125% of base salary for the CFO.
Each year, a target number of performance shares is conditionally granted based on the aforementioned target LTI opportunity percentage of that year, the base salary of that year, and the closing share price of 31 December of the preceding year. The vesting of these performance shares is contingent on HEINEKEN’s performance over a period of three years on four fundamental financial performance measures:
Organic Net Revenue GrowthTo drive top line growth
Organic Operating Profit beia GrowthTo drive profitability and operational efficiency
Earnings Per Share (EPS) beia GrowthTo drive overall long-term Company performance
Free Operating Cash FlowTo drive focus on cash.
These four performance measures have equal weight to minimise the risk that participants over-emphasise one performance measure to the detriment of others. At the beginning of each performance period, the Supervisory Board establishes the corresponding numerical targets for these performance measures based on HEINEKEN’s business priorities. These targets are not disclosed upfront as they are considered to be commercially sensitive. In the first weeks after the end of the performance period, the Supervisory Board reviews the Company’s performance against the pre-set targets, and approves the LTI vesting based on the performance achieved. The performance on each of the measures is reported in qualitative terms in the Remuneration Report after the performance period has been completed (cf. Part III).
For each performance measure, a threshold, target and maximum performance level is set with the following performance share vesting schedule:
Threshold performance50% of performance shares vests
Target performance100% of performance shares vests
Maximum performance200% of performance shares vests.
Remuneration Report 2020
57 Heineken N.V. Annual Report 2020
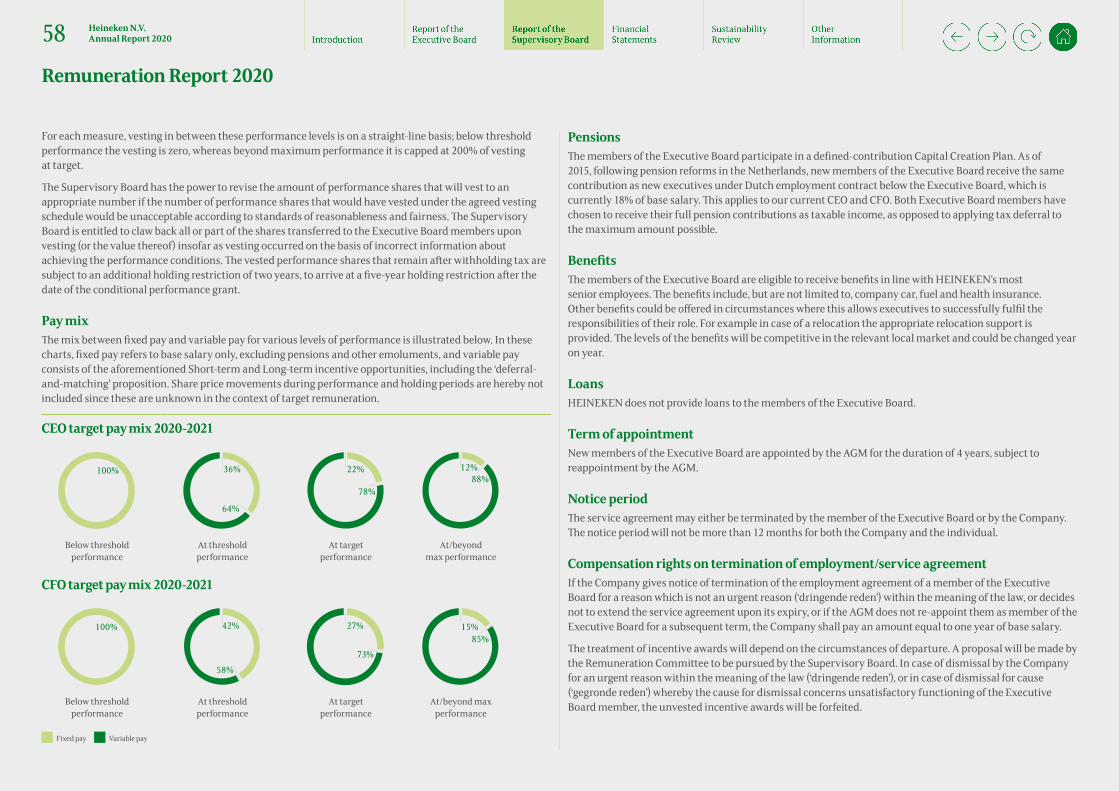
For each measure, vesting in between these performance levels is on a straight-line basis; below threshold performance the vesting is zero, whereas beyond maximum performance it is capped at 200% of vesting at target.
The Supervisory Board has the power to revise the amount of performance shares that will vest to an appropriate number if the number of performance shares that would have vested under the agreed vesting schedule would be unacceptable according to standards of reasonableness and fairness. The Supervisory Board is entitled to claw back all or part of the shares transferred to the Executive Board members upon vesting (or the value thereof) insofar as vesting occurred on the basis of incorrect information about achieving the performance conditions. The vested performance shares that remain after withholding tax are subject to an additional holding restriction of two years, to arrive at a five-year holding restriction after the date of the conditional performance grant.
Pay mixThe mix between fixed pay and variable pay for various levels of performance is illustrated below. In these charts, fixed pay refers to base salary only, excluding pensions and other emoluments, and variable pay consists of the aforementioned Short-term and Long-term incentive opportunities, including the ‘deferral-and-matching’ proposition. Share price movements during performance and holding periods are hereby not included since these are unknown in the context of target remuneration.
CEO target pay mix 2020-2021
100% 36%
64%
22%
78%
12%88%
Below threshold performance
At threshold performance
At target performance
At/beyond max performance
CFO target pay mix 2020-2021
100% 42%
58%
27%
73%
15%85%
Below threshold performance
At threshold performance
At target performance
At/beyond max performance
Fixed pay Variable pay
PensionsThe members of the Executive Board participate in a defined-contribution Capital Creation Plan. As of 2015, following pension reforms in the Netherlands, new members of the Executive Board receive the same contribution as new executives under Dutch employment contract below the Executive Board, which is currently 18% of base salary. This applies to our current CEO and CFO. Both Executive Board members have chosen to receive their full pension contributions as taxable income, as opposed to applying tax deferral to the maximum amount possible.
Benefits The members of the Executive Board are eligible to receive benefits in line with HEINEKEN’s most senior employees. The benefits include, but are not limited to, company car, fuel and health insurance. Other benefits could be offered in circumstances where this allows executives to successfully fulfil the responsibilities of their role. For example in case of a relocation the appropriate relocation support is provided. The levels of the benefits will be competitive in the relevant local market and could be changed year on year.
LoansHEINEKEN does not provide loans to the members of the Executive Board.
Term of appointmentNew members of the Executive Board are appointed by the AGM for the duration of 4 years, subject to reappointment by the AGM.
Notice period The service agreement may either be terminated by the member of the Executive Board or by the Company. The notice period will not be more than 12 months for both the Company and the individual.
Compensation rights on termination of employment/service agreementIf the Company gives notice of termination of the employment agreement of a member of the Executive Board for a reason which is not an urgent reason (‘dringende reden’) within the meaning of the law, or decides not to extend the service agreement upon its expiry, or if the AGM does not re-appoint them as member of the Executive Board for a subsequent term, the Company shall pay an amount equal to one year of base salary.
The treatment of incentive awards will depend on the circumstances of departure. A proposal will be made by the Remuneration Committee to be pursued by the Supervisory Board. In case of dismissal by the Company for an urgent reason within the meaning of the law (‘dringende reden’), or in case of dismissal for cause (‘gegronde reden’) whereby the cause for dismissal concerns unsatisfactory functioning of the Executive Board member, the unvested incentive awards will be forfeited.
Remuneration Report 2020
58 Heineken N.V. Annual Report 2020
Derogation clauseThe Supervisory Board, upon recommendation of the Remuneration Committee, may temporarily deviate from any sections of the Policy based on its discretion in the circumstances described below:
– Upon change of the Executive Board member in accordance with the new hire policy, – In any other circumstance where the deviation may be required to serve the long-term interests and
sustainability of the Company as a whole or to assure its viability.
New hire policyOur recruitment policy is to offer a compensation package that allows HEINEKEN to attract, retain and motivate the individual with the right skills for the required role. When determining remuneration for an Executive Board member, the Supervisory Board will, at the recommendation of the Remuneration Committee, consider the role’s requirements, business needs, the individual’s skills and experience and the relevant external talent market.
Where an individual is recruited externally for an Executive Board member position, the remuneration package in their prior role will be taken into account. The Supervisory Board will seek to align the new member’s remuneration package with the Executive Board Remuneration Policy. The Company may offer compensation to buy out awards or other lost compensation which the candidate held prior to joining HEINEKEN, but which lapsed upon leaving their previous employer. The rationale of any such award will be disclosed in the Remuneration Report.
Where an individual is appointed to the Executive Board through internal promotion or following a corporate transaction (e.g. an acquisition), the Board retains the ability to honour any legally binding legacy arrangements agreed prior to the appointment.
Remuneration GovernanceThe Remuneration Committee makes the proposal to the Supervisory Board for the Remuneration Policy to be pursued, and makes a proposal for the remuneration of the individual members of the Executive Board for adoption by the Supervisory Board. In accordance with Dutch Law, the remuneration policy will be submitted for approval to the AGM at least every four years, or in case of material amendments to the policy. The Executive Board members shall not participate in the decision making regarding their own remuneration to avoid conflict of interest.
Part II –Supervisory Board remuneration policy
Remuneration principles The Supervisory Board remuneration policy is designed to attract and retain high-class and diverse profiles with relevant skills and experience that are required to perform the Supervisory Board’s duties and it ensures appropriate corporate governance by meeting the following key principles:
– Support the business strategy We align our remuneration policy with business strategies focused on creating long-term sustainable growth and shareholder value.
– Pay for purpose We align our remuneration policy to promote the independence and objectivity of our Supervisory Board members, which is a key element to best serve the long-term interest of the company.
– Pay competitively We set remuneration levels to be competitive with other relevant multinational corporations of similar size and complexity.
While establishing and implementing the policy, the perspective and input of internal and external stakeholders and the external environment in which HEINEKEN operates, are taken into consideration. HEINEKEN is also committed to an ongoing dialogue with shareholders and seeks the views of significant shareholders before any material changes to remuneration arrangements are put forward for approval.
Remuneration Report 2020
59 Heineken N.V. Annual Report 2020

Summary overview of remuneration elementsThe Supervisory Board remuneration policy is simple and transparent in design, and consists of the following key elements:
Element Purpose Description
Base Board Fees
– Supervisory Board members receive a fixed cash compensation for their services.
– In line with the Dutch Corporate Governance code, no variable pay and / or equity awards are offered.
– In order to provide a fee level that is competitive with other companies comparable to HEINEKEN, reviews areconducted on a regular basis.
– The Remuneration Committee is responsible to review the compensationlevels on a regular basis and to bring forward proposals (if any) to the Supervisory Board. Proposals are submitted to the Annual General Meeting for approval.
– This review is done through a benchmark assessment against a pan-European peer group consisting of companies that are of comparable size to HEINEKEN.
Committee Fees
– Supervisory Board members are compensated for additionalresponsibilities such as Committee membership.
– In order to provide a fee level that is competitive with other companies comparable to HEINEKEN, reviews areconducted on a regular basis.
– Members are eligible to receive additional fees in respect of serving as aChairman or Member of a Committee.
– Fee levels between Committees can differ if this is deemed appropriate depending on the time commitment and responsibilities associated with theCommittee membership.
– Fees are additive; if a Board member serves in multiple Committees, the compensation will consist of the Boardmembership fee and the sum of the corresponding Committee fees.
Allowances and Benefits
– Supervisory Board members are reimbursed and compensated for additional efforts that enable them toexercise their role.
– Members receive reimbursement of travel expenses and are compensated for intercontinental travel required toexercise their role.
– Small benefits such as retirement giftsmay also be provided.
Remuneration Report 2020
60 Heineken N.V. Annual Report 2020
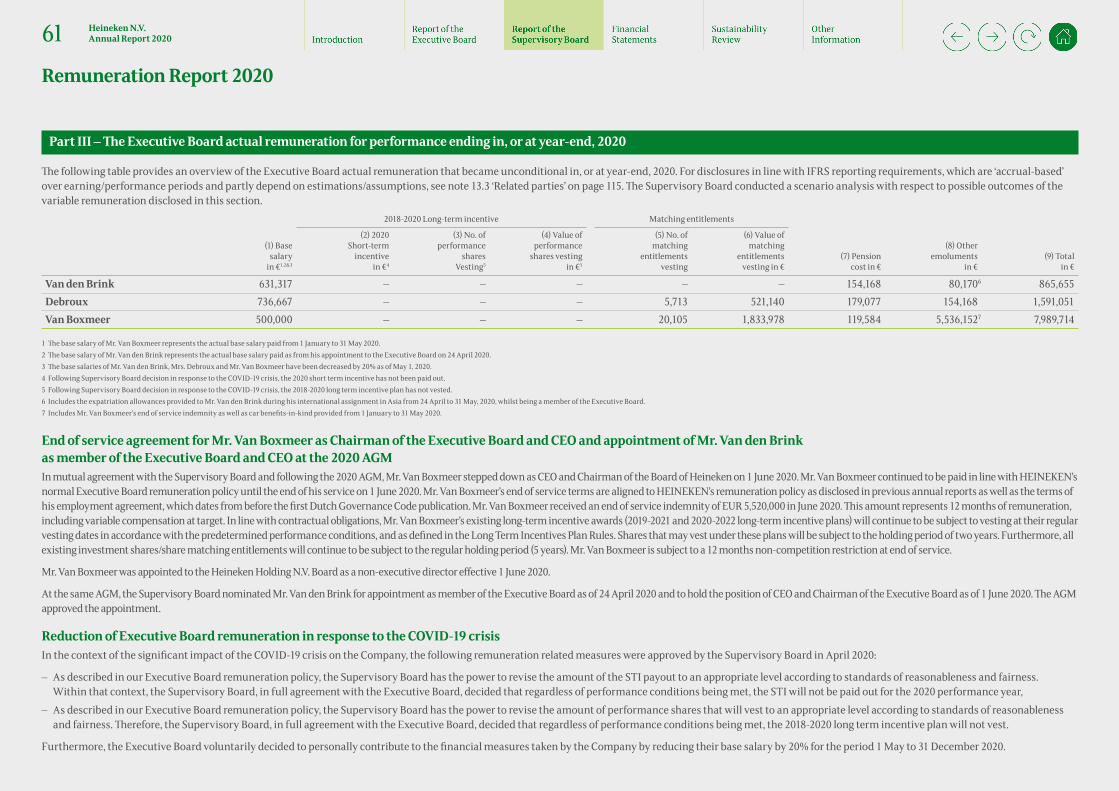
Part III – The Executive Board actual remuneration for performance ending in, or at year-end, 2020
The following table provides an overview of the Executive Board actual remuneration that became unconditional in, or at year-end, 2020. For disclosures in line with IFRS reporting requirements, which are ‘accrual-based’ over earning/performance periods and partly depend on estimations/assumptions, see note 13.3 ‘Related parties’ on page 115. The Supervisory Board conducted a scenario analysis with respect to possible outcomes of the variable remuneration disclosed in this section.
2018-2020 Long-term incentive Matching entitlements
(1) Base salary
in €1,2&3
(2) 2020 Short-term
incentive in €4
(3) No. of performance
sharesVesting5
(4) Value of performance
shares vesting in €5
(5) No. of matching
entitlements vesting
(6) Value of matching
entitlements vesting in €
(7) Pension cost in €
(8) Other emoluments
in €(9) Total
in €
Van den Brink 631,317 – – – – – 154,168 80,1706 865,655Debroux 736,667 – – – 5,713 521,140 179,077 154,168 1,591,051Van Boxmeer 500,000 – – – 20,105 1,833,978 119,584 5,536,1527 7,989,714
1 The base salary of Mr. Van Boxmeer represents the actual base salary paid from 1 January to 31 May 2020. 2 The base salary of Mr. Van den Brink represents the actual base salary paid as from his appointment to the Executive Board on 24 April 2020.3 The base salaries of Mr. Van den Brink, Mrs. Debroux and Mr. Van Boxmeer have been decreased by 20% as of May 1, 2020.4 Following Supervisory Board decision in response to the COVID-19 crisis, the 2020 short term incentive has not been paid out.5 Following Supervisory Board decision in response to the COVID-19 crisis, the 2018-2020 long term incentive plan has not vested.6 Includes the expatriation allowances provided to Mr. Van den Brink during his international assignment in Asia from 24 April to 31 May, 2020, whilst being a member of the Executive Board.7 Includes Mr. Van Boxmeer’s end of service indemnity as well as car benefits-in-kind provided from 1 January to 31 May 2020.
End of service agreement for Mr. Van Boxmeer as Chairman of the Executive Board and CEO and appointment of Mr. Van den Brink as member of the Executive Board and CEO at the 2020 AGMIn mutual agreement with the Supervisory Board and following the 2020 AGM, Mr. Van Boxmeer stepped down as CEO and Chairman of the Board of Heineken on 1 June 2020. Mr. Van Boxmeer continued to be paid in line with HEINEKEN’s normal Executive Board remuneration policy until the end of his service on 1 June 2020. Mr. Van Boxmeer’s end of service terms are aligned to HEINEKEN’s remuneration policy as disclosed in previous annual reports as well as the terms of his employment agreement, which dates from before the first Dutch Governance Code publication. Mr. Van Boxmeer received an end of service indemnity of EUR 5,520,000 in June 2020. This amount represents 12 months of remuneration, including variable compensation at target. In line with contractual obligations, Mr. Van Boxmeer’s existing long-term incentive awards (2019-2021 and 2020-2022 long-term incentive plans) will continue to be subject to vesting at their regular vesting dates in accordance with the predetermined performance conditions, and as defined in the Long Term Incentives Plan Rules. Shares that may vest under these plans will be subject to the holding period of two years. Furthermore, all existing investment shares/share matching entitlements will continue to be subject to the regular holding period (5 years). Mr. Van Boxmeer is subject to a 12 months non-competition restriction at end of service.
Mr. Van Boxmeer was appointed to the Heineken Holding N.V. Board as a non-executive director effective 1 June 2020.
At the same AGM, the Supervisory Board nominated Mr. Van den Brink for appointment as member of the Executive Board as of 24 April 2020 and to hold the position of CEO and Chairman of the Executive Board as of 1 June 2020. The AGM approved the appointment.
Reduction of Executive Board remuneration in response to the COVID-19 crisisIn the context of the significant impact of the COVID-19 crisis on the Company, the following remuneration related measures were approved by the Supervisory Board in April 2020:
– As described in our Executive Board remuneration policy, the Supervisory Board has the power to revise the amount of the STI payout to an appropriate level according to standards of reasonableness and fairness. Within that context, the Supervisory Board, in full agreement with the Executive Board, decided that regardless of performance conditions being met, the STI will not be paid out for the 2020 performance year,
– As described in our Executive Board remuneration policy, the Supervisory Board has the power to revise the amount of performance shares that will vest to an appropriate level according to standards of reasonableness and fairness. Therefore, the Supervisory Board, in full agreement with the Executive Board, decided that regardless of performance conditions being met, the 2018-2020 long term incentive plan will not vest.
Furthermore, the Executive Board voluntarily decided to personally contribute to the financial measures taken by the Company by reducing their base salary by 20% for the period 1 May to 31 December 2020.
Remuneration Report 2020
61 Heineken N.V. Annual Report 2020

ad (1) – Base salaryThese base salaries have been paid to the members of the Executive Board for 2020. In the context of the COVID-19 crisis, the Executive Board has voluntarily decided to personally contribute to the financial measures taken by the Company by reducing their base salary by 20% for the period 1 May to 31 December 2020.
ad (2) – 2020 Short-term incentive In the context of the significant impact of the COVID-19 crisis on the Company, in April 2020 the Supervisory Board decided that the 2020 STI relating to the performance year 2020 will not be paid out. This includes the part of the STI relating to the achievement of individual leadership objectives. As a consequence, there will be no investment shares this year for either member of the Executive Board. The table below provides an overview of the investment shares at year-end that were awarded as part of previous STI payouts, and that have remained blocked and await 1:1 matching by the Company, provided the conditions thereto are met. Only when the holding period of the investment shares has been completed, will the matching share entitlements be converted into shares and transferred to the recipient.
STI payout
for
% of STI payout
invested in shares
Award date
No. of investment
shares awarded
Value of investment shares
as of the award date in €
End of blocking
period
Value of investment shares
as of 31.12.20201 in €
Van den Brink 2020 n.a. n.a. – – n.a. n.a.Debroux 2020 n.a. n.a. – – n.a. n.a.
2019 25% 13.02.2020 2,623 269,776 31.12.2024 239,2702018 25% 14.02.2019 3,323 286,576 31.12.2023 303,1242017 25% 13.02.2018 3,568 293,076 31.12.2022 325,4732016 25% 16.02.2017 4,760 359,999 31.12.2021 434,207
Van Boxmeer 2020 n.a. n.a. – – n.a. n.a.2019 25% 13.02.2020 5,402 555,596 31.12.2024 492,7702018 25% 14.02.2019 7,913 682,417 31.12.2023 721,8242017 25% 13.02.2018 8,326 683,898 31.12.2022 759,4982016 25% 16.02.2017 11,106 839,947 31.12.2021 1,013,089
1 The share price as of 31 December 2020 is €91.22.
Remuneration Report 2020
62 Heineken N.V. Annual Report 2020

ad (3) – 2018-2020 Long-term incentive: number of performance shares vestingIn the context of the significant impact of the COVID-19 crisis on the Company, in April 2020 the Supervisory Board decided that regardless of performance conditions achievement, the 2018-2020 LTI related to the performance period 2018-2020 will not vest.
Grant date
No. of shares conditionally
granted at target level1
Value of shares conditionally granted as
of the grant date in €
Vesting date2
No. of shares vesting on the
vesting date3
(before tax)
No. of shares vesting on the
vesting date4 (after tax)
End of blocking
period
Value of unvested or
blocked shares as of 31.12.20205
in €
Van den Brink6 2020 12,144 1,021,310 02.2023 t.b.d. t.b.d. 14.02.2025 588,551Debroux 2020 11,194 1,151,303 02.2023 t.b.d. t.b.d. 14.02.2025 542,485
2019 13,763 1,186,921 02.2022 t.b.d. t.b.d. 14.02.2024 667,0012018 10,569 868,138 02.2021 – – n.a. –2017 12,630 955,207 13.02.2020 22,734 15,389 16.02.2022 1,403,7852016 11,426 832,613 14.02.2019 20,910 13,836 11.02.2021 1,262,120
Van Boxmeer 2020 19,754 2,031,699 02.2023 t.b.d. t.b.d. 14.02.2025 957,3542019 24,288 2,094,597 02.2022 t.b.d. t.b.d. 14.02.2024 1,177,1032018 21,570 1,771,760 02.2021 – – n.a. –2017 25,260 1,910,414 13.02.2020 45,468 24,157 16.02.2022 2,203,6022016 22,852 1,665,225 14.02.2019 41,820 21,279 11.02.2021 1,941,070
1 Determined according to plan rules, using the closing share price of 31 December of the year preceding the grant date.2 The vesting date is shortly after the publication of the financial statements after completion of the performance period.3 Vested shares are disclosed in before-tax terms (i.e. before deduction of withholding tax due).4 Vested shares are disclosed in after-tax terms (i.e. after deduction of withholding tax due).5 The value for the grants in 2016, 2017 and 2018 is based on the actual number of shares vesting on the vesting date after tax withholding, i.e. after applying the relevant income tax rate, whereas the value for the grants in 2019 and 2020 is based on the number of performance shares conditionally granted at target level (since the
number of performance shares vesting is yet unknown) after applying the currently prevailing income tax rate. The share price as of 31 December 2020 is €91.22. 6 Performance shares granted to Mr. Van den Brink as per his appointment as Executive Board member on 24 April 2020.
Remuneration Report 2020
63 Heineken N.V. Annual Report 2020

ad (4) – 2018-2020 Long-term incentive: value of performance shares vesting The value of performance shares vesting is based on the share price as of 31 December 2020 of €91.22.
ad (5) – Number of matching entitlements vestingThese entries refer to the number of matching share entitlements that vested after year-end 2020, as a result of the investment in shares of part of the STI payout for performance year 2015, and holding on to these investment shares until year-end 2020. For Mr. Van Boxmeer the number of matching shares is the result of a 50% investment of this STI payout in investment shares at the time. For Mrs. Debroux the number of matching shares is the result of a 50% investment of this STI payout in investment shares at the time.
ad (6) – Value of matching entitlements vestingThe value of matching share entitlements vesting is based on the share price as of 31 December 2020 of €91.22.
ad (7) – Pension costThe pension costs involve the employer contributions paid in the Capital Creation Plan as well as the employer contributions to the risk insurances for death and disability.
ad (8) – Other emolumentsThe amounts mainly involve car benefits-in-kind, and also for Mrs. Debroux housing allowance (grossed-up) and schooling costs.
ad (9) – Total The addition of all remuneration elements as described in points (1) to (8).
Actual remuneration paid to former members of the Executive BoardThere has not been any remuneration for 2020 paid to former members of the Executive Board.
Pay Ratio In the Netherlands a revised corporate governance code came into effect as of financial year 2017. This revised code requires Dutch stock-listed companies to consider pay ratios between Executive Board members and other employees within the Company when formulating the remuneration policy for the Executive Board, and to disclose these ratios in the Remuneration Report every year.
As is commonly understood, such ratios are specific to the company’s industry, geographical footprint and organisational model. HEINEKEN has a truly wide geographical footprint, with the majority of its business and employees in emerging markets with widely different pay levels and structures compared to the Netherlands and Europe. In addition, HEINEKEN has a large number of breweries and in-house sales forces worldwide, which adds to the variety of pay within the Company. For other companies in other industries this will be different. Finally, pay ratios can also be quite volatile over time, as they may vary with exchange
rate movements and can be very dependent on the Company’s annual performance since that performance impacts the remuneration of the Executive Board much more than of all other employees.
The 2020 pay ratios for HEINEKEN are 30 for the CEO and 20 for the CFO, versus 166 and 87 in 2019 respectively. These ratios are obtained by dividing the 2020 total remuneration for the CEO and CFO by the 2020 average total remuneration of all other employees worldwide. The common denominator of these ratios is derived from note 6.4 on page 79 by dividing the 2020 total personnel expense (after subtracting the expense for contractors and for the Executive Board), by the reported FTE (minus two; excluding contractors), leading to an amount of 41,934 versus 42,937 in 2019. The total remuneration for the CEO and CFO is retrieved from note 13.3 on page 115. The reason why the Executive Board’s remuneration is obtained from note 13.3 rather than from this Remuneration Report is explained by the fact that the personnel expense in note 6.4 is based on IFRS standards, which implies that the Executive Board’s remuneration also needs to be based on these standards for reasons of comparability.
The Executive Board’s average pay ratio decrease of ca. 80% compared to 2019 results from a decrease in the remuneration of the CEO and CFO over 2019 by ca. 81%. The decrease in the CEO and CFO remuneration is predominantly driven by:
– The cancellation of 2020 STI payout and 2018-2020 LTI vesting as well as the voluntary 20% base salary reduction, measures taken in the context of the COVID-19 crisis as referred on page 63.
– The CEO ratio calculation is based on the remuneration of Mr. Van den Brink as per appointment to theExecutive Board on 24 April 2020.
Comparative overview of remuneration and company performance The following table provides a comparative overview since 2016 of annual Executive Board remuneration; average employee remuneration; Executive Board pay ratio; and company performance:
Total remuneration in thousands of €1 Average employee total
remuneration inthousands of €3
Pay ratio4
Year CEO CFO2 CEO CFO
Organic net revenue
growth %5
2016 9,480 3,514 n.a. n.a. n.a. 4.8%
2017 9,060 4,203 42.1 215 100 5.0%2018 8,244 3,805 41.7 198 91 6.1%2019 7,112 3,726 42.9 166 87 5.6%2020 1,2616 835 41.9 30 20 -11.9%
1 Total remuneration for the CEO and CFO as per note 13.3 Related Parties (i.e. fixed salary, short and long term incentives, pension contributions and other emoluments).
2 Appointed on 23 April 2015.3 Total personnel expense in thousands of € (after subtracting the expense for contractors and for the Executive Board) divided by the reported FTE (minus two;
excluding contractors). Reporting available since 2017.4 Total remuneration for the CEO and CFO divided by the average total remuneration of all other employees worldwide. Reporting available since 2017.5 Organic net revenue growth percentage for the financial year (performance measure for short and long term incentives).6 In 2020, CEO’s remuneration refers to Mr. Van den Brink, as per appointment to the Executive Board on 24 April 2020.
Remuneration Report 2020
64 Heineken N.V. Annual Report 2020

Part IV – The Supervisory Board actual remuneration for performance ending in, or at year-end, 2020
In alignment with the Supervisory Board remuneration policy the Members of the Supervisory Board receive a fixed remuneration for their services. Members are also compensated for intercontinental travel required to exercise their role.
The following table provides an overview of the Supervisory Board actual remuneration for year-end, 2020. In alignment with IFRS reporting requirements, this disclosure can also be found in note 13.3 Related Parties.
In thousands of €2020 Base Board
Fee 2020 Committee
Fees2020 Allowances
and Benefits2020 Total
Remuneration2019 Total
Remuneration3
J.M. Huët 120 105 0 225 195J.A. Fernández Carbajal 90 40 24 154 153M. Das 90 40 0 130 133M.R. de Carvalho 90 45 0 135 141V.C.O.B.J. Navarre 90 15 0 105 110J.G. Astaburuaga Sanjinés 90 20 6 116 133P. Mars-Wright 90 30 6 126 151M. Helmes 90 35 0 125 131R.L. Ripley2 90 15 5 110 97I.H. Arnold 90 20 5 115 100G.J. Wijers1 – – – – 103Y. Dervisoglu1 – – – – 53
930 365 46 1,341 1,500
1 Stepped down on 25 April 2019.2 Appointed as at 25 April 2019. 3 Supervisory Board management fees were approved by the AGM in 2019.
V. Adjustment to remuneration policy and implementation 2021
Policy changesThe Supervisory Board reviewed the remuneration policy and decided not to submit changes for approval to the 2021 AGM.
Implementation changesAs stated in our remuneration policy, the Supervisory Board has the power to revise the amount of performance shares that will vest to an appropriate number if the number of performance shares that would have vested under the agreed vesting schedule would be unacceptable according to standards of reasonableness and fairness. The same rule of reasonableness and fairness applies to the revision of the amount of short-term incentive payout.
Given the significant impact of the COVID-19 crisis on the Company in 2020, the Supervisory Board considered reasonable and fair to cancel the vesting of the 2018-2020 long term incentive awards as well as to cancel the payout of the 2020 short-term incentive. Furthermore, the Supervisory Board has decided to keep under review the performance of the outstanding 2019-2021 and 2020-2022 long-term incentive awards as well as the 2021 short-term incentives to ensure that potential pay-outs remain appropriate according to standards of reasonableness and fairness.
Moreover, given the uncertain, volatile, and unprecedented economic times, the Supervisory Board feels unable to set sound performance conditions for the 2021-2023 long term incentive awards at the beginning of 2021. Due to the insufficient insight into the longer term financial prospects, the Supervisory Board has decided to only set preliminary performance targets for the 2021-2023 LTI award and, if necessary, to adjust those targets in the summer of 2021, at which time it is envisaged that there will be better visibility of the market conditions for the company’s three-year plan.
Supervisory Board Heineken N.V. Amsterdam, 9 February 2021.
Remuneration Report 2020
65 Heineken N.V. Annual Report 2020

Financial Statements 66-124Consolidated Income Statement 67
Consolidated Statement of Comprehensive Income 67
Consolidated Statement of Financial Position 68
Consolidated Statement of Cash Flows 69
Consolidated Statement of Changes in Equity 70
Notes to the Consolidated Financial Statements 71
1 Reporting entity 71
2 Basis of preparation 71
3 Significant accounting estimates and judgements 71
4 Changes in accounting policies 72
5 General accounting policies 72
6 Operating activities 74
6.1 Operating segments 74
6.2 Other income 78
6.3 Raw materials, consumables and services 78
6.4 Personnel expenses 79
6.5 Share-based payments 79
6.6 Amortisation, depreciation and impairments 81
6.7 Earnings per share 81
7 Working capital 82
7.1 Inventories 82
7.2 Trade and other receivables 82
7.3 Trade and other payables 83
7.4 Returnable packaging materials 84
8 Non-current assets 84
8.1 Impairment testing of Intangible assets and Property, plant and equipment 84
8.2 Intangible assets 85
8.3 Property, plant and equipment 87
8.4 Loans and advances to customers 91
8.5 Other non-current assets 92
9 Provisions and contingent liabilities 92
9.1 Post-retirement obligations 92
9.2 Provisions 97
9.3 Contingencies 98
10 Acquisitions, disposals and investments 99
10.1 Acquisitions and disposals 99
10.2 Assets or disposal groups classified as held for sale 99
10.3 Investments in associates and joint ventures 99
11 Financing and capital structure 101
11.1 Net finance income and expense 101
11.2 Cash and cash equivalents 101
11.3 Borrowings 102
11.4 Capital and reserves 103
11.5 Credit, liquidity and market risk 105
11.6 Derivative financial instruments 108
12 Tax 110
12.1 Income tax expense 110
12.2 Deferred tax assets and liabilities 111
12.3 Income tax on other comprehensive income 113
13 Other 113
13.1 Fair value 113
13.2 Off-balance sheet commitments 114
13.3 Related parties 115
13.4 HEINEKEN entities 116
13.5 Subsequent events 117
Heineken N.V. Income Statement 118
Heineken N.V. Balance Sheet 119
Heineken N.V. Shareholders’ equity 120
Notes to the Heineken N.V. Financial Statements 121
A Company disclosures 121
A.1 Investments 121
A.2 Borrowings 122
B Other 123
B.1 Auditor fees 123
B.2 Off-balance sheet commitments 123
B.3 Subsequent events 124
B.4 Other disclosures 124
Contents
66 Heineken N.V. Annual Report 2020
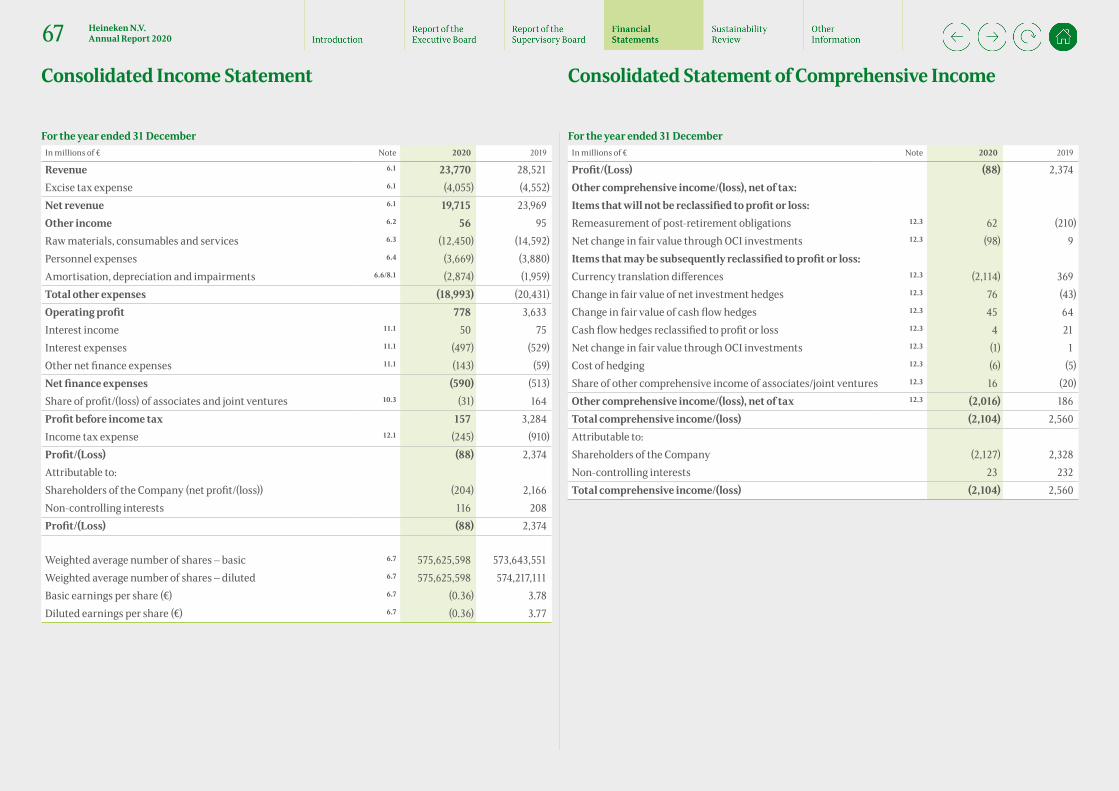
For the year ended 31 DecemberIn millions of € Note 2020 2019
Revenue 6.1 23,770 28,521Excise tax expense 6.1 (4,055) (4,552)Net revenue 6.1 19,715 23,969Other income 6.2 56 95Raw materials, consumables and services 6.3 (12,450) (14,592)Personnel expenses 6.4 (3,669) (3,880)Amortisation, depreciation and impairments 6.6/8.1 (2,874) (1,959)Total other expenses (18,993) (20,431)Operating profit 778 3,633Interest income 11.1 50 75Interest expenses 11.1 (497) (529)Other net finance expenses 11.1 (143) (59)Net finance expenses (590) (513)Share of profit/(loss) of associates and joint ventures 10.3 (31) 164Profit before income tax 157 3,284Income tax expense 12.1 (245) (910)Profit/(Loss) (88) 2,374Attributable to:Shareholders of the Company (net profit/(loss)) (204) 2,166Non-controlling interests 116 208Profit/(Loss) (88) 2,374
Weighted average number of shares – basic 6.7 575,625,598 573,643,551Weighted average number of shares – diluted 6.7 575,625,598 574,217,111Basic earnings per share (€) 6.7 (0.36) 3.78Diluted earnings per share (€) 6.7 (0.36) 3.77
For the year ended 31 DecemberIn millions of € Note 2020 2019
Profit/(Loss) (88) 2,374Other comprehensive income/(loss), net of tax:Items that will not be reclassified to profit or loss:Remeasurement of post-retirement obligations 12.3 62 (210)Net change in fair value through OCI investments 12.3 (98) 9Items that may be subsequently reclassified to profit or loss:Currency translation differences 12.3 (2,114) 369Change in fair value of net investment hedges 12.3 76 (43)Change in fair value of cash flow hedges 12.3 45 64Cash flow hedges reclassified to profit or loss 12.3 4 21Net change in fair value through OCI investments 12.3 (1) 1Cost of hedging 12.3 (6) (5)Share of other comprehensive income of associates/joint ventures 12.3 16 (20)Other comprehensive income/(loss), net of tax 12.3 (2,016) 186Total comprehensive income/(loss) (2,104) 2,560Attributable to:Shareholders of the Company (2,127) 2,328Non-controlling interests 23 232Total comprehensive income/(loss) (2,104) 2,560
Consolidated Income Statement Consolidated Statement of Comprehensive Income
67 Heineken N.V. Annual Report 2020

As at 31 DecemberIn millions of € Note 2020 2019 In millions of € Note 2020 2019
Intangible assets 8.2 15,767 17,769 Shareholders’ equity 11.4 13,392 16,147Property, plant and equipment 8.3 11,551 13,269 Non-controlling interests 11.4 1,000 1,164Investments in associates and joint ventures 10.3 4,437 4,868 Total equity 14,392 17,311Loans and advances to customers 8.4 194 277Deferred tax assets 12.2 779 647 Borrowings 11.3 14,616 13,366Other non-current assets 8.5 884 1,255 Post-retirement obligations 9.1 938 1,189Total non-current assets 33,612 38,085 Provisions 9.2 688 756
Deferred tax liabilities 12.2 999 1,422Inventories 7.1 1,958 2,213 Other non-current liabilities 11.6 131 153Trade and other receivables 7.2 2,807 4,123 Total non-current liabilities 17,372 16,886Current tax assets 154 123Derivative assets 11.6 77 28 Borrowings 11.2/11.3 3,580 3,686Cash and cash equivalents 11.2 4,000 1,821 Trade and other payables 7.3 6,107 7,520Assets classified as held for sale 10.2 24 111 Returnable packaging deposits 7.4 454 565Total current assets 9,020 8,419 Provisions 9.2 416 184
Current tax liabilities 259 283Derivative liabilities 11.6 52 69Total current liabilities 10,868 12,307
Total assets 42,632 46,504 Total equity and liabilities 42,632 46,504
Consolidated Statement of Financial Position
68 Heineken N.V. Annual Report 2020

For the year ended 31 DecemberIn millions of € Note 2020 2019 In millions of € Note 2020 2019
Operating activities Investing activitiesProfit/(Loss) (88) 2,374 Proceeds from sale of property, plant and equipment and
intangible assets150 177
Adjustments for:Amortisation, depreciation and impairments 6.6 2,874 1,959 Purchase of property, plant and equipment (1,501) (1,915)Net interest expenses 11.1 447 454 Purchase of intangible assets (139) (186)Other income 6.2 (56) (95) Loans issued to customers and other investments (177) (249)Share of (profit)/loss of associates and joint ventures and dividend income on fair value through OCI investments
21 (173) Repayment on loans to customers and other investments 44 64Cash flow (used in)/from operational investing activities (1,623) (2,109)
Income tax expenses 12.1 245 910 Free operating cash flow 1,513 2,228Other non-cash items 231 240 Acquisition of subsidiaries, net of cash acquired (26) (183)Cash flow from operations before changes in working capital and provisions
3,674 5,669 Acquisition of/additions to associates, joint ventures and other investments
(9) (2,875)
Change in inventories (18) (257) Disposal of subsidiaries, net of cash disposed of (29) 244Change in trade and other receivables 1,124 (245) Disposal of associates, joint ventures and other investments 249 50Change in trade and other payables and returnable packaging deposits
(759) 510 Cash flow (used in)/from acquisitions and disposals 185 (2,764)
Total change in working capital 347 8 Cash flow (used in)/from investing activities (1,438) (4,873)Change in provisions and post-retirement obligations 211 (121) Financing activitiesCash flow from operations 4,232 5,556 Proceeds from borrowings 6,037 2,288Interest paid (481) (528) Repayment of borrowings (3,714) (2,150)Interest received 45 52 Payment of lease commitments (281) (259)Dividends received 89 181 Dividends paid (811) (1,223)Income taxes paid (749) (924) Purchase own shares and shares issued 11 428Cash flow related to interest, dividend and income tax (1,096) (1,219) Acquisition of non-controlling interests (4) (103)Cash flow from operating activities 3,136 4,337 Other — 3
Cash flow (used in)/from financing activities 1,238 (1,016)Net cash flow 2,936 (1,552)Cash and cash equivalents as at 1 January 687 2,248Effect of movements in exchange rates (104) (9)Cash and cash equivalents as at 31 December 11.2 3,519 687
Consolidated Statement of Cash Flows
69 Heineken N.V. Annual Report 2020
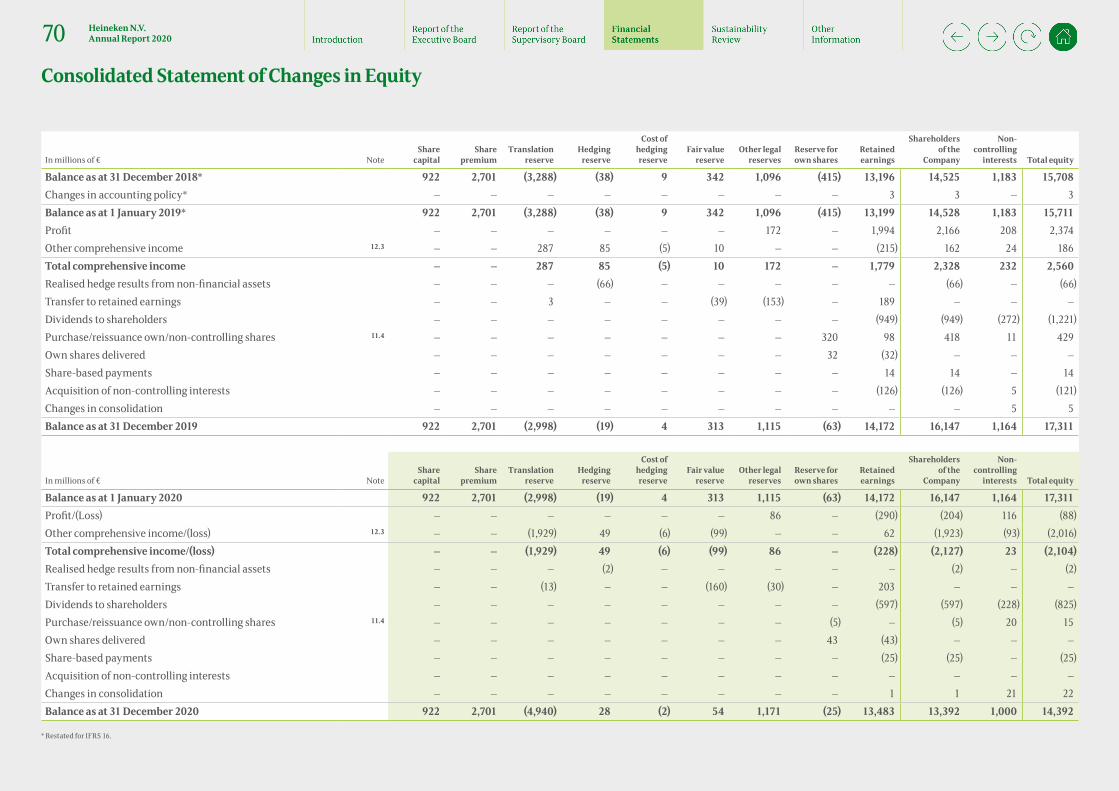
In millions of € NoteShare
capitalShare
premiumTranslation
reserveHedging
reserve
Cost of hedging reserve
Fair value reserve
Other legal reserves
Reserve for own shares
Retained earnings
Shareholders of the
Company
Non-controlling
interests Total equity
Balance as at 31 December 2018* 922 2,701 (3,288) (38) 9 342 1,096 (415) 13,196 14,525 1,183 15,708Changes in accounting policy* — — — — — — — — 3 3 — 3Balance as at 1 January 2019* 922 2,701 (3,288) (38) 9 342 1,096 (415) 13,199 14,528 1,183 15,711Profit — — — — — — 172 — 1,994 2,166 208 2,374Other comprehensive income 12.3 — — 287 85 (5) 10 — — (215) 162 24 186Total comprehensive income — — 287 85 (5) 10 172 — 1,779 2,328 232 2,560Realised hedge results from non-financial assets — — — (66) — — — — — (66) — (66)Transfer to retained earnings — — 3 — — (39) (153) — 189 — — —Dividends to shareholders — — — — — — — — (949) (949) (272) (1,221)Purchase/reissuance own/non-controlling shares 11.4 — — — — — — — 320 98 418 11 429Own shares delivered — — — — — — — 32 (32) — — —Share-based payments — — — — — — — — 14 14 — 14Acquisition of non-controlling interests — — — — — — — — (126) (126) 5 (121)Changes in consolidation — — — — — — — — — — 5 5Balance as at 31 December 2019 922 2,701 (2,998) (19) 4 313 1,115 (63) 14,172 16,147 1,164 17,311
In millions of € NoteShare
capitalShare
premiumTranslation
reserveHedging
reserve
Cost of hedging reserve
Fair value reserve
Other legal reserves
Reserve for own shares
Retained earnings
Shareholders of the
Company
Non-controlling
interests Total equity
Balance as at 1 January 2020 922 2,701 (2,998) (19) 4 313 1,115 (63) 14,172 16,147 1,164 17,311Profit/(Loss) — — — — — — 86 — (290) (204) 116 (88)Other comprehensive income/(loss) 12.3 — — (1,929) 49 (6) (99) — — 62 (1,923) (93) (2,016)Total comprehensive income/(loss) — — (1,929) 49 (6) (99) 86 — (228) (2,127) 23 (2,104)Realised hedge results from non-financial assets — — — (2) — — — — — (2) — (2)Transfer to retained earnings — — (13) — — (160) (30) — 203 — — —Dividends to shareholders — — — — — — — — (597) (597) (228) (825)Purchase/reissuance own/non-controlling shares 11.4 — — — — — — — (5) — (5) 20 15Own shares delivered — — — — — — — 43 (43) — — —Share-based payments — — — — — — — — (25) (25) — (25)Acquisition of non-controlling interests — — — — — — — — — — — —Changes in consolidation — — — — — — — — 1 1 21 22Balance as at 31 December 2020 922 2,701 (4,940) 28 (2) 54 1,171 (25) 13,483 13,392 1,000 14,392
* Restated for IFRS 16.
Consolidated Statement of Changes in Equity
70 Heineken N.V. Annual Report 2020
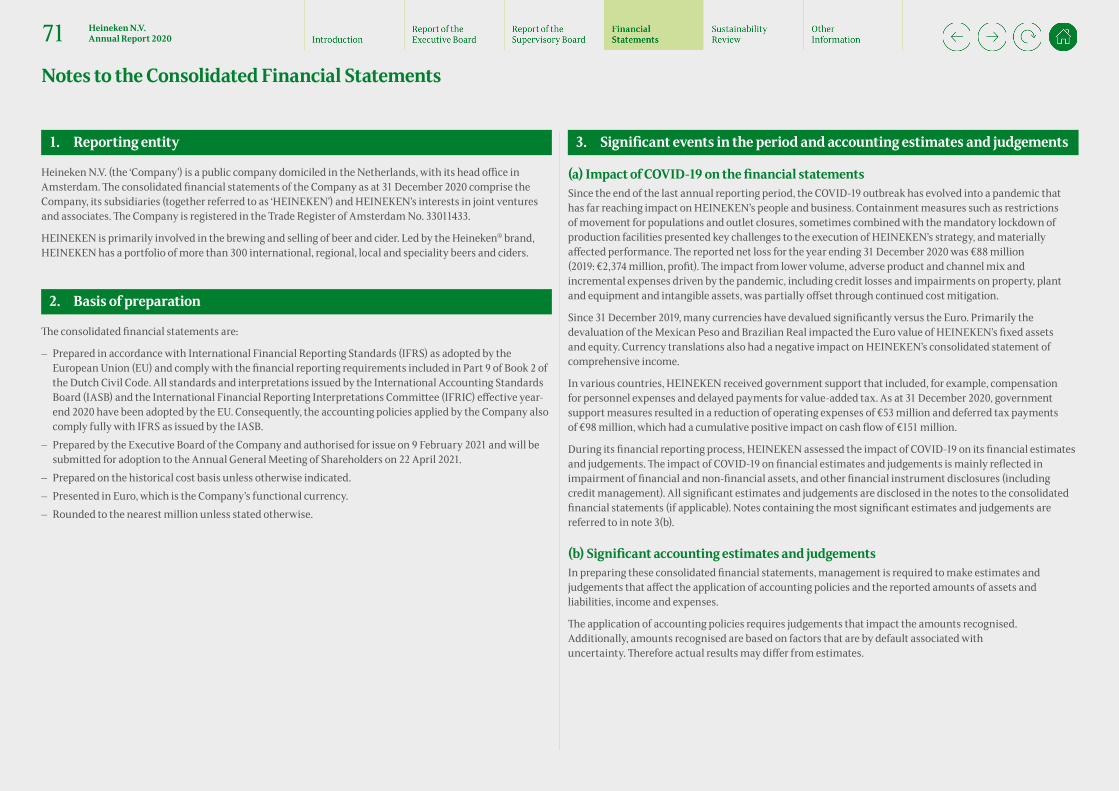
1. Reporting entity
Heineken N.V. (the ‘Company’) is a public company domiciled in the Netherlands, with its head office in Amsterdam. The consolidated financial statements of the Company as at 31 December 2020 comprise the Company, its subsidiaries (together referred to as ‘HEINEKEN’) and HEINEKEN’s interests in joint ventures and associates. The Company is registered in the Trade Register of Amsterdam No. 33011433.
HEINEKEN is primarily involved in the brewing and selling of beer and cider. Led by the Heineken® brand, HEINEKEN has a portfolio of more than 300 international, regional, local and speciality beers and ciders.
2. Basis of preparation
The consolidated financial statements are:
– Prepared in accordance with International Financial Reporting Standards (IFRS) as adopted by the European Union (EU) and comply with the financial reporting requirements included in Part 9 of Book 2 of the Dutch Civil Code. All standards and interpretations issued by the International Accounting Standards Board (IASB) and the International Financial Reporting Interpretations Committee (IFRIC) effective year-end 2020 have been adopted by the EU. Consequently, the accounting policies applied by the Company also comply fully with IFRS as issued by the IASB.
– Prepared by the Executive Board of the Company and authorised for issue on 9 February 2021 and will be submitted for adoption to the Annual General Meeting of Shareholders on 22 April 2021.
– Prepared on the historical cost basis unless otherwise indicated. – Presented in Euro, which is the Company’s functional currency. – Rounded to the nearest million unless stated otherwise.
3. Significant events in the period and accounting estimates and judgements
(a) Impact of COVID-19 on the financial statementsSince the end of the last annual reporting period, the COVID-19 outbreak has evolved into a pandemic that has far reaching impact on HEINEKEN’s people and business. Containment measures such as restrictions of movement for populations and outlet closures, sometimes combined with the mandatory lockdown of production facilities presented key challenges to the execution of HEINEKEN’s strategy, and materially affected performance. The reported net loss for the year ending 31 December 2020 was €88 million (2019: €2,374 million, profit). The impact from lower volume, adverse product and channel mix and incremental expenses driven by the pandemic, including credit losses and impairments on property, plant and equipment and intangible assets, was partially offset through continued cost mitigation.
Since 31 December 2019, many currencies have devalued significantly versus the Euro. Primarily the devaluation of the Mexican Peso and Brazilian Real impacted the Euro value of HEINEKEN’s fixed assets and equity. Currency translations also had a negative impact on HEINEKEN’s consolidated statement of comprehensive income.
In various countries, HEINEKEN received government support that included, for example, compensation for personnel expenses and delayed payments for value-added tax. As at 31 December 2020, government support measures resulted in a reduction of operating expenses of €53 million and deferred tax payments of €98 million, which had a cumulative positive impact on cash flow of €151 million.
During its financial reporting process, HEINEKEN assessed the impact of COVID-19 on its financial estimates and judgements. The impact of COVID-19 on financial estimates and judgements is mainly reflected in impairment of financial and non-financial assets, and other financial instrument disclosures (including credit management). All significant estimates and judgements are disclosed in the notes to the consolidated financial statements (if applicable). Notes containing the most significant estimates and judgements are referred to in note 3(b).
(b) Significant accounting estimates and judgementsIn preparing these consolidated financial statements, management is required to make estimates and judgements that affect the application of accounting policies and the reported amounts of assets and liabilities, income and expenses.
The application of accounting policies requires judgements that impact the amounts recognised. Additionally, amounts recognised are based on factors that are by default associated with uncertainty. Therefore actual results may differ from estimates.
Notes to the Consolidated Financial Statements
71 Heineken N.V. Annual Report 2020
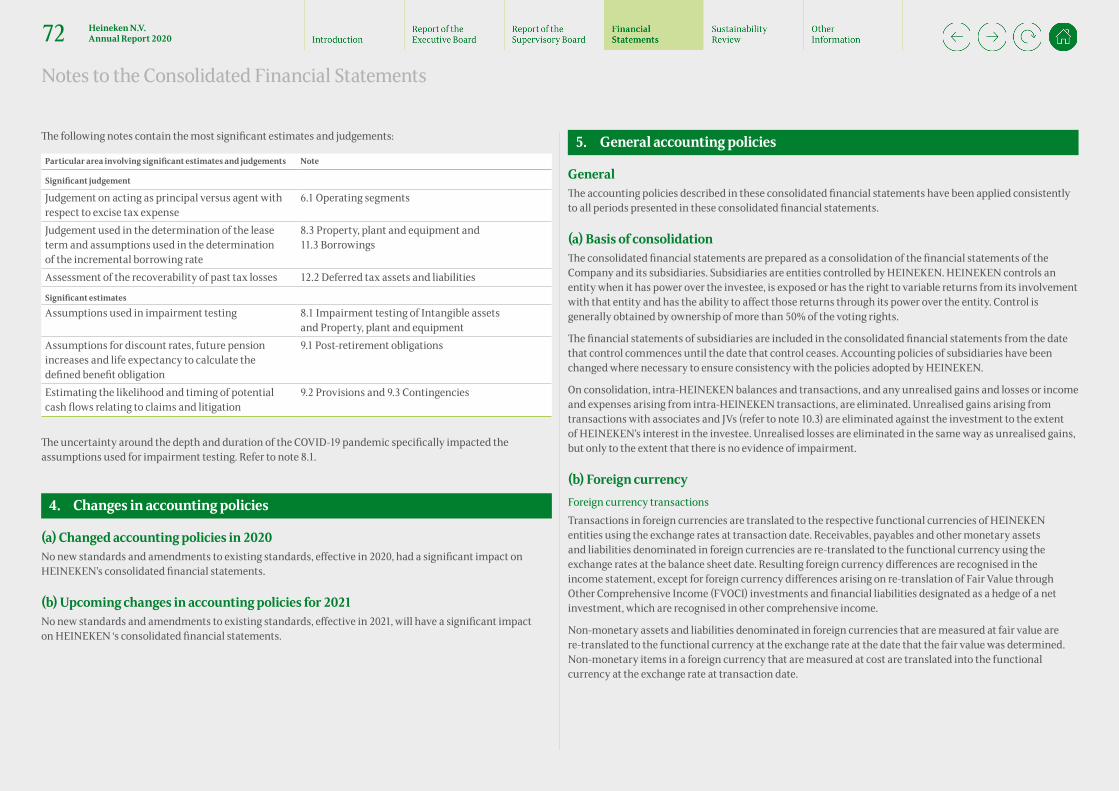
The following notes contain the most significant estimates and judgements:
Particular area involving significant estimates and judgements Note
Significant judgement
Judgement on acting as principal versus agent with respect to excise tax expense
6.1 Operating segments
Judgement used in the determination of the lease term and assumptions used in the determination of the incremental borrowing rate
8.3 Property, plant and equipment and 11.3 Borrowings
Assessment of the recoverability of past tax losses 12.2 Deferred tax assets and liabilities
Significant estimates
Assumptions used in impairment testing 8.1 Impairment testing of Intangible assets and Property, plant and equipment
Assumptions for discount rates, future pension increases and life expectancy to calculate the defined benefit obligation
9.1 Post-retirement obligations
Estimating the likelihood and timing of potential cash flows relating to claims and litigation
9.2 Provisions and 9.3 Contingencies
The uncertainty around the depth and duration of the COVID-19 pandemic specifically impacted the assumptions used for impairment testing. Refer to note 8.1.
4. Changes in accounting policies
(a) Changed accounting policies in 2020No new standards and amendments to existing standards, effective in 2020, had a significant impact on HEINEKEN’s consolidated financial statements.
(b) Upcoming changes in accounting policies for 2021No new standards and amendments to existing standards, effective in 2021, will have a significant impact on HEINEKEN ‘s consolidated financial statements.
5. General accounting policies
General The accounting policies described in these consolidated financial statements have been applied consistently to all periods presented in these consolidated financial statements.
(a) Basis of consolidationThe consolidated financial statements are prepared as a consolidation of the financial statements of the Company and its subsidiaries. Subsidiaries are entities controlled by HEINEKEN. HEINEKEN controls an entity when it has power over the investee, is exposed or has the right to variable returns from its involvement with that entity and has the ability to affect those returns through its power over the entity. Control is generally obtained by ownership of more than 50% of the voting rights.
The financial statements of subsidiaries are included in the consolidated financial statements from the date that control commences until the date that control ceases. Accounting policies of subsidiaries have been changed where necessary to ensure consistency with the policies adopted by HEINEKEN.
On consolidation, intra-HEINEKEN balances and transactions, and any unrealised gains and losses or income and expenses arising from intra-HEINEKEN transactions, are eliminated. Unrealised gains arising from transactions with associates and JVs (refer to note 10.3) are eliminated against the investment to the extent of HEINEKEN’s interest in the investee. Unrealised losses are eliminated in the same way as unrealised gains, but only to the extent that there is no evidence of impairment.
(b) Foreign currency Foreign currency transactions Transactions in foreign currencies are translated to the respective functional currencies of HEINEKEN entities using the exchange rates at transaction date. Receivables, payables and other monetary assets and liabilities denominated in foreign currencies are re-translated to the functional currency using the exchange rates at the balance sheet date. Resulting foreign currency differences are recognised in the income statement, except for foreign currency differences arising on re-translation of Fair Value through Other Comprehensive Income (FVOCI) investments and financial liabilities designated as a hedge of a net investment, which are recognised in other comprehensive income.
Non-monetary assets and liabilities denominated in foreign currencies that are measured at fair value are re-translated to the functional currency at the exchange rate at the date that the fair value was determined. Non-monetary items in a foreign currency that are measured at cost are translated into the functional currency at the exchange rate at transaction date.
Notes to the Consolidated Financial Statements
72 Heineken N.V. Annual Report 2020
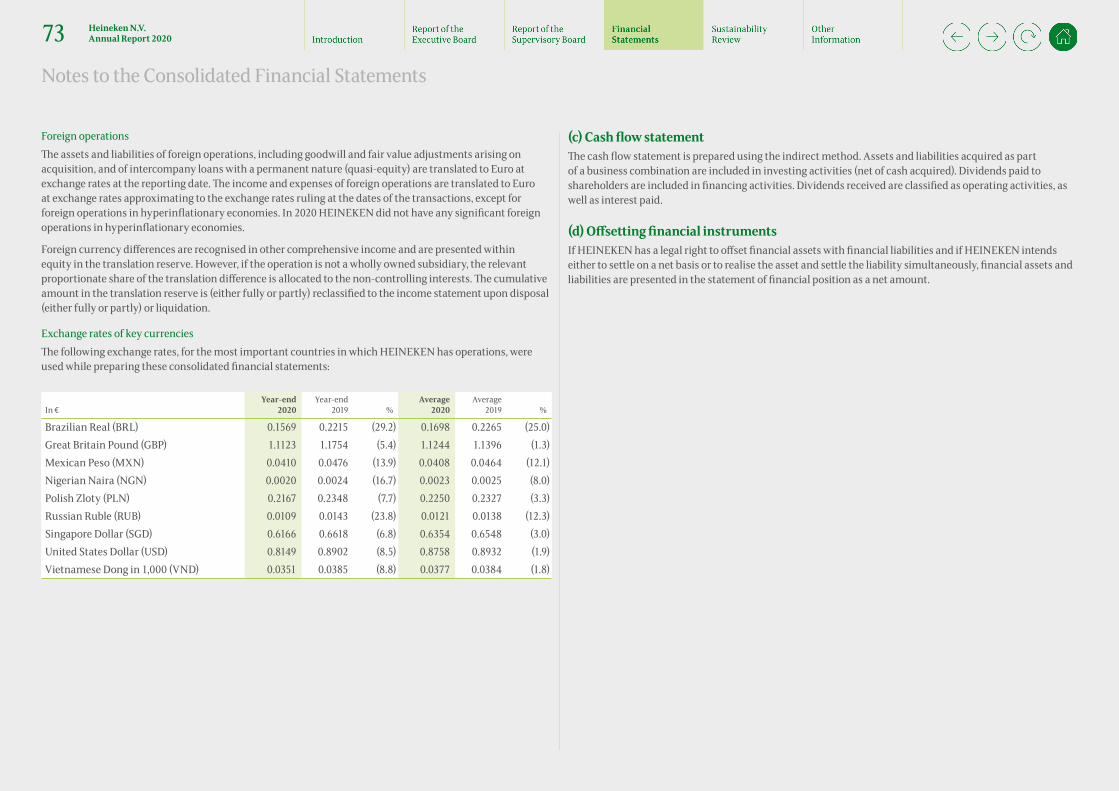
Foreign operations The assets and liabilities of foreign operations, including goodwill and fair value adjustments arising on acquisition, and of intercompany loans with a permanent nature (quasi-equity) are translated to Euro at exchange rates at the reporting date. The income and expenses of foreign operations are translated to Euro at exchange rates approximating to the exchange rates ruling at the dates of the transactions, except for foreign operations in hyperinflationary economies. In 2020 HEINEKEN did not have any significant foreign operations in hyperinflationary economies.
Foreign currency differences are recognised in other comprehensive income and are presented within equity in the translation reserve. However, if the operation is not a wholly owned subsidiary, the relevant proportionate share of the translation difference is allocated to the non-controlling interests. The cumulative amount in the translation reserve is (either fully or partly) reclassified to the income statement upon disposal (either fully or partly) or liquidation.
Exchange rates of key currencies The following exchange rates, for the most important countries in which HEINEKEN has operations, were used while preparing these consolidated financial statements:
In €Year-end
2020Year-end
2019 %Average
2020Average
2019 %
Brazilian Real (BRL) 0.1569 0.2215 (29.2) 0.1698 0.2265 (25.0)Great Britain Pound (GBP) 1.1123 1.1754 (5.4) 1.1244 1.1396 (1.3)Mexican Peso (MXN) 0.0410 0.0476 (13.9) 0.0408 0.0464 (12.1)Nigerian Naira (NGN) 0.0020 0.0024 (16.7) 0.0023 0.0025 (8.0)Polish Zloty (PLN) 0.2167 0.2348 (7.7) 0.2250 0.2327 (3.3)Russian Ruble (RUB) 0.0109 0.0143 (23.8) 0.0121 0.0138 (12.3)Singapore Dollar (SGD) 0.6166 0.6618 (6.8) 0.6354 0.6548 (3.0)United States Dollar (USD) 0.8149 0.8902 (8.5) 0.8758 0.8932 (1.9)Vietnamese Dong in 1,000 (VND) 0.0351 0.0385 (8.8) 0.0377 0.0384 (1.8)
(c) Cash flow statementThe cash flow statement is prepared using the indirect method. Assets and liabilities acquired as part of a business combination are included in investing activities (net of cash acquired). Dividends paid to shareholders are included in financing activities. Dividends received are classified as operating activities, as well as interest paid.
(d) Offsetting financial instruments If HEINEKEN has a legal right to offset financial assets with financial liabilities and if HEINEKEN intends either to settle on a net basis or to realise the asset and settle the liability simultaneously, financial assets and liabilities are presented in the statement of financial position as a net amount.
Notes to the Consolidated Financial Statements
73 Heineken N.V. Annual Report 2020

6. Operating activities
6.1 Operating segments HEINEKEN distinguishes five reportable segments: Europe, Americas, Africa, Middle East & Eastern Europe, Asia Pacific and Head Office & Other/eliminations. Information about these reportable segments are provided in the table below:
Europe AmericasAfrica, Middle East &
Eastern Europe Asia PacificHead Office &
Other/Eliminations Consolidated
In millions of € Note 2020 2019 2020 2019 2020 2019 2020 2019 2020 2019 2020 2019
Net revenue (beia)1 8,631 10,629 6,319 7,429 2,782 3,370 2,707 3,205 (716) (740) 19,724 23,894Third party revenue2 10,462 12,601 6,452 7,656 3,400 4,106 3,443 4,106 13 52 23,770 28,521Interregional revenue 697 758 27 32 — — 5 2 (729) (792) — —Revenue 11,159 13,359 6,479 7,688 3,400 4,106 3,448 4,108 (716) (740) 23,770 28,521Excise tax expense3 (2,528) (2,728) (160) (181) (626) (737) (741) (906) — — (4,055) (4,552)Net revenue1 8,631 10,631 6,319 7,507 2,774 3,369 2,707 3,202 (716) (740) 19,715 23,969Other income 6.2 47 12 5 9 3 1 1 73 — — 56 95
Operating profit (7) 1,286 540 1,176 119 369 425 934 (299) (132) 778 3,633
Net finance expenses 11.1 (590) (513)Share of profit/(loss) of associates and joint ventures 10.3 (4) 17 31 67 17 40 (51) 44 (24) (4) (31) 164Income tax expense 12.1 (245) (910)Profit/(Loss) (88) 2,374Attributable to:Shareholders of the Company (net profit/(loss)) (204) 2,166Non-controlling interests 116 208
Operating profit reconciliationOperating profit (7) 1,286 540 1,176 119 369 425 934 (299) (132) 778 3,633Eia1 454 150 505 28 145 39 442 151 97 18 1,643 387Operating profit (beia)1 447 1,436 1,045 1,204 264 408 867 1,085 (202) (114) 2,421 4,020
1 Note that this is a non-GAAP measure. Due to rounding, this balance will not always cast. 2 Includes other revenue of €261 million in 2020 (2019: €356 million). 3 Next to the €4,055 million of excise tax expense included in revenue (2019: €4,552 million), €1,613 million of excise tax expense is collected on behalf of third parties and excluded from revenue (2019: €1,813 million).
Notes to the Consolidated Financial Statements
74 Heineken N.V. Annual Report 2020

Europe AmericasAfrica, Middle East &
Eastern Europe Asia PacificHead Office &
Other/Eliminations Consolidated
In millions of € Note 2020 2019 2020 2019 2020 2019 2020 2019 2020 2019 2020 2019
Current segment assets 2,291 2,918 1,766 2,286 1,155 1,451 1,215 1,239 2,370 394 8,797 8,288Non-current segment assets 11,815 12,417 7,243 9,149 2,162 2,543 6,312 7,586 848 875 28,380 32,570Investments in associates and joint ventures 282 305 838 864 221 237 3,095 3,452 1 10 4,437 4,868Total segment assets 14,388 15,640 9,847 12,299 3,538 4,231 10,622 12,277 3,219 1,279 41,614 45,726Unallocated assets 1,018 778Total assets 42,632 46,504
Segment liabilities 3,792 4,441 2,176 2,760 1,366 1,590 951 1,127 2,333 2,664 10,618 12,582Unallocated liabilities 17,622 16,611Total equity 14,392 17,311Total equity and liabilities 42,632 46,504Purchase of owned property, plant and equipment 8.3 498 706 334 617 298 426 100 263 20 17 1,250 2,029Acquisition of goodwill 8.2 9 33 — 13 — 23 2 — — — 11 69Purchases of intangible assets 8.2 70 85 23 43 12 17 9 9 25 32 139 186Depreciation of owned Property, plant and equipment 8.3 (557) (538) (296) (322) (235) (244) (137) (135) (13) (11) (1,238) (1,250)(Impairment) and reversal of impairment of owned property, plant and equipment
8.1/8.3 (195) — (135) — (68) (9) (65) (43) — — (463) (52)
Amortisation of intangible assets 8.2 (77) (76) (99) (117) (8) (9) (153) (160) (52) (37) (389) (399)(Impairment) and reversal of impairment of intangible assets 8.1/8.2 (1) — (225) — (26) (8) (200) (12) (14) — (466) (20)
Notes to the Consolidated Financial Statements
75 Heineken N.V. Annual Report 2020
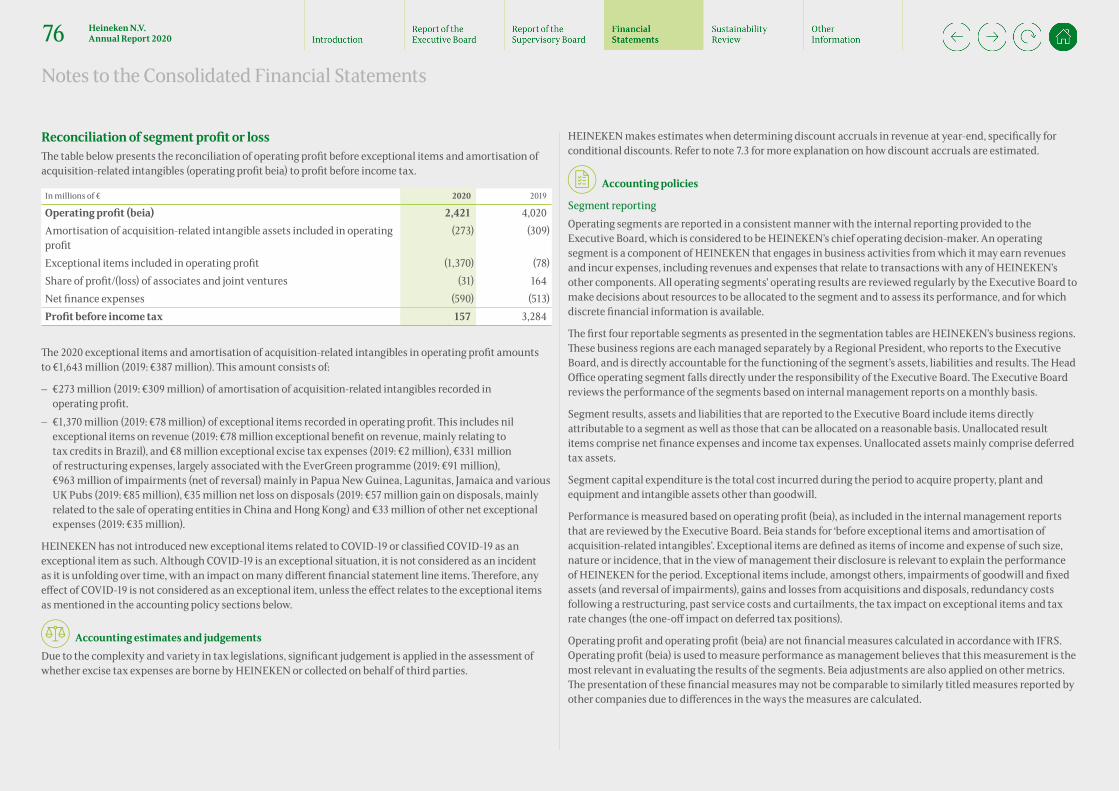
Reconciliation of segment profit or loss The table below presents the reconciliation of operating profit before exceptional items and amortisation of acquisition-related intangibles (operating profit beia) to profit before income tax.
In millions of € 2020 2019
Operating profit (beia) 2,421 4,020Amortisation of acquisition-related intangible assets included in operating profit
(273) (309)
Exceptional items included in operating profit (1,370) (78)Share of profit/(loss) of associates and joint ventures (31) 164Net finance expenses (590) (513)Profit before income tax 157 3,284
The 2020 exceptional items and amortisation of acquisition-related intangibles in operating profit amounts to €1,643 million (2019: €387 million). This amount consists of:
– €273 million (2019: €309 million) of amortisation of acquisition-related intangibles recorded in operating profit.
– €1,370 million (2019: €78 million) of exceptional items recorded in operating profit. This includes nil exceptional items on revenue (2019: €78 million exceptional benefit on revenue, mainly relating to tax credits in Brazil), and €8 million exceptional excise tax expenses (2019: €2 million), €331 million of restructuring expenses, largely associated with the EverGreen programme (2019: €91 million), €963 million of impairments (net of reversal) mainly in Papua New Guinea, Lagunitas, Jamaica and various UK Pubs (2019: €85 million), €35 million net loss on disposals (2019: €57 million gain on disposals, mainly related to the sale of operating entities in China and Hong Kong) and €33 million of other net exceptional expenses (2019: €35 million).
HEINEKEN has not introduced new exceptional items related to COVID-19 or classified COVID-19 as an exceptional item as such. Although COVID-19 is an exceptional situation, it is not considered as an incident as it is unfolding over time, with an impact on many different financial statement line items. Therefore, any effect of COVID-19 is not considered as an exceptional item, unless the effect relates to the exceptional items as mentioned in the accounting policy sections below.
• Accounting estimates and judgements Due to the complexity and variety in tax legislations, significant judgement is applied in the assessment of whether excise tax expenses are borne by HEINEKEN or collected on behalf of third parties.
HEINEKEN makes estimates when determining discount accruals in revenue at year-end, specifically for conditional discounts. Refer to note 7.3 for more explanation on how discount accruals are estimated.
• Accounting policies
Segment reporting Operating segments are reported in a consistent manner with the internal reporting provided to the Executive Board, which is considered to be HEINEKEN’s chief operating decision-maker. An operating segment is a component of HEINEKEN that engages in business activities from which it may earn revenues and incur expenses, including revenues and expenses that relate to transactions with any of HEINEKEN’s other components. All operating segments’ operating results are reviewed regularly by the Executive Board to make decisions about resources to be allocated to the segment and to assess its performance, and for which discrete financial information is available.
The first four reportable segments as presented in the segmentation tables are HEINEKEN’s business regions. These business regions are each managed separately by a Regional President, who reports to the Executive Board, and is directly accountable for the functioning of the segment’s assets, liabilities and results. The Head Office operating segment falls directly under the responsibility of the Executive Board. The Executive Board reviews the performance of the segments based on internal management reports on a monthly basis.
Segment results, assets and liabilities that are reported to the Executive Board include items directly attributable to a segment as well as those that can be allocated on a reasonable basis. Unallocated result items comprise net finance expenses and income tax expenses. Unallocated assets mainly comprise deferred tax assets.
Segment capital expenditure is the total cost incurred during the period to acquire property, plant and equipment and intangible assets other than goodwill.
Performance is measured based on operating profit (beia), as included in the internal management reports that are reviewed by the Executive Board. Beia stands for ‘before exceptional items and amortisation of acquisition-related intangibles’. Exceptional items are defined as items of income and expense of such size, nature or incidence, that in the view of management their disclosure is relevant to explain the performance of HEINEKEN for the period. Exceptional items include, amongst others, impairments of goodwill and fixed assets (and reversal of impairments), gains and losses from acquisitions and disposals, redundancy costs following a restructuring, past service costs and curtailments, the tax impact on exceptional items and tax rate changes (the one-off impact on deferred tax positions).
Operating profit and operating profit (beia) are not financial measures calculated in accordance with IFRS. Operating profit (beia) is used to measure performance as management believes that this measurement is the most relevant in evaluating the results of the segments. Beia adjustments are also applied on other metrics. The presentation of these financial measures may not be comparable to similarly titled measures reported by other companies due to differences in the ways the measures are calculated.
Notes to the Consolidated Financial Statements
76 Heineken N.V. Annual Report 2020
HEINEKEN has multiple distribution models to deliver goods to end customers. There is no reliance on major clients. Deliveries to end consumers are country dependent and include deliveries via own wholesalers and pubs, direct to customers and via third party distribution. As such, distribution models are country-specific and diverse across HEINEKEN. In addition, these various distribution models are not centrally managed or monitored. Consequently, the Executive Board does not allocate resources or assess the performance based on business type information. Accordingly, no segment information on business type is provided.
Inter-segment transfers or transactions are determined on an arm’s length basis. As net finance expenses and income tax expenses are monitored on a consolidated level (and not on an individual regional basis) and Regional Presidents are not accountable for that, net finance expenses and income tax expenses are not provided for the reportable segments.
Revenue The majority of HEINEKEN’s revenue is generated by the sale and delivery of products to customers. The product portfolio of HEINEKEN mainly consists of beer, soft drinks and cider. Products are mostly own-produced finished goods from HEINEKEN’s brewing activities, but also contain purchased goods for resale from HEINEKEN’s wholesale activities. HEINEKEN’s customer group can be split between on-trade customers like cafés, bars and restaurants and off-trade customers like retailers and wholesalers. Due to HEINEKEN’s global footprint, its revenue is exposed to strategic and financial risks that differ per region.
Revenue is recognised when control over products has transferred and HEINEKEN fulfilled its performance obligation to the customer. For the majority of the sales, control is transferred either at delivery of the products or upon pickup by the customer from HEINEKEN’s premises.
Revenue recognised is based on the price specified in the contract, net of returns, discounts, sales taxes and excise taxes collected on behalf of third parties.
Other revenues include rental income from pubs and bars, royalties, income from wholesale activities, pub management services and technical services to third parties. Royalties are sales-based and recognised in profit or loss (consolidated income statement) on an accrual basis in accordance with the relevant agreement. Rental income, income from wholesale activities, pub management services and technical services are recognised in profit or loss when the services have been delivered.
Discounts HEINEKEN uses different types of discounts depending on the nature of the customer. Some discounts are unconditional, like cash discounts, early payment discounts and temporary promotional discounts. Unconditional discounts are recognised at the same moment of the related sales transaction.
HEINEKEN also provides conditional discounts to customers. These contractually agreed conditions include volume and promotional rebates. Conditional discounts are recognised based on estimated target realisation. The estimation is based on accumulated experience supported by historical and current sales information. A discount accrual is recognised at each reporting date for discounts payable to customers based on their expected or actual volume up to that date.
Other discounts include listing and shelving visibility fees charged by the customer whereby the payments to customers are closely related to the volumes sold. HEINEKEN assesses the substance of contracts with customers to determine the classification of payments to customers as either discounts or marketing expenses.
Discounts are accounted for as a reduction of revenue. Only when these payments to customers relate to a distinct service, the amount is classified as operating expense.
Excise tax expense Local tax authorities impose multiple taxes, duties and fees. These include excise on sale or production of alcoholic beverages, environmental taxes on the use of certain raw materials or packaging materials, or the energy consumption in the production process. Excise duties are common in the beverage industry, but levied differently amongst the countries HEINEKEN operates in. HEINEKEN performs a country by country analysis to assess whether the excise duty are sales-related or effectively a production tax. In most countries excise duties are effectively a production tax as excise duties become payable when goods are moved from bonded warehouses and are not based on the sales value. In these countries, increases in excise duties are not always (fully) passed on to customers and HEINEKEN cannot, or can only partly, reclaim the excise duty in the case products are eventually not sold to customers. Excise tax is borne by HEINEKEN for these countries and shown as expenses. Only for those countries where excise is levied at the moment of the sales transaction and excise is based on the sales value, the excise duties are collected on behalf of a tax authority and consequently deducted from revenue. Due to the complexity and variety in tax legislations, significant judgement is applied in the assessment whether taxes are borne by HEINEKEN or collected on behalf of a third party.
To provide transparency on the impact of the accounting for excise, HEINEKEN presents the excise tax expense on a separate line below revenue in the consolidated income statement. A subtotal called ‘Net revenue’ is therefore included in the Income Statement. This ‘Net revenue’ subtotal is ‘revenue’ as defined in IFRS 15 (after discounts) minus the excise tax expense for those countries where the excise is borne by HEINEKEN.
Notes to the Consolidated Financial Statements
77 Heineken N.V. Annual Report 2020

6.2 Other income Other income includes the gain on sale from transactions that do not arise from contracts with customers and are therefore presented separately from revenue.
In millions of € 2020 2019
Gain on sale of property, plant and equipment 35 20Gain on sale of intangible assets 20 —Gain on sale of subsidiaries, joint ventures and associates 1 75
56 95
In 2019, other income mainly related to the gain on sale of HEINEKEN’s operating entities in China and Hong Kong.
• Accounting policies Other income is recognised in profit or loss when control over the sold asset is transferred to the buyer. The amount recognised as other income equals the proceeds obtained from the buyer minus the carrying value of the sold asset.
6.3 Raw materials, consumables and services In millions of € 2020 2019
Raw materials 1,811 2,068Non-returnable packaging 3,691 4,058Goods for resale 920 1,501Inventory movements 17 (75)Marketing and selling expenses 2,044 2,632Transport expenses 1,080 1,325Energy and water 476 572Repair and maintenance 474 519Other expenses 1,937 1,992
12,450 14,592
Other expenses in raw materials, consumables and services mainly include consulting expenses of €187 million (2019: €219 million), telecom and office automation of €271 million (2019: €272 million), warehousing expenses of €179 million (2019: €195 million), travel expenses of €63 million (2019: €150 million), other taxes of €109 million (2019: €75 million), short-term lease expenses of €58 million (2019: €73 million) and low value lease expenses of €33 million (2019: €39 million).
• Accounting policies Expenses are recognised based on accrual accounting. This means that expenses are recognised when the product is received or the service is provided regardless of when cash outflow takes place.
Notes to the Consolidated Financial Statements
78 Heineken N.V. Annual Report 2020
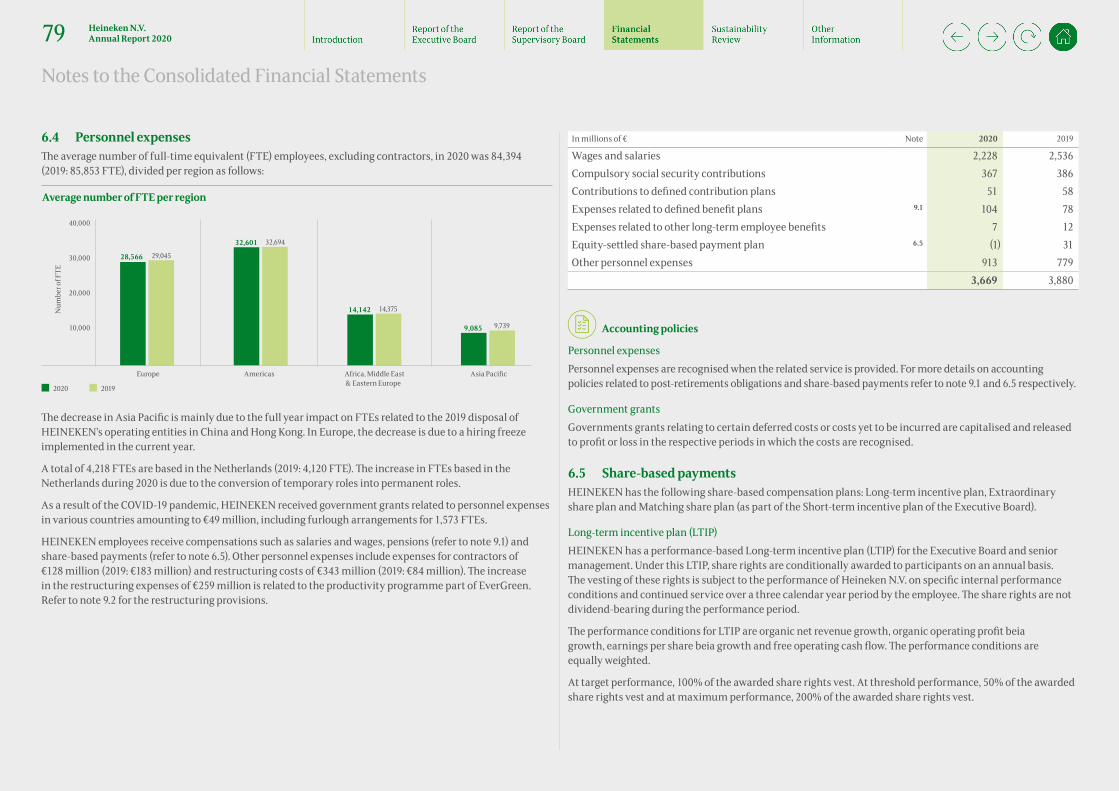
6.4 Personnel expenses The average number of full-time equivalent (FTE) employees, excluding contractors, in 2020 was 84,394 (2019: 85,853 FTE), divided per region as follows:
40,000
Average number of FTE per region
Europe Americas Africa, Middle East & Eastern Europe
Asia Pacific
28,566 29,045
32,601 32,694
14,142 14,375
9,085 9,739
30,000
20,000
10,000
Num
ber o
f FTE
2020 2019
The decrease in Asia Pacific is mainly due to the full year impact on FTEs related to the 2019 disposal of HEINEKEN’s operating entities in China and Hong Kong. In Europe, the decrease is due to a hiring freeze implemented in the current year.
A total of 4,218 FTEs are based in the Netherlands (2019: 4,120 FTE). The increase in FTEs based in the Netherlands during 2020 is due to the conversion of temporary roles into permanent roles.
As a result of the COVID-19 pandemic, HEINEKEN received government grants related to personnel expenses in various countries amounting to €49 million, including furlough arrangements for 1,573 FTEs.
HEINEKEN employees receive compensations such as salaries and wages, pensions (refer to note 9.1) and share-based payments (refer to note 6.5). Other personnel expenses include expenses for contractors of €128 million (2019: €183 million) and restructuring costs of €343 million (2019: €84 million). The increase in the restructuring expenses of €259 million is related to the productivity programme part of EverGreen. Refer to note 9.2 for the restructuring provisions.
In millions of € Note 2020 2019
Wages and salaries 2,228 2,536Compulsory social security contributions 367 386Contributions to defined contribution plans 51 58Expenses related to defined benefit plans 9.1 104 78Expenses related to other long-term employee benefits 7 12Equity-settled share-based payment plan 6.5 (1) 31Other personnel expenses 913 779
3,669 3,880
• Accounting policies
Personnel expenses Personnel expenses are recognised when the related service is provided. For more details on accounting policies related to post-retirements obligations and share-based payments refer to note 9.1 and 6.5 respectively.
Government grants Governments grants relating to certain deferred costs or costs yet to be incurred are capitalised and released to profit or loss in the respective periods in which the costs are recognised.
6.5 Share-based payments HEINEKEN has the following share-based compensation plans: Long-term incentive plan, Extraordinary share plan and Matching share plan (as part of the Short-term incentive plan of the Executive Board).
Long-term incentive plan (LTIP) HEINEKEN has a performance-based Long-term incentive plan (LTIP) for the Executive Board and senior management. Under this LTIP, share rights are conditionally awarded to participants on an annual basis. The vesting of these rights is subject to the performance of Heineken N.V. on specific internal performance conditions and continued service over a three calendar year period by the employee. The share rights are not dividend-bearing during the performance period.
The performance conditions for LTIP are organic net revenue growth, organic operating profit beia growth, earnings per share beia growth and free operating cash flow. The performance conditions are equally weighted.
At target performance, 100% of the awarded share rights vest. At threshold performance, 50% of the awarded share rights vest and at maximum performance, 200% of the awarded share rights vest.
Notes to the Consolidated Financial Statements
79 Heineken N.V. Annual Report 2020
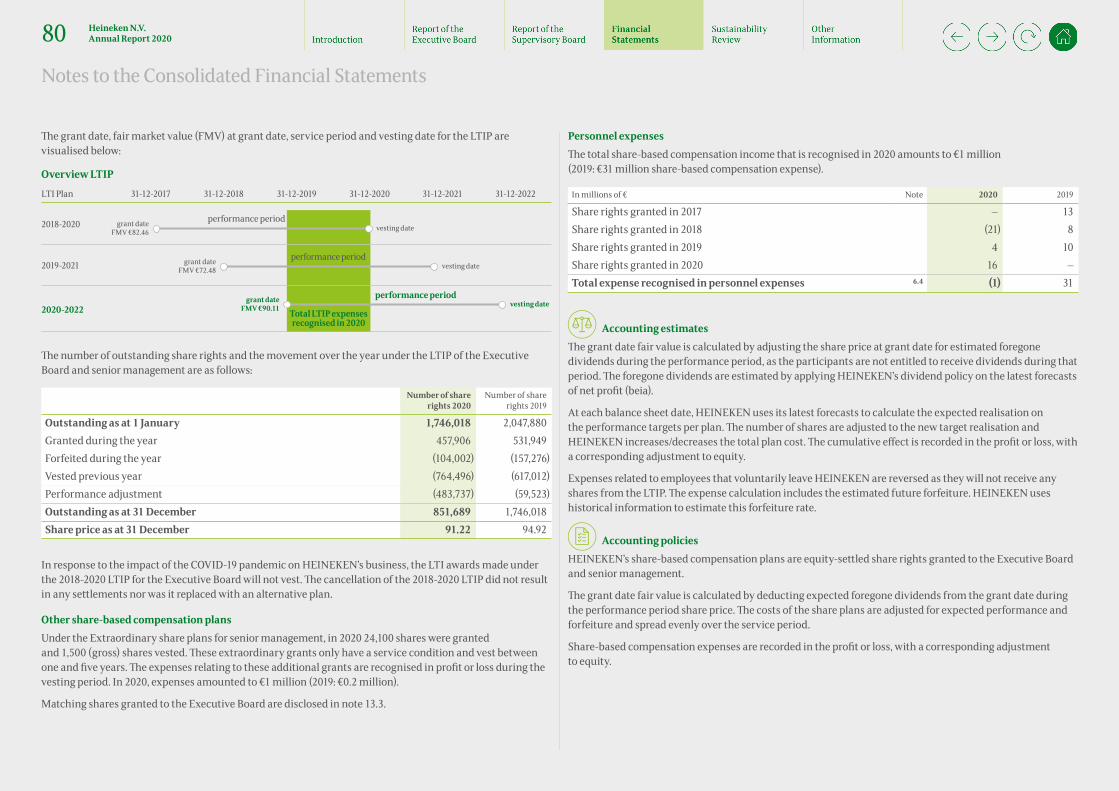
The grant date, fair market value (FMV) at grant date, service period and vesting date for the LTIP are visualised below:
Overview LTIP
Total LTIP expenses recognised in 2020
performance periodgrant date FMV €72.48 vesting date
performance periodgrant date FMV €90.11 vesting date
performance periodgrant date FMV €82.46 vesting date
LTI Plan 31-12-2017 31-12-2018 31-12-2019 31-12-2020 31-12-2021 31-12-2022
2018-2020
2019-2021
2020-2022
The number of outstanding share rights and the movement over the year under the LTIP of the Executive Board and senior management are as follows:
Number of share rights 2020
Number of share rights 2019
Outstanding as at 1 January 1,746,018 2,047,880Granted during the year 457,906 531,949Forfeited during the year (104,002) (157,276)Vested previous year (764,496) (617,012)Performance adjustment (483,737) (59,523)Outstanding as at 31 December 851,689 1,746,018Share price as at 31 December 91.22 94.92
In response to the impact of the COVID-19 pandemic on HEINEKEN’s business, the LTI awards made under the 2018-2020 LTIP for the Executive Board will not vest. The cancellation of the 2018-2020 LTIP did not result in any settlements nor was it replaced with an alternative plan.
Other share-based compensation plans Under the Extraordinary share plans for senior management, in 2020 24,100 shares were granted and 1,500 (gross) shares vested. These extraordinary grants only have a service condition and vest between one and five years. The expenses relating to these additional grants are recognised in profit or loss during the vesting period. In 2020, expenses amounted to €1 million (2019: €0.2 million).
Matching shares granted to the Executive Board are disclosed in note 13.3.
Personnel expenses The total share-based compensation income that is recognised in 2020 amounts to €1 million (2019: €31 million share-based compensation expense).
In millions of € Note 2020 2019
Share rights granted in 2017 — 13Share rights granted in 2018 (21) 8Share rights granted in 2019 4 10Share rights granted in 2020 16 —Total expense recognised in personnel expenses 6.4 (1) 31
• Accounting estimates The grant date fair value is calculated by adjusting the share price at grant date for estimated foregone dividends during the performance period, as the participants are not entitled to receive dividends during that period. The foregone dividends are estimated by applying HEINEKEN’s dividend policy on the latest forecasts of net profit (beia).
At each balance sheet date, HEINEKEN uses its latest forecasts to calculate the expected realisation on the performance targets per plan. The number of shares are adjusted to the new target realisation and HEINEKEN increases/decreases the total plan cost. The cumulative effect is recorded in the profit or loss, with a corresponding adjustment to equity.
Expenses related to employees that voluntarily leave HEINEKEN are reversed as they will not receive any shares from the LTIP. The expense calculation includes the estimated future forfeiture. HEINEKEN uses historical information to estimate this forfeiture rate.
• Accounting policies HEINEKEN’s share-based compensation plans are equity-settled share rights granted to the Executive Board and senior management.
The grant date fair value is calculated by deducting expected foregone dividends from the grant date during the performance period share price. The costs of the share plans are adjusted for expected performance and forfeiture and spread evenly over the service period.
Share-based compensation expenses are recorded in the profit or loss, with a corresponding adjustment to equity.
Notes to the Consolidated Financial Statements
80 Heineken N.V. Annual Report 2020
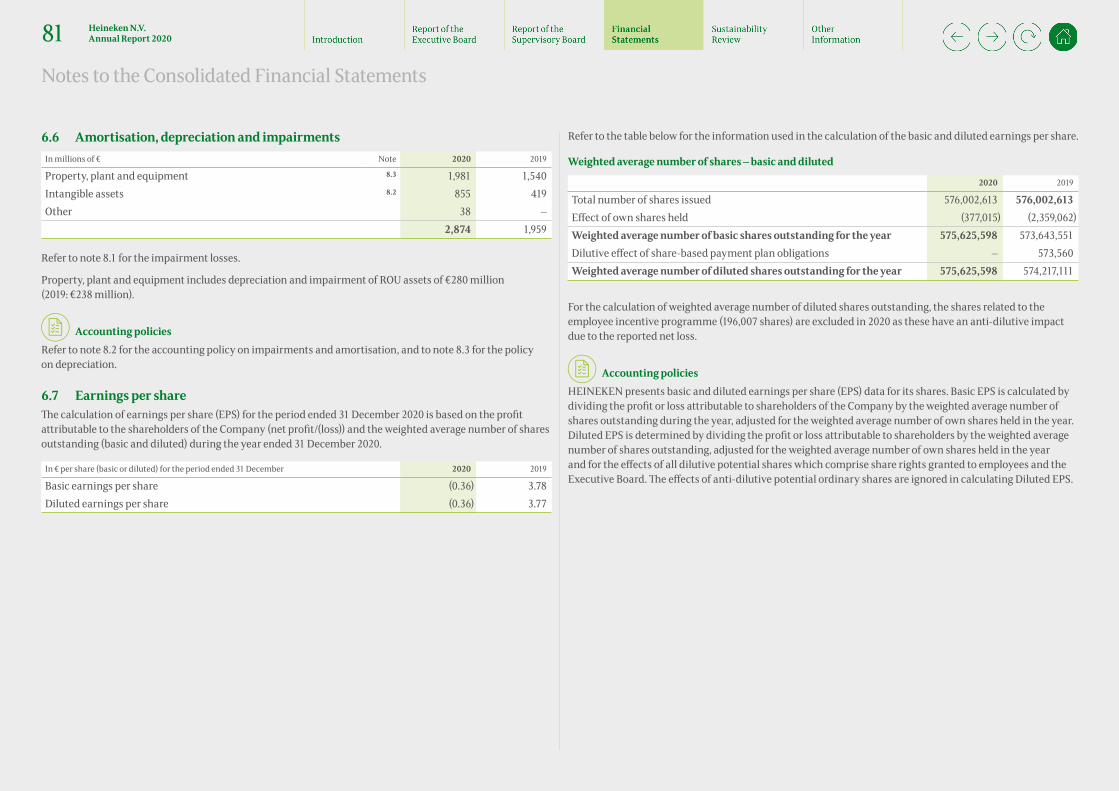
6.6 Amortisation, depreciation and impairmentsIn millions of € Note 2020 2019
Property, plant and equipment 8.3 1,981 1,540Intangible assets 8.2 855 419Other 38 —
2,874 1,959
Refer to note 8.1 for the impairment losses.
Property, plant and equipment includes depreciation and impairment of ROU assets of €280 million (2019: €238 million).
• Accounting policies Refer to note 8.2 for the accounting policy on impairments and amortisation, and to note 8.3 for the policy on depreciation.
6.7 Earnings per share The calculation of earnings per share (EPS) for the period ended 31 December 2020 is based on the profit attributable to the shareholders of the Company (net profit/(loss)) and the weighted average number of shares outstanding (basic and diluted) during the year ended 31 December 2020.
In € per share (basic or diluted) for the period ended 31 December 2020 2019
Basic earnings per share (0.36) 3.78Diluted earnings per share (0.36) 3.77
Refer to the table below for the information used in the calculation of the basic and diluted earnings per share.
Weighted average number of shares – basic and diluted
2020 2019
Total number of shares issued 576,002,613 576,002,613Effect of own shares held (377,015) (2,359,062)Weighted average number of basic shares outstanding for the year 575,625,598 573,643,551Dilutive effect of share-based payment plan obligations — 573,560Weighted average number of diluted shares outstanding for the year 575,625,598 574,217,111
For the calculation of weighted average number of diluted shares outstanding, the shares related to the employee incentive programme (196,007 shares) are excluded in 2020 as these have an anti-dilutive impact due to the reported net loss.
• Accounting policies HEINEKEN presents basic and diluted earnings per share (EPS) data for its shares. Basic EPS is calculated by dividing the profit or loss attributable to shareholders of the Company by the weighted average number of shares outstanding during the year, adjusted for the weighted average number of own shares held in the year. Diluted EPS is determined by dividing the profit or loss attributable to shareholders by the weighted average number of shares outstanding, adjusted for the weighted average number of own shares held in the year and for the effects of all dilutive potential shares which comprise share rights granted to employees and the Executive Board. The effects of anti-dilutive potential ordinary shares are ignored in calculating Diluted EPS.
Notes to the Consolidated Financial Statements
81 Heineken N.V. Annual Report 2020
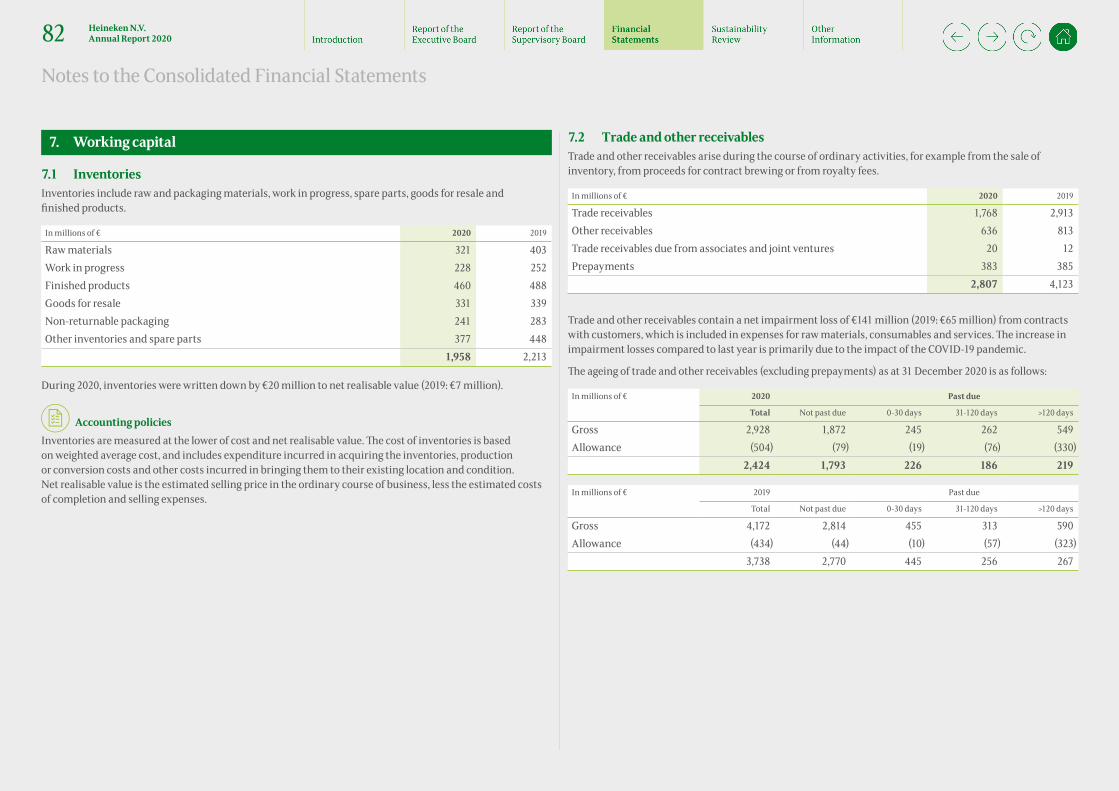
7. Working capital
7.1 InventoriesInventories include raw and packaging materials, work in progress, spare parts, goods for resale and finished products.
In millions of € 2020 2019
Raw materials 321 403Work in progress 228 252Finished products 460 488Goods for resale 331 339Non-returnable packaging 241 283Other inventories and spare parts 377 448
1,958 2,213
During 2020, inventories were written down by €20 million to net realisable value (2019: €7 million).
• Accounting policies Inventories are measured at the lower of cost and net realisable value. The cost of inventories is based on weighted average cost, and includes expenditure incurred in acquiring the inventories, production or conversion costs and other costs incurred in bringing them to their existing location and condition. Net realisable value is the estimated selling price in the ordinary course of business, less the estimated costs of completion and selling expenses.
7.2 Trade and other receivables Trade and other receivables arise during the course of ordinary activities, for example from the sale of inventory, from proceeds for contract brewing or from royalty fees.
In millions of € 2020 2019
Trade receivables 1,768 2,913Other receivables 636 813Trade receivables due from associates and joint ventures 20 12Prepayments 383 385
2,807 4,123
Trade and other receivables contain a net impairment loss of €141 million (2019: €65 million) from contracts with customers, which is included in expenses for raw materials, consumables and services. The increase in impairment losses compared to last year is primarily due to the impact of the COVID-19 pandemic.
The ageing of trade and other receivables (excluding prepayments) as at 31 December 2020 is as follows:
In millions of € 2020 Past due
Total Not past due 0-30 days 31-120 days >120 days
Gross 2,928 1,872 245 262 549Allowance (504) (79) (19) (76) (330)
2,424 1,793 226 186 219
In millions of € 2019 Past due
Total Not past due 0-30 days 31-120 days >120 days
Gross 4,172 2,814 455 313 590Allowance (434) (44) (10) (57) (323)
3,738 2,770 445 256 267
Notes to the Consolidated Financial Statements
82 Heineken N.V. Annual Report 2020

The movement in allowance for credit losses for trade and other receivables during the year is as follows:
Allowance for credit losses 2020 – Trade and other receivables
Balance as at 1 January
Allowance released
E�ect of movements in exchange rates
Transfers Addition toallowance
Allowance used
Balance as at31 December
434 10 (23)
143
(58) (2)504
750
500
0
250
In m
illio
ns o
f €
In millions of € 2020 2019
Balance as at 1 January 434 437Changes in consolidation — 1Transfers 10 —Addition to allowance 143 69Allowance used (58) (73)Allowance released (2) (4)Effect of movements in exchange rates (23) 4Balance as at 31 December 504 434
• Accounting estimates HEINEKEN determines on each reporting date the impairment of trade and other receivables using a model (e.g. flow rate method) which estimates the lifetime expected credit losses that will be incurred on these receivables. Individually significant financial assets are tested for impairment on an individual basis. The remaining financial assets are assessed collectively in groups that share similar credit risk characteristics. Due to the uncertainty relating to the depth and duration of the COVID-19 pandemic and its related impact on HEINEKEN’s customers, more judgement is required in the calculation of expected credit losses compared to the prior year. As part of these assessments, HEINEKEN has incorporated all reasonable and supportable information available such as whether there has been a breach or deterioration of payments terms, a request for extended payment terms or a request for waived payment terms. For more information on HEINEKEN’s credit risk exposure refer to note 11.5.
• Accounting policies Trade and other receivables are held by HEINEKEN in order to collect the related cash flows. These receivables are measured at fair value and subsequently at amortised cost minus any impairment losses. Trade and other receivables are derecognised by HEINEKEN when substantially all risks and rewards are transferred or if HEINEKEN does not retain control over the receivables.
7.3 Trade and other payables In the ordinary course of business, payable positions arise towards suppliers of goods and services, as well as to other parties. Refer to the table below for the different types of trade and other payables.
In millions of € 2020 2019
Trade payables 3,663 4,720Accruals 1,232 1,386Taxation and social security contributions 845 1,009Interest 187 147Dividends 13 12Other payables 167 246
6,107 7,520
As a result of the COVID-19 pandemic, in some countries HEINEKEN was allowed a short-term postponement of payments of certain indirect taxes, such as value-added taxes. As at 31 December 2020, an amount of €98 million of delayed indirect tax payments is included in trade and other payables.
• Accounting estimates HEINEKEN makes estimates in the determination of discount accruals. When discounts are provided to customers, these reduce the transaction price and consequently the revenue. The conditional discounts in revenue (refer to note 6.1) are estimated based on accumulated experience supported by historical and current sales information. Expected sales volumes are determined taking into account (historical) sales patterns and other relevant information. A discount accrual is recognised for expected volume and year-end discounts payable to customers in relation to sales made until the end of the reporting period.
• Accounting policies Trade and other payables are initially measured at fair value and subsequently at amortised cost. Trade payables are derecognised when the contractual obligation is either discharged, cancelled or expired.
Notes to the Consolidated Financial Statements
83 Heineken N.V. Annual Report 2020

7.4 Returnable packaging materials HEINEKEN uses returnable packaging materials such as glass bottles, crates and kegs in selling the finished products to the customer.
Returnable packaging materials The majority of returnable packaging materials is classified as property, plant and equipment. The category ‘Other fixed assets’ in Property, plant and equipment (refer to note 8.3) includes €824 million (2019: €922 million) of returnable packaging materials.
Returnable packaging deposit liability In certain markets, HEINEKEN has the legal or constructive obligation to take back the materials from the market. A deposit value is generally charged upon sale of the finished product, which is reimbursed when the empty returnable packaging material is returned.
In millions of € 2020 2019
Returnable packaging deposits 454 565
• Accounting estimates The main accounting estimate relating to returnable packaging materials is determining the returnable packaging materials in the market and the expected return thereof. This is based on circulation times and losses of returnable packaging materials in the market.
• Accounting policies
Returnable packaging materialsReturnable packaging materials may be classified as property, plant and equipment or inventory. The classification mainly depends on whether ownership is transferred and if HEINEKEN has the legal or constructive obligation to buy back the materials.
Refer to note 8.3 for the general accounting policy on property, plant and equipment. Specifically for returnable packaging materials, the estimated useful life depends on the loss of the materials in the market as well as on HEINEKEN sites.
Returnable packaging deposit liability HEINEKEN recognises a deposit liability when a legal or constructive obligation exists to reimburse the customer for returnable packaging materials that are returned. The returnable packaging deposit liability is based on the estimated returnable packaging materials in the market, the expected return thereof and the deposit value.
8. Non-current assets
8.1 Impairment testing of Intangible assets and Property, plant and equipment
(a) IntroductionThe results of impairment testing for non-financial non-current assets is covered both in note 8.2 Intangible assets and note 8.3 Property, plant and equipment. Note 8.2 covers the impairment testing of goodwill and Intangible assets with an indefinite useful life. Note 8.3 covers the impairment testing for Property, plant and equipment (P,P&E) and intangible assets with a finite useful life.
(b) Impact of the COVID-19 pandemic on impairment testingDue to the uncertainty of the depth and duration of the COVID-19 pandemic, including the resurgence of the virus, limitations on operations and adverse effects on disposable income, projecting future cash flows for cash generating units (CGUs) for 2020 involves a higher degree of judgement compared to previous years. HEINEKEN therefore prepared multiple recovery scenario’s for the impairment trigger testing with regard to the short-term impact (e.g. short-term impact on sales volumes and revenue) and the longer term impact of COVID-19 (e.g. the recovery of sales volumes to pre-COVID-19 levels).
In the event of an impairment indicator, the final forecasts used for impairment testing were prepared for a single most likely scenario. These forecasts were prepared under the assumption of a full recovery to the 2019 sales volumes over a two-year planning horizon. The forecasts took into account the continuation of the current wave and its containment measures into 2021, but no additional waves beyond 2021.
(c) Summary of impairments on Intangible assets and Property, plant and equipmentDuring the year, impairment losses of €963 million were recorded, of which €39 million relates to goodwill (2019: €6 million), €427 million to intangible assets with a finite useful life (2019: €14 million) and €497 million to P,P&E (2019: €52 million). The impairment charges mainly relate to the CGUs Papua New Guinea (€246 million), Lagunitas (€230 million), Jamaica (€100 million) and various (individual) pub impairments in the UK amounting to €191 million. Additionally, various smaller impairments have been recorded.
The drivers of the impairment losses in 2020 are mainly due to the impact of the COVID-19 pandemic on developing economies and on the on-trade business (like cafés, bars and restaurants) in some developed economies. For more details refer to note 8.3.
The impairments have been charged to the line ‘Amortisation, depreciation and impairments’ in the Income Statement.
Notes to the Consolidated Financial Statements
84 Heineken N.V. Annual Report 2020

8.2 Intangible assets Intangible assets within HEINEKEN are mainly goodwill, brands and customer-related intangibles such as customer lists. The majority of intangible assets have been recognised by HEINEKEN as part of acquisitions. Refer to the table below for the historical cost per asset class and the movements during the year including amortisation.
2020 2019
In millions of € Note Goodwill Brands
Customer- related
intangibles
Contract-based
intangibles
Software, research and development
and other Total Goodwill Brands
Customer- related
intangibles
Contract-based
intangibles
Software, research and development
and other Total
CostBalance as at 1 January 11,898 4,979 2,300 1,064 1,037 21,278 11,621 4,775 2,204 1,010 931 20,541Changes in consolidation and other transfers 11 13 (14) (17) (1) (8) 62 71 21 5 12 171Purchased/internally developed — — 1 3 135 139 — — 4 6 176 186Transfer (to)/from assets classified as held for sale 10.2 — (3) — — — (3) (5) — — — — (5)Disposals — — (1) (1) (38) (40) — — — (3) (73) (76)Effect of movements in exchange rates (760) (437) (235) (103) (52) (1,587) 220 133 71 46 (9) 461Balance as at 31 December 11,149 4,552 2,051 946 1,081 19,779 11,898 4,979 2,300 1,064 1,037 21,278
Amortisation and impairment losses
Balance as at 1 January (433) (1,026) (1,169) (328) (553) (3,509) (427) (865) (992) (269) (529) (3,082)Changes in consolidation and other transfers — — 7 8 — 15 — — — — — —Amortisation charge for the year 6.6 — (124) (113) (40) (112) (389) — (134) (135) (43) (87) (399)Impairment losses 6.6 (39) (369) (38) (3) (17) (466) (6) — (6) (6) (2) (20)Transfer (to)/from assets classified as held for sale 10.2 — — — — — — — — — — — —Disposals — — — — 34 34 — — — — 57 57Effect of movements in exchange rates 1 110 131 31 30 303 — (27) (36) (10) 8 (65)Balance as at 31 December (471) (1,409) (1,182) (332) (618) (4,012) (433) (1,026) (1,169) (328) (553) (3,509)
Carrying amountAs at 1 January 11,465 3,953 1,131 736 484 17,769 11,194 3,910 1,212 741 402 17,459As at 31 December 10,678 3,143 869 614 463 15,767 11,465 3,953 1,131 736 484 17,769
Notes to the Consolidated Financial Statements
85 Heineken N.V. Annual Report 2020
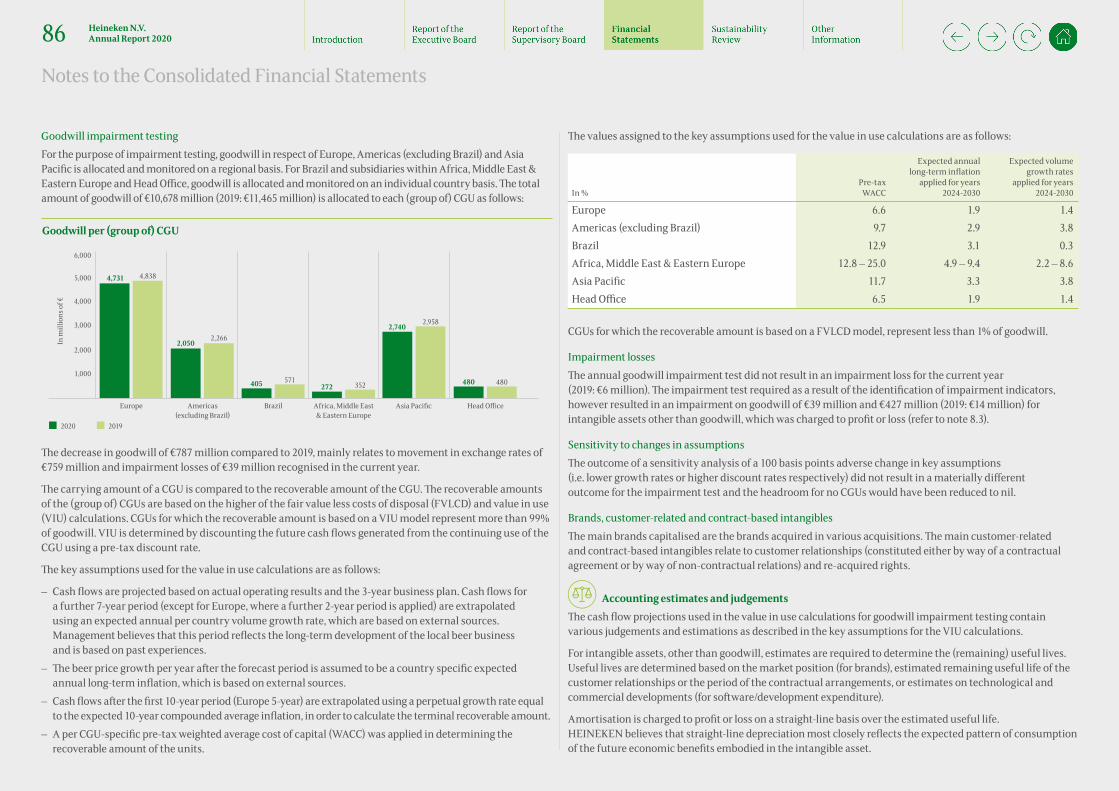
Goodwill impairment testingFor the purpose of impairment testing, goodwill in respect of Europe, Americas (excluding Brazil) and Asia Pacific is allocated and monitored on a regional basis. For Brazil and subsidiaries within Africa, Middle East & Eastern Europe and Head Office, goodwill is allocated and monitored on an individual country basis. The total amount of goodwill of €10,678 million (2019: €11,465 million) is allocated to each (group of) CGU as follows:
Goodwill per (group of) CGU
Europe
2020 2019
Americas(excluding Brazil)
Brazil Africa, Middle East & Eastern Europe
Asia Pacific Head O�ce
4,731 4,838
2,0502,266
2,7402,958
405 571272 352 480 480
6,000
5,000
4,000
3,000
2,000
1,000
In m
illio
ns o
f €
The decrease in goodwill of €787 million compared to 2019, mainly relates to movement in exchange rates of €759 million and impairment losses of €39 million recognised in the current year.
The carrying amount of a CGU is compared to the recoverable amount of the CGU. The recoverable amounts of the (group of) CGUs are based on the higher of the fair value less costs of disposal (FVLCD) and value in use (VIU) calculations. CGUs for which the recoverable amount is based on a VIU model represent more than 99% of goodwill. VIU is determined by discounting the future cash flows generated from the continuing use of the CGU using a pre-tax discount rate.
The key assumptions used for the value in use calculations are as follows:
– Cash flows are projected based on actual operating results and the 3-year business plan. Cash flows fora further 7-year period (except for Europe, where a further 2-year period is applied) are extrapolated using an expected annual per country volume growth rate, which are based on external sources. Management believes that this period reflects the long-term development of the local beer business and is based on past experiences.
– The beer price growth per year after the forecast period is assumed to be a country specific expectedannual long-term inflation, which is based on external sources.
– Cash flows after the first 10-year period (Europe 5-year) are extrapolated using a perpetual growth rate equal to the expected 10-year compounded average inflation, in order to calculate the terminal recoverable amount.
– A per CGU-specific pre-tax weighted average cost of capital (WACC) was applied in determining therecoverable amount of the units.
The values assigned to the key assumptions used for the value in use calculations are as follows:
In %Pre-tax
WACC
Expected annual long-term inflation
applied for years 2024-2030
Expected volume growth rates
applied for years 2024-2030
Europe 6.6 1.9 1.4Americas (excluding Brazil) 9.7 2.9 3.8Brazil 12.9 3.1 0.3Africa, Middle East & Eastern Europe 12.8 – 25.0 4.9 – 9.4 2.2 – 8.6Asia Pacific 11.7 3.3 3.8Head Office 6.5 1.9 1.4
CGUs for which the recoverable amount is based on a FVLCD model, represent less than 1% of goodwill.
Impairment losses The annual goodwill impairment test did not result in an impairment loss for the current year (2019: €6 million). The impairment test required as a result of the identification of impairment indicators, however resulted in an impairment on goodwill of €39 million and €427 million (2019: €14 million) for intangible assets other than goodwill, which was charged to profit or loss (refer to note 8.3).
Sensitivity to changes in assumptions The outcome of a sensitivity analysis of a 100 basis points adverse change in key assumptions (i.e. lower growth rates or higher discount rates respectively) did not result in a materially different outcome for the impairment test and the headroom for no CGUs would have been reduced to nil.
Brands, customer-related and contract-based intangibles The main brands capitalised are the brands acquired in various acquisitions. The main customer-related and contract-based intangibles relate to customer relationships (constituted either by way of a contractual agreement or by way of non-contractual relations) and re-acquired rights.
• Accounting estimates and judgementsThe cash flow projections used in the value in use calculations for goodwill impairment testing contain various judgements and estimations as described in the key assumptions for the VIU calculations.
For intangible assets, other than goodwill, estimates are required to determine the (remaining) useful lives. Useful lives are determined based on the market position (for brands), estimated remaining useful life of the customer relationships or the period of the contractual arrangements, or estimates on technological and commercial developments (for software/development expenditure).
Amortisation is charged to profit or loss on a straight-line basis over the estimated useful life. HEINEKEN believes that straight-line depreciation most closely reflects the expected pattern of consumption of the future economic benefits embodied in the intangible asset.
Notes to the Consolidated Financial Statements
86 Heineken N.V. Annual Report 2020

• Accounting policies
Goodwill Goodwill represents the difference between the fair value of the net assets acquired and the transaction price of the acquisition. Goodwill arising on the acquisition of associates and joint ventures is included in the carrying amount of the associates and joint ventures.
Goodwill is measured at cost less accumulated impairment losses. Goodwill is allocated to individual or groups of CGUs for the purpose of impairment testing and is tested annually for impairment. Negative goodwill is recognised directly in profit or loss as other income. An impairment loss in respect of goodwill can not be reversed.
Brands, customer-related and contract-based intangibles Brands, customer-related and contract-based intangibles acquired as part of a business combination are recognised at fair value. Otherwise these acquired intangibles are recognised at cost and amortised over the estimated useful life of the individual brand, respectively over the remaining useful life of the customer relationships or the period of the contractual arrangements.
Strategic brands are well-known international/local brands with a strong market position and an established brand name.
Software, research and development and other intangible assets Purchased software is measured at cost less accumulated amortisation. Expenditure on internally developed software is capitalised when the expenditure qualifies as development activities, otherwise it is recognised in profit or loss when incurred.
Expenditure on research activities, undertaken with the prospect of gaining new technical knowledge, is recognised in profit or loss when incurred.
Amortisation Amortisation is calculated over the cost of the asset less its residual value. Intangible assets with a finite life are amortised on a straight-line basis over their estimated useful lives from the date they are available for use. The estimated useful lives are as follows:
– Strategic brands 40 – 50 years – Other brands 15 – 25 years – Customer-related and contract-based intangibles 5 – 30 years – Re-acquired rights 3 – 12 years – Software 3 – 7 years – Capitalised development costs 3 years
The amortisation method, useful lives and residual values are reassessed annually. Changes in useful lives or residual value are recognised prospectively.
De-recognition of intangible assets Intangible assets are derecognised when disposed or sold. Gains on sale of intangible assets are presented in profit or loss as other income (refer to note 6.2); losses on sale are included in amortisation. Goodwill is derecognised when the related CGU is sold.
Impairment of non-financial assets At each reporting date HEINEKEN reviews the carrying amounts of its non-financial assets (except for inventories and deferred tax assets) to determine whether there is any indication of impairment. If any such indication exists, the recoverable amount is estimated.
For the purpose of impairment testing, assets are grouped together into the smallest group of assets that generate cash inflows from continuing use. The CGU for other non-financial assets is often the operating company on country level. The recoverable amount of an asset or CGU is the higher of an asset’s FVLCD and VIU. In assessing value in use, the estimated future cash flows are discounted to their present value using a pre-tax discount rate that reflects current market assessments of the time value of money and risks specific to the asset or CGU.
An impairment loss is recognised in profit or loss if the carrying amount of an asset or its CGU exceeds its recoverable amount. Impairment losses are first allocated to goodwill and intangible assets with an indefinite useful life. A remaining impairment loss is then allocated to the other assets in the unit on a pro rata basis. In respect of other assets, impairment losses recognised in prior periods are assessed at each reporting date for any indications that the loss has decreased or no longer exists. An impairment loss is reversed if there has been a change in the estimates used to determine the recoverable amount. An impairment loss is reversed only to the extent that the asset’s carrying amount does not exceed the carrying amount that would have been determined, net of depreciation or amortisation, if no impairment loss had been recognised.
8.3 Property, plant and equipment P,P&E are fixed assets that are owned by HEINEKEN, as well as right of use (ROU) assets under a lease agreement. Owned and ROU assets are held for use in HEINEKEN’s operating activities. Refer to the table below for the split between owned assets and ROU assets as per balance sheet date:
In millions of € 2020 2019
Property, plant and equipment – owned assets 10,606 12,230Right of use assets 945 1,039Property, plant and equipment 11,551 13,269
Notes to the Consolidated Financial Statements
87 Heineken N.V. Annual Report 2020
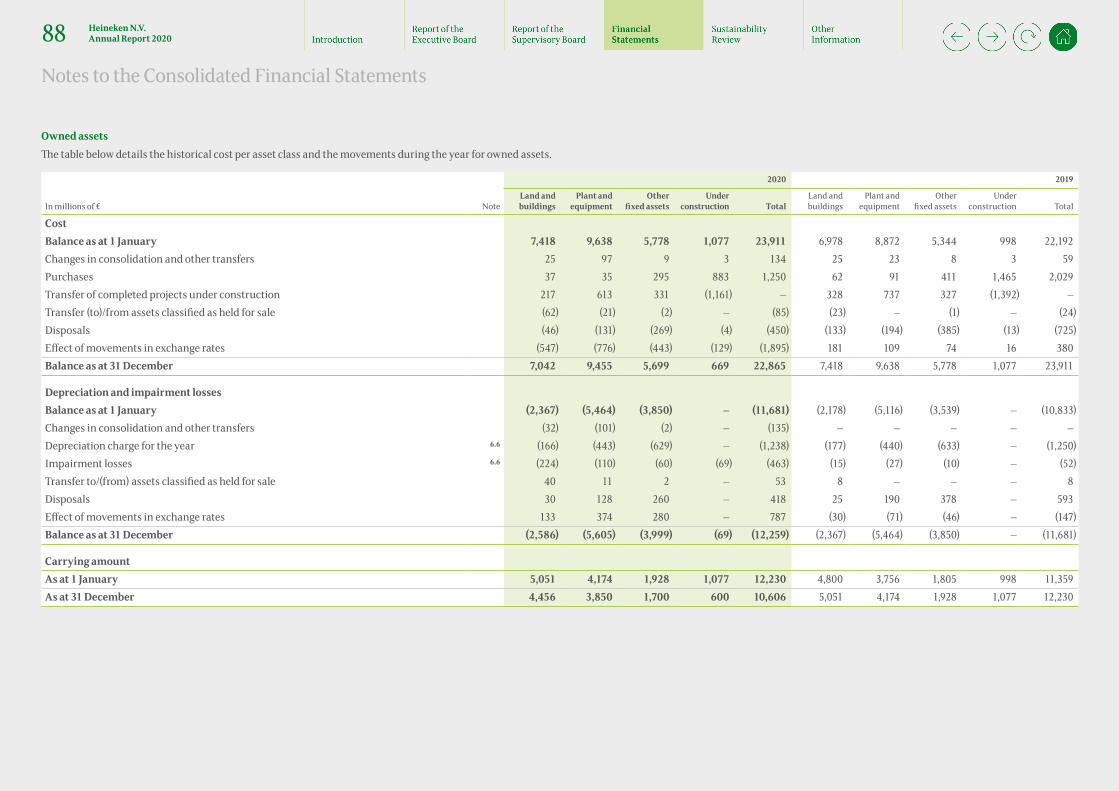
Owned assets The table below details the historical cost per asset class and the movements during the year for owned assets.
2020 2019
In millions of € NoteLand and buildings
Plant and equipment
Other fixed assets
Under construction Total
Land and buildings
Plant and equipment
Other fixed assets
Under construction Total
CostBalance as at 1 January 7,418 9,638 5,778 1,077 23,911 6,978 8,872 5,344 998 22,192Changes in consolidation and other transfers 25 97 9 3 134 25 23 8 3 59Purchases 37 35 295 883 1,250 62 91 411 1,465 2,029Transfer of completed projects under construction 217 613 331 (1,161) — 328 737 327 (1,392) —Transfer (to)/from assets classified as held for sale (62) (21) (2) — (85) (23) — (1) — (24)Disposals (46) (131) (269) (4) (450) (133) (194) (385) (13) (725)Effect of movements in exchange rates (547) (776) (443) (129) (1,895) 181 109 74 16 380Balance as at 31 December 7,042 9,455 5,699 669 22,865 7,418 9,638 5,778 1,077 23,911
Depreciation and impairment lossesBalance as at 1 January (2,367) (5,464) (3,850) — (11,681) (2,178) (5,116) (3,539) — (10,833)Changes in consolidation and other transfers (32) (101) (2) — (135) — — — — —Depreciation charge for the year 6.6 (166) (443) (629) — (1,238) (177) (440) (633) — (1,250)Impairment losses 6.6 (224) (110) (60) (69) (463) (15) (27) (10) — (52)Transfer to/(from) assets classified as held for sale 40 11 2 — 53 8 — — — 8Disposals 30 128 260 — 418 25 190 378 — 593Effect of movements in exchange rates 133 374 280 — 787 (30) (71) (46) — (147)Balance as at 31 December (2,586) (5,605) (3,999) (69) (12,259) (2,367) (5,464) (3,850) — (11,681)
Carrying amountAs at 1 January 5,051 4,174 1,928 1,077 12,230 4,800 3,756 1,805 998 11,359As at 31 December 4,456 3,850 1,700 600 10,606 5,051 4,174 1,928 1,077 12,230
Notes to the Consolidated Financial Statements
88 Heineken N.V. Annual Report 2020
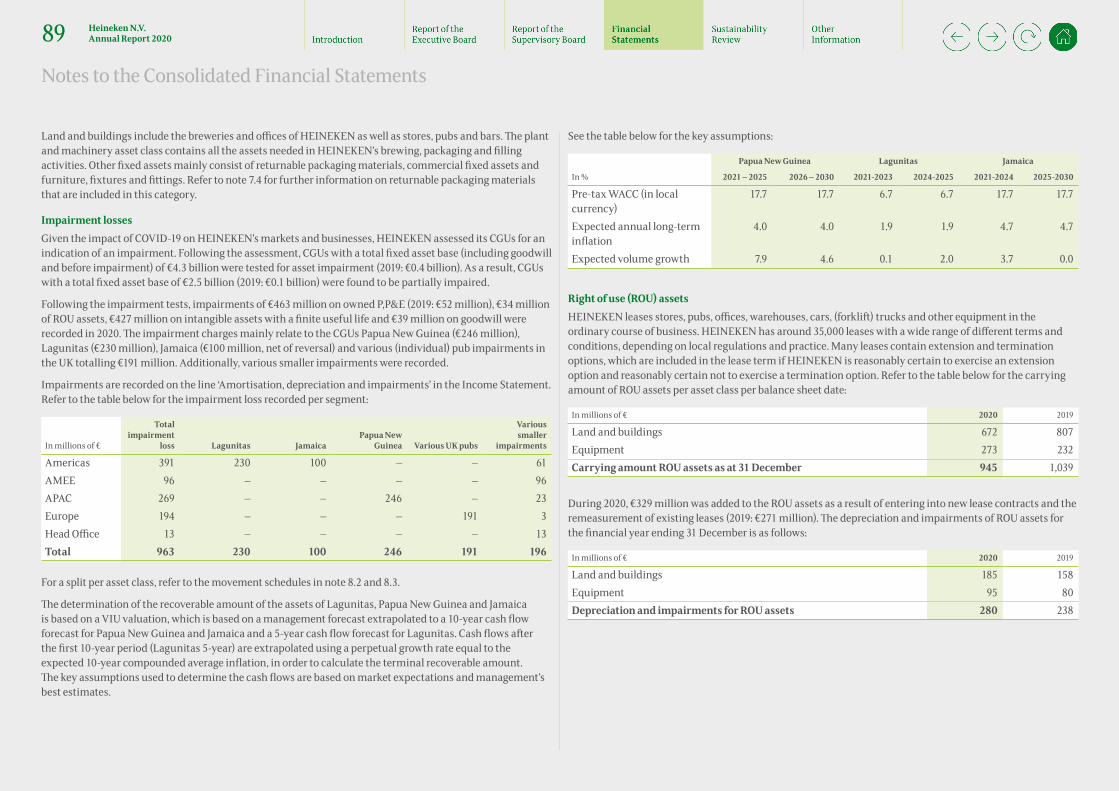
Land and buildings include the breweries and offices of HEINEKEN as well as stores, pubs and bars. The plant and machinery asset class contains all the assets needed in HEINEKEN’s brewing, packaging and filling activities. Other fixed assets mainly consist of returnable packaging materials, commercial fixed assets and furniture, fixtures and fittings. Refer to note 7.4 for further information on returnable packaging materials that are included in this category.
Impairment losses Given the impact of COVID-19 on HEINEKEN’s markets and businesses, HEINEKEN assessed its CGUs for an indication of an impairment. Following the assessment, CGUs with a total fixed asset base (including goodwill and before impairment) of €4.3 billion were tested for asset impairment (2019: €0.4 billion). As a result, CGUs with a total fixed asset base of €2.5 billion (2019: €0.1 billion) were found to be partially impaired.
Following the impairment tests, impairments of €463 million on owned P,P&E (2019: €52 million), €34 million of ROU assets, €427 million on intangible assets with a finite useful life and €39 million on goodwill were recorded in 2020. The impairment charges mainly relate to the CGUs Papua New Guinea (€246 million), Lagunitas (€230 million), Jamaica (€100 million, net of reversal) and various (individual) pub impairments in the UK totalling €191 million. Additionally, various smaller impairments were recorded.
Impairments are recorded on the line ‘Amortisation, depreciation and impairments’ in the Income Statement. Refer to the table below for the impairment loss recorded per segment:
In millions of €
Total impairment
loss Lagunitas JamaicaPapua New
Guinea Various UK pubs
Various smaller
impairments
Americas 391 230 100 – – 61AMEE 96 – – – – 96APAC 269 – – 246 – 23Europe 194 – – – 191 3Head Office 13 – – – – 13Total 963 230 100 246 191 196
For a split per asset class, refer to the movement schedules in note 8.2 and 8.3.
The determination of the recoverable amount of the assets of Lagunitas, Papua New Guinea and Jamaica is based on a VIU valuation, which is based on a management forecast extrapolated to a 10-year cash flow forecast for Papua New Guinea and Jamaica and a 5-year cash flow forecast for Lagunitas. Cash flows after the first 10-year period (Lagunitas 5-year) are extrapolated using a perpetual growth rate equal to the expected 10-year compounded average inflation, in order to calculate the terminal recoverable amount. The key assumptions used to determine the cash flows are based on market expectations and management’s best estimates.
See the table below for the key assumptions:
Papua New Guinea Lagunitas Jamaica
In % 2021 – 2025 2026 – 2030 2021-2023 2024-2025 2021-2024 2025-2030
Pre-tax WACC (in local currency)
17.7 17.7 6.7 6.7 17.7 17.7
Expected annual long-term inflation
4.0 4.0 1.9 1.9 4.7 4.7
Expected volume growth 7.9 4.6 0.1 2.0 3.7 0.0
Right of use (ROU) assets HEINEKEN leases stores, pubs, offices, warehouses, cars, (forklift) trucks and other equipment in the ordinary course of business. HEINEKEN has around 35,000 leases with a wide range of different terms and conditions, depending on local regulations and practice. Many leases contain extension and termination options, which are included in the lease term if HEINEKEN is reasonably certain to exercise an extension option and reasonably certain not to exercise a termination option. Refer to the table below for the carrying amount of ROU assets per asset class per balance sheet date:
In millions of € 2020 2019
Land and buildings 672 807Equipment 273 232Carrying amount ROU assets as at 31 December 945 1,039
During 2020, €329 million was added to the ROU assets as a result of entering into new lease contracts and the remeasurement of existing leases (2019: €271 million). The depreciation and impairments of ROU assets for the financial year ending 31 December is as follows:
In millions of € 2020 2019
Land and buildings 185 158Equipment 95 80Depreciation and impairments for ROU assets 280 238
Notes to the Consolidated Financial Statements
89 Heineken N.V. Annual Report 2020

• Accounting estimates and judgements
Estimates are required to determine the (remaining) useful lives of fixed assets. Useful lives are determined based on an asset’s age, the frequency of its use, repair and maintenance policy, technology changes in production and expected restructuring.
HEINEKEN estimates the expected residual value per asset item. The residual value is the higher of the expected sales price (based on recent market transactions of similar sold items) and its material scrap value.
Depreciation is charged to profit or loss on a straight-line basis over the estimated useful lives of items of P,P&E. HEINEKEN believes that straight-line depreciation most closely reflects the expected pattern of consumption of the future economic benefits embodied in the asset.
Significant judgement is required to determine the lease term. The assessment of whether HEINEKEN is reasonably certain to exercise such options impacts the lease term, which as a result could affect the amount of lease liabilities and ROU assets recognised.
• Accounting policies
Owned assets A fixed asset is recognised when it is probable that future economic benefits associated with the P,P&E item will flow to HEINEKEN and when the cost of the P,P&E can be reliably measured. The majority of the P,P&E of HEINEKEN are owned assets, rather than leased assets.
P,P&E are recognised at historical cost less accumulated depreciation and impairment losses. Historical cost includes all costs directly attributable to the purchase of an asset. The cost of self-constructed assets includes all directly attributable costs to make the asset ready for its intended use. Spare parts that meet the definition of P,P&E are capitalised and accounted for accordingly. If spare parts do not meet the recognition criteria of P,P&E, they are either carried in inventory or consumed and recorded in profit or loss.
Subsequent costs are capitalised only when it is probable that the expenses will lead to future economic benefits and can be measured reliably. The carrying amount of any component accounted for as a separate asset is derecognised when replaced. All other repairs and maintenance are charged to profit or loss during the reporting period in which they are incurred.
For the contractual commitments on ordered P,P&E refer to note 13.2.
Depreciation and impairments Depreciation is calculated using the straight-line method, based on the estimated useful life of the asset class. The estimated useful lives of the main asset classes are as follows:
– Buildings 30 – 40 years – Plant and equipment 10 – 30 years – Other fixed assets 3 – 10 years
Land and assets under construction are not depreciated. When assets under construction are ready for its intended use, they are transferred to the relevant category and depreciation starts. All other P,P&E items are depreciated over their estimated useful live to the asset’s residual value.
The depreciation method, residual value and useful lives are reassessed annually. Changes in useful lives or residual value are recognised prospectively.
HEINEKEN reviews whether indicators for impairment exist on CGU level. When an indicator of impairment exists, assets are tested for impairment. Impairment losses on assets, other than goodwill, recognised in prior periods are assessed at each reporting date for any indication of a reversal.
De-recognition of Property, plant and equipment P,P&E is derecognised when it is scrapped or sold. Gains on sale of P,P&E are presented in profit or loss as other income (refer to note 6.2); losses on sale are included in depreciation.
Right of use (ROU) assetsDefinition of a lease A contract is or contains a lease if it provides the right to control the use of an identified asset for a period of time in exchange for an amount payable to the lessor. The right to control the use of the identified asset exists when having the right to obtain substantially all of the economic benefits from use of that asset and when having the right to direct the use of that asset.
HEINEKEN as a lessee At the start date of the lease, HEINEKEN (lessee) recognises a right of use (ROU) asset and a lease liability on the balance sheet. The ROU asset is initially measured at cost, and subsequently at cost less accumulated depreciation and impairment losses, and adjusted for certain remeasurements of the lease liability. For measurement of the lease liability, refer to note 11.3.
HEINEKEN applies the following practical expedients for the recognition of leases:
– The short-term lease exemption, meaning that leases with a duration of less than a year are expensed in the income statement on a straight-line basis.
– The low value lease exemption, meaning that leased assets with an individual value of €5 thousand or less if bought new, are expensed in the income statement on a straight-line basis.
HEINEKEN as a lessor A lease is classified as a finance lease when it transfers substantially all the risks and rewards relating to ownership of the underlying asset to the lessee. For contracts where HEINEKEN acts as an intermediate lessor, the subleases are classified with reference to the ROU asset.
Notes to the Consolidated Financial Statements
90 Heineken N.V. Annual Report 2020
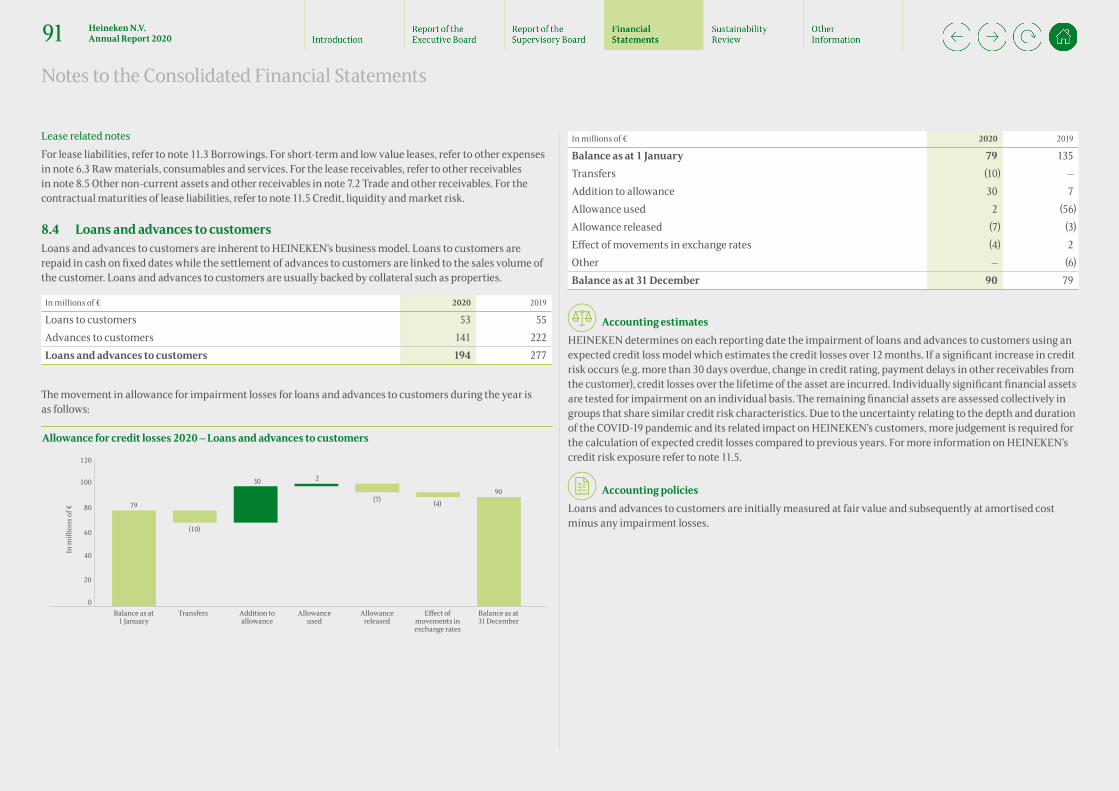
Lease related notes For lease liabilities, refer to note 11.3 Borrowings. For short-term and low value leases, refer to other expenses in note 6.3 Raw materials, consumables and services. For the lease receivables, refer to other receivables in note 8.5 Other non-current assets and other receivables in note 7.2 Trade and other receivables. For the contractual maturities of lease liabilities, refer to note 11.5 Credit, liquidity and market risk.
8.4 Loans and advances to customers Loans and advances to customers are inherent to HEINEKEN’s business model. Loans to customers are repaid in cash on fixed dates while the settlement of advances to customers are linked to the sales volume of the customer. Loans and advances to customers are usually backed by collateral such as properties.
In millions of € 2020 2019
Loans to customers 53 55Advances to customers 141 222Loans and advances to customers 194 277
The movement in allowance for impairment losses for loans and advances to customers during the year is as follows:
Allowance for credit losses 2020 – Loans and advances to customers
Balance as at 1 January
Transfers Addition toallowance
Allowance used
Allowance released
Eect of movements in exchange rates
Balance as at31 December
79
(10)
30 2
(7) (4)90
120
60
80
100
40
20
0
In m
illio
ns o
f €
In millions of € 2020 2019
Balance as at 1 January 79 135Transfers (10) —Addition to allowance 30 7Allowance used 2 (56)Allowance released (7) (3)Effect of movements in exchange rates (4) 2Other — (6)Balance as at 31 December 90 79
• Accounting estimates HEINEKEN determines on each reporting date the impairment of loans and advances to customers using an expected credit loss model which estimates the credit losses over 12 months. If a significant increase in credit risk occurs (e.g. more than 30 days overdue, change in credit rating, payment delays in other receivables from the customer), credit losses over the lifetime of the asset are incurred. Individually significant financial assets are tested for impairment on an individual basis. The remaining financial assets are assessed collectively in groups that share similar credit risk characteristics. Due to the uncertainty relating to the depth and duration of the COVID-19 pandemic and its related impact on HEINEKEN’s customers, more judgement is required for the calculation of expected credit losses compared to previous years. For more information on HEINEKEN’s credit risk exposure refer to note 11.5.
• Accounting policies Loans and advances to customers are initially measured at fair value and subsequently at amortised cost minus any impairment losses.
Notes to the Consolidated Financial Statements
91 Heineken N.V. Annual Report 2020

8.5 Other non-current assets Other non-current assets mainly consist of Fair Value through Other Comprehensive Income (FVOCI) investments, prepayments and other receivables with a duration longer than 12 months.
In millions of € Note 2020 2019
Fair value through OCI investments 117 408Non-current derivatives 11.6 21 2Loans to joint ventures and associates 30 38Long-term prepayments 375 439Other receivables 341 368Other non-current assets 884 1,255
The FVOCI investments primarily consist of equity securities. HEINEKEN designates these investments as FVOCI as these are not held for trading purposes. As at 31 December 2019, the main FVOCI equity investment was €241 million in the Saigon Alcohol Beer and Beverages Corporation (‘SABECO’, Vietnam), of which the majority was sold during 2020.
The other receivables include lease receivables of €160 million (2019: €167 million). Including the short-term portion of lease receivables, the average outstanding term of the lease receivables is 5.3 years (2019: 4.6 years). The remainder of other receivables mainly originate from the acquisition of the beer operations of FEMSA and represent a receivable on the Brazilian authorities on which interest is calculated in accordance with Brazilian legislation. Collection of this receivable is expected to be beyond a period of five years. A part of the aforementioned receivables qualify for indemnification towards FEMSA and is provided for.
Sensitivity analysis – equity securities An increase or decrease of 1% in the share price of the equity securities at the reporting date would not have a material impact.
• Accounting estimates HEINEKEN determines on each reporting date the impairment of other receivables using an expected credit loss model, which estimates the credit losses over 12 months. Only in case a significant increase in credit risk occurs (e.g. more than 30 days overdue, change in credit rating, payment delays in other receivables from the customer) the credit losses over the lifetime of the asset are incurred. Individually significant other receivables are tested for impairment on an individual basis. The remaining financial assets are assessed collectively in groups that share similar credit risk characteristics. For more information on HEINEKEN’s credit risk exposure refer to 11.5.
• Accounting policies
Fair value through OCI investments HEINEKEN’s investments in equity securities are classified as FVOCI. These investments are interests in entities where HEINEKEN has less than significant influence. This is generally the case by ownership of less than 20% of the voting rights. Upon the sale of these equity securities the accumulated fair value- and currency translation changes are transferred to retained earnings.
FVOCI investments are measured at fair value (refer to note 13.1). The fair value changes are recognised in OCI and presented within equity in the fair value reserve. Dividend income is recognised in profit or loss.
Non-current derivatives Refer to the accounting policies on derivative financial instruments in note 11.6.
Other The remaining non-current assets as presented in the previous table are initially measured at fair value and subsequently at amortised cost minus any impairment losses.
9. Provisions and contingent liabilities
9.1 Post-retirement obligations HEINEKEN makes contributions to pension plans that provide pension benefits to (former) employees upon retirement, both via defined benefit as well as defined contribution plans. Other long-term employee benefits include long-term bonus plans, termination benefits, medical plans and jubilee benefits. Refer to note 6.4 for the contribution to defined contribution plans. This note relates to HEINEKEN’s defined benefit pension plans. Refer to the table below for the present value of the defined benefit plans as at 31 December.
In millions of € 2020 2019
Present value of unfunded defined benefit obligations 203 307Present value of funded defined benefit obligations 9,387 9,210Total present value of defined benefit obligations 9,590 9,517Fair value of defined benefit plan assets (8,757) (8,451)Present value of net obligations 833 1,066Asset ceiling items 48 53Defined benefit plans included under non-current assets 5 7Recognised liability for defined benefit obligations 886 1,126Other long-term employee benefits 52 63
938 1,189
Notes to the Consolidated Financial Statements
92 Heineken N.V. Annual Report 2020

The vast majority of benefit payments are from pension funds that are held in trusts (or equivalent), however, there is a small portion where HEINEKEN fulfils the benefit payment obligation as it falls due. Plan assets held in trusts are governed by Trustee Boards composed of HEINEKEN representatives and independent and/or member representation, in accordance with local regulations and practice in each country. The relationship and division of responsibility between HEINEKEN and the Trustee Board (or equivalent) including investment decisions and contribution schedules are carried out in accordance with the plan’s regulations.
The defined benefit pension plans in the Netherlands (NL) and the United Kingdom represent the majority of the total defined benefit plan assets and the present value of the defined benefit obligations.
Refer to the table below for the split of these plans in the total present value of the net obligations of HEINEKEN.
2020 2019 2020 2019 2020 2019 2020 2019
In millions of € UK UK NL NL Other Other Total Total
Total present value of defined benefit obligations
4,063 3,945 4,102 4,096 1,425 1,476 9,590 9,517
Fair value of defined benefit plan assets
(3,751) (3,529) (4,059) (3,939) (947) (983) (8,757) (8,451)
Present value of net obligations
312 416 43 157 478 493 833 1,066
Defined benefit plan in the Netherlands HEINEKEN provides employees in the Netherlands with an average pay pension plan based on earnings up to the legal tax limit. Indexation of accrued benefits is conditional on the funded status of the pension fund. HEINEKEN pays contributions to the fund up to a maximum level agreed with the Board of the pension fund and has no obligation to make additional contributions in case of a funding deficit. In 2020, HEINEKEN’s cash contribution to the Dutch pension plan was at the maximum level. The same level will apply in 2021. As a result of a legal obligation to settle a closed transitional plan per the end of 2020, a one-off contribution of €80 million was prepaid by HEINEKEN to the pension fund in 2020. Early 2021 the final contribution will be determined and settled with the prepayment. As a result of the final settlement, the respective plan will be fully funded. The final contribution is expected to be in line with the prepayment of €80 million.
Defined benefit plan in the United Kingdom HEINEKEN’s UK plan (Scottish & Newcastle pension plan ‘SNPP’) was closed to future accrual in 2011 and the liabilities thus relate to past service before plan closure. Based on the triennial review finalised in early 2019, HEINEKEN has renewed the funding plan (until 31 May 2023) including an annual deficit reduction contribution of GBP39.2 million in 2018, thereafter increasing with GBP1.7 million per year. At the end of 2018, an agreement (the Funding Agreement) was reached with the UK pension fund Trustees on a more conservative longer term funding and investment approach towards 2030. This agreement has been formalised during 2019 and signed early 2020, which leads to a gradual decrease of investment risk. The current schedule of deficit recovery payments until May 2023 will remain in place. As of June 2023 deficit recovery payments will be conditional on the funding position of the pension fund and will be capped on the current contribution level.
Defined benefit plans in other countries In a few other countries HEINEKEN offers defined benefit plans, which are individually not significant to HEINEKEN. The majority of these plans are closed for new participants.
Notes to the Consolidated Financial Statements
93 Heineken N.V. Annual Report 2020
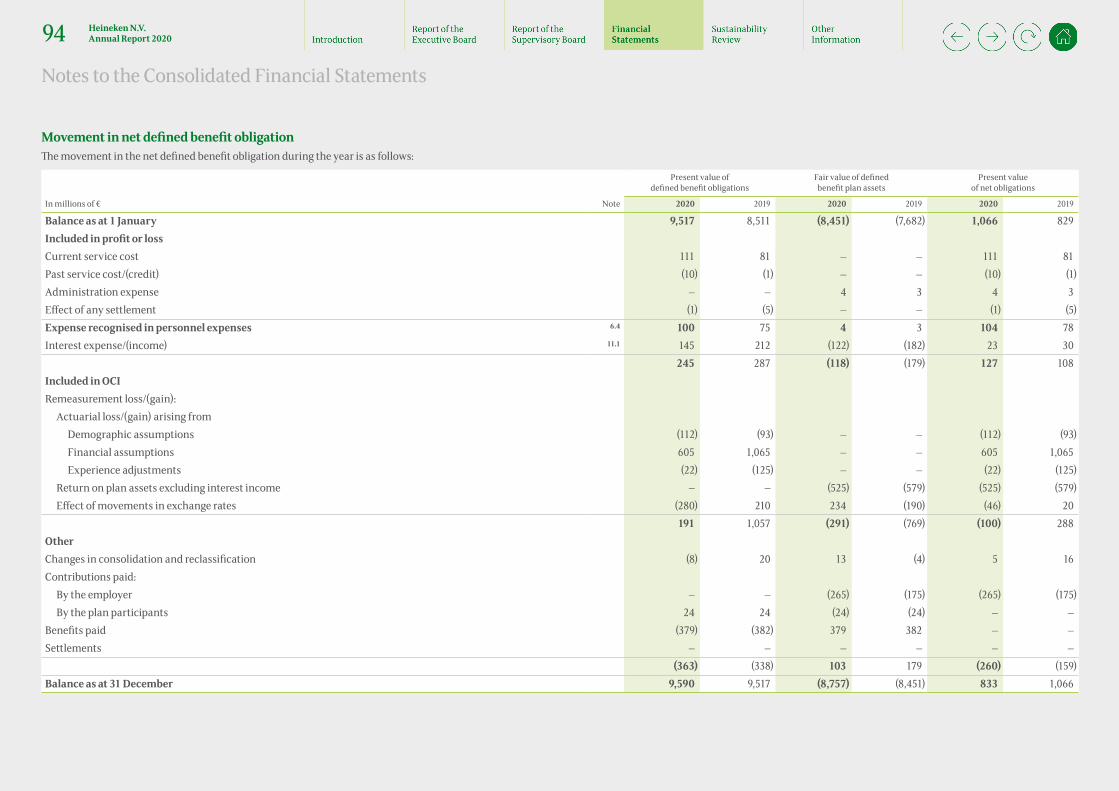
Movement in net defined benefit obligation The movement in the net defined benefit obligation during the year is as follows:
Present value of defined benefit obligations
Fair value of defined benefit plan assets
Present value of net obligations
In millions of € Note 2020 2019 2020 2019 2020 2019
Balance as at 1 January 9,517 8,511 (8,451) (7,682) 1,066 829Included in profit or lossCurrent service cost 111 81 — — 111 81Past service cost/(credit) (10) (1) — — (10) (1)Administration expense — — 4 3 4 3Effect of any settlement (1) (5) — — (1) (5)Expense recognised in personnel expenses 6.4 100 75 4 3 104 78Interest expense/(income) 11.1 145 212 (122) (182) 23 30
245 287 (118) (179) 127 108Included in OCIRemeasurement loss/(gain):
Actuarial loss/(gain) arising fromDemographic assumptions (112) (93) — — (112) (93)Financial assumptions 605 1,065 — — 605 1,065Experience adjustments (22) (125) — — (22) (125)
Return on plan assets excluding interest income — — (525) (579) (525) (579)Effect of movements in exchange rates (280) 210 234 (190) (46) 20
191 1,057 (291) (769) (100) 288OtherChanges in consolidation and reclassification (8) 20 13 (4) 5 16Contributions paid:
By the employer — — (265) (175) (265) (175)By the plan participants 24 24 (24) (24) — —
Benefits paid (379) (382) 379 382 — —Settlements — — — — — —
(363) (338) 103 179 (260) (159)Balance as at 31 December 9,590 9,517 (8,757) (8,451) 833 1,066
Notes to the Consolidated Financial Statements
94 Heineken N.V. Annual Report 2020
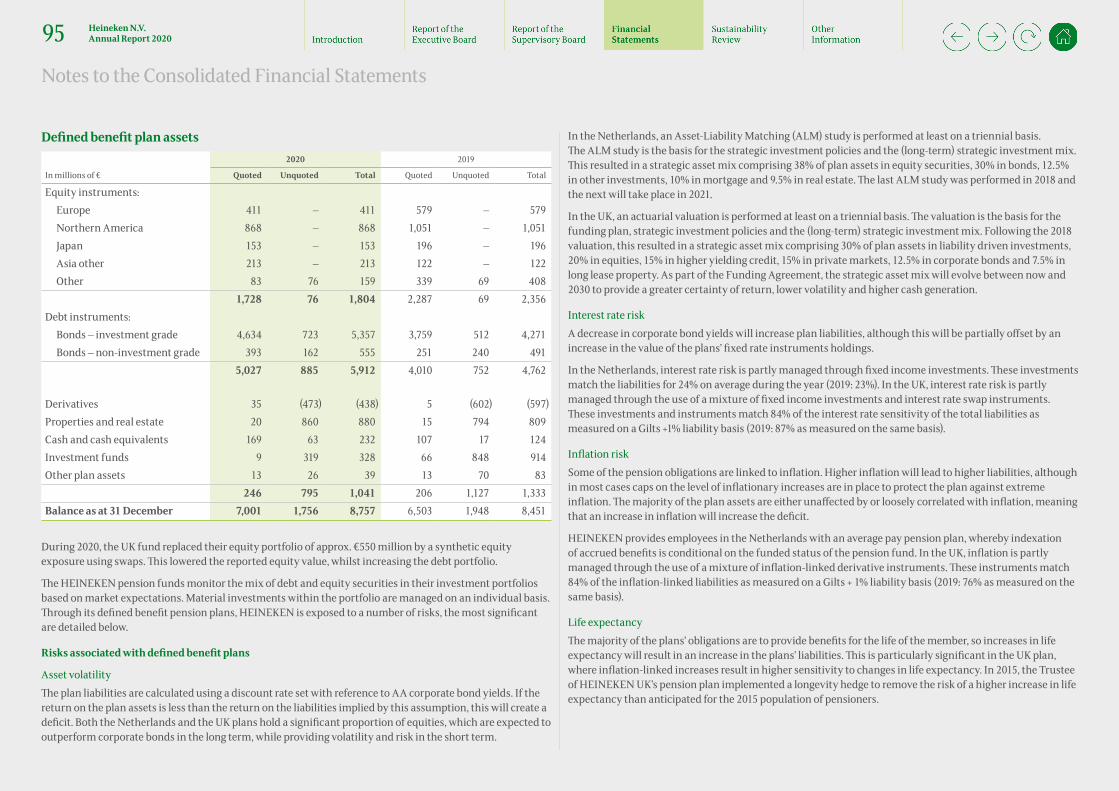
Defined benefit plan assets2020 2019
In millions of € Quoted Unquoted Total Quoted Unquoted Total
Equity instruments:Europe 411 — 411 579 — 579Northern America 868 — 868 1,051 — 1,051Japan 153 — 153 196 — 196Asia other 213 — 213 122 — 122Other 83 76 159 339 69 408
1,728 76 1,804 2,287 69 2,356Debt instruments:
Bonds – investment grade 4,634 723 5,357 3,759 512 4,271Bonds – non-investment grade 393 162 555 251 240 491
5,027 885 5,912 4,010 752 4,762
Derivatives 35 (473) (438) 5 (602) (597)Properties and real estate 20 860 880 15 794 809Cash and cash equivalents 169 63 232 107 17 124Investment funds 9 319 328 66 848 914Other plan assets 13 26 39 13 70 83
246 795 1,041 206 1,127 1,333Balance as at 31 December 7,001 1,756 8,757 6,503 1,948 8,451
During 2020, the UK fund replaced their equity portfolio of approx. €550 million by a synthetic equity exposure using swaps. This lowered the reported equity value, whilst increasing the debt portfolio.
The HEINEKEN pension funds monitor the mix of debt and equity securities in their investment portfolios based on market expectations. Material investments within the portfolio are managed on an individual basis. Through its defined benefit pension plans, HEINEKEN is exposed to a number of risks, the most significant are detailed below.
Risks associated with defined benefit plans
Asset volatility The plan liabilities are calculated using a discount rate set with reference to AA corporate bond yields. If the return on the plan assets is less than the return on the liabilities implied by this assumption, this will create a deficit. Both the Netherlands and the UK plans hold a significant proportion of equities, which are expected to outperform corporate bonds in the long term, while providing volatility and risk in the short term.
In the Netherlands, an Asset-Liability Matching (ALM) study is performed at least on a triennial basis. The ALM study is the basis for the strategic investment policies and the (long-term) strategic investment mix. This resulted in a strategic asset mix comprising 38% of plan assets in equity securities, 30% in bonds, 12.5% in other investments, 10% in mortgage and 9.5% in real estate. The last ALM study was performed in 2018 and the next will take place in 2021.
In the UK, an actuarial valuation is performed at least on a triennial basis. The valuation is the basis for the funding plan, strategic investment policies and the (long-term) strategic investment mix. Following the 2018 valuation, this resulted in a strategic asset mix comprising 30% of plan assets in liability driven investments, 20% in equities, 15% in higher yielding credit, 15% in private markets, 12.5% in corporate bonds and 7.5% in long lease property. As part of the Funding Agreement, the strategic asset mix will evolve between now and 2030 to provide a greater certainty of return, lower volatility and higher cash generation.
Interest rate risk A decrease in corporate bond yields will increase plan liabilities, although this will be partially offset by an increase in the value of the plans’ fixed rate instruments holdings.
In the Netherlands, interest rate risk is partly managed through fixed income investments. These investments match the liabilities for 24% on average during the year (2019: 23%). In the UK, interest rate risk is partly managed through the use of a mixture of fixed income investments and interest rate swap instruments. These investments and instruments match 84% of the interest rate sensitivity of the total liabilities as measured on a Gilts +1% liability basis (2019: 87% as measured on the same basis).
Inflation risk Some of the pension obligations are linked to inflation. Higher inflation will lead to higher liabilities, although in most cases caps on the level of inflationary increases are in place to protect the plan against extreme inflation. The majority of the plan assets are either unaffected by or loosely correlated with inflation, meaning that an increase in inflation will increase the deficit.
HEINEKEN provides employees in the Netherlands with an average pay pension plan, whereby indexation of accrued benefits is conditional on the funded status of the pension fund. In the UK, inflation is partly managed through the use of a mixture of inflation-linked derivative instruments. These instruments match 84% of the inflation-linked liabilities as measured on a Gilts + 1% liability basis (2019: 76% as measured on the same basis).
Life expectancy The majority of the plans’ obligations are to provide benefits for the life of the member, so increases in life expectancy will result in an increase in the plans’ liabilities. This is particularly significant in the UK plan, where inflation-linked increases result in higher sensitivity to changes in life expectancy. In 2015, the Trustee of HEINEKEN UK’s pension plan implemented a longevity hedge to remove the risk of a higher increase in life expectancy than anticipated for the 2015 population of pensioners.
Notes to the Consolidated Financial Statements
95 Heineken N.V. Annual Report 2020

Principal actuarial assumptions as at the balance sheet date Based on the significance of the Dutch and UK pension plans compared with the other plans, the table below refers to the major actuarial assumptions for those two plans as at 31 December:
The Netherlands UK1
In % 2020 2019 2020 2019
Discount rate as at 31 December 0.5 0.9 1.4 2.1Future salary increases 2.0 2.0 — —Future pension increases 0.2 0.5 3.0 2.9
1 The UK plan is closed for future accrual, leading to certain assumptions being equal to zero.
For the other defined benefit plans, the following actuarial assumptions apply as at 31 December:
Europe AmericasAfrica, Middle East &
Eastern Europe
In % 2020 2019 2020 2019 2020 2019
Discount rate as at 31 December 0.2-0.8 0.3-0.9 6.9-12.0 6.8-14.0 0.5-8.0 0.9-12.4Future salary increases 0.0-3.5 0.0-3.5 0.0-4.5 0.0-4.5 0.0-4.0 0.0-5.0Future pension increases 0.0-1.5 0.0-1.5 0.0-3.5 0.0-3.6 0.0-1.2 0.0-2.9Medical cost trend rate 0.0-4.5 0.0-4.5 0.0-15.1 0.0-13.1 0.0-0.0 0.0-0.0
Assumptions regarding future mortality rates are based on published statistics and mortality tables. For the Netherlands, the rates are obtained from the ‘AG-Prognosetafel 2020’, fully generational. For the UK, the future mortality rates are obtained by applying the Continuous Mortality Investigation 2019 projection model.
The weighted average duration of the defined benefit obligation at the end of the reporting period is 18 years.
HEINEKEN expects the contributions to be paid for the defined benefit plans for 2021 to be in line with 2020 excluding the one-off contribution of €80 million for the transitional plan of the Dutch pension fund.
Sensitivity analysis As at 31 December, changes to one of the relevant actuarial assumptions that are considered reasonably possible, holding other assumptions constant, would have affected the defined benefit obligation by the following amounts:
2020 2019
Effect in millions of €Increase in
assumptionDecrease in assumption
Increase in assumption
Decrease in assumption
Discount rate (0.5% movement) (620) 689 (770) 884Future salary growth (0.25% movement) 15 (13) 17 (16)Future pension growth (0.25% movement) 378 (338) 365 (335)Medical cost trend rate (0.5% movement) 6 (5) 6 (5)Life expectancy (1 year) 438 (436) 393 (392)
• Accounting estimates To make the actuarial calculations for the defined benefit plans, HEINEKEN needs to make use of assumptions for discount rates, future pension increases and life expectancy as described in this note. The actuarial calculations are made by external actuaries based on inputs from observable market data, such as corporate bond returns and yield curves to determine the discount rates used, mortality tables to determine life expectancy and inflation numbers to determine future salary and pension growth assumptions.
• Accounting policies
Defined contribution plans A defined contribution plan is a post-retirement plan for which HEINEKEN pays fixed contributions to a separate entity. HEINEKEN has no legal or constructive obligation to pay further contributions if the fund does not hold sufficient assets to pay out employees.
Defined benefit plans A defined benefit plan is a post-retirement plan that is not a defined contribution plan. Typically, defined benefit plans define an amount of pension benefit that an employee will receive on retirement, usually dependent on one or more factors such as age, years of service and compensation.
HEINEKEN’s net obligation in respect of defined benefit pension plans is calculated separately for each plan by estimating the amount of future benefits that employees have earned in return for their service in the current and prior periods; those benefits are discounted to determine its present value. The fair value of any defined benefit plan assets are deducted. The discount rate is the yield at balance sheet date on high-quality credit-rated bonds that have maturity dates approximating to the terms of HEINEKEN’s obligations and that are denominated in the same currency in which the benefits are expected to be paid.
Notes to the Consolidated Financial Statements
96 Heineken N.V. Annual Report 2020
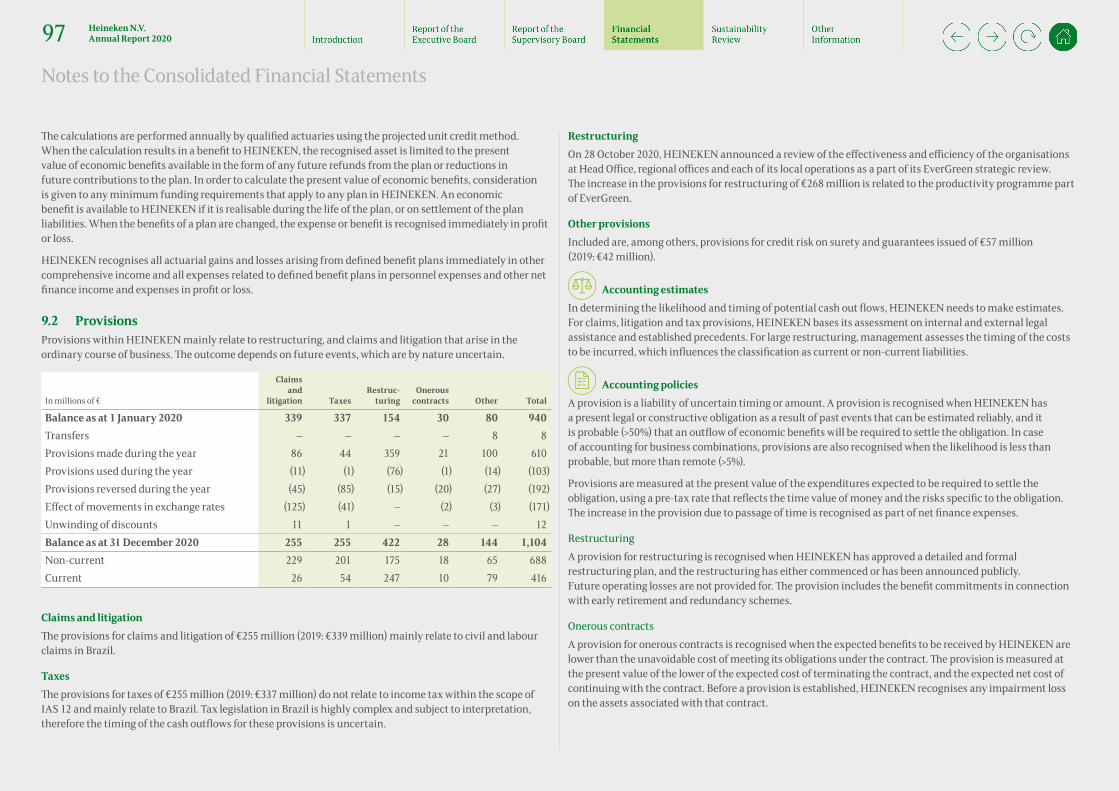
The calculations are performed annually by qualified actuaries using the projected unit credit method. When the calculation results in a benefit to HEINEKEN, the recognised asset is limited to the present value of economic benefits available in the form of any future refunds from the plan or reductions in future contributions to the plan. In order to calculate the present value of economic benefits, consideration is given to any minimum funding requirements that apply to any plan in HEINEKEN. An economic benefit is available to HEINEKEN if it is realisable during the life of the plan, or on settlement of the plan liabilities. When the benefits of a plan are changed, the expense or benefit is recognised immediately in profit or loss.
HEINEKEN recognises all actuarial gains and losses arising from defined benefit plans immediately in other comprehensive income and all expenses related to defined benefit plans in personnel expenses and other net finance income and expenses in profit or loss.
9.2 Provisions Provisions within HEINEKEN mainly relate to restructuring, and claims and litigation that arise in the ordinary course of business. The outcome depends on future events, which are by nature uncertain.
In millions of €
Claims and
litigation TaxesRestruc-
turingOnerous
contracts Other Total
Balance as at 1 January 2020 339 337 154 30 80 940Transfers — — — — 8 8Provisions made during the year 86 44 359 21 100 610Provisions used during the year (11) (1) (76) (1) (14) (103)Provisions reversed during the year (45) (85) (15) (20) (27) (192)Effect of movements in exchange rates (125) (41) — (2) (3) (171)Unwinding of discounts 11 1 — — — 12Balance as at 31 December 2020 255 255 422 28 144 1,104Non-current 229 201 175 18 65 688Current 26 54 247 10 79 416
Claims and litigation The provisions for claims and litigation of €255 million (2019: €339 million) mainly relate to civil and labour claims in Brazil.
Taxes The provisions for taxes of €255 million (2019: €337 million) do not relate to income tax within the scope of IAS 12 and mainly relate to Brazil. Tax legislation in Brazil is highly complex and subject to interpretation, therefore the timing of the cash outflows for these provisions is uncertain.
Restructuring On 28 October 2020, HEINEKEN announced a review of the effectiveness and efficiency of the organisations at Head Office, regional offices and each of its local operations as a part of its EverGreen strategic review. The increase in the provisions for restructuring of €268 million is related to the productivity programme part of EverGreen.
Other provisions Included are, among others, provisions for credit risk on surety and guarantees issued of €57 million (2019: €42 million).
• Accounting estimates In determining the likelihood and timing of potential cash out flows, HEINEKEN needs to make estimates. For claims, litigation and tax provisions, HEINEKEN bases its assessment on internal and external legal assistance and established precedents. For large restructuring, management assesses the timing of the costs to be incurred, which influences the classification as current or non-current liabilities.
• Accounting policies A provision is a liability of uncertain timing or amount. A provision is recognised when HEINEKEN has a present legal or constructive obligation as a result of past events that can be estimated reliably, and it is probable (>50%) that an outflow of economic benefits will be required to settle the obligation. In case of accounting for business combinations, provisions are also recognised when the likelihood is less than probable, but more than remote (>5%).
Provisions are measured at the present value of the expenditures expected to be required to settle the obligation, using a pre-tax rate that reflects the time value of money and the risks specific to the obligation. The increase in the provision due to passage of time is recognised as part of net finance expenses.
Restructuring A provision for restructuring is recognised when HEINEKEN has approved a detailed and formal restructuring plan, and the restructuring has either commenced or has been announced publicly. Future operating losses are not provided for. The provision includes the benefit commitments in connection with early retirement and redundancy schemes.
Onerous contracts A provision for onerous contracts is recognised when the expected benefits to be received by HEINEKEN are lower than the unavoidable cost of meeting its obligations under the contract. The provision is measured at the present value of the lower of the expected cost of terminating the contract, and the expected net cost of continuing with the contract. Before a provision is established, HEINEKEN recognises any impairment loss on the assets associated with that contract.
Notes to the Consolidated Financial Statements
97 Heineken N.V. Annual Report 2020

Other provisions A provision for guarantees is recognised at the time the guarantee is issued. The provision is initially measured at fair value and subsequently at the higher of the amount determined in accordance with the expected credit loss model and the amount initially recognised.
9.3 Contingencies HEINEKEN’s contingencies are mainly in the area of tax, civil cases (part of other contingencies) and guarantees.
Tax The tax contingencies mainly relate to tax positions in Latin America and include a large number of cases with a risk assessment lower than probable but possible. Assessing the amount of tax contingencies, is highly judgemental, and the timing of possible outflows is uncertain. The best estimate of tax related contingent liabilities is €707 million (2019: €957 million), out of which €70 million (2019: €171 million) qualifies for indemnification. For several tax contingencies that were part of acquisitions, an amount of €197 million (2019: €306 million) has been recognised as provisions and other non-current liabilities in the balance sheet (refer to note 9.2 and 11.6).
Other contingencies Other contingencies mainly relate to civil cases in Brazil. Management’s best estimate of the potential financial impact for these cases is €27 million (2019: €39 million). As at 31 December 2020, €15 million (2019: €23 million) of other contingencies related to acquisitions is included in provisions (refer to note 9.2).
Guarantees
In millions of € Total 2020 Less than 1 year 1-5 yearsMore than 5
years Total 2019
Guarantees to banks for loans (to third parties)
330 47 278 5 332
Other guarantees 865 426 229 210 1,019Guarantees 1,195 473 507 215 1,351
Guarantees to banks for loans relate to loans and advances to customers, which are given to external parties in the ordinary course of business of HEINEKEN. HEINEKEN provides guarantees to the banks to cover the risk related to these loans.
• Accounting estimates and judgementsHEINEKEN operates in a high number of jurisdictions, and is subject to a wide variety of taxes per jurisdiction. Tax legislation can be highly complex and subject to interpretation. As a result, HEINEKEN is required to exercise significant judgement in the recognition of taxes payable and determination of tax contingencies.
Also for the other contingencies, HEINEKEN is required to exercise significant judgement to determine whether the risk of loss is possible but not probable. Contingencies involve inherent uncertainties including, but not limited to, court rulings, negotiations between affected parties and governmental actions.
• Accounting policies A contingent liability is a liability of uncertain timing and amount. Contingencies are not recognised in the balance sheet because the existence can only be confirmed by occurrence or non-occurrence of one or more uncertain future events not wholly within the control of HEINEKEN or because the risk of loss is estimated to be possible (>5%) but not probable (<50%) or because the amount cannot be measured reliably.
Notes to the Consolidated Financial Statements
98 Heineken N.V. Annual Report 2020
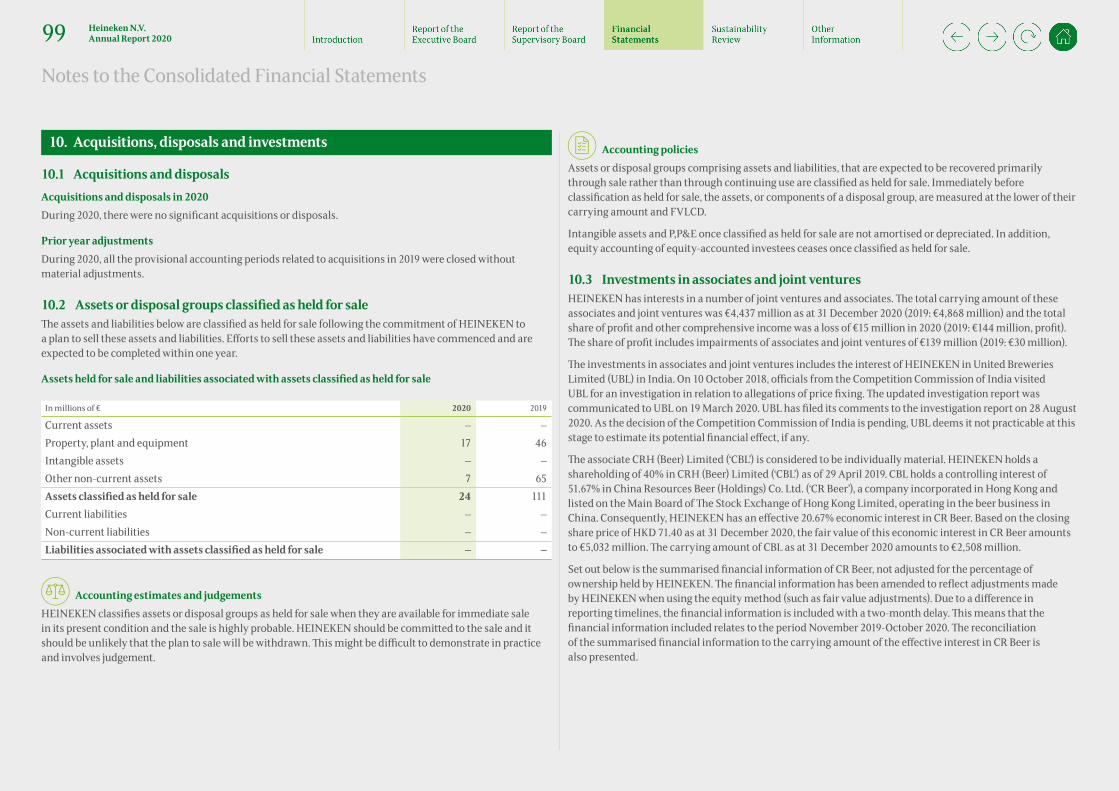
10. Acquisitions, disposals and investments
10.1 Acquisitions and disposals Acquisitions and disposals in 2020 During 2020, there were no significant acquisitions or disposals.
Prior year adjustments During 2020, all the provisional accounting periods related to acquisitions in 2019 were closed without material adjustments.
10.2 Assets or disposal groups classified as held for saleThe assets and liabilities below are classified as held for sale following the commitment of HEINEKEN to a plan to sell these assets and liabilities. Efforts to sell these assets and liabilities have commenced and are expected to be completed within one year.
Assets held for sale and liabilities associated with assets classified as held for sale
In millions of € 2020 2019
Current assets — —Property, plant and equipment 17 46Intangible assets — —Other non-current assets 7 65Assets classified as held for sale 24 111Current liabilities — —Non-current liabilities — —Liabilities associated with assets classified as held for sale — —
• Accounting estimates and judgements HEINEKEN classifies assets or disposal groups as held for sale when they are available for immediate sale in its present condition and the sale is highly probable. HEINEKEN should be committed to the sale and it should be unlikely that the plan to sale will be withdrawn. This might be difficult to demonstrate in practice and involves judgement.
• Accounting policies Assets or disposal groups comprising assets and liabilities, that are expected to be recovered primarily through sale rather than through continuing use are classified as held for sale. Immediately before classification as held for sale, the assets, or components of a disposal group, are measured at the lower of their carrying amount and FVLCD.
Intangible assets and P,P&E once classified as held for sale are not amortised or depreciated. In addition, equity accounting of equity-accounted investees ceases once classified as held for sale.
10.3 Investments in associates and joint ventures HEINEKEN has interests in a number of joint ventures and associates. The total carrying amount of these associates and joint ventures was €4,437 million as at 31 December 2020 (2019: €4,868 million) and the total share of profit and other comprehensive income was a loss of €15 million in 2020 (2019: €144 million, profit). The share of profit includes impairments of associates and joint ventures of €139 million (2019: €30 million).
The investments in associates and joint ventures includes the interest of HEINEKEN in United Breweries Limited (UBL) in India. On 10 October 2018, officials from the Competition Commission of India visited UBL for an investigation in relation to allegations of price fixing. The updated investigation report was communicated to UBL on 19 March 2020. UBL has filed its comments to the investigation report on 28 August 2020. As the decision of the Competition Commission of India is pending, UBL deems it not practicable at this stage to estimate its potential financial effect, if any.
The associate CRH (Beer) Limited (‘CBL’) is considered to be individually material. HEINEKEN holds a shareholding of 40% in CRH (Beer) Limited (‘CBL’) as of 29 April 2019. CBL holds a controlling interest of 51.67% in China Resources Beer (Holdings) Co. Ltd. (‘CR Beer’), a company incorporated in Hong Kong and listed on the Main Board of The Stock Exchange of Hong Kong Limited, operating in the beer business in China. Consequently, HEINEKEN has an effective 20.67% economic interest in CR Beer. Based on the closing share price of HKD 71.40 as at 31 December 2020, the fair value of this economic interest in CR Beer amounts to €5,032 million. The carrying amount of CBL as at 31 December 2020 amounts to €2,508 million.
Set out below is the summarised financial information of CR Beer, not adjusted for the percentage of ownership held by HEINEKEN. The financial information has been amended to reflect adjustments made by HEINEKEN when using the equity method (such as fair value adjustments). Due to a difference in reporting timelines, the financial information is included with a two-month delay. This means that the financial information included relates to the period November 2019-October 2020. The reconciliation of the summarised financial information to the carrying amount of the effective interest in CR Beer is also presented.
Notes to the Consolidated Financial Statements
99 Heineken N.V. Annual Report 2020
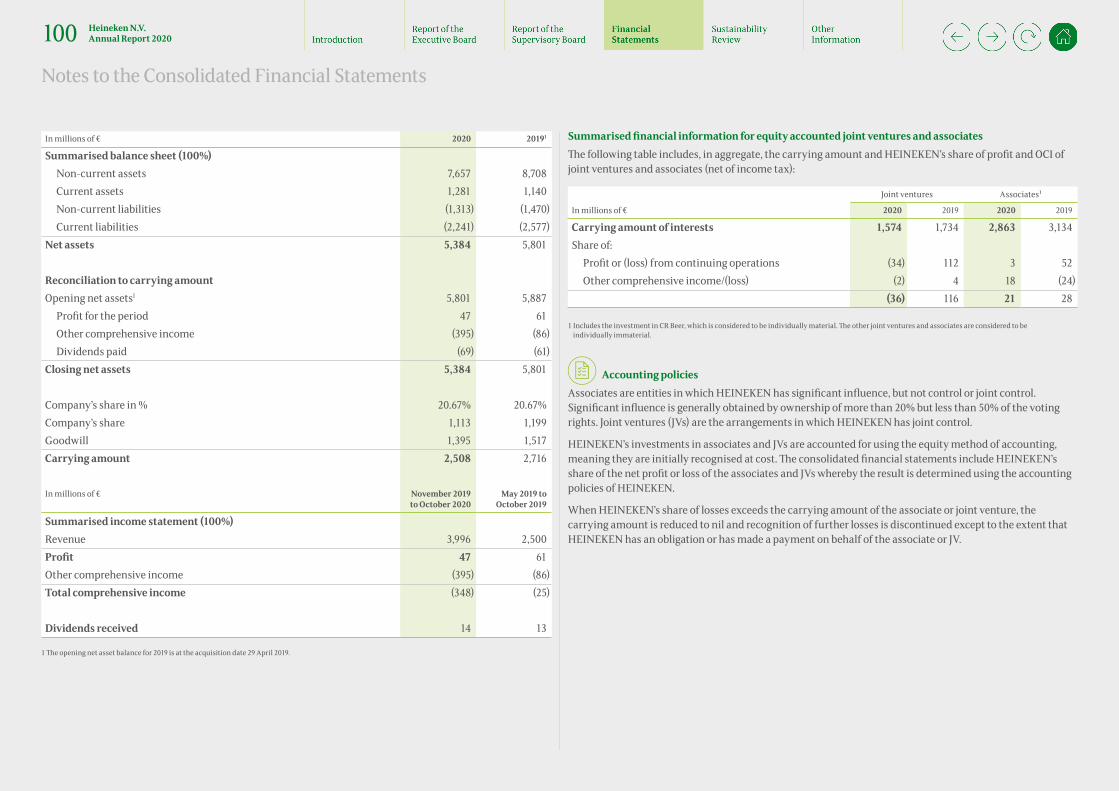
In millions of € 2020 20191
Summarised balance sheet (100%)Non-current assets 7,657 8,708Current assets 1,281 1,140Non-current liabilities (1,313) (1,470)Current liabilities (2,241) (2,577)
Net assets 5,384 5,801
Reconciliation to carrying amountOpening net assets1 5,801 5,887
Profit for the period 47 61Other comprehensive income (395) (86)Dividends paid (69) (61)
Closing net assets 5,384 5,801
Company’s share in % 20.67% 20.67%Company’s share 1,113 1,199Goodwill 1,395 1,517Carrying amount 2,508 2,716
In millions of € November 2019 to October 2020
May 2019 to October 2019
Summarised income statement (100%)Revenue 3,996 2,500Profit 47 61Other comprehensive income (395) (86)Total comprehensive income (348) (25)
Dividends received 14 13
1 The opening net asset balance for 2019 is at the acquisition date 29 April 2019.
Summarised financial information for equity accounted joint ventures and associates The following table includes, in aggregate, the carrying amount and HEINEKEN’s share of profit and OCI of joint ventures and associates (net of income tax):
Joint ventures Associates¹
In millions of € 2020 2019 2020 2019
Carrying amount of interests 1,574 1,734 2,863 3,134Share of:
Profit or (loss) from continuing operations (34) 112 3 52Other comprehensive income/(loss) (2) 4 18 (24)
(36) 116 21 28
1 Includes the investment in CR Beer, which is considered to be individually material. The other joint ventures and associates are considered to be individually immaterial.
• Accounting policies Associates are entities in which HEINEKEN has significant influence, but not control or joint control. Significant influence is generally obtained by ownership of more than 20% but less than 50% of the voting rights. Joint ventures (JVs) are the arrangements in which HEINEKEN has joint control.
HEINEKEN’s investments in associates and JVs are accounted for using the equity method of accounting, meaning they are initially recognised at cost. The consolidated financial statements include HEINEKEN’s share of the net profit or loss of the associates and JVs whereby the result is determined using the accounting policies of HEINEKEN.
When HEINEKEN’s share of losses exceeds the carrying amount of the associate or joint venture, the carrying amount is reduced to nil and recognition of further losses is discontinued except to the extent that HEINEKEN has an obligation or has made a payment on behalf of the associate or JV.
Notes to the Consolidated Financial Statements
100 Heineken N.V. Annual Report 2020
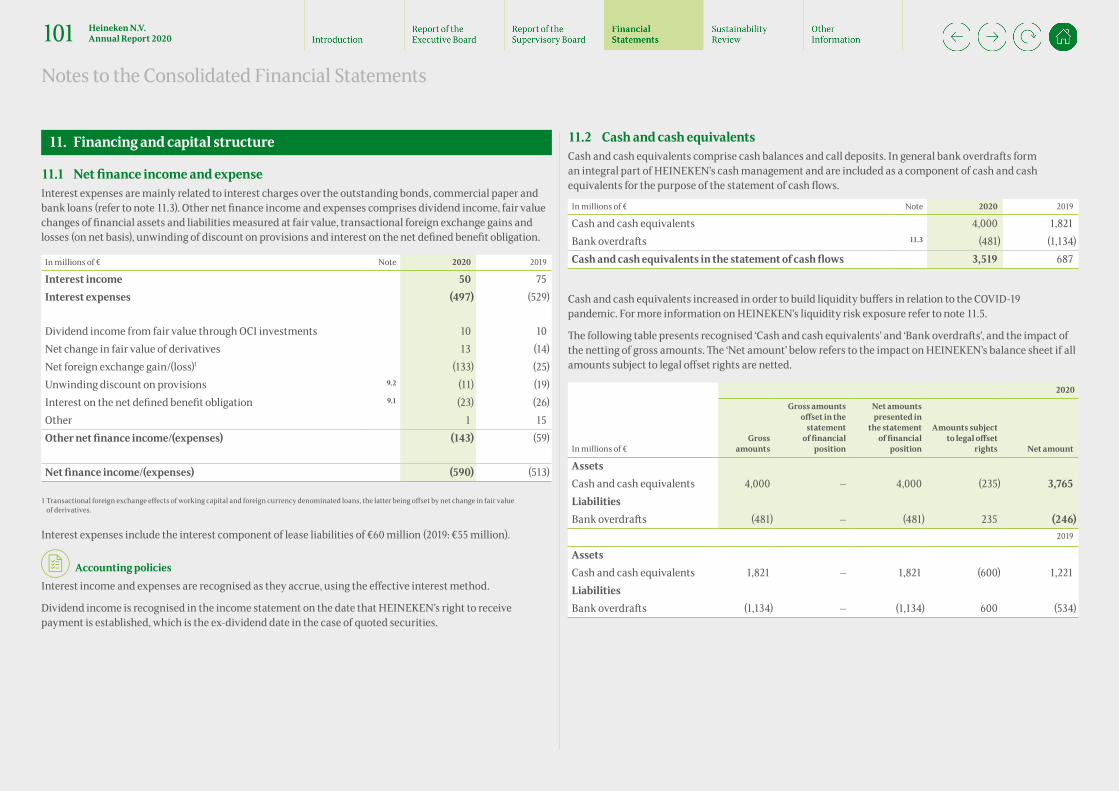
11. Financing and capital structure
11.1 Net finance income and expense Interest expenses are mainly related to interest charges over the outstanding bonds, commercial paper and bank loans (refer to note 11.3). Other net finance income and expenses comprises dividend income, fair value changes of financial assets and liabilities measured at fair value, transactional foreign exchange gains and losses (on net basis), unwinding of discount on provisions and interest on the net defined benefit obligation.
In millions of € Note 2020 2019
Interest income 50 75Interest expenses (497) (529)
Dividend income from fair value through OCI investments 10 10Net change in fair value of derivatives 13 (14)Net foreign exchange gain/(loss)1 (133) (25)Unwinding discount on provisions 9.2 (11) (19)Interest on the net defined benefit obligation 9.1 (23) (26)Other 1 15Other net finance income/(expenses) (143) (59)
Net finance income/(expenses) (590) (513)
1 Transactional foreign exchange effects of working capital and foreign currency denominated loans, the latter being offset by net change in fair value of derivatives.
Interest expenses include the interest component of lease liabilities of €60 million (2019: €55 million).
• Accounting policies Interest income and expenses are recognised as they accrue, using the effective interest method.
Dividend income is recognised in the income statement on the date that HEINEKEN’s right to receive payment is established, which is the ex-dividend date in the case of quoted securities.
11.2 Cash and cash equivalents Cash and cash equivalents comprise cash balances and call deposits. In general bank overdrafts form an integral part of HEINEKEN’s cash management and are included as a component of cash and cash equivalents for the purpose of the statement of cash flows.
In millions of € Note 2020 2019
Cash and cash equivalents 4,000 1,821Bank overdrafts 11.3 (481) (1,134)Cash and cash equivalents in the statement of cash flows 3,519 687
Cash and cash equivalents increased in order to build liquidity buffers in relation to the COVID-19 pandemic. For more information on HEINEKEN’s liquidity risk exposure refer to note 11.5.
The following table presents recognised ‘Cash and cash equivalents’ and ‘Bank overdrafts’, and the impact of the netting of gross amounts. The ‘Net amount’ below refers to the impact on HEINEKEN’s balance sheet if all amounts subject to legal offset rights are netted.
2020
In millions of €Gross
amounts
Gross amounts offset in the
statement of financial
position
Net amounts presented in
the statement of financial
position
Amounts subject to legal offset
rights Net amount
AssetsCash and cash equivalents 4,000 — 4,000 (235) 3,765LiabilitiesBank overdrafts (481) — (481) 235 (246)
2019
AssetsCash and cash equivalents 1,821 — 1,821 (600) 1,221LiabilitiesBank overdrafts (1,134) — (1,134) 600 (534)
Notes to the Consolidated Financial Statements
101 Heineken N.V. Annual Report 2020

HEINEKEN operates in a number of territories where there is limited availability of foreign currency resulting in restrictions on remittances. Mainly as a result of these restrictions, €373 million (2019: €342 million) of cash included in cash and cash equivalents is restricted for use by the Company, yet available for use in the relevant subsidiary’s day-to-day operations.
• Accounting policies Cash and cash equivalents are initially recognised at fair value and subsequently at amortised cost.
HEINEKEN has cash pooling arrangements with legally enforceable rights to offset cash and overdraft balances. Where there is an intention to settle on a net basis, cash and overdraft balances relating to the cash pooling arrangements are reported on a net basis in the statement of financial position.
11.3 Borrowings HEINEKEN mainly uses bonds, commercial paper and bank loans to ensure sufficient financing to support its operations. Net interest-bearing debt is the key metric for HEINEKEN to measure its indebtedness.
2020 2019
In millions of € NoteNon-
current Current Total Non-current Current Total
Unsecured bond issues 13,242 1,200 14,442 11,774 1,014 12,788Lease liabilities 936 263 1,199 1,003 255 1,258Bank loans 374 38 412 462 22 484Other interest-bearing liabilities
64 983 1,047 127 568 695
Deposits from third parties1 — 615 615 — 693 693Bank overdrafts — 481 481 — 1,134 1,134Total borrowings 14,616 3,580 18,196 13,366 3,686 17,052Market value of cross-currency interest rate swaps
11.5 14 28
Cash and cash equivalents 11.2 (4,000) (1,821)Net interest-bearing debt position
14,210 15,259
1 Mainly employee deposits.
As at 31 December 2020, €106 million of the €412 million of bank loans is secured (2019:€103 million). Other interest-bearing liabilities includes €698 million of centrally issued commercial paper (2019: €532 million).
In millions of €Unsecured
bond issuesLease
liabilities Bank loans
Other interest-
bearing liabilities
Deposits from third
parties
Derivatives used for
financing activities
Assets and liabilities
used for financing activities
Balance as at 1 January 2020
12,788 1,258 484 695 693 28 15,946
Consolidation changes — 2 (47) (24) — — (69)Effect of movements in exchange rates
(314) (83) (21) (63) (4) (19) (504)
Addition of leases — 341 — — — — 341Proceeds 2,973 — 290 2,748 21 5 6,037(Re)payments (1,016) (281) (295) (2,300) (90) — (3,982)Interest paid over lease liability
— (60) — — — — (60)
Other 11 22 1 (9) (5) — 20Balance as at 31 December 2020
14,442 1,199 412 1,047 615 14 17,729
In millions of €Unsecured
bond issuesLease
liabilities Bank loans
Other interest-bearing
liabilities
Deposits from third
parties
Derivatives used for
financing activities
Assets and liabilities
used for financing activities
Balance as at 1 January 2019
13,150 — 326 177 678 (2) 14,329
Policy changes — 1,252 — — — — 1,252Consolidation changes — 4 15 8 — — 27Effect of movements in exchange rates
97 29 (1) — 1 38 164
Addition of leases — 268 — — — — 268Proceeds 516 — 335 1,339 98 — 2,288(Re)payments (984) (259) (189) (832) (105) (8) (2,377)Transfer to liabilities held for sale
— (4) — — — — (4)
Interest paid over lease liability
— (55) — — — — (55)
Other 9 23 (2) 3 21 — 54Balance as at 31 December 2019
12,788 1,258 484 695 693 28 15,946
Notes to the Consolidated Financial Statements
102 Heineken N.V. Annual Report 2020
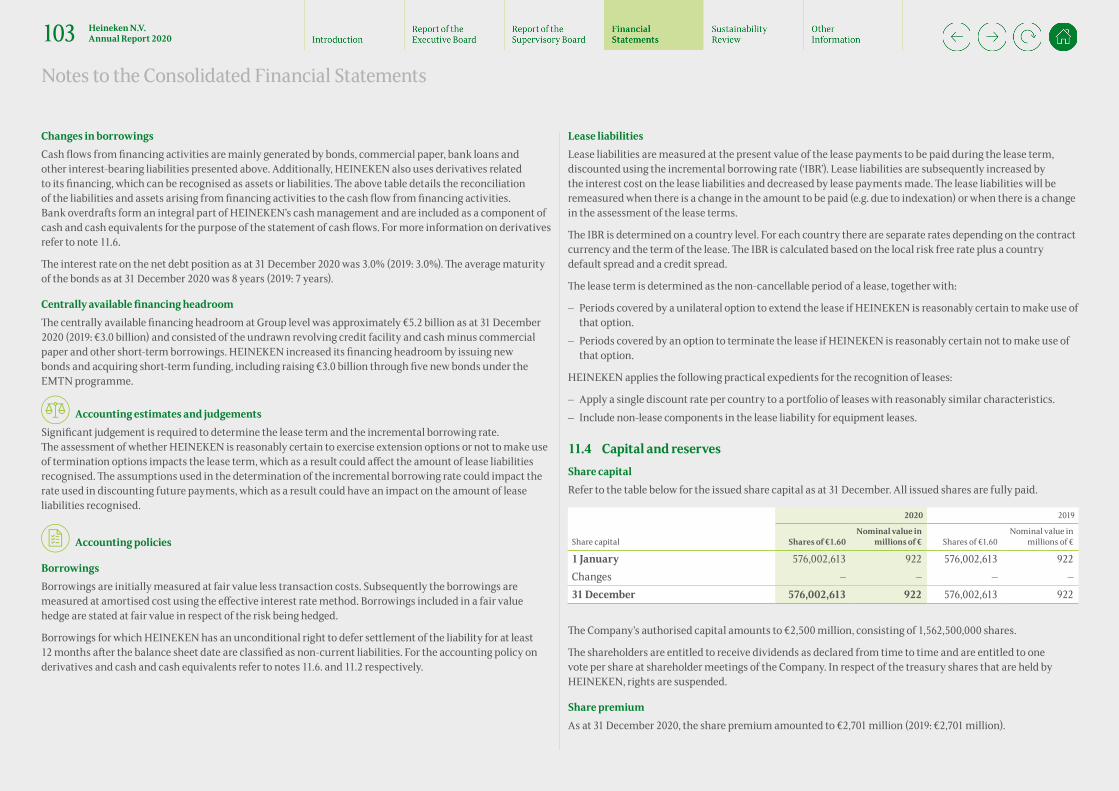
Changes in borrowings Cash flows from financing activities are mainly generated by bonds, commercial paper, bank loans and other interest-bearing liabilities presented above. Additionally, HEINEKEN also uses derivatives related to its financing, which can be recognised as assets or liabilities. The above table details the reconciliation of the liabilities and assets arising from financing activities to the cash flow from financing activities. Bank overdrafts form an integral part of HEINEKEN’s cash management and are included as a component of cash and cash equivalents for the purpose of the statement of cash flows. For more information on derivatives refer to note 11.6.
The interest rate on the net debt position as at 31 December 2020 was 3.0% (2019: 3.0%). The average maturity of the bonds as at 31 December 2020 was 8 years (2019: 7 years).
Centrally available financing headroom
The centrally available financing headroom at Group level was approximately €5.2 billion as at 31 December 2020 (2019: €3.0 billion) and consisted of the undrawn revolving credit facility and cash minus commercial paper and other short-term borrowings. HEINEKEN increased its financing headroom by issuing new bonds and acquiring short-term funding, including raising €3.0 billion through five new bonds under the EMTN programme.
• Accounting estimates and judgementsSignificant judgement is required to determine the lease term and the incremental borrowing rate. The assessment of whether HEINEKEN is reasonably certain to exercise extension options or not to make use of termination options impacts the lease term, which as a result could affect the amount of lease liabilities recognised. The assumptions used in the determination of the incremental borrowing rate could impact the rate used in discounting future payments, which as a result could have an impact on the amount of lease liabilities recognised.
• Accounting policies
Borrowings Borrowings are initially measured at fair value less transaction costs. Subsequently the borrowings are measured at amortised cost using the effective interest rate method. Borrowings included in a fair value hedge are stated at fair value in respect of the risk being hedged.
Borrowings for which HEINEKEN has an unconditional right to defer settlement of the liability for at least 12 months after the balance sheet date are classified as non-current liabilities. For the accounting policy on derivatives and cash and cash equivalents refer to notes 11.6. and 11.2 respectively.
Lease liabilities Lease liabilities are measured at the present value of the lease payments to be paid during the lease term, discounted using the incremental borrowing rate (‘IBR’). Lease liabilities are subsequently increased by the interest cost on the lease liabilities and decreased by lease payments made. The lease liabilities will be remeasured when there is a change in the amount to be paid (e.g. due to indexation) or when there is a change in the assessment of the lease terms.
The IBR is determined on a country level. For each country there are separate rates depending on the contract currency and the term of the lease. The IBR is calculated based on the local risk free rate plus a country default spread and a credit spread.
The lease term is determined as the non-cancellable period of a lease, together with:
– Periods covered by a unilateral option to extend the lease if HEINEKEN is reasonably certain to make use ofthat option.
– Periods covered by an option to terminate the lease if HEINEKEN is reasonably certain not to make use ofthat option.
HEINEKEN applies the following practical expedients for the recognition of leases:
– Apply a single discount rate per country to a portfolio of leases with reasonably similar characteristics. – Include non-lease components in the lease liability for equipment leases.
11.4 Capital and reserves Share capital Refer to the table below for the issued share capital as at 31 December. All issued shares are fully paid.
2020 2019
Share capital Shares of €1.60Nominal value in
millions of € Shares of €1.60Nominal value in
millions of €
1 January 576,002,613 922 576,002,613 922Changes — — — —31 December 576,002,613 922 576,002,613 922
The Company’s authorised capital amounts to €2,500 million, consisting of 1,562,500,000 shares.
The shareholders are entitled to receive dividends as declared from time to time and are entitled to one vote per share at shareholder meetings of the Company. In respect of the treasury shares that are held by HEINEKEN, rights are suspended.
Share premium As at 31 December 2020, the share premium amounted to €2,701 million (2019: €2,701 million).
Notes to the Consolidated Financial Statements
103 Heineken N.V. Annual Report 2020
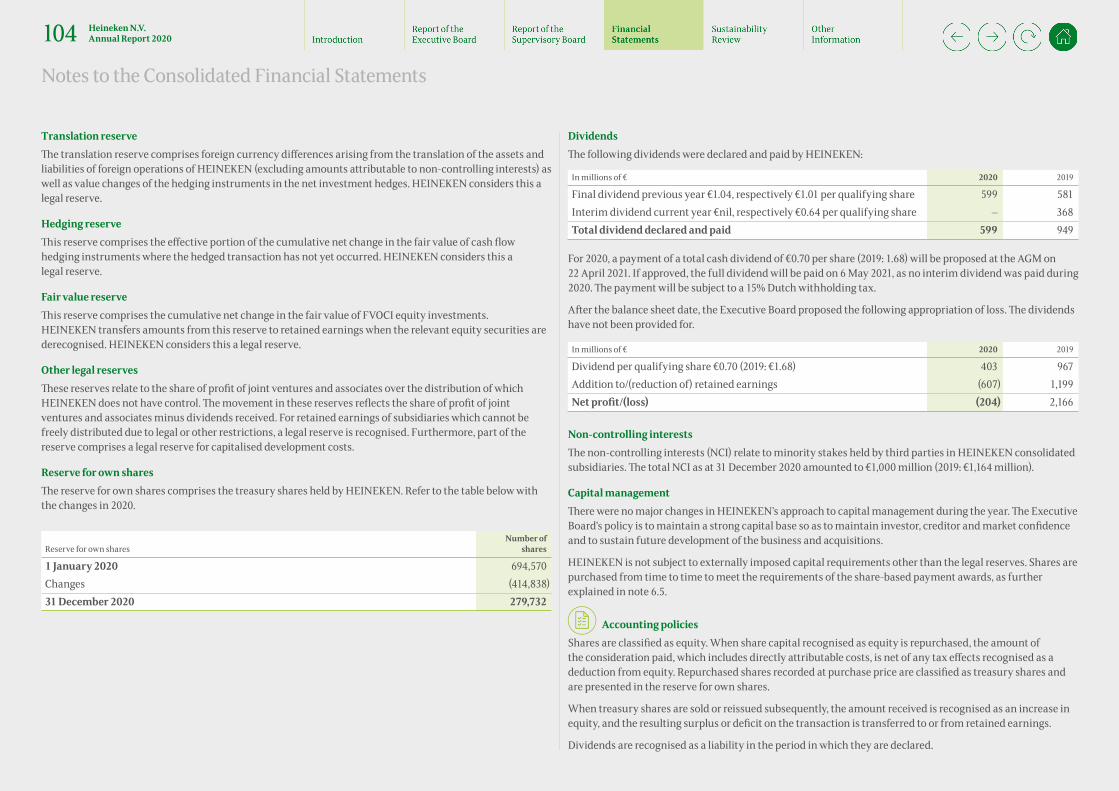
Translation reserve The translation reserve comprises foreign currency differences arising from the translation of the assets and liabilities of foreign operations of HEINEKEN (excluding amounts attributable to non-controlling interests) as well as value changes of the hedging instruments in the net investment hedges. HEINEKEN considers this a legal reserve.
Hedging reserve This reserve comprises the effective portion of the cumulative net change in the fair value of cash flow hedging instruments where the hedged transaction has not yet occurred. HEINEKEN considers this a legal reserve.
Fair value reserve This reserve comprises the cumulative net change in the fair value of FVOCI equity investments. HEINEKEN transfers amounts from this reserve to retained earnings when the relevant equity securities are derecognised. HEINEKEN considers this a legal reserve.
Other legal reserves These reserves relate to the share of profit of joint ventures and associates over the distribution of which HEINEKEN does not have control. The movement in these reserves reflects the share of profit of joint ventures and associates minus dividends received. For retained earnings of subsidiaries which cannot be freely distributed due to legal or other restrictions, a legal reserve is recognised. Furthermore, part of the reserve comprises a legal reserve for capitalised development costs.
Reserve for own shares The reserve for own shares comprises the treasury shares held by HEINEKEN. Refer to the table below with the changes in 2020.
Reserve for own sharesNumber of
shares
1 January 2020 694,570Changes (414,838)31 December 2020 279,732
Dividends The following dividends were declared and paid by HEINEKEN:
In millions of € 2020 2019
Final dividend previous year €1.04, respectively €1.01 per qualifying share 599 581Interim dividend current year €nil, respectively €0.64 per qualifying share — 368Total dividend declared and paid 599 949
For 2020, a payment of a total cash dividend of €0.70 per share (2019: 1.68) will be proposed at the AGM on 22 April 2021. If approved, the full dividend will be paid on 6 May 2021, as no interim dividend was paid during 2020. The payment will be subject to a 15% Dutch withholding tax.
After the balance sheet date, the Executive Board proposed the following appropriation of loss. The dividends have not been provided for.
In millions of € 2020 2019
Dividend per qualifying share €0.70 (2019: €1.68) 403 967Addition to/(reduction of) retained earnings (607) 1,199Net profit/(loss) (204) 2,166
Non-controlling interests The non-controlling interests (NCI) relate to minority stakes held by third parties in HEINEKEN consolidated subsidiaries. The total NCI as at 31 December 2020 amounted to €1,000 million (2019: €1,164 million).
Capital management There were no major changes in HEINEKEN’s approach to capital management during the year. The Executive Board’s policy is to maintain a strong capital base so as to maintain investor, creditor and market confidence and to sustain future development of the business and acquisitions.
HEINEKEN is not subject to externally imposed capital requirements other than the legal reserves. Shares are purchased from time to time to meet the requirements of the share-based payment awards, as further explained in note 6.5.
• Accounting policies Shares are classified as equity. When share capital recognised as equity is repurchased, the amount of the consideration paid, which includes directly attributable costs, is net of any tax effects recognised as a deduction from equity. Repurchased shares recorded at purchase price are classified as treasury shares and are presented in the reserve for own shares.
When treasury shares are sold or reissued subsequently, the amount received is recognised as an increase in equity, and the resulting surplus or deficit on the transaction is transferred to or from retained earnings.
Dividends are recognised as a liability in the period in which they are declared.
Notes to the Consolidated Financial Statements
104 Heineken N.V. Annual Report 2020
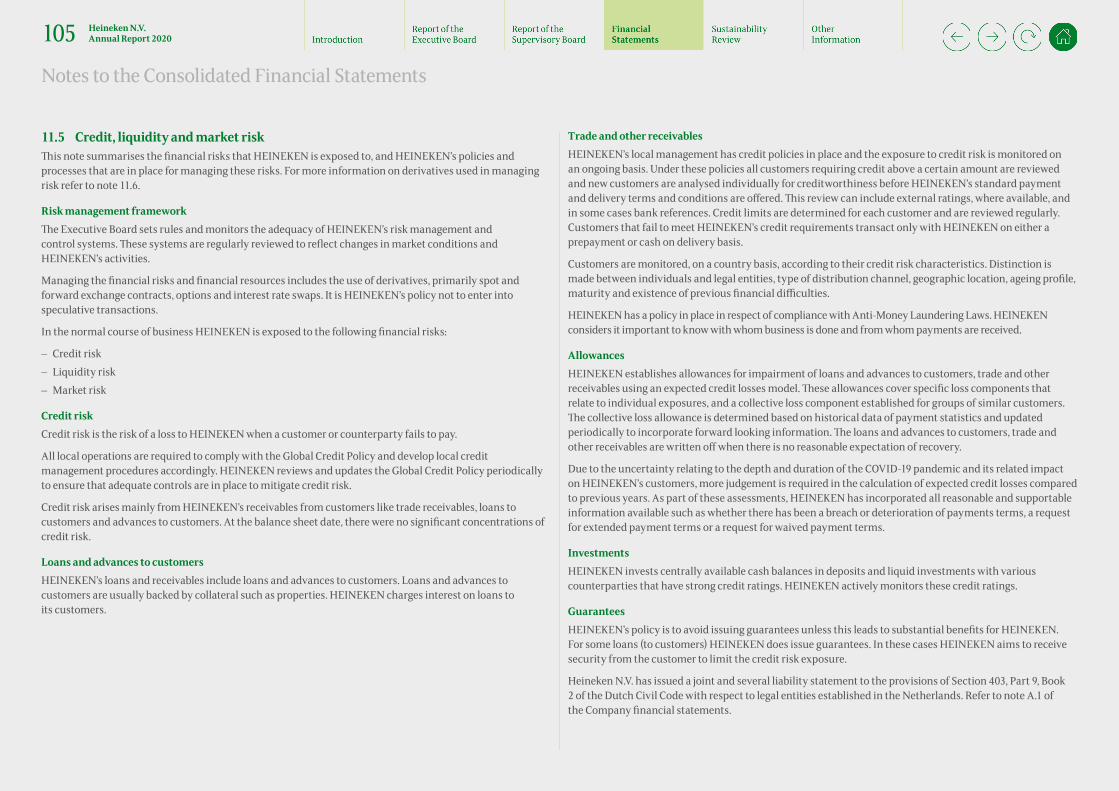
11.5 Credit, liquidity and market risk This note summarises the financial risks that HEINEKEN is exposed to, and HEINEKEN’s policies and processes that are in place for managing these risks. For more information on derivatives used in managing risk refer to note 11.6.
Risk management framework The Executive Board sets rules and monitors the adequacy of HEINEKEN’s risk management and control systems. These systems are regularly reviewed to reflect changes in market conditions and HEINEKEN’s activities.
Managing the financial risks and financial resources includes the use of derivatives, primarily spot and forward exchange contracts, options and interest rate swaps. It is HEINEKEN’s policy not to enter into speculative transactions.
In the normal course of business HEINEKEN is exposed to the following financial risks:
– Credit risk – Liquidity risk – Market risk
Credit risk Credit risk is the risk of a loss to HEINEKEN when a customer or counterparty fails to pay.
All local operations are required to comply with the Global Credit Policy and develop local credit management procedures accordingly. HEINEKEN reviews and updates the Global Credit Policy periodically to ensure that adequate controls are in place to mitigate credit risk.
Credit risk arises mainly from HEINEKEN’s receivables from customers like trade receivables, loans to customers and advances to customers. At the balance sheet date, there were no significant concentrations of credit risk.
Loans and advances to customers HEINEKEN’s loans and receivables include loans and advances to customers. Loans and advances to customers are usually backed by collateral such as properties. HEINEKEN charges interest on loans to its customers.
Trade and other receivables HEINEKEN’s local management has credit policies in place and the exposure to credit risk is monitored on an ongoing basis. Under these policies all customers requiring credit above a certain amount are reviewed and new customers are analysed individually for creditworthiness before HEINEKEN’s standard payment and delivery terms and conditions are offered. This review can include external ratings, where available, and in some cases bank references. Credit limits are determined for each customer and are reviewed regularly. Customers that fail to meet HEINEKEN’s credit requirements transact only with HEINEKEN on either a prepayment or cash on delivery basis.
Customers are monitored, on a country basis, according to their credit risk characteristics. Distinction is made between individuals and legal entities, type of distribution channel, geographic location, ageing profile, maturity and existence of previous financial difficulties.
HEINEKEN has a policy in place in respect of compliance with Anti-Money Laundering Laws. HEINEKEN considers it important to know with whom business is done and from whom payments are received.
Allowances HEINEKEN establishes allowances for impairment of loans and advances to customers, trade and other receivables using an expected credit losses model. These allowances cover specific loss components that relate to individual exposures, and a collective loss component established for groups of similar customers. The collective loss allowance is determined based on historical data of payment statistics and updated periodically to incorporate forward looking information. The loans and advances to customers, trade and other receivables are written off when there is no reasonable expectation of recovery.
Due to the uncertainty relating to the depth and duration of the COVID-19 pandemic and its related impact on HEINEKEN’s customers, more judgement is required in the calculation of expected credit losses compared to previous years. As part of these assessments, HEINEKEN has incorporated all reasonable and supportable information available such as whether there has been a breach or deterioration of payments terms, a request for extended payment terms or a request for waived payment terms.
Investments HEINEKEN invests centrally available cash balances in deposits and liquid investments with various counterparties that have strong credit ratings. HEINEKEN actively monitors these credit ratings.
Guarantees HEINEKEN’s policy is to avoid issuing guarantees unless this leads to substantial benefits for HEINEKEN. For some loans (to customers) HEINEKEN does issue guarantees. In these cases HEINEKEN aims to receive security from the customer to limit the credit risk exposure.
Heineken N.V. has issued a joint and several liability statement to the provisions of Section 403, Part 9, Book 2 of the Dutch Civil Code with respect to legal entities established in the Netherlands. Refer to note A.1 of the Company financial statements.
Notes to the Consolidated Financial Statements
105 Heineken N.V. Annual Report 2020

Exposure to credit risk The maximum exposure to credit risk as at 31 December is as follows:
In millions of € Note 2020 2019
Cash and cash equivalents 11.2 4,000 1,821Trade and other receivables, excluding prepayments 7.2 2,424 3,738Derivative assets 11.6 98 30Fair value through OCI investments 8.5 13 408Loans and advances to customers 8.4 194 277Other non-current receivables 8.5 307 406Guarantees to banks for loans (to third parties) 9.3 330 332
7,366 7,012
The exposure to credit risk by geographic region for trade and other receivables excluding prepayments is as follows:
2020 2019
174
1,049
675
284242
106
1,590
1,056
518
468
5,000
4,000
3,000
2,000
1,000
0
In m
illio
ns o
f €
Europe Americas Africa, Middle East & Eastern Europe Asia Pacific Head O�ce and Other/eliminations
Exposure to credit risk
Liquidity risk Liquidity risk is the risk that HEINEKEN will have difficulties to meet payment obligations associated with its financial liabilities, like payment of financial debt or trade payables when they are due. HEINEKEN’s approach to managing liquidity is to ensure, as far as possible, that it will always have sufficient funds to meet its liabilities when due without incurring unacceptable losses. As a result of the COVID-19 pandemic, there is increased attention for and monitoring of risks associated with working capital that might impact liquidity.
HEINEKEN remains focused on ensuring sufficient access to capital markets to finance long-term growth and to refinance maturing debt obligations. HEINEKEN seeks to align the maturity profile of its long-term debts with its forecasted cash flow generation. More information about borrowing facilities is presented in note 11.3. Furthermore, strong cost and cash management as well as controls over investment proposals are in place.
Contractual maturities The following table presents an overview of the expected timing of cash-out and inflows of non-derivative financial liabilities and derivative financial assets and liabilities, including interest payments.
2020
In millions of €Carrying
amountContractual
cash flowsLess than
1 year 1-5 yearsMore than
5 years
Financial liabilitiesInterest-bearing liabilities (16,997) (20,067) (3,672) (5,899) (10,496)Lease liabilities (1,199) (1,684) (314) (706) (664)Trade and other payables and returnable packaging deposits (excluding interest payable, dividends and including non-current part)
(6,392) (6,392) (6,347) (25) (19)
Derivative financial assets and (liabilities)Cross currency interest rate swaps (14) (61) 8 (62) (7)Forward exchange contracts 4 (12) (12) — —Commodity derivatives 18 18 18 — —Other derivatives 3 16 1 4 11Total (24,577) (28,182) (10,318) (6,688) (11,175)
2019
Financial liabilitiesInterest-bearing liabilities (15,793) (18,653) (3,831) (5,434) (9,388)Lease liabilities (1,258) (1,861) (304) (683) (874)Trade and other payables and returnable packaging deposits (excluding interest payable, dividends and including non-current part)
(7,972) (7,971) (7,846) (91) (34)
Derivative financial assets and (liabilities)Cross currency interest rate swaps (28) (97) (8) (26) (63)Forward exchange contracts (29) (54) (53) (1) —Commodity derivatives (5) (5) (5) — —Other derivatives 2 2 2 — —Total (25,083) (28,639) (12,045) (6,235) (10,359)
For more information on the derivative assets and liabilities refer to note 11.6.
Notes to the Consolidated Financial Statements
106 Heineken N.V. Annual Report 2020

Market risk Market risk is the risk that changes in market prices, such as foreign exchange rates, interest rates, commodity prices and equity prices, will adversely affect HEINEKEN’s income or the value of its financial instruments. During the COVID-19 pandemic, the financial markets became very volatile. The objective of our market risk management was to manage and control market risk exposures within acceptable boundaries.
HEINEKEN enters into derivatives and other financial liabilities to manage market risks. Generally, HEINEKEN seeks to apply hedge accounting or establish natural hedges in order to minimise the impact of market risks in profit or loss. Foreign currency, interest rate and commodity hedging operations are governed by internal policies and rules.
Foreign currency risk HEINEKEN is exposed to:
– Transactional risk on (future) sales, working capital, (future) purchases, deposits, borrowingsand dividends denominated in a currency other than the respective functional currencies of HEINEKEN entities.
– Translational risk, which is the risk resulting from the translation of foreign operations into the reportingcurrency of HEINEKEN.
The main currencies that give rise to this risk are the US Dollar, Mexican Peso, Brazilian Real, British Pound, Vietnamese Dong and Euro. Overall, COVID-19 negatively impacted currency developments for HEINEKEN. In 2020, the transactional exchange risk was hedged in line with the hedging policy to the extent possible. Especially the development of the Mexican Peso and Brazilian Real resulted in a negative translational and transactional impact on the reported numbers of HEINEKEN.
In managing foreign currency risk, HEINEKEN aims to ensure the availability of foreign currencies and to reduce the impact of short-term fluctuations on earnings. Over the longer term, however, permanent changes in foreign exchange rates and the availability of foreign currencies, especially in emerging markets, will have an impact on profit.
HEINEKEN hedges up to 90% of its net US Dollar export cash flows on the basis of rolling cash flow forecasts of sales and purchases. Material cash flows in other foreign currencies are also hedged on the basis of rolling cash flow forecasts. For this hedging, HEINEKEN mainly uses forward exchange contracts. The majority of the forward exchange contracts have maturities of less than one year after the balance sheet date.
HEINEKEN has a clear policy on hedging transactional exchange risks. Translation exchange risks are hedged to a limited extent, as the underlying currency positions are generally considered to be long-term in nature. The result of the hedging of translation risk, using net investment hedges is recognised in the translation reserve, as can be seen in the consolidated statement of comprehensive income.
HEINEKEN’s policy is to hedge material recognised transactional exposure like trade payables, receivables, borrowings and declared dividends. For material unrecognised transactional exposures like forecasted sales in foreign currencies, HEINEKEN hedges the exposure between agreed percentages according to the policy.
It is HEINEKEN’s policy to provide intra-HEINEKEN financing in the functional currency of subsidiaries where possible to prevent foreign currency exposure on a subsidiary level. The resulting exposure at Group level is hedged by means of foreign currency denominated external debts and by forward exchange contracts. Intra-HEINEKEN financing in foreign currencies is mainly in British Pound, US Dollar and Swiss Franc. In some cases, HEINEKEN elects to treat intra-HEINEKEN financing with a permanent character as equity and does not hedge the foreign currency exposure.
HEINEKEN has financial liabilities in foreign currencies like US Dollar and British Pound to hedge local operations, which generate cash flows that have the same or closely correlated functional currencies. The corresponding interest on these liabilities is also denominated in currencies that match the cash flows generated by the underlying operations of HEINEKEN.
In respect of other monetary assets and liabilities denominated in currencies other than the functional currencies of HEINEKEN, HEINEKEN ensures that its net exposure is kept to an acceptable level by buying or selling foreign currencies at spot rates when necessary to address short-term imbalances.
Exposure to foreign currency risk Based on notional amounts, HEINEKEN’s transactional exposure to the US Dollar and Euro as at 31 December is as follows. The Euro column relates to transactional exposure to the Euro within subsidiaries which are reporting in other currencies. The amounts below include intra-HEINEKEN cash flows.
2020 2019
In millions EUR USD EUR USD
Financial assets 111 4,940 171 4,908Financial liabilities (2,374) (5,433) (2,243) (5,524)Gross balance sheet exposure (2,263) (493) (2,072) (616)Estimated forecast sales next year 154 1,207 161 1,203Estimated forecast purchases next year (1,825) (2,346) (1,871) (2,644)Gross exposure (3,934) (1,632) (3,782) (2,057)Net notional amounts foreign exchange contracts 373 885 366 858Net exposure (3,561) (747) (3,416) (1,199)Sensitivity analysisEquity (158) 27 (142) 18Profit/(loss) (30) (6) (21) (12)
The sensitivity analysis above shows the impact on equity and profit of a 10% strengthening of the US Dollar against the Euro or, in case of the Euro, a strengthening of the Euro against all other currencies as at 31 December 2020. This analysis assumes that all other variables, in particular interest rates, remain constant. In case of a 10% weakening, the effects are equal but with an opposite effect.
Notes to the Consolidated Financial Statements
107 Heineken N.V. Annual Report 2020

Interest rate risk Interest rate risk is the risk that changes in market interest rates affect the fair value or cash flows of a financial instrument. The most significant interest rate risk for HEINEKEN relates to borrowings (note 11.3).
By managing interest rate risk, HEINEKEN aims to reduce the impact of short-term fluctuations on earnings. Over the longer term however, permanent changes in interest rates will have an impact on profit.
HEINEKEN opts for a mix of fixed and variable interest rate financial instruments like bonds, commercial paper and bank loans, combined with the use of derivative interest rate instruments. Currently, HEINEKEN’s interest rate position is more weighted towards fixed than floating. Interest rate derivative instruments that can be used are (cross-currency) interest rate swaps, forward rate agreements, caps and floors.
Interest rate risk – profile At the reporting date, the interest rate profile of HEINEKEN’s interest-bearing financial instruments is as follows:
In millions of € 2020 2019
Fixed rate instrumentsFinancial assets 122 128Financial liabilities (16,473) (14,822)Cross-currency interest rate swaps 407 445
(15,944) (14,249)
Variable rate instrumentsFinancial assets 4,289 2,275Financial liabilities (1,724) (2,230)Cross-currency interest rate swaps (463) (463)
2,102 (418)
Cash flow sensitivity analysis for variable rate instruments A change of 100 basis points in interest rates constantly applied during the reporting period would not have a material impact on equity and profit or loss.
Commodity price risk Commodity price risk is the risk that changes in the prices of commodities will affect HEINEKEN’s cost. The objective of commodity price risk management is to manage and control commodity risk exposures within acceptable parameters. As a consequence of the COVID-19 pandemic, the commodity price volatility increased significantly in 2020. The main commodity exposure relates to the purchase of aluminium cans, glass bottles, malt and utilities. Commodity price risk is in principle mitigated by negotiating fixed prices in supplier contracts with various contract durations.
Another method to mitigate commodity price risk is by entering into commodity derivatives. HEINEKEN enters into commodity derivatives for aluminium hedging and to a certain extent other derivatives for commodities like fuel, corn and sugar. HEINEKEN does not enter into commodity contracts other than to meet HEINEKEN’s expected usage and sale requirements.
Sensitivity analysis for aluminium hedges A 10% change in the market price of aluminium would not have a material impact on equity.
11.6 Derivative financial instruments HEINEKEN uses derivatives in order to manage market risks. Refer to the table below for the fair value of derivatives recorded on the balance sheet of HEINEKEN as per reporting date:
2020 2019
In millions of € Asset Liability Asset Liability
Current 77 (52) 28 (69)Non-current1 21 (35) 2 (22)
98 (87) 30 (91)
1 Non-current derivative assets and liabilities are part of ‘Other non-current assets’ (note 8.5) and ‘Other non-current liabilities’ respectively.
Notes to the Consolidated Financial Statements
108 Heineken N.V. Annual Report 2020

Generally, HEINEKEN seeks to apply hedge accounting or make use of natural hedges in order to minimise profit and loss or cash flow volatility. Refer to the table below for derivatives that are used in hedge accounting:
2020 2019
In millions of € Asset Liability Asset Liability
No hedge accounting – CCIRS 3 — — (16)No hedge accounting – Other 9 (12) 4 (10)Cash flow hedge – Forwards 46 (37) 11 (31)Cash flow hedge – Commodity forwards 21 (3) 15 (20)Fair value hedge – CCIRS — (35) — (7)Net investment hedge – CCIRS 18 — — (5)Net investment hedge – Forwards 1 — — (2)
98 (87) 30 (91)
Cash flow hedges The hedging of future, highly probable forecasted transactions are designated as cash flow hedges. Cash flow hedges are entered into to cover commodity price risk and transactional foreign exchange risk.
Net investment hedgesHEINEKEN hedges its investments in certain subsidiaries by entering into local currency denominated borrowings, forward contracts and cross-currency interest rate swaps, which mitigate the foreign currency translation risk arising from the subsidiaries net assets. These borrowings, forward contracts and swaps are designated as net investment hedges and fully effective, as such there was no ineffectiveness recognised in profit and loss in 2020 (2019: nil). As at 31 December 2020 the fair value of these borrowings was €200 million (2019: €288 million), the market value of forward contracts was €1 million positive (2019: €2 million negative) and the market value of these swaps was €18 million positive (2019: €5 million negative).
Fair value hedges HEINEKEN has entered into several cross-currency interest rate swaps (CCIRS) which have been designated as fair value hedges to hedge the foreign exchange rate risk on the principal amount and future interest payments of certain US Dollar borrowings. The borrowings and the cross-currency interest rate swaps have the same critical terms. The accumulated loss arising on derivatives as designated hedging instruments in fair value hedges amounts to €38 million as at 31 December 2020 (2019: €11 million). The gain arising on the adjustment for the hedged item attributable to the hedged risk in a designated fair value hedge accounting relationship also amounts to €38 million as at 31 December 2020 (2019: €11 million).
Hedge effectiveness Hedge effectiveness is determined at the start of the hedge relationship and periodically through a prospective effectiveness assessment to ensure that an economic relationship exists between the hedged item and hedging instrument. This assessment is done qualitatively by comparing the critical terms, and if needed quantitative assessments are done using hypothetical derivatives. For the current hedges no hedge ineffectiveness is expected.
• Accounting policies Derivative financial instruments are recognised initially at fair value. Subsequent accounting for derivatives depends on whether or not the derivatives are designated as hedging instrument in a cash flow, fair value or net investment hedge. Derivatives with positive fair values are recorded as assets and negative fair values as liabilities. Refer to note 13.1 for fair value measurements.
Cash flow hedge Changes in the fair value are recognised in other comprehensive income and presented in the hedging reserve within equity to the extent that the hedge is effective. The ineffective part is recognised as other net finance income/(expense). When the hedged risk impacts the profit or loss, the amounts previously recognised in other comprehensive income are recycled through other comprehensive income and transferred to the same item in the profit or loss as the hedged item. When the hedged risk subsequently results in a non-financial asset or liability (e.g. inventory or P,P&E), the amount previously recognised in the cash flow hedge reserve is directly included in its carrying amount and does not affect other comprehensive income.
Fair value hedge The fair value changes of derivatives used in fair value hedges are recognised in profit or loss.
Net investment hedge The fair value changes of derivatives used in net investment hedges are recognised in other comprehensive income and presented within equity in the translation reserve. Any ineffectiveness is recognised in profit or loss.
Notes to the Consolidated Financial Statements
109 Heineken N.V. Annual Report 2020
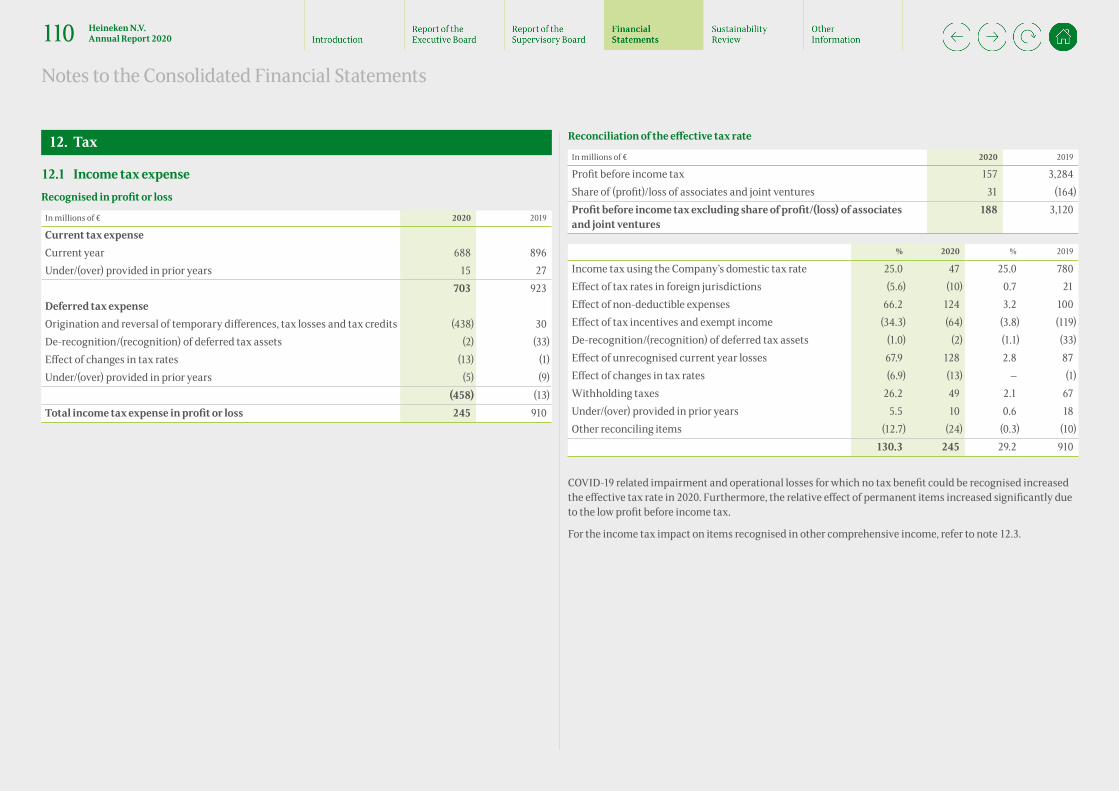
12. Tax
12.1 Income tax expense Recognised in profit or loss
In millions of € 2020 2019
Current tax expenseCurrent year 688 896Under/(over) provided in prior years 15 27
703 923Deferred tax expenseOrigination and reversal of temporary differences, tax losses and tax credits (438) 30De-recognition/(recognition) of deferred tax assets (2) (33)Effect of changes in tax rates (13) (1)Under/(over) provided in prior years (5) (9)
(458) (13)Total income tax expense in profit or loss 245 910
Reconciliation of the effective tax rate
In millions of € 2020 2019
Profit before income tax 157 3,284Share of (profit)/loss of associates and joint ventures 31 (164)Profit before income tax excluding share of profit/(loss) of associates and joint ventures
188 3,120
% 2020 % 2019
Income tax using the Company’s domestic tax rate 25.0 47 25.0 780Effect of tax rates in foreign jurisdictions (5.6) (10) 0.7 21Effect of non-deductible expenses 66.2 124 3.2 100Effect of tax incentives and exempt income (34.3) (64) (3.8) (119)De-recognition/(recognition) of deferred tax assets (1.0) (2) (1.1) (33)Effect of unrecognised current year losses 67.9 128 2.8 87Effect of changes in tax rates (6.9) (13) — (1)Withholding taxes 26.2 49 2.1 67Under/(over) provided in prior years 5.5 10 0.6 18Other reconciling items (12.7) (24) (0.3) (10)
130.3 245 29.2 910
COVID-19 related impairment and operational losses for which no tax benefit could be recognised increased the effective tax rate in 2020. Furthermore, the relative effect of permanent items increased significantly due to the low profit before income tax.
For the income tax impact on items recognised in other comprehensive income, refer to note 12.3.
Notes to the Consolidated Financial Statements
110 Heineken N.V. Annual Report 2020

12.2 Deferred tax assets and liabilities Recognised deferred tax assets and liabilities Deferred tax assets and liabilities are attributable to the following items:
Assets Liabilities Net
In millions of € 2020 2019 2020 2019 2020 2019
P,P&E 104 98 (623) (803) (519) (705)Intangible assets 45 29 (1,049) (1,358) (1,004) (1,329)Investments 35 41 (5) (5) 30 36Inventories 57 47 (3) (12) 54 35Borrowings 281 308 (3) — 278 308Post-retirement obligations 279 278 (5) (4) 274 274Provisions 258 302 (13) (28) 245 274Other items 182 138 (181) (216) 1 (78)Tax losses carried forward 421 410 — — 421 410Tax assets/(liabilities) 1,662 1,651 (1,882) (2,426) (220) (775)Set-off of tax (883) (1,004) 883 1,004 — —Net tax assets/(liabilities) 779 647 (999) (1,422) (220) (775)
Of the total net deferred tax assets of €779 million as at 31 December 2020 (2019: €647 million), €528 million (2019: €101 million) is recognised in respect of subsidiaries in various countries where there have been losses in the current or preceding period. Management’s projections support the assumption that it is probable that the results of future operations will generate sufficient taxable income to utilise these deferred tax assets. This judgement is performed annually and based on budgets and business plans for the coming years, including planned commercial initiatives and the impact of COVID-19.
No deferred tax liability has been recognised in respect of undistributed earnings of subsidiaries, joint ventures and associates, with an impact of €201 million (2019: €141 million). This is because HEINEKEN is able to control the timing of the reversal of the temporary differences, and it is probable that such differences will not reverse in the foreseeable future.
Tax losses carried forward HEINEKEN has tax losses carried forward of €3,663 million as at 31 December 2020 (2019: €4,024 million), out of which €409 million (2019: €382 million) expires in the following five years, €490 million (2019: €191 million) will expire after five years and €2,764 million (2019: €3,451 million) can be carried forward indefinitely. Deferred tax assets have not been recognised in respect of tax losses carried forward of €1,858 million (2019: €2,163 million) as it is not probable that taxable profit will be available to offset these losses. Out of this €1,858 million (2019: €2,163 million), €256 million (2019: €173 million) expires in the following five years, €233 million (2019: €16 million) will expire after five years and €1,369 million (2019: €1,974 million) can be carried forward indefinitely.
Movement in deferred tax balances during the year
In millions of €1 January
2020Changes in
consolidation
Effect of movements
in foreign exchange
Recognised in income
Recognised in equity Transfers
31 December 2020
P,P&E (705) (1) 74 122 — (9) (519)Intangible assets (1,329) 2 128 195 — — (1,004)Investments 36 — (7) 1 — — 30Inventories 35 — — 19 — — 54Borrowings 308 1 (1) (36) (3) 9 278Post-retirement obligations
274 — (10) — 10 — 274
Provisions 274 6 (58) 23 — — 245Other items (78) — 4 87 (12) — 1Tax losses carried forward
410 1 (37) 47 — — 421
Net tax assets/(liabilities)
(775) 9 93 458 (5) — (220)
Notes to the Consolidated Financial Statements
111 Heineken N.V. Annual Report 2020
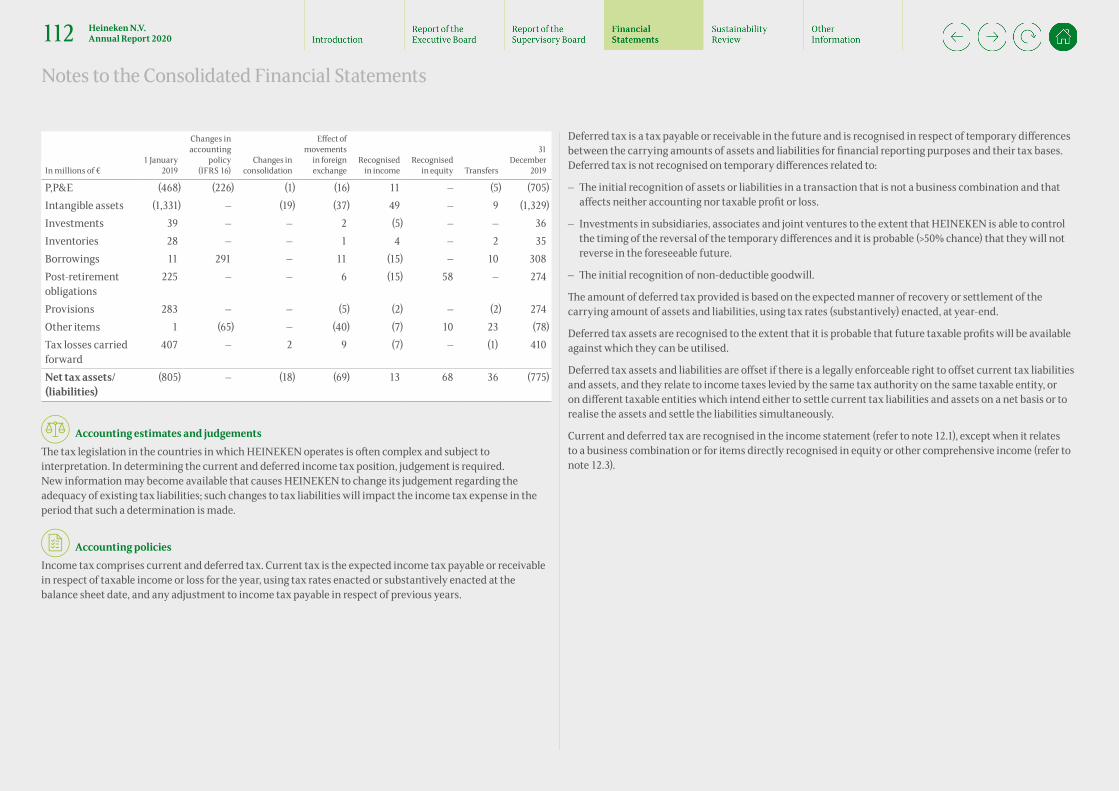
In millions of €1 January
2019
Changes in accounting
policy (IFRS 16)
Changes in consolidation
Effect of movements
in foreign exchange
Recognised in income
Recognised in equity Transfers
31 December
2019
P,P&E (468) (226) (1) (16) 11 — (5) (705)Intangible assets (1,331) — (19) (37) 49 — 9 (1,329)Investments 39 — — 2 (5) — — 36Inventories 28 — — 1 4 — 2 35Borrowings 11 291 — 11 (15) — 10 308Post-retirement obligations
225 — — 6 (15) 58 — 274
Provisions 283 — — (5) (2) — (2) 274Other items 1 (65) — (40) (7) 10 23 (78)Tax losses carried forward
407 — 2 9 (7) — (1) 410
Net tax assets/(liabilities)
(805) — (18) (69) 13 68 36 (775)
• Accounting estimates and judgementsThe tax legislation in the countries in which HEINEKEN operates is often complex and subject to interpretation. In determining the current and deferred income tax position, judgement is required. New information may become available that causes HEINEKEN to change its judgement regarding the adequacy of existing tax liabilities; such changes to tax liabilities will impact the income tax expense in the period that such a determination is made.
• Accounting policies Income tax comprises current and deferred tax. Current tax is the expected income tax payable or receivable in respect of taxable income or loss for the year, using tax rates enacted or substantively enacted at the balance sheet date, and any adjustment to income tax payable in respect of previous years.
Deferred tax is a tax payable or receivable in the future and is recognised in respect of temporary differences between the carrying amounts of assets and liabilities for financial reporting purposes and their tax bases. Deferred tax is not recognised on temporary differences related to:
– The initial recognition of assets or liabilities in a transaction that is not a business combination and thataffects neither accounting nor taxable profit or loss.
– Investments in subsidiaries, associates and joint ventures to the extent that HEINEKEN is able to controlthe timing of the reversal of the temporary differences and it is probable (>50% chance) that they will not reverse in the foreseeable future.
– The initial recognition of non-deductible goodwill.
The amount of deferred tax provided is based on the expected manner of recovery or settlement of the carrying amount of assets and liabilities, using tax rates (substantively) enacted, at year-end.
Deferred tax assets are recognised to the extent that it is probable that future taxable profits will be available against which they can be utilised.
Deferred tax assets and liabilities are offset if there is a legally enforceable right to offset current tax liabilities and assets, and they relate to income taxes levied by the same tax authority on the same taxable entity, or on different taxable entities which intend either to settle current tax liabilities and assets on a net basis or to realise the assets and settle the liabilities simultaneously.
Current and deferred tax are recognised in the income statement (refer to note 12.1), except when it relates to a business combination or for items directly recognised in equity or other comprehensive income (refer to note 12.3).
Notes to the Consolidated Financial Statements
112 Heineken N.V. Annual Report 2020
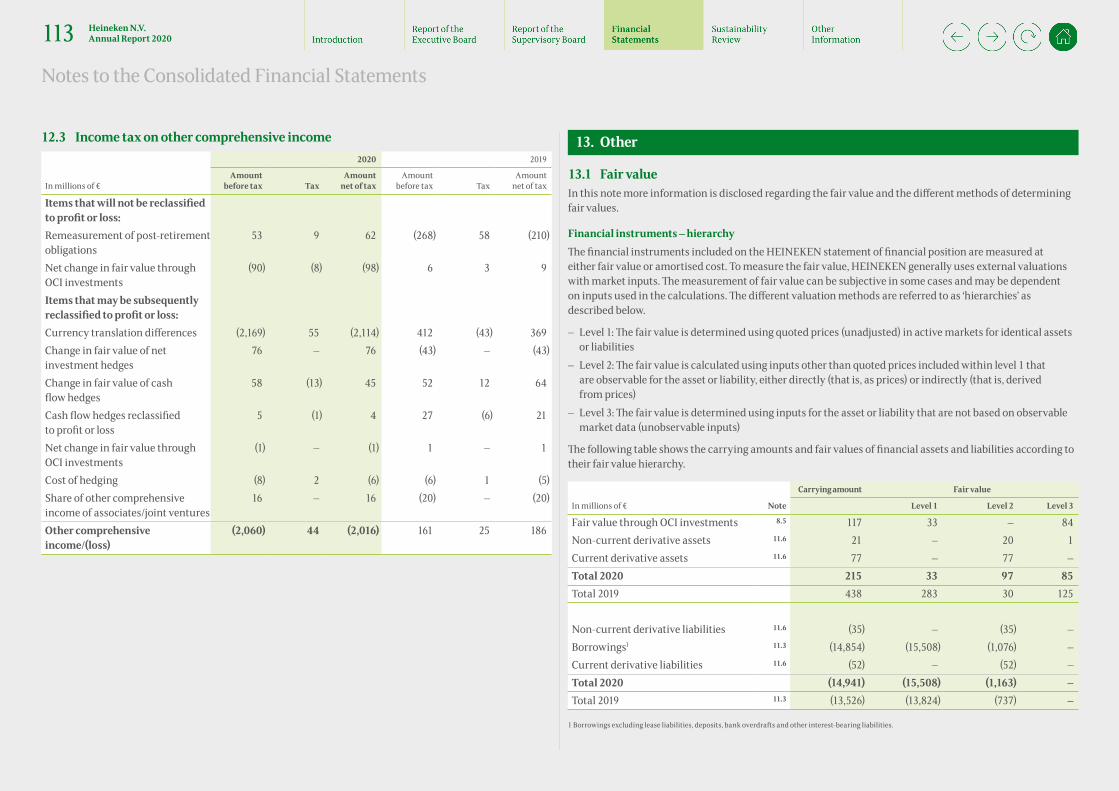
12.3 Income tax on other comprehensive income 2020 2019
In millions of €Amount
before tax TaxAmount
net of taxAmount
before tax TaxAmount
net of tax
Items that will not be reclassified to profit or loss:Remeasurement of post-retirement obligations
53 9 62 (268) 58 (210)
Net change in fair value through OCI investments
(90) (8) (98) 6 3 9
Items that may be subsequently reclassified to profit or loss:Currency translation differences (2,169) 55 (2,114) 412 (43) 369Change in fair value of net investment hedges
76 — 76 (43) — (43)
Change in fair value of cash flow hedges
58 (13) 45 52 12 64
Cash flow hedges reclassified to profit or loss
5 (1) 4 27 (6) 21
Net change in fair value through OCI investments
(1) — (1) 1 — 1
Cost of hedging (8) 2 (6) (6) 1 (5)Share of other comprehensive income of associates/joint ventures
16 — 16 (20) — (20)
Other comprehensive income/(loss)
(2,060) 44 (2,016) 161 25 186
13. Other
13.1 Fair value In this note more information is disclosed regarding the fair value and the different methods of determining fair values.
Financial instruments – hierarchy The financial instruments included on the HEINEKEN statement of financial position are measured at either fair value or amortised cost. To measure the fair value, HEINEKEN generally uses external valuations with market inputs. The measurement of fair value can be subjective in some cases and may be dependent on inputs used in the calculations. The different valuation methods are referred to as ‘hierarchies’ as described below.
– Level 1: The fair value is determined using quoted prices (unadjusted) in active markets for identical assets or liabilities
– Level 2: The fair value is calculated using inputs other than quoted prices included within level 1 that are observable for the asset or liability, either directly (that is, as prices) or indirectly (that is, derived from prices)
– Level 3: The fair value is determined using inputs for the asset or liability that are not based on observable market data (unobservable inputs)
The following table shows the carrying amounts and fair values of financial assets and liabilities according to their fair value hierarchy.
Carrying amount Fair value
In millions of € Note Level 1 Level 2 Level 3
Fair value through OCI investments 8.5 117 33 — 84Non-current derivative assets 11.6 21 — 20 1Current derivative assets 11.6 77 — 77 —Total 2020 215 33 97 85Total 2019 438 283 30 125
Non-current derivative liabilities 11.6 (35) — (35) —Borrowings1 11.3 (14,854) (15,508) (1,076) —Current derivative liabilities 11.6 (52) — (52) —Total 2020 (14,941) (15,508) (1,163) —Total 2019 11.3 (13,526) (13,824) (737) —
1 Borrowings excluding lease liabilities, deposits, bank overdrafts and other interest-bearing liabilities.
Notes to the Consolidated Financial Statements
113 Heineken N.V. Annual Report 2020

Refer to the table below for detail of the determination of level 3 fair value measurements as at 31 December:
In millions of € 2020 2019
Fair value through OCI investments based on level 3Balance as at 1 January 125 91Fair value adjustments recognised in other comprehensive income (41) 34Balance as at 31 December 84 125
The fair values for the level 3 fair value through OCI investments are based on the financial performance of the investments and the market multiples of comparable equity securities.
• Accounting estimates The different methods applied by HEINEKEN to determine the fair value require the use of estimates.
Investments in equity securities The fair value of financial assets at fair value through profit or loss and fair value through OCI is determined by reference to their quoted closing bid price at the reporting date or, if unquoted, determined using an appropriate valuation technique. These valuation techniques maximise the use of observable market data where available.
Derivative financial instruments The fair value of derivative financial instruments is based on their listed market price, if available. If a listed market price is not available, fair value is in general estimated by discounting the difference between the cash flows based on contractual price and the cash flows based on current price for the residual maturity of the contract using observable interest yield curves, basis spread and foreign exchange rates. These calculations are tested for reasonableness by comparing the outcome of the internal valuation with the valuation received from the counterparty. Fair values include the instrument’s credit risk and adjustments to take account of the credit risk of the HEINEKEN entity and counterparty when appropriate.
Non-derivative financial instruments Fair value, which is determined for disclosure purposes or when fair value hedge accounting is applied, is calculated based on the present value of future principal and interest cash flows, discounted at the market rate of interest at the reporting date. Fair values include the instrument’s credit risk and adjustments to take account of the credit risk of the HEINEKEN entity and counterparty when appropriate.
13.2 Off-balance sheet commitments The raw materials purchase contracts mainly relate to malt, bottles and cans which are used in the production and sale of finished products.
In millions of € Total 2020Less than
1 year 1-5 yearsMore than
5 years Total 2019
Property, plant and equipment ordered 363 352 11 — 321Raw materials purchase contracts 9,586 2,934 5,791 861 8,827Marketing and merchandising commitments 851 311 525 15 1,051Other off-balance sheet obligations 1,773 324 629 820 2,005Off-balance sheet obligations 12,573 3,921 6,956 1,696 12,204Undrawn committed bank facilities 3,941 389 3,552 — 3,750
Other off-balance sheet obligations include energy, distribution and service contracts.
Committed bank facilities are credit facilities on which a commitment fee is paid as compensation for the bank’s requirement to reserve capital. The bank is legally obliged to provide the facility under the terms and conditions of the agreement.
• Accounting policies Off-balance sheet commitments are reported on an undiscounted basis.
Raw materials purchase contracts Raw material purchase contracts include long-term purchase contracts with suppliers in which prices are fixed or will be agreed based upon predefined price formulas.
Notes to the Consolidated Financial Statements
114 Heineken N.V. Annual Report 2020

13.3 Related parties Identification of related parties The following parties are considered to be related to Heineken N.V.:
– Key management personnel: the Executive Board and the Supervisory Board – Parent company Heineken Holding N.V. and ultimate controlling party Mrs. de Carvalho-Heineken
(refer to ‘Shareholder Information’) – Associates and Joint ventures of Heineken N.V. – Shareholder with significant influence Fomento Económico Mexicano, S.A.B. de C.V. (FEMSA) – HEINEKEN pension funds (refer to note 9.1) – Employees of HEINEKEN (refer to note 6.4)
Key management remuneration
In millions of € 2020 2019
Executive Board 9.9 10.8Supervisory Board 1.3 1.5Total 11.2 12.3
Executive Board The remuneration of the members of the Executive Board consists of a fixed component and a variable component. The variable component is made up of a Short-term incentive (STI) and a Long-term incentive (LTI). The STI is based on financial and operational measures (75%) and on individual leadership measures (25%) as set by the Supervisory Board at the beginning of the year. Refer to note 6.5 for information related to the LTI component. The separate Remuneration Report is stated on pages 55-65.
As at 31 December 2020, Mr. R.G.S. van den Brink held 4,379 Company shares and Mrs. L.M. Debroux held 63,330 Company shares (2019: Mrs. L.M. Debroux 45,318).
2020 2019
In thousands of €R.G.S. van
den Brink2L.M.
Debroux5J.F.M.L. van
Boxmeer1,3,4,6 TotalJ.F.M.L. van
BoxmeerL.M.
Debroux Total
Fixed salary 631 737 500 1,868 1,250 850 2,100Short-term incentive — — — — 2,223 1,080 3,303Matching share entitlement — — — — 505 245 750Long-term incentive 396 (235) 1,597 1,758 2,323 1,201 3,524Pension contributions 154 179 120 453 762 167 929Other emoluments 80 154 5,536 5,770 49 183 232Total 1,261 835 7,753 9,849 7,112 3,726 10,838
1 Stepped down as CEO and Chairman of the Executive Board on 1 June 2020. 2 Appointed on 24 April 2020 as member of the Executive Board and on 1 June 2020 as CEO and Chairman of the Executive Board. 3 In 2020, an estimated tax penalty of €7.0 million to the Dutch tax authorities was recognised in relation to the remuneration of Mr. J.F.M.L. van Boxmeer.
This tax was an expense to the employer and therefore not included in the table above.4 In 2020, the accrual for the long-term incentive plans for Mr. J.F.M.L. van Boxmeer (LTI plan 2019-2021 and 2020-2022) have been recognised in full.5 The reversal of the LTI plan 2018-2020 accrual (due to the cancellation it will not vest and will not be paid out) and the decline in the LTI plan 2019-2021 (due to
declining performance), has resulted in a negative long-term incentive expense in 2020.6 Other emoluments include the end of service payment for Mr. J.F.M.L. van Boxmeer.
In response to the COVID-19 impact on HEINEKEN’s business and as announced on 22 April 2020, the Executive Board has voluntarily decided to reduce their base salary by 20% between May and December 2020. In addition the Supervisory Board has decided that there will not be a Short-term incentive (STI) pay-out for the performance year 2020 and that the LTIP 2018-2020 will not vest (refer to note 6.5 for more information).
The matching share entitlements for each year are based on the performance in that year. The Executive Board members receive 25% of their STI pay in (investment) shares. In addition they have the opportunity to indicate before year-end whether they wish to receive up to another 25% of their STI in (investment) shares. All (investment) shares are restricted for sale for five calendar years, after which they are matched 1:1 by (matching) shares. Following the decision not to pay out the STI relating to the performance year 2020, no investment shares were issued this year for the members of the Executive Board.
Notes to the Consolidated Financial Statements
115 Heineken N.V. Annual Report 2020

Supervisory Board The individual members of the Supervisory Board received the following remuneration:
In thousands of € 2020 2019
J.M. Huët 225 195J.A. Fernández Carbajal 154 153M. Das 130 133M.R. de Carvalho 135 141V.C.O.B.J. Navarre 105 110J.G. Astaburuaga Sanjinés 116 133P. Mars-Wright 126 151M. Helmes 125 131R.L. Ripley2 110 97I.H. Arnold2 115 100G.J. Wijers1 — 103Y. Dervisoglu1 — 53
1,341 1,500
1 Stepped down as at 25 April 2019. 2 Appointed as at 25 April 2019.
Mr. J.M. Huët held 3,719 shares of Heineken Holding N.V. as at 31 December 2020 (2019: nil shares). Mr. M.R. de Carvalho held 100,008 shares of Heineken N.V. as at 31 December 2020 (2019: 100,008 shares). As at 31 December 2020 and 2019, the Supervisory Board members did not hold any of the Company’s bondsor option rights. Mr. M.R. de Carvalho held 100,008 shares of Heineken Holding N.V. as at 31 December 2020 (2019: 100,008 shares).
Heineken Holding N.V. In 2020, an amount of €1,171,702 (2019: €1,146,413) was paid to Heineken Holding N.V. for management services for HEINEKEN.
This payment is based on an agreement of 1977 as amended in 2001, providing that Heineken N.V. reimburses Heineken Holding N.V. for its costs.
Other related party transactions
Associates & Joint Ventures FEMSA Total
In millions of € 2020 2019 2020 2019 2020 2019
Sales 364 462 831 1,170 1,195 1,632Purchases 178 290 131 160 309 450
Accounts receivables 109 114 135 208 244 322Accounts payables and other liabilities
37 20 65 108 102 128
13.4 HEINEKEN entities Control of HEINEKEN The shares of the Company are traded on Euronext Amsterdam, where the Company is included in the main AEX Index. Heineken Holding N.V. Amsterdam has an interest of 50.005% in the issued capital of the Company and consolidates the financial information of the Company.
A declaration of joint and several liability pursuant to the provisions of Section 403, Part 9, Book 2, of the Dutch Civil Code has been issued with respect to legal entities established in the Netherlands. The list of the legal entities for which the declaration has been issued is disclosed in the Heineken N.V. stand-alone financial statements.
Pursuant to the provisions of Section 357 of the Republic of Ireland Companies Act 2014, the Company irrevocably guarantees, in respect of the financial year from 1 January 2020 up to and including 31 December 2020, the liabilities referred to in Schedule 3 of the Republic of Ireland Companies Act 2014 of the wholly-owned subsidiary companies Heineken Ireland Limited, Heineken Ireland Sales Limited, The West Cork Bottling Company Limited, Western Beverages Limited, Beamish & Crawford Limited and Nash Beverages Limited.
Notes to the Consolidated Financial Statements
116 Heineken N.V. Annual Report 2020

Significant subsidiaries Set out below are HEINEKEN’s significant subsidiaries at 31 December 2020. The subsidiaries as listed below are held by the Company and the proportion of ownership interests held equals the proportion of the voting rights held by HEINEKEN. The disclosed significant subsidiaries represent the largest subsidiaries and represent an approximate total revenue of €14 billion and total asset value of €27 billion and are structural contributors to the business.
There were no significant changes to the HEINEKEN structure and ownership interests.
Country of incorporation
Percentage of ownership
2020 2019
Heineken International B.V. The Netherlands 100.0 100.0Heineken Brouwerijen B.V. The Netherlands 100.0 100.0Heineken Nederland B.V. The Netherlands 100.0 100.0Cuauhtémoc Moctezuma Holding, S.A. de C.V. Mexico 100.0 100.0Cervejarias Kaiser Brasil S.A. Brazil 100.0 100.0Bavaria S.A. Brazil 100.0 100.0Heineken France S.A.S. France 100.0 100.0Nigerian Breweries Plc. Nigeria 56.1 56.0Heineken USA Inc. United States 100.0 100.0Heineken UK Ltd United Kingdom 100.0 100.0Heineken España S.A. Spain 99.8 99.8Heineken Italia S.p.A. Italy 100.0 100.0Brau Union Österreich AG Austria 100.0 100.0Grupa Żywiec S.A. Poland 65.2 65.2LLC Heineken Breweries Russia 100.0 100.0Heineken Vietnam Brewery Limited Company Vietnam 60.0 60.0SCC – Sociedade Central de Cervejas e Bebidas S.A. Portugal 99.9 99.9Heineken South Africa (Proprietary) Limited South Africa 82.4 82.4
13.5 Subsequent events At the end of October 2020, HEINEKEN announced the acquisition of cider brand Strongbow from Asahi Group Holdings Limited (Asahi) in Australia, along with two other cider brands, Little Green and Bonamy’s. As part of the transaction, HEINEKEN will also gain the perpetual licenses on beer brands Stella Artois and Beck’s in Australia.The transaction was completed on 6 January 2021 for €137 million.
Notes to the Consolidated Financial Statements
117 Heineken N.V. Annual Report 2020

For the year ended 31 DecemberIn millions of € 2020 2019
Personnel expenses (18) (12)Total other expenses (18) (12)Interest income 39 31Interest expenses (339) (332)Other net finance income/(expenses) 306 (100)Net finance expenses 6 (401)Share of profit/(loss) of participating interests, after income tax (167) 2,506Profit/(Loss) before income tax (179) 2,093Income tax income/(expense) (25) 73Profit/(Loss) (204) 2,166
For more details on personnel expenses, refer to note 13.3 of the consolidated financial statements.
Heineken N.V. Income Statement
118 Heineken N.V. Annual Report 2020
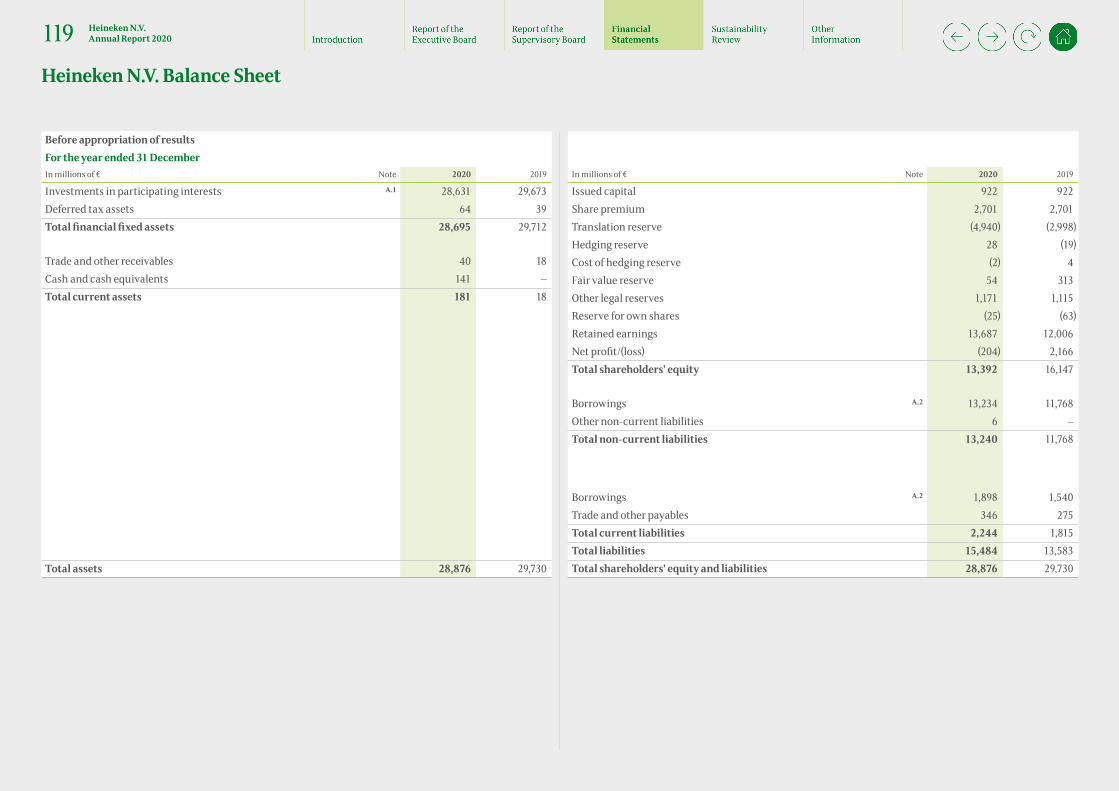
Before appropriation of resultsFor the year ended 31 DecemberIn millions of € Note 2020 2019
Investments in participating interests A.1 28,631 29,673Deferred tax assets 64 39Total financial fixed assets 28,695 29,712
Trade and other receivables 40 18Cash and cash equivalents 141 —Total current assets 181 18
Total assets 28,876 29,730
In millions of € Note 2020 2019
Issued capital 922 922Share premium 2,701 2,701Translation reserve (4,940) (2,998)Hedging reserve 28 (19)Cost of hedging reserve (2) 4Fair value reserve 54 313Other legal reserves 1,171 1,115Reserve for own shares (25) (63)Retained earnings 13,687 12,006Net profit/(loss) (204) 2,166Total shareholders’ equity 13,392 16,147
Borrowings A.2 13,234 11,768Other non-current liabilities 6 —Total non-current liabilities 13,240 11,768
Borrowings A.2 1,898 1,540Trade and other payables 346 275Total current liabilities 2,244 1,815Total liabilities 15,484 13,583Total shareholders’ equity and liabilities 28,876 29,730
Heineken N.V. Balance Sheet
119 Heineken N.V. Annual Report 2020
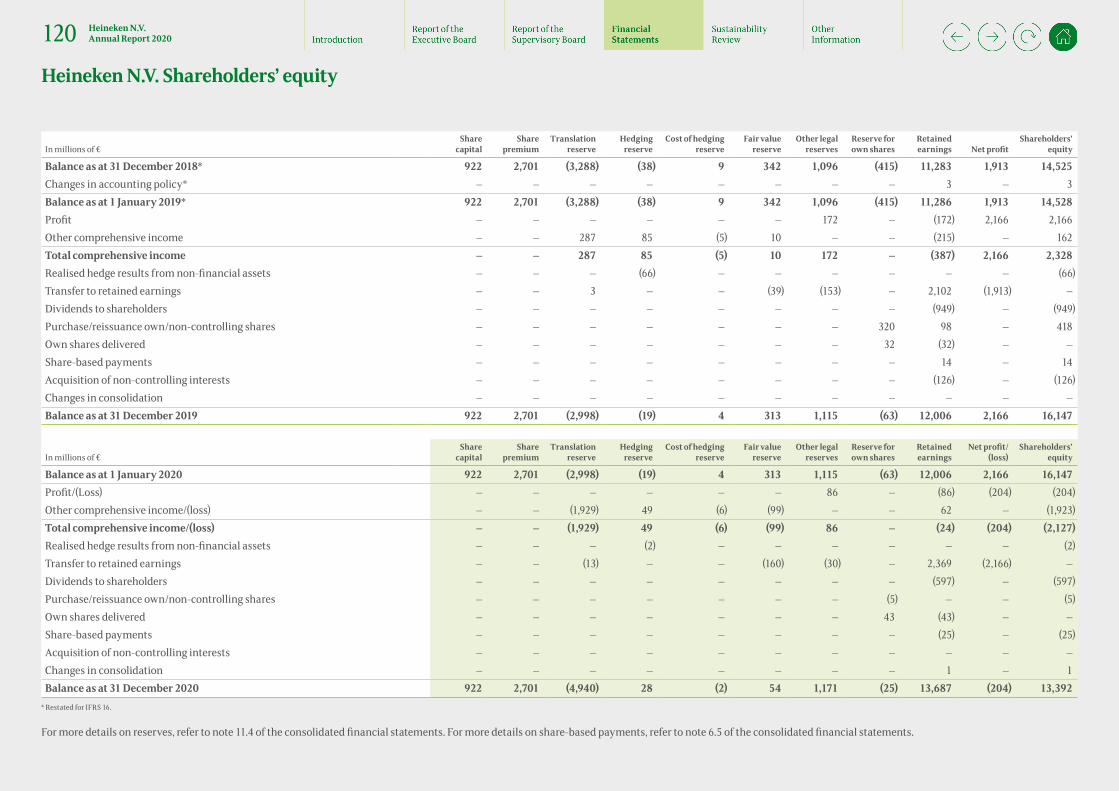
In millions of €Share
capitalShare
premiumTranslation
reserveHedging
reserveCost of hedging
reserveFair value
reserveOther legal
reservesReserve for own shares
Retained earnings Net profit
Shareholders’ equity
Balance as at 31 December 2018* 922 2,701 (3,288) (38) 9 342 1,096 (415) 11,283 1,913 14,525Changes in accounting policy* — — — — — — — — 3 — 3Balance as at 1 January 2019* 922 2,701 (3,288) (38) 9 342 1,096 (415) 11,286 1,913 14,528Profit — — — — — — 172 — (172) 2,166 2,166Other comprehensive income — — 287 85 (5) 10 — — (215) — 162Total comprehensive income — — 287 85 (5) 10 172 — (387) 2,166 2,328Realised hedge results from non-financial assets — — — (66) — — — — — — (66)Transfer to retained earnings — — 3 — — (39) (153) — 2,102 (1,913) —Dividends to shareholders — — — — — — — — (949) — (949)Purchase/reissuance own/non-controlling shares — — — — — — — 320 98 — 418Own shares delivered — — — — — — — 32 (32) — —Share-based payments — — — — — — — — 14 — 14Acquisition of non-controlling interests — — — — — — — — (126) — (126)Changes in consolidation — — — — — — — — — — —Balance as at 31 December 2019 922 2,701 (2,998) (19) 4 313 1,115 (63) 12,006 2,166 16,147
In millions of €Share
capitalShare
premiumTranslation
reserveHedging
reserveCost of hedging
reserveFair value
reserveOther legal
reservesReserve for own shares
Retained earnings
Net profit/(loss)
Shareholders’ equity
Balance as at 1 January 2020 922 2,701 (2,998) (19) 4 313 1,115 (63) 12,006 2,166 16,147Profit/(Loss) — — — — — — 86 — (86) (204) (204)Other comprehensive income/(loss) — — (1,929) 49 (6) (99) — — 62 — (1,923)Total comprehensive income/(loss) — — (1,929) 49 (6) (99) 86 — (24) (204) (2,127)Realised hedge results from non-financial assets — — — (2) — — — — — — (2)Transfer to retained earnings — — (13) — — (160) (30) — 2,369 (2,166) —Dividends to shareholders — — — — — — — — (597) — (597)Purchase/reissuance own/non-controlling shares — — — — — — — (5) — — (5)Own shares delivered — — — — — — — 43 (43) — —Share-based payments — — — — — — — — (25) — (25)Acquisition of non-controlling interests — — — — — — — — — — —Changes in consolidation — — — — — — — — 1 — 1Balance as at 31 December 2020 922 2,701 (4,940) 28 (2) 54 1,171 (25) 13,687 (204) 13,392
* Restated for IFRS 16.
For more details on reserves, refer to note 11.4 of the consolidated financial statements. For more details on share-based payments, refer to note 6.5 of the consolidated financial statements.
Heineken N.V. Shareholders’ equity
120 Heineken N.V. Annual Report 2020
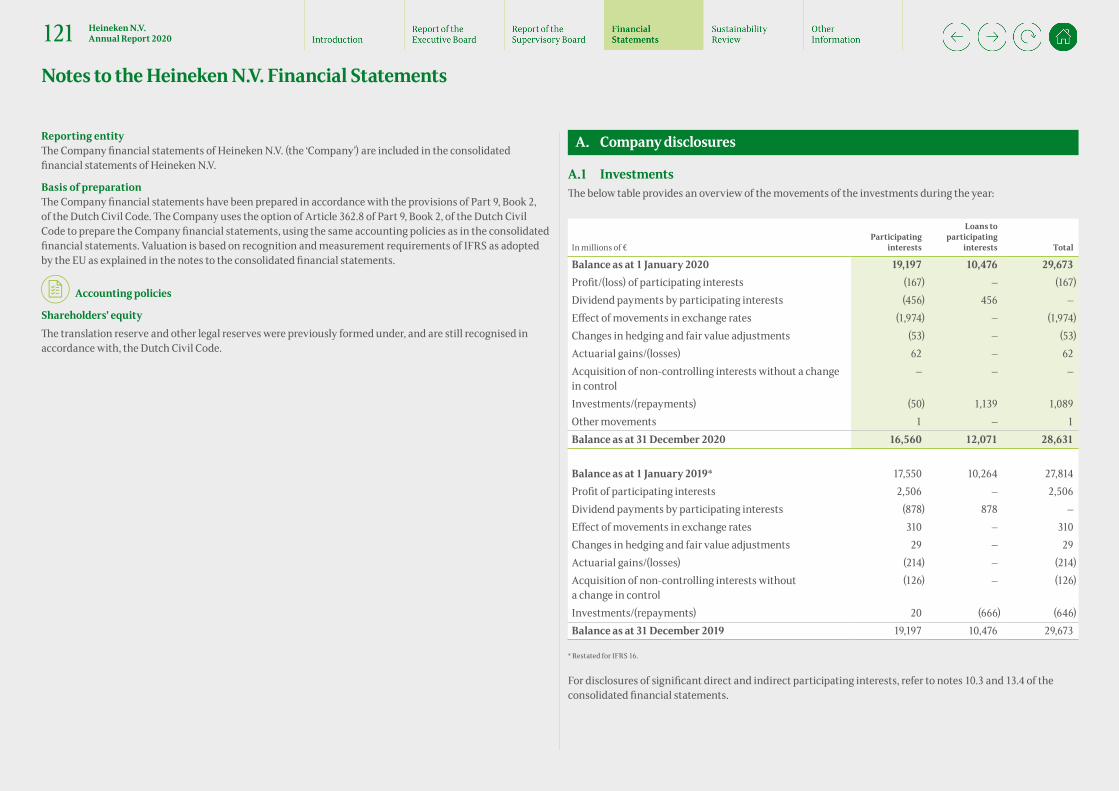
Reporting entity The Company financial statements of Heineken N.V. (the ‘Company’) are included in the consolidated financial statements of Heineken N.V.
Basis of preparation The Company financial statements have been prepared in accordance with the provisions of Part 9, Book 2, of the Dutch Civil Code. The Company uses the option of Article 362.8 of Part 9, Book 2, of the Dutch Civil Code to prepare the Company financial statements, using the same accounting policies as in the consolidated financial statements. Valuation is based on recognition and measurement requirements of IFRS as adopted by the EU as explained in the notes to the consolidated financial statements.
• Accounting policies
Shareholders’ equity The translation reserve and other legal reserves were previously formed under, and are still recognised in accordance with, the Dutch Civil Code.
A. Company disclosures
A.1 Investments The below table provides an overview of the movements of the investments during the year:
In millions of €Participating
interests
Loans to participating
interests Total
Balance as at 1 January 2020 19,197 10,476 29,673Profit/(loss) of participating interests (167) — (167)Dividend payments by participating interests (456) 456 —Effect of movements in exchange rates (1,974) — (1,974)Changes in hedging and fair value adjustments (53) — (53)Actuarial gains/(losses) 62 — 62Acquisition of non-controlling interests without a change in control
— — —
Investments/(repayments) (50) 1,139 1,089Other movements 1 — 1Balance as at 31 December 2020 16,560 12,071 28,631
Balance as at 1 January 2019* 17,550 10,264 27,814Profit of participating interests 2,506 — 2,506Dividend payments by participating interests (878) 878 —Effect of movements in exchange rates 310 — 310Changes in hedging and fair value adjustments 29 — 29Actuarial gains/(losses) (214) — (214)Acquisition of non-controlling interests without a change in control
(126) — (126)
Investments/(repayments) 20 (666) (646)Balance as at 31 December 2019 19,197 10,476 29,673
* Restated for IFRS 16.
For disclosures of significant direct and indirect participating interests, refer to notes 10.3 and 13.4 of the consolidated financial statements.
Notes to the Heineken N.V. Financial Statements
121 Heineken N.V. Annual Report 2020

A declaration of joint and several liability pursuant to the provisions of Section 403, Part 9, Book 2, of the Dutch Civil Code has been issued with respect to the following legal entities established in the Netherlands:
Country of incorporation
Percentage of ownership
2020 2019
Heineken Nederlands Beheer B.V. The Netherlands 100% 100%Heineken Group B.V. The Netherlands 100% 100%Heineken Brouwerijen B.V. The Netherlands 100% 100%Heineken CEE Investments B.V. The Netherlands 100% 100%Heineken Nederland B.V. The Netherlands 100% 100%Heineken International B.V. The Netherlands 100% 100%Heineken Supply Chain B.V. The Netherlands 100% 100%Heineken Global Procurement B.V. The Netherlands 100% 100%Heineken Mexico B.V. The Netherlands 100% 100%HIBV Skopje Holdings B.V. The Netherlands 100% 100%Heineken Beer Systems B.V. The Netherlands 100% 100%Amstel Brouwerij B.V. The Netherlands 100% 100%Vrumona B.V. The Netherlands 100% 100%B.V. Beleggingsmaatschappij Limba The Netherlands 100% 100%Brand Bierbrouwerij B.V. The Netherlands 100% 100%Brasinvest B.V. The Netherlands 100% 100%Heineken Asia Pacific B.V. The Netherlands 100% 100%B.V. Handel- en Exploitatie Maatschappij Schoonhoven1 The Netherlands n/a 100%Distilled Trading International B.V. The Netherlands 100% 100%Premium Beverages International B.V. The Netherlands 100% 100%De Brouwketel B.V. The Netherlands 100% 100%Proseco B.V. The Netherlands 100% 100%Roeminck Insurance N.V. The Netherlands 100% 100%Heineken Americas B.V. The Netherlands 100% 100%Heineken Export Americas B.V. The Netherlands 100% 100%Amstel Export Americas B.V. The Netherlands 100% 100%Heineken Brazil B.V. The Netherlands 100% 100%B.V. Panden Exploitatie Maatschappij PEM The Netherlands 100% 100%Heineken Exploitatie Maatschappij B.V. The Netherlands 100% 100%Hotel De L’Europe B.V. The Netherlands 100% 100%Hotel De L’Europe Monumenten I B.V. The Netherlands 100% 100%Hotel De L’Europe Monumenten II B.V. The Netherlands 100% 100%Heineken Groothandel B.V. The Netherlands 100% 100%Heineken Horeca Services B.V. The Netherlands 100% 100%
Country of incorporation
Percentage of ownership
2020 2019
Beerwulf B.V. The Netherlands 100% 100%Heineken Belize B.V. The Netherlands 100% 100%Heineken Netherlands Supply B.V. The Netherlands 100% 100%
1 Entity ceased to exist during 2020 following a legal merger.
• Accounting policies
Investments in other entities are measured on the basis of the equity method. The share of profit of these investments is the Company’s share of the investments’ results. Results on transfers of assets and liabilities between the Company and its participating interests are eliminated.
The Company shall eliminate any expected credit losses on intercompany loans or receivables against the book value of the intercompany loan or receivable in accordance with Directive 100.107a of the Dutch Accounting Standards Board.
A.2 Borrowings The borrowings of the Company comprise the following:
In millions of € 2020 2019
Unsecured bond issues 14,420 12,748Commercial paper 698 532Derivatives used for financing activities 14 28Total 15,132 13,308
The interest rate on the outstanding bonds as at 31 December 2020 was 2.3% (2019: 2.5%). As at 31 December 2020, 8.8 billion (2019: €7.7 billion) of the outstanding bonds have a maturity longer than 5 years.
The movement in other net finance income/expense for the year is due to the positive transactional foreign exchange effects on foreign currency denominated loans.
Notes to the Heineken N.V. Financial Statements
122 Heineken N.V. Annual Report 2020

During the year the movements in borrowings were as follows:
In millions of €Unsecured bond
issuesCommercial
paper
Derivatives used for financing
activities Total
Balance as at 1 January 2020 12,748 532 28 13,308Effects of movements of exchange rates (313) — (19) (332)Proceeds 2,972 1,948 5 4,925Repayments (1,000) (1,782) — (2,782)Other 13 — — 13Balance as at 31 December 2020 14,420 698 14 15,132
B. Other
B.1 Auditor fees Fees for audit services include the audit of the financial statements of the Company and its subsidiaries. Fees for other audit services include review of interim financial statements, sustainability, subsidy and other audits. Fees for tax services include tax compliance and tax advice. Fees for other non-audit services include agreed-upon procedures and advisory services. Fees for tax and other non-audit services are related to the network outside the Netherlands and are in accordance with local independence regulation.
In 2020 €10.9 million of fees are recognised in the consolidated financial statements for services provided by Deloitte Accountants B.V. and its member firms and/or affiliates (2019: €10.3 million). In the overview below, the breakdown per type of service is provided:
Deloitte Accountants B.V.
Other Deloitte member firms and affiliates Total
In millions of € 2020 2019 2020 2019 2020 2019
Audit of HEINEKEN and its subsidiaries
3.0 3.1 7.1 6.4 10.1 9.5
Other audit services 0.2 0.3 0.4 0.2 0.6 0.5Tax services — — — 0.1 — 0.1Other non-audit services — — 0.2 0.2 0.2 0.2Total 3.2 3.4 7.7 6.9 10.9 10.3
• Accounting policies
Fees for audit services are included in the other expenses in the consolidated financial statements (refer to note 6.3 of the consolidated financial statements for more information). These fees are recognised when the service is provided.
B.2 Off-balance sheet commitments
In millions of € Total 2020Less than
1 year 1 – 5 yearsMore than
5 years Total 2019
Undrawn committed bank facility 3,500 — 3,500 — 3,500
2020 2019
Third parties
HEINEKEN companies
Third parties HEINEKEN companies
Declarations of joint and several liability — 2,350 — 3,128
The legal entities to which the declarations of joint and several liability relate, are listed in note A.1. The declarations include a conditional guarantee for the deficit of the defined benefit pension plan of HEINEKEN UK (Scottish and Newcastle pension plan) as calculated in accordance with IAS 19. Through this guarantee Heineken N.V. is ultimately liable for the payments, including any potential recovery payments, to the pension plan. Refer to note 9.1 of the consolidated financial statements for more information.
Fiscal unity The Company is part of the fiscal unity of HEINEKEN in the Netherlands. As a result, the Company is liable for the tax liability of the fiscal unity in the Netherlands.
Notes to the Heineken N.V. Financial Statements
123 Heineken N.V. Annual Report 2020

B.3 Subsequent events For subsequent events, refer to note 13.5 of the consolidated financial statements.
B.4 Other disclosures Remuneration Refer to note 13.3 of the consolidated financial statements for the remuneration and incentives of the Executive Board and Supervisory Board.
Executive and Supervisory Board statement The members of the Supervisory Board signed the financial statements in order to comply with their statutory obligation pursuant to Article 2:101, paragraph 2, of the Dutch Civil Code.
The members of the Executive Board signed the financial statements in order to comply with their statutory obligation pursuant to Article 2:101, paragraph 2, of the Dutch Civil Code and Article 5:25c, paragraph 2 sub c, of the Financial Markets Supervision Act.
Amsterdam, 9 February 2021 Executive Board Supervisory Board
Van den Brink HuëtDebroux Fernández Carbajal
Dasde Carvalho
NavarreAstaburuaga Sanjinés
Mars-WrightHelmes
RipleyArnold
Notes to the Heineken N.V. Financial Statements
124 Heineken N.V. Annual Report 2020
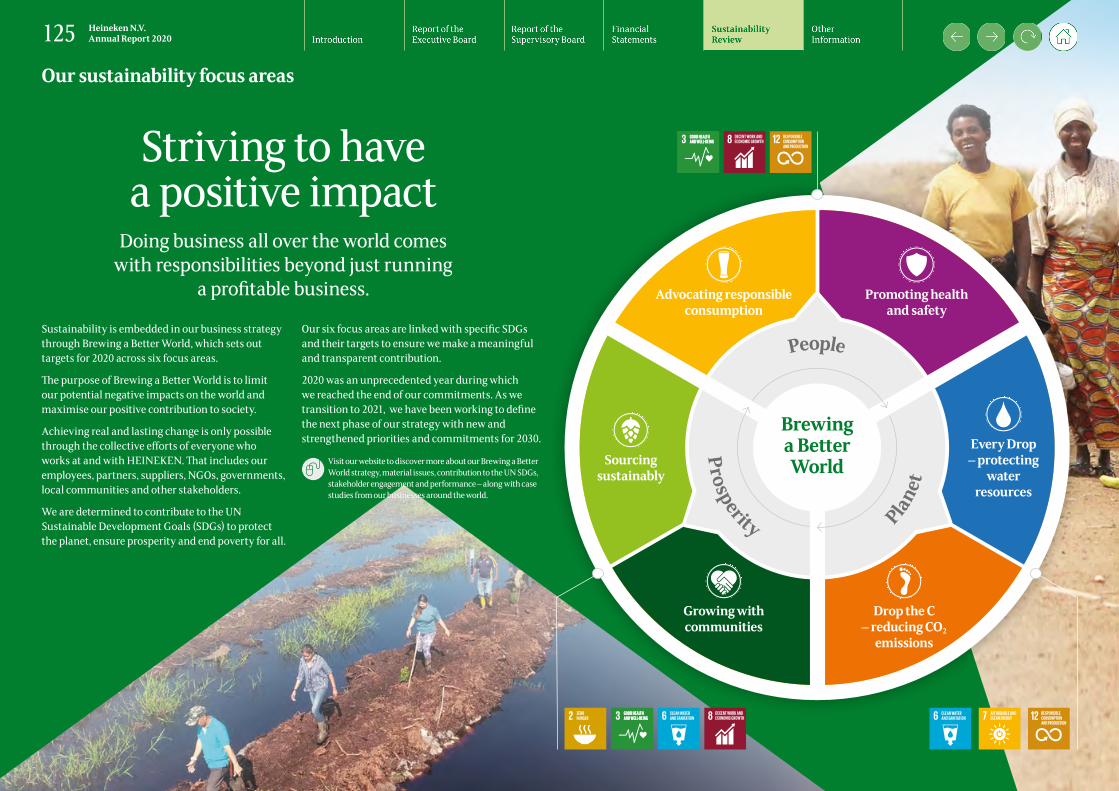
Sustainability is embedded in our business strategy through Brewing a Better World, which sets out targets for 2020 across six focus areas.
The purpose of Brewing a Better World is to limit our potential negative impacts on the world and maximise our positive contribution to society.
Achieving real and lasting change is only possible through the collective efforts of everyone who works at and with HEINEKEN. That includes our employees, partners, suppliers, NGOs, governments, local communities and other stakeholders.
We are determined to contribute to the UN Sustainable Development Goals (SDGs) to protect the planet, ensure prosperity and end poverty for all.
Our six focus areas are linked with specific SDGs and their targets to ensure we make a meaningful and transparent contribution.
2020 was an unprecedented year during which we reached the end of our commitments. As we transition to 2021, we have been working to define the next phase of our strategy with new and strengthened priorities and commitments for 2030.
Visit our website to discover more about our Brewing a Better World strategy, material issues, contribution to the UN SDGs, stakeholder engagement and performance – along with case studies from our businesses around the world.
Doing business all over the world comes with responsibilities beyond just running
a profitable business.
Brewing a Better World
People
Prosperity Planet
Promoting health and safety
Growing with communities
Sourcing sustainably
Advocating responsibleconsumption
Every Drop – protecting
water resources
Drop the C – reducing CO2
emissions
Striving to have a positive impact
Our sustainability focus areas
125 Heineken N.V. Annual Report 2020
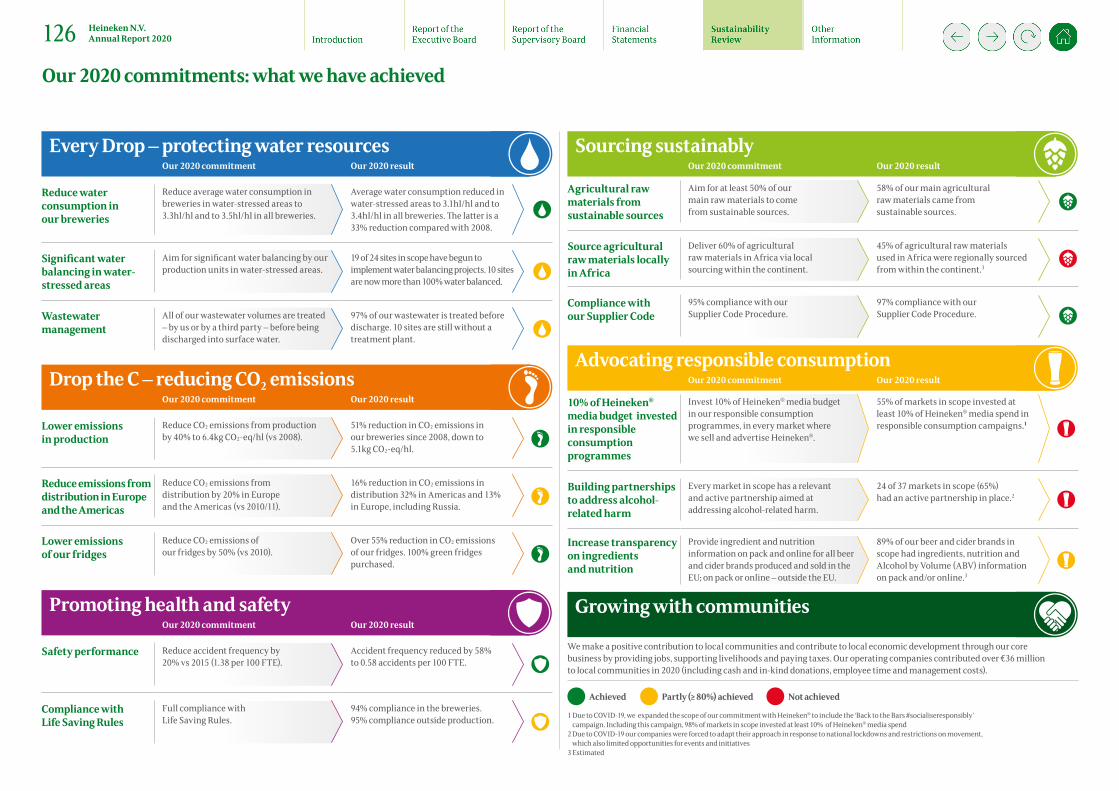
We make a positive contribution to local communities and contribute to local economic development through our core business by providing jobs, supporting livelihoods and paying taxes. Our operating companies contributed over €36 million to local communities in 2020 (including cash and in-kind donations, employee time and management costs).
Reduce water consumption in our breweries
Reduce average water consumption in breweries in water-stressed areas to 3.3hl/hl and to 3.5hl/hl in all breweries.
Average water consumption reduced in water-stressed areas to 3.1hl/hl and to 3.4hl/hl in all breweries. The latter is a 33% reduction compared with 2008.
Significant water balancing in water-stressed areas
Aim for significant water balancing by our production units in water-stressed areas.
19 of 24 sites in scope have begun to implement water balancing projects. 10 sites are now more than 100% water balanced.
Wastewater management
All of our wastewater volumes are treated – by us or by a third party – before being discharged into surface water.
97% of our wastewater is treated before discharge. 10 sites are still without a treatment plant.
Every Drop – protecting water resources Our 2020 commitment Our 2020 result
Agricultural raw materials from sustainable sources
Aim for at least 50% of our main raw materials to come from sustainable sources.
58% of our main agricultural raw materials came from sustainable sources.
Source agricultural raw materials locally in Africa
Deliver 60% of agricultural raw materials in Africa via local sourcing within the continent.
45% of agricultural raw materials used in Africa were regionally sourced from within the continent.3
Compliance with our Supplier Code
95% compliance with our Supplier Code Procedure.
97% compliance with our Supplier Code Procedure.
Sourcing sustainably Our 2020 commitment Our 2020 result
Lower emissions in production
Reduce CO2 emissions from production by 40% to 6.4kg CO2-eq/hl (vs 2008).
51% reduction in CO2 emissions in our breweries since 2008, down to 5.1kg CO2-eq/hl.
Reduce emissions from distribution in Europe and the Americas
Reduce CO2 emissions from distribution by 20% in Europe and the Americas (vs 2010/11).
16% reduction in CO2 emissions in distribution 32% in Americas and 13% in Europe, including Russia.
Lower emissions of our fridges
Reduce CO2 emissions of our fridges by 50% (vs 2010).
Over 55% reduction in CO2 emissions of our fridges. 100% green fridges purchased.
Drop the C – reducing CO2 emissions Our 2020 commitment Our 2020 result 10% of Heineken®
media budget invested in responsible consumption programmes
Invest 10% of Heineken® media budget in our responsible consumption programmes, in every market where we sell and advertise Heineken®.
55% of markets in scope invested at least 10% of Heineken® media spend in responsible consumption campaigns.1
Building partnerships to address alcohol-related harm
Every market in scope has a relevant and active partnership aimed at addressing alcohol-related harm.
24 of 37 markets in scope (65%) had an active partnership in place.2
Increase transparency on ingredients and nutrition
Provide ingredient and nutrition information on pack and online for all beer and cider brands produced and sold in the EU; on pack or online – outside the EU.
89% of our beer and cider brands in scope had ingredients, nutrition and Alcohol by Volume (ABV) information on pack and/or online.3
Advocating responsible consumption Our 2020 commitment Our 2020 result
Growing with communities
Safety performance Reduce accident frequency by 20% vs 2015 (1.38 per 100 FTE).
Accident frequency reduced by 58% to 0.58 accidents per 100 FTE.
Compliance with Life Saving Rules
Full compliance with Life Saving Rules.
94% compliance in the breweries. 95% compliance outside production.
Promoting health and safety Our 2020 commitment Our 2020 result
1 Due to COVID-19, we expanded the scope of our commitment with Heineken® to include the ‘Back to the Bars #socialiseresponsibly’ campaign. Including this campaign, 98% of markets in scope invested at least 10% of Heineken® media spend
2 Due to COVID-19 our companies were forced to adapt their approach in response to national lockdowns and restrictions on movement, which also limited opportunities for events and initiatives
3 Estimated
Achieved Partly (≥ 80%) achieved Not achieved
Our 2020 commitments: what we have achieved
126 Heineken N.V. Annual Report 2020

Our 2030 Targets
Water Stewardship
Fully balance the water that is used in our products, in water-stressed areas
Work collectively with other stakeholders
Water Circularity
Maximise reuse and recycling in water-stressed areas
Treat 100% of wastewater of all breweries
Water Efficiency
2.8 litre per litre beer produced, for breweries in water-stressed areas
3.2 litre per litre for all breweries worldwide
Water is a crucial shared resource that must be protected. Based on projected demand, the world will face a 40% shortfall in fresh water supply within 10 years. Water is also essential for growing crops and making our products. We depend on access to high quality water to sustain our operations.
That is why in 2019 we launched our new 2030 strategy, Every Drop, to address our water vulnerabilities, especially in water-stressed areas.
We have reduced our water usage by more than a third over the past decade and introduced additional commitments for our breweries in water-stressed areas.
Our Every Drop 2030 strategy aims to make a positive contribution to secure the health of local watersheds, specifically in water-stressed areas. We believe our biggest long term impact will be created by adopting three key principles of our ‘water triangle’: Water Stewardship (restore watersheds to absorb more water); Water Circularity (treat wastewater and reusing water); and Water Efficiency (using as little water as possible).
Local context in water-stressed areasWhen we set our 2020 commitments, 24 production sites were identified as being in water-stressed areas. Today, 30 sites in 12 countries are in scope for our 2030 commitments in water stressed areas.
Every watershed is unique and each site requires a contextual approach. Our breweries in water-stressed areas have developed roadmaps of action to support a healthy watershed by 2030.
Advocating for changeIn March 2020, the UN Global Compact’s CEO Water Mandate launched an industry-driven Water Resilience Coalition with the aim of elevating the global water agenda and taking action in water-stressed areas. We are one of the signatories of the pledge to focus investments in water-stressed areas and drive
collaboration to achieve bold commitments by 2050. The aim is to improve availability, quality and accessibility of freshwater resources by the members. Together, we encourage others to join forces and help secure long term water security.
Tackling water use in agricultureGrowing crops, mainly barley (which is a water efficient crop), accounts for 90% of our water footprint. We work with a large number of farmers to comply with the Sustainable Agriculture Initiative Platform standards.
We are investigating innovative ways to further improve agricultural practices, embed water optimisation and expand our agriculture programmes to address climate change challenges.
Learn more about this topic on our website
Our water ambition for 2030
MexicoMonterrey, Guadalajara,Tecate, Toluca
NigeriaLagos, Sanga Ota, Ibadan, Ijebu Ode
BrazilPacatuba, Itu
South AfricaSedibeng
MalaysiaPetaling Jaya
IndonesiaTangerang, Sampang Agung, Sampang Agung So�
EthiopaHarar, Bedele
EgyptEl Obour, Gianaclis,Sharkia, 6th of October
TunisiaGrombalia, Grombalia So�, Ksar Lemsa
SpainMadrid, Valencia,Sevilla, Jaen
AlgeriaRouiba
ItalyMassafra
2
1
Looking ahead: Similar to 2011 and 2016, we will conduct an in-depth water risk-assessment in 2021 to assess current and future risks arising from the watersheds in which our breweries are located.
Production sites in water-stressed areasWe have been assessing water-related risks since 2010 and focus our immediate efforts on the 30 breweries in water-stressed areas.
New sites under investigation:1 Meoqui – Mexico 2 Igarassu – Brazil
1
2
Every Drop – protecting water resources
127 Heineken N.V. Annual Report 2020

Looking ahead: In the coming years, we will channel investments through the Water Good Practices Management initiatives to drive progress on water consumption and recycling.
Our 2020 commitment was to reduce average water consumption in our breweries to 3.5hl/hl compared with 2008. We surpassed the commitment by reducing our average water consumption to 3.4hl/hl (2019: 3.4hl/hl). This represents a 33% decrease in water consumption since 2008 (5.0 hl/hl).
In water-stressed areas, we also surpassed our target of 3.3hl/hl, with an average water consumption in our breweries of 3.1hl/hl. These achievements are the result of adopting good practices and improving water efficiency at our production sites. We are working with 31 production sites, accounting for 5% of total volume, where water consumption remains more than 5hl/hl (2019: 28 sites, 4%).
Investing in technology to reclaim and recycle water from production processes is a high priority, especially in water-stressed areas.
– Our brewery in Spain (Jaen), reduced the water consumption by 12% through redesigning its water network and by addressing leakages.
– In Indonesia (Tangerang), a newly constructed Water Reclamation Plant uses water recycling technology to reclaim wastewater at drinking water quality. It has enabled production of soft-water for the secondary utilities, such as bottle washer, pasteurizer, boiler feed water and general cleaning, which resulted in a water consumption reduction of 35%.
Reduce water consumption in our breweries
Improving water reclamation in Mexico Since it started up early 2020, the new water reclamation plant at our brewery in Meoqui has helped reduce water use from 2.99hl/hl to 2.69hl/hl. The recycled water is reused in evaporative condensers and processes such as the CO2 plant, as well as for on-site landscaping. By improving the efficiency of the reverse osmosis system and challenging operational standards, the team in Mexico managed to achieve a further 10% reduction in water use.
Water consumption (water-stressed areas)(hl/hl beer, cider, soft drinks and water)
baseline
3.13.23.23.3
20202019201820172016
2020 target
3.1
20152014
3.63.8
Water consumption (global average)(hl/hl beer, cider, soft drinks and water)
baseline
3.53.4
3.63.65.0
2020201920182017
20082016
2020 target
3.4
33%Decrease in water consumption in our breweries since 2008
16,100Olympic-sized pools- the equivalent volume of water we saved since 2008
€15msaved through water efficiency since 2009
Our contribution to the SDGs:
6.4Substantially increase water-use efficiency
Our commitment:Reduce average water consumption in our breweries to 3.3 hl/hl in water-stressed areas and to 3.5 hl/hl in all our breweries
Our 2020 result:
Achieved
Total water withdrawal,including sources
Groundwater Surface water �ird-party water
52%
32%
16%
The initiative will support breweries around the world to optimise water consumption and reuse as much water as possible, in a sustainable way.
Learn more about this topic on our website
Accelerating efficiency through knowledge managementLaunched in 2020, the Water Good Practices Management initiative aims to accelerate progress by sharing technical knowledge, supporting collaboration and promoting a zero loss culture across our breweries. So far, it has identified over 85 proven good practices for good water management in production.
87.2m m3
Every Drop – protecting water resources
128 Heineken N.V. Annual Report 2020
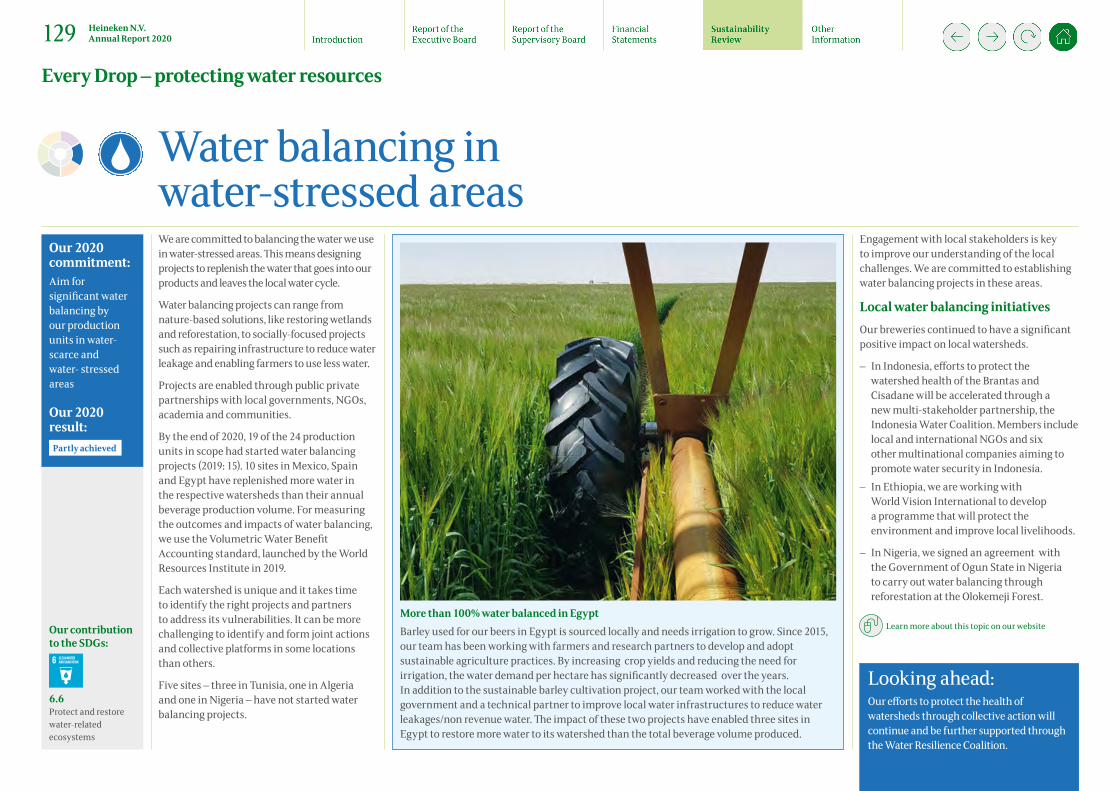
More than 100% water balanced in EgyptBarley used for our beers in Egypt is sourced locally and needs irrigation to grow. Since 2015, our team has been working with farmers and research partners to develop and adopt sustainable agriculture practices. By increasing crop yields and reducing the need for irrigation, the water demand per hectare has significantly decreased over the years. In addition to the sustainable barley cultivation project, our team worked with the local government and a technical partner to improve local water infrastructures to reduce water leakages/non revenue water. The impact of these two projects have enabled three sites in Egypt to restore more water to its watershed than the total beverage volume produced.
We are committed to balancing the water we use in water-stressed areas. This means designing projects to replenish the water that goes into our products and leaves the local water cycle.
Water balancing projects can range from nature-based solutions, like restoring wetlands and reforestation, to socially-focused projects such as repairing infrastructure to reduce water leakage and enabling farmers to use less water.
Projects are enabled through public private partnerships with local governments, NGOs, academia and communities.
By the end of 2020, 19 of the 24 production units in scope had started water balancing projects (2019: 15). 10 sites in Mexico, Spain and Egypt have replenished more water in the respective watersheds than their annual beverage production volume. For measuring the outcomes and impacts of water balancing, we use the Volumetric Water Benefit Accounting standard, launched by the World Resources Institute in 2019.
Each watershed is unique and it takes time to identify the right projects and partners to address its vulnerabilities. It can be more challenging to identify and form joint actions and collective platforms in some locations than others.
Five sites – three in Tunisia, one in Algeria and one in Nigeria – have not started water balancing projects.
Water balancing in water-stressed areas
Our contribution to the SDGs:
6.6Protect and restore water-related ecosystems
Our 2020 commitment:Aim for significant water balancing by our production units in water-scarce and water- stressed areas
Our 2020 result:
Partly achieved
Looking ahead: Our efforts to protect the health of watersheds through collective action will continue and be further supported through the Water Resilience Coalition.
Engagement with local stakeholders is key to improve our understanding of the local challenges. We are committed to establishing water balancing projects in these areas.
Local water balancing initiativesOur breweries continued to have a significant positive impact on local watersheds.
– In Indonesia, efforts to protect the watershed health of the Brantas and Cisadane will be accelerated through a new multi-stakeholder partnership, the Indonesia Water Coalition. Members includelocal and international NGOs and six other multinational companies aiming to promote water security in Indonesia.
– In Ethiopia, we are working with World Vision International to develop a programme that will protect the environment and improve local livelihoods.
– In Nigeria, we signed an agreement with the Government of Ogun State in Nigeriato carry out water balancing through reforestation at the Olokemeji Forest.
Learn more about this topic on our website
Every Drop – protecting water resources
129 Heineken N.V. Annual Report 2020
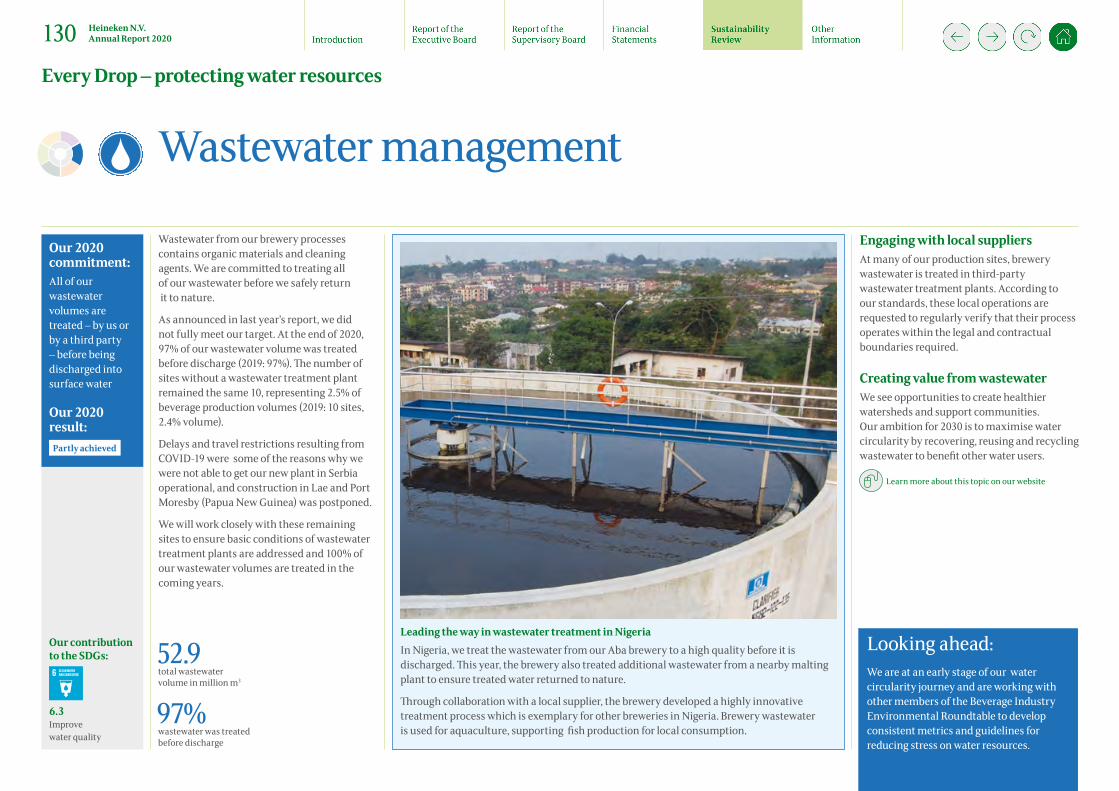
Looking ahead: We are at an early stage of our water circularity journey and are working with other members of the Beverage Industry Environmental Roundtable to develop consistent metrics and guidelines for reducing stress on water resources.
Wastewater from our brewery processes contains organic materials and cleaning agents. We are committed to treating all of our wastewater before we safely return it to nature.
As announced in last year’s report, we did not fully meet our target. At the end of 2020, 97% of our wastewater volume was treated before discharge (2019: 97%). The number of sites without a wastewater treatment plant remained the same 10, representing 2.5% of beverage production volumes (2019: 10 sites, 2.4% volume).
Delays and travel restrictions resulting from COVID-19 were some of the reasons why we were not able to get our new plant in Serbia operational, and construction in Lae and Port Moresby (Papua New Guinea) was postponed.
We will work closely with these remaining sites to ensure basic conditions of wastewater treatment plants are addressed and 100% of our wastewater volumes are treated in the coming years.
Wastewater management
Leading the way in wastewater treatment in NigeriaIn Nigeria, we treat the wastewater from our Aba brewery to a high quality before it is discharged. This year, the brewery also treated additional wastewater from a nearby malting plant to ensure treated water returned to nature.
Through collaboration with a local supplier, the brewery developed a highly innovative treatment process which is exemplary for other breweries in Nigeria. Brewery wastewater is used for aquaculture, supporting fish production for local consumption.
Our contribution to the SDGs:
6.3Improve water quality
Our 2020 commitment:All of our wastewater volumes are treated – by us or by a third party – before being discharged intosurface water
Our 2020 result:
Partly achieved
Engaging with local suppliersAt many of our production sites, brewery wastewater is treated in third-party wastewater treatment plants. According to our standards, these local operations are requested to regularly verify that their process operates within the legal and contractual boundaries required.
Creating value from wastewaterWe see opportunities to create healthier watersheds and support communities. Our ambition for 2030 is to maximise water circularity by recovering, reusing and recycling wastewater to benefit other water users.
Learn more about this topic on our website
52.9total wastewater volume in million m3
97%wastewater was treated before discharge
Every Drop – protecting water resources
130 Heineken N.V. Annual Report 2020
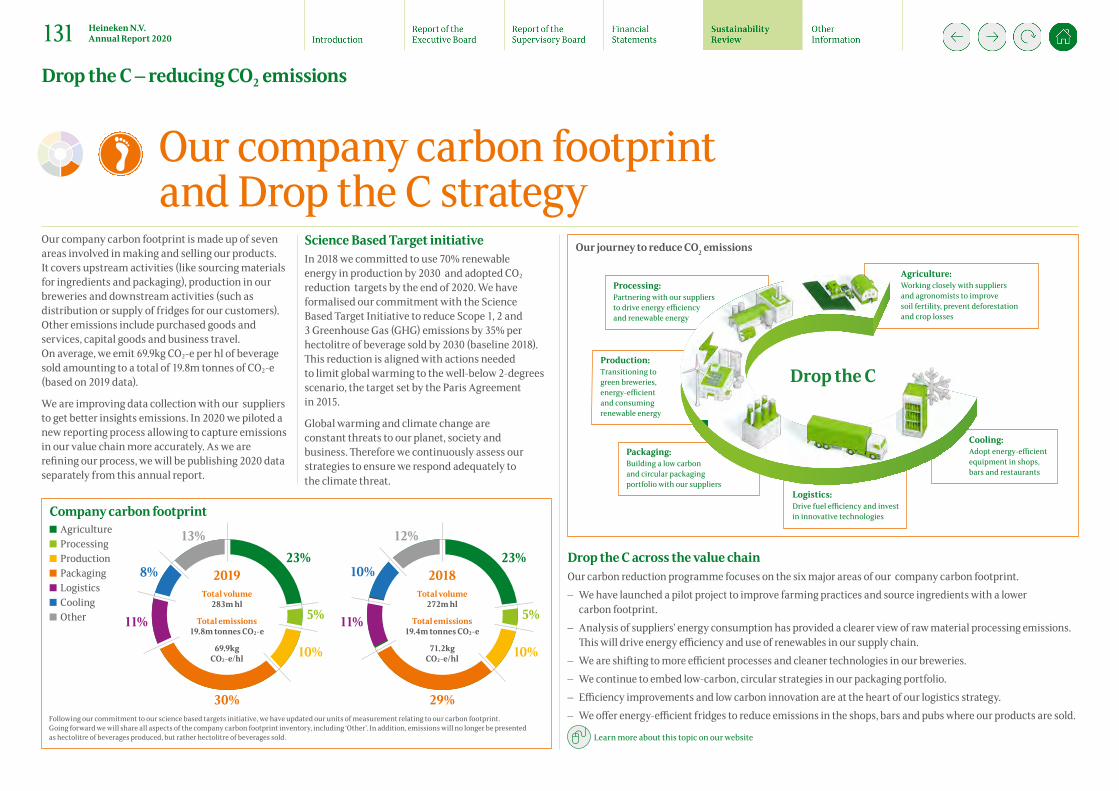
Our company carbon footprint is made up of seven areas involved in making and selling our products. It covers upstream activities (like sourcing materials for ingredients and packaging), production in our breweries and downstream activities (such as distribution or supply of fridges for our customers). Other emissions include purchased goods and services, capital goods and business travel. On average, we emit 69.9kg CO2-e per hl of beverage sold amounting to a total of 19.8m tonnes of CO2-e (based on 2019 data).
We are improving data collection with our suppliers to get better insights emissions. In 2020 we piloted a new reporting process allowing to capture emissions in our value chain more accurately. As we are refining our process, we will be publishing 2020 data separately from this annual report.
Science Based Target initiativeIn 2018 we committed to use 70% renewable energy in production by 2030 and adopted CO2 reduction targets by the end of 2020. We have formalised our commitment with the Science Based Target Initiative to reduce Scope 1, 2 and 3 Greenhouse Gas (GHG) emissions by 35% per hectolitre of beverage sold by 2030 (baseline 2018). This reduction is aligned with actions needed to limit global warming to the well-below 2-degrees scenario, the target set by the Paris Agreement in 2015.
Global warming and climate change are constant threats to our planet, society and business. Therefore we continuously assess our strategies to ensure we respond adequately to the climate threat.
Our company carbon footprint and Drop the C strategy
Our journey to reduce CO2 emissions
Drop the C across the value chainOur carbon reduction programme focuses on the six major areas of our company carbon footprint.
– We have launched a pilot project to improve farming practices and source ingredients with a lower carbon footprint.
– Analysis of suppliers’ energy consumption has provided a clearer view of raw material processing emissions. This will drive energy efficiency and use of renewables in our supply chain.
– We are shifting to more efficient processes and cleaner technologies in our breweries. – We continue to embed low-carbon, circular strategies in our packaging portfolio. – Efficiency improvements and low carbon innovation are at the heart of our logistics strategy. – We offer energy-efficient fridges to reduce emissions in the shops, bars and pubs where our products are sold.
Learn more about this topic on our website
Drop the C
Our journey to reduce CO2 emissions.
Cooling:Adopt energy-ecient equipment in shops, bars and restaurants
Logistics:Drive fuel eciency and invest in innovative technologies
Packaging:Building a low carbon and circular packaging portfolio with our suppliers
Processing:Partnering with our suppliers to drive energy eciency and renewable energy
Agriculture:Working closely with suppliers and agronomists to improve soil fertility, prevent deforestation and crop losses
Production:Transitioning to green breweries, energy-ecient and consuming renewable energy
Drop the C – reducing CO2 emissions
Company carbon footprint
Following our commitment to our science based targets initiative, we have updated our units of measurement relating to our carbon footprint. Going forward we will share all aspects of the company carbon footprint inventory, including ‘Other’. In addition, emissions will no longer be presented as hectolitre of beverages produced, but rather hectolitre of beverages sold.
Agriculture Processing Production Packaging Logistics Cooling Other
23%
11%
8%
13%
5%
10%
30%
2019Total volume
283m hl
Total emissions 19.8m tonnes CO2-e
69.9kg CO2-e/hl
23%
11%
10%
12%
5%
10%
29%
2018Total volume
272m hl
Total emissions 19.4m tonnes CO2-e
71.2kg CO2-e/hl
131 Heineken N.V. Annual Report 2020

Lower emissions in production We achieved our target in 2016 and have continued to reduce emissions in production.
In 2020, CO2 emissions per hectolitre from our breweries decreased 51% compared with 2008 (2019: 49%).
While production volumes were 71% higher, absolute emissions were 16% less than in 2008. This shows business growth and lower emissions can go hand-in-hand.
CO2 emissions in production(kg CO2-e/hl beer, cider, soft drinks and water)
2020 target
baseline
5.15.35.56.16.5
10.4
202020192018201720162008
The specific electricity consumption was 7,9kWh/hl and thermal energy consumption was 56,0MJ/hl. HEINEKEN’s overall beverage production sites had a combined energy consumption of 84.5MJ/hl.
Reducing emissions through energy efficiency In spite of disruptions to production due to COVID-19, our energy efficiency has continued to increase. This was mainly achieved through improved processes of
our methodologies and global Energy Good Practices Management Initiative.
The Monterrey brewery in Mexico achieved a 25% reduction in electricity and a 46% reduction in thermal energy consumption, avoiding more than 1,000 tonnes of CO2.
In Poland, we optimised a pasteuriser to avoid unnecessary hot and cold energy consumption. This resulted in a 15% reduction of thermal energy consumption.
Transitioning to renewable energy We aim to use 70% renewable energy by 2030 in production, including renewable electricity (solar, wind, hydro) and renewable thermal energy (biogas, waste heat pumps, biomass). 22% of our energy came from renewable sources, including 32% of electrical and 18% of thermal energy (2019: 19%, 33%, 13%).
In all parts of the world, solar and wind are becoming increasingly competitive, enabling us to secure significant renewable electricity projects. As a result, there was rapid progress in our transition to renewable electricity in 2020.
We partnered with Philips, Signify and Nouryon to develop a wind farm in Finland. It will allow 13 of our European markets to source green energy through a virtual power purchase agreement.
In comparison to renewable electricity, the renewable thermal industry is relatively young and lacks the same global scale as renewable electricity.
We are developing projects to decarbonise our thermal energy beyond biomass and biogas by reducing demand, recovering waste heat and generating steam from solar energy.
– In Brazil, boilers commissioned at two breweries will use sustainable biomass,meaning three breweries will exceed renewable energy targets.
– Two UK breweries have started using heat and power from biogas recovered from waste water treatment facilities topower production.
– In Spain, heat is being sourced from a biomass boiler and using sustainable oliveresidue as a renewable fuel.
Learn more about this topic on our website
Lower emissions in production
Our contribution to the SDGs:
7.2Share of renewable energy
7.3Double the improvement of energy efficiency
Our 2020 commitment:Reduce CO2 emissions from production by 40%, vs 2008, to 6.4 kg CO2/hl
Our 2020 result:
Achieved
Progressing towards 100% renewable energy in IndonesiaMulti Bintang aims to use 100% renewable energy in production by 2025. By the end of 2020, it had achieved 38% renewable energy with a biomass plant, commissioned at Sampangagung Brewery in 2018, which uses certified sustainable biomass (rice husk) as a fuel. A second biomass plant will start up at Tangerang brewery in 2021, putting Multi Bintang on track to reach its climate goals.
Going solar in SpainIn Spain, we have announced a partnership with Iberdrola to source 100% solar power. A new solar farm in Andalusia became operational in October and will provide 100% renewable electricity to all four breweries as well as its offices.
Looking ahead: Our industry must come together to facilitate the transition to renewable energy and achieve the full scale and impact that is required.We continue to engage in partnerships and initiatives such as RE-Source, the European platform for corporate renewable electricity sourcing.
Drop the C – reducing CO2 emissions
132 Heineken N.V. Annual Report 2020

Looking ahead: Our 2030 Drop the C ambition will drive reduction in CO2 emissions from logistics, with the focus on our 17 largest markets.
We will further optimise our logistic supply chain and look for opportunities to invest in low-carbon technologies.
Transport accounts for 11% of our company carbon footprint. We are committed to investing in innovative and sustainable solutions for our logistics. To drive emissions down, we focus on optimising routes, shifting to fuel-efficient transport and collaborating with our suppliers to adopt low carbon technologies.
In 2020, the impact of COVID-19 varied across markets and we had to respond quickly and decisively to adapt to changing market conditions and consumer demand. In some markets, the temporary closure of on-trade led to a reduction in carbon intense last-mile deliveries. In others, it led to an increase in off-trade long-haul deliveries and, as a result, CO2 emissions increased.
Despite accelerated improvement in our emissions, we have not reached our 2020 ambition of a 20% reduction vs 2010/2011. We achieved a 16% decrease in emissions vs the baseline and an 4% decrease compared with 2019. 12 of 23 markets surpassed the 20% reduction target (2019: 9 markets).
In Americas, we have reached our target, reducing our emissions by 32% vs the baseline and 3% vs last year.
In Europe and Russia, we have not reached our target. We reduced emissions by 13% vs the baseline and 4% vs last year, mainly driven by improved distribution networks in Spain, UK and Poland.
Collaborating with suppliersWe continue to strengthen our collaboration with Logistics Service Providers and other partners to drive down emissions.
We are working with peers through industry platforms, such as Smart Freight Centre and Clean Cargo Working Group, to move the transport sector towards decarbonisation.
We are committed to supporting Europe’s ambition for a cleaner, greener freight transport system. In November, we joined 62 other stakeholders in signing an industry coalition statement pledging to invest in the development, production and deployment of hydrogen trucks.
We use telematics to identify non-economical driver behaviours and to train and incentivise drivers to adopt eco-friendly and safe driving techniques. Now, we are also using these driver behaviour insights from telematics data to reduce our carbon footprint, with our Fuel Management programme. This programme was deployed in four markets - Burundi, Brazil, Portugal and DRC. Due to COVID-19 disruptions in 2020, we did not deploy the programme in the other 10 markets as planned, and instead worked with our carriers to recover from the crisis.
Learn more about this topic on our website
Pioneering zero emissions shipping in the NetherlandsIn the Netherlands, we contributed to the development of a new battery-based energy system for zero emissions transportation of containers by inland barge. The project resulted in the launch of a new company, Zero Emission Services (ZES), which will supply zero emission services to the entire inland shipping sector. In the Netherlands, we ship 70,000 containers annually and supporting ZES as its first customer.
Lower emissions in logistics
Our contribution to the SDGs:
7.2Share of renewable energy
7.3Double the improvement of energy efficiency
Our 2020 commitment:Reduce CO2 emissions from distribution by 20% in Europe and the Americas
Our 2020 result:
Partly achieved
CO2 emissions in logistics(kg CO2/hl sold)
3.33.33.43.53.8
202020192018201720162011
2020 target
3.2
baseline*
* Baseline year 2010 for Mexico and the Netherlands. 2011for all other Operating Companies in scope.
Drop the C – reducing CO2 emissions
133 Heineken N.V. Annual Report 2020

We began our journey to reduce the carbon footprint of our fridges through the Green Cooling programme in 2010. It set a new standard for cooling by phasing out HFCs, improving fridge specifications and shifting away from using open front fridges.
In 2020, 100% of the fridges we purchased had one or more of the required features: use of hydrocarbon refrigerant; LED illumination; an energy management system; and/or energy efficient fans.
Average CO2 emissions from our fridges is now over 55% less than in 2010.
Managing the lifecycle of our equipment and limiting waste is an ongoing priority. This includes optimising demand for new coolers, ensuring that coolers are kept in use for as long as possible and that they are refurbished or upgraded where feasible.
Ensuring the right coolers in the right outlet
Our newly introduced cooler allocation tool enables us to effectively deploy coolers in selected markets.
Lower emissions in our fridges
Our contribution to the SDGs:
7.3Double the improvement of energy efficiency
Our 2020 commitment:100% of purchased fridges are green. Reduce the CO2 emissions of our fridges by 50%
Our 2020 result:
Achieved
Looking ahead: We will reduce our cooling carbon footprint even more by working with suppliers to develop the sustainable cooler of the future. We have set a new energy efficiency standard for any new fridge purchased from 2021 and will leverage technology and local partner capability to evolve the management of our fleet of coolers.
To optimise demand for new coolers, we will ensure they are kept in use for as long as possible at our managed outlets and refurbish and upgrade them wherever possible.
Refurbished fridges in the NetherlandsIn the Netherlands, we have worked with our supplier in charge of fridge maintenance and refurbishment to introduce a ‘refurbish first’ policy with all our partners.
The aim is to re-use fridges, where economically and environmentally viable, before buying a new one. If a refurbished fridge cannot be placed with a customer in the Netherlands, it is listed on the second hand Asset Marketplace to be used by another operating company.
In the first two years, 1,211 fridges were refurbished – 543 in 2019 and 668 in 2020* (+23%). This represents a reduction of more than 80% of planned fridge purchases in 2021. * as of Q3 2020
Refurbishing and reusing fridgesWe promote reuse and redeployment of fridges to save resources and reduce waste. We have launched a second hand Asset Marketplace and introduced a ‘refurbish first’ approach to keep coolers with minor defects in use for as long as possible.
End of life managementWe work with manufacturers to collect fridges and reuse of spare parts and components such as glass doors and shelves in new fridges.
Learn more about this topic on our website
Drop the C – reducing CO2 emissions
134 Heineken N.V. Annual Report 2020
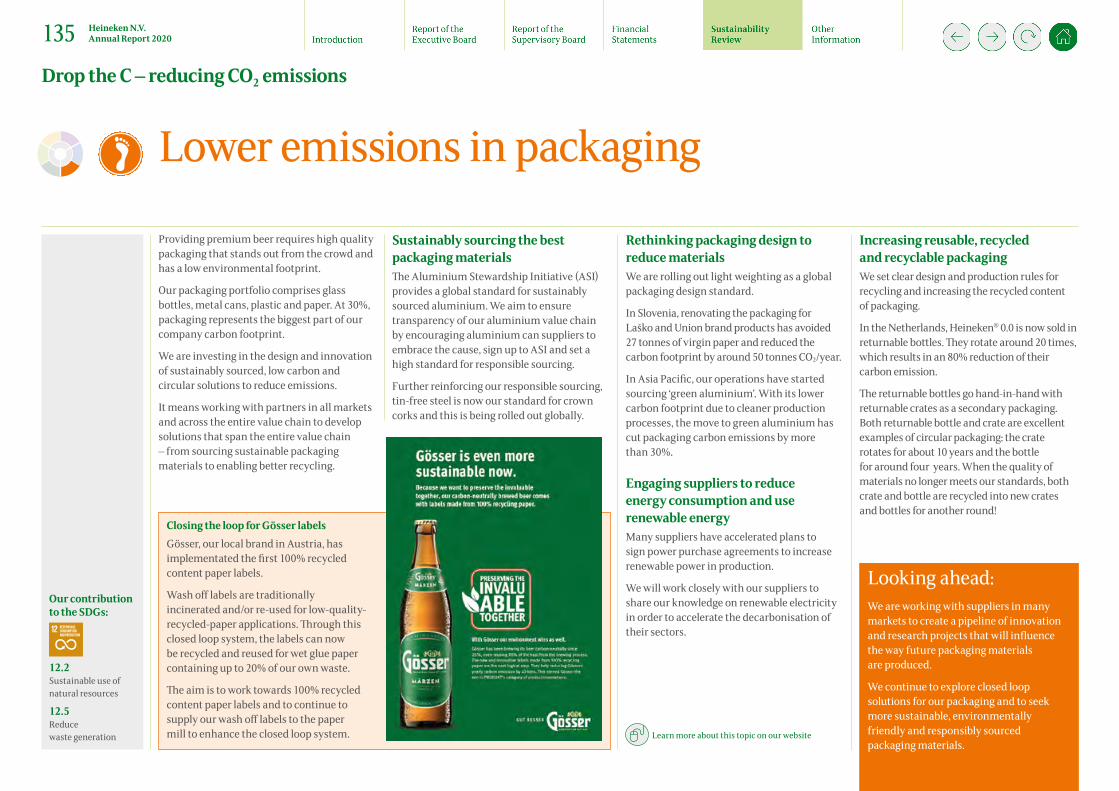
Closing the loop for Gösser labels Gösser, our local brand in Austria, has implementated the first 100% recycled content paper labels.
Wash off labels are traditionally incinerated and/or re-used for low-quality-recycled-paper applications. Through this closed loop system, the labels can now be recycled and reused for wet glue paper containing up to 20% of our own waste.
The aim is to work towards 100% recycled content paper labels and to continue to supply our wash off labels to the paper mill to enhance the closed loop system.
Looking ahead: We are working with suppliers in many markets to create a pipeline of innovation and research projects that will influence the way future packaging materials are produced.
We continue to explore closed loop solutions for our packaging and to seek more sustainable, environmentally friendly and responsibly sourced packaging materials.
Providing premium beer requires high quality packaging that stands out from the crowd and has a low environmental footprint.
Our packaging portfolio comprises glass bottles, metal cans, plastic and paper. At 30%, packaging represents the biggest part of our company carbon footprint.
We are investing in the design and innovation of sustainably sourced, low carbon and circular solutions to reduce emissions.
It means working with partners in all markets and across the entire value chain to develop solutions that span the entire value chain – from sourcing sustainable packagingmaterials to enabling better recycling.
Sustainably sourcing the best packaging materialsThe Aluminium Stewardship Initiative (ASI) provides a global standard for sustainably sourced aluminium. We aim to ensure transparency of our aluminium value chain by encouraging aluminium can suppliers to embrace the cause, sign up to ASI and set a high standard for responsible sourcing.
Further reinforcing our responsible sourcing, tin-free steel is now our standard for crown corks and this is being rolled out globally.
Rethinking packaging design to reduce materialsWe are rolling out light weighting as a global packaging design standard.
In Slovenia, renovating the packaging for Laško and Union brand products has avoided 27 tonnes of virgin paper and reduced the carbon footprint by around 50 tonnes CO2/year.
In Asia Pacific, our operations have started sourcing ‘green aluminium’. With its lower carbon footprint due to cleaner production processes, the move to green aluminium has cut packaging carbon emissions by more than 30%.
Engaging suppliers to reduce energy consumption and use renewable energyMany suppliers have accelerated plans to sign power purchase agreements to increase renewable power in production.
We will work closely with our suppliers to share our knowledge on renewable electricity in order to accelerate the decarbonisation of their sectors.
Learn more about this topic on our website
Increasing reusable, recycled and recyclable packaging We set clear design and production rules for recycling and increasing the recycled content of packaging.
In the Netherlands, Heineken® 0.0 is now sold in returnable bottles. They rotate around 20 times, which results in an 80% reduction of their carbon emission.
The returnable bottles go hand-in-hand with returnable crates as a secondary packaging. Both returnable bottle and crate are excellent examples of circular packaging: the crate rotates for about 10 years and the bottle for around four years. When the quality of materials no longer meets our standards, both crate and bottle are recycled into new crates and bottles for another round!
Lower emissions in packaging
Our contribution to the SDGs:
12.2Sustainable use of natural resources
12.5Reduce waste generation
Drop the C – reducing CO2 emissions
135 Heineken N.V. Annual Report 2020
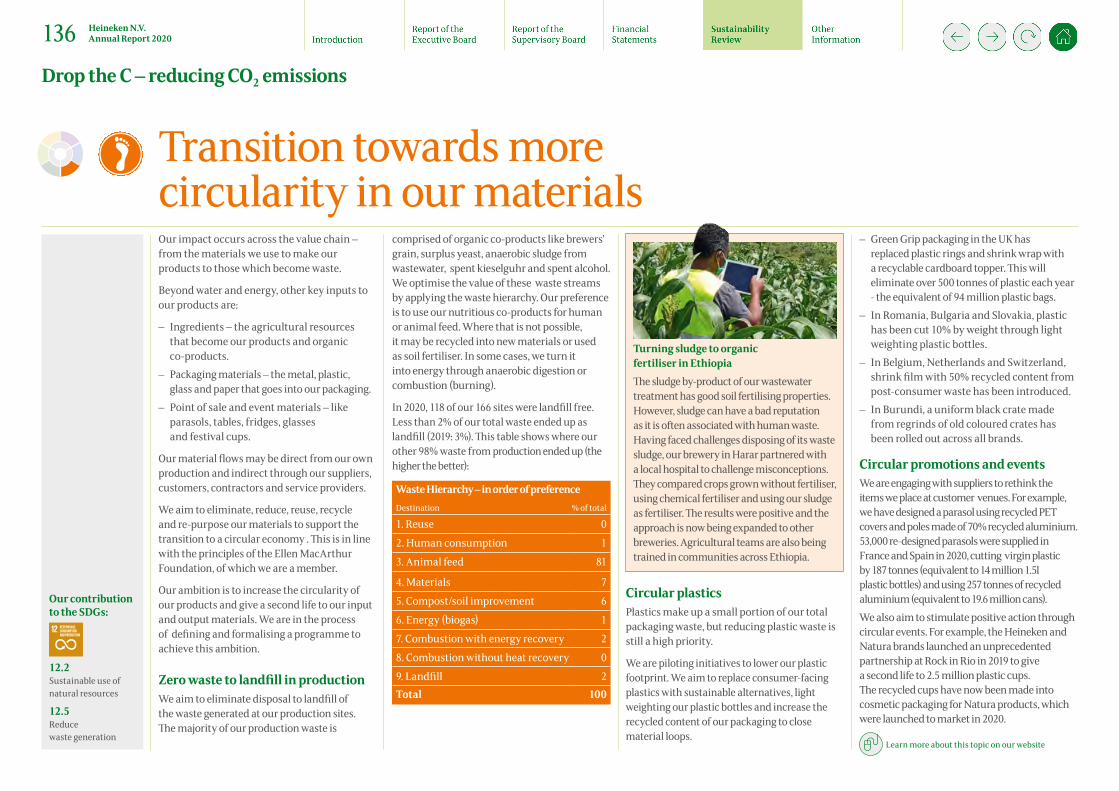
Transition towards more circularity in our materials
Our contribution to the SDGs:
12.2Sustainable use of natural resources
12.5Reduce waste generation
Our impact occurs across the value chain – from the materials we use to make our products to those which become waste.
Beyond water and energy, other key inputs to our products are:
– Ingredients – the agricultural resources that become our products and organic co-products.
– Packaging materials – the metal, plastic, glass and paper that goes into our packaging.
– Point of sale and event materials – like parasols, tables, fridges, glasses and festival cups.
Our material flows may be direct from our own production and indirect through our suppliers, customers, contractors and service providers.
We aim to eliminate, reduce, reuse, recycle and re-purpose our materials to support the transition to a circular economy . This is in line with the principles of the Ellen MacArthur Foundation, of which we are a member.
Our ambition is to increase the circularity of our products and give a second life to our input and output materials. We are in the process of defining and formalising a programme to achieve this ambition.
Zero waste to landfill in production We aim to eliminate disposal to landfill of the waste generated at our production sites. The majority of our production waste is
comprised of organic co-products like brewers’ grain, surplus yeast, anaerobic sludge from wastewater, spent kieselguhr and spent alcohol. We optimise the value of these waste streams by applying the waste hierarchy. Our preference is to use our nutritious co-products for human or animal feed. Where that is not possible, it may be recycled into new materials or used as soil fertiliser. In some cases, we turn it into energy through anaerobic digestion or combustion (burning).
In 2020, 118 of our 166 sites were landfill free. Less than 2% of our total waste ended up as landfill (2019: 3%). This table shows where our other 98% waste from production ended up (the higher the better):
Waste Hierarchy – in order of preference Destination % of total
1. Reuse 0
2. Human consumption 1
3. Animal feed 81
4. Materials 7
5. Compost/soil improvement 6
6. Energy (biogas) 1
7. Combustion with energy recovery 2
8. Combustion without heat recovery 0
9. Landfill 2Total 100
Circular plastics Plastics make up a small portion of our total packaging waste, but reducing plastic waste is still a high priority.
We are piloting initiatives to lower our plastic footprint. We aim to replace consumer-facing plastics with sustainable alternatives, light weighting our plastic bottles and increase the recycled content of our packaging to close material loops.
– Green Grip packaging in the UK has replaced plastic rings and shrink wrap with a recyclable cardboard topper. This will eliminate over 500 tonnes of plastic each year - the equivalent of 94 million plastic bags.
– In Romania, Bulgaria and Slovakia, plastichas been cut 10% by weight through light weighting plastic bottles.
– In Belgium, Netherlands and Switzerland, shrink film with 50% recycled content frompost-consumer waste has been introduced.
– In Burundi, a uniform black crate made from regrinds of old coloured crates hasbeen rolled out across all brands.
Circular promotions and events We are engaging with suppliers to rethink the items we place at customer venues. For example, we have designed a parasol using recycled PET covers and poles made of 70% recycled aluminium. 53,000 re-designed parasols were supplied in France and Spain in 2020, cutting virgin plastic by 187 tonnes (equivalent to 14 million 1.5l plastic bottles) and using 257 tonnes of recycled aluminium (equivalent to 19.6 million cans).We also aim to stimulate positive action through circular events. For example, the Heineken and Natura brands launched an unprecedented partnership at Rock in Rio in 2019 to give a second life to 2.5 million plastic cups. The recycled cups have now been made into cosmetic packaging for Natura products, which were launched to market in 2020.
Learn more about this topic on our website
Turning sludge to organic fertiliser in EthiopiaThe sludge by-product of our wastewater treatment has good soil fertilising properties. However, sludge can have a bad reputation as it is often associated with human waste. Having faced challenges disposing of its waste sludge, our brewery in Harar partnered with a local hospital to challenge misconceptions. They compared crops grown without fertiliser, using chemical fertiliser and using our sludge as fertiliser. The results were positive and the approach is now being expanded to other breweries. Agricultural teams are also being trained in communities across Ethiopia.
Drop the C – reducing CO2 emissions
136 Heineken N.V. Annual Report 2020
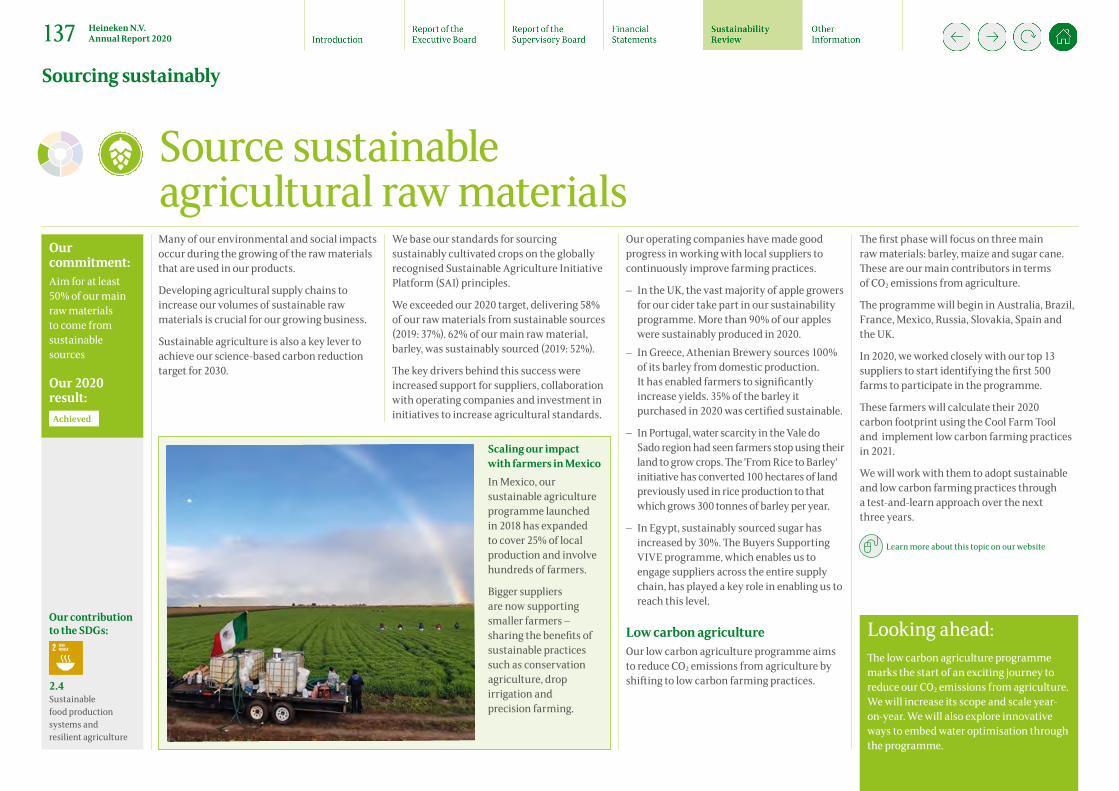
Many of our environmental and social impacts occur during the growing of the raw materials that are used in our products.
Developing agricultural supply chains to increase our volumes of sustainable raw materials is crucial for our growing business.
Sustainable agriculture is also a key lever to achieve our science-based carbon reduction target for 2030.
We base our standards for sourcing sustainably cultivated crops on the globally recognised Sustainable Agriculture Initiative Platform (SAI) principles.
We exceeded our 2020 target, delivering 58% of our raw materials from sustainable sources (2019: 37%). 62% of our main raw material, barley, was sustainably sourced (2019: 52%).
The key drivers behind this success were increased support for suppliers, collaboration with operating companies and investment in initiatives to increase agricultural standards.
Our operating companies have made good progress in working with local suppliers to continuously improve farming practices.
– In the UK, the vast majority of apple growers for our cider take part in our sustainability programme. More than 90% of our apples were sustainably produced in 2020.
– In Greece, Athenian Brewery sources 100% of its barley from domestic production. It has enabled farmers to significantly increase yields. 35% of the barley it purchased in 2020 was certified sustainable.
– In Portugal, water scarcity in the Vale do Sado region had seen farmers stop using their land to grow crops. The 'From Rice to Barley' initiative has converted 100 hectares of land previously used in rice production to that which grows 300 tonnes of barley per year.
– In Egypt, sustainably sourced sugar has increased by 30%. The Buyers Supporting VIVE programme, which enables us to engage suppliers across the entire supply chain, has played a key role in enabling us to reach this level.
Low carbon agricultureOur low carbon agriculture programme aims to reduce CO2 emissions from agriculture by shifting to low carbon farming practices.
The first phase will focus on three main raw materials: barley, maize and sugar cane. These are our main contributors in terms of CO2 emissions from agriculture.
The programme will begin in Australia, Brazil, France, Mexico, Russia, Slovakia, Spain and the UK.
In 2020, we worked closely with our top 13 suppliers to start identifying the first 500 farms to participate in the programme.
These farmers will calculate their 2020 carbon footprint using the Cool Farm Tool and implement low carbon farming practices in 2021.
We will work with them to adopt sustainable and low carbon farming practices through a test-and-learn approach over the next three years.
Learn more about this topic on our website
Source sustainable agricultural raw materials
Our contribution to the SDGs:
2.4Sustainable food production systems and resilient agriculture
Our commitment:Aim for at least 50% of our main raw materials to come from sustainable sources
Our 2020 result:
Achieved
Looking ahead: The low carbon agriculture programme marks the start of an exciting journey to reduce our CO2 emissions from agriculture. We will increase its scope and scale year-on-year. We will also explore innovative ways to embed water optimisation through the programme.
Scaling our impact with farmers in MexicoIn Mexico, our sustainable agriculture programme launched in 2018 has expanded to cover 25% of local production and involve hundreds of farmers.
Bigger suppliers are now supporting smaller farmers – sharing the benefits of sustainable practices such as conservation agriculture, drop irrigation and precision farming.
Sourcing sustainably
137 Heineken N.V. Annual Report 2020
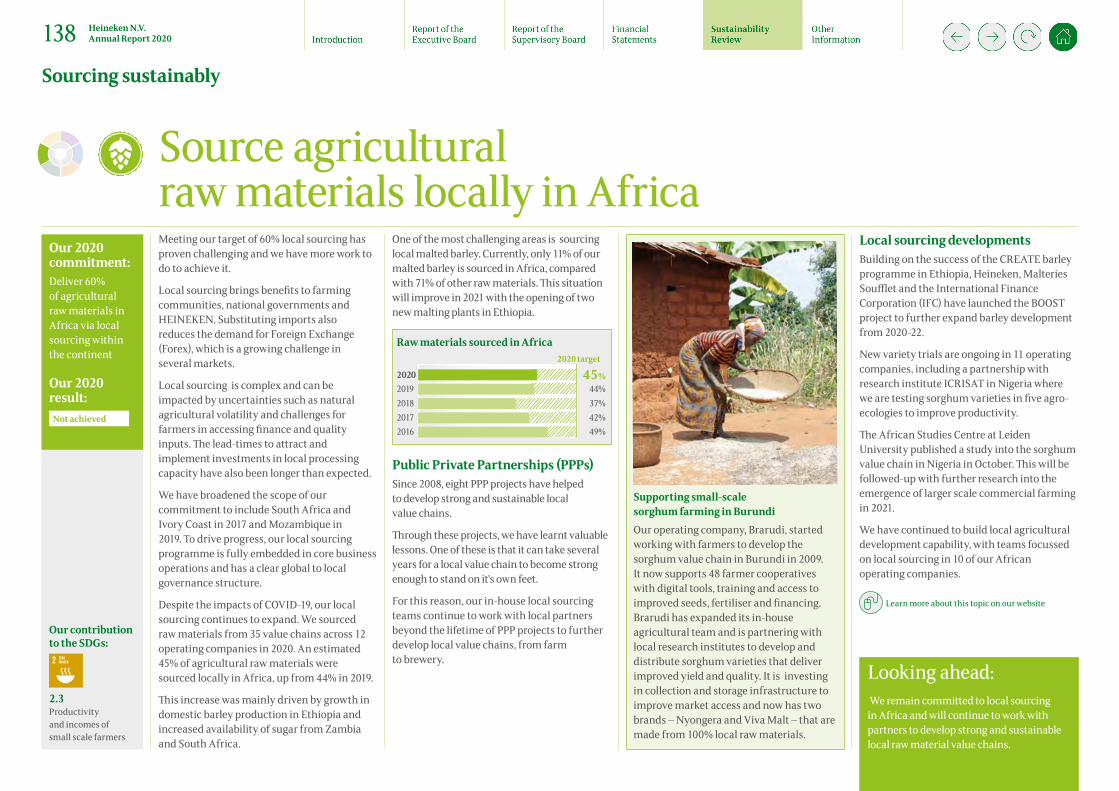
Looking ahead: We remain committed to local sourcing in Africa and will continue to work with partners to develop strong and sustainable local raw material value chains.
Meeting our target of 60% local sourcing has proven challenging and we have more work to do to achieve it.
Local sourcing brings benefits to farming communities, national governments and HEINEKEN. Substituting imports also reduces the demand for Foreign Exchange (Forex), which is a growing challenge in several markets.
Local sourcing is complex and can be impacted by uncertainties such as natural agricultural volatility and challenges for farmers in accessing finance and quality inputs. The lead-times to attract and implement investments in local processing capacity have also been longer than expected.
We have broadened the scope of our commitment to include South Africa and Ivory Coast in 2017 and Mozambique in 2019. To drive progress, our local sourcing programme is fully embedded in core business operations and has a clear global to local governance structure.
Despite the impacts of COVID-19, our local sourcing continues to expand. We sourced raw materials from 35 value chains across 12 operating companies in 2020. An estimated 45% of agricultural raw materials were sourced locally in Africa, up from 44% in 2019.
This increase was mainly driven by growth in domestic barley production in Ethiopia and increased availability of sugar from Zambia and South Africa.
Source agricultural raw materials locally in Africa
Our contribution to the SDGs:
2.3 Productivity and incomes of small scale farmers
Our 2020 commitment:Deliver 60% of agricultural raw materials in Africa via local sourcing within the continent
Our 2020 result:
Not achieved
One of the most challenging areas is sourcing local malted barley. Currently, only 11% of our malted barley is sourced in Africa, compared with 71% of other raw materials. This situation will improve in 2021 with the opening of two new malting plants in Ethiopia.
Raw materials sourced in Africa
2020 target
45%44%37%42%49%
20202019201820172016
Public Private Partnerships (PPPs)Since 2008, eight PPP projects have helped to develop strong and sustainable local value chains.
Through these projects, we have learnt valuable lessons. One of these is that it can take several years for a local value chain to become strong enough to stand on it's own feet.
For this reason, our in-house local sourcing teams continue to work with local partners beyond the lifetime of PPP projects to further develop local value chains, from farm to brewery.
Supporting small-scale sorghum farming in BurundiOur operating company, Brarudi, started working with farmers to develop the sorghum value chain in Burundi in 2009. It now supports 48 farmer cooperatives with digital tools, training and access to improved seeds, fertiliser and financing. Brarudi has expanded its in-house agricultural team and is partnering with local research institutes to develop and distribute sorghum varieties that deliver improved yield and quality. It is investing in collection and storage infrastructure to improve market access and now has two brands – Nyongera and Viva Malt – that are made from 100% local raw materials.
Local sourcing developments Building on the success of the CREATE barley programme in Ethiopia, Heineken, Malteries Soufflet and the International Finance Corporation (IFC) have launched the BOOST project to further expand barley development from 2020-22.
New variety trials are ongoing in 11 operating companies, including a partnership with research institute ICRISAT in Nigeria where we are testing sorghum varieties in five agro-ecologies to improve productivity.
The African Studies Centre at Leiden University published a study into the sorghum value chain in Nigeria in October. This will be followed-up with further research into the emergence of larger scale commercial farming in 2021.
We have continued to build local agricultural development capability, with teams focussed on local sourcing in 10 of our African operating companies.
Learn more about this topic on our website
Sourcing sustainably
138 Heineken N.V. Annual Report 2020

SUPPLIER CODE
C DEof businessconduct
Signing of theSupplier Code
Understanding and acceptingour requirements by suppliers
Supplier RiskAnalysis
Identifying potentially high-risk suppliers
AutomatedScreening
Evaluating high-risk supplierson critical parameters
Action Executing appropriate corrective actions
We are committed to conducting business with integrity and fairness, with respect for people, the law and our values.
We expect our suppliers to help us deliver on our values and commitment to responsible business conduct at all times.
By working together, we can maximise our positive impact and grow together in a sustainable and responsible way.
We have continued to exceed our target, reaching 97% compliance with our Supplier Code Procedure across our global operating companies.
Our risk-based approachThe four step Supplier Code Compliance procedure allows us to identify and evaluate potential risks with our suppliers and execute mitigating actions to address the following issues:
– Anti-bribery and anti-corruption – Sanctions – Political exposure – Negative media coverage related to issues
such as labour and human rights, health and safety, fraud, fair competition and money laundering.
Our supplier base is challenging, dynamic and geographically diverse and we are continuously evolving our processes to address these risks.
As our programme approach matures, we aim to go beyond compliance through proactive supplier engagement.
As a result we have already begun evolving our Supplier Code procedure into a Supplier Engagement Programme. We have enhanced our financial assessments, particularly with our global suppliers. We have strengthened our anti-bribery and corruption programme to improve our capabilities in challenging markets and at the same time more than doubled the number of suppliers put through automated screening compared to 2019.
Learn more about this topic on our website
Compliance with our Supplier Code Procedure
Our contribution to the SDGs:
8.7 Eradicate forced labour, modern slavery, human trafficking and child labour
8.8Protect labour rights and promote safe working environments
Our 2020 commitment:Ongoing 95% compliance with our Supplier Code Procedure
Our 2020 result:
Achieved
Looking ahead: We will continue to evolve our programme approach and pro-actively engage with our suppliers.
Our intention is to expand the Supplier Engagement Programme to advanced labour and human rights due diligence as well as bringing the collection and monitoring of our supplier environmental data into scope to improve consistency and oversight.
Sourcing sustainably
139 Heineken N.V. Annual Report 2020
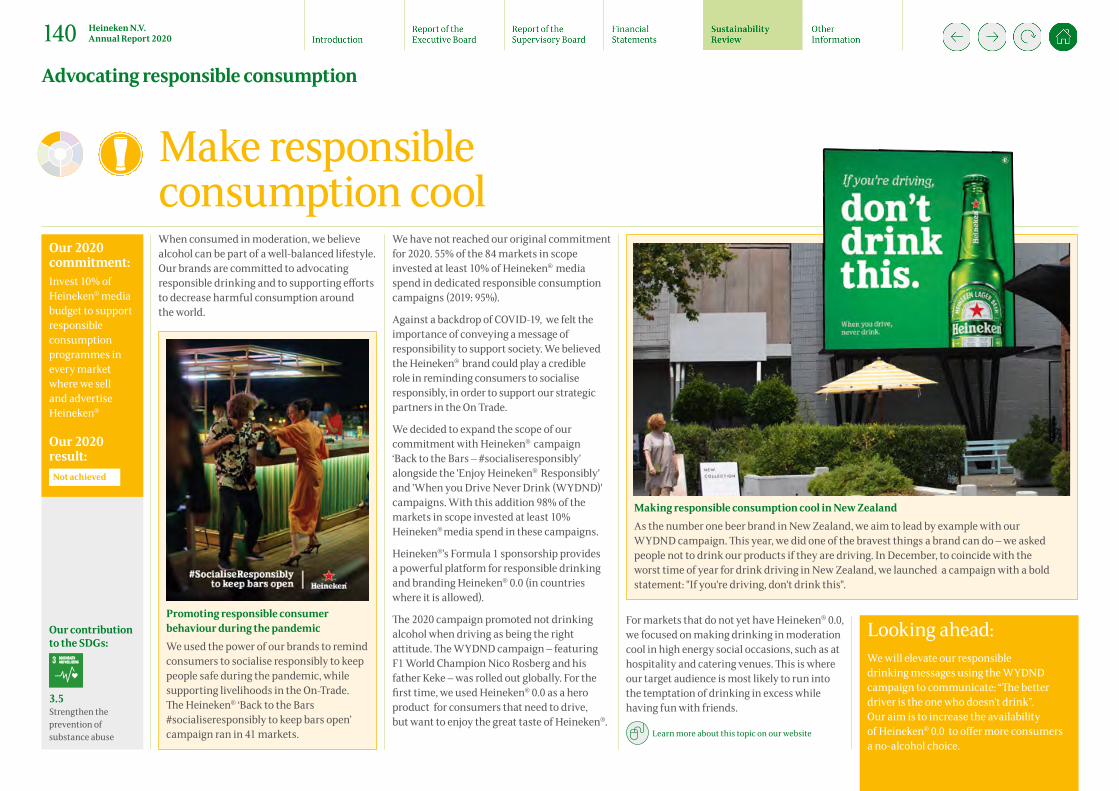
When consumed in moderation, we believe alcohol can be part of a well-balanced lifestyle. Our brands are committed to advocating responsible drinking and to supporting efforts to decrease harmful consumption around the world.
We have not reached our original commitment for 2020. 55% of the 84 markets in scope invested at least 10% of Heineken® media spend in dedicated responsible consumption campaigns (2019: 95%).
Against a backdrop of COVID-19, we felt the importance of conveying a message of responsibility to support society. We believed the Heineken® brand could play a credible role in reminding consumers to socialise responsibly, in order to support our strategic partners in the On Trade.
We decided to expand the scope of our commitment with Heineken® campaign ‘Back to the Bars – #socialiseresponsibly' alongside the 'Enjoy Heineken® Responsibly' and 'When you Drive Never Drink (WYDND)' campaigns. With this addition 98% of the markets in scope invested at least 10% Heineken® media spend in these campaigns.
Heineken®’s Formula 1 sponsorship provides a powerful platform for responsible drinking and branding Heineken® 0.0 (in countries where it is allowed).
The 2020 campaign promoted not drinking alcohol when driving as being the right attitude. The WYDND campaign – featuring F1 World Champion Nico Rosberg and his father Keke – was rolled out globally. For the first time, we used Heineken® 0.0 as a hero product for consumers that need to drive, but want to enjoy the great taste of Heineken®.
Looking ahead: We will elevate our responsible drinking messages using the WYDND campaign to communicate: “The better driver is the one who doesn’t drink”. Our aim is to increase the availability of Heineken® 0.0 to offer more consumers a no-alcohol choice.
Make responsible consumption cool
Our contribution to the SDGs:
3.5Strengthen the prevention of substance abuse
Our 2020 commitment:Invest 10% of Heineken® media budget to support responsible consumption programmes in every market where we sell and advertise Heineken®
Our 2020 result:
Not achieved
Making responsible consumption cool in New ZealandAs the number one beer brand in New Zealand, we aim to lead by example with our WYDND campaign. This year, we did one of the bravest things a brand can do – we asked people not to drink our products if they are driving. In December, to coincide with the worst time of year for drink driving in New Zealand, we launched a campaign with a bold statement: "If you're driving, don't drink this".
Promoting responsible consumer behaviour during the pandemic We used the power of our brands to remind consumers to socialise responsibly to keep people safe during the pandemic, while supporting livelihoods in the On-Trade. The Heineken® ‘Back to the Bars #socialiseresponsibly to keep bars open’ campaign ran in 41 markets.
For markets that do not yet have Heineken® 0.0, we focused on making drinking in moderation cool in high energy social occasions, such as at hospitality and catering venues. This is where our target audience is most likely to run into the temptation of drinking in excess while having fun with friends.
Learn more about this topic on our website
Advocating responsible consumption
140 Heineken N.V. Annual Report 2020
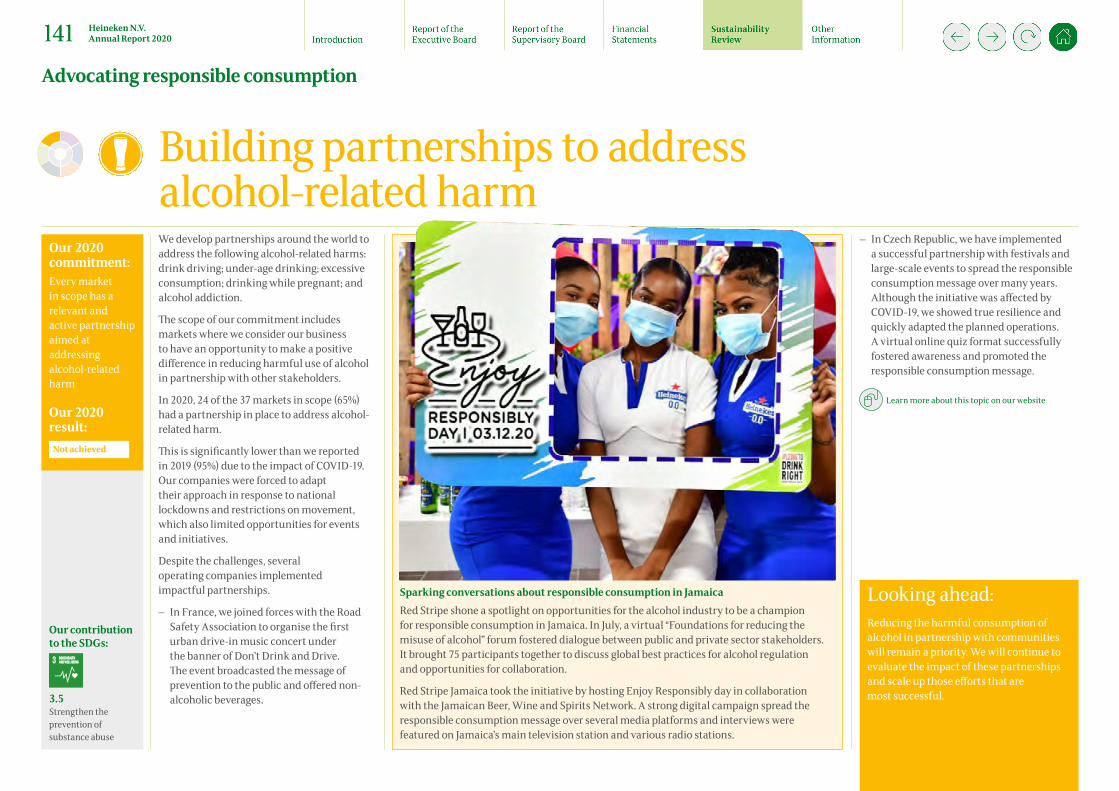
Looking ahead: Reducing the harmful consumption of alcohol in partnership with communities will remain a priority. We will continue to evaluate the impact of these partnerships and scale up those efforts that are most successful.
We develop partnerships around the world to address the following alcohol-related harms: drink driving; under-age drinking; excessive consumption; drinking while pregnant; and alcohol addiction.
The scope of our commitment includes markets where we consider our business to have an opportunity to make a positive difference in reducing harmful use of alcohol in partnership with other stakeholders.
In 2020, 24 of the 37 markets in scope (65%) had a partnership in place to address alcohol-related harm.
This is significantly lower than we reported in 2019 (95%) due to the impact of COVID-19. Our companies were forced to adapt their approach in response to national lockdowns and restrictions on movement, which also limited opportunities for events and initiatives.
Despite the challenges, several operating companies implemented impactful partnerships.
– In France, we joined forces with the Road Safety Association to organise the first urban drive-in music concert under the banner of Don’t Drink and Drive. The event broadcasted the message of prevention to the public and offered non-alcoholic beverages.
Building partnerships to address alcohol-related harm
Our contribution to the SDGs:
3.5Strengthen the prevention of substance abuse
Our 2020 commitment:Every market in scope has a relevant and active partnership aimed at addressing alcohol-related harm
Our 2020 result:
Not achieved
Sparking conversations about responsible consumption in Jamaica Red Stripe shone a spotlight on opportunities for the alcohol industry to be a champion for responsible consumption in Jamaica. In July, a virtual “Foundations for reducing the misuse of alcohol” forum fostered dialogue between public and private sector stakeholders. It brought 75 participants together to discuss global best practices for alcohol regulation and opportunities for collaboration.
Red Stripe Jamaica took the initiative by hosting Enjoy Responsibly day in collaboration with the Jamaican Beer, Wine and Spirits Network. A strong digital campaign spread the responsible consumption message over several media platforms and interviews were featured on Jamaica’s main television station and various radio stations.
– In Czech Republic, we have implemented a successful partnership with festivals and large-scale events to spread the responsibleconsumption message over many years. Although the initiative was affected by COVID-19, we showed true resilience and quickly adapted the planned operations. A virtual online quiz format successfully fostered awareness and promoted the responsible consumption message.
Learn more about this topic on our website
Advocating responsible consumption
141 Heineken N.V. Annual Report 2020
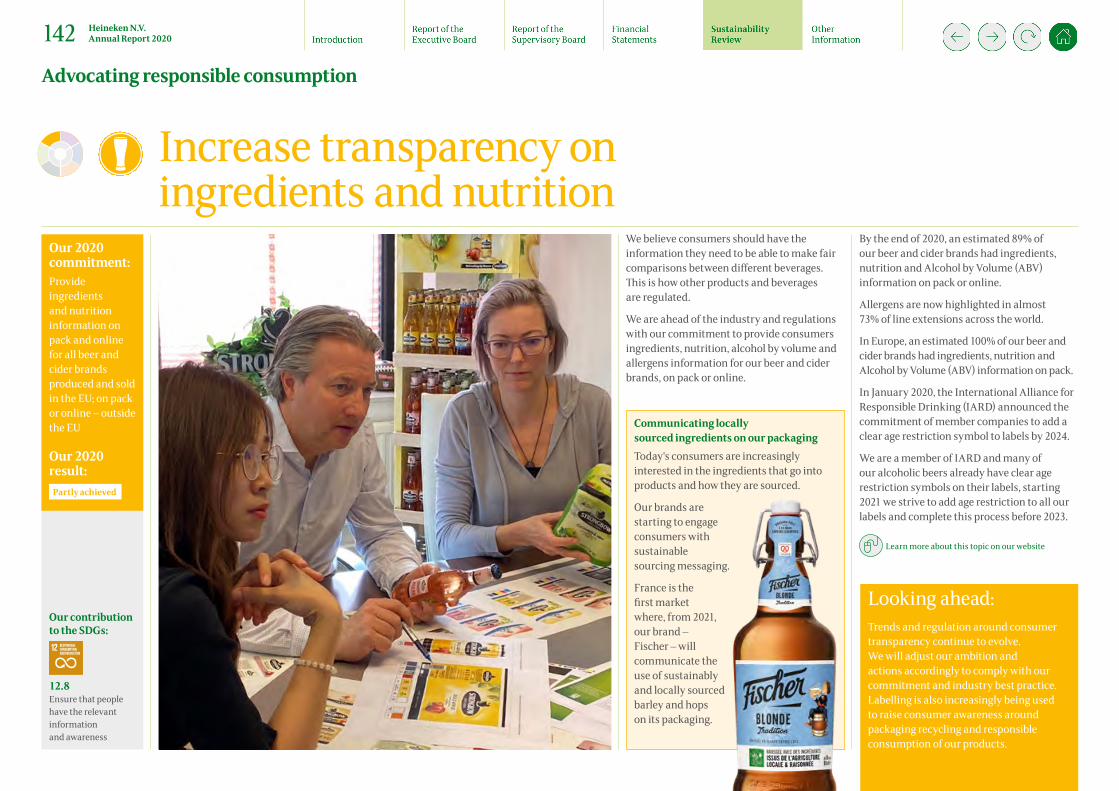
Looking ahead: Trends and regulation around consumer transparency continue to evolve. We will adjust our ambition and actions accordingly to comply with our commitment and industry best practice. Labelling is also increasingly being used to raise consumer awareness around packaging recycling and responsible consumption of our products.
We believe consumers should have the information they need to be able to make fair comparisons between different beverages. This is how other products and beverages are regulated.
We are ahead of the industry and regulations with our commitment to provide consumers ingredients, nutrition, alcohol by volume and allergens information for our beer and cider brands, on pack or online.
By the end of 2020, an estimated 89% of our beer and cider brands had ingredients, nutrition and Alcohol by Volume (ABV) information on pack or online.
Allergens are now highlighted in almost 73% of line extensions across the world.
In Europe, an estimated 100% of our beer and cider brands had ingredients, nutrition and Alcohol by Volume (ABV) information on pack.
In January 2020, the International Alliance for Responsible Drinking (IARD) announced the commitment of member companies to add a clear age restriction symbol to labels by 2024.
We are a member of IARD and many of our alcoholic beers already have clear age restriction symbols on their labels, starting 2021 we strive to add age restriction to all our labels and complete this process before 2023.
Learn more about this topic on our website
Increase transparency on ingredients and nutrition
Our contribution to the SDGs:
12.8Ensure that people have the relevant information and awareness
Our 2020 commitment:Provide ingredients and nutrition information on pack and online for all beer and cider brands produced and sold in the EU; on pack or online – outside the EU
Our 2020 result:
Partly achieved
Communicating locally sourced ingredients on our packagingToday's consumers are increasingly interested in the ingredients that go into products and how they are sourced.
Our brands are starting to engage consumers with sustainable sourcing messaging.
France is the first market where, from 2021, our brand – Fischer – will communicate the use of sustainably and locally sourced barley and hops on its packaging.
Advocating responsible consumption
142 Heineken N.V. Annual Report 2020

We believe in providing options for consumers who do not want to, or cannot, drink alcohol.
Our aim is to create inspiring low- and no-alcohol (LONO) choices for all occasions, supported by strong marketing campaigns to drive positive consumer perceptions of the LONO category.
We continuously innovate across our growing portfolio of LONO brands. Our strong innovation pipeline aims to inject excitement into the LONO category as we develop and launch more and more products around the world.
Responsible marketing is key. We market non-alcoholic products only to adults and as an extension of a brand containing alcohol.
Our global LONO portfolio now includes 356 line extensions across 125 brands.
By the end of 2020, LONO options made up 6.2% of our total global volume1.
LONO options as a proportion of total global volume1
2019 5.7%2018 5.5%
6.2%2020
1 Including beer, cider and malt based soft drinks
Using the power of LONO to support the heroes of the pandemicIn Poland, we developed a 0.0% product for the heroes of the pandemic response – those working in hospitals and taking care of others. The non-alcohol beverage based on malt and fruit lemonade with added vitamins was distributed for free to hospitals to reach the people on the front line of the COVID-19 response. Similar initiatives saw products distributed to people in need in Spain, Mozambique, Colombia, Jamaica and Mexico.
Driving innovation in the low- and no-alcohol category
Our contribution to the SDGs:
3.5 Strengthen the prevention of substance abuse
COVID-19 was no obstacle to innovation in 2020 and the 0.0% category grew volume by 4.7% globally.
– Expansion of our flagship brand, Heineken® 0.0%, continued. It is now available in 84 markets, up from 57 in 2019.
– We launched Desperados Virgin. The iconic brand, with a high energy party reputation, came up with a winning 0.0% product that tells consumers: 'you can have just as much fun without alcohol.'
We also enhanced our multi-category capabilities by entering other non-alcoholic drinks categories, such as Energy.
– In Africa, we are re-shaping the Energy category with a Malt products portfolio. It includes Energy Malt in DRC, Trenk in Sierra Leone, Cheetah in Rwanda and Rhino in Ivory Coast.
Learn more about this topic on our website
Leading the Energy category with Solar PowerWe enhanced our multi-category capabilities by entering other non-alcoholic drinks categories such as Energy, leading with our global Solar Power brand.
Solar Power uses only natural ingredients to provide powerful natural energy and has lower sugar vs the competitive set.
The brand is responding well to Russian and Mexican consumers demand for healthy energy and there are plans for market growth in the coming years.
Advocating responsible consumption
143 Heineken N.V. Annual Report 2020

Safety remains of vital importance and Put Safety First! is our number one company behaviour.
Fatal accidents We deeply regret that six people lost their lives while working for us in 2020 (2019: 11). Three people were our employees and three were employed by contractors. Four fatal accidents were road traffic accidents and two occurred during production operations.
All fatal accidents are investigated by an independent investigation team to ensure we understand the root causes. We take action to prevent recurrence and share the learnings across the company.
Accident Frequency Our accident frequency in 2020 was 0.58 per 100 FTE. This is a reduction of 58% compared to 2015 (1.38 per 100 FTE), meaning we surpassed our 2020 target.
Lost Time Accident frequency(accidents per 100 FTE)
2020 target
2019 0.8420182015
1.131.38
0.582020
baseline
There were 497 accidents that resulted in lost days among our employees, 253 of these were in logistics and distribution, 87 in commerce, 150 in production and 7 in other functions.
A decrease in cases from March 2020 coincided with the national lockdowns in response to COVID-19. Many of our sales teams were off the road and supporting staff working from home, where they continue to do so.
Our risk-based safety strategyIn 2020, we have launched our new safety strategy. The new strategy focuses on our highest risks and requires active involvement from all our people.
We have started three big risk reduction programmes: Road safety and driving, Contractor safety and Safety leadership.
By successfully executing these three programs, we believe that we will achieve significant improvements in our safety performance.
We work hard to build sufficient capacity to manage the risks in our operations. This requires active participation from everyone, including our company leadership.
Even with the strong preventative measures in place, accidents may still happen. It is our people who hold the insights into how we can create a safe working environment.
Safety LeadershipWe held a Virtual Global Safety day in 2020. Leadership at all levels took part in the ‘I am a safety leader’ initiative and content went viral across internal channels, helping to drive action and safe behaviours.
Safety
Our contribution to the SDGs:
3.6Reduce deaths and injuries from road traffic accidents
8.8Protect labour rights and promote safe and secure working environments
Our 2020 commitment:Reduce accident frequency by 20% vs 2015
Our 2020 result:
Achieved
Contractor Safety We launched a new Contractor Safety Standard to ensure the safety of contractors and subcontractors through one global standard. It focuses on high risk activities and streamlines processes for qualification and management of contractors.
Learn more about this topic on our website
Fatal accidents1 2018 2019 20203
Fatalities of Company personnel 3 4 3Fatalities of Contractor personnel on site2 14 6 1Fatalities of Contractor personnel off site2 1 2Accidents (Absolute values)Accidents of Company personnel 1,000 742 497Accidents of Contractor personnel 404 216 100Lost Days of Company personnel 33,566 38,019 17,541Permanent disabilities of Company personnel 1 0 2Total Workforce 88,134 88,430 86,175Accidents (Relative values)Lost Time Accident Frequency (per 100 FTE Company personnel) 1.13 0.84 0.58
1 Company personnel fatalities: 1 in Tango Algeria; 1 in Nigeria; 1 in Brana Haiti. Contractor personnel fatalities: 2 in Bralima DRC; 1 in Nigeria2 Contractors who operate under our direct control (either because they work on HEINEKEN premises or are supervised by HEINEKEN
management and work elsewhere)3 The reporting period of the safety data presented in this chapter is December 2019 – November 2020 with the exception of fatal accident data
which reflected the 2020 full year period
Road Safety A global cross-functional team established a Motorbike Community of Practice to promote and share best practices for the safe management of our motorbike fleet.
Promoting health and safety
144 Heineken N.V. Annual Report 2020
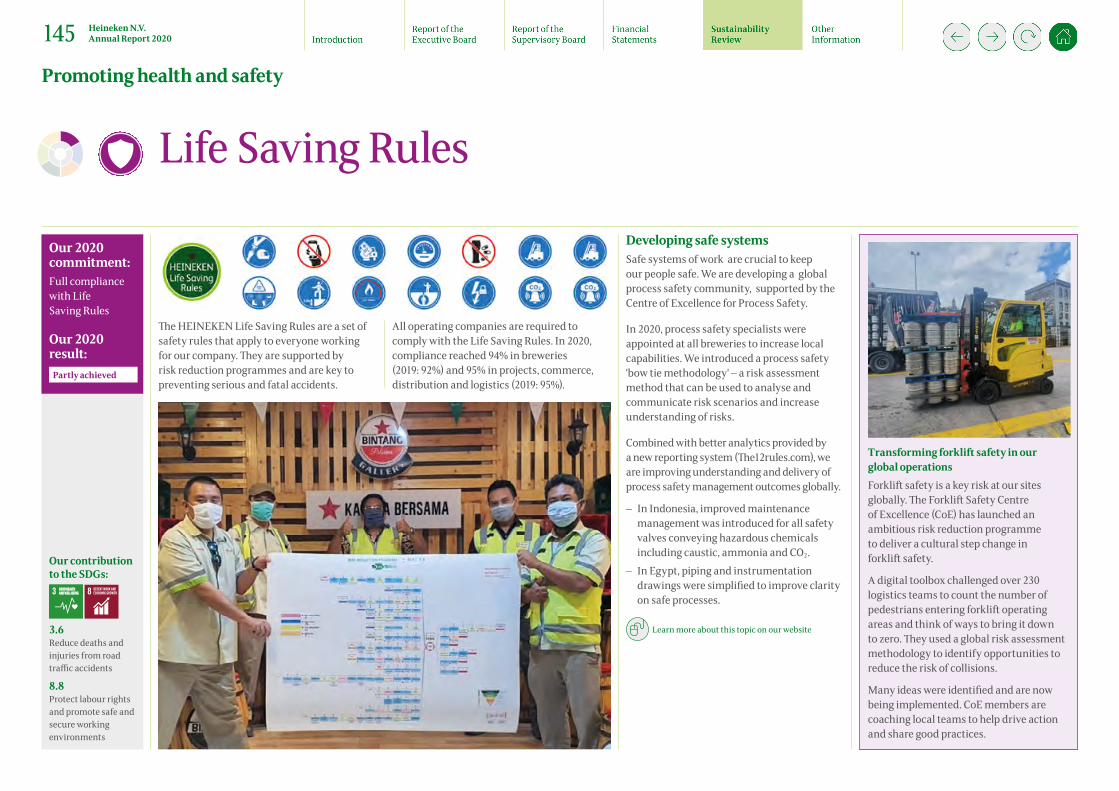
The HEINEKEN Life Saving Rules are a set of safety rules that apply to everyone working for our company. They are supported by risk reduction programmes and are key to preventing serious and fatal accidents.
All operating companies are required to comply with the Life Saving Rules. In 2020, compliance reached 94% in breweries (2019: 92%) and 95% in projects, commerce, distribution and logistics (2019: 95%).
Developing safe systems Safe systems of work are crucial to keep our people safe. We are developing a global process safety community, supported by the Centre of Excellence for Process Safety.
In 2020, process safety specialists were appointed at all breweries to increase local capabilities. We introduced a process safety 'bow tie methodology' – a risk assessment method that can be used to analyse and communicate risk scenarios and increase understanding of risks.
Combined with better analytics provided by a new reporting system (The12rules.com), we are improving understanding and delivery of process safety management outcomes globally.
– In Indonesia, improved maintenance management was introduced for all safetyvalves conveying hazardous chemicals including caustic, ammonia and CO2.
– In Egypt, piping and instrumentation drawings were simplified to improve clarityon safe processes.
Learn more about this topic on our website
Life Saving Rules
Our contribution to the SDGs:
3.6Reduce deaths and injuries from road traffic accidents
8.8Protect labour rights and promote safe and secure working environments
Our 2020 commitment:Full compliance with Life Saving Rules
Our 2020 result:
Partly achieved
Transforming forklift safety in our global operationsForklift safety is a key risk at our sites globally. The Forklift Safety Centre of Excellence (CoE) has launched an ambitious risk reduction programme to deliver a cultural step change in forklift safety.
A digital toolbox challenged over 230 logistics teams to count the number of pedestrians entering forklift operating areas and think of ways to bring it down to zero. They used a global risk assessment methodology to identify opportunities to reduce the risk of collisions.
Many ideas were identified and are now being implemented. CoE members are coaching local teams to help drive action and share good practices.
Promoting health and safety
145 Heineken N.V. Annual Report 2020
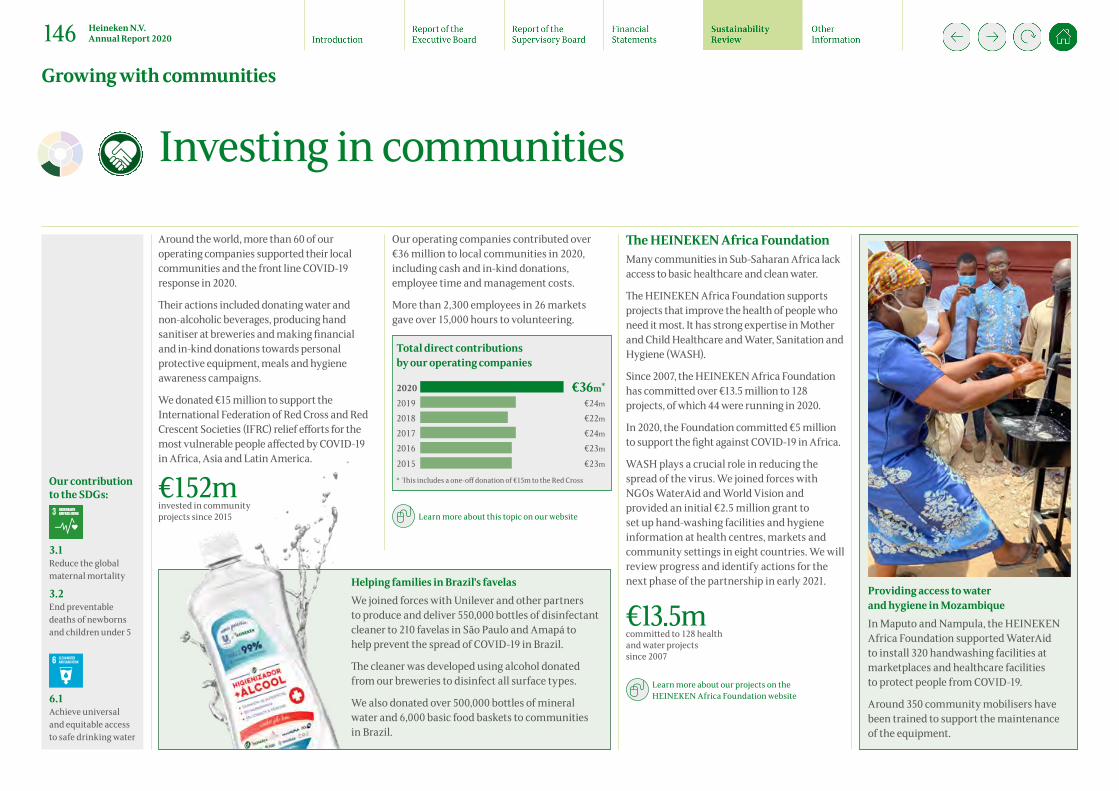
Around the world, more than 60 of our operating companies supported their local communities and the front line COVID-19 response in 2020.
Their actions included donating water and non-alcoholic beverages, producing hand sanitiser at breweries and making financial and in-kind donations towards personal protective equipment, meals and hygiene awareness campaigns.
We donated €15 million to support the International Federation of Red Cross and Red Crescent Societies (IFRC) relief efforts for the most vulnerable people affected by COVID-19 in Africa, Asia and Latin America.
€152minvested in community projects since 2015
Our operating companies contributed over €36 million to local communities in 2020, including cash and in-kind donations, employee time and management costs.
More than 2,300 employees in 26 markets gave over 15,000 hours to volunteering.
Total direct contributions by our operating companies
€36m*
€24m
€22m
€23m
€23m
€24m
20202019201820172016
2015
* This includes a one-off donation of €15m to the Red Cross
Learn more about this topic on our website
The HEINEKEN Africa Foundation Many communities in Sub-Saharan Africa lack access to basic healthcare and clean water.
The HEINEKEN Africa Foundation supports projects that improve the health of people who need it most. It has strong expertise in Mother and Child Healthcare and Water, Sanitation and Hygiene (WASH).
Since 2007, the HEINEKEN Africa Foundation has committed over €13.5 million to 128 projects, of which 44 were running in 2020.
In 2020, the Foundation committed €5 million to support the fight against COVID-19 in Africa.
WASH plays a crucial role in reducing the spread of the virus. We joined forces with NGOs WaterAid and World Vision and provided an initial €2.5 million grant to set up hand-washing facilities and hygiene information at health centres, markets and community settings in eight countries. We will review progress and identify actions for the next phase of the partnership in early 2021.
€13.5mcommitted to 128 health and water projectssince 2007
Learn more about our projects on the HEINEKEN Africa Foundation website
Investing in communities
Helping families in Brazil's favelasWe joined forces with Unilever and other partners to produce and deliver 550,000 bottles of disinfectant cleaner to 210 favelas in São Paulo and Amapá to help prevent the spread of COVID-19 in Brazil.
The cleaner was developed using alcohol donated from our breweries to disinfect all surface types.
We also donated over 500,000 bottles of mineral water and 6,000 basic food baskets to communities in Brazil.
Our contribution to the SDGs:
3.1Reduce the global maternal mortality
3.2End preventable deaths of newborns and children under 5
6.1Achieve universal and equitable access to safe drinking water
Providing access to water and hygiene in MozambiqueIn Maputo and Nampula, the HEINEKEN Africa Foundation supported WaterAid to install 320 handwashing facilities at marketplaces and healthcare facilities to protect people from COVID-19.
Around 350 community mobilisers have been trained to support the maintenance of the equipment.
Growing with communities
146 Heineken N.V. Annual Report 2020
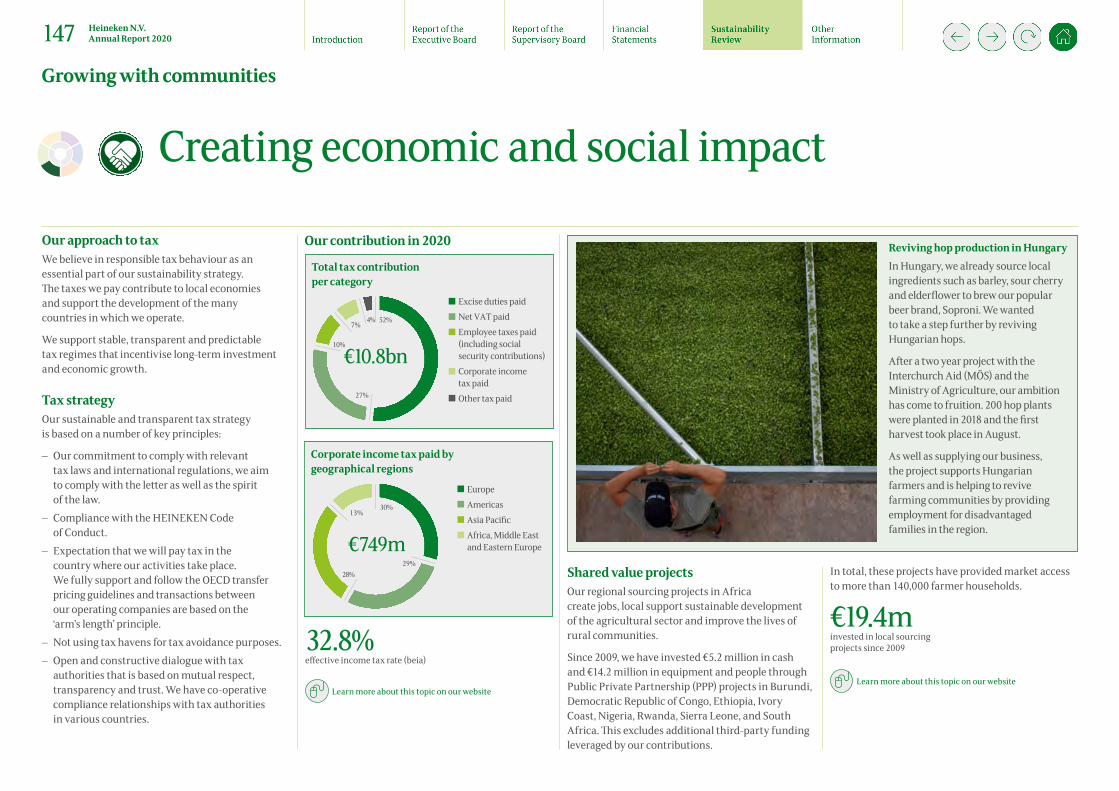
Corporate income tax paid by geographical regions
EuropeAmericasAsia PacificAfrica, Middle Eastand Eastern Europe
30%
28%29%
13%
€749m
Total tax contribution per category
Excise duties paidNet VAT paidEmployee taxes paid(including social security contributions)Corporate income tax paidOther tax paid
52%
10%
27%
7%4%
€10.8bn
Creating economic and social impact
Our approach to taxWe believe in responsible tax behaviour as an essential part of our sustainability strategy. The taxes we pay contribute to local economies and support the development of the many countries in which we operate.
We support stable, transparent and predictable tax regimes that incentivise long-term investment and economic growth.
Tax strategyOur sustainable and transparent tax strategy is based on a number of key principles:
– Our commitment to comply with relevant tax laws and international regulations, we aimto comply with the letter as well as the spirit of the law.
– Compliance with the HEINEKEN Codeof Conduct.
– Expectation that we will pay tax in the country where our activities take place. We fully support and follow the OECD transferpricing guidelines and transactions betweenour operating companies are based on the ‘arm’s length’ principle.
– Not using tax havens for tax avoidance purposes. – Open and constructive dialogue with tax
authorities that is based on mutual respect, transparency and trust. We have co-operativecompliance relationships with tax authorities in various countries.
Reviving hop production in Hungary In Hungary, we already source local ingredients such as barley, sour cherry and elderflower to brew our popular beer brand, Soproni. We wanted to take a step further by reviving Hungarian hops.
After a two year project with the Interchurch Aid (MÖS) and the Ministry of Agriculture, our ambition has come to fruition. 200 hop plants were planted in 2018 and the first harvest took place in August.
As well as supplying our business, the project supports Hungarian farmers and is helping to revive farming communities by providing employment for disadvantaged families in the region.
Our contribution in 2020
Shared value projects Our regional sourcing projects in Africa create jobs, local support sustainable development of the agricultural sector and improve the lives of rural communities.
Since 2009, we have invested €5.2 million in cash and €14.2 million in equipment and people through Public Private Partnership (PPP) projects in Burundi, Democratic Republic of Congo, Ethiopia, Ivory Coast, Nigeria, Rwanda, Sierra Leone, and South Africa. This excludes additional third-party funding leveraged by our contributions.
In total, these projects have provided market access to more than 140,000 farmer households.
€19.4minvested in local sourcing projects since 2009
Learn more about this topic on our website
32.8%effective income tax rate (beia)
Learn more about this topic on our website
Growing with communities
147 Heineken N.V. Annual Report 2020
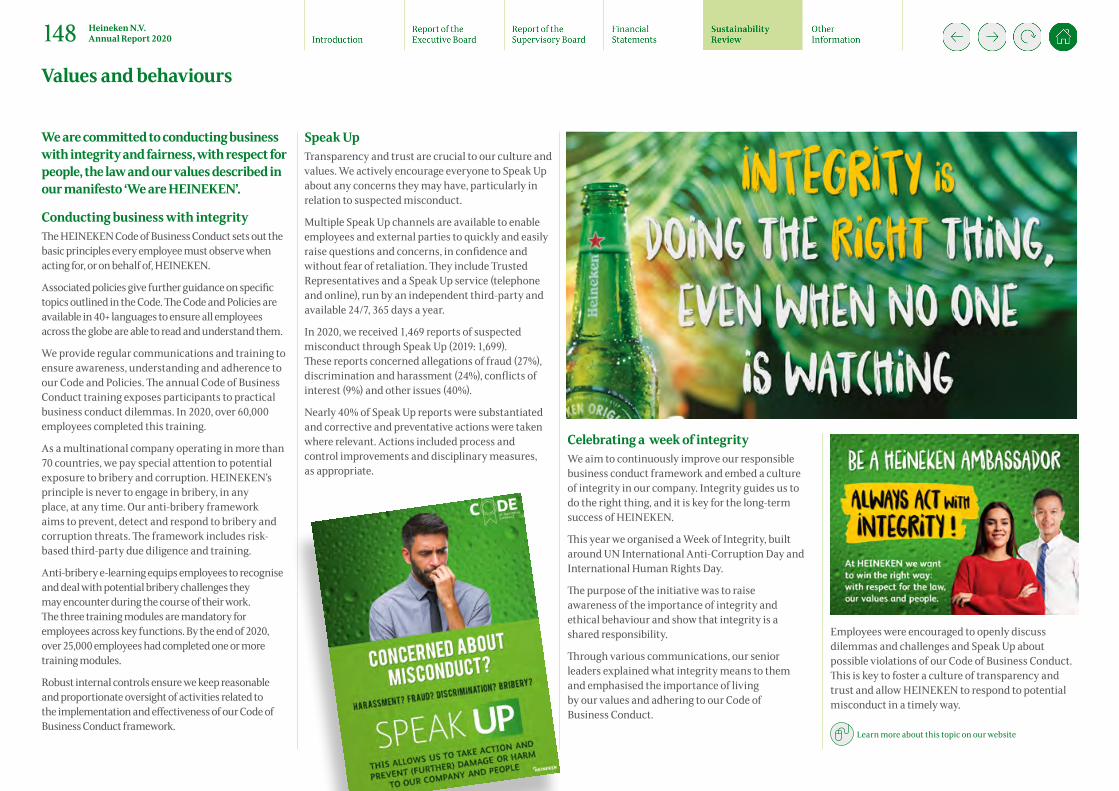
We are committed to conducting business with integrity and fairness, with respect for people, the law and our values described in our manifesto ‘We are HEINEKEN’.
Conducting business with integrityThe HEINEKEN Code of Business Conduct sets out the basic principles every employee must observe when acting for, or on behalf of, HEINEKEN.
Associated policies give further guidance on specific topics outlined in the Code. The Code and Policies are available in 40+ languages to ensure all employees across the globe are able to read and understand them.
We provide regular communications and training to ensure awareness, understanding and adherence to our Code and Policies. The annual Code of Business Conduct training exposes participants to practical business conduct dilemmas. In 2020, over 60,000 employees completed this training.
As a multinational company operating in more than 70 countries, we pay special attention to potential exposure to bribery and corruption. HEINEKEN’s principle is never to engage in bribery, in any place, at any time. Our anti-bribery framework aims to prevent, detect and respond to bribery and corruption threats. The framework includes risk-based third-party due diligence and training.
Anti-bribery e-learning equips employees to recognise and deal with potential bribery challenges they may encounter during the course of their work. The three training modules are mandatory for employees across key functions. By the end of 2020, over 25,000 employees had completed one or more training modules.
Robust internal controls ensure we keep reasonable and proportionate oversight of activities related to the implementation and effectiveness of our Code of Business Conduct framework.
Speak UpTransparency and trust are crucial to our culture and values. We actively encourage everyone to Speak Up about any concerns they may have, particularly in relation to suspected misconduct.
Multiple Speak Up channels are available to enable employees and external parties to quickly and easily raise questions and concerns, in confidence and without fear of retaliation. They include Trusted Representatives and a Speak Up service (telephone and online), run by an independent third-party and available 24/7, 365 days a year.
In 2020, we received 1,469 reports of suspected misconduct through Speak Up (2019: 1,699). These reports concerned allegations of fraud (27%), discrimination and harassment (24%), conflicts of interest (9%) and other issues (40%).
Nearly 40% of Speak Up reports were substantiated and corrective and preventative actions were taken where relevant. Actions included process and control improvements and disciplinary measures, as appropriate.
Celebrating a week of integrityWe aim to continuously improve our responsible business conduct framework and embed a culture of integrity in our company. Integrity guides us to do the right thing, and it is key for the long-term success of HEINEKEN.
This year we organised a Week of Integrity, built around UN International Anti-Corruption Day and International Human Rights Day.
The purpose of the initiative was to raise awareness of the importance of integrity and ethical behaviour and show that integrity is a shared responsibility.
Through various communications, our senior leaders explained what integrity means to them and emphasised the importance of living by our values and adhering to our Code of Business Conduct.
Employees were encouraged to openly discuss dilemmas and challenges and Speak Up about possible violations of our Code of Business Conduct. This is key to foster a culture of transparency and trust and allow HEINEKEN to respond to potential misconduct in a timely way.
Learn more about this topic on our website
Values and behaviours
148 Heineken N.V. Annual Report 2020

Exploring our origins in BrazilHEINEKEN Brazil is one of our largest operating companies and I&D is a hot topic within the company. In 2020, the focus turned to racial and ethnic inclusion with a year-long campaign to explore the concept of ‘origins’. Launched by the Brazil leadership team, the campaign aim was to spark conversations about race and racism across the company.
The first phase raised awareness of the topic of race. It included an online communications campaign, monthly newsletter and an ‘Allies’ social media channel to enable colleagues to spar and become allies. External speakers were invited to bring knowledge and perspectives to the table.
The local I&D team looked into talent acquisition opportunities for recruiting people of diverse origins into leadership roles and internship programmes. They also analysed the current population of HEINEKEN Brazil and proposed actions to shape the future strategy.
As the world’s most international brewer, we aim to reflect the world around us to brew enjoyment of life for all. We use the power of diversity and entrepreneurial spirit to create an inclusive environment where everybody feels they belong and have equal opportunity to contribute.
The HEINEKEN Inclusive Practices 2020 saw the launch of the nine HEINEKEN Inclusive Practices, created to spread awareness and understanding of how to practice inclusion.
The Inclusive Practices cover behaviours such as ‘Communicate inclusively’ and ‘Develop self-awareness’ to address unconscious biases.
Starting in July 2020, the ‘Inclusive Vitamins’ campaign encouraged employees to take e-learning ‘vitamins’ and discover the what, why and how of each Inclusive Practice.
More than 3,500 people have taken their ‘inclusive vitamin’ e-learnings by end of 2020.
Engaging employeesTo best embrace our cultural diversity, we have a global community of 100+ Inclusion and Diversity (I&D) ambassadors. They support management teams around the world to deliver our global I&D goals and to respond to local contexts and opportunities.
A global inclusion network connects Employee Resource Groups with the I&D ambassadors to drive collaboration around the world. Quarterly ‘Share-Learn-Reapply’ sessions give I&D ambassadors the chance to connect and share learnings and best practices.
HEINEKEN Taiwan is taking the lead on the Women in Sales initiative. The senior management team in Taiwan is now made up equally of men and women. Analysis by the HR team has shown there is no gender bias in terms of gender representation, pay, job grade, performance management, promotion opportunities or management representation at HEINEKEN Taiwan.
HEINEKEN Open and ProudOur Employee Resource Group focusing on LGBT+, HEINEKEN Open and Proud (HOP), continued to increase its reach across our operating companies in 2020.
We piloted ‘Listening and Dialogue’ sessions at our Head Office, creating a platform for employees to discuss I&D topics including, but not limited to, gender, race and ethnicity, nationalities, generations and sexual orientation.
The I&D ambassador network launched online unconscious bias workshops in 2020. These trainings highlight the biases we all have, and how we can best mitigate them.
700+ leaders completed the Inclusive Leadership programme in 2020 to develop their inclusive leadership capabilities.
HEINEKEN joined the Financial Times ranks for Europe’s most inclusive companies for the first time, confirmation that our strong I&D ambassador network and our global and local initiatives are helping our company become more inclusive day-by-day.
Diversity at senior levelsAt the end of 2020, there were 61 nationalities among our senior managers (2019: 61). We aim to continually improve the gender balance of our Senior Managers, with female representation at senior levels reaching 23% (2019: 23%, 2018: 20%, 2017: 19%).
Representation by gender in 2020 % male % female
Supervisory Board 60 40Executive Board 50 50Executive Team 82 18Senior Management 77 23
Women in salesIn 2020, the global Sales team launched an action plan to create and nurture an inclusive sales environment where women can thrive. It includes a pilot ‘Women in Sales’ mentoring programme and a dedicated Employee Resource Group which is open to all HEINEKEN employees.
In October 2020, the CEO of HEINEKEN France signed the ‘L’autre cercle’ charter for Inclusion, the most well-known charter for LGBT+ workplace inclusion in France. This is a clear sign of the steps the company is taking towards ensuring that LGBT+ employees can feel safe bringing their full selves to work.
HEINEKEN Mexico earned a top rating by Human Rights Campaign (one of America's largest civil rights organisations) for creating LGBT+-inclusive policies and practices in the workplace.
Learn more about this topic on our website
Inclusion and diversity
149 Heineken N.V. Annual Report 2020
We are committed to doing business with respect for people’s fundamental dignity and their human rights. We use the UN Guiding Principles on Business and Human Rights as our starting point for understanding, avoiding and addressing human rights risks in our operations and value chain.
Human rights due diligenceOur Human Rights due diligence process has been constantly evolving since 2016. It focuses on four key areas: Assess – and prioritise human rights risks;
Integrate – the Human Rights Policy and identified risks into ways of working.
Track – and audit policy implementation.
Communicate – progress internally and externally.
Engagement with stakeholders and industry is key. We are proud to be a founding member of the Consumer Goods Forum coalition to end forced labour, an active member in AIM-Progress and to have a seat at the European Round Table for Industrialists and World Economic Forum social initiatives. We continue to draw from the experience of NGO partners on topics such as local sourcing and respecting human rights in high risk contexts.
In 2020, the Corporate Human Rights Benchmark ranked HEINEKEN number three in the Agri-product category for its human rights disclosures and eighth across all industries.
Assess We started conducting human rights risk assessments and action planning workshops in 2016. Following the workshops, operating companies develop practical and relevant action plans to address the potential human rights risks identified.
To date, we have completed risk assessments and workshops in 16 operating companies: Brazil, Cambodia, Democratic Republic of Congo, Ethiopia, Haiti, Hungary, Indonesia, Jamaica, Mexico, Myanmar, New Zealand, Nigeria, Serbia, South Africa, Timor-Leste and the UK.
In 2020, we developed online workshops and we will continue to strengthen regional governance structures and human rights monitoring in the coming year.
Managing human rights risks across our value chain is an ongoing priority. We have enhanced our supplier screening and due diligence process. An automated supplier risk management tool allows us to identify elevated risks in our value chain and focus on actions to mitigate them.
Following research by the African Studies Centre Leiden (ASCL) into the socio-economic and agronomic dynamics of the Sorghum value chain in Nigeria, we identified potential human and labour rights risks in this market. We will conduct a Human and Labour Rights risk assessment of sorghum farms and aggregators in Nigeria, and Nigerian Breweries and farm owners will develop an action plan to address any issues identified.
Integrate and act Based on the human rights risks identified through our work with Shift, the leading centre of excellence on business and human rights, we revised our Human Rights Policy in 2018. We also strengthened the human rights section of our Supplier Code and compliance is integrated into our global sourcing activities. In 2019, we developed practical implementation guidelines to help operating companies embed the revised Human Rights Policy in their activities.
We have established regional cross-functional Good Governance platforms to address human rights issues and focus operating companies’ time and resources on the common risks for their region.
Track We track our Human Rights risks and impacts through four key channels: The HEINEKEN risk control framework; Global Audit Human Rights reviews; Speak Up; and third-party assessments.
The HEINEKEN risk control framework embeds respect for human rights in our internal controls. The Risk Committee maintains oversight of programmes and actions to strengthen respect for human rights. It is comprised of the chiefs of global functions and chaired by HEINEKEN’s CFO. Each operating company must check their own policies and practices against the Human Rights Policy and implementation guidelines.
With the support of KPMG, Global Audit increased capacity to review operating companies against the key principles of our Human Rights Policy. Any gaps identified are included in the issue management system and operating companies must develop plans and take action to mitigate them.
Despite the impact of COVID-19, in-depth human rights audits were carried out in four more operating companies. Through a partnership with Ulula, mobile phone technology enabled parts of these audits to be conducted virtually through new measurement, listening and engagement tools.
We commission 46 independent third-party audits of our outsourcing practices in Africa. The outcomes enable us to address areas for improvement including strengthening our guidelines for outsourcing and supporting respect for human rights of non-employee workers.
Communicate Openly communicating about our human rights commitments, progress and dilemmas is vital to build trust with stakeholders. New circumstances and incidents trigger new approaches and policies, and we share our learnings to prevent future impacts.
Respecting human rights in high risk contextsWe may face human right dilemmas in countries that are politically less stable. We constantly review whether we can continue to operate in such countries and, if so, how?
Our Policy is that operating companies should never knowingly contribute to human rights violations by others, or where human rights are compromised. We will always protect the security of our employees, their families and of our facilities. We work with security staff who are properly instructed and trained to respect human rights.
The Good Governance Platform for the Africa, Middle East, East Europe region (AMEE) has acted as an operational hub to develop principles and solutions to meet this policy commitment. Its actions have included:
– Internal and external consultation on the potential human rights scenarios we may face;
– Developing a methodology to assess and rank operating companies according to human rights risks;
– Eight golden rules on how to address Human Rights in high risk contexts; and
– Individual action plans and strengthened governance structures in the highest risk Operating Companies.
Looking ahead, we will extend their Good Governance approach beyond AMEE.
An example is our response to concerns over the working conditions of Brand Promoters in Africa.
Internally, we provide dedicated webinars, communication and training for all regions on our Human Rights Policy and guidelines.
Learn more about this topic on the website
Respecting Human Rights
150 Heineken N.V. Annual Report 2020
We continue to disclose our financial and Brewing a Better World performance in one combined, integrated annual report.
We believe it is important to provide independent confirmation that the information in this report is reliable and accurate, hence Deloitte provides limited assurance on 34 of the most important non-financial indicators.
More information about our actions and progress in 2020, other non-financial KPIs and background information can be found in datasheets and the GRI and Environmental tables, Basis of Preparation of Non-Financial Information and other disclosures we make available online.
Brewing a Better World GovernanceOur governance model for Brewing a Better World ensures we deliver against our commitments both globally and locally. Brewing a Better World progress is one of the key topics of HEINEKEN Executive Team discussions chaired by our CEO. Being one of five HEINEKEN strategic priorities, progress on Brewing a Better World achievements and key highlights are reported to the Executive Team, the Executive Board and the Supervisory Board. Material strategy, targets per focus area and significant changes in definitions are subject to approval by the Executive Board. As of 2018, Brewing a Better World focus areas are formally included in HEINEKEN strategic and annual planning process.
Supported by expert input from subject specialists, this ensures effective implementation of Brewing a Better World initiatives across the business.
Focus on sustainability is embedded throughout the business, for example driven by Supply Chain (Every Drop and Drop the C), Procurement (Sustainable Sourcing), HR (Health and Safety) and Commerce (Responsible Consumption). As a part of Brewing a Better World governance, accountability for driving our ambition lies with the HEINEKEN Executive Team globally and with the General Manager of each HEINEKEN operating company locally.
Functions (at global and operating company level) are responsible for defining ambitions and targets, and for implementing, delivering, monitoring and reporting progress on their respective indicators. The Global Sustainable Development team of Global Corporate Affairs and Corporate Affairs management at operating company level oversee the BaBW strategy and drive collaboration and coordination of BaBW activities between involved functions. Each operating company has a responsibility for sustainability reporting and a team engaged in delivering Brewing a Better World.
The Global Sustainable Development team consolidates, analyses and further communicates data reported by operating companies and global functions on a quarterly basis and in the Annual Report. Further, we form alliances (tribes) throughout the organisation and with our suppliers to develop new solutions in the focus areas.
Reporting period and operating companies in scopeThe non-financial indicators in this report cover the performance of all our consolidated operating companies from 1 January 2020 upto and including 31 December 2020, unless stated otherwise. A different reporting period is applied to the accident frequency indicator (December 2019 – November 2020) as the current reporting cycle does not allow for reporting within the timelines required for the Annual Report.
Operating companies included in the scope of our reporting are listed in the sustainability section of the report, unless stated otherwise. The reporting scope depends to a significant extent on the nature of each indicator and hence exceptions and limitations are explained per each indicator in the document ‘Basis of Preparation of Non-Financial Indicators’. Units (countries, sites, suppliers, brands etc.), which for specific reasons received formal derogations for compliance with commitments, are excluded from the indicator scope in consolidation, unless stated otherwise.
Consolidated operating companies include companies fully owned by HEINEKEN, or where HEINEKEN holds a majority share. Joint ventures, associates, licensed partners, export markets are not consolidated, unless stated otherwise (in a number of indicators). Export markets refer to countries outside the custom borders of countries where operating companies are residing. The term ‘production unit’ means breweries, cider plants, soft drink plants, malteries, water plants and combinations of these, at which malt, beer, cider, soft drinks and water are produced. Two packaging material plants are also in the scope of production units, covering the manufacture of bottles and crates. Other consolidated plants include a winery and distillery. New acquisitions and greenfield breweries are included in the consolidated reporting after the first full calendar year of their operation.
In 2020 we started reporting on one new site in Ecuador (Guayaquil). No sites have been excluded from BaBW reporting in 2020.
Indicators in scopeThe content of the report is based on the material aspects for both our Company and our stakeholders and is directly linked to the Brewing a Better World strategy, our six focus areas and our 2020 commitments.
We have selected the non-financial KPIs that are most material, based on the following criteria:
– The KPI is a Brewing a Better World commitment, or a new target we publicly disclosed; – The KPI is not related to a target but part of one of the Brewing a Better World focus areas and seen as
important by our stakeholders; and/or – The combination of KPIs should give a balanced, high level overview of our progress in 2020.
Scope and materiality of indicators may be reviewed by the Disclosure Committee and adjusted once a year with effect as of the following year.
As a part of HEINEKEN Risk management process, we assess main risks that could hinder HEINEKEN in achieving its strategy and business objectives. This process includes identifying Environmental, Social and Governance (ESG) related risks. The three key risks are: limited availability of natural resources which could impact our supply chain continuity; the impact and speed of environmental regulations; and the increased scrutiny of society on companies. These risks are included in this report.
Reporting basis and governance of non-financial indicators
151 Heineken N.V. Annual Report 2020
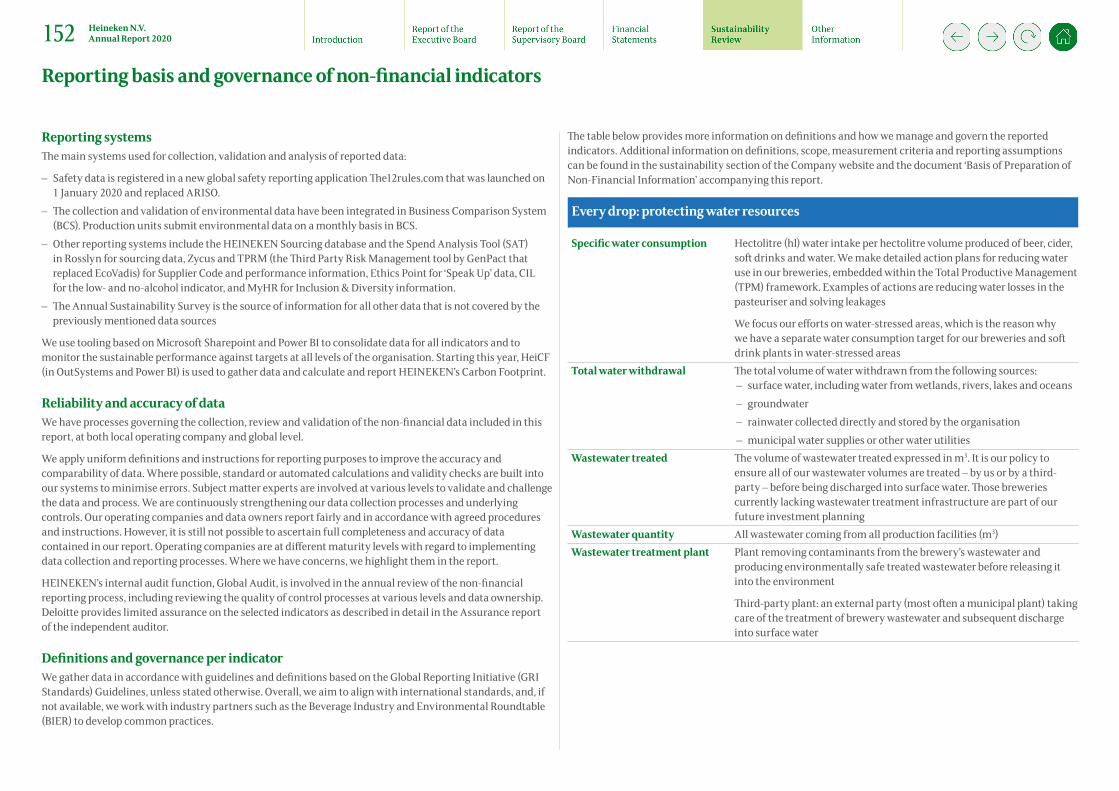
Reporting systemsThe main systems used for collection, validation and analysis of reported data:
– Safety data is registered in a new global safety reporting application The12rules.com that was launched on1 January 2020 and replaced ARISO.
– The collection and validation of environmental data have been integrated in Business Comparison System(BCS). Production units submit environmental data on a monthly basis in BCS.
– Other reporting systems include the HEINEKEN Sourcing database and the Spend Analysis Tool (SAT) in Rosslyn for sourcing data, Zycus and TPRM (the Third Party Risk Management tool by GenPact that replaced EcoVadis) for Supplier Code and performance information, Ethics Point for ‘Speak Up’ data, CILfor the low- and no-alcohol indicator, and MyHR for Inclusion & Diversity information.
– The Annual Sustainability Survey is the source of information for all other data that is not covered by thepreviously mentioned data sources
We use tooling based on Microsoft Sharepoint and Power BI to consolidate data for all indicators and to monitor the sustainable performance against targets at all levels of the organisation. Starting this year, HeiCF (in OutSystems and Power BI) is used to gather data and calculate and report HEINEKEN’s Carbon Footprint.
Reliability and accuracy of dataWe have processes governing the collection, review and validation of the non-financial data included in this report, at both local operating company and global level.
We apply uniform definitions and instructions for reporting purposes to improve the accuracy and comparability of data. Where possible, standard or automated calculations and validity checks are built into our systems to minimise errors. Subject matter experts are involved at various levels to validate and challenge the data and process. We are continuously strengthening our data collection processes and underlying controls. Our operating companies and data owners report fairly and in accordance with agreed procedures and instructions. However, it is still not possible to ascertain full completeness and accuracy of data contained in our report. Operating companies are at different maturity levels with regard to implementing data collection and reporting processes. Where we have concerns, we highlight them in the report.
HEINEKEN’s internal audit function, Global Audit, is involved in the annual review of the non-financial reporting process, including reviewing the quality of control processes at various levels and data ownership. Deloitte provides limited assurance on the selected indicators as described in detail in the Assurance report of the independent auditor.
Definitions and governance per indicatorWe gather data in accordance with guidelines and definitions based on the Global Reporting Initiative (GRI Standards) Guidelines, unless stated otherwise. Overall, we aim to align with international standards, and, if not available, we work with industry partners such as the Beverage Industry and Environmental Roundtable (BIER) to develop common practices.
The table below provides more information on definitions and how we manage and govern the reported indicators. Additional information on definitions, scope, measurement criteria and reporting assumptions can be found in the sustainability section of the Company website and the document ‘Basis of Preparation of Non-Financial Information’ accompanying this report.
.Every drop: protecting water resources
Specific water consumption Hectolitre (hl) water intake per hectolitre volume produced of beer, cider, soft drinks and water. We make detailed action plans for reducing water use in our breweries, embedded within the Total Productive Management (TPM) framework. Examples of actions are reducing water losses in the pasteuriser and solving leakages
We focus our efforts on water-stressed areas, which is the reason why we have a separate water consumption target for our breweries and soft drink plants in water-stressed areas
Total water withdrawal The total volume of water withdrawn from the following sources: – surface water, including water from wetlands, rivers, lakes and oceans – groundwater – rainwater collected directly and stored by the organisation – municipal water supplies or other water utilities
Wastewater treated The volume of wastewater treated expressed in m3. It is our policy to ensure all of our wastewater volumes are treated – by us or by a third-party – before being discharged into surface water. Those breweries currently lacking wastewater treatment infrastructure are part of our future investment planning
Wastewater quantity All wastewater coming from all production facilities (m3)Wastewater treatment plant Plant removing contaminants from the brewery’s wastewater and
producing environmentally safe treated wastewater before releasing it into the environment
Third-party plant: an external party (most often a municipal plant) taking care of the treatment of brewery wastewater and subsequent discharge into surface water
Reporting basis and governance of non-financial indicators
152 Heineken N.V. Annual Report 2020
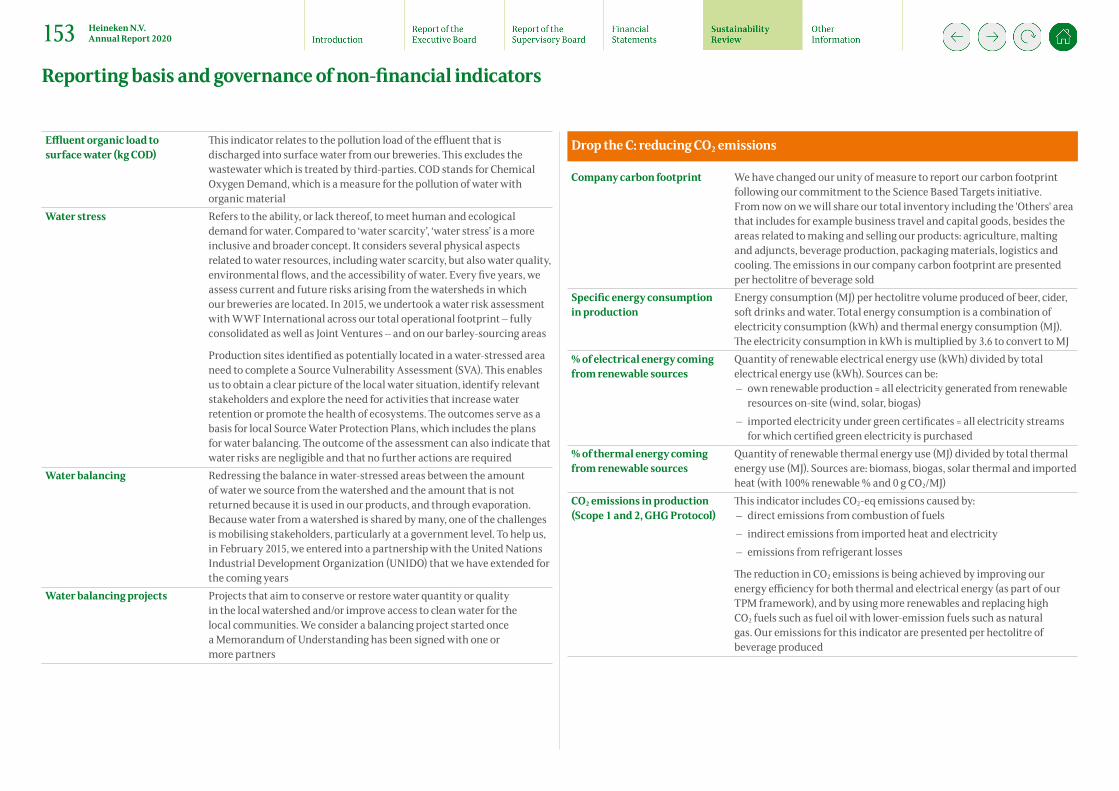
Effluent organic load to surface water (kg COD)
This indicator relates to the pollution load of the effluent that is discharged into surface water from our breweries. This excludes the wastewater which is treated by third-parties. COD stands for Chemical Oxygen Demand, which is a measure for the pollution of water with organic material
Water stress Refers to the ability, or lack thereof, to meet human and ecological demand for water. Compared to ‘water scarcity’, ‘water stress’ is a more inclusive and broader concept. It considers several physical aspects related to water resources, including water scarcity, but also water quality, environmental flows, and the accessibility of water. Every five years, we assess current and future risks arising from the watersheds in which our breweries are located. In 2015, we undertook a water risk assessment with WWF International across our total operational footprint – fully consolidated as well as Joint Ventures – and on our barley-sourcing areas
Production sites identified as potentially located in a water-stressed area need to complete a Source Vulnerability Assessment (SVA). This enables us to obtain a clear picture of the local water situation, identify relevant stakeholders and explore the need for activities that increase water retention or promote the health of ecosystems. The outcomes serve as a basis for local Source Water Protection Plans, which includes the plans for water balancing. The outcome of the assessment can also indicate that water risks are negligible and that no further actions are required
Water balancing Redressing the balance in water-stressed areas between the amount of water we source from the watershed and the amount that is not returned because it is used in our products, and through evaporation. Because water from a watershed is shared by many, one of the challenges is mobilising stakeholders, particularly at a government level. To help us, in February 2015, we entered into a partnership with the United Nations Industrial Development Organization (UNIDO) that we have extended for the coming years
Water balancing projects Projects that aim to conserve or restore water quantity or quality in the local watershed and/or improve access to clean water for the local communities. We consider a balancing project started once a Memorandum of Understanding has been signed with one or more partners
Drop the C: reducing CO2 emissions
Company carbon footprint We have changed our unity of measure to report our carbon footprint following our commitment to the Science Based Targets initiative. From now on we will share our total inventory including the 'Others' area that includes for example business travel and capital goods, besides the areas related to making and selling our products: agriculture, malting and adjuncts, beverage production, packaging materials, logistics and cooling. The emissions in our company carbon footprint are presented per hectolitre of beverage sold
Specific energy consumption in production
Energy consumption (MJ) per hectolitre volume produced of beer, cider, soft drinks and water. Total energy consumption is a combination of electricity consumption (kWh) and thermal energy consumption (MJ). The electricity consumption in kWh is multiplied by 3.6 to convert to MJ
% of electrical energy coming from renewable sources
Quantity of renewable electrical energy use (kWh) divided by total electrical energy use (kWh). Sources can be:
– own renewable production = all electricity generated from renewable resources on-site (wind, solar, biogas)
– imported electricity under green certificates = all electricity streams for which certified green electricity is purchased
% of thermal energy coming from renewable sources
Quantity of renewable thermal energy use (MJ) divided by total thermal energy use (MJ). Sources are: biomass, biogas, solar thermal and imported heat (with 100% renewable % and 0 g CO2/MJ)
CO2 emissions in production (Scope 1 and 2, GHG Protocol)
This indicator includes CO2-eq emissions caused by: – direct emissions from combustion of fuels – indirect emissions from imported heat and electricity – emissions from refrigerant losses
The reduction in CO2 emissions is being achieved by improving our energy efficiency for both thermal and electrical energy (as part of our TPM framework), and by using more renewables and replacing high CO2 fuels such as fuel oil with lower-emission fuels such as natural gas. Our emissions for this indicator are presented per hectolitre of beverage produced
Reporting basis and governance of non-financial indicators
153 Heineken N.V. Annual Report 2020

CO2 emissions in distribution (Scope 3, GHG protocol)
This indicator refers to CO2-eq emissions from outbound distribution of finished goods and returns of empty packaging material. It includes domestic and export transport by road, rail and sea. Excluded is inbound transport
We focus our actions on reducing the distance we drive, improving fuel efficiency with our transport partners, switching from road to rail and water, and using more carbon-efficient vehicles. As the majority of our transport is outsourced, we work in collaboration with our transport service providers and also with peer companies, customers, fuel providers, industry groups and other key stakeholders
CO2 emissions from fridges (Scope 3, GHG protocol)
This indicator refers to CO2-eq emissions as a result of the electricity used by beverage fridges (branded and non-branded) invoiced to HEINEKEN
Green fridges HEINEKEN buys and supplies fridges used to store and display our beer products in supermarkets, bars and restaurants. This allows us to control the quality of the beer by setting the correct temperature, as well as the appearance of the fridge and our brands within it. To reduce our emissions, we focus on installing more energy-efficient fridges in conjunction with our suppliers. We ask our suppliers to test new fridges to determine the HEINEKEN Energy Efficiency Index (HEEI): the energy consumption of the fridge divided by the average energy consumption of similar HEINEKEN fridges on the market in 2010, multiplied by 100
In case our suppliers have not (yet) provided us with the HEEI, we calculate the HEEI based on the energy saving features of the fridge model. We consider our fridges ‘green’ if they have one or more of the following green features: use of hydrocarbon refrigerant, LED illumination, an energy management system and energy-efficient fans
We further enhanced our data gathering method, and decreased our reliance on self-declared numbers by the operating companies to using our centralised procurement tool where possible
Waste destination % and absolute value*
Destination of residual products from the brewing process: either recycled into feed, material loops, compost or energy, or – when not recycled – incinerated or sent to landfill. Brewer’s grains and yeast, for example, have a high nutrition value and are recycled for animal or human consumption
It is our ambition to achieve zero waste to landfill in our production facilities, and this is part of our mandatory TPM framework
Sourcing sustainably
Sustainable agriculture By sourcing raw materials sustainably, we help improve farming practices and enable farmers all over the world to adopt better environmental and social standards. Our procedures for sourcing sustainably cultivated crops are based on the principles of the Sustainable Agriculture Initiative platform (SAI), an organisation of multinational food companies working towards a more sustainable food chain. Suppliers allocating sustainably cultivated crops to us are required to follow our procedures and we encourage them to work with farmers who grow their crops sustainably
We follow the definition of the Sustainable Agriculture Initiative (SAI): the efficient production of safe, high quality agricultural products, in a way that protects and improves the natural environment, the social and economic conditions of farmers, their employees and local communities, and safeguards the health and welfare of all farmed species
Our sustainable sourcing reporting is based on the concept of ‘mass balance’. This tracks what percentage of a suppliers’ materials are produced sustainably and is auditable, from farm to brewery
% of our main agricultural raw materials from sustainable sources
Contracted sustainable volumes as percentage of total contracted volumes. Sustainable is any agricultural product in scope of the Sustainable Agriculture programme, that has been:1. cultivated in accordance with an approved Code of Practice and2. allocated to HEINEKEN by our supplier in accordance with the mass
balance approach
Volumes contracted in 2020 for delivery in 2021 are reported in this Annual Report. In scope are barley, hops, apples, sugar beet, sugar cane, rice, sorghum, wheat and maize supplied to our operating companies and joint ventures via HEINEKEN Global Procurement
% of agricultural raw materials locally sourced in Africa
Quantity (in tonnes) of agricultural ‘extract’ producing raw materials (plus hops) that are cultivated in the Africa and Middle East region (AME) and that are purchased for use in the production of beers, soft drinks, cider, wine and spirits at our own production facilities in that region, divided by the total quantity of raw materials purchased within the region
Number of farmers and families impacted
Calculation based on the total quantity of agricultural raw materials purchased (tons), divided by the average farm size (hectares) and the average yield per crop produced (tons per hectare), plus the number of farmers supported with training in our PPP projects
Reporting basis and governance of non-financial indicators
154 Heineken N.V. Annual Report 2020

Number of different local sourcing initiatives
HEINEKEN operating companies sourcing any agricultural raw material within the AME Region. Each value chain is counted individually and some involve working with smallholder farmers, while others work with larger scale commercial farmers
Local sourcing approach As a large buyer of crops, we can have a significant economic impact on local agricultural communities. Our local sourcing Public-Private Partnership (PPP) projects work with smallholder farmers and aim to help them raise yields and compete against imported crops. They empower farmers and their communities by helping to reduce poverty and improve local food security. At the same time, HEINEKEN benefits by reducing import-related duties and securing a sustainable supply of raw materials
To achieve more, faster, we have supported a number of PPPs in which HEINEKEN and a public sector donor (e.g. the Dutch Ministry of Foreign Affairs and the German GIZ development agency) jointly fund agricultural development projects. Other partners have included the European Cooperative for Rural Development (EUCORD), International Finance Corporation (IFC), and Dutch NGOs Agriterra, ICCO and FairMatch Support
HEINEKEN Supplier Code Much of our impact lies indirectly with our suppliers, so we work with them to embed the right practices. Every supplier is asked to abide by our Supplier Code, which sets out clear guidelines for how we expect them to act in the areas of Integrity and Business Conduct, Human Rights, and the Environment. The Supplier Code Procedure is implemented among all our suppliers, and we expect our suppliers to ensure that their suppliers adhere to the same standards
Supplier A supplier is an entity: – that delivers goods and/or services on a regular basis, more than once a
calendar year, and – is registered in the vendor master database as an active supplier, and
of which invoices are registered in the central systems for payment onbehalf of Heineken N.V. or one of its affiliates, and
– with which there has been spend preceding the assessment of thestatus of the supplier in the 18 months prior to the cut-off date of 13 October 2020.
The definition excludes: tax authorities, charities, sponsorships, customer refunds and intercompany suppliers
Supplier Code four-step procedure
We safeguard compliance through a risk-based step-by-step process:1. Signing. By signing the HEINEKEN Supplier Code, suppliers agree
to comply with our principles of integrity, environmental care andhuman rights.
2. Risk analysis. The intensity with which we monitor compliance against our Supplier Code depends on the risk profile of a supplier. Our supplierrisk analysis (SRA) tool identifies suppliers based on their type of business and level of supplier-specific risk. All potentially high-risk suppliers are required to go through step three of the programme.
3. Screening. We screen our suppliers based on four key risk drivers: (1) sanctions, (2) anti-bribery and anti-corruption, (3) state-owned entitiesand politically exposed persons, (4) adverse media (human and labour rights, health, safety and environment, fair competition, fraud, and anti-money laundering).
4. Action. All medium and high risk suppliers identified in Step 3 have togo through the Step 4 'Action', which has several options of follow up actions: contract termination, training, contract clause, enhanced due-diligence, annual certification, or supplier on-site audits.
Average level of compliance (%) of all operating companies with four-step Supplier Code Procedure
We calculate compliance as the number of suppliers compliant with all applicable four-steps of the Supplier Code Procedure divided by the total number of our suppliers. Suppliers with derogations are included in the calculation as compliant
Reporting basis and governance of non-financial indicators
155 Heineken N.V. Annual Report 2020

Advocating responsible consumption
% of operating companies spending >10% of media spend for Heineken® in supporting dedicated responsible consumption campaigns
Heineken® media spend includes all expenses incurred for placing and broadcasting Heineken® brand dedicated responsible consumption campaigns (‘Enjoy Heineken® Responsibly’ or ‘When You Drive, Never Drink’) amounting to a minimum of 10% of their actual Heineken® media spend, per market. The scope includes all consolidated operating companies, joint ventures and export markets selling Heineken® and investing media spend. Exceptions are ‘dark markets’ where above-the-line communication is not allowed according to regulations
In 2020, in response to the COVID-19 pandemic, many of our markets redirected their 10% of media budgets to a specially developed campaign ‘Back to the Bars – #socialiseresponsibly' alongside the 'Enjoy Heineken® Responsibly' and 'When you Drive Never Drink' campaigns. In addition to the original commitment, we also assessed the compliance of markets that invested at least 10% of their Heineken® media budget in the three campaigns together
Number of operating companies have an active and relevant partnership aimed at addressing alcohol-related harm
Working closely with third-parties like local governments, NGOs and specialists, these partnerships address alcohol-related harm on issues such as underage drinking, drinking and driving, or excessive drinking. In scope are HEINEKEN operating companies with the exemption of those in Islamic countries, export markets, markets where we have a Joint Venture and minimal-volume markets where allocating resources to such partnerships is unrealistic. As of 2019, the scope only includes markets where we feel our business could make a positive contribution to reducing the harmful use of alcohol. For other markets, where partnerships have already delivered what we aspired or partnerships are expiring and markets are preparing for a new, sustainable ambition 2030, this commitment became optional. Active partnerships means: meaningful, substantive engagement over a year or years, with each side benefiting and being challenged by the other. An active partnership should have a regular cadence of communication and a regular schedule for collaborations or joint executions. A relevant alcohol partnership is one that is responsive to the needs of the local community as identified by critical stakeholders and/or local trends
Low- and no-alcohol All beer, cider, hop and/or malt based drinks with an ABV of 3.5% or less. This does not include soft drinks
Low- and no-alcohol as % of our global volume
Total low- and no-alcohol volume/Total consolidated beer and cider volume
Ingredients and nutrition information
We committed to include nutrition information and ingredients on pack and online in our operating companies in the EU, and on pack or online in the operating companies outside the EU. Our target applies to all our beer brands and cider brands around the world, produced and sold by HEINEKEN operating companies. The commitment is applicable to consumer facing products (bottles, cans). The scope includes brands (line extensions) sold in volumes above a threshold of 6,000 hl per year , based on 2019 volume data
Responsible Marketing Code The Code is fully in line with the Producers’ commitments, guides us in the way we market our products. These rules help everyone at HEINEKEN who is involved in marketing and the sales of our products to ensure we do not contribute to excessive consumption or misuse. The Code covers all communications channels, the most common being: packaging, point of sale, signage, trade promotions, sponsorships, advertising, digital and social media
Promoting health & safety
% of compliance with Life Saving Rules
Our ‘Safety First’ approach is focused on improving safety across the whole Company. Our global strategy systematically addresses safety across the whole of the Company, with a particular focus on road safety
The 12 Life Saving Rules set out clear and simple ‘do’s and don’ts’ for our highest-risk activities. All operating companies are required to assess their safety performance and close any gaps through action plans
Fatal accidents All work-related fatal accidents of permanent, fixed-term or temporary personnel (own staff and contractor personnel)
Accidents An accident which resulted in permanent disability or which requires hospitalisation for more than 24 hours or resulting in more than one lost day
Lost days Lost days are only counted for own employees, from the first day after the case until the day the person returns to normal duties at work. All calendar days are counted
Lost time accident frequency Number of accidents resulting in absence from work per 100 FTE (own staff)
This is an indicator of the state of health and safety at the workplace
Note: employees on furlough during the COVID-19 crisis are included in the FTE
Reporting basis and governance of non-financial indicators
156 Heineken N.V. Annual Report 2020

Growing with communities
Our approach to tax We believe in responsible tax behaviour as an essential part of our sustainability strategy. The taxes we pay contribute to local economies and support the development of the many countries in which we operate. We support stable, transparent and predictable tax regimes that incentivise long-term investment and economic growth
Tax strategy HEINEKEN’s sustainable and transparent tax strategy is based on a number of key principles:
– Our commitment to comply with relevant tax laws and internationalregulations, we aim to comply with the letter as well as the spirit of the law;
– Compliance with the HEINEKEN Code of Conduct; – Expectation that we will pay tax in the country where our activities
take place. We fully support and follow the OECD transfer pricing guidelines and transactions between HEINEKEN operating companiesare based on the ‘arm’s length’ principle;
– Not using tax havens for tax avoidance purposes; – Open and constructive dialogue with tax authorities that is based
on mutual respect, transparency and trust. We have co-operative compliance relationships with tax authorities in various countries.
Total tax contribution per category
The tax payments made by the fully consolidated HEINEKEN companies during the calendar year. The total tax contribution includes a limited degree of estimation. The scope of total tax contribution is limited to the consolidated reporting entities (not JVs and associates). The categories are: corporate income tax paid, excise duties paid, net VAT paid, employee taxes paid (including social security contributions, but excluding pension contributions), other taxes paid
Corporate income tax paid Cash flows arising from taxes on income, reported by the fully consolidated HEINEKEN companies
Effective income tax rate (beia) Income tax expense expressed as a percentage of the profit before income tax, adjusted for share of profit of associates and joint ventures and impairments thereof (net of income tax)
Beia Before exceptional items and amortisation of acquisition-related intangible assets
Total direct contributions Voluntary contributions (in cash, knowledge, employee time, products and equipment) that help local communities and broader societies address their development priorities and increase the quality of life
The operating companies are free to establish which issues are relevant to both the community and the business. We provide guidelines how to prioritise projects within the focus areas of Brewing a Better World, for example on water stewardship and addressing alcohol-related harm
In certain markets, community investments are coordinated through local foundations, like in Spain and Malaysia
We encourage our employees to volunteer their time with local community organisations. Volunteerism enables employees to give their time and professional expertise to organisations in need of human resources, and it makes Brewing a Better World personal, relevant and a source of pride and ownership for our employees
HEINEKEN Africa Foundation Donations as a voluntary engagement in collaboration with (non) governmental charitable organisations that extends beyond our core business activities, to help improve the health of the communities where we do business
The HEINEKEN Africa Foundation supports projects that improve health for the people who need it most. Over the years, the Foundation has developed strong expertise in Mother & Child Care and Water, Sanitation and Hygiene (WASH). The Foundation works closely together with the HEINEKEN breweries in Sub-Saharan Africa and (N)GOs. Underpinning HEINEKEN’s long-standing commitment to Africa, projects are only carried out in the Sub-Saharan African countries in which HEINEKEN is operating. For each project a partnership is created between the HEINEKEN Africa Foundation, the local HEINEKEN brewery and a local or international (N)GO. The Foundation provides funding and administrative assistance. The local brewery supports through means of manpower, expertise and monitoring. The (N)GO is responsible for the implementation and continuation of the project
Visit the Foundation’s website for more information
Reporting basis and governance of non-financial indicators
157 Heineken N.V. Annual Report 2020
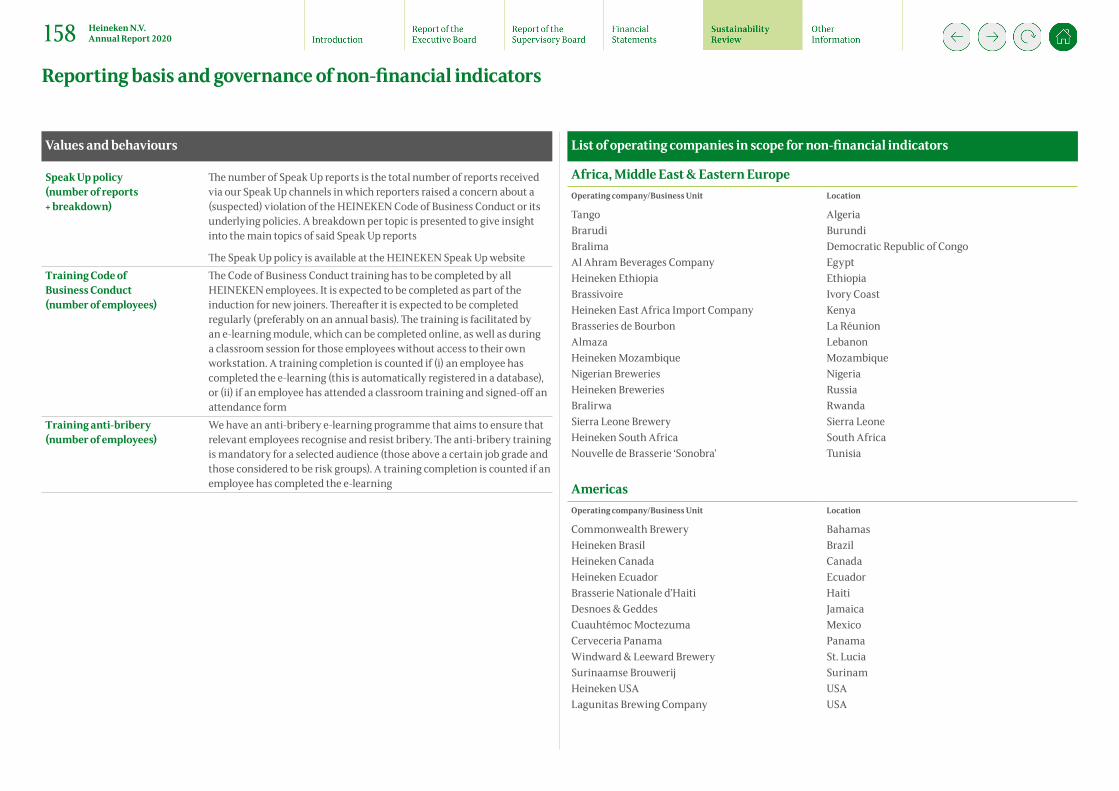
Values and behaviours
Speak Up policy (number of reports + breakdown)
The number of Speak Up reports is the total number of reports received via our Speak Up channels in which reporters raised a concern about a (suspected) violation of the HEINEKEN Code of Business Conduct or its underlying policies. A breakdown per topic is presented to give insight into the main topics of said Speak Up reports
The Speak Up policy is available at the HEINEKEN Speak Up websiteTraining Code of Business Conduct (number of employees)
The Code of Business Conduct training has to be completed by all HEINEKEN employees. It is expected to be completed as part of the induction for new joiners. Thereafter it is expected to be completed regularly (preferably on an annual basis). The training is facilitated by an e-learning module, which can be completed online, as well as during a classroom session for those employees without access to their own workstation. A training completion is counted if (i) an employee has completed the e-learning (this is automatically registered in a database), or (ii) if an employee has attended a classroom training and signed-off an attendance form
Training anti-bribery (number of employees)
We have an anti-bribery e-learning programme that aims to ensure that relevant employees recognise and resist bribery. The anti-bribery training is mandatory for a selected audience (those above a certain job grade and those considered to be risk groups). A training completion is counted if an employee has completed the e-learning
List of operating companies in scope for non-financial indicators
Africa, Middle East & Eastern EuropeOperating company/Business Unit Location
Tango AlgeriaBrarudi BurundiBralima Democratic Republic of CongoAl Ahram Beverages Company EgyptHeineken Ethiopia EthiopiaBrassivoire Ivory CoastHeineken East Africa Import Company KenyaBrasseries de Bourbon La RéunionAlmaza LebanonHeineken Mozambique MozambiqueNigerian Breweries NigeriaHeineken Breweries RussiaBralirwa RwandaSierra Leone Brewery Sierra LeoneHeineken South Africa South Africa Nouvelle de Brasserie ‘Sonobra’ Tunisia
AmericasOperating company/Business Unit Location
Commonwealth Brewery BahamasHeineken Brasil BrazilHeineken Canada CanadaHeineken Ecuador EcuadorBrasserie Nationale d’Haiti HaitiDesnoes & Geddes JamaicaCuauhtémoc Moctezuma MexicoCerveceria Panama PanamaWindward & Leeward Brewery St. LuciaSurinaamse Brouwerij SurinamHeineken USA USALagunitas Brewing Company USA
Reporting basis and governance of non-financial indicators
158 Heineken N.V. Annual Report 2020

Asia PacificOperating company/Business Unit Location
Heineken Cambodia CambodiaHeineken Timor L’Este East TimorPT Multi Bintang Indonesia IndonesiaHeineken Japan JapanLao Asia Pacific Breweries LaosHeineken Malaysia Berhad MalaysiaHeineken Myanmar MyanmarGrande Brasserie de Nouvelle Caledonie New CaledoniaDB Breweries New ZealandSouth Pacific Brewery Papua New GuineaAB Heineken Philippines PhilippinesHeineken Asia Pacific SingaporeAsia Pacific Breweries (Singapore) SingaporeSolomon Breweries Solomon IslandsHeineken Korea South KoreaHeineken Lanka Sri LankaHeineken Taiwan TaiwanHeineken Vietnam Brewery Vietnam
EuropeOperating company/Business Unit Location
Brau Union Österreich AustriaBrouwerijen Alken-Maes BelgiumZagorka BulgariaHeineken Hrvatska CroatiaHeineken Ceská Republika Czech RepublicHeineken France FranceHeineken Deutschland GermanyAthenian Brewery GreeceHeineken Hungaria HungaryHeineken Ireland IrelandHeineken Italia ItalyHeineken Netherlands Commerce NetherlandsHeineken Netherlands Supply NetherlandsVrumona NetherlandsGrupa Żywiec PolandSociedade Central de Cervejas e Bebidas PortugalHeineken Romania RomaniaHeineken Serbia SerbiaHeineken Slovensko SlovakiaPivovarna Laško Union SloveniaHeineken España SpainHeineken Switzerland SwitzerlandHeineken UK UK
GlobalOperating company/Business Unit Location
Various Head Office, Regional Offices including export offices and Global Duty Free, and e-commerce entities
Export Other export markets
Reporting basis and governance of non-financial indicators
159 Heineken N.V. Annual Report 2020

Article 12, paragraph 7, of the Articles of Association stipulates:
“Of the profits, payment shall first be made, if possible, of a dividend of six % of the issued part of the authorised share capital.
The amount remaining shall be at the disposal of the General Meeting of Shareholders.”
For 2020, the reported net loss will be attributed to the equity reserves. The Executive Board, with the approval of the Supervisory Board, proposes to the General Meeting of Shareholders on 22 April 2021, to pay a dividend out of the equity reserves in accordance with article 12 paragraph 9 of the Articles of Association.
Civil Code Heineken N.V. is not a ‘structuurvennootschap’ within the meaning of Section 2:152-164 of the Dutch Civil Code. Heineken Holding N.V., a company listed on Euronext Amsterdam, holds 50.005% of the issued shares of Heineken N.V.
Authorised capital The Company’s authorised capital amounts to €2,500 million.
Appropriation of Results
160 Heineken N.V. Annual Report 2020

To the Annual General meeting of Heineken N.V.
Report on the audit of the financial statements 2020 included in the Annual Report 2020Our opinionWe have audited the accompanying financial statements for the year ended 31 December 2020 of Heineken N.V. (‘The Company’ or ‘HEINEKEN’), based in Amsterdam. The financial statements include the consolidated financial statements and The Company financial statements.
In our opinion:
– The accompanying consolidated financial statements give a true and fair view of the financial position of Heineken N.V. as at 31 December 2020, and of its result and its cash flows for 2020 in accordance with International Financial Reporting Standards as adopted by the European Union (EU-IFRS) and with Part 9of Book 2 of the Dutch Civil Code.
– The accompanying Company financial statements give a true and fair view of the financial position of Heineken N.V. as at 31 December 2020, and of its result for the year 2020 in accordance with Part 9 of Book 2 of the Dutch Civil Code.
The consolidated financial statements comprise:
– The consolidated statement of financial position as at 31 December 2020. – The following consolidated statements for the year ended 31 December 2020: the income statement, the
statements of comprehensive income, changes in equity and cash flows. – The notes comprising a summary of the significant accounting policies and other explanatory information.
The company financial statements comprise:
– The Company balance sheet as at 31 December 2020. – The Company income statement for the year ended 31 December 2020. – The notes comprising a summary of the significant accounting policies and other explanatory information.
Basis for our opinionWe conducted our audit in accordance with Dutch law, including the Dutch Standards on Auditing. Our responsibilities under those standards are further described in the “Our responsibilities for the audit of the financial statements” section of our report.
We are independent of Heineken N.V. in accordance with the EU Regulation on specific requirements regarding statutory audit of public-interest entities, the Wet toezicht accountantsorganisaties (Wta, Audit firms supervision act), the Verordening inzake de onafhankelijkheid van accountants bij assurance-opdrachten (ViO, Code of Ethics for Professional Accountants, a regulation with respect to independence) and other relevant independence regulations in the Netherlands. Furthermore, we have complied with the Verordening gedrags- en beroepsregels accountants (VGBA, Dutch Code of Ethics).
We believe the audit evidence we have obtained is sufficient and appropriate to provide a basis for our opinion.
MaterialityBased on our professional judgement we determined the materiality for the financial statements as a whole at €140 million (2019: €200 million). The decrease of 30% compared to 2019 is predominantly a result of the impact of the COVID-19 outbreak on the financial statements of Heineken N.V. The materiality of 2020 is ultimately based on different materiality benchmarks including the three year average of profit before tax, consolidated revenues and total assets as compared to a singular benchmark of 7% of profit before tax in 2019. We have also taken into account misstatements and/or possible misstatements that in our opinion are material for the users of the financial statements for qualitative reasons. Based on our professional judgement we consider revenue and income-based measures as the most appropriate basis to determine materiality.
Audits of group entities (components) were performed using materiality levels determined by the judgement of the group audit team, having regard to the materiality of the consolidated financial statements. Component materiality did not exceed €42 million and for the majority of the components materiality is significantly less than this amount.
We agreed with the supervisory board that misstatements in excess of € 7 million, which are identified during the audit, would be reported to them, as well as smaller misstatements that in our view must be reported on qualitative grounds.
Scope of the group auditHeineken N.V. is at the head of a group of entities. The financial information of this group is included in the consolidated financial statements of Heineken N.V.
Because we are ultimately responsible for our opinion, we are also responsible for directing, supervising and performing the group audit. In this respect we have determined the nature and extent of the audit procedures to be carried out for the group entities (components). Decisive were size and/or risk profile of the components. On this basis, we selected components for which an audit or review had to be carried out on the complete set of financial information or specific items.
Our group audit mainly focused on significant group entities in terms of size and financial interest or where significant risks or complex activities were present, leading to full scope audits performed for 28 components including 3 non-consolidated components.
We have performed audit procedures ourselves at Heineken N.V., corporate entities and the operations in the Netherlands. Furthermore, we performed audit procedures at group level on areas such as consolidation, disclosures, impairment testing for goodwill and other long-term assets, joint ventures, financial instruments, acquisitions and divestments. Specialists were involved amongst others in the areas of treasury, information technology, tax, accounting, pensions and valuations. For selected component audit teams, the group audit team provided detailed written instructions, which, in addition to communicating the requirements of component audit teams, detailed significant audit areas and information obtained centrally relevant to the audit of individual components including awareness for risk related to management override of controls.
Independent Auditor’s Report
161 Heineken N.V. Annual Report 2020
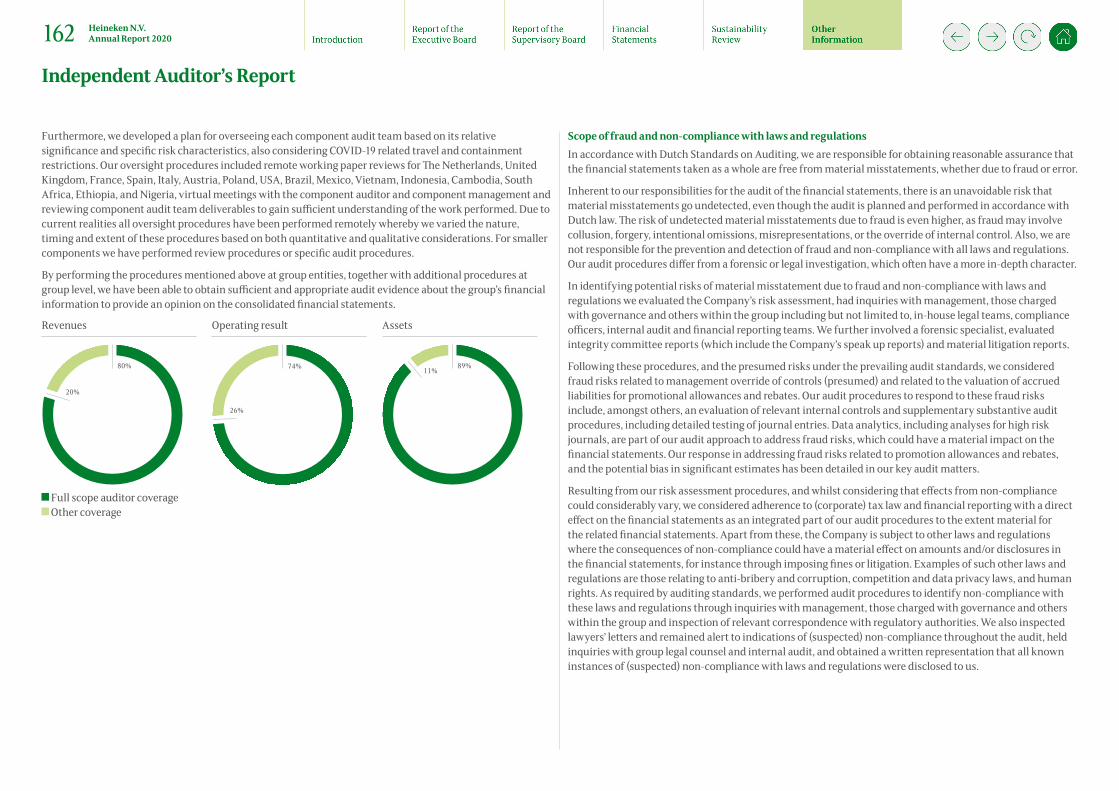
Furthermore, we developed a plan for overseeing each component audit team based on its relative significance and specific risk characteristics, also considering COVID-19 related travel and containment restrictions. Our oversight procedures included remote working paper reviews for The Netherlands, United Kingdom, France, Spain, Italy, Austria, Poland, USA, Brazil, Mexico, Vietnam, Indonesia, Cambodia, South Africa, Ethiopia, and Nigeria, virtual meetings with the component auditor and component management and reviewing component audit team deliverables to gain sufficient understanding of the work performed. Due to current realities all oversight procedures have been performed remotely whereby we varied the nature, timing and extent of these procedures based on both quantitative and qualitative considerations. For smaller components we have performed review procedures or specific audit procedures.
By performing the procedures mentioned above at group entities, together with additional procedures at group level, we have been able to obtain sufficient and appropriate audit evidence about the group’s financial information to provide an opinion on the consolidated financial statements.
Revenues Operating result Assets
80%
20%
74%
26%
89%11%
Full scope auditor coverage Other coverage
Scope of fraud and non-compliance with laws and regulationsIn accordance with Dutch Standards on Auditing, we are responsible for obtaining reasonable assurance that the financial statements taken as a whole are free from material misstatements, whether due to fraud or error.
Inherent to our responsibilities for the audit of the financial statements, there is an unavoidable risk that material misstatements go undetected, even though the audit is planned and performed in accordance with Dutch law. The risk of undetected material misstatements due to fraud is even higher, as fraud may involve collusion, forgery, intentional omissions, misrepresentations, or the override of internal control. Also, we are not responsible for the prevention and detection of fraud and non-compliance with all laws and regulations. Our audit procedures differ from a forensic or legal investigation, which often have a more in-depth character.
In identifying potential risks of material misstatement due to fraud and non-compliance with laws and regulations we evaluated the Company’s risk assessment, had inquiries with management, those charged with governance and others within the group including but not limited to, in-house legal teams, compliance officers, internal audit and financial reporting teams. We further involved a forensic specialist, evaluated integrity committee reports (which include the Company’s speak up reports) and material litigation reports.
Following these procedures, and the presumed risks under the prevailing audit standards, we considered fraud risks related to management override of controls (presumed) and related to the valuation of accrued liabilities for promotional allowances and rebates. Our audit procedures to respond to these fraud risks include, amongst others, an evaluation of relevant internal controls and supplementary substantive audit procedures, including detailed testing of journal entries. Data analytics, including analyses for high risk journals, are part of our audit approach to address fraud risks, which could have a material impact on the financial statements. Our response in addressing fraud risks related to promotion allowances and rebates, and the potential bias in significant estimates has been detailed in our key audit matters.
Resulting from our risk assessment procedures, and whilst considering that effects from non-compliance could considerably vary, we considered adherence to (corporate) tax law and financial reporting with a direct effect on the financial statements as an integrated part of our audit procedures to the extent material for the related financial statements. Apart from these, the Company is subject to other laws and regulations where the consequences of non-compliance could have a material effect on amounts and/or disclosures in the financial statements, for instance through imposing fines or litigation. Examples of such other laws and regulations are those relating to anti-bribery and corruption, competition and data privacy laws, and human rights. As required by auditing standards, we performed audit procedures to identify non-compliance with these laws and regulations through inquiries with management, those charged with governance and others within the group and inspection of relevant correspondence with regulatory authorities. We also inspected lawyers’ letters and remained alert to indications of (suspected) non-compliance throughout the audit, held inquiries with group legal counsel and internal audit, and obtained a written representation that all known instances of (suspected) non-compliance with laws and regulations were disclosed to us.
Independent Auditor’s Report
162 Heineken N.V. Annual Report 2020
Our key audit mattersKey audit matters are those matters that, in our professional judgement, were of most significance in our audit of the financial statements.
We have communicated the key audit matters to the supervisory board. The key audit matters are not a comprehensive reflection of all matters discussed. The matters considered as key to our audit are consistent with those identified in the prior year with the exception of IFRS 16 Leases after the implementation of the standard in 2019. This year, we specifically considered the impact of COVID-19 on Heineken N.V.’s business and its operating results. In addition to the aforementioned impact on materiality, scoping and group oversight we evaluated those accounting areas for which the impact was most pervasive in our audit as a key audit matter. We therefore added our specific audit considerations related to the increased judgement involved with projecting future cash flows and calculating expected credit losses to the key audit matters on impairment testing and contracts with customers, respectively.
The following matters were addressed in the context of our audit of the financial statements as a whole and in forming our opinion thereon, and we do not provide a separate opinion on these matters.
Revenues from contracts with customers – Refer to Note 6.1 and 7.3 to the financial statements
Risk HEINEKEN provides a wide variety of discounts depending on the nature of the customer. The Company also provides discounts with contractually agreed conditions for volume and promotional rebates. Conditional discounts are recognised based on target realisation as specified in Note 6.1 to the financial statements. The target realisation requires management to estimate target realisation based on the expected or actual volume and adjust the discount accruals at balance sheet date.
Given the estimate made by management to assess target realisation for conditional discounts under IFRS 15 Revenue From Contracts with Customers and the inherent presumed fraud risk related to year-end adjustments of revenues and discount accruals, performing audit procedures to evaluate management’s estimate of target realisation based on expected and actual volumes and the resulting adjustments at balance sheet date, required a higher degree of auditor judgement and an increased extent of effort.
How the scope of our audit responded to the risk
Our audit procedures related to management’s assessment of target realisation and the related year end discount accrual included the following, amongst others:
– We obtained an understanding of management’s process for the recognition of discountaccruals at the reporting date based on expected or actual volume data under IFRS 15 Revenue From Contracts with Customers.
– We evaluated forecasting accuracy and management’s ability to appropriately estimate the year end discount accrual by comparing the prior year amount accrued to the amountsubsequently settled.
– We tested the amount of the year end discount accrual through a combination of:
– Developing an expectation for the amount based on the historical and current sales information recorded as a percentage of sales and comparing our expectation to theamount recorded by management.
– Selecting a sample of customers based on current sales information and recalculating the discount accrual by and using the terms of the agreement, accumulated experience,and historical and current sales information.
– Evaluating subsequent settlement of the year end discount accruals – Obtaining confirmations from customers to confirm sales data, contractual agreements
and/or outstanding receivables net of discounts payable.Observation Applying the aforementioned materiality, we have audited the discount accruals for
promotional allowances and volume rebates as recorded in the financial statements. Based on our procedures performed, we did not identify any reportable matters.
Independent Auditor’s Report
163 Heineken N.V. Annual Report 2020

Expected credit losses for contracts with customers – Refer to Notes 7.2, 8.4 and 11.5 to the financial statementsRisk HEINEKEN determines the impairment of receivables using a model which estimates the
lifetime expected credit losses that will be incurred. Individually significant financial assets are tested for impairment on an individual basis. The remaining financial assets are assessed collectively in groups that share similar credit risk characteristics. In 2020 the outbreak of the COVID-19 pandemic and the related containment measures (including the closure of outlets) inherently resulted in a substantial decline in outstanding trade receivables with simultaneously more judgement involved in the calculation of expected credit losses on these and associated receivables (such as loans or advances to customers).
Further details on the accounting and disclosure requirements under IFRS 9 Financial Instruments, including management’s policies around credit management, are included in Notes 7.2, 8.4 and 11.5 to the financial statements respectively. These notes also explain the allowances for expected credit losses recorded at December 31, 2020 for a total amount of €504 million.
Because of increasing judgement involved with the calculation of expected credit losses and the related higher decree of auditor judgement, we considered the recognition of impairments on receivables a key audit matter for our 2020 audit.
How the scope of our audit responded to the risk
Our audit procedures related to management’s assessment of expected credit losses included, amongst others:
– We obtained an understanding of management’s process and evaluated relevant controlsrelated to valuation of allowances of allowances for expected credit losses and the disclosure of credit risks under IFRS 9 Financial Instruments;
– We obtained an understanding of management’s process for the recognition of allowancesfor expected credit losses based on reasonable and supportable information available such as whether there has been a breach or deterioration of payments terms, a request for extended payment terms or a request for waived payment terms.
– We evaluated management’s ability to appropriately estimate allowances for credit lossesand tested the amount recorded at year end through a combination of:
– Developing an expectation for the amount based on the historical collection data and current supportable data on changes in customer payment behaviour and comparingour expectation to the amount recorded by management.
– Testing subsequent collection of outstanding receivables and/or circulating confirmations to customers to confirm contractual agreements and/or the outstandingreceivables net of discounts payable.
Observation Applying the aforementioned materiality, we have audited the allowances for credit losses as recorded in the financial statements and the related disclosures required under IFRS 9 Financial Instruments included in Note 7.2, 8.4 and 11.5. Based on our procedures performed, we did not identify any reportable matters.
Impairment testing of intangible assets and property, plant and equipment – Refer to Notes 8.1, 8.2 and 8.3 to the financial statementsRisk Intangible assets (including goodwill) and property, plant and equipment amounted to
EUR 27,318 million at December 31, 2020 and represented 64 per cent of the consolidated total assets. For purposes of impairment testing, goodwill is allocated and monitored on a (groups of) Cash Generating Unit (‘CGU’) basis. Other intangibles and property, plant and equipment, are grouped to the smallest Cash Generating Units (‘CGUs’). For goodwill, management is required to assess the recoverable amount of the respective CGUs (of groups of CGUs). Recoverable amounts of other non-current assets are assessed upon the existence of a triggering event. Following the impact of COVID-19 on HEINEKEN’s markets and businesses, HEINEKEN has assessed all CGUs for an indication of an impairment, prepared multiple recovery scenarios for the impairment trigger tests (e.g. if and when the CGUs can return to pre-COVID-19 sales volumes) and performed impairment tests based on the single most likely scenario, accordingly.
The estimated sales volumes, revenues and discount rates used in management’s trigger and impairment tests involved a higher degree of uncertainty due to the current market circumstances. Further details on the accounting and disclosure requirements under IAS 36 Impairment of Assets are included in notes 8.1, 8.2 and 8.3 to the financial statements. These notes also explain the total impairment recorded in 2020, for a total amount of EUR 963 million due to the impact of COVID-19 in some developing economies and in the on-trade business (like cafés, bars and restaurants) in some developed economies.
Given the significant judgement made by management to estimate recoverable amounts in the current economic climate, procedures to evaluate the reasonableness of estimated sales volumes, revenues and discount rates used in management’s trigger and impairment tests of intangible assets and property, plant and equipment required a high degree of auditor judgement, including the need to involve our fair value specialists.
Independent Auditor’s Report
164 Heineken N.V. Annual Report 2020
Impairment testing of intangible assets and property, plant and equipment – Refer to Notes 8.1, 8.2 and 8.3 to the financial statementsHow the scope of our audit responded to the risk
Our audit procedures related to the projected cash flows and discount rates used by management included the following, among others:
– We obtained an understanding of management’s process over the impairment trigger tests and the impairment tests.
– We evaluated management’s ability to accurately forecast by comparing actual results to management’s historical forecasts.
– We evaluated sensitivities in management’s projections that could cause a substantial change to the impairments recorded, and or cause headroom to change in an impairment.
– We evaluated projected cash flows and reviewed management’s scenario-analyses by:
– Comparing the projections (and scenarios) to historical forecasts and information included in HEINEKEN’s internal communications to the management and the Executive Board.
– Challenging and comparing the estimated sales volumes and revenues to, for example, external economic outlook data, external market data on the beer market and expected inflation rates.
– With the assistance of our fair value specialists, we evaluated the reasonableness of discount rates, including testing the source information underlying the determination of the discount rates, testing the mathematical accuracy of the calculation, and developing a range of independent estimates and comparing those to the discount rates selected by management.
Observation Applying the aforementioned materiality, we did not identify any reportable matters in management’s assessment of the recoverability of intangible assets and property, plant and equipment, the impairments recorded and the disclosures in Note 8.1 and 8.2 (including further disclosures on key uncertainties and scenarios assumed in management impairment testing).
Management judgement related to the provisions for uncertain tax positions and recoverability of deferred tax assets – Refer to Notes 9.3 and 12 to the financial statementsRisk HEINEKEN operates across several tax jurisdictions and is subject to periodic challenges
by local tax authorities during the normal course of business. In those cases where the amount of tax payable or recoverable is uncertain, management establishes provisions based on its judgement of the probable amount of the tax liability. Deferred tax assets are only recognised to the extent that it is probable that future taxable income will be available, against which unused tax losses can be utilised. This assessment is performed annually and based on budgets and business plans for the coming years, including planned commercial initiatives and the impact of COVID-19.
The accounting for uncertain tax positions and deferred tax assets, as detailed in notes 9.3 and 12 to the financial statements, inherently requires management to apply judgement in quantifying appropriate provisions (including assessing probable outcomes) for uncertain tax positions, and in determining the recoverability of deferred tax assets. Given the significant judgement applied by management, performing procedures to evaluate the reasonableness of probable outcomes for uncertain tax positions and the recoverability of deferred tax assets based on budgets and business plans, required a higher degree of auditor judgement and a need to involve our own in-country tax specialists.
How the scope of our audit responded to the risk
Our audit procedures to address management’s judgement’s related to the provisions for uncertain tax positions and recoverability of deferred tax assets included the following, amongst others:
– We obtained an understanding of management’s tax process related to the valuation uncertain tax positions and the recoverability of deferred tax assets.
– We involved our own in-country tax specialists to assess tax risks, tax carry forward facilities, legislative developments and the status of ongoing local tax authority audits.
– We challenged management’s judgement applied in quantifying provisions for tax uncertainties and assessing probable outcomes based on correspondence with tax authorities, case law and opinions from management’s tax expert.
– We evaluated management’s ability to forecast taxable income by comparing prior forecasts on future taxable income with the actual income for the year.
– We evaluated management’s recoverability assessment including the likelihood of generating sufficient future taxable income based on budgets, business plans and tax losses carry forward facilities in the various tax jurisdictions (including expiry dates).
Observation Applying the aforementioned materiality, we have audited the provisions for uncertain tax positions and the valuation of deferred tax assets as well as the related disclosure in Notes 3, 12 and 9.3 and have no reportable findings.
Independent Auditor’s Report
165 Heineken N.V. Annual Report 2020
Internal controls over financial reporting
Risk HEINEKEN has implemented a control framework and operates various systems, processes and procedures that are important for reliable financial reporting. These systems and processes are operated both centrally as well as locally.
We identified the Company’s internal controls over financial reporting as an area of focus as we consider internal controls over financial reporting as a basis for designing our procedures for the audit. In those instances where accounting procedures, associated IT and process level controls are not designed and/or effectively implemented, there are risks associated with financial reporting to which we need to tailor our substantive audit procedures.
How the scope of our audit responded to the risk
Our procedures in the context of our audit engagement included the following, among others:
– We performed audit procedures on both the centrally and locally established process levelcontrols of the Company, including those relating to the various IT platforms.
– We performed walkthroughs to gain an understanding of the entity and to identify relevant controls.
– We tested the design of those controls and, where effective for the audit, we also testedtheir operating effectiveness.
– In cases of deficiencies, we evaluated compensating controls and measures of the Company and tailored our procedures performed incremental substantive to addressthe risk.
– We evaluated the information on internal controls in the Risk Management and CorporateGovernance section of the Report of the Executive Board.
We note however that we are not required nor engaged to perform an audit of internal controls over financial reporting. Accordingly, we do not express an opinion on the effectiveness of HEINEKEN’s internal controls over financial reporting.
Observation We communicated our observations on internal controls over financial reporting to the Company’s Audit Committee. In our audit, and where deemed necessary, we have mitigated the effect of internal control observations through testing alternative controls or by extending our substantive audit procedures. Overall, we have obtained sufficient and appropriate evidence in response to the financial reporting risks.
Report on the other information included in the Annual Report 2020 In addition to the financial statements and our auditor’s report thereon, the Annual report 2020 contains other information that consists of:
– Report of the Executive Board; – Report of the Supervisory Board; – Other Information pursuant to Part 9 of Book 2 of the Dutch Civil Code; and – Other information included in the Annual Report.
Based on the following procedures performed, we conclude that the other information:
– is consistent with the financial statements and does not contain material misstatements; and – Contains the information as required by Part 9 of Book 2 of the Dutch Civil Code.
We have read the other information. Based on our knowledge and understanding obtained through our audit of the financial statements or otherwise, we have considered whether the other information contains material misstatements.
By performing these procedures, we comply with the requirements of Part 9 of Book 2 of the Dutch Civil Code and the Dutch Standard 720. The scope of the procedures performed is substantially less than the scope of those performed in our audit of the financial statements.
The Executive Board is responsible for the preparation of the other information, including the Report of the Executive Board in accordance with Part 9 of Book 2 of the Dutch Civil Code and other information pursuant to Part 9 of Book 2 of the Dutch Civil Code.
Report on other legal and regulatory requirementsEngagementWe were engaged by the supervisory board as auditor of Heineken N.V. on April 24, 2014 as of and for the year ending 31 December 2015 and have operated as statutory auditor ever since that financial year.
No prohibited non-audit servicesWe have not provided prohibited non-audit services as referred to in Article 5(1) of the EU Regulation on specific requirements regarding statutory audit of public-interest entities.
Independent Auditor’s Report
166 Heineken N.V. Annual Report 2020
Description of responsibilities regarding the financial statementsResponsibilities of the Executive Board and the Supervisory Board for the financial statementsThe Executive Board is responsible for the preparation and fair presentation of the financial statements in accordance with EU-IFRS and Part 9 of Book 2 of the Dutch Civil Code. Furthermore, the Executive Board is responsible for such internal control as the Executive Board determines is necessary to enable the preparation of the financial statements that are free from material misstatement, whether due to fraud or error.
As part of the preparation of the financial statements, the Executive Board is responsible for assessing the Company’s ability to continue as a going concern. Based on the financial reporting frameworks mentioned, the Executive Board should prepare the financial statements using the going concern basis of accounting unless the Executive Board either intends to liquidate the Company or to cease operations, or has no realistic alternative but to do so.
The Executive Board should disclose events and circumstances that may cast significant doubt on the Company’s ability to continue as a going concern in the financial statements.
The Supervisory Board is responsible for overseeing the Company’s financial reporting process.
Our responsibilities for the audit of the financial statementsOur objective is to plan and perform the audit assignment in a manner that allows us to obtain sufficient and appropriate audit evidence for our opinion.
Our audit has been performed with a high, but not absolute, level of assurance, which means we may not detect all material errors and fraud during our audit.
Misstatements can arise from fraud or error and are considered material if, individually or in the aggregate, they could reasonably be expected to influence the economic decisions of users taken on the basis of these financial statements. The materiality affects the nature, timing and extent of our audit procedures and the evaluation of the effect of identified misstatements on our opinion.
We have exercised professional judgement and have maintained professional scepticism throughout the audit, in accordance with Dutch Standards on Auditing, ethical requirements and independence requirements. Our audit included e.g.:
– Identifying and assessing the risks of material misstatement of the financial statements, whether due to fraud or error, designing and performing audit procedures responsive to those risks, and obtaining auditevidence that is sufficient and appropriate to provide a basis for our opinion. The risk of not detecting a material misstatement resulting from fraud is higher than for one resulting from error, as fraud may involve collusion, forgery, intentional omissions, misrepresentations, or the override of internal control.
– Obtaining an understanding of internal control relevant to the audit in order to design audit proceduresthat are appropriate in the circumstances, but not for the purpose of expressing an opinion on the effectiveness of the Company’s internal control.
– Evaluating the appropriateness of accounting policies used and the reasonableness of accountingestimates and related disclosures made by management.
– Concluding on the appropriateness of management’s use of the going concern basis of accounting, and based on the audit evidence obtained, whether a material uncertainty exists related to events or conditionsthat may cast significant doubt on the Company’s ability to continue as a going concern. If we conclude that a material uncertainty exists, we are required to draw attention in our auditor’s report to the related disclosures in the financial statements or, if such disclosures are inadequate, to modify our opinion. Our conclusions are based on the audit evidence obtained up to the date of our auditor’s report. However, future events or conditions may cause the Company to cease to continue as a going concern.
– Evaluating the overall presentation, structure and content of the financial statements, includingthe disclosures.
– Evaluating whether the financial statements represent the underlying transactions and events in a mannerthat achieves fair presentation.
We communicate with the Supervisory Board regarding, among other matters, the planned scope and timing of the audit and significant audit findings, including any significant findings in internal control that we identified during our audit. In this respect we also submit an additional report to the audit committee in accordance with Article 11 of the EU Regulation on specific requirements regarding statutory audit of public-interest entities. The information included in this additional report is consistent with our audit opinion in this auditor’s report.
We provide the supervisory board with a statement that we have complied with relevant ethical requirements regarding independence, and to communicate with them all relationships and other matters that may reasonably be thought to bear on our independence, and where applicable, related safeguards.
Amsterdam, 9 February 2021
Deloitte Accountants B.V. Initials for identification purposes:
L. Albers
Independent Auditor’s Report
167 Heineken N.V. Annual Report 2020
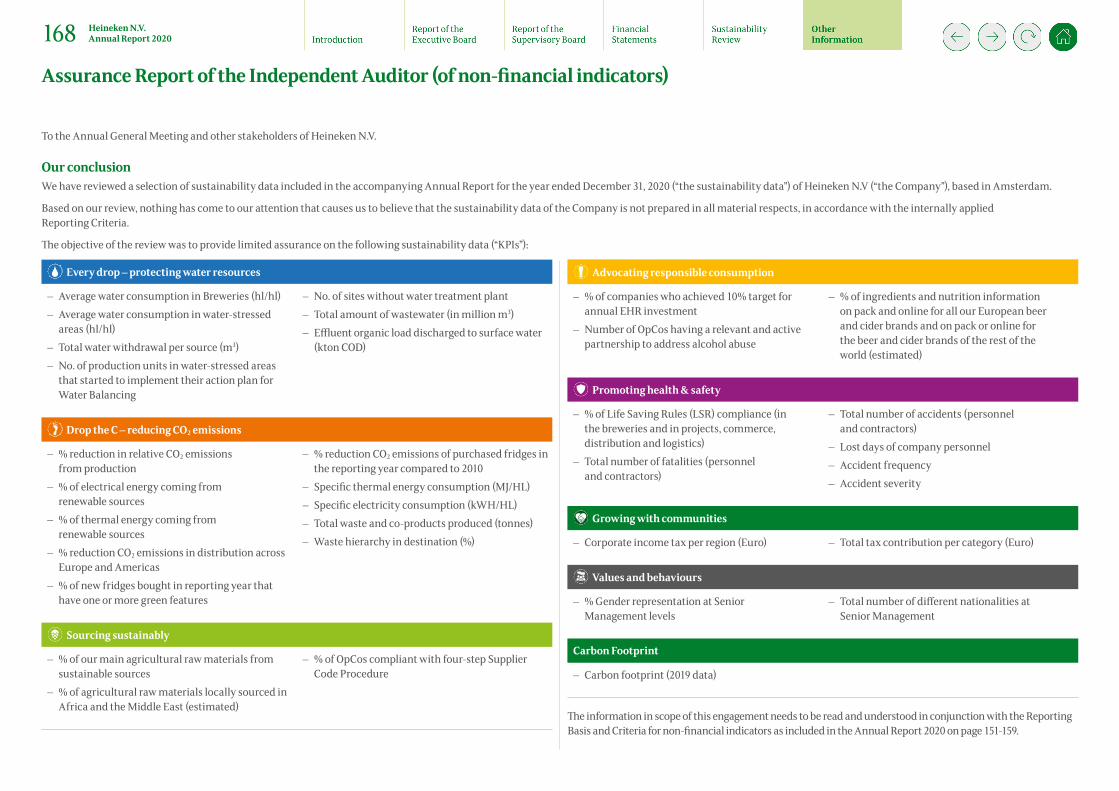
To the Annual General Meeting and other stakeholders of Heineken N.V.
Our conclusionWe have reviewed a selection of sustainability data included in the accompanying Annual Report for the year ended December 31, 2020 (“the sustainability data”) of Heineken N.V (“the Company”), based in Amsterdam.
Based on our review, nothing has come to our attention that causes us to believe that the sustainability data of the Company is not prepared in all material respects, in accordance with the internally applied Reporting Criteria.
The objective of the review was to provide limited assurance on the following sustainability data (“KPIs”):
Every drop – protecting water resources
– Average water consumption in Breweries (hl/hl) – Average water consumption in water-stressed
areas (hl/hl) – Total water withdrawal per source (m3) – No. of production units in water-stressed areas
that started to implement their action plan for Water Balancing
– No. of sites without water treatment plant – Total amount of wastewater (in million m3) – Effluent organic load discharged to surface water
(kton COD)
Drop the C – reducing CO2 emissions
– % reduction in relative CO2 emissions from production
– % of electrical energy coming from renewable sources
– % of thermal energy coming from renewable sources
– % reduction CO2 emissions in distribution across Europe and Americas
– % of new fridges bought in reporting year that have one or more green features
– % reduction CO2 emissions of purchased fridges in the reporting year compared to 2010
– Specific thermal energy consumption (MJ/HL) – Specific electricity consumption (kWH/HL) – Total waste and co-products produced (tonnes) – Waste hierarchy in destination (%)
Sourcing sustainably
– % of our main agricultural raw materials from sustainable sources
– % of agricultural raw materials locally sourced in Africa and the Middle East (estimated)
– % of OpCos compliant with four-step Supplier Code Procedure
Advocating responsible consumption
– % of companies who achieved 10% target for annual EHR investment
– Number of OpCos having a relevant and active partnership to address alcohol abuse
– % of ingredients and nutrition information on pack and online for all our European beer and cider brands and on pack or online for the beer and cider brands of the rest of the world (estimated)
Promoting health & safety
– % of Life Saving Rules (LSR) compliance (in the breweries and in projects, commerce, distribution and logistics)
– Total number of fatalities (personnel and contractors)
– Total number of accidents (personnel and contractors)
– Lost days of company personnel – Accident frequency – Accident severity
Growing with communities
– Corporate income tax per region (Euro) – Total tax contribution per category (Euro)
Values and behaviours
– % Gender representation at Senior Management levels
– Total number of different nationalities at Senior Management
Carbon Footprint
– Carbon footprint (2019 data)
The information in scope of this engagement needs to be read and understood in conjunction with the Reporting Basis and Criteria for non-financial indicators as included in the Annual Report 2020 on page 151-159.
Assurance Report of the Independent Auditor (of non-financial indicators)
168 Heineken N.V. Annual Report 2020

Basis for our conclusionWe have performed our assurance engagement on the sustainability data in accordance with Dutch law, including Dutch Standard 3000A ‘Assurance engagements other than audits or reviews of historical financial information’. This assurance engagement is aimed at obtaining limited assurance. Our responsibilities in this regard are further described in the ‘Our responsibilities for the assurance engagement of the sustainability data’ section of our report.
We are independent of the Company in accordance with the ‘Verordening inzake de onafhankelijkheid van accountants bij assurance-opdrachten’ (ViO, Code of Ethics for Professional Accountants, a regulation with respect to independence). Furthermore we have complied with the ‘Verordening gedrags- en beroepsregels accountants’ (VGBA, Dutch Code of Ethics).
We believe that the evidence we have obtained is sufficient and appropriate to provide a basis for our conclusion.
Responsibilities of the Executive Board and the Supervisory BoardThe Executive Board of the Company is responsible for the preparation of the sustainability data in accordance with the internally applied Reporting Criteria, including the identification of the intended users and the criteria being applicable for the purposes of the intended users.
The Executive Board is also responsible for such internal control as it determines is necessary to enable the preparation, measurement or evaluation of the sustainability data that is free from material misstatement, whether due to fraud or errors.
The Supervisory Board is responsible for overseeing the Company’s reporting process.
Our responsibilities for the assurance engagement of the sustainability dataOur responsibility is to plan and perform the assurance assignment in a manner that allows us to obtain sufficient and appropriate evidence for our conclusion.
The procedures performed in this context differ in nature and timing and are less extent as compared to reasonable assurance engagements. The level of assurance obtained in a limited assurance engagement is therefore substantially lower than the assurance that would have been obtained had a reasonable assurance engagement been performed.
We apply the ‘Nadere voorschriften kwaliteitssystemen’ (NVKS, Regulations for quality management systems) and accordingly maintain a comprehensive system of quality control including documented policies and procedures regarding compliance with ethical requirements, professional standards and applicable legal and regulatory requirements.
Misstatements can arise from fraud or errors and are considered material if, individually or in the aggregate, they could reasonably be expected to influence the decisions of users taken on the basis of the sustainability data. The materiality affects the nature, timing and extent of our procedures and the evaluation of the effect of identified misstatements on our conclusion.
Our assurance engagement included amongst others:
– Gaining knowledge and obtaining an understanding of the sustainability data and other circumstancesregarding the engagement including gaining knowledge regarding internal controls.
– An analytical review of the data and trends submitted. – Assessing the suitability of the Reporting Criteria.
Amsterdam, February 9, 2021
Deloitte Accountants B.V.L. Albers
Assurance Report of the Independent Auditor
169 Heineken N.V. Annual Report 2020
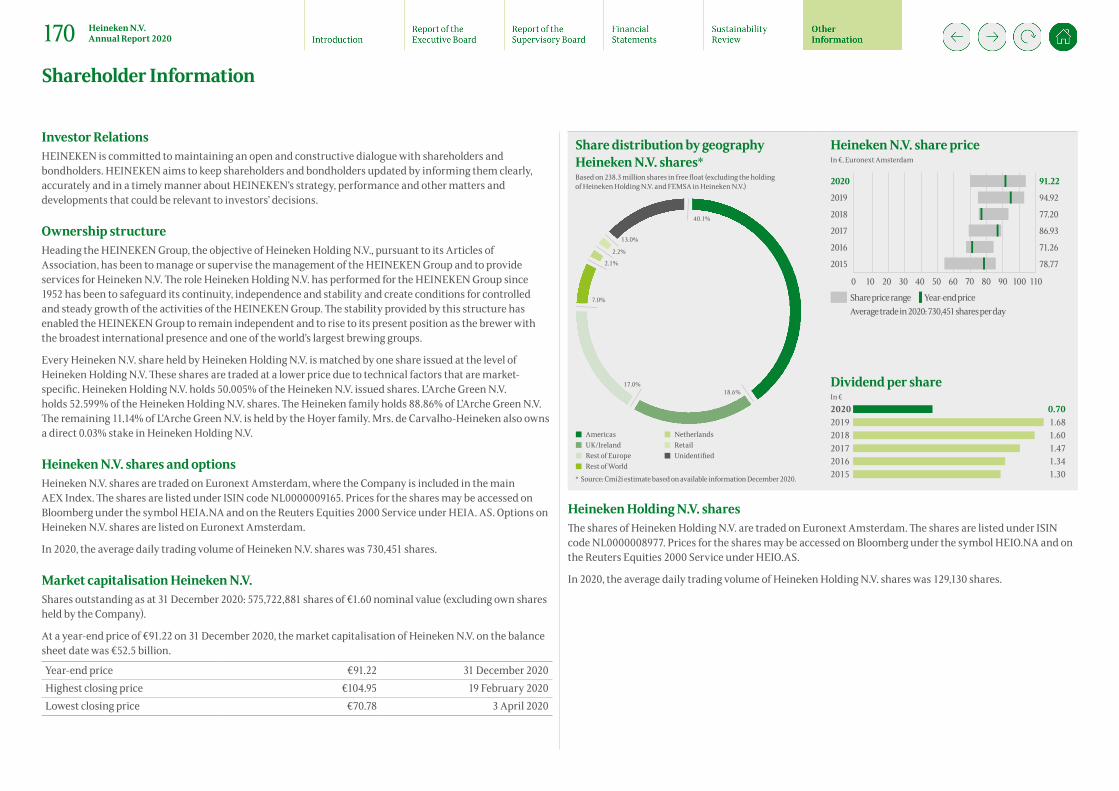
Investor RelationsHEINEKEN is committed to maintaining an open and constructive dialogue with shareholders and bondholders. HEINEKEN aims to keep shareholders and bondholders updated by informing them clearly, accurately and in a timely manner about HEINEKEN’s strategy, performance and other matters and developments that could be relevant to investors’ decisions.
Ownership structureHeading the HEINEKEN Group, the objective of Heineken Holding N.V., pursuant to its Articles of Association, has been to manage or supervise the management of the HEINEKEN Group and to provide services for Heineken N.V. The role Heineken Holding N.V. has performed for the HEINEKEN Group since 1952 has been to safeguard its continuity, independence and stability and create conditions for controlled and steady growth of the activities of the HEINEKEN Group. The stability provided by this structure has enabled the HEINEKEN Group to remain independent and to rise to its present position as the brewer with the broadest international presence and one of the world’s largest brewing groups.
Every Heineken N.V. share held by Heineken Holding N.V. is matched by one share issued at the level of Heineken Holding N.V. These shares are traded at a lower price due to technical factors that are market-specific. Heineken Holding N.V. holds 50.005% of the Heineken N.V. issued shares. L’Arche Green N.V. holds 52.599% of the Heineken Holding N.V. shares. The Heineken family holds 88.86% of L’Arche Green N.V. The remaining 11.14% of L’Arche Green N.V. is held by the Hoyer family. Mrs. de Carvalho-Heineken also owns a direct 0.03% stake in Heineken Holding N.V.
Heineken N.V. shares and optionsHeineken N.V. shares are traded on Euronext Amsterdam, where the Company is included in the main AEX Index. The shares are listed under ISIN code NL0000009165. Prices for the shares may be accessed on Bloomberg under the symbol HEIA.NA and on the Reuters Equities 2000 Service under HEIA. AS. Options on Heineken N.V. shares are listed on Euronext Amsterdam.
In 2020, the average daily trading volume of Heineken N.V. shares was 730,451 shares.
Market capitalisation Heineken N.V.Shares outstanding as at 31 December 2020: 575,722,881 shares of €1.60 nominal value (excluding own shares held by the Company).
At a year-end price of €91.22 on 31 December 2020, the market capitalisation of Heineken N.V. on the balance sheet date was €52.5 billion.
Year-end price €91.22 31 December 2020Highest closing price €104.95 19 February 2020Lowest closing price €70.78 3 April 2020
Share distribution by geography Heineken N.V. shares*Based on 238.3 million shares in free float (excluding the holding of Heineken Holding N.V. and FEMSA in Heineken N.V.)
Heineken N.V. share priceIn €, Euronext Amsterdam
2015
2016
Share price range
2017
0 10 20 30 40 50 60 70 80 100 11090
2018
2019
2020
78.77
71.26
86.93
77.20
94.92
91.22
Year-end priceAverage trade in 2020: 730,451 shares per day
40.1%
18.6%
2.1%
13.0%
2.2%
17.0%
7.0%
AmericasUK/IrelandRest of Europe Rest of World
NetherlandsRetailUnidentified
* Source: Cmi2i estimate based on available information December 2020.
Dividend per shareIn €
2019 1.6820182017 1.47
1.60
1.341.30
0.702020
20162015
Heineken Holding N.V. sharesThe shares of Heineken Holding N.V. are traded on Euronext Amsterdam. The shares are listed under ISIN code NL0000008977. Prices for the shares may be accessed on Bloomberg under the symbol HEIO.NA and on the Reuters Equities 2000 Service under HEIO.AS.
In 2020, the average daily trading volume of Heineken Holding N.V. shares was 129,130 shares.
Shareholder Information
170 Heineken N.V. Annual Report 2020

Market capitalisation Heineken Holding N.V.Shares outstanding as at 31 December 2020: 288,030,168 shares of €1.60 nominal value.
At a year-end price of €77.05 on 31 December 2020, the market capitalisation of Heineken Holding N.V. on balance sheet date was €22.2 billion.
Year-end price €77.05 31 December 2020Highest closing price €94.30 17 January 2020Lowest closing price €64.10 12 March 2020
Share distribution by geography Heineken Holding N.V. shares*Based on 101.2 million shares in free float (excluding the holding of L’Arche Green N.V. and FEMSA in Heineken Holding N.V.)
Heineken Holding N.V.In €, Euronext Amsterdam
2015
2016
Share price range
2017
0 10 20 30 40 50 60 70 80 10090
2018
2019
2020
71.00
66.14
82.49
73.75
86.40
77.05
Year-end priceAverage trade in 2020: 129,130 shares per day
36.2%
29.5%
0.8%
16.5%
4.5%
9.4%
3.1%
AmericasUK/IrelandRest of Europe Rest of World
NetherlandsRetailUnidentified
* Source: Cmi2i estimate based on available information December 2020.
Dividend per shareIn €
2019 1.6820182017 1.47
1.60
1.341.30
0.702020
20162015
American Depositary Receipts (ADRs)HEINEKEN’s shares are trading Over-the-Counter (OTC) in the US as American Depositary Receipts (ADRs). There are two separate HEINEKEN ADR programmes representing ownership respectively in: 1) Heineken N.V. and 2) Heineken Holding N.V. For both programmes, the ratio between HEINEKEN ADRs and the ordinary Dutch (€ denominated) shares is 2:1, i.e. two ADRs represent one HEINEKEN ordinary share. Deutsche Bank Trust Company Americas acts as depositary bank for HEINEKEN’s ADR programmes.
Heineken N.V. Heineken Holding N.V.Ticker: HEINY Ticker: HKHHYISIN: US4230123014 ISIN: US4230081014CUSIP: 423012301 CUSIP: 423008101Structure: Sponsored Level I ADR Structure: Sponsored Level I ADRExchange: OTCQX Exchange: OTCQXRatio (DR:ORD): 2:1 Ratio (DR:ORD): 2:1
ADR contact informationDeutsche Bank Shareholder Services c/o AST 6201 15th Avenue Brooklyn, NY 11219, USA E-mail: [email protected]
Shareholder Service (toll-free) Tel. +1 866 249 2593
Shareholder Service (international) Tel. +1 718 921 8137
www.astfinancial.com
Shareholder Information
171 Heineken N.V. Annual Report 2020
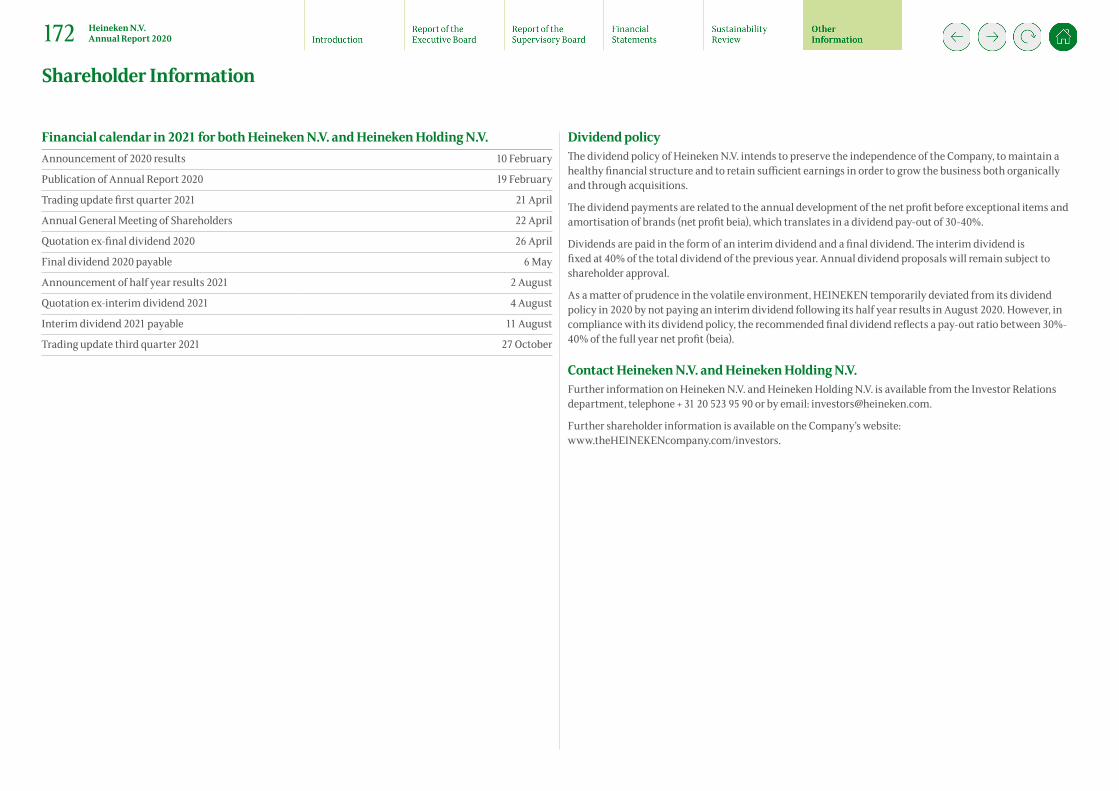
Financial calendar in 2021 for both Heineken N.V. and Heineken Holding N.V.Announcement of 2020 results 10 February
Publication of Annual Report 2020 19 February
Trading update first quarter 2021 21 April
Annual General Meeting of Shareholders 22 April
Quotation ex-final dividend 2020 26 April
Final dividend 2020 payable 6 May
Announcement of half year results 2021 2 August
Quotation ex-interim dividend 2021 4 August
Interim dividend 2021 payable 11 August
Trading update third quarter 2021 27 October
Dividend policyThe dividend policy of Heineken N.V. intends to preserve the independence of the Company, to maintain a healthy financial structure and to retain sufficient earnings in order to grow the business both organically and through acquisitions.
The dividend payments are related to the annual development of the net profit before exceptional items and amortisation of brands (net profit beia), which translates in a dividend pay-out of 30-40%.
Dividends are paid in the form of an interim dividend and a final dividend. The interim dividend is fixed at 40% of the total dividend of the previous year. Annual dividend proposals will remain subject to shareholder approval.
As a matter of prudence in the volatile environment, HEINEKEN temporarily deviated from its dividend policy in 2020 by not paying an interim dividend following its half year results in August 2020. However, in compliance with its dividend policy, the recommended final dividend reflects a pay-out ratio between 30%-40% of the full year net profit (beia).
Contact Heineken N.V. and Heineken Holding N.V.Further information on Heineken N.V. and Heineken Holding N.V. is available from the Investor Relations department, telephone + 31 20 523 95 90 or by email: [email protected].
Further shareholder information is available on the Company’s website: www.theHEINEKENcompany.com/investors.
Shareholder Information
172 Heineken N.V. Annual Report 2020

In September 2008, HEINEKEN established a Euro Medium Term Note (EMTN) Programme which was last updated in March 2020. The programme allows Heineken N.V. to issue Notes for a total amount of up to €20 billion. Approximately €11.2 billion is outstanding under the programme as at 31 December 2020.
In 2020 the following notes were issued under HEINEKEN’s Euro Medium Term Note Programme:
– In March 2020, CHF100 million of privately placed 5-year Notes with a coupon of 0.6375% – In March 2020, €600 million of 5-year Notes with a coupon of 1.625% – In March 2020, €800 million of 10-year Notes with a coupon of 2.25% – In May 2020, €650 million of 13-year Notes with a coupon of 1.25% – In May 2020, €850 million of 20-year Notes with a coupon of 1.75%
Traded Heineken N.V. Notes Issue date Total face value
Interest rate Maturity ISIN code
EUR EMTN 2021 4 April 2013 EUR 500 million 2.000% 6 April 2021 XS0911691003EUR EMTN 2021 10 September 2015 EUR 500 million 1.250% 10 September 2021 XS1288852939144A/RegS 2022 3 April 2012 USD 750 million 3.400% 1 April 2022 US423012AA16144A/RegS 2023 10 October 2012 USD 1,000 million 2.750% 1 April 2023 US423012AD54EUR EMTN 2023 23 October 2015 EUR 140 million 1.700% 23 October 2023 XS1310154536EUR EMTN 2024 19 March 2012 EUR 500 million 3.500% 19 March 2024 XS0758420748EUR EMTN 2024 7 December 2015 EUR 460 million 1.500% 7 December 2024 XS1330434389EUR EMTN 2025 25 March 2020 CHF 100 million 0.638% 25 March 2025 XS2145099201EUR EMTN 2025 30 March 2020 EUR 600 million 1.625% 30 March 2025 XS2147977479EUR EMTN 2025 2 August 2012 EUR 750 million 2.875% 4 August 2025 XS0811555183EUR EMTN 2025 20 October 2015 EUR 225 million 2.000% 20 October 2025 XS1309072020EUR EMTN 2026 4 May 2016 EUR 1,000 million1 1.000% 4 May 2026 XS1401174633EUR EMTN 2027 29 November 2016 EUR 500 million 1.375% 29 January 2027 XS1527192485EUR EMTN 2027 17 September 2018 EUR 600 million 1.250% 17 March 2027 XS1877595444
Traded Heineken N.V. Notes Issue date Total face value
Interest rate Maturity ISIN code
144A/RegS 2028 29 March 2017 USD 1,100 million 3.500% 29 January 2028 US423012AF03EUR EMTN 2029 30 January 2014 EUR 200 million 3.500% 30 July 2029 XS1024136282EUR EMTN 2029 3 October 2017 EUR 800 million 1.500% 3 October 2029 XS1691781865EUR EMTN 2030 30 March 2020 EUR 800 million 2.250% 30 March 2030 XS2147977636EUR EMTN 2031 17 September 2018 EUR 750 million2 1.750% 17 March 2031 XS1877595014EUR EMTN 2032 12 May 2017 EUR 500 million 2.020% 12 May 2032 XS1611855237EUR EMTN 2033 15 April 2013 EUR 180 million 3.250% 15 April 2033 XS0916345621EUR EMTN 2033 7 May 2020 EUR 650 million 1.250% 7 May 2033 XS2168629967EUR EMTN 2033 19 April 2013 EUR 100 million 2.562% 19 April 2033 XS0920838371EUR EMTN 2040 7 May 2020 EUR 850 million 1.750% 7 May 2040 XS2168630205144A/RegS 2042 10 October 2012 USD 500 million 4.000% 1 October 2042 US423012AE38144A/RegS 2047 29 March 2017 USD 650 million 4.350% 29 March 2047 US423012AG85
1 Includes EUR 200 million tap issued on 15 July 2019.2 Includes EUR 100 million tap issued on 5 June 2019.
The EMTN programme and the above Heineken N.V. Notes issued thereunder are listed on the Luxembourg Stock Exchange.
Traded Heineken Asia MTN Pte. Ltd. Notes
Issue date Total face value Interest rate
Maturity ISIN code
SGD MTN 2022 7 January 2010 SGD 16.25 million 4.000% 7 January 2022 SG7U93952517
The above Heineken Asia MTN Pte. Ltd. Notes are listed on the Singapore Exchange.
HEINEKEN has a €2.0 billion Euro Commercial Paper (ECP) programme to facilitate its cash management operations and to diversify its funding sources. There was €700 million ECP in issue per 31 December 2020.
Bondholder Information
173 Heineken N.V. Annual Report 2020
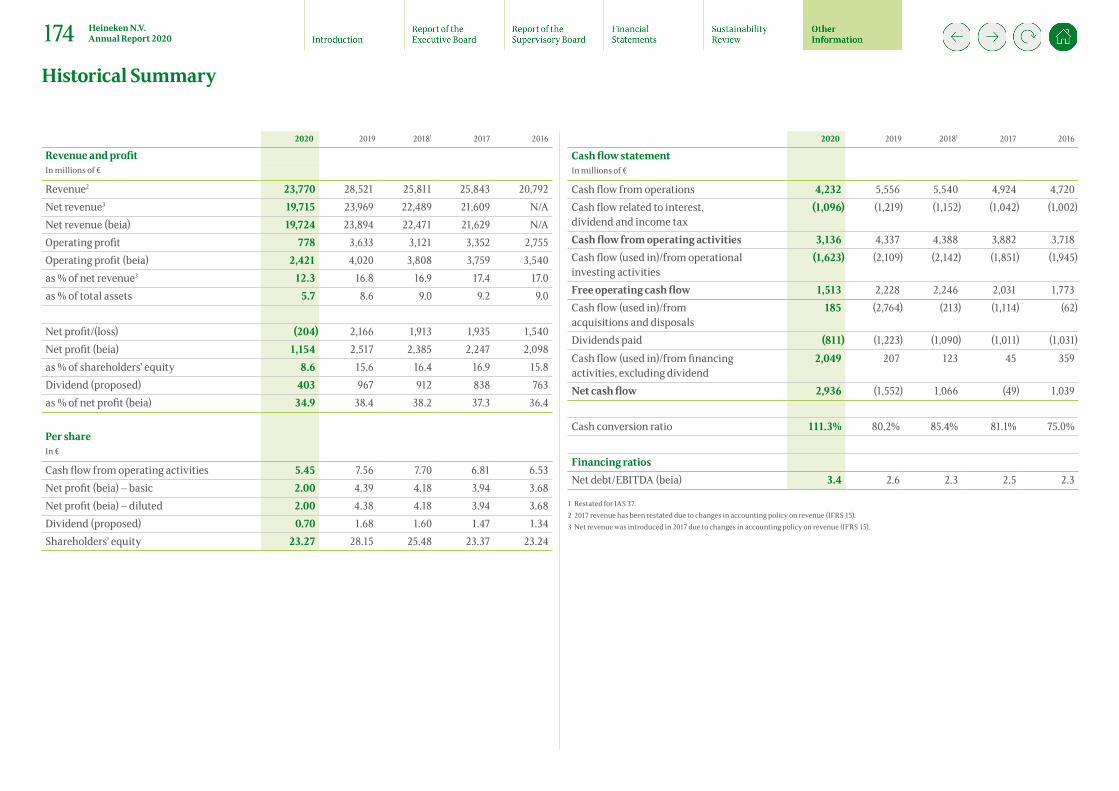
2020 2019 20181 2017 2016
Revenue and profitIn millions of €
Revenue2 23,770 28,521 25,811 25,843 20,792Net revenue3 19,715 23,969 22,489 21,609 N/ANet revenue (beia) 19,724 23,894 22,471 21,629 N/AOperating profit 778 3,633 3,121 3,352 2,755Operating profit (beia) 2,421 4,020 3,808 3,759 3,540as % of net revenue3 12.3 16.8 16.9 17.4 17.0as % of total assets 5.7 8.6 9.0 9.2 9.0
Net profit/(loss) (204) 2,166 1,913 1,935 1,540Net profit (beia) 1,154 2,517 2,385 2,247 2,098as % of shareholders’ equity 8.6 15.6 16.4 16.9 15.8Dividend (proposed) 403 967 912 838 763as % of net profit (beia) 34.9 38.4 38.2 37.3 36.4
Per shareIn €
Cash flow from operating activities 5.45 7.56 7.70 6.81 6.53Net profit (beia) – basic 2.00 4.39 4.18 3.94 3.68Net profit (beia) – diluted 2.00 4.38 4.18 3.94 3.68Dividend (proposed) 0.70 1.68 1.60 1.47 1.34Shareholders’ equity 23.27 28.15 25.48 23.37 23.24
2020 2019 20181 2017 2016
Cash flow statementIn millions of €
Cash flow from operations 4,232 5,556 5,540 4,924 4,720Cash flow related to interest, dividend and income tax
(1,096) (1,219) (1,152) (1,042) (1,002)
Cash flow from operating activities 3,136 4,337 4,388 3,882 3,718Cash flow (used in)/from operational investing activities
(1,623) (2,109) (2,142) (1,851) (1,945)
Free operating cash flow 1,513 2,228 2,246 2,031 1,773Cash flow (used in)/from acquisitions and disposals
185 (2,764) (213) (1,114) (62)
Dividends paid (811) (1,223) (1,090) (1,011) (1,031)Cash flow (used in)/from financing activities, excluding dividend
2,049 207 123 45 359
Net cash flow 2,936 (1,552) 1,066 (49) 1,039
Cash conversion ratio 111.3% 80.2% 85.4% 81.1% 75.0%
Financing ratiosNet debt/EBITDA (beia) 3.4 2.6 2.3 2.5 2.3
1 Restated for IAS 37.2 2017 revenue has been restated due to changes in accounting policy on revenue (IFRS 15). 3 Net revenue was introduced in 2017 due to changes in accounting policy on revenue (IFRS 15).
Historical Summary
174 Heineken N.V. Annual Report 2020
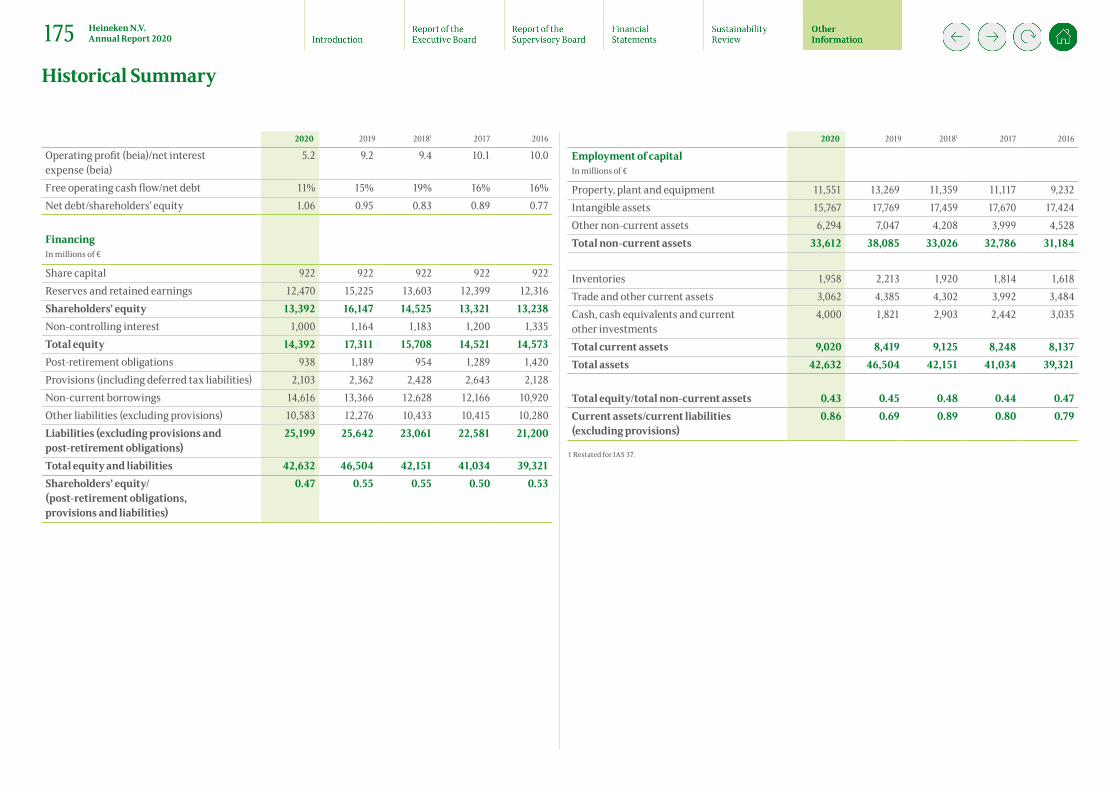
2020 2019 20181 2017 2016
Operating profit (beia)/net interest expense (beia)
5.2 9.2 9.4 10.1 10.0
Free operating cash flow/net debt 11% 15% 19% 16% 16%Net debt/shareholders’ equity 1.06 0.95 0.83 0.89 0.77
FinancingIn millions of €
Share capital 922 922 922 922 922Reserves and retained earnings 12,470 15,225 13,603 12,399 12,316Shareholders’ equity 13,392 16,147 14,525 13,321 13,238Non-controlling interest 1,000 1,164 1,183 1,200 1,335Total equity 14,392 17,311 15,708 14,521 14,573Post-retirement obligations 938 1,189 954 1,289 1,420Provisions (including deferred tax liabilities) 2,103 2,362 2,428 2,643 2,128Non-current borrowings 14,616 13,366 12,628 12,166 10,920Other liabilities (excluding provisions) 10,583 12,276 10,433 10,415 10,280Liabilities (excluding provisions and post-retirement obligations)
25,199 25,642 23,061 22,581 21,200
Total equity and liabilities 42,632 46,504 42,151 41,034 39,321Shareholders’ equity/(post-retirement obligations, provisions and liabilities)
0.47 0.55 0.55 0.50 0.53
2020 2019 20181 2017 2016
Employment of capitalIn millions of €
Property, plant and equipment 11,551 13,269 11,359 11,117 9,232Intangible assets 15,767 17,769 17,459 17,670 17,424Other non-current assets 6,294 7,047 4,208 3,999 4,528Total non-current assets 33,612 38,085 33,026 32,786 31,184
Inventories 1,958 2,213 1,920 1,814 1,618Trade and other current assets 3,062 4,385 4,302 3,992 3,484Cash, cash equivalents and current other investments
4,000 1,821 2,903 2,442 3,035
Total current assets 9,020 8,419 9,125 8,248 8,137Total assets 42,632 46,504 42,151 41,034 39,321
Total equity/total non-current assets 0.43 0.45 0.48 0.44 0.47Current assets/current liabilities (excluding provisions)
0.86 0.69 0.89 0.80 0.79
1 Restated for IAS 37.
Historical Summary
175 Heineken N.V. Annual Report 2020
Acquisition-related intangible assets Acquisition-related intangible assets are assets that HEINEKEN only recognises as part of a purchase price allocation following an acquisition. This includes, among others, brands, customer-related and certain contract-based intangibles.
Beia Before exceptional items and amortisation of acquisition-related intangible assets.
Cash conversion ratio Free operating cash flow/net profit (beia) before deduction of non-controlling interests.
Cash flow (used in)/from operational investing activities This represents the total of cash flow from sale and purchase of Property, plant and equipment and Intangible assets, proceeds and receipts of Loans to customers and Other investments.
Centrally available financing headroomThis consists of the undrawn part of revolving credit facility and cash minus commercial paper and other short-term borrowings.
Consolidation changes Changes as a result of acquisitions and disposals.
Depletions Sales by distributors to the retail trade.
Dividend payout Proposed dividend as percentage of net profit (beia).
Earnings per share (EPS) Basic Net profit/(loss) divided by the weighted average number of shares – basic – during the year.
Diluted Net profit/(loss) divided by the weighted average number of shares – diluted – during the year.
EBITDA Earnings before interest, taxes, net finance expenses, depreciation and amortisation. EBITDA includes HEINEKEN’s share in net profit of joint ventures and associates.
Effective tax rate Income tax expense expressed as a percentage of the profit before income tax, adjusted for share of profit of associates and joint ventures.
Eia Exceptional items and amortisation of acquisition-related intangible assets.
Exceptional items Items of income and expense of such size, nature or incidence, that in the view of management their disclosure is relevant to explain the performance of HEINEKEN for the period.
Free operating cash flow This represents the total of cash flow from operating activities and cash flow from operational investing activities.
Group net revenue (beia) Consolidated net revenue (beia) plus attributable share of net revenue (beia) from joint ventures and associates.
Group operating profit (beia) Consolidated operating profit (beia) plus attributable share of operating profit (beia) from joint ventures and associates, excluding Head Office and eliminations.
Net debt Non-current and current interest-bearing borrowings (incl. lease liabilities), bank overdrafts and market value of cross-currency interest rate swaps less cash and cash equivalents.
Net profit/(loss) Profit/(loss) after deduction of non-controlling interests (profit/(loss) attributable to shareholders’ of the Company).
Net revenue Revenue as defined in IFRS 15 (after discounts) minus the excise tax expense for those countries where the excise is borne by HEINEKEN.
Glossary
176 Heineken N.V. Annual Report 2020

Net revenue per hectolitre Net revenue divided by total consolidated volume.
Organic growth Growth excluding the effect of foreign currency translational effects, consolidation changes, exceptional items and amortisation of acquisition-related intangible assets.
Organic volume growth Growth in volume, excluding the effect of consolidation changes.
Price mix on a constant geographic basis Refers to the different components that influence net revenue per hectolitre, namely the changes in the absolute price of each individual sku and their weight in the portfolio. The weight of the countries in the total revenue in the base year is kept constant.
Profit/(Loss) Total profit/(loss) of HEINEKEN before deduction of non-controlling interests.
® All brand names mentioned in this report, including those brand names not marked by an ®, represent registered trademarks and are legally protected.
Region A region is defined as HEINEKEN’s managerial classification of countries into geographical units.
Volume Brand specific volume (Heineken® volume, Amstel® volume, etc.) Brand volume produced and sold by consolidated companies plus 100% of brand volume sold under licence agreements by joint ventures, associates and third parties.
Beer volume Beer volume produced and sold by consolidated companies.
Non-beer volume Cider, soft drinks and other non-beer volume produced and sold by consolidated companies.
Third party products volume Volume of third party products (beer and non-beer) resold by consolidated companies.
Total consolidated volume The sum of beer volume, non-beer volume and third party products volume.
Licensed volume 100% of volume from HEINEKEN’s beer brands sold under licence agreements by joint ventures, associates and third parties.
Group beer volume The sum of beer volume, licensed beer volume and attributable share of beer volume from joint ventures and associates.
Weighted average number of shares Basic Weighted average number of outstanding shares.
Diluted Weighted average number of outstanding shares and the weighted average number of shares that would be issued on conversion of the dilutive potential shares into shares as a result of HEINEKEN’s share-based payment plans.
Glossary
177 Heineken N.V. Annual Report 2020
This Annual Report contains forward-looking statements with regard to the financial position and results of HEINEKEN’s activities. These forward-looking statements are subject to risks and uncertainties that could cause actual results to differ materially from those expressed in the forward-looking statements. Many of these risks and uncertainties relate to factors that are beyond HEINEKEN’s ability to control or estimate precisely, such as future market and economic conditions, the behaviour of other market participants, changes in consumer preferences, the ability to successfully integrate acquired businesses and achieve anticipated synergies, costs of raw materials, interest-rate and exchange-rate fluctuations, changes in tax rates, changes in law, changes in pension costs, the actions of government regulators and weather conditions. These and other risk factors are detailed in this Annual Report.
You are cautioned not to place undue reliance on these forward-looking statements, which speak only as of the date of this Annual Report.
HEINEKEN does not undertake any obligation to update the forward-looking statements contained in this Annual Report. Market share estimates contained in this Annual Report are based on outside sources, such as specialised research institutes, in combination with management estimates.
A Heineken N.V. publicationHeineken N.V. P.O. Box 28 1000 AA Amsterdam The Netherlands
Telephone: +31 20 523 92 39 Fax: +31 20 626 35 03
The full Annual Report can be downloaded as a PDF at: www.theHEINEKENcompany.com
Production and editingHeineken N.V. Global Corporate Affairs
TextHEINEKEN
PhotographySander Stoepker pages 3 and 8
Graphic design and electronic publishingRadley Yeldar: www.ry.com
Disclaimer and Reference Information
178 Heineken N.V. Annual Report 2020

Heineken N.V. Annual Report 2020