Hay más de una manera de obtener vivienda: estrategias de vivienda en Panam
39
- 0 - Inter-American Development Bank Office of the Chief Economist Documento de Trabajo #392 There’s More Than One Way to Get a House: Housing Strategies in Panama By Michael Jacobs and William D. Savedoff* January 1999 Abstract Throughout Latin America the politics of housing clearly assigns renting an inferior status despite the fact that little is known about household preferences regarding housing tenure or about the strategies households use to get access to ownership. While the literature on self help housing has long emphasized the importance of low income owners in Latin America’s cities, the econometric literature that has quantified important aspects of housing demand has not fully incorporated this strategy of progressive construction into the analysis of tenure choice. This paper uses household data from two cities in Panama to evaluate the determinants of the tenure decision in the context of two models. In the first model, households choose between renting and owning; while in the second model, households choose between renting, buying with savings and credit, or obtaining a site and progressively building their home over time. The study shows that the key factors explaining the decision to rent or own are those associated with the family’s lifecycle while the choice between buying a complete house and progressive building is affected primarily by income and assets. The results suggest that in countries like Panama that have relatively unfettered land markets, low income households are readily able to become owners because of the alternative strategy of progressive building and this has a positive impact for accommodating growth. © 1999 Inter-American Development Bank 1300 New York Avenue, N.W. Washington, D.C. 20577 *The authors are employed by the Inter-American Development Bank as Urban Development Specialist, Social Program Division 2 and Senior Research Economist, Office of the Chief Economist, respectively. The views and interpretations in this document are those of the authors and should not be attributed to the Inter-American Development Bank, or to any individual acting on its behalf. We would like to acknowledge the contributions of Naoru Koizumi and Fabio Mendez who provided energetic research assistance for this paper. The data was obtained in the course of preparing an Inter-American Development Bank loan to Panama to support that country’s reform of its public housing policies. We would also like to acknowledge the contribution of the Urban Institute, which conducted the survey and initial analysis of the data.
-
Upload
independent -
Category
Documents
-
view
1 -
download
0
Transcript of Hay más de una manera de obtener vivienda: estrategias de vivienda en Panam
- 0 -
Inter-American Development BankOffice of the Chief EconomistDocumento de Trabajo #392
There’s More Than One Way to Get a House:Housing Strategies in Panama
By
Michael Jacobs and William D. Savedoff*
January 1999
AbstractThroughout Latin America the politics of housing clearly assigns renting an inferior status despite the factthat little is known about household preferences regarding housing tenure or about the strategieshouseholds use to get access to ownership. While the literature on self help housing has long emphasizedthe importance of low income owners in Latin America’s cities, the econometric literature that hasquantified important aspects of housing demand has not fully incorporated this strategy of progressiveconstruction into the analysis of tenure choice. This paper uses household data from two cities in Panamato evaluate the determinants of the tenure decision in the context of two models. In the first model,households choose between renting and owning; while in the second model, households choose betweenrenting, buying with savings and credit, or obtaining a site and progressively building their home overtime. The study shows that the key factors explaining the decision to rent or own are those associatedwith the family’s lifecycle while the choice between buying a complete house and progressive building isaffected primarily by income and assets. The results suggest that in countries like Panama that haverelatively unfettered land markets, low income households are readily able to become owners because ofthe alternative strategy of progressive building and this has a positive impact for accommodating growth.
© 1999Inter-American Development Bank1300 New York Avenue, N.W.Washington, D.C. 20577*The authors are employed by the Inter-American Development Bank as Urban Development Specialist, SocialProgram Division 2 and Senior Research Economist, Office of the Chief Economist, respectively. The views andinterpretations in this document are those of the authors and should not be attributed to the Inter-AmericanDevelopment Bank, or to any individual acting on its behalf.
We would like to acknowledge the contributions of Naoru Koizumi and Fabio Mendez who provided energeticresearch assistance for this paper. The data was obtained in the course of preparing an Inter-American DevelopmentBank loan to Panama to support that country’s reform of its public housing policies. We would also like toacknowledge the contribution of the Urban Institute, which conducted the survey and initial analysis of the data.
- 1 -
Introduction
The choices facing low-income households lie at the heart of housing policy in LatinAmerica. How much to spend? Where to live? What services are important? Assumptionsabout household responses to these questions determine housing policies, but theseassumptions are often implicit, only rarely based on reliable empirical evidence.Understanding the choice between renting and owning is particularly important.Throughout Latin America the politics of housing clearly assigns renting an inferior status.“A nation of owners” is a slogan that, with local variations, has captured many housingministries. And resources have followed these slogans. Public housing projects and publichousing banks have been used, at great expense, to help some selected households becomeowners. Yet little is known about the factors that affect household preferences regardingtenure, and the strategies used by households for getting access to ownership have notbeen adequately analyzed.
To unravel these household strategies, this study argues for a significant addition to theestablished models of housing demand in developing countries. When analyzing tenurechoice, these models have generally used a straightforward dichotomy between rentingand owning. In doing so, they follow a literature that evolved out of the work done onhousing markets in developed economies. However, becoming an owner-occupier, doesnot necessarily involve the same process in Panama as it does in the United States. Wefocus on a highly salient difference. In the United States, the construction of new substandard housing is virtually impossible. In Panama, it is the way that more than half thehousing stock is built. In the United States, a minimum cost threshold “truncates” themarket for owner-occupiers. In Panama, households can occupy an undeveloped site andbuild a shack that meets no formal definition of adequate urban or housing norms.
The market for housing ownership thus looks very different in these two countries and byextension in industrialized and developing countries. In the industrialized world there isone basic route to becoming an owner-occupier: accumulate the savings and achieve theminimum income level required to qualify for a mortgage and buy a complete standardhouse. In Panama however, this route is open to no more than 40% of the population. Forthe majority, the route to becoming an owner involves the gradual construction of a houseover an extended time, approaching standards of adequacy (in so far as is possible) towardthe end, not the beginning of the process. The initial cost threshold is much lower andhence the distortion introduced by truncation less important.
To model the choices faced by households in such a market, we propose a two-stageanalysis. In the first stage households choose between owning and renting. In such adichotomous model, household lifecycle (age, number of children) is shown to be moresignificant than income in determining choice. In the second stage, we introduce amultinomial model so those households that have decided to become owners choosebetween building their house gradually and buying a complete unit. Here, as might beexpected, income becomes more significant and lifecycle variables less so.
- 2 -
The paper begins with a brief overview of the literature on tenure choice in developingcountries, showing that the self build route to ownership is a central element in asociological tradition of analysis, though it has not yet been fully incorporated intoeconomic analyses of housing demand. The next section discusses the basic debatesregarding tenure choice in developing countries, and is followed by a presentation of thekey features of Panama’s housing market and our data set. The following section exploresthe data to evaluate a story of how household preferences change over the lifecycle andhow households that buy complete units differ from those who build their own homes.Then, two formal models of tenure choice are presented to analyze the impact of income,education, age, children, gender and marriage, on household tenure decisions. Next, theresults of estimating these models are presented and discussed. The final section discussesthe broader conclusions and policy implications of the study.
Tenure choice in developing countries: an overview
The literature on housing in developing countries has bifurcated into two traditions thatpay relatively little heed to each other. The first tradition is sociological and derives fromthe seminal model presented by John Turner in the 1960s. The second more econometrictradition was launched in the late1980s by a World Bank team led by Malpezzi and Mayo.In this paper we propose to use key insights from of the sociological tradition to formulatean econometric model of tenure choice that enhances our understanding of householddecision making.
Turner’s highly influential model was embedded in his understanding of the broaderprocess of urbanization in developing economies. The protagonist, in his account ofhousing strategies, was the rural immigrant coming to the city to find work. Initially thesemigrants rented rooms in the cities’ central zones where casual labor was most readily tobe found. As these households accumulated the capital, skills and information needed tobecome owners, they would shift to the urban periphery and begin to construct a house oftheir own (Turner 1967 and 1968). Thirty years of research have not exhausted thepotential of this fertile vision (Klak and Hotzclaw 1993 provide a summary of thisdaunting literature) but a key proposition was largely implicit: most low-incomehouseholds prefer to be owners. The assumption, in other words, was that renting was theresult of poverty or of some other constraint.
Within this tradition, a re-assessment of rental housing did take place in the 1990s.Eckstein (1990) argued that the benefits of ownership in peripheral areas had beenoverstated while the disadvantages of rental housing in the city center had been assumedwithout much evidence; she concluded that some households prefer to rent. Gilbert (1991)argued that households need a range of alternatives and that for some households rentingbetter fitted their needs. Van Lindert and van Westen (1991) showed that renters in thecentral areas of La Paz actually had incomes higher than those of owner households inmore peripheral locations. Nevertheless, in a survey that emphasized the variety of factorsthat could lead households to prefer renting, Rakodi (1995: 799-780) summarizes the
- 3 -
literature as showing that “Long term tenancy may, therefore, be increasingly a result ofthe commercialization of property markets, low and declining real incomes and failures ofgovernment policy… ”
In the economic tradition pioneered in Mayo and Malpezzi (1987) housing demand wasinitially analyzed separately for owners and renters since owners tended to consume morehousing services than did renters of similar income levels. When the analysis explicitlycompared the two forms of tenure, income was generally found to be a significant factor,with higher incomes increasing the probability of becoming an owner. (Ahmad, 1994). Inthe most recent of these studies Arimah (1997) found that. in the city of Ibadan, Nigeria,while income was statistically significant in determining tenure, the magnitude of theincome coefficients was very small. Daniere (1992) anticipated in some respects theapproach taken in the present study by explicitly taking “squatting” into account as aseparate form of tenure. The results from Manila showed that formal owners had higherincome levels than did squatters but that squatters had higher incomes than did renters.
Because of the methodological gulf separating these traditions, little effort has gone intoseeing how they might be used to mutually strengthen our understanding of housingmarkets in developing countries. Here we can only begin the process by making twofundamental points. First, some key variables show up as significant in both traditions, andthese robust results are worth emphasis. Life cycle variables, particularly age andhousehold size, are consistently significant in the econometric models: renters tend to beyounger, smaller households. The sociological literature has provided a rich account thatlinks these housing choices to labor market opportunities and household priorities as wellas to conditions within urban land and housing markets themselves.
The second point concerns the role of income in tenure choice. In both traditions theresults are weak or ambiguous. The sociological literature undoubtedly began by seeingrenting as the tenure of the very poor, but a number of studies showed renters with higherincomes than owners. From the perspective of the econometric tradition, the weak effectof income is not entirely surprising, since the literature draws on structurally similarmodels from developed economies, particularly the United States.
Henderson and Ioannides (1983) present a model in which this ambiguity regarding theimpact of income results from the interaction of several factors. They demonstrate thatowning is always preferable to renting unless there are uncertainties in housing assetvalues or public policy and institutional factors are at play (such as tax incentives or creditmarket imperfections). Consequently, under certain conditions higher income householdswill be more likely to rent, largely due to the fact that their demand for housing servicesmay exceed their demand for housing investments in their asset portfolio. They also arguethat young individuals with higher education are more likely to rent because they canexpect much higher incomes in the future with which to better balance their housingservice and housing investment needs; while young households with large inherited wealthare likelier to own than rent.
- 4 -
Furthermore, the empirical literature demonstrates that becoming an owner involves a hightransaction cost in developed economies. Overcoming this transaction cost requires eitherhigher permanent income (Struyk and Marshal 1974), or higher current assets(Cooperstein 1989). Either way households must accumulate the resources to make adown payment and meet the income underwriting standards required by mortgage lenders.If purchase of a complete standard house were the only route to ownership in developingcountries, low GNP per capita, very unequal income distribution, and thin financialmarkets would exclude most households (and all low-income households) from becomingowners. Income and asset variables would then be of overwhelming significance indetermining tenure choice in developing countries.
In this respect, the sociological tradition started with a key insight. The explicit thrustbehind Turner’s work was the conviction that low-income households could becomeowner-occupiers if they had access to areas where they could build their own houses indefiance of conventional construction and planning codes (1967:167 et ff). Access to landwith sub standard services was identified as a necessary condition if these households wereto have the option of becoming owners by constructing their own house. (Gilbert 1990).Most important of all, these households are not condemned to a lifetime in severely substandard housing. Rather, ownership gave them the means to invest savings and labor inimprovements to the size, materials, and service connections of the house so that it wasgradually shaped to their long-term preferences.
There are, then, not one but two routes to becoming an owner. The first route, buying acompleted house, comes with a high minimum entry cost, and hence is likely to excludelow-income households. The second route to ownership, constructing a house over time,can have a much lower minimum cost. In one sense, the second route does mimic the first:both allow the household to spread payments over time. For most households that buycompleted houses in developed countries, this is accomplished through the mediation of afinancial system that provides mortgage loans. For households taking the second route, thespread over time is accomplished by initially occupying a sub-standard unit andprogressively building improvements and expansions.
From this perspective, building over time is essentially a financial option that reduces theinitial entry cost of ownership. This reduction will be particularly significant for low-income households. In contrast to developed countries and other developing regionswhere evictions and land controls appear to be more strictly applied, Latin America has infact been relatively tolerant of substandard housing and this may account for LatinAmerica’s higher rates of ownership.1 In those countries that are willing to accommodatehousing that is initially substandard, low-income households will have greater opportunityto become owners.
1 See data in U.N. Centre for Human Settlements, 1993.
- 5 -
Panama’s housing market
Panama’s housing market has functioned very well along a variety of dimensions.Construction of new homes has not only kept pace with the formation of new households,but has actually reduced the number of people per residence. The evidence also showsthat substandard houses in Panama are not evidence of large-scale “hardcore” poverty. Itis true that many homes, at any one time, are inadequate. However, the prevalent strategyof progressive building is quite active, and as a result, substandard houses are regularlyupgraded over time.2
Housing Demand
Between 1980 and 1990, Panama’s total population grew at a rate of about 2.1%(reaching 2.4 million in 1990) but the urban population increased at a 2.9% rate. Theurban housing stock grew even faster at a rate of 3.9% per year. As a result the number ofpeople per house dropped from 4.8 to 4.2 over the decade. This suggests that the marketfor additional housing was able to accommodate not just the demand driven by themigration of rural population into the cities, but also a higher rate of household formation.The fact that the increase in the stock of houses outpaced the increase in population is thefirst piece of evidence that the urban housing market functioned reasonably well.
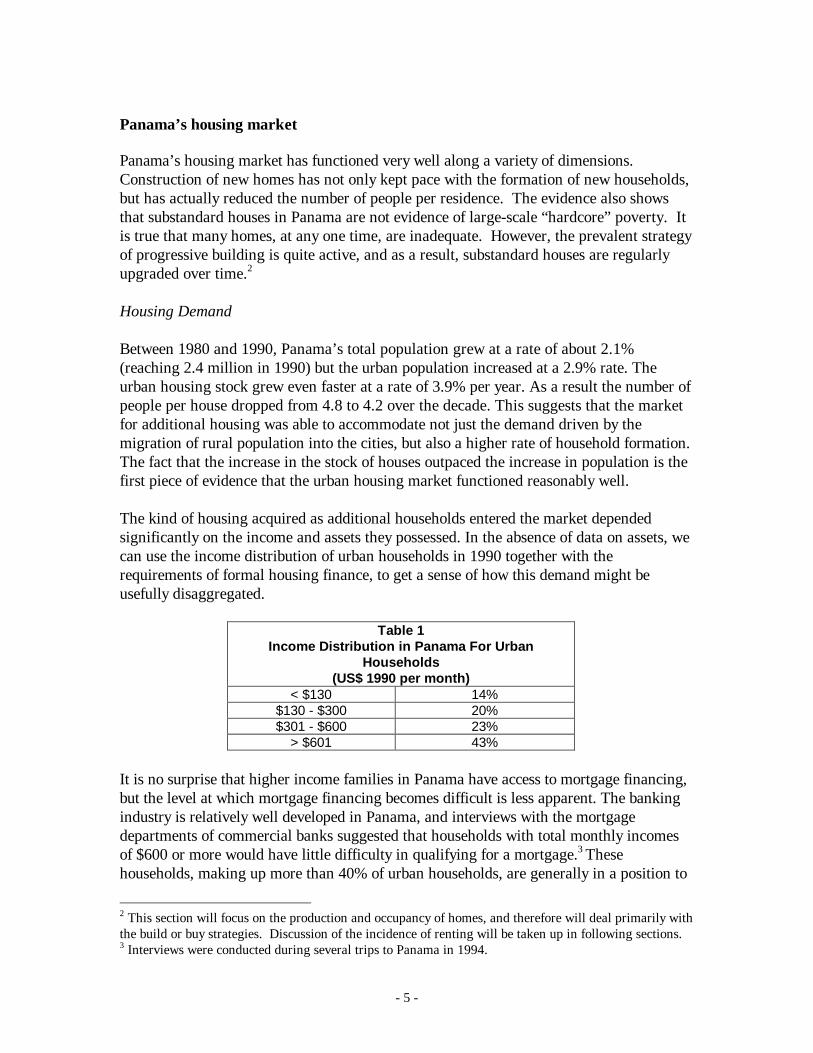
The kind of housing acquired as additional households entered the market dependedsignificantly on the income and assets they possessed. In the absence of data on assets, wecan use the income distribution of urban households in 1990 together with therequirements of formal housing finance, to get a sense of how this demand might beusefully disaggregated.
Table 1Income Distribution in Panama For Urban
Households(US$ 1990 per month)
< $130 14%$130 - $300 20%$301 - $600 23%
> $601 43%
It is no surprise that higher income families in Panama have access to mortgage financing,but the level at which mortgage financing becomes difficult is less apparent. The bankingindustry is relatively well developed in Panama, and interviews with the mortgagedepartments of commercial banks suggested that households with total monthly incomesof $600 or more would have little difficulty in qualifying for a mortgage.3 Thesehouseholds, making up more than 40% of urban households, are generally in a position to
2 This section will focus on the production and occupancy of homes, and therefore will deal primarily withthe build or buy strategies. Discussion of the incidence of renting will be taken up in following sections.3 Interviews were conducted during several trips to Panama in 1994.
- 6 -
take the “buyer” route to ownership. At the other extreme, the households with monthlyincomes of $300 or less (more than a third of the total) are apparently excluded fromformal housing finance and are very likely to be “builders” if they choose to owners. Thehousing they initially acquire will often be substandard, only reaching the desired qualityafter a process of improvement. As a result, for these households the housing marketcannot be understood simply as the acquisition of a unit, but also encompasses the processof improvement.
While it is more difficult for households with incomes below $600 per month to getapproval for a mortgage, income is not the only relevant variable. Banks in Panamagenerally require borrowers to have mortgage payments deducted directly from theirpaychecks. Households with “formal” sector employment may thus have better access tomortgage financing than households with higher but less well-documented income. As aresult, the 23% of households who have incomes between $600 and $300 per month canbest be characterized as occupying a “gray” intermediate zone. Close to the upper boundof this zone, some of these households will have access to commercially producedhousing. As households approach the lower bound their housing acquisition willpresumably come to resemble that of low-income households.
The Supply of New Housing
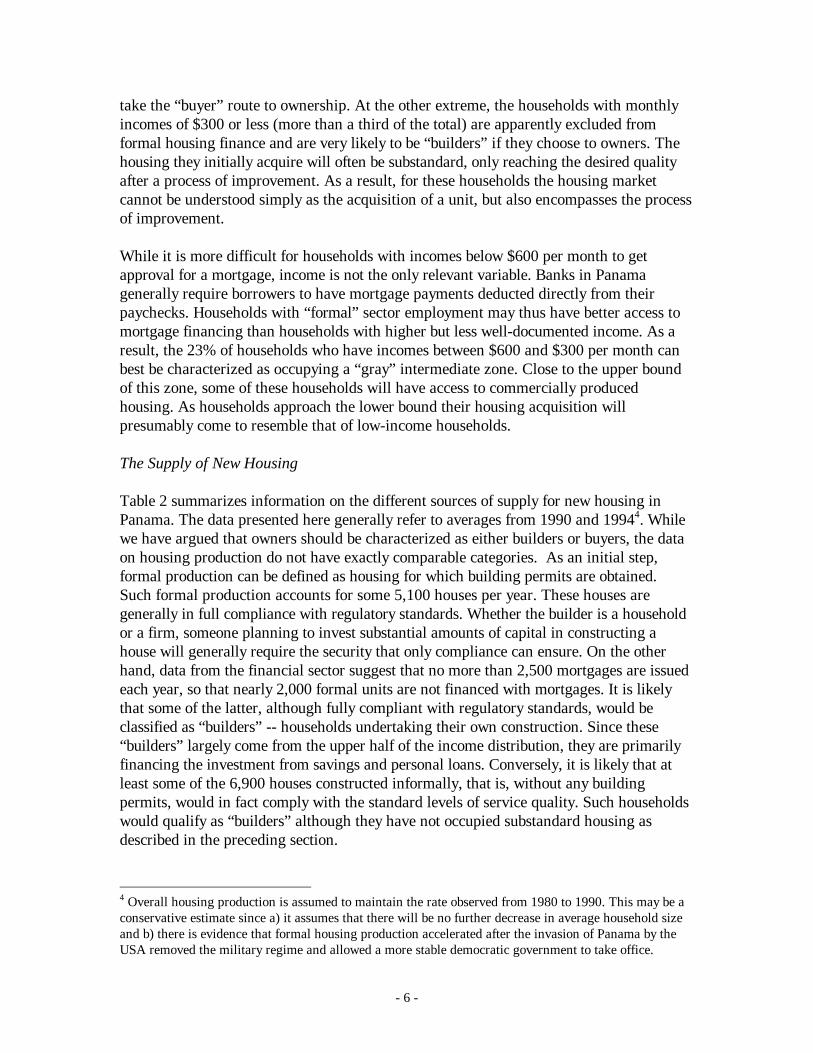
Table 2 summarizes information on the different sources of supply for new housing inPanama. The data presented here generally refer to averages from 1990 and 19944. Whilewe have argued that owners should be characterized as either builders or buyers, the dataon housing production do not have exactly comparable categories. As an initial step,formal production can be defined as housing for which building permits are obtained.Such formal production accounts for some 5,100 houses per year. These houses aregenerally in full compliance with regulatory standards. Whether the builder is a householdor a firm, someone planning to invest substantial amounts of capital in constructing ahouse will generally require the security that only compliance can ensure. On the otherhand, data from the financial sector suggest that no more than 2,500 mortgages are issuedeach year, so that nearly 2,000 formal units are not financed with mortgages. It is likelythat some of the latter, although fully compliant with regulatory standards, would beclassified as “builders” -- households undertaking their own construction. Since these“builders” largely come from the upper half of the income distribution, they are primarilyfinancing the investment from savings and personal loans. Conversely, it is likely that atleast some of the 6,900 houses constructed informally, that is, without any buildingpermits, would in fact comply with the standard levels of service quality. Such householdswould qualify as “builders” although they have not occupied substandard housing asdescribed in the preceding section.
4 Overall housing production is assumed to maintain the rate observed from 1980 to 1990. This may be aconservative estimate since a) it assumes that there will be no further decrease in average household sizeand b) there is evidence that formal housing production accelerated after the invasion of Panama by theUSA removed the military regime and allowed a more stable democratic government to take office.
- 7 -
Table 2Annual Production of Urban Houses in Panama
No. Units AverageUnit Cost
HouseholdIncome Observations
1 Formal Production Total 5,100 Formal defined as houses built with constructionpermits
2 Private Sector Total 4,400 $12,000
Luxury Market: 10%Total Units: Average cost $170,000Middle Market: 30%Total Units: Average Cost $ 40,000Low End Market: 60%Total Units: Average Cost $10,000
3 Priv. Financed byMortgage 2,500 $50,000 Generally >
$600/Mo
Average Loan for Residential Mortgage $40,000Lower bound of mortgage access$300 - $400 /month
4 Priv. Without Mort.Financing 1,900
5 Public Sector 700 $7,700 $450/MoPublic Programs to contract construction ofhouses and apartments; Average Unit cost refersto sales price; full cost in excess of $12,000
6 Informal ProductionTotal 6,900 Informal defined as houses built without
construction permits
7 Private 4,900 $500 -$2,000
Generally <$300/Mo
8 Public Sector 2,000 $2,700 $290/MoPublic Program providing up to $1,500 ofbuilding materials; household provides land andlabor.
9 Total Annual Production 12,000
Notes on Sources and Estimations: All data are rounded averages from 1990 – 1994 unless otherwise noted. Sources includeIDB 1996; Panamanian Chamber for Construction Industry (CAPAC), Statistical Bulletin, 1993, 94, 95; interviews with bankmanagers; and construction firms; and Census of Population and Housing, 1990.
In spite of these caveats regarding the interpretation of the data, the overall picture is bothplausible and instructive. Expanding at a rate of 3.9% per year, the housing sectorproduces a total of some 12,000 units per year. Although Panama does have a relativelywell developed financial industry, little more than 20% of the annual production ofhousing is apparently acquired through the conventional “buyers” route of using mortgagefinancing for the purchase of a completed house. More than 40% of total productionseems to require the “builder” process of acquiring a sub-standard unit for subsequentimprovement over time. Another 20% of total production is accounted for by the publicsector5. The character of the remaining 20% of production is less clear but it seems likelyto correspond to a process of “building” by relatively prosperous households.
5 It is worth emphasizing that the public sector’s production came in two very different forms. The firstconsisted of completed apartments and houses built under contract by commercial developers. The 700units produced each year involved large subsidies for each household and considerable productioninefficiency. The second form consisted of a program that provided about 3,000 low income householdseach year with building materials. The beneficiaries hauled the materials from the warehouse, andprovided the land and construction labour. The program was well targeted and only cost the governmentsome $1,500 per household. For an evaluation of these programs see IDB 1996, Annex II.
- 8 -
The Supply of Housing Improvements
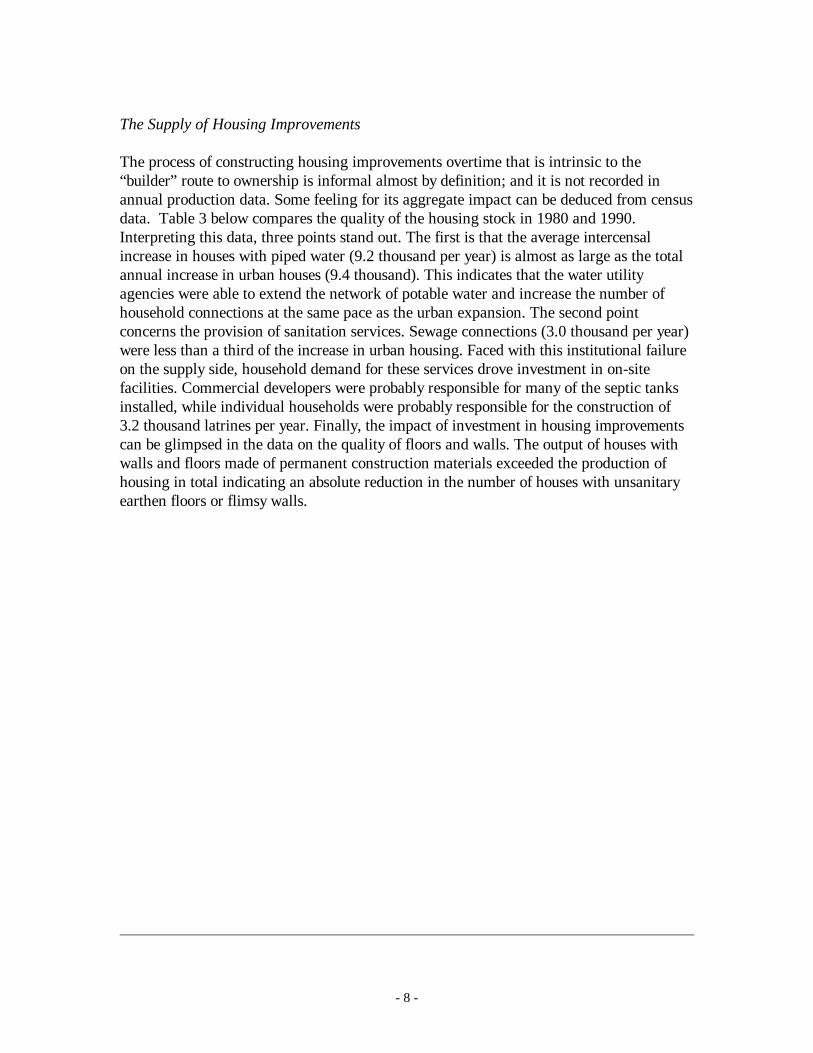
The process of constructing housing improvements overtime that is intrinsic to the“builder” route to ownership is informal almost by definition; and it is not recorded inannual production data. Some feeling for its aggregate impact can be deduced from censusdata. Table 3 below compares the quality of the housing stock in 1980 and 1990.Interpreting this data, three points stand out. The first is that the average intercensalincrease in houses with piped water (9.2 thousand per year) is almost as large as the totalannual increase in urban houses (9.4 thousand). This indicates that the water utilityagencies were able to extend the network of potable water and increase the number ofhousehold connections at the same pace as the urban expansion. The second pointconcerns the provision of sanitation services. Sewage connections (3.0 thousand per year)were less than a third of the increase in urban housing. Faced with this institutional failureon the supply side, household demand for these services drove investment in on-sitefacilities. Commercial developers were probably responsible for many of the septic tanksinstalled, while individual households were probably responsible for the construction of3.2 thousand latrines per year. Finally, the impact of investment in housing improvementscan be glimpsed in the data on the quality of floors and walls. The output of houses withwalls and floors made of permanent construction materials exceeded the production ofhousing in total indicating an absolute reduction in the number of houses with unsanitaryearthen floors or flimsy walls.
- 9 -
Table 3Improvement in Housing Stock
Occupied Urban Houses1980-1990
(Thousands) AverageAnnual
Increase1980 1990 1980 -1990
Urban Population
970 1,233 2.9%
Urban Houses 201.3 295.1 3.9% Urban Pop/House
4.8 4.2
Urban Houses
Urban Houses with:
9.4
Piped Water 195.7 287.5 9.2 In House Connection
141.8 212.6 7.1
Sewer Connection
123.4 153.4 3.0
Septic Tank 21.2 51.0 3.0 Latrines 53.8 86.0 3.2
Permanent Walls 131.6 239.5 10.8 Constructed Floor
189.3 285.6 9.6
Source: Census, 1980, 1990
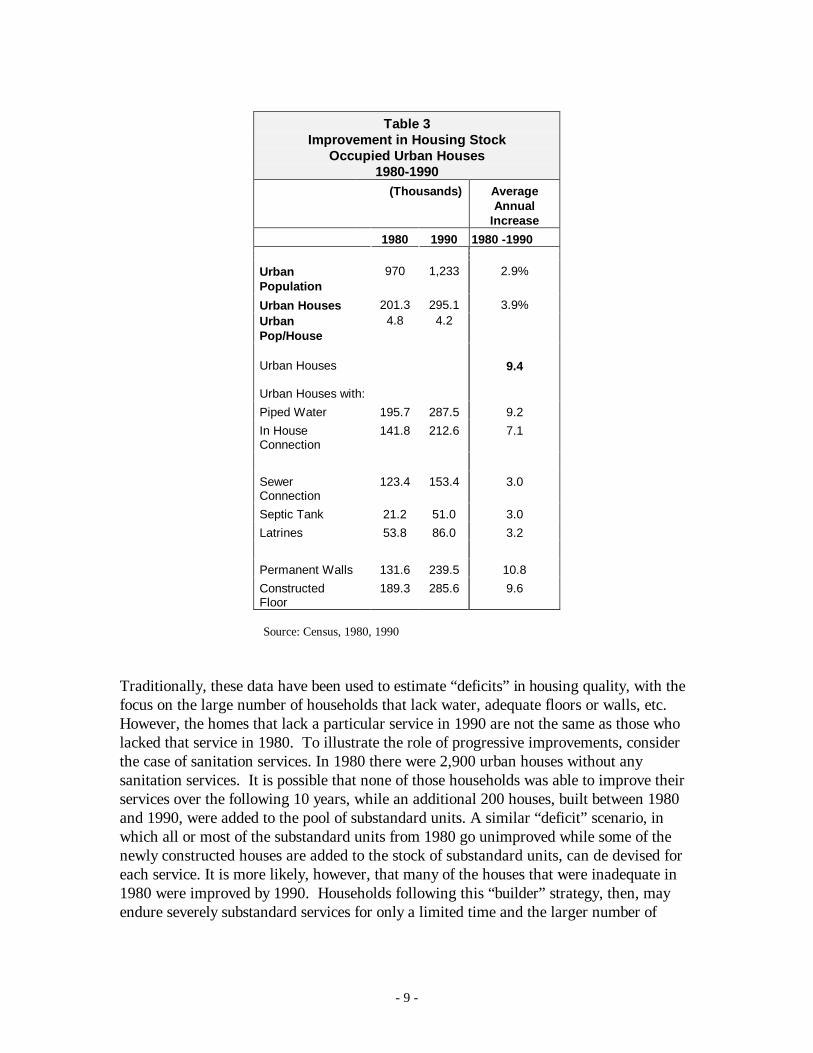
Traditionally, these data have been used to estimate “deficits” in housing quality, with thefocus on the large number of households that lack water, adequate floors or walls, etc.However, the homes that lack a particular service in 1990 are not the same as those wholacked that service in 1980. To illustrate the role of progressive improvements, considerthe case of sanitation services. In 1980 there were 2,900 urban houses without anysanitation services. It is possible that none of those households was able to improve theirservices over the following 10 years, while an additional 200 houses, built between 1980and 1990, were added to the pool of substandard units. A similar “deficit” scenario, inwhich all or most of the substandard units from 1980 go unimproved while some of thenewly constructed houses are added to the stock of substandard units, can de devised foreach service. It is more likely, however, that many of the houses that were inadequate in1980 were improved by 1990. Households following this “builder” strategy, then, mayendure severely substandard services for only a limited time and the larger number of

- 10 -
inadequate homes would be indicative more of a more dynamic pace of householdformation and construction than of absolute and continuing deprivation.
Table 4 demonstrates that, in fact, house upgrading occurs quite extensively. Althoughthe numbers refer to the national rather than the urban housing stock (census data do notprovide the same breakdown for urban housing), there is every reason to believe that theeffect would be more marked in urban areas where the scope for improving householdincome is much greater. Nevertheless, the conclusion is clear enough. The most recentlybuilt houses tend to be substandard at a much higher rate than houses built earlier. Giventhe increase in the absolute number of houses meeting each quality standard between 1980and 1990, the data support the dynamic scenario by which low income households becomeowners of acceptable housing through a gradual process of constructing and financingimprovements. 6
Table 4Quality of National Housing Stock by Date of Construction
Date of ConstructionTotal Stock1990 Before
19801980 –1985
1986 –1990
Un -Known
Total Stock (1,000s) 524.3 277.2 110.0 99.9 37.2Without sanitation 12% 6% 13% 26% 13%With Earthen Floor 18% 11% 22% 41% ***Note: Data refer to national not urban housing stock.Source: Census 1990.
The growth in the housing stock, the fall in the number of people per house, and theimprovement in housing quality over the last decade must be attributable in great part tothe performance of the land market. A number of factors contributed towards its efficientoperation. Physically, the principal cities appear to have ready access to land suitable forconstruction. Public policy, however, was probably more important. Consensualpurchases of land, even without formal title or registration, could get official recognitionthrough municipally issued documents that validated the owners’ rights. These documents,though not acceptable for mortgage financing, could be held as collateral for personal 6 In Latin America it is still common for ministries to define their goal as the elimination of the housing“deficit”. There are many reasons why the “deficit” is a feeble way to define the problems of the housingsector, but this data demonstrates one of its most serious weaknesses. The “deficit” is defined at any onetime by the sum of houses needed to alleviate overcrowding plus the sum needed to replace substandardunits. But the housing market is not a static pool of substandard houses that constitute a potential targetfor a one-shot eradication program. Each year households new to the ownership begin with substandardunits, and each year large numbers of houses move toward standard quality as owner-builders invest inimprovements. In a growing housing market dominated by “builders”, the deficit is very likely to increase,even if the market is performing as well as in Panama. It is true that a core of “chronically” poorhouseholds will be trapped in very poor housing conditions and that policies to help them are justified.However, this core group is quite different from the mainstream occupants of substandard houses observedat any one time. Moreover, the actions needed to support this group, are likely to be quite different fromthose that would provide the most effective help to the wider group of building households.

- 11 -
loans and give a high degree of security. Moreover, evictions, even for occupying publiclands, occurred rarely if at all. The water utilities (with some help from commercialdevelopers that sank wells to service their developments) were generally able to keep upwith the expanding demand for connections, hence removing one of the key constraints onthe ability of the housing market to accommodate expansion efficiently. Finally,governments followed the general pattern in Latin America of not enforcing land useregulations that might otherwise have restricted access of low-income households to land.
The Data for the Study
The data for this study came from a survey taken in 1994 of 1,427 households in PanamaCity and David, with 916 and 511 households in each, respectively.7 The metropolitanarea of Panama City is by far the largest urban area in the country, accounting for morethan 60% of the urban population. Among the country’s 32 secondary cities, David wasselected as a fairly typical city whose housing market is not tightly linked to themetropolitan area because of its distance. The survey was originally aimed atunderstanding housing demand among low and middle-income families, so the sample wasselected to be representative of census tracts in each of these cities in which more than50% of the households had monthly household incomes between $125 and $506. Thelower cutoff was used to exclude areas that were likely to have a high degree ofgovernment assistance; including such areas would have distorted the findings becausesupply of housing in these areas is determined by government policy and demand is heavilyinfluenced by the structure of public subsidies.8 The upper limit is equal to the 60thpercentile urban household income according to the 1990 census and was set in order tooversample the population that was of direct interest. As it turned out, the samplingapproach did not oversample lower income families, and the sample population was quitesimilar to the total urban population in a number of dimensions (see Table 5). Thisparticular sampling approach means that the study’s results must be interpretedappropriately. Specifically, the estimates of behavioral parameters are representative ofpeople living in census tracts with these characteristics. Nevertheless, we believe that thesampling frame is not so restrictive that it invalidates the basic conclusions.
Table 5 shows the basic characteristics of the sample in Panama City and David, andcompares them with features of Panama’s urban population at the time of the 1990 census.The basic household characteristics such as household size and age of head of householdare very similar in the Panama City and David samples, and are not very different from thecountry’s overall urban areas. Mean income is also similar across the two samples, butsomewhat lower than in all urban areas. Interestingly, the median wage is higher in thesamples than in all urban areas – indicative that our sample is made up of families living inneighborhoods with relatively more homogeneous incomes. The share of female-headedhouseholds is significantly smaller in the sample than in the urban areas reported by the1990 census. By tenure, the city of David had somewhat more “unregistered occupants”, 7 For details on the sampling process, see Urban Institute (1996), available from the authors.8 Local experts identified neighborhoods within the sampling frame that had large amounts of publiclyassisted housing and these neighborhoods were also dropped form the sampling frame.
- 12 -
that is, people who consider themselves owners but who have no formal registration ordocument to prove title. It is difficult to compare these disaggregations of tenure with the1990 census because of differences in definitions. Nevertheless, the samples and the urbanareas all show a relatively high rate of formal ownership, ranging from 62% in David, to65.9% for all urban areas, and 67.5% in Panama City.
Looking at the combined sample by income, we can see that average household sizeincreases with income, a finding that is at odds with the trend in most Latin Americancountries in which household size decreases as income rises (see Table A.1 in theappendix).9 Other characteristics do not differ significantly by income except for the shareof households headed by women (who are overrepresented in the poorest category) andthe share with formal employment (which is lower in the lowest income group).
Despite these broad similarities, Panama City and David differ markedly with regard to thestrategies people used to get a home. Roughly the same proportion of householdsreported that they built their unit, 73% in Panama City and 60% in David, but more thanhalf of the households in Panama City who constructed their unit relied on family labor,while only about 35% did in David. Hired labor was used by only 39% of the householdswho built their houses in Panama City, but by more than 60% in David. Futhermore, only16% of the households in Panama City used formal loans to finance their acquisition of ahome; compared to almost 32% in David. Apparently, families in David have had greateraccess to credit, or more reason to use it, than those in Panama City. (See Table A.2 in theappendix).
9 For a discussion of household size and income in 14 Latin American countries, see IDB (1998).

- 13 -
Table 5Household Characteristics and Tenure
Panama David Total UrbanHousehold size (persons)Mean 4.4 4.4 4.2Median 4 4 4
Age of head (years)Mean 47 47 44.6median 45 44 42
Households headed by women (%) 15.8 16.6 27.5
Monthly income (PN$)mean 599 583 643median 480 460 400
Distribution by Tenure (%)Owner 67.5 62 65.9unregistered occupant 6.9 15.5 *no categoryrenter 18.6 19 25.3rent-free 7.1 3.5 *no category
Source: Tabulation from survey data, except "Total Urban" which is taken from the 1990census.
Choosing a Housing Strategy: The Role of Income and Age
This section provides an initial look at the factors that influence housing preferences. Tomake these snapshots as clear as possible, we will generally exclude households with readyaccess to mortgage financing will generally be excluded. This leaves only two incomegroups:10 households with total monthly income of less than $300, who thus have noaccess to formal housing finance; and households with total monthly income of between$300 and $600 who might qualify for a mortgage at the lower end of the formal housingmarket. We start with the choice between renting and owning and then discuss howowners choose between building and buying.
Dividing housing tenure into renting and owning is a useful conceptual device, but itsimplifies a multitude of arrangements. Ownership, in developing countries, is particularlyhard to pin down. In part this is a legal issue. Few owners have officially registered title
10 Excluding the upper income group and splitting the remainder into two somewhat arbitrary categoriesmakes the story more graphic at the cost of creating more uncertainty about the general validity of theresults. The econometric model presented in the following sections will test the significance of the samevariables as those described here, using data from all the households in the sample. In short we hope bothto have our graphic cake and eat its statistical significance.

- 14 -
deeds and most ownership is illegal in the sense that either the land or its improvementsare held in contravention of some formal regulation. At one extreme of illegality there isthe de facto occupation of property belonging to other households or private corporations.In most countries in Latin America only a small percentage of the housing stock is in thissituation. Most households occupy property through some kind of consensual transaction,sometimes related to family or employment networks, often through straightforwardpurchase. Fortunately, for our purposes, these distinctions are not relevant from theperspective of housing strategies. A household that acquires a plot of land, even withoutformal registration, has made a decision to invest capital in an asset they expect tocontinue to call their own. Therefore, households that reported themselves as being renterswere classified as such; the remainder were classified as owners whatever the degree ofinformality in their property rights.
Renting versus Owning
What then determines a household’s choice between owning and renting? Householdincome has surprisingly little impact given the expectation that ownership is likely to beconstrained by the substantial transaction costs associated with obtaining a home (SeeTable 6).
Table 6Housing Tenure by Total Household Monthly Income (US$)
Tenure Less than $300 $300 - $600Owner 73% 71%Renter 27% 29%Total 100% 100%
Clearly, owning is the dominant form of tenure for all households but the share of rentingis in fact slightly lower in the lower income group. This result is not an artifact of thechoice of income categories. Inspection of households at or below the poverty line of$130 income per month shows that they rent even less frequently – only 21% of thesehouseholds choose to rent compared with 29% of households in the $300-$600 category.These results match those in the sociological literature sketched earlier, where it wasfound that among low-income neighborhoods the average income of renters oftenexceeded that of owners. Anecdotal evidence in Panama suggested that a proportion ofowners in peripheral informal neighborhoods had switched from renting when loss ofemployment meant they could no longer meet the inexorable monthly outlay of cashrequired of renters. Nevertheless, for the highest income group (households with incomesof more than $600 per month) conventional expectations are reinstated and for thesehouseholds with more financial options for becoming owners, the proportion that rentedfell to 19%.
If income has a relatively modest impact, what drives the choice between renting andowning? The single clearest factor is age. Table 7 shows that among households in thelower income category nearly half of the households rent when the head of the household
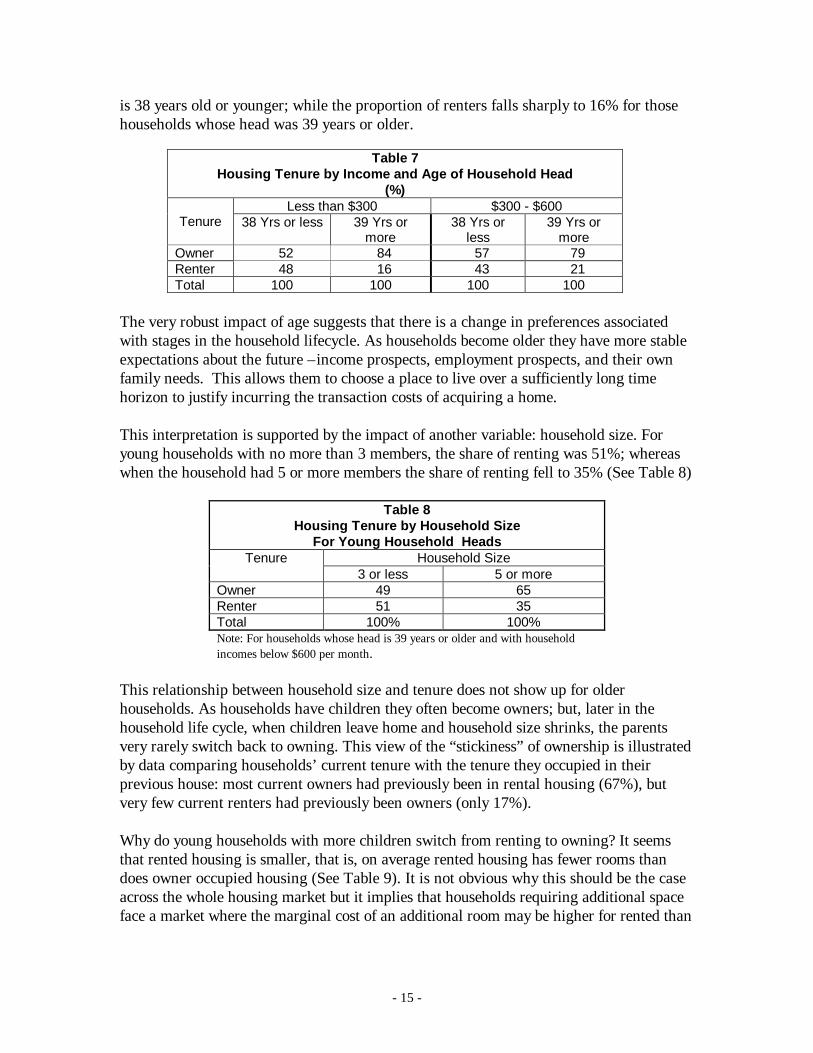
- 15 -
is 38 years old or younger; while the proportion of renters falls sharply to 16% for thosehouseholds whose head was 39 years or older.
Table 7Housing Tenure by Income and Age of Household Head
(%)Less than $300 $300 - $600
Tenure 38 Yrs or less 39 Yrs ormore
38 Yrs orless
39 Yrs ormore
Owner 52 84 57 79Renter 48 16 43 21Total 100 100 100 100
The very robust impact of age suggests that there is a change in preferences associatedwith stages in the household lifecycle. As households become older they have more stableexpectations about the future –income prospects, employment prospects, and their ownfamily needs. This allows them to choose a place to live over a sufficiently long timehorizon to justify incurring the transaction costs of acquiring a home.
This interpretation is supported by the impact of another variable: household size. Foryoung households with no more than 3 members, the share of renting was 51%; whereaswhen the household had 5 or more members the share of renting fell to 35% (See Table 8)
Table 8Housing Tenure by Household Size
For Young Household HeadsHousehold SizeTenure
3 or less 5 or moreOwner 49 65Renter 51 35Total 100% 100%Note: For households whose head is 39 years or older and with householdincomes below $600 per month.
This relationship between household size and tenure does not show up for olderhouseholds. As households have children they often become owners; but, later in thehousehold life cycle, when children leave home and household size shrinks, the parentsvery rarely switch back to owning. This view of the “stickiness” of ownership is illustratedby data comparing households’ current tenure with the tenure they occupied in theirprevious house: most current owners had previously been in rental housing (67%), butvery few current renters had previously been owners (only 17%).
Why do young households with more children switch from renting to owning? It seemsthat rented housing is smaller, that is, on average rented housing has fewer rooms thandoes owner occupied housing (See Table 9). It is not obvious why this should be the caseacross the whole housing market but it implies that households requiring additional spaceface a market where the marginal cost of an additional room may be higher for rented than
- 16 -
for owner occupied housing. From this perspective, those young households with smallerfamilies who nevertheless are owners, may be anticipating future increases in family size.
Table 9Housing Tenure by Number of Rooms for Young Household
HeadsNumber of RoomsTenure
2 or less 4 or moreOwner 37 86Renter 63 14Total 100% 100%
Renting is not a choice dictated by simple poverty. If anything, renters in low-incomegroups may have slightly more disposable income than owners. Renting is an optionexercised by young households whose uncertainty concerning the future (job location,family requirements) makes the transactions cost of ownership unattractive. Their incomebears relatively little on the choice of renting versus owning. Nevertheless, due to the lowobstacles to ownership in Panama for low-income households, income does bear on thechoice of building or buying.
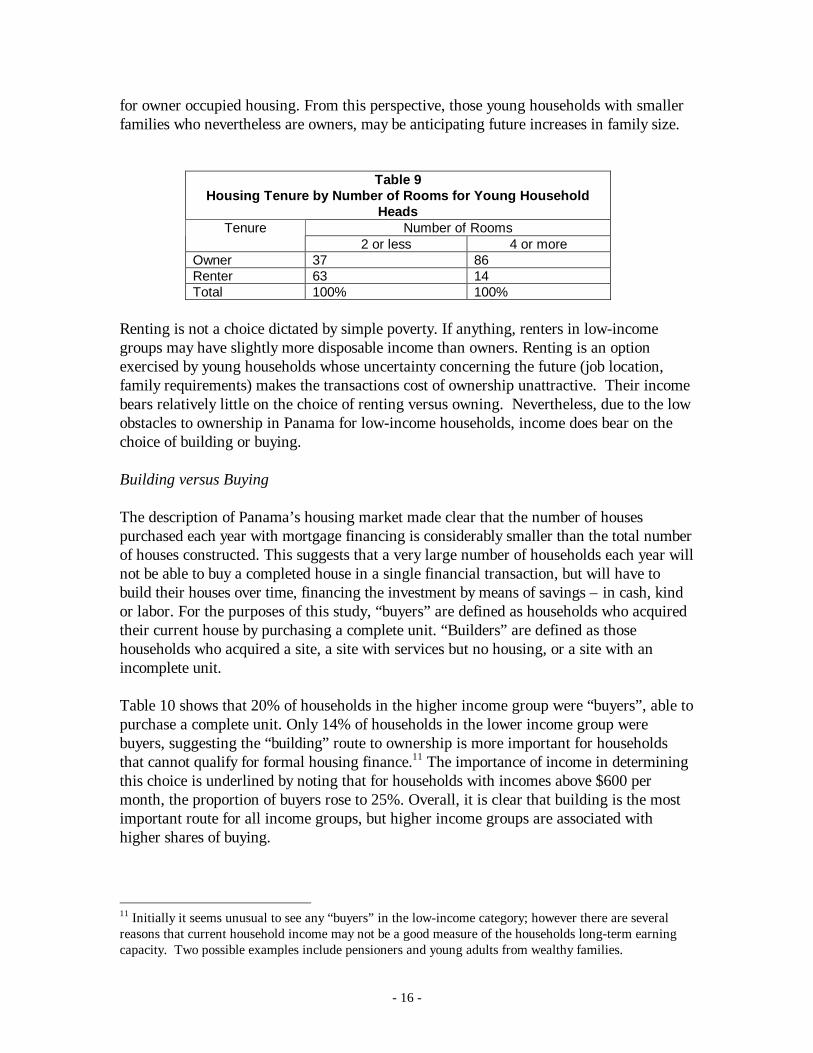
Building versus Buying
The description of Panama’s housing market made clear that the number of housespurchased each year with mortgage financing is considerably smaller than the total numberof houses constructed. This suggests that a very large number of households each year willnot be able to buy a completed house in a single financial transaction, but will have tobuild their houses over time, financing the investment by means of savings – in cash, kindor labor. For the purposes of this study, “buyers” are defined as households who acquiredtheir current house by purchasing a complete unit. “Builders” are defined as thosehouseholds who acquired a site, a site with services but no housing, or a site with anincomplete unit.
Table 10 shows that 20% of households in the higher income group were “buyers”, able topurchase a complete unit. Only 14% of households in the lower income group werebuyers, suggesting the “building” route to ownership is more important for householdsthat cannot qualify for formal housing finance.11 The importance of income in determiningthis choice is underlined by noting that for households with incomes above $600 permonth, the proportion of buyers rose to 25%. Overall, it is clear that building is the mostimportant route for all income groups, but higher income groups are associated withhigher shares of buying.
11 Initially it seems unusual to see any “buyers” in the low-income category; however there are severalreasons that current household income may not be a good measure of the households long-term earningcapacity. Two possible examples include pensioners and young adults from wealthy families.
- 17 -
Table 10Ownership Strategies by Total Household Monthly Income
(US$/month)Strategy Less than $300 $300 - $600
Builder 86 80Buyer 14 20Total 100% 100%
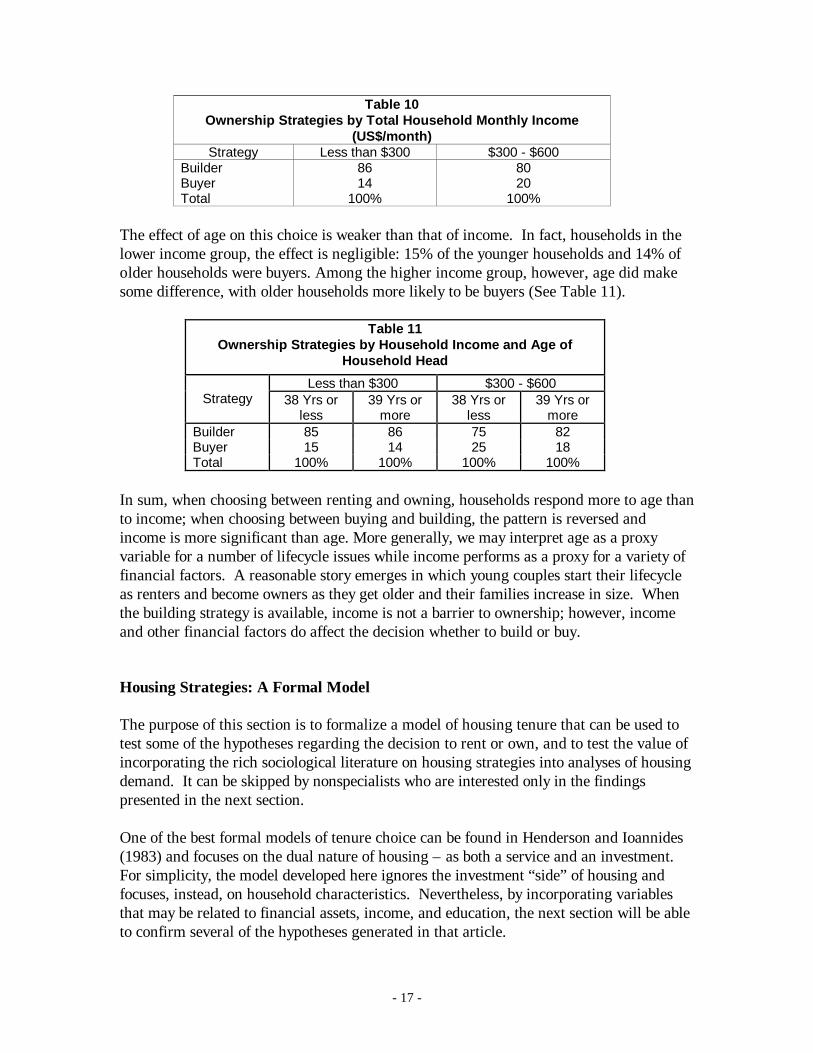
The effect of age on this choice is weaker than that of income. In fact, households in thelower income group, the effect is negligible: 15% of the younger households and 14% ofolder households were buyers. Among the higher income group, however, age did makesome difference, with older households more likely to be buyers (See Table 11).
Table 11Ownership Strategies by Household Income and Age of
Household Head
Less than $300 $300 - $600Strategy 38 Yrs or
less39 Yrs or
more38 Yrs or
less39 Yrs or
moreBuilder 85 86 75 82Buyer 15 14 25 18Total 100% 100% 100% 100%
In sum, when choosing between renting and owning, households respond more to age thanto income; when choosing between buying and building, the pattern is reversed andincome is more significant than age. More generally, we may interpret age as a proxyvariable for a number of lifecycle issues while income performs as a proxy for a variety offinancial factors. A reasonable story emerges in which young couples start their lifecycleas renters and become owners as they get older and their families increase in size. Whenthe building strategy is available, income is not a barrier to ownership; however, incomeand other financial factors do affect the decision whether to build or buy.
Housing Strategies: A Formal Model
The purpose of this section is to formalize a model of housing tenure that can be used totest some of the hypotheses regarding the decision to rent or own, and to test the value ofincorporating the rich sociological literature on housing strategies into analyses of housingdemand. It can be skipped by nonspecialists who are interested only in the findingspresented in the next section.
One of the best formal models of tenure choice can be found in Henderson and Ioannides(1983) and focuses on the dual nature of housing – as both a service and an investment.For simplicity, the model developed here ignores the investment “side” of housing andfocuses, instead, on household characteristics. Nevertheless, by incorporating variablesthat may be related to financial assets, income, and education, the next section will be ableto confirm several of the hypotheses generated in that article.
- 18 -
We begin by characterizing the household’s utility function as:12
),( HXUU =
where U is utility, X represents a vector of consumption goods, and H represents a vectorof housing characteristics. H would probably include such features of housing services astotal space, quality of the house, distance from jobs, and neighborhood amenities. Thevector of housing characteristics chosen could, itself, be a function of age, sex, number ofchildren, number of adults, and family structure – such as whether there is a marriedcouple heading the family, whether the family is headed by a woman without other adultspresent, and whether the household contains a nuclear family or is extended to otherrelatives.
This utility function would be maximized by the household subject to the constraint of itsincome (Y) and prices (PH representing the vector of prices for housing characteristics andPX representing prices of other goods).
In this simple model, the household’s decision requires only that they compare the relativecost of renting and owning. Let Rt represent the household’s tenure at time t, such thatRt takes the value 0 when the household rents and 1 when the household owns its house.Then the family decision can be characterized as:
+>=+<=
++
++
TtTtTT
TtTtTT
TCmNPVrNPVRTCmNPVrNPVR
)()( if 1)()( if 0
where r is the rental payment at time T+t, m is the mortgage payment (or opportunity costof capital) at time T+t, TC is the transaction cost incurred at time T in the purchase of ahome, and NPV is the net present value operator.
This simple model is inadequate to fully characterizing the housing tenure decision for atleast two important reasons: it doesn’t address the relationship between housing tenureand housing features nor does it sufficiently address the effect of time on the housingtenure choice.
First, the vector of housing characteristics, H, may itself be a function of housing tenure.For example, as noted earlier, large homes are not readily available in the rental market,thereby skewing the tenure choice in the direction of ownership for anyone who has a 12 For the purposes of this model, we will simplify the household decision-making process by treating it asa monolithic unit with a single utility function. Although this is not an appropriate assumption for manypurposes, we do not believe that the complexity of including the intra-household decision-making processinto the model would be worthwhile relative to the marginal contribution it would make to understandinghousing tenure strategies at this level. This study initially hypothesized that the more adults in thehousehold would increase the probability of building a house (substituting own-labor for monetaryresources); however, this variable was never significant in any of the estimations.
- 19 -
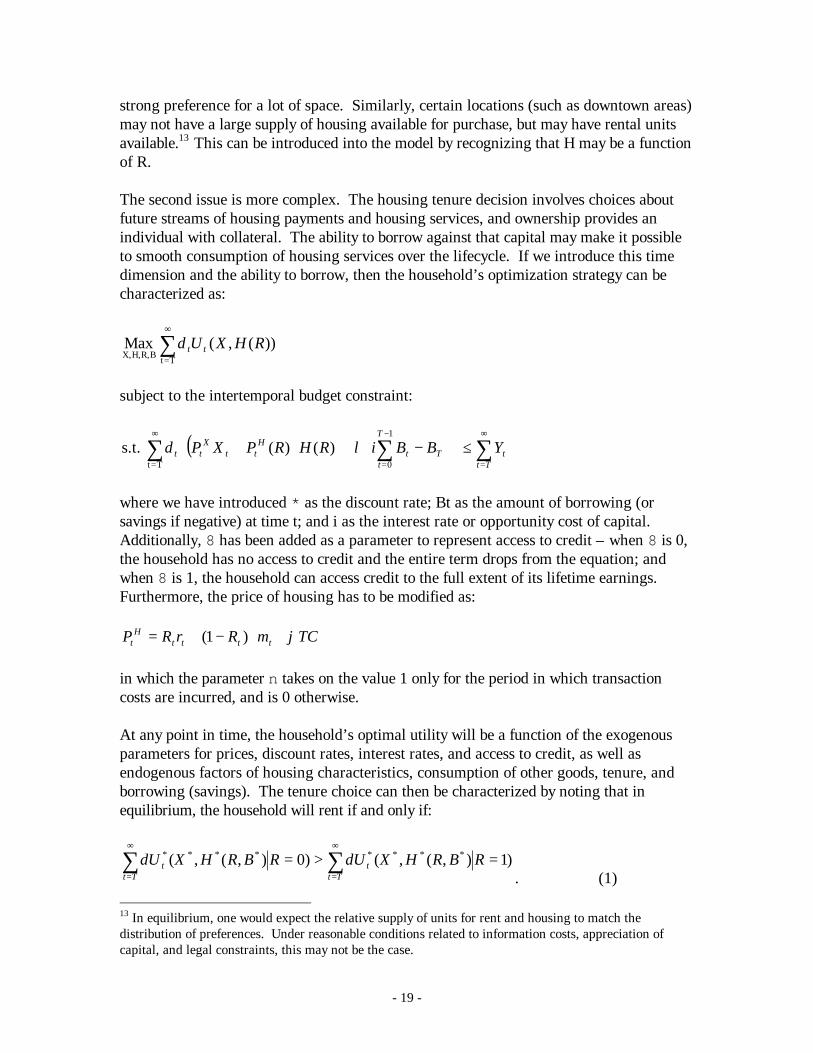
strong preference for a lot of space. Similarly, certain locations (such as downtown areas)may not have a large supply of housing available for purchase, but may have rental unitsavailable.13 This can be introduced into the model by recognizing that H may be a functionof R.
The second issue is more complex. The housing tenure decision involves choices aboutfuture streams of housing payments and housing services, and ownership provides anindividual with collateral. The ability to borrow against that capital may make it possibleto smooth consumption of housing services over the lifecycle. If we introduce this timedimension and the ability to borrow, then the household’s optimization strategy can becharacterized as:
))(,( MaxTtBR,H,X,
RHXU tt∑∞
=δ
subject to the intertemporal budget constraint:
( ) ∑∑ ∑∞
=
∞
=
−
=≤
−+⋅+
Ttt
T
tTt
Htt
Xtt YBBiRHRPXP
Tt
1
0
)()( s.t. λδ
where we have introduced * as the discount rate; Bt as the amount of borrowing (orsavings if negative) at time t; and i as the interest rate or opportunity cost of capital.Additionally, 8 has been added as a parameter to represent access to credit – when 8 is 0,the household has no access to credit and the entire term drops from the equation; andwhen 8 is 1, the household can access credit to the full extent of its lifetime earnings.Furthermore, the price of housing has to be modified as:
TCmRrRP ttttH
t ϕ+⋅−+= )1(
in which the parameter n takes on the value 1 only for the period in which transactioncosts are incurred, and is 0 otherwise.
At any point in time, the household’s optimal utility will be a function of the exogenousparameters for prices, discount rates, interest rates, and access to credit, as well asendogenous factors of housing characteristics, consumption of other goods, tenure, andborrowing (savings). The tenure choice can then be characterized by noting that inequilibrium, the household will rent if and only if:
)1),(,()0),(,( ******** =>= ∑∑∞
=
∞
=RBRHXURBRHXU
Ttt
Ttt δδ
. (1) 13 In equilibrium, one would expect the relative supply of units for rent and housing to match thedistribution of preferences. Under reasonable conditions related to information costs, appreciation ofcapital, and legal constraints, this may not be the case.

- 20 -
This incorporates the effects of tenure decisions on the marginal cost of housing attributes(such as rooms and location); the marginal utility of the particular housing attributes to thehousehold; and the relative net present value of housing costs (monthly rental paymentsversus transaction costs and a mortgage or foregone interest on savings). The equationcan be estimated by standard logit methods.
The model assumes that the household is in equilibrium, which may be problematic forseveral reasons related to information costs, uncertainty, and transaction costs. Althoughwe do not judge these factors to be critical to estimating the model, we are concerned thatthe model presumes knowledge of the entire vector of current and future goods, housingservices, and income. In particular, the data set contains information on current householdincome that may or may not be correlated with either the net present value of all futureearnings or the expectation of future earnings at the time an owner chose to purchase ahouse. These qualifications should be kept in mind in interpreting the results below.
Thus far, we have looked only at the binary choice between renting and owning. Aspointed out earlier, there is substantial evidence that housing tenure decisions in LatinAmerica are more complex due to the availability of a second route to ownership. Inparticular, if people also have the option of purchasing land informally and progressivelybuilding their home, then access to credit may not be as much of an impediment toownership. The model above can be extended to incorporate this second route by addinga third tenure choice. When R is 0 it still indicates that the household rents. However, forhouseholds that own their home, R is 1 when the household purchased the house on creditor with savings (“buyers”), and R is 2 when the household acquired the house throughprogressive building (“builders”). While deciding to buy is affected by mortgage payments(or the opportunity cost of capital) and transaction costs in the formal market, the decisionto build is affected by the opportunity cost of household labor, different transaction costs,and a discount for the uncertainty of unregistered ownership.
This leads to a household problem that can be summarized as:
)),(,( MaxRB,H,X,
BRHXUTt
t∑∞
=δ
,in which the household maximizes its utility by choosing an optimal path of consumptionof non-housing goods (X) and housing goods (H) which are themselves affected by thechoice of tenure (R=0,1,2, i.e., owning, building or buying) and borrowing (B) subject tothe intertemporal budget constraint described earlier.
This model can be estimated with standard multinomial logit techniques. Thus, either inthe binary or multinomial framework, we can test the determinants of tenure (1) as a directresult of the demand for housing characteristics (affected by age, sex, number of children,etc.), and (2) as the result of access to credit (using non-housing assets as a proxy for 8).Furthermore, we can compare the binary and multinomial specifications to see whether the3-way characterization of the tenure decision is preferred to the binary one.

- 21 -
Determinants of Tenure: the Life Cycle and Financial Resources
This section estimates the formal model discussed above. The variables utilized in theanalysis are summarized in Table 12. The first estimates are for those in which householdsare presumed to choose only between renting and owning. For this purpose, thehousehold was classified either as a renter or as an owner according to the informationprovided by the survey. Specifically, a household was classified as a renter or owner basedon a question that asked the individual to classify the household within 8 categories. Fiveof the categories were owners of different status (formal, informal, etc.), while 3categories were renters. Later, builders and buyers were distinguished on the basis ofwhether they acquired a completed unit at the time they occupied it.
Most of the other variables are self-explanatory. Heads of household were classified ineducational categories based on the highest level of education that they attained. Thosewho had no education or did not complete primary school were the excluded category inthe estimations. The durable goods measure is a dummy constructed from a questionasking whether the family has such goods as refrigerators, radios, and televisions. From anoriginal sample of 1427 households, 87 were dropped because of missing information.The final sample, then, included 1340 households for whom summary statistics arepresented in Table 13.

- 22 -
Table 12Variables Utilized in the Analysis
Variable DefinitionOwn-Rent Owning versus Renting: 0 = owner, 1=renterBuildBuyRent Buying, Building, Renting: 0=Buyer, 1=Builder, 2=renterDavid City: 0 = Panama, 1=DavidHhage Age of Head of HouseholdHHage2 HHage squaredChildren Number of children in householdMarried Head of household is married: 0=no, 1=yesHHGender Sex of Head of Household : 0=male, 1=femaleHHIncome Monthly income of head of householdHHIncome2 HHIncome squaredPrimary Only completed primary education: 1=yes, 0 otherwiseSecondary Only completed secondary education: 1=yes, 0 otherwiseTertiary Some or completed tertiary education: 1=yes, 0 otherwiseInterest income Interest income received by head of householdDurable Goods Durable goods: 0=few durable goods, 1=many durable goods
Table 13Summary Statistics for the Sample
Variable Mean Std. Dev.Children 1.5 1.4HHage 47.2 14.4HHincome 319.2 317.8Primary 0.4 0.5Secondary 0.1 0.3Tertiary 0.1 0.3David 0.4 0.5Married 0.8 0.4HHGender 0.2 0.4Interest Income 1.7 21.0Durable Goods 0.0 0.2
Table 14 reports the results of a binomial logit model that correctly predicts thehousehold’s tenure choice for about 80% of the sample. The main variables of interest arethose related to the family lifecycle, including age, marital status, and number of children,along with those related to income and access to credit. The results support the notionthat the household’s stage in its lifecycle has a strong impact on the tenure decision. Thenumber of children, the age of the household head and its square, and marital statusincrease the probability of owning a home, with coefficients that are statisticallysignificant. Under a variety of specifications, children and age of the household head werealways statistically significant. Furthermore, the age of the head of household had thelargest impact of any single variable on the probability of renting versus owning. Numberof children had a smaller but still significant effect. By contrast, marital status was not asrobust to alternative specifications. Interestingly, another measure that is often associatedwith household preferences, the gender of the head of household, does not have a
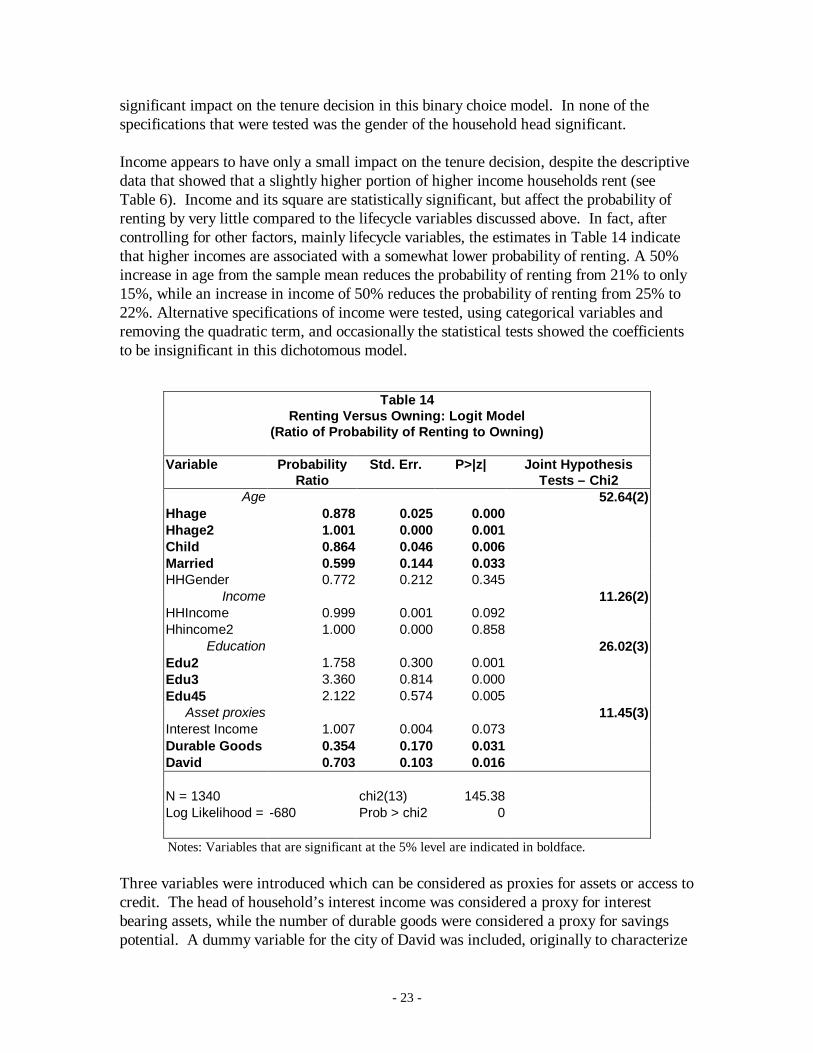
- 23 -
significant impact on the tenure decision in this binary choice model. In none of thespecifications that were tested was the gender of the household head significant.
Income appears to have only a small impact on the tenure decision, despite the descriptivedata that showed that a slightly higher portion of higher income households rent (seeTable 6). Income and its square are statistically significant, but affect the probability ofrenting by very little compared to the lifecycle variables discussed above. In fact, aftercontrolling for other factors, mainly lifecycle variables, the estimates in Table 14 indicatethat higher incomes are associated with a somewhat lower probability of renting. A 50%increase in age from the sample mean reduces the probability of renting from 21% to only15%, while an increase in income of 50% reduces the probability of renting from 25% to22%. Alternative specifications of income were tested, using categorical variables andremoving the quadratic term, and occasionally the statistical tests showed the coefficientsto be insignificant in this dichotomous model.
Table 14Renting Versus Owning: Logit Model
(Ratio of Probability of Renting to Owning)
Variable ProbabilityRatio
Std. Err. P>|z| Joint HypothesisTests – Chi2
Age 52.64(2)Hhage 0.878 0.025 0.000Hhage2 1.001 0.000 0.001Child 0.864 0.046 0.006Married 0.599 0.144 0.033HHGender 0.772 0.212 0.345
Income 11.26(2)HHIncome 0.999 0.001 0.092Hhincome2 1.000 0.000 0.858
Education 26.02(3)Edu2 1.758 0.300 0.001Edu3 3.360 0.814 0.000Edu45 2.122 0.574 0.005
Asset proxies 11.45(3)Interest Income 1.007 0.004 0.073Durable Goods 0.354 0.170 0.031David 0.703 0.103 0.016
N = 1340 chi2(13) 145.38Log Likelihood = -680 Prob > chi2 0
Notes: Variables that are significant at the 5% level are indicated in boldface.
Three variables were introduced which can be considered as proxies for assets or access tocredit. The head of household’s interest income was considered a proxy for interestbearing assets, while the number of durable goods were considered a proxy for savingspotential. A dummy variable for the city of David was included, originally to characterize

- 24 -
the difference between the Panama City and David housing markets. However, the onlysignificant difference that we detected between the samples in Panama City and David wasthat households in David made much greater use of formal and informal credit to purchasetheir homes. Therefore, we have interpreted this regional dummy to reflect what appearsto be a significant difference in access to credit in the two cities.
Of these asset or credit proxies, the durable goods and city variables were statisticallysignificant, while interest income was not. The three variables together were jointlysignificant. However, these variables need to be interpreted with care for several reasons.First, they were not always significant under alternative specifications. Second, they arepoorly measured and may be weak proxies for what we are actually trying to measure.Third, in the case of David, the variable may be representing some other difference in thelocal housing market related to land use, relative scarcity, or different preferencestructures for people who have chosen to remain in a smaller city.
Education is a very robust variable and has a strong impact on the probability of renting.Curiously, more educated household heads are more likely to rent. This relationship,which contradicted our expectations, is also found in the literature on United Stateshousing markets. Henderson and Ioannides (1983) demonstrate that young individualswith more education and, consequently, expectations of more steeply rising earnings in thefuture are likely to rent because their consumption demand for housing is higher than theirinvestment demand.
The relationship between education and tenure, then, can be understood by recognizingthat this educational effect occurs after current income and age are included, and themeasured effect of education on the rent-own decision is related to something other thanthe effect of education on current earnings.14 Estimating the two-way model withouteducation reduced the explanatory power of the income variable. Current income has asmall influence on the rental decision while permanent income and, more specifically,expectations of steeply rising future earnings have a large impact. The evidence isconsistent with the notion that the combination of current income and education variables(as proxies for permanent income) allows the model to more accurately distinguish theeffects of two different time dimensions of earnings.
The fact that the sex of the head of household had no significant impact on the tenuredecision bears on a longstanding expectation that households headed by women are morelikely to prefer renting. This expectation was based on the notion that female headedhouseholds are more vulnerable to income shocks, less stable, or need close proximity toother social resources. Particularly for women bringing up children without a partner, this
14 There are a variety of other possible explanations for the importance of education which we consideredto be less likely, including: a) preferences (more educated people like to live in areas of the city that areprimarily available for rent), b) that educated people are more mobile (therefore less willing to paytransactions costs for what could be a temporary stay), and c) educated people delay decisions due to thelength of time in school – so that they are effectively 5 – 10 years behind others in a standard lifecyclepattern.

- 25 -
preference might be linked to access to childcare. Another hypothesis linked thepreference for renting to women having less experience with construction. The firstrigorous examination of household demand for housing found no such preference(Malpezzi, Mayo, and Gross, 1987). More recently Arimah (1997) did find that the sex ofthe household head was significant in predicting tenure choice in Nigeria. However, nosuch effect was observed in any of the models tested for Panama. This suggests that whilefemale headed households are more likely to be poor and to lack access to credit inPanama, their housing decisions are like those of other households in similarcircumstances.
The robustness of this specification was evaluated by estimating the model with severalvariables included or excluded. Age of household head and number of children continuedto be significant factors; while income and assets were occasionally insignificant The samemodel presented in Table 14 was also estimated excluding all the renters who, oddlyenough, reported paying no rent.15 Again, this had no effect upon the main conclusions.
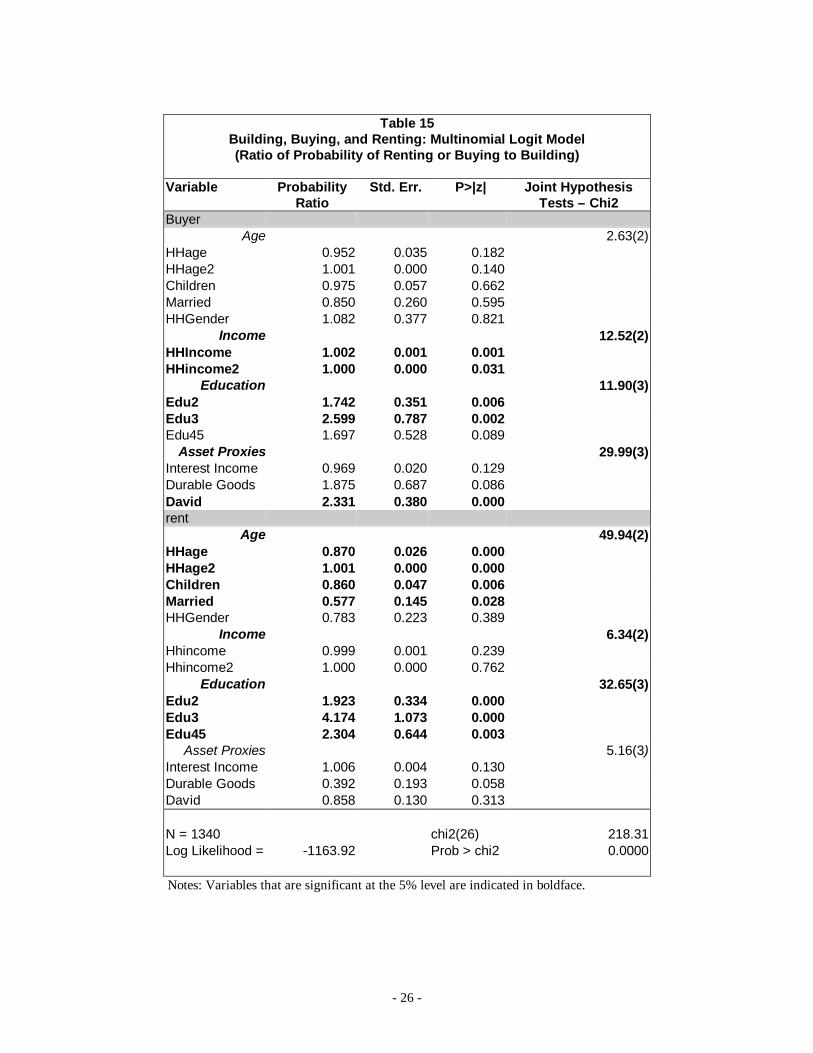
This estimate would be appropriate if the only housing strategies available to householdsin Panama were to rent or own. However, as noted earlier, households become owners intwo very distinct ways: by buying and by building. Table 15 presents the results ofestimating a multinomial logit model in which households are assumed to choose betweenrenting, buying and building. This classification was made in two stages. First, those wholisted themselves as renters were considered to be renters. Second, the remaininghouseholds were divided between those who said they acquired a completed house andthose who reported acquiring a partially completed house or site. If the household ownsits home and the house was complete when they purchased it, then they are classified as“buyers”. If the household owns its home and they initially purchased a partiallycompleted house or just a site, then they are classified as “builders”.
15 These may be families who are living with relatives in an informal “rental” arrangement, whetherbecause they are newly formed or in transition. If this is so, then they would correspond to the“allegados” or “attached” families who are identified in the literature on Chile.
- 26 -
Table 15Building, Buying, and Renting: Multinomial Logit Model(Ratio of Probability of Renting or Buying to Building)
Variable ProbabilityRatio
Std. Err. P>|z| Joint HypothesisTests – Chi2
BuyerAge 2.63(2)
HHage 0.952 0.035 0.182HHage2 1.001 0.000 0.140Children 0.975 0.057 0.662Married 0.850 0.260 0.595HHGender 1.082 0.377 0.821
Income 12.52(2)HHIncome 1.002 0.001 0.001HHincome2 1.000 0.000 0.031
Education 11.90(3)Edu2 1.742 0.351 0.006Edu3 2.599 0.787 0.002Edu45 1.697 0.528 0.089
Asset Proxies 29.99(3)Interest Income 0.969 0.020 0.129Durable Goods 1.875 0.687 0.086David 2.331 0.380 0.000rent
Age 49.94(2)HHage 0.870 0.026 0.000HHage2 1.001 0.000 0.000Children 0.860 0.047 0.006Married 0.577 0.145 0.028HHGender 0.783 0.223 0.389
Income 6.34(2)Hhincome 0.999 0.001 0.239Hhincome2 1.000 0.000 0.762
Education 32.65(3)Edu2 1.923 0.334 0.000Edu3 4.174 1.073 0.000Edu45 2.304 0.644 0.003
Asset Proxies 5.16(3)Interest Income 1.006 0.004 0.130Durable Goods 0.392 0.193 0.058David 0.858 0.130 0.313
N = 1340 chi2(26) 218.31Log Likelihood = -1163.92 Prob > chi2 0.0000
Notes: Variables that are significant at the 5% level are indicated in boldface.

- 27 -
Consistent with our model, the amount of total assets and income are the only variablesthat explain the difference between builders and buyers in most regressions. The onlyother significant variables are the education dummies. The three variables representingasset and credit proxies are associated with a higher probability of being a buyer ratherthan a builder; yet in this three-way model they have no significant impact on being arenter. In other words, the existence of two routes to home ownership in Panama meansthat income and assets – both critical to mobilizing the resources and financing forpurchasing a home – make little difference to the decision of renting versus owning.However, they significantly affect the choice between strategies for acquiring a home oncethe family has reached the decision to cease renting and “settle down”.
Once again, the education variables are also significant and have large effects on theprobability of renting versus owning and on the probability of buying versus building.Following our earlier discussion, these results are consistent with the notion that educationvariables are acting as proxies for permanent income and expectations regarding futureincreases in income.
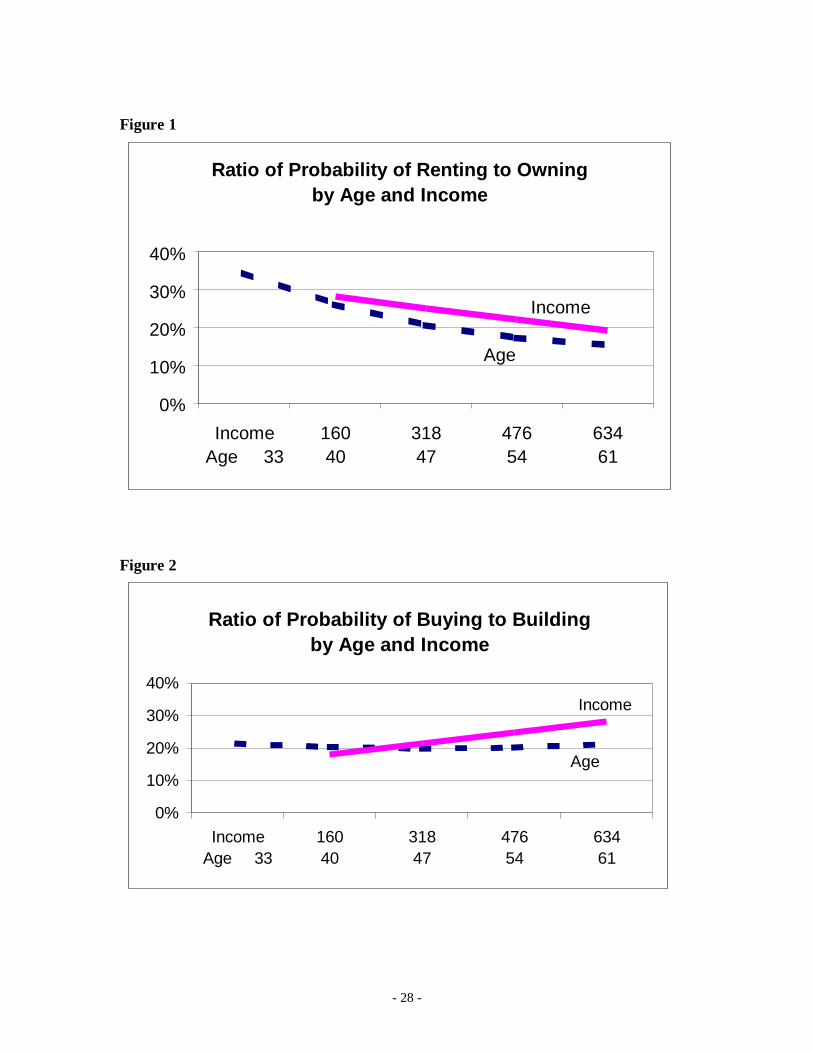
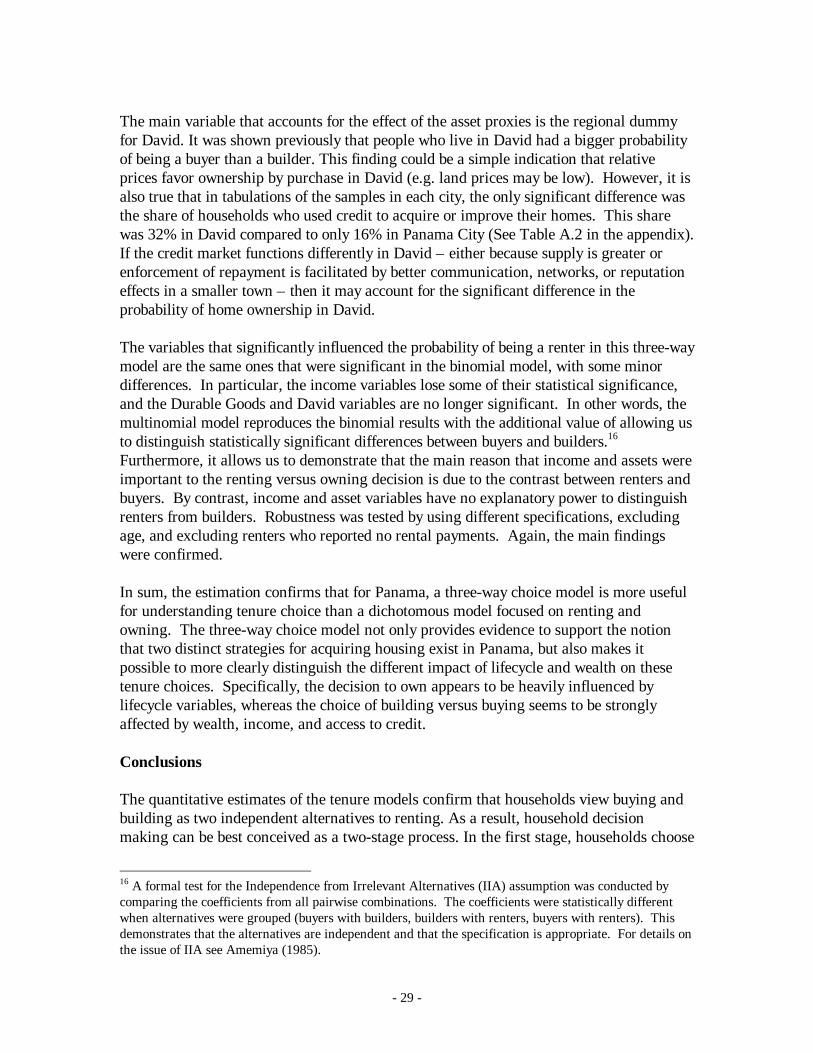
The relative magnitudes of the lifecycle and income effects can be seen in Figures 1 and 2.The effects of changing the household head’s age and income were simulated for thesample, and the resulting changes in the magnitudes of the probabilities were calculated.In Figure 1, changes in the household head’s age can be seen to have a more significantimpact on the probability of renting than changes in income. By contrast, Figure 2 showsthat the impact of age on the probability of buying versus building is smaller andsignificantly less than the impact of income. The actual estimates can be seen in Table A.3in the appendix.
- 28 -
Figure 1
Ratio of Probability of Renting to Owningby Age and Income
0%
10%
20%
30%
40%
IncomeAge 33
16040
31847
47654
63461
Income
Age
Figure 2
Ratio of Probability of Buying to Buildingby Age and Income
0%
10%
20%
30%
40%
IncomeAge 33
16040
31847
47654
63461
Income
Age
- 29 -
The main variable that accounts for the effect of the asset proxies is the regional dummyfor David. It was shown previously that people who live in David had a bigger probabilityof being a buyer than a builder. This finding could be a simple indication that relativeprices favor ownership by purchase in David (e.g. land prices may be low). However, it isalso true that in tabulations of the samples in each city, the only significant difference wasthe share of households who used credit to acquire or improve their homes. This sharewas 32% in David compared to only 16% in Panama City (See Table A.2 in the appendix).If the credit market functions differently in David – either because supply is greater orenforcement of repayment is facilitated by better communication, networks, or reputationeffects in a smaller town – then it may account for the significant difference in theprobability of home ownership in David.
The variables that significantly influenced the probability of being a renter in this three-waymodel are the same ones that were significant in the binomial model, with some minordifferences. In particular, the income variables lose some of their statistical significance,and the Durable Goods and David variables are no longer significant. In other words, themultinomial model reproduces the binomial results with the additional value of allowing usto distinguish statistically significant differences between buyers and builders.16
Furthermore, it allows us to demonstrate that the main reason that income and assets wereimportant to the renting versus owning decision is due to the contrast between renters andbuyers. By contrast, income and asset variables have no explanatory power to distinguishrenters from builders. Robustness was tested by using different specifications, excludingage, and excluding renters who reported no rental payments. Again, the main findingswere confirmed.
In sum, the estimation confirms that for Panama, a three-way choice model is more usefulfor understanding tenure choice than a dichotomous model focused on renting andowning. The three-way choice model not only provides evidence to support the notionthat two distinct strategies for acquiring housing exist in Panama, but also makes itpossible to more clearly distinguish the different impact of lifecycle and wealth on thesetenure choices. Specifically, the decision to own appears to be heavily influenced bylifecycle variables, whereas the choice of building versus buying seems to be stronglyaffected by wealth, income, and access to credit.
Conclusions
The quantitative estimates of the tenure models confirm that households view buying andbuilding as two independent alternatives to renting. As a result, household decisionmaking can be best conceived as a two-stage process. In the first stage, households choose
16 A formal test for the Independence from Irrelevant Alternatives (IIA) assumption was conducted bycomparing the coefficients from all pairwise combinations. The coefficients were statistically differentwhen alternatives were grouped (buyers with builders, builders with renters, buyers with renters). Thisdemonstrates that the alternatives are independent and that the specification is appropriate. For details onthe issue of IIA see Amemiya (1985).
- 30 -
between renting and owning. Here, financial constraints have a limited impact and lifecycleissues primarily age and the number of children -- both of which affect the stability ofhousehold preferences and expectations -- dominate the decision.
Lifecycle factors probably affect the tenure decision in two ways. First, the existence oftransaction costs means that individuals who are not certain about how long they will beresiding in a particular location will be less likely to choose to own their home. If theymove shortly after becoming an owner, they would have to amortize those transactioncosts over a shorter period and this raises the net cost relative to renting. Consequently,younger households are likely to rent or find other, more temporary, arrangements, andonly seek to own their home when they are older and have more stable expectationsregarding their work and family life. The second factor is the way the household lifecycleaffects the demand for housing attributes that have different relative prices in the housingmarket. Households with more children generally seek larger housing. However, inPanama, the rental market is largely reserved for apartments, for which the marginal costof an additional room is high compared to the cost in separate houses. Therefore, as thefamily passes through its lifecycle, the net benefit of owning a house rises relative torenting because of this feature of housing supply.
In the second stage of the decision process, households choose between buying andbuilding. Here the key factors are financial, with income and perhaps a household’s assetsas the key variables. These factors determine whether a household has access to mortgagefinancing and this, for most households, determines whether they can get immediate accessto a complete house, or whether they will need to take the time to build a housethemselves.
More broadly, the study suggests that income is not as critical to the decision to ownprecisely because the relatively unfettered activity of the housing market gives low incomehouseholds a route to ownership that is not available in developed economies. Building isthe dominant route to ownership for all income groups but it is overwhelmingly significantfor the poor. As a result, many houses are initially occupied in severely sub-standardconditions. Nevertheless, for these substandard homes, the process of getting a housedoes not conclude when it is first acquired. Households invest in improvements, and theaggregate effect on the quality of the housing stock is significant. By implication, incountries or cities where this route to ownership is constrained (whether due totopography or policies of violent eviction), tenure decisions will be more stronglydetermined by income.
Regarding other findings, the study suggests that neither marital status nor the sex of thehousehold head has much impact on housing decisions. Marital status did show up assignificant in some analyses, but the results were not robust. Sex, on the other hand, wasconsistently insignificant throughout the study. Even when marital status was removedfrom the equations, it did not affect this result. What characterizes women headedhouseholds is that they are, in many countries including Panama, more likely to be poorand to lack access to credit. Where land markets and other factors do not exclude the very
- 31 -
poor from ownership, it seems likely that women will choose to rent and own in ways thatdiffer little from the choices made by other poor households.
Education was strongly significant in both models and the results were robust in allspecifications. In the absence of any compelling explanation for why education would havea strong direct impact on tenure decisions and housing strategies, we explored thehypothesis that its significance is linked in some fashion to income. By consideringalternative specifications, with and without education, it appears that education may berelevant in these models as a better proxy for permanent income that is more relevant tolong-term housing decisions.
Policy Implications
The findings in this paper have implications for housing policy in Panama and in otherdeveloping countries. The implications apply to policies regarding the rental market,subsidies for ownership, and land markets.
Rental Housing. The standard recommendations to avoid actions that damage the privatesupply of rental housing are not contradicted by this study. Other studies have shown thatregulations that attempt to control rents, or that prevent households from offering roomsto tenants, are likely to be damaging (World bank 1993; Gilbert 1991). In developedcountries, public housing policies have often been two-faced – encouraging homeownership among the affluent through tax breaks or infrastructure subsidies, whilesupporting low income housing through rental units, directly supplied through publichousing projects or with some form of rent support. In these countries housing marketsare truncated so that there is little or no private supply of new low-cost housing. Thefocus on rental subsidies for the poor is justified if it is evident that such policies are morecost-effective than those that could be aimed at encouraging home ownership. Bycontrast, in Latin American countries where housing markets are less truncated and bothrenters and owners come from all income levels, it is difficult to imagine good reasons forpolicies that specifically subsidize renters.
Subsidies to Owners. Traditionally public policy in Latin America public has sought toencourage home ownership among the poor through direct construction of units that aredistributed below cost to the lucky few. This has generally proven to be extremelyinefficient.17 More recently, public policies have promoted home ownership throughtargeted demand subsidies. If governments wish to subsidize ownership in some fashion,young households with two or more children are likely to benefit the most from help inmoving out of rental housing because the subsidy may make a difference in the “timing” ofthe switch from renter to owner. For older households, and those with few or no children,the effect of a subsidy is not clear given the long-term impact of the tenure decision.Indeed since the decision to rent or own does not seem to be sensitive to financialconstraints, it is perhaps less likely that the decision to own would be distorted by theoffer of a subsidy. However, further research is required to investigate the effect of the 17 See IDB 1996 for an analysis of the performance of public production of housing in Panama

- 32 -
size of a subsidy on tenure decisions. Subsidy programs that focus not so much on gettinghouseholds out of rental housing but rather on helping low income “builders” improvetheir housing conditions (particularly with respect to hooking up to water and sanitationutilities), may well shorten the period that these households spend in substandard housing.Such targeted subsidies might be an efficient way to improve welfare, particularly if theycan be designed to avoid displacing the expenditures that households would have madeotherwise.
Efficient Land Markets. Low-income households are very dependent on the buildingstrategy for becoming owners, and this route is itself very dependent on the performanceof the urban land market, particularly on the periphery of growing cities. At present, manybuilders are forced to operate covertly. Measures that make land purchases and titleregistration easier would reduce transactions cost and increase security of tenure for allincome groups, but the poor would benefit more than proportionally. Policies thatpromote more complete and competitive land markets are likely to be the most costefficient way of improving the quality of housing for low-income households. Three kindsof measures seem promising. First, investment plans for water utilities and roads can beexplicitly designed to open up new areas to occupation, helping households leapfrogblocks of land held by owners who choose not to subdivide or sell their properties.Second, lands already in public ownership can be put on the market in an orderly fashion,rather than being monopolized for public housing projects. Finally, in most countries areview of land use regulation, at both the national and local levels, would probably detecta variety of standards and enforcement mechanisms that create obstacles to the efficientdevelopment of the housing market, and which need to be overhauled.
The performance of the housing market in Panama is a powerful argument in favor ofderegulating land markets. In developed countries, the regulatory controls that truncatethe housing market by preventing the construction of substandard housing, are,presumably, justified by the public good aspects of land use and housing regulations.Moreover, the incidence of the welfare losses has traditionally been offset, at least in part,by the housing subsidies for low-income households mentioned above. By contrast, fordeveloping countries, the situation is radically different. Many authorities have argued thatin these countries, engineering, service, subdivision, and housing standards are generallyset too high.18 The current inability of city and national governments to enforce thesestandards is thus very fortunate. Enforcement would result in a more distorted, lessefficient market, which would directly harm the poor. However, the de facto policy ofunenforced regulations is no more than a clumsy second best. Policies that encouraged theorderly legal supply of unserviced but subdivided land parcels would be considerably moreefficient since they would reduce the cost of an ex-post introduction of infrastructure.Such policies would also be equitable in that improved access to legal land would giveparticular help to low-income households that have the most to fear from the insecurestatus that prevails in many countries. The substantial upgrading of the housing stock overthe past decade in Panama is testimony to the powerful effects that can result from a
18 For example, Malpezzi and Mayo 1997 examine the cost of regulation in some East Asian markets.

- 33 -
combination of secure (if not registered) land title and the benign neglect of land useregulation.
Putting together these specific policy implications, governments would do well toexplicitly focus on making life less difficult for low income “builders”. In Latin America, itis still common for ministries to define their goal as the elimination of the housing deficit –which is clearly misleading. Construction programs that produce costly units that can onlymeet a fraction of the annual demand for additional houses certainly waste resources thatcould be better used if put directly in the hands of households following the “building”strategy. If investment in urban infrastructure takes the “building” strategy into account, itwill not only accelerate access to services, but also improve its cost-effectiveness.Ironically, it may be the least costly policies that can have the most effect. Land usepolicies that force households following the “building” path to ownership to act illegallyand land-titling procedures that deny them secure tenure or collateral can be reformed atvery little cost but with the widest possible impact.

- 34 -
Appendix
Table A.1Household Characteristics by Income Group
Monthly IncomeHousehold Characteristics <300 301-600 >600
Number of Households 366 537 487Share of sample 26.4% 38.7% 35.0%Share of all urban/1 40.6% 25.8% 33.6%
Household size (persons)mean 4.0 4.4 4.8median 4.0 4.0 4.0
Age of headmean 48.6 45.7 47.6median 46.0 43.0 45.0
Households headed by women (%) 25.4 13.4 11.5
Formal employment/2 (%) 41.6 59.9 57.8
1. Based on census data. All other figures are from the sample.2. Head of household is currently employed by a private enterprise or thegovernment.
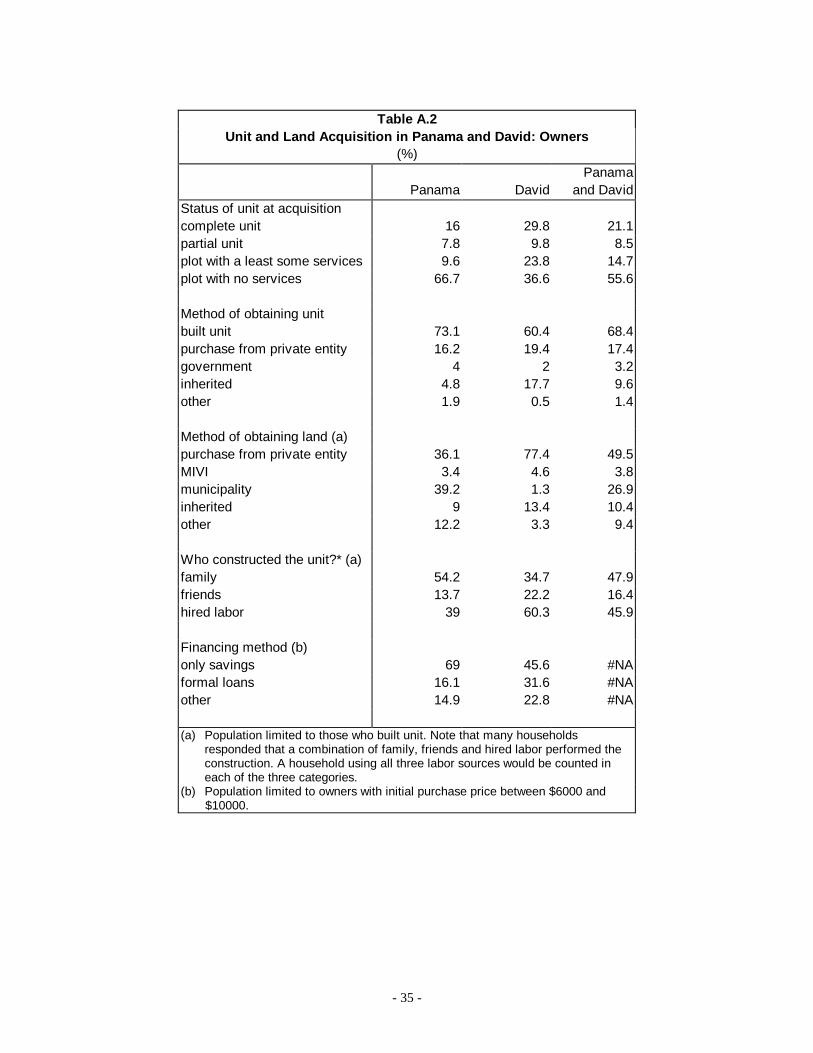
- 35 -
Table A.2Unit and Land Acquisition in Panama and David: Owners
(%)Panama
Panama David and DavidStatus of unit at acquisitioncomplete unit 16 29.8 21.1partial unit 7.8 9.8 8.5plot with a least some services 9.6 23.8 14.7plot with no services 66.7 36.6 55.6
Method of obtaining unitbuilt unit 73.1 60.4 68.4purchase from private entity 16.2 19.4 17.4government 4 2 3.2inherited 4.8 17.7 9.6other 1.9 0.5 1.4
Method of obtaining land (a)purchase from private entity 36.1 77.4 49.5MIVI 3.4 4.6 3.8municipality 39.2 1.3 26.9inherited 9 13.4 10.4other 12.2 3.3 9.4
Who constructed the unit?* (a)family 54.2 34.7 47.9friends 13.7 22.2 16.4hired labor 39 60.3 45.9
Financing method (b)only savings 69 45.6 #NAformal loans 16.1 31.6 #NAother 14.9 22.8 #NA
(a) Population limited to those who built unit. Note that many householdsresponded that a combination of family, friends and hired labor performed theconstruction. A household using all three labor sources would be counted ineach of the three categories.
(b) Population limited to owners with initial purchase price between $6000 and $10000.
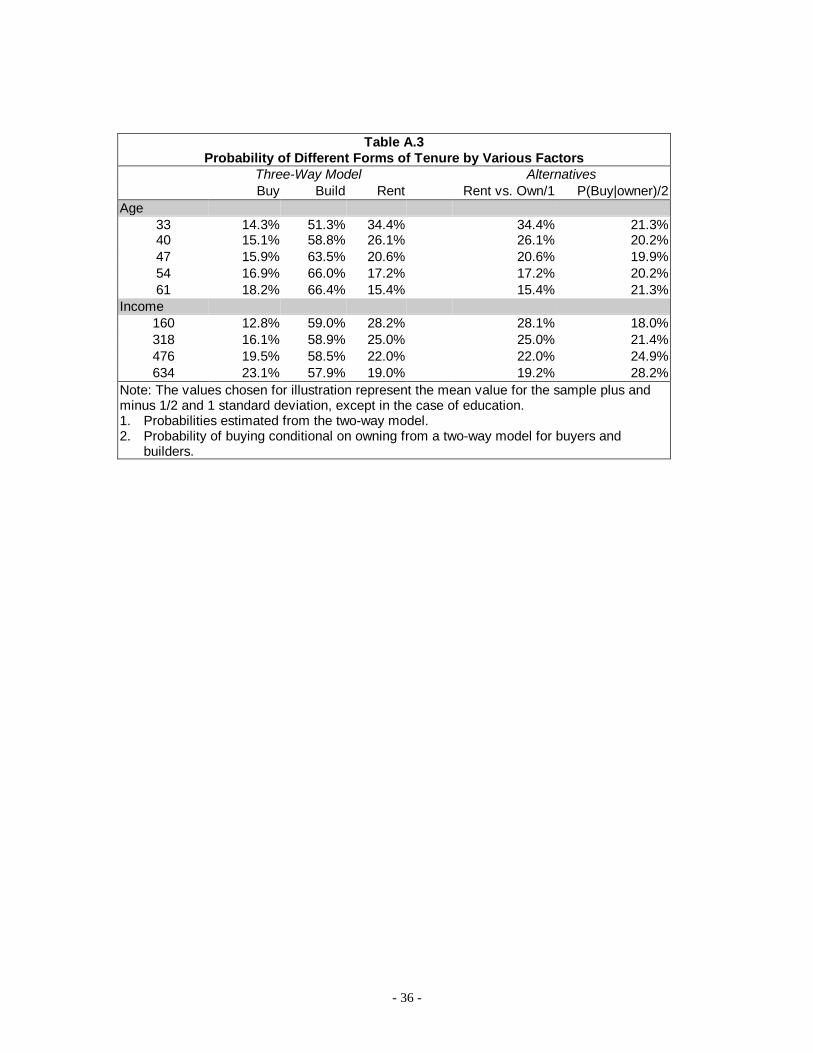
- 36 -
Table A.3Probability of Different Forms of Tenure by Various Factors
Three-Way Model AlternativesBuy Build Rent Rent vs. Own/1 P(Buy|owner)/2
Age33 14.3% 51.3% 34.4% 34.4% 21.3%40 15.1% 58.8% 26.1% 26.1% 20.2%47 15.9% 63.5% 20.6% 20.6% 19.9%54 16.9% 66.0% 17.2% 17.2% 20.2%61 18.2% 66.4% 15.4% 15.4% 21.3%
Income160 12.8% 59.0% 28.2% 28.1% 18.0%318 16.1% 58.9% 25.0% 25.0% 21.4%476 19.5% 58.5% 22.0% 22.0% 24.9%634 23.1% 57.9% 19.0% 19.2% 28.2%
Note: The values chosen for illustration represent the mean value for the sample plus andminus 1/2 and 1 standard deviation, except in the case of education.1. Probabilities estimated from the two-way model.2. Probability of buying conditional on owning from a two-way model for buyers and
builders.
- 37 -
References
Amemiya, Takeshi. Advanced Econometrics. Harvard University Press, Cambridge, MA,1985.
Arimah, Ben C. “The Determinants of Housing Tenure Choice in Ibadan, Nigeria.”Urban Studies, Vol. 34, No. 1, 1997, pp. 105-124.
Buckley, Robert M. “Housing Finance in Developing Countries: The Role of CredibleContracts.” Economic Development and Cultural Change, 1994, pp. 317-322.
Cooperstein, Richard L. “Quantifying the Decision to become a First Time Home Buyer”Urban Studies, Vol 26, 1989, pp223-233.
Struyk, R. and Marshall S. “The Determinants of Household Homeownership”. UrbanStudies, 1974.
Daniere, Aurita G. “Determinants of tenure choice in the third world, an empirical study ofCairo and Manila”. Journal of Housing Economics, Vol.2, 1992, pp. 159-184
Daniere, Aurita G. “Estimating willingness-to-pay for housing attributes An application toCairo and Manila.” Regional Science and Urban Economics, Vol.24, 1994, pp. 577-599.
Eckstein, S. “Urbanization Revisited: Inner-City Slum of Hope and Squatter Settlement ofDespair.” World Development, Vol. 18, No. 2, 1990, pp. 165-181.
Freidman, J., E. Jimenez,; Mayo, S. “The Demand for Tenure Security in DevelopingCountries.” Journal of Development Economics, Vol. 29, 1988, pp. 185-198.
Follian, James R.; Jimenez, Emmanuel. “The Demand for Housing Characteristics inDeveloping Countries.” Urban Studies, Vol. 22, 1985, pp. 421-432.
Gilbert, Alan. “Renting and the Transition to Owner Occupation in Latin AmericanCities.” Habitat International, Vol. 15, No. 1/2, 1991, pp. 87-99.
Gilbert, Alan, “The Costs and Benefits of Illegality and Irregularity in the Supply ofLand” in Paul Baross and Jan van der Linden (Ed) The Transformation of Land SupplySystems in Third World Cities, Avebury 1990.
Henderson, J. V.; Ioannides, Y. M. “A Model of Housing Tenure Choice.” The AmericanEconomic Review, Vol. 73, No. 7, March 1983, pp. 98-113.
Hoy, Michael.; Jimenez, Emmanuel. “Squatters’ Rights and Urban Development: AnEconomic Perspective.” Economica, Vol. 58, 1991, pp. 79-92.
- 38 -
Inter-American Development Bank. Facing Up to Inequality in Latin America. JohnsHopkinss University Press, 1998 .
Inter-American Development Bank, “Panama Housing Program”, Project Report PR1532, 1996.
Jimenez, Emmanuel; Keare, Douglas H. “Housing Consumption and Permanent Income inDeveloping Countries: Estimates from Panel Data in El Salvador.” Journal of UrbanEconomics, Vol. 15, 1984, pp. 172-194.
Klak, Thomas; Holtclaw, Michael. “The Housing, Geography, and Mobility of LatinAmerican Urban Poor: The Prevailing Model and the Case of Quito, Ecuador.” Growthand Change, Vol.24, Spring 1993, pp. 247-276.
Malpezzi, Stephen and Stephen K. Mayo. “User Cost and Housing Tenure in DevelopingCountries.” Journal of Development Economics, Vol. 25, 1987, pp.197-220.
Malpezzi, Stephen, Stephen K. Mayo with David J. Gross. “Housing Demand inDeveloping Countries.” Staff Working Paper, No 733, The World Bank, Washington, DC,1985.
Malpezzi, Stephen, Stephen K. Mayo “Getting Housing Incentives Right: A Case Study ofthe Effects of Regulation, Taxes, and Subsidies on Housing Supply in Malasia” LandEconomics, Vol 73, 1997, Pp 372 – 91.
Miraftab, Faranak. “Revisiting Informal Sector Homeownership: The Relevance ofHousehold Composition for Housing Options of the Poor.” Mimeo, 1996.
Rakodi, Carole. “Rental Tenure in the Cities of Developing Countries.” Urban Studies,Vol. 32, No. 4-5, 1995, pp. 791-811.
Lindert Paul Van.; Westen August Van. “Household Shelter Strategies in ComparativePerspective: Evidence from Low Income Groups in Bamako and La Paz.” WorldDevelopment, Vol. 19, No. 8, 1991, pp. 1007-1028.
U.N. Centre for Human Settlements and The World Bank, 1992. The Housing IndicatorsProgram, Vol. I-IV. Item 5 of the Provisional Agenda, Global Strategy for Shelter to theYear 2000.
World Bank. Housing: Enabling Markets to Work. A World Bank Policy Paper.Washington, DC, 1993.