GRAD: Cost-Benefit Analysis of the Honey Value Chain in Ethiopia
35
1 COST-BENEFIT ANALYSIS OF THE HONEY VALUE CHAIN IN ETHIOPIA GRADUATION WITH RESILIENCE TO ACHIEVE SUSTAINABLE DEVELOPMENT - GRAD PROJECT FINAL REPORT This report was produced for review by the United States Agency for International Development (USAID). It was prepared by Optimal Solutions Group, LLC and Cambridge Resources International for USAID’s “Learning, Evaluation, and Analysis Project (LEAP). Contract Number: AID-OAA-C-11-00169
Transcript of GRAD: Cost-Benefit Analysis of the Honey Value Chain in Ethiopia
1
COST-BENEFIT ANALYSIS OF THE HONEY
VALUE CHAIN IN ETHIOPIA
GRADUATION WITH RESILIENCE TO ACHIEVE SUSTAINABLE DEVELOPMENT - GRAD PROJECT
FINAL REPORT
This report was produced for review by the United States Agency for International Development (USAID) It was prepared by Optimal Solutions Group LLC and Cambridge Resources International for USAIDrsquos ldquoLearning Evaluation and Analysis Project (LEAP) Contract Number AID-OAA-C-11-00169
Cost Benefit Analysis of the GRAD Honey Value Chain November 2012
UNITED STATES AGENCY FOR INTERNATIONAL DEVELOPMENT
LEARNING EVALUATION AND ANALYSIS PROJECT
(AID-OAA-C-11-00169)
COST-BENEFIT ANALYSIS OF THE GRAD HONEY VALUE CHAIN
FINAL REPORT
Prepared for
US Agency for International DevelopmentEthiopia Attn USAID
Prepared by
Optimal Solutions Group LLC University of Maryland Research Park M Square 5825 University Research Court Suite 2800 College Park MD 20740 USA wwwOptimalSolutionsGroupcom
Cambridge Resources International Inc 60 Montgomery Street Cambridge MA 02141 USA wwwcri-worldcom
Project Analysts Richard Barichello Senior Cost-Benefit Analyst Mikhail Miklyaev Cost-Benefit Analyst Kate Pankowska Cost-Benefit Analyst Glenn P Jenkins Cost-Benefit Manager
November 2012
Disclaimer The authorsrsquo views expressed in this publication do not necessarily reflect the views of the United States Agency for International Development or the United States government
2
Cost Benefit Analysis of the GRAD Honey Value Chain November 2012
Table of Contents
ACRONYMS 5
EXECUTIVE SUMMARY 6
THE GRAD HONEY VALUE CHAIN COST-BENEFIT ANALYSIS 10
METHODOLOGY 10 Project Background 10 Commodity Background 12
Honey Production in Ethiopia 12 Current Market Situation in the Ethiopian Honey Sector 12
Project Description and Activities 13 GRAD Project Interventions in the Honey Value Chain 13 Assumptions for the Selected GRAD Interventions in the Honey Value Chainhelliphelliphelliphelliphelliphellip15
PROJECT MODELING 16
FINDINGS 17 Financial Analysis 17 Comparison of Interventions A and B23 Economic Analysis 23
STAKEHOLDER AND BENEFICIARY ANALYSIS 25
SENSITIVITY ANALYSIS 28
The Joint Impact of Honey Price and Yield of the FNPV for Intervention A 29
RECOMMENDATIONS 31
REFERENCES 32
APPENDIX 34
3
ACKNOWLEDGMENTS
The LEAP team appreciates the assistance received from many people during its field visits to Tigray and Amhara in July 2012 including the representatives of USAID ACDIVOCA CARE SNV Holeta and Andasa Research Centers Zembaba Union of Cooperatives Ethiopian Apiculture Board and the owners of agribusiness enterprises in the honey sector Beza Mar Comel Dimma Tsedey-Mar and Rahi Honey Agro Industry Special thanks are also directed to many small-scale farmers and local traders unknown by name who were interviewed so the team could obtain a clear picture of the situation in the Ethiopian honey sector Their assistance is greatly appreciated This report has benefited from the comments and suggestions of the reviewers of the previous draft report
Cost Benefit Analysis of the GRAD Honey Value Chain November 2012 4
Cost Benefit Analysis of the GRAD Honey Value Chain November 2012
ACRONYMS
AGP Agriculture Growth Program CARE Implementing Organization CBA Cost Benefit Analysis CF Conversion Factor CRS Catholic Relief Services CSA Central Statistical Agency of Ethiopia ENPV Economic Net Present Value ETB Ethiopian Birr (Currency) FEP Foreign Exchange Premium FNPV Financial Net Present Value FtF Feed the Future (Program) GDP Gross Domestic Product GRAD Graduation With Resilience to Achieve
Sustainable Development (Project) Ha Hectare kg Kilogram MFI Microfinance Institutions NPV Net Present Value ORDA Organization for Rehabilitation and
Development in Amhara PSNP Productive Safety Net Program Plus REST Relief Society of Tigray RUSACCO Rural Saving and Credit Cooperatives SADSCR Semiannual Debt Service Coverage Ratio SNV Netherlands Development Agency US$ United States Dollar USAID United States Agency for International
Development
5
EXECUTIVE SUMMARY
Project Description USAIDEthiopia started to implement the Graduation With Resilience to Achieve Sustainable Development (GRAD) project in 2012 The main purpose of the GRAD project is to graduate 50000 chronically food-insecure Ethiopian households (out of the 65000 targeted) by facilitating an increase in their yearly income by US$365householdyear The main objectives that the project aims to achieve are
1 to enhance livelihood options of chronically food-insecure households in Highlands areas 2 to improve household and community resilience and 3 to strengthen an enabling environment to promote scale-up and sustainability
A special emphasis of this project is the inclusion of women and the creation of non-gender-biased income opportunities improved cooperation between stakeholders and the creation of accountability for the beneficiaries of the project
To facilitate the proper implementation of the project and the flow of necessary financial resources for the targeted households USAID established a US$2-million loan-credit guarantee fund that will be available to lending institutions microfinance institutions (MFI) and rural savings and credit cooperatives (RUSACCO) so these institutions can supply the necessary loans to the targeted households for undertaking the GRAD interventions
The implementers of the GRAD project include CARE the Relief Society of Tigray (REST) the Organization for Rehabilitation and Development in Amhara (ORDA) Catholic Relief Services (CRS) and the Netherlands Development Agency (SNV)
The GRAD project proposes interventions in four commodity value chains honey meat vegetables and pulses The investment plan for GRAD households designed by SNV Ethiopia proposes fattening interventions for small ruminants as well as for cattle in the meat value chain but the analysis for the meat value chain has been carried out for the shoats-fattening intervention only These value chainsmdashhoney meat vegetables and pulsesmdashwere chosen because of their suitability for chronically food-insecure households and the rather low initial investment costs necessary for their implementation1
Strategic Context and Rationale The GRAD project is a part of USAIDrsquos wider Feed the Future (FtF) agenda which prioritizes investments in agriculture and nutrition The project particularly aims to facilitate improvements in the commodity value chains to make them more inclusive and efficient for chronically food-insecure households
Promotion of these inclusive commodity value chains will facilitate market access for these households which in turn will increase their yearly income decrease their current food insecurity and allow them to profit from newly established or improved market linkages
The GRAD project proposes two intervention packages in the honey value chain Intervention A will introduce three modern beehives with tools and appropriate training regarding modern honey-production methods starting in year 1 Intervention B will initially introduce two transitional beehives and one modern beehive with tools and training but by the beginning of the year 3 participants will transition to the use of modern beehives only
1 Suitability is defined in terms of the ease in implementation Preferably a number of the food-insecure households already have experience producing some of these commodities
Cost Benefit Analysis of the GRAD Honey Value Chain November 2012 6
Cost Benefit Analysis of the GRAD Honey Value Chain November 2012
Description of the Interventions Regardless of which of the two interventions proposed for the honey value chain are selected each of the chronically food-insecure households targeted in this project will receive an investment loan for the initial purchase of beehives and necessary tools Intervention A includes the initial purchase of three modern beehives and necessary tools at year 1 of the project The amount of the loan required for the investment is above the amount that MFIs of Ethiopia are willing to provide for new clients It has been assumed that targeted households will contribute 28 percent equity capital of the total investment required hence reducing the required borrowing The household will repay this loan on a per-round basis (1 round = 6 months) with the first round being a grace period
Intervention B proposes the initial purchase of one modern beehive and two transitional beehives and necessary tools in year 1 of the project The transitional beehives will be replaced with two modern beehives at the end of year 2 of the project Two Intervention-B scenarios were analyzed Under the first scenario the households again have been assumed to contribute 28 percent of the required investment from the equity capital the second scenario was designed by eliminating 28 percent of the equity contribution from Intervention B The required funds for the replacement of transitional beehives under both scenarios will be obtained through an additional loan taken by the households from the MFIs after repayment of the initial loan In the following text the first scenario of intervention B is referred to as Intervention B and the second scenario is referred to as Intervention C
Financial and Economic Analysis Results The appraisal has been carried out over an 11-year period The analysis shows that at a financial discount rate of 12 percent each householdrsquos financial net present value (FNPV) for Intervention A is US$90640 The FNPV of Intervention B is US$79666 while the FNPV of Intervention C is US$79002 The economic net present value (ENPV) for Intervention A is US$113092 while it is US$100774 for Interventions B and C
In summary the FNPVs and ENPVs are positive for all proposed interventions with Intervention A showing a higher FNPV and ENPV
Table A SADSCRround for household for the interventions Intervention A Year 1 round 1 Year 1 round 2 Year 2 round 1 Year 2 round 2 SADSCR - 093 100 171 Intervention B Year 1 round 1 Year 1 round 2 Year 2 round 1 Year 2 round 2 SADSCR (first loan) - 093 093 141 SADSCR (second loan) 126 174 271 Intervention C Year 1 round 1 Year 1 round 2 Year 2 round 1 Year 2 round 2 SADSCR (first loan) 068 052 058 SADSCR (second loan) 127 175 272
Table A describes the semiannual debt service coverage ratios (SADSCRs) The debt service obligations are defined here to be the interest and principal that are due in a given period plus the debt service from the previous period that could not be paid due to inadequate net cash flow The opportunity cost of labor will be retained within the family and therefore can be treated as part of the cash flow available for debt servicing
In the case of Intervention A the households will face difficulty repaying their debt obligation only during the first repayment period The debt service of the second repayment period together with the unpaid debt service from the previous period will be repaid in round 1 of year 2
7
Cost Benefit Analysis of the GRAD Honey Value Chain November 2012
In the case of Intervention B when repayments are due in the first two rounds the SADSCRs are below one If these farmers are going to be expected to repay the loan this quickly they will have to draw on other sources of cash 2 In round 2 of year 2 the SADSCR reaches a value above 1 indicating that the financial situation of the households will stabilize and the initial loan will be repaid After that round the household will be able to get a new loan required for the complete transition toward modern beehives
The SADSCRs of Intervention C are below a value of 1 in all rounds indicating that households will not be able to repay their debt obligations without the contribution of financial resources generated by other activities The second loan however will be provided only for the households that will repay the previous loan hence households will have to draw on other resources of cash to repay the initial loan
The eventual necessity to contribute additional financial resources in Intervention C erases principal difference (no equity contribution) between Interventions B and C Intervention B will require households to initially invest 28 percent equity capital while Intervention C will split almost the same amount over two repayment rounds The present value of the equity contribution for Intervention B is ETB 120820 (US$6904) while the present value of the amount under Intervention C is ETB 109668 (US$6267) with ETB 67598 (US$3863) in the second round of year 1 and ETB 42070 (US$2404) in the first round of year 2
Beneficiary Analysis Results The results of the analysis reveal that the income of the targeted households will increase This annual increase in the income of the households under each intervention is presented in table B below
Table B Annual increase in the income of the households including opportunity cost of family labor (in US$) Year Intervention A Intervention B Intervention C
2012 ndash15244 ndash11927 ndash8886 2013 5372 3492 ndash3192 2014 27694 20650 20733 2015 27694 18620 18657
2016ndash2022 27694 27694 27694
The net income decrease in the first years of the interventions will occur because of the equity contribution The annual increase in income presented in table B includes the opportunity cost of family labor spent on the beekeeping activities Each householdrsquos net income over the 11-year evaluation period will be US$121304 for Intervention A US$110868 for Intervention B and US$108033 for Intervention C The other beneficiary of the intervention will be the Ethiopian government for the following reasons
The government will benefit directly from the taxes collected on the inputs and outputs of the intervention Plastic containers honey extractors sugar and so forth are importable to Ethiopia The total tax rate applied to these inputs is higher than the foreign exchange premium The inflow of taxes will reduce the economic cost below its financial cost and generate tax revenue for the government of Ethiopia
Modern beehives and smokers are produced domestically so they are assumed to be internationally nontradable goods The inputs used to produce beehives and smokers such as stainless steel nails and covers are exportable to Ethiopia Again the total tax rate applied
2 Other sources of cash refer to financial resources generated by the householdsrsquo activities except beekeeping activities
8
to these inputs is higher than the foreign exchange premium thus generating tax revenue for the government of Ethiopia
The government will also benefit indirectly because honey is exported from Ethiopia Exports allow the country to earn foreign exchange
The total amount of government benefits from the intervention over the 11-year period per household is estimated at US$22928 for Intervention A and US$21027 for Interventions B and C
Conclusions and Recommendations Expected returns on the modern beekeeping activities are dependent on the full list of inputs required for the proper implementation so none of the tools can be eliminated from the required investment A missing input such as a honey extractor will directly result in decreased quality or yield of honey Absence of other inputs such as gloves or overall coats may put the health of the beekeepers at risk because of the aggressiveness of Ethiopian bees Taking into consideration the financial situation of the GRAD beneficiaries it will be appropriate to share the most expensive inputs of production such as a honey extractor between groups of farmers
The loan amount from MFIs for new clients in 2012 is limited to ETB 4000 (US$22857) which is less than the required investment for all three interventions GRAD beneficiaries consist primarily of chronically food-insecure households The necessity of the equity contribution may limit the beneficiaries of the honey interventions to better-off groups of farmers It is suggested that the interventions be redesigned to allow farmers access to sufficient financial resources to start modern beekeeping activities without equity contribution If such loan amounts can be negotiated with MFIs by the implementers of the GRAD project the term of the loan should also be expanded to 3 years
In the case of Intervention B the total initial investment cost is ETB 4315 This amount is only slightly above the amount of ETB 4000 usually provided by MFIs hence reducing the requirements for an equity contribution Intervention B however has been analyzed assuming an equity contribution of 28 percent the analysis reveals that the households will be able to repay the loan although they should be allowed to move small fractions of the debt service to the next repayment period if necessary The repayment of the loan in turn will give them access to the next loan
In the case of Intervention C the total initial investment cost is also ETB 4315 Intervention C has been analyzed without assuming an equity contribution of 28 percent The increased debt service will not allow the households to repay their loan obligations without contributing additional financial resources If the first loan will not be repaid the households will not have access to the next loan required for the purchase of two modern beehives at the end of the intervention year 2
All three interventions require household equity contribution for successful implementation If this requirement can be erased Intervention A is recommended over Interventions B and C because its benefits outweigh its costs and indicate the likely success of this project Even though analyses of Interventions B and C also yield positive FNPV and ENPV values these NPVs are lower than those obtained in the analysis of Intervention A
There is no principal difference between Interventions B and C other than the distribution of the equity contribution over time The minimum equity contribution for Intervention B that will allow the households to repay the loan is 2463 percent
If money from the loan-guarantee fund will be used to cover the unpaid fractions of the loan in Intervention C thus allowing the households access to the loan required for the complete transition toward modern beehives the FNPV of the intervention will be US$87650 which is still below the FNPV of Intervention A The increase in the FNPV in this case is just a financial subsidy from USAID to the targeted households
Cost Benefit Analysis of the GRAD Honey Value Chain November 2012 9
THE GRAD HONEY VALUE CHAIN COST-BENEFIT ANALYSIS
METHODOLOGY
Project Background
Ethiopiarsquos economy is highly dependent on its agricultural production with agriculture accounting for about 46 percent of the countryrsquos gross domestic product (GDP) About 80 percent of Ethiopiarsquos total population lives in the rural areas and agricultural activities generate about 85 percent of the total employment in Ethiopia (USAID AGP-LGPPRIME Summary Proposal 2011)
USAIDEthiopia is one of the major donors providing support for the goal of making Ethiopiarsquos households more food self-sufficient It supports various initiatives related to increasing access to food for Ethiopiarsquos food-insecure households and emergency assistance USAIDrsquos working agenda in Ethiopia involves promoting increased agricultural productivity and developing viable commodity value chains that in turn will increase the level of food security and reduce the negative impacts of famine
Ethiopia is ranked among the top five fastest-growing countries in the world with real GDP growth reaching 75 percent in 2011 (The World Factbook CIA) Despite its currently impressive economic growth rate Ethiopia has not been able to achieve a level of agricultural production that leads to food self-sufficiency It still is home to about 8 million people who remain chronically food insecure with the vast majority of them living in the rural areas About 60 percent of rural households experience food shortages between June and October each year (USAID AGP-LGPPRIME Summary Proposal 2011)
For these reasons the GRAD project concentrates on improving the value chains for several commodities The project addresses the need to develop profitable and functional value chains that include chronically food-insecure households to provide them with opportunities to profit from improved or newly established market linkages
The majority of Ethiopian households in the rural areas cultivate low-value cash crops and live with poor access to commodity markets and financial services They often lack proper market information or are not able to benefit from available market linkages Food-security improvements are likely to come from their inclusion in the commodity value chain cycle
The GRAD project plans to first target 65000 households of which 58500 are chronically food insecure and 6500 are labeled as ldquoUltra Poorrdquo 3 A secondary target group involves 10000 households that can be categorized as food-sufficient households (6000) or food-secure households (4000) This second targeted group is intended to act as a role model for the first GRAD group of households Of the 65000 targeted households the 5-year-long GRAD project aims to graduate 50000 households
Specifically the GRAD project aims to achieve the following goals
1 Enhance the livelihood options of chronically food-insecure households in Highlands areas 2 Improve household and community resilience 3 Strengthen the enabling environment to promote scale-up and sustainability
3 ldquoUltra Poorrdquo households include female-headed households and landless youth
Cost Benefit Analysis of the GRAD Honey Value Chain November 2012 10
To ensure future success in the implementation of the GRAD project USAIDEthiopia plans to cooperate with several implementing agencies that are well-known experts in the areas of food security and commodity value chain development These technical partnersmdashCARE the Relief Society of Tigray (REST) the Organization for Rehabilitation and Development in Amhara (ORDA) Catholic Relief Services (CRS) and the Netherlands Development Agency (SNV)mdash possess the required expertise and hands-on experience from implementing similar projects in Ethiopia and elsewhere
The chronically food-insecure families who are the subjects of the GRAD project are located in 16 woredas in four regions of Ethiopia SNNPR Tigray Amhara and Oromia4 The selection of these woredas was based on their proximity to the Agriculture Growth Program (AGP) and active markets that will facilitate opportunities for engaging in local based commodity trading
The market linkages established during the lifetime of this project will connect chronically food-insecure households with locally based traders and facilitate the sales of commodities for income generation by this targeted group of households
In addition the GRAD project aims to correct the shortcomings experienced in the Productive Safety Net Program Plus (PSNP) project by facilitating an increase in the yearly income of chronically food-insecure households The objective of the chosen interventions is to increase each householdrsquos yearly income by US$365 (or US$1day) by the end of the project It is possible that this objective will not be met if such households engage in just one additional commodity value chain In such cases a combination of commodity value chains will be suggested to achieve the desired increase in the householdsrsquo income level
The GRAD project will emphasize gender equality and the inclusion of women via cooperation between stakeholders and a widely understood accountability to beneficiaries
USAID will facilitate the implementation of this project by establishing a credit-guarantee fund of US$2 million This guaranteed fund will enable the flow of credit resources necessary for the chronically food-insecure households to engage in the commodity production The distribution of financial resources will be handled by microlending institutions MFIs and RUSACCO One additional benefit of this credit guarantee will be to spread the financial risk between the implementing agency and the financial organizations that are responsible for lending to the targeted households
Four commodity value chains are being proposed for the GRAD project honey pulses vegetables and meat The choice of these value chains is based on their simplicity in terms of the necessary knowledge required for their introduction and the rather low initial start-up costs needed to engage in their production The value chains of these commodities show a good potential for postgraduation production increases and marketing Demand for all these commodities is growing in the domestic market (Ethiopian) and export markets
The list of the key FtF indicators proposed for monitoring and evaluating the GRAD projectrsquos performance is presented in table A in the appendix
4 As per the CARE proposal
Cost Benefit Analysis of the GRAD Honey Value Chain November 2012 11
Commodity Background
Honey Production in Ethiopia
Ethiopia has a long tradition of honey production reaching back many centuriesmdashin fact the longest tradition of honey and beeswax marketing in Africa Despite this long tradition honey production in Ethiopia is still treated as a supplemental on-farm activity that is usually combined with crop cultivation and animal husbandry A vast majority of the honey produced in Ethiopia comes from traditional beehives which currently are the most common form of technology used for honey production in Ethiopia As of 2011 Ethiopia possessed about 49 million traditional beehives which constitutes about 9557 percent of the total number of beehives in Ethiopia Currently only about 81500 transitional beehives (commonly called Kenya top bar hives) and 140000 modern beehives exist (CSA Agricultural Survey Report 2012) The total quantity of honey produced in Ethiopia in 2010ndash11 was about 399 million kilograms (kg) Almost all honey that is currently produced in Ethiopia (about 98 percent of the total yearly production) is consumed in the domestic market with only about 2 percent of the total yearly production being exported
Ethiopia has about 14ndash17 million households that are engaged in beekeeping and produce different types of honey that vary regionally as well as in terms of color consistency and purity The most in-demand honey among Ethiopians comes from Eastern Tigray where bees forage on the regionally specific Tebeb plant (Basium clandiforbium) and produce distinctive low-moisture white honey Other types of honey produced include Lalibela honey (Acacia honey) multifloral yellow honey dark brown honey and crude red honey (mainly used for the production of tej an Ethiopian drink with low alcohol content)
Current Market Situation in the Ethiopian Honey Sector
The sectorrsquos current market situation is characterized by a strong domestic demand and relatively low supply of table honey resulting in rising domestic prices for honey Producer prices differ by region and type of honey The most expensive is Eastern Tigrayrsquos white honey where the current retail price is ETB 17000kg Lower retail prices (of around ETB 60ndash9000kg) are observed for other varieties of white honey depending on the area and the honeyrsquos characteristics The retail prices for yellow honey are around ETB 50ndash6000kg while the least expensive red honey is sold at a price of around ETB 45ndash50kg5 This current market situation in the Ethiopian honey sector and producersrsquo overreliance on traditional technology are influenced by several factors
1 The use of traditional methods in the honey production The most commonly used method of honey production in Ethiopia relies on traditional beehives that are usually handmade from old logs found in the forest These beehives present low-productivity rates (around 5ndash7kgbeehiveyear) and low-quality honey that contains brood wax and other impurities The yield from transitional and modern beehives is significantly higher (8ndash15kgtransitional beehive and 15ndash20kgmodern beehive) and these improved beehives produce better-quality honey as well
2 The lack of financial resources that would allow the beekeepers to obtain modern beehives Small-scale farmers who are interested in beekeeping find it difficult to obtain the financial resources necessary to acquire transitional or modern beehives They possess few private financial resources and usually are unable to obtain the credit required to borrow capital
5 The honey retail prices were obtained during field interviews in Tigray and Amhara in July 2012
Cost Benefit Analysis of the GRAD Honey Value Chain November 2012 12
These financial barriers therefore do not allow them to switch from traditional to modern technology
3 Somewhat poor access to the tools necessary to start honey production with modern beehives Some beekeepers possess modern beehives (just boxes) yet do not have any of the tools required for the proper management of these beehives (eg smoker queen excluder honey extractor etc) This situation results in the production of honey within modern-style beehives but with yields and quality comparable to that of honey coming from traditional beehives
4 Lack of proper training on the management of the modern-style apiary Beekeepers who try to switch to modern-style honey production usually do not have the skills necessary for the proper management of modern beehives They maintain their beehives poorly using primitive harvesting methods and inappropriate tools Due to their lack of training they do not provide additional feed (water and sugar syrup) during droughts and have little knowledge of quality requirements in the honey market
5 Other associated obstacles Other barriers include the disappearance of desirable bee forage due to crop intensification and the growing use of agrochemicals extreme weather conditions in some parts of Ethiopia (droughts) poor transportation infrastructure and the lack of knowledge about proper storage techniques (at both the farm and the local honey collectorstraders levels)
Project Description and Activities
The inclusion of the honey value chain in the GRAD project is based on several factors that positively affect this commodityrsquos economic potential and its suitability for chronically food-insecure households One of the factors contributing to the inclusion of the honey value chain is that the labor and land requirements for modern honey-production techniques are relatively low The amount of land necessary for the establishment of an apiary with three modern beehives is 0001 hectares (Ha) with labor requirements of about 107 hoursround6 These low land requirements are especially helpful in the case of food-insecure households which on average possess no more than 025 Ha of land Modern-style honey production is also able to create non-gender-biased employment and income opportunities Honey production is neither physically strenuous nor culturally assigned to men and it is a ready source of cash hence it is ideally suited for female participation Given the traditional-style beekeeping experience that some of the households targeted in the GRAD project possess the inclusion of the honey value chain in the GRAD project has a solid rational basis
GRAD Project Interventions in the Honey Value Chain
Two honey value chain interventions in this GRAD project are being proposed for implementation both with the goal of improving honey-production techniques Intervention A will introduce three modern beehives related maintenance tools and appropriate training All investments will be made starting in year 1 of the intervention in modern honey-production techniques The amount of the investment required for the Intervention A is much higher than the usual amount available for new clients of MFIs operating in Ethiopia thus necessitating household equity contribution The main targeted beneficiaries of the GRAD project are chronically food-insecure households which may not have financial resources to make the contribution The second proposed intervention would overcome this barrier
6 A round refers to a 6-month period of time
Cost Benefit Analysis of the GRAD Honey Value Chain November 2012 13
Cost Benefit Analysis of the GRAD Honey Value Chain November 2012
Intervention B will introduce two transitional beehives and one modern beehive related maintenance tools and training A progressive transition will be made toward the exclusive use of modern beehives at the beginning of year 3 The total initial investment cost of the Intervention B will be ETB 4315 which is much lower than the total investment cost of Intervention A (ETB 7205) and only slightly above ETB 40007 Two versions of Intervention B have been analyzed Under the first scenario the households have been assumed to contribute 28 percent of the required investment but this contribution will be significantly smaller than 28 percent of the investment cost of the more expensive Intervention A This scenario is referred to as Intervention B in the following text The alternate scenario will eliminate the 28 percent equity contribution required for Intervention B and is referred to as Intervention C in the following text The required funds needed for the replacement of transitional beehives under both scenarios will be obtained through an additional loan taken by the households from the MFIs after repayment of the initial loan
Table 1 below shows a detailed outline of the specific investment expenditures associated with each of the proposed interventions
Table 1 Total investment expenditures for Interventions A B and C8
Input Intervention A Intervention B and C
(year 1)
Intervention B and C
(year 3) Modern beehives (3 for A 1 for B) 3300 1100 2200 Bee colony 2100 700 Queen excluder 330 110 220 Wax (ETBkg) 405 135 270 Smoker 140 140 Overall coat 150 150 Veil 90 90 Glove 80 80 Extractor 3209 320 Wax mold 150 150 Bee forage seedling or seeds 50 50 Plastic honey container 90 90 Transitional beehives (2) 0 200 Bee colony for transitional beehives (2) 0 1000 Total10 7205 4315 2690
Assumptions for the Selected GRAD Interventions in the Honey Value Chain
1 The GRAD-targeted chronically food-insecure households that will engage in the modern-style honey production will each be provided with a microloan necessary to purchase the
9 It has been assumed that an extractor and a wax mold will be shared by a group of households due to the equipmentrsquos relatively high prices10 Total investment and operating costs (including labor and additional feed for bees) for the first year and first round of the intervention will be ETB 769653 (nominal) for Intervention A and ETB 502653 (nominal) for Intervention B
7 The total amount of loan available for the new clients of MFIs is ETB 4000 8 Total investment expenditures for Intervention A three modern beehives with tools and appropriate training starting in year 1 Total investment expenditures for Intervention B two transitional beehives plus one modern beehive with tools and training starting in year 1 with progressive transition into all modern beehives by year 3 (in ETB)
14
required inputs It has been assumed that each targeted household possesses assets that can be sold to obtain cash (eg livestock) or has personal savings that can be used to provide a down payment 11 The size of this loan will vary according to the intervention With the required 28 percent participant contribution the necessary loan for Intervention A (covering three modern beehives starting in year 1 maintenance tools and training) will be ETB 5825household In the case of Intervention B (covering two transitional beehives and one modern beehive maintenance tools training and progressive transition into all modern beehives by the end of year 2) the size of the first loan will be ETB 3495household For financing the investment needed for the transition to using all modern beehives no equity contribution will be required and the amount of the second loan will be ETB 3028household The financing of the investment in Intervention C will occur without equity contribution The ability of the households to repay the initial loan for Interventions B and C will be very critical because it will determine the availability of the next loan required for the complete transition toward modern beehives
2 Training will be provided free of charge so targeted households will not incur any costs related to training (except the opportunity cost of time they spend being trained)
3 The microloan necessary for purchasing the required inputs will be provided at a subsidized interest rate of 15 percent Additional fees associated with this loan will include a service charge (1 percent) loan insurance (1 percent) upfront savings (10 percent) and a passbook fee (ETB 15) This loan will be for a period of 2 years with a grace period of 6 months Each household will make semiannual loan repayments for a total of three repayments of the loan principal12 The upfront savings (10 percent) will be returned to the households after the loan has been repaid There will be no interest renewed on the upfront savings
4 In the case of Interventions B and C households will need to replace the transitional beehives with modern ones in year 3 It has been assumed that they will cover the costs of the second loan after repaying the initial loan It has also been assumed that a down payment will not be needed for the second loan because the required amount is far below ETB 10000 (the amount provided by MFIs to clients who repaid the first loan and have good reputations)
5 It has been assumed that in the case where a household is not able to repay the total amount of its loan principal due in a particular round this amount will be transferred to the next round together with the incurred interest rate on the total outstanding amount This procedure will be repeated until the total loan amount is repaid13
6 It has also been assumed that each household will be able to harvest honey only one time in year 1 of Intervention A B or C In subsequent years it has been assumed that harvesting will happen twice annually For Intervention A it has been assumed that the average yield from each modern beehiveharvest will be 19 kgyear14 For Intervention B the same yield has been assumed in the case of modern beehive while the average yield from each transitional beehive has been assumed to be 8 kgyear
7 The household consumption of honey for both interventions has been assumed to be 5 kghouseholdround For Interventions B and C it has also been assumed that a household will consume lower-quality honey that comes from the transitional beehives and sell the honey from the modern beehives because it will fetch a higher price and thus allow the farmer to repay the loan faster
11 This ldquoafter down paymentrdquo loan amount in both cases includes investment expenditures as well as service charge loan insurance upfront savings and passbook fee12 In the first year of each intervention only one repayment has been assumed (in round 2) 13 Loan description provided by CARE 14 Such yield will be possible to obtain because of training that will improve a householdrsquos knowledge of modern beekeeping (eg the necessity for additional feedings and bee-forage planting)
Cost Benefit Analysis of the GRAD Honey Value Chain November 2012 15
8 The necessary operating costs for both interventions in the first round will include bee-feeding costs of ETB 14175 land-rental costs of ETB 040 and labor costs of ETB 34938 It has been assumed that households will provide the necessary labor for beehive maintenance so the labor required to maintain the beehives will not represent a cash burden
9 The cost of beehive maintenance (per round) has been set at 5 percent of the initial cost of the beehive for both interventions It has been assumed that households will use locally available materials and family labor for this purpose
10 The lifespan for the modern beehive for both interventions has been assumed to be 11 years which will be equal to the lifespan of the project15 In the case of Intervention B the lifespan for the transitional beehive is 2 years because at that point they will be replaced with modern beehives It has been assumed that farmers will just replace transitional beehives with modern versions (not add two modern beehives) because of two reasons
a Households keep modern beehives in the residential area to prevent them from being stolen Such a security system puts a constraint on the quantity of bee colonies that can be held by households because of the potential danger to the families
b The cost of the bee colony is much higher than the cost of transitional beehives so moving existing bee colonies from transitional beehives to modern ones instead of obtaining new bee colonies makes economic sense
11 In this analysis the farm-gate price of yellow honey has been assumed to be ETB 45kg for modern beehives and ETB 43kg for transitional beehives16
12 For Interventions B and C it has been assumed that households will replace their transitional beehives with modern ones at the beginning of year 3 The bee colonies from the transitional beehives will be moved to the modern ones so no additional costs will be incurred to replace the bee colonies
13 It has been assumed that the initial price of a bee colony for a modern beehive will be ETB 700 while it will be ETB 500 for a transitional beehive The difference in price results because the bee colony for a transitional beehive is smaller
14 For the purpose of this analysis the following macrolevel assumptions have been made The expected average annual domestic inflation rate is 20 percent and the US inflation rate is 25 percent The financial discount rate is a real rate of 12 percent the economic discount rate is a real rate of 12 percent the foreign exchange premium (FEP) is 65 percent (Kuo 2011) and the exchange rate is US$1 = ETB 1750
PROJECT MODELING
The financial and economic feasibility of the GRAD honey interventions in this analysis has been established by constructing cash flows from the point of view of the project (total investment point of view) and the point of view of the targeted households (equity point of view) All revenues or potential revenue items have been treated as cash inflows and all expenditures or potential expenditure items have been treated as cash outflows (Jenkins Kuo and Harberger 2011) The analysis has been carried out for an 11-year period
The cash flows have been constructed in nominal and real terms and on per-round (every 6 months) as well as annual bases (for total investment point of view and equity point of view) The cash flows have also been constructed for the total investment point of view with the exclusion of domestic
15 This lifespan was confirmed during the field interviews in July 2012 16 Honey prices have been based on field interviews conducted in July 2012 in Amhara and Tigray The difference in prices has come from the assumption that honey produced in modern beehives has a bit higher quality hence the higher price
Cost Benefit Analysis of the GRAD Honey Value Chain November 2012 16
Cost Benefit Analysis of the GRAD Honey Value Chain November 2012
consumption of honey (in nominal and real terms) to reflect the actual cash available for repayment of the loans
The economy resource flow statements have been constructed by adjusting each of the line items in the cash-flow statements of the total investment point of view by the corresponding economic conversion factor (CF)17
The financial sustainability of an intervention has been analyzed by estimating the SADSCR of the project over the life of the loan used to finance the project and by calculating the FNPV of the project from the targeted householdsrsquo (equity) point of view If the ENPV of the project is positive this means the total value of the benefits of the project (to whomever they accrue) will be greater than the combined costs required to implement and operate the intervention
FINDINGS
Financial Analysis
The appraisal has been carried out for an 11-year period Based on assumptions established for the purpose of this analysis all interventions will yield positive FNPVs The FNPV has been calculated using 12 percent real financial discount rate Table 2 presents the FNPVs for each intervention
Table 2 FNPVhouseholdintervention (in US$) FNPV
Intervention A 90640 Intervention B 79666 Intervention C 79002
The interventions in the honey value chain will also substantially increase the annual income of the targeted households Stabilized additional yearly income of US$21811 will be achieved by 2014 in the case of Intervention A compared to 2016 for Interventions B and C The resulting additional yearly income is presented in table 3 below18
Table 3 Annual net cash flows resulting from the interventions (in US$) Year Intervention A Intervention B Intervention C
2012 ndash16191 ndash12303 ndash9262 2013 3436 313 ndash3940 2014 21811 14767 14850 2015 21811 12737 12774 2016ndash2022 21811 21811 21811
The negative annual net cash flows in 2012 for Interventions A and B will result from the 28 percent equity contribution needed to finance the initial investment Intervention C will have two negative net cash flows in 2012 and 2013 because farmers will not have adequate cash flows to finance their debt burden during these years Although the initial equity contribution has been removed from
17 Dividing the separately calculated economic value of a unit of an item by its financial price will yield the conversion factor 18 Net cash flow from the household perspective has been measured as its revenue less operating expenses less debt service including both debt repayments and interest expense In the early years the net cash flows will be less than the strict accounting definition of income which only subtracts interest expense During these years annual financial depreciation will be less than debt repayment and hence net cash flow will be lower than net income
17
Cost Benefit Analysis of the GRAD Honey Value Chain November 2012
Intervention C targeted households will still need to contribute financial resources from other activities to repay their debt obligation
Table 4 describes the SADSCRs These indicators are very important from a program sustainability perspective because they show each householdrsquos ability to repay the loan necessary for the financing of the initial investment in each of the interventions The debt service obligations in a given period have been defined here to be the interest and principal that will be due in a given period plus the debt service from the previous period that cannot be paid due to inadequate net cash flow
Table 4 SADSCRround for household for the interventions Intervention A Year 1 round 1 Year 1 round 2 Year 2 round 1 Year 2 round 2 SADSCR - 093 100 171 Intervention B Year 1 round 1 Year 1 round 2 Year 2 round 1 Year 2 round 2 SADSCR (first loan) - 093 093 141 SADSCR (second loan) 126 174 271 Intervention C Year 1 round 1 Year 1 round 2 Year 2 round 1 Year 2 round 2 SADSCR (first loan) 068 052 058 SADSCR (second loan) 127 175 272
In the case of Intervention A the households will face difficulty repaying their debt obligation only during the first repayment period The debt service of the second repayment period and the unpaid debt service from the previous period will be repaid in round 1 of year 2
In the case of Intervention B when repayments will be due in the first two rounds the SADSCR will be below a value of 1 If the farmers will be expected to repay the loan this quickly they will have to draw on other sources of cash In round 2 of year 2 the SADSCR will reach a value above 1 indicating that the financial situation of the households will stabilize allowing the initial loan to be repaid This indicates that households by that time will be able to access the new loan required for the investment to replace transitional beehives with modern ones
The SADSCR of Intervention C will be below a value of 1 in all rounds indicating that households will not be able to repay their debt obligations without contributing financial resources generated by other activities The second loan however will be provided only for the households that repay the previous loan hence households will have to draw on other cash resources to repay the initial loan
The eventual necessity to contribute additional financial resources to repay the loan in Intervention C negates the principal difference (no equity contribution) between Interventions B and C Intervention B will require households to initially invest 28 percent equity capital while Intervention C will split almost the same amount over two repayment rounds The present value of equity contribution for Intervention B will be ETB 120820 (US$6904) while the present value of contribution under Intervention C will be ETB 109668 (US$6267) with ETB 67598 (US$3863) in the second round of year 1 and ETB 42070 (US$2404) in the first round of year 2
The SADSCR of the second loan of Interventions B and C will be above 1 in all rounds indicating that the financial standing of the households will be good enough to repay the loan although not in a timely manner
Table 5 presents the annual scheduled debt service obligations versus the annual net cash flows including the opportunity cost of labor which reflect the actual financial resources generated by the activity in the given period and available for the loan repayment It has been assumed that actual debt repayment will be made by the households without moving additional financial resources from other (non-honey-producing) activities to repay the loan for both interventions For Interventions A
18
Cost Benefit Analysis of the GRAD Honey Value Chain November 2012
and B these values confirm the status quo outlined in the discussion above about SADSCRs Although in both cases the households cannot repay the full amount of debt service in timely manner they will be able to cover the biggest part of payment and eventually will have adequate cash flow to pay back the loan At this time they will be refunded the upfront savings (10 percent of the initial loanrsquos amount) For Intervention B repayment of the loan will open access for the new loan required to finance investment in the two new modern beehives The annual net cash flows of Intervention C will not allow the households to repay the loan so they will not get access to the second loan
Table 5 Annual debt repayment obligations versus net annual cash flows including opportunity cost of family laborroundintervention (in ETB)
Year 1 Year 2 Intervention A Round 1 Round 2 Round 1 Round 2- Annual Debt Service Obl 278495 243149 156349 - Net cash flow 257625 243942 267225
Intervention B Round 1 Round 2 Round 1 Round 2 - Annual Debt Service Obl 168906 145146 104800- Net cash flow 157720 134502 147340
Intervention C Round 1 Round 2 Round 1 Round 2 - Annual Debt Service Obl 231771 259036 254673 - Net cash flow 157720 134502 147340
Note The debt service obligations in a given period have been defined here to be the interest and principal that are due plus the debt service from the previous period that cannot be paid due to inadequate net cash flow Note For the second loan of Interventions B and C annual debt service obligations will be equal to the actual debt payments because households will have sufficient cash flow to fully cover the obligations
19
Table 6 Intervention A annual cash-flow statement equity point of view (real ETB) Line items Yearltltltlt 2012 2013 2014 2015 2016 2017 2018 2019 2020 2021 2022 PV
Receipts
‐Value of in‐house honey consumption 22500 45000 45000 45000 45000 45000 45000 45000 45000 45000 45000 276760 ‐Revenue from honey sale 234000 468000 468000 468000 468000 468000 468000 468000 468000 468000 468000 2878304
Total inflows 256500 513000 513000 513000 513000 513000 513000 513000 513000 513000 513000 3155064
Expenditures Investment costs for modern beehives Modern beehive 330000 330000
Bee colony 210000 210000
Queen excluder 33000 33000
Wax 40500 40500
Smoker 14000 14000
Overall coat 15000 15000
Veil 9000 9000
Glove 8000 8000
Extractor 32000 32000
Wax mold 15000 15000
Bee forage seedling or seed to plant around backyard 5000 5000
Plastic honey container 9000 9000
Service costs for beehives Sugar for feeding 28350 28350 28350 28350 28350 28350 28350 28350 28350 28350 28350 188534
Beehive maintenance 16500 33000 33000 33000 33000 33000 33000 33000 33000 33000 33000 202957
or cost 69875 69875 69875 69875 69875 69875 69875 69875 69875 69875 69875 464684
Rental value of land 080 080 080 080 080 080 080 080 080 080 080 532
Subsidized loan ndash295457 321563 000 000 000 000 000 000 000 000 000 ndash8347
Total outflows 539848 452868 131305 131305 131305 131305 131305 131305 131305 131305 131305 1568860
Net cash flows ndash283348 60132 381695 381695 381695 381695 381695 381695 381695 381695 381695 1586204
Net cash flows real US$ ndash16191 3436 21811 21811 21811 21811 21811 21811 21811 21811 21811 90640
NPV 12 discount rate ETB 1586204 NPV 12 discount rate US$ 90640
20
Table 7 Intervention B annual cash-flow statement equity point of view (real ETB) Line items Yearltltltlt 2012 2013 2014 2015 2016 2017 2018 2019 2020 2021 2022 PV
Receipts
‐Value of in‐house honey consumption 21500 43000 45000 45000 45000 45000 45000 45000 45000 45000 45000 273974 ‐Revenue from honey sale 132800 265600 468000 468000 468000 468000 468000 468000 468000 468000 468000 2596390
Total inflows 154300 308600 513000 513000 513000 513000 513000 513000 513000 513000 513000 2870364
Expenditures Investment costs Modern beehive 110000 000 220000 285383
Bee colony for modern beehive 70000 70000
Transitional beehive 20000 20000
Bee colony for transitional beehive 100000 100000
Queen excluder 11000 000 22000 28538
Wax 13500 000 27000 35024
Smoker 14000 14000
Overall coat 15000 15000
Veil 9000 9000
Glove 8000 8000
Extractor 32000 32000
Wax mold 15000 15000
Bee forage seedling or seed to plant around backyard 5000 5000
Plastic honey container 9000 9000
Service costs for beehives Sugar for feeding 28350 28350 28350 28350 28350 28350 28350 28350 28350 28350 28350 188534
Modern beehive maintenance 5500 11000 33000 33000 33000 33000 33000 33000 33000 33000 33000 172315
Transitional beehive maintenance 1000 2000 000 000 000 000 000 000 000 000 000 2786
Labor cost 69875 69875 69875 69875 69875 69875 69875 69875 69875 69875 69875 464684
Rental value of land 080 080 080 080 080 080 080 080 080 080 080 532
Subsidized loan ndash166702 191809 ndash145729 158794 000 000 000 000 000 000 000 1409
Total outflows 369603 303114 254576 290099 131305 131305 131305 131305 131305 131305 131305 1476204
Net cash flows ndash215303 5486 258424 222901 381695 381695 381695 381695 381695 381695 381695 1394160
Net cash flows real US$ ndash12303 313 14767 12737 21811 21811 21811 21811 21811 21811 21811 79666
NPV 12 discount rate ETB 1394160 NPV 12 discount rate US$ 79666
Cost Benefit Analysis of the GRAD Honey Value Chain November 2012 21
Table 8 Intervention C annual cash-flow statement equity point of view (real ETB)19
Line items Yearltltltlt 2012 2013 2014 2015 2016 2017 2018 2019 2020 2021 2022 PV
Receipts
‐Value of in‐house honey 21500 43000 45000 45000 45000 45000 45000 45000 45000 45000 45000 273974Revenue from honey ‐ sale 132800 265600 468000 468000 468000 468000 468000 468000 468000 468000 468000 2596390
Total inflows 154300 308600 513000 513000 513000 513000 513000 513000 513000 513000 513000 2870364
Expenditures Investment costs Modern beehive 110000 000 220000 285383
Bee colony for modern beehive 70000 70000
Transitional beehive 20000 20000 Bee colony for transitional 100000 100000
Queen excluder 11000 000 22000 28538
Wax 13500 000 27000 35024
Smoker 14000 14000
Overall coat 15000 15000
Veil 9000 9000
Glove 8000 8000
Extractor 32000 32000
Wax mold 15000 15000 Bee forage seedling or seed to plant around
5000 5000
Plastic honey container 9000 9000
Services costs for beehives Sugar for feeding 28350 28350 28350 28350 28350 28350 28350 28350 28350 28350 28350 188534
Modern beehive maintenance 0055 11000 33000 33000 33000 33000 33000 33000 33000 33000 33000 172315 Transitional beehive 0010 2000 000 000 000 000 000 000 000 000 000 2786
Labor cost 69875 69875 69875 69875 69875 69875 69875 69875 69875 69875 69875 464684
Rental value of land 080 080 080 080 080 080 080 080 080 080 080 532
Subsidized loan ndash219923 266240 ndash147177 158152 000 000 000 000 000 000 000 32013
Total outflows 316382 377545 253128 289457 131305 131305 131305 131305 131305 131305 131305 1487827
Net cash flows ndash162082 ndash68945 259872 223543 381695 381695 381695 381695 381695 381695 381695 1382537
Net cash flows real US$ ndash9262 ndash3940 14850 12774 21811 21811 21811 21811 21811 21811 21811 79002
NPV 12 discount rate ETB 1382537
NPV 12 discount rate US$ 79002
19 The only difference between tables 8 and 9 is the repayment of the loan (subsidized loan line) All other lines of the tables are the same
Cost Benefit Analysis of the GRAD Honey Value Chain November 2012 22
Comparison of Interventions A B and C
Even though all interventions will yield positive FNPVs with Intervention A resulting in a greater FNPV the choice between the interventions will depend on several factors
1 Intervention A will require higher initial investment expenditures than Intervention B (ETB 7205 versus ETB 4315) Within the lifespan of Intervention A greater quantities of honey will be produced earlier thus allowing for higher financial returns that will offset the costs associated with the higher initial investment Such high initial investment requirements however will require an equity contribution from the household side because current policies of MFIs in Ethiopia will allow households to borrow a maximum of ETB 4000 in the first loan If the households are able to repay they will get access to a new loan up to ETB 10000
2 The main group of GRAD beneficiaries will be the households for which the equity contribution required for Intervention A may be a constraint to participate in the program For such households Intervention B will be more attractive because of the reduced equity contribution
3 The success of the complete transition toward modern beekeeping in Interventions B and C will entirely depend on the ability of the households to get a second loan from the MFIs The MFIs will not provide an additional loan to households that fail to repay the first loan so the households will need to contribute financial resources generated by other farm activities to repay the first loan This erases the principal difference of no equity contribution between the two interventions Some households however may prefer not to contribute 28 percent of the needed equity at the beginning of the project and will instead make this contribution in two installments to cover the debt burden as in the case of Intervention C
4 In addition to the higher FNPV Intervention A will also result in GRAD householdsrsquo achieving stable additional income of US$218 by 2014 as compared to 2016 for Intervention B Total incremental earnings of Intervention A as compared to Intervention B calculated over the 4-year period of 2012ndash16 will be equal to US$14681 (See table 3) For those households that will be financially capable of making the equity contribution it will be advantageous to choose Intervention A
5 Although Interventions B and C will require a second loan to finance the complete transition toward modern beekeeping this loan will not put a significant financial burden on the households because the cash flows will be sufficient to cover the householdsrsquo debt service obligations in full For Intervention A however after the total repayment of the initial investment loan in round 2 of year 2 the household will be free of debt and can continue honey production fully benefiting from the increased income from honey sales
Economic Analysis
Differences have emerged between the financial and economic outcomes due to the fact that the financial values do not include all externalities present in the economy In this case the only externality will come from increased tax revenues either directly from the taxation of inputs or indirectly via the FEP Honey is an exportable commodity in Ethiopia The FEP for Ethiopia has been estimated to be equal to 65 percent (Kuo 2011) Hence every incremental unit of foreign exchange (dollars) earned from increased exports will have an economic value to the country of 1065 times the value of the revenues by the exporters when exchanging the foreign exchange for local currency at the market exchange rate
23
To show the true economic impact of the proposed intervention on the Ethiopian economy the economic values have been derived by adjusting the financial values by the appropriate economic conversion factors If no distortions are present in the market then the financial value of an item has been used to measure its economic value20
Table 9 reports that the ENPV obtained in the analysis will be positive for both interventions The economic opportunity cost of capital of 12 percent has been used while calculating the ENPV If they are successfully implemented both interventions will benefit the Ethiopian economy
When the two interventions are compared Intervention A will result in total higher production of honey through the full life of the project as compared to Intervention B mainly because of the larger volume of output that will be produced by Intervention A during first 2 years of the project On the cost side farmers eventually will have to purchase the same equipment and the same number of modern beehives for Intervention B as they will for Intervention A The net results have shown that Intervention A will have a greater ENPV than Intervention B will The only difference between Interventions B and C is the way the interventions will be financed This method of investment financing will just be a transfer of resources and hence will not bring any change to the economic outcomes of the interventions As a result there is no difference between Interventions B and C Intervention A will be a better choice not only for the chronically food-insecure households targeted in the GRAD project but also for the Ethiopian economy as a whole because it will be more productive and create a larger value of financial and economic net benefits
The estimated ENPVs are presented in table 9 below
Table 9 ENPVs for Interventions A and B (in US$) ENPV
Intervention A 113092 Intervention B 100774
20 The list of CFs used for the purpose of this analysis is presented in table A in the appendix
Cost Benefit Analysis of the GRAD Honey Value Chain November 2012 24
Table 10 Economic resources cash-flow statement for Intervention A (real ETB) Line items CF Yearltltltlt 2012 2013 2014 2015 2016 2017 2018 2019 2020 2021 2022 PV
Receipts ‐Value of in‐house honey consumption 109 24583 49166 49166 49166 49166 49166 49166 49166 49166 49166 49166 302382 ‐Revenue from honey sale 109 255663 511327 511327 511327 511327 511327 511327 511327 511327 511327 511327 3144775
Total Inflows 280246 560493 560493 560493 560493 560493 560493 560493 560493 560493 560493 3447157
Expenditures Investment costs Modern beehive 085 281185 281185
Bee colony 100 210000 210000
Queen excluder 085 28118 28118
Wax 106 43104 43104
Smoker 085 11898 11898
Overall coat 073 10995 10995
Veil 073 6597 6597
Glove 080 6416 6416
Extractor 082 26244 26244
Wax mold 100 15000 15000 Bee forage seedling or seed to plant around 100 5000 5000
Plastic honey container 075 6724 6724
Services costs for beehives Sugar for feeding 079 22345 22345 22345 22345 22345 22345 22345 22345 22345 22345 22345 148600
Beehive maintenance 100 16500 33000 33000 33000 33000 33000 33000 33000 33000 33000 33000 202957
Labor cost 100 69875 69875 69875 69875 69875 69875 69875 69875 69875 69875 69875 464684
Rental value of land 100 080 080 080 080 080 080 080 080 080 080 080 532
Total outflows 760082 125300 125300 125300 125300 125300 125300 125300 125300 125300 125300 1468055
Net cash flows ‐ 435193 435193 435193 435193 435193 435193 435193 435193 435193 435193 1979102
Net cash flows real US$ ‐27419 24868 24868 24868 24868 24868 24868 24868 24868 24868 24868 113092
ENPV 12 discount rate ETB 19791
ENPV 12 discount rate $US 113092
25
Table 11 Economic resources cash-flow statement for Intervention B (real ETB)21
Line items CF Yearltltltlt 2012 2013 2014 2015 2016 2017 2018 2019 2020 2021 2022 PV
Receipts ‐Value of in‐house honey consumption 109 23490 46981 49166 49166 49166 49166 49166 49166 49166 49166 49166 299339
‐ Revenue from honey sale 109 145094
290189 511327 511327 511327 511327 511327 511327 511327 511327 511327 2836761
Total inflows 168585 337170 560493 560493 560493 560493 560493 560493 560493 560493 560493 3136100
Expenditures Investment costs Modern beehive 085 93728 000 187457 243167
Bee colony for modern beehive 100 70000 70000
Transitional beehive 100 20000 20000
Bee colony for transitional beehive 100 100000 100000
Queen excluder 085 9373 000 18746 24317
Wax 106 14368 000 28736 37276
Smoker 085 11898 11898
Overall coat 073 10995 10995
Veil 073 6597 6597
Glove 080 6416 6416Extractor 082 26244 26244
Wax mold 100 15000 15000 Bee forage seedling or seed to plant around backyard 100 5000 5000
Plastic honey container 075 6724 6724
Services costs for beehives Sugar for feeding 079 22345 22345 22345 22345 22345 22345 22345 22345 22345 22345 22345 148600
Modern beehive maintenance 100 5500 11000 33000 33000 33000 33000 33000 33000 33000 33000 33000 172315
Transitional beehive maintenance 100 1000 2000 000 000 000 000 000 000 000 000 000 2786
Labor cost 100 69875 69875 69875 69875 69875 69875 69875 69875 69875 69875 69875 464684
Rental value of land 100 080 080 080 080 080 080 080 080 080 080 080 532
Total outflows 495144 105300 360238 125300 125300 125300 125300 125300 125300 125300 125300 1372551
Net cash flows ndash326559 231870 200255 435193 435193 435193 435193 435193 435193 435193 435193 1763549
Net cash flows real US$ ndash18660 13250 11443 24868 24868 24868 24868 24868 24868 24868 24868 100774
ENPV 12 discount rate ETB 17635
ENPV 12 discount rate $US 100774
21 There is no difference between Interventions B and C from the economy point of view
Cost Benefit Analysis of the GRAD Honey Value Chain November 2012 26
STAKEHOLDER AND BENEFICIARY ANALYSIS
An economic surplus in the economy is created by producing an output that has an economic value greater than the economic cost of the inputs such as capital land and labor that are used to produce the item The proposed interventions in the honey value chain will yield two groups of beneficiaries the households engaged in the interventions and the government of Ethiopia
The results of the analysis reveal that the income of the targeted households will increase Table 3 presented above has been designed by treating the opportunity cost of labor as a cash outflow The opportunity cost of labor will be retained within the family and therefore can be included in the present annual income of the targeted families Table 12 presents the annual family income profiles including the opportunity cost of labor which has been assumed to remain within the family
Table 12 Annual income of the targeted households including opportunity cost of family labor (in US$) Year Intervention A Intervention B Intervention C 2012 ndash15244 ndash11927 ndash8886 2013 5372 3492 ndash3192 2014 27694 20650 20733 2015 27694 18620 18667 2016ndash2022 27694 27694 27694
The net income decrease in the first years of the interventions will occur because of the equity contribution The annual increase in income presented in table 12 includes the opportunity cost of family labor spent on the beekeeping activities Each householdrsquos net income over the 11-year evaluation period will be US$121304 for Intervention A US$110868 for Intervention B and US$108033 for Intervention C
The other beneficiary of the intervention will be the government for the following reasons
The government will benefit directly from the taxes collected on the inputs and outputs of the intervention Plastic containers honey extractor sugar and so forth are importable to Ethiopia The total tax rate applied to these inputs is higher than the foreign exchange premium The inflow of taxes will reduce the economic cost below its financial cost and generate tax revenue for the government of Ethiopia
Modern beehives and smokers are produced domestically so they are assumed to be internationally non-tradable goods The inputs used to produce beehives and smokers such as stainless steel nails and covers are exportable to Ethiopia Again the total tax rate applied to these inputs will be higher than the FEP thus generating tax revenue for the government of Ethiopia
The government will also benefit indirectly because honey is exported from Ethiopia Exports allow the country to earn foreign exchange
The total amount of government benefits from the interventions over the 11-year period per household has been estimated to be US$22928 for Intervention A and US$21027 for Interventions B and C
The values of stakeholder gains under each of the interventions are presented in table 13 below
27
Cost Benefit Analysis of the GRAD Honey Value Chain November 2012
Table 13 Stakeholder and beneficiary impacts of the project (in US$)
Intervention A Intervention B Intervention C
Economic NPV (FNPV + externalities)
113092 100774 100774
Financial NPV (households) 90640 79666 79002 Externalities 22451 21108 21772
o Government 22928 21027 21027 o Financing
contribution ndash477 080 745
The financing contribution will be the amount of the interest and other charges paid on the three loans provided by MFIs over and above a real cost of 12 percent This figure represents a transfer of resources between the households and the MFIs USAIDEthiopia generally negotiates subsidized interest rates for households benefiting from aid programs The negative financing contribution in the case of Intervention A represents a direct subsidy to the targeted households that will be created through the submarket interest rate In the case of the GRAD project the subsidized interest rate will be 15 percent which is 5 percent below the current level of inflation in Ethiopia However the additional fees charged by the MFIs to make them willing to provide loans will more than offset the subsidy content of the interest rate paid on the loan in the case of Interventions B and C
Exact information regarding the number of households that will engage in beekeeping activities does not exist but assuming that 70 percent of the chronically food-insecure households participate (the main group of the GRAD beneficiaries)mdashthat is 70 percent of 50000 households will participate in beekeeping eventually (not necessary in year 1 of the project)mdashit is possible to calculate combined stakeholder and beneficiary impacts of the project Figures are presented in Table 14
Table 14 Combined stakeholder and beneficiary impacts of 35000 households in the project (in thousands US$)
28
Intervention A Intervention B Intervention C Economic NPV (FNPV + externalities)
3958220 3527090 3527090
Financial NPV (households) 3172400 2788310 2765070 Externalities 785785 738780 762020
o Government 802480 735945 735945 o Financing
contribution ndash16695 ndash2800 26075
SENSITIVITY ANALYSIS
A sensitivity analysis for the GRAD honey value chain intervention has been performed using the key variables that will be prone to change and likely to influence the situation of the households engaged in the project These variables include the price and yield of honey as well as their joint impact Details related to this sensitivity analysis are outlined in tables 15 16 17 and 18 below
Cost Benefit Analysis of the GRAD Honey Value Chain November 2012
The Joint Impact of Honey Price and Yield of the FNPV for Intervention A
Because prices and yields of honey are two of the most important factors that will influence the householdsrsquo income it is prudent to consider the possible impacts of changing one of their values in a sensitivity analysis The joint impact of these two variables for Intervention A is presented in table 15 below
Table 15 The joint impact of honey price and yield on the FNPV of households for Intervention A
Yield (in kg) 1200 1500 1700 1900 2100
4300 30850 51891 65918 82823 100599
4500 34924 56943 72174 90640 109417
5000 45108 69575 89659 110471 131558
6000 65477 100066 125232 150535 175839
7000 87799 131558 161079 190600 220121 Price (in ETB)
Table 15 shows the joint impact of the honey price and honey yield on the FNPV under Intervention A (three modern beehives with related tools and training) The scenario for this analysis has assumed that the price of honey will be ETB 45kg and the yield will be 19 kground (This honey price has been based on the assumption that the household will produce yellow honey which fetches lower prices in the domestic market) Under these circumstances the FNPV will be US$90640 But it is safe to assume that given the current high demand and rather low supply of honey in the domestic market the price of yellow honey will increase in the future Therefore the FNPV will likely be higher Even in the worst-case scenario if prices were to drop to ETB 43kg and the yield were to decrease from 19 kground to 12 kground the FNPV will still be positive at US$30850 which indicates very low risk of intervention failure at the household level
Table 16 The joint impact of honey price and yield on the net cash flow of households for Intervention A
Yield (in kg) 1200 1500 1700 1900 2100
4300 10188 14611 17560 20508 23457
4500 11011 15640 18725 21811 24897
5000 13068 18211 21640 25068 28497
6000 17183 23354 27468 31583 35697
7000 21297 28497 33297 38097 42897 Price (in ETB)
Table 16 presents the joint impact of honey yield and price on the net cash flow of the targeted households in 2014 and after when the loan will be repaid and cash flows will be stable Under the baseline scenario the annual net cash flow will be US$21811 If the price were ETB 7000 and the yield were 19 kg the net cash flow will reach US$38097 which is even higher than the targeted income increase of US$36500 Currently however only white honey will be able to fetch such high price levels in the domestic market The findings suggest that households in the areas where bees produce white honey will easily reach the targeted increase in income
29
Cost Benefit Analysis of the GRAD Honey Value Chain November 2012
Table 17 presents the joint impact of honey price and honey yield on the FNPV under Intervention B The FNPV in this case will be US$79666 In the worst-case scenario the FNPV will be lower under Intervention B than under Intervention A but will still be positive at US$22711 which again indicates low risk
Table 17 The joint impact of honey price and yield on the FNPV of households for Intervention B
Yield (in kg) 1200 1500 1700 1900 2100
4300 22721 43762 57790 72936 88169
4500 26636 48655 63725 79666 95644
5000 36422 61069 78781 96534 114429
6000 55995 87637 109059 130542 152025
7000 77009 114429 139493 164557 189621 Price (In ETB) Price (in ETB)
Table 18 describes the joint impact of honey price and yield on the annual net cash flow of the beneficiaries of Intervention B after 2016 when both of the loans will be repaid and cash flows will be stable The baseline scenario will yield a net annual cash flow of US$21811 If the price of white honey were to reach ETB 7000 the net increase in annual income excluding the opportunity cost of family labor will reach US$38097 holding the yield constant This figure is again higher than the targeted increase of US$36500
Table 18 The joint impact of honey price and yield on the FNPV of households for Intervention B
Yield (in kg) 1200 1500 1700 1900 2100
4300 10188 14611 17560 20508 23457
4500 11011 15640 18725 21811 24897
5000 13068 18211 21640 25068 28497
6000 17183 23354 27468 31583 35697
7000 21297 28497 33297 38097 42897 Price (in ETB)
If the nationwide production of honey continue to be limited and with the increasing popularity of good-quality honey the prices may go higher In the best-case scenario for Intervention A if prices were to reach ETB 70kg (more relevant price for white honey) and yields were to reach 21 kground the FNPV will be US$220121 In Intervention B under the same circumstances the FNPV will reach US$189621 The net annual cash flow accruing to the households at this combination of yield and price will provide an additional US$42897 per year after the loan has been paid in 2013 under Intervention A and in 2015 under Intervention B If domestic production could be substantially increased it is likely that the processing costs and perhaps the fob price for honey exports will fall allowing Ethiopian honey to become more competitive in the international market
30
RECOMMENDATIONS
Interventions A and B show a good potential for a substantial increase in income and economic impact for the households targeted by the GRAD project USAID should support their implementation They appear to have the ability to improve the livelihood and food security of the targeted households That said regardless of their potential Interventions A and B on their own may not guarantee an increase of US$365 in the householdsrsquo yearly income as hoped for in the GRAD proposal However when combined with other income-generating activities they may allow households to achieve the additional US$365year Another important benefit of these interventions is the almost nonexistent requirements for land Taking into consideration the very limited land holdings of GRAD beneficiaries and their almost complete reliance on this land as a source of income these interventions are attractive because they will allow households to earn additional income without changing their current land usage An intervention will also allow households to benefit from an additional MFI loan in year 3 after complete repayment of the initial loan for honey production for purchasing more beehives or participating in other proposed GRAD interventions such as haricot beans production Therefore it will be advisable to combine this intervention with another commodity intervention proposed in the GRAD project introducing them as a ldquopackage solutionrdquo to achieve the desired increase in householdsrsquo yearly income
It is debatable whether farmers will be able to repay a free market interest loan at 50 percent interest if they need to borrow their ldquoequityrdquo contributions Taking into consideration that the farmers will first try to repay the free market loan the risk of default on the USAID loan will be high The debt service from the two loans will be so significant that farmers may either refuse to participate in the beekeeping intervention or fail to repay the USAID-backed loan Many GRAD households have no access to free market loans as their current financial situation is such that financial institutions are unwilling to lend money to them Reducing the required amount of money necessary for a down payment might better facilitate the implementation of Intervention A ensuring that the targeted households will be able to join the project and benefit from its outcome
The analysis also reveals that Intervention B which has been designed to eliminate the equity contribution for households that will not be able to take a financial stake in the investment will eventually require the households to contribute other resources to repay their debt services This structure however may be preferred by many farmers because the equity contribution will be divided into two parts thus making it easier for them to find the required financial resources
In summary it is recommended that the burden of the initial down payment (28 percent) that is required from each targeted household to participate in the GRAD intervention in the honey value chain be lessened An ideal financing package will eliminate the down-payment requirements by increasing the size of the USAID-backed loan and increasing the length of the repayment period for Intervention A to 3 years In principal it is a good practice to require households to take a financial stake in the project by forcing them to contribute their own money yet such a system might prevent some farmers from choosing honey production as an intervention
Cost Benefit Analysis of the GRAD Honey Value Chain November 2012 31
REFERENCES
Abebe A (2009) Market Chain Analysis of Honey Production in Atsbi Wemberta District Eastern Zone of Tigray National Regional State Department of Agricultural Economics School of Graduate Studies Haramaya University
Agonafir J (2005) Strategic Intervention Plan on Honey and Beeswax Value Chains SNV Support to Business Organizations and Their Access to Market (BOAM)
Alemseged T and Yildiz N (2008) Beekeeping and Honey Production in the Tigray Region Ethiopia African Services Committee
Alemtsehay T (2011) Seasonal Availability of Common Bee Flora in Relation to Land Use and Colony Performance in Gergera Watershed Atsbi Wembwrta District Eastern Tigray Ethiopia Master Thesis Hawassa University
Anand S and Sisay G (2011) Engaging Smallholders in Value Chains Creating New Opportunities for Beekeepers in Ethiopia Programme Insights
APM Consul PLC (2008) A Study on Private Sector Linkages for Bee Product Producers in Bale Bale Regional Sustainable Management Program
Belie T (2009) Honeybee Production and Marketing Systems Constraints and Opportunities in Burie District of Amhara Region Ethiopia Department of Animal Science and Technology School of Graduate Studies Bahir Dar University
Chala K Taye T Kebede D and Tadele T (2012) Opportunities and Challenges of Honey Production in Gomma District of Jimma Zone South-West Ethiopia Journal of Agricultural Extension and Rural Development 4(4) 85ndash91
Desalegn B (2007) Assessment of the Effect of Ant (Dorylus fulvus) on Honeybee Colony (A mellifera) and Their Products in West and South-West Shewa Zones Ethiopia Ethiopian Journal of Animal Production 7(1) 12ndash26
Graduation With Resilience to Achieve Sustainable Development (GRAD) Technical Proposal July 20 2012
Jenkins G Kuo CY and Harberger A (2011) Cost-Benefit Analysis for Investment Decision Queenrsquos University August 2012 edition
Kuo CY (2011) Estimates of the Foreign Exchange Premium and the Premium for Non-Tradable Outlays for Countries in Africa John Deutsch International Department of Economics Queenrsquos University Canada
Shiferaw A Jaleta M Gebremedhin B and Hoekstra D (2010) Increasing Economic Benefit From Apiculture Through Value Chain Development Approach The Case of Alaba Special District Southern Ethiopia IPMS Ethiopia
Cost Benefit Analysis of the GRAD Honey Value Chain November 2012 32
Tadesse B and Phillips D (2007) Ensuring Small-Scale Producers in Ethiopia to Achieve Sustainable and Fair Access to Honey Markets International Development Enterprises (IDE) and Ethiopian Society for Appropriate Technology (ESAT)
Workneh A and Ranjitha P (2011) Beekeeping Subsector Challenges and Constraints in Atsbi Wemberta District of Eastern Zone Tigray Region Ethiopia Journal of Agricultural Extension and Rural Development 3(1) Z8ndashZ12
Yigzaw D Hoekstra D Berhe K Derso T and Mehari Y (2010) Smallholder Apiculture Development in Bure Ethiopia Experiences From IPMS Project Interventions IPMS Ethiopia
Yirga G Koru B Kidane D and Mebrahatu A (2012) Assessment of Beekeeping Practices in Asgede Tsimbla District Northern Ethiopia Absconding Bee Forage and Bee Pests African Journal of Agricultural Research 7(1) 1ndash5
Yirga G and Teferi M (2010) Participatory Technology and Constraints Assessment to Improve the Livelihood of Beekeepers in Tigray Region Northern Ethiopia Biology Department College of Natural and Computational Sciences Mekelle University
Cost Benefit Analysis of the GRAD Honey Value Chain November 2012 33
Cost Benefit Analysis of the GRAD Honey Value Chain November 2012
APPENDIX
Table A The FtF indicators proposed for the monitoring and evaluation of the GRAD project
Results Indicator Target
Overall objective To graduate chronically food-insecure households from food support
Graduation of chronically food-insecure households from food aid by increasing their yearly household income
50000 households that will experience an increase in yearly income of US$365 by year 5
Result 1 Enhanced livelihood options for chronically food-insecure households
45-2 Number of jobs attributed to FtF implementation (RiA) ndashdelete it
Higher is better
3191-3 and 47-4 Prevalence of households with moderate or severe hunger (RiA)
Lower is better
Result 2 Improved community and household resilience
319-16 Prevalence of underweight children under 5 years of age (R)-delete it
Lower is better
319-13 Prevalence of underweight women (R)
Lower is better
319-4 and 3191-4 Prevalence of exclusive breastfeeding of children under 6 months of age (RiA)
Lower is better
319-11 Prevalence of stunted children under 5 years of age (R)
Lower is better
452-14 Number of vulnerable households benefiting directly from USG assistance (S)
Lower is better
Result 3 Strengthened enabling environment to promote scale-up and sustainability
45 Womenrsquos Empowerment in Agriculture Index Score (R)
Higher is better
451-27 and CBLD-5 Percentage of combined key areas of organization capacity among USG direct and indirect local implementing partner levels
Higher is better
34
Cost Benefit Analysis of the GRAD Honey Value Chain November 2012
452-38 Value of new private sector investment in the agriculture sector or food chain leveraged by FtF implementation (RiA)
Higher is better
Table B List of CFs used to make adjustments in the economic analysis for both interventions
Summary of CFs Honey 109 Transportation 084 Labor 100 Modern beehive 085 Transitional beehive 100 Bee colony 100 Queen excluder 085 Wax (ETBkg) 106 Smoker 085 Overall coat 073 Veil 073 Glove 080 Extractor 082 Wax mold 100 Plastic honey container 075 Beehive maintenance 100 Rental value of land 100 Sugar 079
35

Cost Benefit Analysis of the GRAD Honey Value Chain November 2012
UNITED STATES AGENCY FOR INTERNATIONAL DEVELOPMENT
LEARNING EVALUATION AND ANALYSIS PROJECT
(AID-OAA-C-11-00169)
COST-BENEFIT ANALYSIS OF THE GRAD HONEY VALUE CHAIN
FINAL REPORT
Prepared for
US Agency for International DevelopmentEthiopia Attn USAID
Prepared by
Optimal Solutions Group LLC University of Maryland Research Park M Square 5825 University Research Court Suite 2800 College Park MD 20740 USA wwwOptimalSolutionsGroupcom
Cambridge Resources International Inc 60 Montgomery Street Cambridge MA 02141 USA wwwcri-worldcom
Project Analysts Richard Barichello Senior Cost-Benefit Analyst Mikhail Miklyaev Cost-Benefit Analyst Kate Pankowska Cost-Benefit Analyst Glenn P Jenkins Cost-Benefit Manager
November 2012
Disclaimer The authorsrsquo views expressed in this publication do not necessarily reflect the views of the United States Agency for International Development or the United States government
2
Cost Benefit Analysis of the GRAD Honey Value Chain November 2012
Table of Contents
ACRONYMS 5
EXECUTIVE SUMMARY 6
THE GRAD HONEY VALUE CHAIN COST-BENEFIT ANALYSIS 10
METHODOLOGY 10 Project Background 10 Commodity Background 12
Honey Production in Ethiopia 12 Current Market Situation in the Ethiopian Honey Sector 12
Project Description and Activities 13 GRAD Project Interventions in the Honey Value Chain 13 Assumptions for the Selected GRAD Interventions in the Honey Value Chainhelliphelliphelliphelliphelliphellip15
PROJECT MODELING 16
FINDINGS 17 Financial Analysis 17 Comparison of Interventions A and B23 Economic Analysis 23
STAKEHOLDER AND BENEFICIARY ANALYSIS 25
SENSITIVITY ANALYSIS 28
The Joint Impact of Honey Price and Yield of the FNPV for Intervention A 29
RECOMMENDATIONS 31
REFERENCES 32
APPENDIX 34
3
ACKNOWLEDGMENTS
The LEAP team appreciates the assistance received from many people during its field visits to Tigray and Amhara in July 2012 including the representatives of USAID ACDIVOCA CARE SNV Holeta and Andasa Research Centers Zembaba Union of Cooperatives Ethiopian Apiculture Board and the owners of agribusiness enterprises in the honey sector Beza Mar Comel Dimma Tsedey-Mar and Rahi Honey Agro Industry Special thanks are also directed to many small-scale farmers and local traders unknown by name who were interviewed so the team could obtain a clear picture of the situation in the Ethiopian honey sector Their assistance is greatly appreciated This report has benefited from the comments and suggestions of the reviewers of the previous draft report
Cost Benefit Analysis of the GRAD Honey Value Chain November 2012 4
Cost Benefit Analysis of the GRAD Honey Value Chain November 2012
ACRONYMS
AGP Agriculture Growth Program CARE Implementing Organization CBA Cost Benefit Analysis CF Conversion Factor CRS Catholic Relief Services CSA Central Statistical Agency of Ethiopia ENPV Economic Net Present Value ETB Ethiopian Birr (Currency) FEP Foreign Exchange Premium FNPV Financial Net Present Value FtF Feed the Future (Program) GDP Gross Domestic Product GRAD Graduation With Resilience to Achieve
Sustainable Development (Project) Ha Hectare kg Kilogram MFI Microfinance Institutions NPV Net Present Value ORDA Organization for Rehabilitation and
Development in Amhara PSNP Productive Safety Net Program Plus REST Relief Society of Tigray RUSACCO Rural Saving and Credit Cooperatives SADSCR Semiannual Debt Service Coverage Ratio SNV Netherlands Development Agency US$ United States Dollar USAID United States Agency for International
Development
5
EXECUTIVE SUMMARY
Project Description USAIDEthiopia started to implement the Graduation With Resilience to Achieve Sustainable Development (GRAD) project in 2012 The main purpose of the GRAD project is to graduate 50000 chronically food-insecure Ethiopian households (out of the 65000 targeted) by facilitating an increase in their yearly income by US$365householdyear The main objectives that the project aims to achieve are
1 to enhance livelihood options of chronically food-insecure households in Highlands areas 2 to improve household and community resilience and 3 to strengthen an enabling environment to promote scale-up and sustainability
A special emphasis of this project is the inclusion of women and the creation of non-gender-biased income opportunities improved cooperation between stakeholders and the creation of accountability for the beneficiaries of the project
To facilitate the proper implementation of the project and the flow of necessary financial resources for the targeted households USAID established a US$2-million loan-credit guarantee fund that will be available to lending institutions microfinance institutions (MFI) and rural savings and credit cooperatives (RUSACCO) so these institutions can supply the necessary loans to the targeted households for undertaking the GRAD interventions
The implementers of the GRAD project include CARE the Relief Society of Tigray (REST) the Organization for Rehabilitation and Development in Amhara (ORDA) Catholic Relief Services (CRS) and the Netherlands Development Agency (SNV)
The GRAD project proposes interventions in four commodity value chains honey meat vegetables and pulses The investment plan for GRAD households designed by SNV Ethiopia proposes fattening interventions for small ruminants as well as for cattle in the meat value chain but the analysis for the meat value chain has been carried out for the shoats-fattening intervention only These value chainsmdashhoney meat vegetables and pulsesmdashwere chosen because of their suitability for chronically food-insecure households and the rather low initial investment costs necessary for their implementation1
Strategic Context and Rationale The GRAD project is a part of USAIDrsquos wider Feed the Future (FtF) agenda which prioritizes investments in agriculture and nutrition The project particularly aims to facilitate improvements in the commodity value chains to make them more inclusive and efficient for chronically food-insecure households
Promotion of these inclusive commodity value chains will facilitate market access for these households which in turn will increase their yearly income decrease their current food insecurity and allow them to profit from newly established or improved market linkages
The GRAD project proposes two intervention packages in the honey value chain Intervention A will introduce three modern beehives with tools and appropriate training regarding modern honey-production methods starting in year 1 Intervention B will initially introduce two transitional beehives and one modern beehive with tools and training but by the beginning of the year 3 participants will transition to the use of modern beehives only
1 Suitability is defined in terms of the ease in implementation Preferably a number of the food-insecure households already have experience producing some of these commodities
Cost Benefit Analysis of the GRAD Honey Value Chain November 2012 6
Cost Benefit Analysis of the GRAD Honey Value Chain November 2012
Description of the Interventions Regardless of which of the two interventions proposed for the honey value chain are selected each of the chronically food-insecure households targeted in this project will receive an investment loan for the initial purchase of beehives and necessary tools Intervention A includes the initial purchase of three modern beehives and necessary tools at year 1 of the project The amount of the loan required for the investment is above the amount that MFIs of Ethiopia are willing to provide for new clients It has been assumed that targeted households will contribute 28 percent equity capital of the total investment required hence reducing the required borrowing The household will repay this loan on a per-round basis (1 round = 6 months) with the first round being a grace period
Intervention B proposes the initial purchase of one modern beehive and two transitional beehives and necessary tools in year 1 of the project The transitional beehives will be replaced with two modern beehives at the end of year 2 of the project Two Intervention-B scenarios were analyzed Under the first scenario the households again have been assumed to contribute 28 percent of the required investment from the equity capital the second scenario was designed by eliminating 28 percent of the equity contribution from Intervention B The required funds for the replacement of transitional beehives under both scenarios will be obtained through an additional loan taken by the households from the MFIs after repayment of the initial loan In the following text the first scenario of intervention B is referred to as Intervention B and the second scenario is referred to as Intervention C
Financial and Economic Analysis Results The appraisal has been carried out over an 11-year period The analysis shows that at a financial discount rate of 12 percent each householdrsquos financial net present value (FNPV) for Intervention A is US$90640 The FNPV of Intervention B is US$79666 while the FNPV of Intervention C is US$79002 The economic net present value (ENPV) for Intervention A is US$113092 while it is US$100774 for Interventions B and C
In summary the FNPVs and ENPVs are positive for all proposed interventions with Intervention A showing a higher FNPV and ENPV
Table A SADSCRround for household for the interventions Intervention A Year 1 round 1 Year 1 round 2 Year 2 round 1 Year 2 round 2 SADSCR - 093 100 171 Intervention B Year 1 round 1 Year 1 round 2 Year 2 round 1 Year 2 round 2 SADSCR (first loan) - 093 093 141 SADSCR (second loan) 126 174 271 Intervention C Year 1 round 1 Year 1 round 2 Year 2 round 1 Year 2 round 2 SADSCR (first loan) 068 052 058 SADSCR (second loan) 127 175 272
Table A describes the semiannual debt service coverage ratios (SADSCRs) The debt service obligations are defined here to be the interest and principal that are due in a given period plus the debt service from the previous period that could not be paid due to inadequate net cash flow The opportunity cost of labor will be retained within the family and therefore can be treated as part of the cash flow available for debt servicing
In the case of Intervention A the households will face difficulty repaying their debt obligation only during the first repayment period The debt service of the second repayment period together with the unpaid debt service from the previous period will be repaid in round 1 of year 2
7
Cost Benefit Analysis of the GRAD Honey Value Chain November 2012
In the case of Intervention B when repayments are due in the first two rounds the SADSCRs are below one If these farmers are going to be expected to repay the loan this quickly they will have to draw on other sources of cash 2 In round 2 of year 2 the SADSCR reaches a value above 1 indicating that the financial situation of the households will stabilize and the initial loan will be repaid After that round the household will be able to get a new loan required for the complete transition toward modern beehives
The SADSCRs of Intervention C are below a value of 1 in all rounds indicating that households will not be able to repay their debt obligations without the contribution of financial resources generated by other activities The second loan however will be provided only for the households that will repay the previous loan hence households will have to draw on other resources of cash to repay the initial loan
The eventual necessity to contribute additional financial resources in Intervention C erases principal difference (no equity contribution) between Interventions B and C Intervention B will require households to initially invest 28 percent equity capital while Intervention C will split almost the same amount over two repayment rounds The present value of the equity contribution for Intervention B is ETB 120820 (US$6904) while the present value of the amount under Intervention C is ETB 109668 (US$6267) with ETB 67598 (US$3863) in the second round of year 1 and ETB 42070 (US$2404) in the first round of year 2
Beneficiary Analysis Results The results of the analysis reveal that the income of the targeted households will increase This annual increase in the income of the households under each intervention is presented in table B below
Table B Annual increase in the income of the households including opportunity cost of family labor (in US$) Year Intervention A Intervention B Intervention C
2012 ndash15244 ndash11927 ndash8886 2013 5372 3492 ndash3192 2014 27694 20650 20733 2015 27694 18620 18657
2016ndash2022 27694 27694 27694
The net income decrease in the first years of the interventions will occur because of the equity contribution The annual increase in income presented in table B includes the opportunity cost of family labor spent on the beekeeping activities Each householdrsquos net income over the 11-year evaluation period will be US$121304 for Intervention A US$110868 for Intervention B and US$108033 for Intervention C The other beneficiary of the intervention will be the Ethiopian government for the following reasons
The government will benefit directly from the taxes collected on the inputs and outputs of the intervention Plastic containers honey extractors sugar and so forth are importable to Ethiopia The total tax rate applied to these inputs is higher than the foreign exchange premium The inflow of taxes will reduce the economic cost below its financial cost and generate tax revenue for the government of Ethiopia
Modern beehives and smokers are produced domestically so they are assumed to be internationally nontradable goods The inputs used to produce beehives and smokers such as stainless steel nails and covers are exportable to Ethiopia Again the total tax rate applied
2 Other sources of cash refer to financial resources generated by the householdsrsquo activities except beekeeping activities
8
to these inputs is higher than the foreign exchange premium thus generating tax revenue for the government of Ethiopia
The government will also benefit indirectly because honey is exported from Ethiopia Exports allow the country to earn foreign exchange
The total amount of government benefits from the intervention over the 11-year period per household is estimated at US$22928 for Intervention A and US$21027 for Interventions B and C
Conclusions and Recommendations Expected returns on the modern beekeeping activities are dependent on the full list of inputs required for the proper implementation so none of the tools can be eliminated from the required investment A missing input such as a honey extractor will directly result in decreased quality or yield of honey Absence of other inputs such as gloves or overall coats may put the health of the beekeepers at risk because of the aggressiveness of Ethiopian bees Taking into consideration the financial situation of the GRAD beneficiaries it will be appropriate to share the most expensive inputs of production such as a honey extractor between groups of farmers
The loan amount from MFIs for new clients in 2012 is limited to ETB 4000 (US$22857) which is less than the required investment for all three interventions GRAD beneficiaries consist primarily of chronically food-insecure households The necessity of the equity contribution may limit the beneficiaries of the honey interventions to better-off groups of farmers It is suggested that the interventions be redesigned to allow farmers access to sufficient financial resources to start modern beekeeping activities without equity contribution If such loan amounts can be negotiated with MFIs by the implementers of the GRAD project the term of the loan should also be expanded to 3 years
In the case of Intervention B the total initial investment cost is ETB 4315 This amount is only slightly above the amount of ETB 4000 usually provided by MFIs hence reducing the requirements for an equity contribution Intervention B however has been analyzed assuming an equity contribution of 28 percent the analysis reveals that the households will be able to repay the loan although they should be allowed to move small fractions of the debt service to the next repayment period if necessary The repayment of the loan in turn will give them access to the next loan
In the case of Intervention C the total initial investment cost is also ETB 4315 Intervention C has been analyzed without assuming an equity contribution of 28 percent The increased debt service will not allow the households to repay their loan obligations without contributing additional financial resources If the first loan will not be repaid the households will not have access to the next loan required for the purchase of two modern beehives at the end of the intervention year 2
All three interventions require household equity contribution for successful implementation If this requirement can be erased Intervention A is recommended over Interventions B and C because its benefits outweigh its costs and indicate the likely success of this project Even though analyses of Interventions B and C also yield positive FNPV and ENPV values these NPVs are lower than those obtained in the analysis of Intervention A
There is no principal difference between Interventions B and C other than the distribution of the equity contribution over time The minimum equity contribution for Intervention B that will allow the households to repay the loan is 2463 percent
If money from the loan-guarantee fund will be used to cover the unpaid fractions of the loan in Intervention C thus allowing the households access to the loan required for the complete transition toward modern beehives the FNPV of the intervention will be US$87650 which is still below the FNPV of Intervention A The increase in the FNPV in this case is just a financial subsidy from USAID to the targeted households
Cost Benefit Analysis of the GRAD Honey Value Chain November 2012 9
THE GRAD HONEY VALUE CHAIN COST-BENEFIT ANALYSIS
METHODOLOGY
Project Background
Ethiopiarsquos economy is highly dependent on its agricultural production with agriculture accounting for about 46 percent of the countryrsquos gross domestic product (GDP) About 80 percent of Ethiopiarsquos total population lives in the rural areas and agricultural activities generate about 85 percent of the total employment in Ethiopia (USAID AGP-LGPPRIME Summary Proposal 2011)
USAIDEthiopia is one of the major donors providing support for the goal of making Ethiopiarsquos households more food self-sufficient It supports various initiatives related to increasing access to food for Ethiopiarsquos food-insecure households and emergency assistance USAIDrsquos working agenda in Ethiopia involves promoting increased agricultural productivity and developing viable commodity value chains that in turn will increase the level of food security and reduce the negative impacts of famine
Ethiopia is ranked among the top five fastest-growing countries in the world with real GDP growth reaching 75 percent in 2011 (The World Factbook CIA) Despite its currently impressive economic growth rate Ethiopia has not been able to achieve a level of agricultural production that leads to food self-sufficiency It still is home to about 8 million people who remain chronically food insecure with the vast majority of them living in the rural areas About 60 percent of rural households experience food shortages between June and October each year (USAID AGP-LGPPRIME Summary Proposal 2011)
For these reasons the GRAD project concentrates on improving the value chains for several commodities The project addresses the need to develop profitable and functional value chains that include chronically food-insecure households to provide them with opportunities to profit from improved or newly established market linkages
The majority of Ethiopian households in the rural areas cultivate low-value cash crops and live with poor access to commodity markets and financial services They often lack proper market information or are not able to benefit from available market linkages Food-security improvements are likely to come from their inclusion in the commodity value chain cycle
The GRAD project plans to first target 65000 households of which 58500 are chronically food insecure and 6500 are labeled as ldquoUltra Poorrdquo 3 A secondary target group involves 10000 households that can be categorized as food-sufficient households (6000) or food-secure households (4000) This second targeted group is intended to act as a role model for the first GRAD group of households Of the 65000 targeted households the 5-year-long GRAD project aims to graduate 50000 households
Specifically the GRAD project aims to achieve the following goals
1 Enhance the livelihood options of chronically food-insecure households in Highlands areas 2 Improve household and community resilience 3 Strengthen the enabling environment to promote scale-up and sustainability
3 ldquoUltra Poorrdquo households include female-headed households and landless youth
Cost Benefit Analysis of the GRAD Honey Value Chain November 2012 10
To ensure future success in the implementation of the GRAD project USAIDEthiopia plans to cooperate with several implementing agencies that are well-known experts in the areas of food security and commodity value chain development These technical partnersmdashCARE the Relief Society of Tigray (REST) the Organization for Rehabilitation and Development in Amhara (ORDA) Catholic Relief Services (CRS) and the Netherlands Development Agency (SNV)mdash possess the required expertise and hands-on experience from implementing similar projects in Ethiopia and elsewhere
The chronically food-insecure families who are the subjects of the GRAD project are located in 16 woredas in four regions of Ethiopia SNNPR Tigray Amhara and Oromia4 The selection of these woredas was based on their proximity to the Agriculture Growth Program (AGP) and active markets that will facilitate opportunities for engaging in local based commodity trading
The market linkages established during the lifetime of this project will connect chronically food-insecure households with locally based traders and facilitate the sales of commodities for income generation by this targeted group of households
In addition the GRAD project aims to correct the shortcomings experienced in the Productive Safety Net Program Plus (PSNP) project by facilitating an increase in the yearly income of chronically food-insecure households The objective of the chosen interventions is to increase each householdrsquos yearly income by US$365 (or US$1day) by the end of the project It is possible that this objective will not be met if such households engage in just one additional commodity value chain In such cases a combination of commodity value chains will be suggested to achieve the desired increase in the householdsrsquo income level
The GRAD project will emphasize gender equality and the inclusion of women via cooperation between stakeholders and a widely understood accountability to beneficiaries
USAID will facilitate the implementation of this project by establishing a credit-guarantee fund of US$2 million This guaranteed fund will enable the flow of credit resources necessary for the chronically food-insecure households to engage in the commodity production The distribution of financial resources will be handled by microlending institutions MFIs and RUSACCO One additional benefit of this credit guarantee will be to spread the financial risk between the implementing agency and the financial organizations that are responsible for lending to the targeted households
Four commodity value chains are being proposed for the GRAD project honey pulses vegetables and meat The choice of these value chains is based on their simplicity in terms of the necessary knowledge required for their introduction and the rather low initial start-up costs needed to engage in their production The value chains of these commodities show a good potential for postgraduation production increases and marketing Demand for all these commodities is growing in the domestic market (Ethiopian) and export markets
The list of the key FtF indicators proposed for monitoring and evaluating the GRAD projectrsquos performance is presented in table A in the appendix
4 As per the CARE proposal
Cost Benefit Analysis of the GRAD Honey Value Chain November 2012 11
Commodity Background
Honey Production in Ethiopia
Ethiopia has a long tradition of honey production reaching back many centuriesmdashin fact the longest tradition of honey and beeswax marketing in Africa Despite this long tradition honey production in Ethiopia is still treated as a supplemental on-farm activity that is usually combined with crop cultivation and animal husbandry A vast majority of the honey produced in Ethiopia comes from traditional beehives which currently are the most common form of technology used for honey production in Ethiopia As of 2011 Ethiopia possessed about 49 million traditional beehives which constitutes about 9557 percent of the total number of beehives in Ethiopia Currently only about 81500 transitional beehives (commonly called Kenya top bar hives) and 140000 modern beehives exist (CSA Agricultural Survey Report 2012) The total quantity of honey produced in Ethiopia in 2010ndash11 was about 399 million kilograms (kg) Almost all honey that is currently produced in Ethiopia (about 98 percent of the total yearly production) is consumed in the domestic market with only about 2 percent of the total yearly production being exported
Ethiopia has about 14ndash17 million households that are engaged in beekeeping and produce different types of honey that vary regionally as well as in terms of color consistency and purity The most in-demand honey among Ethiopians comes from Eastern Tigray where bees forage on the regionally specific Tebeb plant (Basium clandiforbium) and produce distinctive low-moisture white honey Other types of honey produced include Lalibela honey (Acacia honey) multifloral yellow honey dark brown honey and crude red honey (mainly used for the production of tej an Ethiopian drink with low alcohol content)
Current Market Situation in the Ethiopian Honey Sector
The sectorrsquos current market situation is characterized by a strong domestic demand and relatively low supply of table honey resulting in rising domestic prices for honey Producer prices differ by region and type of honey The most expensive is Eastern Tigrayrsquos white honey where the current retail price is ETB 17000kg Lower retail prices (of around ETB 60ndash9000kg) are observed for other varieties of white honey depending on the area and the honeyrsquos characteristics The retail prices for yellow honey are around ETB 50ndash6000kg while the least expensive red honey is sold at a price of around ETB 45ndash50kg5 This current market situation in the Ethiopian honey sector and producersrsquo overreliance on traditional technology are influenced by several factors
1 The use of traditional methods in the honey production The most commonly used method of honey production in Ethiopia relies on traditional beehives that are usually handmade from old logs found in the forest These beehives present low-productivity rates (around 5ndash7kgbeehiveyear) and low-quality honey that contains brood wax and other impurities The yield from transitional and modern beehives is significantly higher (8ndash15kgtransitional beehive and 15ndash20kgmodern beehive) and these improved beehives produce better-quality honey as well
2 The lack of financial resources that would allow the beekeepers to obtain modern beehives Small-scale farmers who are interested in beekeeping find it difficult to obtain the financial resources necessary to acquire transitional or modern beehives They possess few private financial resources and usually are unable to obtain the credit required to borrow capital
5 The honey retail prices were obtained during field interviews in Tigray and Amhara in July 2012
Cost Benefit Analysis of the GRAD Honey Value Chain November 2012 12
These financial barriers therefore do not allow them to switch from traditional to modern technology
3 Somewhat poor access to the tools necessary to start honey production with modern beehives Some beekeepers possess modern beehives (just boxes) yet do not have any of the tools required for the proper management of these beehives (eg smoker queen excluder honey extractor etc) This situation results in the production of honey within modern-style beehives but with yields and quality comparable to that of honey coming from traditional beehives
4 Lack of proper training on the management of the modern-style apiary Beekeepers who try to switch to modern-style honey production usually do not have the skills necessary for the proper management of modern beehives They maintain their beehives poorly using primitive harvesting methods and inappropriate tools Due to their lack of training they do not provide additional feed (water and sugar syrup) during droughts and have little knowledge of quality requirements in the honey market
5 Other associated obstacles Other barriers include the disappearance of desirable bee forage due to crop intensification and the growing use of agrochemicals extreme weather conditions in some parts of Ethiopia (droughts) poor transportation infrastructure and the lack of knowledge about proper storage techniques (at both the farm and the local honey collectorstraders levels)
Project Description and Activities
The inclusion of the honey value chain in the GRAD project is based on several factors that positively affect this commodityrsquos economic potential and its suitability for chronically food-insecure households One of the factors contributing to the inclusion of the honey value chain is that the labor and land requirements for modern honey-production techniques are relatively low The amount of land necessary for the establishment of an apiary with three modern beehives is 0001 hectares (Ha) with labor requirements of about 107 hoursround6 These low land requirements are especially helpful in the case of food-insecure households which on average possess no more than 025 Ha of land Modern-style honey production is also able to create non-gender-biased employment and income opportunities Honey production is neither physically strenuous nor culturally assigned to men and it is a ready source of cash hence it is ideally suited for female participation Given the traditional-style beekeeping experience that some of the households targeted in the GRAD project possess the inclusion of the honey value chain in the GRAD project has a solid rational basis
GRAD Project Interventions in the Honey Value Chain
Two honey value chain interventions in this GRAD project are being proposed for implementation both with the goal of improving honey-production techniques Intervention A will introduce three modern beehives related maintenance tools and appropriate training All investments will be made starting in year 1 of the intervention in modern honey-production techniques The amount of the investment required for the Intervention A is much higher than the usual amount available for new clients of MFIs operating in Ethiopia thus necessitating household equity contribution The main targeted beneficiaries of the GRAD project are chronically food-insecure households which may not have financial resources to make the contribution The second proposed intervention would overcome this barrier
6 A round refers to a 6-month period of time
Cost Benefit Analysis of the GRAD Honey Value Chain November 2012 13
Cost Benefit Analysis of the GRAD Honey Value Chain November 2012
Intervention B will introduce two transitional beehives and one modern beehive related maintenance tools and training A progressive transition will be made toward the exclusive use of modern beehives at the beginning of year 3 The total initial investment cost of the Intervention B will be ETB 4315 which is much lower than the total investment cost of Intervention A (ETB 7205) and only slightly above ETB 40007 Two versions of Intervention B have been analyzed Under the first scenario the households have been assumed to contribute 28 percent of the required investment but this contribution will be significantly smaller than 28 percent of the investment cost of the more expensive Intervention A This scenario is referred to as Intervention B in the following text The alternate scenario will eliminate the 28 percent equity contribution required for Intervention B and is referred to as Intervention C in the following text The required funds needed for the replacement of transitional beehives under both scenarios will be obtained through an additional loan taken by the households from the MFIs after repayment of the initial loan
Table 1 below shows a detailed outline of the specific investment expenditures associated with each of the proposed interventions
Table 1 Total investment expenditures for Interventions A B and C8
Input Intervention A Intervention B and C
(year 1)
Intervention B and C
(year 3) Modern beehives (3 for A 1 for B) 3300 1100 2200 Bee colony 2100 700 Queen excluder 330 110 220 Wax (ETBkg) 405 135 270 Smoker 140 140 Overall coat 150 150 Veil 90 90 Glove 80 80 Extractor 3209 320 Wax mold 150 150 Bee forage seedling or seeds 50 50 Plastic honey container 90 90 Transitional beehives (2) 0 200 Bee colony for transitional beehives (2) 0 1000 Total10 7205 4315 2690
Assumptions for the Selected GRAD Interventions in the Honey Value Chain
1 The GRAD-targeted chronically food-insecure households that will engage in the modern-style honey production will each be provided with a microloan necessary to purchase the
9 It has been assumed that an extractor and a wax mold will be shared by a group of households due to the equipmentrsquos relatively high prices10 Total investment and operating costs (including labor and additional feed for bees) for the first year and first round of the intervention will be ETB 769653 (nominal) for Intervention A and ETB 502653 (nominal) for Intervention B
7 The total amount of loan available for the new clients of MFIs is ETB 4000 8 Total investment expenditures for Intervention A three modern beehives with tools and appropriate training starting in year 1 Total investment expenditures for Intervention B two transitional beehives plus one modern beehive with tools and training starting in year 1 with progressive transition into all modern beehives by year 3 (in ETB)
14
required inputs It has been assumed that each targeted household possesses assets that can be sold to obtain cash (eg livestock) or has personal savings that can be used to provide a down payment 11 The size of this loan will vary according to the intervention With the required 28 percent participant contribution the necessary loan for Intervention A (covering three modern beehives starting in year 1 maintenance tools and training) will be ETB 5825household In the case of Intervention B (covering two transitional beehives and one modern beehive maintenance tools training and progressive transition into all modern beehives by the end of year 2) the size of the first loan will be ETB 3495household For financing the investment needed for the transition to using all modern beehives no equity contribution will be required and the amount of the second loan will be ETB 3028household The financing of the investment in Intervention C will occur without equity contribution The ability of the households to repay the initial loan for Interventions B and C will be very critical because it will determine the availability of the next loan required for the complete transition toward modern beehives
2 Training will be provided free of charge so targeted households will not incur any costs related to training (except the opportunity cost of time they spend being trained)
3 The microloan necessary for purchasing the required inputs will be provided at a subsidized interest rate of 15 percent Additional fees associated with this loan will include a service charge (1 percent) loan insurance (1 percent) upfront savings (10 percent) and a passbook fee (ETB 15) This loan will be for a period of 2 years with a grace period of 6 months Each household will make semiannual loan repayments for a total of three repayments of the loan principal12 The upfront savings (10 percent) will be returned to the households after the loan has been repaid There will be no interest renewed on the upfront savings
4 In the case of Interventions B and C households will need to replace the transitional beehives with modern ones in year 3 It has been assumed that they will cover the costs of the second loan after repaying the initial loan It has also been assumed that a down payment will not be needed for the second loan because the required amount is far below ETB 10000 (the amount provided by MFIs to clients who repaid the first loan and have good reputations)
5 It has been assumed that in the case where a household is not able to repay the total amount of its loan principal due in a particular round this amount will be transferred to the next round together with the incurred interest rate on the total outstanding amount This procedure will be repeated until the total loan amount is repaid13
6 It has also been assumed that each household will be able to harvest honey only one time in year 1 of Intervention A B or C In subsequent years it has been assumed that harvesting will happen twice annually For Intervention A it has been assumed that the average yield from each modern beehiveharvest will be 19 kgyear14 For Intervention B the same yield has been assumed in the case of modern beehive while the average yield from each transitional beehive has been assumed to be 8 kgyear
7 The household consumption of honey for both interventions has been assumed to be 5 kghouseholdround For Interventions B and C it has also been assumed that a household will consume lower-quality honey that comes from the transitional beehives and sell the honey from the modern beehives because it will fetch a higher price and thus allow the farmer to repay the loan faster
11 This ldquoafter down paymentrdquo loan amount in both cases includes investment expenditures as well as service charge loan insurance upfront savings and passbook fee12 In the first year of each intervention only one repayment has been assumed (in round 2) 13 Loan description provided by CARE 14 Such yield will be possible to obtain because of training that will improve a householdrsquos knowledge of modern beekeeping (eg the necessity for additional feedings and bee-forage planting)
Cost Benefit Analysis of the GRAD Honey Value Chain November 2012 15
8 The necessary operating costs for both interventions in the first round will include bee-feeding costs of ETB 14175 land-rental costs of ETB 040 and labor costs of ETB 34938 It has been assumed that households will provide the necessary labor for beehive maintenance so the labor required to maintain the beehives will not represent a cash burden
9 The cost of beehive maintenance (per round) has been set at 5 percent of the initial cost of the beehive for both interventions It has been assumed that households will use locally available materials and family labor for this purpose
10 The lifespan for the modern beehive for both interventions has been assumed to be 11 years which will be equal to the lifespan of the project15 In the case of Intervention B the lifespan for the transitional beehive is 2 years because at that point they will be replaced with modern beehives It has been assumed that farmers will just replace transitional beehives with modern versions (not add two modern beehives) because of two reasons
a Households keep modern beehives in the residential area to prevent them from being stolen Such a security system puts a constraint on the quantity of bee colonies that can be held by households because of the potential danger to the families
b The cost of the bee colony is much higher than the cost of transitional beehives so moving existing bee colonies from transitional beehives to modern ones instead of obtaining new bee colonies makes economic sense
11 In this analysis the farm-gate price of yellow honey has been assumed to be ETB 45kg for modern beehives and ETB 43kg for transitional beehives16
12 For Interventions B and C it has been assumed that households will replace their transitional beehives with modern ones at the beginning of year 3 The bee colonies from the transitional beehives will be moved to the modern ones so no additional costs will be incurred to replace the bee colonies
13 It has been assumed that the initial price of a bee colony for a modern beehive will be ETB 700 while it will be ETB 500 for a transitional beehive The difference in price results because the bee colony for a transitional beehive is smaller
14 For the purpose of this analysis the following macrolevel assumptions have been made The expected average annual domestic inflation rate is 20 percent and the US inflation rate is 25 percent The financial discount rate is a real rate of 12 percent the economic discount rate is a real rate of 12 percent the foreign exchange premium (FEP) is 65 percent (Kuo 2011) and the exchange rate is US$1 = ETB 1750
PROJECT MODELING
The financial and economic feasibility of the GRAD honey interventions in this analysis has been established by constructing cash flows from the point of view of the project (total investment point of view) and the point of view of the targeted households (equity point of view) All revenues or potential revenue items have been treated as cash inflows and all expenditures or potential expenditure items have been treated as cash outflows (Jenkins Kuo and Harberger 2011) The analysis has been carried out for an 11-year period
The cash flows have been constructed in nominal and real terms and on per-round (every 6 months) as well as annual bases (for total investment point of view and equity point of view) The cash flows have also been constructed for the total investment point of view with the exclusion of domestic
15 This lifespan was confirmed during the field interviews in July 2012 16 Honey prices have been based on field interviews conducted in July 2012 in Amhara and Tigray The difference in prices has come from the assumption that honey produced in modern beehives has a bit higher quality hence the higher price
Cost Benefit Analysis of the GRAD Honey Value Chain November 2012 16
Cost Benefit Analysis of the GRAD Honey Value Chain November 2012
consumption of honey (in nominal and real terms) to reflect the actual cash available for repayment of the loans
The economy resource flow statements have been constructed by adjusting each of the line items in the cash-flow statements of the total investment point of view by the corresponding economic conversion factor (CF)17
The financial sustainability of an intervention has been analyzed by estimating the SADSCR of the project over the life of the loan used to finance the project and by calculating the FNPV of the project from the targeted householdsrsquo (equity) point of view If the ENPV of the project is positive this means the total value of the benefits of the project (to whomever they accrue) will be greater than the combined costs required to implement and operate the intervention
FINDINGS
Financial Analysis
The appraisal has been carried out for an 11-year period Based on assumptions established for the purpose of this analysis all interventions will yield positive FNPVs The FNPV has been calculated using 12 percent real financial discount rate Table 2 presents the FNPVs for each intervention
Table 2 FNPVhouseholdintervention (in US$) FNPV
Intervention A 90640 Intervention B 79666 Intervention C 79002
The interventions in the honey value chain will also substantially increase the annual income of the targeted households Stabilized additional yearly income of US$21811 will be achieved by 2014 in the case of Intervention A compared to 2016 for Interventions B and C The resulting additional yearly income is presented in table 3 below18
Table 3 Annual net cash flows resulting from the interventions (in US$) Year Intervention A Intervention B Intervention C
2012 ndash16191 ndash12303 ndash9262 2013 3436 313 ndash3940 2014 21811 14767 14850 2015 21811 12737 12774 2016ndash2022 21811 21811 21811
The negative annual net cash flows in 2012 for Interventions A and B will result from the 28 percent equity contribution needed to finance the initial investment Intervention C will have two negative net cash flows in 2012 and 2013 because farmers will not have adequate cash flows to finance their debt burden during these years Although the initial equity contribution has been removed from
17 Dividing the separately calculated economic value of a unit of an item by its financial price will yield the conversion factor 18 Net cash flow from the household perspective has been measured as its revenue less operating expenses less debt service including both debt repayments and interest expense In the early years the net cash flows will be less than the strict accounting definition of income which only subtracts interest expense During these years annual financial depreciation will be less than debt repayment and hence net cash flow will be lower than net income
17
Cost Benefit Analysis of the GRAD Honey Value Chain November 2012
Intervention C targeted households will still need to contribute financial resources from other activities to repay their debt obligation
Table 4 describes the SADSCRs These indicators are very important from a program sustainability perspective because they show each householdrsquos ability to repay the loan necessary for the financing of the initial investment in each of the interventions The debt service obligations in a given period have been defined here to be the interest and principal that will be due in a given period plus the debt service from the previous period that cannot be paid due to inadequate net cash flow
Table 4 SADSCRround for household for the interventions Intervention A Year 1 round 1 Year 1 round 2 Year 2 round 1 Year 2 round 2 SADSCR - 093 100 171 Intervention B Year 1 round 1 Year 1 round 2 Year 2 round 1 Year 2 round 2 SADSCR (first loan) - 093 093 141 SADSCR (second loan) 126 174 271 Intervention C Year 1 round 1 Year 1 round 2 Year 2 round 1 Year 2 round 2 SADSCR (first loan) 068 052 058 SADSCR (second loan) 127 175 272
In the case of Intervention A the households will face difficulty repaying their debt obligation only during the first repayment period The debt service of the second repayment period and the unpaid debt service from the previous period will be repaid in round 1 of year 2
In the case of Intervention B when repayments will be due in the first two rounds the SADSCR will be below a value of 1 If the farmers will be expected to repay the loan this quickly they will have to draw on other sources of cash In round 2 of year 2 the SADSCR will reach a value above 1 indicating that the financial situation of the households will stabilize allowing the initial loan to be repaid This indicates that households by that time will be able to access the new loan required for the investment to replace transitional beehives with modern ones
The SADSCR of Intervention C will be below a value of 1 in all rounds indicating that households will not be able to repay their debt obligations without contributing financial resources generated by other activities The second loan however will be provided only for the households that repay the previous loan hence households will have to draw on other cash resources to repay the initial loan
The eventual necessity to contribute additional financial resources to repay the loan in Intervention C negates the principal difference (no equity contribution) between Interventions B and C Intervention B will require households to initially invest 28 percent equity capital while Intervention C will split almost the same amount over two repayment rounds The present value of equity contribution for Intervention B will be ETB 120820 (US$6904) while the present value of contribution under Intervention C will be ETB 109668 (US$6267) with ETB 67598 (US$3863) in the second round of year 1 and ETB 42070 (US$2404) in the first round of year 2
The SADSCR of the second loan of Interventions B and C will be above 1 in all rounds indicating that the financial standing of the households will be good enough to repay the loan although not in a timely manner
Table 5 presents the annual scheduled debt service obligations versus the annual net cash flows including the opportunity cost of labor which reflect the actual financial resources generated by the activity in the given period and available for the loan repayment It has been assumed that actual debt repayment will be made by the households without moving additional financial resources from other (non-honey-producing) activities to repay the loan for both interventions For Interventions A
18
Cost Benefit Analysis of the GRAD Honey Value Chain November 2012
and B these values confirm the status quo outlined in the discussion above about SADSCRs Although in both cases the households cannot repay the full amount of debt service in timely manner they will be able to cover the biggest part of payment and eventually will have adequate cash flow to pay back the loan At this time they will be refunded the upfront savings (10 percent of the initial loanrsquos amount) For Intervention B repayment of the loan will open access for the new loan required to finance investment in the two new modern beehives The annual net cash flows of Intervention C will not allow the households to repay the loan so they will not get access to the second loan
Table 5 Annual debt repayment obligations versus net annual cash flows including opportunity cost of family laborroundintervention (in ETB)
Year 1 Year 2 Intervention A Round 1 Round 2 Round 1 Round 2- Annual Debt Service Obl 278495 243149 156349 - Net cash flow 257625 243942 267225
Intervention B Round 1 Round 2 Round 1 Round 2 - Annual Debt Service Obl 168906 145146 104800- Net cash flow 157720 134502 147340
Intervention C Round 1 Round 2 Round 1 Round 2 - Annual Debt Service Obl 231771 259036 254673 - Net cash flow 157720 134502 147340
Note The debt service obligations in a given period have been defined here to be the interest and principal that are due plus the debt service from the previous period that cannot be paid due to inadequate net cash flow Note For the second loan of Interventions B and C annual debt service obligations will be equal to the actual debt payments because households will have sufficient cash flow to fully cover the obligations
19
Table 6 Intervention A annual cash-flow statement equity point of view (real ETB) Line items Yearltltltlt 2012 2013 2014 2015 2016 2017 2018 2019 2020 2021 2022 PV
Receipts
‐Value of in‐house honey consumption 22500 45000 45000 45000 45000 45000 45000 45000 45000 45000 45000 276760 ‐Revenue from honey sale 234000 468000 468000 468000 468000 468000 468000 468000 468000 468000 468000 2878304
Total inflows 256500 513000 513000 513000 513000 513000 513000 513000 513000 513000 513000 3155064
Expenditures Investment costs for modern beehives Modern beehive 330000 330000
Bee colony 210000 210000
Queen excluder 33000 33000
Wax 40500 40500
Smoker 14000 14000
Overall coat 15000 15000
Veil 9000 9000
Glove 8000 8000
Extractor 32000 32000
Wax mold 15000 15000
Bee forage seedling or seed to plant around backyard 5000 5000
Plastic honey container 9000 9000
Service costs for beehives Sugar for feeding 28350 28350 28350 28350 28350 28350 28350 28350 28350 28350 28350 188534
Beehive maintenance 16500 33000 33000 33000 33000 33000 33000 33000 33000 33000 33000 202957
or cost 69875 69875 69875 69875 69875 69875 69875 69875 69875 69875 69875 464684
Rental value of land 080 080 080 080 080 080 080 080 080 080 080 532
Subsidized loan ndash295457 321563 000 000 000 000 000 000 000 000 000 ndash8347
Total outflows 539848 452868 131305 131305 131305 131305 131305 131305 131305 131305 131305 1568860
Net cash flows ndash283348 60132 381695 381695 381695 381695 381695 381695 381695 381695 381695 1586204
Net cash flows real US$ ndash16191 3436 21811 21811 21811 21811 21811 21811 21811 21811 21811 90640
NPV 12 discount rate ETB 1586204 NPV 12 discount rate US$ 90640
20
Table 7 Intervention B annual cash-flow statement equity point of view (real ETB) Line items Yearltltltlt 2012 2013 2014 2015 2016 2017 2018 2019 2020 2021 2022 PV
Receipts
‐Value of in‐house honey consumption 21500 43000 45000 45000 45000 45000 45000 45000 45000 45000 45000 273974 ‐Revenue from honey sale 132800 265600 468000 468000 468000 468000 468000 468000 468000 468000 468000 2596390
Total inflows 154300 308600 513000 513000 513000 513000 513000 513000 513000 513000 513000 2870364
Expenditures Investment costs Modern beehive 110000 000 220000 285383
Bee colony for modern beehive 70000 70000
Transitional beehive 20000 20000
Bee colony for transitional beehive 100000 100000
Queen excluder 11000 000 22000 28538
Wax 13500 000 27000 35024
Smoker 14000 14000
Overall coat 15000 15000
Veil 9000 9000
Glove 8000 8000
Extractor 32000 32000
Wax mold 15000 15000
Bee forage seedling or seed to plant around backyard 5000 5000
Plastic honey container 9000 9000
Service costs for beehives Sugar for feeding 28350 28350 28350 28350 28350 28350 28350 28350 28350 28350 28350 188534
Modern beehive maintenance 5500 11000 33000 33000 33000 33000 33000 33000 33000 33000 33000 172315
Transitional beehive maintenance 1000 2000 000 000 000 000 000 000 000 000 000 2786
Labor cost 69875 69875 69875 69875 69875 69875 69875 69875 69875 69875 69875 464684
Rental value of land 080 080 080 080 080 080 080 080 080 080 080 532
Subsidized loan ndash166702 191809 ndash145729 158794 000 000 000 000 000 000 000 1409
Total outflows 369603 303114 254576 290099 131305 131305 131305 131305 131305 131305 131305 1476204
Net cash flows ndash215303 5486 258424 222901 381695 381695 381695 381695 381695 381695 381695 1394160
Net cash flows real US$ ndash12303 313 14767 12737 21811 21811 21811 21811 21811 21811 21811 79666
NPV 12 discount rate ETB 1394160 NPV 12 discount rate US$ 79666
Cost Benefit Analysis of the GRAD Honey Value Chain November 2012 21
Table 8 Intervention C annual cash-flow statement equity point of view (real ETB)19
Line items Yearltltltlt 2012 2013 2014 2015 2016 2017 2018 2019 2020 2021 2022 PV
Receipts
‐Value of in‐house honey 21500 43000 45000 45000 45000 45000 45000 45000 45000 45000 45000 273974Revenue from honey ‐ sale 132800 265600 468000 468000 468000 468000 468000 468000 468000 468000 468000 2596390
Total inflows 154300 308600 513000 513000 513000 513000 513000 513000 513000 513000 513000 2870364
Expenditures Investment costs Modern beehive 110000 000 220000 285383
Bee colony for modern beehive 70000 70000
Transitional beehive 20000 20000 Bee colony for transitional 100000 100000
Queen excluder 11000 000 22000 28538
Wax 13500 000 27000 35024
Smoker 14000 14000
Overall coat 15000 15000
Veil 9000 9000
Glove 8000 8000
Extractor 32000 32000
Wax mold 15000 15000 Bee forage seedling or seed to plant around
5000 5000
Plastic honey container 9000 9000
Services costs for beehives Sugar for feeding 28350 28350 28350 28350 28350 28350 28350 28350 28350 28350 28350 188534
Modern beehive maintenance 0055 11000 33000 33000 33000 33000 33000 33000 33000 33000 33000 172315 Transitional beehive 0010 2000 000 000 000 000 000 000 000 000 000 2786
Labor cost 69875 69875 69875 69875 69875 69875 69875 69875 69875 69875 69875 464684
Rental value of land 080 080 080 080 080 080 080 080 080 080 080 532
Subsidized loan ndash219923 266240 ndash147177 158152 000 000 000 000 000 000 000 32013
Total outflows 316382 377545 253128 289457 131305 131305 131305 131305 131305 131305 131305 1487827
Net cash flows ndash162082 ndash68945 259872 223543 381695 381695 381695 381695 381695 381695 381695 1382537
Net cash flows real US$ ndash9262 ndash3940 14850 12774 21811 21811 21811 21811 21811 21811 21811 79002
NPV 12 discount rate ETB 1382537
NPV 12 discount rate US$ 79002
19 The only difference between tables 8 and 9 is the repayment of the loan (subsidized loan line) All other lines of the tables are the same
Cost Benefit Analysis of the GRAD Honey Value Chain November 2012 22
Comparison of Interventions A B and C
Even though all interventions will yield positive FNPVs with Intervention A resulting in a greater FNPV the choice between the interventions will depend on several factors
1 Intervention A will require higher initial investment expenditures than Intervention B (ETB 7205 versus ETB 4315) Within the lifespan of Intervention A greater quantities of honey will be produced earlier thus allowing for higher financial returns that will offset the costs associated with the higher initial investment Such high initial investment requirements however will require an equity contribution from the household side because current policies of MFIs in Ethiopia will allow households to borrow a maximum of ETB 4000 in the first loan If the households are able to repay they will get access to a new loan up to ETB 10000
2 The main group of GRAD beneficiaries will be the households for which the equity contribution required for Intervention A may be a constraint to participate in the program For such households Intervention B will be more attractive because of the reduced equity contribution
3 The success of the complete transition toward modern beekeeping in Interventions B and C will entirely depend on the ability of the households to get a second loan from the MFIs The MFIs will not provide an additional loan to households that fail to repay the first loan so the households will need to contribute financial resources generated by other farm activities to repay the first loan This erases the principal difference of no equity contribution between the two interventions Some households however may prefer not to contribute 28 percent of the needed equity at the beginning of the project and will instead make this contribution in two installments to cover the debt burden as in the case of Intervention C
4 In addition to the higher FNPV Intervention A will also result in GRAD householdsrsquo achieving stable additional income of US$218 by 2014 as compared to 2016 for Intervention B Total incremental earnings of Intervention A as compared to Intervention B calculated over the 4-year period of 2012ndash16 will be equal to US$14681 (See table 3) For those households that will be financially capable of making the equity contribution it will be advantageous to choose Intervention A
5 Although Interventions B and C will require a second loan to finance the complete transition toward modern beekeeping this loan will not put a significant financial burden on the households because the cash flows will be sufficient to cover the householdsrsquo debt service obligations in full For Intervention A however after the total repayment of the initial investment loan in round 2 of year 2 the household will be free of debt and can continue honey production fully benefiting from the increased income from honey sales
Economic Analysis
Differences have emerged between the financial and economic outcomes due to the fact that the financial values do not include all externalities present in the economy In this case the only externality will come from increased tax revenues either directly from the taxation of inputs or indirectly via the FEP Honey is an exportable commodity in Ethiopia The FEP for Ethiopia has been estimated to be equal to 65 percent (Kuo 2011) Hence every incremental unit of foreign exchange (dollars) earned from increased exports will have an economic value to the country of 1065 times the value of the revenues by the exporters when exchanging the foreign exchange for local currency at the market exchange rate
23
To show the true economic impact of the proposed intervention on the Ethiopian economy the economic values have been derived by adjusting the financial values by the appropriate economic conversion factors If no distortions are present in the market then the financial value of an item has been used to measure its economic value20
Table 9 reports that the ENPV obtained in the analysis will be positive for both interventions The economic opportunity cost of capital of 12 percent has been used while calculating the ENPV If they are successfully implemented both interventions will benefit the Ethiopian economy
When the two interventions are compared Intervention A will result in total higher production of honey through the full life of the project as compared to Intervention B mainly because of the larger volume of output that will be produced by Intervention A during first 2 years of the project On the cost side farmers eventually will have to purchase the same equipment and the same number of modern beehives for Intervention B as they will for Intervention A The net results have shown that Intervention A will have a greater ENPV than Intervention B will The only difference between Interventions B and C is the way the interventions will be financed This method of investment financing will just be a transfer of resources and hence will not bring any change to the economic outcomes of the interventions As a result there is no difference between Interventions B and C Intervention A will be a better choice not only for the chronically food-insecure households targeted in the GRAD project but also for the Ethiopian economy as a whole because it will be more productive and create a larger value of financial and economic net benefits
The estimated ENPVs are presented in table 9 below
Table 9 ENPVs for Interventions A and B (in US$) ENPV
Intervention A 113092 Intervention B 100774
20 The list of CFs used for the purpose of this analysis is presented in table A in the appendix
Cost Benefit Analysis of the GRAD Honey Value Chain November 2012 24
Table 10 Economic resources cash-flow statement for Intervention A (real ETB) Line items CF Yearltltltlt 2012 2013 2014 2015 2016 2017 2018 2019 2020 2021 2022 PV
Receipts ‐Value of in‐house honey consumption 109 24583 49166 49166 49166 49166 49166 49166 49166 49166 49166 49166 302382 ‐Revenue from honey sale 109 255663 511327 511327 511327 511327 511327 511327 511327 511327 511327 511327 3144775
Total Inflows 280246 560493 560493 560493 560493 560493 560493 560493 560493 560493 560493 3447157
Expenditures Investment costs Modern beehive 085 281185 281185
Bee colony 100 210000 210000
Queen excluder 085 28118 28118
Wax 106 43104 43104
Smoker 085 11898 11898
Overall coat 073 10995 10995
Veil 073 6597 6597
Glove 080 6416 6416
Extractor 082 26244 26244
Wax mold 100 15000 15000 Bee forage seedling or seed to plant around 100 5000 5000
Plastic honey container 075 6724 6724
Services costs for beehives Sugar for feeding 079 22345 22345 22345 22345 22345 22345 22345 22345 22345 22345 22345 148600
Beehive maintenance 100 16500 33000 33000 33000 33000 33000 33000 33000 33000 33000 33000 202957
Labor cost 100 69875 69875 69875 69875 69875 69875 69875 69875 69875 69875 69875 464684
Rental value of land 100 080 080 080 080 080 080 080 080 080 080 080 532
Total outflows 760082 125300 125300 125300 125300 125300 125300 125300 125300 125300 125300 1468055
Net cash flows ‐ 435193 435193 435193 435193 435193 435193 435193 435193 435193 435193 1979102
Net cash flows real US$ ‐27419 24868 24868 24868 24868 24868 24868 24868 24868 24868 24868 113092
ENPV 12 discount rate ETB 19791
ENPV 12 discount rate $US 113092
25
Table 11 Economic resources cash-flow statement for Intervention B (real ETB)21
Line items CF Yearltltltlt 2012 2013 2014 2015 2016 2017 2018 2019 2020 2021 2022 PV
Receipts ‐Value of in‐house honey consumption 109 23490 46981 49166 49166 49166 49166 49166 49166 49166 49166 49166 299339
‐ Revenue from honey sale 109 145094
290189 511327 511327 511327 511327 511327 511327 511327 511327 511327 2836761
Total inflows 168585 337170 560493 560493 560493 560493 560493 560493 560493 560493 560493 3136100
Expenditures Investment costs Modern beehive 085 93728 000 187457 243167
Bee colony for modern beehive 100 70000 70000
Transitional beehive 100 20000 20000
Bee colony for transitional beehive 100 100000 100000
Queen excluder 085 9373 000 18746 24317
Wax 106 14368 000 28736 37276
Smoker 085 11898 11898
Overall coat 073 10995 10995
Veil 073 6597 6597
Glove 080 6416 6416Extractor 082 26244 26244
Wax mold 100 15000 15000 Bee forage seedling or seed to plant around backyard 100 5000 5000
Plastic honey container 075 6724 6724
Services costs for beehives Sugar for feeding 079 22345 22345 22345 22345 22345 22345 22345 22345 22345 22345 22345 148600
Modern beehive maintenance 100 5500 11000 33000 33000 33000 33000 33000 33000 33000 33000 33000 172315
Transitional beehive maintenance 100 1000 2000 000 000 000 000 000 000 000 000 000 2786
Labor cost 100 69875 69875 69875 69875 69875 69875 69875 69875 69875 69875 69875 464684
Rental value of land 100 080 080 080 080 080 080 080 080 080 080 080 532
Total outflows 495144 105300 360238 125300 125300 125300 125300 125300 125300 125300 125300 1372551
Net cash flows ndash326559 231870 200255 435193 435193 435193 435193 435193 435193 435193 435193 1763549
Net cash flows real US$ ndash18660 13250 11443 24868 24868 24868 24868 24868 24868 24868 24868 100774
ENPV 12 discount rate ETB 17635
ENPV 12 discount rate $US 100774
21 There is no difference between Interventions B and C from the economy point of view
Cost Benefit Analysis of the GRAD Honey Value Chain November 2012 26
STAKEHOLDER AND BENEFICIARY ANALYSIS
An economic surplus in the economy is created by producing an output that has an economic value greater than the economic cost of the inputs such as capital land and labor that are used to produce the item The proposed interventions in the honey value chain will yield two groups of beneficiaries the households engaged in the interventions and the government of Ethiopia
The results of the analysis reveal that the income of the targeted households will increase Table 3 presented above has been designed by treating the opportunity cost of labor as a cash outflow The opportunity cost of labor will be retained within the family and therefore can be included in the present annual income of the targeted families Table 12 presents the annual family income profiles including the opportunity cost of labor which has been assumed to remain within the family
Table 12 Annual income of the targeted households including opportunity cost of family labor (in US$) Year Intervention A Intervention B Intervention C 2012 ndash15244 ndash11927 ndash8886 2013 5372 3492 ndash3192 2014 27694 20650 20733 2015 27694 18620 18667 2016ndash2022 27694 27694 27694
The net income decrease in the first years of the interventions will occur because of the equity contribution The annual increase in income presented in table 12 includes the opportunity cost of family labor spent on the beekeeping activities Each householdrsquos net income over the 11-year evaluation period will be US$121304 for Intervention A US$110868 for Intervention B and US$108033 for Intervention C
The other beneficiary of the intervention will be the government for the following reasons
The government will benefit directly from the taxes collected on the inputs and outputs of the intervention Plastic containers honey extractor sugar and so forth are importable to Ethiopia The total tax rate applied to these inputs is higher than the foreign exchange premium The inflow of taxes will reduce the economic cost below its financial cost and generate tax revenue for the government of Ethiopia
Modern beehives and smokers are produced domestically so they are assumed to be internationally non-tradable goods The inputs used to produce beehives and smokers such as stainless steel nails and covers are exportable to Ethiopia Again the total tax rate applied to these inputs will be higher than the FEP thus generating tax revenue for the government of Ethiopia
The government will also benefit indirectly because honey is exported from Ethiopia Exports allow the country to earn foreign exchange
The total amount of government benefits from the interventions over the 11-year period per household has been estimated to be US$22928 for Intervention A and US$21027 for Interventions B and C
The values of stakeholder gains under each of the interventions are presented in table 13 below
27
Cost Benefit Analysis of the GRAD Honey Value Chain November 2012
Table 13 Stakeholder and beneficiary impacts of the project (in US$)
Intervention A Intervention B Intervention C
Economic NPV (FNPV + externalities)
113092 100774 100774
Financial NPV (households) 90640 79666 79002 Externalities 22451 21108 21772
o Government 22928 21027 21027 o Financing
contribution ndash477 080 745
The financing contribution will be the amount of the interest and other charges paid on the three loans provided by MFIs over and above a real cost of 12 percent This figure represents a transfer of resources between the households and the MFIs USAIDEthiopia generally negotiates subsidized interest rates for households benefiting from aid programs The negative financing contribution in the case of Intervention A represents a direct subsidy to the targeted households that will be created through the submarket interest rate In the case of the GRAD project the subsidized interest rate will be 15 percent which is 5 percent below the current level of inflation in Ethiopia However the additional fees charged by the MFIs to make them willing to provide loans will more than offset the subsidy content of the interest rate paid on the loan in the case of Interventions B and C
Exact information regarding the number of households that will engage in beekeeping activities does not exist but assuming that 70 percent of the chronically food-insecure households participate (the main group of the GRAD beneficiaries)mdashthat is 70 percent of 50000 households will participate in beekeeping eventually (not necessary in year 1 of the project)mdashit is possible to calculate combined stakeholder and beneficiary impacts of the project Figures are presented in Table 14
Table 14 Combined stakeholder and beneficiary impacts of 35000 households in the project (in thousands US$)
28
Intervention A Intervention B Intervention C Economic NPV (FNPV + externalities)
3958220 3527090 3527090
Financial NPV (households) 3172400 2788310 2765070 Externalities 785785 738780 762020
o Government 802480 735945 735945 o Financing
contribution ndash16695 ndash2800 26075
SENSITIVITY ANALYSIS
A sensitivity analysis for the GRAD honey value chain intervention has been performed using the key variables that will be prone to change and likely to influence the situation of the households engaged in the project These variables include the price and yield of honey as well as their joint impact Details related to this sensitivity analysis are outlined in tables 15 16 17 and 18 below
Cost Benefit Analysis of the GRAD Honey Value Chain November 2012
The Joint Impact of Honey Price and Yield of the FNPV for Intervention A
Because prices and yields of honey are two of the most important factors that will influence the householdsrsquo income it is prudent to consider the possible impacts of changing one of their values in a sensitivity analysis The joint impact of these two variables for Intervention A is presented in table 15 below
Table 15 The joint impact of honey price and yield on the FNPV of households for Intervention A
Yield (in kg) 1200 1500 1700 1900 2100
4300 30850 51891 65918 82823 100599
4500 34924 56943 72174 90640 109417
5000 45108 69575 89659 110471 131558
6000 65477 100066 125232 150535 175839
7000 87799 131558 161079 190600 220121 Price (in ETB)
Table 15 shows the joint impact of the honey price and honey yield on the FNPV under Intervention A (three modern beehives with related tools and training) The scenario for this analysis has assumed that the price of honey will be ETB 45kg and the yield will be 19 kground (This honey price has been based on the assumption that the household will produce yellow honey which fetches lower prices in the domestic market) Under these circumstances the FNPV will be US$90640 But it is safe to assume that given the current high demand and rather low supply of honey in the domestic market the price of yellow honey will increase in the future Therefore the FNPV will likely be higher Even in the worst-case scenario if prices were to drop to ETB 43kg and the yield were to decrease from 19 kground to 12 kground the FNPV will still be positive at US$30850 which indicates very low risk of intervention failure at the household level
Table 16 The joint impact of honey price and yield on the net cash flow of households for Intervention A
Yield (in kg) 1200 1500 1700 1900 2100
4300 10188 14611 17560 20508 23457
4500 11011 15640 18725 21811 24897
5000 13068 18211 21640 25068 28497
6000 17183 23354 27468 31583 35697
7000 21297 28497 33297 38097 42897 Price (in ETB)
Table 16 presents the joint impact of honey yield and price on the net cash flow of the targeted households in 2014 and after when the loan will be repaid and cash flows will be stable Under the baseline scenario the annual net cash flow will be US$21811 If the price were ETB 7000 and the yield were 19 kg the net cash flow will reach US$38097 which is even higher than the targeted income increase of US$36500 Currently however only white honey will be able to fetch such high price levels in the domestic market The findings suggest that households in the areas where bees produce white honey will easily reach the targeted increase in income
29
Cost Benefit Analysis of the GRAD Honey Value Chain November 2012
Table 17 presents the joint impact of honey price and honey yield on the FNPV under Intervention B The FNPV in this case will be US$79666 In the worst-case scenario the FNPV will be lower under Intervention B than under Intervention A but will still be positive at US$22711 which again indicates low risk
Table 17 The joint impact of honey price and yield on the FNPV of households for Intervention B
Yield (in kg) 1200 1500 1700 1900 2100
4300 22721 43762 57790 72936 88169
4500 26636 48655 63725 79666 95644
5000 36422 61069 78781 96534 114429
6000 55995 87637 109059 130542 152025
7000 77009 114429 139493 164557 189621 Price (In ETB) Price (in ETB)
Table 18 describes the joint impact of honey price and yield on the annual net cash flow of the beneficiaries of Intervention B after 2016 when both of the loans will be repaid and cash flows will be stable The baseline scenario will yield a net annual cash flow of US$21811 If the price of white honey were to reach ETB 7000 the net increase in annual income excluding the opportunity cost of family labor will reach US$38097 holding the yield constant This figure is again higher than the targeted increase of US$36500
Table 18 The joint impact of honey price and yield on the FNPV of households for Intervention B
Yield (in kg) 1200 1500 1700 1900 2100
4300 10188 14611 17560 20508 23457
4500 11011 15640 18725 21811 24897
5000 13068 18211 21640 25068 28497
6000 17183 23354 27468 31583 35697
7000 21297 28497 33297 38097 42897 Price (in ETB)
If the nationwide production of honey continue to be limited and with the increasing popularity of good-quality honey the prices may go higher In the best-case scenario for Intervention A if prices were to reach ETB 70kg (more relevant price for white honey) and yields were to reach 21 kground the FNPV will be US$220121 In Intervention B under the same circumstances the FNPV will reach US$189621 The net annual cash flow accruing to the households at this combination of yield and price will provide an additional US$42897 per year after the loan has been paid in 2013 under Intervention A and in 2015 under Intervention B If domestic production could be substantially increased it is likely that the processing costs and perhaps the fob price for honey exports will fall allowing Ethiopian honey to become more competitive in the international market
30
RECOMMENDATIONS
Interventions A and B show a good potential for a substantial increase in income and economic impact for the households targeted by the GRAD project USAID should support their implementation They appear to have the ability to improve the livelihood and food security of the targeted households That said regardless of their potential Interventions A and B on their own may not guarantee an increase of US$365 in the householdsrsquo yearly income as hoped for in the GRAD proposal However when combined with other income-generating activities they may allow households to achieve the additional US$365year Another important benefit of these interventions is the almost nonexistent requirements for land Taking into consideration the very limited land holdings of GRAD beneficiaries and their almost complete reliance on this land as a source of income these interventions are attractive because they will allow households to earn additional income without changing their current land usage An intervention will also allow households to benefit from an additional MFI loan in year 3 after complete repayment of the initial loan for honey production for purchasing more beehives or participating in other proposed GRAD interventions such as haricot beans production Therefore it will be advisable to combine this intervention with another commodity intervention proposed in the GRAD project introducing them as a ldquopackage solutionrdquo to achieve the desired increase in householdsrsquo yearly income
It is debatable whether farmers will be able to repay a free market interest loan at 50 percent interest if they need to borrow their ldquoequityrdquo contributions Taking into consideration that the farmers will first try to repay the free market loan the risk of default on the USAID loan will be high The debt service from the two loans will be so significant that farmers may either refuse to participate in the beekeeping intervention or fail to repay the USAID-backed loan Many GRAD households have no access to free market loans as their current financial situation is such that financial institutions are unwilling to lend money to them Reducing the required amount of money necessary for a down payment might better facilitate the implementation of Intervention A ensuring that the targeted households will be able to join the project and benefit from its outcome
The analysis also reveals that Intervention B which has been designed to eliminate the equity contribution for households that will not be able to take a financial stake in the investment will eventually require the households to contribute other resources to repay their debt services This structure however may be preferred by many farmers because the equity contribution will be divided into two parts thus making it easier for them to find the required financial resources
In summary it is recommended that the burden of the initial down payment (28 percent) that is required from each targeted household to participate in the GRAD intervention in the honey value chain be lessened An ideal financing package will eliminate the down-payment requirements by increasing the size of the USAID-backed loan and increasing the length of the repayment period for Intervention A to 3 years In principal it is a good practice to require households to take a financial stake in the project by forcing them to contribute their own money yet such a system might prevent some farmers from choosing honey production as an intervention
Cost Benefit Analysis of the GRAD Honey Value Chain November 2012 31
REFERENCES
Abebe A (2009) Market Chain Analysis of Honey Production in Atsbi Wemberta District Eastern Zone of Tigray National Regional State Department of Agricultural Economics School of Graduate Studies Haramaya University
Agonafir J (2005) Strategic Intervention Plan on Honey and Beeswax Value Chains SNV Support to Business Organizations and Their Access to Market (BOAM)
Alemseged T and Yildiz N (2008) Beekeeping and Honey Production in the Tigray Region Ethiopia African Services Committee
Alemtsehay T (2011) Seasonal Availability of Common Bee Flora in Relation to Land Use and Colony Performance in Gergera Watershed Atsbi Wembwrta District Eastern Tigray Ethiopia Master Thesis Hawassa University
Anand S and Sisay G (2011) Engaging Smallholders in Value Chains Creating New Opportunities for Beekeepers in Ethiopia Programme Insights
APM Consul PLC (2008) A Study on Private Sector Linkages for Bee Product Producers in Bale Bale Regional Sustainable Management Program
Belie T (2009) Honeybee Production and Marketing Systems Constraints and Opportunities in Burie District of Amhara Region Ethiopia Department of Animal Science and Technology School of Graduate Studies Bahir Dar University
Chala K Taye T Kebede D and Tadele T (2012) Opportunities and Challenges of Honey Production in Gomma District of Jimma Zone South-West Ethiopia Journal of Agricultural Extension and Rural Development 4(4) 85ndash91
Desalegn B (2007) Assessment of the Effect of Ant (Dorylus fulvus) on Honeybee Colony (A mellifera) and Their Products in West and South-West Shewa Zones Ethiopia Ethiopian Journal of Animal Production 7(1) 12ndash26
Graduation With Resilience to Achieve Sustainable Development (GRAD) Technical Proposal July 20 2012
Jenkins G Kuo CY and Harberger A (2011) Cost-Benefit Analysis for Investment Decision Queenrsquos University August 2012 edition
Kuo CY (2011) Estimates of the Foreign Exchange Premium and the Premium for Non-Tradable Outlays for Countries in Africa John Deutsch International Department of Economics Queenrsquos University Canada
Shiferaw A Jaleta M Gebremedhin B and Hoekstra D (2010) Increasing Economic Benefit From Apiculture Through Value Chain Development Approach The Case of Alaba Special District Southern Ethiopia IPMS Ethiopia
Cost Benefit Analysis of the GRAD Honey Value Chain November 2012 32
Tadesse B and Phillips D (2007) Ensuring Small-Scale Producers in Ethiopia to Achieve Sustainable and Fair Access to Honey Markets International Development Enterprises (IDE) and Ethiopian Society for Appropriate Technology (ESAT)
Workneh A and Ranjitha P (2011) Beekeeping Subsector Challenges and Constraints in Atsbi Wemberta District of Eastern Zone Tigray Region Ethiopia Journal of Agricultural Extension and Rural Development 3(1) Z8ndashZ12
Yigzaw D Hoekstra D Berhe K Derso T and Mehari Y (2010) Smallholder Apiculture Development in Bure Ethiopia Experiences From IPMS Project Interventions IPMS Ethiopia
Yirga G Koru B Kidane D and Mebrahatu A (2012) Assessment of Beekeeping Practices in Asgede Tsimbla District Northern Ethiopia Absconding Bee Forage and Bee Pests African Journal of Agricultural Research 7(1) 1ndash5
Yirga G and Teferi M (2010) Participatory Technology and Constraints Assessment to Improve the Livelihood of Beekeepers in Tigray Region Northern Ethiopia Biology Department College of Natural and Computational Sciences Mekelle University
Cost Benefit Analysis of the GRAD Honey Value Chain November 2012 33
Cost Benefit Analysis of the GRAD Honey Value Chain November 2012
APPENDIX
Table A The FtF indicators proposed for the monitoring and evaluation of the GRAD project
Results Indicator Target
Overall objective To graduate chronically food-insecure households from food support
Graduation of chronically food-insecure households from food aid by increasing their yearly household income
50000 households that will experience an increase in yearly income of US$365 by year 5
Result 1 Enhanced livelihood options for chronically food-insecure households
45-2 Number of jobs attributed to FtF implementation (RiA) ndashdelete it
Higher is better
3191-3 and 47-4 Prevalence of households with moderate or severe hunger (RiA)
Lower is better
Result 2 Improved community and household resilience
319-16 Prevalence of underweight children under 5 years of age (R)-delete it
Lower is better
319-13 Prevalence of underweight women (R)
Lower is better
319-4 and 3191-4 Prevalence of exclusive breastfeeding of children under 6 months of age (RiA)
Lower is better
319-11 Prevalence of stunted children under 5 years of age (R)
Lower is better
452-14 Number of vulnerable households benefiting directly from USG assistance (S)
Lower is better
Result 3 Strengthened enabling environment to promote scale-up and sustainability
45 Womenrsquos Empowerment in Agriculture Index Score (R)
Higher is better
451-27 and CBLD-5 Percentage of combined key areas of organization capacity among USG direct and indirect local implementing partner levels
Higher is better
34
Cost Benefit Analysis of the GRAD Honey Value Chain November 2012
452-38 Value of new private sector investment in the agriculture sector or food chain leveraged by FtF implementation (RiA)
Higher is better
Table B List of CFs used to make adjustments in the economic analysis for both interventions
Summary of CFs Honey 109 Transportation 084 Labor 100 Modern beehive 085 Transitional beehive 100 Bee colony 100 Queen excluder 085 Wax (ETBkg) 106 Smoker 085 Overall coat 073 Veil 073 Glove 080 Extractor 082 Wax mold 100 Plastic honey container 075 Beehive maintenance 100 Rental value of land 100 Sugar 079
35
Cost Benefit Analysis of the GRAD Honey Value Chain November 2012
Table of Contents
ACRONYMS 5
EXECUTIVE SUMMARY 6
THE GRAD HONEY VALUE CHAIN COST-BENEFIT ANALYSIS 10
METHODOLOGY 10 Project Background 10 Commodity Background 12
Honey Production in Ethiopia 12 Current Market Situation in the Ethiopian Honey Sector 12
Project Description and Activities 13 GRAD Project Interventions in the Honey Value Chain 13 Assumptions for the Selected GRAD Interventions in the Honey Value Chainhelliphelliphelliphelliphelliphellip15
PROJECT MODELING 16
FINDINGS 17 Financial Analysis 17 Comparison of Interventions A and B23 Economic Analysis 23
STAKEHOLDER AND BENEFICIARY ANALYSIS 25
SENSITIVITY ANALYSIS 28
The Joint Impact of Honey Price and Yield of the FNPV for Intervention A 29
RECOMMENDATIONS 31
REFERENCES 32
APPENDIX 34
3
ACKNOWLEDGMENTS
The LEAP team appreciates the assistance received from many people during its field visits to Tigray and Amhara in July 2012 including the representatives of USAID ACDIVOCA CARE SNV Holeta and Andasa Research Centers Zembaba Union of Cooperatives Ethiopian Apiculture Board and the owners of agribusiness enterprises in the honey sector Beza Mar Comel Dimma Tsedey-Mar and Rahi Honey Agro Industry Special thanks are also directed to many small-scale farmers and local traders unknown by name who were interviewed so the team could obtain a clear picture of the situation in the Ethiopian honey sector Their assistance is greatly appreciated This report has benefited from the comments and suggestions of the reviewers of the previous draft report
Cost Benefit Analysis of the GRAD Honey Value Chain November 2012 4
Cost Benefit Analysis of the GRAD Honey Value Chain November 2012
ACRONYMS
AGP Agriculture Growth Program CARE Implementing Organization CBA Cost Benefit Analysis CF Conversion Factor CRS Catholic Relief Services CSA Central Statistical Agency of Ethiopia ENPV Economic Net Present Value ETB Ethiopian Birr (Currency) FEP Foreign Exchange Premium FNPV Financial Net Present Value FtF Feed the Future (Program) GDP Gross Domestic Product GRAD Graduation With Resilience to Achieve
Sustainable Development (Project) Ha Hectare kg Kilogram MFI Microfinance Institutions NPV Net Present Value ORDA Organization for Rehabilitation and
Development in Amhara PSNP Productive Safety Net Program Plus REST Relief Society of Tigray RUSACCO Rural Saving and Credit Cooperatives SADSCR Semiannual Debt Service Coverage Ratio SNV Netherlands Development Agency US$ United States Dollar USAID United States Agency for International
Development
5
EXECUTIVE SUMMARY
Project Description USAIDEthiopia started to implement the Graduation With Resilience to Achieve Sustainable Development (GRAD) project in 2012 The main purpose of the GRAD project is to graduate 50000 chronically food-insecure Ethiopian households (out of the 65000 targeted) by facilitating an increase in their yearly income by US$365householdyear The main objectives that the project aims to achieve are
1 to enhance livelihood options of chronically food-insecure households in Highlands areas 2 to improve household and community resilience and 3 to strengthen an enabling environment to promote scale-up and sustainability
A special emphasis of this project is the inclusion of women and the creation of non-gender-biased income opportunities improved cooperation between stakeholders and the creation of accountability for the beneficiaries of the project
To facilitate the proper implementation of the project and the flow of necessary financial resources for the targeted households USAID established a US$2-million loan-credit guarantee fund that will be available to lending institutions microfinance institutions (MFI) and rural savings and credit cooperatives (RUSACCO) so these institutions can supply the necessary loans to the targeted households for undertaking the GRAD interventions
The implementers of the GRAD project include CARE the Relief Society of Tigray (REST) the Organization for Rehabilitation and Development in Amhara (ORDA) Catholic Relief Services (CRS) and the Netherlands Development Agency (SNV)
The GRAD project proposes interventions in four commodity value chains honey meat vegetables and pulses The investment plan for GRAD households designed by SNV Ethiopia proposes fattening interventions for small ruminants as well as for cattle in the meat value chain but the analysis for the meat value chain has been carried out for the shoats-fattening intervention only These value chainsmdashhoney meat vegetables and pulsesmdashwere chosen because of their suitability for chronically food-insecure households and the rather low initial investment costs necessary for their implementation1
Strategic Context and Rationale The GRAD project is a part of USAIDrsquos wider Feed the Future (FtF) agenda which prioritizes investments in agriculture and nutrition The project particularly aims to facilitate improvements in the commodity value chains to make them more inclusive and efficient for chronically food-insecure households
Promotion of these inclusive commodity value chains will facilitate market access for these households which in turn will increase their yearly income decrease their current food insecurity and allow them to profit from newly established or improved market linkages
The GRAD project proposes two intervention packages in the honey value chain Intervention A will introduce three modern beehives with tools and appropriate training regarding modern honey-production methods starting in year 1 Intervention B will initially introduce two transitional beehives and one modern beehive with tools and training but by the beginning of the year 3 participants will transition to the use of modern beehives only
1 Suitability is defined in terms of the ease in implementation Preferably a number of the food-insecure households already have experience producing some of these commodities
Cost Benefit Analysis of the GRAD Honey Value Chain November 2012 6
Cost Benefit Analysis of the GRAD Honey Value Chain November 2012
Description of the Interventions Regardless of which of the two interventions proposed for the honey value chain are selected each of the chronically food-insecure households targeted in this project will receive an investment loan for the initial purchase of beehives and necessary tools Intervention A includes the initial purchase of three modern beehives and necessary tools at year 1 of the project The amount of the loan required for the investment is above the amount that MFIs of Ethiopia are willing to provide for new clients It has been assumed that targeted households will contribute 28 percent equity capital of the total investment required hence reducing the required borrowing The household will repay this loan on a per-round basis (1 round = 6 months) with the first round being a grace period
Intervention B proposes the initial purchase of one modern beehive and two transitional beehives and necessary tools in year 1 of the project The transitional beehives will be replaced with two modern beehives at the end of year 2 of the project Two Intervention-B scenarios were analyzed Under the first scenario the households again have been assumed to contribute 28 percent of the required investment from the equity capital the second scenario was designed by eliminating 28 percent of the equity contribution from Intervention B The required funds for the replacement of transitional beehives under both scenarios will be obtained through an additional loan taken by the households from the MFIs after repayment of the initial loan In the following text the first scenario of intervention B is referred to as Intervention B and the second scenario is referred to as Intervention C
Financial and Economic Analysis Results The appraisal has been carried out over an 11-year period The analysis shows that at a financial discount rate of 12 percent each householdrsquos financial net present value (FNPV) for Intervention A is US$90640 The FNPV of Intervention B is US$79666 while the FNPV of Intervention C is US$79002 The economic net present value (ENPV) for Intervention A is US$113092 while it is US$100774 for Interventions B and C
In summary the FNPVs and ENPVs are positive for all proposed interventions with Intervention A showing a higher FNPV and ENPV
Table A SADSCRround for household for the interventions Intervention A Year 1 round 1 Year 1 round 2 Year 2 round 1 Year 2 round 2 SADSCR - 093 100 171 Intervention B Year 1 round 1 Year 1 round 2 Year 2 round 1 Year 2 round 2 SADSCR (first loan) - 093 093 141 SADSCR (second loan) 126 174 271 Intervention C Year 1 round 1 Year 1 round 2 Year 2 round 1 Year 2 round 2 SADSCR (first loan) 068 052 058 SADSCR (second loan) 127 175 272
Table A describes the semiannual debt service coverage ratios (SADSCRs) The debt service obligations are defined here to be the interest and principal that are due in a given period plus the debt service from the previous period that could not be paid due to inadequate net cash flow The opportunity cost of labor will be retained within the family and therefore can be treated as part of the cash flow available for debt servicing
In the case of Intervention A the households will face difficulty repaying their debt obligation only during the first repayment period The debt service of the second repayment period together with the unpaid debt service from the previous period will be repaid in round 1 of year 2
7
Cost Benefit Analysis of the GRAD Honey Value Chain November 2012
In the case of Intervention B when repayments are due in the first two rounds the SADSCRs are below one If these farmers are going to be expected to repay the loan this quickly they will have to draw on other sources of cash 2 In round 2 of year 2 the SADSCR reaches a value above 1 indicating that the financial situation of the households will stabilize and the initial loan will be repaid After that round the household will be able to get a new loan required for the complete transition toward modern beehives
The SADSCRs of Intervention C are below a value of 1 in all rounds indicating that households will not be able to repay their debt obligations without the contribution of financial resources generated by other activities The second loan however will be provided only for the households that will repay the previous loan hence households will have to draw on other resources of cash to repay the initial loan
The eventual necessity to contribute additional financial resources in Intervention C erases principal difference (no equity contribution) between Interventions B and C Intervention B will require households to initially invest 28 percent equity capital while Intervention C will split almost the same amount over two repayment rounds The present value of the equity contribution for Intervention B is ETB 120820 (US$6904) while the present value of the amount under Intervention C is ETB 109668 (US$6267) with ETB 67598 (US$3863) in the second round of year 1 and ETB 42070 (US$2404) in the first round of year 2
Beneficiary Analysis Results The results of the analysis reveal that the income of the targeted households will increase This annual increase in the income of the households under each intervention is presented in table B below
Table B Annual increase in the income of the households including opportunity cost of family labor (in US$) Year Intervention A Intervention B Intervention C
2012 ndash15244 ndash11927 ndash8886 2013 5372 3492 ndash3192 2014 27694 20650 20733 2015 27694 18620 18657
2016ndash2022 27694 27694 27694
The net income decrease in the first years of the interventions will occur because of the equity contribution The annual increase in income presented in table B includes the opportunity cost of family labor spent on the beekeeping activities Each householdrsquos net income over the 11-year evaluation period will be US$121304 for Intervention A US$110868 for Intervention B and US$108033 for Intervention C The other beneficiary of the intervention will be the Ethiopian government for the following reasons
The government will benefit directly from the taxes collected on the inputs and outputs of the intervention Plastic containers honey extractors sugar and so forth are importable to Ethiopia The total tax rate applied to these inputs is higher than the foreign exchange premium The inflow of taxes will reduce the economic cost below its financial cost and generate tax revenue for the government of Ethiopia
Modern beehives and smokers are produced domestically so they are assumed to be internationally nontradable goods The inputs used to produce beehives and smokers such as stainless steel nails and covers are exportable to Ethiopia Again the total tax rate applied
2 Other sources of cash refer to financial resources generated by the householdsrsquo activities except beekeeping activities
8
to these inputs is higher than the foreign exchange premium thus generating tax revenue for the government of Ethiopia
The government will also benefit indirectly because honey is exported from Ethiopia Exports allow the country to earn foreign exchange
The total amount of government benefits from the intervention over the 11-year period per household is estimated at US$22928 for Intervention A and US$21027 for Interventions B and C
Conclusions and Recommendations Expected returns on the modern beekeeping activities are dependent on the full list of inputs required for the proper implementation so none of the tools can be eliminated from the required investment A missing input such as a honey extractor will directly result in decreased quality or yield of honey Absence of other inputs such as gloves or overall coats may put the health of the beekeepers at risk because of the aggressiveness of Ethiopian bees Taking into consideration the financial situation of the GRAD beneficiaries it will be appropriate to share the most expensive inputs of production such as a honey extractor between groups of farmers
The loan amount from MFIs for new clients in 2012 is limited to ETB 4000 (US$22857) which is less than the required investment for all three interventions GRAD beneficiaries consist primarily of chronically food-insecure households The necessity of the equity contribution may limit the beneficiaries of the honey interventions to better-off groups of farmers It is suggested that the interventions be redesigned to allow farmers access to sufficient financial resources to start modern beekeeping activities without equity contribution If such loan amounts can be negotiated with MFIs by the implementers of the GRAD project the term of the loan should also be expanded to 3 years
In the case of Intervention B the total initial investment cost is ETB 4315 This amount is only slightly above the amount of ETB 4000 usually provided by MFIs hence reducing the requirements for an equity contribution Intervention B however has been analyzed assuming an equity contribution of 28 percent the analysis reveals that the households will be able to repay the loan although they should be allowed to move small fractions of the debt service to the next repayment period if necessary The repayment of the loan in turn will give them access to the next loan
In the case of Intervention C the total initial investment cost is also ETB 4315 Intervention C has been analyzed without assuming an equity contribution of 28 percent The increased debt service will not allow the households to repay their loan obligations without contributing additional financial resources If the first loan will not be repaid the households will not have access to the next loan required for the purchase of two modern beehives at the end of the intervention year 2
All three interventions require household equity contribution for successful implementation If this requirement can be erased Intervention A is recommended over Interventions B and C because its benefits outweigh its costs and indicate the likely success of this project Even though analyses of Interventions B and C also yield positive FNPV and ENPV values these NPVs are lower than those obtained in the analysis of Intervention A
There is no principal difference between Interventions B and C other than the distribution of the equity contribution over time The minimum equity contribution for Intervention B that will allow the households to repay the loan is 2463 percent
If money from the loan-guarantee fund will be used to cover the unpaid fractions of the loan in Intervention C thus allowing the households access to the loan required for the complete transition toward modern beehives the FNPV of the intervention will be US$87650 which is still below the FNPV of Intervention A The increase in the FNPV in this case is just a financial subsidy from USAID to the targeted households
Cost Benefit Analysis of the GRAD Honey Value Chain November 2012 9
THE GRAD HONEY VALUE CHAIN COST-BENEFIT ANALYSIS
METHODOLOGY
Project Background
Ethiopiarsquos economy is highly dependent on its agricultural production with agriculture accounting for about 46 percent of the countryrsquos gross domestic product (GDP) About 80 percent of Ethiopiarsquos total population lives in the rural areas and agricultural activities generate about 85 percent of the total employment in Ethiopia (USAID AGP-LGPPRIME Summary Proposal 2011)
USAIDEthiopia is one of the major donors providing support for the goal of making Ethiopiarsquos households more food self-sufficient It supports various initiatives related to increasing access to food for Ethiopiarsquos food-insecure households and emergency assistance USAIDrsquos working agenda in Ethiopia involves promoting increased agricultural productivity and developing viable commodity value chains that in turn will increase the level of food security and reduce the negative impacts of famine
Ethiopia is ranked among the top five fastest-growing countries in the world with real GDP growth reaching 75 percent in 2011 (The World Factbook CIA) Despite its currently impressive economic growth rate Ethiopia has not been able to achieve a level of agricultural production that leads to food self-sufficiency It still is home to about 8 million people who remain chronically food insecure with the vast majority of them living in the rural areas About 60 percent of rural households experience food shortages between June and October each year (USAID AGP-LGPPRIME Summary Proposal 2011)
For these reasons the GRAD project concentrates on improving the value chains for several commodities The project addresses the need to develop profitable and functional value chains that include chronically food-insecure households to provide them with opportunities to profit from improved or newly established market linkages
The majority of Ethiopian households in the rural areas cultivate low-value cash crops and live with poor access to commodity markets and financial services They often lack proper market information or are not able to benefit from available market linkages Food-security improvements are likely to come from their inclusion in the commodity value chain cycle
The GRAD project plans to first target 65000 households of which 58500 are chronically food insecure and 6500 are labeled as ldquoUltra Poorrdquo 3 A secondary target group involves 10000 households that can be categorized as food-sufficient households (6000) or food-secure households (4000) This second targeted group is intended to act as a role model for the first GRAD group of households Of the 65000 targeted households the 5-year-long GRAD project aims to graduate 50000 households
Specifically the GRAD project aims to achieve the following goals
1 Enhance the livelihood options of chronically food-insecure households in Highlands areas 2 Improve household and community resilience 3 Strengthen the enabling environment to promote scale-up and sustainability
3 ldquoUltra Poorrdquo households include female-headed households and landless youth
Cost Benefit Analysis of the GRAD Honey Value Chain November 2012 10
To ensure future success in the implementation of the GRAD project USAIDEthiopia plans to cooperate with several implementing agencies that are well-known experts in the areas of food security and commodity value chain development These technical partnersmdashCARE the Relief Society of Tigray (REST) the Organization for Rehabilitation and Development in Amhara (ORDA) Catholic Relief Services (CRS) and the Netherlands Development Agency (SNV)mdash possess the required expertise and hands-on experience from implementing similar projects in Ethiopia and elsewhere
The chronically food-insecure families who are the subjects of the GRAD project are located in 16 woredas in four regions of Ethiopia SNNPR Tigray Amhara and Oromia4 The selection of these woredas was based on their proximity to the Agriculture Growth Program (AGP) and active markets that will facilitate opportunities for engaging in local based commodity trading
The market linkages established during the lifetime of this project will connect chronically food-insecure households with locally based traders and facilitate the sales of commodities for income generation by this targeted group of households
In addition the GRAD project aims to correct the shortcomings experienced in the Productive Safety Net Program Plus (PSNP) project by facilitating an increase in the yearly income of chronically food-insecure households The objective of the chosen interventions is to increase each householdrsquos yearly income by US$365 (or US$1day) by the end of the project It is possible that this objective will not be met if such households engage in just one additional commodity value chain In such cases a combination of commodity value chains will be suggested to achieve the desired increase in the householdsrsquo income level
The GRAD project will emphasize gender equality and the inclusion of women via cooperation between stakeholders and a widely understood accountability to beneficiaries
USAID will facilitate the implementation of this project by establishing a credit-guarantee fund of US$2 million This guaranteed fund will enable the flow of credit resources necessary for the chronically food-insecure households to engage in the commodity production The distribution of financial resources will be handled by microlending institutions MFIs and RUSACCO One additional benefit of this credit guarantee will be to spread the financial risk between the implementing agency and the financial organizations that are responsible for lending to the targeted households
Four commodity value chains are being proposed for the GRAD project honey pulses vegetables and meat The choice of these value chains is based on their simplicity in terms of the necessary knowledge required for their introduction and the rather low initial start-up costs needed to engage in their production The value chains of these commodities show a good potential for postgraduation production increases and marketing Demand for all these commodities is growing in the domestic market (Ethiopian) and export markets
The list of the key FtF indicators proposed for monitoring and evaluating the GRAD projectrsquos performance is presented in table A in the appendix
4 As per the CARE proposal
Cost Benefit Analysis of the GRAD Honey Value Chain November 2012 11
Commodity Background
Honey Production in Ethiopia
Ethiopia has a long tradition of honey production reaching back many centuriesmdashin fact the longest tradition of honey and beeswax marketing in Africa Despite this long tradition honey production in Ethiopia is still treated as a supplemental on-farm activity that is usually combined with crop cultivation and animal husbandry A vast majority of the honey produced in Ethiopia comes from traditional beehives which currently are the most common form of technology used for honey production in Ethiopia As of 2011 Ethiopia possessed about 49 million traditional beehives which constitutes about 9557 percent of the total number of beehives in Ethiopia Currently only about 81500 transitional beehives (commonly called Kenya top bar hives) and 140000 modern beehives exist (CSA Agricultural Survey Report 2012) The total quantity of honey produced in Ethiopia in 2010ndash11 was about 399 million kilograms (kg) Almost all honey that is currently produced in Ethiopia (about 98 percent of the total yearly production) is consumed in the domestic market with only about 2 percent of the total yearly production being exported
Ethiopia has about 14ndash17 million households that are engaged in beekeeping and produce different types of honey that vary regionally as well as in terms of color consistency and purity The most in-demand honey among Ethiopians comes from Eastern Tigray where bees forage on the regionally specific Tebeb plant (Basium clandiforbium) and produce distinctive low-moisture white honey Other types of honey produced include Lalibela honey (Acacia honey) multifloral yellow honey dark brown honey and crude red honey (mainly used for the production of tej an Ethiopian drink with low alcohol content)
Current Market Situation in the Ethiopian Honey Sector
The sectorrsquos current market situation is characterized by a strong domestic demand and relatively low supply of table honey resulting in rising domestic prices for honey Producer prices differ by region and type of honey The most expensive is Eastern Tigrayrsquos white honey where the current retail price is ETB 17000kg Lower retail prices (of around ETB 60ndash9000kg) are observed for other varieties of white honey depending on the area and the honeyrsquos characteristics The retail prices for yellow honey are around ETB 50ndash6000kg while the least expensive red honey is sold at a price of around ETB 45ndash50kg5 This current market situation in the Ethiopian honey sector and producersrsquo overreliance on traditional technology are influenced by several factors
1 The use of traditional methods in the honey production The most commonly used method of honey production in Ethiopia relies on traditional beehives that are usually handmade from old logs found in the forest These beehives present low-productivity rates (around 5ndash7kgbeehiveyear) and low-quality honey that contains brood wax and other impurities The yield from transitional and modern beehives is significantly higher (8ndash15kgtransitional beehive and 15ndash20kgmodern beehive) and these improved beehives produce better-quality honey as well
2 The lack of financial resources that would allow the beekeepers to obtain modern beehives Small-scale farmers who are interested in beekeeping find it difficult to obtain the financial resources necessary to acquire transitional or modern beehives They possess few private financial resources and usually are unable to obtain the credit required to borrow capital
5 The honey retail prices were obtained during field interviews in Tigray and Amhara in July 2012
Cost Benefit Analysis of the GRAD Honey Value Chain November 2012 12
These financial barriers therefore do not allow them to switch from traditional to modern technology
3 Somewhat poor access to the tools necessary to start honey production with modern beehives Some beekeepers possess modern beehives (just boxes) yet do not have any of the tools required for the proper management of these beehives (eg smoker queen excluder honey extractor etc) This situation results in the production of honey within modern-style beehives but with yields and quality comparable to that of honey coming from traditional beehives
4 Lack of proper training on the management of the modern-style apiary Beekeepers who try to switch to modern-style honey production usually do not have the skills necessary for the proper management of modern beehives They maintain their beehives poorly using primitive harvesting methods and inappropriate tools Due to their lack of training they do not provide additional feed (water and sugar syrup) during droughts and have little knowledge of quality requirements in the honey market
5 Other associated obstacles Other barriers include the disappearance of desirable bee forage due to crop intensification and the growing use of agrochemicals extreme weather conditions in some parts of Ethiopia (droughts) poor transportation infrastructure and the lack of knowledge about proper storage techniques (at both the farm and the local honey collectorstraders levels)
Project Description and Activities
The inclusion of the honey value chain in the GRAD project is based on several factors that positively affect this commodityrsquos economic potential and its suitability for chronically food-insecure households One of the factors contributing to the inclusion of the honey value chain is that the labor and land requirements for modern honey-production techniques are relatively low The amount of land necessary for the establishment of an apiary with three modern beehives is 0001 hectares (Ha) with labor requirements of about 107 hoursround6 These low land requirements are especially helpful in the case of food-insecure households which on average possess no more than 025 Ha of land Modern-style honey production is also able to create non-gender-biased employment and income opportunities Honey production is neither physically strenuous nor culturally assigned to men and it is a ready source of cash hence it is ideally suited for female participation Given the traditional-style beekeeping experience that some of the households targeted in the GRAD project possess the inclusion of the honey value chain in the GRAD project has a solid rational basis
GRAD Project Interventions in the Honey Value Chain
Two honey value chain interventions in this GRAD project are being proposed for implementation both with the goal of improving honey-production techniques Intervention A will introduce three modern beehives related maintenance tools and appropriate training All investments will be made starting in year 1 of the intervention in modern honey-production techniques The amount of the investment required for the Intervention A is much higher than the usual amount available for new clients of MFIs operating in Ethiopia thus necessitating household equity contribution The main targeted beneficiaries of the GRAD project are chronically food-insecure households which may not have financial resources to make the contribution The second proposed intervention would overcome this barrier
6 A round refers to a 6-month period of time
Cost Benefit Analysis of the GRAD Honey Value Chain November 2012 13
Cost Benefit Analysis of the GRAD Honey Value Chain November 2012
Intervention B will introduce two transitional beehives and one modern beehive related maintenance tools and training A progressive transition will be made toward the exclusive use of modern beehives at the beginning of year 3 The total initial investment cost of the Intervention B will be ETB 4315 which is much lower than the total investment cost of Intervention A (ETB 7205) and only slightly above ETB 40007 Two versions of Intervention B have been analyzed Under the first scenario the households have been assumed to contribute 28 percent of the required investment but this contribution will be significantly smaller than 28 percent of the investment cost of the more expensive Intervention A This scenario is referred to as Intervention B in the following text The alternate scenario will eliminate the 28 percent equity contribution required for Intervention B and is referred to as Intervention C in the following text The required funds needed for the replacement of transitional beehives under both scenarios will be obtained through an additional loan taken by the households from the MFIs after repayment of the initial loan
Table 1 below shows a detailed outline of the specific investment expenditures associated with each of the proposed interventions
Table 1 Total investment expenditures for Interventions A B and C8
Input Intervention A Intervention B and C
(year 1)
Intervention B and C
(year 3) Modern beehives (3 for A 1 for B) 3300 1100 2200 Bee colony 2100 700 Queen excluder 330 110 220 Wax (ETBkg) 405 135 270 Smoker 140 140 Overall coat 150 150 Veil 90 90 Glove 80 80 Extractor 3209 320 Wax mold 150 150 Bee forage seedling or seeds 50 50 Plastic honey container 90 90 Transitional beehives (2) 0 200 Bee colony for transitional beehives (2) 0 1000 Total10 7205 4315 2690
Assumptions for the Selected GRAD Interventions in the Honey Value Chain
1 The GRAD-targeted chronically food-insecure households that will engage in the modern-style honey production will each be provided with a microloan necessary to purchase the
9 It has been assumed that an extractor and a wax mold will be shared by a group of households due to the equipmentrsquos relatively high prices10 Total investment and operating costs (including labor and additional feed for bees) for the first year and first round of the intervention will be ETB 769653 (nominal) for Intervention A and ETB 502653 (nominal) for Intervention B
7 The total amount of loan available for the new clients of MFIs is ETB 4000 8 Total investment expenditures for Intervention A three modern beehives with tools and appropriate training starting in year 1 Total investment expenditures for Intervention B two transitional beehives plus one modern beehive with tools and training starting in year 1 with progressive transition into all modern beehives by year 3 (in ETB)
14
required inputs It has been assumed that each targeted household possesses assets that can be sold to obtain cash (eg livestock) or has personal savings that can be used to provide a down payment 11 The size of this loan will vary according to the intervention With the required 28 percent participant contribution the necessary loan for Intervention A (covering three modern beehives starting in year 1 maintenance tools and training) will be ETB 5825household In the case of Intervention B (covering two transitional beehives and one modern beehive maintenance tools training and progressive transition into all modern beehives by the end of year 2) the size of the first loan will be ETB 3495household For financing the investment needed for the transition to using all modern beehives no equity contribution will be required and the amount of the second loan will be ETB 3028household The financing of the investment in Intervention C will occur without equity contribution The ability of the households to repay the initial loan for Interventions B and C will be very critical because it will determine the availability of the next loan required for the complete transition toward modern beehives
2 Training will be provided free of charge so targeted households will not incur any costs related to training (except the opportunity cost of time they spend being trained)
3 The microloan necessary for purchasing the required inputs will be provided at a subsidized interest rate of 15 percent Additional fees associated with this loan will include a service charge (1 percent) loan insurance (1 percent) upfront savings (10 percent) and a passbook fee (ETB 15) This loan will be for a period of 2 years with a grace period of 6 months Each household will make semiannual loan repayments for a total of three repayments of the loan principal12 The upfront savings (10 percent) will be returned to the households after the loan has been repaid There will be no interest renewed on the upfront savings
4 In the case of Interventions B and C households will need to replace the transitional beehives with modern ones in year 3 It has been assumed that they will cover the costs of the second loan after repaying the initial loan It has also been assumed that a down payment will not be needed for the second loan because the required amount is far below ETB 10000 (the amount provided by MFIs to clients who repaid the first loan and have good reputations)
5 It has been assumed that in the case where a household is not able to repay the total amount of its loan principal due in a particular round this amount will be transferred to the next round together with the incurred interest rate on the total outstanding amount This procedure will be repeated until the total loan amount is repaid13
6 It has also been assumed that each household will be able to harvest honey only one time in year 1 of Intervention A B or C In subsequent years it has been assumed that harvesting will happen twice annually For Intervention A it has been assumed that the average yield from each modern beehiveharvest will be 19 kgyear14 For Intervention B the same yield has been assumed in the case of modern beehive while the average yield from each transitional beehive has been assumed to be 8 kgyear
7 The household consumption of honey for both interventions has been assumed to be 5 kghouseholdround For Interventions B and C it has also been assumed that a household will consume lower-quality honey that comes from the transitional beehives and sell the honey from the modern beehives because it will fetch a higher price and thus allow the farmer to repay the loan faster
11 This ldquoafter down paymentrdquo loan amount in both cases includes investment expenditures as well as service charge loan insurance upfront savings and passbook fee12 In the first year of each intervention only one repayment has been assumed (in round 2) 13 Loan description provided by CARE 14 Such yield will be possible to obtain because of training that will improve a householdrsquos knowledge of modern beekeeping (eg the necessity for additional feedings and bee-forage planting)
Cost Benefit Analysis of the GRAD Honey Value Chain November 2012 15
8 The necessary operating costs for both interventions in the first round will include bee-feeding costs of ETB 14175 land-rental costs of ETB 040 and labor costs of ETB 34938 It has been assumed that households will provide the necessary labor for beehive maintenance so the labor required to maintain the beehives will not represent a cash burden
9 The cost of beehive maintenance (per round) has been set at 5 percent of the initial cost of the beehive for both interventions It has been assumed that households will use locally available materials and family labor for this purpose
10 The lifespan for the modern beehive for both interventions has been assumed to be 11 years which will be equal to the lifespan of the project15 In the case of Intervention B the lifespan for the transitional beehive is 2 years because at that point they will be replaced with modern beehives It has been assumed that farmers will just replace transitional beehives with modern versions (not add two modern beehives) because of two reasons
a Households keep modern beehives in the residential area to prevent them from being stolen Such a security system puts a constraint on the quantity of bee colonies that can be held by households because of the potential danger to the families
b The cost of the bee colony is much higher than the cost of transitional beehives so moving existing bee colonies from transitional beehives to modern ones instead of obtaining new bee colonies makes economic sense
11 In this analysis the farm-gate price of yellow honey has been assumed to be ETB 45kg for modern beehives and ETB 43kg for transitional beehives16
12 For Interventions B and C it has been assumed that households will replace their transitional beehives with modern ones at the beginning of year 3 The bee colonies from the transitional beehives will be moved to the modern ones so no additional costs will be incurred to replace the bee colonies
13 It has been assumed that the initial price of a bee colony for a modern beehive will be ETB 700 while it will be ETB 500 for a transitional beehive The difference in price results because the bee colony for a transitional beehive is smaller
14 For the purpose of this analysis the following macrolevel assumptions have been made The expected average annual domestic inflation rate is 20 percent and the US inflation rate is 25 percent The financial discount rate is a real rate of 12 percent the economic discount rate is a real rate of 12 percent the foreign exchange premium (FEP) is 65 percent (Kuo 2011) and the exchange rate is US$1 = ETB 1750
PROJECT MODELING
The financial and economic feasibility of the GRAD honey interventions in this analysis has been established by constructing cash flows from the point of view of the project (total investment point of view) and the point of view of the targeted households (equity point of view) All revenues or potential revenue items have been treated as cash inflows and all expenditures or potential expenditure items have been treated as cash outflows (Jenkins Kuo and Harberger 2011) The analysis has been carried out for an 11-year period
The cash flows have been constructed in nominal and real terms and on per-round (every 6 months) as well as annual bases (for total investment point of view and equity point of view) The cash flows have also been constructed for the total investment point of view with the exclusion of domestic
15 This lifespan was confirmed during the field interviews in July 2012 16 Honey prices have been based on field interviews conducted in July 2012 in Amhara and Tigray The difference in prices has come from the assumption that honey produced in modern beehives has a bit higher quality hence the higher price
Cost Benefit Analysis of the GRAD Honey Value Chain November 2012 16
Cost Benefit Analysis of the GRAD Honey Value Chain November 2012
consumption of honey (in nominal and real terms) to reflect the actual cash available for repayment of the loans
The economy resource flow statements have been constructed by adjusting each of the line items in the cash-flow statements of the total investment point of view by the corresponding economic conversion factor (CF)17
The financial sustainability of an intervention has been analyzed by estimating the SADSCR of the project over the life of the loan used to finance the project and by calculating the FNPV of the project from the targeted householdsrsquo (equity) point of view If the ENPV of the project is positive this means the total value of the benefits of the project (to whomever they accrue) will be greater than the combined costs required to implement and operate the intervention
FINDINGS
Financial Analysis
The appraisal has been carried out for an 11-year period Based on assumptions established for the purpose of this analysis all interventions will yield positive FNPVs The FNPV has been calculated using 12 percent real financial discount rate Table 2 presents the FNPVs for each intervention
Table 2 FNPVhouseholdintervention (in US$) FNPV
Intervention A 90640 Intervention B 79666 Intervention C 79002
The interventions in the honey value chain will also substantially increase the annual income of the targeted households Stabilized additional yearly income of US$21811 will be achieved by 2014 in the case of Intervention A compared to 2016 for Interventions B and C The resulting additional yearly income is presented in table 3 below18
Table 3 Annual net cash flows resulting from the interventions (in US$) Year Intervention A Intervention B Intervention C
2012 ndash16191 ndash12303 ndash9262 2013 3436 313 ndash3940 2014 21811 14767 14850 2015 21811 12737 12774 2016ndash2022 21811 21811 21811
The negative annual net cash flows in 2012 for Interventions A and B will result from the 28 percent equity contribution needed to finance the initial investment Intervention C will have two negative net cash flows in 2012 and 2013 because farmers will not have adequate cash flows to finance their debt burden during these years Although the initial equity contribution has been removed from
17 Dividing the separately calculated economic value of a unit of an item by its financial price will yield the conversion factor 18 Net cash flow from the household perspective has been measured as its revenue less operating expenses less debt service including both debt repayments and interest expense In the early years the net cash flows will be less than the strict accounting definition of income which only subtracts interest expense During these years annual financial depreciation will be less than debt repayment and hence net cash flow will be lower than net income
17
Cost Benefit Analysis of the GRAD Honey Value Chain November 2012
Intervention C targeted households will still need to contribute financial resources from other activities to repay their debt obligation
Table 4 describes the SADSCRs These indicators are very important from a program sustainability perspective because they show each householdrsquos ability to repay the loan necessary for the financing of the initial investment in each of the interventions The debt service obligations in a given period have been defined here to be the interest and principal that will be due in a given period plus the debt service from the previous period that cannot be paid due to inadequate net cash flow
Table 4 SADSCRround for household for the interventions Intervention A Year 1 round 1 Year 1 round 2 Year 2 round 1 Year 2 round 2 SADSCR - 093 100 171 Intervention B Year 1 round 1 Year 1 round 2 Year 2 round 1 Year 2 round 2 SADSCR (first loan) - 093 093 141 SADSCR (second loan) 126 174 271 Intervention C Year 1 round 1 Year 1 round 2 Year 2 round 1 Year 2 round 2 SADSCR (first loan) 068 052 058 SADSCR (second loan) 127 175 272
In the case of Intervention A the households will face difficulty repaying their debt obligation only during the first repayment period The debt service of the second repayment period and the unpaid debt service from the previous period will be repaid in round 1 of year 2
In the case of Intervention B when repayments will be due in the first two rounds the SADSCR will be below a value of 1 If the farmers will be expected to repay the loan this quickly they will have to draw on other sources of cash In round 2 of year 2 the SADSCR will reach a value above 1 indicating that the financial situation of the households will stabilize allowing the initial loan to be repaid This indicates that households by that time will be able to access the new loan required for the investment to replace transitional beehives with modern ones
The SADSCR of Intervention C will be below a value of 1 in all rounds indicating that households will not be able to repay their debt obligations without contributing financial resources generated by other activities The second loan however will be provided only for the households that repay the previous loan hence households will have to draw on other cash resources to repay the initial loan
The eventual necessity to contribute additional financial resources to repay the loan in Intervention C negates the principal difference (no equity contribution) between Interventions B and C Intervention B will require households to initially invest 28 percent equity capital while Intervention C will split almost the same amount over two repayment rounds The present value of equity contribution for Intervention B will be ETB 120820 (US$6904) while the present value of contribution under Intervention C will be ETB 109668 (US$6267) with ETB 67598 (US$3863) in the second round of year 1 and ETB 42070 (US$2404) in the first round of year 2
The SADSCR of the second loan of Interventions B and C will be above 1 in all rounds indicating that the financial standing of the households will be good enough to repay the loan although not in a timely manner
Table 5 presents the annual scheduled debt service obligations versus the annual net cash flows including the opportunity cost of labor which reflect the actual financial resources generated by the activity in the given period and available for the loan repayment It has been assumed that actual debt repayment will be made by the households without moving additional financial resources from other (non-honey-producing) activities to repay the loan for both interventions For Interventions A
18
Cost Benefit Analysis of the GRAD Honey Value Chain November 2012
and B these values confirm the status quo outlined in the discussion above about SADSCRs Although in both cases the households cannot repay the full amount of debt service in timely manner they will be able to cover the biggest part of payment and eventually will have adequate cash flow to pay back the loan At this time they will be refunded the upfront savings (10 percent of the initial loanrsquos amount) For Intervention B repayment of the loan will open access for the new loan required to finance investment in the two new modern beehives The annual net cash flows of Intervention C will not allow the households to repay the loan so they will not get access to the second loan
Table 5 Annual debt repayment obligations versus net annual cash flows including opportunity cost of family laborroundintervention (in ETB)
Year 1 Year 2 Intervention A Round 1 Round 2 Round 1 Round 2- Annual Debt Service Obl 278495 243149 156349 - Net cash flow 257625 243942 267225
Intervention B Round 1 Round 2 Round 1 Round 2 - Annual Debt Service Obl 168906 145146 104800- Net cash flow 157720 134502 147340
Intervention C Round 1 Round 2 Round 1 Round 2 - Annual Debt Service Obl 231771 259036 254673 - Net cash flow 157720 134502 147340
Note The debt service obligations in a given period have been defined here to be the interest and principal that are due plus the debt service from the previous period that cannot be paid due to inadequate net cash flow Note For the second loan of Interventions B and C annual debt service obligations will be equal to the actual debt payments because households will have sufficient cash flow to fully cover the obligations
19
Table 6 Intervention A annual cash-flow statement equity point of view (real ETB) Line items Yearltltltlt 2012 2013 2014 2015 2016 2017 2018 2019 2020 2021 2022 PV
Receipts
‐Value of in‐house honey consumption 22500 45000 45000 45000 45000 45000 45000 45000 45000 45000 45000 276760 ‐Revenue from honey sale 234000 468000 468000 468000 468000 468000 468000 468000 468000 468000 468000 2878304
Total inflows 256500 513000 513000 513000 513000 513000 513000 513000 513000 513000 513000 3155064
Expenditures Investment costs for modern beehives Modern beehive 330000 330000
Bee colony 210000 210000
Queen excluder 33000 33000
Wax 40500 40500
Smoker 14000 14000
Overall coat 15000 15000
Veil 9000 9000
Glove 8000 8000
Extractor 32000 32000
Wax mold 15000 15000
Bee forage seedling or seed to plant around backyard 5000 5000
Plastic honey container 9000 9000
Service costs for beehives Sugar for feeding 28350 28350 28350 28350 28350 28350 28350 28350 28350 28350 28350 188534
Beehive maintenance 16500 33000 33000 33000 33000 33000 33000 33000 33000 33000 33000 202957
or cost 69875 69875 69875 69875 69875 69875 69875 69875 69875 69875 69875 464684
Rental value of land 080 080 080 080 080 080 080 080 080 080 080 532
Subsidized loan ndash295457 321563 000 000 000 000 000 000 000 000 000 ndash8347
Total outflows 539848 452868 131305 131305 131305 131305 131305 131305 131305 131305 131305 1568860
Net cash flows ndash283348 60132 381695 381695 381695 381695 381695 381695 381695 381695 381695 1586204
Net cash flows real US$ ndash16191 3436 21811 21811 21811 21811 21811 21811 21811 21811 21811 90640
NPV 12 discount rate ETB 1586204 NPV 12 discount rate US$ 90640
20
Table 7 Intervention B annual cash-flow statement equity point of view (real ETB) Line items Yearltltltlt 2012 2013 2014 2015 2016 2017 2018 2019 2020 2021 2022 PV
Receipts
‐Value of in‐house honey consumption 21500 43000 45000 45000 45000 45000 45000 45000 45000 45000 45000 273974 ‐Revenue from honey sale 132800 265600 468000 468000 468000 468000 468000 468000 468000 468000 468000 2596390
Total inflows 154300 308600 513000 513000 513000 513000 513000 513000 513000 513000 513000 2870364
Expenditures Investment costs Modern beehive 110000 000 220000 285383
Bee colony for modern beehive 70000 70000
Transitional beehive 20000 20000
Bee colony for transitional beehive 100000 100000
Queen excluder 11000 000 22000 28538
Wax 13500 000 27000 35024
Smoker 14000 14000
Overall coat 15000 15000
Veil 9000 9000
Glove 8000 8000
Extractor 32000 32000
Wax mold 15000 15000
Bee forage seedling or seed to plant around backyard 5000 5000
Plastic honey container 9000 9000
Service costs for beehives Sugar for feeding 28350 28350 28350 28350 28350 28350 28350 28350 28350 28350 28350 188534
Modern beehive maintenance 5500 11000 33000 33000 33000 33000 33000 33000 33000 33000 33000 172315
Transitional beehive maintenance 1000 2000 000 000 000 000 000 000 000 000 000 2786
Labor cost 69875 69875 69875 69875 69875 69875 69875 69875 69875 69875 69875 464684
Rental value of land 080 080 080 080 080 080 080 080 080 080 080 532
Subsidized loan ndash166702 191809 ndash145729 158794 000 000 000 000 000 000 000 1409
Total outflows 369603 303114 254576 290099 131305 131305 131305 131305 131305 131305 131305 1476204
Net cash flows ndash215303 5486 258424 222901 381695 381695 381695 381695 381695 381695 381695 1394160
Net cash flows real US$ ndash12303 313 14767 12737 21811 21811 21811 21811 21811 21811 21811 79666
NPV 12 discount rate ETB 1394160 NPV 12 discount rate US$ 79666
Cost Benefit Analysis of the GRAD Honey Value Chain November 2012 21
Table 8 Intervention C annual cash-flow statement equity point of view (real ETB)19
Line items Yearltltltlt 2012 2013 2014 2015 2016 2017 2018 2019 2020 2021 2022 PV
Receipts
‐Value of in‐house honey 21500 43000 45000 45000 45000 45000 45000 45000 45000 45000 45000 273974Revenue from honey ‐ sale 132800 265600 468000 468000 468000 468000 468000 468000 468000 468000 468000 2596390
Total inflows 154300 308600 513000 513000 513000 513000 513000 513000 513000 513000 513000 2870364
Expenditures Investment costs Modern beehive 110000 000 220000 285383
Bee colony for modern beehive 70000 70000
Transitional beehive 20000 20000 Bee colony for transitional 100000 100000
Queen excluder 11000 000 22000 28538
Wax 13500 000 27000 35024
Smoker 14000 14000
Overall coat 15000 15000
Veil 9000 9000
Glove 8000 8000
Extractor 32000 32000
Wax mold 15000 15000 Bee forage seedling or seed to plant around
5000 5000
Plastic honey container 9000 9000
Services costs for beehives Sugar for feeding 28350 28350 28350 28350 28350 28350 28350 28350 28350 28350 28350 188534
Modern beehive maintenance 0055 11000 33000 33000 33000 33000 33000 33000 33000 33000 33000 172315 Transitional beehive 0010 2000 000 000 000 000 000 000 000 000 000 2786
Labor cost 69875 69875 69875 69875 69875 69875 69875 69875 69875 69875 69875 464684
Rental value of land 080 080 080 080 080 080 080 080 080 080 080 532
Subsidized loan ndash219923 266240 ndash147177 158152 000 000 000 000 000 000 000 32013
Total outflows 316382 377545 253128 289457 131305 131305 131305 131305 131305 131305 131305 1487827
Net cash flows ndash162082 ndash68945 259872 223543 381695 381695 381695 381695 381695 381695 381695 1382537
Net cash flows real US$ ndash9262 ndash3940 14850 12774 21811 21811 21811 21811 21811 21811 21811 79002
NPV 12 discount rate ETB 1382537
NPV 12 discount rate US$ 79002
19 The only difference between tables 8 and 9 is the repayment of the loan (subsidized loan line) All other lines of the tables are the same
Cost Benefit Analysis of the GRAD Honey Value Chain November 2012 22
Comparison of Interventions A B and C
Even though all interventions will yield positive FNPVs with Intervention A resulting in a greater FNPV the choice between the interventions will depend on several factors
1 Intervention A will require higher initial investment expenditures than Intervention B (ETB 7205 versus ETB 4315) Within the lifespan of Intervention A greater quantities of honey will be produced earlier thus allowing for higher financial returns that will offset the costs associated with the higher initial investment Such high initial investment requirements however will require an equity contribution from the household side because current policies of MFIs in Ethiopia will allow households to borrow a maximum of ETB 4000 in the first loan If the households are able to repay they will get access to a new loan up to ETB 10000
2 The main group of GRAD beneficiaries will be the households for which the equity contribution required for Intervention A may be a constraint to participate in the program For such households Intervention B will be more attractive because of the reduced equity contribution
3 The success of the complete transition toward modern beekeeping in Interventions B and C will entirely depend on the ability of the households to get a second loan from the MFIs The MFIs will not provide an additional loan to households that fail to repay the first loan so the households will need to contribute financial resources generated by other farm activities to repay the first loan This erases the principal difference of no equity contribution between the two interventions Some households however may prefer not to contribute 28 percent of the needed equity at the beginning of the project and will instead make this contribution in two installments to cover the debt burden as in the case of Intervention C
4 In addition to the higher FNPV Intervention A will also result in GRAD householdsrsquo achieving stable additional income of US$218 by 2014 as compared to 2016 for Intervention B Total incremental earnings of Intervention A as compared to Intervention B calculated over the 4-year period of 2012ndash16 will be equal to US$14681 (See table 3) For those households that will be financially capable of making the equity contribution it will be advantageous to choose Intervention A
5 Although Interventions B and C will require a second loan to finance the complete transition toward modern beekeeping this loan will not put a significant financial burden on the households because the cash flows will be sufficient to cover the householdsrsquo debt service obligations in full For Intervention A however after the total repayment of the initial investment loan in round 2 of year 2 the household will be free of debt and can continue honey production fully benefiting from the increased income from honey sales
Economic Analysis
Differences have emerged between the financial and economic outcomes due to the fact that the financial values do not include all externalities present in the economy In this case the only externality will come from increased tax revenues either directly from the taxation of inputs or indirectly via the FEP Honey is an exportable commodity in Ethiopia The FEP for Ethiopia has been estimated to be equal to 65 percent (Kuo 2011) Hence every incremental unit of foreign exchange (dollars) earned from increased exports will have an economic value to the country of 1065 times the value of the revenues by the exporters when exchanging the foreign exchange for local currency at the market exchange rate
23
To show the true economic impact of the proposed intervention on the Ethiopian economy the economic values have been derived by adjusting the financial values by the appropriate economic conversion factors If no distortions are present in the market then the financial value of an item has been used to measure its economic value20
Table 9 reports that the ENPV obtained in the analysis will be positive for both interventions The economic opportunity cost of capital of 12 percent has been used while calculating the ENPV If they are successfully implemented both interventions will benefit the Ethiopian economy
When the two interventions are compared Intervention A will result in total higher production of honey through the full life of the project as compared to Intervention B mainly because of the larger volume of output that will be produced by Intervention A during first 2 years of the project On the cost side farmers eventually will have to purchase the same equipment and the same number of modern beehives for Intervention B as they will for Intervention A The net results have shown that Intervention A will have a greater ENPV than Intervention B will The only difference between Interventions B and C is the way the interventions will be financed This method of investment financing will just be a transfer of resources and hence will not bring any change to the economic outcomes of the interventions As a result there is no difference between Interventions B and C Intervention A will be a better choice not only for the chronically food-insecure households targeted in the GRAD project but also for the Ethiopian economy as a whole because it will be more productive and create a larger value of financial and economic net benefits
The estimated ENPVs are presented in table 9 below
Table 9 ENPVs for Interventions A and B (in US$) ENPV
Intervention A 113092 Intervention B 100774
20 The list of CFs used for the purpose of this analysis is presented in table A in the appendix
Cost Benefit Analysis of the GRAD Honey Value Chain November 2012 24
Table 10 Economic resources cash-flow statement for Intervention A (real ETB) Line items CF Yearltltltlt 2012 2013 2014 2015 2016 2017 2018 2019 2020 2021 2022 PV
Receipts ‐Value of in‐house honey consumption 109 24583 49166 49166 49166 49166 49166 49166 49166 49166 49166 49166 302382 ‐Revenue from honey sale 109 255663 511327 511327 511327 511327 511327 511327 511327 511327 511327 511327 3144775
Total Inflows 280246 560493 560493 560493 560493 560493 560493 560493 560493 560493 560493 3447157
Expenditures Investment costs Modern beehive 085 281185 281185
Bee colony 100 210000 210000
Queen excluder 085 28118 28118
Wax 106 43104 43104
Smoker 085 11898 11898
Overall coat 073 10995 10995
Veil 073 6597 6597
Glove 080 6416 6416
Extractor 082 26244 26244
Wax mold 100 15000 15000 Bee forage seedling or seed to plant around 100 5000 5000
Plastic honey container 075 6724 6724
Services costs for beehives Sugar for feeding 079 22345 22345 22345 22345 22345 22345 22345 22345 22345 22345 22345 148600
Beehive maintenance 100 16500 33000 33000 33000 33000 33000 33000 33000 33000 33000 33000 202957
Labor cost 100 69875 69875 69875 69875 69875 69875 69875 69875 69875 69875 69875 464684
Rental value of land 100 080 080 080 080 080 080 080 080 080 080 080 532
Total outflows 760082 125300 125300 125300 125300 125300 125300 125300 125300 125300 125300 1468055
Net cash flows ‐ 435193 435193 435193 435193 435193 435193 435193 435193 435193 435193 1979102
Net cash flows real US$ ‐27419 24868 24868 24868 24868 24868 24868 24868 24868 24868 24868 113092
ENPV 12 discount rate ETB 19791
ENPV 12 discount rate $US 113092
25
Table 11 Economic resources cash-flow statement for Intervention B (real ETB)21
Line items CF Yearltltltlt 2012 2013 2014 2015 2016 2017 2018 2019 2020 2021 2022 PV
Receipts ‐Value of in‐house honey consumption 109 23490 46981 49166 49166 49166 49166 49166 49166 49166 49166 49166 299339
‐ Revenue from honey sale 109 145094
290189 511327 511327 511327 511327 511327 511327 511327 511327 511327 2836761
Total inflows 168585 337170 560493 560493 560493 560493 560493 560493 560493 560493 560493 3136100
Expenditures Investment costs Modern beehive 085 93728 000 187457 243167
Bee colony for modern beehive 100 70000 70000
Transitional beehive 100 20000 20000
Bee colony for transitional beehive 100 100000 100000
Queen excluder 085 9373 000 18746 24317
Wax 106 14368 000 28736 37276
Smoker 085 11898 11898
Overall coat 073 10995 10995
Veil 073 6597 6597
Glove 080 6416 6416Extractor 082 26244 26244
Wax mold 100 15000 15000 Bee forage seedling or seed to plant around backyard 100 5000 5000
Plastic honey container 075 6724 6724
Services costs for beehives Sugar for feeding 079 22345 22345 22345 22345 22345 22345 22345 22345 22345 22345 22345 148600
Modern beehive maintenance 100 5500 11000 33000 33000 33000 33000 33000 33000 33000 33000 33000 172315
Transitional beehive maintenance 100 1000 2000 000 000 000 000 000 000 000 000 000 2786
Labor cost 100 69875 69875 69875 69875 69875 69875 69875 69875 69875 69875 69875 464684
Rental value of land 100 080 080 080 080 080 080 080 080 080 080 080 532
Total outflows 495144 105300 360238 125300 125300 125300 125300 125300 125300 125300 125300 1372551
Net cash flows ndash326559 231870 200255 435193 435193 435193 435193 435193 435193 435193 435193 1763549
Net cash flows real US$ ndash18660 13250 11443 24868 24868 24868 24868 24868 24868 24868 24868 100774
ENPV 12 discount rate ETB 17635
ENPV 12 discount rate $US 100774
21 There is no difference between Interventions B and C from the economy point of view
Cost Benefit Analysis of the GRAD Honey Value Chain November 2012 26
STAKEHOLDER AND BENEFICIARY ANALYSIS
An economic surplus in the economy is created by producing an output that has an economic value greater than the economic cost of the inputs such as capital land and labor that are used to produce the item The proposed interventions in the honey value chain will yield two groups of beneficiaries the households engaged in the interventions and the government of Ethiopia
The results of the analysis reveal that the income of the targeted households will increase Table 3 presented above has been designed by treating the opportunity cost of labor as a cash outflow The opportunity cost of labor will be retained within the family and therefore can be included in the present annual income of the targeted families Table 12 presents the annual family income profiles including the opportunity cost of labor which has been assumed to remain within the family
Table 12 Annual income of the targeted households including opportunity cost of family labor (in US$) Year Intervention A Intervention B Intervention C 2012 ndash15244 ndash11927 ndash8886 2013 5372 3492 ndash3192 2014 27694 20650 20733 2015 27694 18620 18667 2016ndash2022 27694 27694 27694
The net income decrease in the first years of the interventions will occur because of the equity contribution The annual increase in income presented in table 12 includes the opportunity cost of family labor spent on the beekeeping activities Each householdrsquos net income over the 11-year evaluation period will be US$121304 for Intervention A US$110868 for Intervention B and US$108033 for Intervention C
The other beneficiary of the intervention will be the government for the following reasons
The government will benefit directly from the taxes collected on the inputs and outputs of the intervention Plastic containers honey extractor sugar and so forth are importable to Ethiopia The total tax rate applied to these inputs is higher than the foreign exchange premium The inflow of taxes will reduce the economic cost below its financial cost and generate tax revenue for the government of Ethiopia
Modern beehives and smokers are produced domestically so they are assumed to be internationally non-tradable goods The inputs used to produce beehives and smokers such as stainless steel nails and covers are exportable to Ethiopia Again the total tax rate applied to these inputs will be higher than the FEP thus generating tax revenue for the government of Ethiopia
The government will also benefit indirectly because honey is exported from Ethiopia Exports allow the country to earn foreign exchange
The total amount of government benefits from the interventions over the 11-year period per household has been estimated to be US$22928 for Intervention A and US$21027 for Interventions B and C
The values of stakeholder gains under each of the interventions are presented in table 13 below
27
Cost Benefit Analysis of the GRAD Honey Value Chain November 2012
Table 13 Stakeholder and beneficiary impacts of the project (in US$)
Intervention A Intervention B Intervention C
Economic NPV (FNPV + externalities)
113092 100774 100774
Financial NPV (households) 90640 79666 79002 Externalities 22451 21108 21772
o Government 22928 21027 21027 o Financing
contribution ndash477 080 745
The financing contribution will be the amount of the interest and other charges paid on the three loans provided by MFIs over and above a real cost of 12 percent This figure represents a transfer of resources between the households and the MFIs USAIDEthiopia generally negotiates subsidized interest rates for households benefiting from aid programs The negative financing contribution in the case of Intervention A represents a direct subsidy to the targeted households that will be created through the submarket interest rate In the case of the GRAD project the subsidized interest rate will be 15 percent which is 5 percent below the current level of inflation in Ethiopia However the additional fees charged by the MFIs to make them willing to provide loans will more than offset the subsidy content of the interest rate paid on the loan in the case of Interventions B and C
Exact information regarding the number of households that will engage in beekeeping activities does not exist but assuming that 70 percent of the chronically food-insecure households participate (the main group of the GRAD beneficiaries)mdashthat is 70 percent of 50000 households will participate in beekeeping eventually (not necessary in year 1 of the project)mdashit is possible to calculate combined stakeholder and beneficiary impacts of the project Figures are presented in Table 14
Table 14 Combined stakeholder and beneficiary impacts of 35000 households in the project (in thousands US$)
28
Intervention A Intervention B Intervention C Economic NPV (FNPV + externalities)
3958220 3527090 3527090
Financial NPV (households) 3172400 2788310 2765070 Externalities 785785 738780 762020
o Government 802480 735945 735945 o Financing
contribution ndash16695 ndash2800 26075
SENSITIVITY ANALYSIS
A sensitivity analysis for the GRAD honey value chain intervention has been performed using the key variables that will be prone to change and likely to influence the situation of the households engaged in the project These variables include the price and yield of honey as well as their joint impact Details related to this sensitivity analysis are outlined in tables 15 16 17 and 18 below
Cost Benefit Analysis of the GRAD Honey Value Chain November 2012
The Joint Impact of Honey Price and Yield of the FNPV for Intervention A
Because prices and yields of honey are two of the most important factors that will influence the householdsrsquo income it is prudent to consider the possible impacts of changing one of their values in a sensitivity analysis The joint impact of these two variables for Intervention A is presented in table 15 below
Table 15 The joint impact of honey price and yield on the FNPV of households for Intervention A
Yield (in kg) 1200 1500 1700 1900 2100
4300 30850 51891 65918 82823 100599
4500 34924 56943 72174 90640 109417
5000 45108 69575 89659 110471 131558
6000 65477 100066 125232 150535 175839
7000 87799 131558 161079 190600 220121 Price (in ETB)
Table 15 shows the joint impact of the honey price and honey yield on the FNPV under Intervention A (three modern beehives with related tools and training) The scenario for this analysis has assumed that the price of honey will be ETB 45kg and the yield will be 19 kground (This honey price has been based on the assumption that the household will produce yellow honey which fetches lower prices in the domestic market) Under these circumstances the FNPV will be US$90640 But it is safe to assume that given the current high demand and rather low supply of honey in the domestic market the price of yellow honey will increase in the future Therefore the FNPV will likely be higher Even in the worst-case scenario if prices were to drop to ETB 43kg and the yield were to decrease from 19 kground to 12 kground the FNPV will still be positive at US$30850 which indicates very low risk of intervention failure at the household level
Table 16 The joint impact of honey price and yield on the net cash flow of households for Intervention A
Yield (in kg) 1200 1500 1700 1900 2100
4300 10188 14611 17560 20508 23457
4500 11011 15640 18725 21811 24897
5000 13068 18211 21640 25068 28497
6000 17183 23354 27468 31583 35697
7000 21297 28497 33297 38097 42897 Price (in ETB)
Table 16 presents the joint impact of honey yield and price on the net cash flow of the targeted households in 2014 and after when the loan will be repaid and cash flows will be stable Under the baseline scenario the annual net cash flow will be US$21811 If the price were ETB 7000 and the yield were 19 kg the net cash flow will reach US$38097 which is even higher than the targeted income increase of US$36500 Currently however only white honey will be able to fetch such high price levels in the domestic market The findings suggest that households in the areas where bees produce white honey will easily reach the targeted increase in income
29
Cost Benefit Analysis of the GRAD Honey Value Chain November 2012
Table 17 presents the joint impact of honey price and honey yield on the FNPV under Intervention B The FNPV in this case will be US$79666 In the worst-case scenario the FNPV will be lower under Intervention B than under Intervention A but will still be positive at US$22711 which again indicates low risk
Table 17 The joint impact of honey price and yield on the FNPV of households for Intervention B
Yield (in kg) 1200 1500 1700 1900 2100
4300 22721 43762 57790 72936 88169
4500 26636 48655 63725 79666 95644
5000 36422 61069 78781 96534 114429
6000 55995 87637 109059 130542 152025
7000 77009 114429 139493 164557 189621 Price (In ETB) Price (in ETB)
Table 18 describes the joint impact of honey price and yield on the annual net cash flow of the beneficiaries of Intervention B after 2016 when both of the loans will be repaid and cash flows will be stable The baseline scenario will yield a net annual cash flow of US$21811 If the price of white honey were to reach ETB 7000 the net increase in annual income excluding the opportunity cost of family labor will reach US$38097 holding the yield constant This figure is again higher than the targeted increase of US$36500
Table 18 The joint impact of honey price and yield on the FNPV of households for Intervention B
Yield (in kg) 1200 1500 1700 1900 2100
4300 10188 14611 17560 20508 23457
4500 11011 15640 18725 21811 24897
5000 13068 18211 21640 25068 28497
6000 17183 23354 27468 31583 35697
7000 21297 28497 33297 38097 42897 Price (in ETB)
If the nationwide production of honey continue to be limited and with the increasing popularity of good-quality honey the prices may go higher In the best-case scenario for Intervention A if prices were to reach ETB 70kg (more relevant price for white honey) and yields were to reach 21 kground the FNPV will be US$220121 In Intervention B under the same circumstances the FNPV will reach US$189621 The net annual cash flow accruing to the households at this combination of yield and price will provide an additional US$42897 per year after the loan has been paid in 2013 under Intervention A and in 2015 under Intervention B If domestic production could be substantially increased it is likely that the processing costs and perhaps the fob price for honey exports will fall allowing Ethiopian honey to become more competitive in the international market
30
RECOMMENDATIONS
Interventions A and B show a good potential for a substantial increase in income and economic impact for the households targeted by the GRAD project USAID should support their implementation They appear to have the ability to improve the livelihood and food security of the targeted households That said regardless of their potential Interventions A and B on their own may not guarantee an increase of US$365 in the householdsrsquo yearly income as hoped for in the GRAD proposal However when combined with other income-generating activities they may allow households to achieve the additional US$365year Another important benefit of these interventions is the almost nonexistent requirements for land Taking into consideration the very limited land holdings of GRAD beneficiaries and their almost complete reliance on this land as a source of income these interventions are attractive because they will allow households to earn additional income without changing their current land usage An intervention will also allow households to benefit from an additional MFI loan in year 3 after complete repayment of the initial loan for honey production for purchasing more beehives or participating in other proposed GRAD interventions such as haricot beans production Therefore it will be advisable to combine this intervention with another commodity intervention proposed in the GRAD project introducing them as a ldquopackage solutionrdquo to achieve the desired increase in householdsrsquo yearly income
It is debatable whether farmers will be able to repay a free market interest loan at 50 percent interest if they need to borrow their ldquoequityrdquo contributions Taking into consideration that the farmers will first try to repay the free market loan the risk of default on the USAID loan will be high The debt service from the two loans will be so significant that farmers may either refuse to participate in the beekeeping intervention or fail to repay the USAID-backed loan Many GRAD households have no access to free market loans as their current financial situation is such that financial institutions are unwilling to lend money to them Reducing the required amount of money necessary for a down payment might better facilitate the implementation of Intervention A ensuring that the targeted households will be able to join the project and benefit from its outcome
The analysis also reveals that Intervention B which has been designed to eliminate the equity contribution for households that will not be able to take a financial stake in the investment will eventually require the households to contribute other resources to repay their debt services This structure however may be preferred by many farmers because the equity contribution will be divided into two parts thus making it easier for them to find the required financial resources
In summary it is recommended that the burden of the initial down payment (28 percent) that is required from each targeted household to participate in the GRAD intervention in the honey value chain be lessened An ideal financing package will eliminate the down-payment requirements by increasing the size of the USAID-backed loan and increasing the length of the repayment period for Intervention A to 3 years In principal it is a good practice to require households to take a financial stake in the project by forcing them to contribute their own money yet such a system might prevent some farmers from choosing honey production as an intervention
Cost Benefit Analysis of the GRAD Honey Value Chain November 2012 31
REFERENCES
Abebe A (2009) Market Chain Analysis of Honey Production in Atsbi Wemberta District Eastern Zone of Tigray National Regional State Department of Agricultural Economics School of Graduate Studies Haramaya University
Agonafir J (2005) Strategic Intervention Plan on Honey and Beeswax Value Chains SNV Support to Business Organizations and Their Access to Market (BOAM)
Alemseged T and Yildiz N (2008) Beekeeping and Honey Production in the Tigray Region Ethiopia African Services Committee
Alemtsehay T (2011) Seasonal Availability of Common Bee Flora in Relation to Land Use and Colony Performance in Gergera Watershed Atsbi Wembwrta District Eastern Tigray Ethiopia Master Thesis Hawassa University
Anand S and Sisay G (2011) Engaging Smallholders in Value Chains Creating New Opportunities for Beekeepers in Ethiopia Programme Insights
APM Consul PLC (2008) A Study on Private Sector Linkages for Bee Product Producers in Bale Bale Regional Sustainable Management Program
Belie T (2009) Honeybee Production and Marketing Systems Constraints and Opportunities in Burie District of Amhara Region Ethiopia Department of Animal Science and Technology School of Graduate Studies Bahir Dar University
Chala K Taye T Kebede D and Tadele T (2012) Opportunities and Challenges of Honey Production in Gomma District of Jimma Zone South-West Ethiopia Journal of Agricultural Extension and Rural Development 4(4) 85ndash91
Desalegn B (2007) Assessment of the Effect of Ant (Dorylus fulvus) on Honeybee Colony (A mellifera) and Their Products in West and South-West Shewa Zones Ethiopia Ethiopian Journal of Animal Production 7(1) 12ndash26
Graduation With Resilience to Achieve Sustainable Development (GRAD) Technical Proposal July 20 2012
Jenkins G Kuo CY and Harberger A (2011) Cost-Benefit Analysis for Investment Decision Queenrsquos University August 2012 edition
Kuo CY (2011) Estimates of the Foreign Exchange Premium and the Premium for Non-Tradable Outlays for Countries in Africa John Deutsch International Department of Economics Queenrsquos University Canada
Shiferaw A Jaleta M Gebremedhin B and Hoekstra D (2010) Increasing Economic Benefit From Apiculture Through Value Chain Development Approach The Case of Alaba Special District Southern Ethiopia IPMS Ethiopia
Cost Benefit Analysis of the GRAD Honey Value Chain November 2012 32
Tadesse B and Phillips D (2007) Ensuring Small-Scale Producers in Ethiopia to Achieve Sustainable and Fair Access to Honey Markets International Development Enterprises (IDE) and Ethiopian Society for Appropriate Technology (ESAT)
Workneh A and Ranjitha P (2011) Beekeeping Subsector Challenges and Constraints in Atsbi Wemberta District of Eastern Zone Tigray Region Ethiopia Journal of Agricultural Extension and Rural Development 3(1) Z8ndashZ12
Yigzaw D Hoekstra D Berhe K Derso T and Mehari Y (2010) Smallholder Apiculture Development in Bure Ethiopia Experiences From IPMS Project Interventions IPMS Ethiopia
Yirga G Koru B Kidane D and Mebrahatu A (2012) Assessment of Beekeeping Practices in Asgede Tsimbla District Northern Ethiopia Absconding Bee Forage and Bee Pests African Journal of Agricultural Research 7(1) 1ndash5
Yirga G and Teferi M (2010) Participatory Technology and Constraints Assessment to Improve the Livelihood of Beekeepers in Tigray Region Northern Ethiopia Biology Department College of Natural and Computational Sciences Mekelle University
Cost Benefit Analysis of the GRAD Honey Value Chain November 2012 33
Cost Benefit Analysis of the GRAD Honey Value Chain November 2012
APPENDIX
Table A The FtF indicators proposed for the monitoring and evaluation of the GRAD project
Results Indicator Target
Overall objective To graduate chronically food-insecure households from food support
Graduation of chronically food-insecure households from food aid by increasing their yearly household income
50000 households that will experience an increase in yearly income of US$365 by year 5
Result 1 Enhanced livelihood options for chronically food-insecure households
45-2 Number of jobs attributed to FtF implementation (RiA) ndashdelete it
Higher is better
3191-3 and 47-4 Prevalence of households with moderate or severe hunger (RiA)
Lower is better
Result 2 Improved community and household resilience
319-16 Prevalence of underweight children under 5 years of age (R)-delete it
Lower is better
319-13 Prevalence of underweight women (R)
Lower is better
319-4 and 3191-4 Prevalence of exclusive breastfeeding of children under 6 months of age (RiA)
Lower is better
319-11 Prevalence of stunted children under 5 years of age (R)
Lower is better
452-14 Number of vulnerable households benefiting directly from USG assistance (S)
Lower is better
Result 3 Strengthened enabling environment to promote scale-up and sustainability
45 Womenrsquos Empowerment in Agriculture Index Score (R)
Higher is better
451-27 and CBLD-5 Percentage of combined key areas of organization capacity among USG direct and indirect local implementing partner levels
Higher is better
34
Cost Benefit Analysis of the GRAD Honey Value Chain November 2012
452-38 Value of new private sector investment in the agriculture sector or food chain leveraged by FtF implementation (RiA)
Higher is better
Table B List of CFs used to make adjustments in the economic analysis for both interventions
Summary of CFs Honey 109 Transportation 084 Labor 100 Modern beehive 085 Transitional beehive 100 Bee colony 100 Queen excluder 085 Wax (ETBkg) 106 Smoker 085 Overall coat 073 Veil 073 Glove 080 Extractor 082 Wax mold 100 Plastic honey container 075 Beehive maintenance 100 Rental value of land 100 Sugar 079
35

Cost Benefit Analysis of the GRAD Honey Value Chain November 2012
ACRONYMS
AGP Agriculture Growth Program CARE Implementing Organization CBA Cost Benefit Analysis CF Conversion Factor CRS Catholic Relief Services CSA Central Statistical Agency of Ethiopia ENPV Economic Net Present Value ETB Ethiopian Birr (Currency) FEP Foreign Exchange Premium FNPV Financial Net Present Value FtF Feed the Future (Program) GDP Gross Domestic Product GRAD Graduation With Resilience to Achieve
Sustainable Development (Project) Ha Hectare kg Kilogram MFI Microfinance Institutions NPV Net Present Value ORDA Organization for Rehabilitation and
Development in Amhara PSNP Productive Safety Net Program Plus REST Relief Society of Tigray RUSACCO Rural Saving and Credit Cooperatives SADSCR Semiannual Debt Service Coverage Ratio SNV Netherlands Development Agency US$ United States Dollar USAID United States Agency for International
Development
5
EXECUTIVE SUMMARY
Project Description USAIDEthiopia started to implement the Graduation With Resilience to Achieve Sustainable Development (GRAD) project in 2012 The main purpose of the GRAD project is to graduate 50000 chronically food-insecure Ethiopian households (out of the 65000 targeted) by facilitating an increase in their yearly income by US$365householdyear The main objectives that the project aims to achieve are
1 to enhance livelihood options of chronically food-insecure households in Highlands areas 2 to improve household and community resilience and 3 to strengthen an enabling environment to promote scale-up and sustainability
A special emphasis of this project is the inclusion of women and the creation of non-gender-biased income opportunities improved cooperation between stakeholders and the creation of accountability for the beneficiaries of the project
To facilitate the proper implementation of the project and the flow of necessary financial resources for the targeted households USAID established a US$2-million loan-credit guarantee fund that will be available to lending institutions microfinance institutions (MFI) and rural savings and credit cooperatives (RUSACCO) so these institutions can supply the necessary loans to the targeted households for undertaking the GRAD interventions
The implementers of the GRAD project include CARE the Relief Society of Tigray (REST) the Organization for Rehabilitation and Development in Amhara (ORDA) Catholic Relief Services (CRS) and the Netherlands Development Agency (SNV)
The GRAD project proposes interventions in four commodity value chains honey meat vegetables and pulses The investment plan for GRAD households designed by SNV Ethiopia proposes fattening interventions for small ruminants as well as for cattle in the meat value chain but the analysis for the meat value chain has been carried out for the shoats-fattening intervention only These value chainsmdashhoney meat vegetables and pulsesmdashwere chosen because of their suitability for chronically food-insecure households and the rather low initial investment costs necessary for their implementation1
Strategic Context and Rationale The GRAD project is a part of USAIDrsquos wider Feed the Future (FtF) agenda which prioritizes investments in agriculture and nutrition The project particularly aims to facilitate improvements in the commodity value chains to make them more inclusive and efficient for chronically food-insecure households
Promotion of these inclusive commodity value chains will facilitate market access for these households which in turn will increase their yearly income decrease their current food insecurity and allow them to profit from newly established or improved market linkages
The GRAD project proposes two intervention packages in the honey value chain Intervention A will introduce three modern beehives with tools and appropriate training regarding modern honey-production methods starting in year 1 Intervention B will initially introduce two transitional beehives and one modern beehive with tools and training but by the beginning of the year 3 participants will transition to the use of modern beehives only
1 Suitability is defined in terms of the ease in implementation Preferably a number of the food-insecure households already have experience producing some of these commodities
Cost Benefit Analysis of the GRAD Honey Value Chain November 2012 6
Cost Benefit Analysis of the GRAD Honey Value Chain November 2012
Description of the Interventions Regardless of which of the two interventions proposed for the honey value chain are selected each of the chronically food-insecure households targeted in this project will receive an investment loan for the initial purchase of beehives and necessary tools Intervention A includes the initial purchase of three modern beehives and necessary tools at year 1 of the project The amount of the loan required for the investment is above the amount that MFIs of Ethiopia are willing to provide for new clients It has been assumed that targeted households will contribute 28 percent equity capital of the total investment required hence reducing the required borrowing The household will repay this loan on a per-round basis (1 round = 6 months) with the first round being a grace period
Intervention B proposes the initial purchase of one modern beehive and two transitional beehives and necessary tools in year 1 of the project The transitional beehives will be replaced with two modern beehives at the end of year 2 of the project Two Intervention-B scenarios were analyzed Under the first scenario the households again have been assumed to contribute 28 percent of the required investment from the equity capital the second scenario was designed by eliminating 28 percent of the equity contribution from Intervention B The required funds for the replacement of transitional beehives under both scenarios will be obtained through an additional loan taken by the households from the MFIs after repayment of the initial loan In the following text the first scenario of intervention B is referred to as Intervention B and the second scenario is referred to as Intervention C
Financial and Economic Analysis Results The appraisal has been carried out over an 11-year period The analysis shows that at a financial discount rate of 12 percent each householdrsquos financial net present value (FNPV) for Intervention A is US$90640 The FNPV of Intervention B is US$79666 while the FNPV of Intervention C is US$79002 The economic net present value (ENPV) for Intervention A is US$113092 while it is US$100774 for Interventions B and C
In summary the FNPVs and ENPVs are positive for all proposed interventions with Intervention A showing a higher FNPV and ENPV
Table A SADSCRround for household for the interventions Intervention A Year 1 round 1 Year 1 round 2 Year 2 round 1 Year 2 round 2 SADSCR - 093 100 171 Intervention B Year 1 round 1 Year 1 round 2 Year 2 round 1 Year 2 round 2 SADSCR (first loan) - 093 093 141 SADSCR (second loan) 126 174 271 Intervention C Year 1 round 1 Year 1 round 2 Year 2 round 1 Year 2 round 2 SADSCR (first loan) 068 052 058 SADSCR (second loan) 127 175 272
Table A describes the semiannual debt service coverage ratios (SADSCRs) The debt service obligations are defined here to be the interest and principal that are due in a given period plus the debt service from the previous period that could not be paid due to inadequate net cash flow The opportunity cost of labor will be retained within the family and therefore can be treated as part of the cash flow available for debt servicing
In the case of Intervention A the households will face difficulty repaying their debt obligation only during the first repayment period The debt service of the second repayment period together with the unpaid debt service from the previous period will be repaid in round 1 of year 2
7
Cost Benefit Analysis of the GRAD Honey Value Chain November 2012
In the case of Intervention B when repayments are due in the first two rounds the SADSCRs are below one If these farmers are going to be expected to repay the loan this quickly they will have to draw on other sources of cash 2 In round 2 of year 2 the SADSCR reaches a value above 1 indicating that the financial situation of the households will stabilize and the initial loan will be repaid After that round the household will be able to get a new loan required for the complete transition toward modern beehives
The SADSCRs of Intervention C are below a value of 1 in all rounds indicating that households will not be able to repay their debt obligations without the contribution of financial resources generated by other activities The second loan however will be provided only for the households that will repay the previous loan hence households will have to draw on other resources of cash to repay the initial loan
The eventual necessity to contribute additional financial resources in Intervention C erases principal difference (no equity contribution) between Interventions B and C Intervention B will require households to initially invest 28 percent equity capital while Intervention C will split almost the same amount over two repayment rounds The present value of the equity contribution for Intervention B is ETB 120820 (US$6904) while the present value of the amount under Intervention C is ETB 109668 (US$6267) with ETB 67598 (US$3863) in the second round of year 1 and ETB 42070 (US$2404) in the first round of year 2
Beneficiary Analysis Results The results of the analysis reveal that the income of the targeted households will increase This annual increase in the income of the households under each intervention is presented in table B below
Table B Annual increase in the income of the households including opportunity cost of family labor (in US$) Year Intervention A Intervention B Intervention C
2012 ndash15244 ndash11927 ndash8886 2013 5372 3492 ndash3192 2014 27694 20650 20733 2015 27694 18620 18657
2016ndash2022 27694 27694 27694
The net income decrease in the first years of the interventions will occur because of the equity contribution The annual increase in income presented in table B includes the opportunity cost of family labor spent on the beekeeping activities Each householdrsquos net income over the 11-year evaluation period will be US$121304 for Intervention A US$110868 for Intervention B and US$108033 for Intervention C The other beneficiary of the intervention will be the Ethiopian government for the following reasons
The government will benefit directly from the taxes collected on the inputs and outputs of the intervention Plastic containers honey extractors sugar and so forth are importable to Ethiopia The total tax rate applied to these inputs is higher than the foreign exchange premium The inflow of taxes will reduce the economic cost below its financial cost and generate tax revenue for the government of Ethiopia
Modern beehives and smokers are produced domestically so they are assumed to be internationally nontradable goods The inputs used to produce beehives and smokers such as stainless steel nails and covers are exportable to Ethiopia Again the total tax rate applied
2 Other sources of cash refer to financial resources generated by the householdsrsquo activities except beekeeping activities
8
to these inputs is higher than the foreign exchange premium thus generating tax revenue for the government of Ethiopia
The government will also benefit indirectly because honey is exported from Ethiopia Exports allow the country to earn foreign exchange
The total amount of government benefits from the intervention over the 11-year period per household is estimated at US$22928 for Intervention A and US$21027 for Interventions B and C
Conclusions and Recommendations Expected returns on the modern beekeeping activities are dependent on the full list of inputs required for the proper implementation so none of the tools can be eliminated from the required investment A missing input such as a honey extractor will directly result in decreased quality or yield of honey Absence of other inputs such as gloves or overall coats may put the health of the beekeepers at risk because of the aggressiveness of Ethiopian bees Taking into consideration the financial situation of the GRAD beneficiaries it will be appropriate to share the most expensive inputs of production such as a honey extractor between groups of farmers
The loan amount from MFIs for new clients in 2012 is limited to ETB 4000 (US$22857) which is less than the required investment for all three interventions GRAD beneficiaries consist primarily of chronically food-insecure households The necessity of the equity contribution may limit the beneficiaries of the honey interventions to better-off groups of farmers It is suggested that the interventions be redesigned to allow farmers access to sufficient financial resources to start modern beekeeping activities without equity contribution If such loan amounts can be negotiated with MFIs by the implementers of the GRAD project the term of the loan should also be expanded to 3 years
In the case of Intervention B the total initial investment cost is ETB 4315 This amount is only slightly above the amount of ETB 4000 usually provided by MFIs hence reducing the requirements for an equity contribution Intervention B however has been analyzed assuming an equity contribution of 28 percent the analysis reveals that the households will be able to repay the loan although they should be allowed to move small fractions of the debt service to the next repayment period if necessary The repayment of the loan in turn will give them access to the next loan
In the case of Intervention C the total initial investment cost is also ETB 4315 Intervention C has been analyzed without assuming an equity contribution of 28 percent The increased debt service will not allow the households to repay their loan obligations without contributing additional financial resources If the first loan will not be repaid the households will not have access to the next loan required for the purchase of two modern beehives at the end of the intervention year 2
All three interventions require household equity contribution for successful implementation If this requirement can be erased Intervention A is recommended over Interventions B and C because its benefits outweigh its costs and indicate the likely success of this project Even though analyses of Interventions B and C also yield positive FNPV and ENPV values these NPVs are lower than those obtained in the analysis of Intervention A
There is no principal difference between Interventions B and C other than the distribution of the equity contribution over time The minimum equity contribution for Intervention B that will allow the households to repay the loan is 2463 percent
If money from the loan-guarantee fund will be used to cover the unpaid fractions of the loan in Intervention C thus allowing the households access to the loan required for the complete transition toward modern beehives the FNPV of the intervention will be US$87650 which is still below the FNPV of Intervention A The increase in the FNPV in this case is just a financial subsidy from USAID to the targeted households
Cost Benefit Analysis of the GRAD Honey Value Chain November 2012 9
THE GRAD HONEY VALUE CHAIN COST-BENEFIT ANALYSIS
METHODOLOGY
Project Background
Ethiopiarsquos economy is highly dependent on its agricultural production with agriculture accounting for about 46 percent of the countryrsquos gross domestic product (GDP) About 80 percent of Ethiopiarsquos total population lives in the rural areas and agricultural activities generate about 85 percent of the total employment in Ethiopia (USAID AGP-LGPPRIME Summary Proposal 2011)
USAIDEthiopia is one of the major donors providing support for the goal of making Ethiopiarsquos households more food self-sufficient It supports various initiatives related to increasing access to food for Ethiopiarsquos food-insecure households and emergency assistance USAIDrsquos working agenda in Ethiopia involves promoting increased agricultural productivity and developing viable commodity value chains that in turn will increase the level of food security and reduce the negative impacts of famine
Ethiopia is ranked among the top five fastest-growing countries in the world with real GDP growth reaching 75 percent in 2011 (The World Factbook CIA) Despite its currently impressive economic growth rate Ethiopia has not been able to achieve a level of agricultural production that leads to food self-sufficiency It still is home to about 8 million people who remain chronically food insecure with the vast majority of them living in the rural areas About 60 percent of rural households experience food shortages between June and October each year (USAID AGP-LGPPRIME Summary Proposal 2011)
For these reasons the GRAD project concentrates on improving the value chains for several commodities The project addresses the need to develop profitable and functional value chains that include chronically food-insecure households to provide them with opportunities to profit from improved or newly established market linkages
The majority of Ethiopian households in the rural areas cultivate low-value cash crops and live with poor access to commodity markets and financial services They often lack proper market information or are not able to benefit from available market linkages Food-security improvements are likely to come from their inclusion in the commodity value chain cycle
The GRAD project plans to first target 65000 households of which 58500 are chronically food insecure and 6500 are labeled as ldquoUltra Poorrdquo 3 A secondary target group involves 10000 households that can be categorized as food-sufficient households (6000) or food-secure households (4000) This second targeted group is intended to act as a role model for the first GRAD group of households Of the 65000 targeted households the 5-year-long GRAD project aims to graduate 50000 households
Specifically the GRAD project aims to achieve the following goals
1 Enhance the livelihood options of chronically food-insecure households in Highlands areas 2 Improve household and community resilience 3 Strengthen the enabling environment to promote scale-up and sustainability
3 ldquoUltra Poorrdquo households include female-headed households and landless youth
Cost Benefit Analysis of the GRAD Honey Value Chain November 2012 10
To ensure future success in the implementation of the GRAD project USAIDEthiopia plans to cooperate with several implementing agencies that are well-known experts in the areas of food security and commodity value chain development These technical partnersmdashCARE the Relief Society of Tigray (REST) the Organization for Rehabilitation and Development in Amhara (ORDA) Catholic Relief Services (CRS) and the Netherlands Development Agency (SNV)mdash possess the required expertise and hands-on experience from implementing similar projects in Ethiopia and elsewhere
The chronically food-insecure families who are the subjects of the GRAD project are located in 16 woredas in four regions of Ethiopia SNNPR Tigray Amhara and Oromia4 The selection of these woredas was based on their proximity to the Agriculture Growth Program (AGP) and active markets that will facilitate opportunities for engaging in local based commodity trading
The market linkages established during the lifetime of this project will connect chronically food-insecure households with locally based traders and facilitate the sales of commodities for income generation by this targeted group of households
In addition the GRAD project aims to correct the shortcomings experienced in the Productive Safety Net Program Plus (PSNP) project by facilitating an increase in the yearly income of chronically food-insecure households The objective of the chosen interventions is to increase each householdrsquos yearly income by US$365 (or US$1day) by the end of the project It is possible that this objective will not be met if such households engage in just one additional commodity value chain In such cases a combination of commodity value chains will be suggested to achieve the desired increase in the householdsrsquo income level
The GRAD project will emphasize gender equality and the inclusion of women via cooperation between stakeholders and a widely understood accountability to beneficiaries
USAID will facilitate the implementation of this project by establishing a credit-guarantee fund of US$2 million This guaranteed fund will enable the flow of credit resources necessary for the chronically food-insecure households to engage in the commodity production The distribution of financial resources will be handled by microlending institutions MFIs and RUSACCO One additional benefit of this credit guarantee will be to spread the financial risk between the implementing agency and the financial organizations that are responsible for lending to the targeted households
Four commodity value chains are being proposed for the GRAD project honey pulses vegetables and meat The choice of these value chains is based on their simplicity in terms of the necessary knowledge required for their introduction and the rather low initial start-up costs needed to engage in their production The value chains of these commodities show a good potential for postgraduation production increases and marketing Demand for all these commodities is growing in the domestic market (Ethiopian) and export markets
The list of the key FtF indicators proposed for monitoring and evaluating the GRAD projectrsquos performance is presented in table A in the appendix
4 As per the CARE proposal
Cost Benefit Analysis of the GRAD Honey Value Chain November 2012 11
Commodity Background
Honey Production in Ethiopia
Ethiopia has a long tradition of honey production reaching back many centuriesmdashin fact the longest tradition of honey and beeswax marketing in Africa Despite this long tradition honey production in Ethiopia is still treated as a supplemental on-farm activity that is usually combined with crop cultivation and animal husbandry A vast majority of the honey produced in Ethiopia comes from traditional beehives which currently are the most common form of technology used for honey production in Ethiopia As of 2011 Ethiopia possessed about 49 million traditional beehives which constitutes about 9557 percent of the total number of beehives in Ethiopia Currently only about 81500 transitional beehives (commonly called Kenya top bar hives) and 140000 modern beehives exist (CSA Agricultural Survey Report 2012) The total quantity of honey produced in Ethiopia in 2010ndash11 was about 399 million kilograms (kg) Almost all honey that is currently produced in Ethiopia (about 98 percent of the total yearly production) is consumed in the domestic market with only about 2 percent of the total yearly production being exported
Ethiopia has about 14ndash17 million households that are engaged in beekeeping and produce different types of honey that vary regionally as well as in terms of color consistency and purity The most in-demand honey among Ethiopians comes from Eastern Tigray where bees forage on the regionally specific Tebeb plant (Basium clandiforbium) and produce distinctive low-moisture white honey Other types of honey produced include Lalibela honey (Acacia honey) multifloral yellow honey dark brown honey and crude red honey (mainly used for the production of tej an Ethiopian drink with low alcohol content)
Current Market Situation in the Ethiopian Honey Sector
The sectorrsquos current market situation is characterized by a strong domestic demand and relatively low supply of table honey resulting in rising domestic prices for honey Producer prices differ by region and type of honey The most expensive is Eastern Tigrayrsquos white honey where the current retail price is ETB 17000kg Lower retail prices (of around ETB 60ndash9000kg) are observed for other varieties of white honey depending on the area and the honeyrsquos characteristics The retail prices for yellow honey are around ETB 50ndash6000kg while the least expensive red honey is sold at a price of around ETB 45ndash50kg5 This current market situation in the Ethiopian honey sector and producersrsquo overreliance on traditional technology are influenced by several factors
1 The use of traditional methods in the honey production The most commonly used method of honey production in Ethiopia relies on traditional beehives that are usually handmade from old logs found in the forest These beehives present low-productivity rates (around 5ndash7kgbeehiveyear) and low-quality honey that contains brood wax and other impurities The yield from transitional and modern beehives is significantly higher (8ndash15kgtransitional beehive and 15ndash20kgmodern beehive) and these improved beehives produce better-quality honey as well
2 The lack of financial resources that would allow the beekeepers to obtain modern beehives Small-scale farmers who are interested in beekeeping find it difficult to obtain the financial resources necessary to acquire transitional or modern beehives They possess few private financial resources and usually are unable to obtain the credit required to borrow capital
5 The honey retail prices were obtained during field interviews in Tigray and Amhara in July 2012
Cost Benefit Analysis of the GRAD Honey Value Chain November 2012 12
These financial barriers therefore do not allow them to switch from traditional to modern technology
3 Somewhat poor access to the tools necessary to start honey production with modern beehives Some beekeepers possess modern beehives (just boxes) yet do not have any of the tools required for the proper management of these beehives (eg smoker queen excluder honey extractor etc) This situation results in the production of honey within modern-style beehives but with yields and quality comparable to that of honey coming from traditional beehives
4 Lack of proper training on the management of the modern-style apiary Beekeepers who try to switch to modern-style honey production usually do not have the skills necessary for the proper management of modern beehives They maintain their beehives poorly using primitive harvesting methods and inappropriate tools Due to their lack of training they do not provide additional feed (water and sugar syrup) during droughts and have little knowledge of quality requirements in the honey market
5 Other associated obstacles Other barriers include the disappearance of desirable bee forage due to crop intensification and the growing use of agrochemicals extreme weather conditions in some parts of Ethiopia (droughts) poor transportation infrastructure and the lack of knowledge about proper storage techniques (at both the farm and the local honey collectorstraders levels)
Project Description and Activities
The inclusion of the honey value chain in the GRAD project is based on several factors that positively affect this commodityrsquos economic potential and its suitability for chronically food-insecure households One of the factors contributing to the inclusion of the honey value chain is that the labor and land requirements for modern honey-production techniques are relatively low The amount of land necessary for the establishment of an apiary with three modern beehives is 0001 hectares (Ha) with labor requirements of about 107 hoursround6 These low land requirements are especially helpful in the case of food-insecure households which on average possess no more than 025 Ha of land Modern-style honey production is also able to create non-gender-biased employment and income opportunities Honey production is neither physically strenuous nor culturally assigned to men and it is a ready source of cash hence it is ideally suited for female participation Given the traditional-style beekeeping experience that some of the households targeted in the GRAD project possess the inclusion of the honey value chain in the GRAD project has a solid rational basis
GRAD Project Interventions in the Honey Value Chain
Two honey value chain interventions in this GRAD project are being proposed for implementation both with the goal of improving honey-production techniques Intervention A will introduce three modern beehives related maintenance tools and appropriate training All investments will be made starting in year 1 of the intervention in modern honey-production techniques The amount of the investment required for the Intervention A is much higher than the usual amount available for new clients of MFIs operating in Ethiopia thus necessitating household equity contribution The main targeted beneficiaries of the GRAD project are chronically food-insecure households which may not have financial resources to make the contribution The second proposed intervention would overcome this barrier
6 A round refers to a 6-month period of time
Cost Benefit Analysis of the GRAD Honey Value Chain November 2012 13
Cost Benefit Analysis of the GRAD Honey Value Chain November 2012
Intervention B will introduce two transitional beehives and one modern beehive related maintenance tools and training A progressive transition will be made toward the exclusive use of modern beehives at the beginning of year 3 The total initial investment cost of the Intervention B will be ETB 4315 which is much lower than the total investment cost of Intervention A (ETB 7205) and only slightly above ETB 40007 Two versions of Intervention B have been analyzed Under the first scenario the households have been assumed to contribute 28 percent of the required investment but this contribution will be significantly smaller than 28 percent of the investment cost of the more expensive Intervention A This scenario is referred to as Intervention B in the following text The alternate scenario will eliminate the 28 percent equity contribution required for Intervention B and is referred to as Intervention C in the following text The required funds needed for the replacement of transitional beehives under both scenarios will be obtained through an additional loan taken by the households from the MFIs after repayment of the initial loan
Table 1 below shows a detailed outline of the specific investment expenditures associated with each of the proposed interventions
Table 1 Total investment expenditures for Interventions A B and C8
Input Intervention A Intervention B and C
(year 1)
Intervention B and C
(year 3) Modern beehives (3 for A 1 for B) 3300 1100 2200 Bee colony 2100 700 Queen excluder 330 110 220 Wax (ETBkg) 405 135 270 Smoker 140 140 Overall coat 150 150 Veil 90 90 Glove 80 80 Extractor 3209 320 Wax mold 150 150 Bee forage seedling or seeds 50 50 Plastic honey container 90 90 Transitional beehives (2) 0 200 Bee colony for transitional beehives (2) 0 1000 Total10 7205 4315 2690
Assumptions for the Selected GRAD Interventions in the Honey Value Chain
1 The GRAD-targeted chronically food-insecure households that will engage in the modern-style honey production will each be provided with a microloan necessary to purchase the
9 It has been assumed that an extractor and a wax mold will be shared by a group of households due to the equipmentrsquos relatively high prices10 Total investment and operating costs (including labor and additional feed for bees) for the first year and first round of the intervention will be ETB 769653 (nominal) for Intervention A and ETB 502653 (nominal) for Intervention B
7 The total amount of loan available for the new clients of MFIs is ETB 4000 8 Total investment expenditures for Intervention A three modern beehives with tools and appropriate training starting in year 1 Total investment expenditures for Intervention B two transitional beehives plus one modern beehive with tools and training starting in year 1 with progressive transition into all modern beehives by year 3 (in ETB)
14
required inputs It has been assumed that each targeted household possesses assets that can be sold to obtain cash (eg livestock) or has personal savings that can be used to provide a down payment 11 The size of this loan will vary according to the intervention With the required 28 percent participant contribution the necessary loan for Intervention A (covering three modern beehives starting in year 1 maintenance tools and training) will be ETB 5825household In the case of Intervention B (covering two transitional beehives and one modern beehive maintenance tools training and progressive transition into all modern beehives by the end of year 2) the size of the first loan will be ETB 3495household For financing the investment needed for the transition to using all modern beehives no equity contribution will be required and the amount of the second loan will be ETB 3028household The financing of the investment in Intervention C will occur without equity contribution The ability of the households to repay the initial loan for Interventions B and C will be very critical because it will determine the availability of the next loan required for the complete transition toward modern beehives
2 Training will be provided free of charge so targeted households will not incur any costs related to training (except the opportunity cost of time they spend being trained)
3 The microloan necessary for purchasing the required inputs will be provided at a subsidized interest rate of 15 percent Additional fees associated with this loan will include a service charge (1 percent) loan insurance (1 percent) upfront savings (10 percent) and a passbook fee (ETB 15) This loan will be for a period of 2 years with a grace period of 6 months Each household will make semiannual loan repayments for a total of three repayments of the loan principal12 The upfront savings (10 percent) will be returned to the households after the loan has been repaid There will be no interest renewed on the upfront savings
4 In the case of Interventions B and C households will need to replace the transitional beehives with modern ones in year 3 It has been assumed that they will cover the costs of the second loan after repaying the initial loan It has also been assumed that a down payment will not be needed for the second loan because the required amount is far below ETB 10000 (the amount provided by MFIs to clients who repaid the first loan and have good reputations)
5 It has been assumed that in the case where a household is not able to repay the total amount of its loan principal due in a particular round this amount will be transferred to the next round together with the incurred interest rate on the total outstanding amount This procedure will be repeated until the total loan amount is repaid13
6 It has also been assumed that each household will be able to harvest honey only one time in year 1 of Intervention A B or C In subsequent years it has been assumed that harvesting will happen twice annually For Intervention A it has been assumed that the average yield from each modern beehiveharvest will be 19 kgyear14 For Intervention B the same yield has been assumed in the case of modern beehive while the average yield from each transitional beehive has been assumed to be 8 kgyear
7 The household consumption of honey for both interventions has been assumed to be 5 kghouseholdround For Interventions B and C it has also been assumed that a household will consume lower-quality honey that comes from the transitional beehives and sell the honey from the modern beehives because it will fetch a higher price and thus allow the farmer to repay the loan faster
11 This ldquoafter down paymentrdquo loan amount in both cases includes investment expenditures as well as service charge loan insurance upfront savings and passbook fee12 In the first year of each intervention only one repayment has been assumed (in round 2) 13 Loan description provided by CARE 14 Such yield will be possible to obtain because of training that will improve a householdrsquos knowledge of modern beekeeping (eg the necessity for additional feedings and bee-forage planting)
Cost Benefit Analysis of the GRAD Honey Value Chain November 2012 15
8 The necessary operating costs for both interventions in the first round will include bee-feeding costs of ETB 14175 land-rental costs of ETB 040 and labor costs of ETB 34938 It has been assumed that households will provide the necessary labor for beehive maintenance so the labor required to maintain the beehives will not represent a cash burden
9 The cost of beehive maintenance (per round) has been set at 5 percent of the initial cost of the beehive for both interventions It has been assumed that households will use locally available materials and family labor for this purpose
10 The lifespan for the modern beehive for both interventions has been assumed to be 11 years which will be equal to the lifespan of the project15 In the case of Intervention B the lifespan for the transitional beehive is 2 years because at that point they will be replaced with modern beehives It has been assumed that farmers will just replace transitional beehives with modern versions (not add two modern beehives) because of two reasons
a Households keep modern beehives in the residential area to prevent them from being stolen Such a security system puts a constraint on the quantity of bee colonies that can be held by households because of the potential danger to the families
b The cost of the bee colony is much higher than the cost of transitional beehives so moving existing bee colonies from transitional beehives to modern ones instead of obtaining new bee colonies makes economic sense
11 In this analysis the farm-gate price of yellow honey has been assumed to be ETB 45kg for modern beehives and ETB 43kg for transitional beehives16
12 For Interventions B and C it has been assumed that households will replace their transitional beehives with modern ones at the beginning of year 3 The bee colonies from the transitional beehives will be moved to the modern ones so no additional costs will be incurred to replace the bee colonies
13 It has been assumed that the initial price of a bee colony for a modern beehive will be ETB 700 while it will be ETB 500 for a transitional beehive The difference in price results because the bee colony for a transitional beehive is smaller
14 For the purpose of this analysis the following macrolevel assumptions have been made The expected average annual domestic inflation rate is 20 percent and the US inflation rate is 25 percent The financial discount rate is a real rate of 12 percent the economic discount rate is a real rate of 12 percent the foreign exchange premium (FEP) is 65 percent (Kuo 2011) and the exchange rate is US$1 = ETB 1750
PROJECT MODELING
The financial and economic feasibility of the GRAD honey interventions in this analysis has been established by constructing cash flows from the point of view of the project (total investment point of view) and the point of view of the targeted households (equity point of view) All revenues or potential revenue items have been treated as cash inflows and all expenditures or potential expenditure items have been treated as cash outflows (Jenkins Kuo and Harberger 2011) The analysis has been carried out for an 11-year period
The cash flows have been constructed in nominal and real terms and on per-round (every 6 months) as well as annual bases (for total investment point of view and equity point of view) The cash flows have also been constructed for the total investment point of view with the exclusion of domestic
15 This lifespan was confirmed during the field interviews in July 2012 16 Honey prices have been based on field interviews conducted in July 2012 in Amhara and Tigray The difference in prices has come from the assumption that honey produced in modern beehives has a bit higher quality hence the higher price
Cost Benefit Analysis of the GRAD Honey Value Chain November 2012 16
Cost Benefit Analysis of the GRAD Honey Value Chain November 2012
consumption of honey (in nominal and real terms) to reflect the actual cash available for repayment of the loans
The economy resource flow statements have been constructed by adjusting each of the line items in the cash-flow statements of the total investment point of view by the corresponding economic conversion factor (CF)17
The financial sustainability of an intervention has been analyzed by estimating the SADSCR of the project over the life of the loan used to finance the project and by calculating the FNPV of the project from the targeted householdsrsquo (equity) point of view If the ENPV of the project is positive this means the total value of the benefits of the project (to whomever they accrue) will be greater than the combined costs required to implement and operate the intervention
FINDINGS
Financial Analysis
The appraisal has been carried out for an 11-year period Based on assumptions established for the purpose of this analysis all interventions will yield positive FNPVs The FNPV has been calculated using 12 percent real financial discount rate Table 2 presents the FNPVs for each intervention
Table 2 FNPVhouseholdintervention (in US$) FNPV
Intervention A 90640 Intervention B 79666 Intervention C 79002
The interventions in the honey value chain will also substantially increase the annual income of the targeted households Stabilized additional yearly income of US$21811 will be achieved by 2014 in the case of Intervention A compared to 2016 for Interventions B and C The resulting additional yearly income is presented in table 3 below18
Table 3 Annual net cash flows resulting from the interventions (in US$) Year Intervention A Intervention B Intervention C
2012 ndash16191 ndash12303 ndash9262 2013 3436 313 ndash3940 2014 21811 14767 14850 2015 21811 12737 12774 2016ndash2022 21811 21811 21811
The negative annual net cash flows in 2012 for Interventions A and B will result from the 28 percent equity contribution needed to finance the initial investment Intervention C will have two negative net cash flows in 2012 and 2013 because farmers will not have adequate cash flows to finance their debt burden during these years Although the initial equity contribution has been removed from
17 Dividing the separately calculated economic value of a unit of an item by its financial price will yield the conversion factor 18 Net cash flow from the household perspective has been measured as its revenue less operating expenses less debt service including both debt repayments and interest expense In the early years the net cash flows will be less than the strict accounting definition of income which only subtracts interest expense During these years annual financial depreciation will be less than debt repayment and hence net cash flow will be lower than net income
17
Cost Benefit Analysis of the GRAD Honey Value Chain November 2012
Intervention C targeted households will still need to contribute financial resources from other activities to repay their debt obligation
Table 4 describes the SADSCRs These indicators are very important from a program sustainability perspective because they show each householdrsquos ability to repay the loan necessary for the financing of the initial investment in each of the interventions The debt service obligations in a given period have been defined here to be the interest and principal that will be due in a given period plus the debt service from the previous period that cannot be paid due to inadequate net cash flow
Table 4 SADSCRround for household for the interventions Intervention A Year 1 round 1 Year 1 round 2 Year 2 round 1 Year 2 round 2 SADSCR - 093 100 171 Intervention B Year 1 round 1 Year 1 round 2 Year 2 round 1 Year 2 round 2 SADSCR (first loan) - 093 093 141 SADSCR (second loan) 126 174 271 Intervention C Year 1 round 1 Year 1 round 2 Year 2 round 1 Year 2 round 2 SADSCR (first loan) 068 052 058 SADSCR (second loan) 127 175 272
In the case of Intervention A the households will face difficulty repaying their debt obligation only during the first repayment period The debt service of the second repayment period and the unpaid debt service from the previous period will be repaid in round 1 of year 2
In the case of Intervention B when repayments will be due in the first two rounds the SADSCR will be below a value of 1 If the farmers will be expected to repay the loan this quickly they will have to draw on other sources of cash In round 2 of year 2 the SADSCR will reach a value above 1 indicating that the financial situation of the households will stabilize allowing the initial loan to be repaid This indicates that households by that time will be able to access the new loan required for the investment to replace transitional beehives with modern ones
The SADSCR of Intervention C will be below a value of 1 in all rounds indicating that households will not be able to repay their debt obligations without contributing financial resources generated by other activities The second loan however will be provided only for the households that repay the previous loan hence households will have to draw on other cash resources to repay the initial loan
The eventual necessity to contribute additional financial resources to repay the loan in Intervention C negates the principal difference (no equity contribution) between Interventions B and C Intervention B will require households to initially invest 28 percent equity capital while Intervention C will split almost the same amount over two repayment rounds The present value of equity contribution for Intervention B will be ETB 120820 (US$6904) while the present value of contribution under Intervention C will be ETB 109668 (US$6267) with ETB 67598 (US$3863) in the second round of year 1 and ETB 42070 (US$2404) in the first round of year 2
The SADSCR of the second loan of Interventions B and C will be above 1 in all rounds indicating that the financial standing of the households will be good enough to repay the loan although not in a timely manner
Table 5 presents the annual scheduled debt service obligations versus the annual net cash flows including the opportunity cost of labor which reflect the actual financial resources generated by the activity in the given period and available for the loan repayment It has been assumed that actual debt repayment will be made by the households without moving additional financial resources from other (non-honey-producing) activities to repay the loan for both interventions For Interventions A
18
Cost Benefit Analysis of the GRAD Honey Value Chain November 2012
and B these values confirm the status quo outlined in the discussion above about SADSCRs Although in both cases the households cannot repay the full amount of debt service in timely manner they will be able to cover the biggest part of payment and eventually will have adequate cash flow to pay back the loan At this time they will be refunded the upfront savings (10 percent of the initial loanrsquos amount) For Intervention B repayment of the loan will open access for the new loan required to finance investment in the two new modern beehives The annual net cash flows of Intervention C will not allow the households to repay the loan so they will not get access to the second loan
Table 5 Annual debt repayment obligations versus net annual cash flows including opportunity cost of family laborroundintervention (in ETB)
Year 1 Year 2 Intervention A Round 1 Round 2 Round 1 Round 2- Annual Debt Service Obl 278495 243149 156349 - Net cash flow 257625 243942 267225
Intervention B Round 1 Round 2 Round 1 Round 2 - Annual Debt Service Obl 168906 145146 104800- Net cash flow 157720 134502 147340
Intervention C Round 1 Round 2 Round 1 Round 2 - Annual Debt Service Obl 231771 259036 254673 - Net cash flow 157720 134502 147340
Note The debt service obligations in a given period have been defined here to be the interest and principal that are due plus the debt service from the previous period that cannot be paid due to inadequate net cash flow Note For the second loan of Interventions B and C annual debt service obligations will be equal to the actual debt payments because households will have sufficient cash flow to fully cover the obligations
19
Table 6 Intervention A annual cash-flow statement equity point of view (real ETB) Line items Yearltltltlt 2012 2013 2014 2015 2016 2017 2018 2019 2020 2021 2022 PV
Receipts
‐Value of in‐house honey consumption 22500 45000 45000 45000 45000 45000 45000 45000 45000 45000 45000 276760 ‐Revenue from honey sale 234000 468000 468000 468000 468000 468000 468000 468000 468000 468000 468000 2878304
Total inflows 256500 513000 513000 513000 513000 513000 513000 513000 513000 513000 513000 3155064
Expenditures Investment costs for modern beehives Modern beehive 330000 330000
Bee colony 210000 210000
Queen excluder 33000 33000
Wax 40500 40500
Smoker 14000 14000
Overall coat 15000 15000
Veil 9000 9000
Glove 8000 8000
Extractor 32000 32000
Wax mold 15000 15000
Bee forage seedling or seed to plant around backyard 5000 5000
Plastic honey container 9000 9000
Service costs for beehives Sugar for feeding 28350 28350 28350 28350 28350 28350 28350 28350 28350 28350 28350 188534
Beehive maintenance 16500 33000 33000 33000 33000 33000 33000 33000 33000 33000 33000 202957
or cost 69875 69875 69875 69875 69875 69875 69875 69875 69875 69875 69875 464684
Rental value of land 080 080 080 080 080 080 080 080 080 080 080 532
Subsidized loan ndash295457 321563 000 000 000 000 000 000 000 000 000 ndash8347
Total outflows 539848 452868 131305 131305 131305 131305 131305 131305 131305 131305 131305 1568860
Net cash flows ndash283348 60132 381695 381695 381695 381695 381695 381695 381695 381695 381695 1586204
Net cash flows real US$ ndash16191 3436 21811 21811 21811 21811 21811 21811 21811 21811 21811 90640
NPV 12 discount rate ETB 1586204 NPV 12 discount rate US$ 90640
20
Table 7 Intervention B annual cash-flow statement equity point of view (real ETB) Line items Yearltltltlt 2012 2013 2014 2015 2016 2017 2018 2019 2020 2021 2022 PV
Receipts
‐Value of in‐house honey consumption 21500 43000 45000 45000 45000 45000 45000 45000 45000 45000 45000 273974 ‐Revenue from honey sale 132800 265600 468000 468000 468000 468000 468000 468000 468000 468000 468000 2596390
Total inflows 154300 308600 513000 513000 513000 513000 513000 513000 513000 513000 513000 2870364
Expenditures Investment costs Modern beehive 110000 000 220000 285383
Bee colony for modern beehive 70000 70000
Transitional beehive 20000 20000
Bee colony for transitional beehive 100000 100000
Queen excluder 11000 000 22000 28538
Wax 13500 000 27000 35024
Smoker 14000 14000
Overall coat 15000 15000
Veil 9000 9000
Glove 8000 8000
Extractor 32000 32000
Wax mold 15000 15000
Bee forage seedling or seed to plant around backyard 5000 5000
Plastic honey container 9000 9000
Service costs for beehives Sugar for feeding 28350 28350 28350 28350 28350 28350 28350 28350 28350 28350 28350 188534
Modern beehive maintenance 5500 11000 33000 33000 33000 33000 33000 33000 33000 33000 33000 172315
Transitional beehive maintenance 1000 2000 000 000 000 000 000 000 000 000 000 2786
Labor cost 69875 69875 69875 69875 69875 69875 69875 69875 69875 69875 69875 464684
Rental value of land 080 080 080 080 080 080 080 080 080 080 080 532
Subsidized loan ndash166702 191809 ndash145729 158794 000 000 000 000 000 000 000 1409
Total outflows 369603 303114 254576 290099 131305 131305 131305 131305 131305 131305 131305 1476204
Net cash flows ndash215303 5486 258424 222901 381695 381695 381695 381695 381695 381695 381695 1394160
Net cash flows real US$ ndash12303 313 14767 12737 21811 21811 21811 21811 21811 21811 21811 79666
NPV 12 discount rate ETB 1394160 NPV 12 discount rate US$ 79666
Cost Benefit Analysis of the GRAD Honey Value Chain November 2012 21
Table 8 Intervention C annual cash-flow statement equity point of view (real ETB)19
Line items Yearltltltlt 2012 2013 2014 2015 2016 2017 2018 2019 2020 2021 2022 PV
Receipts
‐Value of in‐house honey 21500 43000 45000 45000 45000 45000 45000 45000 45000 45000 45000 273974Revenue from honey ‐ sale 132800 265600 468000 468000 468000 468000 468000 468000 468000 468000 468000 2596390
Total inflows 154300 308600 513000 513000 513000 513000 513000 513000 513000 513000 513000 2870364
Expenditures Investment costs Modern beehive 110000 000 220000 285383
Bee colony for modern beehive 70000 70000
Transitional beehive 20000 20000 Bee colony for transitional 100000 100000
Queen excluder 11000 000 22000 28538
Wax 13500 000 27000 35024
Smoker 14000 14000
Overall coat 15000 15000
Veil 9000 9000
Glove 8000 8000
Extractor 32000 32000
Wax mold 15000 15000 Bee forage seedling or seed to plant around
5000 5000
Plastic honey container 9000 9000
Services costs for beehives Sugar for feeding 28350 28350 28350 28350 28350 28350 28350 28350 28350 28350 28350 188534
Modern beehive maintenance 0055 11000 33000 33000 33000 33000 33000 33000 33000 33000 33000 172315 Transitional beehive 0010 2000 000 000 000 000 000 000 000 000 000 2786
Labor cost 69875 69875 69875 69875 69875 69875 69875 69875 69875 69875 69875 464684
Rental value of land 080 080 080 080 080 080 080 080 080 080 080 532
Subsidized loan ndash219923 266240 ndash147177 158152 000 000 000 000 000 000 000 32013
Total outflows 316382 377545 253128 289457 131305 131305 131305 131305 131305 131305 131305 1487827
Net cash flows ndash162082 ndash68945 259872 223543 381695 381695 381695 381695 381695 381695 381695 1382537
Net cash flows real US$ ndash9262 ndash3940 14850 12774 21811 21811 21811 21811 21811 21811 21811 79002
NPV 12 discount rate ETB 1382537
NPV 12 discount rate US$ 79002
19 The only difference between tables 8 and 9 is the repayment of the loan (subsidized loan line) All other lines of the tables are the same
Cost Benefit Analysis of the GRAD Honey Value Chain November 2012 22
Comparison of Interventions A B and C
Even though all interventions will yield positive FNPVs with Intervention A resulting in a greater FNPV the choice between the interventions will depend on several factors
1 Intervention A will require higher initial investment expenditures than Intervention B (ETB 7205 versus ETB 4315) Within the lifespan of Intervention A greater quantities of honey will be produced earlier thus allowing for higher financial returns that will offset the costs associated with the higher initial investment Such high initial investment requirements however will require an equity contribution from the household side because current policies of MFIs in Ethiopia will allow households to borrow a maximum of ETB 4000 in the first loan If the households are able to repay they will get access to a new loan up to ETB 10000
2 The main group of GRAD beneficiaries will be the households for which the equity contribution required for Intervention A may be a constraint to participate in the program For such households Intervention B will be more attractive because of the reduced equity contribution
3 The success of the complete transition toward modern beekeeping in Interventions B and C will entirely depend on the ability of the households to get a second loan from the MFIs The MFIs will not provide an additional loan to households that fail to repay the first loan so the households will need to contribute financial resources generated by other farm activities to repay the first loan This erases the principal difference of no equity contribution between the two interventions Some households however may prefer not to contribute 28 percent of the needed equity at the beginning of the project and will instead make this contribution in two installments to cover the debt burden as in the case of Intervention C
4 In addition to the higher FNPV Intervention A will also result in GRAD householdsrsquo achieving stable additional income of US$218 by 2014 as compared to 2016 for Intervention B Total incremental earnings of Intervention A as compared to Intervention B calculated over the 4-year period of 2012ndash16 will be equal to US$14681 (See table 3) For those households that will be financially capable of making the equity contribution it will be advantageous to choose Intervention A
5 Although Interventions B and C will require a second loan to finance the complete transition toward modern beekeeping this loan will not put a significant financial burden on the households because the cash flows will be sufficient to cover the householdsrsquo debt service obligations in full For Intervention A however after the total repayment of the initial investment loan in round 2 of year 2 the household will be free of debt and can continue honey production fully benefiting from the increased income from honey sales
Economic Analysis
Differences have emerged between the financial and economic outcomes due to the fact that the financial values do not include all externalities present in the economy In this case the only externality will come from increased tax revenues either directly from the taxation of inputs or indirectly via the FEP Honey is an exportable commodity in Ethiopia The FEP for Ethiopia has been estimated to be equal to 65 percent (Kuo 2011) Hence every incremental unit of foreign exchange (dollars) earned from increased exports will have an economic value to the country of 1065 times the value of the revenues by the exporters when exchanging the foreign exchange for local currency at the market exchange rate
23
To show the true economic impact of the proposed intervention on the Ethiopian economy the economic values have been derived by adjusting the financial values by the appropriate economic conversion factors If no distortions are present in the market then the financial value of an item has been used to measure its economic value20
Table 9 reports that the ENPV obtained in the analysis will be positive for both interventions The economic opportunity cost of capital of 12 percent has been used while calculating the ENPV If they are successfully implemented both interventions will benefit the Ethiopian economy
When the two interventions are compared Intervention A will result in total higher production of honey through the full life of the project as compared to Intervention B mainly because of the larger volume of output that will be produced by Intervention A during first 2 years of the project On the cost side farmers eventually will have to purchase the same equipment and the same number of modern beehives for Intervention B as they will for Intervention A The net results have shown that Intervention A will have a greater ENPV than Intervention B will The only difference between Interventions B and C is the way the interventions will be financed This method of investment financing will just be a transfer of resources and hence will not bring any change to the economic outcomes of the interventions As a result there is no difference between Interventions B and C Intervention A will be a better choice not only for the chronically food-insecure households targeted in the GRAD project but also for the Ethiopian economy as a whole because it will be more productive and create a larger value of financial and economic net benefits
The estimated ENPVs are presented in table 9 below
Table 9 ENPVs for Interventions A and B (in US$) ENPV
Intervention A 113092 Intervention B 100774
20 The list of CFs used for the purpose of this analysis is presented in table A in the appendix
Cost Benefit Analysis of the GRAD Honey Value Chain November 2012 24
Table 10 Economic resources cash-flow statement for Intervention A (real ETB) Line items CF Yearltltltlt 2012 2013 2014 2015 2016 2017 2018 2019 2020 2021 2022 PV
Receipts ‐Value of in‐house honey consumption 109 24583 49166 49166 49166 49166 49166 49166 49166 49166 49166 49166 302382 ‐Revenue from honey sale 109 255663 511327 511327 511327 511327 511327 511327 511327 511327 511327 511327 3144775
Total Inflows 280246 560493 560493 560493 560493 560493 560493 560493 560493 560493 560493 3447157
Expenditures Investment costs Modern beehive 085 281185 281185
Bee colony 100 210000 210000
Queen excluder 085 28118 28118
Wax 106 43104 43104
Smoker 085 11898 11898
Overall coat 073 10995 10995
Veil 073 6597 6597
Glove 080 6416 6416
Extractor 082 26244 26244
Wax mold 100 15000 15000 Bee forage seedling or seed to plant around 100 5000 5000
Plastic honey container 075 6724 6724
Services costs for beehives Sugar for feeding 079 22345 22345 22345 22345 22345 22345 22345 22345 22345 22345 22345 148600
Beehive maintenance 100 16500 33000 33000 33000 33000 33000 33000 33000 33000 33000 33000 202957
Labor cost 100 69875 69875 69875 69875 69875 69875 69875 69875 69875 69875 69875 464684
Rental value of land 100 080 080 080 080 080 080 080 080 080 080 080 532
Total outflows 760082 125300 125300 125300 125300 125300 125300 125300 125300 125300 125300 1468055
Net cash flows ‐ 435193 435193 435193 435193 435193 435193 435193 435193 435193 435193 1979102
Net cash flows real US$ ‐27419 24868 24868 24868 24868 24868 24868 24868 24868 24868 24868 113092
ENPV 12 discount rate ETB 19791
ENPV 12 discount rate $US 113092
25
Table 11 Economic resources cash-flow statement for Intervention B (real ETB)21
Line items CF Yearltltltlt 2012 2013 2014 2015 2016 2017 2018 2019 2020 2021 2022 PV
Receipts ‐Value of in‐house honey consumption 109 23490 46981 49166 49166 49166 49166 49166 49166 49166 49166 49166 299339
‐ Revenue from honey sale 109 145094
290189 511327 511327 511327 511327 511327 511327 511327 511327 511327 2836761
Total inflows 168585 337170 560493 560493 560493 560493 560493 560493 560493 560493 560493 3136100
Expenditures Investment costs Modern beehive 085 93728 000 187457 243167
Bee colony for modern beehive 100 70000 70000
Transitional beehive 100 20000 20000
Bee colony for transitional beehive 100 100000 100000
Queen excluder 085 9373 000 18746 24317
Wax 106 14368 000 28736 37276
Smoker 085 11898 11898
Overall coat 073 10995 10995
Veil 073 6597 6597
Glove 080 6416 6416Extractor 082 26244 26244
Wax mold 100 15000 15000 Bee forage seedling or seed to plant around backyard 100 5000 5000
Plastic honey container 075 6724 6724
Services costs for beehives Sugar for feeding 079 22345 22345 22345 22345 22345 22345 22345 22345 22345 22345 22345 148600
Modern beehive maintenance 100 5500 11000 33000 33000 33000 33000 33000 33000 33000 33000 33000 172315
Transitional beehive maintenance 100 1000 2000 000 000 000 000 000 000 000 000 000 2786
Labor cost 100 69875 69875 69875 69875 69875 69875 69875 69875 69875 69875 69875 464684
Rental value of land 100 080 080 080 080 080 080 080 080 080 080 080 532
Total outflows 495144 105300 360238 125300 125300 125300 125300 125300 125300 125300 125300 1372551
Net cash flows ndash326559 231870 200255 435193 435193 435193 435193 435193 435193 435193 435193 1763549
Net cash flows real US$ ndash18660 13250 11443 24868 24868 24868 24868 24868 24868 24868 24868 100774
ENPV 12 discount rate ETB 17635
ENPV 12 discount rate $US 100774
21 There is no difference between Interventions B and C from the economy point of view
Cost Benefit Analysis of the GRAD Honey Value Chain November 2012 26
STAKEHOLDER AND BENEFICIARY ANALYSIS
An economic surplus in the economy is created by producing an output that has an economic value greater than the economic cost of the inputs such as capital land and labor that are used to produce the item The proposed interventions in the honey value chain will yield two groups of beneficiaries the households engaged in the interventions and the government of Ethiopia
The results of the analysis reveal that the income of the targeted households will increase Table 3 presented above has been designed by treating the opportunity cost of labor as a cash outflow The opportunity cost of labor will be retained within the family and therefore can be included in the present annual income of the targeted families Table 12 presents the annual family income profiles including the opportunity cost of labor which has been assumed to remain within the family
Table 12 Annual income of the targeted households including opportunity cost of family labor (in US$) Year Intervention A Intervention B Intervention C 2012 ndash15244 ndash11927 ndash8886 2013 5372 3492 ndash3192 2014 27694 20650 20733 2015 27694 18620 18667 2016ndash2022 27694 27694 27694
The net income decrease in the first years of the interventions will occur because of the equity contribution The annual increase in income presented in table 12 includes the opportunity cost of family labor spent on the beekeeping activities Each householdrsquos net income over the 11-year evaluation period will be US$121304 for Intervention A US$110868 for Intervention B and US$108033 for Intervention C
The other beneficiary of the intervention will be the government for the following reasons
The government will benefit directly from the taxes collected on the inputs and outputs of the intervention Plastic containers honey extractor sugar and so forth are importable to Ethiopia The total tax rate applied to these inputs is higher than the foreign exchange premium The inflow of taxes will reduce the economic cost below its financial cost and generate tax revenue for the government of Ethiopia
Modern beehives and smokers are produced domestically so they are assumed to be internationally non-tradable goods The inputs used to produce beehives and smokers such as stainless steel nails and covers are exportable to Ethiopia Again the total tax rate applied to these inputs will be higher than the FEP thus generating tax revenue for the government of Ethiopia
The government will also benefit indirectly because honey is exported from Ethiopia Exports allow the country to earn foreign exchange
The total amount of government benefits from the interventions over the 11-year period per household has been estimated to be US$22928 for Intervention A and US$21027 for Interventions B and C
The values of stakeholder gains under each of the interventions are presented in table 13 below
27
Cost Benefit Analysis of the GRAD Honey Value Chain November 2012
Table 13 Stakeholder and beneficiary impacts of the project (in US$)
Intervention A Intervention B Intervention C
Economic NPV (FNPV + externalities)
113092 100774 100774
Financial NPV (households) 90640 79666 79002 Externalities 22451 21108 21772
o Government 22928 21027 21027 o Financing
contribution ndash477 080 745
The financing contribution will be the amount of the interest and other charges paid on the three loans provided by MFIs over and above a real cost of 12 percent This figure represents a transfer of resources between the households and the MFIs USAIDEthiopia generally negotiates subsidized interest rates for households benefiting from aid programs The negative financing contribution in the case of Intervention A represents a direct subsidy to the targeted households that will be created through the submarket interest rate In the case of the GRAD project the subsidized interest rate will be 15 percent which is 5 percent below the current level of inflation in Ethiopia However the additional fees charged by the MFIs to make them willing to provide loans will more than offset the subsidy content of the interest rate paid on the loan in the case of Interventions B and C
Exact information regarding the number of households that will engage in beekeeping activities does not exist but assuming that 70 percent of the chronically food-insecure households participate (the main group of the GRAD beneficiaries)mdashthat is 70 percent of 50000 households will participate in beekeeping eventually (not necessary in year 1 of the project)mdashit is possible to calculate combined stakeholder and beneficiary impacts of the project Figures are presented in Table 14
Table 14 Combined stakeholder and beneficiary impacts of 35000 households in the project (in thousands US$)
28
Intervention A Intervention B Intervention C Economic NPV (FNPV + externalities)
3958220 3527090 3527090
Financial NPV (households) 3172400 2788310 2765070 Externalities 785785 738780 762020
o Government 802480 735945 735945 o Financing
contribution ndash16695 ndash2800 26075
SENSITIVITY ANALYSIS
A sensitivity analysis for the GRAD honey value chain intervention has been performed using the key variables that will be prone to change and likely to influence the situation of the households engaged in the project These variables include the price and yield of honey as well as their joint impact Details related to this sensitivity analysis are outlined in tables 15 16 17 and 18 below
Cost Benefit Analysis of the GRAD Honey Value Chain November 2012
The Joint Impact of Honey Price and Yield of the FNPV for Intervention A
Because prices and yields of honey are two of the most important factors that will influence the householdsrsquo income it is prudent to consider the possible impacts of changing one of their values in a sensitivity analysis The joint impact of these two variables for Intervention A is presented in table 15 below
Table 15 The joint impact of honey price and yield on the FNPV of households for Intervention A
Yield (in kg) 1200 1500 1700 1900 2100
4300 30850 51891 65918 82823 100599
4500 34924 56943 72174 90640 109417
5000 45108 69575 89659 110471 131558
6000 65477 100066 125232 150535 175839
7000 87799 131558 161079 190600 220121 Price (in ETB)
Table 15 shows the joint impact of the honey price and honey yield on the FNPV under Intervention A (three modern beehives with related tools and training) The scenario for this analysis has assumed that the price of honey will be ETB 45kg and the yield will be 19 kground (This honey price has been based on the assumption that the household will produce yellow honey which fetches lower prices in the domestic market) Under these circumstances the FNPV will be US$90640 But it is safe to assume that given the current high demand and rather low supply of honey in the domestic market the price of yellow honey will increase in the future Therefore the FNPV will likely be higher Even in the worst-case scenario if prices were to drop to ETB 43kg and the yield were to decrease from 19 kground to 12 kground the FNPV will still be positive at US$30850 which indicates very low risk of intervention failure at the household level
Table 16 The joint impact of honey price and yield on the net cash flow of households for Intervention A
Yield (in kg) 1200 1500 1700 1900 2100
4300 10188 14611 17560 20508 23457
4500 11011 15640 18725 21811 24897
5000 13068 18211 21640 25068 28497
6000 17183 23354 27468 31583 35697
7000 21297 28497 33297 38097 42897 Price (in ETB)
Table 16 presents the joint impact of honey yield and price on the net cash flow of the targeted households in 2014 and after when the loan will be repaid and cash flows will be stable Under the baseline scenario the annual net cash flow will be US$21811 If the price were ETB 7000 and the yield were 19 kg the net cash flow will reach US$38097 which is even higher than the targeted income increase of US$36500 Currently however only white honey will be able to fetch such high price levels in the domestic market The findings suggest that households in the areas where bees produce white honey will easily reach the targeted increase in income
29
Cost Benefit Analysis of the GRAD Honey Value Chain November 2012
Table 17 presents the joint impact of honey price and honey yield on the FNPV under Intervention B The FNPV in this case will be US$79666 In the worst-case scenario the FNPV will be lower under Intervention B than under Intervention A but will still be positive at US$22711 which again indicates low risk
Table 17 The joint impact of honey price and yield on the FNPV of households for Intervention B
Yield (in kg) 1200 1500 1700 1900 2100
4300 22721 43762 57790 72936 88169
4500 26636 48655 63725 79666 95644
5000 36422 61069 78781 96534 114429
6000 55995 87637 109059 130542 152025
7000 77009 114429 139493 164557 189621 Price (In ETB) Price (in ETB)
Table 18 describes the joint impact of honey price and yield on the annual net cash flow of the beneficiaries of Intervention B after 2016 when both of the loans will be repaid and cash flows will be stable The baseline scenario will yield a net annual cash flow of US$21811 If the price of white honey were to reach ETB 7000 the net increase in annual income excluding the opportunity cost of family labor will reach US$38097 holding the yield constant This figure is again higher than the targeted increase of US$36500
Table 18 The joint impact of honey price and yield on the FNPV of households for Intervention B
Yield (in kg) 1200 1500 1700 1900 2100
4300 10188 14611 17560 20508 23457
4500 11011 15640 18725 21811 24897
5000 13068 18211 21640 25068 28497
6000 17183 23354 27468 31583 35697
7000 21297 28497 33297 38097 42897 Price (in ETB)
If the nationwide production of honey continue to be limited and with the increasing popularity of good-quality honey the prices may go higher In the best-case scenario for Intervention A if prices were to reach ETB 70kg (more relevant price for white honey) and yields were to reach 21 kground the FNPV will be US$220121 In Intervention B under the same circumstances the FNPV will reach US$189621 The net annual cash flow accruing to the households at this combination of yield and price will provide an additional US$42897 per year after the loan has been paid in 2013 under Intervention A and in 2015 under Intervention B If domestic production could be substantially increased it is likely that the processing costs and perhaps the fob price for honey exports will fall allowing Ethiopian honey to become more competitive in the international market
30
RECOMMENDATIONS
Interventions A and B show a good potential for a substantial increase in income and economic impact for the households targeted by the GRAD project USAID should support their implementation They appear to have the ability to improve the livelihood and food security of the targeted households That said regardless of their potential Interventions A and B on their own may not guarantee an increase of US$365 in the householdsrsquo yearly income as hoped for in the GRAD proposal However when combined with other income-generating activities they may allow households to achieve the additional US$365year Another important benefit of these interventions is the almost nonexistent requirements for land Taking into consideration the very limited land holdings of GRAD beneficiaries and their almost complete reliance on this land as a source of income these interventions are attractive because they will allow households to earn additional income without changing their current land usage An intervention will also allow households to benefit from an additional MFI loan in year 3 after complete repayment of the initial loan for honey production for purchasing more beehives or participating in other proposed GRAD interventions such as haricot beans production Therefore it will be advisable to combine this intervention with another commodity intervention proposed in the GRAD project introducing them as a ldquopackage solutionrdquo to achieve the desired increase in householdsrsquo yearly income
It is debatable whether farmers will be able to repay a free market interest loan at 50 percent interest if they need to borrow their ldquoequityrdquo contributions Taking into consideration that the farmers will first try to repay the free market loan the risk of default on the USAID loan will be high The debt service from the two loans will be so significant that farmers may either refuse to participate in the beekeeping intervention or fail to repay the USAID-backed loan Many GRAD households have no access to free market loans as their current financial situation is such that financial institutions are unwilling to lend money to them Reducing the required amount of money necessary for a down payment might better facilitate the implementation of Intervention A ensuring that the targeted households will be able to join the project and benefit from its outcome
The analysis also reveals that Intervention B which has been designed to eliminate the equity contribution for households that will not be able to take a financial stake in the investment will eventually require the households to contribute other resources to repay their debt services This structure however may be preferred by many farmers because the equity contribution will be divided into two parts thus making it easier for them to find the required financial resources
In summary it is recommended that the burden of the initial down payment (28 percent) that is required from each targeted household to participate in the GRAD intervention in the honey value chain be lessened An ideal financing package will eliminate the down-payment requirements by increasing the size of the USAID-backed loan and increasing the length of the repayment period for Intervention A to 3 years In principal it is a good practice to require households to take a financial stake in the project by forcing them to contribute their own money yet such a system might prevent some farmers from choosing honey production as an intervention
Cost Benefit Analysis of the GRAD Honey Value Chain November 2012 31
REFERENCES
Abebe A (2009) Market Chain Analysis of Honey Production in Atsbi Wemberta District Eastern Zone of Tigray National Regional State Department of Agricultural Economics School of Graduate Studies Haramaya University
Agonafir J (2005) Strategic Intervention Plan on Honey and Beeswax Value Chains SNV Support to Business Organizations and Their Access to Market (BOAM)
Alemseged T and Yildiz N (2008) Beekeeping and Honey Production in the Tigray Region Ethiopia African Services Committee
Alemtsehay T (2011) Seasonal Availability of Common Bee Flora in Relation to Land Use and Colony Performance in Gergera Watershed Atsbi Wembwrta District Eastern Tigray Ethiopia Master Thesis Hawassa University
Anand S and Sisay G (2011) Engaging Smallholders in Value Chains Creating New Opportunities for Beekeepers in Ethiopia Programme Insights
APM Consul PLC (2008) A Study on Private Sector Linkages for Bee Product Producers in Bale Bale Regional Sustainable Management Program
Belie T (2009) Honeybee Production and Marketing Systems Constraints and Opportunities in Burie District of Amhara Region Ethiopia Department of Animal Science and Technology School of Graduate Studies Bahir Dar University
Chala K Taye T Kebede D and Tadele T (2012) Opportunities and Challenges of Honey Production in Gomma District of Jimma Zone South-West Ethiopia Journal of Agricultural Extension and Rural Development 4(4) 85ndash91
Desalegn B (2007) Assessment of the Effect of Ant (Dorylus fulvus) on Honeybee Colony (A mellifera) and Their Products in West and South-West Shewa Zones Ethiopia Ethiopian Journal of Animal Production 7(1) 12ndash26
Graduation With Resilience to Achieve Sustainable Development (GRAD) Technical Proposal July 20 2012
Jenkins G Kuo CY and Harberger A (2011) Cost-Benefit Analysis for Investment Decision Queenrsquos University August 2012 edition
Kuo CY (2011) Estimates of the Foreign Exchange Premium and the Premium for Non-Tradable Outlays for Countries in Africa John Deutsch International Department of Economics Queenrsquos University Canada
Shiferaw A Jaleta M Gebremedhin B and Hoekstra D (2010) Increasing Economic Benefit From Apiculture Through Value Chain Development Approach The Case of Alaba Special District Southern Ethiopia IPMS Ethiopia
Cost Benefit Analysis of the GRAD Honey Value Chain November 2012 32
Tadesse B and Phillips D (2007) Ensuring Small-Scale Producers in Ethiopia to Achieve Sustainable and Fair Access to Honey Markets International Development Enterprises (IDE) and Ethiopian Society for Appropriate Technology (ESAT)
Workneh A and Ranjitha P (2011) Beekeeping Subsector Challenges and Constraints in Atsbi Wemberta District of Eastern Zone Tigray Region Ethiopia Journal of Agricultural Extension and Rural Development 3(1) Z8ndashZ12
Yigzaw D Hoekstra D Berhe K Derso T and Mehari Y (2010) Smallholder Apiculture Development in Bure Ethiopia Experiences From IPMS Project Interventions IPMS Ethiopia
Yirga G Koru B Kidane D and Mebrahatu A (2012) Assessment of Beekeeping Practices in Asgede Tsimbla District Northern Ethiopia Absconding Bee Forage and Bee Pests African Journal of Agricultural Research 7(1) 1ndash5
Yirga G and Teferi M (2010) Participatory Technology and Constraints Assessment to Improve the Livelihood of Beekeepers in Tigray Region Northern Ethiopia Biology Department College of Natural and Computational Sciences Mekelle University
Cost Benefit Analysis of the GRAD Honey Value Chain November 2012 33
Cost Benefit Analysis of the GRAD Honey Value Chain November 2012
APPENDIX
Table A The FtF indicators proposed for the monitoring and evaluation of the GRAD project
Results Indicator Target
Overall objective To graduate chronically food-insecure households from food support
Graduation of chronically food-insecure households from food aid by increasing their yearly household income
50000 households that will experience an increase in yearly income of US$365 by year 5
Result 1 Enhanced livelihood options for chronically food-insecure households
45-2 Number of jobs attributed to FtF implementation (RiA) ndashdelete it
Higher is better
3191-3 and 47-4 Prevalence of households with moderate or severe hunger (RiA)
Lower is better
Result 2 Improved community and household resilience
319-16 Prevalence of underweight children under 5 years of age (R)-delete it
Lower is better
319-13 Prevalence of underweight women (R)
Lower is better
319-4 and 3191-4 Prevalence of exclusive breastfeeding of children under 6 months of age (RiA)
Lower is better
319-11 Prevalence of stunted children under 5 years of age (R)
Lower is better
452-14 Number of vulnerable households benefiting directly from USG assistance (S)
Lower is better
Result 3 Strengthened enabling environment to promote scale-up and sustainability
45 Womenrsquos Empowerment in Agriculture Index Score (R)
Higher is better
451-27 and CBLD-5 Percentage of combined key areas of organization capacity among USG direct and indirect local implementing partner levels
Higher is better
34
Cost Benefit Analysis of the GRAD Honey Value Chain November 2012
452-38 Value of new private sector investment in the agriculture sector or food chain leveraged by FtF implementation (RiA)
Higher is better
Table B List of CFs used to make adjustments in the economic analysis for both interventions
Summary of CFs Honey 109 Transportation 084 Labor 100 Modern beehive 085 Transitional beehive 100 Bee colony 100 Queen excluder 085 Wax (ETBkg) 106 Smoker 085 Overall coat 073 Veil 073 Glove 080 Extractor 082 Wax mold 100 Plastic honey container 075 Beehive maintenance 100 Rental value of land 100 Sugar 079
35

Cost Benefit Analysis of the GRAD Honey Value Chain November 2012
In the case of Intervention B when repayments are due in the first two rounds the SADSCRs are below one If these farmers are going to be expected to repay the loan this quickly they will have to draw on other sources of cash 2 In round 2 of year 2 the SADSCR reaches a value above 1 indicating that the financial situation of the households will stabilize and the initial loan will be repaid After that round the household will be able to get a new loan required for the complete transition toward modern beehives
The SADSCRs of Intervention C are below a value of 1 in all rounds indicating that households will not be able to repay their debt obligations without the contribution of financial resources generated by other activities The second loan however will be provided only for the households that will repay the previous loan hence households will have to draw on other resources of cash to repay the initial loan
The eventual necessity to contribute additional financial resources in Intervention C erases principal difference (no equity contribution) between Interventions B and C Intervention B will require households to initially invest 28 percent equity capital while Intervention C will split almost the same amount over two repayment rounds The present value of the equity contribution for Intervention B is ETB 120820 (US$6904) while the present value of the amount under Intervention C is ETB 109668 (US$6267) with ETB 67598 (US$3863) in the second round of year 1 and ETB 42070 (US$2404) in the first round of year 2
Beneficiary Analysis Results The results of the analysis reveal that the income of the targeted households will increase This annual increase in the income of the households under each intervention is presented in table B below
Table B Annual increase in the income of the households including opportunity cost of family labor (in US$) Year Intervention A Intervention B Intervention C
2012 ndash15244 ndash11927 ndash8886 2013 5372 3492 ndash3192 2014 27694 20650 20733 2015 27694 18620 18657
2016ndash2022 27694 27694 27694
The net income decrease in the first years of the interventions will occur because of the equity contribution The annual increase in income presented in table B includes the opportunity cost of family labor spent on the beekeeping activities Each householdrsquos net income over the 11-year evaluation period will be US$121304 for Intervention A US$110868 for Intervention B and US$108033 for Intervention C The other beneficiary of the intervention will be the Ethiopian government for the following reasons
The government will benefit directly from the taxes collected on the inputs and outputs of the intervention Plastic containers honey extractors sugar and so forth are importable to Ethiopia The total tax rate applied to these inputs is higher than the foreign exchange premium The inflow of taxes will reduce the economic cost below its financial cost and generate tax revenue for the government of Ethiopia
Modern beehives and smokers are produced domestically so they are assumed to be internationally nontradable goods The inputs used to produce beehives and smokers such as stainless steel nails and covers are exportable to Ethiopia Again the total tax rate applied
2 Other sources of cash refer to financial resources generated by the householdsrsquo activities except beekeeping activities
8
to these inputs is higher than the foreign exchange premium thus generating tax revenue for the government of Ethiopia
The government will also benefit indirectly because honey is exported from Ethiopia Exports allow the country to earn foreign exchange
The total amount of government benefits from the intervention over the 11-year period per household is estimated at US$22928 for Intervention A and US$21027 for Interventions B and C
Conclusions and Recommendations Expected returns on the modern beekeeping activities are dependent on the full list of inputs required for the proper implementation so none of the tools can be eliminated from the required investment A missing input such as a honey extractor will directly result in decreased quality or yield of honey Absence of other inputs such as gloves or overall coats may put the health of the beekeepers at risk because of the aggressiveness of Ethiopian bees Taking into consideration the financial situation of the GRAD beneficiaries it will be appropriate to share the most expensive inputs of production such as a honey extractor between groups of farmers
The loan amount from MFIs for new clients in 2012 is limited to ETB 4000 (US$22857) which is less than the required investment for all three interventions GRAD beneficiaries consist primarily of chronically food-insecure households The necessity of the equity contribution may limit the beneficiaries of the honey interventions to better-off groups of farmers It is suggested that the interventions be redesigned to allow farmers access to sufficient financial resources to start modern beekeeping activities without equity contribution If such loan amounts can be negotiated with MFIs by the implementers of the GRAD project the term of the loan should also be expanded to 3 years
In the case of Intervention B the total initial investment cost is ETB 4315 This amount is only slightly above the amount of ETB 4000 usually provided by MFIs hence reducing the requirements for an equity contribution Intervention B however has been analyzed assuming an equity contribution of 28 percent the analysis reveals that the households will be able to repay the loan although they should be allowed to move small fractions of the debt service to the next repayment period if necessary The repayment of the loan in turn will give them access to the next loan
In the case of Intervention C the total initial investment cost is also ETB 4315 Intervention C has been analyzed without assuming an equity contribution of 28 percent The increased debt service will not allow the households to repay their loan obligations without contributing additional financial resources If the first loan will not be repaid the households will not have access to the next loan required for the purchase of two modern beehives at the end of the intervention year 2
All three interventions require household equity contribution for successful implementation If this requirement can be erased Intervention A is recommended over Interventions B and C because its benefits outweigh its costs and indicate the likely success of this project Even though analyses of Interventions B and C also yield positive FNPV and ENPV values these NPVs are lower than those obtained in the analysis of Intervention A
There is no principal difference between Interventions B and C other than the distribution of the equity contribution over time The minimum equity contribution for Intervention B that will allow the households to repay the loan is 2463 percent
If money from the loan-guarantee fund will be used to cover the unpaid fractions of the loan in Intervention C thus allowing the households access to the loan required for the complete transition toward modern beehives the FNPV of the intervention will be US$87650 which is still below the FNPV of Intervention A The increase in the FNPV in this case is just a financial subsidy from USAID to the targeted households
Cost Benefit Analysis of the GRAD Honey Value Chain November 2012 9
THE GRAD HONEY VALUE CHAIN COST-BENEFIT ANALYSIS
METHODOLOGY
Project Background
Ethiopiarsquos economy is highly dependent on its agricultural production with agriculture accounting for about 46 percent of the countryrsquos gross domestic product (GDP) About 80 percent of Ethiopiarsquos total population lives in the rural areas and agricultural activities generate about 85 percent of the total employment in Ethiopia (USAID AGP-LGPPRIME Summary Proposal 2011)
USAIDEthiopia is one of the major donors providing support for the goal of making Ethiopiarsquos households more food self-sufficient It supports various initiatives related to increasing access to food for Ethiopiarsquos food-insecure households and emergency assistance USAIDrsquos working agenda in Ethiopia involves promoting increased agricultural productivity and developing viable commodity value chains that in turn will increase the level of food security and reduce the negative impacts of famine
Ethiopia is ranked among the top five fastest-growing countries in the world with real GDP growth reaching 75 percent in 2011 (The World Factbook CIA) Despite its currently impressive economic growth rate Ethiopia has not been able to achieve a level of agricultural production that leads to food self-sufficiency It still is home to about 8 million people who remain chronically food insecure with the vast majority of them living in the rural areas About 60 percent of rural households experience food shortages between June and October each year (USAID AGP-LGPPRIME Summary Proposal 2011)
For these reasons the GRAD project concentrates on improving the value chains for several commodities The project addresses the need to develop profitable and functional value chains that include chronically food-insecure households to provide them with opportunities to profit from improved or newly established market linkages
The majority of Ethiopian households in the rural areas cultivate low-value cash crops and live with poor access to commodity markets and financial services They often lack proper market information or are not able to benefit from available market linkages Food-security improvements are likely to come from their inclusion in the commodity value chain cycle
The GRAD project plans to first target 65000 households of which 58500 are chronically food insecure and 6500 are labeled as ldquoUltra Poorrdquo 3 A secondary target group involves 10000 households that can be categorized as food-sufficient households (6000) or food-secure households (4000) This second targeted group is intended to act as a role model for the first GRAD group of households Of the 65000 targeted households the 5-year-long GRAD project aims to graduate 50000 households
Specifically the GRAD project aims to achieve the following goals
1 Enhance the livelihood options of chronically food-insecure households in Highlands areas 2 Improve household and community resilience 3 Strengthen the enabling environment to promote scale-up and sustainability
3 ldquoUltra Poorrdquo households include female-headed households and landless youth
Cost Benefit Analysis of the GRAD Honey Value Chain November 2012 10
To ensure future success in the implementation of the GRAD project USAIDEthiopia plans to cooperate with several implementing agencies that are well-known experts in the areas of food security and commodity value chain development These technical partnersmdashCARE the Relief Society of Tigray (REST) the Organization for Rehabilitation and Development in Amhara (ORDA) Catholic Relief Services (CRS) and the Netherlands Development Agency (SNV)mdash possess the required expertise and hands-on experience from implementing similar projects in Ethiopia and elsewhere
The chronically food-insecure families who are the subjects of the GRAD project are located in 16 woredas in four regions of Ethiopia SNNPR Tigray Amhara and Oromia4 The selection of these woredas was based on their proximity to the Agriculture Growth Program (AGP) and active markets that will facilitate opportunities for engaging in local based commodity trading
The market linkages established during the lifetime of this project will connect chronically food-insecure households with locally based traders and facilitate the sales of commodities for income generation by this targeted group of households
In addition the GRAD project aims to correct the shortcomings experienced in the Productive Safety Net Program Plus (PSNP) project by facilitating an increase in the yearly income of chronically food-insecure households The objective of the chosen interventions is to increase each householdrsquos yearly income by US$365 (or US$1day) by the end of the project It is possible that this objective will not be met if such households engage in just one additional commodity value chain In such cases a combination of commodity value chains will be suggested to achieve the desired increase in the householdsrsquo income level
The GRAD project will emphasize gender equality and the inclusion of women via cooperation between stakeholders and a widely understood accountability to beneficiaries
USAID will facilitate the implementation of this project by establishing a credit-guarantee fund of US$2 million This guaranteed fund will enable the flow of credit resources necessary for the chronically food-insecure households to engage in the commodity production The distribution of financial resources will be handled by microlending institutions MFIs and RUSACCO One additional benefit of this credit guarantee will be to spread the financial risk between the implementing agency and the financial organizations that are responsible for lending to the targeted households
Four commodity value chains are being proposed for the GRAD project honey pulses vegetables and meat The choice of these value chains is based on their simplicity in terms of the necessary knowledge required for their introduction and the rather low initial start-up costs needed to engage in their production The value chains of these commodities show a good potential for postgraduation production increases and marketing Demand for all these commodities is growing in the domestic market (Ethiopian) and export markets
The list of the key FtF indicators proposed for monitoring and evaluating the GRAD projectrsquos performance is presented in table A in the appendix
4 As per the CARE proposal
Cost Benefit Analysis of the GRAD Honey Value Chain November 2012 11
Commodity Background
Honey Production in Ethiopia
Ethiopia has a long tradition of honey production reaching back many centuriesmdashin fact the longest tradition of honey and beeswax marketing in Africa Despite this long tradition honey production in Ethiopia is still treated as a supplemental on-farm activity that is usually combined with crop cultivation and animal husbandry A vast majority of the honey produced in Ethiopia comes from traditional beehives which currently are the most common form of technology used for honey production in Ethiopia As of 2011 Ethiopia possessed about 49 million traditional beehives which constitutes about 9557 percent of the total number of beehives in Ethiopia Currently only about 81500 transitional beehives (commonly called Kenya top bar hives) and 140000 modern beehives exist (CSA Agricultural Survey Report 2012) The total quantity of honey produced in Ethiopia in 2010ndash11 was about 399 million kilograms (kg) Almost all honey that is currently produced in Ethiopia (about 98 percent of the total yearly production) is consumed in the domestic market with only about 2 percent of the total yearly production being exported
Ethiopia has about 14ndash17 million households that are engaged in beekeeping and produce different types of honey that vary regionally as well as in terms of color consistency and purity The most in-demand honey among Ethiopians comes from Eastern Tigray where bees forage on the regionally specific Tebeb plant (Basium clandiforbium) and produce distinctive low-moisture white honey Other types of honey produced include Lalibela honey (Acacia honey) multifloral yellow honey dark brown honey and crude red honey (mainly used for the production of tej an Ethiopian drink with low alcohol content)
Current Market Situation in the Ethiopian Honey Sector
The sectorrsquos current market situation is characterized by a strong domestic demand and relatively low supply of table honey resulting in rising domestic prices for honey Producer prices differ by region and type of honey The most expensive is Eastern Tigrayrsquos white honey where the current retail price is ETB 17000kg Lower retail prices (of around ETB 60ndash9000kg) are observed for other varieties of white honey depending on the area and the honeyrsquos characteristics The retail prices for yellow honey are around ETB 50ndash6000kg while the least expensive red honey is sold at a price of around ETB 45ndash50kg5 This current market situation in the Ethiopian honey sector and producersrsquo overreliance on traditional technology are influenced by several factors
1 The use of traditional methods in the honey production The most commonly used method of honey production in Ethiopia relies on traditional beehives that are usually handmade from old logs found in the forest These beehives present low-productivity rates (around 5ndash7kgbeehiveyear) and low-quality honey that contains brood wax and other impurities The yield from transitional and modern beehives is significantly higher (8ndash15kgtransitional beehive and 15ndash20kgmodern beehive) and these improved beehives produce better-quality honey as well
2 The lack of financial resources that would allow the beekeepers to obtain modern beehives Small-scale farmers who are interested in beekeeping find it difficult to obtain the financial resources necessary to acquire transitional or modern beehives They possess few private financial resources and usually are unable to obtain the credit required to borrow capital
5 The honey retail prices were obtained during field interviews in Tigray and Amhara in July 2012
Cost Benefit Analysis of the GRAD Honey Value Chain November 2012 12
These financial barriers therefore do not allow them to switch from traditional to modern technology
3 Somewhat poor access to the tools necessary to start honey production with modern beehives Some beekeepers possess modern beehives (just boxes) yet do not have any of the tools required for the proper management of these beehives (eg smoker queen excluder honey extractor etc) This situation results in the production of honey within modern-style beehives but with yields and quality comparable to that of honey coming from traditional beehives
4 Lack of proper training on the management of the modern-style apiary Beekeepers who try to switch to modern-style honey production usually do not have the skills necessary for the proper management of modern beehives They maintain their beehives poorly using primitive harvesting methods and inappropriate tools Due to their lack of training they do not provide additional feed (water and sugar syrup) during droughts and have little knowledge of quality requirements in the honey market
5 Other associated obstacles Other barriers include the disappearance of desirable bee forage due to crop intensification and the growing use of agrochemicals extreme weather conditions in some parts of Ethiopia (droughts) poor transportation infrastructure and the lack of knowledge about proper storage techniques (at both the farm and the local honey collectorstraders levels)
Project Description and Activities
The inclusion of the honey value chain in the GRAD project is based on several factors that positively affect this commodityrsquos economic potential and its suitability for chronically food-insecure households One of the factors contributing to the inclusion of the honey value chain is that the labor and land requirements for modern honey-production techniques are relatively low The amount of land necessary for the establishment of an apiary with three modern beehives is 0001 hectares (Ha) with labor requirements of about 107 hoursround6 These low land requirements are especially helpful in the case of food-insecure households which on average possess no more than 025 Ha of land Modern-style honey production is also able to create non-gender-biased employment and income opportunities Honey production is neither physically strenuous nor culturally assigned to men and it is a ready source of cash hence it is ideally suited for female participation Given the traditional-style beekeeping experience that some of the households targeted in the GRAD project possess the inclusion of the honey value chain in the GRAD project has a solid rational basis
GRAD Project Interventions in the Honey Value Chain
Two honey value chain interventions in this GRAD project are being proposed for implementation both with the goal of improving honey-production techniques Intervention A will introduce three modern beehives related maintenance tools and appropriate training All investments will be made starting in year 1 of the intervention in modern honey-production techniques The amount of the investment required for the Intervention A is much higher than the usual amount available for new clients of MFIs operating in Ethiopia thus necessitating household equity contribution The main targeted beneficiaries of the GRAD project are chronically food-insecure households which may not have financial resources to make the contribution The second proposed intervention would overcome this barrier
6 A round refers to a 6-month period of time
Cost Benefit Analysis of the GRAD Honey Value Chain November 2012 13
Cost Benefit Analysis of the GRAD Honey Value Chain November 2012
Intervention B will introduce two transitional beehives and one modern beehive related maintenance tools and training A progressive transition will be made toward the exclusive use of modern beehives at the beginning of year 3 The total initial investment cost of the Intervention B will be ETB 4315 which is much lower than the total investment cost of Intervention A (ETB 7205) and only slightly above ETB 40007 Two versions of Intervention B have been analyzed Under the first scenario the households have been assumed to contribute 28 percent of the required investment but this contribution will be significantly smaller than 28 percent of the investment cost of the more expensive Intervention A This scenario is referred to as Intervention B in the following text The alternate scenario will eliminate the 28 percent equity contribution required for Intervention B and is referred to as Intervention C in the following text The required funds needed for the replacement of transitional beehives under both scenarios will be obtained through an additional loan taken by the households from the MFIs after repayment of the initial loan
Table 1 below shows a detailed outline of the specific investment expenditures associated with each of the proposed interventions
Table 1 Total investment expenditures for Interventions A B and C8
Input Intervention A Intervention B and C
(year 1)
Intervention B and C
(year 3) Modern beehives (3 for A 1 for B) 3300 1100 2200 Bee colony 2100 700 Queen excluder 330 110 220 Wax (ETBkg) 405 135 270 Smoker 140 140 Overall coat 150 150 Veil 90 90 Glove 80 80 Extractor 3209 320 Wax mold 150 150 Bee forage seedling or seeds 50 50 Plastic honey container 90 90 Transitional beehives (2) 0 200 Bee colony for transitional beehives (2) 0 1000 Total10 7205 4315 2690
Assumptions for the Selected GRAD Interventions in the Honey Value Chain
1 The GRAD-targeted chronically food-insecure households that will engage in the modern-style honey production will each be provided with a microloan necessary to purchase the
9 It has been assumed that an extractor and a wax mold will be shared by a group of households due to the equipmentrsquos relatively high prices10 Total investment and operating costs (including labor and additional feed for bees) for the first year and first round of the intervention will be ETB 769653 (nominal) for Intervention A and ETB 502653 (nominal) for Intervention B
7 The total amount of loan available for the new clients of MFIs is ETB 4000 8 Total investment expenditures for Intervention A three modern beehives with tools and appropriate training starting in year 1 Total investment expenditures for Intervention B two transitional beehives plus one modern beehive with tools and training starting in year 1 with progressive transition into all modern beehives by year 3 (in ETB)
14
required inputs It has been assumed that each targeted household possesses assets that can be sold to obtain cash (eg livestock) or has personal savings that can be used to provide a down payment 11 The size of this loan will vary according to the intervention With the required 28 percent participant contribution the necessary loan for Intervention A (covering three modern beehives starting in year 1 maintenance tools and training) will be ETB 5825household In the case of Intervention B (covering two transitional beehives and one modern beehive maintenance tools training and progressive transition into all modern beehives by the end of year 2) the size of the first loan will be ETB 3495household For financing the investment needed for the transition to using all modern beehives no equity contribution will be required and the amount of the second loan will be ETB 3028household The financing of the investment in Intervention C will occur without equity contribution The ability of the households to repay the initial loan for Interventions B and C will be very critical because it will determine the availability of the next loan required for the complete transition toward modern beehives
2 Training will be provided free of charge so targeted households will not incur any costs related to training (except the opportunity cost of time they spend being trained)
3 The microloan necessary for purchasing the required inputs will be provided at a subsidized interest rate of 15 percent Additional fees associated with this loan will include a service charge (1 percent) loan insurance (1 percent) upfront savings (10 percent) and a passbook fee (ETB 15) This loan will be for a period of 2 years with a grace period of 6 months Each household will make semiannual loan repayments for a total of three repayments of the loan principal12 The upfront savings (10 percent) will be returned to the households after the loan has been repaid There will be no interest renewed on the upfront savings
4 In the case of Interventions B and C households will need to replace the transitional beehives with modern ones in year 3 It has been assumed that they will cover the costs of the second loan after repaying the initial loan It has also been assumed that a down payment will not be needed for the second loan because the required amount is far below ETB 10000 (the amount provided by MFIs to clients who repaid the first loan and have good reputations)
5 It has been assumed that in the case where a household is not able to repay the total amount of its loan principal due in a particular round this amount will be transferred to the next round together with the incurred interest rate on the total outstanding amount This procedure will be repeated until the total loan amount is repaid13
6 It has also been assumed that each household will be able to harvest honey only one time in year 1 of Intervention A B or C In subsequent years it has been assumed that harvesting will happen twice annually For Intervention A it has been assumed that the average yield from each modern beehiveharvest will be 19 kgyear14 For Intervention B the same yield has been assumed in the case of modern beehive while the average yield from each transitional beehive has been assumed to be 8 kgyear
7 The household consumption of honey for both interventions has been assumed to be 5 kghouseholdround For Interventions B and C it has also been assumed that a household will consume lower-quality honey that comes from the transitional beehives and sell the honey from the modern beehives because it will fetch a higher price and thus allow the farmer to repay the loan faster
11 This ldquoafter down paymentrdquo loan amount in both cases includes investment expenditures as well as service charge loan insurance upfront savings and passbook fee12 In the first year of each intervention only one repayment has been assumed (in round 2) 13 Loan description provided by CARE 14 Such yield will be possible to obtain because of training that will improve a householdrsquos knowledge of modern beekeeping (eg the necessity for additional feedings and bee-forage planting)
Cost Benefit Analysis of the GRAD Honey Value Chain November 2012 15
8 The necessary operating costs for both interventions in the first round will include bee-feeding costs of ETB 14175 land-rental costs of ETB 040 and labor costs of ETB 34938 It has been assumed that households will provide the necessary labor for beehive maintenance so the labor required to maintain the beehives will not represent a cash burden
9 The cost of beehive maintenance (per round) has been set at 5 percent of the initial cost of the beehive for both interventions It has been assumed that households will use locally available materials and family labor for this purpose
10 The lifespan for the modern beehive for both interventions has been assumed to be 11 years which will be equal to the lifespan of the project15 In the case of Intervention B the lifespan for the transitional beehive is 2 years because at that point they will be replaced with modern beehives It has been assumed that farmers will just replace transitional beehives with modern versions (not add two modern beehives) because of two reasons
a Households keep modern beehives in the residential area to prevent them from being stolen Such a security system puts a constraint on the quantity of bee colonies that can be held by households because of the potential danger to the families
b The cost of the bee colony is much higher than the cost of transitional beehives so moving existing bee colonies from transitional beehives to modern ones instead of obtaining new bee colonies makes economic sense
11 In this analysis the farm-gate price of yellow honey has been assumed to be ETB 45kg for modern beehives and ETB 43kg for transitional beehives16
12 For Interventions B and C it has been assumed that households will replace their transitional beehives with modern ones at the beginning of year 3 The bee colonies from the transitional beehives will be moved to the modern ones so no additional costs will be incurred to replace the bee colonies
13 It has been assumed that the initial price of a bee colony for a modern beehive will be ETB 700 while it will be ETB 500 for a transitional beehive The difference in price results because the bee colony for a transitional beehive is smaller
14 For the purpose of this analysis the following macrolevel assumptions have been made The expected average annual domestic inflation rate is 20 percent and the US inflation rate is 25 percent The financial discount rate is a real rate of 12 percent the economic discount rate is a real rate of 12 percent the foreign exchange premium (FEP) is 65 percent (Kuo 2011) and the exchange rate is US$1 = ETB 1750
PROJECT MODELING
The financial and economic feasibility of the GRAD honey interventions in this analysis has been established by constructing cash flows from the point of view of the project (total investment point of view) and the point of view of the targeted households (equity point of view) All revenues or potential revenue items have been treated as cash inflows and all expenditures or potential expenditure items have been treated as cash outflows (Jenkins Kuo and Harberger 2011) The analysis has been carried out for an 11-year period
The cash flows have been constructed in nominal and real terms and on per-round (every 6 months) as well as annual bases (for total investment point of view and equity point of view) The cash flows have also been constructed for the total investment point of view with the exclusion of domestic
15 This lifespan was confirmed during the field interviews in July 2012 16 Honey prices have been based on field interviews conducted in July 2012 in Amhara and Tigray The difference in prices has come from the assumption that honey produced in modern beehives has a bit higher quality hence the higher price
Cost Benefit Analysis of the GRAD Honey Value Chain November 2012 16
Cost Benefit Analysis of the GRAD Honey Value Chain November 2012
consumption of honey (in nominal and real terms) to reflect the actual cash available for repayment of the loans
The economy resource flow statements have been constructed by adjusting each of the line items in the cash-flow statements of the total investment point of view by the corresponding economic conversion factor (CF)17
The financial sustainability of an intervention has been analyzed by estimating the SADSCR of the project over the life of the loan used to finance the project and by calculating the FNPV of the project from the targeted householdsrsquo (equity) point of view If the ENPV of the project is positive this means the total value of the benefits of the project (to whomever they accrue) will be greater than the combined costs required to implement and operate the intervention
FINDINGS
Financial Analysis
The appraisal has been carried out for an 11-year period Based on assumptions established for the purpose of this analysis all interventions will yield positive FNPVs The FNPV has been calculated using 12 percent real financial discount rate Table 2 presents the FNPVs for each intervention
Table 2 FNPVhouseholdintervention (in US$) FNPV
Intervention A 90640 Intervention B 79666 Intervention C 79002
The interventions in the honey value chain will also substantially increase the annual income of the targeted households Stabilized additional yearly income of US$21811 will be achieved by 2014 in the case of Intervention A compared to 2016 for Interventions B and C The resulting additional yearly income is presented in table 3 below18
Table 3 Annual net cash flows resulting from the interventions (in US$) Year Intervention A Intervention B Intervention C
2012 ndash16191 ndash12303 ndash9262 2013 3436 313 ndash3940 2014 21811 14767 14850 2015 21811 12737 12774 2016ndash2022 21811 21811 21811
The negative annual net cash flows in 2012 for Interventions A and B will result from the 28 percent equity contribution needed to finance the initial investment Intervention C will have two negative net cash flows in 2012 and 2013 because farmers will not have adequate cash flows to finance their debt burden during these years Although the initial equity contribution has been removed from
17 Dividing the separately calculated economic value of a unit of an item by its financial price will yield the conversion factor 18 Net cash flow from the household perspective has been measured as its revenue less operating expenses less debt service including both debt repayments and interest expense In the early years the net cash flows will be less than the strict accounting definition of income which only subtracts interest expense During these years annual financial depreciation will be less than debt repayment and hence net cash flow will be lower than net income
17
Cost Benefit Analysis of the GRAD Honey Value Chain November 2012
Intervention C targeted households will still need to contribute financial resources from other activities to repay their debt obligation
Table 4 describes the SADSCRs These indicators are very important from a program sustainability perspective because they show each householdrsquos ability to repay the loan necessary for the financing of the initial investment in each of the interventions The debt service obligations in a given period have been defined here to be the interest and principal that will be due in a given period plus the debt service from the previous period that cannot be paid due to inadequate net cash flow
Table 4 SADSCRround for household for the interventions Intervention A Year 1 round 1 Year 1 round 2 Year 2 round 1 Year 2 round 2 SADSCR - 093 100 171 Intervention B Year 1 round 1 Year 1 round 2 Year 2 round 1 Year 2 round 2 SADSCR (first loan) - 093 093 141 SADSCR (second loan) 126 174 271 Intervention C Year 1 round 1 Year 1 round 2 Year 2 round 1 Year 2 round 2 SADSCR (first loan) 068 052 058 SADSCR (second loan) 127 175 272
In the case of Intervention A the households will face difficulty repaying their debt obligation only during the first repayment period The debt service of the second repayment period and the unpaid debt service from the previous period will be repaid in round 1 of year 2
In the case of Intervention B when repayments will be due in the first two rounds the SADSCR will be below a value of 1 If the farmers will be expected to repay the loan this quickly they will have to draw on other sources of cash In round 2 of year 2 the SADSCR will reach a value above 1 indicating that the financial situation of the households will stabilize allowing the initial loan to be repaid This indicates that households by that time will be able to access the new loan required for the investment to replace transitional beehives with modern ones
The SADSCR of Intervention C will be below a value of 1 in all rounds indicating that households will not be able to repay their debt obligations without contributing financial resources generated by other activities The second loan however will be provided only for the households that repay the previous loan hence households will have to draw on other cash resources to repay the initial loan
The eventual necessity to contribute additional financial resources to repay the loan in Intervention C negates the principal difference (no equity contribution) between Interventions B and C Intervention B will require households to initially invest 28 percent equity capital while Intervention C will split almost the same amount over two repayment rounds The present value of equity contribution for Intervention B will be ETB 120820 (US$6904) while the present value of contribution under Intervention C will be ETB 109668 (US$6267) with ETB 67598 (US$3863) in the second round of year 1 and ETB 42070 (US$2404) in the first round of year 2
The SADSCR of the second loan of Interventions B and C will be above 1 in all rounds indicating that the financial standing of the households will be good enough to repay the loan although not in a timely manner
Table 5 presents the annual scheduled debt service obligations versus the annual net cash flows including the opportunity cost of labor which reflect the actual financial resources generated by the activity in the given period and available for the loan repayment It has been assumed that actual debt repayment will be made by the households without moving additional financial resources from other (non-honey-producing) activities to repay the loan for both interventions For Interventions A
18
Cost Benefit Analysis of the GRAD Honey Value Chain November 2012
and B these values confirm the status quo outlined in the discussion above about SADSCRs Although in both cases the households cannot repay the full amount of debt service in timely manner they will be able to cover the biggest part of payment and eventually will have adequate cash flow to pay back the loan At this time they will be refunded the upfront savings (10 percent of the initial loanrsquos amount) For Intervention B repayment of the loan will open access for the new loan required to finance investment in the two new modern beehives The annual net cash flows of Intervention C will not allow the households to repay the loan so they will not get access to the second loan
Table 5 Annual debt repayment obligations versus net annual cash flows including opportunity cost of family laborroundintervention (in ETB)
Year 1 Year 2 Intervention A Round 1 Round 2 Round 1 Round 2- Annual Debt Service Obl 278495 243149 156349 - Net cash flow 257625 243942 267225
Intervention B Round 1 Round 2 Round 1 Round 2 - Annual Debt Service Obl 168906 145146 104800- Net cash flow 157720 134502 147340
Intervention C Round 1 Round 2 Round 1 Round 2 - Annual Debt Service Obl 231771 259036 254673 - Net cash flow 157720 134502 147340
Note The debt service obligations in a given period have been defined here to be the interest and principal that are due plus the debt service from the previous period that cannot be paid due to inadequate net cash flow Note For the second loan of Interventions B and C annual debt service obligations will be equal to the actual debt payments because households will have sufficient cash flow to fully cover the obligations
19
Table 6 Intervention A annual cash-flow statement equity point of view (real ETB) Line items Yearltltltlt 2012 2013 2014 2015 2016 2017 2018 2019 2020 2021 2022 PV
Receipts
‐Value of in‐house honey consumption 22500 45000 45000 45000 45000 45000 45000 45000 45000 45000 45000 276760 ‐Revenue from honey sale 234000 468000 468000 468000 468000 468000 468000 468000 468000 468000 468000 2878304
Total inflows 256500 513000 513000 513000 513000 513000 513000 513000 513000 513000 513000 3155064
Expenditures Investment costs for modern beehives Modern beehive 330000 330000
Bee colony 210000 210000
Queen excluder 33000 33000
Wax 40500 40500
Smoker 14000 14000
Overall coat 15000 15000
Veil 9000 9000
Glove 8000 8000
Extractor 32000 32000
Wax mold 15000 15000
Bee forage seedling or seed to plant around backyard 5000 5000
Plastic honey container 9000 9000
Service costs for beehives Sugar for feeding 28350 28350 28350 28350 28350 28350 28350 28350 28350 28350 28350 188534
Beehive maintenance 16500 33000 33000 33000 33000 33000 33000 33000 33000 33000 33000 202957
or cost 69875 69875 69875 69875 69875 69875 69875 69875 69875 69875 69875 464684
Rental value of land 080 080 080 080 080 080 080 080 080 080 080 532
Subsidized loan ndash295457 321563 000 000 000 000 000 000 000 000 000 ndash8347
Total outflows 539848 452868 131305 131305 131305 131305 131305 131305 131305 131305 131305 1568860
Net cash flows ndash283348 60132 381695 381695 381695 381695 381695 381695 381695 381695 381695 1586204
Net cash flows real US$ ndash16191 3436 21811 21811 21811 21811 21811 21811 21811 21811 21811 90640
NPV 12 discount rate ETB 1586204 NPV 12 discount rate US$ 90640
20
Table 7 Intervention B annual cash-flow statement equity point of view (real ETB) Line items Yearltltltlt 2012 2013 2014 2015 2016 2017 2018 2019 2020 2021 2022 PV
Receipts
‐Value of in‐house honey consumption 21500 43000 45000 45000 45000 45000 45000 45000 45000 45000 45000 273974 ‐Revenue from honey sale 132800 265600 468000 468000 468000 468000 468000 468000 468000 468000 468000 2596390
Total inflows 154300 308600 513000 513000 513000 513000 513000 513000 513000 513000 513000 2870364
Expenditures Investment costs Modern beehive 110000 000 220000 285383
Bee colony for modern beehive 70000 70000
Transitional beehive 20000 20000
Bee colony for transitional beehive 100000 100000
Queen excluder 11000 000 22000 28538
Wax 13500 000 27000 35024
Smoker 14000 14000
Overall coat 15000 15000
Veil 9000 9000
Glove 8000 8000
Extractor 32000 32000
Wax mold 15000 15000
Bee forage seedling or seed to plant around backyard 5000 5000
Plastic honey container 9000 9000
Service costs for beehives Sugar for feeding 28350 28350 28350 28350 28350 28350 28350 28350 28350 28350 28350 188534
Modern beehive maintenance 5500 11000 33000 33000 33000 33000 33000 33000 33000 33000 33000 172315
Transitional beehive maintenance 1000 2000 000 000 000 000 000 000 000 000 000 2786
Labor cost 69875 69875 69875 69875 69875 69875 69875 69875 69875 69875 69875 464684
Rental value of land 080 080 080 080 080 080 080 080 080 080 080 532
Subsidized loan ndash166702 191809 ndash145729 158794 000 000 000 000 000 000 000 1409
Total outflows 369603 303114 254576 290099 131305 131305 131305 131305 131305 131305 131305 1476204
Net cash flows ndash215303 5486 258424 222901 381695 381695 381695 381695 381695 381695 381695 1394160
Net cash flows real US$ ndash12303 313 14767 12737 21811 21811 21811 21811 21811 21811 21811 79666
NPV 12 discount rate ETB 1394160 NPV 12 discount rate US$ 79666
Cost Benefit Analysis of the GRAD Honey Value Chain November 2012 21
Table 8 Intervention C annual cash-flow statement equity point of view (real ETB)19
Line items Yearltltltlt 2012 2013 2014 2015 2016 2017 2018 2019 2020 2021 2022 PV
Receipts
‐Value of in‐house honey 21500 43000 45000 45000 45000 45000 45000 45000 45000 45000 45000 273974Revenue from honey ‐ sale 132800 265600 468000 468000 468000 468000 468000 468000 468000 468000 468000 2596390
Total inflows 154300 308600 513000 513000 513000 513000 513000 513000 513000 513000 513000 2870364
Expenditures Investment costs Modern beehive 110000 000 220000 285383
Bee colony for modern beehive 70000 70000
Transitional beehive 20000 20000 Bee colony for transitional 100000 100000
Queen excluder 11000 000 22000 28538
Wax 13500 000 27000 35024
Smoker 14000 14000
Overall coat 15000 15000
Veil 9000 9000
Glove 8000 8000
Extractor 32000 32000
Wax mold 15000 15000 Bee forage seedling or seed to plant around
5000 5000
Plastic honey container 9000 9000
Services costs for beehives Sugar for feeding 28350 28350 28350 28350 28350 28350 28350 28350 28350 28350 28350 188534
Modern beehive maintenance 0055 11000 33000 33000 33000 33000 33000 33000 33000 33000 33000 172315 Transitional beehive 0010 2000 000 000 000 000 000 000 000 000 000 2786
Labor cost 69875 69875 69875 69875 69875 69875 69875 69875 69875 69875 69875 464684
Rental value of land 080 080 080 080 080 080 080 080 080 080 080 532
Subsidized loan ndash219923 266240 ndash147177 158152 000 000 000 000 000 000 000 32013
Total outflows 316382 377545 253128 289457 131305 131305 131305 131305 131305 131305 131305 1487827
Net cash flows ndash162082 ndash68945 259872 223543 381695 381695 381695 381695 381695 381695 381695 1382537
Net cash flows real US$ ndash9262 ndash3940 14850 12774 21811 21811 21811 21811 21811 21811 21811 79002
NPV 12 discount rate ETB 1382537
NPV 12 discount rate US$ 79002
19 The only difference between tables 8 and 9 is the repayment of the loan (subsidized loan line) All other lines of the tables are the same
Cost Benefit Analysis of the GRAD Honey Value Chain November 2012 22
Comparison of Interventions A B and C
Even though all interventions will yield positive FNPVs with Intervention A resulting in a greater FNPV the choice between the interventions will depend on several factors
1 Intervention A will require higher initial investment expenditures than Intervention B (ETB 7205 versus ETB 4315) Within the lifespan of Intervention A greater quantities of honey will be produced earlier thus allowing for higher financial returns that will offset the costs associated with the higher initial investment Such high initial investment requirements however will require an equity contribution from the household side because current policies of MFIs in Ethiopia will allow households to borrow a maximum of ETB 4000 in the first loan If the households are able to repay they will get access to a new loan up to ETB 10000
2 The main group of GRAD beneficiaries will be the households for which the equity contribution required for Intervention A may be a constraint to participate in the program For such households Intervention B will be more attractive because of the reduced equity contribution
3 The success of the complete transition toward modern beekeeping in Interventions B and C will entirely depend on the ability of the households to get a second loan from the MFIs The MFIs will not provide an additional loan to households that fail to repay the first loan so the households will need to contribute financial resources generated by other farm activities to repay the first loan This erases the principal difference of no equity contribution between the two interventions Some households however may prefer not to contribute 28 percent of the needed equity at the beginning of the project and will instead make this contribution in two installments to cover the debt burden as in the case of Intervention C
4 In addition to the higher FNPV Intervention A will also result in GRAD householdsrsquo achieving stable additional income of US$218 by 2014 as compared to 2016 for Intervention B Total incremental earnings of Intervention A as compared to Intervention B calculated over the 4-year period of 2012ndash16 will be equal to US$14681 (See table 3) For those households that will be financially capable of making the equity contribution it will be advantageous to choose Intervention A
5 Although Interventions B and C will require a second loan to finance the complete transition toward modern beekeeping this loan will not put a significant financial burden on the households because the cash flows will be sufficient to cover the householdsrsquo debt service obligations in full For Intervention A however after the total repayment of the initial investment loan in round 2 of year 2 the household will be free of debt and can continue honey production fully benefiting from the increased income from honey sales
Economic Analysis
Differences have emerged between the financial and economic outcomes due to the fact that the financial values do not include all externalities present in the economy In this case the only externality will come from increased tax revenues either directly from the taxation of inputs or indirectly via the FEP Honey is an exportable commodity in Ethiopia The FEP for Ethiopia has been estimated to be equal to 65 percent (Kuo 2011) Hence every incremental unit of foreign exchange (dollars) earned from increased exports will have an economic value to the country of 1065 times the value of the revenues by the exporters when exchanging the foreign exchange for local currency at the market exchange rate
23
To show the true economic impact of the proposed intervention on the Ethiopian economy the economic values have been derived by adjusting the financial values by the appropriate economic conversion factors If no distortions are present in the market then the financial value of an item has been used to measure its economic value20
Table 9 reports that the ENPV obtained in the analysis will be positive for both interventions The economic opportunity cost of capital of 12 percent has been used while calculating the ENPV If they are successfully implemented both interventions will benefit the Ethiopian economy
When the two interventions are compared Intervention A will result in total higher production of honey through the full life of the project as compared to Intervention B mainly because of the larger volume of output that will be produced by Intervention A during first 2 years of the project On the cost side farmers eventually will have to purchase the same equipment and the same number of modern beehives for Intervention B as they will for Intervention A The net results have shown that Intervention A will have a greater ENPV than Intervention B will The only difference between Interventions B and C is the way the interventions will be financed This method of investment financing will just be a transfer of resources and hence will not bring any change to the economic outcomes of the interventions As a result there is no difference between Interventions B and C Intervention A will be a better choice not only for the chronically food-insecure households targeted in the GRAD project but also for the Ethiopian economy as a whole because it will be more productive and create a larger value of financial and economic net benefits
The estimated ENPVs are presented in table 9 below
Table 9 ENPVs for Interventions A and B (in US$) ENPV
Intervention A 113092 Intervention B 100774
20 The list of CFs used for the purpose of this analysis is presented in table A in the appendix
Cost Benefit Analysis of the GRAD Honey Value Chain November 2012 24
Table 10 Economic resources cash-flow statement for Intervention A (real ETB) Line items CF Yearltltltlt 2012 2013 2014 2015 2016 2017 2018 2019 2020 2021 2022 PV
Receipts ‐Value of in‐house honey consumption 109 24583 49166 49166 49166 49166 49166 49166 49166 49166 49166 49166 302382 ‐Revenue from honey sale 109 255663 511327 511327 511327 511327 511327 511327 511327 511327 511327 511327 3144775
Total Inflows 280246 560493 560493 560493 560493 560493 560493 560493 560493 560493 560493 3447157
Expenditures Investment costs Modern beehive 085 281185 281185
Bee colony 100 210000 210000
Queen excluder 085 28118 28118
Wax 106 43104 43104
Smoker 085 11898 11898
Overall coat 073 10995 10995
Veil 073 6597 6597
Glove 080 6416 6416
Extractor 082 26244 26244
Wax mold 100 15000 15000 Bee forage seedling or seed to plant around 100 5000 5000
Plastic honey container 075 6724 6724
Services costs for beehives Sugar for feeding 079 22345 22345 22345 22345 22345 22345 22345 22345 22345 22345 22345 148600
Beehive maintenance 100 16500 33000 33000 33000 33000 33000 33000 33000 33000 33000 33000 202957
Labor cost 100 69875 69875 69875 69875 69875 69875 69875 69875 69875 69875 69875 464684
Rental value of land 100 080 080 080 080 080 080 080 080 080 080 080 532
Total outflows 760082 125300 125300 125300 125300 125300 125300 125300 125300 125300 125300 1468055
Net cash flows ‐ 435193 435193 435193 435193 435193 435193 435193 435193 435193 435193 1979102
Net cash flows real US$ ‐27419 24868 24868 24868 24868 24868 24868 24868 24868 24868 24868 113092
ENPV 12 discount rate ETB 19791
ENPV 12 discount rate $US 113092
25
Table 11 Economic resources cash-flow statement for Intervention B (real ETB)21
Line items CF Yearltltltlt 2012 2013 2014 2015 2016 2017 2018 2019 2020 2021 2022 PV
Receipts ‐Value of in‐house honey consumption 109 23490 46981 49166 49166 49166 49166 49166 49166 49166 49166 49166 299339
‐ Revenue from honey sale 109 145094
290189 511327 511327 511327 511327 511327 511327 511327 511327 511327 2836761
Total inflows 168585 337170 560493 560493 560493 560493 560493 560493 560493 560493 560493 3136100
Expenditures Investment costs Modern beehive 085 93728 000 187457 243167
Bee colony for modern beehive 100 70000 70000
Transitional beehive 100 20000 20000
Bee colony for transitional beehive 100 100000 100000
Queen excluder 085 9373 000 18746 24317
Wax 106 14368 000 28736 37276
Smoker 085 11898 11898
Overall coat 073 10995 10995
Veil 073 6597 6597
Glove 080 6416 6416Extractor 082 26244 26244
Wax mold 100 15000 15000 Bee forage seedling or seed to plant around backyard 100 5000 5000
Plastic honey container 075 6724 6724
Services costs for beehives Sugar for feeding 079 22345 22345 22345 22345 22345 22345 22345 22345 22345 22345 22345 148600
Modern beehive maintenance 100 5500 11000 33000 33000 33000 33000 33000 33000 33000 33000 33000 172315
Transitional beehive maintenance 100 1000 2000 000 000 000 000 000 000 000 000 000 2786
Labor cost 100 69875 69875 69875 69875 69875 69875 69875 69875 69875 69875 69875 464684
Rental value of land 100 080 080 080 080 080 080 080 080 080 080 080 532
Total outflows 495144 105300 360238 125300 125300 125300 125300 125300 125300 125300 125300 1372551
Net cash flows ndash326559 231870 200255 435193 435193 435193 435193 435193 435193 435193 435193 1763549
Net cash flows real US$ ndash18660 13250 11443 24868 24868 24868 24868 24868 24868 24868 24868 100774
ENPV 12 discount rate ETB 17635
ENPV 12 discount rate $US 100774
21 There is no difference between Interventions B and C from the economy point of view
Cost Benefit Analysis of the GRAD Honey Value Chain November 2012 26
STAKEHOLDER AND BENEFICIARY ANALYSIS
An economic surplus in the economy is created by producing an output that has an economic value greater than the economic cost of the inputs such as capital land and labor that are used to produce the item The proposed interventions in the honey value chain will yield two groups of beneficiaries the households engaged in the interventions and the government of Ethiopia
The results of the analysis reveal that the income of the targeted households will increase Table 3 presented above has been designed by treating the opportunity cost of labor as a cash outflow The opportunity cost of labor will be retained within the family and therefore can be included in the present annual income of the targeted families Table 12 presents the annual family income profiles including the opportunity cost of labor which has been assumed to remain within the family
Table 12 Annual income of the targeted households including opportunity cost of family labor (in US$) Year Intervention A Intervention B Intervention C 2012 ndash15244 ndash11927 ndash8886 2013 5372 3492 ndash3192 2014 27694 20650 20733 2015 27694 18620 18667 2016ndash2022 27694 27694 27694
The net income decrease in the first years of the interventions will occur because of the equity contribution The annual increase in income presented in table 12 includes the opportunity cost of family labor spent on the beekeeping activities Each householdrsquos net income over the 11-year evaluation period will be US$121304 for Intervention A US$110868 for Intervention B and US$108033 for Intervention C
The other beneficiary of the intervention will be the government for the following reasons
The government will benefit directly from the taxes collected on the inputs and outputs of the intervention Plastic containers honey extractor sugar and so forth are importable to Ethiopia The total tax rate applied to these inputs is higher than the foreign exchange premium The inflow of taxes will reduce the economic cost below its financial cost and generate tax revenue for the government of Ethiopia
Modern beehives and smokers are produced domestically so they are assumed to be internationally non-tradable goods The inputs used to produce beehives and smokers such as stainless steel nails and covers are exportable to Ethiopia Again the total tax rate applied to these inputs will be higher than the FEP thus generating tax revenue for the government of Ethiopia
The government will also benefit indirectly because honey is exported from Ethiopia Exports allow the country to earn foreign exchange
The total amount of government benefits from the interventions over the 11-year period per household has been estimated to be US$22928 for Intervention A and US$21027 for Interventions B and C
The values of stakeholder gains under each of the interventions are presented in table 13 below
27
Cost Benefit Analysis of the GRAD Honey Value Chain November 2012
Table 13 Stakeholder and beneficiary impacts of the project (in US$)
Intervention A Intervention B Intervention C
Economic NPV (FNPV + externalities)
113092 100774 100774
Financial NPV (households) 90640 79666 79002 Externalities 22451 21108 21772
o Government 22928 21027 21027 o Financing
contribution ndash477 080 745
The financing contribution will be the amount of the interest and other charges paid on the three loans provided by MFIs over and above a real cost of 12 percent This figure represents a transfer of resources between the households and the MFIs USAIDEthiopia generally negotiates subsidized interest rates for households benefiting from aid programs The negative financing contribution in the case of Intervention A represents a direct subsidy to the targeted households that will be created through the submarket interest rate In the case of the GRAD project the subsidized interest rate will be 15 percent which is 5 percent below the current level of inflation in Ethiopia However the additional fees charged by the MFIs to make them willing to provide loans will more than offset the subsidy content of the interest rate paid on the loan in the case of Interventions B and C
Exact information regarding the number of households that will engage in beekeeping activities does not exist but assuming that 70 percent of the chronically food-insecure households participate (the main group of the GRAD beneficiaries)mdashthat is 70 percent of 50000 households will participate in beekeeping eventually (not necessary in year 1 of the project)mdashit is possible to calculate combined stakeholder and beneficiary impacts of the project Figures are presented in Table 14
Table 14 Combined stakeholder and beneficiary impacts of 35000 households in the project (in thousands US$)
28
Intervention A Intervention B Intervention C Economic NPV (FNPV + externalities)
3958220 3527090 3527090
Financial NPV (households) 3172400 2788310 2765070 Externalities 785785 738780 762020
o Government 802480 735945 735945 o Financing
contribution ndash16695 ndash2800 26075
SENSITIVITY ANALYSIS
A sensitivity analysis for the GRAD honey value chain intervention has been performed using the key variables that will be prone to change and likely to influence the situation of the households engaged in the project These variables include the price and yield of honey as well as their joint impact Details related to this sensitivity analysis are outlined in tables 15 16 17 and 18 below
Cost Benefit Analysis of the GRAD Honey Value Chain November 2012
The Joint Impact of Honey Price and Yield of the FNPV for Intervention A
Because prices and yields of honey are two of the most important factors that will influence the householdsrsquo income it is prudent to consider the possible impacts of changing one of their values in a sensitivity analysis The joint impact of these two variables for Intervention A is presented in table 15 below
Table 15 The joint impact of honey price and yield on the FNPV of households for Intervention A
Yield (in kg) 1200 1500 1700 1900 2100
4300 30850 51891 65918 82823 100599
4500 34924 56943 72174 90640 109417
5000 45108 69575 89659 110471 131558
6000 65477 100066 125232 150535 175839
7000 87799 131558 161079 190600 220121 Price (in ETB)
Table 15 shows the joint impact of the honey price and honey yield on the FNPV under Intervention A (three modern beehives with related tools and training) The scenario for this analysis has assumed that the price of honey will be ETB 45kg and the yield will be 19 kground (This honey price has been based on the assumption that the household will produce yellow honey which fetches lower prices in the domestic market) Under these circumstances the FNPV will be US$90640 But it is safe to assume that given the current high demand and rather low supply of honey in the domestic market the price of yellow honey will increase in the future Therefore the FNPV will likely be higher Even in the worst-case scenario if prices were to drop to ETB 43kg and the yield were to decrease from 19 kground to 12 kground the FNPV will still be positive at US$30850 which indicates very low risk of intervention failure at the household level
Table 16 The joint impact of honey price and yield on the net cash flow of households for Intervention A
Yield (in kg) 1200 1500 1700 1900 2100
4300 10188 14611 17560 20508 23457
4500 11011 15640 18725 21811 24897
5000 13068 18211 21640 25068 28497
6000 17183 23354 27468 31583 35697
7000 21297 28497 33297 38097 42897 Price (in ETB)
Table 16 presents the joint impact of honey yield and price on the net cash flow of the targeted households in 2014 and after when the loan will be repaid and cash flows will be stable Under the baseline scenario the annual net cash flow will be US$21811 If the price were ETB 7000 and the yield were 19 kg the net cash flow will reach US$38097 which is even higher than the targeted income increase of US$36500 Currently however only white honey will be able to fetch such high price levels in the domestic market The findings suggest that households in the areas where bees produce white honey will easily reach the targeted increase in income
29
Cost Benefit Analysis of the GRAD Honey Value Chain November 2012
Table 17 presents the joint impact of honey price and honey yield on the FNPV under Intervention B The FNPV in this case will be US$79666 In the worst-case scenario the FNPV will be lower under Intervention B than under Intervention A but will still be positive at US$22711 which again indicates low risk
Table 17 The joint impact of honey price and yield on the FNPV of households for Intervention B
Yield (in kg) 1200 1500 1700 1900 2100
4300 22721 43762 57790 72936 88169
4500 26636 48655 63725 79666 95644
5000 36422 61069 78781 96534 114429
6000 55995 87637 109059 130542 152025
7000 77009 114429 139493 164557 189621 Price (In ETB) Price (in ETB)
Table 18 describes the joint impact of honey price and yield on the annual net cash flow of the beneficiaries of Intervention B after 2016 when both of the loans will be repaid and cash flows will be stable The baseline scenario will yield a net annual cash flow of US$21811 If the price of white honey were to reach ETB 7000 the net increase in annual income excluding the opportunity cost of family labor will reach US$38097 holding the yield constant This figure is again higher than the targeted increase of US$36500
Table 18 The joint impact of honey price and yield on the FNPV of households for Intervention B
Yield (in kg) 1200 1500 1700 1900 2100
4300 10188 14611 17560 20508 23457
4500 11011 15640 18725 21811 24897
5000 13068 18211 21640 25068 28497
6000 17183 23354 27468 31583 35697
7000 21297 28497 33297 38097 42897 Price (in ETB)
If the nationwide production of honey continue to be limited and with the increasing popularity of good-quality honey the prices may go higher In the best-case scenario for Intervention A if prices were to reach ETB 70kg (more relevant price for white honey) and yields were to reach 21 kground the FNPV will be US$220121 In Intervention B under the same circumstances the FNPV will reach US$189621 The net annual cash flow accruing to the households at this combination of yield and price will provide an additional US$42897 per year after the loan has been paid in 2013 under Intervention A and in 2015 under Intervention B If domestic production could be substantially increased it is likely that the processing costs and perhaps the fob price for honey exports will fall allowing Ethiopian honey to become more competitive in the international market
30
RECOMMENDATIONS
Interventions A and B show a good potential for a substantial increase in income and economic impact for the households targeted by the GRAD project USAID should support their implementation They appear to have the ability to improve the livelihood and food security of the targeted households That said regardless of their potential Interventions A and B on their own may not guarantee an increase of US$365 in the householdsrsquo yearly income as hoped for in the GRAD proposal However when combined with other income-generating activities they may allow households to achieve the additional US$365year Another important benefit of these interventions is the almost nonexistent requirements for land Taking into consideration the very limited land holdings of GRAD beneficiaries and their almost complete reliance on this land as a source of income these interventions are attractive because they will allow households to earn additional income without changing their current land usage An intervention will also allow households to benefit from an additional MFI loan in year 3 after complete repayment of the initial loan for honey production for purchasing more beehives or participating in other proposed GRAD interventions such as haricot beans production Therefore it will be advisable to combine this intervention with another commodity intervention proposed in the GRAD project introducing them as a ldquopackage solutionrdquo to achieve the desired increase in householdsrsquo yearly income
It is debatable whether farmers will be able to repay a free market interest loan at 50 percent interest if they need to borrow their ldquoequityrdquo contributions Taking into consideration that the farmers will first try to repay the free market loan the risk of default on the USAID loan will be high The debt service from the two loans will be so significant that farmers may either refuse to participate in the beekeeping intervention or fail to repay the USAID-backed loan Many GRAD households have no access to free market loans as their current financial situation is such that financial institutions are unwilling to lend money to them Reducing the required amount of money necessary for a down payment might better facilitate the implementation of Intervention A ensuring that the targeted households will be able to join the project and benefit from its outcome
The analysis also reveals that Intervention B which has been designed to eliminate the equity contribution for households that will not be able to take a financial stake in the investment will eventually require the households to contribute other resources to repay their debt services This structure however may be preferred by many farmers because the equity contribution will be divided into two parts thus making it easier for them to find the required financial resources
In summary it is recommended that the burden of the initial down payment (28 percent) that is required from each targeted household to participate in the GRAD intervention in the honey value chain be lessened An ideal financing package will eliminate the down-payment requirements by increasing the size of the USAID-backed loan and increasing the length of the repayment period for Intervention A to 3 years In principal it is a good practice to require households to take a financial stake in the project by forcing them to contribute their own money yet such a system might prevent some farmers from choosing honey production as an intervention
Cost Benefit Analysis of the GRAD Honey Value Chain November 2012 31
REFERENCES
Abebe A (2009) Market Chain Analysis of Honey Production in Atsbi Wemberta District Eastern Zone of Tigray National Regional State Department of Agricultural Economics School of Graduate Studies Haramaya University
Agonafir J (2005) Strategic Intervention Plan on Honey and Beeswax Value Chains SNV Support to Business Organizations and Their Access to Market (BOAM)
Alemseged T and Yildiz N (2008) Beekeeping and Honey Production in the Tigray Region Ethiopia African Services Committee
Alemtsehay T (2011) Seasonal Availability of Common Bee Flora in Relation to Land Use and Colony Performance in Gergera Watershed Atsbi Wembwrta District Eastern Tigray Ethiopia Master Thesis Hawassa University
Anand S and Sisay G (2011) Engaging Smallholders in Value Chains Creating New Opportunities for Beekeepers in Ethiopia Programme Insights
APM Consul PLC (2008) A Study on Private Sector Linkages for Bee Product Producers in Bale Bale Regional Sustainable Management Program
Belie T (2009) Honeybee Production and Marketing Systems Constraints and Opportunities in Burie District of Amhara Region Ethiopia Department of Animal Science and Technology School of Graduate Studies Bahir Dar University
Chala K Taye T Kebede D and Tadele T (2012) Opportunities and Challenges of Honey Production in Gomma District of Jimma Zone South-West Ethiopia Journal of Agricultural Extension and Rural Development 4(4) 85ndash91
Desalegn B (2007) Assessment of the Effect of Ant (Dorylus fulvus) on Honeybee Colony (A mellifera) and Their Products in West and South-West Shewa Zones Ethiopia Ethiopian Journal of Animal Production 7(1) 12ndash26
Graduation With Resilience to Achieve Sustainable Development (GRAD) Technical Proposal July 20 2012
Jenkins G Kuo CY and Harberger A (2011) Cost-Benefit Analysis for Investment Decision Queenrsquos University August 2012 edition
Kuo CY (2011) Estimates of the Foreign Exchange Premium and the Premium for Non-Tradable Outlays for Countries in Africa John Deutsch International Department of Economics Queenrsquos University Canada
Shiferaw A Jaleta M Gebremedhin B and Hoekstra D (2010) Increasing Economic Benefit From Apiculture Through Value Chain Development Approach The Case of Alaba Special District Southern Ethiopia IPMS Ethiopia
Cost Benefit Analysis of the GRAD Honey Value Chain November 2012 32
Tadesse B and Phillips D (2007) Ensuring Small-Scale Producers in Ethiopia to Achieve Sustainable and Fair Access to Honey Markets International Development Enterprises (IDE) and Ethiopian Society for Appropriate Technology (ESAT)
Workneh A and Ranjitha P (2011) Beekeeping Subsector Challenges and Constraints in Atsbi Wemberta District of Eastern Zone Tigray Region Ethiopia Journal of Agricultural Extension and Rural Development 3(1) Z8ndashZ12
Yigzaw D Hoekstra D Berhe K Derso T and Mehari Y (2010) Smallholder Apiculture Development in Bure Ethiopia Experiences From IPMS Project Interventions IPMS Ethiopia
Yirga G Koru B Kidane D and Mebrahatu A (2012) Assessment of Beekeeping Practices in Asgede Tsimbla District Northern Ethiopia Absconding Bee Forage and Bee Pests African Journal of Agricultural Research 7(1) 1ndash5
Yirga G and Teferi M (2010) Participatory Technology and Constraints Assessment to Improve the Livelihood of Beekeepers in Tigray Region Northern Ethiopia Biology Department College of Natural and Computational Sciences Mekelle University
Cost Benefit Analysis of the GRAD Honey Value Chain November 2012 33
Cost Benefit Analysis of the GRAD Honey Value Chain November 2012
APPENDIX
Table A The FtF indicators proposed for the monitoring and evaluation of the GRAD project
Results Indicator Target
Overall objective To graduate chronically food-insecure households from food support
Graduation of chronically food-insecure households from food aid by increasing their yearly household income
50000 households that will experience an increase in yearly income of US$365 by year 5
Result 1 Enhanced livelihood options for chronically food-insecure households
45-2 Number of jobs attributed to FtF implementation (RiA) ndashdelete it
Higher is better
3191-3 and 47-4 Prevalence of households with moderate or severe hunger (RiA)
Lower is better
Result 2 Improved community and household resilience
319-16 Prevalence of underweight children under 5 years of age (R)-delete it
Lower is better
319-13 Prevalence of underweight women (R)
Lower is better
319-4 and 3191-4 Prevalence of exclusive breastfeeding of children under 6 months of age (RiA)
Lower is better
319-11 Prevalence of stunted children under 5 years of age (R)
Lower is better
452-14 Number of vulnerable households benefiting directly from USG assistance (S)
Lower is better
Result 3 Strengthened enabling environment to promote scale-up and sustainability
45 Womenrsquos Empowerment in Agriculture Index Score (R)
Higher is better
451-27 and CBLD-5 Percentage of combined key areas of organization capacity among USG direct and indirect local implementing partner levels
Higher is better
34
Cost Benefit Analysis of the GRAD Honey Value Chain November 2012
452-38 Value of new private sector investment in the agriculture sector or food chain leveraged by FtF implementation (RiA)
Higher is better
Table B List of CFs used to make adjustments in the economic analysis for both interventions
Summary of CFs Honey 109 Transportation 084 Labor 100 Modern beehive 085 Transitional beehive 100 Bee colony 100 Queen excluder 085 Wax (ETBkg) 106 Smoker 085 Overall coat 073 Veil 073 Glove 080 Extractor 082 Wax mold 100 Plastic honey container 075 Beehive maintenance 100 Rental value of land 100 Sugar 079
35
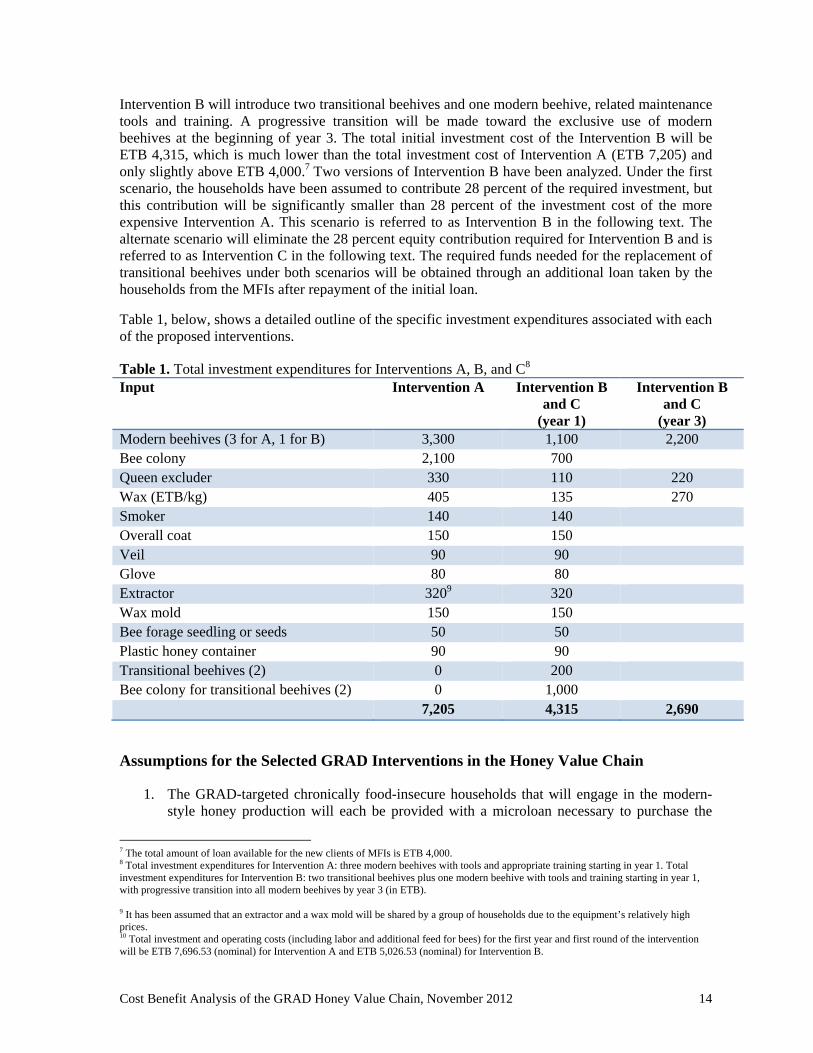
Cost Benefit Analysis of the GRAD Honey Value Chain November 2012
Intervention B will introduce two transitional beehives and one modern beehive related maintenance tools and training A progressive transition will be made toward the exclusive use of modern beehives at the beginning of year 3 The total initial investment cost of the Intervention B will be ETB 4315 which is much lower than the total investment cost of Intervention A (ETB 7205) and only slightly above ETB 40007 Two versions of Intervention B have been analyzed Under the first scenario the households have been assumed to contribute 28 percent of the required investment but this contribution will be significantly smaller than 28 percent of the investment cost of the more expensive Intervention A This scenario is referred to as Intervention B in the following text The alternate scenario will eliminate the 28 percent equity contribution required for Intervention B and is referred to as Intervention C in the following text The required funds needed for the replacement of transitional beehives under both scenarios will be obtained through an additional loan taken by the households from the MFIs after repayment of the initial loan
Table 1 below shows a detailed outline of the specific investment expenditures associated with each of the proposed interventions
Table 1 Total investment expenditures for Interventions A B and C8
Input Intervention A Intervention B and C
(year 1)
Intervention B and C
(year 3) Modern beehives (3 for A 1 for B) 3300 1100 2200 Bee colony 2100 700 Queen excluder 330 110 220 Wax (ETBkg) 405 135 270 Smoker 140 140 Overall coat 150 150 Veil 90 90 Glove 80 80 Extractor 3209 320 Wax mold 150 150 Bee forage seedling or seeds 50 50 Plastic honey container 90 90 Transitional beehives (2) 0 200 Bee colony for transitional beehives (2) 0 1000 Total10 7205 4315 2690
Assumptions for the Selected GRAD Interventions in the Honey Value Chain
1 The GRAD-targeted chronically food-insecure households that will engage in the modern-style honey production will each be provided with a microloan necessary to purchase the
9 It has been assumed that an extractor and a wax mold will be shared by a group of households due to the equipmentrsquos relatively high prices10 Total investment and operating costs (including labor and additional feed for bees) for the first year and first round of the intervention will be ETB 769653 (nominal) for Intervention A and ETB 502653 (nominal) for Intervention B
7 The total amount of loan available for the new clients of MFIs is ETB 4000 8 Total investment expenditures for Intervention A three modern beehives with tools and appropriate training starting in year 1 Total investment expenditures for Intervention B two transitional beehives plus one modern beehive with tools and training starting in year 1 with progressive transition into all modern beehives by year 3 (in ETB)
14
required inputs It has been assumed that each targeted household possesses assets that can be sold to obtain cash (eg livestock) or has personal savings that can be used to provide a down payment 11 The size of this loan will vary according to the intervention With the required 28 percent participant contribution the necessary loan for Intervention A (covering three modern beehives starting in year 1 maintenance tools and training) will be ETB 5825household In the case of Intervention B (covering two transitional beehives and one modern beehive maintenance tools training and progressive transition into all modern beehives by the end of year 2) the size of the first loan will be ETB 3495household For financing the investment needed for the transition to using all modern beehives no equity contribution will be required and the amount of the second loan will be ETB 3028household The financing of the investment in Intervention C will occur without equity contribution The ability of the households to repay the initial loan for Interventions B and C will be very critical because it will determine the availability of the next loan required for the complete transition toward modern beehives
2 Training will be provided free of charge so targeted households will not incur any costs related to training (except the opportunity cost of time they spend being trained)
3 The microloan necessary for purchasing the required inputs will be provided at a subsidized interest rate of 15 percent Additional fees associated with this loan will include a service charge (1 percent) loan insurance (1 percent) upfront savings (10 percent) and a passbook fee (ETB 15) This loan will be for a period of 2 years with a grace period of 6 months Each household will make semiannual loan repayments for a total of three repayments of the loan principal12 The upfront savings (10 percent) will be returned to the households after the loan has been repaid There will be no interest renewed on the upfront savings
4 In the case of Interventions B and C households will need to replace the transitional beehives with modern ones in year 3 It has been assumed that they will cover the costs of the second loan after repaying the initial loan It has also been assumed that a down payment will not be needed for the second loan because the required amount is far below ETB 10000 (the amount provided by MFIs to clients who repaid the first loan and have good reputations)
5 It has been assumed that in the case where a household is not able to repay the total amount of its loan principal due in a particular round this amount will be transferred to the next round together with the incurred interest rate on the total outstanding amount This procedure will be repeated until the total loan amount is repaid13
6 It has also been assumed that each household will be able to harvest honey only one time in year 1 of Intervention A B or C In subsequent years it has been assumed that harvesting will happen twice annually For Intervention A it has been assumed that the average yield from each modern beehiveharvest will be 19 kgyear14 For Intervention B the same yield has been assumed in the case of modern beehive while the average yield from each transitional beehive has been assumed to be 8 kgyear
7 The household consumption of honey for both interventions has been assumed to be 5 kghouseholdround For Interventions B and C it has also been assumed that a household will consume lower-quality honey that comes from the transitional beehives and sell the honey from the modern beehives because it will fetch a higher price and thus allow the farmer to repay the loan faster
11 This ldquoafter down paymentrdquo loan amount in both cases includes investment expenditures as well as service charge loan insurance upfront savings and passbook fee12 In the first year of each intervention only one repayment has been assumed (in round 2) 13 Loan description provided by CARE 14 Such yield will be possible to obtain because of training that will improve a householdrsquos knowledge of modern beekeeping (eg the necessity for additional feedings and bee-forage planting)
Cost Benefit Analysis of the GRAD Honey Value Chain November 2012 15
8 The necessary operating costs for both interventions in the first round will include bee-feeding costs of ETB 14175 land-rental costs of ETB 040 and labor costs of ETB 34938 It has been assumed that households will provide the necessary labor for beehive maintenance so the labor required to maintain the beehives will not represent a cash burden
9 The cost of beehive maintenance (per round) has been set at 5 percent of the initial cost of the beehive for both interventions It has been assumed that households will use locally available materials and family labor for this purpose
10 The lifespan for the modern beehive for both interventions has been assumed to be 11 years which will be equal to the lifespan of the project15 In the case of Intervention B the lifespan for the transitional beehive is 2 years because at that point they will be replaced with modern beehives It has been assumed that farmers will just replace transitional beehives with modern versions (not add two modern beehives) because of two reasons
a Households keep modern beehives in the residential area to prevent them from being stolen Such a security system puts a constraint on the quantity of bee colonies that can be held by households because of the potential danger to the families
b The cost of the bee colony is much higher than the cost of transitional beehives so moving existing bee colonies from transitional beehives to modern ones instead of obtaining new bee colonies makes economic sense
11 In this analysis the farm-gate price of yellow honey has been assumed to be ETB 45kg for modern beehives and ETB 43kg for transitional beehives16
12 For Interventions B and C it has been assumed that households will replace their transitional beehives with modern ones at the beginning of year 3 The bee colonies from the transitional beehives will be moved to the modern ones so no additional costs will be incurred to replace the bee colonies
13 It has been assumed that the initial price of a bee colony for a modern beehive will be ETB 700 while it will be ETB 500 for a transitional beehive The difference in price results because the bee colony for a transitional beehive is smaller
14 For the purpose of this analysis the following macrolevel assumptions have been made The expected average annual domestic inflation rate is 20 percent and the US inflation rate is 25 percent The financial discount rate is a real rate of 12 percent the economic discount rate is a real rate of 12 percent the foreign exchange premium (FEP) is 65 percent (Kuo 2011) and the exchange rate is US$1 = ETB 1750
PROJECT MODELING
The financial and economic feasibility of the GRAD honey interventions in this analysis has been established by constructing cash flows from the point of view of the project (total investment point of view) and the point of view of the targeted households (equity point of view) All revenues or potential revenue items have been treated as cash inflows and all expenditures or potential expenditure items have been treated as cash outflows (Jenkins Kuo and Harberger 2011) The analysis has been carried out for an 11-year period
The cash flows have been constructed in nominal and real terms and on per-round (every 6 months) as well as annual bases (for total investment point of view and equity point of view) The cash flows have also been constructed for the total investment point of view with the exclusion of domestic
15 This lifespan was confirmed during the field interviews in July 2012 16 Honey prices have been based on field interviews conducted in July 2012 in Amhara and Tigray The difference in prices has come from the assumption that honey produced in modern beehives has a bit higher quality hence the higher price
Cost Benefit Analysis of the GRAD Honey Value Chain November 2012 16
Cost Benefit Analysis of the GRAD Honey Value Chain November 2012
consumption of honey (in nominal and real terms) to reflect the actual cash available for repayment of the loans
The economy resource flow statements have been constructed by adjusting each of the line items in the cash-flow statements of the total investment point of view by the corresponding economic conversion factor (CF)17
The financial sustainability of an intervention has been analyzed by estimating the SADSCR of the project over the life of the loan used to finance the project and by calculating the FNPV of the project from the targeted householdsrsquo (equity) point of view If the ENPV of the project is positive this means the total value of the benefits of the project (to whomever they accrue) will be greater than the combined costs required to implement and operate the intervention
FINDINGS
Financial Analysis
The appraisal has been carried out for an 11-year period Based on assumptions established for the purpose of this analysis all interventions will yield positive FNPVs The FNPV has been calculated using 12 percent real financial discount rate Table 2 presents the FNPVs for each intervention
Table 2 FNPVhouseholdintervention (in US$) FNPV
Intervention A 90640 Intervention B 79666 Intervention C 79002
The interventions in the honey value chain will also substantially increase the annual income of the targeted households Stabilized additional yearly income of US$21811 will be achieved by 2014 in the case of Intervention A compared to 2016 for Interventions B and C The resulting additional yearly income is presented in table 3 below18
Table 3 Annual net cash flows resulting from the interventions (in US$) Year Intervention A Intervention B Intervention C
2012 ndash16191 ndash12303 ndash9262 2013 3436 313 ndash3940 2014 21811 14767 14850 2015 21811 12737 12774 2016ndash2022 21811 21811 21811
The negative annual net cash flows in 2012 for Interventions A and B will result from the 28 percent equity contribution needed to finance the initial investment Intervention C will have two negative net cash flows in 2012 and 2013 because farmers will not have adequate cash flows to finance their debt burden during these years Although the initial equity contribution has been removed from
17 Dividing the separately calculated economic value of a unit of an item by its financial price will yield the conversion factor 18 Net cash flow from the household perspective has been measured as its revenue less operating expenses less debt service including both debt repayments and interest expense In the early years the net cash flows will be less than the strict accounting definition of income which only subtracts interest expense During these years annual financial depreciation will be less than debt repayment and hence net cash flow will be lower than net income
17
Cost Benefit Analysis of the GRAD Honey Value Chain November 2012
Intervention C targeted households will still need to contribute financial resources from other activities to repay their debt obligation
Table 4 describes the SADSCRs These indicators are very important from a program sustainability perspective because they show each householdrsquos ability to repay the loan necessary for the financing of the initial investment in each of the interventions The debt service obligations in a given period have been defined here to be the interest and principal that will be due in a given period plus the debt service from the previous period that cannot be paid due to inadequate net cash flow
Table 4 SADSCRround for household for the interventions Intervention A Year 1 round 1 Year 1 round 2 Year 2 round 1 Year 2 round 2 SADSCR - 093 100 171 Intervention B Year 1 round 1 Year 1 round 2 Year 2 round 1 Year 2 round 2 SADSCR (first loan) - 093 093 141 SADSCR (second loan) 126 174 271 Intervention C Year 1 round 1 Year 1 round 2 Year 2 round 1 Year 2 round 2 SADSCR (first loan) 068 052 058 SADSCR (second loan) 127 175 272
In the case of Intervention A the households will face difficulty repaying their debt obligation only during the first repayment period The debt service of the second repayment period and the unpaid debt service from the previous period will be repaid in round 1 of year 2
In the case of Intervention B when repayments will be due in the first two rounds the SADSCR will be below a value of 1 If the farmers will be expected to repay the loan this quickly they will have to draw on other sources of cash In round 2 of year 2 the SADSCR will reach a value above 1 indicating that the financial situation of the households will stabilize allowing the initial loan to be repaid This indicates that households by that time will be able to access the new loan required for the investment to replace transitional beehives with modern ones
The SADSCR of Intervention C will be below a value of 1 in all rounds indicating that households will not be able to repay their debt obligations without contributing financial resources generated by other activities The second loan however will be provided only for the households that repay the previous loan hence households will have to draw on other cash resources to repay the initial loan
The eventual necessity to contribute additional financial resources to repay the loan in Intervention C negates the principal difference (no equity contribution) between Interventions B and C Intervention B will require households to initially invest 28 percent equity capital while Intervention C will split almost the same amount over two repayment rounds The present value of equity contribution for Intervention B will be ETB 120820 (US$6904) while the present value of contribution under Intervention C will be ETB 109668 (US$6267) with ETB 67598 (US$3863) in the second round of year 1 and ETB 42070 (US$2404) in the first round of year 2
The SADSCR of the second loan of Interventions B and C will be above 1 in all rounds indicating that the financial standing of the households will be good enough to repay the loan although not in a timely manner
Table 5 presents the annual scheduled debt service obligations versus the annual net cash flows including the opportunity cost of labor which reflect the actual financial resources generated by the activity in the given period and available for the loan repayment It has been assumed that actual debt repayment will be made by the households without moving additional financial resources from other (non-honey-producing) activities to repay the loan for both interventions For Interventions A
18
Cost Benefit Analysis of the GRAD Honey Value Chain November 2012
and B these values confirm the status quo outlined in the discussion above about SADSCRs Although in both cases the households cannot repay the full amount of debt service in timely manner they will be able to cover the biggest part of payment and eventually will have adequate cash flow to pay back the loan At this time they will be refunded the upfront savings (10 percent of the initial loanrsquos amount) For Intervention B repayment of the loan will open access for the new loan required to finance investment in the two new modern beehives The annual net cash flows of Intervention C will not allow the households to repay the loan so they will not get access to the second loan
Table 5 Annual debt repayment obligations versus net annual cash flows including opportunity cost of family laborroundintervention (in ETB)
Year 1 Year 2 Intervention A Round 1 Round 2 Round 1 Round 2- Annual Debt Service Obl 278495 243149 156349 - Net cash flow 257625 243942 267225
Intervention B Round 1 Round 2 Round 1 Round 2 - Annual Debt Service Obl 168906 145146 104800- Net cash flow 157720 134502 147340
Intervention C Round 1 Round 2 Round 1 Round 2 - Annual Debt Service Obl 231771 259036 254673 - Net cash flow 157720 134502 147340
Note The debt service obligations in a given period have been defined here to be the interest and principal that are due plus the debt service from the previous period that cannot be paid due to inadequate net cash flow Note For the second loan of Interventions B and C annual debt service obligations will be equal to the actual debt payments because households will have sufficient cash flow to fully cover the obligations
19
Table 6 Intervention A annual cash-flow statement equity point of view (real ETB) Line items Yearltltltlt 2012 2013 2014 2015 2016 2017 2018 2019 2020 2021 2022 PV
Receipts
‐Value of in‐house honey consumption 22500 45000 45000 45000 45000 45000 45000 45000 45000 45000 45000 276760 ‐Revenue from honey sale 234000 468000 468000 468000 468000 468000 468000 468000 468000 468000 468000 2878304
Total inflows 256500 513000 513000 513000 513000 513000 513000 513000 513000 513000 513000 3155064
Expenditures Investment costs for modern beehives Modern beehive 330000 330000
Bee colony 210000 210000
Queen excluder 33000 33000
Wax 40500 40500
Smoker 14000 14000
Overall coat 15000 15000
Veil 9000 9000
Glove 8000 8000
Extractor 32000 32000
Wax mold 15000 15000
Bee forage seedling or seed to plant around backyard 5000 5000
Plastic honey container 9000 9000
Service costs for beehives Sugar for feeding 28350 28350 28350 28350 28350 28350 28350 28350 28350 28350 28350 188534
Beehive maintenance 16500 33000 33000 33000 33000 33000 33000 33000 33000 33000 33000 202957
or cost 69875 69875 69875 69875 69875 69875 69875 69875 69875 69875 69875 464684
Rental value of land 080 080 080 080 080 080 080 080 080 080 080 532
Subsidized loan ndash295457 321563 000 000 000 000 000 000 000 000 000 ndash8347
Total outflows 539848 452868 131305 131305 131305 131305 131305 131305 131305 131305 131305 1568860
Net cash flows ndash283348 60132 381695 381695 381695 381695 381695 381695 381695 381695 381695 1586204
Net cash flows real US$ ndash16191 3436 21811 21811 21811 21811 21811 21811 21811 21811 21811 90640
NPV 12 discount rate ETB 1586204 NPV 12 discount rate US$ 90640
20
Table 7 Intervention B annual cash-flow statement equity point of view (real ETB) Line items Yearltltltlt 2012 2013 2014 2015 2016 2017 2018 2019 2020 2021 2022 PV
Receipts
‐Value of in‐house honey consumption 21500 43000 45000 45000 45000 45000 45000 45000 45000 45000 45000 273974 ‐Revenue from honey sale 132800 265600 468000 468000 468000 468000 468000 468000 468000 468000 468000 2596390
Total inflows 154300 308600 513000 513000 513000 513000 513000 513000 513000 513000 513000 2870364
Expenditures Investment costs Modern beehive 110000 000 220000 285383
Bee colony for modern beehive 70000 70000
Transitional beehive 20000 20000
Bee colony for transitional beehive 100000 100000
Queen excluder 11000 000 22000 28538
Wax 13500 000 27000 35024
Smoker 14000 14000
Overall coat 15000 15000
Veil 9000 9000
Glove 8000 8000
Extractor 32000 32000
Wax mold 15000 15000
Bee forage seedling or seed to plant around backyard 5000 5000
Plastic honey container 9000 9000
Service costs for beehives Sugar for feeding 28350 28350 28350 28350 28350 28350 28350 28350 28350 28350 28350 188534
Modern beehive maintenance 5500 11000 33000 33000 33000 33000 33000 33000 33000 33000 33000 172315
Transitional beehive maintenance 1000 2000 000 000 000 000 000 000 000 000 000 2786
Labor cost 69875 69875 69875 69875 69875 69875 69875 69875 69875 69875 69875 464684
Rental value of land 080 080 080 080 080 080 080 080 080 080 080 532
Subsidized loan ndash166702 191809 ndash145729 158794 000 000 000 000 000 000 000 1409
Total outflows 369603 303114 254576 290099 131305 131305 131305 131305 131305 131305 131305 1476204
Net cash flows ndash215303 5486 258424 222901 381695 381695 381695 381695 381695 381695 381695 1394160
Net cash flows real US$ ndash12303 313 14767 12737 21811 21811 21811 21811 21811 21811 21811 79666
NPV 12 discount rate ETB 1394160 NPV 12 discount rate US$ 79666
Cost Benefit Analysis of the GRAD Honey Value Chain November 2012 21
Table 8 Intervention C annual cash-flow statement equity point of view (real ETB)19
Line items Yearltltltlt 2012 2013 2014 2015 2016 2017 2018 2019 2020 2021 2022 PV
Receipts
‐Value of in‐house honey 21500 43000 45000 45000 45000 45000 45000 45000 45000 45000 45000 273974Revenue from honey ‐ sale 132800 265600 468000 468000 468000 468000 468000 468000 468000 468000 468000 2596390
Total inflows 154300 308600 513000 513000 513000 513000 513000 513000 513000 513000 513000 2870364
Expenditures Investment costs Modern beehive 110000 000 220000 285383
Bee colony for modern beehive 70000 70000
Transitional beehive 20000 20000 Bee colony for transitional 100000 100000
Queen excluder 11000 000 22000 28538
Wax 13500 000 27000 35024
Smoker 14000 14000
Overall coat 15000 15000
Veil 9000 9000
Glove 8000 8000
Extractor 32000 32000
Wax mold 15000 15000 Bee forage seedling or seed to plant around
5000 5000
Plastic honey container 9000 9000
Services costs for beehives Sugar for feeding 28350 28350 28350 28350 28350 28350 28350 28350 28350 28350 28350 188534
Modern beehive maintenance 0055 11000 33000 33000 33000 33000 33000 33000 33000 33000 33000 172315 Transitional beehive 0010 2000 000 000 000 000 000 000 000 000 000 2786
Labor cost 69875 69875 69875 69875 69875 69875 69875 69875 69875 69875 69875 464684
Rental value of land 080 080 080 080 080 080 080 080 080 080 080 532
Subsidized loan ndash219923 266240 ndash147177 158152 000 000 000 000 000 000 000 32013
Total outflows 316382 377545 253128 289457 131305 131305 131305 131305 131305 131305 131305 1487827
Net cash flows ndash162082 ndash68945 259872 223543 381695 381695 381695 381695 381695 381695 381695 1382537
Net cash flows real US$ ndash9262 ndash3940 14850 12774 21811 21811 21811 21811 21811 21811 21811 79002
NPV 12 discount rate ETB 1382537
NPV 12 discount rate US$ 79002
19 The only difference between tables 8 and 9 is the repayment of the loan (subsidized loan line) All other lines of the tables are the same
Cost Benefit Analysis of the GRAD Honey Value Chain November 2012 22
Comparison of Interventions A B and C
Even though all interventions will yield positive FNPVs with Intervention A resulting in a greater FNPV the choice between the interventions will depend on several factors
1 Intervention A will require higher initial investment expenditures than Intervention B (ETB 7205 versus ETB 4315) Within the lifespan of Intervention A greater quantities of honey will be produced earlier thus allowing for higher financial returns that will offset the costs associated with the higher initial investment Such high initial investment requirements however will require an equity contribution from the household side because current policies of MFIs in Ethiopia will allow households to borrow a maximum of ETB 4000 in the first loan If the households are able to repay they will get access to a new loan up to ETB 10000
2 The main group of GRAD beneficiaries will be the households for which the equity contribution required for Intervention A may be a constraint to participate in the program For such households Intervention B will be more attractive because of the reduced equity contribution
3 The success of the complete transition toward modern beekeeping in Interventions B and C will entirely depend on the ability of the households to get a second loan from the MFIs The MFIs will not provide an additional loan to households that fail to repay the first loan so the households will need to contribute financial resources generated by other farm activities to repay the first loan This erases the principal difference of no equity contribution between the two interventions Some households however may prefer not to contribute 28 percent of the needed equity at the beginning of the project and will instead make this contribution in two installments to cover the debt burden as in the case of Intervention C
4 In addition to the higher FNPV Intervention A will also result in GRAD householdsrsquo achieving stable additional income of US$218 by 2014 as compared to 2016 for Intervention B Total incremental earnings of Intervention A as compared to Intervention B calculated over the 4-year period of 2012ndash16 will be equal to US$14681 (See table 3) For those households that will be financially capable of making the equity contribution it will be advantageous to choose Intervention A
5 Although Interventions B and C will require a second loan to finance the complete transition toward modern beekeeping this loan will not put a significant financial burden on the households because the cash flows will be sufficient to cover the householdsrsquo debt service obligations in full For Intervention A however after the total repayment of the initial investment loan in round 2 of year 2 the household will be free of debt and can continue honey production fully benefiting from the increased income from honey sales
Economic Analysis
Differences have emerged between the financial and economic outcomes due to the fact that the financial values do not include all externalities present in the economy In this case the only externality will come from increased tax revenues either directly from the taxation of inputs or indirectly via the FEP Honey is an exportable commodity in Ethiopia The FEP for Ethiopia has been estimated to be equal to 65 percent (Kuo 2011) Hence every incremental unit of foreign exchange (dollars) earned from increased exports will have an economic value to the country of 1065 times the value of the revenues by the exporters when exchanging the foreign exchange for local currency at the market exchange rate
23
To show the true economic impact of the proposed intervention on the Ethiopian economy the economic values have been derived by adjusting the financial values by the appropriate economic conversion factors If no distortions are present in the market then the financial value of an item has been used to measure its economic value20
Table 9 reports that the ENPV obtained in the analysis will be positive for both interventions The economic opportunity cost of capital of 12 percent has been used while calculating the ENPV If they are successfully implemented both interventions will benefit the Ethiopian economy
When the two interventions are compared Intervention A will result in total higher production of honey through the full life of the project as compared to Intervention B mainly because of the larger volume of output that will be produced by Intervention A during first 2 years of the project On the cost side farmers eventually will have to purchase the same equipment and the same number of modern beehives for Intervention B as they will for Intervention A The net results have shown that Intervention A will have a greater ENPV than Intervention B will The only difference between Interventions B and C is the way the interventions will be financed This method of investment financing will just be a transfer of resources and hence will not bring any change to the economic outcomes of the interventions As a result there is no difference between Interventions B and C Intervention A will be a better choice not only for the chronically food-insecure households targeted in the GRAD project but also for the Ethiopian economy as a whole because it will be more productive and create a larger value of financial and economic net benefits
The estimated ENPVs are presented in table 9 below
Table 9 ENPVs for Interventions A and B (in US$) ENPV
Intervention A 113092 Intervention B 100774
20 The list of CFs used for the purpose of this analysis is presented in table A in the appendix
Cost Benefit Analysis of the GRAD Honey Value Chain November 2012 24
Table 10 Economic resources cash-flow statement for Intervention A (real ETB) Line items CF Yearltltltlt 2012 2013 2014 2015 2016 2017 2018 2019 2020 2021 2022 PV
Receipts ‐Value of in‐house honey consumption 109 24583 49166 49166 49166 49166 49166 49166 49166 49166 49166 49166 302382 ‐Revenue from honey sale 109 255663 511327 511327 511327 511327 511327 511327 511327 511327 511327 511327 3144775
Total Inflows 280246 560493 560493 560493 560493 560493 560493 560493 560493 560493 560493 3447157
Expenditures Investment costs Modern beehive 085 281185 281185
Bee colony 100 210000 210000
Queen excluder 085 28118 28118
Wax 106 43104 43104
Smoker 085 11898 11898
Overall coat 073 10995 10995
Veil 073 6597 6597
Glove 080 6416 6416
Extractor 082 26244 26244
Wax mold 100 15000 15000 Bee forage seedling or seed to plant around 100 5000 5000
Plastic honey container 075 6724 6724
Services costs for beehives Sugar for feeding 079 22345 22345 22345 22345 22345 22345 22345 22345 22345 22345 22345 148600
Beehive maintenance 100 16500 33000 33000 33000 33000 33000 33000 33000 33000 33000 33000 202957
Labor cost 100 69875 69875 69875 69875 69875 69875 69875 69875 69875 69875 69875 464684
Rental value of land 100 080 080 080 080 080 080 080 080 080 080 080 532
Total outflows 760082 125300 125300 125300 125300 125300 125300 125300 125300 125300 125300 1468055
Net cash flows ‐ 435193 435193 435193 435193 435193 435193 435193 435193 435193 435193 1979102
Net cash flows real US$ ‐27419 24868 24868 24868 24868 24868 24868 24868 24868 24868 24868 113092
ENPV 12 discount rate ETB 19791
ENPV 12 discount rate $US 113092
25
Table 11 Economic resources cash-flow statement for Intervention B (real ETB)21
Line items CF Yearltltltlt 2012 2013 2014 2015 2016 2017 2018 2019 2020 2021 2022 PV
Receipts ‐Value of in‐house honey consumption 109 23490 46981 49166 49166 49166 49166 49166 49166 49166 49166 49166 299339
‐ Revenue from honey sale 109 145094
290189 511327 511327 511327 511327 511327 511327 511327 511327 511327 2836761
Total inflows 168585 337170 560493 560493 560493 560493 560493 560493 560493 560493 560493 3136100
Expenditures Investment costs Modern beehive 085 93728 000 187457 243167
Bee colony for modern beehive 100 70000 70000
Transitional beehive 100 20000 20000
Bee colony for transitional beehive 100 100000 100000
Queen excluder 085 9373 000 18746 24317
Wax 106 14368 000 28736 37276
Smoker 085 11898 11898
Overall coat 073 10995 10995
Veil 073 6597 6597
Glove 080 6416 6416Extractor 082 26244 26244
Wax mold 100 15000 15000 Bee forage seedling or seed to plant around backyard 100 5000 5000
Plastic honey container 075 6724 6724
Services costs for beehives Sugar for feeding 079 22345 22345 22345 22345 22345 22345 22345 22345 22345 22345 22345 148600
Modern beehive maintenance 100 5500 11000 33000 33000 33000 33000 33000 33000 33000 33000 33000 172315
Transitional beehive maintenance 100 1000 2000 000 000 000 000 000 000 000 000 000 2786
Labor cost 100 69875 69875 69875 69875 69875 69875 69875 69875 69875 69875 69875 464684
Rental value of land 100 080 080 080 080 080 080 080 080 080 080 080 532
Total outflows 495144 105300 360238 125300 125300 125300 125300 125300 125300 125300 125300 1372551
Net cash flows ndash326559 231870 200255 435193 435193 435193 435193 435193 435193 435193 435193 1763549
Net cash flows real US$ ndash18660 13250 11443 24868 24868 24868 24868 24868 24868 24868 24868 100774
ENPV 12 discount rate ETB 17635
ENPV 12 discount rate $US 100774
21 There is no difference between Interventions B and C from the economy point of view
Cost Benefit Analysis of the GRAD Honey Value Chain November 2012 26
STAKEHOLDER AND BENEFICIARY ANALYSIS
An economic surplus in the economy is created by producing an output that has an economic value greater than the economic cost of the inputs such as capital land and labor that are used to produce the item The proposed interventions in the honey value chain will yield two groups of beneficiaries the households engaged in the interventions and the government of Ethiopia
The results of the analysis reveal that the income of the targeted households will increase Table 3 presented above has been designed by treating the opportunity cost of labor as a cash outflow The opportunity cost of labor will be retained within the family and therefore can be included in the present annual income of the targeted families Table 12 presents the annual family income profiles including the opportunity cost of labor which has been assumed to remain within the family
Table 12 Annual income of the targeted households including opportunity cost of family labor (in US$) Year Intervention A Intervention B Intervention C 2012 ndash15244 ndash11927 ndash8886 2013 5372 3492 ndash3192 2014 27694 20650 20733 2015 27694 18620 18667 2016ndash2022 27694 27694 27694
The net income decrease in the first years of the interventions will occur because of the equity contribution The annual increase in income presented in table 12 includes the opportunity cost of family labor spent on the beekeeping activities Each householdrsquos net income over the 11-year evaluation period will be US$121304 for Intervention A US$110868 for Intervention B and US$108033 for Intervention C
The other beneficiary of the intervention will be the government for the following reasons
The government will benefit directly from the taxes collected on the inputs and outputs of the intervention Plastic containers honey extractor sugar and so forth are importable to Ethiopia The total tax rate applied to these inputs is higher than the foreign exchange premium The inflow of taxes will reduce the economic cost below its financial cost and generate tax revenue for the government of Ethiopia
Modern beehives and smokers are produced domestically so they are assumed to be internationally non-tradable goods The inputs used to produce beehives and smokers such as stainless steel nails and covers are exportable to Ethiopia Again the total tax rate applied to these inputs will be higher than the FEP thus generating tax revenue for the government of Ethiopia
The government will also benefit indirectly because honey is exported from Ethiopia Exports allow the country to earn foreign exchange
The total amount of government benefits from the interventions over the 11-year period per household has been estimated to be US$22928 for Intervention A and US$21027 for Interventions B and C
The values of stakeholder gains under each of the interventions are presented in table 13 below
27
Cost Benefit Analysis of the GRAD Honey Value Chain November 2012
Table 13 Stakeholder and beneficiary impacts of the project (in US$)
Intervention A Intervention B Intervention C
Economic NPV (FNPV + externalities)
113092 100774 100774
Financial NPV (households) 90640 79666 79002 Externalities 22451 21108 21772
o Government 22928 21027 21027 o Financing
contribution ndash477 080 745
The financing contribution will be the amount of the interest and other charges paid on the three loans provided by MFIs over and above a real cost of 12 percent This figure represents a transfer of resources between the households and the MFIs USAIDEthiopia generally negotiates subsidized interest rates for households benefiting from aid programs The negative financing contribution in the case of Intervention A represents a direct subsidy to the targeted households that will be created through the submarket interest rate In the case of the GRAD project the subsidized interest rate will be 15 percent which is 5 percent below the current level of inflation in Ethiopia However the additional fees charged by the MFIs to make them willing to provide loans will more than offset the subsidy content of the interest rate paid on the loan in the case of Interventions B and C
Exact information regarding the number of households that will engage in beekeeping activities does not exist but assuming that 70 percent of the chronically food-insecure households participate (the main group of the GRAD beneficiaries)mdashthat is 70 percent of 50000 households will participate in beekeeping eventually (not necessary in year 1 of the project)mdashit is possible to calculate combined stakeholder and beneficiary impacts of the project Figures are presented in Table 14
Table 14 Combined stakeholder and beneficiary impacts of 35000 households in the project (in thousands US$)
28
Intervention A Intervention B Intervention C Economic NPV (FNPV + externalities)
3958220 3527090 3527090
Financial NPV (households) 3172400 2788310 2765070 Externalities 785785 738780 762020
o Government 802480 735945 735945 o Financing
contribution ndash16695 ndash2800 26075
SENSITIVITY ANALYSIS
A sensitivity analysis for the GRAD honey value chain intervention has been performed using the key variables that will be prone to change and likely to influence the situation of the households engaged in the project These variables include the price and yield of honey as well as their joint impact Details related to this sensitivity analysis are outlined in tables 15 16 17 and 18 below
Cost Benefit Analysis of the GRAD Honey Value Chain November 2012
The Joint Impact of Honey Price and Yield of the FNPV for Intervention A
Because prices and yields of honey are two of the most important factors that will influence the householdsrsquo income it is prudent to consider the possible impacts of changing one of their values in a sensitivity analysis The joint impact of these two variables for Intervention A is presented in table 15 below
Table 15 The joint impact of honey price and yield on the FNPV of households for Intervention A
Yield (in kg) 1200 1500 1700 1900 2100
4300 30850 51891 65918 82823 100599
4500 34924 56943 72174 90640 109417
5000 45108 69575 89659 110471 131558
6000 65477 100066 125232 150535 175839
7000 87799 131558 161079 190600 220121 Price (in ETB)
Table 15 shows the joint impact of the honey price and honey yield on the FNPV under Intervention A (three modern beehives with related tools and training) The scenario for this analysis has assumed that the price of honey will be ETB 45kg and the yield will be 19 kground (This honey price has been based on the assumption that the household will produce yellow honey which fetches lower prices in the domestic market) Under these circumstances the FNPV will be US$90640 But it is safe to assume that given the current high demand and rather low supply of honey in the domestic market the price of yellow honey will increase in the future Therefore the FNPV will likely be higher Even in the worst-case scenario if prices were to drop to ETB 43kg and the yield were to decrease from 19 kground to 12 kground the FNPV will still be positive at US$30850 which indicates very low risk of intervention failure at the household level
Table 16 The joint impact of honey price and yield on the net cash flow of households for Intervention A
Yield (in kg) 1200 1500 1700 1900 2100
4300 10188 14611 17560 20508 23457
4500 11011 15640 18725 21811 24897
5000 13068 18211 21640 25068 28497
6000 17183 23354 27468 31583 35697
7000 21297 28497 33297 38097 42897 Price (in ETB)
Table 16 presents the joint impact of honey yield and price on the net cash flow of the targeted households in 2014 and after when the loan will be repaid and cash flows will be stable Under the baseline scenario the annual net cash flow will be US$21811 If the price were ETB 7000 and the yield were 19 kg the net cash flow will reach US$38097 which is even higher than the targeted income increase of US$36500 Currently however only white honey will be able to fetch such high price levels in the domestic market The findings suggest that households in the areas where bees produce white honey will easily reach the targeted increase in income
29
Cost Benefit Analysis of the GRAD Honey Value Chain November 2012
Table 17 presents the joint impact of honey price and honey yield on the FNPV under Intervention B The FNPV in this case will be US$79666 In the worst-case scenario the FNPV will be lower under Intervention B than under Intervention A but will still be positive at US$22711 which again indicates low risk
Table 17 The joint impact of honey price and yield on the FNPV of households for Intervention B
Yield (in kg) 1200 1500 1700 1900 2100
4300 22721 43762 57790 72936 88169
4500 26636 48655 63725 79666 95644
5000 36422 61069 78781 96534 114429
6000 55995 87637 109059 130542 152025
7000 77009 114429 139493 164557 189621 Price (In ETB) Price (in ETB)
Table 18 describes the joint impact of honey price and yield on the annual net cash flow of the beneficiaries of Intervention B after 2016 when both of the loans will be repaid and cash flows will be stable The baseline scenario will yield a net annual cash flow of US$21811 If the price of white honey were to reach ETB 7000 the net increase in annual income excluding the opportunity cost of family labor will reach US$38097 holding the yield constant This figure is again higher than the targeted increase of US$36500
Table 18 The joint impact of honey price and yield on the FNPV of households for Intervention B
Yield (in kg) 1200 1500 1700 1900 2100
4300 10188 14611 17560 20508 23457
4500 11011 15640 18725 21811 24897
5000 13068 18211 21640 25068 28497
6000 17183 23354 27468 31583 35697
7000 21297 28497 33297 38097 42897 Price (in ETB)
If the nationwide production of honey continue to be limited and with the increasing popularity of good-quality honey the prices may go higher In the best-case scenario for Intervention A if prices were to reach ETB 70kg (more relevant price for white honey) and yields were to reach 21 kground the FNPV will be US$220121 In Intervention B under the same circumstances the FNPV will reach US$189621 The net annual cash flow accruing to the households at this combination of yield and price will provide an additional US$42897 per year after the loan has been paid in 2013 under Intervention A and in 2015 under Intervention B If domestic production could be substantially increased it is likely that the processing costs and perhaps the fob price for honey exports will fall allowing Ethiopian honey to become more competitive in the international market
30
RECOMMENDATIONS
Interventions A and B show a good potential for a substantial increase in income and economic impact for the households targeted by the GRAD project USAID should support their implementation They appear to have the ability to improve the livelihood and food security of the targeted households That said regardless of their potential Interventions A and B on their own may not guarantee an increase of US$365 in the householdsrsquo yearly income as hoped for in the GRAD proposal However when combined with other income-generating activities they may allow households to achieve the additional US$365year Another important benefit of these interventions is the almost nonexistent requirements for land Taking into consideration the very limited land holdings of GRAD beneficiaries and their almost complete reliance on this land as a source of income these interventions are attractive because they will allow households to earn additional income without changing their current land usage An intervention will also allow households to benefit from an additional MFI loan in year 3 after complete repayment of the initial loan for honey production for purchasing more beehives or participating in other proposed GRAD interventions such as haricot beans production Therefore it will be advisable to combine this intervention with another commodity intervention proposed in the GRAD project introducing them as a ldquopackage solutionrdquo to achieve the desired increase in householdsrsquo yearly income
It is debatable whether farmers will be able to repay a free market interest loan at 50 percent interest if they need to borrow their ldquoequityrdquo contributions Taking into consideration that the farmers will first try to repay the free market loan the risk of default on the USAID loan will be high The debt service from the two loans will be so significant that farmers may either refuse to participate in the beekeeping intervention or fail to repay the USAID-backed loan Many GRAD households have no access to free market loans as their current financial situation is such that financial institutions are unwilling to lend money to them Reducing the required amount of money necessary for a down payment might better facilitate the implementation of Intervention A ensuring that the targeted households will be able to join the project and benefit from its outcome
The analysis also reveals that Intervention B which has been designed to eliminate the equity contribution for households that will not be able to take a financial stake in the investment will eventually require the households to contribute other resources to repay their debt services This structure however may be preferred by many farmers because the equity contribution will be divided into two parts thus making it easier for them to find the required financial resources
In summary it is recommended that the burden of the initial down payment (28 percent) that is required from each targeted household to participate in the GRAD intervention in the honey value chain be lessened An ideal financing package will eliminate the down-payment requirements by increasing the size of the USAID-backed loan and increasing the length of the repayment period for Intervention A to 3 years In principal it is a good practice to require households to take a financial stake in the project by forcing them to contribute their own money yet such a system might prevent some farmers from choosing honey production as an intervention
Cost Benefit Analysis of the GRAD Honey Value Chain November 2012 31
REFERENCES
Abebe A (2009) Market Chain Analysis of Honey Production in Atsbi Wemberta District Eastern Zone of Tigray National Regional State Department of Agricultural Economics School of Graduate Studies Haramaya University
Agonafir J (2005) Strategic Intervention Plan on Honey and Beeswax Value Chains SNV Support to Business Organizations and Their Access to Market (BOAM)
Alemseged T and Yildiz N (2008) Beekeeping and Honey Production in the Tigray Region Ethiopia African Services Committee
Alemtsehay T (2011) Seasonal Availability of Common Bee Flora in Relation to Land Use and Colony Performance in Gergera Watershed Atsbi Wembwrta District Eastern Tigray Ethiopia Master Thesis Hawassa University
Anand S and Sisay G (2011) Engaging Smallholders in Value Chains Creating New Opportunities for Beekeepers in Ethiopia Programme Insights
APM Consul PLC (2008) A Study on Private Sector Linkages for Bee Product Producers in Bale Bale Regional Sustainable Management Program
Belie T (2009) Honeybee Production and Marketing Systems Constraints and Opportunities in Burie District of Amhara Region Ethiopia Department of Animal Science and Technology School of Graduate Studies Bahir Dar University
Chala K Taye T Kebede D and Tadele T (2012) Opportunities and Challenges of Honey Production in Gomma District of Jimma Zone South-West Ethiopia Journal of Agricultural Extension and Rural Development 4(4) 85ndash91
Desalegn B (2007) Assessment of the Effect of Ant (Dorylus fulvus) on Honeybee Colony (A mellifera) and Their Products in West and South-West Shewa Zones Ethiopia Ethiopian Journal of Animal Production 7(1) 12ndash26
Graduation With Resilience to Achieve Sustainable Development (GRAD) Technical Proposal July 20 2012
Jenkins G Kuo CY and Harberger A (2011) Cost-Benefit Analysis for Investment Decision Queenrsquos University August 2012 edition
Kuo CY (2011) Estimates of the Foreign Exchange Premium and the Premium for Non-Tradable Outlays for Countries in Africa John Deutsch International Department of Economics Queenrsquos University Canada
Shiferaw A Jaleta M Gebremedhin B and Hoekstra D (2010) Increasing Economic Benefit From Apiculture Through Value Chain Development Approach The Case of Alaba Special District Southern Ethiopia IPMS Ethiopia
Cost Benefit Analysis of the GRAD Honey Value Chain November 2012 32
Tadesse B and Phillips D (2007) Ensuring Small-Scale Producers in Ethiopia to Achieve Sustainable and Fair Access to Honey Markets International Development Enterprises (IDE) and Ethiopian Society for Appropriate Technology (ESAT)
Workneh A and Ranjitha P (2011) Beekeeping Subsector Challenges and Constraints in Atsbi Wemberta District of Eastern Zone Tigray Region Ethiopia Journal of Agricultural Extension and Rural Development 3(1) Z8ndashZ12
Yigzaw D Hoekstra D Berhe K Derso T and Mehari Y (2010) Smallholder Apiculture Development in Bure Ethiopia Experiences From IPMS Project Interventions IPMS Ethiopia
Yirga G Koru B Kidane D and Mebrahatu A (2012) Assessment of Beekeeping Practices in Asgede Tsimbla District Northern Ethiopia Absconding Bee Forage and Bee Pests African Journal of Agricultural Research 7(1) 1ndash5
Yirga G and Teferi M (2010) Participatory Technology and Constraints Assessment to Improve the Livelihood of Beekeepers in Tigray Region Northern Ethiopia Biology Department College of Natural and Computational Sciences Mekelle University
Cost Benefit Analysis of the GRAD Honey Value Chain November 2012 33
Cost Benefit Analysis of the GRAD Honey Value Chain November 2012
APPENDIX
Table A The FtF indicators proposed for the monitoring and evaluation of the GRAD project
Results Indicator Target
Overall objective To graduate chronically food-insecure households from food support
Graduation of chronically food-insecure households from food aid by increasing their yearly household income
50000 households that will experience an increase in yearly income of US$365 by year 5
Result 1 Enhanced livelihood options for chronically food-insecure households
45-2 Number of jobs attributed to FtF implementation (RiA) ndashdelete it
Higher is better
3191-3 and 47-4 Prevalence of households with moderate or severe hunger (RiA)
Lower is better
Result 2 Improved community and household resilience
319-16 Prevalence of underweight children under 5 years of age (R)-delete it
Lower is better
319-13 Prevalence of underweight women (R)
Lower is better
319-4 and 3191-4 Prevalence of exclusive breastfeeding of children under 6 months of age (RiA)
Lower is better
319-11 Prevalence of stunted children under 5 years of age (R)
Lower is better
452-14 Number of vulnerable households benefiting directly from USG assistance (S)
Lower is better
Result 3 Strengthened enabling environment to promote scale-up and sustainability
45 Womenrsquos Empowerment in Agriculture Index Score (R)
Higher is better
451-27 and CBLD-5 Percentage of combined key areas of organization capacity among USG direct and indirect local implementing partner levels
Higher is better
34
Cost Benefit Analysis of the GRAD Honey Value Chain November 2012
452-38 Value of new private sector investment in the agriculture sector or food chain leveraged by FtF implementation (RiA)
Higher is better
Table B List of CFs used to make adjustments in the economic analysis for both interventions
Summary of CFs Honey 109 Transportation 084 Labor 100 Modern beehive 085 Transitional beehive 100 Bee colony 100 Queen excluder 085 Wax (ETBkg) 106 Smoker 085 Overall coat 073 Veil 073 Glove 080 Extractor 082 Wax mold 100 Plastic honey container 075 Beehive maintenance 100 Rental value of land 100 Sugar 079
35
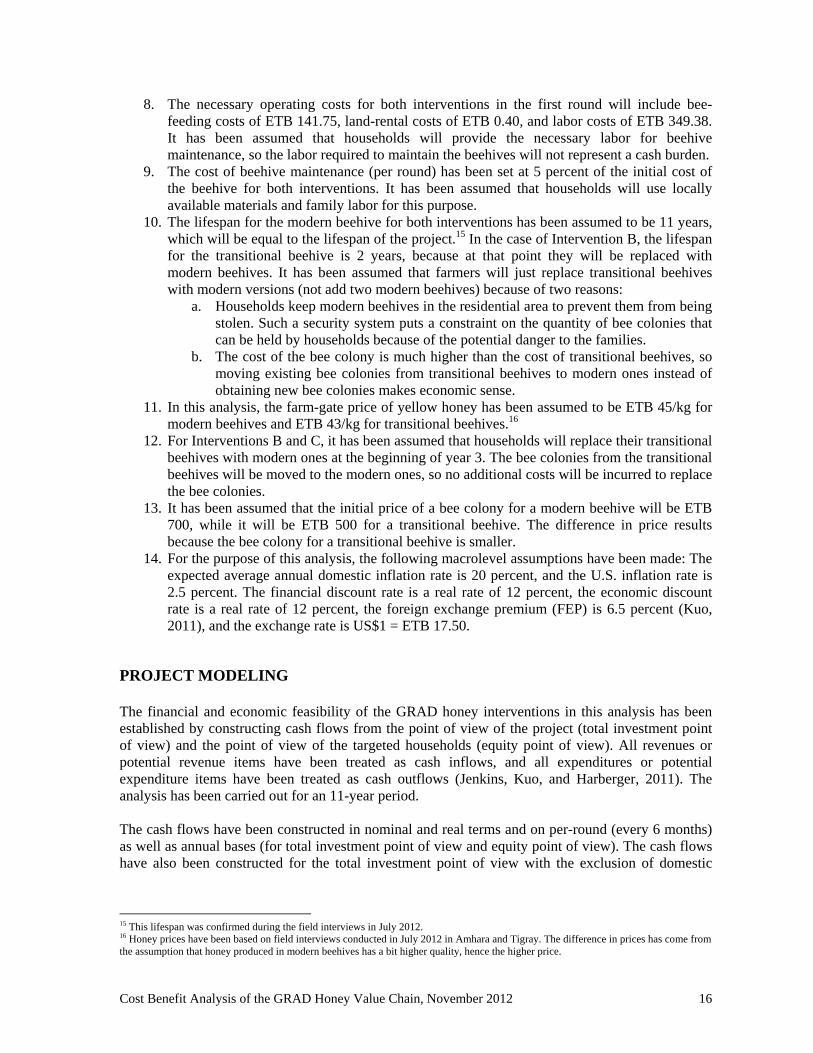

Cost Benefit Analysis of the GRAD Honey Value Chain November 2012
consumption of honey (in nominal and real terms) to reflect the actual cash available for repayment of the loans
The economy resource flow statements have been constructed by adjusting each of the line items in the cash-flow statements of the total investment point of view by the corresponding economic conversion factor (CF)17
The financial sustainability of an intervention has been analyzed by estimating the SADSCR of the project over the life of the loan used to finance the project and by calculating the FNPV of the project from the targeted householdsrsquo (equity) point of view If the ENPV of the project is positive this means the total value of the benefits of the project (to whomever they accrue) will be greater than the combined costs required to implement and operate the intervention
FINDINGS
Financial Analysis
The appraisal has been carried out for an 11-year period Based on assumptions established for the purpose of this analysis all interventions will yield positive FNPVs The FNPV has been calculated using 12 percent real financial discount rate Table 2 presents the FNPVs for each intervention
Table 2 FNPVhouseholdintervention (in US$) FNPV
Intervention A 90640 Intervention B 79666 Intervention C 79002
The interventions in the honey value chain will also substantially increase the annual income of the targeted households Stabilized additional yearly income of US$21811 will be achieved by 2014 in the case of Intervention A compared to 2016 for Interventions B and C The resulting additional yearly income is presented in table 3 below18
Table 3 Annual net cash flows resulting from the interventions (in US$) Year Intervention A Intervention B Intervention C
2012 ndash16191 ndash12303 ndash9262 2013 3436 313 ndash3940 2014 21811 14767 14850 2015 21811 12737 12774 2016ndash2022 21811 21811 21811
The negative annual net cash flows in 2012 for Interventions A and B will result from the 28 percent equity contribution needed to finance the initial investment Intervention C will have two negative net cash flows in 2012 and 2013 because farmers will not have adequate cash flows to finance their debt burden during these years Although the initial equity contribution has been removed from
17 Dividing the separately calculated economic value of a unit of an item by its financial price will yield the conversion factor 18 Net cash flow from the household perspective has been measured as its revenue less operating expenses less debt service including both debt repayments and interest expense In the early years the net cash flows will be less than the strict accounting definition of income which only subtracts interest expense During these years annual financial depreciation will be less than debt repayment and hence net cash flow will be lower than net income
17
Cost Benefit Analysis of the GRAD Honey Value Chain November 2012
Intervention C targeted households will still need to contribute financial resources from other activities to repay their debt obligation
Table 4 describes the SADSCRs These indicators are very important from a program sustainability perspective because they show each householdrsquos ability to repay the loan necessary for the financing of the initial investment in each of the interventions The debt service obligations in a given period have been defined here to be the interest and principal that will be due in a given period plus the debt service from the previous period that cannot be paid due to inadequate net cash flow
Table 4 SADSCRround for household for the interventions Intervention A Year 1 round 1 Year 1 round 2 Year 2 round 1 Year 2 round 2 SADSCR - 093 100 171 Intervention B Year 1 round 1 Year 1 round 2 Year 2 round 1 Year 2 round 2 SADSCR (first loan) - 093 093 141 SADSCR (second loan) 126 174 271 Intervention C Year 1 round 1 Year 1 round 2 Year 2 round 1 Year 2 round 2 SADSCR (first loan) 068 052 058 SADSCR (second loan) 127 175 272
In the case of Intervention A the households will face difficulty repaying their debt obligation only during the first repayment period The debt service of the second repayment period and the unpaid debt service from the previous period will be repaid in round 1 of year 2
In the case of Intervention B when repayments will be due in the first two rounds the SADSCR will be below a value of 1 If the farmers will be expected to repay the loan this quickly they will have to draw on other sources of cash In round 2 of year 2 the SADSCR will reach a value above 1 indicating that the financial situation of the households will stabilize allowing the initial loan to be repaid This indicates that households by that time will be able to access the new loan required for the investment to replace transitional beehives with modern ones
The SADSCR of Intervention C will be below a value of 1 in all rounds indicating that households will not be able to repay their debt obligations without contributing financial resources generated by other activities The second loan however will be provided only for the households that repay the previous loan hence households will have to draw on other cash resources to repay the initial loan
The eventual necessity to contribute additional financial resources to repay the loan in Intervention C negates the principal difference (no equity contribution) between Interventions B and C Intervention B will require households to initially invest 28 percent equity capital while Intervention C will split almost the same amount over two repayment rounds The present value of equity contribution for Intervention B will be ETB 120820 (US$6904) while the present value of contribution under Intervention C will be ETB 109668 (US$6267) with ETB 67598 (US$3863) in the second round of year 1 and ETB 42070 (US$2404) in the first round of year 2
The SADSCR of the second loan of Interventions B and C will be above 1 in all rounds indicating that the financial standing of the households will be good enough to repay the loan although not in a timely manner
Table 5 presents the annual scheduled debt service obligations versus the annual net cash flows including the opportunity cost of labor which reflect the actual financial resources generated by the activity in the given period and available for the loan repayment It has been assumed that actual debt repayment will be made by the households without moving additional financial resources from other (non-honey-producing) activities to repay the loan for both interventions For Interventions A
18
Cost Benefit Analysis of the GRAD Honey Value Chain November 2012
and B these values confirm the status quo outlined in the discussion above about SADSCRs Although in both cases the households cannot repay the full amount of debt service in timely manner they will be able to cover the biggest part of payment and eventually will have adequate cash flow to pay back the loan At this time they will be refunded the upfront savings (10 percent of the initial loanrsquos amount) For Intervention B repayment of the loan will open access for the new loan required to finance investment in the two new modern beehives The annual net cash flows of Intervention C will not allow the households to repay the loan so they will not get access to the second loan
Table 5 Annual debt repayment obligations versus net annual cash flows including opportunity cost of family laborroundintervention (in ETB)
Year 1 Year 2 Intervention A Round 1 Round 2 Round 1 Round 2- Annual Debt Service Obl 278495 243149 156349 - Net cash flow 257625 243942 267225
Intervention B Round 1 Round 2 Round 1 Round 2 - Annual Debt Service Obl 168906 145146 104800- Net cash flow 157720 134502 147340
Intervention C Round 1 Round 2 Round 1 Round 2 - Annual Debt Service Obl 231771 259036 254673 - Net cash flow 157720 134502 147340
Note The debt service obligations in a given period have been defined here to be the interest and principal that are due plus the debt service from the previous period that cannot be paid due to inadequate net cash flow Note For the second loan of Interventions B and C annual debt service obligations will be equal to the actual debt payments because households will have sufficient cash flow to fully cover the obligations
19
Table 6 Intervention A annual cash-flow statement equity point of view (real ETB) Line items Yearltltltlt 2012 2013 2014 2015 2016 2017 2018 2019 2020 2021 2022 PV
Receipts
‐Value of in‐house honey consumption 22500 45000 45000 45000 45000 45000 45000 45000 45000 45000 45000 276760 ‐Revenue from honey sale 234000 468000 468000 468000 468000 468000 468000 468000 468000 468000 468000 2878304
Total inflows 256500 513000 513000 513000 513000 513000 513000 513000 513000 513000 513000 3155064
Expenditures Investment costs for modern beehives Modern beehive 330000 330000
Bee colony 210000 210000
Queen excluder 33000 33000
Wax 40500 40500
Smoker 14000 14000
Overall coat 15000 15000
Veil 9000 9000
Glove 8000 8000
Extractor 32000 32000
Wax mold 15000 15000
Bee forage seedling or seed to plant around backyard 5000 5000
Plastic honey container 9000 9000
Service costs for beehives Sugar for feeding 28350 28350 28350 28350 28350 28350 28350 28350 28350 28350 28350 188534
Beehive maintenance 16500 33000 33000 33000 33000 33000 33000 33000 33000 33000 33000 202957
or cost 69875 69875 69875 69875 69875 69875 69875 69875 69875 69875 69875 464684
Rental value of land 080 080 080 080 080 080 080 080 080 080 080 532
Subsidized loan ndash295457 321563 000 000 000 000 000 000 000 000 000 ndash8347
Total outflows 539848 452868 131305 131305 131305 131305 131305 131305 131305 131305 131305 1568860
Net cash flows ndash283348 60132 381695 381695 381695 381695 381695 381695 381695 381695 381695 1586204
Net cash flows real US$ ndash16191 3436 21811 21811 21811 21811 21811 21811 21811 21811 21811 90640
NPV 12 discount rate ETB 1586204 NPV 12 discount rate US$ 90640
20
Table 7 Intervention B annual cash-flow statement equity point of view (real ETB) Line items Yearltltltlt 2012 2013 2014 2015 2016 2017 2018 2019 2020 2021 2022 PV
Receipts
‐Value of in‐house honey consumption 21500 43000 45000 45000 45000 45000 45000 45000 45000 45000 45000 273974 ‐Revenue from honey sale 132800 265600 468000 468000 468000 468000 468000 468000 468000 468000 468000 2596390
Total inflows 154300 308600 513000 513000 513000 513000 513000 513000 513000 513000 513000 2870364
Expenditures Investment costs Modern beehive 110000 000 220000 285383
Bee colony for modern beehive 70000 70000
Transitional beehive 20000 20000
Bee colony for transitional beehive 100000 100000
Queen excluder 11000 000 22000 28538
Wax 13500 000 27000 35024
Smoker 14000 14000
Overall coat 15000 15000
Veil 9000 9000
Glove 8000 8000
Extractor 32000 32000
Wax mold 15000 15000
Bee forage seedling or seed to plant around backyard 5000 5000
Plastic honey container 9000 9000
Service costs for beehives Sugar for feeding 28350 28350 28350 28350 28350 28350 28350 28350 28350 28350 28350 188534
Modern beehive maintenance 5500 11000 33000 33000 33000 33000 33000 33000 33000 33000 33000 172315
Transitional beehive maintenance 1000 2000 000 000 000 000 000 000 000 000 000 2786
Labor cost 69875 69875 69875 69875 69875 69875 69875 69875 69875 69875 69875 464684
Rental value of land 080 080 080 080 080 080 080 080 080 080 080 532
Subsidized loan ndash166702 191809 ndash145729 158794 000 000 000 000 000 000 000 1409
Total outflows 369603 303114 254576 290099 131305 131305 131305 131305 131305 131305 131305 1476204
Net cash flows ndash215303 5486 258424 222901 381695 381695 381695 381695 381695 381695 381695 1394160
Net cash flows real US$ ndash12303 313 14767 12737 21811 21811 21811 21811 21811 21811 21811 79666
NPV 12 discount rate ETB 1394160 NPV 12 discount rate US$ 79666
Cost Benefit Analysis of the GRAD Honey Value Chain November 2012 21
Table 8 Intervention C annual cash-flow statement equity point of view (real ETB)19
Line items Yearltltltlt 2012 2013 2014 2015 2016 2017 2018 2019 2020 2021 2022 PV
Receipts
‐Value of in‐house honey 21500 43000 45000 45000 45000 45000 45000 45000 45000 45000 45000 273974Revenue from honey ‐ sale 132800 265600 468000 468000 468000 468000 468000 468000 468000 468000 468000 2596390
Total inflows 154300 308600 513000 513000 513000 513000 513000 513000 513000 513000 513000 2870364
Expenditures Investment costs Modern beehive 110000 000 220000 285383
Bee colony for modern beehive 70000 70000
Transitional beehive 20000 20000 Bee colony for transitional 100000 100000
Queen excluder 11000 000 22000 28538
Wax 13500 000 27000 35024
Smoker 14000 14000
Overall coat 15000 15000
Veil 9000 9000
Glove 8000 8000
Extractor 32000 32000
Wax mold 15000 15000 Bee forage seedling or seed to plant around
5000 5000
Plastic honey container 9000 9000
Services costs for beehives Sugar for feeding 28350 28350 28350 28350 28350 28350 28350 28350 28350 28350 28350 188534
Modern beehive maintenance 0055 11000 33000 33000 33000 33000 33000 33000 33000 33000 33000 172315 Transitional beehive 0010 2000 000 000 000 000 000 000 000 000 000 2786
Labor cost 69875 69875 69875 69875 69875 69875 69875 69875 69875 69875 69875 464684
Rental value of land 080 080 080 080 080 080 080 080 080 080 080 532
Subsidized loan ndash219923 266240 ndash147177 158152 000 000 000 000 000 000 000 32013
Total outflows 316382 377545 253128 289457 131305 131305 131305 131305 131305 131305 131305 1487827
Net cash flows ndash162082 ndash68945 259872 223543 381695 381695 381695 381695 381695 381695 381695 1382537
Net cash flows real US$ ndash9262 ndash3940 14850 12774 21811 21811 21811 21811 21811 21811 21811 79002
NPV 12 discount rate ETB 1382537
NPV 12 discount rate US$ 79002
19 The only difference between tables 8 and 9 is the repayment of the loan (subsidized loan line) All other lines of the tables are the same
Cost Benefit Analysis of the GRAD Honey Value Chain November 2012 22
Comparison of Interventions A B and C
Even though all interventions will yield positive FNPVs with Intervention A resulting in a greater FNPV the choice between the interventions will depend on several factors
1 Intervention A will require higher initial investment expenditures than Intervention B (ETB 7205 versus ETB 4315) Within the lifespan of Intervention A greater quantities of honey will be produced earlier thus allowing for higher financial returns that will offset the costs associated with the higher initial investment Such high initial investment requirements however will require an equity contribution from the household side because current policies of MFIs in Ethiopia will allow households to borrow a maximum of ETB 4000 in the first loan If the households are able to repay they will get access to a new loan up to ETB 10000
2 The main group of GRAD beneficiaries will be the households for which the equity contribution required for Intervention A may be a constraint to participate in the program For such households Intervention B will be more attractive because of the reduced equity contribution
3 The success of the complete transition toward modern beekeeping in Interventions B and C will entirely depend on the ability of the households to get a second loan from the MFIs The MFIs will not provide an additional loan to households that fail to repay the first loan so the households will need to contribute financial resources generated by other farm activities to repay the first loan This erases the principal difference of no equity contribution between the two interventions Some households however may prefer not to contribute 28 percent of the needed equity at the beginning of the project and will instead make this contribution in two installments to cover the debt burden as in the case of Intervention C
4 In addition to the higher FNPV Intervention A will also result in GRAD householdsrsquo achieving stable additional income of US$218 by 2014 as compared to 2016 for Intervention B Total incremental earnings of Intervention A as compared to Intervention B calculated over the 4-year period of 2012ndash16 will be equal to US$14681 (See table 3) For those households that will be financially capable of making the equity contribution it will be advantageous to choose Intervention A
5 Although Interventions B and C will require a second loan to finance the complete transition toward modern beekeeping this loan will not put a significant financial burden on the households because the cash flows will be sufficient to cover the householdsrsquo debt service obligations in full For Intervention A however after the total repayment of the initial investment loan in round 2 of year 2 the household will be free of debt and can continue honey production fully benefiting from the increased income from honey sales
Economic Analysis
Differences have emerged between the financial and economic outcomes due to the fact that the financial values do not include all externalities present in the economy In this case the only externality will come from increased tax revenues either directly from the taxation of inputs or indirectly via the FEP Honey is an exportable commodity in Ethiopia The FEP for Ethiopia has been estimated to be equal to 65 percent (Kuo 2011) Hence every incremental unit of foreign exchange (dollars) earned from increased exports will have an economic value to the country of 1065 times the value of the revenues by the exporters when exchanging the foreign exchange for local currency at the market exchange rate
23
To show the true economic impact of the proposed intervention on the Ethiopian economy the economic values have been derived by adjusting the financial values by the appropriate economic conversion factors If no distortions are present in the market then the financial value of an item has been used to measure its economic value20
Table 9 reports that the ENPV obtained in the analysis will be positive for both interventions The economic opportunity cost of capital of 12 percent has been used while calculating the ENPV If they are successfully implemented both interventions will benefit the Ethiopian economy
When the two interventions are compared Intervention A will result in total higher production of honey through the full life of the project as compared to Intervention B mainly because of the larger volume of output that will be produced by Intervention A during first 2 years of the project On the cost side farmers eventually will have to purchase the same equipment and the same number of modern beehives for Intervention B as they will for Intervention A The net results have shown that Intervention A will have a greater ENPV than Intervention B will The only difference between Interventions B and C is the way the interventions will be financed This method of investment financing will just be a transfer of resources and hence will not bring any change to the economic outcomes of the interventions As a result there is no difference between Interventions B and C Intervention A will be a better choice not only for the chronically food-insecure households targeted in the GRAD project but also for the Ethiopian economy as a whole because it will be more productive and create a larger value of financial and economic net benefits
The estimated ENPVs are presented in table 9 below
Table 9 ENPVs for Interventions A and B (in US$) ENPV
Intervention A 113092 Intervention B 100774
20 The list of CFs used for the purpose of this analysis is presented in table A in the appendix
Cost Benefit Analysis of the GRAD Honey Value Chain November 2012 24
Table 10 Economic resources cash-flow statement for Intervention A (real ETB) Line items CF Yearltltltlt 2012 2013 2014 2015 2016 2017 2018 2019 2020 2021 2022 PV
Receipts ‐Value of in‐house honey consumption 109 24583 49166 49166 49166 49166 49166 49166 49166 49166 49166 49166 302382 ‐Revenue from honey sale 109 255663 511327 511327 511327 511327 511327 511327 511327 511327 511327 511327 3144775
Total Inflows 280246 560493 560493 560493 560493 560493 560493 560493 560493 560493 560493 3447157
Expenditures Investment costs Modern beehive 085 281185 281185
Bee colony 100 210000 210000
Queen excluder 085 28118 28118
Wax 106 43104 43104
Smoker 085 11898 11898
Overall coat 073 10995 10995
Veil 073 6597 6597
Glove 080 6416 6416
Extractor 082 26244 26244
Wax mold 100 15000 15000 Bee forage seedling or seed to plant around 100 5000 5000
Plastic honey container 075 6724 6724
Services costs for beehives Sugar for feeding 079 22345 22345 22345 22345 22345 22345 22345 22345 22345 22345 22345 148600
Beehive maintenance 100 16500 33000 33000 33000 33000 33000 33000 33000 33000 33000 33000 202957
Labor cost 100 69875 69875 69875 69875 69875 69875 69875 69875 69875 69875 69875 464684
Rental value of land 100 080 080 080 080 080 080 080 080 080 080 080 532
Total outflows 760082 125300 125300 125300 125300 125300 125300 125300 125300 125300 125300 1468055
Net cash flows ‐ 435193 435193 435193 435193 435193 435193 435193 435193 435193 435193 1979102
Net cash flows real US$ ‐27419 24868 24868 24868 24868 24868 24868 24868 24868 24868 24868 113092
ENPV 12 discount rate ETB 19791
ENPV 12 discount rate $US 113092
25
Table 11 Economic resources cash-flow statement for Intervention B (real ETB)21
Line items CF Yearltltltlt 2012 2013 2014 2015 2016 2017 2018 2019 2020 2021 2022 PV
Receipts ‐Value of in‐house honey consumption 109 23490 46981 49166 49166 49166 49166 49166 49166 49166 49166 49166 299339
‐ Revenue from honey sale 109 145094
290189 511327 511327 511327 511327 511327 511327 511327 511327 511327 2836761
Total inflows 168585 337170 560493 560493 560493 560493 560493 560493 560493 560493 560493 3136100
Expenditures Investment costs Modern beehive 085 93728 000 187457 243167
Bee colony for modern beehive 100 70000 70000
Transitional beehive 100 20000 20000
Bee colony for transitional beehive 100 100000 100000
Queen excluder 085 9373 000 18746 24317
Wax 106 14368 000 28736 37276
Smoker 085 11898 11898
Overall coat 073 10995 10995
Veil 073 6597 6597
Glove 080 6416 6416Extractor 082 26244 26244
Wax mold 100 15000 15000 Bee forage seedling or seed to plant around backyard 100 5000 5000
Plastic honey container 075 6724 6724
Services costs for beehives Sugar for feeding 079 22345 22345 22345 22345 22345 22345 22345 22345 22345 22345 22345 148600
Modern beehive maintenance 100 5500 11000 33000 33000 33000 33000 33000 33000 33000 33000 33000 172315
Transitional beehive maintenance 100 1000 2000 000 000 000 000 000 000 000 000 000 2786
Labor cost 100 69875 69875 69875 69875 69875 69875 69875 69875 69875 69875 69875 464684
Rental value of land 100 080 080 080 080 080 080 080 080 080 080 080 532
Total outflows 495144 105300 360238 125300 125300 125300 125300 125300 125300 125300 125300 1372551
Net cash flows ndash326559 231870 200255 435193 435193 435193 435193 435193 435193 435193 435193 1763549
Net cash flows real US$ ndash18660 13250 11443 24868 24868 24868 24868 24868 24868 24868 24868 100774
ENPV 12 discount rate ETB 17635
ENPV 12 discount rate $US 100774
21 There is no difference between Interventions B and C from the economy point of view
Cost Benefit Analysis of the GRAD Honey Value Chain November 2012 26
STAKEHOLDER AND BENEFICIARY ANALYSIS
An economic surplus in the economy is created by producing an output that has an economic value greater than the economic cost of the inputs such as capital land and labor that are used to produce the item The proposed interventions in the honey value chain will yield two groups of beneficiaries the households engaged in the interventions and the government of Ethiopia
The results of the analysis reveal that the income of the targeted households will increase Table 3 presented above has been designed by treating the opportunity cost of labor as a cash outflow The opportunity cost of labor will be retained within the family and therefore can be included in the present annual income of the targeted families Table 12 presents the annual family income profiles including the opportunity cost of labor which has been assumed to remain within the family
Table 12 Annual income of the targeted households including opportunity cost of family labor (in US$) Year Intervention A Intervention B Intervention C 2012 ndash15244 ndash11927 ndash8886 2013 5372 3492 ndash3192 2014 27694 20650 20733 2015 27694 18620 18667 2016ndash2022 27694 27694 27694
The net income decrease in the first years of the interventions will occur because of the equity contribution The annual increase in income presented in table 12 includes the opportunity cost of family labor spent on the beekeeping activities Each householdrsquos net income over the 11-year evaluation period will be US$121304 for Intervention A US$110868 for Intervention B and US$108033 for Intervention C
The other beneficiary of the intervention will be the government for the following reasons
The government will benefit directly from the taxes collected on the inputs and outputs of the intervention Plastic containers honey extractor sugar and so forth are importable to Ethiopia The total tax rate applied to these inputs is higher than the foreign exchange premium The inflow of taxes will reduce the economic cost below its financial cost and generate tax revenue for the government of Ethiopia
Modern beehives and smokers are produced domestically so they are assumed to be internationally non-tradable goods The inputs used to produce beehives and smokers such as stainless steel nails and covers are exportable to Ethiopia Again the total tax rate applied to these inputs will be higher than the FEP thus generating tax revenue for the government of Ethiopia
The government will also benefit indirectly because honey is exported from Ethiopia Exports allow the country to earn foreign exchange
The total amount of government benefits from the interventions over the 11-year period per household has been estimated to be US$22928 for Intervention A and US$21027 for Interventions B and C
The values of stakeholder gains under each of the interventions are presented in table 13 below
27
Cost Benefit Analysis of the GRAD Honey Value Chain November 2012
Table 13 Stakeholder and beneficiary impacts of the project (in US$)
Intervention A Intervention B Intervention C
Economic NPV (FNPV + externalities)
113092 100774 100774
Financial NPV (households) 90640 79666 79002 Externalities 22451 21108 21772
o Government 22928 21027 21027 o Financing
contribution ndash477 080 745
The financing contribution will be the amount of the interest and other charges paid on the three loans provided by MFIs over and above a real cost of 12 percent This figure represents a transfer of resources between the households and the MFIs USAIDEthiopia generally negotiates subsidized interest rates for households benefiting from aid programs The negative financing contribution in the case of Intervention A represents a direct subsidy to the targeted households that will be created through the submarket interest rate In the case of the GRAD project the subsidized interest rate will be 15 percent which is 5 percent below the current level of inflation in Ethiopia However the additional fees charged by the MFIs to make them willing to provide loans will more than offset the subsidy content of the interest rate paid on the loan in the case of Interventions B and C
Exact information regarding the number of households that will engage in beekeeping activities does not exist but assuming that 70 percent of the chronically food-insecure households participate (the main group of the GRAD beneficiaries)mdashthat is 70 percent of 50000 households will participate in beekeeping eventually (not necessary in year 1 of the project)mdashit is possible to calculate combined stakeholder and beneficiary impacts of the project Figures are presented in Table 14
Table 14 Combined stakeholder and beneficiary impacts of 35000 households in the project (in thousands US$)
28
Intervention A Intervention B Intervention C Economic NPV (FNPV + externalities)
3958220 3527090 3527090
Financial NPV (households) 3172400 2788310 2765070 Externalities 785785 738780 762020
o Government 802480 735945 735945 o Financing
contribution ndash16695 ndash2800 26075
SENSITIVITY ANALYSIS
A sensitivity analysis for the GRAD honey value chain intervention has been performed using the key variables that will be prone to change and likely to influence the situation of the households engaged in the project These variables include the price and yield of honey as well as their joint impact Details related to this sensitivity analysis are outlined in tables 15 16 17 and 18 below
Cost Benefit Analysis of the GRAD Honey Value Chain November 2012
The Joint Impact of Honey Price and Yield of the FNPV for Intervention A
Because prices and yields of honey are two of the most important factors that will influence the householdsrsquo income it is prudent to consider the possible impacts of changing one of their values in a sensitivity analysis The joint impact of these two variables for Intervention A is presented in table 15 below
Table 15 The joint impact of honey price and yield on the FNPV of households for Intervention A
Yield (in kg) 1200 1500 1700 1900 2100
4300 30850 51891 65918 82823 100599
4500 34924 56943 72174 90640 109417
5000 45108 69575 89659 110471 131558
6000 65477 100066 125232 150535 175839
7000 87799 131558 161079 190600 220121 Price (in ETB)
Table 15 shows the joint impact of the honey price and honey yield on the FNPV under Intervention A (three modern beehives with related tools and training) The scenario for this analysis has assumed that the price of honey will be ETB 45kg and the yield will be 19 kground (This honey price has been based on the assumption that the household will produce yellow honey which fetches lower prices in the domestic market) Under these circumstances the FNPV will be US$90640 But it is safe to assume that given the current high demand and rather low supply of honey in the domestic market the price of yellow honey will increase in the future Therefore the FNPV will likely be higher Even in the worst-case scenario if prices were to drop to ETB 43kg and the yield were to decrease from 19 kground to 12 kground the FNPV will still be positive at US$30850 which indicates very low risk of intervention failure at the household level
Table 16 The joint impact of honey price and yield on the net cash flow of households for Intervention A
Yield (in kg) 1200 1500 1700 1900 2100
4300 10188 14611 17560 20508 23457
4500 11011 15640 18725 21811 24897
5000 13068 18211 21640 25068 28497
6000 17183 23354 27468 31583 35697
7000 21297 28497 33297 38097 42897 Price (in ETB)
Table 16 presents the joint impact of honey yield and price on the net cash flow of the targeted households in 2014 and after when the loan will be repaid and cash flows will be stable Under the baseline scenario the annual net cash flow will be US$21811 If the price were ETB 7000 and the yield were 19 kg the net cash flow will reach US$38097 which is even higher than the targeted income increase of US$36500 Currently however only white honey will be able to fetch such high price levels in the domestic market The findings suggest that households in the areas where bees produce white honey will easily reach the targeted increase in income
29
Cost Benefit Analysis of the GRAD Honey Value Chain November 2012
Table 17 presents the joint impact of honey price and honey yield on the FNPV under Intervention B The FNPV in this case will be US$79666 In the worst-case scenario the FNPV will be lower under Intervention B than under Intervention A but will still be positive at US$22711 which again indicates low risk
Table 17 The joint impact of honey price and yield on the FNPV of households for Intervention B
Yield (in kg) 1200 1500 1700 1900 2100
4300 22721 43762 57790 72936 88169
4500 26636 48655 63725 79666 95644
5000 36422 61069 78781 96534 114429
6000 55995 87637 109059 130542 152025
7000 77009 114429 139493 164557 189621 Price (In ETB) Price (in ETB)
Table 18 describes the joint impact of honey price and yield on the annual net cash flow of the beneficiaries of Intervention B after 2016 when both of the loans will be repaid and cash flows will be stable The baseline scenario will yield a net annual cash flow of US$21811 If the price of white honey were to reach ETB 7000 the net increase in annual income excluding the opportunity cost of family labor will reach US$38097 holding the yield constant This figure is again higher than the targeted increase of US$36500
Table 18 The joint impact of honey price and yield on the FNPV of households for Intervention B
Yield (in kg) 1200 1500 1700 1900 2100
4300 10188 14611 17560 20508 23457
4500 11011 15640 18725 21811 24897
5000 13068 18211 21640 25068 28497
6000 17183 23354 27468 31583 35697
7000 21297 28497 33297 38097 42897 Price (in ETB)
If the nationwide production of honey continue to be limited and with the increasing popularity of good-quality honey the prices may go higher In the best-case scenario for Intervention A if prices were to reach ETB 70kg (more relevant price for white honey) and yields were to reach 21 kground the FNPV will be US$220121 In Intervention B under the same circumstances the FNPV will reach US$189621 The net annual cash flow accruing to the households at this combination of yield and price will provide an additional US$42897 per year after the loan has been paid in 2013 under Intervention A and in 2015 under Intervention B If domestic production could be substantially increased it is likely that the processing costs and perhaps the fob price for honey exports will fall allowing Ethiopian honey to become more competitive in the international market
30
RECOMMENDATIONS
Interventions A and B show a good potential for a substantial increase in income and economic impact for the households targeted by the GRAD project USAID should support their implementation They appear to have the ability to improve the livelihood and food security of the targeted households That said regardless of their potential Interventions A and B on their own may not guarantee an increase of US$365 in the householdsrsquo yearly income as hoped for in the GRAD proposal However when combined with other income-generating activities they may allow households to achieve the additional US$365year Another important benefit of these interventions is the almost nonexistent requirements for land Taking into consideration the very limited land holdings of GRAD beneficiaries and their almost complete reliance on this land as a source of income these interventions are attractive because they will allow households to earn additional income without changing their current land usage An intervention will also allow households to benefit from an additional MFI loan in year 3 after complete repayment of the initial loan for honey production for purchasing more beehives or participating in other proposed GRAD interventions such as haricot beans production Therefore it will be advisable to combine this intervention with another commodity intervention proposed in the GRAD project introducing them as a ldquopackage solutionrdquo to achieve the desired increase in householdsrsquo yearly income
It is debatable whether farmers will be able to repay a free market interest loan at 50 percent interest if they need to borrow their ldquoequityrdquo contributions Taking into consideration that the farmers will first try to repay the free market loan the risk of default on the USAID loan will be high The debt service from the two loans will be so significant that farmers may either refuse to participate in the beekeeping intervention or fail to repay the USAID-backed loan Many GRAD households have no access to free market loans as their current financial situation is such that financial institutions are unwilling to lend money to them Reducing the required amount of money necessary for a down payment might better facilitate the implementation of Intervention A ensuring that the targeted households will be able to join the project and benefit from its outcome
The analysis also reveals that Intervention B which has been designed to eliminate the equity contribution for households that will not be able to take a financial stake in the investment will eventually require the households to contribute other resources to repay their debt services This structure however may be preferred by many farmers because the equity contribution will be divided into two parts thus making it easier for them to find the required financial resources
In summary it is recommended that the burden of the initial down payment (28 percent) that is required from each targeted household to participate in the GRAD intervention in the honey value chain be lessened An ideal financing package will eliminate the down-payment requirements by increasing the size of the USAID-backed loan and increasing the length of the repayment period for Intervention A to 3 years In principal it is a good practice to require households to take a financial stake in the project by forcing them to contribute their own money yet such a system might prevent some farmers from choosing honey production as an intervention
Cost Benefit Analysis of the GRAD Honey Value Chain November 2012 31
REFERENCES
Abebe A (2009) Market Chain Analysis of Honey Production in Atsbi Wemberta District Eastern Zone of Tigray National Regional State Department of Agricultural Economics School of Graduate Studies Haramaya University
Agonafir J (2005) Strategic Intervention Plan on Honey and Beeswax Value Chains SNV Support to Business Organizations and Their Access to Market (BOAM)
Alemseged T and Yildiz N (2008) Beekeeping and Honey Production in the Tigray Region Ethiopia African Services Committee
Alemtsehay T (2011) Seasonal Availability of Common Bee Flora in Relation to Land Use and Colony Performance in Gergera Watershed Atsbi Wembwrta District Eastern Tigray Ethiopia Master Thesis Hawassa University
Anand S and Sisay G (2011) Engaging Smallholders in Value Chains Creating New Opportunities for Beekeepers in Ethiopia Programme Insights
APM Consul PLC (2008) A Study on Private Sector Linkages for Bee Product Producers in Bale Bale Regional Sustainable Management Program
Belie T (2009) Honeybee Production and Marketing Systems Constraints and Opportunities in Burie District of Amhara Region Ethiopia Department of Animal Science and Technology School of Graduate Studies Bahir Dar University
Chala K Taye T Kebede D and Tadele T (2012) Opportunities and Challenges of Honey Production in Gomma District of Jimma Zone South-West Ethiopia Journal of Agricultural Extension and Rural Development 4(4) 85ndash91
Desalegn B (2007) Assessment of the Effect of Ant (Dorylus fulvus) on Honeybee Colony (A mellifera) and Their Products in West and South-West Shewa Zones Ethiopia Ethiopian Journal of Animal Production 7(1) 12ndash26
Graduation With Resilience to Achieve Sustainable Development (GRAD) Technical Proposal July 20 2012
Jenkins G Kuo CY and Harberger A (2011) Cost-Benefit Analysis for Investment Decision Queenrsquos University August 2012 edition
Kuo CY (2011) Estimates of the Foreign Exchange Premium and the Premium for Non-Tradable Outlays for Countries in Africa John Deutsch International Department of Economics Queenrsquos University Canada
Shiferaw A Jaleta M Gebremedhin B and Hoekstra D (2010) Increasing Economic Benefit From Apiculture Through Value Chain Development Approach The Case of Alaba Special District Southern Ethiopia IPMS Ethiopia
Cost Benefit Analysis of the GRAD Honey Value Chain November 2012 32
Tadesse B and Phillips D (2007) Ensuring Small-Scale Producers in Ethiopia to Achieve Sustainable and Fair Access to Honey Markets International Development Enterprises (IDE) and Ethiopian Society for Appropriate Technology (ESAT)
Workneh A and Ranjitha P (2011) Beekeeping Subsector Challenges and Constraints in Atsbi Wemberta District of Eastern Zone Tigray Region Ethiopia Journal of Agricultural Extension and Rural Development 3(1) Z8ndashZ12
Yigzaw D Hoekstra D Berhe K Derso T and Mehari Y (2010) Smallholder Apiculture Development in Bure Ethiopia Experiences From IPMS Project Interventions IPMS Ethiopia
Yirga G Koru B Kidane D and Mebrahatu A (2012) Assessment of Beekeeping Practices in Asgede Tsimbla District Northern Ethiopia Absconding Bee Forage and Bee Pests African Journal of Agricultural Research 7(1) 1ndash5
Yirga G and Teferi M (2010) Participatory Technology and Constraints Assessment to Improve the Livelihood of Beekeepers in Tigray Region Northern Ethiopia Biology Department College of Natural and Computational Sciences Mekelle University
Cost Benefit Analysis of the GRAD Honey Value Chain November 2012 33
Cost Benefit Analysis of the GRAD Honey Value Chain November 2012
APPENDIX
Table A The FtF indicators proposed for the monitoring and evaluation of the GRAD project
Results Indicator Target
Overall objective To graduate chronically food-insecure households from food support
Graduation of chronically food-insecure households from food aid by increasing their yearly household income
50000 households that will experience an increase in yearly income of US$365 by year 5
Result 1 Enhanced livelihood options for chronically food-insecure households
45-2 Number of jobs attributed to FtF implementation (RiA) ndashdelete it
Higher is better
3191-3 and 47-4 Prevalence of households with moderate or severe hunger (RiA)
Lower is better
Result 2 Improved community and household resilience
319-16 Prevalence of underweight children under 5 years of age (R)-delete it
Lower is better
319-13 Prevalence of underweight women (R)
Lower is better
319-4 and 3191-4 Prevalence of exclusive breastfeeding of children under 6 months of age (RiA)
Lower is better
319-11 Prevalence of stunted children under 5 years of age (R)
Lower is better
452-14 Number of vulnerable households benefiting directly from USG assistance (S)
Lower is better
Result 3 Strengthened enabling environment to promote scale-up and sustainability
45 Womenrsquos Empowerment in Agriculture Index Score (R)
Higher is better
451-27 and CBLD-5 Percentage of combined key areas of organization capacity among USG direct and indirect local implementing partner levels
Higher is better
34
Cost Benefit Analysis of the GRAD Honey Value Chain November 2012
452-38 Value of new private sector investment in the agriculture sector or food chain leveraged by FtF implementation (RiA)
Higher is better
Table B List of CFs used to make adjustments in the economic analysis for both interventions
Summary of CFs Honey 109 Transportation 084 Labor 100 Modern beehive 085 Transitional beehive 100 Bee colony 100 Queen excluder 085 Wax (ETBkg) 106 Smoker 085 Overall coat 073 Veil 073 Glove 080 Extractor 082 Wax mold 100 Plastic honey container 075 Beehive maintenance 100 Rental value of land 100 Sugar 079
35
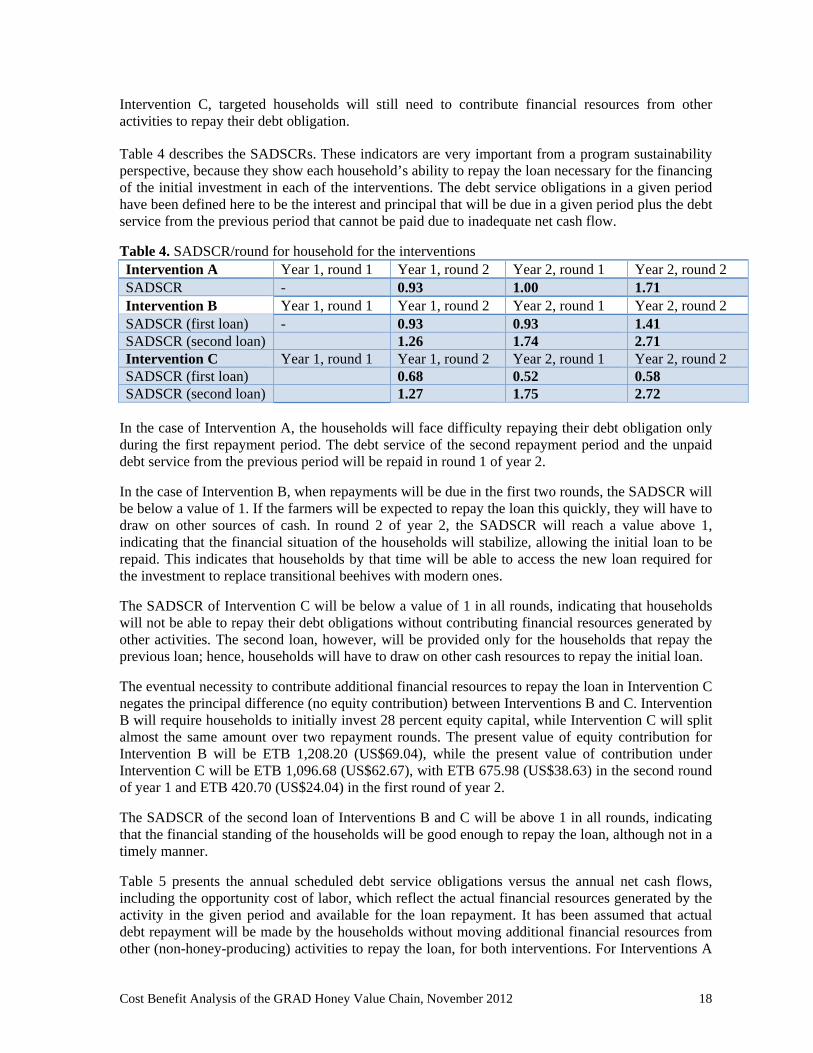
Cost Benefit Analysis of the GRAD Honey Value Chain November 2012
and B these values confirm the status quo outlined in the discussion above about SADSCRs Although in both cases the households cannot repay the full amount of debt service in timely manner they will be able to cover the biggest part of payment and eventually will have adequate cash flow to pay back the loan At this time they will be refunded the upfront savings (10 percent of the initial loanrsquos amount) For Intervention B repayment of the loan will open access for the new loan required to finance investment in the two new modern beehives The annual net cash flows of Intervention C will not allow the households to repay the loan so they will not get access to the second loan
Table 5 Annual debt repayment obligations versus net annual cash flows including opportunity cost of family laborroundintervention (in ETB)
Year 1 Year 2 Intervention A Round 1 Round 2 Round 1 Round 2- Annual Debt Service Obl 278495 243149 156349 - Net cash flow 257625 243942 267225
Intervention B Round 1 Round 2 Round 1 Round 2 - Annual Debt Service Obl 168906 145146 104800- Net cash flow 157720 134502 147340
Intervention C Round 1 Round 2 Round 1 Round 2 - Annual Debt Service Obl 231771 259036 254673 - Net cash flow 157720 134502 147340
Note The debt service obligations in a given period have been defined here to be the interest and principal that are due plus the debt service from the previous period that cannot be paid due to inadequate net cash flow Note For the second loan of Interventions B and C annual debt service obligations will be equal to the actual debt payments because households will have sufficient cash flow to fully cover the obligations
19
Table 6 Intervention A annual cash-flow statement equity point of view (real ETB) Line items Yearltltltlt 2012 2013 2014 2015 2016 2017 2018 2019 2020 2021 2022 PV
Receipts
‐Value of in‐house honey consumption 22500 45000 45000 45000 45000 45000 45000 45000 45000 45000 45000 276760 ‐Revenue from honey sale 234000 468000 468000 468000 468000 468000 468000 468000 468000 468000 468000 2878304
Total inflows 256500 513000 513000 513000 513000 513000 513000 513000 513000 513000 513000 3155064
Expenditures Investment costs for modern beehives Modern beehive 330000 330000
Bee colony 210000 210000
Queen excluder 33000 33000
Wax 40500 40500
Smoker 14000 14000
Overall coat 15000 15000
Veil 9000 9000
Glove 8000 8000
Extractor 32000 32000
Wax mold 15000 15000
Bee forage seedling or seed to plant around backyard 5000 5000
Plastic honey container 9000 9000
Service costs for beehives Sugar for feeding 28350 28350 28350 28350 28350 28350 28350 28350 28350 28350 28350 188534
Beehive maintenance 16500 33000 33000 33000 33000 33000 33000 33000 33000 33000 33000 202957
or cost 69875 69875 69875 69875 69875 69875 69875 69875 69875 69875 69875 464684
Rental value of land 080 080 080 080 080 080 080 080 080 080 080 532
Subsidized loan ndash295457 321563 000 000 000 000 000 000 000 000 000 ndash8347
Total outflows 539848 452868 131305 131305 131305 131305 131305 131305 131305 131305 131305 1568860
Net cash flows ndash283348 60132 381695 381695 381695 381695 381695 381695 381695 381695 381695 1586204
Net cash flows real US$ ndash16191 3436 21811 21811 21811 21811 21811 21811 21811 21811 21811 90640
NPV 12 discount rate ETB 1586204 NPV 12 discount rate US$ 90640
20
Table 7 Intervention B annual cash-flow statement equity point of view (real ETB) Line items Yearltltltlt 2012 2013 2014 2015 2016 2017 2018 2019 2020 2021 2022 PV
Receipts
‐Value of in‐house honey consumption 21500 43000 45000 45000 45000 45000 45000 45000 45000 45000 45000 273974 ‐Revenue from honey sale 132800 265600 468000 468000 468000 468000 468000 468000 468000 468000 468000 2596390
Total inflows 154300 308600 513000 513000 513000 513000 513000 513000 513000 513000 513000 2870364
Expenditures Investment costs Modern beehive 110000 000 220000 285383
Bee colony for modern beehive 70000 70000
Transitional beehive 20000 20000
Bee colony for transitional beehive 100000 100000
Queen excluder 11000 000 22000 28538
Wax 13500 000 27000 35024
Smoker 14000 14000
Overall coat 15000 15000
Veil 9000 9000
Glove 8000 8000
Extractor 32000 32000
Wax mold 15000 15000
Bee forage seedling or seed to plant around backyard 5000 5000
Plastic honey container 9000 9000
Service costs for beehives Sugar for feeding 28350 28350 28350 28350 28350 28350 28350 28350 28350 28350 28350 188534
Modern beehive maintenance 5500 11000 33000 33000 33000 33000 33000 33000 33000 33000 33000 172315
Transitional beehive maintenance 1000 2000 000 000 000 000 000 000 000 000 000 2786
Labor cost 69875 69875 69875 69875 69875 69875 69875 69875 69875 69875 69875 464684
Rental value of land 080 080 080 080 080 080 080 080 080 080 080 532
Subsidized loan ndash166702 191809 ndash145729 158794 000 000 000 000 000 000 000 1409
Total outflows 369603 303114 254576 290099 131305 131305 131305 131305 131305 131305 131305 1476204
Net cash flows ndash215303 5486 258424 222901 381695 381695 381695 381695 381695 381695 381695 1394160
Net cash flows real US$ ndash12303 313 14767 12737 21811 21811 21811 21811 21811 21811 21811 79666
NPV 12 discount rate ETB 1394160 NPV 12 discount rate US$ 79666
Cost Benefit Analysis of the GRAD Honey Value Chain November 2012 21
Table 8 Intervention C annual cash-flow statement equity point of view (real ETB)19
Line items Yearltltltlt 2012 2013 2014 2015 2016 2017 2018 2019 2020 2021 2022 PV
Receipts
‐Value of in‐house honey 21500 43000 45000 45000 45000 45000 45000 45000 45000 45000 45000 273974Revenue from honey ‐ sale 132800 265600 468000 468000 468000 468000 468000 468000 468000 468000 468000 2596390
Total inflows 154300 308600 513000 513000 513000 513000 513000 513000 513000 513000 513000 2870364
Expenditures Investment costs Modern beehive 110000 000 220000 285383
Bee colony for modern beehive 70000 70000
Transitional beehive 20000 20000 Bee colony for transitional 100000 100000
Queen excluder 11000 000 22000 28538
Wax 13500 000 27000 35024
Smoker 14000 14000
Overall coat 15000 15000
Veil 9000 9000
Glove 8000 8000
Extractor 32000 32000
Wax mold 15000 15000 Bee forage seedling or seed to plant around
5000 5000
Plastic honey container 9000 9000
Services costs for beehives Sugar for feeding 28350 28350 28350 28350 28350 28350 28350 28350 28350 28350 28350 188534
Modern beehive maintenance 0055 11000 33000 33000 33000 33000 33000 33000 33000 33000 33000 172315 Transitional beehive 0010 2000 000 000 000 000 000 000 000 000 000 2786
Labor cost 69875 69875 69875 69875 69875 69875 69875 69875 69875 69875 69875 464684
Rental value of land 080 080 080 080 080 080 080 080 080 080 080 532
Subsidized loan ndash219923 266240 ndash147177 158152 000 000 000 000 000 000 000 32013
Total outflows 316382 377545 253128 289457 131305 131305 131305 131305 131305 131305 131305 1487827
Net cash flows ndash162082 ndash68945 259872 223543 381695 381695 381695 381695 381695 381695 381695 1382537
Net cash flows real US$ ndash9262 ndash3940 14850 12774 21811 21811 21811 21811 21811 21811 21811 79002
NPV 12 discount rate ETB 1382537
NPV 12 discount rate US$ 79002
19 The only difference between tables 8 and 9 is the repayment of the loan (subsidized loan line) All other lines of the tables are the same
Cost Benefit Analysis of the GRAD Honey Value Chain November 2012 22
Comparison of Interventions A B and C
Even though all interventions will yield positive FNPVs with Intervention A resulting in a greater FNPV the choice between the interventions will depend on several factors
1 Intervention A will require higher initial investment expenditures than Intervention B (ETB 7205 versus ETB 4315) Within the lifespan of Intervention A greater quantities of honey will be produced earlier thus allowing for higher financial returns that will offset the costs associated with the higher initial investment Such high initial investment requirements however will require an equity contribution from the household side because current policies of MFIs in Ethiopia will allow households to borrow a maximum of ETB 4000 in the first loan If the households are able to repay they will get access to a new loan up to ETB 10000
2 The main group of GRAD beneficiaries will be the households for which the equity contribution required for Intervention A may be a constraint to participate in the program For such households Intervention B will be more attractive because of the reduced equity contribution
3 The success of the complete transition toward modern beekeeping in Interventions B and C will entirely depend on the ability of the households to get a second loan from the MFIs The MFIs will not provide an additional loan to households that fail to repay the first loan so the households will need to contribute financial resources generated by other farm activities to repay the first loan This erases the principal difference of no equity contribution between the two interventions Some households however may prefer not to contribute 28 percent of the needed equity at the beginning of the project and will instead make this contribution in two installments to cover the debt burden as in the case of Intervention C
4 In addition to the higher FNPV Intervention A will also result in GRAD householdsrsquo achieving stable additional income of US$218 by 2014 as compared to 2016 for Intervention B Total incremental earnings of Intervention A as compared to Intervention B calculated over the 4-year period of 2012ndash16 will be equal to US$14681 (See table 3) For those households that will be financially capable of making the equity contribution it will be advantageous to choose Intervention A
5 Although Interventions B and C will require a second loan to finance the complete transition toward modern beekeeping this loan will not put a significant financial burden on the households because the cash flows will be sufficient to cover the householdsrsquo debt service obligations in full For Intervention A however after the total repayment of the initial investment loan in round 2 of year 2 the household will be free of debt and can continue honey production fully benefiting from the increased income from honey sales
Economic Analysis
Differences have emerged between the financial and economic outcomes due to the fact that the financial values do not include all externalities present in the economy In this case the only externality will come from increased tax revenues either directly from the taxation of inputs or indirectly via the FEP Honey is an exportable commodity in Ethiopia The FEP for Ethiopia has been estimated to be equal to 65 percent (Kuo 2011) Hence every incremental unit of foreign exchange (dollars) earned from increased exports will have an economic value to the country of 1065 times the value of the revenues by the exporters when exchanging the foreign exchange for local currency at the market exchange rate
23
To show the true economic impact of the proposed intervention on the Ethiopian economy the economic values have been derived by adjusting the financial values by the appropriate economic conversion factors If no distortions are present in the market then the financial value of an item has been used to measure its economic value20
Table 9 reports that the ENPV obtained in the analysis will be positive for both interventions The economic opportunity cost of capital of 12 percent has been used while calculating the ENPV If they are successfully implemented both interventions will benefit the Ethiopian economy
When the two interventions are compared Intervention A will result in total higher production of honey through the full life of the project as compared to Intervention B mainly because of the larger volume of output that will be produced by Intervention A during first 2 years of the project On the cost side farmers eventually will have to purchase the same equipment and the same number of modern beehives for Intervention B as they will for Intervention A The net results have shown that Intervention A will have a greater ENPV than Intervention B will The only difference between Interventions B and C is the way the interventions will be financed This method of investment financing will just be a transfer of resources and hence will not bring any change to the economic outcomes of the interventions As a result there is no difference between Interventions B and C Intervention A will be a better choice not only for the chronically food-insecure households targeted in the GRAD project but also for the Ethiopian economy as a whole because it will be more productive and create a larger value of financial and economic net benefits
The estimated ENPVs are presented in table 9 below
Table 9 ENPVs for Interventions A and B (in US$) ENPV
Intervention A 113092 Intervention B 100774
20 The list of CFs used for the purpose of this analysis is presented in table A in the appendix
Cost Benefit Analysis of the GRAD Honey Value Chain November 2012 24
Table 10 Economic resources cash-flow statement for Intervention A (real ETB) Line items CF Yearltltltlt 2012 2013 2014 2015 2016 2017 2018 2019 2020 2021 2022 PV
Receipts ‐Value of in‐house honey consumption 109 24583 49166 49166 49166 49166 49166 49166 49166 49166 49166 49166 302382 ‐Revenue from honey sale 109 255663 511327 511327 511327 511327 511327 511327 511327 511327 511327 511327 3144775
Total Inflows 280246 560493 560493 560493 560493 560493 560493 560493 560493 560493 560493 3447157
Expenditures Investment costs Modern beehive 085 281185 281185
Bee colony 100 210000 210000
Queen excluder 085 28118 28118
Wax 106 43104 43104
Smoker 085 11898 11898
Overall coat 073 10995 10995
Veil 073 6597 6597
Glove 080 6416 6416
Extractor 082 26244 26244
Wax mold 100 15000 15000 Bee forage seedling or seed to plant around 100 5000 5000
Plastic honey container 075 6724 6724
Services costs for beehives Sugar for feeding 079 22345 22345 22345 22345 22345 22345 22345 22345 22345 22345 22345 148600
Beehive maintenance 100 16500 33000 33000 33000 33000 33000 33000 33000 33000 33000 33000 202957
Labor cost 100 69875 69875 69875 69875 69875 69875 69875 69875 69875 69875 69875 464684
Rental value of land 100 080 080 080 080 080 080 080 080 080 080 080 532
Total outflows 760082 125300 125300 125300 125300 125300 125300 125300 125300 125300 125300 1468055
Net cash flows ‐ 435193 435193 435193 435193 435193 435193 435193 435193 435193 435193 1979102
Net cash flows real US$ ‐27419 24868 24868 24868 24868 24868 24868 24868 24868 24868 24868 113092
ENPV 12 discount rate ETB 19791
ENPV 12 discount rate $US 113092
25
Table 11 Economic resources cash-flow statement for Intervention B (real ETB)21
Line items CF Yearltltltlt 2012 2013 2014 2015 2016 2017 2018 2019 2020 2021 2022 PV
Receipts ‐Value of in‐house honey consumption 109 23490 46981 49166 49166 49166 49166 49166 49166 49166 49166 49166 299339
‐ Revenue from honey sale 109 145094
290189 511327 511327 511327 511327 511327 511327 511327 511327 511327 2836761
Total inflows 168585 337170 560493 560493 560493 560493 560493 560493 560493 560493 560493 3136100
Expenditures Investment costs Modern beehive 085 93728 000 187457 243167
Bee colony for modern beehive 100 70000 70000
Transitional beehive 100 20000 20000
Bee colony for transitional beehive 100 100000 100000
Queen excluder 085 9373 000 18746 24317
Wax 106 14368 000 28736 37276
Smoker 085 11898 11898
Overall coat 073 10995 10995
Veil 073 6597 6597
Glove 080 6416 6416Extractor 082 26244 26244
Wax mold 100 15000 15000 Bee forage seedling or seed to plant around backyard 100 5000 5000
Plastic honey container 075 6724 6724
Services costs for beehives Sugar for feeding 079 22345 22345 22345 22345 22345 22345 22345 22345 22345 22345 22345 148600
Modern beehive maintenance 100 5500 11000 33000 33000 33000 33000 33000 33000 33000 33000 33000 172315
Transitional beehive maintenance 100 1000 2000 000 000 000 000 000 000 000 000 000 2786
Labor cost 100 69875 69875 69875 69875 69875 69875 69875 69875 69875 69875 69875 464684
Rental value of land 100 080 080 080 080 080 080 080 080 080 080 080 532
Total outflows 495144 105300 360238 125300 125300 125300 125300 125300 125300 125300 125300 1372551
Net cash flows ndash326559 231870 200255 435193 435193 435193 435193 435193 435193 435193 435193 1763549
Net cash flows real US$ ndash18660 13250 11443 24868 24868 24868 24868 24868 24868 24868 24868 100774
ENPV 12 discount rate ETB 17635
ENPV 12 discount rate $US 100774
21 There is no difference between Interventions B and C from the economy point of view
Cost Benefit Analysis of the GRAD Honey Value Chain November 2012 26
STAKEHOLDER AND BENEFICIARY ANALYSIS
An economic surplus in the economy is created by producing an output that has an economic value greater than the economic cost of the inputs such as capital land and labor that are used to produce the item The proposed interventions in the honey value chain will yield two groups of beneficiaries the households engaged in the interventions and the government of Ethiopia
The results of the analysis reveal that the income of the targeted households will increase Table 3 presented above has been designed by treating the opportunity cost of labor as a cash outflow The opportunity cost of labor will be retained within the family and therefore can be included in the present annual income of the targeted families Table 12 presents the annual family income profiles including the opportunity cost of labor which has been assumed to remain within the family
Table 12 Annual income of the targeted households including opportunity cost of family labor (in US$) Year Intervention A Intervention B Intervention C 2012 ndash15244 ndash11927 ndash8886 2013 5372 3492 ndash3192 2014 27694 20650 20733 2015 27694 18620 18667 2016ndash2022 27694 27694 27694
The net income decrease in the first years of the interventions will occur because of the equity contribution The annual increase in income presented in table 12 includes the opportunity cost of family labor spent on the beekeeping activities Each householdrsquos net income over the 11-year evaluation period will be US$121304 for Intervention A US$110868 for Intervention B and US$108033 for Intervention C
The other beneficiary of the intervention will be the government for the following reasons
The government will benefit directly from the taxes collected on the inputs and outputs of the intervention Plastic containers honey extractor sugar and so forth are importable to Ethiopia The total tax rate applied to these inputs is higher than the foreign exchange premium The inflow of taxes will reduce the economic cost below its financial cost and generate tax revenue for the government of Ethiopia
Modern beehives and smokers are produced domestically so they are assumed to be internationally non-tradable goods The inputs used to produce beehives and smokers such as stainless steel nails and covers are exportable to Ethiopia Again the total tax rate applied to these inputs will be higher than the FEP thus generating tax revenue for the government of Ethiopia
The government will also benefit indirectly because honey is exported from Ethiopia Exports allow the country to earn foreign exchange
The total amount of government benefits from the interventions over the 11-year period per household has been estimated to be US$22928 for Intervention A and US$21027 for Interventions B and C
The values of stakeholder gains under each of the interventions are presented in table 13 below
27
Cost Benefit Analysis of the GRAD Honey Value Chain November 2012
Table 13 Stakeholder and beneficiary impacts of the project (in US$)
Intervention A Intervention B Intervention C
Economic NPV (FNPV + externalities)
113092 100774 100774
Financial NPV (households) 90640 79666 79002 Externalities 22451 21108 21772
o Government 22928 21027 21027 o Financing
contribution ndash477 080 745
The financing contribution will be the amount of the interest and other charges paid on the three loans provided by MFIs over and above a real cost of 12 percent This figure represents a transfer of resources between the households and the MFIs USAIDEthiopia generally negotiates subsidized interest rates for households benefiting from aid programs The negative financing contribution in the case of Intervention A represents a direct subsidy to the targeted households that will be created through the submarket interest rate In the case of the GRAD project the subsidized interest rate will be 15 percent which is 5 percent below the current level of inflation in Ethiopia However the additional fees charged by the MFIs to make them willing to provide loans will more than offset the subsidy content of the interest rate paid on the loan in the case of Interventions B and C
Exact information regarding the number of households that will engage in beekeeping activities does not exist but assuming that 70 percent of the chronically food-insecure households participate (the main group of the GRAD beneficiaries)mdashthat is 70 percent of 50000 households will participate in beekeeping eventually (not necessary in year 1 of the project)mdashit is possible to calculate combined stakeholder and beneficiary impacts of the project Figures are presented in Table 14
Table 14 Combined stakeholder and beneficiary impacts of 35000 households in the project (in thousands US$)
28
Intervention A Intervention B Intervention C Economic NPV (FNPV + externalities)
3958220 3527090 3527090
Financial NPV (households) 3172400 2788310 2765070 Externalities 785785 738780 762020
o Government 802480 735945 735945 o Financing
contribution ndash16695 ndash2800 26075
SENSITIVITY ANALYSIS
A sensitivity analysis for the GRAD honey value chain intervention has been performed using the key variables that will be prone to change and likely to influence the situation of the households engaged in the project These variables include the price and yield of honey as well as their joint impact Details related to this sensitivity analysis are outlined in tables 15 16 17 and 18 below
Cost Benefit Analysis of the GRAD Honey Value Chain November 2012
The Joint Impact of Honey Price and Yield of the FNPV for Intervention A
Because prices and yields of honey are two of the most important factors that will influence the householdsrsquo income it is prudent to consider the possible impacts of changing one of their values in a sensitivity analysis The joint impact of these two variables for Intervention A is presented in table 15 below
Table 15 The joint impact of honey price and yield on the FNPV of households for Intervention A
Yield (in kg) 1200 1500 1700 1900 2100
4300 30850 51891 65918 82823 100599
4500 34924 56943 72174 90640 109417
5000 45108 69575 89659 110471 131558
6000 65477 100066 125232 150535 175839
7000 87799 131558 161079 190600 220121 Price (in ETB)
Table 15 shows the joint impact of the honey price and honey yield on the FNPV under Intervention A (three modern beehives with related tools and training) The scenario for this analysis has assumed that the price of honey will be ETB 45kg and the yield will be 19 kground (This honey price has been based on the assumption that the household will produce yellow honey which fetches lower prices in the domestic market) Under these circumstances the FNPV will be US$90640 But it is safe to assume that given the current high demand and rather low supply of honey in the domestic market the price of yellow honey will increase in the future Therefore the FNPV will likely be higher Even in the worst-case scenario if prices were to drop to ETB 43kg and the yield were to decrease from 19 kground to 12 kground the FNPV will still be positive at US$30850 which indicates very low risk of intervention failure at the household level
Table 16 The joint impact of honey price and yield on the net cash flow of households for Intervention A
Yield (in kg) 1200 1500 1700 1900 2100
4300 10188 14611 17560 20508 23457
4500 11011 15640 18725 21811 24897
5000 13068 18211 21640 25068 28497
6000 17183 23354 27468 31583 35697
7000 21297 28497 33297 38097 42897 Price (in ETB)
Table 16 presents the joint impact of honey yield and price on the net cash flow of the targeted households in 2014 and after when the loan will be repaid and cash flows will be stable Under the baseline scenario the annual net cash flow will be US$21811 If the price were ETB 7000 and the yield were 19 kg the net cash flow will reach US$38097 which is even higher than the targeted income increase of US$36500 Currently however only white honey will be able to fetch such high price levels in the domestic market The findings suggest that households in the areas where bees produce white honey will easily reach the targeted increase in income
29
Cost Benefit Analysis of the GRAD Honey Value Chain November 2012
Table 17 presents the joint impact of honey price and honey yield on the FNPV under Intervention B The FNPV in this case will be US$79666 In the worst-case scenario the FNPV will be lower under Intervention B than under Intervention A but will still be positive at US$22711 which again indicates low risk
Table 17 The joint impact of honey price and yield on the FNPV of households for Intervention B
Yield (in kg) 1200 1500 1700 1900 2100
4300 22721 43762 57790 72936 88169
4500 26636 48655 63725 79666 95644
5000 36422 61069 78781 96534 114429
6000 55995 87637 109059 130542 152025
7000 77009 114429 139493 164557 189621 Price (In ETB) Price (in ETB)
Table 18 describes the joint impact of honey price and yield on the annual net cash flow of the beneficiaries of Intervention B after 2016 when both of the loans will be repaid and cash flows will be stable The baseline scenario will yield a net annual cash flow of US$21811 If the price of white honey were to reach ETB 7000 the net increase in annual income excluding the opportunity cost of family labor will reach US$38097 holding the yield constant This figure is again higher than the targeted increase of US$36500
Table 18 The joint impact of honey price and yield on the FNPV of households for Intervention B
Yield (in kg) 1200 1500 1700 1900 2100
4300 10188 14611 17560 20508 23457
4500 11011 15640 18725 21811 24897
5000 13068 18211 21640 25068 28497
6000 17183 23354 27468 31583 35697
7000 21297 28497 33297 38097 42897 Price (in ETB)
If the nationwide production of honey continue to be limited and with the increasing popularity of good-quality honey the prices may go higher In the best-case scenario for Intervention A if prices were to reach ETB 70kg (more relevant price for white honey) and yields were to reach 21 kground the FNPV will be US$220121 In Intervention B under the same circumstances the FNPV will reach US$189621 The net annual cash flow accruing to the households at this combination of yield and price will provide an additional US$42897 per year after the loan has been paid in 2013 under Intervention A and in 2015 under Intervention B If domestic production could be substantially increased it is likely that the processing costs and perhaps the fob price for honey exports will fall allowing Ethiopian honey to become more competitive in the international market
30
RECOMMENDATIONS
Interventions A and B show a good potential for a substantial increase in income and economic impact for the households targeted by the GRAD project USAID should support their implementation They appear to have the ability to improve the livelihood and food security of the targeted households That said regardless of their potential Interventions A and B on their own may not guarantee an increase of US$365 in the householdsrsquo yearly income as hoped for in the GRAD proposal However when combined with other income-generating activities they may allow households to achieve the additional US$365year Another important benefit of these interventions is the almost nonexistent requirements for land Taking into consideration the very limited land holdings of GRAD beneficiaries and their almost complete reliance on this land as a source of income these interventions are attractive because they will allow households to earn additional income without changing their current land usage An intervention will also allow households to benefit from an additional MFI loan in year 3 after complete repayment of the initial loan for honey production for purchasing more beehives or participating in other proposed GRAD interventions such as haricot beans production Therefore it will be advisable to combine this intervention with another commodity intervention proposed in the GRAD project introducing them as a ldquopackage solutionrdquo to achieve the desired increase in householdsrsquo yearly income
It is debatable whether farmers will be able to repay a free market interest loan at 50 percent interest if they need to borrow their ldquoequityrdquo contributions Taking into consideration that the farmers will first try to repay the free market loan the risk of default on the USAID loan will be high The debt service from the two loans will be so significant that farmers may either refuse to participate in the beekeeping intervention or fail to repay the USAID-backed loan Many GRAD households have no access to free market loans as their current financial situation is such that financial institutions are unwilling to lend money to them Reducing the required amount of money necessary for a down payment might better facilitate the implementation of Intervention A ensuring that the targeted households will be able to join the project and benefit from its outcome
The analysis also reveals that Intervention B which has been designed to eliminate the equity contribution for households that will not be able to take a financial stake in the investment will eventually require the households to contribute other resources to repay their debt services This structure however may be preferred by many farmers because the equity contribution will be divided into two parts thus making it easier for them to find the required financial resources
In summary it is recommended that the burden of the initial down payment (28 percent) that is required from each targeted household to participate in the GRAD intervention in the honey value chain be lessened An ideal financing package will eliminate the down-payment requirements by increasing the size of the USAID-backed loan and increasing the length of the repayment period for Intervention A to 3 years In principal it is a good practice to require households to take a financial stake in the project by forcing them to contribute their own money yet such a system might prevent some farmers from choosing honey production as an intervention
Cost Benefit Analysis of the GRAD Honey Value Chain November 2012 31
REFERENCES
Abebe A (2009) Market Chain Analysis of Honey Production in Atsbi Wemberta District Eastern Zone of Tigray National Regional State Department of Agricultural Economics School of Graduate Studies Haramaya University
Agonafir J (2005) Strategic Intervention Plan on Honey and Beeswax Value Chains SNV Support to Business Organizations and Their Access to Market (BOAM)
Alemseged T and Yildiz N (2008) Beekeeping and Honey Production in the Tigray Region Ethiopia African Services Committee
Alemtsehay T (2011) Seasonal Availability of Common Bee Flora in Relation to Land Use and Colony Performance in Gergera Watershed Atsbi Wembwrta District Eastern Tigray Ethiopia Master Thesis Hawassa University
Anand S and Sisay G (2011) Engaging Smallholders in Value Chains Creating New Opportunities for Beekeepers in Ethiopia Programme Insights
APM Consul PLC (2008) A Study on Private Sector Linkages for Bee Product Producers in Bale Bale Regional Sustainable Management Program
Belie T (2009) Honeybee Production and Marketing Systems Constraints and Opportunities in Burie District of Amhara Region Ethiopia Department of Animal Science and Technology School of Graduate Studies Bahir Dar University
Chala K Taye T Kebede D and Tadele T (2012) Opportunities and Challenges of Honey Production in Gomma District of Jimma Zone South-West Ethiopia Journal of Agricultural Extension and Rural Development 4(4) 85ndash91
Desalegn B (2007) Assessment of the Effect of Ant (Dorylus fulvus) on Honeybee Colony (A mellifera) and Their Products in West and South-West Shewa Zones Ethiopia Ethiopian Journal of Animal Production 7(1) 12ndash26
Graduation With Resilience to Achieve Sustainable Development (GRAD) Technical Proposal July 20 2012
Jenkins G Kuo CY and Harberger A (2011) Cost-Benefit Analysis for Investment Decision Queenrsquos University August 2012 edition
Kuo CY (2011) Estimates of the Foreign Exchange Premium and the Premium for Non-Tradable Outlays for Countries in Africa John Deutsch International Department of Economics Queenrsquos University Canada
Shiferaw A Jaleta M Gebremedhin B and Hoekstra D (2010) Increasing Economic Benefit From Apiculture Through Value Chain Development Approach The Case of Alaba Special District Southern Ethiopia IPMS Ethiopia
Cost Benefit Analysis of the GRAD Honey Value Chain November 2012 32
Tadesse B and Phillips D (2007) Ensuring Small-Scale Producers in Ethiopia to Achieve Sustainable and Fair Access to Honey Markets International Development Enterprises (IDE) and Ethiopian Society for Appropriate Technology (ESAT)
Workneh A and Ranjitha P (2011) Beekeeping Subsector Challenges and Constraints in Atsbi Wemberta District of Eastern Zone Tigray Region Ethiopia Journal of Agricultural Extension and Rural Development 3(1) Z8ndashZ12
Yigzaw D Hoekstra D Berhe K Derso T and Mehari Y (2010) Smallholder Apiculture Development in Bure Ethiopia Experiences From IPMS Project Interventions IPMS Ethiopia
Yirga G Koru B Kidane D and Mebrahatu A (2012) Assessment of Beekeeping Practices in Asgede Tsimbla District Northern Ethiopia Absconding Bee Forage and Bee Pests African Journal of Agricultural Research 7(1) 1ndash5
Yirga G and Teferi M (2010) Participatory Technology and Constraints Assessment to Improve the Livelihood of Beekeepers in Tigray Region Northern Ethiopia Biology Department College of Natural and Computational Sciences Mekelle University
Cost Benefit Analysis of the GRAD Honey Value Chain November 2012 33
Cost Benefit Analysis of the GRAD Honey Value Chain November 2012
APPENDIX
Table A The FtF indicators proposed for the monitoring and evaluation of the GRAD project
Results Indicator Target
Overall objective To graduate chronically food-insecure households from food support
Graduation of chronically food-insecure households from food aid by increasing their yearly household income
50000 households that will experience an increase in yearly income of US$365 by year 5
Result 1 Enhanced livelihood options for chronically food-insecure households
45-2 Number of jobs attributed to FtF implementation (RiA) ndashdelete it
Higher is better
3191-3 and 47-4 Prevalence of households with moderate or severe hunger (RiA)
Lower is better
Result 2 Improved community and household resilience
319-16 Prevalence of underweight children under 5 years of age (R)-delete it
Lower is better
319-13 Prevalence of underweight women (R)
Lower is better
319-4 and 3191-4 Prevalence of exclusive breastfeeding of children under 6 months of age (RiA)
Lower is better
319-11 Prevalence of stunted children under 5 years of age (R)
Lower is better
452-14 Number of vulnerable households benefiting directly from USG assistance (S)
Lower is better
Result 3 Strengthened enabling environment to promote scale-up and sustainability
45 Womenrsquos Empowerment in Agriculture Index Score (R)
Higher is better
451-27 and CBLD-5 Percentage of combined key areas of organization capacity among USG direct and indirect local implementing partner levels
Higher is better
34
Cost Benefit Analysis of the GRAD Honey Value Chain November 2012
452-38 Value of new private sector investment in the agriculture sector or food chain leveraged by FtF implementation (RiA)
Higher is better
Table B List of CFs used to make adjustments in the economic analysis for both interventions
Summary of CFs Honey 109 Transportation 084 Labor 100 Modern beehive 085 Transitional beehive 100 Bee colony 100 Queen excluder 085 Wax (ETBkg) 106 Smoker 085 Overall coat 073 Veil 073 Glove 080 Extractor 082 Wax mold 100 Plastic honey container 075 Beehive maintenance 100 Rental value of land 100 Sugar 079
35
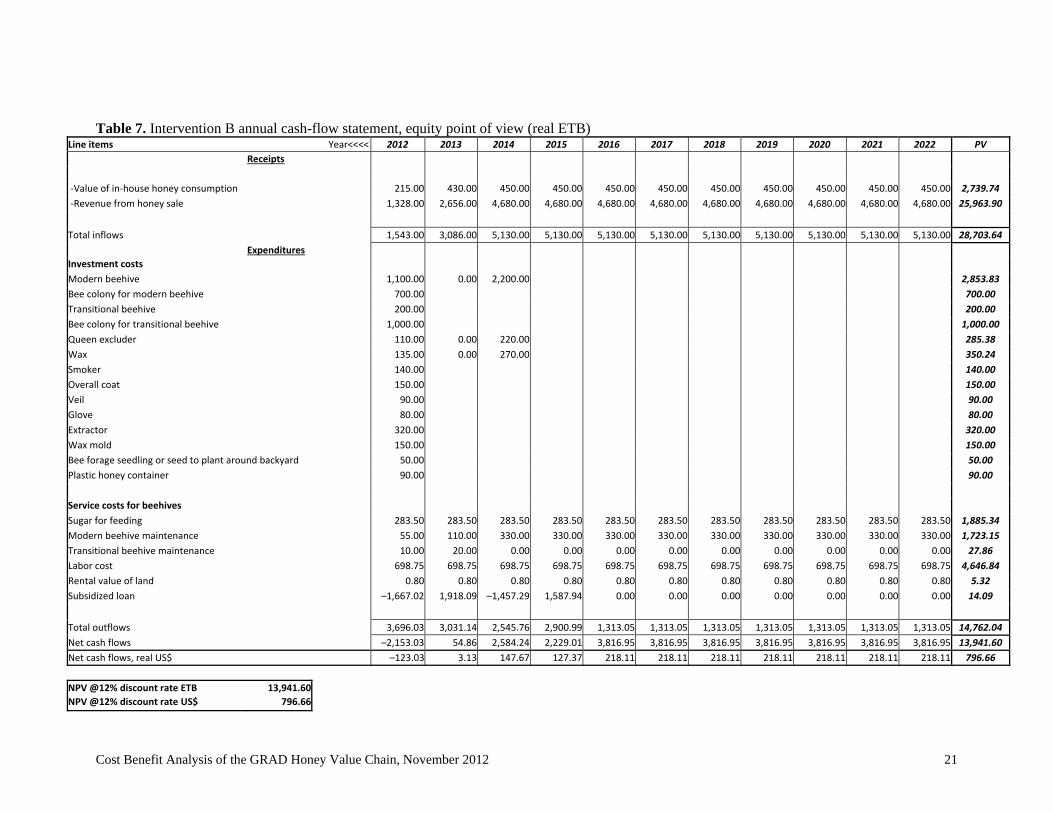
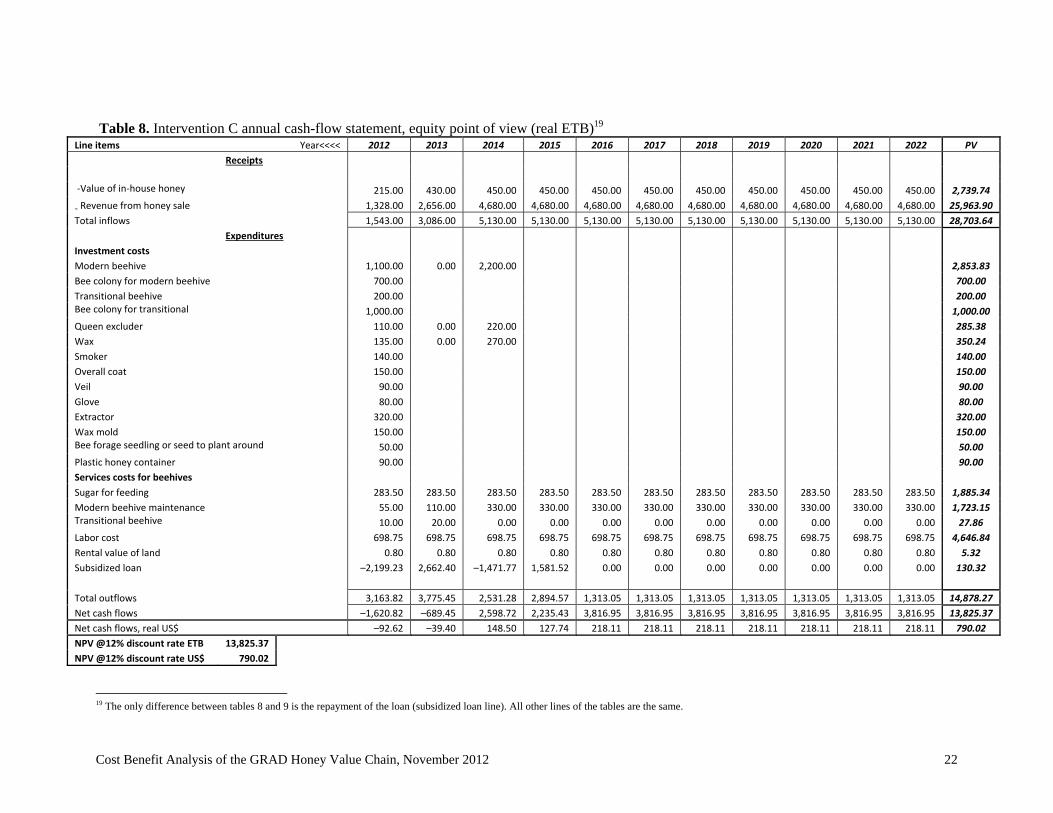
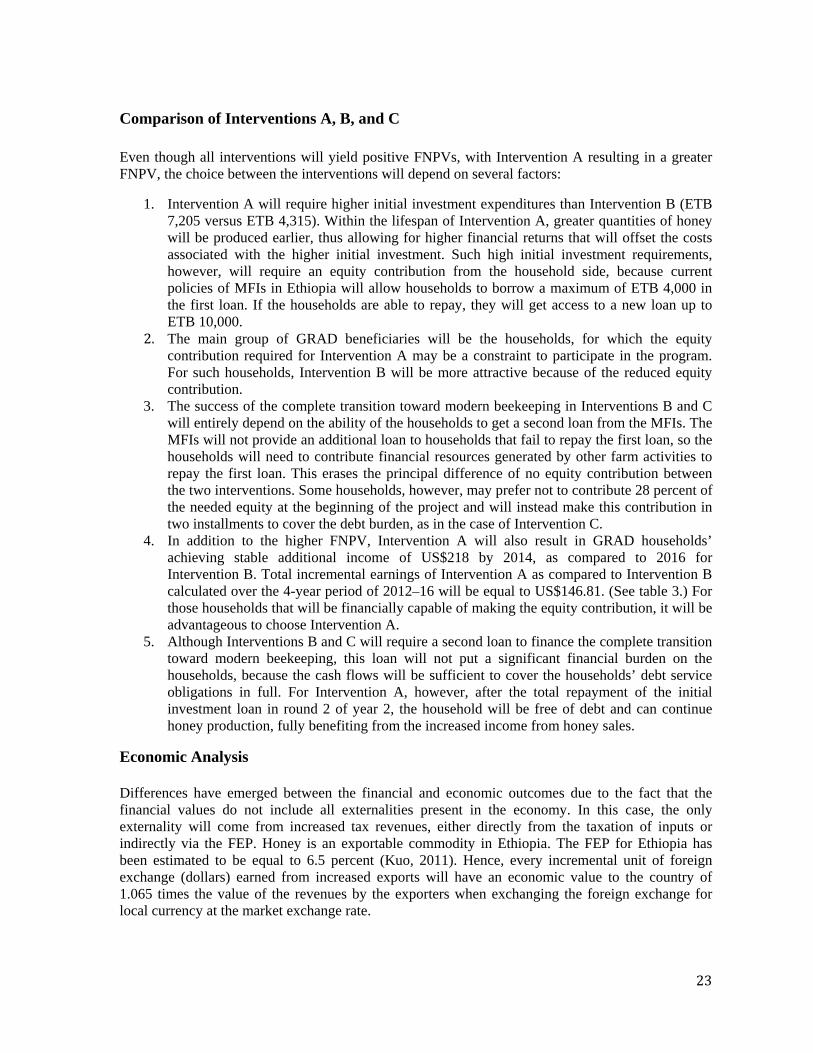
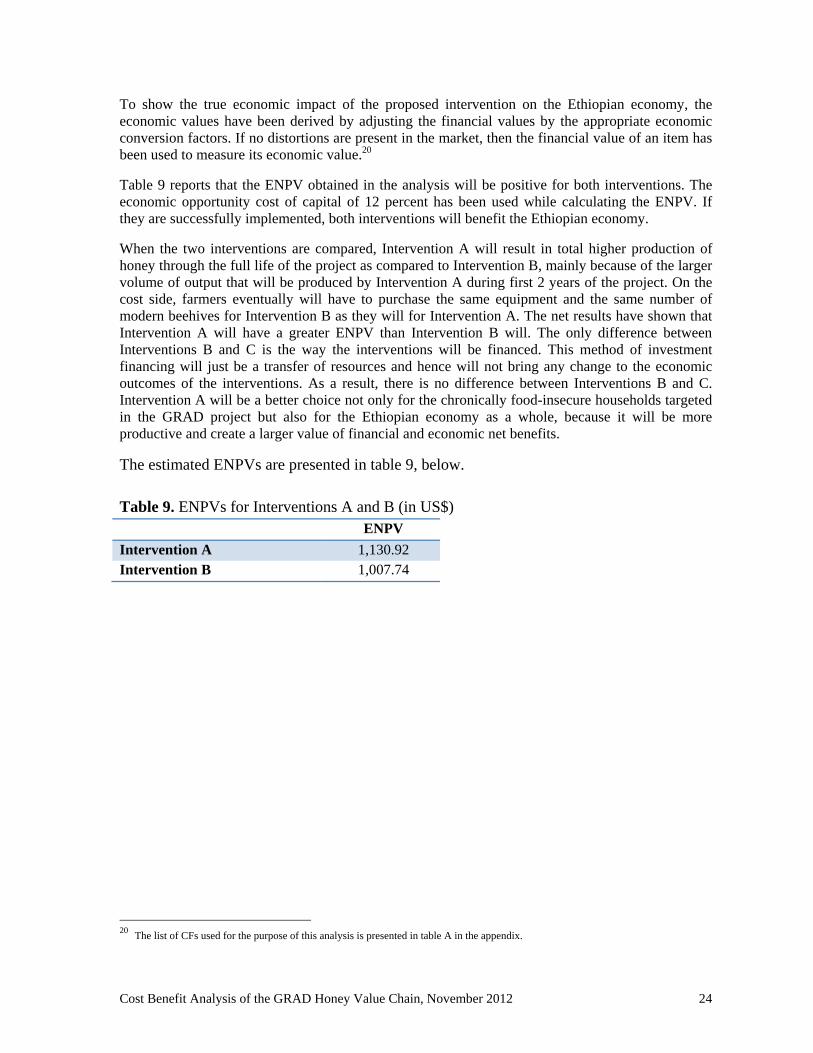
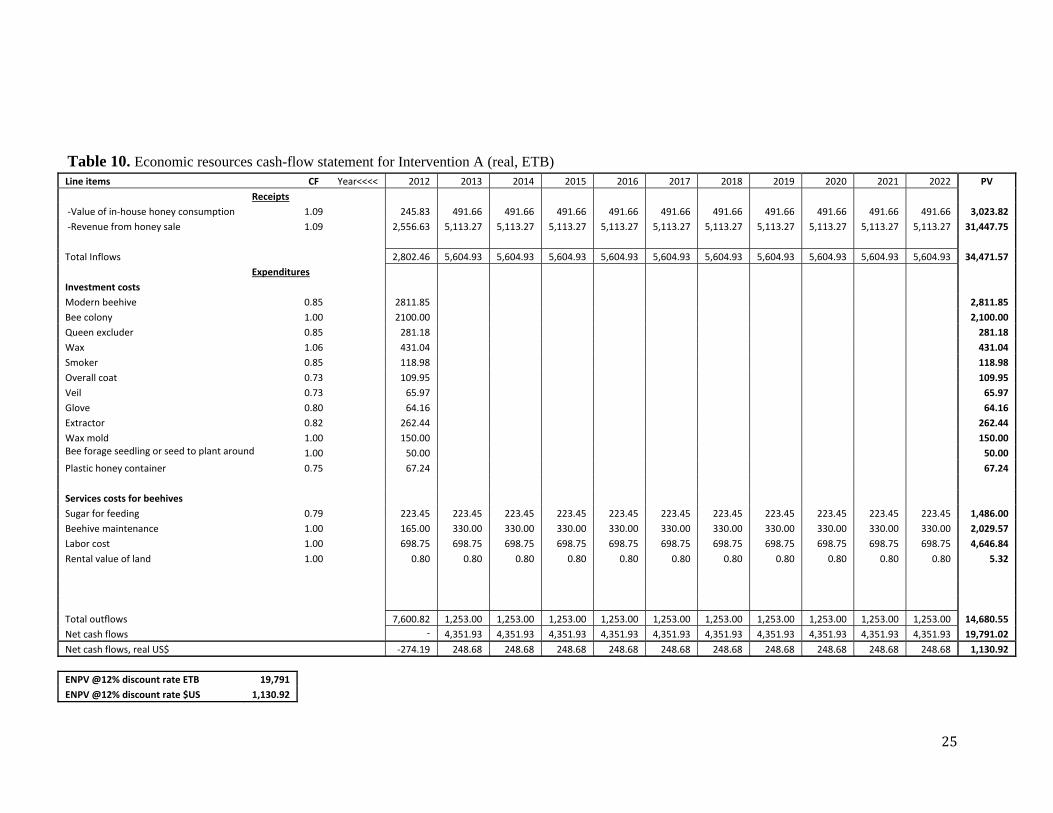
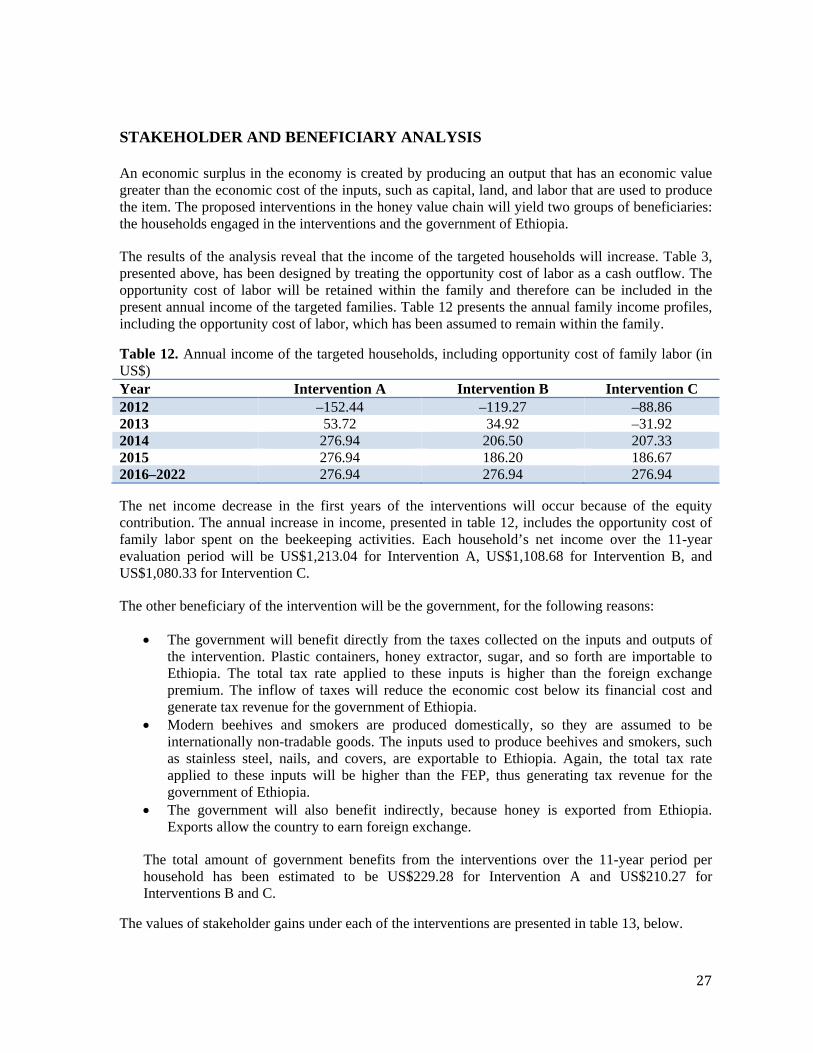

Cost Benefit Analysis of the GRAD Honey Value Chain November 2012
Table 13 Stakeholder and beneficiary impacts of the project (in US$)
Intervention A Intervention B Intervention C
Economic NPV (FNPV + externalities)
113092 100774 100774
Financial NPV (households) 90640 79666 79002 Externalities 22451 21108 21772
o Government 22928 21027 21027 o Financing
contribution ndash477 080 745
The financing contribution will be the amount of the interest and other charges paid on the three loans provided by MFIs over and above a real cost of 12 percent This figure represents a transfer of resources between the households and the MFIs USAIDEthiopia generally negotiates subsidized interest rates for households benefiting from aid programs The negative financing contribution in the case of Intervention A represents a direct subsidy to the targeted households that will be created through the submarket interest rate In the case of the GRAD project the subsidized interest rate will be 15 percent which is 5 percent below the current level of inflation in Ethiopia However the additional fees charged by the MFIs to make them willing to provide loans will more than offset the subsidy content of the interest rate paid on the loan in the case of Interventions B and C
Exact information regarding the number of households that will engage in beekeeping activities does not exist but assuming that 70 percent of the chronically food-insecure households participate (the main group of the GRAD beneficiaries)mdashthat is 70 percent of 50000 households will participate in beekeeping eventually (not necessary in year 1 of the project)mdashit is possible to calculate combined stakeholder and beneficiary impacts of the project Figures are presented in Table 14
Table 14 Combined stakeholder and beneficiary impacts of 35000 households in the project (in thousands US$)
28
Intervention A Intervention B Intervention C Economic NPV (FNPV + externalities)
3958220 3527090 3527090
Financial NPV (households) 3172400 2788310 2765070 Externalities 785785 738780 762020
o Government 802480 735945 735945 o Financing
contribution ndash16695 ndash2800 26075
SENSITIVITY ANALYSIS
A sensitivity analysis for the GRAD honey value chain intervention has been performed using the key variables that will be prone to change and likely to influence the situation of the households engaged in the project These variables include the price and yield of honey as well as their joint impact Details related to this sensitivity analysis are outlined in tables 15 16 17 and 18 below
Cost Benefit Analysis of the GRAD Honey Value Chain November 2012
The Joint Impact of Honey Price and Yield of the FNPV for Intervention A
Because prices and yields of honey are two of the most important factors that will influence the householdsrsquo income it is prudent to consider the possible impacts of changing one of their values in a sensitivity analysis The joint impact of these two variables for Intervention A is presented in table 15 below
Table 15 The joint impact of honey price and yield on the FNPV of households for Intervention A
Yield (in kg) 1200 1500 1700 1900 2100
4300 30850 51891 65918 82823 100599
4500 34924 56943 72174 90640 109417
5000 45108 69575 89659 110471 131558
6000 65477 100066 125232 150535 175839
7000 87799 131558 161079 190600 220121 Price (in ETB)
Table 15 shows the joint impact of the honey price and honey yield on the FNPV under Intervention A (three modern beehives with related tools and training) The scenario for this analysis has assumed that the price of honey will be ETB 45kg and the yield will be 19 kground (This honey price has been based on the assumption that the household will produce yellow honey which fetches lower prices in the domestic market) Under these circumstances the FNPV will be US$90640 But it is safe to assume that given the current high demand and rather low supply of honey in the domestic market the price of yellow honey will increase in the future Therefore the FNPV will likely be higher Even in the worst-case scenario if prices were to drop to ETB 43kg and the yield were to decrease from 19 kground to 12 kground the FNPV will still be positive at US$30850 which indicates very low risk of intervention failure at the household level
Table 16 The joint impact of honey price and yield on the net cash flow of households for Intervention A
Yield (in kg) 1200 1500 1700 1900 2100
4300 10188 14611 17560 20508 23457
4500 11011 15640 18725 21811 24897
5000 13068 18211 21640 25068 28497
6000 17183 23354 27468 31583 35697
7000 21297 28497 33297 38097 42897 Price (in ETB)
Table 16 presents the joint impact of honey yield and price on the net cash flow of the targeted households in 2014 and after when the loan will be repaid and cash flows will be stable Under the baseline scenario the annual net cash flow will be US$21811 If the price were ETB 7000 and the yield were 19 kg the net cash flow will reach US$38097 which is even higher than the targeted income increase of US$36500 Currently however only white honey will be able to fetch such high price levels in the domestic market The findings suggest that households in the areas where bees produce white honey will easily reach the targeted increase in income
29
Cost Benefit Analysis of the GRAD Honey Value Chain November 2012
Table 17 presents the joint impact of honey price and honey yield on the FNPV under Intervention B The FNPV in this case will be US$79666 In the worst-case scenario the FNPV will be lower under Intervention B than under Intervention A but will still be positive at US$22711 which again indicates low risk
Table 17 The joint impact of honey price and yield on the FNPV of households for Intervention B
Yield (in kg) 1200 1500 1700 1900 2100
4300 22721 43762 57790 72936 88169
4500 26636 48655 63725 79666 95644
5000 36422 61069 78781 96534 114429
6000 55995 87637 109059 130542 152025
7000 77009 114429 139493 164557 189621 Price (In ETB) Price (in ETB)
Table 18 describes the joint impact of honey price and yield on the annual net cash flow of the beneficiaries of Intervention B after 2016 when both of the loans will be repaid and cash flows will be stable The baseline scenario will yield a net annual cash flow of US$21811 If the price of white honey were to reach ETB 7000 the net increase in annual income excluding the opportunity cost of family labor will reach US$38097 holding the yield constant This figure is again higher than the targeted increase of US$36500
Table 18 The joint impact of honey price and yield on the FNPV of households for Intervention B
Yield (in kg) 1200 1500 1700 1900 2100
4300 10188 14611 17560 20508 23457
4500 11011 15640 18725 21811 24897
5000 13068 18211 21640 25068 28497
6000 17183 23354 27468 31583 35697
7000 21297 28497 33297 38097 42897 Price (in ETB)
If the nationwide production of honey continue to be limited and with the increasing popularity of good-quality honey the prices may go higher In the best-case scenario for Intervention A if prices were to reach ETB 70kg (more relevant price for white honey) and yields were to reach 21 kground the FNPV will be US$220121 In Intervention B under the same circumstances the FNPV will reach US$189621 The net annual cash flow accruing to the households at this combination of yield and price will provide an additional US$42897 per year after the loan has been paid in 2013 under Intervention A and in 2015 under Intervention B If domestic production could be substantially increased it is likely that the processing costs and perhaps the fob price for honey exports will fall allowing Ethiopian honey to become more competitive in the international market
30
RECOMMENDATIONS
Interventions A and B show a good potential for a substantial increase in income and economic impact for the households targeted by the GRAD project USAID should support their implementation They appear to have the ability to improve the livelihood and food security of the targeted households That said regardless of their potential Interventions A and B on their own may not guarantee an increase of US$365 in the householdsrsquo yearly income as hoped for in the GRAD proposal However when combined with other income-generating activities they may allow households to achieve the additional US$365year Another important benefit of these interventions is the almost nonexistent requirements for land Taking into consideration the very limited land holdings of GRAD beneficiaries and their almost complete reliance on this land as a source of income these interventions are attractive because they will allow households to earn additional income without changing their current land usage An intervention will also allow households to benefit from an additional MFI loan in year 3 after complete repayment of the initial loan for honey production for purchasing more beehives or participating in other proposed GRAD interventions such as haricot beans production Therefore it will be advisable to combine this intervention with another commodity intervention proposed in the GRAD project introducing them as a ldquopackage solutionrdquo to achieve the desired increase in householdsrsquo yearly income
It is debatable whether farmers will be able to repay a free market interest loan at 50 percent interest if they need to borrow their ldquoequityrdquo contributions Taking into consideration that the farmers will first try to repay the free market loan the risk of default on the USAID loan will be high The debt service from the two loans will be so significant that farmers may either refuse to participate in the beekeeping intervention or fail to repay the USAID-backed loan Many GRAD households have no access to free market loans as their current financial situation is such that financial institutions are unwilling to lend money to them Reducing the required amount of money necessary for a down payment might better facilitate the implementation of Intervention A ensuring that the targeted households will be able to join the project and benefit from its outcome
The analysis also reveals that Intervention B which has been designed to eliminate the equity contribution for households that will not be able to take a financial stake in the investment will eventually require the households to contribute other resources to repay their debt services This structure however may be preferred by many farmers because the equity contribution will be divided into two parts thus making it easier for them to find the required financial resources
In summary it is recommended that the burden of the initial down payment (28 percent) that is required from each targeted household to participate in the GRAD intervention in the honey value chain be lessened An ideal financing package will eliminate the down-payment requirements by increasing the size of the USAID-backed loan and increasing the length of the repayment period for Intervention A to 3 years In principal it is a good practice to require households to take a financial stake in the project by forcing them to contribute their own money yet such a system might prevent some farmers from choosing honey production as an intervention
Cost Benefit Analysis of the GRAD Honey Value Chain November 2012 31
REFERENCES
Abebe A (2009) Market Chain Analysis of Honey Production in Atsbi Wemberta District Eastern Zone of Tigray National Regional State Department of Agricultural Economics School of Graduate Studies Haramaya University
Agonafir J (2005) Strategic Intervention Plan on Honey and Beeswax Value Chains SNV Support to Business Organizations and Their Access to Market (BOAM)
Alemseged T and Yildiz N (2008) Beekeeping and Honey Production in the Tigray Region Ethiopia African Services Committee
Alemtsehay T (2011) Seasonal Availability of Common Bee Flora in Relation to Land Use and Colony Performance in Gergera Watershed Atsbi Wembwrta District Eastern Tigray Ethiopia Master Thesis Hawassa University
Anand S and Sisay G (2011) Engaging Smallholders in Value Chains Creating New Opportunities for Beekeepers in Ethiopia Programme Insights
APM Consul PLC (2008) A Study on Private Sector Linkages for Bee Product Producers in Bale Bale Regional Sustainable Management Program
Belie T (2009) Honeybee Production and Marketing Systems Constraints and Opportunities in Burie District of Amhara Region Ethiopia Department of Animal Science and Technology School of Graduate Studies Bahir Dar University
Chala K Taye T Kebede D and Tadele T (2012) Opportunities and Challenges of Honey Production in Gomma District of Jimma Zone South-West Ethiopia Journal of Agricultural Extension and Rural Development 4(4) 85ndash91
Desalegn B (2007) Assessment of the Effect of Ant (Dorylus fulvus) on Honeybee Colony (A mellifera) and Their Products in West and South-West Shewa Zones Ethiopia Ethiopian Journal of Animal Production 7(1) 12ndash26
Graduation With Resilience to Achieve Sustainable Development (GRAD) Technical Proposal July 20 2012
Jenkins G Kuo CY and Harberger A (2011) Cost-Benefit Analysis for Investment Decision Queenrsquos University August 2012 edition
Kuo CY (2011) Estimates of the Foreign Exchange Premium and the Premium for Non-Tradable Outlays for Countries in Africa John Deutsch International Department of Economics Queenrsquos University Canada
Shiferaw A Jaleta M Gebremedhin B and Hoekstra D (2010) Increasing Economic Benefit From Apiculture Through Value Chain Development Approach The Case of Alaba Special District Southern Ethiopia IPMS Ethiopia
Cost Benefit Analysis of the GRAD Honey Value Chain November 2012 32
Tadesse B and Phillips D (2007) Ensuring Small-Scale Producers in Ethiopia to Achieve Sustainable and Fair Access to Honey Markets International Development Enterprises (IDE) and Ethiopian Society for Appropriate Technology (ESAT)
Workneh A and Ranjitha P (2011) Beekeeping Subsector Challenges and Constraints in Atsbi Wemberta District of Eastern Zone Tigray Region Ethiopia Journal of Agricultural Extension and Rural Development 3(1) Z8ndashZ12
Yigzaw D Hoekstra D Berhe K Derso T and Mehari Y (2010) Smallholder Apiculture Development in Bure Ethiopia Experiences From IPMS Project Interventions IPMS Ethiopia
Yirga G Koru B Kidane D and Mebrahatu A (2012) Assessment of Beekeeping Practices in Asgede Tsimbla District Northern Ethiopia Absconding Bee Forage and Bee Pests African Journal of Agricultural Research 7(1) 1ndash5
Yirga G and Teferi M (2010) Participatory Technology and Constraints Assessment to Improve the Livelihood of Beekeepers in Tigray Region Northern Ethiopia Biology Department College of Natural and Computational Sciences Mekelle University
Cost Benefit Analysis of the GRAD Honey Value Chain November 2012 33
Cost Benefit Analysis of the GRAD Honey Value Chain November 2012
APPENDIX
Table A The FtF indicators proposed for the monitoring and evaluation of the GRAD project
Results Indicator Target
Overall objective To graduate chronically food-insecure households from food support
Graduation of chronically food-insecure households from food aid by increasing their yearly household income
50000 households that will experience an increase in yearly income of US$365 by year 5
Result 1 Enhanced livelihood options for chronically food-insecure households
45-2 Number of jobs attributed to FtF implementation (RiA) ndashdelete it
Higher is better
3191-3 and 47-4 Prevalence of households with moderate or severe hunger (RiA)
Lower is better
Result 2 Improved community and household resilience
319-16 Prevalence of underweight children under 5 years of age (R)-delete it
Lower is better
319-13 Prevalence of underweight women (R)
Lower is better
319-4 and 3191-4 Prevalence of exclusive breastfeeding of children under 6 months of age (RiA)
Lower is better
319-11 Prevalence of stunted children under 5 years of age (R)
Lower is better
452-14 Number of vulnerable households benefiting directly from USG assistance (S)
Lower is better
Result 3 Strengthened enabling environment to promote scale-up and sustainability
45 Womenrsquos Empowerment in Agriculture Index Score (R)
Higher is better
451-27 and CBLD-5 Percentage of combined key areas of organization capacity among USG direct and indirect local implementing partner levels
Higher is better
34
Cost Benefit Analysis of the GRAD Honey Value Chain November 2012
452-38 Value of new private sector investment in the agriculture sector or food chain leveraged by FtF implementation (RiA)
Higher is better
Table B List of CFs used to make adjustments in the economic analysis for both interventions
Summary of CFs Honey 109 Transportation 084 Labor 100 Modern beehive 085 Transitional beehive 100 Bee colony 100 Queen excluder 085 Wax (ETBkg) 106 Smoker 085 Overall coat 073 Veil 073 Glove 080 Extractor 082 Wax mold 100 Plastic honey container 075 Beehive maintenance 100 Rental value of land 100 Sugar 079
35
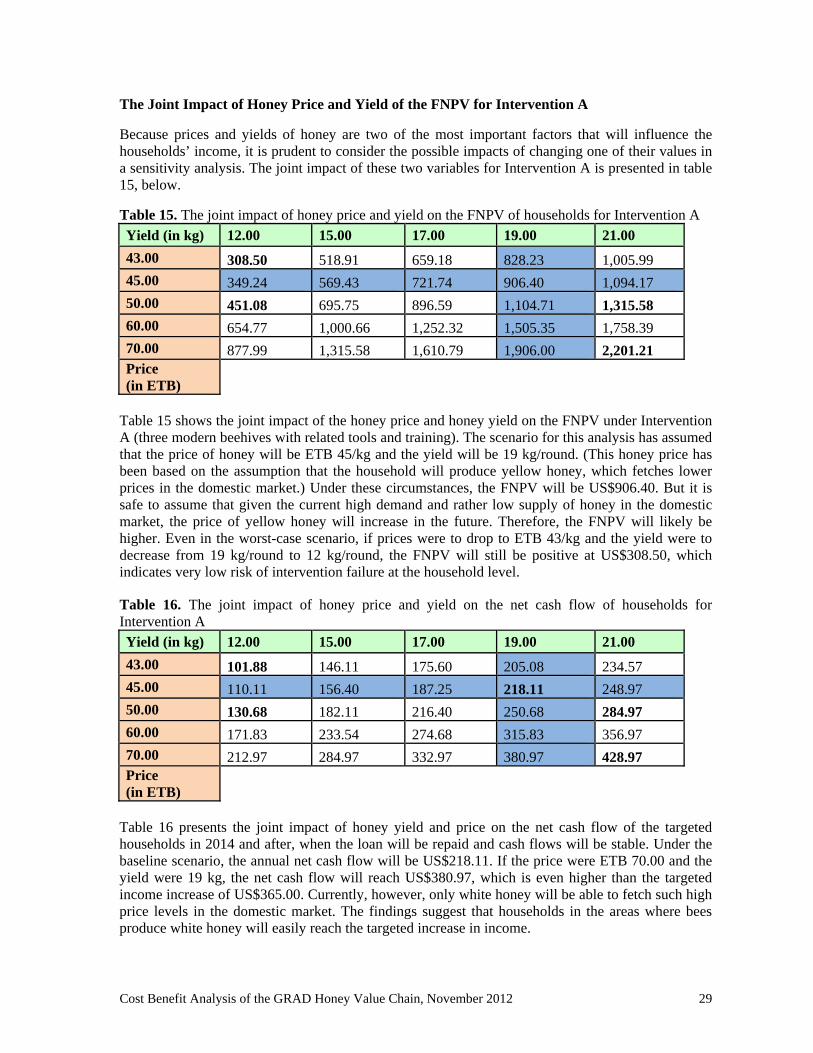
Cost Benefit Analysis of the GRAD Honey Value Chain November 2012
The Joint Impact of Honey Price and Yield of the FNPV for Intervention A
Because prices and yields of honey are two of the most important factors that will influence the householdsrsquo income it is prudent to consider the possible impacts of changing one of their values in a sensitivity analysis The joint impact of these two variables for Intervention A is presented in table 15 below
Table 15 The joint impact of honey price and yield on the FNPV of households for Intervention A
Yield (in kg) 1200 1500 1700 1900 2100
4300 30850 51891 65918 82823 100599
4500 34924 56943 72174 90640 109417
5000 45108 69575 89659 110471 131558
6000 65477 100066 125232 150535 175839
7000 87799 131558 161079 190600 220121 Price (in ETB)
Table 15 shows the joint impact of the honey price and honey yield on the FNPV under Intervention A (three modern beehives with related tools and training) The scenario for this analysis has assumed that the price of honey will be ETB 45kg and the yield will be 19 kground (This honey price has been based on the assumption that the household will produce yellow honey which fetches lower prices in the domestic market) Under these circumstances the FNPV will be US$90640 But it is safe to assume that given the current high demand and rather low supply of honey in the domestic market the price of yellow honey will increase in the future Therefore the FNPV will likely be higher Even in the worst-case scenario if prices were to drop to ETB 43kg and the yield were to decrease from 19 kground to 12 kground the FNPV will still be positive at US$30850 which indicates very low risk of intervention failure at the household level
Table 16 The joint impact of honey price and yield on the net cash flow of households for Intervention A
Yield (in kg) 1200 1500 1700 1900 2100
4300 10188 14611 17560 20508 23457
4500 11011 15640 18725 21811 24897
5000 13068 18211 21640 25068 28497
6000 17183 23354 27468 31583 35697
7000 21297 28497 33297 38097 42897 Price (in ETB)
Table 16 presents the joint impact of honey yield and price on the net cash flow of the targeted households in 2014 and after when the loan will be repaid and cash flows will be stable Under the baseline scenario the annual net cash flow will be US$21811 If the price were ETB 7000 and the yield were 19 kg the net cash flow will reach US$38097 which is even higher than the targeted income increase of US$36500 Currently however only white honey will be able to fetch such high price levels in the domestic market The findings suggest that households in the areas where bees produce white honey will easily reach the targeted increase in income
29
Cost Benefit Analysis of the GRAD Honey Value Chain November 2012
Table 17 presents the joint impact of honey price and honey yield on the FNPV under Intervention B The FNPV in this case will be US$79666 In the worst-case scenario the FNPV will be lower under Intervention B than under Intervention A but will still be positive at US$22711 which again indicates low risk
Table 17 The joint impact of honey price and yield on the FNPV of households for Intervention B
Yield (in kg) 1200 1500 1700 1900 2100
4300 22721 43762 57790 72936 88169
4500 26636 48655 63725 79666 95644
5000 36422 61069 78781 96534 114429
6000 55995 87637 109059 130542 152025
7000 77009 114429 139493 164557 189621 Price (In ETB) Price (in ETB)
Table 18 describes the joint impact of honey price and yield on the annual net cash flow of the beneficiaries of Intervention B after 2016 when both of the loans will be repaid and cash flows will be stable The baseline scenario will yield a net annual cash flow of US$21811 If the price of white honey were to reach ETB 7000 the net increase in annual income excluding the opportunity cost of family labor will reach US$38097 holding the yield constant This figure is again higher than the targeted increase of US$36500
Table 18 The joint impact of honey price and yield on the FNPV of households for Intervention B
Yield (in kg) 1200 1500 1700 1900 2100
4300 10188 14611 17560 20508 23457
4500 11011 15640 18725 21811 24897
5000 13068 18211 21640 25068 28497
6000 17183 23354 27468 31583 35697
7000 21297 28497 33297 38097 42897 Price (in ETB)
If the nationwide production of honey continue to be limited and with the increasing popularity of good-quality honey the prices may go higher In the best-case scenario for Intervention A if prices were to reach ETB 70kg (more relevant price for white honey) and yields were to reach 21 kground the FNPV will be US$220121 In Intervention B under the same circumstances the FNPV will reach US$189621 The net annual cash flow accruing to the households at this combination of yield and price will provide an additional US$42897 per year after the loan has been paid in 2013 under Intervention A and in 2015 under Intervention B If domestic production could be substantially increased it is likely that the processing costs and perhaps the fob price for honey exports will fall allowing Ethiopian honey to become more competitive in the international market
30
RECOMMENDATIONS
Interventions A and B show a good potential for a substantial increase in income and economic impact for the households targeted by the GRAD project USAID should support their implementation They appear to have the ability to improve the livelihood and food security of the targeted households That said regardless of their potential Interventions A and B on their own may not guarantee an increase of US$365 in the householdsrsquo yearly income as hoped for in the GRAD proposal However when combined with other income-generating activities they may allow households to achieve the additional US$365year Another important benefit of these interventions is the almost nonexistent requirements for land Taking into consideration the very limited land holdings of GRAD beneficiaries and their almost complete reliance on this land as a source of income these interventions are attractive because they will allow households to earn additional income without changing their current land usage An intervention will also allow households to benefit from an additional MFI loan in year 3 after complete repayment of the initial loan for honey production for purchasing more beehives or participating in other proposed GRAD interventions such as haricot beans production Therefore it will be advisable to combine this intervention with another commodity intervention proposed in the GRAD project introducing them as a ldquopackage solutionrdquo to achieve the desired increase in householdsrsquo yearly income
It is debatable whether farmers will be able to repay a free market interest loan at 50 percent interest if they need to borrow their ldquoequityrdquo contributions Taking into consideration that the farmers will first try to repay the free market loan the risk of default on the USAID loan will be high The debt service from the two loans will be so significant that farmers may either refuse to participate in the beekeeping intervention or fail to repay the USAID-backed loan Many GRAD households have no access to free market loans as their current financial situation is such that financial institutions are unwilling to lend money to them Reducing the required amount of money necessary for a down payment might better facilitate the implementation of Intervention A ensuring that the targeted households will be able to join the project and benefit from its outcome
The analysis also reveals that Intervention B which has been designed to eliminate the equity contribution for households that will not be able to take a financial stake in the investment will eventually require the households to contribute other resources to repay their debt services This structure however may be preferred by many farmers because the equity contribution will be divided into two parts thus making it easier for them to find the required financial resources
In summary it is recommended that the burden of the initial down payment (28 percent) that is required from each targeted household to participate in the GRAD intervention in the honey value chain be lessened An ideal financing package will eliminate the down-payment requirements by increasing the size of the USAID-backed loan and increasing the length of the repayment period for Intervention A to 3 years In principal it is a good practice to require households to take a financial stake in the project by forcing them to contribute their own money yet such a system might prevent some farmers from choosing honey production as an intervention
Cost Benefit Analysis of the GRAD Honey Value Chain November 2012 31
REFERENCES
Abebe A (2009) Market Chain Analysis of Honey Production in Atsbi Wemberta District Eastern Zone of Tigray National Regional State Department of Agricultural Economics School of Graduate Studies Haramaya University
Agonafir J (2005) Strategic Intervention Plan on Honey and Beeswax Value Chains SNV Support to Business Organizations and Their Access to Market (BOAM)
Alemseged T and Yildiz N (2008) Beekeeping and Honey Production in the Tigray Region Ethiopia African Services Committee
Alemtsehay T (2011) Seasonal Availability of Common Bee Flora in Relation to Land Use and Colony Performance in Gergera Watershed Atsbi Wembwrta District Eastern Tigray Ethiopia Master Thesis Hawassa University
Anand S and Sisay G (2011) Engaging Smallholders in Value Chains Creating New Opportunities for Beekeepers in Ethiopia Programme Insights
APM Consul PLC (2008) A Study on Private Sector Linkages for Bee Product Producers in Bale Bale Regional Sustainable Management Program
Belie T (2009) Honeybee Production and Marketing Systems Constraints and Opportunities in Burie District of Amhara Region Ethiopia Department of Animal Science and Technology School of Graduate Studies Bahir Dar University
Chala K Taye T Kebede D and Tadele T (2012) Opportunities and Challenges of Honey Production in Gomma District of Jimma Zone South-West Ethiopia Journal of Agricultural Extension and Rural Development 4(4) 85ndash91
Desalegn B (2007) Assessment of the Effect of Ant (Dorylus fulvus) on Honeybee Colony (A mellifera) and Their Products in West and South-West Shewa Zones Ethiopia Ethiopian Journal of Animal Production 7(1) 12ndash26
Graduation With Resilience to Achieve Sustainable Development (GRAD) Technical Proposal July 20 2012
Jenkins G Kuo CY and Harberger A (2011) Cost-Benefit Analysis for Investment Decision Queenrsquos University August 2012 edition
Kuo CY (2011) Estimates of the Foreign Exchange Premium and the Premium for Non-Tradable Outlays for Countries in Africa John Deutsch International Department of Economics Queenrsquos University Canada
Shiferaw A Jaleta M Gebremedhin B and Hoekstra D (2010) Increasing Economic Benefit From Apiculture Through Value Chain Development Approach The Case of Alaba Special District Southern Ethiopia IPMS Ethiopia
Cost Benefit Analysis of the GRAD Honey Value Chain November 2012 32
Tadesse B and Phillips D (2007) Ensuring Small-Scale Producers in Ethiopia to Achieve Sustainable and Fair Access to Honey Markets International Development Enterprises (IDE) and Ethiopian Society for Appropriate Technology (ESAT)
Workneh A and Ranjitha P (2011) Beekeeping Subsector Challenges and Constraints in Atsbi Wemberta District of Eastern Zone Tigray Region Ethiopia Journal of Agricultural Extension and Rural Development 3(1) Z8ndashZ12
Yigzaw D Hoekstra D Berhe K Derso T and Mehari Y (2010) Smallholder Apiculture Development in Bure Ethiopia Experiences From IPMS Project Interventions IPMS Ethiopia
Yirga G Koru B Kidane D and Mebrahatu A (2012) Assessment of Beekeeping Practices in Asgede Tsimbla District Northern Ethiopia Absconding Bee Forage and Bee Pests African Journal of Agricultural Research 7(1) 1ndash5
Yirga G and Teferi M (2010) Participatory Technology and Constraints Assessment to Improve the Livelihood of Beekeepers in Tigray Region Northern Ethiopia Biology Department College of Natural and Computational Sciences Mekelle University
Cost Benefit Analysis of the GRAD Honey Value Chain November 2012 33
Cost Benefit Analysis of the GRAD Honey Value Chain November 2012
APPENDIX
Table A The FtF indicators proposed for the monitoring and evaluation of the GRAD project
Results Indicator Target
Overall objective To graduate chronically food-insecure households from food support
Graduation of chronically food-insecure households from food aid by increasing their yearly household income
50000 households that will experience an increase in yearly income of US$365 by year 5
Result 1 Enhanced livelihood options for chronically food-insecure households
45-2 Number of jobs attributed to FtF implementation (RiA) ndashdelete it
Higher is better
3191-3 and 47-4 Prevalence of households with moderate or severe hunger (RiA)
Lower is better
Result 2 Improved community and household resilience
319-16 Prevalence of underweight children under 5 years of age (R)-delete it
Lower is better
319-13 Prevalence of underweight women (R)
Lower is better
319-4 and 3191-4 Prevalence of exclusive breastfeeding of children under 6 months of age (RiA)
Lower is better
319-11 Prevalence of stunted children under 5 years of age (R)
Lower is better
452-14 Number of vulnerable households benefiting directly from USG assistance (S)
Lower is better
Result 3 Strengthened enabling environment to promote scale-up and sustainability
45 Womenrsquos Empowerment in Agriculture Index Score (R)
Higher is better
451-27 and CBLD-5 Percentage of combined key areas of organization capacity among USG direct and indirect local implementing partner levels
Higher is better
34
Cost Benefit Analysis of the GRAD Honey Value Chain November 2012
452-38 Value of new private sector investment in the agriculture sector or food chain leveraged by FtF implementation (RiA)
Higher is better
Table B List of CFs used to make adjustments in the economic analysis for both interventions
Summary of CFs Honey 109 Transportation 084 Labor 100 Modern beehive 085 Transitional beehive 100 Bee colony 100 Queen excluder 085 Wax (ETBkg) 106 Smoker 085 Overall coat 073 Veil 073 Glove 080 Extractor 082 Wax mold 100 Plastic honey container 075 Beehive maintenance 100 Rental value of land 100 Sugar 079
35
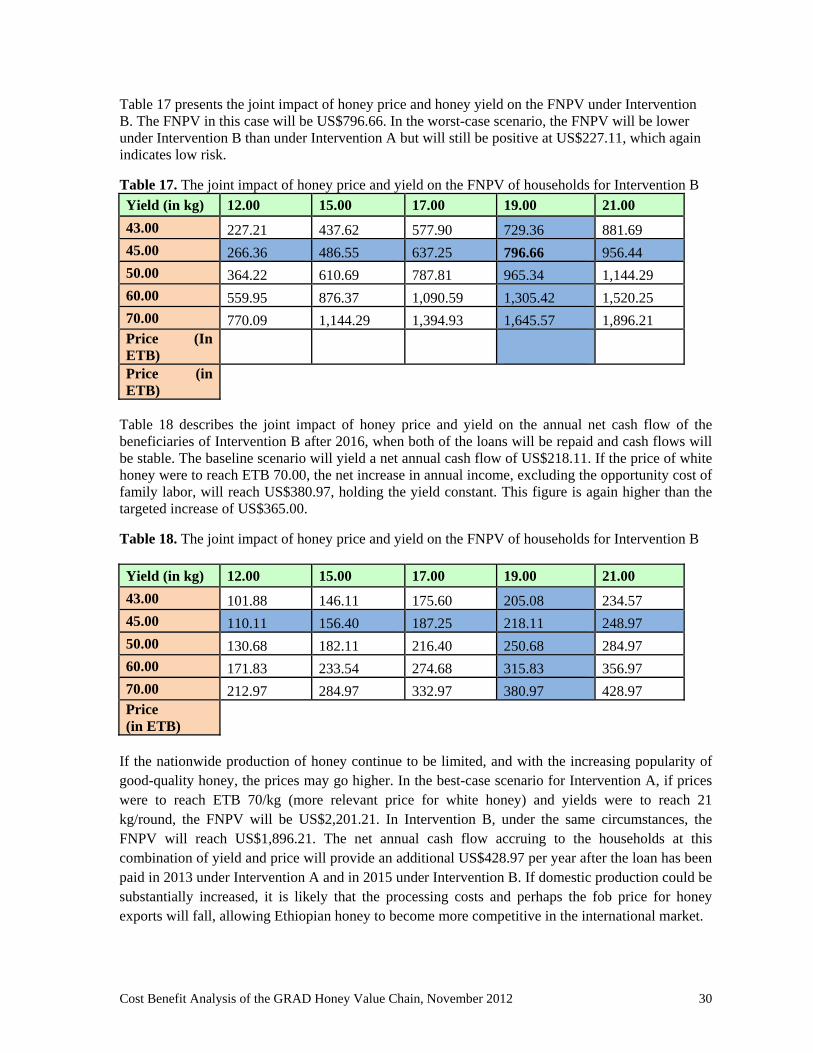
Cost Benefit Analysis of the GRAD Honey Value Chain November 2012
Table 17 presents the joint impact of honey price and honey yield on the FNPV under Intervention B The FNPV in this case will be US$79666 In the worst-case scenario the FNPV will be lower under Intervention B than under Intervention A but will still be positive at US$22711 which again indicates low risk
Table 17 The joint impact of honey price and yield on the FNPV of households for Intervention B
Yield (in kg) 1200 1500 1700 1900 2100
4300 22721 43762 57790 72936 88169
4500 26636 48655 63725 79666 95644
5000 36422 61069 78781 96534 114429
6000 55995 87637 109059 130542 152025
7000 77009 114429 139493 164557 189621 Price (In ETB) Price (in ETB)
Table 18 describes the joint impact of honey price and yield on the annual net cash flow of the beneficiaries of Intervention B after 2016 when both of the loans will be repaid and cash flows will be stable The baseline scenario will yield a net annual cash flow of US$21811 If the price of white honey were to reach ETB 7000 the net increase in annual income excluding the opportunity cost of family labor will reach US$38097 holding the yield constant This figure is again higher than the targeted increase of US$36500
Table 18 The joint impact of honey price and yield on the FNPV of households for Intervention B
Yield (in kg) 1200 1500 1700 1900 2100
4300 10188 14611 17560 20508 23457
4500 11011 15640 18725 21811 24897
5000 13068 18211 21640 25068 28497
6000 17183 23354 27468 31583 35697
7000 21297 28497 33297 38097 42897 Price (in ETB)
If the nationwide production of honey continue to be limited and with the increasing popularity of good-quality honey the prices may go higher In the best-case scenario for Intervention A if prices were to reach ETB 70kg (more relevant price for white honey) and yields were to reach 21 kground the FNPV will be US$220121 In Intervention B under the same circumstances the FNPV will reach US$189621 The net annual cash flow accruing to the households at this combination of yield and price will provide an additional US$42897 per year after the loan has been paid in 2013 under Intervention A and in 2015 under Intervention B If domestic production could be substantially increased it is likely that the processing costs and perhaps the fob price for honey exports will fall allowing Ethiopian honey to become more competitive in the international market
30
RECOMMENDATIONS
Interventions A and B show a good potential for a substantial increase in income and economic impact for the households targeted by the GRAD project USAID should support their implementation They appear to have the ability to improve the livelihood and food security of the targeted households That said regardless of their potential Interventions A and B on their own may not guarantee an increase of US$365 in the householdsrsquo yearly income as hoped for in the GRAD proposal However when combined with other income-generating activities they may allow households to achieve the additional US$365year Another important benefit of these interventions is the almost nonexistent requirements for land Taking into consideration the very limited land holdings of GRAD beneficiaries and their almost complete reliance on this land as a source of income these interventions are attractive because they will allow households to earn additional income without changing their current land usage An intervention will also allow households to benefit from an additional MFI loan in year 3 after complete repayment of the initial loan for honey production for purchasing more beehives or participating in other proposed GRAD interventions such as haricot beans production Therefore it will be advisable to combine this intervention with another commodity intervention proposed in the GRAD project introducing them as a ldquopackage solutionrdquo to achieve the desired increase in householdsrsquo yearly income
It is debatable whether farmers will be able to repay a free market interest loan at 50 percent interest if they need to borrow their ldquoequityrdquo contributions Taking into consideration that the farmers will first try to repay the free market loan the risk of default on the USAID loan will be high The debt service from the two loans will be so significant that farmers may either refuse to participate in the beekeeping intervention or fail to repay the USAID-backed loan Many GRAD households have no access to free market loans as their current financial situation is such that financial institutions are unwilling to lend money to them Reducing the required amount of money necessary for a down payment might better facilitate the implementation of Intervention A ensuring that the targeted households will be able to join the project and benefit from its outcome
The analysis also reveals that Intervention B which has been designed to eliminate the equity contribution for households that will not be able to take a financial stake in the investment will eventually require the households to contribute other resources to repay their debt services This structure however may be preferred by many farmers because the equity contribution will be divided into two parts thus making it easier for them to find the required financial resources
In summary it is recommended that the burden of the initial down payment (28 percent) that is required from each targeted household to participate in the GRAD intervention in the honey value chain be lessened An ideal financing package will eliminate the down-payment requirements by increasing the size of the USAID-backed loan and increasing the length of the repayment period for Intervention A to 3 years In principal it is a good practice to require households to take a financial stake in the project by forcing them to contribute their own money yet such a system might prevent some farmers from choosing honey production as an intervention
Cost Benefit Analysis of the GRAD Honey Value Chain November 2012 31
REFERENCES
Abebe A (2009) Market Chain Analysis of Honey Production in Atsbi Wemberta District Eastern Zone of Tigray National Regional State Department of Agricultural Economics School of Graduate Studies Haramaya University
Agonafir J (2005) Strategic Intervention Plan on Honey and Beeswax Value Chains SNV Support to Business Organizations and Their Access to Market (BOAM)
Alemseged T and Yildiz N (2008) Beekeeping and Honey Production in the Tigray Region Ethiopia African Services Committee
Alemtsehay T (2011) Seasonal Availability of Common Bee Flora in Relation to Land Use and Colony Performance in Gergera Watershed Atsbi Wembwrta District Eastern Tigray Ethiopia Master Thesis Hawassa University
Anand S and Sisay G (2011) Engaging Smallholders in Value Chains Creating New Opportunities for Beekeepers in Ethiopia Programme Insights
APM Consul PLC (2008) A Study on Private Sector Linkages for Bee Product Producers in Bale Bale Regional Sustainable Management Program
Belie T (2009) Honeybee Production and Marketing Systems Constraints and Opportunities in Burie District of Amhara Region Ethiopia Department of Animal Science and Technology School of Graduate Studies Bahir Dar University
Chala K Taye T Kebede D and Tadele T (2012) Opportunities and Challenges of Honey Production in Gomma District of Jimma Zone South-West Ethiopia Journal of Agricultural Extension and Rural Development 4(4) 85ndash91
Desalegn B (2007) Assessment of the Effect of Ant (Dorylus fulvus) on Honeybee Colony (A mellifera) and Their Products in West and South-West Shewa Zones Ethiopia Ethiopian Journal of Animal Production 7(1) 12ndash26
Graduation With Resilience to Achieve Sustainable Development (GRAD) Technical Proposal July 20 2012
Jenkins G Kuo CY and Harberger A (2011) Cost-Benefit Analysis for Investment Decision Queenrsquos University August 2012 edition
Kuo CY (2011) Estimates of the Foreign Exchange Premium and the Premium for Non-Tradable Outlays for Countries in Africa John Deutsch International Department of Economics Queenrsquos University Canada
Shiferaw A Jaleta M Gebremedhin B and Hoekstra D (2010) Increasing Economic Benefit From Apiculture Through Value Chain Development Approach The Case of Alaba Special District Southern Ethiopia IPMS Ethiopia
Cost Benefit Analysis of the GRAD Honey Value Chain November 2012 32
Tadesse B and Phillips D (2007) Ensuring Small-Scale Producers in Ethiopia to Achieve Sustainable and Fair Access to Honey Markets International Development Enterprises (IDE) and Ethiopian Society for Appropriate Technology (ESAT)
Workneh A and Ranjitha P (2011) Beekeeping Subsector Challenges and Constraints in Atsbi Wemberta District of Eastern Zone Tigray Region Ethiopia Journal of Agricultural Extension and Rural Development 3(1) Z8ndashZ12
Yigzaw D Hoekstra D Berhe K Derso T and Mehari Y (2010) Smallholder Apiculture Development in Bure Ethiopia Experiences From IPMS Project Interventions IPMS Ethiopia
Yirga G Koru B Kidane D and Mebrahatu A (2012) Assessment of Beekeeping Practices in Asgede Tsimbla District Northern Ethiopia Absconding Bee Forage and Bee Pests African Journal of Agricultural Research 7(1) 1ndash5
Yirga G and Teferi M (2010) Participatory Technology and Constraints Assessment to Improve the Livelihood of Beekeepers in Tigray Region Northern Ethiopia Biology Department College of Natural and Computational Sciences Mekelle University
Cost Benefit Analysis of the GRAD Honey Value Chain November 2012 33
Cost Benefit Analysis of the GRAD Honey Value Chain November 2012
APPENDIX
Table A The FtF indicators proposed for the monitoring and evaluation of the GRAD project
Results Indicator Target
Overall objective To graduate chronically food-insecure households from food support
Graduation of chronically food-insecure households from food aid by increasing their yearly household income
50000 households that will experience an increase in yearly income of US$365 by year 5
Result 1 Enhanced livelihood options for chronically food-insecure households
45-2 Number of jobs attributed to FtF implementation (RiA) ndashdelete it
Higher is better
3191-3 and 47-4 Prevalence of households with moderate or severe hunger (RiA)
Lower is better
Result 2 Improved community and household resilience
319-16 Prevalence of underweight children under 5 years of age (R)-delete it
Lower is better
319-13 Prevalence of underweight women (R)
Lower is better
319-4 and 3191-4 Prevalence of exclusive breastfeeding of children under 6 months of age (RiA)
Lower is better
319-11 Prevalence of stunted children under 5 years of age (R)
Lower is better
452-14 Number of vulnerable households benefiting directly from USG assistance (S)
Lower is better
Result 3 Strengthened enabling environment to promote scale-up and sustainability
45 Womenrsquos Empowerment in Agriculture Index Score (R)
Higher is better
451-27 and CBLD-5 Percentage of combined key areas of organization capacity among USG direct and indirect local implementing partner levels
Higher is better
34
Cost Benefit Analysis of the GRAD Honey Value Chain November 2012
452-38 Value of new private sector investment in the agriculture sector or food chain leveraged by FtF implementation (RiA)
Higher is better
Table B List of CFs used to make adjustments in the economic analysis for both interventions
Summary of CFs Honey 109 Transportation 084 Labor 100 Modern beehive 085 Transitional beehive 100 Bee colony 100 Queen excluder 085 Wax (ETBkg) 106 Smoker 085 Overall coat 073 Veil 073 Glove 080 Extractor 082 Wax mold 100 Plastic honey container 075 Beehive maintenance 100 Rental value of land 100 Sugar 079
35

Cost Benefit Analysis of the GRAD Honey Value Chain November 2012
APPENDIX
Table A The FtF indicators proposed for the monitoring and evaluation of the GRAD project
Results Indicator Target
Overall objective To graduate chronically food-insecure households from food support
Graduation of chronically food-insecure households from food aid by increasing their yearly household income
50000 households that will experience an increase in yearly income of US$365 by year 5
Result 1 Enhanced livelihood options for chronically food-insecure households
45-2 Number of jobs attributed to FtF implementation (RiA) ndashdelete it
Higher is better
3191-3 and 47-4 Prevalence of households with moderate or severe hunger (RiA)
Lower is better
Result 2 Improved community and household resilience
319-16 Prevalence of underweight children under 5 years of age (R)-delete it
Lower is better
319-13 Prevalence of underweight women (R)
Lower is better
319-4 and 3191-4 Prevalence of exclusive breastfeeding of children under 6 months of age (RiA)
Lower is better
319-11 Prevalence of stunted children under 5 years of age (R)
Lower is better
452-14 Number of vulnerable households benefiting directly from USG assistance (S)
Lower is better
Result 3 Strengthened enabling environment to promote scale-up and sustainability
45 Womenrsquos Empowerment in Agriculture Index Score (R)
Higher is better
451-27 and CBLD-5 Percentage of combined key areas of organization capacity among USG direct and indirect local implementing partner levels
Higher is better
34
Cost Benefit Analysis of the GRAD Honey Value Chain November 2012
452-38 Value of new private sector investment in the agriculture sector or food chain leveraged by FtF implementation (RiA)
Higher is better
Table B List of CFs used to make adjustments in the economic analysis for both interventions
Summary of CFs Honey 109 Transportation 084 Labor 100 Modern beehive 085 Transitional beehive 100 Bee colony 100 Queen excluder 085 Wax (ETBkg) 106 Smoker 085 Overall coat 073 Veil 073 Glove 080 Extractor 082 Wax mold 100 Plastic honey container 075 Beehive maintenance 100 Rental value of land 100 Sugar 079
35
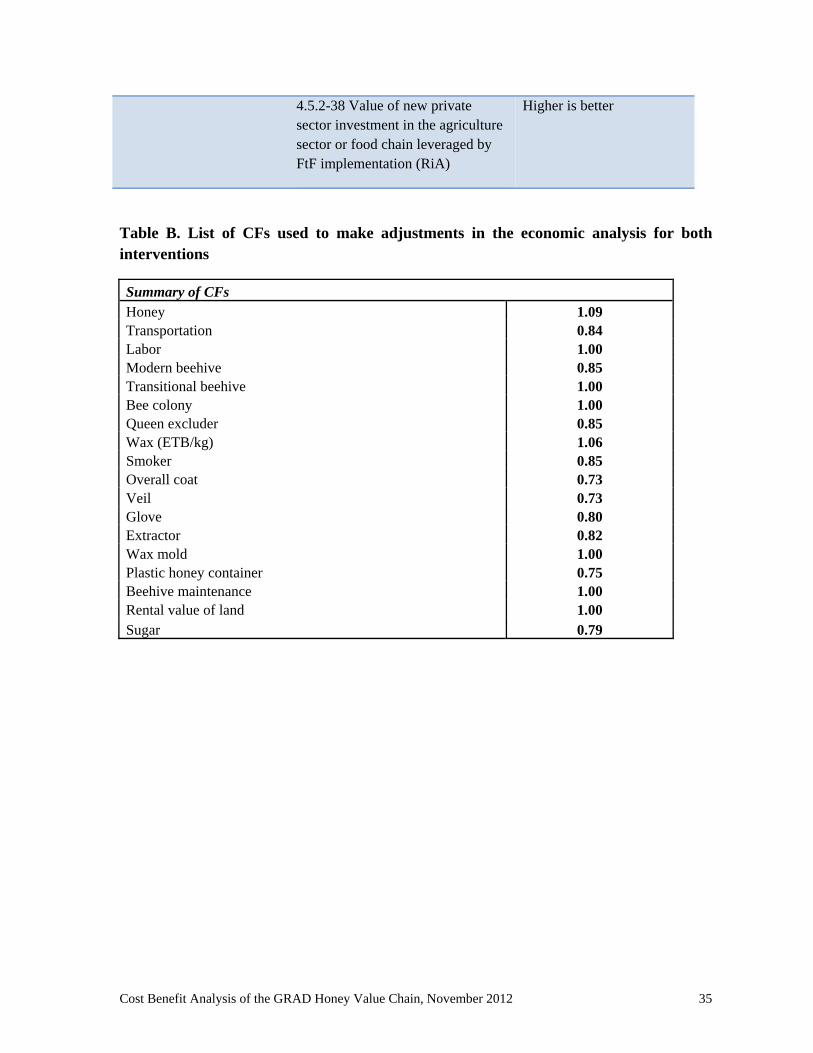
Cost Benefit Analysis of the GRAD Honey Value Chain November 2012
452-38 Value of new private sector investment in the agriculture sector or food chain leveraged by FtF implementation (RiA)
Higher is better
Table B List of CFs used to make adjustments in the economic analysis for both interventions
Summary of CFs Honey 109 Transportation 084 Labor 100 Modern beehive 085 Transitional beehive 100 Bee colony 100 Queen excluder 085 Wax (ETBkg) 106 Smoker 085 Overall coat 073 Veil 073 Glove 080 Extractor 082 Wax mold 100 Plastic honey container 075 Beehive maintenance 100 Rental value of land 100 Sugar 079
35