Identifying and Accommodating High-Risk, High-Vulnerability Poulations in Disasters
© The Author 2014. Published by Oxford University Press on behalf of the University of North Carolina at Chapel Hill. All rights reserved. For permissions, please e-mail: [email protected].
Social Forces 00(00) 1–34, Month 2014doi: 10.1093/sf/sou104
The author benefited from the comments of Daniel Aldrich, Lori Peek, Shu-Ling Tsai, Michael Hsiao, Xiaogang Wu, Yu Xie, Yandong Zhao, Mingsho Ho, Hsiang-Chieh Lee, Yoshimichi Sato, and Shin Arita, as well as the participants of the 2012 Annual Meeting of the Japanese Sociological Society and the participants of the 2014 International Sociological Association World Congress of the Research Committee 39. He would like to thank the anonymous reviewers for their excellent suggestions. Rico Yang provided valuable research assistance. Supplementary information and replication data for this article are available at http://www.ios.sinica.edu.tw/fellow/thunghonglin/. The study is supported by the Taiwanese Ministry of Science and Technology, project No. 100–2628-H-001–007-MY4. Please direct correspondence to Thung-Hong Lin, 128 Sec. 2, Academia Rd., Nankang, Taipei 11529, Taiwan; E-mail: [email protected].
Governing Natural Disasters
Governing Natural Disasters: State Capacity, Democracy, and Human Vulnerability
Thung-Hong Lin, Institute of Sociology, Academia Sinica
From the perspective of historical institutionalism, I argue that state capacity, democracy, and their interaction shape the distribution of human vulnerability in natural disasters. The ruling elite, irrespective of whether it is democratic, has the
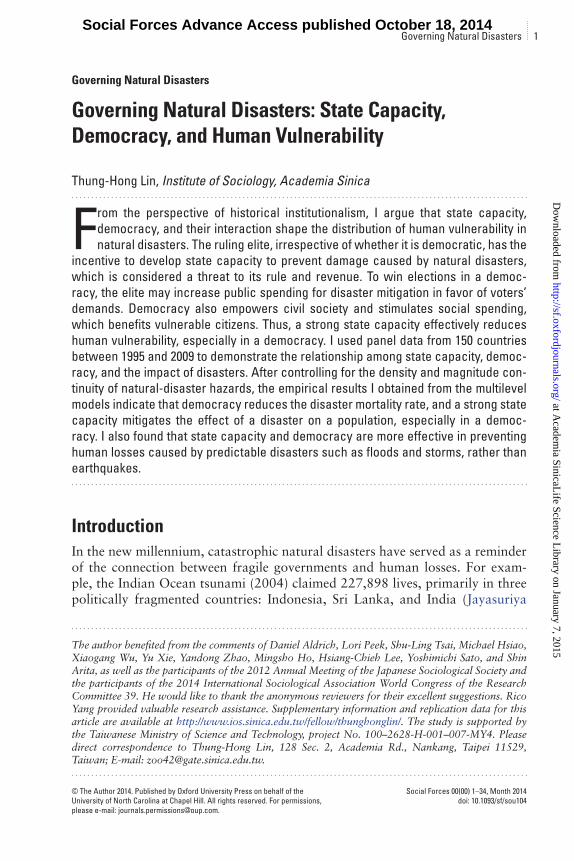
incentive to develop state capacity to prevent damage caused by natural disasters, which is considered a threat to its rule and revenue. To win elections in a democ-racy, the elite may increase public spending for disaster mitigation in favor of voters’ demands. Democracy also empowers civil society and stimulates social spending, which benefits vulnerable citizens. Thus, a strong state capacity effectively reduces human vulnerability, especially in a democracy. I used panel data from 150 countries between 1995 and 2009 to demonstrate the relationship among state capacity, democ-racy, and the impact of disasters. After controlling for the density and magnitude con-tinuity of natural-disaster hazards, the empirical results I obtained from the multilevel models indicate that democracy reduces the disaster mortality rate, and a strong state capacity mitigates the effect of a disaster on a population, especially in a democ-racy. I also found that state capacity and democracy are more effective in preventing human losses caused by predictable disasters such as floods and storms, rather than earthquakes.
IntroductionIn the new millennium, catastrophic natural disasters have served as a reminder of the connection between fragile governments and human losses. For exam-ple, the Indian Ocean tsunami (2004) claimed 227,898 lives, primarily in three politically fragmented countries: Indonesia, Sri Lanka, and India (Jayasuriya
Governing Natural Disasters 1 Social Forces Advance Access published October 18, 2014
at Academ
ia SinicaLife Science L
ibrary on January 7, 2015http://sf.oxfordjournals.org/
Dow
nloaded from
and McCawley 2010). One disaster occurred in a country that had undergone a bloody civil war; the 2010 Haiti earthquake killed between 46,190 and 316,000 people (Khazai, Daniell, and Wenzel 2011).1 The Wenchuan earthquake (2008) occurred in one of the poorest agricultural areas of China, killing at least 87,148 people (this figure includes missing people; see Deng [2009]). By contrast, although the Japanese Tohoku tsunami (2011) was triggered by an earthquake with a higher magnitude than those that occurred in China and Haiti, in addi-tion to the damage resulting from the nuclear accident, it claimed 18,536 lives (including those who were deemed missing; see National Police Agency of Japan [2013]), which is the lowest number of casualties among the mentioned catas-trophes. Apparently, the great variation of death toll is not only exaggerated by the magnitude of disaster, but also determined by some political factors.
In the social science literature on disasters, several classical studies have eluci-dated the association between politics and human vulnerability (Albala-Bertrand 1993; Hass, Kates, and Bowden 1977; Seitz and Davis 1984).2 Most scholars have recognized that, in preparedness and postdisaster relief, politics affects people’s vulnerability and resilience (Aldrich 2012; Brooks, Adger, and Kelly 2005; Cutter 1996; Jones and Murphy 2009; Oliver-Smith 1996; Pelling 2003; Wisner et al. 2004). Pragmatically, international organizations typically work with weak states, which frustrate their efforts to engage and provide humani-tarian aid in postconflict and postdisaster management arenas (Organization for Economic Cooperation and Development [OECD] 2008). Therefore, the problem of “state fragility” has been frequently mentioned in disaster studies (Burkle 2006; Collinson, Elhawary, and Muggah 2010; Newbrander, Waldman, and Shepherd-Banigan 2011).
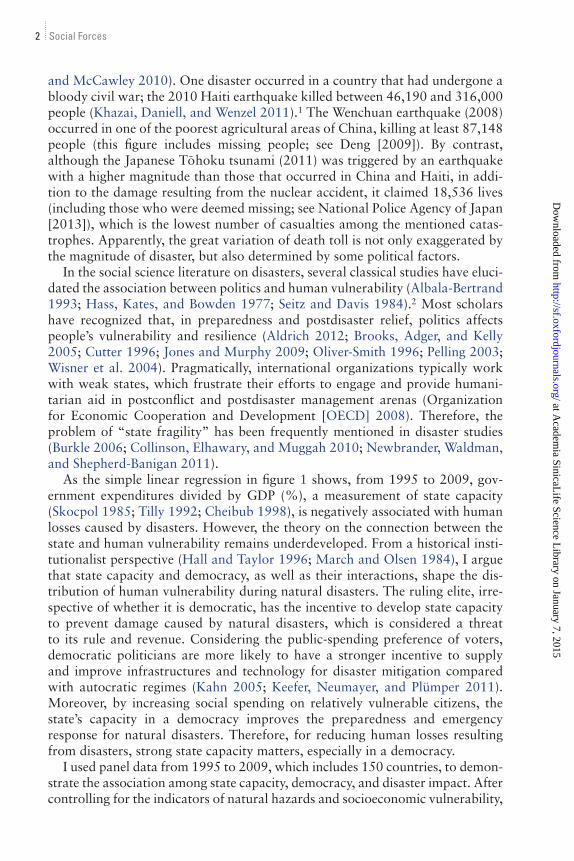
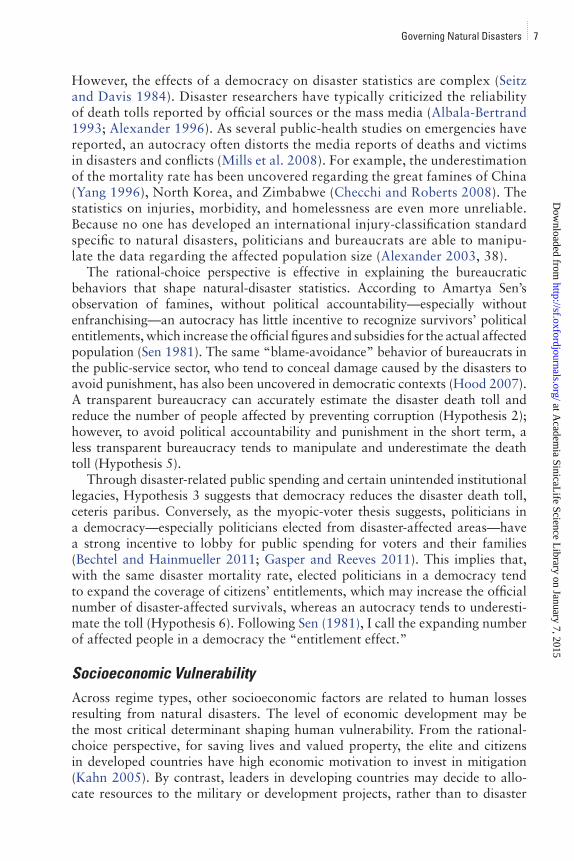
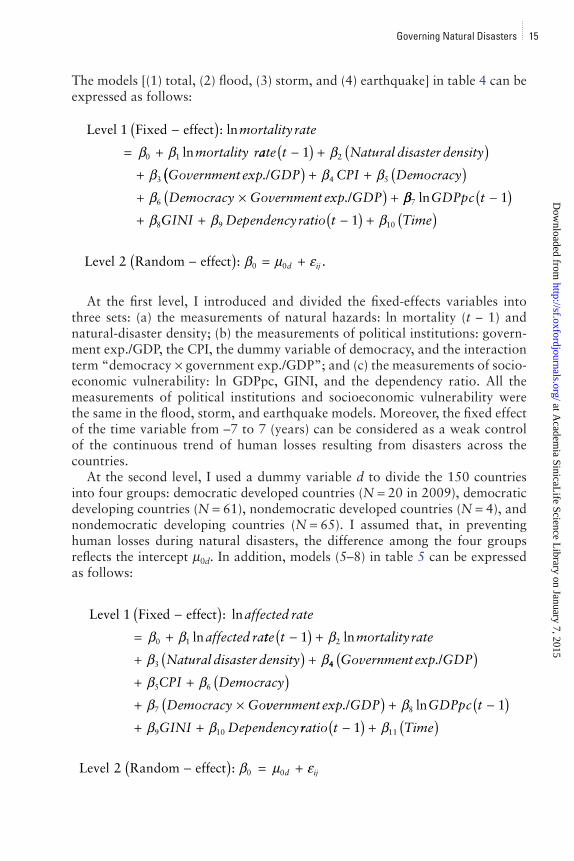
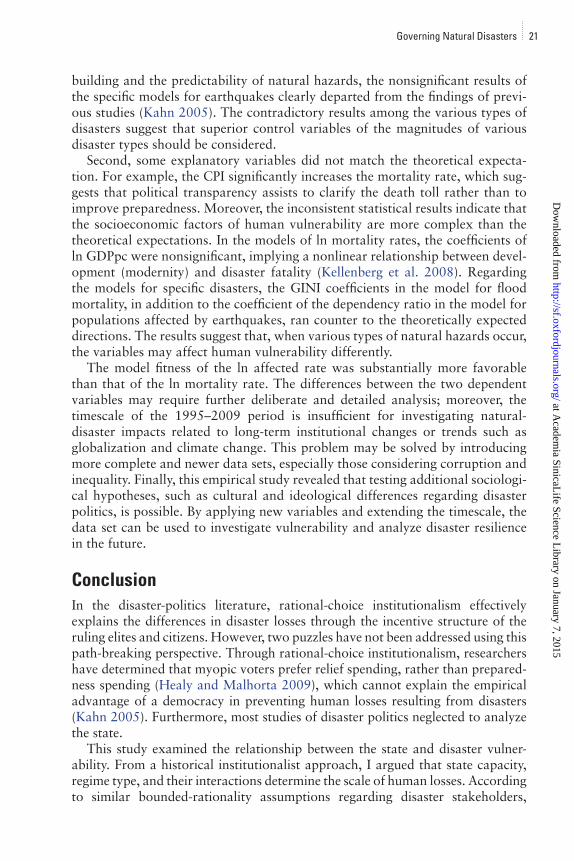
As the simple linear regression in figure 1 shows, from 1995 to 2009, gov-ernment expenditures divided by GDP (%), a measurement of state capacity (Skocpol 1985; Tilly 1992; Cheibub 1998), is negatively associated with human losses caused by disasters. However, the theory on the connection between the state and human vulnerability remains underdeveloped. From a historical insti-tutionalist perspective (Hall and Taylor 1996; March and Olsen 1984), I argue that state capacity and democracy, as well as their interactions, shape the dis-tribution of human vulnerability during natural disasters. The ruling elite, irre-spective of whether it is democratic, has the incentive to develop state capacity to prevent damage caused by natural disasters, which is considered a threat to its rule and revenue. Considering the public-spending preference of voters, democratic politicians are more likely to have a stronger incentive to supply and improve infrastructures and technology for disaster mitigation compared with autocratic regimes (Kahn 2005; Keefer, Neumayer, and Plümper 2011). Moreover, by increasing social spending on relatively vulnerable citizens, the state’s capacity in a democracy improves the preparedness and emergency response for natural disasters. Therefore, for reducing human losses resulting from disasters, strong state capacity matters, especially in a democracy.
I used panel data from 1995 to 2009, which includes 150 countries, to demon-strate the association among state capacity, democracy, and disaster impact. After controlling for the indicators of natural hazards and socioeconomic vulnerability,
2 Social Forces
at Academ
ia SinicaLife Science L
ibrary on January 7, 2015http://sf.oxfordjournals.org/
Dow
nloaded from
the multilevel modeling results indicated that democracy substantially reduced the death toll resulting from disasters; a strong state capacity and its interaction with democracy were robustly associated with a low number of people affected by disasters. In addition, state capacity and democracy are more effective in pre-venting human losses caused by predictable disasters such as floods and storms, rather than earthquakes.
Historical Institutionalism of Disaster PoliticsThe relationship between politics and disaster vulnerability is an undervalued sub-ject (Freudenburg et al. 2009; Hewitt 1998). Economists and political scientists have recently revisited the political economy of natural disasters and focused on the self-interest of politicians and voters, which implies that they have adopted a rational choice institutionalist perspective (North 1990; Weingast 1996). Several studies have explained the cross-national differences in disaster vulnerability through the incentive structures of the political elite. For example, Kahn (2005) found that disaster fatality is lower in democracies, and explained this finding by
Figure 1. State capacity and human losses in natural disasters, 150 countries, 1995–2009
ALBDZA
AGOARG
ARM
AUS
AUT
AZE
BGD
BRBBLRBEL
BLZ
BEN
BTN
BOL
BIHBWA
BRA
BGR
BFA
BDIKHM
CMR CAN CPV
TCD
CHL
CHN
COL
COMZAR COG
CRI
CIV HRVCYP CZE
DNK
DMA
DOM
ECU
EGY
SLV
EST
ETH
FJI
FIN
FRAGAB
GMB
GEO
DEU
GHA
GRC
GRD
GTM
GIN
GNBHTI
HND
HKG
HUN
ISL
IND
IDN
IRN
IRLISRITA
JAM
JPN
JOR
KAZ
KEN
KOR KGZ
LAO
LVALBN
LBR
LTULUX
MKD
MDGMWI
MYS
MDV
MLI
MLT
MRT
MUS
MEX
MDA
MNG
MNE
MAR
MOZNAM
NPL
NLD
NZL
NIC NER
NGA
NOR
PAK
PAN
PNG
PRY
PER
PHL
POL PRT
ROM RUSRWASEN
SRBSLE
SGP SVKSVN
ZAF
ESP
LKA
LCAVCT
SWZ
SWE
CHE
TWN
TZA
THA
TGO
TTO TUN
TUR
TKM
UGA
UKR
GBR
USA
URY
UZB
VEN
VNM
YEM
ZMB
ZWE
0
2
4
6
8
10
5 10 15 20 25Government Expenditure of GDP
In hu
man-
loss r
ate
95% CI Fitted valuesln human-loss rate
ln human-loss rate: per 100,000 personsNote: This figure is based on country-level averages across 1995–2009. The X-axis is the measurement of state capacity, government expenditure/GDP, the source is taken from the World Development Indicators (WDI); and the Y-axis is the logarithmic number of natural-disaster-impacted population (death and affected, named as ln human-loss rate), based on the Emergency Event Database (EM-DAT) (see table 1). The line is the fitted value from a simple regression, and the gray zone refers to the confidence interval (95 percent).
Governing Natural Disasters 3
at Academ
ia SinicaLife Science L
ibrary on January 7, 2015http://sf.oxfordjournals.org/
Dow
nloaded from

the incentives of politicians, who are likely to increase public spending for miti-gation during elections. Scholars have also reported that public-sector corrup-tion is positively related to earthquake deaths (Escaleras, Anbarci, and Register 2007). Moreover, by controlling for earthquake magnitudes, Keefer, Neumayer, and Plümper (2011) noted that “both democracies and non- democracies exhibit considerable heterogeneity”; instead of measuring variations in state capacity, they argued that if a democracy or an autocracy remains in power for a long period, the nation would become increasingly institutionalized, and the leader-ship would, therefore, reasonably increase its focus on disaster mitigation.
By contrast, other studies have emphasized the collective-action problem and the myopic responses of citizens; for example, Anbarci, Escaleras, and Register (2005) argued that when the level of inequality increases, the likelihood of vari-ous income groups agreeing on the distribution of the burden of preparedness decreases, causing the rich to self-insure against disasters, whereas the poor are left to its mercy. Recent studies have also found that voters ignore disaster-preparedness spending, but heavily reward (or punish) the incumbent politician responsible for relief spending, holding him or her accountable for actions taken after the disaster occurs (Chen 2013; Cole, Healy, and Werker 2012; Gasper and Reeves 2011). This implies that a democracy may still underinvest in disaster mit-igation because of the myopic preference of voters (Healy and Malhorta 2009).
Although the path-breaking rational-choice perspective was successfully used to establish an explanatory framework of disaster politics, several theoretical problems remain unaddressed. First, this perspective indicates that, compared with autocracy, democracy facilitates the protection of citizens from disaster impacts because voters shape the incentive structure of elected politicians (Kahn 2005). However, it also indicates that the shortsightedness of voters and politi-cians results from the failure of electoral accountability (Healy and Malhorta 2009), which may reduce the differences in disaster preparedness between a democracy and an autocracy. Second, the rational-choice perspective neglected the analysis of the role of the state in disaster politics. Although Keefer, Neumayer, and Plümper (2011) recognized the varying performance of states in disaster preparedness across democracies and autocracies, they explained it based solely on the age of the regime.
Supplementary to rational-choice institutionalism, historical institutionalism (Hall and Taylor 1996) considers political institutions as the legacies of political struggles in a relatively longer time horizon (Thelen 1999). Historical institu-tionalism typically shares the same assumptions included in the rational-choice perspective; for example, political elites typically prefer to remain in office for as long as possible (Bueno de Mesquita et al. 2003), rather than protect their citizens from disaster impacts, whereas the citizens prefer to reduce disaster vulnerability by increasing public spending on preparedness, of which a short-age typically exists under the free-rider problem (Kahn 2005). In contrast to the voters and elected politicians in a democracy, bureaucrats responsible for the execution of disaster management in the public-service sector typically avoid blame and punishment (Hood 2007). While the incentive structure of stake-holders in disaster management can explain certain variations in human losses
4 Social Forces
at Academ
ia SinicaLife Science L
ibrary on January 7, 2015http://sf.oxfordjournals.org/
Dow
nloaded from
caused by disasters, historical institutionalism explains the effects of institu-tional legacies that have originated from various historical contexts (e.g., a public medical system shaped by previous class conflicts or political struggles in welfare states; see Esping-Andersen [1990]; Hacker [2004]). The unintended institutional effects of welfare states may shape the performance of the political elite, the bureaucrats, and citizens, in response to natural disasters. In addition to the rational-choice perspective on disaster politics, historical institutional-ism, which focuses on the state and unintended effects of institutions, may supplement these factors to explain the cross-national heterogeneity of human vulnerability.
State Capacity, Democracy, and DisasterState capacity is typically referred to as the ability of a government to administer its territory effectively (Skocpol 1985). As the predatory theory of state building argues, state capacity typically originates in an ongoing process conditioned by internal and external rivalries (Kisangani and Pickering 2013; Thies 2007; Tilly 1992). Military threats may be the most critical motivation for ruling elites to build stronger states, but they are not the only threats they face. Similar to a war, a natural disaster may reduce the population size, reduce capital and land pro-ductivity, destroy the infrastructure, undermine the tax revenue base, and cause widespread political discontent among the victims, who may fuel opposition to the current government or instigate a rebellion (e.g., Hendrix and Salehyan 2012). Because natural disasters may endanger the rule and revenue of govern-ments, the ruling elite occasionally focus on disaster mitigation when building state capacity. However, in a developing country, the elite may not have suf-ficient information and the ability to predict and prevent the damage caused by natural disasters, and may choose to allocate resources to more urgent tasks or more crucial “selectorates” for political survival (Bueno de Mesquita et al. 2003; Keefer Neumayer, and Plümper 2011). Regarding disaster preparedness in a developing country, the ruling elite can be myopic.
Despite intended preparedness, state capacity in preventing natural- disaster losses is derived from certain unintended consequences of state building. Regarding tax revenue and military concerns (Levi 1988; Olson 2000), the state may create “infrastructural power” (Mann 1986), such as a national registra-tion system for the population and property, a larger administration and police force, a transportation system, and a communication system, which are effec-tive for evacuations and emergencies after certain types of natural disasters, such as floods and storms (Jha et al. 2010). In addition, state capacity in taxa-tion and market regulation depends on previous investments in fiscal and legal institutions (Besley and Persson 2009). According to all perspectives on state capacity, the fiscal extractive capacity is fundamental for public spending on intended and unintended policies for preventing natural disasters. By focusing on this general association, rather than on the mechanisms that effectuate it, I propose Hypothesis 1: A certain state fiscal capacity is the precondition to prevent human losses that occur during natural disasters.
Governing Natural Disasters 5
at Academ
ia SinicaLife Science L
ibrary on January 7, 2015http://sf.oxfordjournals.org/
Dow
nloaded from
A strong state capacity is associated with the quality of the administration (Hendrix 2010). Following Weber (1958), numerous authors have emphasized rational bureaucracy in providing productive conditions for economic growth by creating and maintaining institutions, including adequate legal and regulatory frameworks, reliable information diffusion, and low illegal expenses for businesses (Block and Evans 2005; Hamm, King, and Stuckler 2012). Researchers have dis-covered that a rational and transparent bureaucracy reduces the principal-agent problem or clientelism that results in political corruption (Rose-Ackerman 1978), and prevents people from becoming victims of collapsed buildings weakened by corruption (Escaleras, Anbarci, and Register 2007). Simplifying additional fac-tors under a ceteris paribus clause, Hypothesis 2 can be derived: A transparent administration results in reduced human losses during natural disasters.
Several scholars have claim that, in a democracy, voters and elected politicians shall prefer disaster mitigation (Kahn 2005; Wildavsky 1988). However, accord-ing to the myopic-voter thesis, a democracy may reward relief spending, leading to underinvestment in preparedness (Healy and Malhorta 2009). In addition to the rational-choice perspective, I argue that improved performance in a democ-racy regarding disaster prevention originates from several unintended effects of state building. Researchers have determined that a democracy tends to increase social spending (Brown and Hunter 1999), such as that on unemployment pay-ments, pensions, education, and other redistributive policies associated with wel-fare states (Lindert 2004). Several factors related to social spending (e.g., for education, food and water supply, and the public healthcare system) are effective for preventing human losses in disaster management. Consequently, although the state extractive capacity can be the same, a democracy reshapes the structure of public spending in favor of disaster prevention. Therefore, Hypothesis 3 is proposed: Compared with an autocracy, a stronger state capacity in a democracy leads to a more effective reduction in human losses caused by natural disasters.
In addition to state capacity, a substantial institutional difference between democracy and autocracy is the population’s degree of civil liberties and politi-cal rights (Dahl 1972). By reducing information incompleteness and asymmetry in disaster preparedness and relief, a higher degree of media freedom is helpful in saving lives and property, as well as in inhibiting political corruption (Besley and Burgess 2002). Furthermore, by nurturing a civil association’s capacity for resource mobilization (Tilly 2007), namely social capital (Putnam 1993), a highly liberal civil society can facilitate the delivery of goods and services after natural disasters (Aldrich 2012). However, even when encountering serious impacts caused by natural disasters, an autocracy generally restricts the freedom of speech and association to suppress potential political opposition (Lin 2012). Consequently, by underinvesting in preparedness and constraining civil society’s resource mobilization and freedom of speech, an autocracy amplifies the fatali-ties resulting from a natural disaster (Hypothesis 4).
The Complex Effects of DemocracyHistorical institutionalism assumes that, irrespective of whether the myopic-voter assumption is true, a democracy performs favorably in disaster prevention.
6 Social Forces
at Academ
ia SinicaLife Science L
ibrary on January 7, 2015http://sf.oxfordjournals.org/
Dow
nloaded from
However, the effects of a democracy on disaster statistics are complex (Seitz and Davis 1984). Disaster researchers have typically criticized the reliability of death tolls reported by official sources or the mass media (Albala-Bertrand 1993; Alexander 1996). As several public-health studies on emergencies have reported, an autocracy often distorts the media reports of deaths and victims in disasters and conflicts (Mills et al. 2008). For example, the underestimation of the mortality rate has been uncovered regarding the great famines of China (Yang 1996), North Korea, and Zimbabwe (Checchi and Roberts 2008). The statistics on injuries, morbidity, and homelessness are even more unreliable. Because no one has developed an international injury-classification standard specific to natural disasters, politicians and bureaucrats are able to manipu-late the data regarding the affected population size (Alexander 2003, 38).
The rational-choice perspective is effective in explaining the bureaucratic behaviors that shape natural-disaster statistics. According to Amartya Sen’s observation of famines, without political accountability—especially without enfranchising—an autocracy has little incentive to recognize survivors’ political entitlements, which increase the official figures and subsidies for the actual affected population (Sen 1981). The same “blame-avoidance” behavior of bureaucrats in the public-service sector, who tend to conceal damage caused by the disasters to avoid punishment, has also been uncovered in democratic contexts (Hood 2007). A transparent bureaucracy can accurately estimate the disaster death toll and reduce the number of people affected by preventing corruption (Hypothesis 2); however, to avoid political accountability and punishment in the short term, a less transparent bureaucracy tends to manipulate and underestimate the death toll (Hypothesis 5).
Through disaster-related public spending and certain unintended institutional legacies, Hypothesis 3 suggests that democracy reduces the disaster death toll, ceteris paribus. Conversely, as the myopic-voter thesis suggests, politicians in a democracy—especially politicians elected from disaster-affected areas—have a strong incentive to lobby for public spending for voters and their families (Bechtel and Hainmueller 2011; Gasper and Reeves 2011). This implies that, with the same disaster mortality rate, elected politicians in a democracy tend to expand the coverage of citizens’ entitlements, which may increase the official number of disaster-affected survivals, whereas an autocracy tends to underesti-mate the toll (Hypothesis 6). Following Sen (1981), I call the expanding number of affected people in a democracy the “entitlement effect.”
Socioeconomic VulnerabilityAcross regime types, other socioeconomic factors are related to human losses resulting from natural disasters. The level of economic development may be the most critical determinant shaping human vulnerability. From the rational-choice perspective, for saving lives and valued property, the elite and citizens in developed countries have high economic motivation to invest in mitigation (Kahn 2005). By contrast, leaders in developing countries may decide to allo-cate resources to the military or development projects, rather than to disaster
Governing Natural Disasters 7
at Academ
ia SinicaLife Science L
ibrary on January 7, 2015http://sf.oxfordjournals.org/
Dow
nloaded from
preparedness (Keefer, Neumayer, and Plümper 2011). From the historical insti-tutionalist perspective, economic development also improves the health and housing of, information provided to, and transportation conditions experienced by the national population, the vulnerability of which is thereby reduced in multiple dimensions (Deaton 2003). Based on both perspectives, I propose the following hypothesis: A high level of development reduces human losses that occur during natural disasters (Hypothesis 7).
Economic inequality is another frequently mentioned factor that determines socioeconomic vulnerability. From the rational-choice perspective, high eco-nomic inequality reduces the probability of citizens taking collective action to pre-vent the poor from being affected by disasters (Anbarci, Escaleras, and Register 2005). In addition, to secure votes from the poor, politicians in a democracy tend to moderate economic inequality by introducing progressive taxation poli-cies and engaging in generous social spending (Acemoglu and Robinson 2005), which reduces the poor’s exposure to disaster vulnerability. Comparative studies on developing countries have suggested that certain egalitarian states have per-formed better than the market in disaster mitigation and relief (Seitz and Davis 1984). Therefore, this paper proposes Hypothesis 8: Greater economic inequal-ity increases human losses caused by disasters.
Finally, evidence has revealed that the aged and younger populations are more likely to be affected by disasters. For example, statistical data on the Japanese Hanshin Earthquake (1995) indicated that approximately 60 percent of the victims belonged to the aged population and lived primarily in tradi-tional wood-frame houses, which were subject to postdisaster fires (City of Kobe 2009). In the 2011 Tohoku earthquake and tsunami, the percentage of aged victims was higher than that reported after the Hanshin earthquake.3 In contrast to the aged society, poverty has caused Haiti’s high fertility rate and its young demographic structure, and has led to a relatively high death toll for the younger population (Centers for Disease Control and Prevention 2011, 1675).4 Therefore, this paper proposes the following hypothesis: A high proportion of a dependent population increases human losses resulting from natural disasters (Hypothesis 9).
Several recent studies have reported a negative association between natural-disaster frequency and the resulting economic losses, and have explained the association through rational actors’ learning from disaster experiences. Another finding is that the stakeholders of disaster mitigation may pay increased atten-tion to certain predicable disasters such as storms and floods, but are less likely to prepare for unpredictable disasters such as earthquakes (Neumayer, Plümper, and Barthel 2014). From the historical institutionalist perspective, politicians and voters may gradually learn from disaster experiences and build sustain-able institutions for some predictable natural hazards in a longer time horizon (Hypothesis 10).
Apparently, the rational-choice institutionalism contributes much to our understanding of disaster politics; meanwhile, incorporating historical institu-tionalism into the analysis of disaster politics may improve the explanations of the role of democracy and the state. The new hypotheses from the historical
8 Social Forces
at Academ
ia SinicaLife Science L
ibrary on January 7, 2015http://sf.oxfordjournals.org/
Dow
nloaded from
institutionalism, regarding state capacity, its interaction with democracy, and democracy itself, are therefore the mixed mechanisms of rational-choice behav-ior and institutional path dependence.
Data, Variables, and MethodTo test the hypotheses, I analyzed the determinants of the disaster mortality rate and the weight of the affected population. Following previous studies (Kahn 2005; Neumayer, Plümper, and Barthel 2014; Noy 2009), I used disaster data from the Emergency Event Database (EM-DAT) collected by the Centre for Research on the Epidemiology of Disasters (CRED).5 The EM-DAT contains data on 11 types of natural disasters: floods, droughts, storms, dry and wet mass movements, extreme temperatures, earthquakes, volcanos, wildfires, insect infestations, epidemics, and complex disasters involving at least two types of natural disasters, as well as three types of human-made disasters. Because of the complexities of human-made disasters (Perrow 1984), I used only the database on natural disasters.
Dependent VariablesI built three standardized measurements for human losses. The first measure-ment is calculated from the annual sum of deaths caused by natural disasters divided by the national population (per 100,000) in the same year. Because cer-tain country-year sums are near zero, and would result in a skew to the left in the data set, I normalized the indicators’ distribution by considering the natural logarithm transfer; that is, the logarithmic annual mortality rate (abbreviated as ln mortality rate) resulting from natural disasters.
The second measurement is the logarithm of the annual sum of disaster-affected survivors per 100,000 citizens (abbreviated as the ln affected rate). The EM-DAT defines disaster-affected survivors as those who experience at least one of the following three situations after a disaster: (a) injured: people suffer-ing from physical injuries, trauma, or an illness requiring medical treatment as a direct result of a disaster; (b) affected: people requiring immediate assistance during an emergency; and (c) homeless: people requiring immediate assistance for shelter (this includes displaced or evacuated people). Limited by the informa-tion in the database, analyzing additional details regarding the three categories was difficult. Although the statistical reliability of the affected population toll is occasionally doubted, it is the most consistent international panel data, and is accepted and published by academic journals (e.g., Kellenberg and Mobarak 2008).
The third measurement of human vulnerability as a whole is the logarithm of the annual sum of disaster deaths and affected survivors (abbreviated as the ln human-loss rate). The ln mortality rate and the ln affected rate are major dependent variables in the following statistical models; however, the ln human-loss rate is used to present the total number of human losses in figure 1 and the appendix. The three rates can be negative when the mortality rate or the
Governing Natural Disasters 9
at Academ
ia SinicaLife Science L
ibrary on January 7, 2015http://sf.oxfordjournals.org/
Dow
nloaded from
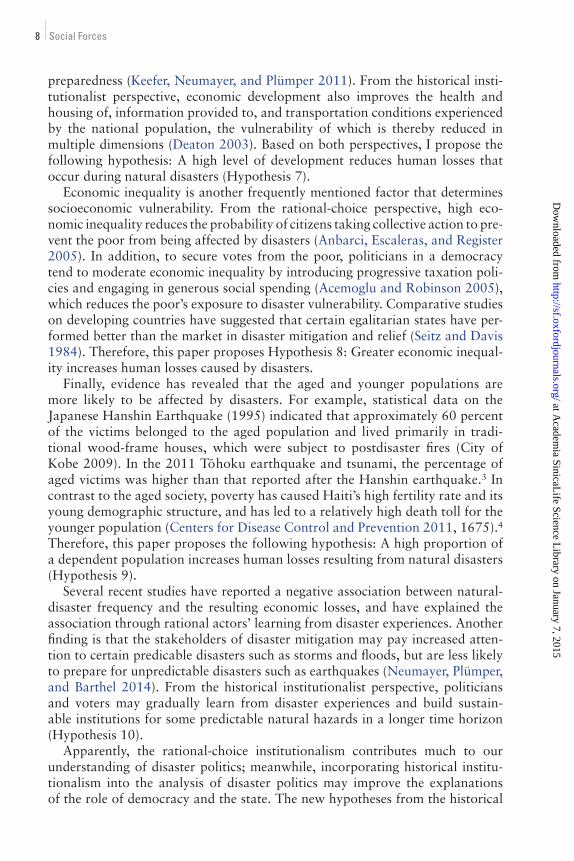
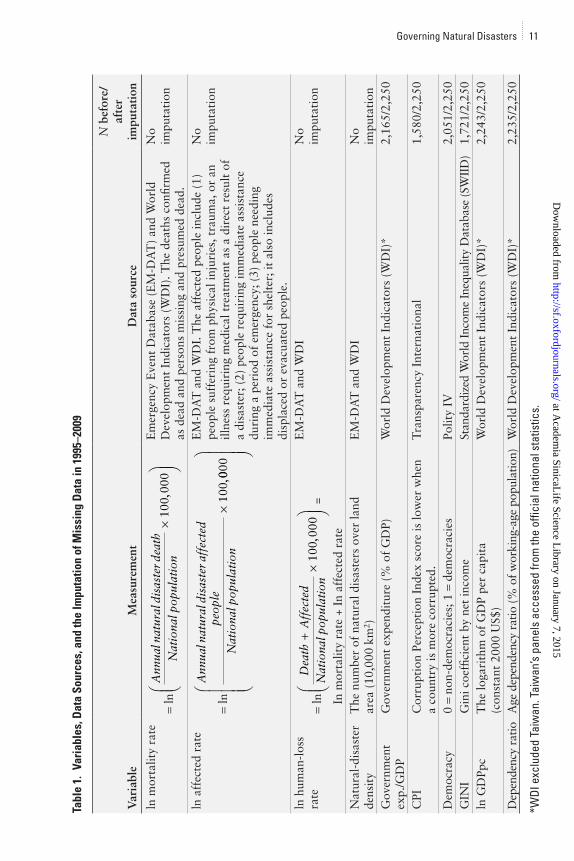
affected percentage of the population is <1/100,000. The sources and formulas of the three dependent variables and other explanatory variables are listed in table 1. The ranked list of the average ln human-loss rate and the democratic grouping of 150 countries for the 1995–2009 period are shown in table 1 in the appendix.
Compared with previous studies, which have adopted only the death toll as the dependent variable and placed the national population on the right side of the equation (Escaleras, Anbarci, and Register 2007; Kahn 2005; Keefer, Neumayer, and Plümper 2011), the ln mortality rate and ln affected rate used in the present study are superior because they are standardized as the other cross-national mortality and morbidity indicators. Based on the same formula, I calculated the ln mortality rate, ln affected rate, and ln human-loss rate for floods, storms, and earthquakes. These three types of natural disasters were chosen for comparison because they are the most fatal disasters, either in single events or through long-term accumulation, according to the EM-DAT histori-cal records (CRED 2011).
The EM-DAT also provides the estimated economic losses resulting from each disaster. Compared with human losses, one study noted that the eco-nomic parameter may underestimate losses in developing countries (Gall, Emrich, and Cutter 2008). Additional effort is required to adjust the errors, standardize the indicators, and provide theoretical justifications (Neumayer and Barthel 2011). To avoid the obvious divergence between the death toll and economic losses, the simple measurement of human vulnerability was used in this study.
Independent VariablesState capacity is a key explanatory variable affecting human losses resulting from disaster. Empirically, Hendrix (2010) suggested that state capacity can be defined and operationalized using three dimensions: military capacity, bureaucratic/administrative capacity, and institutional coherence and quality. In addition, he separated the bureaucratic/administrative capacity into extractive capacity and bureaucratic quality. I used the percentage of government expenditures divided by GDP (abbreviated as government exp./GDP) to measure the extractive capac-ity (Levi 1988). Although several scholars have argued that this one-dimensional measurement hardly reflects the taxation structure and the other complex per-spectives of state building (Lieberman 2002), government exp./GDP remains the most widely used index for measuring the extractive capacity (Bräutigam, Fjeldstad, and Moore 2008; Cheibub 1998). The variable was calculated using the World Bank’s World Development Indicators (WDI), which cover 230 coun-tries between 1960 and 2010.
The Corruption Perception Index (CPI) was used, compiled by Transparency International (TI), to measure the bureaucratic quality. The CPI, weighted according to expert opinions and relevant surveys, covers the corruption perception of 195 countries from 1995 to 2010. It is scored from 0 to 10; a high score reflects a high degree of political transparency, whereas a low
10 Social Forces
at Academ
ia SinicaLife Science L
ibrary on January 7, 2015http://sf.oxfordjournals.org/
Dow
nloaded from
Tabl
e 1.
Var
iabl
es, D
ata
Sour
ces,
and
the
Impu
tatio
n of
Mis
sing
Dat
a in
199
5–20
09
Var
iabl
eM
easu
rem
ent
Dat
a so
urce
N b
efor
e/af
ter
impu
tati
on
ln m
orta
lity
rate
= ln
Ann
ualn
atur
aldi
sast
erde
ath
Nat
iona
lpop
ulat
ion
×
10
000
0,
Em
erge
ncy
Eve
nt D
atab
ase
(EM
-DA
T)
and
Wor
ld
Dev
elop
men
t In
dica
tors
(W
DI)
. The
dea
ths
confi
rmed
as
dea
d an
d pe
rson
s m
issi
ng a
nd p
resu
med
dea
d.
No
impu
tati
on
ln a
ffec
ted
rate
= ln
Ann
ualn
atur
aldi
sast
eraf
fect
edpe
ople
Nat
iona
lpop
ulat
ion
×10
0,000
0
EM
-DA
T a
nd W
DI.
The
aff
ecte
d pe
ople
incl
ude
(1)
peop
le s
uffe
ring
fro
m p
hysi
cal i
njur
ies,
tra
uma,
or
an
illne
ss r
equi
ring
med
ical
tre
atm
ent
as a
dir
ect
resu
lt o
f a
disa
ster
; (2)
peo
ple
requ
irin
g im
med
iate
ass
ista
nce
duri
ng a
per
iod
of e
mer
genc
y; (
3) p
eopl
e ne
edin
g im
med
iate
ass
ista
nce
for
shel
ter;
it a
lso
incl
udes
di
spla
ced
or e
vacu
ated
peo
ple.
No
impu
tati
on
ln h
uman
-los
s ra
te=
lnD
eath
Aff
ecte
dN
atio
nalp
opul
atio
n+
×
10
000
0,
=
In
mor
talit
y ra
te +
In
affe
cted
rat
e
EM
-DA
T a
nd W
DI
No
impu
tati
on
Nat
ural
-dis
aste
r de
nsit
yT
he n
umbe
r of
nat
ural
dis
aste
rs o
ver
land
ar
ea (
10,0
00 k
m2 )
EM
-DA
T a
nd W
DI
No
impu
tati
onG
over
nmen
t ex
p./G
DP
Gov
ernm
ent
expe
ndit
ure
(% o
f G
DP)
Wor
ld D
evel
opm
ent
Indi
cato
rs (
WD
I)*
2,16
5/2,
250
CPI
Cor
rupt
ion
Perc
epti
on I
ndex
sco
re is
low
er w
hen
a co
untr
y is
mor
e co
rrup
ted.
Tra
nspa
renc
y In
tern
atio
nal
1,58
0/2,
250
Dem
ocra
cy0 =
non-
dem
ocra
cies
; 1 =
dem
ocra
cies
Polit
y IV
2,05
1/2,
250
GIN
IG
ini c
oeffi
cien
t by
net
inco
me
Stan
dard
ized
Wor
ld In
com
e In
equa
lity
Dat
abas
e (S
WII
D)
1,72
1/2,
250
ln G
DPp
cT
he lo
gari
thm
of
GD
P pe
r ca
pita
(c
onst
ant
2000
US$
)W
orld
Dev
elop
men
t In
dica
tors
(W
DI)
*2,
243/
2,25
0
Dep
ende
ncy
ratio
Age
dep
ende
ncy
ratio
(% o
f wor
king
-age
pop
ulat
ion)
Wor
ld D
evel
opm
ent
Indi
cato
rs (
WD
I)*
2,23
5/2,
250
*WDI
exc
lude
d Ta
iwan
. Tai
wan
’s pa
nels
acc
esse
d fro
m th
e of
ficia
l nat
iona
l sta
tistic
s.
Governing Natural Disasters 11
at Academ
ia SinicaLife Science L
ibrary on January 7, 2015http://sf.oxfordjournals.org/
Dow
nloaded from
score indicates increased corruption. The CPI uncovers the negative effects of corruption and weak bureaucratic transparency on disaster management (Green 2005).
I applied Polity IV, a measurement of democracy widely used by political sci-entists, to categorize regime types (Marshall, Jaggers, and Gurr 2006). Covering 164 countries from 1800 to the present, regime types in the Polity IV database are scored from –10 to +10, which can be divided into three categories: autocra-cies (< –5), anocracies (from –5 to 5), and democracies (> 5). In accordance with Przeworski et al. (2000), I adopted the regime type dichotomy—democracy (= 1) or nondemocracy (= 0 refers to autocracy or anocracy). In addition, I measured the regime-related state capacity by using an interaction term of democracy and government exp./GDP.
I measured economic development, another critical source of human vul-nerability, by using the natural logarithm of GDP per capita (abbreviated as ln GDPpc) from the WDI database. I used the Gini coefficient (abbrevi-ated as GINI), a widely applied measurement of income distribution, to esti-mate the effect of economic inequality. Regarding the panel data, I adopted GINI from the Standardized World Income Inequality Database (Solt 2009), which covers the income-inequality indicators of 158 countries from 1960 to 2009. Moreover, the WDI database provides the dependency ratio for divid-ing the dependent population (age >65 years and age <15 years) according to the workforce population (15 years < age <65 years), which reveals the demographic structure associated with human vulnerability (Donner and Rodríguez 2008). For the countries missing from the WDI data sets, I cal-culated the ratio from the Penn World Table or other official statistics (i.e., data on Taiwan).
I used two methods, density and magnitude continuity, to measure the nat-ural-disaster hazards. First, I used a standardized indicator of natural-disaster hazards, the annual frequency of natural disasters divided by the surface area of the national territory of each country; in other words, the average number of events that occur on each land unit (10,000 km2) of the territory per year (abbreviated as natural-disaster density). It is scaled from 0 to 3; a high disas-ter density indicates increased annual natural hazards. Using the same formula, I also calculated the natural-disaster density of floods, storms, and earthquakes. Compared to the natural-disaster frequency, which is biased by the surface area of national territory (see table 2), the density may better explain the standard-ized ln mortality rate and ln affected rate.
The natural-disaster density estimates the unevenly distributed number of natural hazards in various countries, but it suggests that each event was char-acterized by the same magnitude. To modify this problem, I added last year’s ln mortality rate and ln affected rate, namely the ln mortality rate (t – 1) and the ln affected rate (t – 1), to estimate the continual impact of the magnitude of the events. I assumed that if a country is typically subject to a high or low magnitude of natural-disaster events resulting from its geographical and climate conditions, its ln mortality rate (t – 1) and ln affected rate (t – 1) are highly associated with its present rates.
12 Social Forces
at Academ
ia SinicaLife Science L
ibrary on January 7, 2015http://sf.oxfordjournals.org/
Dow
nloaded from
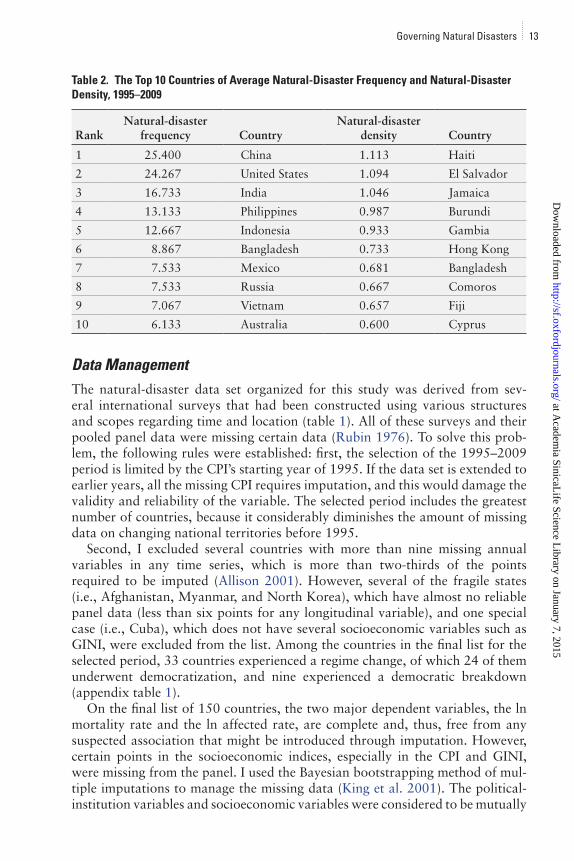
Data ManagementThe natural-disaster data set organized for this study was derived from sev-eral international surveys that had been constructed using various structures and scopes regarding time and location (table 1). All of these surveys and their pooled panel data were missing certain data (Rubin 1976). To solve this prob-lem, the following rules were established: first, the selection of the 1995–2009 period is limited by the CPI’s starting year of 1995. If the data set is extended to earlier years, all the missing CPI requires imputation, and this would damage the validity and reliability of the variable. The selected period includes the greatest number of countries, because it considerably diminishes the amount of missing data on changing national territories before 1995.
Second, I excluded several countries with more than nine missing annual variables in any time series, which is more than two-thirds of the points required to be imputed (Allison 2001). However, several of the fragile states (i.e., Afghanistan, Myanmar, and North Korea), which have almost no reliable panel data (less than six points for any longitudinal variable), and one special case (i.e., Cuba), which does not have several socioeconomic variables such as GINI, were excluded from the list. Among the countries in the final list for the selected period, 33 countries experienced a regime change, of which 24 of them underwent democratization, and nine experienced a democratic breakdown (appendix table 1).
On the final list of 150 countries, the two major dependent variables, the ln mortality rate and the ln affected rate, are complete and, thus, free from any suspected association that might be introduced through imputation. However, certain points in the socioeconomic indices, especially in the CPI and GINI, were missing from the panel. I used the Bayesian bootstrapping method of mul-tiple imputations to manage the missing data (King et al. 2001). The political- institution variables and socioeconomic variables were considered to be mutually
Table 2. The Top 10 Countries of Average Natural-Disaster Frequency and Natural-Disaster Density, 1995–2009
RankNatural-disaster
frequency CountryNatural-disaster
density Country
1 25.400 China 1.113 Haiti
2 24.267 United States 1.094 El Salvador
3 16.733 India 1.046 Jamaica
4 13.133 Philippines 0.987 Burundi
5 12.667 Indonesia 0.933 Gambia
6 8.867 Bangladesh 0.733 Hong Kong
7 7.533 Mexico 0.681 Bangladesh
8 7.533 Russia 0.667 Comoros
9 7.067 Vietnam 0.657 Fiji
10 6.133 Australia 0.600 Cyprus
Governing Natural Disasters 13
at Academ
ia SinicaLife Science L
ibrary on January 7, 2015http://sf.oxfordjournals.org/
Dow
nloaded from
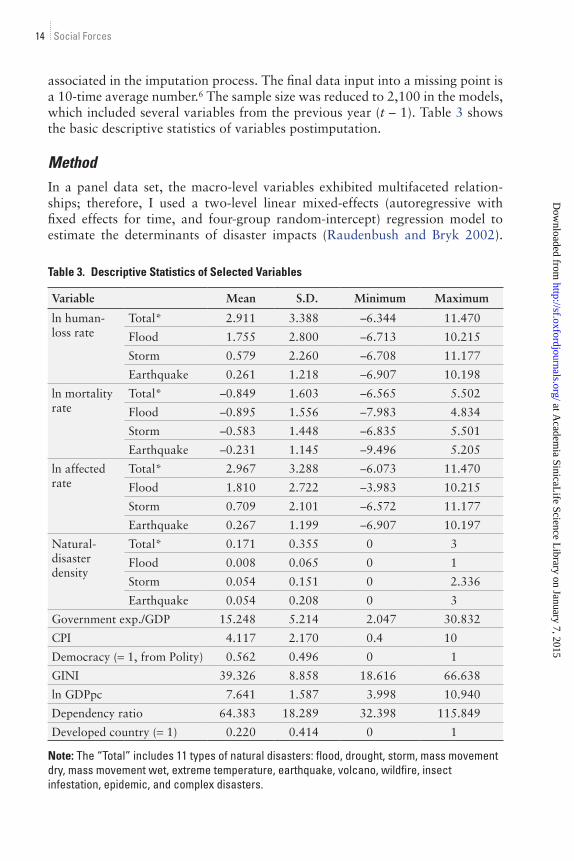
associated in the imputation process. The final data input into a missing point is a 10-time average number.6 The sample size was reduced to 2,100 in the models, which included several variables from the previous year (t – 1). Table 3 shows the basic descriptive statistics of variables postimputation.
MethodIn a panel data set, the macro-level variables exhibited multifaceted relation-ships; therefore, I used a two-level linear mixed-effects (autoregressive with fixed effects for time, and four-group random-intercept) regression model to estimate the determinants of disaster impacts (Raudenbush and Bryk 2002).
Table 3. Descriptive Statistics of Selected Variables
Variable Mean S.D. Minimum Maximum
ln human-loss rate
Total* 2.911 3.388 –6.344 11.470
Flood 1.755 2.800 –6.713 10.215
Storm 0.579 2.260 –6.708 11.177
Earthquake 0.261 1.218 –6.907 10.198
ln mortality rate
Total* –0.849 1.603 –6.565 5.502
Flood –0.895 1.556 –7.983 4.834
Storm –0.583 1.448 –6.835 5.501
Earthquake –0.231 1.145 –9.496 5.205
ln affected rate
Total* 2.967 3.288 –6.073 11.470
Flood 1.810 2.722 –3.983 10.215
Storm 0.709 2.101 –6.572 11.177
Earthquake 0.267 1.199 –6.907 10.197
Natural-disaster density
Total* 0.171 0.355 0 3
Flood 0.008 0.065 0 1
Storm 0.054 0.151 0 2.336
Earthquake 0.054 0.208 0 3
Government exp./GDP 15.248 5.214 2.047 30.832
CPI 4.117 2.170 0.4 10
Democracy (= 1, from Polity) 0.562 0.496 0 1
GINI 39.326 8.858 18.616 66.638
ln GDPpc 7.641 1.587 3.998 10.940
Dependency ratio 64.383 18.289 32.398 115.849
Developed country (= 1) 0.220 0.414 0 1
Note: The “Total” includes 11 types of natural disasters: flood, drought, storm, mass movement dry, mass movement wet, extreme temperature, earthquake, volcano, wildfire, insect infestation, epidemic, and complex disasters.
14 Social Forces
at Academ
ia SinicaLife Science L
ibrary on January 7, 2015http://sf.oxfordjournals.org/
Dow
nloaded from
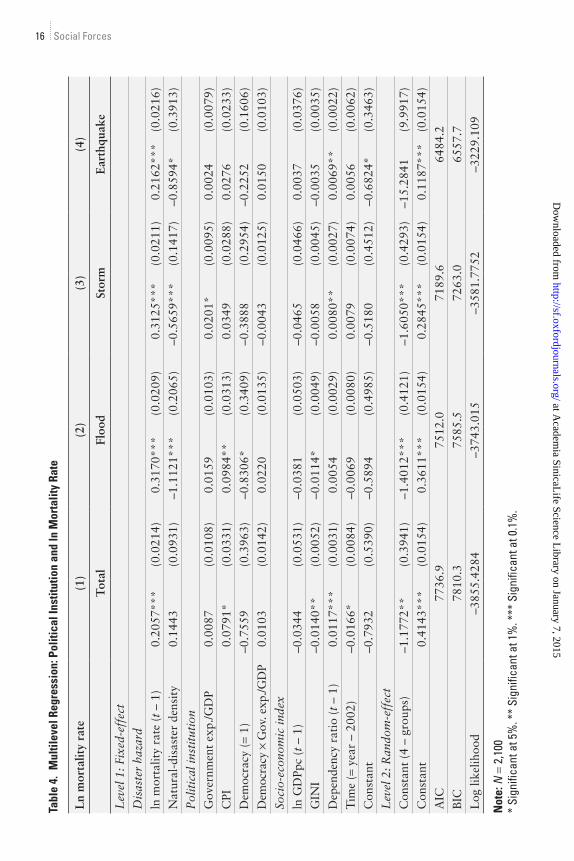
The models [(1) total, (2) flood, (3) storm, and (4) earthquake] in table 4 can be expressed as follows:
Level Fixed effect :1
0 1
−( )= +
ln
ln
mortality rate
mortality rβ β aate t
Government exp GDP
Natural disaster density−( ) +
+
( )1 2
3
β
β ./(( ) + + ( )+ ( ) +
β β
β4 5
6
CPI Democracy
Democracy Government exp GDP× ./ ββ
β β β7
8 9 10
1
1
lnGDPpc t
GINI Dependencyratio t Time
−( )+ + −( ) + ( )
Level Random effect :2 0 0−( ) = +β µ εd ij .
At the first level, I introduced and divided the fixed-effects variables into three sets: (a) the measurements of natural hazards: ln mortality (t – 1) and natural-disaster density; (b) the measurements of political institutions: govern-ment exp./GDP, the CPI, the dummy variable of democracy, and the interaction term “democracy × government exp./GDP”; and (c) the measurements of socio-economic vulnerability: ln GDPpc, GINI, and the dependency ratio. All the measurements of political institutions and socioeconomic vulnerability were the same in the flood, storm, and earthquake models. Moreover, the fixed effect of the time variable from –7 to 7 (years) can be considered as a weak control of the continuous trend of human losses resulting from disasters across the countries.
At the second level, I used a dummy variable d to divide the 150 countries into four groups: democratic developed countries (N = 20 in 2009), democratic developing countries (N = 61), nondemocratic developed countries (N = 4), and nondemocratic developing countries (N = 65). I assumed that, in preventing human losses during natural disasters, the difference among the four groups reflects the intercept μ0d. In addition, models (5–8) in table 5 can be expressed as follows:
Level Fixed effect : 1
0 1
−( )= +
ln
ln
affected rate
affected raβ β tte t mortality rate
Natural disaster density
−( ) +
+ ( ) +
1 2
3
β
β β
ln
44
5 6
7
Government exp GDP
CPI Democracy
Democracy Go
./( )+ + ( )+
β β
β × vvernment exp GDP GDPpc t
GINI Dependency
. ln/( ) + −( )+ +
β
β β8
9 10
1
rratio t Time−( ) + ( )1 11β
Level Random effect :2 0 0−( ) = +β µ εd ij
Governing Natural Disasters 15
at Academ
ia SinicaLife Science L
ibrary on January 7, 2015http://sf.oxfordjournals.org/
Dow
nloaded from
Tabl
e 4.
Mul
tilev
el R
egre
ssio
n: P
oliti
cal I
nstit
utio
n an
d ln
Mor
talit
y Ra
te
Ln
mor
talit
y ra
te(1
)(2
)(3
)(4
)
Tot
alFl
ood
Stor
mE
arth
quak
e
Lev
el 1
: Fix
ed-e
ffec
t
Dis
aste
r ha
zard
ln m
orta
lity
rate
(t
– 1)
0.20
57**
*(0
.021
4)0.
3170
***
(0.0
209)
0.31
25**
*(0
.021
1)0.
2162
***
(0.0
216)
Nat
ural
-dis
aste
r de
nsit
y0.
1443
(0.0
931)
–1.1
121*
**(0
.206
5)–0
.565
9***
(0.1
417)
–0.8
594*
(0.3
913)
Pol
itic
al in
stit
utio
n
Gov
ernm
ent
exp.
/GD
P0.
0087
(0.0
108)
0.01
59(0
.010
3)0.
0201
*(0
.009
5)0.
0024
(0.0
079)
CPI
0.07
91*
(0.0
331)
0.09
84**
(0.0
313)
0.03
49(0
.028
8)0.
0276
(0.0
233)
Dem
ocra
cy (=
1)–0
.755
9(0
.396
3)–0
.830
6*(0
.340
9)–0
.388
8(0
.295
4)–0
.225
2(0
.160
6)
Dem
ocra
cy ×
Gov
. exp
./GD
P0.
0103
(0.0
142)
0.02
20(0
.013
5)–0
.004
3(0
.012
5)0.
0150
(0.0
103)
Soci
o-ec
onom
ic in
dex
ln G
DPp
c (t
– 1
)–0
.034
4(0
.053
1)–0
.038
1(0
.050
3)–0
.046
5(0
.046
6)0.
0037
(0.0
376)
GIN
I–0
.014
0**
(0.0
052)
–0.0
114*
(0.0
049)
–0.0
058
(0.0
045)
–0.0
035
(0.0
035)
Dep
ende
ncy
rati
o (t
– 1
)0.
0117
***
(0.0
031)
0.00
54(0
.002
9)0.
0080
**(0
.002
7)0.
0069
**(0
.002
2)
Tim
e (=
yea
r –
2002
)–0
.016
6*(0
.008
4)–0
.006
9(0
.008
0)0.
0079
(0.0
074)
0.00
56(0
.006
2)
Con
stan
t–0
.793
2(0
.539
0)–0
.589
4(0
.498
5)–0
.518
0(0
.451
2)–0
.682
4*(0
.346
3)
Lev
el 2
: Ran
dom
-eff
ect
Con
stan
t (4
– g
roup
s)–1
.177
2**
(0.3
941)
–1.4
012*
**(0
.412
1)–1
.605
0***
(0.4
293)
–15.
2841
(9.9
917)
Con
stan
t0.
4143
***
(0.0
154)
0.36
11**
*(0
.015
4)0.
2845
***
(0.0
154)
0.11
87**
*(0
.015
4)
AIC
7736
.975
12.0
7189
.664
84.2
BIC
7810
.375
85.5
7263
.065
57.7
Log
like
lihoo
d–3
855.
4284
–374
3.01
5–3
581.
7752
–322
9.10
9
Not
e: N
= 2
,100
* Si
gnifi
cant
at 5
%. *
* Si
gnifi
cant
at 1
%. *
** S
igni
fican
t at 0
.1%
.
16 Social Forces
at Academ
ia SinicaLife Science L
ibrary on January 7, 2015http://sf.oxfordjournals.org/
Dow
nloaded from

Tabl
e 5.
Mul
tilev
el R
egre
ssio
n: P
oliti
cal I
nstit
utio
n an
d ln
Affe
cted
Rat
e
ln a
ffec
ted
rate
(5)
(6)
(7)
(8)
Tot
alFl
ood
Stor
mE
arth
quak
e
Lev
el 1
: Fix
ed-e
ffec
tD
isas
ter
haza
rdln
aff
ecte
d ra
te (
t –
1)0.
2202
***
(0.0
205)
0.22
60**
*(0
.019
2)0.
2673
***
(0.0
195)
0.11
88**
*(0
.020
7)ln
mor
talit
y ra
te–0
.041
0(0
.038
6)–0
.493
9***
(0.0
315)
–0.1
395*
**(0
.027
8)–0
.173
1***
(0.0
210)
Nat
ural
-dis
aste
r de
nsit
y2.
0340
***
(0.1
674)
4.31
49**
*(0
.313
4)3.
5079
***
(0.1
914)
6.42
85**
*(0
.373
9)P
olit
ical
inst
itut
ion
Gov
ernm
ent
exp.
/GD
P–0
.042
1*(0
.019
5)–0
.019
7(0
.015
4)–0
.015
7(0
.012
6)–0
.003
9(0
.007
6)C
PI–0
.031
4(0
.058
2)0.
0776
(0.0
450)
–0.0
031
(0.0
368)
–0.0
370
(0.0
222)
Dem
ocra
cy (=
1)1.
8598
***
(0.5
108)
0.88
45**
(0.3
096)
0.91
34**
*(0
.255
9)0.
0436
(0.1
533)
Dem
ocra
cy ×
Gov
. exp
./GD
P–0
.054
0*(0
.025
5)–0
.033
4(0
.019
7)–0
.042
3**
(0.0
163)
–0.0
051
(0.0
098)
Soci
o-ec
onom
ic in
dex
ln G
DPp
c (t
– 1
)–0
.572
1***
(0.0
957)
–0.4
257*
**(0
.073
6)–0
.100
8(0
.059
8)–0
.020
7(0
.035
9)G
INI
0.05
78**
*(0
.009
3)0.
0220
**(0
.006
7)0.
0085
(0.0
055)
0.00
55(0
.003
3)D
epen
denc
y ra
tio
(t –
1)
–0.0
083
(0.0
055)
–0.0
079
(0.0
043)
–0.0
049
(0.0
035)
–0.0
085*
**(0
.002
1)T
ime
(= y
ear
– 20
02)
0.02
59(0
.015
2)0.
0307
*(0
.012
1)–0
.008
1(0
.009
9)–0
.010
1(0
.006
0)C
onst
ant
4.83
12**
*(0
.897
5)3.
4050
***
(0.6
819)
1.13
28*
(0.5
487)
0.87
58**
(0.3
310)
Lev
el 2
: Ran
dom
-eff
ect
Con
stan
t (4
– g
roup
s)–1
.323
2*(0
.567
7)–2
0.49
26*
(10.
4202
)–1
7.95
02(1
1.47
47)
–20.
9129
*(1
0.56
12)
Con
stan
t1.
0038
***
(0.0
155)
0.77
50**
*(0
.015
4)0.
5786
***
(0.0
154)
0.07
20**
*(0
.015
4)A
IC10
210.
192
42.7
8417
.562
89.8
BIC
1028
9.2
9321
.884
96.6
6368
.9L
og li
kelih
ood
–509
1.03
77–4
607.
3706
–419
4.75
16–3
130.
9162
Not
e: N
= 2
,100
* Si
gnifi
cant
at 5
%. *
* Si
gnifi
cant
at 1
%. *
** S
igni
fican
t at 0
.1%
.
Governing Natural Disasters 17
at Academ
ia SinicaLife Science L
ibrary on January 7, 2015http://sf.oxfordjournals.org/
Dow
nloaded from
Despite the dependent variables, the only difference between the first model and the second model was the ln mortality rate, which was considered as an independent variable in the second model. However, several economists have argued that, in the same year, the impact of large-scale disasters could reduce the annual GDPpc and change the demographic structure (Noy 2009). After consid-ering the endogenous problem, I used ln GDPpc (t – 1) and the dependency ratio (t – 1) to replace the data from the same year.
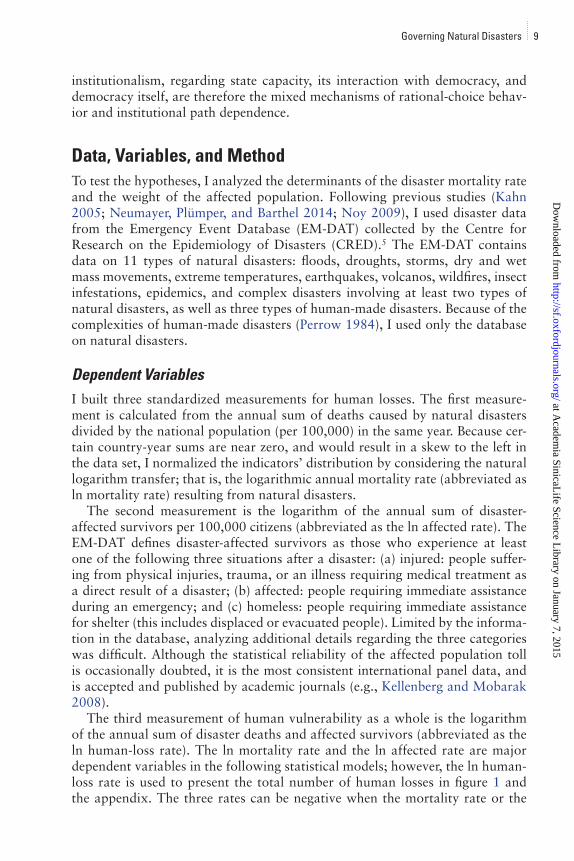
AnalysisDisaster MortalityTable 4 shows the statistical results for the determinants of the ln mortality rate of natural disasters. Model 1 regresses on the dependent variable of 11 types of natural disasters (“Total”), and it shows that the coefficient of democracy was marginally significant (< .1), and negatively associated with the mortality rate (Hypothesis 4). The coefficient of the CPI was positively significant, which implies that an increased degree of political transparency results in reduced cov-erage of the death toll by the government (Hypothesis 5). The coefficient of the dependency ratio revealed a significantly positive impact on the disaster mortal-ity rate (Hypothesis 9). The coefficient of autoregression (t – 1) also revealed a significant continuity of natural-disaster mortality. Contrary to theoretical expectations, the coefficient of government exp./GDP was positive and non-significant, and a high GINI may lead to a low mortality rate. The coefficient of ln GDPpc was nonsignificant as well. Moreover, the negative and significant coefficient of time suggests that the natural-disaster mortality rate continually decreased in 1995–2009.
Table 4 displays the same model of the ln mortality rate for floods, storms, and earthquakes. The results of model 2 for floods were similar to those of the model for total disasters; the coefficients implied that democracy significantly reduced the ln mortality rate, but that political transparency increased the ln mortality rate. The unexpected result of model 2 was that the GINI coefficient was negative and significant for floods. For model 3, which concerns storms, the dependency ratio was a critical determinant of the ln mortality rate; in addition, government exp./GDP was positively associated with the ln mortal-ity rate. Model 4 on earthquakes revealed that the dependency ratio was the only significant variable that increased the ln mortality rate. After comparing the three types of disasters, the model suitably fit floods and storms, and the disaster density was negatively correlated with the ln mortality rate for the three disaster types, suggesting that the frequency of disasters may stimulate the efforts of a country in preparing for natural disasters (Hypothesis 10). The modeling results for the ln mortality rates for the disaster types indicate the prevention effect of democracy and the statistical bias of a less transparent bureaucracy. However, they do not support the disaster-prevention effect of state capacity.
18 Social Forces
at Academ
ia SinicaLife Science L
ibrary on January 7, 2015http://sf.oxfordjournals.org/
Dow
nloaded from
Affected PopulationModel 5 in table 5 shows the determinants’ coefficients regressing on another dependent variable, the ln affected rate of 11 types of natural disasters, and it shows that the coefficient of government exp./GDP was associated with the less affected population during natural disasters (Hypothesis 1). The significantly negative coefficient of the interaction term (democracy × government exp./GDP) confirmed Hypothesis 3: Public spending effectively diminishes the impact of natural disasters on survivors, especially in democracies. After controlling for the ln mortality rate, the significantly positive coefficient of democracy on the ln affected rate matched the explanation provided by Hypothesis 6. The sig-nificant coefficients of ln GDPpc and GINI matched the direction of theoretical expectations, suggesting that economic development reduced the affected popu-lation size (Hypothesis 7), whereas income inequality increased it (Hypothesis 8). Compared with the significantly positive effects of the dependency ratio in the models of the ln mortality rate, the coefficients of the dependency ratio were nonsignificant in the model.
Table 5 shows the same two-level model results of the ln affected rate, specifi-cally for floods, storms, and earthquakes. Model 6 on floods displayed a pattern identical to model 5; the coefficients indicate that, after controlling for the ln mortality rate, democracy contributed to the ln affected rate. At a marginally significant level (< .1), the interaction term (democracy × government exp./GDP) reduced the ln affected rate of floods. The significantly positive coefficient of time suggested an increasing population affected by floods from 1995 to 2009. In model 7 on storms, democracy and the interaction term were significant, and in the same direction of model 5. The coefficients of ln GDPpc and GINI matched the theoretical expectations in model 6, but were relatively more significant in model 7. In model 8 for earthquakes, most variables were nonsignificant; only the coefficient of the dependency ratio was significantly negative, contrary to expectations. For the flood and storm models, although certain coefficients were marginally significant or nonsignificant, the effects of the state and democracy match the theoretical expectations. However, the earthquake model was non-significant. The results of comparing the various types of disasters matched the explanation provided by Hypotheses 10.
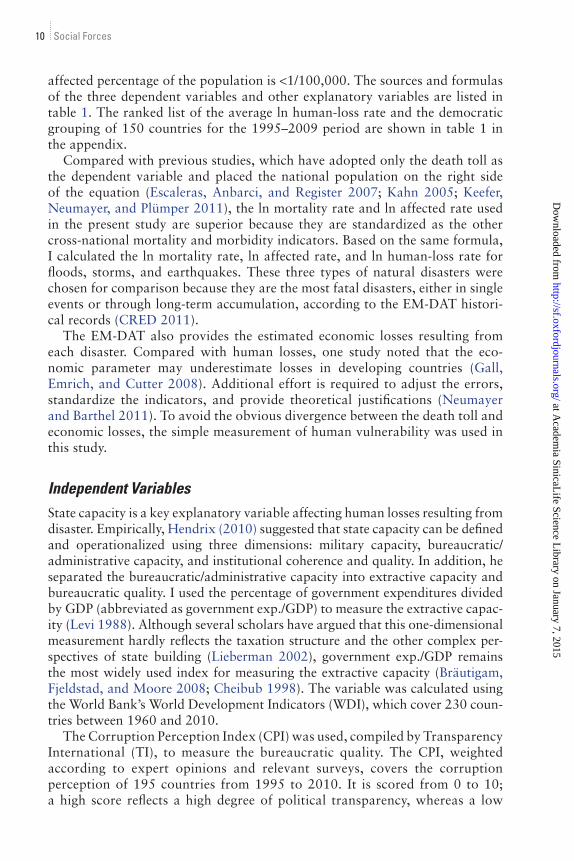
Interaction between Democracy and the StateThe effect of the interaction between state capacity and regime type on human losses resulting from disaster is displayed in figure 2, which shows a compari-son of the various predicted values of the ln mortality rate (model 1) and the ln affected rate (model 5) in democracies and nondemocracies. The x-axis rep-resents the predicted values of the two rates, and the y-axis refers to the gov-ernment exp./GDP. As figure 2 shows, the average estimated value of the ln mortality rate of disasters was substantially lower in democracies than in non-democracies. It also shows that government exp./GDP alone and its interaction with democracy did not affect the ln mortality rate. Instead, in both democracies
Governing Natural Disasters 19
at Academ
ia SinicaLife Science L
ibrary on January 7, 2015http://sf.oxfordjournals.org/
Dow
nloaded from
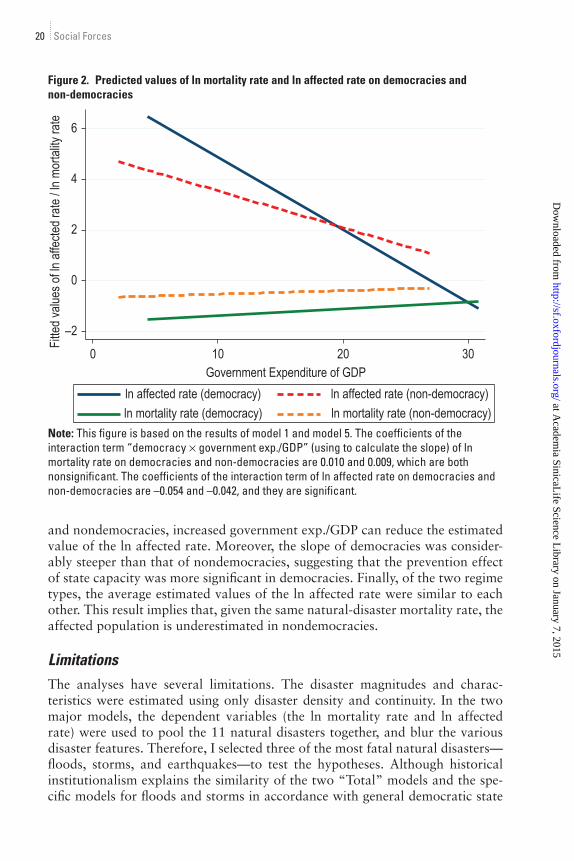
and nondemocracies, increased government exp./GDP can reduce the estimated value of the ln affected rate. Moreover, the slope of democracies was consider-ably steeper than that of nondemocracies, suggesting that the prevention effect of state capacity was more significant in democracies. Finally, of the two regime types, the average estimated values of the ln affected rate were similar to each other. This result implies that, given the same natural-disaster mortality rate, the affected population is underestimated in nondemocracies.
LimitationsThe analyses have several limitations. The disaster magnitudes and charac-teristics were estimated using only disaster density and continuity. In the two major models, the dependent variables (the ln mortality rate and ln affected rate) were used to pool the 11 natural disasters together, and blur the various disaster features. Therefore, I selected three of the most fatal natural disasters—floods, storms, and earthquakes—to test the hypotheses. Although historical institutionalism explains the similarity of the two “Total” models and the spe-cific models for floods and storms in accordance with general democratic state
Figure 2. Predicted values of ln mortality rate and ln affected rate on democracies and non-democracies
–2
0
2
4
6
Fitted
value
s of ln
affec
ted ra
te / ln
mor
tality
rate
0 10 20 30Government Expenditure of GDP
ln affected rate (democracy) ln affected rate (non-democracy)ln mortality rate (democracy) ln mortality rate (non-democracy)
Note: This figure is based on the results of model 1 and model 5. The coefficients of the interaction term “democracy × government exp./GDP” (using to calculate the slope) of ln mortality rate on democracies and non-democracies are 0.010 and 0.009, which are both nonsignificant. The coefficients of the interaction term of ln affected rate on democracies and non-democracies are –0.054 and –0.042, and they are significant.
20 Social Forces
at Academ
ia SinicaLife Science L
ibrary on January 7, 2015http://sf.oxfordjournals.org/
Dow
nloaded from
building and the predictability of natural hazards, the nonsignificant results of the specific models for earthquakes clearly departed from the findings of previ-ous studies (Kahn 2005). The contradictory results among the various types of disasters suggest that superior control variables of the magnitudes of various disaster types should be considered.
Second, some explanatory variables did not match the theoretical expecta-tion. For example, the CPI significantly increases the mortality rate, which sug-gests that political transparency assists to clarify the death toll rather than to improve preparedness. Moreover, the inconsistent statistical results indicate that the socioeconomic factors of human vulnerability are more complex than the theoretical expectations. In the models of ln mortality rates, the coefficients of ln GDPpc were nonsignificant, implying a nonlinear relationship between devel-opment (modernity) and disaster fatality (Kellenberg et al. 2008). Regarding the models for specific disasters, the GINI coefficients in the model for flood mortality, in addition to the coefficient of the dependency ratio in the model for populations affected by earthquakes, ran counter to the theoretically expected directions. The results suggest that, when various types of natural hazards occur, the variables may affect human vulnerability differently.
The model fitness of the ln affected rate was substantially more favorable than that of the ln mortality rate. The differences between the two dependent variables may require further deliberate and detailed analysis; moreover, the timescale of the 1995–2009 period is insufficient for investigating natural-disaster impacts related to long-term institutional changes or trends such as globalization and climate change. This problem may be solved by introducing more complete and newer data sets, especially those considering corruption and inequality. Finally, this empirical study revealed that testing additional sociologi-cal hypotheses, such as cultural and ideological differences regarding disaster politics, is possible. By applying new variables and extending the timescale, the data set can be used to investigate vulnerability and analyze disaster resilience in the future.
ConclusionIn the disaster-politics literature, rational-choice institutionalism effectively explains the differences in disaster losses through the incentive structure of the ruling elites and citizens. However, two puzzles have not been addressed using this path-breaking perspective. Through rational-choice institutionalism, researchers have determined that myopic voters prefer relief spending, rather than prepared-ness spending (Healy and Malhorta 2009), which cannot explain the empirical advantage of a democracy in preventing human losses resulting from disasters (Kahn 2005). Furthermore, most studies of disaster politics neglected to analyze the state.
This study examined the relationship between the state and disaster vulner-ability. From a historical institutionalist approach, I argued that state capacity, regime type, and their interactions determine the scale of human losses. According to similar bounded-rationality assumptions regarding disaster stakeholders,
Governing Natural Disasters 21
at Academ
ia SinicaLife Science L
ibrary on January 7, 2015http://sf.oxfordjournals.org/
Dow
nloaded from
historical institutionalism explains the cross-national differences in mitigation through the intended and unintended effects of political institutions, especially the state. Natural disasters damage the economy and the base of taxation, and occasionally trigger political discontent in the affected population. Asserting gov-ernmental authority and obtaining revenue serve as incentives for the ruling elite to prevent the loss of life and property resulting from natural disasters. In devel-oping countries, however, the elite may allocate resources to other, more press-ing tasks to secure their own political survival (Keefer, Neumayer, and Plümper 2011). Therefore, democracies and nondemocracies may both suffer from disas-ters because of the fragility of the state.
Under military threats, state building (e.g., creating a population registration system, increasing administrative and police personnel, and developing infra-structures) is occasionally effective for evacuations and emergencies in disaster management. Therefore, a stronger state-extractive capacity is robustly asso-ciated with a reduction of human losses that occur during natural disasters. Bureaucratic qualities, such as the administrative transparency and rule of law, effectively prevent political corruption, and correspondingly mitigate the haz-ards of citizens killed by low-quality buildings and infrastructure weakened by corruption (Escaleras, Anbarci, and Register 2007).
Several rational-choice studies have reported that myopic voters prefer engaging in public spending on relief, rather than on preparedness (Healy and Malhorta 2009). From the historical institutionalist perspective, compared to an autocracy, a democracy changes the political elite’s state-building preferences as a whole, such as increasing social spending on firefighting, public health, educa-tion, and pensions, which mitigates the impact of natural disasters on society, especially on the weak and the poor. Consequently, in strong states, especially in democracies, an increased number of lives are saved.
Although its advantage of disaster mitigation may be undermined by myopic politicians and voters, a democracy typically provides a more open political-opportunity structure for civil associations and the mass media. By contrast, an autocracy typically restricts the freedom of association and freedom of speech, even under the threat of disasters; this undermines the accountability and trans-parency of the policymaking process in disaster management, blocks disaster-related information, constrains political entitlements, and manipulates the death toll of the affected population.
To test the hypotheses incorporating the historical institutionalism into the rational-choice perspective, I estimated the multilevel models by using a pooled panel data set of 150 countries from 1995 to 2009. The statistical results sug-gest that a strong state capacity, measured using government exp./GDP, reduces the percentage of the disaster-affected population. Democracies performed more favorably than nondemocracies did in reducing natural-disaster fatality. The entitlement effect, derived from the underestimation of the disaster-affected population by autocracies, reflects the complex relationship between politics and the estimations of disaster impacts, but not to the extent of neutralizing the main mitigation effect of democracy. In addition, the results indicated that state capacity and democracy are more effective in preventing human losses caused
22 Social Forces
at Academ
ia SinicaLife Science L
ibrary on January 7, 2015http://sf.oxfordjournals.org/
Dow
nloaded from
by predictable disasters such as floods and storms, rather than earthquakes. The empirical results confirm the analyses conducted from the historical institution-alism on disaster politics, especially regarding the prevention effects of the state and democracy.
After the catastrophic damage caused by typhoon Haiyan, a perfect storm according to historical records, which claimed more than 6,000 lives in November 2013, a Filipino writer and survivor noted in a publication in the New York Times: “[But] governance is the point.” Instead of blaming the natural, she criticized the patronage politics and human-made damages to the environment. “History is our tsunami, and in our seaside shelters, we keep watching the tide return, wait-ing for our cleansing as bodies drown,” she added (Apostol 2013). For the vic-tims of natural disasters, through historical legacies, a weak state capacity and an irresponsible regime could exacerbate the condition of human vulnerability. Only by carefully identifying and measuring the specific political hazards of previous disaster mitigation and relief strategies can nations avoid a repetition of such political disasters in the future.
Notes1. Following Alexander (1993), the total risk of disasters can be considered as three
components—elements at risk, natural hazard, and “human vulnerability.” Natural hazard can be defined as the threat of a naturally occurring event, and human vul-nerability can be defined as the endogenous potential for human losses in a society (Alexander 2003, 12).
2. The Haiti case exposed the mortality data problem in a fragile state. Based on the aggregation of bodies counted by various agencies, the original official Haitian death toll of 316,000 (adjusted to 230,000 from 2011) has been criticized as an overes-timation. Although the US Geological Survey adopted the official number, a dis-putable report published in 2011 by the US Agency for International Development (USAid) estimated that the death toll was between 46,190 and 84,961. The other scholars indicate that a reasonable interval for the death toll is approximately 130,000–200,000 (Daniell 2011).
3. The population aged 65+ in Japan was approximately 11 percent in 1995 and appro-aching 25 percent in 2011, and 60 and 65 percent of the deaths in the Hanshin earthquake and Tohoku tsunami comprised members of the aged population (Khazai, Daniell, and Wenzel 2011).
4. Disaster researchers have argued that the mortality and morbidity of infants and children are typically suspected of being underestimated in retrospective surveys (Alexander 1985, 57–60; Cairns et al. 2009, 505). According to surveys conducted before the disaster (Daumerie and Hardee 2010; Kolbe and Hutson 2006), 38.4 percent of Haitians were under age 20. A post-earthquake report conducted by the University of Miami Global Institute/Project Medishare (UMGI/PM) indicated that 53.4 percent of the injured were aged < 25, suggesting that victims were relatively young (CDC 2011).
5. For a disaster to be recorded by the EM-DAT, it must fulfill at least one of the following criteria: (a) 10 or more people reported killed; (b) 100 people or more reported affected; (c) declaration of a state of emergency; or (d) call for international assistance.
Governing Natural Disasters 23
at Academ
ia SinicaLife Science L
ibrary on January 7, 2015http://sf.oxfordjournals.org/
Dow
nloaded from
6. I used the software Amelia II developed by King to impute the missing data (King et al. 2001). The variables applied in the imputation of ln GDPpc, the dependency ratio, CPI, government expenditures, and Polity IV (regime type: 0, 1, and 2) are listed as follows: most of the variables were from the WDI and Penn World Table 7.1; two Gini coefficients were from the SWIID; the CPI, total oil supply was from the US Energy Information Agency; three indices were from the Freedom House (political rights, civil liberties, and regime type); and happiness and the Human Development Index (HDI) were from the HDI database. All these ordinary variables have posi-tive values; therefore, I introduced the minimal bound as zero. The Ridge Prior was 2250 × 0.05 = 112.5, and the Seed was equal to 12,457.
About the AuthorThung-Hong Lin is an Associate Research Fellow and Joint Appointment Associate Professor in the Institute of Sociology, Academia Sinica, and National Tsinghua University. He is interested in social stratification, the sociology of disas-ters, and labor studies. Thung-Hong Lin graduated from the HKUST and is active in social movements in Taiwan, Hong Kong, and China. He is also an author of The Generation of Collapse (2011), one of bestselling social-critique books in Taiwan.
24 Social Forces
at Academ
ia SinicaLife Science L
ibrary on January 7, 2015http://sf.oxfordjournals.org/
Dow
nloaded from
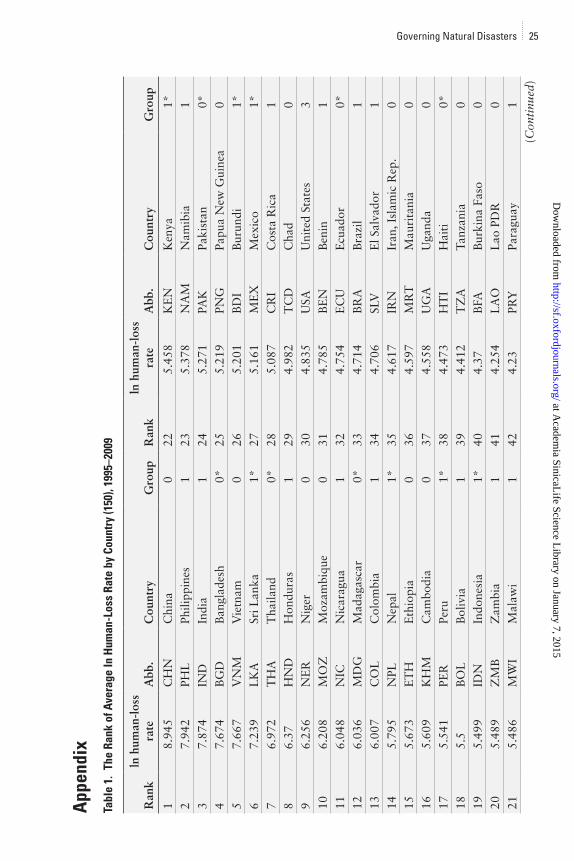
App
endi
xTa
ble
1. T
he R
ank
of A
vera
ge ln
Hum
an-L
oss
Rate
by
Coun
try
(150
), 19
95–2
009
Ran
kln
hum
an-l
oss
rate
Abb
.C
ount
ryG
roup
Ran
kln
hum
an-l
oss
rate
Abb
.C
ount
ryG
roup
18.
945
CH
NC
hina
022
5.45
8K
EN
Ken
ya1*
27.
942
PHL
Phili
ppin
es1
235.
378
NA
MN
amib
ia1
37.
874
IND
Indi
a1
245.
271
PAK
Paki
stan
0*4
7.67
4B
GD
Ban
glad
esh
0*25
5.21
9PN
GPa
pua
New
Gui
nea
05
7.66
7V
NM
Vie
tnam
026
5.20
1B
DI
Bur
undi
1*6
7.23
9L
KA
Sri L
anka
1*27
5.16
1M
EX
Mex
ico
1*7
6.97
2T
HA
Tha
iland
0*28
5.08
7C
RI
Cos
ta R
ica
18
6.37
HN
DH
ondu
ras
129
4.98
2T
CD
Cha
d0
96.
256
NE
RN
iger
030
4.83
5U
SAU
nite
d St
ates
310
6.20
8M
OZ
Moz
ambi
que
031
4.78
5B
EN
Ben
in1
116.
048
NIC
Nic
arag
ua1
324.
754
EC
UE
cuad
or0*
126.
036
MD
GM
adag
asca
r0*
334.
714
BR
AB
razi
l1
136.
007
CO
LC
olom
bia
134
4.70
6SL
VE
l Sal
vado
r1
145.
795
NPL
Nep
al1*
354.
617
IRN
Iran
, Isl
amic
Rep
.0
155.
673
ET
HE
thio
pia
036
4.59
7M
RT
Mau
rita
nia
016
5.60
9K
HM
Cam
bodi
a0
374.
558
UG
AU
gand
a0
175.
541
PER
Peru
1*38
4.47
3H
TI
Hai
ti0*
185.
5B
OL
Bol
ivia
139
4.41
2T
ZA
Tanz
ania
019
5.49
9ID
NIn
done
sia
1*40
4.37
BFA
Bur
kina
Fas
o0
205.
489
ZM
BZ
ambi
a1
414.
254
LA
OL
ao P
DR
021
5.48
6M
WI
Mal
awi
142
4.23
PRY
Para
guay
1(C
onti
nued
)
Governing Natural Disasters 25
at Academ
ia SinicaLife Science L
ibrary on January 7, 2015http://sf.oxfordjournals.org/
Dow
nloaded from
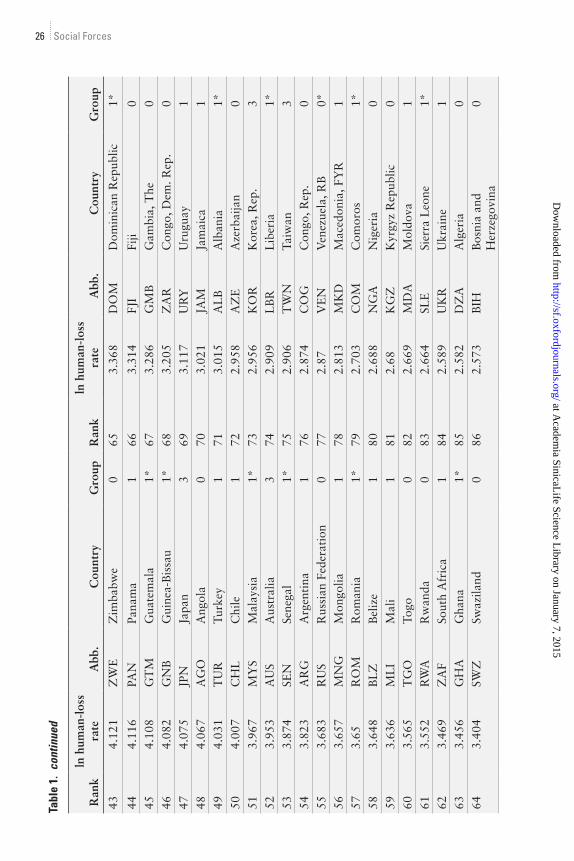
Tabl
e 1.
con
tinue
d
Ran
kln
hum
an-l
oss
rate
Abb
.C
ount
ryG
roup
Ran
kln
hum
an-l
oss
rate
Abb
.C
ount
ryG
roup
434.
121
ZW
EZ
imba
bwe
065
3.36
8D
OM
Dom
inic
an R
epub
lic1*
444.
116
PAN
Pana
ma
166
3.31
4FJ
IFi
ji0
454.
108
GT
MG
uate
mal
a1*
673.
286
GM
BG
ambi
a, T
he0
464.
082
GN
BG
uine
a-B
issa
u1*
683.
205
ZA
RC
ongo
, Dem
. Rep
.0
474.
075
JPN
Japa
n3
693.
117
UR
YU
rugu
ay1
484.
067
AG
OA
ngol
a0
703.
021
JAM
Jam
aica
149
4.03
1T
UR
Turk
ey1
713.
015
AL
BA
lban
ia1*
504.
007
CH
LC
hile
172
2.95
8A
ZE
Aze
rbai
jan
051
3.96
7M
YS
Mal
aysi
a1*
732.
956
KO
RK
orea
, Rep
.3
523.
953
AU
SA
ustr
alia
374
2.90
9L
BR
Lib
eria
1*53
3.87
4SE
NSe
nega
l1*
752.
906
TW
NTa
iwan
354
3.82
3A
RG
Arg
enti
na1
762.
874
CO
GC
ongo
, Rep
.0
553.
683
RU
SR
ussi
an F
eder
atio
n0
772.
87V
EN
Ven
ezue
la, R
B0*
563.
657
MN
GM
ongo
lia1
782.
813
MK
DM
aced
onia
, FY
R1
573.
65R
OM
Rom
ania
1*79
2.70
3C
OM
Com
oros
1*58
3.64
8B
LZ
Bel
ize
180
2.68
8N
GA
Nig
eria
059
3.63
6M
LI
Mal
i1
812.
68K
GZ
Kyr
gyz
Rep
ublic
060
3.56
5T
GO
Togo
082
2.66
9M
DA
Mol
dova
161
3.55
2R
WA
Rw
anda
083
2.66
4SL
ESi
erra
Leo
ne1*
623.
469
ZA
FSo
uth
Afr
ica
184
2.58
9U
KR
Ukr
aine
163
3.45
6G
HA
Gha
na1*
852.
582
DZ
AA
lger
ia0
643.
404
SWZ
Swaz
iland
086
2.57
3B
IHB
osni
a an
d H
erze
govi
na0
26 Social Forces
at Academ
ia SinicaLife Science L
ibrary on January 7, 2015http://sf.oxfordjournals.org/
Dow
nloaded from
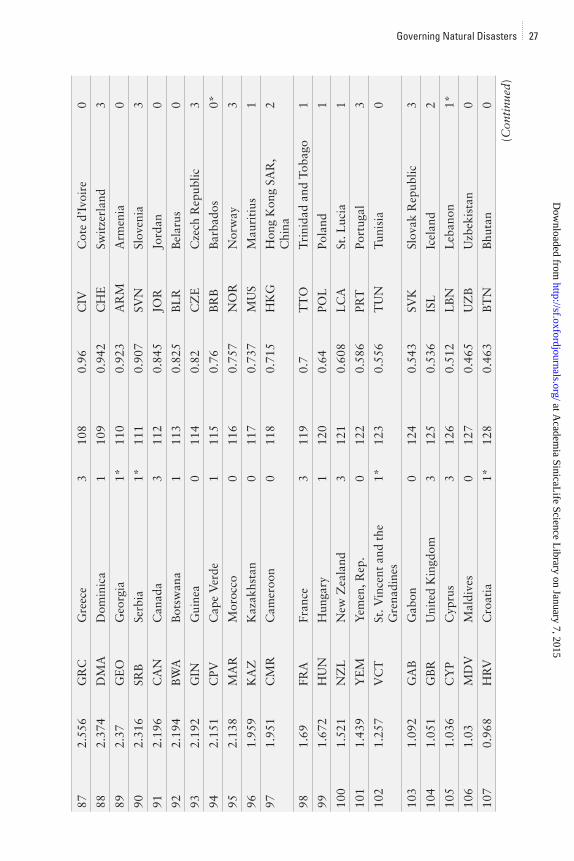
872.
556
GR
CG
reec
e3
108
0.96
CIV
Cot
e d’
Ivoi
re0
882.
374
DM
AD
omin
ica
110
90.
942
CH
ESw
itze
rlan
d3
892.
37G
EO
Geo
rgia
1*11
00.
923
AR
MA
rmen
ia0
902.
316
SRB
Serb
ia1*
111
0.90
7SV
NSl
oven
ia3
912.
196
CA
NC
anad
a3
112
0.84
5JO
RJo
rdan
0
922.
194
BW
AB
otsw
ana
111
30.
825
BL
RB
elar
us0
932.
192
GIN
Gui
nea
011
40.
82C
ZE
Cze
ch R
epub
lic3
942.
151
CPV
Cap
e V
erde
111
50.
76B
RB
Bar
bado
s0*
952.
138
MA
RM
oroc
co0
116
0.75
7N
OR
Nor
way
3
961.
959
KA
ZK
azak
hsta
n0
117
0.73
7M
US
Mau
riti
us1
971.
951
CM
RC
amer
oon
011
80.
715
HK
GH
ong
Kon
g SA
R,
Chi
na2
981.
69FR
AFr
ance
311
90.
7T
TO
Tri
nida
d an
d To
bago
1
991.
672
HU
NH
unga
ry1
120
0.64
POL
Pola
nd1
100
1.52
1N
ZL
New
Zea
land
312
10.
608
LC
ASt
. Luc
ia1
101
1.43
9Y
EM
Yem
en, R
ep.
012
20.
586
PRT
Port
ugal
3
102
1.25
7V
CT
St. V
ince
nt a
nd t
he
Gre
nadi
nes
1*12
30.
556
TU
NTu
nisi
a0
103
1.09
2G
AB
Gab
on0
124
0.54
3SV
KSl
ovak
Rep
ublic
3
104
1.05
1G
BR
Uni
ted
Kin
gdom
312
50.
536
ISL
Icel
and
2
105
1.03
6C
YP
Cyp
rus
312
60.
512
LB
NL
eban
on1*
106
1.03
MD
VM
aldi
ves
012
70.
465
UZ
BU
zbek
ista
n0
107
0.96
8H
RV
Cro
atia
1*12
80.
463
BT
NB
huta
n0
(Con
tinu
ed)
Governing Natural Disasters 27
at Academ
ia SinicaLife Science L
ibrary on January 7, 2015http://sf.oxfordjournals.org/
Dow
nloaded from

Tabl
e 1.
con
tinue
d
Ran
kln
hum
an-l
oss
rate
Abb
.C
ount
ryG
roup
Ran
kln
hum
an-l
oss
rate
Abb
.C
ount
ryG
roup
129
0.34
4M
NE
Mon
tene
gro
1*14
00
GR
DG
rena
da0
130
0.34
1IS
RIs
rael
314
10
MLT
Mal
ta2
131
0.33
9B
EL
Bel
gium
314
2-0
.039
LTU
Lit
huan
ia1
132
0.33
7B
GR
Bul
gari
a1
143
-0.0
55A
UT
Aus
tria
3
133
0.29
9SG
PSi
ngap
ore
214
4-0
.094
TK
MTu
rkm
enis
tan
0
134
0.24
2L
UX
Lux
embo
urg
314
5-0
.12
ESP
Spai
n3
135
0.13
5FI
NFi
nlan
d3
146
-0.1
22D
EU
Ger
man
y3
136
0.09
7N
LD
Net
herl
ands
314
7-0
.256
IRL
Irel
and
3
137
0.03
4E
STE
ston
ia1
148
-0.3
05SW
ESw
eden
3
138
0.01
9IT
AIt
aly
314
9-0
.464
EG
YE
gypt
, Ara
b R
ep.
0
139
0.00
5LV
AL
atvi
a1
150
-0.5
75D
NK
Den
mar
k3
28 Social Forces
at Academ
ia SinicaLife Science L
ibrary on January 7, 2015http://sf.oxfordjournals.org/
Dow
nloaded from
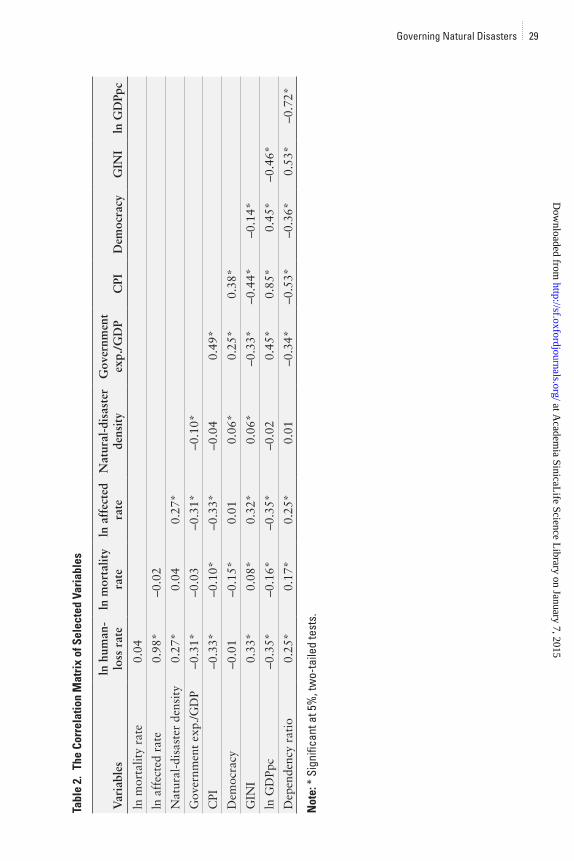
Tabl
e 2.
The
Cor
rela
tion
Mat
rix
of S
elec
ted
Vari
able
s
Var
iabl
esln
hum
an-
loss
rat
eln
mor
talit
y ra
teln
aff
ecte
d ra
teN
atur
al-d
isas
ter
dens
ity
Gov
ernm
ent
exp.
/GD
PC
PID
emoc
racy
GIN
Iln
GD
Ppc
ln m
orta
lity
rate
0.04
ln a
ffec
ted
rate
0.98
*–0
.02
Nat
ural
-dis
aste
r de
nsit
y0.
27*
0.04
0.27
*
Gov
ernm
ent
exp.
/GD
P–0
.31*
–0.0
3–0
.31*
–0.1
0*
CPI
–0.3
3*–0
.10*
–0.3
3*–0
.04
0.49
*
Dem
ocra
cy–0
.01
–0.1
5*0.
010.
06*
0.25
*0.
38*
GIN
I0.
33*
0.08
*0.
32*
0.06
*–0
.33*
–0.4
4*–0
.14*
ln G
DPp
c–0
.35*
–0.1
6*–0
.35*
–0.0
20.
45*
0.85
*0.
45*
–0.4
6*
Dep
ende
ncy
rati
o0.
25*
0.17
*0.
25*
0.01
–0.3
4*–0
.53*
–0.3
6*0.
53*
–0.7
2*
Not
e: *
Sig
nific
ant a
t 5%
, tw
o-ta
iled
test
s.
Governing Natural Disasters 29
at Academ
ia SinicaLife Science L
ibrary on January 7, 2015http://sf.oxfordjournals.org/
Dow
nloaded from
References2004 Indian Ocean earthquake and tsunami. http://en.wikipedia.org/wiki/2004_Indian_Ocean_
earthquake_and_tsunami.2010 Haiti earthquake. http://en.wikipedia.org/wiki/2010_Haiti_earthquake.2011 Tohoku earthquake and tsunami. http://en.wikipedia.org/wiki/2011_T%C5%8Dhoku_earthquake_
and_tsunami.Acemoglu, Daron, and James A. Robinson. 2005. Economic Origins of Dictatorship and Democracy.
TCambridge, UK: Cambridge University Press.Albala-Bertrand, J. M. 1993. Political Economy of Large Natural Disasters. Oxford: Oxford University Press.Aldrich, Daniel P. 2012. Building Resilience: Social Capital in Post-Disaster Recovery. Chicago and London:
University of Chicago Press.Alexander, David E. 1985. “Death and Injury in Earthquakes.” Disasters 9(1):57–60.______. 1993. Natural Disasters. London: UCL Press; New York: Chapman & Hall.______. 1996. “The Health Effects of Earthquakes in the Mid-1990s.” Disasters 20(3):231–47.______. 2003. Confronting Catastrophe. New York: Oxford University Press.Allison, Paul D. 2001. Missing Data. Thousand Oaks, CA: Sage Publications.Anbarci, Nejat, Monica Escaleras, and Charles A. Register. 2005. “Earthquake Fatalities: The Interaction of
Nature and Political Economy.” Journal of Public Economics 89(9–10):1907–33.Apostol, Gina. 2013. “Surrender, Oblivion, Survival.” New York Times, November 16. http://cn.nytimes.
com/opinion/20131116/c16apostol/en-us/.Bechtel, Michael M., and Jens Hainmueller. 2011. “How Lasting Is Voter Gratitude? An Analysis of the Short-
and Long-Term Electoral Returns to Beneficial Policy.” American Journal of Political Science 55(4):852–68.Besley, Timothy, and Robin Burgess. 2002. “The Political Economy of Government Responsiveness: Theory
and Evidence from India.” Quarterly Journal of Economics 117(4):1415–51.Besley, Timothy, and Torsten Persson. 2009. “The Origins of State Capacity: Property Rights, Taxation, and
Politics.” American Economic Review 99(4):1218–44.Block, Fred, and Peter Evans. 2005. “The State and the Economy.” In The Handbook of Economic Sociology,
2nd ed., edited by Neil J. Smelser and Richard Swedberg, 505–26. Princeton: Princeton University Press.Bräutigam, Deborah A., Odd-Helge Fjeldstad, and Mick Moore. 2008. Taxation and State-Building in
Developing Countries: Capacity and Consent. Cambridge, UK: Cambridge University Press.Brooks, Nick, W. Neil Adger, and P. Mick Kelly. 2005. “The Determinants of Vulnerability and Adaptive
Capacity at the National Level and the Implications for Adaptation.” Global Environmental Change Part A 15(2):151–63.
Brown, David S., and Wendy Hunter. 1999. “Democracy and Social Spending in Latin America, 1980–92.” American Political Science Review 93(4):779–90.
Bueno de Mesquita, Bruce, Alastair Smith, Randolph Siverson, and James Morrow. 2003. The Logic of Political Survival. Cambridge, MA: MIT Press.
Burkle, Frederick M. Jr. 2006. “The Globalization of Disaster: Globalization and Disasters: Issues of Public Health, State Capacity, and Political Action.” Journal of International Affairs 59(2, Spring/Summer): 241–65.
Cairns, K. Lisa, Bradley A. Woodruff, Mark Myatt, Linda Bartlett, Howard Goldberg, and Les Roberts. 2009. “Cross-Sectional Survey Methods to Assess Retrospectively Mortality in Humanitarian Emergencies.” Disasters 33(4):503–21.
Centers for Disease Control and Prevention (CDC). 2011. “Post-Earthquake Injuries Treated at a Field Hospital—Haiti 2010.” Morbidity and Mortality Weekly Report (MMWR) 59(51–52):1673–77.
Centre for Research on the Epidemiology of Disasters (CRED). 2011. Emergency Event Database (EM-DAT). http://www.emdat.be/database.
30 Social Forces
at Academ
ia SinicaLife Science L
ibrary on January 7, 2015http://sf.oxfordjournals.org/
Dow
nloaded from
Checchi, Francesco, and Les Roberts. 2008. “Documenting Mortality in Crises: What Keeps Us from Doing Better?” PLoS Medicine 5(7):1025–32.
Cheibub, José Antonio. 1998. “Political Regimes and the Extractive Capacity of Governments: Taxation in Democracies and Dictatorships.” World Politics 50(3):349–76.
Chen, Jowei. 2013. “Voter Partisanship and the Effect of Distributive Spending on Political Participation.” American Journal of Political Science 57(1):200–17.
City of Kobe. 2009. The Great Hanshin-Awaji Earthquake Statistics and Restoration Progress. http://www.city.kobe.lg.jp/safety/.hanshinawaji/revival/promote/img/january.2009.pdf.
Cole, Shawn, Andrew Healy, and Eric Werker. 2012. “Do Voters Demand Responsive Governments? Evidence from Indian Disaster Relief.” Journal of Development Economics 97(2):167–81.
Collinson, Sarah, Samir Elhawary, and Robert Muggah. 2010. “States of Fragility: Stabilization and Its Implications for Humanitarian Action.” Disasters 34(S3):S275–96.
Cutter, Susan L. 1996. “Societal Vulnerability to Environmental Hazards.” International Social Science Journal 47(4):525–36.
Dahl, Robert Alan. 1972. Polyarchy: Participation and Opposition. New Haven, CT: Yale University Press.Daniell, James E. 2011. 2003–2011: The CATDAT Damaging Earthquakes Database. Digital Database,
update v0.0 to latest update v5.024.Daumerie, Beatrice, and Karen Hardee. 2010. The Effects of a Very Young Age Structure on Haiti: Country Case
Study. The Shape of Things to Come Series. http://www.populationaction.org/oldmedia/SOTC_Haiti.pdf.Deaton, Angus. 2003. “Health, Inequality, and Economic Development.” Journal of Economic Literature
41(1):113–58.Deng, Guosheng. 2009. Responding to Wenchuan: An Analysis on Relief Mechanisms in China. Beijing:
Peking University Press (in Chinese).Donner, William, and Havidán Rodríguez. 2008. “Population Composition, Migration, and Inequality: The
Influence of Demographic Changes on Disaster Risk and Vulnerability.” Social Forces 87(2):1089–114.Escaleras, Monica, Nejat Anbarci, and Charles A. Register. 2007. “Public Sector Corruption and Major
Earthquakes: A Potentially Deadly Interaction.” Public Choice 132(1):209–30.Esping-Andersen, Gøsta. 1990. The Three Worlds of Welfare Capitalism. Oxford: Polity Press.Freudenburg, William R., Robert Gramling, Shirley Laska, and Kai T. Erikson. 2009. “Organizing Hazards,
Engineering Disasters: Improving the Recognition of Political-Economic Factors in the Creation of Disasters.” Social Forces 87(2):1015–38.
Gall, M., C. T. Emrich, and S. L. Cutter. 2008. “Toward a Comprehensive Loss Inventory of Weather and Climate Hazards.” In Climate Extremes and Society, edited by H. F. Diaz and R. J. Murnane, 279–95. Cambridge, UK: Cambridge University Press.
Gasper, John T., and Andrew Reeves. 2011. “Make It Rain? Retrospection and the Attentive Electorate in the Context of Natural Disasters.” American Journal of Political Science 55(2):340–55.
Green, Penny. 2005. “Disaster by Design: Corruption, Construction and Catastrophe.” British Journal of Criminal 45(4):528–46.
Hacker, Jacob S. 2004. “Dismantling the Health Care State? Political Institutions, Public Policies, and the Comparative Politics of Health Reform.” British Journal of Political Science 34(4):693–724.
Hall, Peter A., and Rosemary C. R. Taylor. 1996. “Political Science and the Three New Institutionalisms.” Political Studies 44(5):936–57.
Hamm, Patrick, Lawrence P. King, and David Stuckler. 2012. “Mass Privatization, State Capacity, and Economic Growth in Post-Communist Countries.” American Sociological Review 77(2):295–324.
Hass, J. Eugene, Robert W. Kates, and Martyn J. Bowden, eds. 1977. Reconstruction Following Disaster. Cambridge, MA: MIT Press.
Healy, Andrew, and Neil Malhorta. 2009. “Myopic Voters and Natural Disaster Policy.” American Political Science Review 103(3):387–406.
Governing Natural Disasters 31
at Academ
ia SinicaLife Science L
ibrary on January 7, 2015http://sf.oxfordjournals.org/
Dow
nloaded from
Hendrix, Cullen S. 2010. “Measuring State Capacity: Theoretical and Empirical Implications for the Study of Civil Conflict.” Journal of Peace Research 47(3):273–85.
Hendrix, Cullen S., and Idean Salehyan. 2012. “Climate Change, Rainfall, and Conflict in Africa.” Journal of Peace Research 47(1):35–50.
Hewitt, Kenneth. 1998. “Excluded Perspectives in the Social Construction of Disaster.” In What Is a Disaster? edited by E. L. Quarantelli, 75–92. London: Routledge.
Hood, Christopher. 2007. “What Happens When Transparency Meets Blame-Avoidance?” Public Management Review 9(2):191–210.
Jayasuriya, Sisira, and Peter McCawley. 2010. The Asian Tsunami: Aid and Reconstruction after a Disaster. Cheltenham, UK: Asian Development Bank Institute and Edward Elgar Publishing.
Jha, Abhas K., Jennifer Duyne Barenstein, Priscilla M. Phelps, Daniel Pittet, and Stephen Sena. 2010. Safer Homes, Stronger Communities: A Handbook for Reconstructing after Natural Disasters. Washington, DC: World Bank.
Jones, Eric C., and Arthur D. Murphy, eds. 2009. The Political Economy of Hazards and Disasters. Lanham, MD: AltaMira Press.
Kahn, Matthew E. 2005. “The Death Toll from Natural Disasters: The Role of Income, Geography, and Institutions.” Review of Economics and Statistics 87(2):271–84.
Keefer, Philip, Eric Neumayer, and Thomas Plümper. 2011. “Earthquake Propensity and the Politics of Mortality Prevention.” World Development 39(9):1530–41.
Kellenberg, Derek K., and Ahmed Mushfiq Mobarak. 2008. “Does Rising Income Increase or Decrease Damage Risk from Natural Disasters?” Journal of Urban Economics 63(3):788–802.
Khazai, Bijan, James E. Daniell, and Friedemann Wenzel. 2011. “The March 2011 Japan Earthquake: Analysis of Losses, Impacts, and Implications for the Understanding of Risks Posed by Extreme Events.” Technikfolgenabschätzung: Theorie und Praxis 20(3):22–33.
King, Gary, James Honaker, Anne Joseph, and Kenneth Scheve. 2001. “Analyzing Incomplete Political Science Data: An Alternative Algorithm for Multiple Imputation.” American Political Science Review 95(1):49–69.
Kisangani, Emizet F., and Jeffrey Pickering. 2013. “Rebels, Rivals, and Postcolonial State-Building: Identifying Bellicist Influences on State Extractive Capability.” International Studies Quarterly 58(1):187–98.
Kolbe, Athena R., and Royce A. Hutson. 2006. “Human Rights Abuse and Other Criminal Violations in Port-au-Prince, Haiti: A Random Survey of Households.” The Lancet 368(9538):864–73.
Levi, Margaret. 1988. Of Rule and Revenue. Berkeley: University of California Press.Lieberman, Evan S. 2002. “Taxation Data as Indicators of State-Society Relations: Possibilities and Pitfalls
in Cross-National Research.” Studies in Comparative International Development 36(4):89–115.Lin, T.-H. 2012. “Politics of Reconstruction: A Case Study of Earthquake Relief in China.” Taiwanese
Sociological Review 50:57–110 (in Chinese).Lindert, Peter H. 2004. Growing Public: Social Spending and Economic Growth since the Eighteenth
Century. Cambridge, UK: Cambridge University Press.Mann, Michael. 1986. The Sources of Social Power. Cambridge and New York: Cambridge University Press.March, James G., and Johan P. Olsen. 1984. “The New Institutionalism: Organizational Factors in Political
Life.” American Political Science Review 78(September):734–49.Marshall, Monty G., Keith Jaggers, and Ted Robert Gurr. 2006. Polity IV datasets. University of Maryland,
Center for International Development and Conflict Management.Mills, Edward J., Francesco Checchi, James J. Orbinski, Michael J. Schull, Frederick M. Burkle, Chris
Beyrer, Curtis Cooper, Colleen Hardy, Sonal Singh, Richard Garfield, Bradley A. Woodruff, and Gordon H. Guyatt. 2008. “Users’ Guides to the Medical Literature: How to Use an Article about Mortality in a Humanitarian Emergency.” Conflict and Health 2(9):1–9.
32 Social Forces
at Academ
ia SinicaLife Science L
ibrary on January 7, 2015http://sf.oxfordjournals.org/
Dow
nloaded from
National Police Agency of Japan. 2013. Damage Situation and Police Countermeasures Associated with 2011 Tohoku District: Off the Pacific Ocean Earthquake. http://www.npa.go.jp/archive/keibi/biki/higaijokyo_e.pdf.
Neumayer, Eric, and Fabian Barthel. 2011. “Normalizing Economic Loss from Natural Disasters: A Global Analysis.” Global Environmental Change 21(1):13–24. http://ssrn.com/abstract=1720414.
Neumayer, Eric, Thomas Plümper, and Fabian Barthel. 2014. “The Political Economy of Natural Disaster Damage.” Global Environmental Change 24(1):8–19.
Newbrander, William, Ronald Waldman, and Megan Shepherd-Banigan. 2011. “Rebuilding and Strengthening Health Systems and Providing Basic Health Services in Fragile States.” Disasters 35(4):639–60.
North, Douglass C. 1990. Institutions, Institutional Change, and Economic Performance. Cambridge, UK: Cambridge University Press.
Noy, Ilan. 2009. “The Macroeconomic Consequences of Disasters.” Journal of Development Economics 88(2):221–31.
Oliver-Smith, Anthony. 1996. “Anthropological Research on Hazards and Disasters.” Annual Review of Anthropology 25(1):303–28.
Olson, Mancur. 2000. Power and Prosperity: Outgrowing Communist and Capitalist Dictatorships. New York: Basic Books.
Organization for Economic Cooperation and Development (OECD). 2008. State Building in Fragile States. London: Kogan Page.
Pelling, Mark. 2003. The Vulnerability of Cities: Natural Disasters and Social Resilience. London: Earthscan.Perrow, Charles. 1984. Normal Accidents: Living with High-Risk Technologies. New York: Basic Books.Przeworski, Adam, Michael E. Alvarez, José Antonio Cheibub, and Fernando Limongi. 2000. Democracy
and Development; Political Institutions and Well-Being in the World, 1950–1990. New York: Cambridge University Press.
Putnam, Robert D. 1993. Making Democracy Work: Civic Traditions in Modern Italy. Princeton, NJ: Princeton University Press.
Raudenbush, Stephen W., and Anthony S. Bryk. 2002. Hierarchical Linear Models: Application and Data Analysis Methods. Thousand Oaks, CA: Sage.
Rose-Ackerman, Susan. 1978. Corruption: A Study in Political Economy. New York: Academic Press.Rubin, Donald B. 1976. “Inference and Missing Data.” Biometrika 63(3):581–92.Seitz, Steven Thomas, and Morris Davis. 1984. “The Political Matrix of Natural Disasters: Africa and Latin
America.” International Journal of Mass Emergencies and Disasters 2(2):231–50.Sen, Amartya. 1981. Poverty and Famines: An Essay on Entitlement and Deprivation. Oxford: Oxford
University Press.Skocpol, Theda. 1985. “Bringing the State Back In: Strategies of Analysis in Current Research.” In Bringing
the State Back In, edited by P. B. Evans, D. Rueschemeyer, and T. Skocpol, 3–37. New York: Cambridge University Press.
Solt, Frederick. 2009. “Standardizing the World Income Inequality Database (SWIID Version 3.1, December 2011).” Social Science 90(2):231–42.
Thelen, Kathleen. 1999. “Historical Institutionalism in Comparative Politics.” Annual Review of Political Science 2:369–404.
Thies, Cameron G. 2007. “The Political Economy of State Building in Sub-Saharan Africa.” Journal of Politics 69(3):716–31.
Tilly, Charles. 1992. Coercion, Capital, and European States, AD 990–1992. Malden, MA: Wiley-Blackwell.______. 2007. Democracy. Cambridge, UK: Cambridge University Press.Transparency International. 2010. Transparency International Corruption Perceptions Index (CPI). http://
www.transparency.org/research/cpi/.
Governing Natural Disasters 33
at Academ
ia SinicaLife Science L
ibrary on January 7, 2015http://sf.oxfordjournals.org/
Dow
nloaded from

Weber, Max. 1958. From Max Weber: Essays in Sociology, translated by Hans Heinrich Gerth, and Charles Wright Mills. New York: Oxford University Press.
Weingast, Barry R. 1996. “Political Institutions: Rational Choice Perspectives.” In A New Handbook of Political Science, edited by Robert E. Goodin and Hans-Dieter Klingemann, 167–90. Oxford: Oxford University Press.
Wildavsky, Aaron B. 1988. Searching for Safety. New Brunswick and London: Transaction Books.Wisner, Ben, Piers Blaikie, Terry Cannon, and Ian Davis. 2004. At Risk: Natural Hazards, People’s
Vulnerability, and Disasters. New York: Routledge.World Bank. 2010. World Development Indicators (WDI). http://devdata.worldbank.org/data-query/.Yang, Dali L. 1996. Calamity and Reform in China: State, Rural Society, and Institutional Change since the
Great Leap Famine. Stanford, CA: Stanford University Press.
34 Social Forces
at Academ
ia SinicaLife Science L
ibrary on January 7, 2015http://sf.oxfordjournals.org/
Dow
nloaded from
Copyright © 2022 FDOKUMEN