Good prospect of ionic liquid based–poly(vinyl alcohol) polymer electrolytes for supercapacitors...
11
Good prospect of ionic liquid based-poly(vinyl alcohol) polymer electrolytes for supercapacitors with excellent electrical, electrochemical and thermal properties Chiam-Wen Liew, S. Ramesh*, A.K. Arof Centre for Ionics University of Malaya, Department of Physics, Faculty of Science, University of Malaya, Lembah Pantai, 50603 Kuala Lumpur, Malaysia article info Article history: Received 29 November 2012 Received in revised form 26 April 2013 Accepted 14 June 2013 Available online 8 July 2013 Keywords: PVA Ionic liquid Polymer electrolyte Supercapacitor Specific capacitance abstract Poly(vinyl alcohol) (PVA)/ammonium acetate (CH 3 COONH 4 )/1ebutyle3emethylimi dazolium chloride (BmImCl) based polymer electrolytes were prepared by solution casting method. The ionic conductivity increased with temperature as shown in temperature dependent-ionic conductivity study. The maximum ionic conductivity of (7.31 0.01) mS cm 1 was achieved at 120 C upon adulteration of 50 wt% of BmImCl. The samples obeyed VogeleTammaneFulcher (VTF) relationship. The glass transition temperature (T g ) of the polymer matrix was reduced by doping it with salt and ionic liquid as shown in differential scanning calorimetry (DSC). Supercapacitor was thus assembled. Wider po- tential stability range has been observed with addition of ionic liquid. Inclusion of ionic liquid also improved the electrochemical behavior of EDLC. The capacitance of super- capacitor were determined by cyclic voltammetry, electrochemical impedance spectros- copy and galvanostatic chargeedischarge tester. The cell also illustrated energy density of 2.39 Wh kg 1 and power density of 19.79 W kg 1 with Coulombic efficiency above 90%. Copyright ª 2013, Hydrogen Energy Publications, LLC. Published by Elsevier Ltd. All rights reserved. 1. Introduction As the world paces towards green technology, the imple- mentation of environmentally friendly materials in manufacturing is an alternative way to reduce environmental issues of plastic waste disposal throughout all phases of the product life cycle. Therefore, biodegradable polymers have received an upsurge of interest nowadays in replacing those environmentally unfriendly polymers. Among biodegradable synthetic polymer, poly(vinyl alcohol) (PVA) is a multitalented material with excellent tensile strength and high ability to form transparent film [1]. PVA has merits of being a host polymer due to its availability, good optical properties, cost effectiveness, non-toxicity, high hydrophilicity and good mechanical strength as well as high temperature resistance [2,3]. PVA also possesses some inherent characteristics, viz. biocompatible, ease of preparation, high abrasion resistance and high flexibility with superior chemical and thermal sta- bilities [4,5]. Other reasons for choosing PVA as host polymer are greater extent of polar groups (hydroxyl group) and high chain flexibility which promotes the salt-solvation [6]. High dielectric constant, excellent charge storage capacity and * Corresponding author. Tel.: þ60 3 7967 4391; fax: þ60 3 7967 4146. E-mail addresses: [email protected] (C.-W. Liew), [email protected] (S. Ramesh), [email protected] (A.K. Arof). Available online at www.sciencedirect.com journal homepage: www.elsevier.com/locate/he international journal of hydrogen energy 39 (2014) 2953 e2963 0360-3199/$ e see front matter Copyright ª 2013, Hydrogen Energy Publications, LLC. Published by Elsevier Ltd. All rights reserved. http://dx.doi.org/10.1016/j.ijhydene.2013.06.061
-
Upload
independent -
Category
Documents
-
view
1 -
download
0
Transcript of Good prospect of ionic liquid based–poly(vinyl alcohol) polymer electrolytes for supercapacitors...
ww.sciencedirect.com
i n t e r n a t i o n a l j o u r n a l o f h y d r o g e n en e r g y 3 9 ( 2 0 1 4 ) 2 9 5 3e2 9 6 3
Available online at w
journal homepage: www.elsevier .com/locate/he
Good prospect of ionic liquid based-poly(vinylalcohol) polymer electrolytes for supercapacitorswith excellent electrical, electrochemical andthermal properties
Chiam-Wen Liew, S. Ramesh*, A.K. Arof
Centre for Ionics University of Malaya, Department of Physics, Faculty of Science, University of Malaya, Lembah
Pantai, 50603 Kuala Lumpur, Malaysia
a r t i c l e i n f o
Article history:
Received 29 November 2012
Received in revised form
26 April 2013
Accepted 14 June 2013
Available online 8 July 2013
Keywords:
PVA
Ionic liquid
Polymer electrolyte
Supercapacitor
Specific capacitance
* Corresponding author. Tel.: þ60 3 7967 439E-mail addresses: liewchiamwen85@gma
0360-3199/$ e see front matter Copyright ªhttp://dx.doi.org/10.1016/j.ijhydene.2013.06.0
a b s t r a c t
Poly(vinyl alcohol) (PVA)/ammonium acetate (CH3COONH4)/1ebutyle3emethylimi
dazolium chloride (BmImCl) based polymer electrolytes were prepared by solution casting
method. The ionic conductivity increased with temperature as shown in temperature
dependent-ionic conductivity study. The maximum ionic conductivity of (7.31 � 0.01)
mS cm�1 was achieved at 120 �C upon adulteration of 50 wt% of BmImCl. The samples
obeyed VogeleTammaneFulcher (VTF) relationship. The glass transition temperature (Tg)
of the polymer matrix was reduced by doping it with salt and ionic liquid as shown in
differential scanning calorimetry (DSC). Supercapacitor was thus assembled. Wider po-
tential stability range has been observed with addition of ionic liquid. Inclusion of ionic
liquid also improved the electrochemical behavior of EDLC. The capacitance of super-
capacitor were determined by cyclic voltammetry, electrochemical impedance spectros-
copy and galvanostatic chargeedischarge tester. The cell also illustrated energy density of
2.39 Wh kg�1 and power density of 19.79 W kg�1 with Coulombic efficiency above 90%.
Copyright ª 2013, Hydrogen Energy Publications, LLC. Published by Elsevier Ltd. All rights
reserved.
1. Introduction form transparent film [1]. PVA has merits of being a host
As the world paces towards green technology, the imple-
mentation of environmentally friendly materials in
manufacturing is an alternative way to reduce environmental
issues of plastic waste disposal throughout all phases of the
product life cycle. Therefore, biodegradable polymers have
received an upsurge of interest nowadays in replacing those
environmentally unfriendly polymers. Among biodegradable
synthetic polymer, poly(vinyl alcohol) (PVA) is a multitalented
material with excellent tensile strength and high ability to
1; fax: þ60 3 7967 4146.il.com (C.-W. Liew), rame2013, Hydrogen Energy P61
polymer due to its availability, good optical properties, cost
effectiveness, non-toxicity, high hydrophilicity and good
mechanical strength as well as high temperature resistance
[2,3]. PVA also possesses some inherent characteristics, viz.
biocompatible, ease of preparation, high abrasion resistance
and high flexibility with superior chemical and thermal sta-
bilities [4,5]. Other reasons for choosing PVA as host polymer
are greater extent of polar groups (hydroxyl group) and high
chain flexibility which promotes the salt-solvation [6]. High
dielectric constant, excellent charge storage capacity and
[email protected] (S. Ramesh), [email protected] (A.K. Arof).ublications, LLC. Published by Elsevier Ltd. All rights reserved.

Table 1 e Nomenclature and weight percent of thematerials added in the ionic liquid basedePVA polymerelectrolytes.
Designations Weight percent ofPVAeCH3COONH4eBmImCl
PVA(wt%)
CH3COONH4
(wt%)BmImCl(wt%)
CL 0 70 30 0
CL 2 56 24 20
CL 5 35 15 50
CL 6 28 12 60
i n t e rn a t i o n a l j o u r n a l o f h y d r o g e n en e r g y 3 9 ( 2 0 1 4 ) 2 9 5 3e2 9 6 32954
dopantedependent electrical properties make PVA as a
promising candidate in the development of electrochemical
devices, especially EDLC and fuel cell applications [7].
Ammonium acetate is selected as doping salt in this current
project. Ammonium acetate (CH3COONH4) is chosen due to its
plasticizing effect. Besides, the acetate anion (CH3COO�) is
preferred in salt-solvation through hydrogen bonding.
The PVAeCH3COONH4 polymer system has been widely
investigated by G. Hirankumar and his co-workers [6e8].
However, the ionic conductivity is still too low and it is not
applicable in the electrochemical devices. Therefore, several
ways have been employed to improve the ionic conductivity,
such as polymer blending, addition of plasticizers, impreg-
nation of ionic liquids and doping of fillers. Among all the
methods, addition of ionic liquid is the most viable technique
to enhance the ionic conductivity because of its strong plas-
ticizing effect, environmental friendly nature and high ion
content. Ionic liquid is generally defined as a type of molten
salt composed solely of ions. Other features of ionic liquid are
excellent thermal stability, negligible vapor pressure, non-
volatile, low melting point, non-flammable, low viscosity,
wider electrochemical potential window and high ionic con-
ductivity [9]. The objective of this present work is to prepare
an environmentally friendly polymer electrolyte with superior
electrical, thermal and electrochemical properties. Another
aim is to investigate the effect of ionic liquid onto the polymer
electrolytes and supercapacitors. In this paper, we report the
effect of ionic liquid on the PVAeCH3COONH4 polymer elec-
trolytes in supercapacitor application. Supercapacitor (or
known as electrical double layer capacitor, EDLC) is fabricated
using the highest conducting polymer membrane in this
present work. Supercapacitor is the preferred choice
compared to secondary batteries owing to the longer cycle life
(>105 cycles), higher power density, higher capacitive density
and faster chargeedischarge rate as well as higher ability to be
charged and discharged continuously without degrading [10].
Fig. 1 e The image of ionic liquidebased PVA polymer
electrolyte.
2. Experimental
2.1. Materials
Polymer electrolytes containing PVA, CH3COONH4 and
1ebutyle3emethylimidazolium chloride (BmImCl) were pre-
pared in this current work. Synthetic biodegradable polymer,
PVA (SigmaeAldrich, USA, 99% hydrolyzed with molecular
weight of 130000 g mol�1), CH3COONH4 (Sigma, Japan) and
BmImCl (Acros organic, USA) were used as host polymer, salt
and ionic liquid, respectively. All the materials were used as
received.
2.2. Preparation of ionic liquid based-poly(vinyl alcohol)polymer electrolytes
Ionic liquid based-poly(vinyl alcohol) polymer electrolytes
were prepared bymeans of solution casting. Table 1 shows the
weight proportion of PVA, CH3COONH4 and BmImCl added
into the polymer electrolytes and the designations of the
polymer complexes. PVA was initially dissolved in distilled
water. Appropriate amount of CH3COONH4 was subsequently
mixed in PVA solution. The weight ratio of PVA:CH3COONH4
was kept at 70:30. Different weight ratio of BmImCl was thus
added into the PVAeCH3COONH4 mixture to prepare ionic
liquid-based polymer electrolyte. The resulting solution was
stirred thoroughly and heated at 70 �C for few hours until a
homogenous colorless solution was obtained. The solution
was eventually casted on glass Petri dish and dried in an oven
at 60 �C. A free-standing polymer electrolyte filmwas obtained
and shown in Fig. 1.
2.3. Characterization of ionic liquid based-PVA polymerelectrolytes
2.3.1. Temperature dependence-ionic conductivity studiesFreshly prepared samples were subjected to ac-impedance
spectroscopy for ionic conductivity measurements. Digital
micrometer screw gauge was used to determine the thickness
of the samples. The ionic conductivity of the polymer electro-
lytes was measured by HIOKI 3532-50 LCR HiTESTER imped-
ance analyzer over a frequency range between 50Hz and 5MHz
from ambient temperature to 120 �C at a signal level of 10 mV.
Polymer electrolytes were placed on the sample holder under
spring pressure in the configuration of stainless steel (SS)
blocking electrode/polymer electrolyte/SS electrode.
2.3.2. Differential scanning calorimetry (DSC)DSC analysis was carried out by TA Instrument Universal
Analyzer 200 which consists of DSC Standard Cell FC as main

i n t e r n a t i o n a l j o u r n a l o f h y d r o g e n en e r g y 3 9 ( 2 0 1 4 ) 2 9 5 3e2 9 6 3 2955
unit and Universal V4.7A software. The whole analysis was
conducted in a nitrogen atmosphere with a flow rate of
60 ml min�1. Samples weighing 3e5 mg were hermetically
sealed in the aluminum Tzero pan, while, an empty
aluminum pan was hermetically sealed as reference cell. In
order to remove any trace amount of water and moisture, the
samples were heated from 25 �C to 105 �C at a heating rate of
10 �Cmin�1. The heating process wasmaintained at 105 �C for
5 min to ensure the complete evaporation. Beyond this step,
an equilibrium stage was achieved at 25 �C. After that, the
samples were heated from 25 �C to 150 �C and followed up
with a rapid cooling process to �50 �C at the pre-set heating
rate. The samples were eventually reheated to 150 �C at the
same heating rate. Glass transition temperature (Tg) was
evaluated using the final heating scan with the provided
software.
2.4. Electrodes preparation
The activated carbon-based EDLC electrodeswere prepared by
dip coating technique. The carbon slurry was prepared by
mixing 80 wt% of activated carbon (Kuraray Chemical Co Ltd.,
Japan, particle size is 5 w 20 mm, surface area is
1800 w 2000 m2 g�1), 10 wt% of carbon black (known as Super
P) and 10 wt% of poly(vinylidene fluoride) (PVdF) binder (mo-
lecular weight of 534000 g mol�1 from Aldrich) in 1-methyl-2-
pyrrolidone (Purity� 99.5% fromMerck, Germany). This slurry
was stirred thoroughly for several hours at ambient temper-
ature until homogenous slurry with smooth surface is ob-
tained. The aluminum electrode mesh and the slurry were
then subjected to dip coater for dip coating process. The speed
of lifting up and down is 90 mm s�1; meanwhile the duration
for the dipping process is 15 s. The coated electrodes were
dried in an oven at 70 �C for drying process. The weight of
electrode materials was evaluated including the binder and
super P.
2.5. EDLC fabrication
EDLC cell was fabricated by sandwiching the polymer elec-
trolyte between two symmetrical activated carbon-based
electrodes. The cell was then pressed by hydraulic hand
pump at 1MPa to ensure good contact between electrolyte and
electrode. The EDLC cell configuration was eventually placed
in a cell kit for further electrochemical analyses.
2.6. EDLC characterization
The EDLC cell was subsequently subjected to linear sweep vol-
tammetry (LSV), cyclic voltammetry (CV), electrochemical
impedance spectroscopy (EIS) and galvanostatic char-
geedischarge (GCD) tester for electrochemical characterization.
The effect of ionic liquid was investigated for all of these elec-
trochemical analysesbyassembling twodifferentEDLCs, except
GCD study. The cells using the polymer electrolyte without
doping of ionic liquid (denoted as CL 0) is designated as type I
supercapacitor, whereas the one using the most conducting
ionic liquid-based polymer electrolyte is assigned as type II
supercapacitor.
2.6.1. Linear sweep voltammetry (LSV)The LSV responses of CL 0 and CL 5 were accomplished using
CHI600D electrochemical analyzer. These cells were analyzed
at a scan rate of 5 mV s�1 with the configuration of stainless
steel (SS)/polymer electrolyte/SS in the potential range of
�3 V. The sample interval was 0.001 V with 2 s as the rest time
prior to the analysis.
2.6.2. Cyclic voltammetry (CV)CHI600D electrochemical analyzer was also used to scrutinize
CV measurement of EDLC. Initially, the cell was at rest for 2 s.
The EDLC cell was then evaluated at 10mV s�1 scan rate in the
potential range between 0 and þ1 V with sample interval of
0.001 V. The specific capacitance (Csp) of EDLC was calculated
using the following equation [11,12]:
Csp ¼ ism
(1)
where i is the average anodicecathodic current (A), s is the
potential scan rate (V s�1) and m is the average mass of active
materials (including the binder and super P). The average
mass of electrode materials is around 0.015 g.
2.6.3. Electrochemical impedance spectroscopy (EIS)The impedance spectroscopy was probed by HIOKI 3522-50
LCR HiTESTER impedance analyzer at room temperature with
a bias voltage of 10mV. The EISmeasurement was done in the
frequency range of 10 mHze100 kHz. The capacitance, C was
determined from the impedance data at a frequency of
10 mHz using the following equation [13]:
C ¼ � 1uZ00 ¼ � 1
2pf � Z00 (2)
where u is angular frequency, which is represented by 2pf and
Z00 is the imaginary part of the total impedance (Z ). The spe-
cific capacitance of EDLC was calculated by dividing the
capacitancewith averageweight of activematerials (including
the binder and super P). The average weight of electrode ma-
terials is 0.02 g.
2.6.4. Galvanostatic chargeedischarge performance (GCD)The chargeedischarge studywas performed using the Neware
battery cycler. The EDLC was charged and discharged at cur-
rent of 1 mA. EDLC is allowed to rest for 30 min prior to the
measurement. The specific discharge capacitance (Csp) was
obtained from chargeedischarge curves, according to
following relation [12]:
Csp ¼ I
m�dVdt
� (3)
where I is the applied current (A), m is the average mass of
electrode materials (including the binder and super P), dV rep-
resents the potential change of a discharging process excluding
the internal resistance drop occurring at the beginning of the
cell discharge and dt is the time interval of discharging process.
The dV/dt is determined from the slope of the discharge curve.
The electrode used in this study is in 0.02 g.
Energy density (E, W h kg�1), power density (P, W kg�1) and
Coulombic efficiency (h, %) were assessed from the equations
below [14]:

i n t e rn a t i o n a l j o u r n a l o f h y d r o g e n en e r g y 3 9 ( 2 0 1 4 ) 2 9 5 3e2 9 6 32956
E ¼ Csp � ðdVÞ2 � 1000(4)
2 3600
P ¼ I� dV2�m
� 1000 (5)
h ¼ tdtc� 100 (6)
where td and tc are the discharging time and charging time,
respectively.
3. Results and discussion
3.1. Temperature dependence-ionic conductivity studies
Fig. 2 portrays the ionic conductivity of ionic liquid doped
polymer electrolytes and ionic liquid free-based polymer
electrolyte in the temperature regime between ambient tem-
perature and 120 �C. Upon addition of BmImCl, the ionic
conductivity is greatly enhanced by comparing CL 0 with CL 2,
CL 5 and CL 6. Strong plasticizing effect of ionic liquid is the
main contributor in this phenomenon [15]. The polymer
chains could be more flexible in the presence of ionic liquid.
So, the flexible polymer backbone increases the segmental
motion of the polymer matrix and hence assists the ionic
transportation which confers with high ionic conductivity.
Incorporation of ionic liquid also reduces the glass transition
temperature (Tg). Lower Tg would promote the rubbery phase
formation which constrains the crystalline degree of polymer
electrolytes in conjunction with higher amorphous propor-
tion. Higher amorphousness of polymer complexes initiates
the breakdown of transient coordination bonds between
charge carriers (or more preferably known as cation) and ox-
ygen from hydroxyl group in PVA. Therefore, more mobile
charge carriers can be migrated within the vicinity of the
unordered arrangement of the macromolecules. As a result,
higher ionic conductivity is obtained. Apart from that, the
ionic liquids help in deteriorating the coordinative bonding
between proton and the weakly bonded polar group in the
polymer chains. Consequently, the protons are free tomigrate
from one site to another site [9].
According to Kumar et al., the incorporation of ionic liquid
can alter the electrical properties in different ways, for
y = -1.1567x - 0.8177R² = 0.9009
y = -0.2946x - 1.9957R² = 0.9596
y = -0.1185x - 1.8214R² = 0.8872
y = -0.2852x - 2.1061R² = 0.9805
-5.00
-4.50
-4.00
-3.50
-3.00
-2.50
-2.00
2.5 2.6 2.7 2.8 2.9 3 3.1 3.2 3.3 3.4
log
[(
Scm
-1)]
1000/T (K-1)
CL 0 CL 2 CL 5 CL 6
σ
Fig. 2 e The Arrhenius plots of the ionic conductivity with
different mass fraction of BmImCl doped in the polymer
electrolytes over a wide temperature range.
example bigger size of anion will dissociate the cations easily
[16]. In this present work, the bulky group of BmImþ also helps
in improving the ionic conductivity by producing free volume
for conduction [16]. Moreover, the physicochemistry of ionic
liquid such as viscosity and dielectric constant also contrib-
utes to the increase in ionic conductivity. Lower viscosity of
ionic liquid also enhances the polymer chain flexibility.
Therefore, this flexible polymer backbone could interrupt the
ion-polymer bonding and promote the ionic conducting pro-
cess [16]. In contrast, high dielectric permittivity of ionic liquid
plays an important role to separate the ion pairs and/or ion
aggregateswith high self-dissociating properties. Moremobile
cations are consequently producedwhich leads to higher ionic
conductivity [16]. In addition, the ionic conductivity rises with
the ionic liquid concentration, as shown in CL 2 and CL 5 plots.
The same explanations as aforementioned also applied onto
this increase in ionic conductivity, such as increase in amor-
phous region and plasticizing effect of ionic liquid. The high-
est ionic conductivity of (7.31 � 0.01) mS cm�1 has been
achieved by adding 50 wt% of BmImCl at 120 �C. However, the
ionic conductivity is decreased with further incorporation of
BmImCl as shown in Fig. 2.
A moderate increase in ionic conductivity with a gradual
increase in temperature is observed in Fig. 2. This is principally
due to the fast vibrationmodes of themolecules in the polymer
membrane upon heating. Rapid vibration mode of the macro-
molecules promotes the bond rotation within the polymer
matrix. The cations coupling with higher polymer segmental
mobility can be detached from the coordination bond with the
oxygen in PVA easily at elevated temperature. Therefore, ionic
transportation is enhanced with increasing temperature. In
addition, the amplitude of the molecular vibration increases
with temperature. Therefore, the thermal vibration improves
the decoupling rate of cation from transient coordination
bonding with anion. More cations can be transported within
the polymer electrolytes with higher decoupling rate. Since the
number of mobile cations which is responsible for ionic
transportation is higher, thus more ionic conduction in the
polymer electrolytes would be generated. So, as expected,
higher ionic conductivity is attained in this study. Apart from
that, the polymer membrane could be expanded due to higher
amplitude of oscillation mode at elevated temperature. This
thermal expansion creates free spaces for conduction mecha-
nism. As a consequence, the charge carriers are decoupled and
hence transported easily, contributing to increase in ionic
conductivity with reciprocal of temperature.
Fig. 2 illustrates positively curved plot for all the samples
where its regression value is far away from unity [17]. These
non-linear variations reflect that all the polymer electrolytes
exhibit VogeleTammaneFulcher (VTF) theory which is asso-
ciated with free volumemodel [17,18]. In order to interpret the
result, the plots are then fitted with VTF empirical formula.
Based on this volume-activated principle, the ionic conduc-
tivity is expressed as below:
s ¼ AoT�12exp
� �BT� Tg
�¼ AoT
�12exp
��Ea=kB
T� Tg
�(7)
where Ao is pre-exponential constant proportional to the
number of charge carriers, B represents a constant which is
determined from the gradient of the plot (K�1), Ea is pseudo-
y = -0.09x - 2.3892R² = 0.9954
y = -0.0875x - 1.2712R² = 0.9929
y = -0.0825x - 0.6515R² = 0.9947
y = -0.0898x - 1.3087R² = 0.9908
-4.50
-4.00
-3.50
-3.00
-2.50
-2.00
-1.50
-1.00
5 10 15 20 25 30 35
log
[T
1/2
(Scm
-1K
1/2 )
]
1000/T-To((K-1)
CL 0 CL 2 CL 5 CL 6
σ
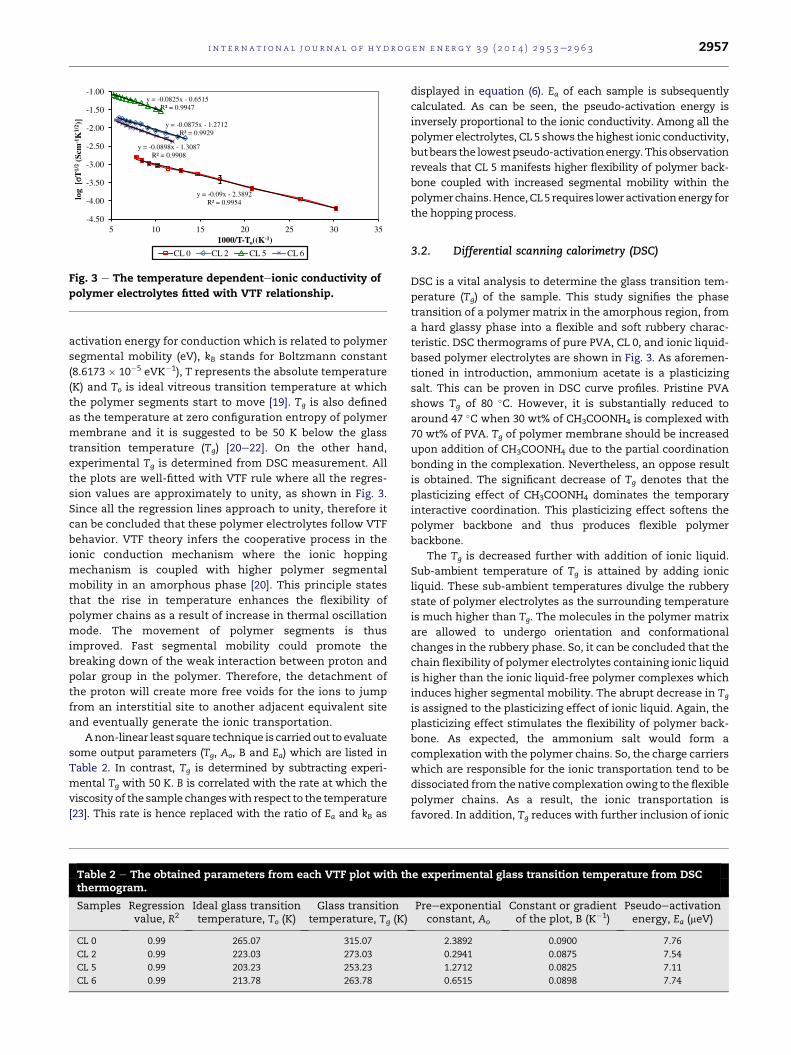
Fig. 3 e The temperature dependenteionic conductivity of
polymer electrolytes fitted with VTF relationship.
i n t e r n a t i o n a l j o u r n a l o f h y d r o g e n en e r g y 3 9 ( 2 0 1 4 ) 2 9 5 3e2 9 6 3 2957
activation energy for conduction which is related to polymer
segmental mobility (eV), kB stands for Boltzmann constant
(8.6173 � 10�5 eVK�1), T represents the absolute temperature
(K) and To is ideal vitreous transition temperature at which
the polymer segments start to move [19]. Tg is also defined
as the temperature at zero configuration entropy of polymer
membrane and it is suggested to be 50 K below the glass
transition temperature (Tg) [20e22]. On the other hand,
experimental Tg is determined from DSC measurement. All
the plots are well-fitted with VTF rule where all the regres-
sion values are approximately to unity, as shown in Fig. 3.
Since all the regression lines approach to unity, therefore it
can be concluded that these polymer electrolytes follow VTF
behavior. VTF theory infers the cooperative process in the
ionic conduction mechanism where the ionic hopping
mechanism is coupled with higher polymer segmental
mobility in an amorphous phase [20]. This principle states
that the rise in temperature enhances the flexibility of
polymer chains as a result of increase in thermal oscillation
mode. The movement of polymer segments is thus
improved. Fast segmental mobility could promote the
breaking down of the weak interaction between proton and
polar group in the polymer. Therefore, the detachment of
the proton will create more free voids for the ions to jump
from an interstitial site to another adjacent equivalent site
and eventually generate the ionic transportation.
Anon-linear least square technique is carried out to evaluate
some output parameters (Tg, Ao, B and Ea) which are listed in
Table 2. In contrast, Tg is determined by subtracting experi-
mental Tg with 50 K. B is correlated with the rate at which the
viscosity of the sample changeswith respect to the temperature
[23]. This rate is hence replaced with the ratio of Ea and kB as
Table 2 e The obtained parameters from each VTF plot with ththermogram.
Samples Regressionvalue, R2
Ideal glass transitiontemperature, To (K)
Glass transitiontemperature, Tg (K)
CL 0 0.99 265.07 315.07
CL 2 0.99 223.03 273.03
CL 5 0.99 203.23 253.23
CL 6 0.99 213.78 263.78
displayed in equation (6). Ea of each sample is subsequently
calculated. As can be seen, the pseudo-activation energy is
inversely proportional to the ionic conductivity. Among all the
polymer electrolytes, CL 5 shows the highest ionic conductivity,
butbears the lowest pseudo-activationenergy. Thisobservation
reveals that CL 5 manifests higher flexibility of polymer back-
bone coupled with increased segmental mobility within the
polymerchains.Hence,CL5 requires loweractivationenergy for
the hopping process.
3.2. Differential scanning calorimetry (DSC)
DSC is a vital analysis to determine the glass transition tem-
perature (Tg) of the sample. This study signifies the phase
transition of a polymer matrix in the amorphous region, from
a hard glassy phase into a flexible and soft rubbery charac-
teristic. DSC thermograms of pure PVA, CL 0, and ionic liquid-
based polymer electrolytes are shown in Fig. 3. As aforemen-
tioned in introduction, ammonium acetate is a plasticizing
salt. This can be proven in DSC curve profiles. Pristine PVA
shows Tg of 80 �C. However, it is substantially reduced to
around 47 �C when 30 wt% of CH3COONH4 is complexed with
70 wt% of PVA. Tg of polymer membrane should be increased
upon addition of CH3COONH4 due to the partial coordination
bonding in the complexation. Nevertheless, an oppose result
is obtained. The significant decrease of Tg denotes that the
plasticizing effect of CH3COONH4 dominates the temporary
interactive coordination. This plasticizing effect softens the
polymer backbone and thus produces flexible polymer
backbone.
The Tg is decreased further with addition of ionic liquid.
Sub-ambient temperature of Tg is attained by adding ionic
liquid. These sub-ambient temperatures divulge the rubbery
state of polymer electrolytes as the surrounding temperature
is much higher than Tg. The molecules in the polymer matrix
are allowed to undergo orientation and conformational
changes in the rubbery phase. So, it can be concluded that the
chain flexibility of polymer electrolytes containing ionic liquid
is higher than the ionic liquid-free polymer complexes which
induces higher segmental mobility. The abrupt decrease in Tg
is assigned to the plasticizing effect of ionic liquid. Again, the
plasticizing effect stimulates the flexibility of polymer back-
bone. As expected, the ammonium salt would form a
complexation with the polymer chains. So, the charge carriers
which are responsible for the ionic transportation tend to be
dissociated from the native complexation owing to the flexible
polymer chains. As a result, the ionic transportation is
favored. In addition, Tg reduces with further inclusion of ionic
e experimental glass transition temperature from DSC
Preeexponentialconstant, Ao
Constant or gradientof the plot, B (K�1)
Pseudoeactivationenergy, Ea (meV)
2.3892 0.0900 7.76
0.2941 0.0875 7.54
1.2712 0.0825 7.11
0.6515 0.0898 7.74

-6
-4
-2
0
2
4
6
8
-4 -3 -2 -1 0 1 2 3 4
Cur
ent,
I (
µA) 1.8 V
–1.9 V
(a)
i n t e rn a t i o n a l j o u r n a l o f h y d r o g e n en e r g y 3 9 ( 2 0 1 4 ) 2 9 5 3e2 9 6 32958
liquid. The Tg exhibits downward shift from �0.12 �C to
�19.92 �C corresponding to addition of 20 wt% and 50 wt% of
BmImCl as portrayed in Fig. 4. The plasticizing effect becomes
more apparent with increasing mass fraction of ionic liquid.
Therefore, the flexibility of polymer chain in CL 5 is higher
than in CL 2. The ionic hopping mechanism is more favorable
in CL 5 which leads to higher ionic conductivity. The result is
in good agreement with previous study. Nevertheless,
different phenomenon is observed for CL 6. Tg is enhanced to
�9.37 �C by adding 10 wt% of BmImCl further. The increase in
Tg (instead of decrease) might be due to the formation of ion
pairs and ion aggregates. Ion pairing and ion aggregation
could obstruct the orientation of the molecules and hence
constrain the flexibility of polymer chains. Therefore, the
decoupling and migration of cations are hindered by the ion
pairs and ion agglomerates.
3.3. Linear sweep voltammetry (LSV)
The maximum operational potential for charge or energy
storage in EDLCs is checked by carrying out LSV study [11].
Fig. 5(a) and (b) describe LSV responds of the EDLC cell with CL
0 and CL 5 polymer electrolytes, respectively. The CL 0-based
EDLC can be operated up to 3.7 V in the potential range be-
tween�1.9 V and 1.8 V, as shown in Fig. 5(a). Upon inclusion of
50 wt% of BmImCl into the polymer electrolyte, the electro-
chemical stability window is expanded to 4 V, where the
cathodic and anodic potentials are detected at �1.8 V and
2.2 V, respectively. Therefore, it can be concluded that
impregnation of ionic liquid can improve the electrochemical
stability of EDLC. Apart from that, the operational current of
EDLC comprising of CL 5 is higher than that of CL 0. This is
mainly assigned to high ion concentration in ionic liquid. The
activated carbon layer would allow the absorption of a large
extent of ions as ionic liquid provides more ions. Hence, the
ion absorption forms the charge accumulation at the elec-
trolyteeelectrode interface and yields the electrical double
layer. Therefore, more energy would be stored in this vicinity.
More electrons will be left and transported from positive
electrode to negative electrode when the ion absorption is
-50 -30 -10 10 30 50 70 90 110 130 150
Hea
t Flo
w (
W/g
)
Temperature (C)
PVA CL 0 CL 2 CL 5 CL 6
–19.92 C
0.12 C
46.58 C
9.37 C
80.15 C
Fig. 4 e DSC thermograms of pure PVA, CL 0 and ionic
liquidebased polymer electrolytes from L50 �C to 150 �C.
increased. This is responsible for higher operational current in
the EDLC based on CL 5 polymer membrane.
3.4. Cyclic voltammetry (CV)
According to the literature, there are three different tech-
niques to find out the capacity of the electrochemical devices
[24]:
i) From cyclic voltammetry
ii) From impedance spectroscopy
iii) From galvanostatic chargeedischarge performance
All these experiments will be analyzed and discussed in
details in this present approach. In order to verify the capac-
itance of the fabricated EDLC cells, the results obtained from
each experiment are compared. Fig. 6 (a) and (b) exemplify CV
curves of type I and II cells, respectively. Type I supercapacitor
shows leaf-like shape with specific capacitance of 0.02 Fg�1,
whereas type II cell illustrates a voltammogram approaching
ideal box-like shape with specific capacitance value of
28.36 Fg�1 [25]. This result is higher than some literatures.
Pandey and his co-workers fabricated EDLC using ionic liquid-
based poly(ethylene oxide) polymer electrolytes and multi-
walled carbon nanotube electrodes. The result is almost 10
times lower than our current work, which is 2.6e3 Fg�1 [23].
Hybrid capacitors using PVA-sodium poly (acrylate) (PAAS)-
potassium hydroxide (KOH) alkaline polymer electrolytes and
nickel hydroxide (Ni(OH)2)/activated carbon (AC) composite
positive electrodes were also assembled by Sun et al. [27].
-10
-8
Cell potential, ΔE (V)
-80
-60
-40
-20
0
20
40
60
80
-4 -3 -2 -1 0 1 2 3 4Cur
ent,
I (
µA)
Cell potential, ΔE (V)
2.2 V–1.8V
(b)
Fig. 5 e (a): LSV response of type I EDLC. (b): LSV response
of type II EDLC.

-0.4
-0.2
0
0.2
0.4
0.6
0.8
1
0 0.2 0.4 0.6 0.8
(a)
(b)
1
Cur
rent
, I (
µA)
Cell potential, ΔE (V)
-6
-4
-2
0
2
4
6
8
10
12
0 0.2 0.4 0.6 0.8 1
Cur
rent
, I (
mA
)
Cell potential, ΔE (V)
Fig. 6 e (a): Cyclic voltammograms of type I EDLC. (b): Cyclic
voltammograms of type II EDLC.
i n t e r n a t i o n a l j o u r n a l o f h y d r o g e n en e r g y 3 9 ( 2 0 1 4 ) 2 9 5 3e2 9 6 3 2959
Higher specific capacitance of 29.8 Fg�1 was obtained for these
hybrid capacitors. This result is expected because of the high
faradic specific pseudocapacitance of Ni(OH)2 [27].
Type I cell is deviated from the ideal rectangular shape
due to the poor contact between electrode and electrolyte.
So, the ions are very difficult to be absorbed onto the elec-
trode surface with this low interfacial contact. The ill-
defined rectangular shape in Fig. 6(a) is also because of the
low conductivity of polymer electrolyte [10]. However, when
ionic liquid is added into the polymer matrix, sticky sample
is produced due to the plasticizing effect of ionic liquid.
Hence, the interfacial contact is improved with this sticky
behavior leading to increase in energy storage in EDLC. The
improvement of interfacial contact could then induce
higher capacitive performance of EDLC. In addition, the
ionic conductivity is enhanced upon addition of ionic liquid
which helps in improving the charge storage capacitive
behavior. The capacitance of type I supercapacitor is
extremely low compared with type II cell. The specific
capacitance value is found to be increased about 131833%
with addition of ionic liquid into the polymer matrix. Apart
from better interfacial contact, the increment of specific
capacitance is attributed to the main feature of ionic liquid.
As aforementioned in introduction and section 3.3, ionic
liquid is comprised solely of ions. Consequently, higher ion
concentration favors the ion migration within the polymer
electrolyte (known as separator in EDLC) and promotes the
charge accumulation at the electrolyteeelectrode boundary.
Eventually, the formation of this electrical double layer in-
creases the capability of energy storage in EDLC. No faradaic
process is detected in the figure entailing no redox reaction
in the EDLC. In addition, higher operational current also
observed in this study. Based on the findings, inclusion of
ionic liquid is a successful way to improve the capacitive
feature of EDLC.
3.5. Electrochemical impedance spectroscopy (EIS)
EIS is a versatile method to assess the electrical behavior of
the assembled cells. Fig. 7(a) and (b) show the complex
impedance spectra of different capacitor cells at ambient
temperature. Both impedance responses illustrate a spike at
low frequency range which is associated with a semicircle at
high frequency region [26]. The semicircular feature is not so
clear in Fig. 7(a), so the scale of the plot is enlarged and shown
in inset of the figure. The linearly rising pattern (or spike) in
the impedance plot reveals the ion absorption at the electro-
deeelectrolyte boundary and hence indicates the capacitive
behavior of EDLC. From both impedance plots, it can be seen
that there are two resistances appearing in the whole fre-
quency regime. Both resistances are determined from the in-
tercepts on x-axis of the complex impedance plot of EDLCs.
The resistance at low frequency range is known as the com-
bination of charge transfer resistance (Rct) and bulk resistance
(Rb), whereas the bulk resistance (Rb) is located at high fre-
quency end, as shown in both figures. The high frequency
intercept (bulk resistance) reflects the bulk properties of
polymer electrolyte [11,23]. Type I cell displays high bulk
resistance that is around 3400 U, however, this resistance is
significantly reduced to 5 U with doping of ionic liquid into
polymer electrolyte for type II supercapacitor. Strong plasti-
cizing effect of ionic liquid is an important contributor in
decreasing the bulk resistance of polymer membrane as dis-
cussed in section 3.1. The ionic mobility and transportation
could be enhanced with this low bulk resistance, resulting in
higher ionic conductivity. This result is in good agreement
with the previous findings in section 3.1. On the contrary, the
charge transfer resistance is one of the bulk behaviors of
electrodeeelectrolyte interface. It is defined as a resistance
that the charge carriers required to overcome during the
charge transfer process from the electrolyte to surface of
electrode. It is noteworthy that the charge transfer resistance
of type II EDLC is radically improved from 1100 U to 4 U upon
addition of ionic liquid into the polymer electrolyte. This
observation indicates the effective role of ionic liquid in
improving the interfacial contact between the electrode and
electrolyte. The specific capacitance of the cells is then eval-
uated using equation (2). As expected, the specific capacitance
of type II cell is higher than type I cell. The specific capaci-
tances of 0.03 Fg�1 and 27.76 Fg�1 are obtained for type I and
type II EDLCs, respectively. The results are comparable with
the CV findings. Again, the abrupt increase in specific capac-
itance of type II EDLC is suggestive of the high ion concen-
tration and good adhesion of the electrolyte to electrode, as
explained in previous study. Superior electrochemical prop-
erties in conjunction with excellent interfacial contact are

Fig. 7 e (a): Nyquist impedance plot of type I EDLC at room temperature from 10 mHz to 100 kHz with closeeup view of the
plot in high frequency region (inset). (b): Nyquist impedance plot of type II EDLC at room temperature from 10 mHz to
100 kHz.
i n t e rn a t i o n a l j o u r n a l o f h y d r o g e n en e r g y 3 9 ( 2 0 1 4 ) 2 9 5 3e2 9 6 32960
0
0.2
0.4
0.6
0.8
1
1.2
0 500 1000 1500 2000 2500 3000 3500
Cel
l pot
enti
al, E
(V
)
Time (s)
0
0.2
0.4
0.6
0.8
1
0 500 1000 1500 2000 2500 3000
Cel
lpot
enti
al, E
(V)
Time (s)
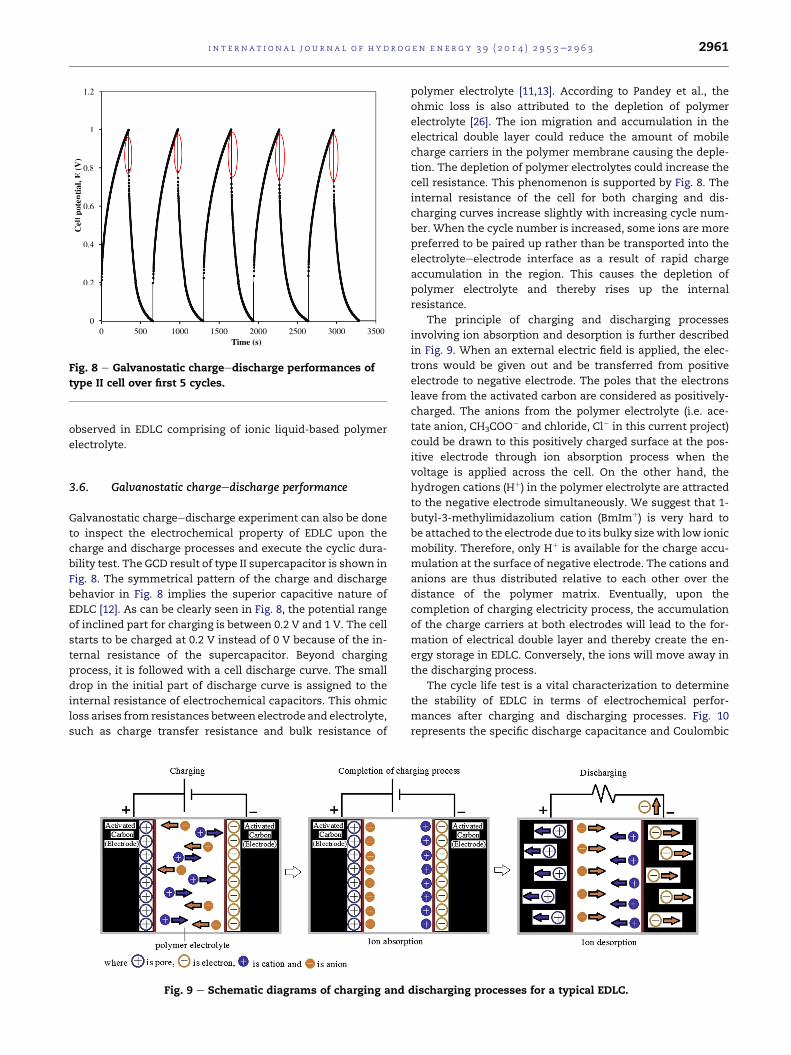
Fig. 8 e Galvanostatic chargeedischarge performances of
type II cell over first 5 cycles.
i n t e r n a t i o n a l j o u r n a l o f h y d r o g e n en e r g y 3 9 ( 2 0 1 4 ) 2 9 5 3e2 9 6 3 2961
observed in EDLC comprising of ionic liquid-based polymer
electrolyte.
3.6. Galvanostatic chargeedischarge performance
Galvanostatic chargeedischarge experiment can also be done
to inspect the electrochemical property of EDLC upon the
charge and discharge processes and execute the cyclic dura-
bility test. The GCD result of type II supercapacitor is shown in
Fig. 8. The symmetrical pattern of the charge and discharge
behavior in Fig. 8 implies the superior capacitive nature of
EDLC [12]. As can be clearly seen in Fig. 8, the potential range
of inclined part for charging is between 0.2 V and 1 V. The cell
starts to be charged at 0.2 V instead of 0 V because of the in-
ternal resistance of the supercapacitor. Beyond charging
process, it is followed with a cell discharge curve. The small
drop in the initial part of discharge curve is assigned to the
internal resistance of electrochemical capacitors. This ohmic
loss arises from resistances between electrode and electrolyte,
such as charge transfer resistance and bulk resistance of
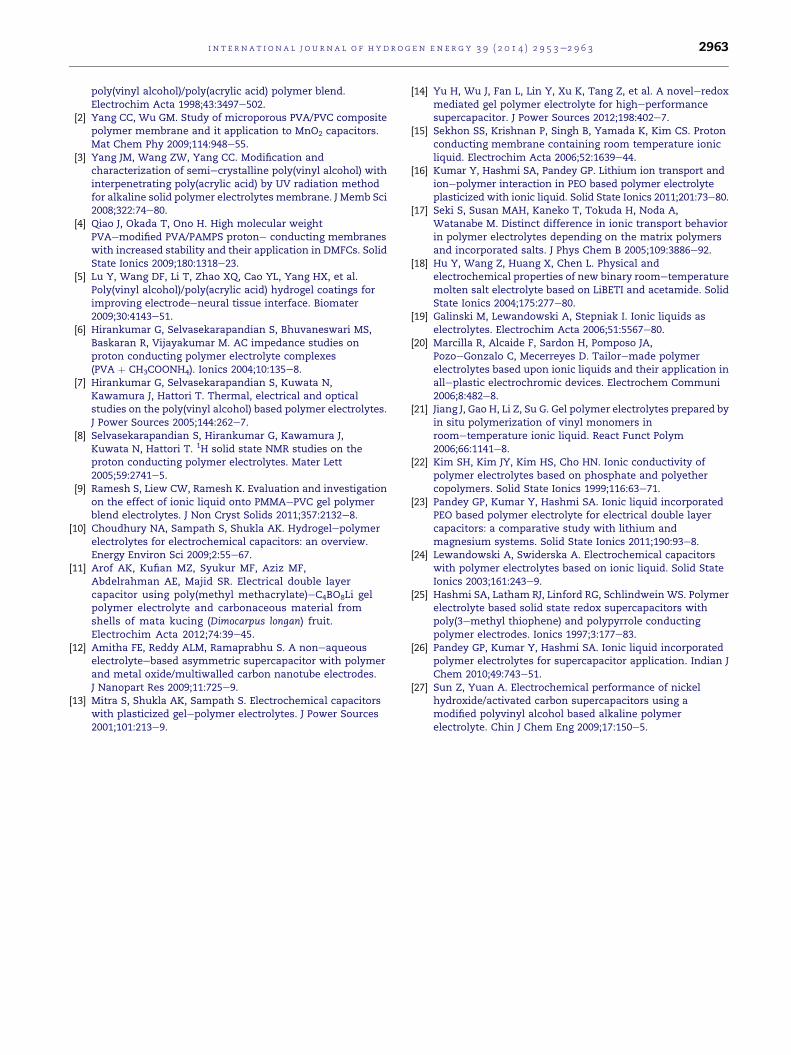
Fig. 9 e Schematic diagrams of charging and
polymer electrolyte [11,13]. According to Pandey et al., the
ohmic loss is also attributed to the depletion of polymer
electrolyte [26]. The ion migration and accumulation in the
electrical double layer could reduce the amount of mobile
charge carriers in the polymer membrane causing the deple-
tion. The depletion of polymer electrolytes could increase the
cell resistance. This phenomenon is supported by Fig. 8. The
internal resistance of the cell for both charging and dis-
charging curves increase slightly with increasing cycle num-
ber. When the cycle number is increased, some ions are more
preferred to be paired up rather than be transported into the
electrolyteeelectrode interface as a result of rapid charge
accumulation in the region. This causes the depletion of
polymer electrolyte and thereby rises up the internal
resistance.
The principle of charging and discharging processes
involving ion absorption and desorption is further described
in Fig. 9. When an external electric field is applied, the elec-
trons would be given out and be transferred from positive
electrode to negative electrode. The poles that the electrons
leave from the activated carbon are considered as positively-
charged. The anions from the polymer electrolyte (i.e. ace-
tate anion, CH3COO� and chloride, Cl� in this current project)
could be drawn to this positively charged surface at the pos-
itive electrode through ion absorption process when the
voltage is applied across the cell. On the other hand, the
hydrogen cations (Hþ) in the polymer electrolyte are attracted
to the negative electrode simultaneously. We suggest that 1-
butyl-3-methylimidazolium cation (BmImþ) is very hard to
be attached to the electrode due to its bulky sizewith low ionic
mobility. Therefore, only Hþ is available for the charge accu-
mulation at the surface of negative electrode. The cations and
anions are thus distributed relative to each other over the
distance of the polymer matrix. Eventually, upon the
completion of charging electricity process, the accumulation
of the charge carriers at both electrodes will lead to the for-
mation of electrical double layer and thereby create the en-
ergy storage in EDLC. Conversely, the ions will move away in
the discharging process.
The cycle life test is a vital characterization to determine
the stability of EDLC in terms of electrochemical perfor-
mances after charging and discharging processes. Fig. 10
represents the specific discharge capacitance and Coulombic
discharging processes for a typical EDLC.

0
20
40
60
80
100
120
0
5
10
15
20
25
30
35
0 100 200 300 400 500
Cou
lom
bic
effi
cien
cy (
%)
Spec
ific
dis
char
ge c
apac
itan
ce, C
sp(F
g- 1)
Cycles
Fig. 10 e Specific capacitance and Coulombic efficiency of
type II EDLC over 500 cycles.
i n t e rn a t i o n a l j o u r n a l o f h y d r o g e n en e r g y 3 9 ( 2 0 1 4 ) 2 9 5 3e2 9 6 32962
efficiency of supercapacitor over 500 cycles. The energy and
power densities are thus calculated using equations 4 and 5,
respectively. The result obtained over 500 cycles is then
plotted in Fig. 11. The initial specific discharge capacitance of
31.28 Fg�1 with Coulombic efficiency of 90% is observed for
type II cell in Fig. 10. This capacitance value is similar with the
result obtained in CV and impedance spectroscopy. However,
the capacity of cell decreases with cycle number. The energy
and power densities also possess the same pattern. The de-
creases in the electrochemical performance might be due to
the depletion of polymer electrolyte. The amount of charge
carriers within the polymer membrane is reduced with
increasing cycle number. The internal resistance of cell is
increasedwith cycle number as explained as aforesaid. So, the
ions requires higher amount of energy to be transported to-
wards the surface of electrodewith higher internal resistance.
These ions have to overcome this barrier in order to form the
electrical double layer in the electrodeeelectrolyte region. As a
result, the capacitive behavior is declined. The specific
discharge capacitance is reduced to 20.98 Fg�1 with 98% of
efficiency upon charge and discharge for 500 cycles. On the
other hand, the initial energy density is 2.39Wh kg�1; however
it has been reduced 1.45 Wh kg�1 in 500th cycles. A small
change about 11. 67% in power density, from 19.79 W kg�1 to
17.43 Wh kg�1, is also observed in Fig. 11. From both figures,
we also observe that the specific capacitance, energy density
17
17.5
18
18.5
19
19.5
20
0
0.5
1
1.5
2
2.5
3
0 100 200 300 400 500
Pow
er d
ensi
ty, P
(W
kg-1
)
Ene
rgy
dens
ity,
E (
Whk
g-1)
Cycles
Fig. 11 e Energy density and power density of type II EDLC
over 500 cycles.
and power density become almost constant above 400th cy-
cles. This signifies that the cell can remain in its electro-
chemical stability without any abrupt changes in
electrochemical performances upon charge and discharge for
400 cycles, suggesting that the ionic liquid-based polymer
electrolyte is a best choice as separator in supercapacitor. The
most conducting ionic liquid-based polymer electrolyte is also
a promising candidate by maintaining its Coulombic effi-
ciency above 90% in 500 cycles of charging and discharging.
According to the findings, CL 5 is very suitable to be applied in
EDLC application as the electrochemical performance has
been greatly improved.
4. Conclusion
PVA-based polymer electrolytes were prepared by solution
casting method. The ionic conductivity increased with tem-
perature due to the polymer expansion effect. Polymer elec-
trolyte containing 50 wt% of BmImCl offered the maximum
ionic conductivity of (7.31 � 0.01) mS cm�1 at 120 �C. The
samples obeyed non-Arrhenius VTF rule as convex upward
curved profiles were shown in temperature dependence-ionic
conductivity studies. This principle stated that the ion trans-
portation mechanism is coupled with highly flexible polymer
chain which promotes the ion hopping process. Upon
impregnation of BmImCl, the Tg of polymer electrolytes is
lowered down to sub-ambient value. The decrease in Tg hel-
ped in softening the polymer backbone. EDLC containing the
most conducting polymer electrolyte was assembled. The
fabricated EDLC can be charged up to 4.8 V, as illustrated in
LSV study. Doping of ionic liquid into polymer electrolyte also
increased the capacitive nature of EDLC. The specific capaci-
tance of 28.36 Fg�1 was achieved with better electrochemical
characteristic in cyclic voltammogram. The specific capaci-
tance value obtained from impedance spectra and galvano-
static chargeedischarge test are also comparable with the
result from CV study. The inclusion of ionic liquid not only
improves the interfacial contact between electrode and elec-
trolyte, but also increases the electrochemical property of
supercapacitors. Doping of ionic liquid into PVA-based poly-
mer electrolyte is a good prospect for improving the electro-
chemical performance of an energy storage device.
Acknowledgment
This work was supported by the High Impact Research Grant
(J-21002-73851) from University of Malaya. Gratitude also goes
to “Peruntukan Penyelidikan Pascasiswazah (PPP), Universiti
Malaysia”. One of the authors, Chiam-Wen Liew gratefully
acknowledges the “Skim Bright Sparks Universiti Malaya”
(SBSUM) for scholarship awarded.
r e f e r e n c e s
[1] Dasenbrock CO, Ridgway TH, Seliskar CJ, Heineman WR.Evaluation of the electrochemical characteristics of a
i n t e r n a t i o n a l j o u r n a l o f h y d r o g e n en e r g y 3 9 ( 2 0 1 4 ) 2 9 5 3e2 9 6 3 2963
poly(vinyl alcohol)/poly(acrylic acid) polymer blend.Electrochim Acta 1998;43:3497e502.
[2] Yang CC, Wu GM. Study of microporous PVA/PVC compositepolymer membrane and it application to MnO2 capacitors.Mat Chem Phy 2009;114:948e55.
[3] Yang JM, Wang ZW, Yang CC. Modification andcharacterization of semiecrystalline poly(vinyl alcohol) withinterpenetrating poly(acrylic acid) by UV radiation methodfor alkaline solid polymer electrolytes membrane. J Memb Sci2008;322:74e80.
[4] Qiao J, Okada T, Ono H. High molecular weightPVAemodified PVA/PAMPS protone conducting membraneswith increased stability and their application in DMFCs. SolidState Ionics 2009;180:1318e23.
[5] Lu Y, Wang DF, Li T, Zhao XQ, Cao YL, Yang HX, et al.Poly(vinyl alcohol)/poly(acrylic acid) hydrogel coatings forimproving electrodeeneural tissue interface. Biomater2009;30:4143e51.
[6] Hirankumar G, Selvasekarapandian S, Bhuvaneswari MS,Baskaran R, Vijayakumar M. AC impedance studies onproton conducting polymer electrolyte complexes(PVA þ CH3COONH4). Ionics 2004;10:135e8.
[7] Hirankumar G, Selvasekarapandian S, Kuwata N,Kawamura J, Hattori T. Thermal, electrical and opticalstudies on the poly(vinyl alcohol) based polymer electrolytes.J Power Sources 2005;144:262e7.
[8] Selvasekarapandian S, Hirankumar G, Kawamura J,Kuwata N, Hattori T. 1H solid state NMR studies on theproton conducting polymer electrolytes. Mater Lett2005;59:2741e5.
[9] Ramesh S, Liew CW, Ramesh K. Evaluation and investigationon the effect of ionic liquid onto PMMAePVC gel polymerblend electrolytes. J Non Cryst Solids 2011;357:2132e8.
[10] Choudhury NA, Sampath S, Shukla AK. Hydrogelepolymerelectrolytes for electrochemical capacitors: an overview.Energy Environ Sci 2009;2:55e67.
[11] Arof AK, Kufian MZ, Syukur MF, Aziz MF,Abdelrahman AE, Majid SR. Electrical double layercapacitor using poly(methyl methacrylate)eC4BO8Li gelpolymer electrolyte and carbonaceous material fromshells of mata kucing (Dimocarpus longan) fruit.Electrochim Acta 2012;74:39e45.
[12] Amitha FE, Reddy ALM, Ramaprabhu S. A noneaqueouselectrolyteebased asymmetric supercapacitor with polymerand metal oxide/multiwalled carbon nanotube electrodes.J Nanopart Res 2009;11:725e9.
[13] Mitra S, Shukla AK, Sampath S. Electrochemical capacitorswith plasticized gelepolymer electrolytes. J Power Sources2001;101:213e9.
[14] Yu H, Wu J, Fan L, Lin Y, Xu K, Tang Z, et al. A noveleredoxmediated gel polymer electrolyte for higheperformancesupercapacitor. J Power Sources 2012;198:402e7.
[15] Sekhon SS, Krishnan P, Singh B, Yamada K, Kim CS. Protonconducting membrane containing room temperature ionicliquid. Electrochim Acta 2006;52:1639e44.
[16] Kumar Y, Hashmi SA, Pandey GP. Lithium ion transport andionepolymer interaction in PEO based polymer electrolyteplasticized with ionic liquid. Solid State Ionics 2011;201:73e80.
[17] Seki S, Susan MAH, Kaneko T, Tokuda H, Noda A,Watanabe M. Distinct difference in ionic transport behaviorin polymer electrolytes depending on the matrix polymersand incorporated salts. J Phys Chem B 2005;109:3886e92.
[18] Hu Y, Wang Z, Huang X, Chen L. Physical andelectrochemical properties of new binary roometemperaturemolten salt electrolyte based on LiBETI and acetamide. SolidState Ionics 2004;175:277e80.
[19] Galinski M, Lewandowski A, Stepniak I. Ionic liquids aselectrolytes. Electrochim Acta 2006;51:5567e80.
[20] Marcilla R, Alcaide F, Sardon H, Pomposo JA,PozoeGonzalo C, Mecerreyes D. Tailoremade polymerelectrolytes based upon ionic liquids and their application inalleplastic electrochromic devices. Electrochem Communi2006;8:482e8.
[21] Jiang J, Gao H, Li Z, Su G. Gel polymer electrolytes prepared byin situ polymerization of vinyl monomers inroometemperature ionic liquid. React Funct Polym2006;66:1141e8.
[22] Kim SH, Kim JY, Kim HS, Cho HN. Ionic conductivity ofpolymer electrolytes based on phosphate and polyethercopolymers. Solid State Ionics 1999;116:63e71.
[23] Pandey GP, Kumar Y, Hashmi SA. Ionic liquid incorporatedPEO based polymer electrolyte for electrical double layercapacitors: a comparative study with lithium andmagnesium systems. Solid State Ionics 2011;190:93e8.
[24] Lewandowski A, Swiderska A. Electrochemical capacitorswith polymer electrolytes based on ionic liquid. Solid StateIonics 2003;161:243e9.
[25] Hashmi SA, Latham RJ, Linford RG, Schlindwein WS. Polymerelectrolyte based solid state redox supercapacitors withpoly(3emethyl thiophene) and polypyrrole conductingpolymer electrodes. Ionics 1997;3:177e83.
[26] Pandey GP, Kumar Y, Hashmi SA. Ionic liquid incorporatedpolymer electrolytes for supercapacitor application. Indian JChem 2010;49:743e51.
[27] Sun Z, Yuan A. Electrochemical performance of nickelhydroxide/activated carbon supercapacitors using amodified polyvinyl alcohol based alkaline polymerelectrolyte. Chin J Chem Eng 2009;17:150e5.