Global Powers of Retailing 2022 - Deloitte
52
Global Powers of Retailing 2022 Resilience despite challenges
-
Upload
khangminh22 -
Category
Documents
-
view
4 -
download
0
Transcript of Global Powers of Retailing 2022 - Deloitte

Global Powers of Retailing 2022 Resilience despite challenges

2
Foreword by Evan Sheehan 3
Top 250 quick statistics 4
Global economic outlook by Dr. Ira Kalish 5
Top 10 highlights 7
Retail and sustainability 13
Top 250 17
Geographic analysis 29
Product sector analysis 36
New entrants 40
Fastest 50 42
Study methodology and data sources 47
End notes 49
Contacts 51
Contents
2

3
“Despite a year of economic fits and starts, retail appears to be on an upward trajectory, with innovation in digital and sustainability as exciting bright spots in the face of the disruption and uncertainty. Unfortunately, churn is likely to stick with us for a while, so anticipating customer needs has never been more critical. The retailers that can get consumers what they want, where they want it, and when they want it will be the ones that continue to win - No matter where they operate.”
Evan SheehanGlobal Retail, Wholesale & Distribution Leader

G L O B A L P O W E R S O FR E T A I L I N G 2 0 2 2
This is the first year a Chinese company has entered the top ten retailers.
Despite challenges, retail rebounds
Top 250 Composite Net Profit Margin
3.3%
3.1%
Top 250 Composite Year-over-Year Retail Revenue Growth
5.2%
4.4%
Top 250 Composite Return on Assets
4.4%
4.3%
*financial years ending within the 12 months from 1 July 2020 to 30 June 2021
*financial years ending within the 12 months from 1 July 2019 to 30 June 2020
32%
19%16%
16%
13%Of those surveyed....32% Paid significantly more than an alternative
19% Waited longer for deliver or to obtain it
16% Bought a used or upcycled product
16% Accepted a lower quality product/service
13% Agreed to participate in a special processto dispose of it.
* October 2021
55% of consumers purchased a sustainable product or service within the past 4 weeks*
Consumer demand sparks sustainability movement in retail

5
Global Powers of Retailing 2022 | Global economic outlook
Inflation and supply chains The high rates of inflation in the United States and Europe are due largely to supply chain disruption, as evidenced by large price increases for goods but not for services. There are indications that supply chain disruptions may have peaked and will soon abate. Consumer spending on goods is lessening. Industrial production in East Asia is soaring, due partly to increased availability of inputs such as semiconductors. If supply chains revert to normal in the next 12-18 months, the rate of inflation should decline sharply. However, if the omicron variant prolongs disruption, inflation will last longer.
Labor marketsIn the United States, and also in some other countries, labor force participation is down, and businesses face labor shortages. Possible reasons include mass early retirement by older workers, fewer women working due to childcare responsibilities during the pandemic, fear of the virus, less migration, and a skills mismatch due to fewer low skill jobs and an increase in high skill jobs. A labor shortage would usually result in a big increase in wages. However, although wages have risen, the increase has been less than expected and not sufficient to drive up inflation. Some businesses have avoided wage increases by offering signing and retention bonuses. Others have invested in labor-saving or labor augmenting technologies.
Monetary policyMonetary policy is shifting in the United States, Eurozone, the United Kingdom, Canada, and Australia. This has entailed a commitment by central banks to reduce asset purchases and start interest rate normalization in 2022. It is an acknowledgement of strong economic growth and healthy labor markets, as well as concerns about inflation. However, most central bankers still see current high rates of inflation as temporary and likely to abate by 2023. Investors appear to accept this argument, as evidenced by market indicators of inflation expectations. Thus, there is reason to expect that borrowing costs will remain historically low.
Fiscal policyFiscal policy in most countries has become less expansive, with Japan an exception. Government borrowing in the United States and Europe is therefore likely to decline this year, putting downward pressure on yields even as central banks stop buying bonds. Fiscal policy in the United States and Europe is becoming focused more on the longer term, with investments in infrastructure and human capital. Although fiscal contraction could have negative consequences for growth, the impact could be offset by a decline in consumer saving as households dip into their accumulated savings.
Global tradeGlobal trade has expanded rapidly despite supply chain disruption and tensions between the United States and China. Global companies continue to engage in cross-border investment, including direct investment into China. However, they are starting to diversify supply chains away from China, and into India and other countries in Southeast Asia, Mexico, and home markets. The United States has been cautious about liberalizing trade with China and Europe but is starting to move in that direction. However, the United States did not join either of the new free trade agreements in the Asia-Pacific region.
OmicronThe omicron variant is spreading rapidly in North America and Europe, less so in Asia and Latin America. It is difficult to predict the path of the virus or its potential public health impact. However, we do know a few things. January 2022 saw people avoiding work in large numbers, thereby diminishing economic activity and disrupting supply chains. Businesses were scaling back activities that involved social interaction. Consumers were becoming less mobile, something that will likely have a negative impact on spending on services or on store visits. At the least, January looks problematic for North America and Europe, but how long the situation will last is hard to say. If consumer spending falls as a result of omicron, inflationary pressures would lessen. On the other hand, further disruption of supply chains by omicron could boost and/or prolong high rates of inflation.
Global economic outlook
Prepared by Dr. Ira KalishChief Global Economist
We entered 2022 with high rates of inflation in the United States and Europe, continuing disruption of global supply chains, a shortage of labor in key markets, and a reversal of monetary policy in the United States and Europe. December 2021 and January 2022 experienced the worst outbreak of coronavirus infections, with the omicron variant, since the start of the pandemic. And yet retailers have reasons for optimism. Supply chain disruption is likely to abate. Inflation is likely to recede. Major economies are likely to grow at a healthy pace in 2022, especially as many consumers are flush with cash. And, despite political tensions between major countries, trade and cross-border investment continues apace, thereby allowing global retailers to enjoy the fruits of globalization.
Here, we offer some thoughts on the major issues and outlooks for key markets:

6
Outlooks by region • United States. We can expect moderate growth, slower than previously expected due to the negative impact of the omicron variant in the first quarter of 2022. The rate of inflation should fall as the year progresses. Labor shortages are likely to persist, especially due to limited immigration. Consumer spending on goods is likely fall as consumers shift back toward spending on services.
• Europe. In the first quarter the economy in Europe is likely to be restricted by omicron, but subsequently the rate of growth (and increase in consumer spending) should rebound nicely. The rate of inflation will also fall as the year progresses, especially if energy prices peak.
• China. There is reason to expect much slower economic growth in 2022 than in 2021, due largely to troubles in the country’s huge property market. Unlike elsewhere, monetary policy will be more expansive and less concerned about inflation, which is currently low. Demographics are a major concern, with China having seen fewer births in 2020 than in any year since 1961; and there could be long-term negative consequences for economic growth, consumer demand, and the health of the pension and healthcare systems.
• Japan. The government is engaging in considerable fiscal stimulus, bucking the global trend. Lately, the economy has been relatively weak, with declining household spending. If the virus fades, the upcoming fiscal stimulus could help to restore moderate growth.
Global Powers of Retailing 2022 | Global economic outlook

7
Global Powers of Retailing 2022 | Top 10 highlights
Top 10 highlights
Top 10 retailers, FY2020
Top 250 rank
Change in rank
Name of company
Country of origin
FY2020 retail
revenue (US$M)
FY2020 retail
revenue growth
FY2020 net
profit margin1
FY2020 return
on assets
FY2015-2020 retail
revenue CAGR2
# countries of
operation
% retail revenue
from foreign
operations
1 0 Walmart Inc United States 559,151 6.7% 2.5% 5.4% 3.0% 26 21.9%
2 0 Amazon.com, Inc. United States 213,573 34.8% 5.5% 6.6% 21.9% 21 31.7%
3 0 Costco Wholesale Corporation United States 166,761 9.2% 2.4% 7.3% 7.5% 12 26.8%
4 0 Schwarz Group Germany 144,254 10.0% n/a n/a 7.8% 33 72.0%
5 2 The Home Depot, Inc. United States 132,110 19.9% 9.7% 18.2% 8.3% 3 7.5%
6 -1 The Kroger Co. United States 131,620 8.3% 2.0% 5.3% 3.7% 1 0.0%
7 -1 Walgreens Boots Alliance, Inc. United States 117,705 1.5% 0.3% 0.5% 5.6% 9 8.5%
8 0
Aldi Einkauf GmbH & Co. oHG and Aldi International Services GmbH & Co. oHG
Germany 117,047 e 8.1% n/a n/a 5.8% 19 73.3%
9 4 JD.com, Inc China 94,423 27.6% 6.6% 11.7% 31.2% 1 0.0%
10 1 Target Corporation United States 92,400 19.8% 4.7% 8.5% 4.6% 1 0.0%
Source: Deloitte Global. Global Powers of Retailing 2022. Analysis of financial performance and operations for financial years ending within the 12 months from 1 July 2020 to 30 June 2021 (FY2020) using company annual reports, Supermarket News, Forbes America’s largest private companies and other sources.
e = estimate
n/a = not available
1Sales-weighted, currency-adjusted composites
Source: Deloitte Global. Global Powers of Retailing 2022. Analysis of financial performance and operations for financial years ending within the 12 months from 1 July 2020 to 30 June 2021 (FY2020) using company annual reports, Supermarket News, Forbes America’s largest private companies and other sources.
Top 10 share of Top 250 retail revenue1
FY2019US$1,583B32.7%
Top 1012.6
FY2020US$1,769B34.6%
Top 25010.8
Countries of operation in FY20202
1 Net profit margin based on total consolidated revenue and net income. May include results from non-retail operations if these are <50% of group revenue.2 Compound annual growth rate
² Average

8
Retail revenue YoY growth1
0%
5%
10%
15%
20%
25%
30%
35%
Top
250
Top
10
Walm
art I
nc.
Amaz
on.co
m In
c.Co
stco
Who
lesale
Corp
orat
ion
Schw
arz G
roup
The
Home
Depot
, Inc.
The
Krog
er C
o.
Walg
reen
s Boo
ts
Allia
nce,
Inc.
JD.co
m, In
cTa
rget
Cor
pora
tion
Aldi
Ein
kauf
Gm
bH &
Co.
oHG an
d Al
di
Inte
rnat
iona
l Ser
vices
Gm
bH &
Co.
oHG
FY 2019
4.4%
FY 2020
5.2%4.4%
12.4%
1.9%
6.7%
13.0%
34.8%
7.9% 8.6%10.0%
1.9%
19.9%
1.0%
8.3%
4.8%
1.5%
5.6%
8.1%
22.7%
3.6%
19.8%
27.6%
9.2%
1Sales-weighted, currency-adjusted composites
Source: Deloitte Global. Global Powers of Retailing 2022. Analysis of financial performance and operations for financial years ending within the 12 months from 1 July 2020 to 30 June 2021 (FY2020) using company annual reports, Supermarket News, Forbes America’s largest private companies and other sources.
JD.com and Target enter the Top 10, displacing CVS and Tesco. Online sales are a key driver of growth.China’s online retail specialist JD.com and US discount mass merchandizer Target entered the Global Powers of Retailing Top 10 list in FY2020. US home improvement leader Home Depot overtook Kroger and Walgreens Boots Alliance, to move into fifth place. Tesco and CVS Health Corporation dropped out of the Top 10. Tesco’s sale of its Asian and Polish businesses led to a drop in retail revenue, while CVS was overtaken by faster-growing companies.
1. WalmartWalmart continued its leadership of the world’s Top 250 global retailers. The company registered year-over-year FY2020 retail revenue growth of 6.7%, fueled by growth in comparable store sales, together with a rapid rise in e-commerce sales.
Walmart US e-commerce sales grew by 79%, as its investments in omnichannel and e-commerce innovation delivered results during the COVID-19 pandemic. Walmart launched multiple delivery/store pickup initiatives in the United States, Canada, Mexico and China. At the end of the financial year, Walmart had around 7,300
pickup and 5,200 delivery locations worldwide. In September 2020, the company launched Walmart+, a new membership option with omnichannel shopping benefits, including unlimited free delivery, fuel discounts, mobile scan & go for a streamlined in-store shopping experience, and early access to events such as Black Friday.1,2
Since their first shoppable livestream in December 2020 (a “Holiday Shop-Along Spectacular” with TikTok), Walmart has piloted additional events on other major social platforms including YouTube and Twitter.3 It has partnered with DroneUp4 and Zipline, for its first multi-site commercial drone delivery. Delivery operation pilots started in November 2021, to deliver items to eligible Walmart customers by air in as little as 30 minutes.5
In 2021, Walmart launched Walmart GoLocal, its new delivery as a service business, in the United States. This uses Walmart’s network to provide white-label delivery for other businesses. In October 2021, Home Depot became the first retailer to partner with Walmart GoLocal.6 In China, Walmart’s partnerships with JD.com and JD Daojia have provided one-hour delivery to customers by leveraging Walmart stores as fulfillment centers since 2016.7
Global Powers of Retailing 2022 | Top 10 highlights

9
Walmart International’s retail revenue increased by 1.0%, or 5.2% in constant currency, with strength in Mexico, Canada, and India-based e-commerce group Flipkart, which it acquired in August 2018.8 In July 2021 Flipkart raised US$3.6 billion in funding to grow its digital e-commerce.9 Walmart continued to divest foreign operations in 2020 and 2021. In November 2020, it agreed to sell its business in Argentina to Grupo de Narváez.10 In February 2021, it completed the sale of a majority stake in UK grocery retailer Asda to the Issa brothers (founders of convenience/forecourt retailer EG Group) and TDR Capital for £6.8 billion.11 Walmart retains an equity investment in the business, with an ongoing commercial relationship and a seat on the board. In March 2021, it completed the sale to KKR and Rakuten of a majority stake in wholly-owned Japanese supermarket subsidiary Seiyu, retaining 15% of the company.12 In the same month, it invested US$153 million in Japan’s e-commerce retailer Rakuten, taking a 0.9% strategic equity stake in order to benefit from future growth in a rapidly changing global retail environment.13
In September 2021 Walmart issued its first green bond offering, for US$2 billion, under its Green Financing Framework. The funds will be invested in projects that advance the company’s environmental sustainability goals, including achieving 100% renewable energy by 2035 and zero emissions in operations by 2040.14 In July 2021 Walmart partnered with other Top 250 retailers H&M Group, Ingka Group (IKEA) and Kingfisher plc to launch a new climate change initiative–the Race to Zero Breakthroughs: Retail Campaign–in partnership with the COP26 High Level Climate Action Champions and supported by the World Business Council for Sustainable Development (WBCSD).15
Walmart’s net profit margin fell by 0.4 percentage points in FY2020, to 2.5%. Gains associated with equity investments were partially offset by a US$8.3 billion pre-tax loss relating to the divestiture of international operations classified as held for sale or sold in FY2020.
2. AmazonAmazon again achieved the highest FY2020 retail revenue growth among the Top 10. Retail revenue (first-party retail sales only) soared by 34.8% year-over-year, as consumers increased online purchases during the COVID-19 pandemic. Higher demand at its online stores both in North America and internationally was partially offset, however, by fulfillment network capacity and supply chain constraints.
Amazon did not make any retail acquisitions in FY2020. Its US$1.2 billion spend on acquisitions was targeted at gaining technologies and know-how to enable it to serve customers more effectively. In November 2020, Amazon Pharmacy was launched in the United States, for home delivery of customers’ prescription medications, with free delivery for Prime members.16 In the same month, the company announced that “Key by Amazon In-Garage Grocery Delivery” was expanding to over 4,000 US cities.17 Amazon has a more limited presence in Asia than in North America and Europe (where the most recent dedicated Amazon site launch was in
Poland in March 2021).18 In South Korea, Amazon Global Store, a new way for customers in Korea to shop the Amazon US selection, was launched on local e-commerce player 11st in August 2021.19
Amazon became the world’s largest corporate purchaser of renewable energy in FY2020, taking another step toward net-zero carbon by 2040. The company has invested in 127 renewable energy projects around the world.
Amazon achieved the third-highest net profit margin among the Top 10 (5.5%), up 1.4 percentage points on FY2019.
3. CostcoCostco retained third place in the Top 10, with FY2020 retail revenue up by 9.2%. The company’s organic growth was driven by an 8% increase in comparable sales, together with new warehouse openings, nine in the United States, one in Canada and three in other countries. Comparable sales benefited from increases in average purchase sizes, and a 50% increase in e-commerce comparable sales in 2020 (80% in the second half of the year). E-commerce net sales were approximately 6% of total net sales in FY2020. The second half of FY2020 also saw a substantial shift in revenue from Costco's ancillary and other businesses to core categories (food and sundries and fresh foods) due to COVID-19.
Costco has been investing in delivery solutions. In March 2020, it completed the US$1 billion acquisition of Innovel Solutions, a logistics solutions company which provides “final mile” delivery, complete installation, and white glove capabilities for “big and bulky” products, across the United States and Puerto Rico.20 In July 2021, Costco started a pilot with Uber in 25 locations in Texas, offering members grocery delivery within hours via Uber and Uber Eats mobile apps. This is the second grocery delivery partnership for Costco, which already offers same-day delivery through Instacart at all of its mainland US clubs, as well as its own two-day delivery service for groceries and household essentials.21
Costco’s net profit margin in FY2020 was 2.4%, the same as in the previous year.
4. Schwarz GroupSchwarz Group’s FY2020 retail revenue growth of 10.0% was the highest among the six fast-moving consumer goods (FMCG) retailers in the Top 10. The privately-owned company continued to expand in existing markets, ending FY2020 with over 12,900 stores in 33 countries, although it withdrew from the Australian market in 2020 before opening its first store.22
The majority of Schwarz Group stores are its 11,550 Lidl discount stores. Lidl increased its FY2020 revenue by 9.9% to €96.3 billion. Lidl’s primary focus is on keeping prices low through efficiency in its physical stores business, although there are Lidl online shops in seven countries, and it offers the Lidl Plus customer benefit program as part of its omnichannel strategy.23
Global Powers of Retailing 2022 | Top 10 highlights

10
Schwarz Group’s Kaufland supermarket business ended FY2020 with around 1,350 stores in Europe, and increased its revenue in the year by 7.5%, to €25.5 billion. In December 2020 the German Federal Cartel Office cleared Kaufland’s acquisition of 92 of Metro’s Real hypermarkets and e-commerce site real.de24, and allowed another 22 Real stores to be acquired in August 2021.25 Some 64 of these stores had been converted to the Kaufland brand by November 2021.
In August 2020, Schwarz Group joined the Science Based Targets Initiative. It has committed to reduce operational greenhouse gas emissions by 55% by 2030, as well as reducing plastics consumption by 20% and ensuring that all private label packaging is recyclable by 2025.26 The company is investing in its environmental division, PreZero, making multiple acquisitions in 2021: Roplast Industries, Inc, a US-based sustainable polyethylene film and bag manufacturer (completed in March)27; the recycling and recovery activities of the Suez Group in four European countries (completed in June)28; and Ferrovial’s Environmental Services business in Spain and Portugal for €1.13 billion (agreed in July).29
5. Home DepotThe Home Depot reported the third-highest percentage growth in retail revenue among the Top 10 companies, overtaking Kroger and Walgreens Boots Alliance to leap into fifth place in the list. FY2020 retail revenue grew by over US$21 billion or 19.9% year-over-year, up 18 percentage points, with record-breaking sales and profit. The company benefited from increased consumer demand for home improvement products during the COVID-19 pandemic. Online sales grew by about 86% during FY2020, to 14.4% of total net sales, as the company’s “One Home Depot” investment strategy to drive interconnected customer experience in both physical and digital stores enabled it to pivot rapidly to digital solutions. Home Depot extended its “buy online, pick-up in-store” offering to curbside and converted a newly opened Market Delivery Center to a Direct Fulfillment Center in order to reduce online delivery lead times and improve the customer experience.
In December 2020, Home Depot completed its US$8 billion acquisition of former subsidiary HD Supply Holdings, Inc., a leading North American wholesale distributor of maintenance, repair and operations products.30
Home Depot joined the Science Based Targets Initiative in July 2021, setting goals for 2030 of 100% renewable electricity for all facilities worldwide, and reducing emissions by 40%.31
The company’s net profit margin in FY2020 was 9.7%, the highest among the Top 10 retailers but down by 0.5 percentage points on FY2019.
6. KrogerKroger’s retail revenue grew by 8.3% in FY2020, up 7.3 percentage points on FY2019. Total sales to retail customers (excluding fuel) increased by 13.6%, driven by unprecedented demand due to the
COVID-19 pandemic, digital sales growth and share gains from competitors. This increase was partially offset by fuel sales, down 32.5%, and the deconsolidation of Lucky’s Market following its sale in Q4 FY2019. Digital sales, which include pickup, delivery, ship and pharmacy e-commerce sales, grew by 116% in 2020, enabled by Kroger’s rapid pivot to digital in the first stage of the pandemic and investments in its digital network over the previous several years. Kroger did not make any significant acquisitions in FY2020.
Kroger’s FY2020 net profit margin improved by 0.7 percentage points, to 2.0%, although this was still the second lowest among the Top 10 companies.
7. Walgreens Boots AllianceWalgreens Boots Alliance (WBA) recorded the lowest percentage retail revenue growth among the Top 10 companies in FY2020. Retail sales were up by only 1.5% in FY2020, 3.3 percentage points less than in FY2019. US sales were up 3.0%, due to higher brand inflation and growth in specialty sales. International sales were down, by 12.7% (17.2% in constant currency). This was due mainly to lower Boots UK retail sales, as footfall in stores in the second half of the year fell significantly due to COVID-19.
WBA was the least profitable Top 10 company. Its FY2020 net profit margin fell by 2.6 percentage points, to 0.3%.
In June 2021, the company completed the sale of its Alliance Healthcare wholesale distribution business to drug wholesaler Amerisource Bergen, for US$6.5 billion, while continuing the strategic distribution agreements between the two companies. The proceeds are being used to pay down US$3.3 billion in debt, and to invest in WBA’s core retail pharmacy and healthcare businesses.32 Major 2021 initiatives were the October 2021 additional US$5.2 billion investment in its partner VillageMD to accelerate the opening of 1,000 physician-staffed clinics co-located at its US drugstores by 202733, and the acquisition of a majority stake in iA, a leading-edge provider of software-enabled pharmacy automation solutions.34
In November 2021, WBA took 100% ownership of its wholesale businesses in Germany, Alliance Healthcare Deutschland and GEHE Pharma Handel, adding to the 70% controlling interest it had acquired in 2020.35
According to media reports in December 2021, WBA engaged Goldman Sachs to work on the potential disposal of its more than 2,000 Boots pharmacies in the United Kingdom.36
8. AldiAldi’s retail revenue grew by 8.1% in FY2020. Its 11,540 discount stores in 20 countries are split between two privately-owned companies: Aldi Süd, with FY2020 net sales of €64 billion, and its smaller sister company Aldi Nord, with FY2020 net sales of €24.2 billion. Aldi also owns US neighborhood grocery store Trader Joe’s, which had 2020 sales of around US$16.5 billion. All of the Aldi operations achieved revenue growth in FY2020. Aldi Süd opened
Global Powers of Retailing 2022 | Top 10 highlights

11
around three-quarters of the 305 new Aldi discount stores, with the highest number of store openings in the United States and the United Kingdom. It opened its first two pilot stores in China in June 2019, and had 10 stores by November 2020, as well as a Tmall store and WeChat Mini Program. In FY2020 Aldi Nord expanded its discount store network for the first time since 2015. The two companies continued their convergence, with a new 50:50 joint venture company in their home market, Aldi E-commerce Verwaltungs GmbH.37 Its merged German online site “Aldi Onlineshop”, launched in September 2021, offers faster delivery of mainly non-food items.38
Like Lidl, Aldi’s main focus is still on physical discount stores. For example, in the United Kingdom, despite a number of online initiatives including click-and-collect in 200 stores, a trial of delivery with on-demand courier Deliveroo, and its non-food Specialbuys portal, it has announced that it will make its major investment (£1.3 billion) to open 100 new stores by the end of 2023, commenting “There's no doubt that bricks and mortar is the focus for our business”.39
9. JD.comOnline retailer JD.com achieved year-over-year FY2020 retail sales growth of 27.6% in FY2020, the second highest among the Top 10 companies, and the highest five-year compound annual growth rate (CAGR) in FY2015-2020, 31.2%. It moved up four places in the ranking to enter the Top 10 for the first time. Its growth was driven mainly by a 30% year-over-year increase in annual active customer accounts in 2020, to 471.9 million. JD.com also had the second highest FY2020 net profit margin among the Top 10 companies, 6.6%, a year-over-year increase of 4.6 percentage points.
JD.com is Alibaba’s main e-commerce rival in China, although the two companies have different business models. JD.com’s primary strategic focus is on B2C online retail, unlike Alibaba’s predominantly B2B marketplace ecosystem of buyers and sellers. JD.com’s online retail revenue represented 87.4% of its total revenues in FY2020. Historically the company grew from strength in the consumer electronics, computers and telecommunications sectors; and it now offers a wide range of products including electronics, home appliances and a large variety of other general merchandise items. It delivers the majority of orders to customers through its own fulfillment infrastructure, which it claims is the largest of any e-commerce company in China.
To support its retail business, JD.com has strategic partnerships and investments with a range of companies, including other Top 250 retailers. It has a strategic alliance with Walmart, with which it collaborates on e-commerce, including launching Sam’s Club Flagship Store and Walmart Flagship Store on JD.com, as well as Sam’s Club Global Flagship Store, Walmart Global Flagship Store, ASDA Flagship Store and several category global stores to sell specific category products (for example Walmart Beauty and Personal Care Global Store) on JD Worldwide, and a one-hour delivery service from Walmart Stores and Sam’s Clubs in several cities through the JD Daojia app. The company’s strategic
partnership with Tencent gives it preferred partner status for all its physical goods e-commerce businesses. Internet company Tencent has over 1.2 billion monthly active user accounts on its mobile apps Weixin and WeChat.
In the second quarter of 2020, JD.com acquired 100% ownership of Jiangsu Five Star Appliance Co., Ltd., one of the leading offline retailers of home appliances and consumer electronics in China. JD.com also has minority stakes in other Chinese online and offline retailers: at the end of December 2020, it held 13% of Yonghui Superstores, and had invested US$600 million in online discount retailer Vipshop. In August 2020 it acquired a controlling interest in Kuayue Express, a delivery provider of express courier services.40 In March 2021, it agreed to buy additional shares to give it a 51% holding in Dada Group, a leading platform for local on-demand retail and delivery in China.41
10. TargetUS discount mass merchandiser Target achieved retail revenue growth of 19.8% in FY2020. The company overtook both CVS and Tesco in the rankings, entering the Top 10 for the first time since FY2013. Its sales growth of more than US$15 billion in FY2020 was greater than its entire sales growth over the previous 11 years. Growth was driven primarily by a US$10 billion increase (145%) in digital sales, as Target responded rapidly to consumer online demand for essential purchases during the COVID-19 pandemic. The company expanded its digital fulfillment capabilities, adding fresh and frozen food and beverage products to Order Pickup and Drive Up. During 2020, over 50% of its comparable digital sales growth was driven by its same-day fulfillment options: Order Pickup, Drive Up, and delivery via Shipt. These services grew by 235% in 2020, led by more than 600% growth in Drive Up. Comparable in-store sales were also up, by 7.2%.
In August 2021, Target launched a strategic partnership with Ulta Beauty. The “Ulta Beauty at Target” shop-in-shop is offered on Target.com and at more than 100 Target locations, with a planned rollout to 800 stores.42
Target’s FY2020 net profit margin was 4.7%, an increase of 0.5 percentage points on the previous year.
Comparing the Top 10 and Top 250Retail revenue growth by the Top 10 in FY2020 jumped by eight percentage points from the previous year, to 12.4%, on a composite sales-weighted and currency-adjusted basis. This was more than double the composite growth of the Top 250 retailers. Amazon, JD.com, Home Depot and Schwarz Group all achieved double-digit revenue growth. The Top 10 share of the total retail revenue of the Top 250 increased again, to 34.6%, compared to 32.7% in the previous year’s Global Powers of Retailing report.
The FY2020 composite net profit margin, 3.9%, for the eight Top 10 retailers reporting net profits was 0.5 percentage points higher than the previous year, despite continued pressure on retail margins from costs related to the COVID-19 pandemic, intense
Global Powers of Retailing 2022 | Top 10 highlights

12
competition, rising labor costs, price wars, and investment in e-commerce capabilities. This increase was due mainly to the profitability of the online specialists, Amazon and JD.com. The composite net profit margin for the 191 Top 250 retailers reporting net profits was 0.6 percentage points lower than for the Top 10. The composite return on assets was also higher for the Top 10 than for the Top 250, increasing by 0.4 percentage points year-over-year, to 7.0%.
The Top 10 retailers operate more internationally than the Top 250, with retail operations in 13 countries on average in FY2019, compared to an average of 11 countries for the Top 250 retailers.
However, this average hides the fact that the internationalization of the Top 10 is polarized. Kroger, JD.com and Target operate only in their home country, and Home Depot and Walgreens Boots Alliance obtain less than 10% of their retail revenue from foreign operations. Walmart, Amazon and Costco operate in multiple countries, with around 20-30% of their retail revenue from foreign operations. At the other end of the spectrum, German companies Aldi and Schwarz Group both generate nearly three-quarters of their retail revenue outside their home country.
Top 10 vs Top 2501, FY2020
1Sales-weighted, currency-adjusted composites
Source: Deloitte Global. Global Powers of Retailing 2022. Analysis of financial performance and operations for financial years ending within the 12 months from 1 July 2020 to 30 June 2021 (FY2020) using company annual reports, Supermarket News, Forbes America’s largest private companies and other sources.
0%
5%
10%
15%
20%
25%
30%
Retail revenue growth Retail revenue 5 year CAGR
Net profit margin Return on assets % Retail Revenue from foreign operations
Top 250 Top 10
5.2%
12.4%
4.7%
7.2%
3.3% 3.9% 4.4%
7.0%
21.3%
25.1%
Global Powers of Retailing 2022 | Top 10 highlights

13
Global Powers of Retailing 2022 | Sustainability in retail: profit, people, and the planet
Sustainability in retail: profit, people, and the planetDriven by the three-pronged effect of consumer behavior, government regulations and investor sentiment, retailers globally are redirecting their strategic planning efforts and investments toward sustainable and responsible growth.
Almost all the retailers in the Top 250 have outlined their environmental, social and governance (ESG) commitments and are publishing ESG-related metrics based on one or more of the ESG reporting standards, such as Sustainability Accounting Standards Board (SASB), Task Force on Climate-Related Financial Disclosure (TCFD) and Global Reporting Index (GRI).
Retailers are now considering the sustainability credentials of their products, as well as their overall brand, as a core part of their business strategy, in order to resonate with the concerns of an increasingly wide range of consumers.
of consumers purchased a sustainable product or service within the past 4 weeks
Purchased a sustainable product or service within the past four weeks
Of those surveyed....
32% Paid significantly more than an alternative
19% Waited longer for deliver or to obtain it
16% Bought a used or upcycled product
16% Accepted a lower quality product/service
13% Agreed to participate in a special process to dispose of it.
55%
55%
19%16%
16%
13%
32%
Drivers behind the sustainability pushThe responsible consumerOne of the biggest drivers behind the focus on the environment and social issues is the emergence of the ’responsible consumer’. Consumers, particularly those from the millennial and Gen Z age groups, are showing a strong interest in sustainability and expect the same from the companies they interact with.
Deloitte’s Global State of the Consumer Tracker found that 55% of consumers in its survey had purchased a sustainable product or service in October 2021, and 32% also said that they paid significantly more for their sustainable purchase than the price of an alternative product. The largest category of sustainable purchases by respondents was food and beverages at 42%, followed by everyday household goods at 25%.
Food and beverages
Beauty products
Housing, water, electricity, gas, utilities, and other fuels
Appliances and home furnishings
Clothing and footwear
Transportation
Everyday household goods
Food and beverages 42%
25%
7%
7%
6%
6%
3%
2%
Source: Global State of the Consumer Tracker, October 2021
Consumer demand sparks sustainability movement in retail

14
Global Powers of Retailing 2022 | Sustainability in retail: profit, people, and the planet
Millennials and Gen ZsThe topic of sustainability is especially high on the agenda of Millennials and Gen Zs. For Gen Zs, it is their number one concern. For Millennials, it comes just after concerns about healthcare and unemployment. Among the respondents to the survey, 44% of millennials and 43% of Gen Zs feared that the environment has passed a point of no return and it is too late to repair the damage caused by climate change. As a consequence, 28% had started or deepened their relationships as customers with businesses whose products and services benefit the environment. About the same percentage had stopped or lessened their relationships with organizations whose offerings they considered to be harmful to the planet.59 In line with the changing expectations of the Gen Z consumer, apparel retailer The Gap launched a new collection called Gap Teen in FY2019, with clothes in the collection made using sustainable practices, that save water and reduce wastage.61
Investor sentimentRetailers are also facing pressure in the boardroom from their shareholders and other investors to adopt sustainable strategies. Investors are conscious of how their own brand and reputation are affected by the retailers they support, and 59% of investors surveyed globally by BNP Paribas invest in companies that align with their values.62 US-based apparel and home goods retailer TJX introduced a new chemical management strategy to protect its customers, employees and the environment from toxic chemicals, in response to pressure from investors (44% of its shareholders) to reduce the company’s chemical footprint.63 Retailers are also facing pressure from their shareholders to provide equal employment opportunities in their organizations. In the US 2021 proxy season, the average percentage of shareholder votes cast in favor of releasing the EEO-1 report, which consists of demographic data such as race/ethnicity and gender of employees, increased to 70% as compared to just 25% in 2020.64
Ripple effects in the boardroomAccording to Deloitte’s 2022 CxO Sustainability Survey, 86% of consumer industry CxOs believe that, with immediate action, they can limit the worst impacts of climate change and move toward an improved future. As a result, 66% expect climate change to have a big impact on their company’s strategy and operations over the next three years.
The top actions already taken are increasing the efficiency of energy use, and using more sustainable materials (both 71%). 56% of the executives are also developing new climate-friendly products or services. While the organizational strategies continue to evolve, executives also feel that developing new climate friendly products and services is among the harder-to-implement actions, which they can adopt to combat climate change. Other onerous actions selected by the CxOs are requiring suppliers and business partners to meet specific sustainability criteria, updating/relocating facilities to make them more resistant to climate impacts and tying the compensation of senior leaders to sustainability performance.
Retailers continue to develop their sustainability strategies with ambitious net-zero emissions targets, and initiatives to reduce product wastage and implement a circular economy. Given the high accountability to the consumer within the industry, the initiatives are being designed to satisfy customer demand for sustainable actions from the brands they interact with. Deloitte’s CxO survey found 50% of consumer industry senior executives selected brand recognition and reputation as the area most likely to benefit from their sustainability efforts, followed by 43% of CxOs selecting customer satisfaction as an area likely to have a positive impact.
Which of the following actions/adaptations has your company already undertaken as part of its sustainability efforts?
(select all that apply of up to 15 actions)
TOP ACTIONS TAKEN
71%Increasing the efficiency energy use
56%Developing new climate-friendly products or services
71%Using more sustainable materials (e.g., recycled materials, lower emitting products)
48%Requiring suppliers and business partners to meet specific sustainability criteria
57%Reducing the amount of air travel post pandemic
37%Updating/relocating facilities to make them more resistant to climate impacts
56%Developing new climate- friendly products or services
36%Incorporating climate considerations into lobbying/political donations
33%Tying senior leaders' compensation to sustainability performance
HARDER TO IMPLEMENT, NEEDLE-MOVING ACTIONS
Source: 2022 Deloitte CxO Sustainability Report

15
Global Powers of Retailing 2022 | Sustainability in retail: profit, people, and the planet
Sustainability strategiesThe many drivers for adopting sustainable strategies are together contributing to the unified global effort to tackle climate change, and accelerating efforts toward creating a healthier, less harmful, sustainable and cleaner future over the next decade. Below, we look in more detail at retailers’ strategies around the reduction of emissions and waste and efforts toward a circular economy.
Emission reductionSupermarket and grocery retailers continue to focus on strategies for reducing greenhouse gas (GHG) emissions and increasing the use of renewable energy resources. For instance, some of the biggest retailers such as Walmart and JD.com are exploring ways to make their supply chain operations greener.44,45 Walmart has committed to achieving zero emissions across its global operations by 2040 and aims to power all its facilities using 100% renewable energy sources by 2035.46
Waste reductionAnother area attracting much attention is the reduction of waste. Leading retailers in the United States such as Walmart, Target, Walgreens and Kroger have partnered with an investment firm Closed Loop Partners to form a multi-year collaboration, ‘Beyond the Bag Initiative’, with an aim to identify, test and implement innovative new design solutions for everyday retail bags, and deliver both convenience for customers and less environmental impact at the same time.48
Initiatives to reduce waste are seen across the retail industry. For example cosmetics retailer Ulta Beauty has partnered with Loop to launch refillable packaging, making it the first-ever circular beauty platform. This partnership is intended to reduce the waste from single-use packaging for cosmetics products.47
Circular economyWith the fashion industry being subjected to criticism due to its environmentally harmful practices, retailers have responded swiftly by introducing a new era of ’fashion re-commerce’. Retailers such as H&M, REI and Patagonia and several new online players such as ThreadUp and DePop are allowing consumers to donate, rent or re-sell their clothes instead of discarding them to landfill sites.49,50 Recent studies suggest that the secondhand fashion market is growing 11 times faster than traditional retail and is likely to be worth US$84 billion by 2030.51
The circular economy is also becoming a key imperative for growth among hardline retailers such as Ikea and Decathlon.52 Ikea, for instance, has launched secondhand furniture outlets and has committed to using renewable and recycled materials in its products.53
Retail workers as new frontline workersThroughout lockdowns and store closures, retail workers have shown feats of resilience to ensure that stores remained operational, orders were fulfilled on a timely basis, and the engine of retail kept moving. Largely through their efforts, the year-on-year retail revenue of the Top 250 retailers grew by 5.2% in FY2020, compared to 4.4% in FY2019. Retailers responded with wage hikes and other employment benefits. For example, Costco gave staff a ’permanent pandemic raise’.54
The great quitHowever in the later part of 2021 large numbers of employees in many different occupations and sectors quit their jobs to obtain higher wages and better benefits elsewhere. In the United States alone, 4.4 million people quit their jobs in the month of September 2021.55 In response to this ’great quit’, retailers such as Target and Best Buy raised their wages, while others such as Amazon offered hiring bonuses to new employees. The full implications of the great quit are yet to be seen, as employees continue to resign. According to a recent survey of 50 US retailers by consultants Korn Ferry, 40% said that they were having significant problems with hiring distribution center employees.56
Diversity, equality and inclusionRetailers continue to invest in diversity, equality and inclusion-related programs to bring about an inclusive working culture. The German discounter giant Aldi has created a diversity, equality and inclusion (DE&I) fund of US$5.5 million to benefit organizations that support racial equality in the United States. The retailer is also introducing unconscious bias training for all its employees.57 US-based retailer Best Buy gives training in inclusive behavior to its leaders, as an initiative for integrating DE&I into the company’s culture.58
OutlookThe pandemic has significantly altered consumer sentiment and purchasing behavior, and there seems to have been a change in consumer consciousness over the past two years, which will continue to shape future shopping patterns, along with the increasing preference for convenience and shopping online. This has led to greater focus by retailers on ESG issues, with many of them committing to ambitious environment and social goals.
Shareholders and investors are also likely to continue demanding action from retailers to report metrics relating to sustainability, employee diversity and inclusion, and corporate governance. Hence, it will be critical for retailers to continue incorporating into their strategies the ever-evolving consumer needs and expectations for a better, inclusive and sustainable future.

Global Powers of Retailing 2022 | Sustainability in retail: profit, people, and the planet
16
Case studies: Retailers’ sustainability initiatives1: LVMH Moët Hennessy-Louis Vuitton S.A.LVMH's comprehensive social and environmental responsibility report 2020 outlines the company's marquee initiatives. These include a focus on community development, and toward fostering DE&I within the workplace and promoting diversity through its consumer brands. The company established a Diversity and Inclusion program in the United States, appointing Diversity and Inclusion Managers to help educate the workforce about prejudice and its impact. Sephora became the first retailer to join the ‘15% pledge’, dedicating 15% of its shelf space to Black-owned businesses.65
2: Target CorporationTarget Corporation continues its strong focus on ESG reporting and tracking progress against metrics such as Global Reporting Initiative (GRI), Sustainability Accounting Standards Board (SASB) and Task Force on Climate-Related Financial Disclosures (TCFD), and against the United Nations Sustainable Development goals (SDGs). As part of its commitment to equality, 58% of non-managerial posts and 56% of managerial posts were held by female employees in 2021. The retailer also reports on the workforce composition by race/color across non-manager and manager levels and continues to increase its spending with diverse suppliers. Target has implemented programs such as training in circular design for its employees and the assessment of supplier factories in accordance with the Higg FEM Assessment. It is also increasing the number of charging stations for electric vehicles for consumers at its outlets, and increasing the percentage of energy consumption from renewable sources.66
3: Tesco plcUK-based retailer Tesco plc has outlined its commitment to sustainability under its Little Helps Plan, which tracks progress under four major pillars: people, product, planet and places. Some of the key developments reported in its 2020-21 sustainability update included a reduction in its Scope 1 and 2 GHG emissions by 54% compared to 2015 levels. It is also committed to increasing the proportion of healthy products to 65% of total volumes sold by 2025. Tesco also supported its employees during the pandemic, by enabling its clinically vulnerable employees to stay at home with full pay during lockdown periods.67
4: Decathlon S.A. France-based sporting goods retailer Decathlon S.A. continues to be a pioneer in the field of sustainable designs for sporting goods. The retailer released a transition plan for sustainable development through 2020-2026, focusing on three key areas: human/community development; preserving nature; and creating sustainable value. The retailer is also promoting diversity and inclusion within the workplace and monitors the human rights practices of its suppliers. Decathlon is also known for its commitment to a circular economy, and it continues to design its products and processes to incorporate recycling, eco-design and responsible sourcing initiatives.68

17
Global Powers of Retailing 2022 | Top 250
Global Powers of Retailing Top 250
Five-year growth and profitability1 of Top 250 retailers in Global Powers of Retailing reports
1Sales-weighted, currency-adjusted composites
Source: Deloitte Global. Global Powers of Retailing reports from 2018 to 2022. Analysis of financial performance and operations for financial years ending within the 12 months from 1 July to 30 June (e.g., FY2020 is financial year ending within the 12 months from 1 July 2020 to 30 June 2021) using company annual reports, Supermarket News, Forbes America’s largest private companies and other sources
In FY2020 the COVID-19 pandemic helped fuel growth of the Top 250 retailers at a faster pace than in FY2019. E-commerce specialists saw strong growth as consumer purchasing moved online. Food and drink retailers increased sales as consumption switched from the hospitality sector to in-home, and retailers in other sectors such as home improvement benefited from the consumer ‘stay-at-home’ focus. This was partially offset by falling sales in retailers operating in the fashion and luxury categories; those with significant travel retail operations; and those with little e-commerce capability.
The total retail revenue of the Top 250 companies reached US$5.1 trillion in FY2020, an increase of 5.2% over FY2019 on a sales-weighted, currency-adjusted composite basis. However, 69 companies reported declining sales, 14 more than in the previous year. The five-year compound annual growth rate (CAGR) for the period FY2015-2020, 4.7%, was 0.3 percentage points below the CAGR for the period FY2014-2019. The threshold retail revenue to make it into the Top 250 list in FY2020, US$4.1 billion, increased by less than US$0.1 billion.
Of the 191 companies that reported their bottom-line results, 82.7% of them (158 companies) operated profitably. The composite net profit for the Top 250 improved by 0.2 percentage points, to 3.3%, and return on assets increased by 0.1 percentage points, to 4.4%.
Some Top 250 retailers sold or closed foreign operations to focus on their core business; the number of companies with operations only in their home country increased from 88 in FY2019 to 96 in FY2020. The average number of countries in which the Top 250 operate declined to 10.8 from 11.1 in FY2019, and the share of their revenue from foreign operations fell again, down 0.9 percentage points, to 21.3%. Retailers based in Europe are the most international, with more than 80% operating outside their home country, in 18.5 countries on average.
2.5%
3.0%
3.5%
4.0%
4.5%
5.0%
5.5%
FY2016 FY2017 FY2018 FY2019 FY2020
Retail revenue growth Net profit margin
3.2%
4.1% 4.1%
4.3%
4.7%
3.2%
3.0%3.1%
3.3%
5.2%
Top 250 companies by size (retail revenue US$B), FY2020
0%
25%
50%
75%
100%
% of companies % of retail revenue
>US$50B >20-50 US$B >10-20 US$B
>5-10 US$B <= US$5B
8.0%
40.4%
17.6%
46.4%
20.8%
14.0%
14.8%
4.1%
13.6%
20.4%
Source: Deloitte Global. Global Powers of Retailing 2022. Analysis of financial performance and operations for financial years ending within the 12 months from 1 July 2020 to 30 June 2021 (FY2020) using company annual reports, Supermarket News, Forbes America’s largest private companies and other sources.

18
FY2020 retail revenue rank
Change in rank from FY20193
Name of company Country of origin
FY2020 retail revenue (US$M)
FY2020 parent company/ group revenue (US$M)
Dominant operational format
# countries
of operation
FY2015-2020
retail revenue
CAGR2
FY2020 retail
revenue growth
FY2020 Net
profit margin1
1 0 Walmart Inc United States 559,151 559,151 Hypermarket/supercenter 26 3.0% 6.7% 2.5%
2 0 Amazon.com, Inc. United States 213,573 386,064 Non-store 21 21.9% 34.8% 5.5%
3 0 Costco Wholesale Corporation United States 166,761 166,761
Cash & carry/warehouse club 12 7.5% 9.2% 2.4%
4 0 Schwarz Group Germany 144,254 145,064 Discount store 33 7.8% 10.0% n/a
5 2 The Home Depot, Inc. United States 132,110 132,110 Home improvement 3 8.3% 19.9% 9.7%
6 -1 The Kroger Co. United States 131,620 132,498 Supermarket 1 3.7% 8.3% 2.0%
7 -1 Walgreens Boots Alliance, Inc. United States 117,705 139,537
Drug store/pharmacy 9 5.6% 1.5% 0.3%
8 0
Aldi Einkauf GmbH & Co. oHG and Aldi International Services GmbH & Co. oHG
Germany 117,047 e 117,047 e Discount store 19 5.8% 8.1% n/a
9 4 JD.com, Inc China 94,423 108,028 ** Non-store 1 31.2% 27.6% 6.6%
10 1 Target Corporation United States 92,400 93,561 Discount department store 1 4.6% 19.8% 4.7%
11 -2 CVS Health Corporation United States 91,198 268,706
Drug store/pharmacy 1 4.8% 5.3% n/a
12 3 Lowe's Companies, Inc. United States 89,597 89,597
Home improvement 2 8.7% 24.2% 6.5%
13 -1 Ahold Delhaize Netherlands 85,177 85,177 Supermarket 10 14.4% 12.8% 1.9%
14 0 Aeon Co., Ltd. Japan 75,077 81,204 ** Hypermarket/supercenter 11 0.7% 0.3% -0.4%
15 -5 Tesco PLC United Kingdom 73,888 74,838
Hypermarket/supercenter 5 1.3% -10.3% 10.6%
16 0 Albertsons Companies, Inc. United States 69,690 69,690 Supermarket 1 3.5% 11.6% 1.2%
17 0 Edeka-Verbund Germany 68,268 e** 69,522 ** Supermarket 1 4.9% 9.7% n/a
18 1 Rewe Group Germany 61,853 ** 77,761 ** Supermarket 11 6.7% 8.9% 0.6%
19 -1 Seven & i Holdings Co., Ltd. Japan 52,317 ** 54,426 **
Convenience/forecourt store 17 -0.8% -13.2% 3.4%
20 1 Best Buy Co., Inc. United States 47,262 47,262 Electronics specialty 3 3.6% 8.3% 3.8%
21 7 Publix Super Markets, Inc. United States 45,204 45,204 Supermarket 1 6.7% 17.5% 8.8%
22 0 Centres Distributeurs E. Leclerc France 44,676 e** 55,959 ge** Supermarket 6 2.1% 1.0% n/a
Global Powers of Retailing 2022 | Top 250
Source: Deloitte Global. Global Powers of Retailing 2022. Analysis of financial performance and operations for financial years ending within the 12 months from 1 July 2020 to 30 June 2021 (FY2020) using company annual reports, Supermarket News, Forbes America’s largest private companies and other sources
n/a = not available
g = gross turnover as reported by company
** Revenue includes wholesale and retail sales
ne = not in existence (created by merger or divestiture)
1 Net profit margin based on total consolidated revenue and net income. May include results from non-retail operations if these are <50% of group revenue.2 Compound annual growth rate3 Change in ranking versus FY2019 ranking from the Global Powers of Retailing 2021 report
e=estimate
Global Powers of Retailing Top 250, FY2020

19
FY2020 retail revenue rank
Change in rank from FY20193
Name of company Country of origin
FY2020 retail revenue (US$M)
FY2020 parent company/ group revenue (US$M)
Dominant operational format
# countries
of operation
FY2015-2020
retail revenue
CAGR2
FY2020 retail
revenue growth
FY2020 Net
profit margin1
23 1 Woolworths Limited Australia 41,533 ** 41,533 ** Supermarket 2 -0.4% -10.7% 3.8%
24 2 The IKEA Group (INGKA Holding B.V.) Netherlands 39,174 41,586 Other specialty 30 2.0% -4.1% 3.2%
25 6 Loblaw Companies Limited Canada 38,663 ** 39,300 **
Hypermarket/supercenter 3 3.1% 10.1% 2.3%
26 6ITM Développement International (Intermarché)
France 37,496 e** 52,768 g** Supermarket 4 3.4% 3.9% n/a
27 3 J Sainsbury plc United Kingdom 36,997 37,554
Hypermarket/supercenter 2 4.3% 0.7% -1.0%
28 -1 Casino Guichard-Perrachon S.A. France 36,370 37,052 **
Hypermarket/supercenter 27 -7.1% -7.9% 2.0%
29 -9 Auchan Holding SA France 36,045 e 36,604 ** Hypermarket/supercenter 13 -9.9% -30.9% 2.8%
30 -7LVMH Moët Hennessy- Louis Vuitton S.A."
France 35,856 50,889 ** Other specialty 80 6.4% -15.8% 11.1%
31 -2 Suning.com Co., Ltd. China 34,547 36,545 Electronics specialty 1 12.9% -6.0% -2.1%
32 3 Dollar General Corporation United States 33,747 33,747 Discount store 1 10.6% 21.6% 7.9%
33 -8 The TJX Companies, Inc. United States 32,137 32,137
Apparel/footwear specialty 9 0.8% -23.0% 0.3%
34 0 H-E-B Grocery United States 32,000 e 32,000 e Supermarket 2 6.8% 13.5% n/a
35 4 Coles Group Limited Australia 28,757 29,033 Supermarket 1 -0.3% 3.1% 2.6%
36 4Migros-Genossenschafts Bund
Switzerland 28,457 e** 31,895 ** Hypermarket/supercenter 3 2.7% 7.7% 5.9%
37 0 Mercadona, S.A. Spain 28,129 28,129 Supermarket 2 5.3% 5.6% 2.9%
38 -2 X5 Retail Group N.V. Russia 27,310 ** 27,342 ** Discount store 1 19.6% 14.3% 1.4%
39 7 Coop Group Switzerland 25,623 e** 32,135 Supermarket 7 2.2% 3.7% 2.2%
40 5 Dollar Tree, Inc. United States 25,509 25,509 Discount store 2 10.5% 8.0% 5.3%
41 2 Groupe Adeo SA France 25,425 ** 25,425 ** Home improvement 13 8.0% 2.1% n/a
42 44Alibaba Group Holding Limited/ New Retail & Direct Sales
Hong Kong SAR 24,718 e 105,779 Department store 1 n/a 94.3% n/a
43 4 Système U, Centrale Nationale France 24,435 e** 30,544 g** Supermarket 3 2.8% 4.7% n/a
44 -6 Metro AG Germany 24,277 e 28,683 ** Cash & carry/warehouse club 24 ne -3.5% 1.8%
45 -12 Inditex, S.A. Spain 23,431 ** 23,431 ** Apparel/footwear specialty 216 -0.5% -27.9% 5.4%
Global Powers of Retailing 2022 | Top 250
Source: Deloitte Global. Global Powers of Retailing 2022. Analysis of financial performance and operations for financial years ending within the 12 months from 1 July 2020 to 30 June 2021 (FY2020) using company annual reports, Supermarket News, Forbes America’s largest private companies and other sources
n/a = not available
g = gross turnover as reported by company
** Revenue includes wholesale and retail sales
ne = not in existence (created by merger or divestiture)
1 Net profit margin based on total consolidated revenue and net income. May include results from non-retail operations if these are <50% of group revenue.2 Compound annual growth rate3 Change in ranking versus FY2019 ranking from the Global Powers of Retailing 2021 report
e=estimate

20
FY2020 retail revenue rank
Change in rank from FY20193
Name of company Country of origin
FY2020 retail revenue (US$M)
FY2020 parent company/ group revenue (US$M)
Dominant operational format
# countries
of operation
FY2015-2020
retail revenue
CAGR2
FY2020 retail
revenue growth
FY2020 Net
profit margin1
46 -2 Ceconomy AG Germany 23,310 23,310 Electronics specialty 13 ne -2.9% -1.0%
47 1 Wm Morrison Supermarkets PLC
United Kingdom 22,640 ** 22,640 ** Supermarket 1 1.8% 0.4% 0.5%
48 9 Wesfarmers Limited Australia 22,215 25,311 Supermarket 4 -13.4% 10.6% 7.0%
49 1 Jerónimo Martins, SGPS, S.A. Portugal 21,988 21,988 Discount store 3 7.0% 3.5% 1.7%
50 5 Empire Company Limited Canada 21,582 ** 21,662 ** Supermarket 1 2.7% 6.3% 2.7%
51 3 Meijer, Inc. United States 21,000 e 21,000 e Hypermarket/supercenter 1 4.4% 4.0% n/a
52 0 PJSC "Magnit" Russia 20,874 21,478 ** Convenience/forecourt store 1 9.8% 13.3% 2.1%
53 -4 A.S. Watson Group Hong Kong SAR 20,579 ** 20,579 **
Drug store/pharmacy 27 1.0% -5.7% n/a
54 -13 H & M Hennes & Mauritz AB Sweden 20,099 ** 20,099 **
Apparel/footwear specialty 74 0.7% -19.6% 0.7%
55 -4 Fast Retailing Co., Ltd. Japan 18,579 ** 18,600 ** Apparel/footwear specialty 24 3.6% -12.3% 4.5%
56 -3 Reliance Retail Limited India 18,454 18,494 Supermarket 1 49.4% -5.3% 3.4%
57 5 E-MART Inc. South Korea 17,426 ** 18,663 ** Supermarket 6 10.4% 16.4% 1.6%
58 -16 Macy's, Inc. United States 17,346 ** 17,346 ** Department store 3 -8.5% -29.4% -22.7%
59 18 NIKE, Inc. / NIKE Direct United States 17,136 44,538 **
Apparel/footwear specialty 76 16.9% 32.0% n/a
60 -2 CP ALL Plc. Thailand 16,780 ** 17,441 ** Convenience/forecourt store 1 6.1% -4.5% 3.0%
61 9
Conad Consorzio Nazionale, Dettaglianti Soc. Coop. a.r.l.
Italy 16,366 e** 18,178 g** Supermarket 5 5.5% 12.4% n/a
62 -1 Rite Aid Corporation United States 16,365 24,043 Drug store/pharmacy 1 -9.4% 4.8% -0.4%
63 5 Kingfisher plc United Kingdom 15,880 15,880
Home improvement 8 3.4% 7.2% 4.8%
64 12 BJ’s Wholesale Club Holdings, Inc. United States 15,430 15,430
Cash & carry/warehouse club 1 4.4% 17.0% 2.7%
65 1Pan Pacific International Holdings
Japan 15,335 16,041 Discount department store 7 17.4% 1.5% 3.2%
66 -10 Kohl's Corporation United States 15,031 15,955 Department store 1 -4.8% -20.4% -1.0%
67 16 Vipshop Holdings Limited China 14,935 15,610 Non-store 1 19.7% 17.2% 5.8%
68 21 PetSmart, Inc. United States 14,600 e 14,600 e Other specialty 2 14.9% 23.2% n/a
Global Powers of Retailing 2022 | Top 250
Source: Deloitte Global. Global Powers of Retailing 2022. Analysis of financial performance and operations for financial years ending within the 12 months from 1 July 2020 to 30 June 2021 (FY2020) using company annual reports, Supermarket News, Forbes America’s largest private companies and other sources
n/a = not available
g = gross turnover as reported by company
** Revenue includes wholesale and retail sales
ne = not in existence (created by merger or divestiture)
1 Net profit margin based on total consolidated revenue and net income. May include results from non-retail operations if these are <50% of group revenue.2 Compound annual growth rate3 Change in ranking versus FY2019 ranking from the Global Powers of Retailing 2021 report
e=estimate

21
FY2020 retail revenue rank
Change in rank from FY20193
Name of company Country of origin
FY2020 retail revenue (US$M)
FY2020 parent company/ group revenue (US$M)
Dominant operational format
# countries
of operation
FY2015-2020
retail revenue
CAGR2
FY2020 retail
revenue growth
FY2020 Net
profit margin1
69 5 Qurate Retail Group United States 14,177 14,177 Non-store 7 7.3% 5.3% 8.9%
70 -3
Yamada Holdings Co., Ltd. (Formerly Yamada Denki Co., Ltd.)
Japan 14,176 ** 16,526 ** Electronics specialty 4 -1.4% 3.7% 2.9%
71 46 Wayfair Inc United States 14,145 14,145 Non-store 4 44.4% 55.0% 1.3%
72 13 Spar Holding AG Austria 13,864 ** 13,942 ** Supermarket 8 6.1% 9.9% 2.3%
73 5 John Lewis Partnership plc
United Kingdom 13,858 ** 13,858 ** Supermarket 2 2.0% 6.1% -4.2%
74 -15 The Gap, Inc. United States 13,800 ** 13,800 ** Apparel/footwear specialty 40 -2.7% -15.8% -4.8%
75 15 Otto (GmbH & Co KG) Germany 13,783 18,108 Non-store 30 3.9% 11.8% 6.2%
76 -11 Lotte Shopping Co., Ltd. South Korea 13,709 13,709 Discount store 5 -10.1% -8.2% -4.2%
77 -4 Coop Italia Italy 13,642 e 16,412 ge Hypermarket/supercenter 1 1.2% -0.7% n/a
78 4 Currys plc. (formerly Dixons Carphone plc)
United Kingdom 13,624 13,624
Electronics specialty 7 1.5% 1.7% 0.1%
79 5 Metro Inc. Canada 13,376 ** 13,376 ** Supermarket 1 8.0% 7.3% 4.4%
80 7 ICA Gruppen AB Sweden 13,345 ** 13,705 ** Supermarket 4 4.4% 6.1% 3.3%
81 -18 FEMSA Comercio, S.A. de C.V. Mexico 13,058 13,058
Convenience/forecourt store 6 13.1% -3.7% n/a
82 -11 Décathlon S.A. France 12,993 12,993 Other specialty 60 4.6% -8.1% 4.8%
83 5 AutoZone, Inc. United States 12,632 ** 12,632 ** Other specialty 3 4.4% 6.5% 13.7%
84 8 Yonghui Superstores Co., Ltd. China 12,607 13,500
Hypermarket/supercenter 1 16.7% 10.8% 1.8%
85 -25 Ross Stores, Inc. United States 12,532 12,532 Apparel/footwear specialty 1 1.0% -21.9% 0.7%
86 -5 Cencosud S.A. Chile 12,402 12,679 Supermarket 5 -1.4% 8.3% 1.7%
87 4 S Group Finland 12,229 13,249 Supermarket 3 2.3% 3.2% n/a
88 10 Alimentation Couche-Tard Inc. Canada 12,119 34,936
Convenience/forecourt store 24 9.5% 8.2% n/a
89 -10 Marks and Spencer Group plc
United Kingdom 11,951 ** 11,951 ** Department store 100 -2.8% -10.1% -2.2%
90 -10 L Brands, Inc. United States 11,847 ** 11,847 ** Apparel/footwear specialty 75 -0.5% -8.3% 7.1%
91 10 Menard, Inc. United States 11,800 e 11,800 e Home improvement 1 6.3% 10.3% n/a
92 2 Dirk Rossmann GmbH Germany 11,796 g 11,796 g
Drug store/pharmacy 8 5.6% 3.5% n/a
93 3Compagnie Financière Richemont SA
Switzerland 11,700 15,314 ** Other specialty 54 10.3% 0.6% 9.8%
Global Powers of Retailing 2022 | Top 250
Source: Deloitte Global. Global Powers of Retailing 2022. Analysis of financial performance and operations for financial years ending within the 12 months from 1 July 2020 to 30 June 2021 (FY2020) using company annual reports, Supermarket News, Forbes America’s largest private companies and other sources
n/a = not available
g = gross turnover as reported by company
** Revenue includes wholesale and retail sales
ne = not in existence (created by merger or divestiture)
1 Net profit margin based on total consolidated revenue and net income. May include results from non-retail operations if these are <50% of group revenue.2 Compound annual growth rate3 Change in ranking versus FY2019 ranking from the Global Powers of Retailing 2021 report
e=estimate

22
FY2020 retail revenue rank
Change in rank from FY20193
Name of company Country of origin
FY2020 retail revenue (US$M)
FY2020 parent company/ group revenue (US$M)
Dominant operational format
# countries
of operation
FY2015-2020
retail revenue
CAGR2
FY2020 retail
revenue growth
FY2020 Net
profit margin1
94 10 O'Reilly Automotive, Inc. United States 11,604 ** 11,604 ** Other specialty 2 7.8% 14.3% 15.1%
95 -20 Kering S.A. France 11,296 e 14,930 ** Apparel/footwear specialty 95 9.4% -17.5% 16.6%
96 3 dm-drogerie markt Verwaltungs-GmbH Germany 11,098 12,972 g
Drug store/pharmacy 13 5.3% 3.6% 1.2%
97 -28 El Corte Inglés, S.A. Spain 11,098 12,077 Department store 19 -4.2% -27.0% -28.3%
98 91 Coupang, Inc. South Korea 11,045 11,967 Non-store 1 66.0% 90.9% -4.0%
99 6 Hy-Vee, Inc. United States 11,000 e 11,000 e Supermarket 1 3.4% 8.9% n/a
100 7 Shoprite Holdings Ltd. South Africa 10,892 ** 10,892 ** Supermarket 13 5.3% 7.1% 2.9%
101 11 Wegmans Food Markets, Inc. United States 10,796 10,796 Supermarket 1 6.4% 11.3% n/a
102 25 Tractor Supply Company United States 10,620 10,620 Other specialty 1 11.3% 27.2% 7.1%
103 7 NorgesGruppen ASA Norway 10,529 ** 10,754 ** Discount store 1 6.2% 13.3% 3.5%
104 -1The Sherwin-Williams Company / Americas Group
United States 10,383 ** 18,362 ** Home improvement 15 5.8% 2.1% 11.1%
105 -41 Nordstrom, Inc. United States 10,357 10,715 Department store 2 -6.0% -31.6% -6.4%
106 10 Giant Eagle, Inc. United States 10,350 e** 10,350 e** Supermarket 1 1.5% 8.9% n/a
107 -14Dairy Farm International Holdings Limited
Hong Kong SAR 10,269 10,269 Supermarket 10 -1.6% -8.3% 2.5%
108 -11 China Resources Vanguard Co., Ltd. China 10,178 e 12,722 ge
Hypermarket/supercenter 1 -4.3% -7.6% n/a
109 0 Canadian Tire Corporation, Limited Canada 10,152 ** 11,087 ** Other specialty 1 4.2% 3.1% 5.8%
110 1 Advance Auto Parts, Inc. United States 10,106 ** 10,106 ** Other specialty 5 0.7% 4.1% 4.9%
111 3 Co-operative Group Ltd.
United Kingdom 9,966 14,708 **
Convenience/forecourt store 1 2.0% 3.4% 0.7%
112 -10 S.A.C.I. Falabella Chile 9,888 10,444 Home improvement 7 2.3% 4.7% 0.4%
113 7 Colruyt Group Belgium 9,756 11,570 ** Supermarket 3 3.2% 5.2% 4.2%
114 22
Southeastern Grocers, Inc. (formerly Southeastern Grocers, LLC)
United States 9,645 e 9,645 e Supermarket 1 -3.0% 16.5% n/a
115 7 Dick's Sporting Goods, Inc. United States 9,584 9,584 Other specialty 1 5.7% 9.5% 5.5%
116 2 Esselunga S.p.A. Italy 9,350 9,350 Hypermarket/supercenter 1 2.7% 2.6% 3.3%
Global Powers of Retailing 2022 | Top 250
Source: Deloitte Global. Global Powers of Retailing 2022. Analysis of financial performance and operations for financial years ending within the 12 months from 1 July 2020 to 30 June 2021 (FY2020) using company annual reports, Supermarket News, Forbes America’s largest private companies and other sources
n/a = not available
g = gross turnover as reported by company
** Revenue includes wholesale and retail sales
ne = not in existence (created by merger or divestiture)
1 Net profit margin based on total consolidated revenue and net income. May include results from non-retail operations if these are <50% of group revenue.2 Compound annual growth rate3 Change in ranking versus FY2019 ranking from the Global Powers of Retailing 2021 report
e=estimate

23
FY2020 retail revenue rank
Change in rank from FY20193
Name of company Country of origin
FY2020 retail revenue (US$M)
FY2020 parent company/ group revenue (US$M)
Dominant operational format
# countries
of operation
FY2015-2020
retail revenue
CAGR2
FY2020 retail
revenue growth
FY2020 Net
profit margin1
117 4 Tengelmann Group Germany 9,346 e** 9,460 e** Home improvement 19 0.1% 4.1% n/a
118 5 Adidas Group Germany 9,267 22,616 ** Apparel/footwear specialty 50 14.0% 4.1% n/a
119 9 Beisia Group Co., Ltd. Japan 9,249 e** 9,694 e** Home improvement 1 3.8% 8.9% n/a
120 6 Salling Group Denmark 9,246 9,302 Discount store 3 1.1% 7.4% 3.0%
121 -26 Bed Bath and Beyond Inc. United States 9,233 9,233 Other specialty 3 -5.3% -17.3% -1.6%
122 27 Zalando SE Germany 9,097 9,097 Non-store 17 22.0% 23.1% 2.8%
123 25Chow Tai Fook Jewellery Group Limited
Hong Kong SAR 9,050 ** 9,050 ** Other specialty 11 4.4% 23.6% 8.8%
124 -52Steinhoff International Holdings N.V.
South Africa 8,839 8,839 Discount store 29 -6.7% -34.1% -30.0%
125 6 WinCo Foods LLC United States 8,800 e 8,800 e Supermarket 1 7.3% 8.6% n/a
126 19 Jumbo Groep Holding B.V. Netherlands 8,776 ** 8,818 ** Supermarket 2 7.7% 13.8% 1.8%
127 8 Tsuruha Holdings Inc. Japan 8,660 8,660 Drug store/pharmacy 2 11.7% 9.3% 3.2%
128 -15 Grupo Coppel Mexico 8,660 e 8,660 e Department store 2 11.9% 1.5% n/a
129 -14 SIGNA Retail Group Austria 8,548 e 8,548 e Department store 20 n/a -11.8% n/a
130 -1 FNAC Darty S.A. France 8,537 ** 8,537 ** Other specialty 12 14.1% 1.9% 1.2%
131 15 Emke Group / Lulu Group International
United Arab Emirates 8,400 e 8,400 e
Hypermarket/supercenter 10 6.3% 0.0% n/a
132 -2 "Kesko Corporation " Finland 8,400 e** 12,160 ** Supermarket 7 2.5% 0.7% 4.1%
133 -14 Louis Delhaize S.A. Belgium 8,302 8,402 Hypermarket/supercenter 4 -2.9% -8.1% 0.5%
134 8 President Chain Store Corp. Taiwan 8,019 8,773 **
Convenience/forecourt store 4 4.2% 1.2% 4.4%
135 9 Globus Holding GmbH & Co. KG Germany 8,000 e 8,000 e
Hypermarket/supercenter 4 2.8% -1.6% n/a
136 new Mercury Retail Holding plc Russia 7,896 7,979
Convenience/forecourt store 1 n/a n/a 4.4%
137 15 BİM Birleşik Mağazalar A.Ş. Turkey 7,891 7,891 Discount store 3 26.1% 38.0% 4.7%
138 -1
Distribuidora Internacional de Alimentación, S.A. (Dia, S.A.)
Spain 7,844 ** 7,896 ** Discount store 4 -5.1% 0.2% -5.3%
139 new Real Hypermarket Business Germany 7,750 e 7,750 e
Hypermarket/supercenter 1 ne 1.5% n/a
Global Powers of Retailing 2022 | Top 250
Source: Deloitte Global. Global Powers of Retailing 2022. Analysis of financial performance and operations for financial years ending within the 12 months from 1 July 2020 to 30 June 2021 (FY2020) using company annual reports, Supermarket News, Forbes America’s largest private companies and other sources
n/a = not available
g = gross turnover as reported by company
** Revenue includes wholesale and retail sales
ne = not in existence (created by merger or divestiture)
1 Net profit margin based on total consolidated revenue and net income. May include results from non-retail operations if these are <50% of group revenue.2 Compound annual growth rate3 Change in ranking versus FY2019 ranking from the Global Powers of Retailing 2021 report
e=estimate

24
FY2020 retail revenue rank
Change in rank from FY20193
Name of company Country of origin
FY2020 retail revenue (US$M)
FY2020 parent company/ group revenue (US$M)
Dominant operational format
# countries
of operation
FY2015-2020
retail revenue
CAGR2
FY2020 retail
revenue growth
FY2020 Net
profit margin1
140 -8 Bic Camera Inc. Japan 7,737 7,851 Electronics specialty 1 1.3% -5.1% 1.1%
141 0 JD Sports Fashion Plc United Kingdom 7,696 e 7,934 ** Other specialty 20 28.2% 0.9% 3.7%
142 -3 The SPAR Group Limited South Africa 7,648 ** 7,648 ** Supermarket 13 10.9% 13.5% 1.6%
143 -5 Majid Al Futtaim Holding LLC
United Arab Emirates 7,616 8,867
Hypermarket/supercenter 17 4.9% -0.6% 8.3%
144 14 Sonae, SGPS, SA Portugal 7,588 ** 7,781 ** Supermarket 62 6.8% 7.6% 0.8%
145 -11 Foot Locker, Inc. United States 7,548 7,548 Apparel/footwear specialty 27 0.4% -5.7% 4.3%
146 -38 Associated British Foods plc / Primark
United Kingdom 7,481 17,688
Apparel/footwear specialty 13 2.0% -24.3% n/a
147 19 K's Holdings Corporation Japan 7,474 ** 7,474 **
Electronics specialty 1 4.2% 11.9% 4.9%
148 -42 Isetan Mitsukoshi Holdings Ltd. Japan 7,445 7,695 Department store 7 -8.9% -27.4% -5.2%
149 10 Reitan AS Norway 7,389 ** 8,558 ** Discount store 7 5.9% 14.9% 5.0%
150 41 Ace Hardware Corporation United States 7,346 7,763
Home improvement 66 9.3% 29.3% 4.1%
151 -18 Organización Soriana, S.A.B. de C.V. Mexico 7,305 ** 7,305 **
Hypermarket/supercenter 1 7.5% 0.8% 2.4%
152 8 Edion Corporation Japan 7,243 ** 7,243 ** Electronics specialty 1 2.1% 4.7% 2.2%
153 10 Gruppo Eurospin Italy 7,223 7,304 Discount store 3 7.3% 7.5% 4.5%
154 11 Life Corporation Japan 7,165 7,165 Supermarket 1 4.4% 6.2% 2.3%
155 14Bauhaus AG (formerly Bauhaus GmBH & Co. KG)
Germany 7,107 e 8,434 e Home improvement 19 3.6% 7.7% n/a
156 0
Great American Outdoors Group, LLC (fomerly Bass Pro Group, LLC)
United States 7,100 e 7,100 e Other specialty 2 18.1% 1.4% n/a
157 -7 GS Retail Co., Ltd. South Korea 7,003 e 7,507 Convenience/forecourt store 3 6.5% -0.8% 1.7%
158 47
Wumart Technology Group Co., Ltd. (formerly Wumart Holdings, Inc.)
China 6,914 e** 8,065 ** Supermarket 1 9.5% 32.0% 3.1%
159 11 Yodobashi Camera Co., Ltd. Japan 6,901 6,901
Electronics specialty 1 0.9% 3.9% n/a
160 13 Cosmos Pharmaceutical Corp. Japan 6,833 6,833
Drug store/pharmacy 1 10.2% 6.1% 3.7%
161 21 Williams-Sonoma, Inc. United States 6,783 6,783 Non-store 13 6.4% 15.0% 10.0%
Global Powers of Retailing 2022 | Top 250
Source: Deloitte Global. Global Powers of Retailing 2022. Analysis of financial performance and operations for financial years ending within the 12 months from 1 July 2020 to 30 June 2021 (FY2020) using company annual reports, Supermarket News, Forbes America’s largest private companies and other sources
n/a = not available
g = gross turnover as reported by company
** Revenue includes wholesale and retail sales
ne = not in existence (created by merger or divestiture)
1 Net profit margin based on total consolidated revenue and net income. May include results from non-retail operations if these are <50% of group revenue.2 Compound annual growth rate3 Change in ranking versus FY2019 ranking from the Global Powers of Retailing 2021 report
e=estimate

25
FY2020 retail revenue rank
Change in rank from FY20193
Name of company Country of origin
FY2020 retail revenue (US$M)
FY2020 parent company/ group revenue (US$M)
Dominant operational format
# countries
of operation
FY2015-2020
retail revenue
CAGR2
FY2020 retail
revenue growth
FY2020 Net
profit margin1
162 22 Nitori Holdings Co., Ltd. Japan 6,766 6,766 Other specialty 4 9.4% 11.6% 12.8%
163 -2Grupo Comercial Chedraui, S.A.B. de C.V.
Mexico 6,765 6,804 Hypermarket/supercenter 2 13.3% 13.3% 1.8%
164 0 Hermès International SCA France 6,657 e 7,397 **
Apparel/footwear specialty 47 8.2% -2.9% 21.7%
165 12 Axel Johnson AB Sweden 6,657 ** 9,427 ** Supermarket 3 4.5% 3.8% 1.2%
166 36 JB Hi-Fi Limited Australia 6,649 6,649 Electronics specialty 2 17.7% 12.6% 5.7%
167 27 Sprouts Farmers Market, Inc. United States 6,469 6,469 Supermarket 1 12.5% 14.8% 4.4%
168 19 Action Holding BV Netherlands 6,425 6,425 Discount department store 8 22.6% 10.2% 4.4%
169 -44 Gome Retail Holdings Limited China 6,391 6,391
Electronics specialty 1 -12.7% -25.8% -16.3%
170 15 Valor Holdings Co., Ltd. Japan 6,384 6,885 Supermarket 2 7.4% 8.1% 2.1%
171 -20Army and Air Force Exchange Service (AAFES)
United States 6,321 6,321 Convenience/forecourt store 31 -2.6% -11.2% 1.7%
172 43 B&M European Value Retail S.A.
United Kingdom 6,267 6,267 Discount store 2 18.7% 25.9% 8.9%
173 28 Big Lots, Inc. United States 6,199 6,199 Discount store 1 3.6% 16.5% 10.1%
174 -2 Lenta Group Russia 6,159 6,159 Hypermarket/supercenter 1 12.0% 6.7% 3.7%
175 -8 Izumi Co., Ltd. Japan 6,094 ** 6,094 ** Hypermarket/supercenter 1 0.2% -9.0% 3.8%
176 14 Sundrug Co., Ltd. Japan 5,981 ** 5,981 ** Drug store/pharmacy 1 4.7% 2.7% 4.0%
177 -20 EssilorLuxottica SA Italy 5,977 16,445 ** Apparel/footwear specialty 80 ne -15.9% n/a
178 -24 SM Investments Corporation Philippines 5,973 7,937
Hypermarket/supercenter 1 6.7% -19.0% 8.7%
179 -24 Ulta Beauty, Inc United States 5,967 6,152 Other specialty 1 9.9% -15.1% 2.9%
180 -2Homeplus Co., Ltd.(formerly Homeplus Stores Co., Ltd.)
South Korea 5,962 5,962 Hypermarket/supercenter 1 0.6% -4.6% 1.3%
181 15 Coop Norge, the Group Norway 5,950 ** 6,219 ** Supermarket 1 6.9% 16.5% 1.4%
182 -42 H2O Retailing Corporation Japan 5,930 6,971 Department store 1 -6.2% -24.0% -3.4%
183 30 HORNBACH Baumarkt AG Group Germany 5,924 5,924
Home improvement 9 7.7% 15.6% 3.0%
Global Powers of Retailing 2022 | Top 250
Source: Deloitte Global. Global Powers of Retailing 2022. Analysis of financial performance and operations for financial years ending within the 12 months from 1 July 2020 to 30 June 2021 (FY2020) using company annual reports, Supermarket News, Forbes America’s largest private companies and other sources
n/a = not available
g = gross turnover as reported by company
** Revenue includes wholesale and retail sales
ne = not in existence (created by merger or divestiture)
1 Net profit margin based on total consolidated revenue and net income. May include results from non-retail operations if these are <50% of group revenue.2 Compound annual growth rate3 Change in ranking versus FY2019 ranking from the Global Powers of Retailing 2021 report
e=estimate

26
FY2020 retail revenue rank
Change in rank from FY20193
Name of company Country of origin
FY2020 retail revenue (US$M)
FY2020 parent company/ group revenue (US$M)
Dominant operational format
# countries
of operation
FY2015-2020
retail revenue
CAGR2
FY2020 retail
revenue growth
FY2020 Net
profit margin1
184 2Berkshire Hathaway Inc. / Retailing operations
United States 5,921 e 245,510 Other specialty 13 2.5% 2.9% n/a
185 new DNS Russia 5,911 5,911 Electronics specialty 1 25.9% 38.3% n/a
186 -3PT Indomarco Prismatama (Indomaret)
Indonesia 5,901 ** 5,901 ** Convenience/forecourt store 1 11.7% 5.3% 1.2%
187 1 XXXLutz Group Austria 5,812 e 5,812 e Other specialty 13 5.5% 0.0% n/a
188 12Demoulas Super Markets, Inc. (dba Market Basket)
United States 5,780 e 5,780 e Supermarket 1 4.0% 8.0% n/a
189 4 PJSC "M.video" Russia 5,772 5,776 Electronics specialty 1 20.9% 14.5% 1.6%
190 -43 Burlington Stores, Inc. United States 5,764 5,764 Department store 1 2.4% -20.9% -3.8%
191 -48 Takashimaya Company, Ltd. Japan 5,744 ** 6,426 ** Department store 5 -6.5% -26.0% -4.9%
192 24 Academy Sports and Outdoors, Inc. United States 5,689 5,689 Other specialty 1 4.1% 17.8% 5.4%
193 18 Sugi Holdings Co., Ltd. Japan 5,649 5,687 **
Drug store/pharmacy 1 7.8% 11.1% 3.5%
194 -15 Pick n Pay Stores Limited South Africa 5,632 ** 5,632 ** Supermarket 8 5.1% 4.3% 1.0%
195 14 Magazine Luiza S.A. Brazil 5,614 5,659 Other specialty 1 26.5% 46.2% 1.3%
196 -28 Via Varejo S.A. Brazil 5,606 5,606 Electronics specialty 1 n/a 12.7% 3.5%
197 2 Coop Danmark A/S Denmark 5,605 ** 5,864 ** Supermarket 2 -0.9% 2.6% 1.1%
198 -22Central Retail Corporation Public Company Limited
Thailand 5,525 6,200 Department store 3 ne -11.4% 0.2%
199 -1Lao Feng Xiang Co., Ltd. 老凤祥股份有限公司
China 5,516 e** 7,492 ** Other specialty 4 7.9% 2.6% 4.0%
200 -8 Lawson, Inc. Japan 5,482 6,286 ** Convenience/forecourt store 6 3.7% -5.5% 1.3%
201 30 Save-On-Foods LP Canada 5,480 e 5,480 e Supermarket 1 10.1% 21.5% n/a
202 -28 Deichmann SE Germany 5,436 5,490 Apparel/footwear specialty 30 0.6% -15.6% -1.5%
203 7 Harbor Freight Tools USA, Inc. United States 5,400 e 5,400 e Other specialty 1 14.8% 8.0% n/a
204 8 Grupo Eroski Spain 5,388 e** 5,808 ** Supermarket 3 -1.7% 6.1% -1.5%
205 3 The Michaels Companies, Inc. United States 5,271 5,271 Other specialty 2 1.4% 3.9% 5.6%
206 13 Arcs Co., Ltd. Japan 5,246 5,256 Supermarket 1 2.1% 7.3% 2.3%
Global Powers of Retailing 2022 | Top 250
Source: Deloitte Global. Global Powers of Retailing 2022. Analysis of financial performance and operations for financial years ending within the 12 months from 1 July 2020 to 30 June 2021 (FY2020) using company annual reports, Supermarket News, Forbes America’s largest private companies and other sources
n/a = not available
g = gross turnover as reported by company
** Revenue includes wholesale and retail sales
ne = not in existence (created by merger or divestiture)
1 Net profit margin based on total consolidated revenue and net income. May include results from non-retail operations if these are <50% of group revenue.2 Compound annual growth rate3 Change in ranking versus FY2019 ranking from the Global Powers of Retailing 2021 report
e=estimate

27
FY2020 retail revenue rank
Change in rank from FY20193
Name of company Country of origin
FY2020 retail revenue (US$M)
FY2020 parent company/ group revenue (US$M)
Dominant operational format
# countries
of operation
FY2015-2020
retail revenue
CAGR2
FY2020 retail
revenue growth
FY2020 Net
profit margin1
207 -10
MatsumotoKiyoshi Holdings Co., Ltd. (now MatsukiyoCocokara & Co.)
Japan 5,218 ** 5,252 ** Drug store/pharmacy 5 0.7% -5.8% 3.9%
208 -27 Signet Jewelers Limited United States 5,197 5,227 Other specialty 4 -4.5% -14.6% -0.3%
209 -3 PT Sumber Alfaria Trijaya Tbk (Alfamart) Indonesia 5,196 ** 5,196 **
Convenience/forecourt store 2 9.5% 4.0% 1.4%
210 4
Reinalt-Thomas Corporation (dba Discount Tire/America's Tire)
United States 5,170 e 5,170 e Other specialty 1 4.3% 5.5% n/a
211 16 Tapestry, Inc. United States 5,170 e 5,746 ** Other specialty 65 6.6% 14.1% 14.5%
212 6 Shimamura Co., Ltd. Japan 5,121 5,121 Apparel/footwear specialty 3 -0.1% 4.0% 4.8%
213 11 Woolworths Holdings Limited South Africa 5,106 5,247 Department store 13 3.9% 9.1% 5.1%
214 -43 GameStop Corp. United States 5,090 5,090 Other specialty 10 -11.5% -21.3% -4.2%
215 11 Stater Bros. Holdings Inc. United States 5,000 e 5,000 e Supermarket 1 3.5% 9.6% n/a
216 -63 Shanghai Bailian Group Co., Ltd. China 4,938 ** 5,100 **
Hypermarket/supercenter 1 -6.4% -30.2% 2.3%
217 28
Lannis Limited dba Iceland (formerly Iceland Topco Limited)
United Kingdom 4,930 ** 4,930 ** Supermarket 9 7.1% 16.2% -0.2%
218 22 JYSK Group Denmark 4,871 ** 4,871 ** Other specialty 51 6.8% 7.5% n/a
219 13 MAXIMA GRUPĖ, UAB Lithuania 4,816 ** 4,816 ** Supermarket 5 9.6% 5.8% 3.6%
220 -58El Puerto de Liverpool, S.A.B. de C.V.
Mexico 4,695 5,371 Department store 1 5.0% -20.7% 0.7%
221 26Chyuan Lien Enterprise Co Ltd / PX Mart Co., Ltd.
Taiwan 4,683 e 4,683 e Supermarket 1 -29.6% 6.2% n/a
222 13Mobile World Investment Corporation
Vietnam 4,658 4,658 Electronics specialty 2 33.9% 6.2% 3.6%
223 18 Daiso Industries Co., Ltd Japan 4,615 e** 4,962 g**
Discount department store 24 5.9% 4.9% n/a
224 1 The Save Mart Companies United States 4,600 e 4,600 e Supermarket 1 1.4% 0.0% n/a
225 5 Defense Commissary Agency (DeCA) United States 4,600 4,600 Supermarket 13 -3.5% 2.2% n/a
226 23 Yaoko Co., Ltd. Japan 4,594 4,789 Supermarket 1 9.4% 10.2% 2.9%
227 -23 Hobby Lobby Stores, Inc. United States 4,580 e 4,580 e Other specialty 1 3.8% -12.8% n/a
Global Powers of Retailing 2022 | Top 250
Source: Deloitte Global. Global Powers of Retailing 2022. Analysis of financial performance and operations for financial years ending within the 12 months from 1 July 2020 to 30 June 2021 (FY2020) using company annual reports, Supermarket News, Forbes America’s largest private companies and other sources
n/a = not available
g = gross turnover as reported by company
** Revenue includes wholesale and retail sales
ne = not in existence (created by merger or divestiture)
1 Net profit margin based on total consolidated revenue and net income. May include results from non-retail operations if these are <50% of group revenue.2 Compound annual growth rate3 Change in ranking versus FY2019 ranking from the Global Powers of Retailing 2021 report
e=estimate

28
FY2020 retail revenue rank
Change in rank from FY20193
Name of company Country of origin
FY2020 retail revenue (US$M)
FY2020 parent company/ group revenue (US$M)
Dominant operational format
# countries
of operation
FY2015-2020
retail revenue
CAGR2
FY2020 retail
revenue growth
FY2020 Net
profit margin1
228 -11
Frasers Group plc (formerly Sports Direct International plc)
United Kingdom 4,573 4,775 ** Other specialty 22 5.4% -8.6% -2.2%
229 21NORMA Unternehmens Stiftung
Germany 4,559 e 4,559 e Discount store 4 4.8% 11.0% n/a
230 new ATB-Market LLC Ukraine 4,552 e 5,505 g Discount store 1 26.3% 18.1% 3.8%
231 13 A101 Yeni Mağazacılık A.S Turkey 4,536 e 4,536 e Discount store 1 32.6% 35.4% n/a
232 14
Petco Health and Wellness Company, Inc. (formerly PETCO Animal Supplies, Inc.)
United States 4,520 e 4,920 Other specialty 2 2.6% 14.4% -0.6%
233 new Liquor Control Board of Ontario Canada 4,505 5,431 ** Other specialty 1 6.0% 12.3% 35.3%
234 8Topsports International Holdings Ltd
China 4,503 5,276 ** Other specialty 1 ne 5.4% 7.7%
235 13 Ingles Markets, Inc. United States 4,482 4,611 ** Supermarket 1 4.3% 10.1% 3.9%
236 -16 Itochu Corporation/FamilyMart Co., Ltd Japan 4,464 ** 4,464 **
Convenience/forecourt store 8 2.1% -8.5% -0.5%
237 new EG Group Limited United Kingdom 4,417 21,463
Convenience/forecourt store 10 ne 37.3% -1.1%
238 new Shufersal Ltd. Israel 4,406 4,421 Discount store 1 5.8% 14.1% 2.5%
239 new lululemon athletica inc. Canada 4,402 4,402 Other specialty 17 16.4% 10.6% 13.4%
240 new Sklavenitis Group Greece 4,321 4,321 Supermarket 2 n/a 15.6% 1.7%
241 new Joshin Denki Co., Ltd. Japan 4,235 ** 4,235 ** Electronics specialty 1 3.6% 8.1% 2.0%
242 -62 Dillard's, Inc. United States 4,213 4,433 Department store 1 -8.4% -31.5% -1.6%
243 -36 Next plc United Kingdom 4,207 ** 4,547 **
Apparel/footwear specialty 65 -4.7% -17.7% 8.1%
244 new KF Group Sweden 4,179 ** 4,205 ** Supermarket 1 3.6% 8.1% -0.3%
245 -8The ODP Corporation (formerly Office Depot)
United States 4,167 9,710 Other specialty 1 -10.5% -4.5% n/a
246 -25 OJSC Dixy Group Russia 4,130 e 4,130 e** Supermarket 1 2.0% -2.6% n/a
247 -25 Lojas Americanas S.A. Brazil 4,130 4,130 Discount department store 1 3.5% 14.1% 1.5%
248 new Weis Markets, Inc. United States 4,113 4,113 Supermarket 1 7.4% 16.1% 2.9%
249 -26 Raia Drogasil S.A. Brazil 4,108 4,108 Drug store/pharmacy 1 18.6% 15.1% 2.8%
250 new Smart & Final Stores, Inc. United States 4,100 e 4,100 e
Cash & carry/warehouse club 2 0.6% 10.2% n/a
Global Powers of Retailing 2022 | Top 250
Source: Deloitte Global. Global Powers of Retailing 2022. Analysis of financial performance and operations for financial years ending within the 12 months from 1 July 2020 to 30 June 2021 (FY2020) using company annual reports, Supermarket News, Forbes America’s largest private companies and other sources
n/a = not available
g = gross turnover as reported by company
** Revenue includes wholesale and retail sales
ne = not in existence (created by merger or divestiture)
1 Net profit margin based on total consolidated revenue and net income. May include results from non-retail operations if these are <50% of group revenue.2 Compound annual growth rate3 Change in ranking versus FY2019 ranking from the Global Powers of Retailing 2021 report
e=estimate

29
Global Powers of Retailing 2022 | Geographic analysis
Geographic analysis
This section of the report analyzes retail performance of the Top 250 by region. For the purposes of geographic analysis, companies are assigned to a region based on the location of their headquarters, which may not always coincide with where they derive the majority of their sales. Although many companies service sales from outside their region, 100% of each company’s sales are accounted for within the region that the company is headquartered in.
Top 250 profile by region, FY2020
Results reflect Top 250 retailers headquartered in each region
Source: Deloitte Global. Global Powers of Retailing 2022. Analysis of financial performance and operations for financial years ending within the 12 months from 1 July 2020 to 30 June 2021 (FY2020) using company annual reports, Supermarket News, Forbes America’s largest private companies and other sources.
Regional map is for representation purpose only
North America
Latin America
Europe
Africa/ Middle East
Asia Pacific
15.9%
32.7%
1.6%
48.4%
1.4%
US$ FY2020 Retail revenue
Region share of Top 250 retail revenue
YoY % change
No. of companies
US$2,472.8B
9.2%
78
US$82.2B
5.2%
11
US$1,670.2B
1.1%
90
US$71.0B
2.3%
10
US$814.8B
2.6%
61

30
Global Powers of Retailing 2022 | Geographic analysis
Source: Deloitte Global. Global Powers of Retailing 2022. Analysis of financial performance and operations for financial years ending within the 12 months from 1 July 2020 to 30 June 2021 (FY2020) using company annual reports, Supermarket News, Forbes America’s largest private companies and other sources.
*Sales growth rates are sales-weighted, currency-adjusted composites
*** Net profit margin and return on assets are sales-weighted composites
1 Net profit margin based on total consolidated revenue and net income. May include results from non-retail operations if these are <50% of group revenue.
² Compound annual growth rate
Retail revenue growth and profitability by region, FY2020
% of companies by product sector within each region, FY2020
-2%
0%
2%
4%
6%
8%
10%
FY2015-2020 retail revenue CAGR2*
FY2020 retail revenue growth*
FY2020 net profit margin1***
FY2020 return on assets***
Top 250 Africa/Middle East Asia Pacific Europe Latin America North America
4.7%
5.9%
3.4%
4.3%
5.3%
7.4%
5.2%
2.3%2.6%
1.1%
5.2%
9.2%
3.3%2.7%
3.0%
1.7%
-1.1%
3.8%4.4%
3.1% 3.3%
1.3%
-1.3%
6.2%
Apparel and accessories
FMCG Hardlines and leisure goods
Diversified
Africa/Middle East 90% 10%
Asia Pacific 10% 54% 21% 15%
Europe 13% 64% 18% 4%
Latin America 9% 45% 27% 18%
North America 17% 46% 32% 5%
Top 250 13% 56% 23% 8%

31
Global Powers of Retailing 2022 | Geographic analysis
Africa/ Middle EastNumber of companies
Average retail
revenue (US$M)
% retail revenue
from foreign operations
South Africa 5 7,623 30.6%
Turkey 2 6,213 5.8%
United Arab Emirates
2 8,008 45.9%
Israel 1 4,406 0.0%
Total Africa/ Middle East
10 7,097 27.8%
Top 5 companies share of retail revenue, FY2020
Shoprite Steinhoff Emke/Lulu
BIM Spar Others (5 companies)
15%
12%
12%
11%11%
39%
The Top 250 companies include 10 retailers from Africa/Middle East. South Africa’s Shoprite Holdings was the largest retailer in the region, displacing Steinhoff in FY2020, and rising seven places in the Top 250 rankings: it recorded strong sales in the supermarket segment, despite discontinuation of operations in Nigeria, Kenya, Uganda, and Madagascar.69
The composite performance of the companies in this region is overshadowed by the poor performance of troubled South African retailer Steinhoff, which reported FY2020 retail revenue down 34.1%, and a US$2.6 billion net loss (30%), due to high finance costs, the effect of currency translation for foreign operations, and losses due to ongoing litigation.70
Excluding Steinhoff, the other nine retailers from Africa/Middle East delivered composite retail revenue growth of 11.0%, and a net profit margin of 3.9%. Including Steinhoff, the region’s results are less positive. The cumulative five-year CAGR for all companies in the region was 5.9% between FY2015 and FY2020, and year-over-year retail revenue grew by 2.3% in FY2020. Composite FY2020 net profit margin (-1.1%) and return on assets (-1.4%) were negative.

32
Global Powers of Retailing 2022 | Geographic analysis
Asia PacificNumber of companies
Average retail
revenue (US$M)
% retail revenue
from foreign operations
Japan 29 11,232 12.8%
China/Hong Kong SAR
14 18,540 6.7%
South Korea 5 11,029 4.9%
Australia 4 24,789 6.9%
Other Asia Pacific 9 8,354 3.9%
Total Asia Pacific 61 13,357 8.8%
Top 5 companies share of retail revenue, FY2020
JD.com Aeon Seven & i
Woolworths Suning.com Others (56 companies)
12%
9%
6%
5%
4%64%
The share of the global Top 250 revenue from retailers based in the Asia Pacific region, 15.9%, fell by 0.3 percentage points from the previous year. The Asia Pacific composite year-over-year growth in FY2020 retail revenue, 2.6%, was 5.5 percentage points lower than the growth in FY2019. There are big differences in performance between retailers from the different countries. As a group, the 14 Chinese retailers had a higher FY2020 year-over-year growth (13.1%, up 1.4 percentage points) than retailers in any other major Top 250 country. However, the 29 retailers in Japan saw FY2020 retail revenue fall by 3.3%, while the 18 retailers based in other Asia Pacific countries achieved only 0.9% FY2020 retail revenue growth. For the group of Chinese retailers, 43% achieved double-digit retail revenue growth ranging from 17% to 94% in FY2020. These were mostly online specialists and those with strong e-commerce capabilities. The Japanese retailers, with more limited e-commerce capabilities, saw a greater impact of temporary store closures and other COVID-19 pandemic effects on their revenue. Only 14% achieved double-digit retail revenue growth, and 40% saw revenues fall.
The composite CAGR for the companies in the Asia Pacific region for the period FY2015-2020 was 3.4%. This was the lowest among the regions, down from 6% for the period FY2014-2019. The 2.7% net profit margin for companies in the region (the same as in FY2019) was 0.6 percentage points lower than the Top 250 composite net profit margin. Japan’s Nitori Holdings was the only Asia Pacific company reporting a double-digit net profit margin.
The nine ‘other Asia Pacific’ retailers are based in Thailand (2), Taiwan (2), Indonesia (2), India (1), Philippines (1), and Vietnam (1).
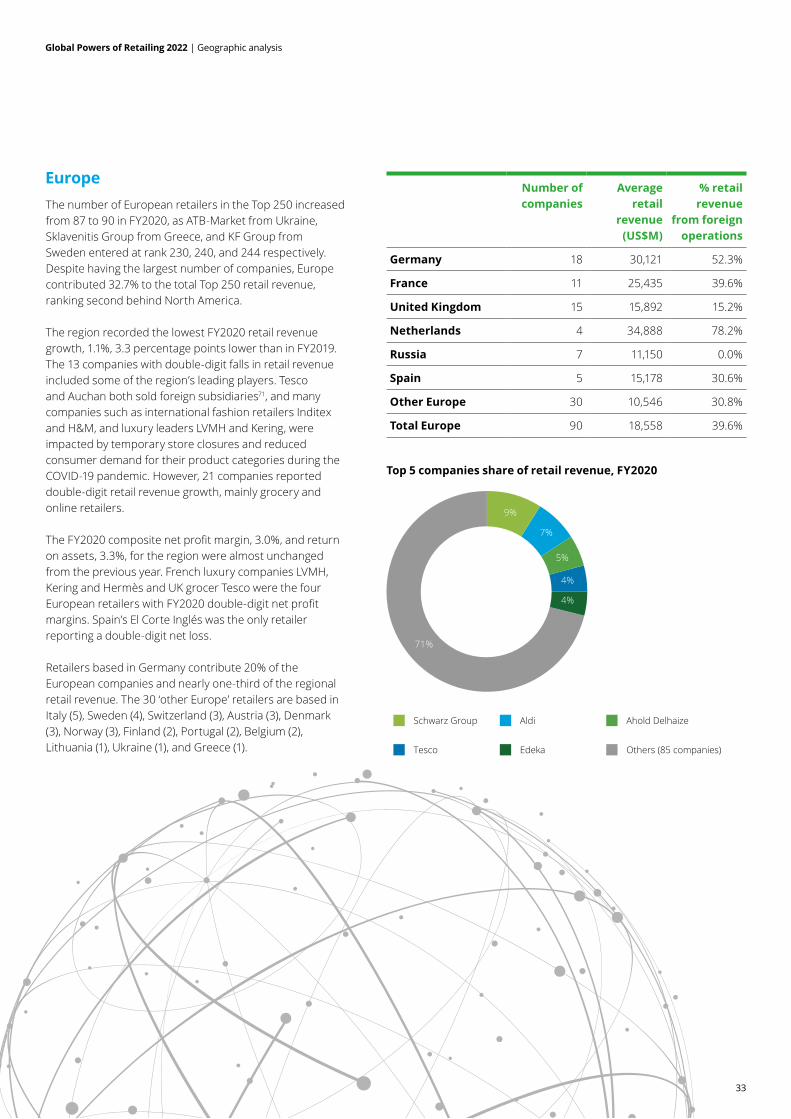
33
Global Powers of Retailing 2022 | Geographic analysis
EuropeNumber of companies
Average retail
revenue (US$M)
% retail revenue
from foreign operations
Germany 18 30,121 52.3%
France 11 25,435 39.6%
United Kingdom 15 15,892 15.2%
Netherlands 4 34,888 78.2%
Russia 7 11,150 0.0%
Spain 5 15,178 30.6%
Other Europe 30 10,546 30.8%
Total Europe 90 18,558 39.6%
Top 5 companies share of retail revenue, FY2020
Schwarz Group Aldi Ahold Delhaize
Tesco Edeka Others (85 companies)
9%
7%
5%
4%
4%
71%
The number of European retailers in the Top 250 increased from 87 to 90 in FY2020, as ATB-Market from Ukraine, Sklavenitis Group from Greece, and KF Group from Sweden entered at rank 230, 240, and 244 respectively. Despite having the largest number of companies, Europe contributed 32.7% to the total Top 250 retail revenue, ranking second behind North America.
The region recorded the lowest FY2020 retail revenue growth, 1.1%, 3.3 percentage points lower than in FY2019. The 13 companies with double-digit falls in retail revenue included some of the region’s leading players. Tesco and Auchan both sold foreign subsidiaries71, and many companies such as international fashion retailers Inditex and H&M, and luxury leaders LVMH and Kering, were impacted by temporary store closures and reduced consumer demand for their product categories during the COVID-19 pandemic. However, 21 companies reported double-digit retail revenue growth, mainly grocery and online retailers.
The FY2020 composite net profit margin, 3.0%, and return on assets, 3.3%, for the region were almost unchanged from the previous year. French luxury companies LVMH, Kering and Hermès and UK grocer Tesco were the four European retailers with FY2020 double-digit net profit margins. Spain’s El Corte Inglés was the only retailer reporting a double-digit net loss.
Retailers based in Germany contribute 20% of the European companies and nearly one-third of the regional retail revenue. The 30 ‘other Europe’ retailers are based in Italy (5), Sweden (4), Switzerland (3), Austria (3), Denmark (3), Norway (3), Finland (2), Portugal (2), Belgium (2), Lithuania (1), Ukraine (1), and Greece (1).

34
Global Powers of Retailing 2022 | Geographic analysis
Latin AmericaNumber of companies
Average retail
revenue (US$M)
% retail revenue
from foreign operations
Brazil 4 4,864 0.0%
Mexico 5 8,096 14.2%
Chile 2 11,145 45.2%
Total Latin America 11 7,475 19.3%
Top 5 companies share of retail revenue, FY2020
FEMSA Cencosud Falabella
Coppel Soriana Others (6 companies)
16%
15%
12%
10%9%
38%
The 11 retailers from Latin America recorded the highest five-year CAGR retail revenue growth, 7.4%, and second-highest year-over-year growth, 5.2%, in FY2020, compared to other regions.
All four retailers based in Brazil, and Mexico’s Chedraui, achieved double-digit growth in FY2020. Magazine Luiza, known as ‘Magalu’, became the leading Brazilian retailer, with retail revenue growth of 46.2%. It quickly pivoted to e-commerce during the COVID-19 pandemic, achieving internet sales growth of 122.6%, taking more than half of the company’s revenue through this channel in FY2020.72 Mexico’s department store retailer, El Puerto de Liverpool, saw the greatest impact of the pandemic-related store closures and reduced consumer demand, with retail revenue down 20.7%.
Chilean retailer Cencosud is the most international retailer in the region, with 49.4% of its revenue outside Chile. Cencosud postponed its planned 2021 initial public offering (IPO) of its Brazilian unit due to market conditions, but still plans to expand its operations further across the Latin American region, through acquisitions, store openings and renovations, and investment in e-commerce and logistics.73
All of the nine companies in the region reporting their bottom-line results were profitable in FY2020. However, their FY2020 composite net profit margin, 1.7%, was the second lowest compared to other regions, with no company reporting a net profit margin of more than 3.5%.

35
Global Powers of Retailing 2022 | Geographic analysis
North AmericaNumber of companies
Average retail
revenue (US$M)
% retail revenue
from foreign operations
United States 70 33,751 13.1%
Canada 8 13,785 13.1%
Total North America
78 31,703 13.1%
Top 5 companies share of retail revenue, FY2020
Walmart Amazon.com Direct Costco
The Home Depot Kroger Others (73 companies)
23%
9%
7%
5%5%
51%
The number of US-based companies in the Top 250 fell to 70 in FY2020, from 74 in FY2019, while the number of Canadian companies increased to eight from six in the previous year, as Liquor Control Board of Ontario (LCBO) and lululemon athletica were new entrants to the Top 250.
North American retailers achieved the highest composite retail revenue year-over-year growth among all the regions. Their 9.2% FY2020 growth rate was 5.6 percentage points higher than in FY2019. Nearly 40% of the companies in the region achieved double-digit revenue growth. Online specialists Wayfair and Amazon were the biggest beneficiaries from the consumer switch to online shopping during the COVID-19 pandemic, with 55% and 34.8% growth, respectively, in FY2020. E-commerce was also the main driver of growth for many other North American companies.
The big losers from the changes in shopping behavior and reduced demand for apparel were the US department stores and specialty fashion chains without a strong e-commerce distribution channel. Department store retailers Macy’s, Kohl’s, Nordstrom, Burlington Stores, and Dillard’s, as well as apparel specialty chains TJX and Ross Stores, all saw FY2020 retail revenue fall by 20-30%.
The 54 North American retailers reporting their bottom-line results also achieved the highest composite FY2020 net profit margin, 3.8%, among all the regions. Eight companies reported double-digit net profit margins, and only 11 companies reported losses.

36
Global Powers of Retailing 2022 | Product sector analysis
This section of the report analyzes retail performance of the Top 250 by primary retail product sector. Four product sectors are used for analysis: apparel and accessories; fast-moving consumer goods (FMCG); hardlines and leisure goods; and diversified. A company is assigned to one of the three specific product sectors if at least half of its retail revenue is derived from that broadly defined product category. If each of these product sectors accounts for less than half of a company’s retail revenue, it is categorized as diversified.
The highest rate of annual revenue growth was in the hardlines and leisure goods sector, which was also the most profitable sector in FY2020.
Product sector analysis
Apparel and accessories FMCG
Hardlines and leisure goods
Diversified
Retail revenue FY2020 US$372.2B US$3396.1B US$1075.3B US$267.4B
7% 66% 21% 5%
32 141 57 20
Share of Top 250 FY2020
Number of companies
Source: Deloitte Global. Global Powers of Retailing 2022. Analysis of financial performance and operations for financial years ending within the 12 months from 1 July 2020 to 30 June 2021 (FY2020) using company annual reports, Supermarket News, Forbes America’s largest private companies and other sources.
% of companies by region within each product sector, FY2020
Africa/Middle East
Asia Pacific Europe Latin America North America
Apparel and accessories 19% 38% 3% 41%
FMCG 6% 23% 41% 4% 26%
Hardlines and leisure goods 23% 28% 5% 44%
Diversified 5% 45% 20% 10% 20%
Top 250 4% 24% 36% 4% 31%

37
Global Powers of Retailing 2022 | Product sector analysis
Retail revenue growth and profitability by primary product sector, FY2020
-15%
-12%
-9%
-6%
-3%
0%
3%
6%
9%
12%
15%
FY2015-2020 retail revenue CAGR2*
FY2020 retail revenue growth*
FY2020 net profit margin1***
FY2020 return on assets***
Top 250 Apparel and accessories FMCG Hardlines and leisure goods Diversified
4.7%
2.0%
3.8%2.7%
10.1%
5.2%
-14.0%
4.7%
10.1%
14.5%
3.3% 3.4%2.5%
5.4%
1.7%
4.4%
2.6%3.9%
7.3%
1.7%
Source: Deloitte Global. Global Powers of Retailing 2022. Analysis of financial performance and operations for financial years ending within the 12 months from 1 July 2020 to 30 June 2021 (FY2020) using company annual reports, Supermarket News, Forbes America’s largest private companies and other sources.
*Sales growth rates are sales-weighted, currency-adjusted composites
*** Net profit margin and return on assets are sales-weighted composites
1Net profit margin based on total consolidated revenue and net income. May include results from non-retail operations if these are <50% of group revenue2Compound annual growth rate
Apparel and accessoriesRetailers in the apparel and accessories sector saw retail revenues fall by 14% in FY2020, a decline of 18.6 percentage points from FY2019. Fashion specialty and department stores were the sector worst-affected by the COVID-19 pandemic, with enforced store closures and reduced consumer demand for workplace and occasion apparel and accessories. Out of the 32 companies in this product sector, 23 recorded a double-digit decline in revenue, with US department stores Macy’s, Nordstrom and Dillard’s down around 30%. Four out of the five companies with double-digit growth benefited from the switch to online shopping: Nike, with e-commerce sales up 60%; online retailers Vipshop and Zalando; and Tapestry, with e-commerce sales up by US$1 billion.
LVMH increased its share of sector revenue from 8.9% to 9.6% and Fast Retailing replaced Macy’s as the fifth largest retailer in the sector in FY2020, by retail revenue. French luxury goods leaders LVMH, Kering and Hermès all reported double-digit net profit margins, along with US-based Tapestry. The composite net profit margin for companies in this product sector was resilient. At 3.4%, it was down just 3.5 percentage points, despite the much greater fall in revenues. Retailers in the apparel and accessories sector are the most international by far, achieving a sales-weighted average of 42.9% of revenue from foreign operations. Only six companies operated solely in their home country.
Top 5 companies share of retail revenue, FY2020
LVMH TJX Inditex
H&M Fast Retailing Others (27 companies)
10%
9%
6%
5%
5%65%

38
Global Powers of Retailing 2022 | Product sector analysis
FMCGThe FMCG sector again contained a larger number of retailers than in the other three product sectors combined, increasing from 135 companies in FY2019 to 141 in FY2020, to take a 66.4% share of total Top 250 retail revenues. Ten out of the total of 13 new entrants to the Top 250 in FY2020 were from the FMCG sector. Retail revenue year-over-year growth was 4.7%, 1.1 percentage points higher than in FY2019 and just lower than for the Top 250 as a whole.
Around 30% of retailers in the sector registered double-digit growth. Turkish retailers BİM and A101, and convenience retailer EG Group all grew by more than 30%; driven by store expansion for the Turkish retailers, and acquisitions for EG Group. In contrast, just nine retailers reported a double-digit decline; Auchan, Steinhoff and Shanghai Bailian Group recorded a fall of more than 30% in revenue in FY2020. For Auchan and Steinhoff this was due to disposals, while Shanghai Bailian attributed the fall to the COVID-19 pandemic.
FMCG retailers are larger, on average, than the Top 250, with FY2020 average retail revenue of US$24 billion. The top five FMCG retailers were the same as in the previous year.
In terms of profitability, the FMCG sector ranked third, with a FY2020 composite net profit margin of 2.5% (an increase of 0.5 percentage points from FY2019), and 91 out of the 104 companies that reported their bottom-line results were profitable.
Hardlines and leisure sectorThe hardlines and leisure sector was the best-performing sector in FY2020 on all metrics. Retail revenue growth more than doubled, from 6.5% in FY2019, to 14.5% in FY2020. Nearly 80% of the 57 retailers in the sector reported growth, with 35% achieving double-digit growth in retail revenue. The sector contributed 21% of the total revenue of the Top 250, two percentage points more than in FY2019.
Four companies grew their retail revenue by more than 30% year-over-year, mainly driven by e-commerce growth: online specialists Amazon and Wayfair, Brazil’s Magazine Luiza, and Russia’s DNS. The ability to pivot rapidly to increase online sales during the pandemic was a key growth factor for many retailers in this sector. For example, online sales rose by 86% for Home Depot, 123% for Magazine Luiza, and 144% for Best Buy in FY2020.
The hardlines and leisure sector also achieved the highest composite net profit margin in FY2020, 5.4%, up one percentage point on the previous year. Only six companies out of the 43 companies reporting their bottom-line recorded losses, while another six companies reported double-digit net profit margins.
Top 5 companies share of retail revenue, FY2020
Top 5 companies share of retail revenue, FY2020
Walmart Costco Schwarz
Kroger Walgreens Boots Others (136 companies)
16%
5%
4%
4%
4%
67%
Amazon Home Depot JD.com
Lowe’s Best Buy Others (52 companies)
20%
12%
9%
8%5%
46%

39
Global Powers of Retailing 2022 | Product sector analysis
DiversifiedThere were only 20 companies in this sector, but they achieved a strong performance in FY2020, with retail revenue growth of 10.1%, 3.3 percentage points higher than the previous year. Nearly all of this growth was due to three companies: Target, Alibaba and Coupang. Target contributes more than one-third of the total sector revenue, and grew by 19.8%, driven primarily by a US$10 billion increase (145%) in digital sales, as Target responded rapidly to consumer online demand for essential purchases during the COVID-19 pandemic. Alibaba’s FY2020 retail revenue nearly doubled, primarily driven by the acquisition of the Sun Art hypermarket chain from Auchan, as well as the contributions from direct sales businesses, including Tmall Supermarket and Freshippo. South Korea’s leading e-commerce retailer, Coupang, also nearly doubled sales in FY2020. At the other end of the spectrum, six, mainly store-based, diversified retailers saw double-digit falls in their retail revenues in FY2020, due primarily to the impact of the pandemic on store closures and consumer demand for their key product categories.
The 16 companies in the sector reporting their bottom line had the lowest FY2020 composite net profit margin (1.7%) and return on assets (also 1.7%) among the four product sectors. Net profit margin was down 0.9 percentage points from FY2019. Five companies reported a loss, and only one company, US discount retailer Big Lots, achieved a double-digit net profit margin.
Top 5 companies share of retail revenue, FY2020
Target Alibaba Qurate
Otto Lotte Shopping Others (15 companies)
35%
9%
5%5%5%
41%

40
Global Powers of Retailing 2022 | New entrants
New entrants
Thirteen retailers joined or re-entered the Top 250 in FY2020. Three of the top four entrants are based in Russia and Ukraine.
New entrants, FY2020
Top 250 rank Name of company Country of origin Dominant operational format
FY2020 retail revenue growth
136 Mercury Retail Holding plc Russia Convenience/forecourt store n/a
139 Real Hypermarket Business Germany Hypermarket/supercenter 1.5%
185 DNS Russia Electronics specialty 38.3%
230 ATB-Market LLC Ukraine Discount store 18.1%
233Liquor Control Board of Ontario
Canada Other specialty 12.3%
237 EG Group Limited United Kingdom Convenience/forecourt store 37.3%
238 Shufersal Ltd. Israel Discount store 14.1%
239 lululemon athletica inc. Canada Other specialty 10.6%
240 Sklavenitis Group Greece Supermarket 15.6%
241 Joshin Denki Co., Ltd. Japan Electronics specialty 8.1%
244 KF Group Sweden Supermarket 8.1%
248 Weis Markets, Inc. United States Supermarket 16.1%
250 Smart & Final Stores, Inc. United States Cash & carry/warehouse club 10.2%
n/a = not available
Source: Deloitte Global. Global Powers of Retailing 2022. Analysis of financial performance and operations for financial years ending within the 12 months from 1 July 2020 to 30 June 2021 (FY2020) using company annual reports, Supermarket News, Forbes America’s largest private companies and other sources.
Three entries were the result of M&A/demerger activityRussia’s Mercury Retail was formed by the merger of ultra-convenience chains Red & White (or Krasnoye & Beloye in Russia) and Bristol, and supermarket chain Dixy in 2019.74 The parent company sold the Dixy chain to retailer Magnit in 2021 to focus on its ultra-convenience strategy. Its small stores are located in residential areas offering consumers a limited low-price assortment of daily essential goods, with a focus on alcohol and tobacco, “on the doorstep”.75 The company operates around 13,500 stores across Russia and plans to grow through expansion of its store network across the country.76 It postponed its initial public offering on the Moscow Exchange in November 2021 due to market conditions.
Real Hypermarket Business entered the Top 250 ranked at 139; however, it features as a separate entity only in this 2022 edition of the Global Powers of Retailing. Real Hypermarket Business was sold by Germany’s Metro AG to property investors SCP in June 2020.77 In March 2021, SCP announced that it was selling most of the Real Hypermarkets to Schwarz Group’s Kaufland and Edeka, with the stores being re-branded by these two companies.78
Revenue of leading international independent convenience retailer EG Group Limited increased by 37.3% in FY2020, mainly due to several acquisitions, bringing the company into the Top 250 at rank 237. It benefited from a full year of revenue from its 2019 acquisitions in the United States, Cumberland Farms, Fastrac and Certified Oil, as well as in Australia, where it bought Woolworths’ network of 537 Fuelco forecourts. In December 2020 it announced the acquisition of the German forecourt business of OMV, (285 sites). At the end of 2020, the Group operated over 6,000 sites on three continents. EG Group also has long-standing partnerships with leading European and Australian grocery and merchandise brands, further bolstering its revenue growth.79
Fast-growing DNS enters due to improved data coverageLeading Russian consumer electronics retailer DNS entered the Top 250 at position 185, as data for the privately-owned company became available for the first time. It was also one of the fastest-growing retailers among the new entrants, with 38.3% retail revenue growth in FY2020. The electronics and home appliances retailer has over 2,200 stores throughout Russia.80

41
Global Powers of Retailing 2022 | New entrants
Grocery and athleisure retailers’ growth, boosted by changes in consumer buying resulting from the COVID-19 pandemic, brings them into the lower ranks of the Top 250Fast-growing Ukrainian discount store chain ATB-Market entered the Top 250 at position 230, having just missed out in FY2019. The company also features as one of the Fastest 50, focusing on a development strategy of ‘50 stores a year’ and planning expansion in Poland and the Baltic countries to compete with discounters such as Aldi and Lidl.81
Liquor Control Board of Ontario (LCBO), the provincial government-owned Canadian alcoholic beverages retailer, saw its retail revenue grow 12.3% in FY2020, fueled by consumer demand during the COVID-19 pandemic. Although there was a decline in footfall in its retail outlets, LCBO’s e-commerce channel achieved strong sales, backed by the continued expansion of its same-day pickup locations.82
Israel’s leading grocery retailer Shufersal entered the Top 250 for the first time, having achieved year-over-year revenue growth of 14.1%, due mainly to huge growth in its e-commerce business during the pandemic.83 Canada-based athleisure clothing retailer lululemon athletica shares a similar growth story, with an increase
of 10.6% in retail revenue in FY2020, as it more than doubled its e-commerce business.84
The top grocery retailer in Greece, Sklavenitis Group, also entered the Top 250 for the first time, with annual retail revenue growth of 15.6% in FY2020, backed by higher footfall at its larger stores during the pandemic.85 Japan’s consumer electronics retailer Joshin Denki and Sweden’s supermarket co-operative KF Group both grew revenue by 8.1% in FY2020, entering in positions 241 and 244, respectively.
US-based retailers Weis Markets and Smart & Final Stores re-entered the Top 250 ranked at 248 and 250 respectively. Weis Markets responded to higher demand due to the pandemic with enhanced product offerings and service add-ons such as “Weis 2 Go Online” to improve customer convenience.86

42
Global Powers of Retailing 2022 | Fastest 50
Fastest 50
The Fastest 50 are the 50 companies in the global Top 250 retailers with the highest compound annual growth rates (CAGR) in retail revenue for the period FY2015 to FY2020. Those that were also in the Fastest 50 last year are shown in the list in bold type.
E-commerce, specialists and discounters drive high retail revenue growthThe composite CAGR for the Fastest 50 retailers was 18.1% for FY2015-FY2020, down by one percentage point on the CAGR for FY2014-FY2019. E-commerce, rapid organic store expansion, M&A activity, and continuing efforts by retailers to build a strong consumer base are key driving factors for this high retail revenue growth. Thirty-five of the Fastest 50 operated hypermarkets/supermarkets, specialty stores (including electronics specialty but excluding fashion specialty), or discount stores. All of the six e-commerce companies in the Fastest 50 saw strong growth, ranking in positions 1-16.
Annual growth in retail revenue for the Fastest 50 was 18.7%, 6.2 percentage points higher than the 12.5% annual growth for the Fastest 50 in last year’s report.
The Fastest 50 in FY2020 features 11 new retailers, of which the fastest-growing were three new entrants to the Top 250: Ukrainian discount store chain ATB-Market, Russian consumer electronics retailer DNS, and Canada-based athleisure retailer lululemon.
Among the Fastest 50, 27 companies were from the FMCG sector (compared to 24 in FY2019), and 16 were from the hardlines and leisure goods sector (compared to 13 in FY2019). There was a drop in the number of companies in the Fastest 50 from the other two product sectors-apparel and accessories (down from nine to five), and diversified (down from four to two), as these sectors suffered from store closures and reduced consumer demand due to the COVID-19 pandemic.
Fastest 5 company performancesThe top four fastest-growing retailers in FY2019–Coupang, Reliance Retail Limited, Wayfair Inc and Mobile World Investment Corporation–all retained their positions in FY2020. Turkish discount retailer A101 Yeni Mağazacılık regained fifth place, overtaking China’s JD.com.
Coupang, South Korea’s leading e-commerce retailer, was the fastest-growing retailer in the Top 250. Retail revenue nearly doubled, year-over-year, and its five-year CAGR in FY2015-FY2020 was 66%. Coupang’s rapid growth was driven by increases in active customers and buying frequency, and expansion of its product selection, including a move into grocery and food delivery in FY2020, supported by its market-leading fulfillment and logistics network, which enables all deliveries to be made within one day.87 The company raised US$4.55 billion to invest in future growth from its initial public offering in March 2021–the largest foreign listing in the United States since Alibaba Group Holding Ltd. in 2014.88
Reliance Retail was the second fastest-growing retailer, posting a five-year CAGR growth in retail revenue of 49.4% in FY2015-FY2020. Pandemic-induced lockdowns and subsequent restrictions on store operations led to a 5.3% fall in retail revenue in FY2020. However, the retailer continued to broaden its digital capabilities through expansion of its e-commerce platform JioMart and several key acquisitions of e-commerce businesses.89,90
Wayfair Inc., the US-based online furniture and home goods retailer, achieved year-over-year retail revenue growth of 55% in FY2020, and five-year CAGR of 44.4% in FY2015-FY2020. The retailer also posted a net profit for the first time in FY2020. Its growing customer base, which increased by 54% year-over-year, together with repeat purchases accounting for 73% of all sales, enabled it to retain the position of third fastest-growing retailer in this year’s rankings.91
Vietnamese retailer Mobile World Investment Corporation was the fourth fastest-growing retailer, with a five-year CAGR growth in retail revenue of 33.9% between FY2015 and FY2020. Annual growth slowed to 6.2% in FY2020. Revenue from the company’s BachHoaXanh (BHX) grocery stores nearly doubled, offsetting falling sales in its consumer electronics store chains Dien may XANH and thegioididong, which experienced store closures and changes in consumer demand resulting from the COVID-19 pandemic.92,93
A101 Yeni Mağazacılık A.S from Turkey was the fifth fastest-growing retailer, posting a five-year CAGR for retail revenue of 32.6% in FY2015-FY2020 and 35.4% year-over-year retail revenue growth in FY2020. It continued its rapid store expansion, opening 1,000 discount stores during FY2020, to end the year with 10,000 stores across Turkey.94
Fastest 50 vs Top 250: CountriesAlthough the United States has the highest share of retailers in the Fastest 50, 22%, this is lower than the US retailer proportion of the Top 250, 28%. China and Russia both have five retailers in the Fastest 50. Companies in countries with less mature retail markets represent a much higher proportion of the Fastest 50 than their share of the Top 250. This is due primarily to their much faster pace of retail store expansion, retail concentration and increasing customer traffic as they take share from ‘unorganized’ traditional retailing, as well as higher growth in consumer demand.

43
Global Powers of Retailing 2022 | Fastest 50
Country Number of companies
Average FY2020 retail revenue (US$M)
FY2015-2020 retail revenue CAGR1*
FY2020 retail revenue YoY growth*
United States 11 32,206 18.5% 28.0%
China 5 32,685 22.4% 16.7%
Russia 5 13,205 15.7% 15.0%
Japan 3 10,276 13.9% 4.6%
Mexico 3 9,494 12.8% 1.5%
Turkey 2 6,213 28.2% 37.1%
United Kingdom 2 6,982 23.4% 10.8%
Brazil 2 4,861 22.8% 31.2%
South Korea 2 14,235 19.9% 37.2%
Germany 2 9,182 17.5% 12.7%
Canada 2 4,941 12.6% 16.4%
Netherlands 2 45,801 14.8% 12.6%
India 1 18,454 49.4% -5.3%
Vietnam 1 4,658 33.9% 6.2%
Ukraine 1 4,552 26.3% 18.1%
Australia 1 6,649 17.7% 12.6%
France 1 8,537 14.1% 1.9%
Indonesia 1 5,901 11.7% 5.3%
South Africa 1 7,648 10.9% 13.5%
Switzerland 1 11,700 10.3% 0.6%
Lithuania 1 4,816 9.6% 5.8%
*Sales growth rates are sales-weighted, currency-adjusted composites
Source: Deloitte Global. Global Powers of Retailing 2022. Analysis of financial performance and operations for financial years ending within the 12 months from 1 July 2020 to 30 June 2021 (FY2020) using company annual reports, Supermarket News, Forbes America’s largest private companies and other sources.`
1 Compound annual growth rate
Fastest 50 by country, FY2015-2020

Global Powers of Retailing 2022 | Fastest 50
44
Case study 1: ATB-Market LLCUkraine discount store retailer ATB-Market LLC was a new entrant to the Top 250 in FY2020. Its year-over-year retail revenue grew by 18.1%, backed by new store openings, and its FY2015-FY2020 CAGR was 26.3%, making it the ninth fastest-growing retailer in the Top 250. At the end of FY2020 it operated more than 1,200 stores across Ukraine, adding 127 new discount stores and reconstructing 59 existing stores amid the pandemic.95
ATB-Market LLC’s market share of Ukraine’s food retail sector is about 25-30%. The retailer continues to focus on core growth by expanding the number of its discount stores across the country and investing in the development of its private labels, which currently contribute 25% of its total turnover. It is also estimated to have the highest sales per square meter as compared to its Ukrainian competitors, owing to a smaller trading area in its stores, a narrow range and an aggressive pricing strategy.96
Case study 2: lululemon athletica inc.Canada-based athleisure retailer lululemon athletica was the 25th fastest-growing retailer in FY2020, and another new entrant to the Top 250. Its retail revenue increased year-over-year by 10.6%, and its CAGR in FY2015-FY2020 was 16.4%. The company more than doubled its e-commerce business during the COVID-19 pandemic, contributing 52% of its total revenue in FY2020.97 This offset the 34% revenue decline in company-operated stores.
In FY2020, lululemon remained focused on delivering on its “Power of Three” growth strategy; to double its men’s business; double its digital business; and quadruple its international business by year end 2023. The company’s business in North America increased 8%, while total growth in international markets was 31%. It opened 30 net new company-operated stores, including 18 stores in Asia Pacific, nine stores in North America, and three stores in Europe. It also expanded its seasonal store strategy in 2020 with over 100 seasonal stores in operation for some period of time during the year. The company completed its first acquisition in FY2020, buying MIRROR, a leading in-home fitness company that created an interactive workout platform featuring live and on-demand classes, for a purchase price of US$500 million.98

45
Global Powers of Retailing 2022 | Fastest 50
Growth rank
Top 250 rank
Name of company Country of origin
FY2020 Retail revenue (US$M)
Dominant operational format FY2015-2020
retail revenue CAGR2*
FY2020 retail
revenue growth*
FY2020 net
profit margin1
1 98 Coupang, Inc. South Korea 11,045 Non-store 66.0% 90.9% -4.0%
2 56 Reliance Retail Limited India 18,454 Supermarket 49.4% -5.3% 3.4%
3 71 Wayfair Inc United States 14,145 Non-store 44.4% 55.0% 1.3%
4 222 Mobile World Investment Corporation Vietnam 4,658 Electronics specialty 33.9% 6.2% 3.6%
5 231 A101 Yeni Mağazacılık A.S Turkey 4,536 e Discount store 32.6% 35.4% n/a
6 9 JD.com, Inc China 94,423 Non-store 31.2% 27.6% 6.6%
7 141 JD Sports Fashion Plc United Kingdom 7,696 e Other specialty 28.2% 0.9% 3.7%
8 195 Magazine Luiza S.A. Brazil 5,614 Other specialty 26.5% 46.2% 1.3%
9 230 ATB-Market LLC Ukraine 4,552 e Discount store 26.3% 18.1% 3.8%
10 137 BİM Birleşik Mağazalar A.Ş. Turkey 7,891 Discount store 26.1% 38.0% 4.7%
11 185 DNS Russia 5,911 Electronics specialty 25.9% 38.3% n/a
12 168 Action Holding BV Netherlands 6,425 Discount department store 22.6% 10.2% 4.4%
13 122 Zalando SE Germany 9,097 Non-store 22.0% 23.1% 2.8%
14 2 Amazon.com, Inc. United States 2,13,573 Non-store 21.9% 34.8% 5.5%
15 189 PJSC "M.video" Russia 5,772 Electronics specialty 20.9% 14.5% 1.6%
16 67 Vipshop Holdings Limited China 14,935 Non-store 19.7% 17.2% 5.8%
17 38 X5 Retail Group N.V. Russia 27,310 ** Discount store 19.6% 14.3% 1.4%
18 172 B&M European Value Retail S.A. United Kingdom 6,267 Discount store 18.7% 25.9% 8.9%
19 249 Raia Drogasil S.A. Brazil 4,108 Drug store/pharmacy 18.6% 15.1% 2.8%
20 156Great American Outdoors Group, LLC (fomerly Bass Pro Group, LLC)
United States 7,100 e Other specialty 18.1% 1.4% n/a
21 166 JB Hi-Fi Limited Australia 6,649 Electronics specialty 17.7% 12.6% 5.7%
22 65 Pan Pacific International Holdings Japan 15,335 Discount department store 17.4% 1.5% 3.2%
23 59 NIKE, Inc. / NIKE Direct United States 17,136 Apparel/footwear specialty 16.9% 32.0% n/a
24 84 Yonghui Superstores Co., Ltd. China 12,607 Hypermarket/supercenter 16.7% 10.8% 1.8%
25 239 lululemon athletica inc. Canada 4,402 Other specialty 16.4% 10.6% 13.4%
26 68 PetSmart, Inc. United States 14,600 e Other specialty 14.9% 23.2% n/a
27 203 Harbor Freight Tools USA, Inc. United States 5,400 e Other specialty 14.8% 8.0% n/a
28 13 Ahold Delhaize Netherlands 85,177 Supermarket 14.4% 12.8% 1.9%
Fastest 50 retailers, FY2015-2020
Source: Deloitte Global. Global Powers of Retailing 2022. Analysis of financial performance and operations for financial years ending within the 12 months from 1 July 2020 to 30 June 2021 (FY2020) using company annual reports, Supermarket News, Forbes America’s largest private companies and other sources.
** Revenue includes wholesale and retail sales
*** Net profit margin is a sales-weighted composite
e = estimate
n/a = not available
Companies in bold type were also among the Fastest 50 retailers in FY2019.
¹ Net profit margin based on total consolidated revenue and net income. May include results from non-retail operations if these are <50% of group revenue.2 Compound annual growth rate
*Sales growth rates are sales-weighted, currency-adjusted composites

46
Global Powers of Retailing 2022 | Fastest 50
Growth rank
Top 250 rank
Name of company Country of origin
FY2020 Retail revenue (US$M)
Dominant operational format FY2015-2020
retail revenue CAGR2*
FY2020 retail
revenue growth*
FY2020 net
profit margin1
29 130 FNAC Darty S.A. France 8,537 ** Other specialty 14.1% 1.9% 1.2%
30 118 Adidas Group Germany 9,267 Apparel/footwear specialty 14.0% 4.1% n/a
31 163 Grupo Comercial Chedraui, S.A.B. de C.V. Mexico 6,765 Hypermarket/supercenter 13.3% 13.3% 1.8%
32 81 FEMSA Comercio, S.A. de C.V. Mexico 13,058 Convenience/forecourt store 13.1% -3.7% n/a
33 31 Suning.com Co., Ltd. China 34,547 Electronics specialty 12.9% -6.0% -2.1%
34 167 Sprouts Farmers Market, Inc. United States 6,469 Supermarket 12.5% 14.8% 4.4%
35 174 Lenta Group Russia 6,159 Hypermarket/supercenter 12.0% 6.7% 3.7%
36 128 Grupo Coppel Mexico 8,660 e Department store 11.9% 1.5% n/a
37 127 Tsuruha Holdings Inc. Japan 8,660 Drug store/pharmacy 11.7% 9.3% 3.2%
38 186 PT Indomarco Prismatama (Indomaret) Indonesia 5,901 ** Convenience/forecourt store 11.7% 5.3% 1.2%
39 102 Tractor Supply Company United States 10,620 Other specialty 11.3% 27.2% 7.1%
40 142 The SPAR Group Limited South Africa 7,648 ** Supermarket 10.9% 13.5% 1.6%
41 32 Dollar General Corporation United States 33,747 Discount store 10.6% 21.6% 7.9%
42 40 Dollar Tree, Inc. United States 25,509 Discount store 10.5% 8.0% 5.3%
43 57 E-MART Inc. South Korea 17,426 ** Supermarket 10.4% 16.4% 1.6%
44 93 Compagnie Financière Richemont SA Switzerland 11,700 Other specialty 10.3% 0.6% 9.8%
45 160 Cosmos Pharmaceutical Corp. Japan 6,833 Drug store/pharmacy 10.2% 6.1% 3.7%
46 201 Save-On-Foods LP Canada 5,480 e Supermarket 10.1% 21.5% n/a
47 179 Ulta Beauty, Inc United States 5,967 Other specialty 9.9% -15.1% 2.9%
48 52 PJSC "Magnit" Russia 20,874 Convenience/forecourt store 9.8% 13.3% 2.1%
49 219 MAXIMA GRUPĖ, UAB Lithuania 4,816 ** Supermarket 9.6% 5.8% 3.6%
50 158 Wumart Technology Group Co., Ltd. (formerly Wumart Holdings, Inc.) China 6,914 e** Supermarket 9.5% 32.0% 3.1%
Fastest 50* *** 900,376 18.3% 18.7% 4.4%
Top 250* *** 5,110,998 4.7% 5.2% 3.3%
Source: Deloitte Global. Global Powers of Retailing 2022. Analysis of financial performance and operations for financial years ending within the 12 months from 1 July 2020 to 30 June 2021 (FY2020) using company annual reports, Supermarket News, Forbes America’s largest private companies and other sources.
** Revenue includes wholesale and retail sales
*** Net profit margin is a sales-weighted composite
e = estimate
n/a = not available
Companies in bold type were also among the Fastest 50 retailers in FY2019.
¹ Net profit margin based on total consolidated revenue and net income. May include results from non-retail operations if these are <50% of group revenue.2 Compound annual growth rate
*Sales growth rates are sales-weighted, currency-adjusted composites

47
Global Powers of Retailing 2022 | Study methodology and data sources
Study methodology and data sources
Data sourcesThe primary data sources for this report are company-released information, including annual reports, SEC filings, and information found in company press releases, fact sheets, presentations, or on company websites.
Where this is not available, other public-domain sources are used, including trade journal estimates, industry analyst reports, and press interviews. Each year a small number of privately-owned retailers cannot be included in the ranking, because there is insufficient data from any source to make a reasonable estimate of their retail revenue.
Fiscal year and exchange rates for rankings, growth and company group resultsFiscal Year 2020 (FY2020) used in this report includes company results for financial years ending within the 12 months from 1 July 2020 to 30 June 2021.The only exception is where a company’s financial year start or end date is changed by a few days as a result of where the usual reporting day falls in the calendar year.
The FY2020 year-over-year growth rate and FY2015-2020 compound annual growth rate (CAGR) for individual companies are calculated in their local currency.
The financial information used for each company in a given year is accurate as of the date the financial report was originally issued.Although a company may have restated prior-year results to reflect a change in its operations, such restatements are not reflected in this data, except in special circumstances.
When companies are grouped e.g., Top 250, Top 10, by product sector and by region, all calculations are made in US$.
Non-US company results in local currency are converted to US$ at the average exchange rate for the 12 months up to the company’s fiscal year end. OANDA.com is the source for the exchange rates.
Group financial results are based only on companies with data. Not all data elements are available for all companies.
Group revenue, net income and total assetsGroup revenue, net income and total assets are the consolidated results of a retailer’s parent company, including non-retail activities, and excluding operations in which a company has only a minority interest. Discontinued operations which are not reported in consolidated sales are excluded. Where retail revenue is less than 50% of group revenue, net income and total assets figures are not used, to avoid distorting composite results with non-retail activities. If a privately held company reports gross turnover only, this figure is reported as group revenue and footnoted as “g.”
Retailers: Companies we include and excludeInclude: • Retail companies and integrated cooperatives selling merchandise directly to consumers
• Vertically integrated brand manufacturers with corporate-owned retail operations
• E-commerce B2C retailers selling goods directly to consumers
• Cash & carry wholesalers
• Fuel retailers reporting merchandise sales
Exclude: • Delivered B2B wholesalers
• E-commerce marketplaces, auction sites and streaming services
• Foodservice companies
• Auto dealers
• Fuel retailers not reporting merchandise sales
• Private equity and other investment companies
• Parent companies/conglomerates with retail and non-retail operations which do not report consolidated retail sales
• Buying groups and non-integrated cooperatives/voluntary groups
• Companies with insufficient data to make a reasonable estimate of their retail revenue
• Companies resulting from structure changes after the end of FY2020, including demergers, acquisitions and bankruptcies
• Carrefour S.A. has been excluded from this year’s report at the company’s request
Retail revenue: What is included and excluded?The definitions given below are applied wherever possible. In practice, some companies do not break out their retail revenue in line with these definitions – in such cases best estimates are made applying the principles behind the definitions.
Include: • Retail merchandise sales to consumers, excluding sales tax/value added tax
• Wholesale sales to “controlled wholesale space” e.g., affiliated/member stores within cooperatives and franchise networks, concessions and shop-in-shops
• B2B sales made from retail stores e.g., warehouse clubs, DIY stores, cash & carry stores
• E-commerce retail revenue from direct (first party) B2C sales where the company is the seller of record
• Retail-related revenue from services and activities supporting retail operations, franchise/license fees, royalties, commissions

48
Global Powers of Retailing 2022 | Study methodology and data sources
• In-store foodservice/restaurant revenue
• Fuel sales (excluding tax) where these are less than 50% of retail sales
Exclude: • Retail operations in which the company has a minority interest
• Traditional wholesale or other B2B revenue (except where this is sold through retail stores)
• E-commerce third-party sales and other marketplace and auction revenue e.g., commissions, fees, advertising revenue
• Revenue from other activities which do not primarily support retail operations
• Foodservice revenue from activities outside retail stores e.g., standalone restaurants
• Auto/car sales revenue
• Fuel sales (excluding tax) where these are more than 50% of retail sales
This study is not an accounting report. It is intended to provide a reflection of market dynamics and the impact on the retailing industry over a period of time. As a result, growth rates for individual companies may not correspond to other published results.
Impact of exchange rates on rankingThe Top 250 companies in the Global Powers of Retailing 2022 report have been ranked according to their FY2020 retail revenue in US dollars (US$). Changes in the rankings from year to year are generally driven by increases or decreases in company sales. However, a stronger currency vis-à-vis the US$ in FY2020 means that companies reporting in that currency may rank higher in FY2020 than they did in FY2019, all other things being equal. Conversely, companies reporting in a weaker currency may rank lower.
In FY2020, some major currencies strengthened slightly against the US$. The Japanese yen was up 2.1%, the euro was up 1.8%, while the Hong Kong dollar, British pound and Chinese yuan were up 1.0%, 0.5% and 0.1%, respectively. However, currencies in many Latin American and Eastern European countries saw significant falls against the US$. The biggest faller against was the Brazilian real, down 23.4%, followed by the Turkish lira, down 19.1%. The South African rand, Chilean peso, Russian rouble and Mexican peso also weakened by more than 10%. Most other currencies for companies in this report weakened against the US$ by less than 10%.
For companies, the impact of these exchange rate movements on results depends on their reporting currency, the geographic spread of their business, and the resulting exposure to different currencies.

49
Global Powers of Retailing 2022 | Endnotes
Endnotes
1. Walmart+ is here! 15 September 2020.
2. Walmart Announces 2021 Return of “Black Friday Deals for Days,” This Time With Special Early Access for Walmart+ Members. 15 November 2021.
3. Walmart Celebrates One Year of Livestreams With First Shoppable Livestream on Twitter. 22 November 2021.
4. Walmart Invests in DroneUp, the Nationwide On-Demand Drone Delivery Provider. 17 June 2021.
5. Walmart drone delivery has started tests, dropping orders from the sky in 30 minutes. 18 November 2021.
6. The Home Depot Teams Up with Walmart GoLocal To Enhance Local Delivery Capabilities. 6 October 2021.
7. Walmart and JD.com Expand Strategic Cooperation. 25 July 2017.
8. Walmart and Flipkart announce completion of Walmart Investment in Flipkart, India’s leading marketplace eCommerce platform. 18 August 2018.
9. Flipkart Raises US$3.6 Billion in Funding To Accelerate the Growth of the Consumer Internet Ecosystem in India. 12 July 2021.
10. Grupo de Narváez acquires full ownership of Walmart Argentina. 6 November 2020.
11. Issa Brothers and TDR Capital complete the acquisition of Asda from Walmart. 16 February 2021.
12. KKR and Rakuten complete Seiyu share purchase from Walmart. 1 March 2021.
13. Walmart Investment to Accelerate Growth of Rakuten’s Global Ecosystem. 12 March 2021.
14. Walmart Announces Closing of Inaugural $2 Billion Green Bond Issuance. 23 September 2021.
15. Retailers Join Forces to Tackle Climate Change in the Race to Zero. 7 July 2021.
16. Introducing Amazon Pharmacy: Prescription Medications Delivered. 17 November 2020.
17. Amazon In-Garage Delivery Expands to Millions More Prime Members in Over 4,000 Cities. 12 November 2020.
18. Amazon launches new website in Poland. 2 March 2021.
19. Amazon and 11st Launch New Amazon Global Store in Korea. 31 August 2021.
20. Costco Wholesale Corporation – acquisition to further last mile capacity. 17 March 2020.
21. Costco pilots grocery delivery with Uber. 21 July 2021.
22. ‘No warning’ as Kaufland pulls plug on Australia. 22 January 2020.
23. Lidl Digital. Accessed 7 December 2021.
24. Schwarz Gruppe erwirbt Online-Platform real.de. 22 June 2020.
25. Kaufland darf noch weitere 22 Real-Filialen übernehmen - das sind die Standorte. 24 August 2021.
26. Schwarz Group: Our Actions. Accessed 7 December 2021.
27. Recycling company PreZero US acquires Roplast Industries. 5 March 2021.
28. PreZero Acquires SUEZ Employees and Locations. 1 June 2021.
29. Ferrovial sells its Environmental Services business in Spain and Portugal to PreZero (Schwarz Group) for €1,133 million. 27 July 2021.
30. The Home Depot completes acquisition of HD Supply. 24 December 2020.
31. The Home Depot Reduced Carbon Emissions by More Than 127,000 Metric Tons in 2020; Commits to 100 Percent Renewable Electricity for Facilities by 2030, 27 July 2021.
32. Walgreens Boots Alliance completes strategic transaction with AmerisourceBergen divesting Alliance Healthcare businesses. 2 June 2021.
33. Walgreens Boots Alliance makes $5.2 billion investment in VillageMD to deliver value-based primary care to communities across America. 14 October 2021.
34. Walgreens Boots Alliance makes a majority investment into iA to advance automation capabilities for the pharmacy industry. 12 January 2021.
35. Walgreens Boots Alliance acquires remaining stake in German GEHE-ALLIANCE healthcare joint venture from McKesson. 30 November 2021.
36. Boots exit may smooth way for Walgreens buyout. 7 December 2021.
37. Aldi nimmt sich E-Food vor. 18 February 2021.
38. Aldi Nord und Süd wachsen online zusammen. 21 September 2021.
39. Aldi to invest $1.8 billion in British growth push. 27 September 2021.
40. JD to Acquire Controlling Interest in Kuayue Express. 13 August 2020.
41. JD and Dada Announce Equity Investment. 22 March 2021.
42. Ulta Beauty at Target Launches in August — Get *All* the Gorgeous Details. 21 July 2021.
43. Nike reports. Accessed 17 January 2022.
44. Walmart Environmental, Social & Governance Reporting. March 2021.
45. JD.com sustainability. Accessed 20 December 2021.
46. Walmart, Climate change. Accessed 20 December 2021.
47. Ulta Beauty Launches Reusable Packaging in Partnership with Loop. 4 March 2021.
48. Beyond the Bag- Reinventing the Retail Bag. 21 February 2021.
49. Incorporating Sustainability into Retail Supply Chains is a Strategic Imperative. 12 February 2021.

50
Global Powers of Retailing 2022 | Endnotes
50. A Change of Clothes - Starting Up In Fashion’s Circular Economy? 16 August 2021.
51. The Resale Market Is Booming: Here’s How Small Businesses Can Benefit. 27 June 2021.
52. Decathlon to begin circular economy drive with second life options. 27 January 2021.
53. About Ikea. Accessed 20 December 2021.
54. Costco Canada Gave Staff A Permanent Pandemic Raise & Now Some Cashiers Make $60K A Year. 26 April 2021.
55. A record 4.4 million people quit in September as Great Resignation shows no signs of stopping. 12 November 2021.
56. Big People Problem in Retail: Korn Ferry Survey Finds Significant Labor Shortages at Distribution Centers. 31 August 2021.
57. Diversity, Equity & Inclusion at ALDI. Accessed 20 December 2021.
58. Best Buy emphasizes inclusive leadership. 1 June 2021.
59. A call for accountability and action. Accessed 21 December 2021.
60. 2021 Deloitte holiday retail survey. October 2021.
61. Gap targets Gen Z with the launch of Gap Teen. 6 May 2020.
62. THE ESG GLOBAL SURVEY 2021. September 2021.
63. TJX Companies, Inc.—Over 44% of the retailer’s shareholders voted for action to reduce chemical risk. 15 June 2020.
64. 2021 Corporate Governance Trends in the Retail Industry. 29 September 2021.
65. LVMH releases Social and Environmental Report, spotlighting initiatives to support sustainable growth. 10 May 2021.
66. 2021 Target Corporate Responsibility Report. Accessed 21 December 2021.
67. Tesco Little Helps Plan Sustainability Update 2020/21. Accessed 21 December 2021.
68. Decathlon, Transition Plan 2020-2026. Accessed 21 December 2021.
69. Shoprite Holdings Annual Report. September 2021.
70. Another hefty loss for Steinhoff as high finance costs, litigation provisions bite. 26 February 2021.
71. Auchan Retail sells its Chinese subsidiary SunArt to its partner Alibaba. 19 October 2020.
72. Magalu prepares to be the Brazilian Alibaba. 9 March 2021.
73. Chilean retailer Cencosud plans IPO of Brazilian unit. 3 September 2021.
74. Russia's Mercury Retail bets on ultra-convenience format to win food shoppers, boost growth. 30 September 2021.
75. Russians’ search for ever more convenience creates big new opportunities for retailers. 14 October 2021.
76. Russia's Mercury Retail sets IPO price range, implies up to $13bn market cap. 3 November 2021.
77. More than 140 German Real stores to be sold on to Kaufland, Edeka. 31 March 2020.
78. Real stores are being renamed: Customers will have to adapt to changes shortly. 2 March 2021.
79. EG Group: About us, news, and latest annual report. Accessed 20 December 2021.
80. DNS company website. Accessed on 23 December 2021.
81. European Ambitions of Ukrainian Business: "ATB" Discount Store of Gennadiy Butkevych Will Compete with Eastern European Retailers? Accessed on 23 December 2021.
82. Larger format offerings: LCBO sees shift in booze purchases during pandemic. 12 March 2021.
83. Shufersal. Accessed 20 December 2021.
84. lululemon athletica inc. Announces Fourth Quarter and Full Year Fiscal 2020 Results. 30 March 2021.
85. Pandemic favors supermarket giants. 6 April 2021.
86. Weis Markets 10-K report. Accessed 20 December 2021.
87. Coupang, Inc., Form S-1 Registration Statement, Preliminary prospectus initial public offering. 12 February 2021.
88. Coupang could struggle to live up to IPO valuation – analysts. 16 March 2021.
89. Retail to be next growth engine for Reliance Industries. 21 June 2021.
90. Reliance Retail Q4 Pre-Tax Profit Up 41.5% To Rs3,617 Cr; Revenue Rises 20% To Rs41,296 Cr. 1 May 2021.
91. Wayfair Has a New Profit Outlook. 28 February 2021.
92. Mobile World: Recovery momentum continues. 31 March 2021.
93. Mobile World Investment Corporation: Aiming high. 2 April 2021.
94. A101 company information. Accessed 23 October 2021.
95. ATB-Market's turnover increased by 18.2 percent in 2020. Accessed 20 December 2021.
96. ATB-Market LLC. Accessed 20 December 2021.
97. lululemon athletica inc. Announces Fourth Quarter and Full Year Fiscal 2020 Results. 30 March 2021.
98. Lululemon Athletica Inc. To Acquire Home Fitness Innovator MIRROR. 29 June 2020.

51
Global Powers of Retailing 2022 | Contacts
Contacts
Retail contacts for Deloitte Touche Tohmatsu Limited (DTTL) and its member firms
GlobalGlobal Retail, Wholesale &Distribution Sector LeaderEvan [email protected]
Chief Global EconomistIra [email protected]
North AmericaCanadaMarty [email protected]
Deloitte United States(Deloitte Consulting LLP)Rod [email protected]
Europe, Middle East and Africa (EMEA)AustriaOrsolya Hegedü[email protected]
BelgiumJoris van [email protected]
Czech RepublicMartin Tesař[email protected]
FranceYannick Franc [email protected]
Benedicte [email protected]
GermanyKarsten [email protected]
IrelandDaniel [email protected]
IsraelRani [email protected]
ItalyEnrico [email protected]
NetherlandsAdgild [email protected]
NordicsJoakim [email protected]
PolandAnita [email protected]
PortugalDuarte Nuno [email protected]
Russia/CISVladimir [email protected]
South AfricaRodger [email protected]
SpainFernando [email protected]
SwitzerlandKarine [email protected]
TurkeyHande [email protected]
UkraineOleksandr Yampolskyi [email protected]
United KingdomIan [email protected]
Latin AmericaBrazilRicardo [email protected]
Spanish Latin AmericaErick [email protected]
Asia PacificAustraliaDavid [email protected]
ChinaTian Bing [email protected]
IndiaPorus [email protected]
JapanJun [email protected]
Satoshi [email protected]
South KoreaDong Sup [email protected]
Southeast Asia and SingaporeWee Meng [email protected]
TaiwanSteven [email protected]
We would like to thank Pranasha Sahu, Soujanya Narsipur, Annie Wallace, Katie Weir, Jeroen Smits, Athappan Balasubramanian, Ashley Tebbe, Tushar Dhamne, Brian Coyle, and Debbie Allan for their contributions to this report.
Acknowledgements

Deloitte refers to one or more of Deloitte Touche Tohmatsu Limited (“DTTL”), its global network of member firms, and their related entities (collectively, the “Deloitte organization”). DTTL (also referred to as “Deloitte Global”) and each of its member firms and related entities are legally separate and independent entities, which cannot obligate or bind each other in respect of third parties. DTTL and each DTTL member firm and related entity is liable only for its own acts and omissions, and not those of each other. DTTL does not provide services to clients. Please see www.deloitte.com/about to learn more.
Deloitte is a leading global provider of audit and assurance, consulting, financial advisory, risk advisory, tax and related services. Our global network of member firms and related entities in more than 150 countries and territories (collectively, the “Deloitte organization”) serves four out of five Fortune Global 500® companies. Learn how Deloitte’s approximately 330,000 people make an impact that matters at www.deloitte.com.
This communication contains general information only, and none of Deloitte Touche Tohmatsu Limited (“DTTL”), its global network of member firms or their related entities (collectively, the “Deloitte organization”) is, by means of this communication, rendering professional advice or services. Before making any decision or taking any action that may affect your finances or your business, you should consult a qualified professional adviser.
No representations, warranties or undertakings (express or implied) are given as to the accuracy or completeness of the information in this communication, and none of DTTL, its member firms, related entities, employees or agents shall be liable or responsible for any loss or damage whatsoever arising directly or indirectly in connection with any person relying on this communication. DTTL and each of its member firms, and their related entities, are legally separate and independent entities.
© 2022. For information, contact Deloitte Global.
Designed by CoRe Creative Services. RITM0915565