Ghana Living Standards Survey (GLSS), 1987-88 and 1988 ...
60
Ghana Living Standards Survey (GLSS), 1987-88 and 1988-89 Basic Information Poverty and Human Resources Division The World Bank March 1999 t:\lsms\b_info\ghana88\binfo3.doc
-
Upload
khangminh22 -
Category
Documents
-
view
5 -
download
0
Transcript of Ghana Living Standards Survey (GLSS), 1987-88 and 1988 ...
Ghana Living Standards Survey (GLSS), 1987-88 and 1988-89
Basic Information
Poverty and Human Resources DivisionThe World Bank
March 1999
t:\lsms\b_info\ghana88\binfo3.doc
Table of Contents1. Overview ............................................................................................................................................12. Survey Questionnaires .........................................................................................................................1
2.1 Household Questionnaire.......................................................................................................12.2 Community Questionnaire .....................................................................................................82.3 Price Questionnaire ...............................................................................................................92.4 Health and Family Planning Facilities Questionnaire ...............................................................92.5 Drugstores, Pharmacies and Drug Vendors Questionnaire ....................................................102.6 School Questionnaire...........................................................................................................11
3. Sample..............................................................................................................................................113.1 Sample Design....................................................................................................................113.2 Implementation ...................................................................................................................12
4. Organization of the Survey.................................................................................................................144.1 Survey Management ...........................................................................................................144.2 Training and Field Test........................................................................................................144.3 Organization of Fieldwork...................................................................................................14
5. Using the Data...................................................................................................................................165.1 Data Problems ....................................................................................................................175.2 Linking Parts of the Household Survey.................................................................................185.3 Linking 1987-88 and 1988-89 Data Sets ..............................................................................195.4 Linking the Household to the Community Data.....................................................................205.5 Linking to the Price Data .....................................................................................................215.6 Linking the Household to the Health Facility and Pharmacy Data ..........................................215.7 Linking the Households to the School Data...........................................................................21
6. Constructed Data Sets........................................................................................................................226.1 Aggregate Expenditure, EXPEND.......................................................................................226.2 Price Data, PRICE ..............................................................................................................236.3 Household and Household Head Characteristics, HEAD ......................................................246.4 Panel Data Set, PANELC....................................................................................................246.5 Height for Age, Weight for Age and Height for Weight, ZSCORE........................................246.6 Household to Community Link, HHCOMM ........................................................................256.7 1987-88 to 1988-89 Cluster Link, CLYR1YR2....................................................................256.8 Cluster to Health Facility Link, CLHLTH ............................................................................25
7. Summary ..........................................................................................................................................26Appendix A. How to Obtain the GLSS Data.......................................................................................28Appendix B. List of GLSS Data Sets Available ..................................................................................29Appendix C. List of Related Documents .............................................................................................30Appendix D. List of Reports and Papers Using the GLSS Data ..........................................................31Appendix E. Monthly, Regional and Annual Price Indices ..................................................................34Appendix F. Translation of School Codes............................................................................................36Appendix G. Codes not in Questionnaire.............................................................................................37Appendix H. Corrections to the Data...................................................................................................43Appendix I. Cluster Names, Numbers, Region........................................................................................Appendix J. List of Health Facilities........................................................................................................Maps Showing Locations of Sampling Clusters .......................................................................................
1
Ghana Living Standards Survey (GLSS), 1987-88 and 1988-89
Basic Information
1. Overview
As of 1993, Living Standards Measurement Study (LSMS) household surveys have beenconducted in 11 countries. The purpose of these surveys is to collect individual, household, andcommunity level data to measure levels and changes in living standards of the population, and toevaluate the effects of various government policies on these indicators of living standards in developingcountries.
The Ghana Living Standards Survey (GLSS) was first conducted in 1987-88. This nationwidesurvey gathered individual and household level data using a multi-purpose household questionnaire. Community level data were collected using a community questionnaire in rural areas and a pricequestionnaire was used in both urban and rural areas. In 1988-89 the household, community and pricequestionnaires were repeated. Additional community level data were collected through a health andfamily planning facilities questionnaire, a pharmacy questionnaire, and a school questionnaire. Additional household and individual level data relevant to education were also collected, includingtesting of household members' mathematics, reading and abstract thinking skills.
This document describes the GLSS for potential users. Survey content, sample design andfieldwork are outlined in Sections 2 through 4. Section 5 discusses the extent to which the two yearsof data can be linked for panel use. Constructed data sets that are available are described in Sections 6. Appendix A describes the procedure for obtaining the data. Lists of the data sets and additionaldocumentation are in Appendix B and C, respectively. Appendix D catalogs the research that has beenconducted with the GLSS data. The remaining appendices provide details on using the data.
2. Survey Questionnaires
2.1 Household Questionnaire
The household survey contains modules (sections) to collect data on household demographicstructure, housing conditions, schooling, health, employment, migration, expenditure and income,household non-agricultural businesses, agricultural activities, fertility and contraceptive use, savingsand credit, and anthropometric (height and weight) measures. Half of the households in the 1988-89phase also participated in the collection of cognitive test scores.
The individual designated by the household members as the household head providedresponses to questions on general household information, or indicated which member would know theanswer. If the household head was not available, a member of the household who was able to provideinformation on household affairs was selected. In most sections of the questionnaire, each member ofthe household was asked to respond for himself or herself, except that parents were allowed to respond
2
for younger children.
The household questionnaire was completed in two interviews two weeks apart: Sections 0-8,16A, 17A and 17C were conducted in the first interview.1 Sections 9-15, 16B and 17B wereconducted in the second interview. The survey was designed so that more sensitive issues such asfertility and savings were discussed near the end. The content of each module is briefly describedbelow. For complete details, the questionnaires can be obtained (see Appendix C).
I. FIRST INTERVIEW
Section 0 SURVEY INFORMATION0A HOUSEHOLD HEAD AND RESPONDENT INFORMATION0B SUMMARY OF SURVEY RESULTS0C OBSERVATIONS AND COMMENTS
The date of the interview, the religion and language of the household head, the language usedby the respondent and other technical information related to the interview are noted. Section 0B and0C are only available for 1988-89.
Section 1 HOUSEHOLD MEMBERSHIP1A HOUSEHOLD ROSTER1B INFORMATION ON PARENTS OF HOUSEHOLD MEMBERS1C CHILDREN RESIDING ELSEWHERE
The roster in Section 1A lists the age, sex, marital status and relation to household head of allpeople who spent the previous night in that household and for other household members. Thehousehold head is listed first and receives personal id # 1. Household members were defined to include"all the people who normally live and eat their meals together in this dwelling." Those who wereabsent more than nine of the last twelve months were excluded, except for the head of the householdand infants less than three months old. An historical calendar prepared for the 1984 population censuswas used to help respondents accurately date births and other long-ago events for whichdocumentation could not be produced.
Information on schooling and occupation for non-resident (including deceased) parents ofhousehold members and on the age, sex, and schooling of (currently living) non-resident children ofhousehold members were collected in Sections 1B and 1C, respectively.
1Sections 17A, 17B, and 17C apply only to those households in the 1988-89 survey thatparticipated in the collection of cognitive skill test score data.
3
Section 2 HOUSING2A TYPE OF DWELLING2B HOUSING EXPENSES
Section 2A contains the type of dwelling and years at current residence. Household expenses,including rent and utilities, source of water, cooking fuel and light, and type of toilet are in Section 2B.
Section 3 SCHOOLING3I ATTENDANCE3II EXPENSES
In Section 3I, data were collected for each household member 5 years or older on self-reportedliteracy and numeracy, school attendance, completion and current enrollment. For all individuals whoattended school during the past 12 months, data were collected on expenses, scholarships, and distanceand travel time to school in Section 3II. The translation of the highest grade completed into thenumber of years of schooling is provided in Appendix F.
Section 4 HEALTH
Individual members and parents of children were asked to respond to the health questions inSection 4. The respondent reported on at most one illness or injury, if any, sustained in the last fourweeks, the type, location and cost of any care sought, and the amount spent in the last twelve monthson vaccinations, Maternal and Child Health or other health consultations. Women age 15 and olderwere asked how many live births they have had.
Section 5 ECONOMIC ACTIVITIES5A TIME USE AND JOB SEARCH5B MAIN JOB DURING THE PAST SEVEN DAYS5C SECONDARY JOB DURING THE PAST SEVEN DAYS5D SEARCH FOR ADDITIONAL EMPLOYMENT5E MAIN JOB DURING THE PAST TWELVE MONTHS5F EMPLOYMENT HISTORY5G SECONDARY JOB DURING THE PAST TWELVE MONTHS5H OTHER ACTIVITIES
All individuals age seven and older were asked to respond to the economic activity questions inSection 5, beginning with the questions on the nature of their work in the last seven days. For personsthat did not work in last seven days, data were collected on job search, reservation wage, and reasonfor not seeking employment. For work in last seven days, information was collected on hours, lengthof employment, type of employer, taxes, distance and travel time to work, money and in kindcompensation, and benefits. Similar questions were asked on the secondary job in the last seven days. Questions were asked on search for additional employment, including the kind of work sought and thelowest acceptable wage. If main work in the last twelve months was different from the main orsecondary job in the last seven days, the complete set of questions was answered for that work as well.
4
Type of work and years of experience at any work prior to that of the main job in the last twelvemonths were collected. Again, if there was a secondary job in the last twelve months different from theother jobs, data on work conditions and compensation were collected. Days and hours spent doinghousehold chores were collected for each household member age seven and older.
Section 6 MIGRATION
All household members age seven or older also responded to the questions on migration inSection 6: If not born at current residence, was place of birth a village, town, city, or other? How oldwere the individuals when they left? What was the main reason for leaving? What was the mainreason for coming to the current place of residence? From what region did the person come to thecurrent place, was it a village, town or city? In how many places has the person lived for periods ofmore than three months in his or her life?
Section 7 RESPONDENTS CHOSEN FOR ROUND TWO (the second interview)
In Section 7, the principal respondent was asked to identify 1) the household member whoknows the most about all the agricultural and livestock activities of the household, 2) the householdmember who shops for food and 3) the household member who knows the most about the otherhousehold expenses, income and savings of household members. The respondent was also asked toidentify the three most important businesses and trades belonging to the household. Finally, a womanwas selected at random from among the women in the household between the ages of 15 and 50 torespond to the fertility module. All these women would then be interviewed in the second round(interview) of the survey.
Section 8 CHARACTERISTICS OF HOUSING
Section 8 notes the construction material of the household's dwelling's walls, flooring, roof andwindows, and the floor area in square meters.
Section 9 AGRO-PASTORAL ACTIVITIES (BEGINNING OF SECOND INTERVIEW)9A LAND9B CROPS9C AGE OF TREE CROPS9D FARM INPUTS9E SALES OF FOOD PRODUCTS MADE FROM HOMEGROWN CROPS9F LIVESTOCK9G ANIMAL PRODUCTS9H EXTENSION CONTACTS FOR LIVESTOCK9I LIVESTOCK EXPENDITURES9J HAND TOOLS9K FARMING EQUIPMENT
In Section 9 the respondent was the household member identified in Section 7 as the one most

5
knowledgeable about the household's agricultural and pastoral activities. Most questions refer to thepast twelve months. Because interviews were conducted throughout the year, the period covered bythe prior twelve months differs among households. This also means that crop production (harvest)over that time period may be from the previous agricultural cycle while the inputs may correspond tothe current agricultural cycle. Section 9A covers land owned, rented and cultivated by the household,land sales, gifts and trades, and land sharecropped in and out. Section 9B collects information onacreage, production, distribution, loss to pests and market value of 32 crops. Section 9C notes theproportion of tree crops in each of the three categories: 1) too young to produce, 2) in full production,and 3) near the end of productive life. Section 9D surveys farm inputs, including seeds, young plants,fertilizer, manure, herbicides and insecticides, and twine and sacks. Information was collected on theamounts used, costs, and source of credit for purchase. Information on expenses for transport,storage, paid labor, rented animals, fuel, and machinery rental and repair was also collected. Sharecropping in and out, including the proportion of harvest exchanged, were also noted, as wascontact with an extension agent.
Section 9E contains information on processing of homegrown crops for sale. Who did theprocessing? For how many months of the year? How often was it sold? How much was it sold for? How much was spent on tools, transport and labor? Section 9F contains data on the value, sale,consumption and purchase of livestock in the last twelve months. Section 9G asks about theprocessing for sale of animal products produced by the household, including the value of the amountsold. Contact with animal husbandry or veterinary extension workers in the past twelve months iscovered in section 9H. Expenditures on, and source of, supplies and services for livestock are noted inSection 9I. Ownership of hand tools is surveyed in Section 9J. Section 9K surveys ownership, value,sale and purchase of heavier farm machinery including tractors, ploughs, cart, vehicles and draftbullocks.
Section 10 NON-FARM SELF-EMPLOYMENT10A WORKING CONDITIONS10B EXPENDITURES10C REVENUES10D BUSINESS ASSETS
Section 10 gathers data on Non-Farm Self-Employment for the three most importantenterprises operated by the household. The respondent for each enterprise is the household membermost familiar with its operation (as identified in Section 7). Data are gathered on the ownership,number of employees, and type of employee compensation for each enterprise. For each business,expenditures over the last twelve months on wages, raw materials, and taxes are collected. Therespondent was asked how much, in money and goods, was received from sales and how much of theenterprise's product was consumed by the household since the first interview. Information onownership, sales and purchases of assets--buildings, land, vehicles, tools and durable goods-- in the lasttwelve months is also collected.
6
Section 11 NON-FOOD EXPENDITURES & INVENTORY OF DURABLE GOODS11A DAILY EXPENSES11B ANNUAL EXPENSES11C INVENTORY OF DURABLE GOODS11D EXPENSES FOR REMITTANCES
Section 11 collects information on household expenditures from the household memberidentified in Section 7 as the one most able to answer non-food expenditure questions. Respondentswere asked to recall the amount spent since the first interview (approximately two weeks) on dailyexpenses such as lottery tickets, cigarettes, soap, personal care products, cooking fuel, matches andcandles, and gasoline. Expenditures on other goods, both in the last two weeks and the last twelvemonths, were collected for shoes, cloth, clothing repairs, public transport, paper supplies, furniture,kitchen equipment, medical services, domestic servants, jewelry, entertainment and other goods (seehousehold questionnaire). Purchase price, length of ownership and resale value of durable goodsowned were collected in Section 11C. Relation and location of the recipients of remittances sent out ofthe household were noted in Section 11D (remittances received by the household are recorded inSection 14A). Susu contributions are recorded in this section as an expense. ("Susu" is a rotatingsavings scheme in which participants contribute a fixed sum regularly. The total is then allocatedamong the participants in turn.) Income from susu is recorded in Section 14.
Section 12 FOOD EXPENSES AND HOME PRODUCTION12A FOOD EXPENSES12B CONSUMPTION OF HOME PRODUCTION
In Section 12A the amounts spent since the first interview (about two weeks) on 60 food itemswere collected. In addition, questions were asked on the number of months the item was purchasedduring the past twelve months, the frequency of purchases within a month, and the amount spent eachtime were collected for the same 60 food items. This allows for a rough calculation of annualexpenditure. Section 12B asks the amount consumed and market value of foods grown or raised bythe household in the last twelve months.
Section 13 FERTILITY13A FERTILITY HISTORY13B FAMILY PLANNING
In each household one woman, randomly selected as explained in Section 7, responded to thequestions in Section 13. The woman was asked if she had been pregnant and, if so, had she given birth. Women who respond that they have are asked the birth date and sex of all children they have givenbirth to, including those who did not survive. If the child is not alive the woman is asked how long itsurvived. The woman is asked about the birth and breastfeeding of her last child, the age at which shestarted cohabiting, and the number of miscarriages she has had. Section 13B gathers information onknowledge, use, source and cost of six modern and six traditional methods of family planning.

7
Section 14 OTHER INCOME14A INCOME FROM REMITTANCES14B MISCELLANEOUS INCOME
Section 14 collects data on money and goods that come into the household as remittances orfrom other sources such as employee welfare funds, dowries or susu.
Section 15 CREDIT AND SAVING15A MONEY AND GOODS LENT AND BORROWED15B LOANS CONTRACTED15C SAVINGS
Section 15 collects information on the amount of indebtedness of household members topeople or institutions outside the household. If money or goods have been borrowed and repaid by anyhousehold member in the last twelve months then the details of those loans are collected. Informationincludes the source and amount of loan, interest, side payments, collateral, repayment schedule, reasonfor borrowing, and number of loans from the same source. The household is asked to list the locationof its savings, if any, including bank, housing saving bank, rural savings bank, foreign currency account,other bank accounts, bonds, stocks and home. The total value of all savings accounts is noted.
Section 16 ANTHROPOMETRICS16A ROUND ONE16B ROUND TWO
Anthropometric measurements are done for each household member. Section 16Ameasurements were taken in the Round One interview and Section 16B measurements were taken inthe Round Two interview. Data were collected on the household member's sex, date of measurement,weight and height. It was also noted if female respondents were pregnant or breastfeeding. Thesurvey was designed so that 20% of the respondents, including those whose measurements deviatedsubstantially from the norm, would be re-measured and re-weighed in Round Two. Due to a data-entry program error not connected with the accuracy of the data, the majority of respondents were re-weighed and re-measured in the first three months of the first year. The error was subsequentlycorrected.
Section 17 COGNITIVE SKILLS TESTS (1988-89 ONLY)17A ROUND ONE: EASY READING, EASY MATH AND RAVEN TEST SCORES17B ROUND TWO: ADVANCED READING AND ADVANCED MATH TEST SCORES17C HOUSEHOLD INFORMATION
In the second year (1988-89) approximately one half of the households participated in theCognitive Skills Tests component of the Household questionnaire. Sections 17A, 17B and 17C wereincluded in the household survey in 85 sampling clusters randomly selected from the entire second yearsample of 170 clusters. The clusters included are noted in Appendix I. These modules containcognitive skills test score data for household members between the ages of 9 and 55. Section 17A
8
contains scores for the Raven Progressive Matrices test, an easy reading test and an easy math test. Allhousehold members age 9 to 55 were given the Raven's test. The easy math and easy reading testswere given to all household members who had at least three years of schooling and were present on theday of the survey. Respondents who scored more than 4 out of 8 on the easy test were given theadvanced test during the second round. Section 17B contains those scores. Section 17C contains dataon distance, travel time, and transport cost both to the three nearest primary schools and the threenearest middle schools. An explanation of the tests is provided in Glewwe (1991) and Glewwe andJacoby (1992), listed in Appendix C. The actual reading and math tests are available in the EducationModule Questionnaire, also listed in Appendix C.
2.2 Community Questionnaire
A Community questionnaire was administered by the team supervisor and completed with thehelp of village chiefs, teachers, government officials and health care workers. Supervisors wereinstructed to conduct interviews for all rural areas and in other areas where agricultural pursuits werefollowed. The questionnaires were completed for almost all rural, most semi-urban clusters and oneurban cluster. (Cluster refers to a group of 16, 32 or 48 households within one geographic area thatwere surveyed, as explained in Section 3 of this document.) Where the households in one cluster werelocated in more than one distinct community, questionnaires were completed for each community. Inthose cases, each community questionnaire contains a list indicating which of the households in thatcluster belong to that community. Data were collected on a variety of topics as discussed below.
Section 1 (DEMOGRAPHIC INFORMATION) includes the population of the community, alist of principal ethnic groups and religions, the length of time the community has existed and whetheror not it has grown. Section 2 (ECONOMY AND INFRASTRUCTURE) questions include a list ofprincipal economic activities, access to a motorable road, electricity, pipe-borne water, restaurant orfood stall, post office, bank, daily market and public transport. There are also questions onemployment, migration for jobs, and the existence of community development projects. Section 3(EDUCATION) asks distance to primary and middle schools. For up to three primary schools, thenearest middle school and the nearest secondary school, information is obtained on whether it is publicor private, whether it is for boys or girls, or both, how many classes there are, and when it was built. Enrollment rates and reasons why children do not attend school are also collected. Section 4(HEALTH) collects data on distance and travel time to the nearest of each of several types of healthworkers (doctor, nurse, pharmacist, midwife, family planning worker, community health worker,traditional birth attendant and traditional healer) and each type of several types of health facilities(hospital, dispensary, pharmacy, maternity home, health post and family planning clinic). Thequestions in Section 5 (AGRICULTURE) include the type of crops grown in the community, howoften and when they are planted and harvested, and how the harvest is generally sold. This section alsoincludes questions on the availability of an extension center, agricultural cooperatives, and machinery,and questions on the use of pesticides and irrigation. Qualitative data on the last year's rainfall, thelocal land market, the prevalence of sharecropping, and agricultural wages in the community are alsogathered.
In several sections respondents were asked to list the problems experienced by the community.
9
The responses were noted and codes were assigned after all the questionnaires had been entered. These codes are provided in Section 3 of Appendix G.
In clusters that were surveyed in both years of the GLSS (1987-88 and 1988-89), thecommunity questionnaire was not administered in the second year.
2.3 Price Questionnaire
In principle, a price questionnaire was to be completed for each cluster. Prices from up tothree vendors are collected for 28 food, 6 pharmaceutical and 13 other non-food items. The itemswere selected because they are important in most household budgets and because they are usuallyavailable in most areas of the country. Weighing scales were used to determine the exact weight offood items.
In clusters that contained more than one locality, a questionnaire was completed for the marketclosest to each locality. The price questionnaire was administered in both years to half of the clustersthat were surveyed in both 1987-88 and 1988-89.
2.4 Health and Family Planning Facilities Questionnaire
In order to examine the effect of the quality and availability of health and family planningservices near the household, health facility and pharmacy surveys were conducted by the AfricaTechnical Department with funds from the Netherlands Trust Fund. In December, 1989, shortly aftercompletion of the household survey, health facilities and pharmacies were surveyed for all clusters inthe 1988-89 sample. Interview teams were instructed to survey the nearest health facility to eachcluster, the nearest public health facility (if the nearest is private), and the nearest source of familyplanning (if not available at the nearest health facility or the nearest public health facility). In the eventthat a public and a private facility are equal distance from the community, then the private facilityshould be interviewed as the nearest health facility and the public facility would be interviewed as thenearest public facility. In rural areas, the community questionnaires were consulted to determine thenearest facility. In urban areas the facilities nearest to the central point of the cluster were surveyed. All health facilities and family planning clinics were surveyed with the same questionnaire. The healthfacility survey covered 231 health facilities.
The Health and Family Planning Services Questionnaire begins by asking whether the facility isa clinic, a health post, a maternity home or a hospital. Section I (CHARACTERISTICS OF THEFACILITY) includes the age of the oldest building, availability of electricity, water, and a refrigerator,an operating room and a laboratory. Data on the amount charged for lab tests were collected. SectionII (SERVICES) collects information on the services that are offered at that facility. Days and hours ofavailability and the amount charged for service were collected for out-patient consultations, deliveries,prenatal consultations, postnatal consultations, well-baby clinics, and programs for malnourishedchildren. In Section III (IMMUNIZATIONS), availability and cost data were collected for BCG,DPT, Tetanus, Measles, Yellow fever, Meningitis, and Polio. Section IV (PERSONNEL) collectsinformation on the number of people currently employed, at work at the time of the survey, and at
10
work in the last 24 hours for twelve job categories from medical doctor to laborers. Section V(BEDS) notes availability, occupancy and charge for beds, private rooms and food.2 Section VI(EQUIPMENT) asks about the number and type of vehicles owned (and the number in workingcondition), and the presence of air conditioners and fans. Section VII (DRUG SUPPLY) asks, for 17drugs, if the drug is now in stock, how is it dispensed, the price to patients and how long the mostrecent stock lasted before it was depleted. Anti-malarials, aspirin, vitamins, ampicillin and valium areincluded. This section also includes questions on drug restocking, when the busy times of the day,week and year are and whether credit or exemptions are extended to patients who can not pay. Section VIII (FAMILY PLANNING) is completed for facilities where methods or consultations areavailable. Questions are asked about hours of operation and the cost of a family planning consultation. For each of six methods (condoms, spermicide, pills, IUD, diaphragm and injection), facilities wereasked: 1) if the method is offered; 2) if it is available the day of the interview; and 3) the amount thatclients are charged. Information was gathered on the age, sex, number of children and training of up tofive family planning workers.
The purpose of collecting the facility data was to measure household and individual access tohealth services. Because of this, the facilities surveyed are not a random sample of the health facilitiesin Ghana. The survey is also not a blanket survey of the facilities in the clusters. The data are designedto measure price, availability and quality of the nearest services available to households, but not togenerate national or regional statistics on health services. Facilities in rural and less-populated areas areover-represented in this sample of 237 facilities. If the nearest facility was public and offered familyplanning then only one facility was surveyed for that cluster. If, on the other hand, the nearest facilitywas private and neither the nearest private nor the nearest public facility offered family planning, thenthree facilities were to have been surveyed for that cluster. In no case were more than three facilitiessurveyed regardless of the number of facilities in the cluster.
2.5 Drugstores, Pharmacies and Drug Vendors Questionnaire
The pharmacy questionnaire is very similar to the health facility questionnaire. The nearestsource of drugs other than health facilities (drugstore, pharmacy, chemical seller, or market vendor ofdrugs) to each cluster was surveyed. Data were collected on type of facility, year it opened, availabilityof electricity and refrigeration, hours of operation, and presence of a qualified pharmacist. Respondents were asked if they usually offer, have in stock, and charge for eight immunizations, sixmethods of contraception, and the same 17 drugs as the health facilities. As with the health facilitysurvey, this is not a random sample of pharmacies in the country nor is it a blanket survey of allpharmacies in selected areas. The survey covered 169 drugstores, pharmacies and drug vendors.
2The survey supervisor suggests that number of beds may be a more useful indicator of category offacility than the clinic/health post distinction mentioned above. (See notes distributed with the healthservices questionnaire.)
11
2.6 School Questionnaire
The 1988-89 GLSS included a survey of schools. For each of the randomly-selected clusters inwhich cognitive skills tests were administered (see the description of module 17A in Section 2.1above), each primary and middle school in the cluster was surveyed. For clusters without a primary ormiddle school, the nearest school of each type outside the cluster was surveyed. In urban areas, wherethe number of schools is often rather large, schools that were neither the closest school to any surveyedhousehold nor attended by any individual in any surveyed household may have been missed.
Section I (SCHOOL CHARACTERISTICS) asks whether the school is public, private secularor private religious. Data are gathered on the physical size and overall condition of the school, qualityof blackboards, availability of chalk, textbooks, desks, teacher accommodations and visits from schoolinspectors. Section II (ENROLLMENT) notes the number of classes, number of students, number ofgirls, and number of repeaters for each grade. There are also questions on enrollment criteria andnumber of students who have completed and continued. Section III (SCHOOL STAFF) gathersinformation on occupation, schooling and training, and outside jobs for all school employees. SectionIV (EXPENDITURES ON SCHOOLING) collects information on fees and school-related expensesfor students at that school. Section V (OBSERVATIONS) asks the respondent to comment onimportant problems with education and staff at that school and provides room for the interviewer tonote observations. The Middle/Junior Secondary School questionnaire is very similar except that thegrades and the completion questions have been adjusted appropriately.
Like the health facility survey, this is not a national survey of schools. It is a blanket survey ofall schools in the randomly-selected clusters (with the exception in urban areas noted above). However, clusters were selected to accurately reflect population distribution, not school distribution. (Cluster selection is described in Section 3.1 below.) Schools in areas with lower school/populationratios are expected to be over-sampled. Again, the data provide measurements of the quality ofschooling facilities available to the sample of the population and they will not necessarily provideaccurate measures of average school quality.
3. Sample
3.1 Sample Design
The methodology that was chosen reflects the purpose of the survey. To balance the desire fora large, representative sample with the expense of a long, detailed survey instrument, a sample size of3,200 households was selected. The households were to be chosen in such a manner that eachhousehold had an equal probability of being selected. At the same time, the logistics of locating thehouseholds and conducting all interviews within a specific time frame required that the households begrouped into "workloads" of 16 households each. A final concern was that all three of the country'secological zones (coastal, forest and savannah), and each of urban, semi-urban and rural areas(population greater than 5000, 1500 to 5000, and less than 1500, respectively) form the sameproportion in the sample as they do in the national population.
12
To achieve the three objectives simultaneously, a stratified selection process was used. For the1984 Census, all of Ghana was divided into approximately 13,000 enumeration areas (EAs). From thislist it was determined what proportion of the 200 GLSS workloads should be selected from each of thenine zone/urban categories. Two hundred sampling areas were then selected from the enumerationareas in the sub-divided list. For each enumeration area, the probability of being selected wasproportional to the number of households contained in that area.
After the 200 sampling areas were selected, households in those areas were enumerated in1987. Therefore it was possible to take into account changes in the number of households andpreserve the self-weighting nature of the sample. The 200 workloads were assigned among the 200sampling areas with probability equal to the number of households in that area in 1987 divided by thenumber of households in that area in 1984 and multiplied by the total number of households in 1984divided by the total number of households in 1987. That is, sampling areas that had greater thanaverage increases in size had a greater than one chance of being selected. Thus, each sampling areawas assigned zero, one, two, or even three workloads of sixteen households. The households (sixteenselected and four replacement for each workload) were then chosen randomly from the household listfor each sampling area. The resulting list is 3200 households and 800 replacement households insomething less than 200 sampling areas (specifically 178 in 1987-88 and 170 in 1988-89). Each groupof 16, 32 or 48 households within a sampling area is referred to as a cluster in the GLSS data sets andin this document.
Following the same households over time is important for evaluating changes in livingstandards, even though each interview is time-consuming and repeated visits to the same householdbegin to represent a substantial burden. On the other hand, replacing households increases therepresentative nature of the data. To balance these competing concerns, the survey was designed to bea rotating panel. Each year, half of the sampling areas would be retained and half replaced. Within theretained sampling areas, the same households would be interviewed for the two years. Scott andAmenuvegbe, (1989), listed in Appendix C, provide a detailed description of the sample design.
3.2 Implementation
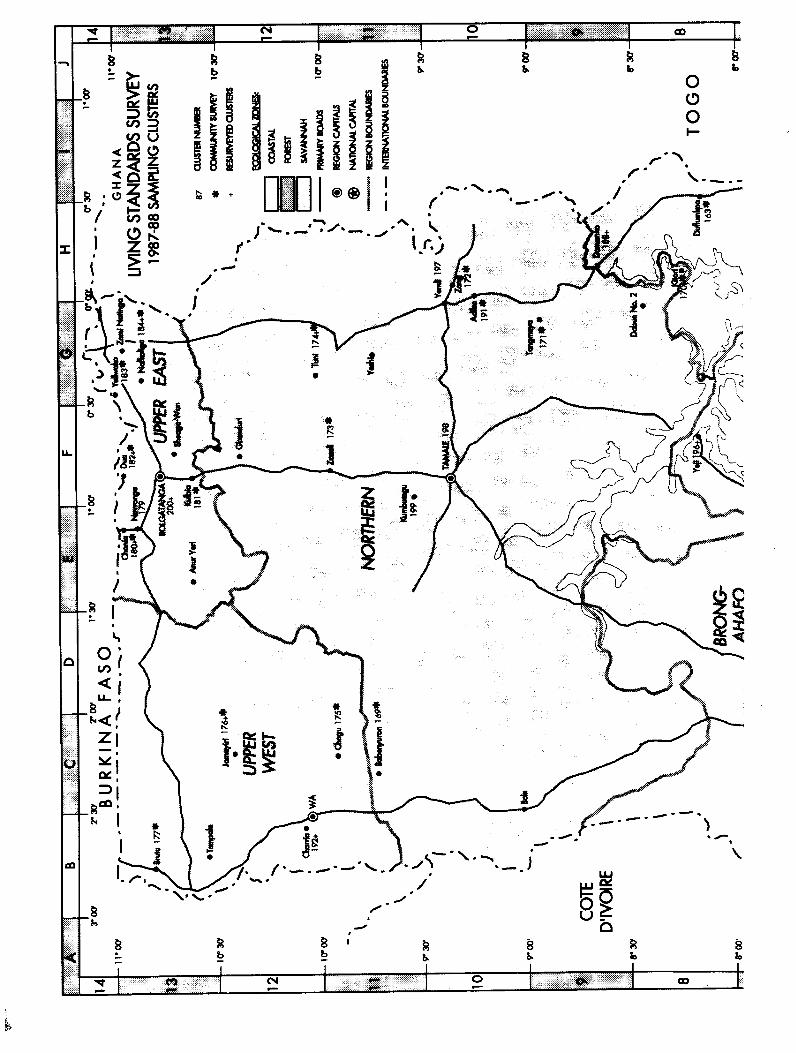
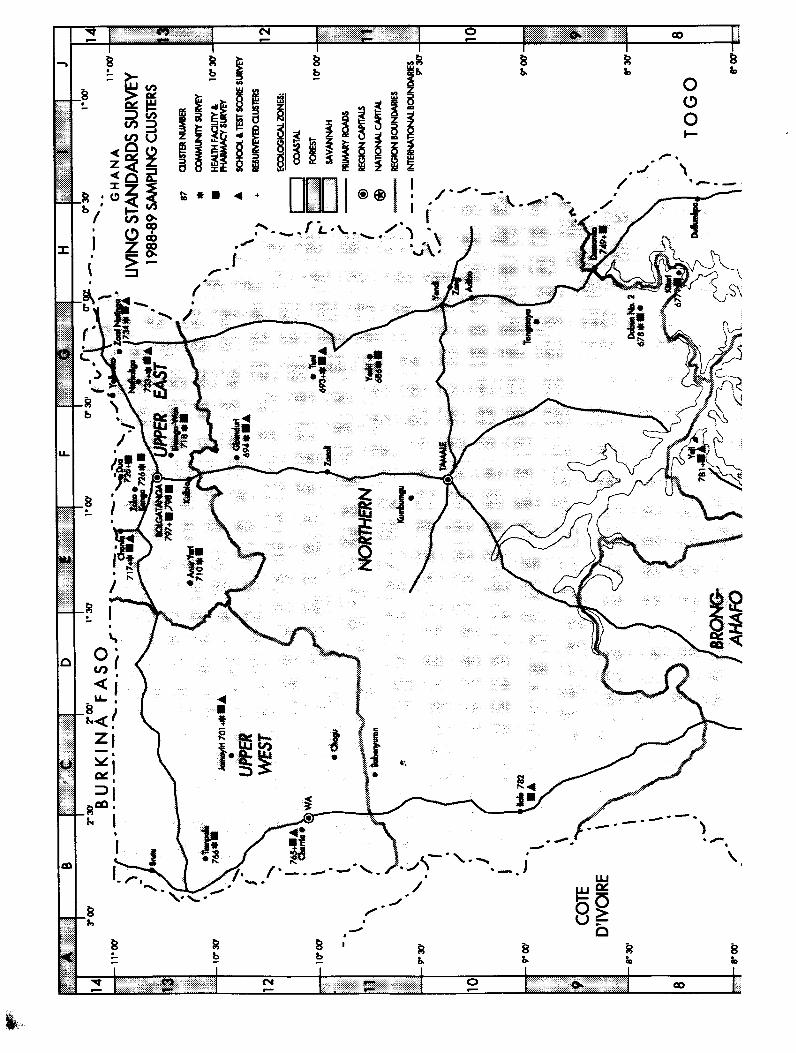
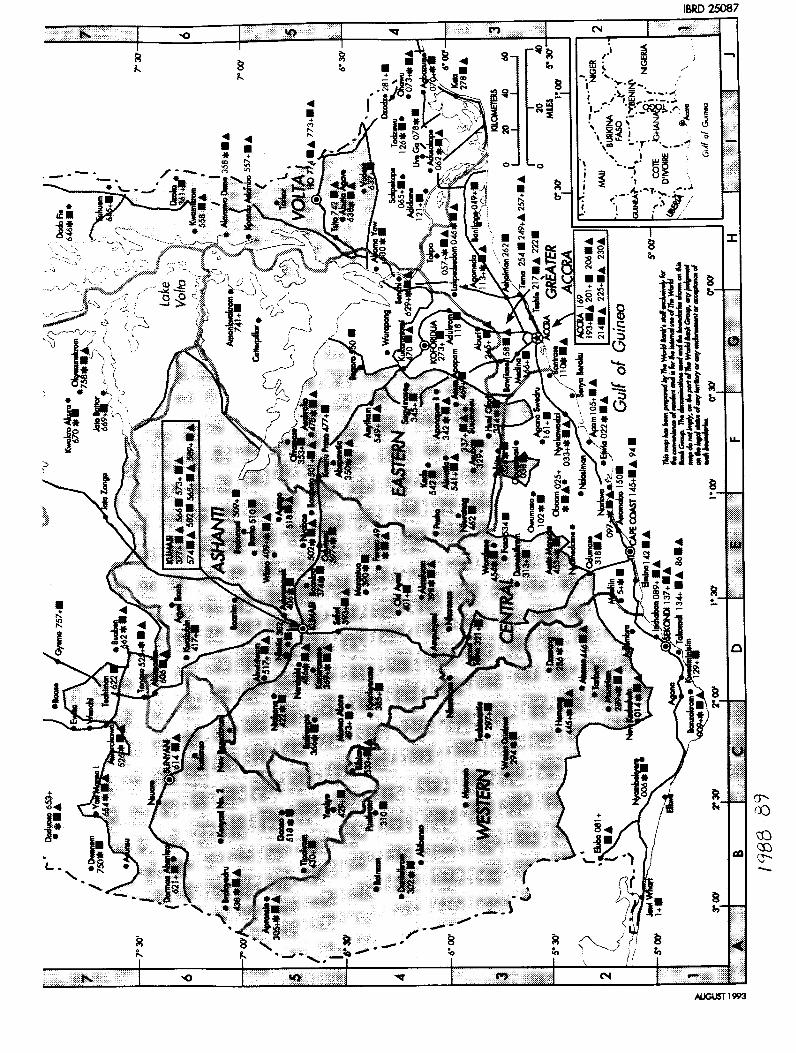
The attached maps show the location and cluster number of all first and second year clusters. Where community, health facility and education data were collected, is noted as well.
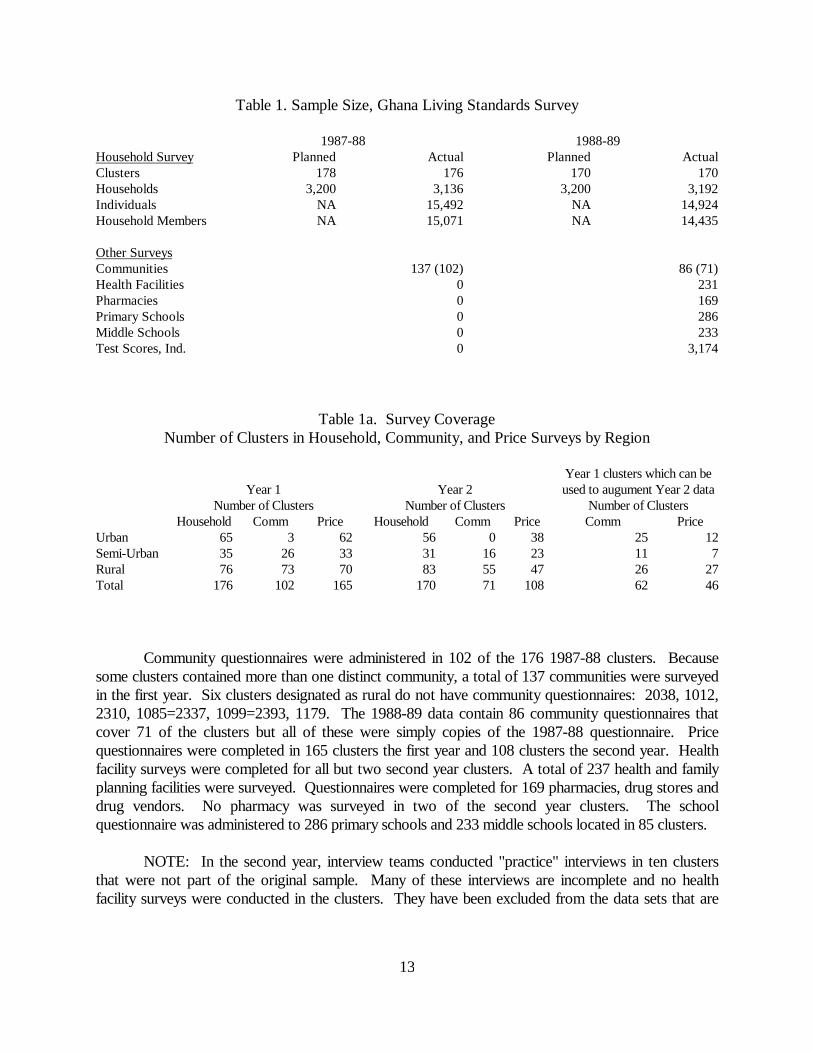
Table 1 shows the sample size of the resulting data sets. The 1987-88 survey contained 176clusters, 3,136 households and 15,492 individuals. Two of the planned clusters of 16 households each,1020 and 1167, were not surveyed due to an automobile accident involving the team that was toundertake the work. Questionnaires were incomplete for 32 households that have been excluded. Inthe 1987-88 survey, only one household refused to participate. Approximately 4%, 123, could not belocated and had to be replaced. The 1988-89 data contain 170 clusters, 3,192 households and 14,924individuals. All intended clusters were surveyed, and only eight households were missed.
13
Table 1. Sample Size, Ghana Living Standards Survey
1987-88 1988-89Household Survey Planned Actual Planned ActualClusters 178 176 170 170Households 3,200 3,136 3,200 3,192Individuals NA 15,492 NA 14,924Household Members NA 15,071 NA 14,435
Other SurveysCommunities 137 (102) 86 (71)Health Facilities 0 231Pharmacies 0 169Primary Schools 0 286Middle Schools 0 233Test Scores, Ind. 0 3,174
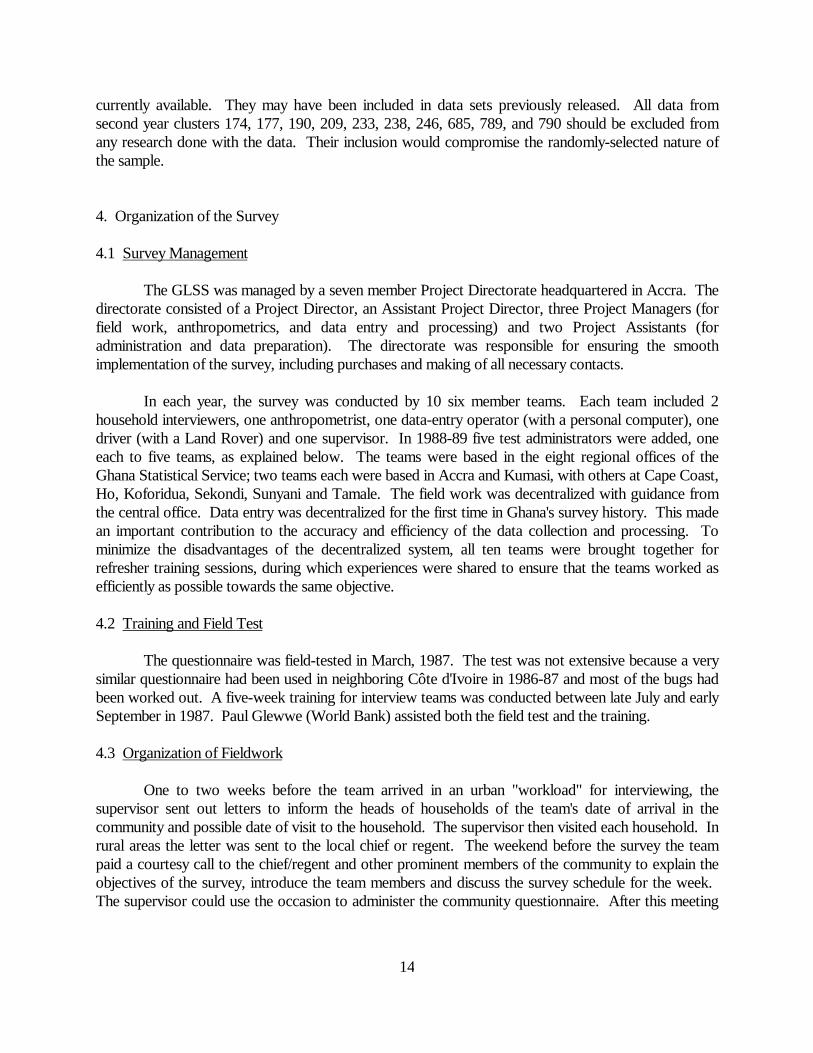
Table 1a. Survey CoverageNumber of Clusters in Household, Community, and Price Surveys by Region
Year 1 Year 2Year 1 clusters which can beused to augument Year 2 data
Number of Clusters Number of Clusters Number of ClustersHousehold Comm Price Household Comm Price Comm Price
Urban 65 3 62 56 0 38 25 12Semi-Urban 35 26 33 31 16 23 11 7Rural 76 73 70 83 55 47 26 27Total 176 102 165 170 71 108 62 46
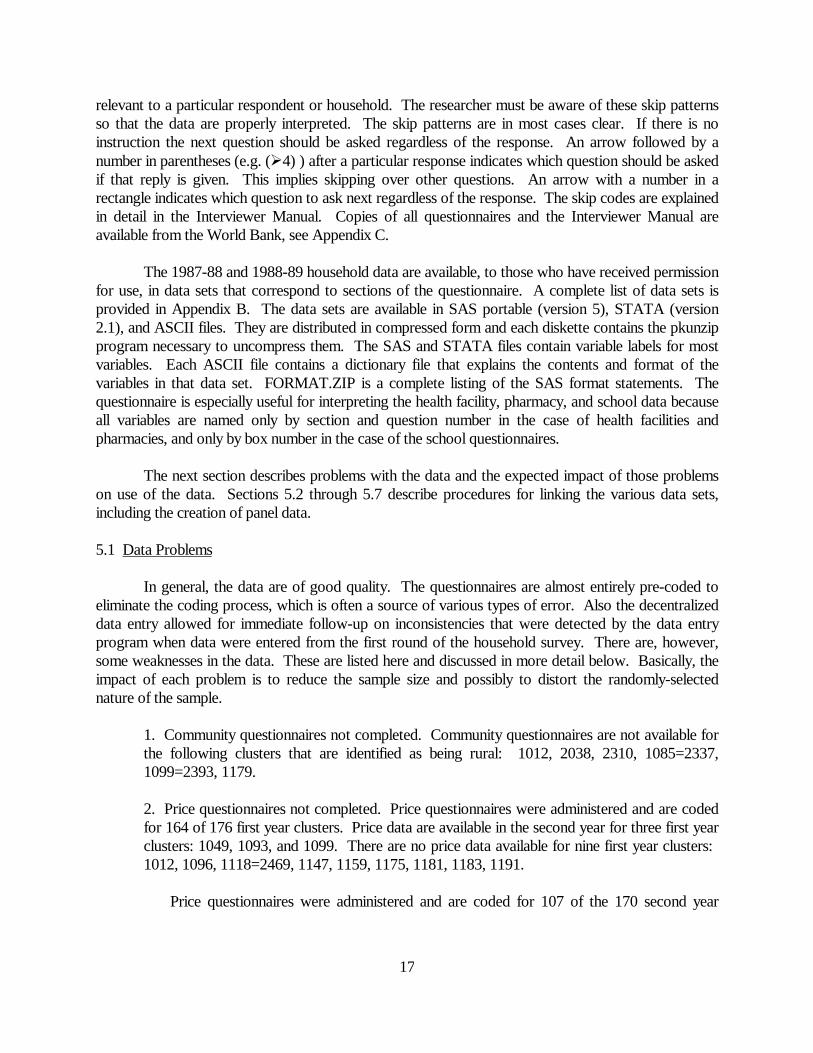
Community questionnaires were administered in 102 of the 176 1987-88 clusters. Becausesome clusters contained more than one distinct community, a total of 137 communities were surveyedin the first year. Six clusters designated as rural do not have community questionnaires: 2038, 1012,2310, 1085=2337, 1099=2393, 1179. The 1988-89 data contain 86 community questionnaires thatcover 71 of the clusters but all of these were simply copies of the 1987-88 questionnaire. Pricequestionnaires were completed in 165 clusters the first year and 108 clusters the second year. Healthfacility surveys were completed for all but two second year clusters. A total of 237 health and familyplanning facilities were surveyed. Questionnaires were completed for 169 pharmacies, drug stores anddrug vendors. No pharmacy was surveyed in two of the second year clusters. The schoolquestionnaire was administered to 286 primary schools and 233 middle schools located in 85 clusters.
NOTE: In the second year, interview teams conducted "practice" interviews in ten clustersthat were not part of the original sample. Many of these interviews are incomplete and no healthfacility surveys were conducted in the clusters. They have been excluded from the data sets that are
14
currently available. They may have been included in data sets previously released. All data fromsecond year clusters 174, 177, 190, 209, 233, 238, 246, 685, 789, and 790 should be excluded fromany research done with the data. Their inclusion would compromise the randomly-selected nature ofthe sample.
4. Organization of the Survey
4.1 Survey Management
The GLSS was managed by a seven member Project Directorate headquartered in Accra. Thedirectorate consisted of a Project Director, an Assistant Project Director, three Project Managers (forfield work, anthropometrics, and data entry and processing) and two Project Assistants (foradministration and data preparation). The directorate was responsible for ensuring the smoothimplementation of the survey, including purchases and making of all necessary contacts.
In each year, the survey was conducted by 10 six member teams. Each team included 2household interviewers, one anthropometrist, one data-entry operator (with a personal computer), onedriver (with a Land Rover) and one supervisor. In 1988-89 five test administrators were added, oneeach to five teams, as explained below. The teams were based in the eight regional offices of theGhana Statistical Service; two teams each were based in Accra and Kumasi, with others at Cape Coast,Ho, Koforidua, Sekondi, Sunyani and Tamale. The field work was decentralized with guidance fromthe central office. Data entry was decentralized for the first time in Ghana's survey history. This madean important contribution to the accuracy and efficiency of the data collection and processing. Tominimize the disadvantages of the decentralized system, all ten teams were brought together forrefresher training sessions, during which experiences were shared to ensure that the teams worked asefficiently as possible towards the same objective.
4.2 Training and Field Test
The questionnaire was field-tested in March, 1987. The test was not extensive because a verysimilar questionnaire had been used in neighboring Côte d'Ivoire in 1986-87 and most of the bugs hadbeen worked out. A five-week training for interview teams was conducted between late July and earlySeptember in 1987. Paul Glewwe (World Bank) assisted both the field test and the training.
4.3 Organization of Fieldwork
One to two weeks before the team arrived in an urban "workload" for interviewing, thesupervisor sent out letters to inform the heads of households of the team's date of arrival in thecommunity and possible date of visit to the household. The supervisor then visited each household. Inrural areas the letter was sent to the local chief or regent. The weekend before the survey the teampaid a courtesy call to the chief/regent and other prominent members of the community to explain theobjectives of the survey, introduce the team members and discuss the survey schedule for the week. The supervisor could use the occasion to administer the community questionnaire. After this meeting

15
the interviewers contacted the households to introduce themselves, explain the purposes of the surveyand to make appointments for interviews.
These visits were not necessary in urban areas because household heads would have receivedthe letters and visits from the supervisors. In rural areas these pre-survey field preparations werenecessary to ensure that all the selected households could be easily located, and to establish thenecessary rapport. The supervisor enlisted the help of the community leaders in locating householdsand in persuading reluctant households to participate.
The household survey was conducted in two interviews. Round 1 covered Sections 0 through8 and Round 2 covered Sections 9-17. The interview for each of the two rounds of the householdquestionnaire were expected to take 2-3 hours. Each team conducted 32 complete interviews in eachfour week period, 16 for each of the two interviewers. Round one was conducted in one cluster thefirst week. Then the team moved to a second cluster for the second week. The third week, the teamreturned to conduct Round Two of the household interviews in the first cluster. The second round wascompleted in the second cluster in week four.
The data entry was decentralized. Responses from all household questionnaires were enteredin regional offices in the week between the two rounds of interviews. The data entry programperformed range and consistency checks on all responses and produced lists of questions that neededto be readministered for each household in the cluster. This allowed for correction of first interviewdiscrepancies during the second round. Each team conducted both rounds of interviews, entered theresponses for 32 households, and had one week off in each five week period.
The supervisor was responsible for administering the community questionnaire. The supervisoralso sat in on some interviews and randomly revisited 25 percent of the households to verify theanswers to some key questions to provide quality control. A complete list of reinterview questions canbe found in the Supervisor's Instruction Manual (Appendix C). The Anthropometrist performed theanthropometry (Section 16 of the household questionnaire) and conducted the price survey. In thesecond year, a test administrator was added to the team to conduct the cognitive skills tests (Section 17of the household questionnaire) and to administer the school surveys.
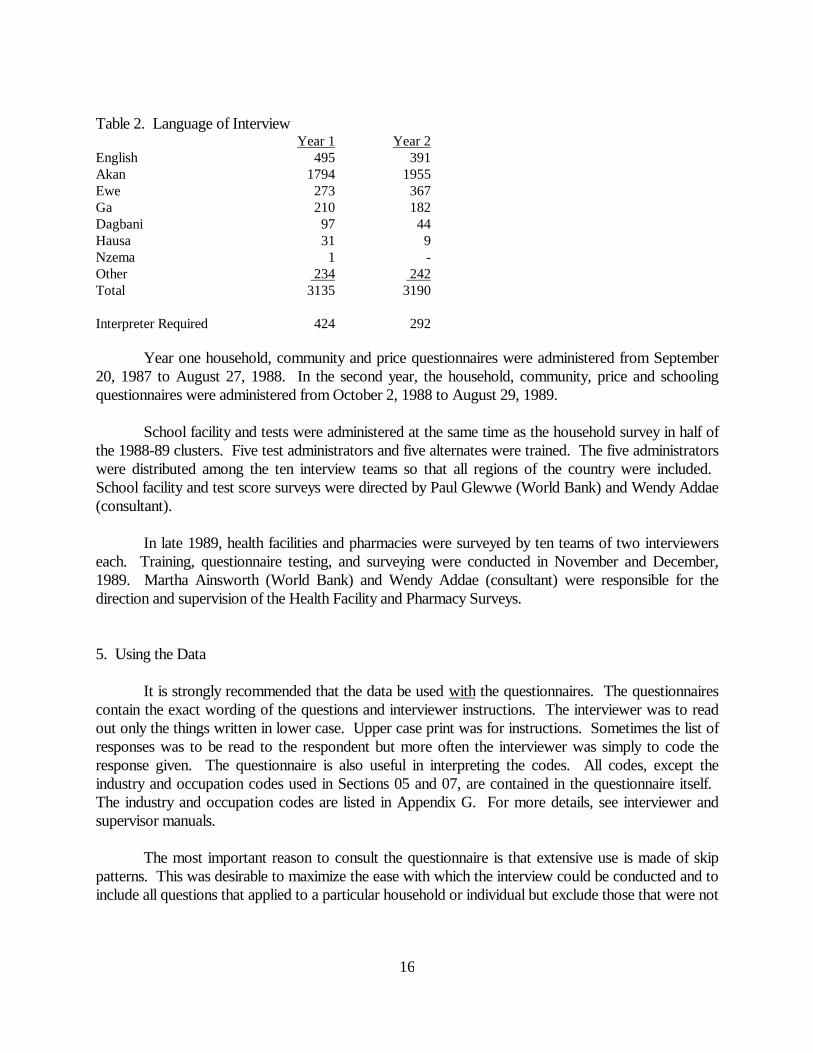
Table 2 presents the language of the interview. If no one in the household spoke English and ifno member of the team spoke the language of the household, then the household was asked to choosesomeone known to them who spoke and understood English to translate. If the household could notname anyone, then the chief was asked to designate someone.
16
Table 2. Language of InterviewYear 1 Year 2
English 495 391Akan 1794 1955Ewe 273 367Ga 210 182Dagbani 97 44Hausa 31 9Nzema 1 -Other 234 242Total 3135 3190
Interpreter Required 424 292
Year one household, community and price questionnaires were administered from September20, 1987 to August 27, 1988. In the second year, the household, community, price and schoolingquestionnaires were administered from October 2, 1988 to August 29, 1989.
School facility and tests were administered at the same time as the household survey in half ofthe 1988-89 clusters. Five test administrators and five alternates were trained. The five administratorswere distributed among the ten interview teams so that all regions of the country were included. School facility and test score surveys were directed by Paul Glewwe (World Bank) and Wendy Addae(consultant).
In late 1989, health facilities and pharmacies were surveyed by ten teams of two interviewerseach. Training, questionnaire testing, and surveying were conducted in November and December,1989. Martha Ainsworth (World Bank) and Wendy Addae (consultant) were responsible for thedirection and supervision of the Health Facility and Pharmacy Surveys.
5. Using the Data
It is strongly recommended that the data be used with the questionnaires. The questionnairescontain the exact wording of the questions and interviewer instructions. The interviewer was to readout only the things written in lower case. Upper case print was for instructions. Sometimes the list ofresponses was to be read to the respondent but more often the interviewer was simply to code theresponse given. The questionnaire is also useful in interpreting the codes. All codes, except theindustry and occupation codes used in Sections 05 and 07, are contained in the questionnaire itself. The industry and occupation codes are listed in Appendix G. For more details, see interviewer andsupervisor manuals.
The most important reason to consult the questionnaire is that extensive use is made of skippatterns. This was desirable to maximize the ease with which the interview could be conducted and toinclude all questions that applied to a particular household or individual but exclude those that were not
17
relevant to a particular respondent or household. The researcher must be aware of these skip patternsso that the data are properly interpreted. The skip patterns are in most cases clear. If there is noinstruction the next question should be asked regardless of the response. An arrow followed by anumber in parentheses (e.g. (Ø4) ) after a particular response indicates which question should be askedif that reply is given. This implies skipping over other questions. An arrow with a number in arectangle indicates which question to ask next regardless of the response. The skip codes are explainedin detail in the Interviewer Manual. Copies of all questionnaires and the Interviewer Manual areavailable from the World Bank, see Appendix C.
The 1987-88 and 1988-89 household data are available, to those who have received permissionfor use, in data sets that correspond to sections of the questionnaire. A complete list of data sets isprovided in Appendix B. The data sets are available in SAS portable (version 5), STATA (version2.1), and ASCII files. They are distributed in compressed form and each diskette contains the pkunzipprogram necessary to uncompress them. The SAS and STATA files contain variable labels for mostvariables. Each ASCII file contains a dictionary file that explains the contents and format of thevariables in that data set. FORMAT.ZIP is a complete listing of the SAS format statements. Thequestionnaire is especially useful for interpreting the health facility, pharmacy, and school data becauseall variables are named only by section and question number in the case of health facilities andpharmacies, and only by box number in the case of the school questionnaires.
The next section describes problems with the data and the expected impact of those problemson use of the data. Sections 5.2 through 5.7 describe procedures for linking the various data sets,including the creation of panel data.
5.1 Data Problems
In general, the data are of good quality. The questionnaires are almost entirely pre-coded toeliminate the coding process, which is often a source of various types of error. Also the decentralizeddata entry allowed for immediate follow-up on inconsistencies that were detected by the data entryprogram when data were entered from the first round of the household survey. There are, however,some weaknesses in the data. These are listed here and discussed in more detail below. Basically, theimpact of each problem is to reduce the sample size and possibly to distort the randomly-selectednature of the sample.
1. Community questionnaires not completed. Community questionnaires are not available forthe following clusters that are identified as being rural: 1012, 2038, 2310, 1085=2337,1099=2393, 1179.
2. Price questionnaires not completed. Price questionnaires were administered and are codedfor 164 of 176 first year clusters. Price data are available in the second year for three first yearclusters: 1049, 1093, and 1099. There are no price data available for nine first year clusters: 1012, 1096, 1118=2469, 1147, 1159, 1175, 1181, 1183, 1191.
Price questionnaires were administered and are coded for 107 of the 170 second year
18
clusters and price data are available from the first year for 43 additional clusters. There are noprice data for 20 of the second year clusters: 2014, 2078, 2094, 2134, 2169, 2217, 2262,2294, 2302, 2326, 2366, 2374, 2382, 2469, 2582, 2622, 2646, 2678, 2742, 2774.
2. Community and Price questionnaires not completed for both years. The communityquestionnaire was administered in none of the 86 resurveyed clusters. The second year data setcontains community data for some of these clusters but it was simply copied from the first yearquestionnaires.
For clusters included in both years, price questionnaires were only administered in thesecond year for three of the first year clusters and only in the first year for 43 clusters. Use ofthe community and price variables collected in the first year requires the assumption that pricesand community characteristics did not change substantially between the two surveys.
3. The procedure for matching households to community questionnaires in clusters with morethan one community is slightly complicated. In sampling clusters that contained more than onecommunity, multiple community and price questionnaires exist and the communityquestionnaires are often lacking the list of households necessary to make an easy link. Thisproblem is not expected to have an important impact on the quality of the data. It means thatlinking households to the communities requires some thought. The linking procedure isdescribed in Section 5.4 and linking files constructed by World Bank researchers are available.
4. The procedure for matching individuals and households in the panel data did not work well. This issue is discussed in greater detail in Section 5.3 below. Because of difficulty in matchinghouseholds and because of the high degree of change within households, the number ofindividuals that can be linked in both years is about half of what was intended.
5. In the special Education module implemented in half of the 1988-89 clusters, some studentsin the households could not be matched to the schools they attended and so only characteristicsof nearest schools (not necessarily the school attended) are available. Raven, reading and mathtest scores are only available for 50%, 22% and 32% of the individuals in the households,respectively. The cognitive skills tests were only administered to individuals between the agesof 9 and 55 and, of them, 81% took the Raven test. The reading and math tests were furtherrestricted to individuals with at least three years of schooling.
Some specific corrections that have been identified are listed in Appendix H. Most concern theSection 13 (Fertility) and the health facility data.
5.2 Linking Parts of the Household Survey
As presented in Section 2 and Appendix B, the household survey data is in 77 separate datasets. Each cluster has a four digit id number: CLUST = Year*1000 + cluster number where Year =1for 1987-88 and Year=2 for 1988-89. Each household has a two digit number for identification withinthe cluster and a unique six digit id number constructed: HID = CLUST*100 + Household ID. Each
19
individual has a two digit id code within the household and a unique eight digit person id can beconstructed: PID = HID*100 + personal id.
A child in the household can be linked to the parents, if the parents are part of the householdthrough the id codes in Section 01B. For parents who are not in the household, information iscollected on the parent's schooling, main occupation and whether he/she is currently alive are known. Household members can be linked with their non-resident children through the id codes in Section01C. The woman chosen for the fertility section can be linked to the children living with her in thehousehold through the id codes in Section 13A1B. There is no code to link the children in her fertilityroster who are not living in the household with the non-resident children in Section 01C, though mostcan be linked by comparing age, sex and mother's id.
5.3 Linking 1987-88 and 1988-89 Data Sets
Cluster numbers in the 1987-88 range from 1 to 200. In the second year almost all resurveyedclusters were renumbered with cluster numbers ranging from 1 to 798. To insure that the clusternumber is unique, the four digit code with the year as the first digit should be used. The complete listof cluster names with the year 1 and year 2 cluster numbers is listed in Appendix I and is available ondiskette in CLYR1YR2 as listed in Appendix B. It is very important to use this list for linkingpurposes. For example, cluster 1 in the first year does correspond to cluster 1 in the second year butcluster 25 in year one corresponds to cluster 97 (not 25) in year two even though there is a cluster 25in the second year. The renumbering appears to have been done for purposes of more internalconsistency with a broader sampling frame within the Ghana Statistical Service. The confusion causedshould be minimal if the researcher makes use of the list in Appendix I.
The ability to use the GLSS data as a panel data set is severely limited. In principle, datashould be available to construct a panel data set of roughly half of the clusters /households/individualsbecause the same household should have been interviewed in each year. However, three factors makethis extremely difficult. The first is that though households should retain the same number in both yearsthis often was not the case. For the clusters resurveyed in 1988-89, there is no indication on the 1988-89 questionnaire of whether or not the household participated in the 1987-88 round. Severalhousehold numbers used in the first year were not used in the second year. It is not clear if thehouseholds were not found, not interviewed, or re-interviewed with different numbers.
The second difficulty is that within households, personal id codes were not maintained. Thehousehold head should be listed first in each case but even this does not guarantee that the twoindividuals are the same person. The severity of the second difficulty is confounded by the third factor,intra-household mobility. Ghanaian households, the people that eat meals regularly together, are veryfluid entities. Nieces and nephews often travel to attend school and for other reasons.3 Even adwelling that contained the same household may not contain the same members. 3The survey itself provides evidence of this. Of the individuals under 20, 58% have fathers livingelsewhere and 43% have mothers living elsewhere and the non-resident children roster contains 3504children of household members who are living elsewhere and who are less than 21 years of age.
20
In spite of these difficulties, a surprisingly large number of individuals have been linked for useas a panel data set. Individuals and households must be matched almost manually by age and sex. Aresearcher at the World Bank compared respondent names (no longer available in the data sets ) withinclusters to link households and then linked individuals by comparing age and sex. PANELC containsfirst and second year household and personal id codes of 3,370 individuals in 741 households that weresurveyed in both years. The entire list of individual names were not available for this exercise. It ispossible that household by household comparison would yield more matches.
Table 3. Frequency of Time Lapsed Between First Year and Second Year Interviews
Months Number of Clusters Months Number of Clusters2 1 13 93 2 14 34 1 15 85 4 16 46 4 17 77 0 18 78 6 19 09 5 20 3
10 9 21 011 5 22 012 4 23 1
There is an additional problem, however. Because of a lapse of supervision of the survey, thetiming of the first year interviews was not carried forward into the second year and the panel nature ofthe data is thus compromised further. The panel observations actually measure anywhere from twomonths to twenty-three months of change. Table 3 presents the frequency of the interval betweeninterviews for resurveyed clusters. Half of the clusters were resurveyed within 9-15 months of the firstsurvey, and 80% within 8-18 months.
5.4 Linking the Household to the Community Data
Linking the household to the community data can be done, but it is not straightforward. Community questionnaires were not completed for urban areas, so some clusters will have nocommunity questionnaire. Of the 57 non-urban resurveyed (panel) clusters, data from first yearcommunity questionnaire for 21 clusters were copied into the second year data set. For the rest of theresurveyed clusters, in order to link a second year household with the community data, first the secondyear cluster number must be linked to the first year cluster number and then to the appropriatecommunity data. Finally, many sampling clusters contain more than one distinct community. For theseclusters a community questionnaire was completed for each community. Each communityquestionnaire contains a list of ids of the households in that cluster that correspond to that community. So that other researchers need not duplicate the tedious linking process, the World Bank provides theresults of its linking file, HHCOMM that contains a list of household id, the cluster number, thecommunity number (see Section 6.6 below).

21
5.5 Linking to the Price Data
Each record in the price data set contains the price and quantity of one item purchased from upto three vendors in the cluster. Price data were to be collected at markets in each locality in eachcluster. However, it was found to be the case that even where there was more than one locality, allhouseholds did most of their marketing in one market. In fact, in several cases, one market servedmore than one cluster. And regional variation in prices was found to be insignificant so it is possiblethat the inability to completely account for the very local variation does not represent an importantweakness. (Glewwe and Twum-Baah, 1991.)
For the clusters included in both years, data for three first year clusters must be retrieved fromthe second year data set and data for 43 second year clusters are only available in the first year data set. Appendix E indicates the assumption of price stability over time is not justified. If relative pricesbetween regions remain constant then first year prices can be adjusted. No price data are available for28 of the total 266 clusters.
5.6 Linking the Household to the Health Facility and Pharmacy Data
Each facility in the health facility survey has a unique four digit id that is built in the followingfashion: ID = REGION*1000 + TEAM*100 + FACILITY. Appendix I provides a complete list ofclusters with the facility id for the nearest public health facility, the nearest health facility and the nearesthealth facility offering family planning and the distance to each facility. The corresponding data set,CLHLTH, can be used to link the individual or household data to the facilities. Cluster 17 in thehealth facility data corresponds to cluster 5 in the household data and cluster 434 in the healthdata corresponds to cluster 454 in the household survey. These corrections have been taken intoaccount in this list. All other cluster numbers in the health facilities data set correspond to the secondyear cluster numbers. All surveyed health facilities are listed in Appendix J.
For pharmacies, this link is very straightforward. For every regular cluster in the second yearsurvey there is one pharmacy in the pharmacy data set. Using the data set DRUG, create a facility idcode: DRUG_ID = REGION * 1000 + TEAM * 100 + FACILITY.
5.7 Linking the Households to the School Data
As described in Section 2, the local primary or middle school attended by each child, (currentlyor in the last five years) is noted in Section 17A of the household questionnaire. In Section 17C, eachhousehold was asked to identify the nearest primary and middle schools (up to three each). A masterlist of schools was kept for each cluster and each school that was mentioned in either Section 17A or17C was given a school code and then an attempt was made to administer the school questionnaire ateach of those schools. The cluster number together with the code in Section 17C or 17A will uniquelyidentify the school in the data set PSCHOOL or MSCHOOL.
22
6. Constructed Data Sets
Researchers at the World Bank have created several data sets that combine various sections ofthe questionnaires in ways they have found to be especially useful. To increase the facility with whichthe data can be used by other researchers, these data sets are being made available with the raw datasets. These constructed data sets are made available for general use with the understanding that thedescription below is the only documentation that will be provided. Any manipulation of the datarequires assumptions to be made and, to the extent possible, those assumptions are explained below. Except where noted, the data sets have been created using only the raw data sets. A researcher couldconstruct similar data sets incorporating different assumptions.
6.1 Aggregate Expenditure, EXPEND
The data sets EXPEND, one for each year, contain variables for all household expenditureitems in the household questionnaire. All expenditures are in cedis, the Ghanaian currency. The 1988cedi exchange rate was 188 cedis = 1USD. All expenditure has been calculated on an annual basis. Noprice inflation adjustment has been made to any of the variables. Annual price inflation was 31%during the period of the 1987-88 survey and 24% during the 1988-89 survey. The national Ghanaianprice index provided by the Ghana Statistical Service is in Appendix E. The variables in the EXPENDdata set are:
SIZE is the number of household members (non-member individuals are not counted) listed in Section 01A forcalculating per capita values.
PFOOD is the total amount spent on all food items in the last year calculated from the answers to questions 4-6in Section 12A (not from the two week estimate).
HPFOOD is the value of home produced food consumed in the last year calculated from Section 12B.
FOODEXP is the sum of PFOOD and HPFOOD.
RENTYR is the value in cash and kind of annual rent paid for the household calculated from Section 02B. It isonly available for renters.
MORTYR is the annual value of the mortgage payment for all owner-occupied housing.
RENTVYR is the owner's estimate of the annual rental value of the dwelling.
IMPRENT is calculated for all households based on physical characteristics and location of the dwelling (type ofwall, floor, roof, window, number of rooms, type of residence, type of latrine, rural, semi-urban, coastal,savannah and per capita expenditure from Sections 02A, 02B and 08) using coefficients from a regression of thelog of RENTVYR of owner-occupied dwellings on those same characteristics.
WATERYR is the annual payments for water adjusted down for the fraction of water sold.
GARBYR is the annual payment for garbage disposal.

23
ELECYR is the annual payment for electricity.
EXPSCHL sums the annual school-related expenses (A,C,E,F and G in Section 03II) for all household members.
EXP101-EXP109 are calculated by multiplying the two week amounts in Section 11A by 26. (Not available forGLSS2.)
NFOODA is the sum of items 102 to 109 (lottery tickets are excluded).
EXP115-EXP145 are the annual expenditure estimates provided in Section 11B. (Not available for GLSS2.)
NFOODB is the sum of EXP115 to EXP144. Losses, EXP145, are not included.
EXPEMPL is the value of employee benefits from Section 05B for all household members.
DURSERV is an estimate of the annual service value of the durable goods owned by the household reported inSection 11C. It is calculated from the current value of each durable good using depreciation rates that arecalculated from the entire sample. The values of all goods owned are then summed for each household.
TOTALEXP is PFOOD + HPFOOD + NFOODA + NFOODB + WATERYR + GARBYR + ELECYR + EXPSCHL + EXPEMPL + IMPRENT + DURSERV.
MO2 and YR2 are the month and year of the second interview.
Consumption and expenditure aggregates were also created by Jeffrey Round and AndrewMcKay at University of Warwick in England. These variables are not currently available from theWorld Bank.
6.2 Price Data, PRICE
Each record in PRICE corresponds to one item in one cluster. The prices, quantities, and dateof interview are recorded from the questionnaire. Unit prices and an average real price have beencalculated. The appropriate national monthly price index and the location of the cluster have beenincluded.
CLUST is the three digit cluster number.
ITEMNO is the item number as listed on the questionnaire.
MOINT, YRINT are the month and year of the price interview, they may not correspond to the date of thehousehold interview.
PRICE1, PRICE2, PRICE3 are the prices charged for the item.
QUAN1, QUAN2, QUAN3 are the quantities that correspond to the three prices.
24
PRICE1U, PRICE2U, PRICE3U is the unit price= PRICE1/QUAN1, PRICE2/QUAN2,...
DEFL is the price index (Appendix E) that corresponds to the month and year of interview.
PRICE is the real price, the straight average of PRICE1U, PRICE2U, and PRICE3U divided by DEFL.
TYPRES is the location of the cluster (1=Accra/Tema 2=Other Urban Coast 3=Rural Coast 4=Urban Forest5=Rural Forest 6=Urban Savannah 7=Rural Savannah).
6.3 Household and Household Head Characteristics, HEAD
LANGHD is the primary language of the household head from Section 00A.
RELIGION of the household head from Section 00A
AGEHD, SEXHD, NATHD and GRADEHD are from sections 01A and 03I.
EMPLOYER (1=government 2=state owned 3=private 4=self employed 5=unemployed) is the type ofemployment in the last year derived from all parts of Section 05.
EMPST (1=too old/retired 2=unemployed 3=other reasons for not working 4=cocoa farmer 5=other farmer6=sales/service 7=white collar 8=ind/prod/craft) is derived from Sections 05 and 09B.
DWATER, LIGHT and TOILET report the source of drinking water and light, and type of toilet from Section02B.
6.4 Panel Data Set, PANELC
PANELC contains the id codes for the individuals linked by researchers at the World Bank asdescribed in Section 5.3 above. It contains 3,370 individuals.
HID1 is the six digit household id code from 1987-88.
PID1 is the two digit personal id code from 1987-88.
HID2 is the six digit household id code from 1988-89.
PID2 is the two digit personal id code from 1988-89.
6.5 Height for Age, Weight for Age and Height for Weight, ZSCORE
ZSCORE contains Z-scores derived from the anthropometric measures from sections 16A and16B. When measurements were made in both rounds and did not match and when age or sex in roundone and round two did not match, a judgement was made as to which to use. A Z-score was thencalculated by comparing the height and weight of the individual to averages for US children using the

25
CASP software. All children under 10 years are included in the ZSCORE data set for 1987-88. Thedata set has only been constructed for the children under age 10 in the half of the 1988-89 sample thatparticipated in the school and cognitive skill test components, ZSCOREH. Anthropometricmeasurements for all household members are available in Sections 16A and 16B.
6.6 Household to Community Link, HHCOMM
HHCOMM contains the six digit household id, HID, the corresponding first or second yearfour digit cluster number, CLUST, and the number of the community within the cluster, NO_CLST. Household data can be linked to the community data through HID in the household data sets andCLUST and NO_CLST in the COMM data sets. The cluster number in the COMM data sets is onlythe three digit cluster number. In order to perform the merge, the four digit cluster number has to becreated (using year 1 or 2 as the first digit).
As with the other constructed data sets, this is provided only for the researcher's convenience,it is possible to do the linking without it. Also, as with other constructed data sets, this one containscertain assumptions that the researcher may wish to resolve differently. In this case, where there wasmore than one community questionnaire but the list of household ids was missing, all households in thecluster were assigned to the first community. The same decision was made where households in thesecond year were not contained in the list of the first year households, all were assigned to the firstcommunity.
6.7 1987-88 to 1988-89 Cluster Link, CLYR1YR2
CLYR1YR2 contains CLYR1 and CLYR2, two four digit cluster numbers. When the clusterwas resurveyed, the two numbers are contained in the same record.
6.8 Cluster to Health Facility Link, CLHLTH
A unique id code for each facility can be created in the health data set: ID=REGION*1000+TEAM*100 + FACILITY. The data set CLHLTH contains, for each cluster the ID of the nearesthealth facility, the nearest health facility offering family planning and the nearest public health facility. Some facilities are the nearest facility for more than one cluster. CLHLTH also contains the distanceto each facility. The DRUG id and distance correspond to the pharmacies and drug stores in theDRUG data set.
CLUST is the four digit second year cluster number.
FACID is the four digit id of the nearest health facility.
FACMI is the distance in miles to the nearest health facility.
FPID is the four digit id of the nearest health facility offering family planning.
26
FPMI is the distance in miles to the nearest health facility offering family planning services.
IDPUB is the four digit id of the nearest public health facility.
PUBMI is the distance in miles to the nearest public health facility offering family planning services.
DRUG is the four digit id of the nearest drug store or pharmacy.
DRMI is the distance in miles to the nearest drug store or pharmacy.
7. Summary
This document is designed to provide an overview of the data available from the Ghana LivingStandards Survey and to set out the procedures for obtaining the data. All the basic knowledgerequired to use the data is contained in this document and the questionnaires. The training manuals andadditional papers are also available. Inquiries may be directed to the World Bank at the address listedin Appendix A.
27
List of Appendices
Appendix A. How to Obtain the GLSS dataAppendix B. List of Data Sets AvailableAppendix C. List of Related Documents AvailableAppendix D. List of Reports and Papers using the GLSS dataAppendix E. Regional and Monthly Price IndicesAppendix F. Translation of School CodesAppendix G. Codes not in QuestionnaireAppendix H. Corrections to the DataAppendix I. Cluster Names, Numbers, Region, Health FacilitiesAppendix J. List of Health Facilities
28
Appendix AHow to Obtain the GLSS Data
The GLSS data are the property of the Ghanaian government. Permission to use the GLSS datamust first be obtained from the Ghanaian Statistical Service. The request should be submitted to:
Daasebre Dr. Oti BoatengGhana Statistical Service
Ministry of FinanceP.O. Box 1098
AccraGHANA
tel: 233-21-663-578fax:233-21-667-069
The request should include a two page letter explaining the proposed research, the specific sectionsof the data requested, the reason for using the GLSS, and the value of the research to the government andpeople of Ghana.
After permission has been received requests for the data sets should be directed to:
Living Standards Measurement StudyPoverty and Human ResourcesDevelopment Research Group
Attn: LSMS Database ManagerThe World Bank
1818 H Street, N.W.Washington, DC 20433
USAfax: (202) 522-1153
The letter should include a photocopy of the letter of permission from the Ghana Statistical Serviceand a copy of the research proposal.
There is a nominal fee associated with the data, which are on 3 1/2" diskette, in SAS (version 5.0)portable, STATA (version 2.1), or ASCII files.
Once received, the data cannot be passed on to a third party for any reason or used for otherresearch. Other researchers must contact the Ghana Statistical Service and the World Bank directly foraccess to these data. Any violation of this policy will result in the denial of future access to World BankLSMS data. Researchers are also required to send copies of all reports and documents resulting fromresearch that uses the data to the Ghana Statistical Service and the Poverty and Human Resources Divisionof the World Bank.
More information is available on the LSMS Web site at:
http://www.worldbank.org/lsms/lsmshome.html
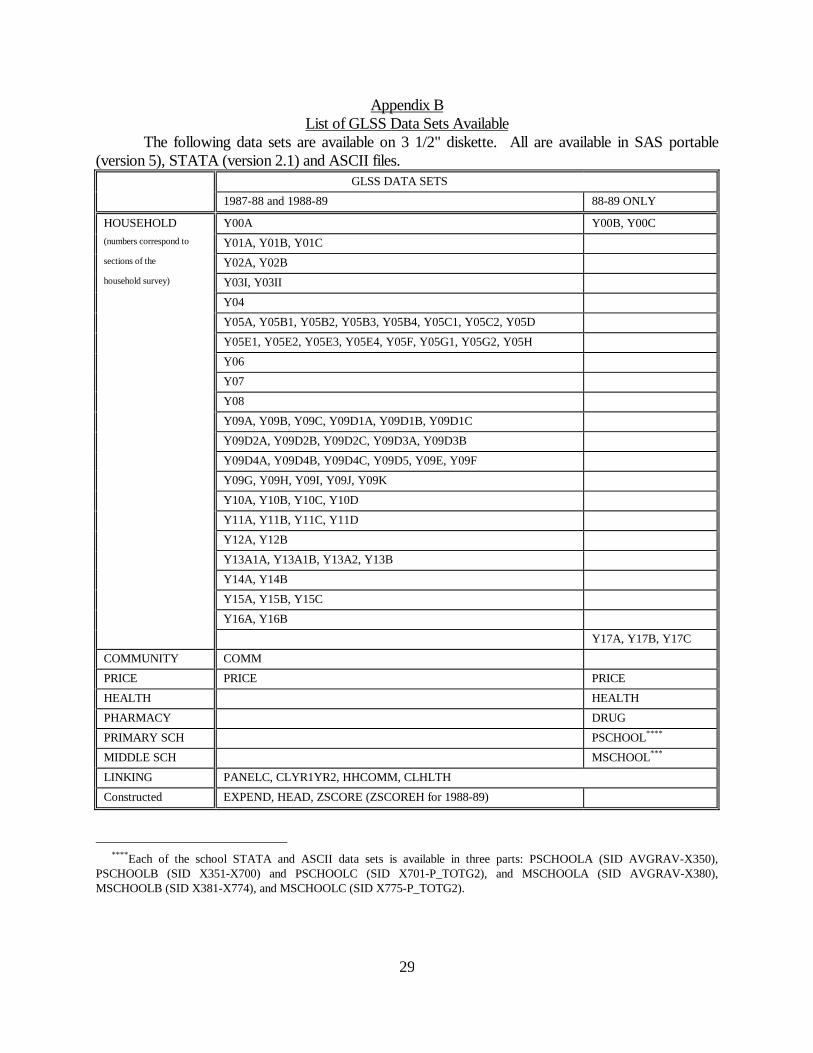
29
Appendix BList of GLSS Data Sets Available
The following data sets are available on 3 1/2" diskette. All are available in SAS portable(version 5), STATA (version 2.1) and ASCII files.
GLSS DATA SETS
1987-88 and 1988-89 88-89 ONLY
HOUSEHOLD Y00A Y00B, Y00C(numbers correspond to Y01A, Y01B, Y01Csections of the Y02A, Y02Bhousehold survey) Y03I, Y03II
Y04
Y05A, Y05B1, Y05B2, Y05B3, Y05B4, Y05C1, Y05C2, Y05D
Y05E1, Y05E2, Y05E3, Y05E4, Y05F, Y05G1, Y05G2, Y05H
Y06
Y07
Y08
Y09A, Y09B, Y09C, Y09D1A, Y09D1B, Y09D1C
Y09D2A, Y09D2B, Y09D2C, Y09D3A, Y09D3B
Y09D4A, Y09D4B, Y09D4C, Y09D5, Y09E, Y09F
Y09G, Y09H, Y09I, Y09J, Y09K
Y10A, Y10B, Y10C, Y10D
Y11A, Y11B, Y11C, Y11D
Y12A, Y12B
Y13A1A, Y13A1B, Y13A2, Y13B
Y14A, Y14B
Y15A, Y15B, Y15C
Y16A, Y16B
Y17A, Y17B, Y17C
COMMUNITY COMM
PRICE PRICE PRICE
HEALTH HEALTH
PHARMACY DRUG
PRIMARY SCH PSCHOOL****
MIDDLE SCH MSCHOOL***
LINKING PANELC, CLYR1YR2, HHCOMM, CLHLTH
Constructed EXPEND, HEAD, ZSCORE (ZSCOREH for 1988-89)
****Each of the school STATA and ASCII data sets is available in three parts: PSCHOOLA (SID AVGRAV-X350),PSCHOOLB (SID X351-X700) and PSCHOOLC (SID X701-P_TOTG2), and MSCHOOLA (SID AVGRAV-X380),MSCHOOLB (SID X381-X774), and MSCHOOLC (SID X775-P_TOTG2).

30
Appendix C
List of Related Documents
The following documents can be obtained from the World Bank, Poverty and HumanResources Division, Policy Research Department (PRD/PH), at a cost of five cents per page forphotocopying.
A. Questionnaires (free of charge)
1. Household Questionnaire 77 pages 2. Community Questionnaire 21 pages3. Price Questionnaire 4 pages3. Questionnaire for Health and Family Planning Services 19 pages4. Questionnaire for Drugstores, Pharmacies & Drug Vendors 10 pages5. Primary School Questionnaire 11 pages6. Middle/Junior Secondary School Questionnaire 11 pages7. Household Education Module 26 pages
B. Training Manuals
1. Supervisor's Instruction Manual 55 pages2. Interviewer's Instruction Manual 79 pages3. Anthropometrist's Instruction Manual 39 pages4. Data Entry Operator's Instruction Manual 40 pages5. Availability, Price and Quality of Health Care Survey: Protocol for Questionnaire Administrators 6 pages6. Education Module Supervisor's Instructions 5 pages
C. Other
1. Scott, Chris and Ben Amenuvegbe. October, 1986. "Ghana Living Standards Survey: Recommended Sample Design." 31 pages. Also available as LSMS Working Paper No.49.
2. Glewwe, Paul. "Schooling, Skills and the Returns to Government Investments inEducation: An Exploration Using Data from Ghana." LSMS Working Paper No. 76,March 1991. 56 pages
3. Glewwe, Paul and Hanan Jacoby, 1992. "Estimating the Determinants of CognitiveAchievement in Low Income Countries: The Case of Ghana." LSMS Working PaperNo. 91. 74 pages
4. Glewwe, Paul and Kwaku A. Twum-Baah. 1991. "The Distribution of Welfare inGhana, 1987-88." LSMS Working Paper No. 75, March, 1991. 94 pages
5. Listing of variable means and standard deviations 137 pages
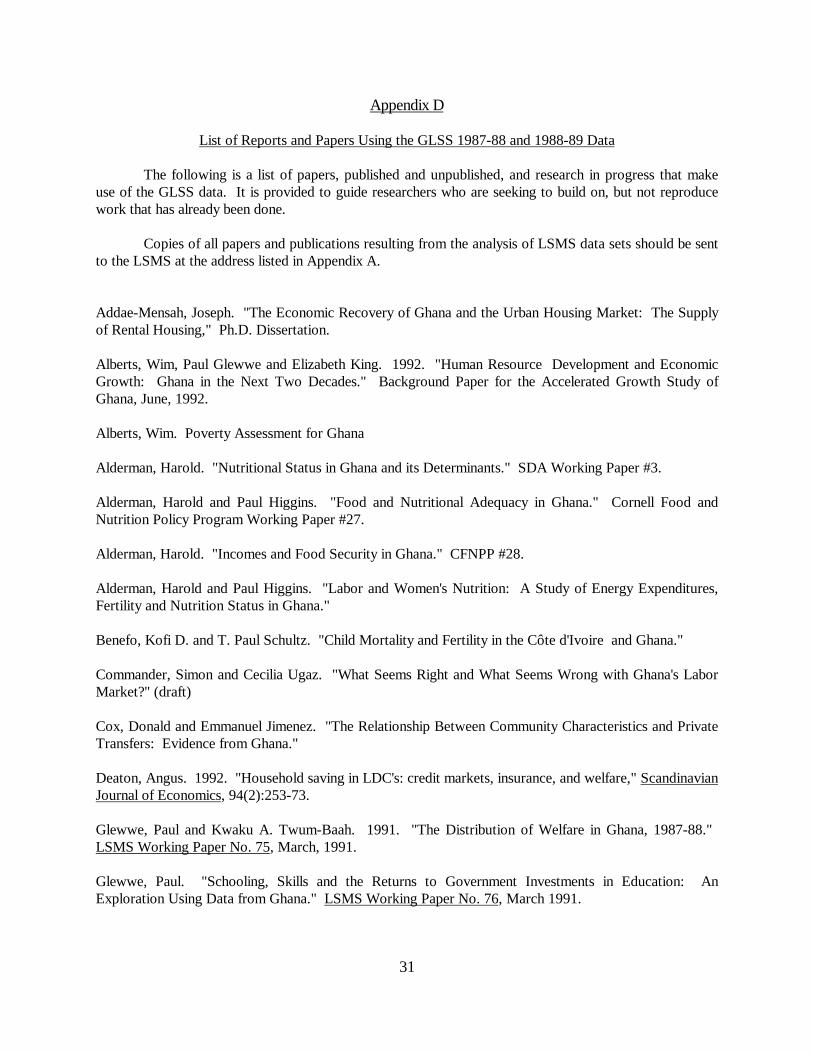
31
Appendix D
List of Reports and Papers Using the GLSS 1987-88 and 1988-89 Data
The following is a list of papers, published and unpublished, and research in progress that makeuse of the GLSS data. It is provided to guide researchers who are seeking to build on, but not reproducework that has already been done.
Copies of all papers and publications resulting from the analysis of LSMS data sets should be sentto the LSMS at the address listed in Appendix A.
Addae-Mensah, Joseph. "The Economic Recovery of Ghana and the Urban Housing Market: The Supplyof Rental Housing," Ph.D. Dissertation.
Alberts, Wim, Paul Glewwe and Elizabeth King. 1992. "Human Resource Development and EconomicGrowth: Ghana in the Next Two Decades." Background Paper for the Accelerated Growth Study ofGhana, June, 1992.
Alberts, Wim. Poverty Assessment for Ghana
Alderman, Harold. "Nutritional Status in Ghana and its Determinants." SDA Working Paper #3.
Alderman, Harold and Paul Higgins. "Food and Nutritional Adequacy in Ghana." Cornell Food andNutrition Policy Program Working Paper #27.
Alderman, Harold. "Incomes and Food Security in Ghana." CFNPP #28.
Alderman, Harold and Paul Higgins. "Labor and Women's Nutrition: A Study of Energy Expenditures,Fertility and Nutrition Status in Ghana."
Benefo, Kofi D. and T. Paul Schultz. "Child Mortality and Fertility in the Côte d'Ivoire and Ghana."
Commander, Simon and Cecilia Ugaz. "What Seems Right and What Seems Wrong with Ghana's LaborMarket?" (draft)
Cox, Donald and Emmanuel Jimenez. "The Relationship Between Community Characteristics and PrivateTransfers: Evidence from Ghana."
Deaton, Angus. 1992. "Household saving in LDC's: credit markets, insurance, and welfare," ScandinavianJournal of Economics, 94(2):253-73.
Glewwe, Paul and Kwaku A. Twum-Baah. 1991. "The Distribution of Welfare in Ghana, 1987-88." LSMS Working Paper No. 75, March, 1991.
Glewwe, Paul. "Schooling, Skills and the Returns to Government Investments in Education: AnExploration Using Data from Ghana." LSMS Working Paper No. 76, March 1991.
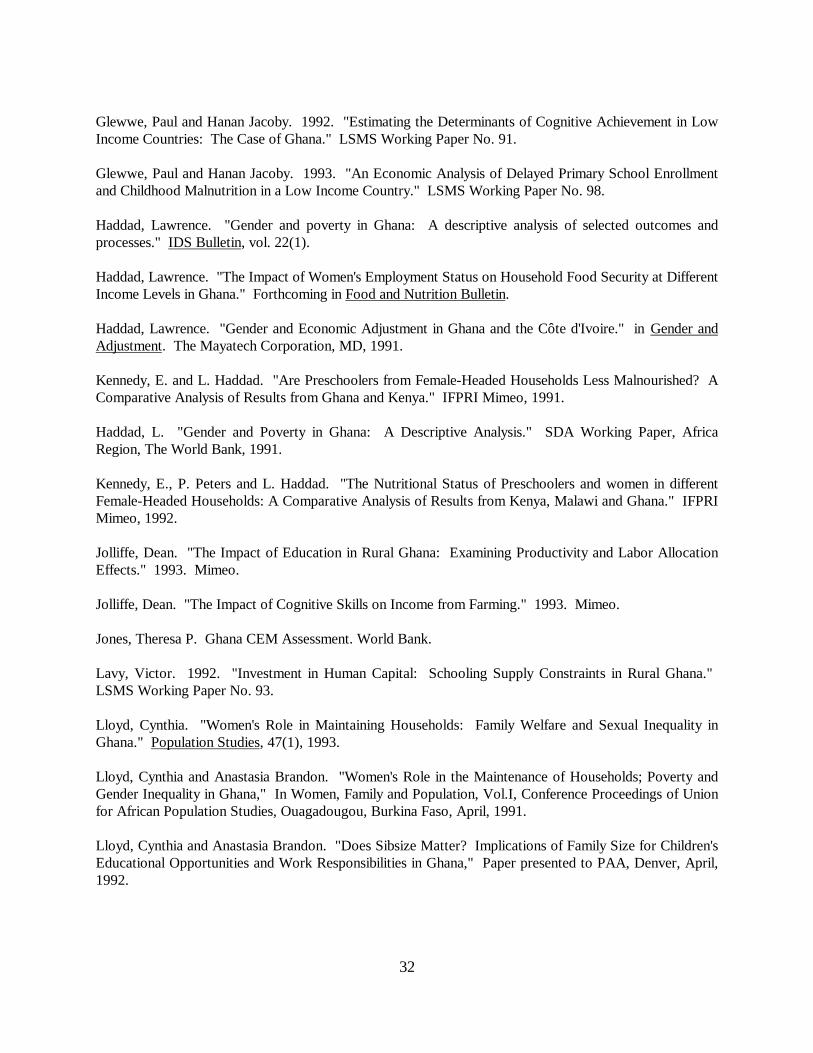
32
Glewwe, Paul and Hanan Jacoby. 1992. "Estimating the Determinants of Cognitive Achievement in LowIncome Countries: The Case of Ghana." LSMS Working Paper No. 91.
Glewwe, Paul and Hanan Jacoby. 1993. "An Economic Analysis of Delayed Primary School Enrollmentand Childhood Malnutrition in a Low Income Country." LSMS Working Paper No. 98.
Haddad, Lawrence. "Gender and poverty in Ghana: A descriptive analysis of selected outcomes andprocesses." IDS Bulletin, vol. 22(1).
Haddad, Lawrence. "The Impact of Women's Employment Status on Household Food Security at DifferentIncome Levels in Ghana." Forthcoming in Food and Nutrition Bulletin.
Haddad, Lawrence. "Gender and Economic Adjustment in Ghana and the Côte d'Ivoire." in Gender andAdjustment. The Mayatech Corporation, MD, 1991.
Kennedy, E. and L. Haddad. "Are Preschoolers from Female-Headed Households Less Malnourished? AComparative Analysis of Results from Ghana and Kenya." IFPRI Mimeo, 1991.
Haddad, L. "Gender and Poverty in Ghana: A Descriptive Analysis." SDA Working Paper, AfricaRegion, The World Bank, 1991.
Kennedy, E., P. Peters and L. Haddad. "The Nutritional Status of Preschoolers and women in differentFemale-Headed Households: A Comparative Analysis of Results from Kenya, Malawi and Ghana." IFPRIMimeo, 1992.
Jolliffe, Dean. "The Impact of Education in Rural Ghana: Examining Productivity and Labor AllocationEffects." 1993. Mimeo.
Jolliffe, Dean. "The Impact of Cognitive Skills on Income from Farming." 1993. Mimeo.
Jones, Theresa P. Ghana CEM Assessment. World Bank.
Lavy, Victor. 1992. "Investment in Human Capital: Schooling Supply Constraints in Rural Ghana." LSMS Working Paper No. 93.
Lloyd, Cynthia. "Women's Role in Maintaining Households: Family Welfare and Sexual Inequality inGhana." Population Studies, 47(1), 1993.
Lloyd, Cynthia and Anastasia Brandon. "Women's Role in the Maintenance of Households; Poverty andGender Inequality in Ghana," In Women, Family and Population, Vol.I, Conference Proceedings of Unionfor African Population Studies, Ouagadougou, Burkina Faso, April, 1991.
Lloyd, Cynthia and Anastasia Brandon. "Does Sibsize Matter? Implications of Family Size for Children'sEducational Opportunities and Work Responsibilities in Ghana," Paper presented to PAA, Denver, April,1992.
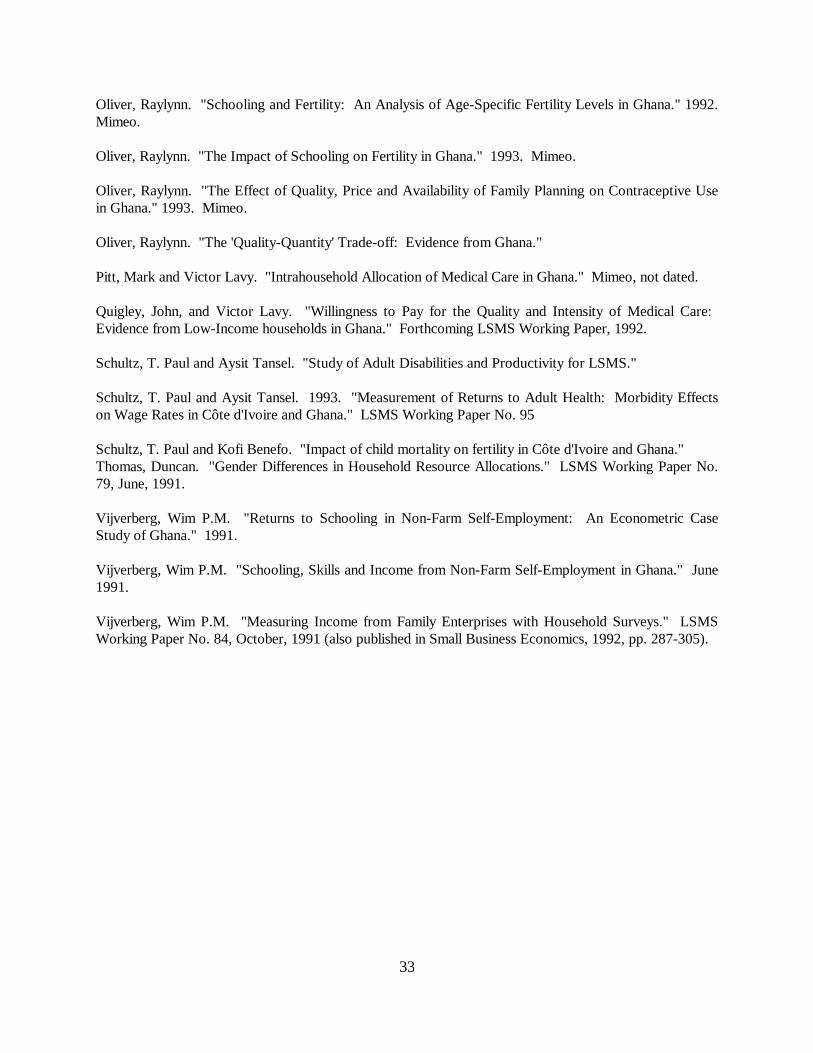
33
Oliver, Raylynn. "Schooling and Fertility: An Analysis of Age-Specific Fertility Levels in Ghana." 1992.Mimeo.
Oliver, Raylynn. "The Impact of Schooling on Fertility in Ghana." 1993. Mimeo.
Oliver, Raylynn. "The Effect of Quality, Price and Availability of Family Planning on Contraceptive Usein Ghana." 1993. Mimeo.
Oliver, Raylynn. "The 'Quality-Quantity' Trade-off: Evidence from Ghana."
Pitt, Mark and Victor Lavy. "Intrahousehold Allocation of Medical Care in Ghana." Mimeo, not dated.
Quigley, John, and Victor Lavy. "Willingness to Pay for the Quality and Intensity of Medical Care: Evidence from Low-Income households in Ghana." Forthcoming LSMS Working Paper, 1992.
Schultz, T. Paul and Aysit Tansel. "Study of Adult Disabilities and Productivity for LSMS."
Schultz, T. Paul and Aysit Tansel. 1993. "Measurement of Returns to Adult Health: Morbidity Effectson Wage Rates in Côte d'Ivoire and Ghana." LSMS Working Paper No. 95
Schultz, T. Paul and Kofi Benefo. "Impact of child mortality on fertility in Côte d'Ivoire and Ghana."Thomas, Duncan. "Gender Differences in Household Resource Allocations." LSMS Working Paper No.79, June, 1991.
Vijverberg, Wim P.M. "Returns to Schooling in Non-Farm Self-Employment: An Econometric CaseStudy of Ghana." 1991.
Vijverberg, Wim P.M. "Schooling, Skills and Income from Non-Farm Self-Employment in Ghana." June1991.
Vijverberg, Wim P.M. "Measuring Income from Family Enterprises with Household Surveys." LSMSWorking Paper No. 84, October, 1991 (also published in Small Business Economics, 1992, pp. 287-305).
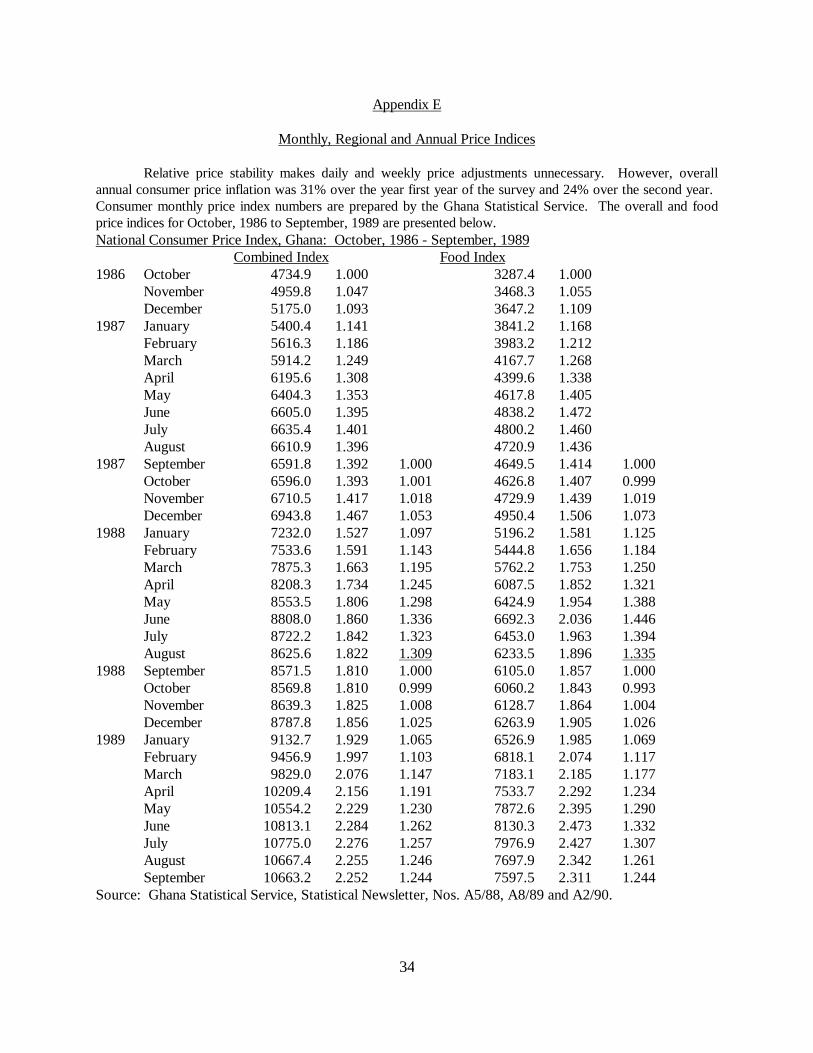
34
Appendix E
Monthly, Regional and Annual Price Indices
Relative price stability makes daily and weekly price adjustments unnecessary. However, overallannual consumer price inflation was 31% over the year first year of the survey and 24% over the second year. Consumer monthly price index numbers are prepared by the Ghana Statistical Service. The overall and foodprice indices for October, 1986 to September, 1989 are presented below.National Consumer Price Index, Ghana: October, 1986 - September, 1989 Combined Index Food Index1986 October 4734.9 1.000 3287.4 1.000
November 4959.8 1.047 3468.3 1.055December 5175.0 1.093 3647.2 1.109
1987 January 5400.4 1.141 3841.2 1.168February 5616.3 1.186 3983.2 1.212March 5914.2 1.249 4167.7 1.268April 6195.6 1.308 4399.6 1.338May 6404.3 1.353 4617.8 1.405June 6605.0 1.395 4838.2 1.472July 6635.4 1.401 4800.2 1.460August 6610.9 1.396 4720.9 1.436
1987 September 6591.8 1.392 1.000 4649.5 1.414 1.000October 6596.0 1.393 1.001 4626.8 1.407 0.999November 6710.5 1.417 1.018 4729.9 1.439 1.019December 6943.8 1.467 1.053 4950.4 1.506 1.073
1988 January 7232.0 1.527 1.097 5196.2 1.581 1.125February 7533.6 1.591 1.143 5444.8 1.656 1.184March 7875.3 1.663 1.195 5762.2 1.753 1.250April 8208.3 1.734 1.245 6087.5 1.852 1.321May 8553.5 1.806 1.298 6424.9 1.954 1.388June 8808.0 1.860 1.336 6692.3 2.036 1.446July 8722.2 1.842 1.323 6453.0 1.963 1.394August 8625.6 1.822 1.309 6233.5 1.896 1.335
1988 September 8571.5 1.810 1.000 6105.0 1.857 1.000October 8569.8 1.810 0.999 6060.2 1.843 0.993November 8639.3 1.825 1.008 6128.7 1.864 1.004December 8787.8 1.856 1.025 6263.9 1.905 1.026
1989 January 9132.7 1.929 1.065 6526.9 1.985 1.069February 9456.9 1.997 1.103 6818.1 2.074 1.117March 9829.0 2.076 1.147 7183.1 2.185 1.177April 10209.4 2.156 1.191 7533.7 2.292 1.234May 10554.2 2.229 1.230 7872.6 2.395 1.290June 10813.1 2.284 1.262 8130.3 2.473 1.332July 10775.0 2.276 1.257 7976.9 2.427 1.307August 10667.4 2.255 1.246 7697.9 2.342 1.261September 10663.2 2.252 1.244 7597.5 2.311 1.244
Source: Ghana Statistical Service, Statistical Newsletter, Nos. A5/88, A8/89 and A2/90.
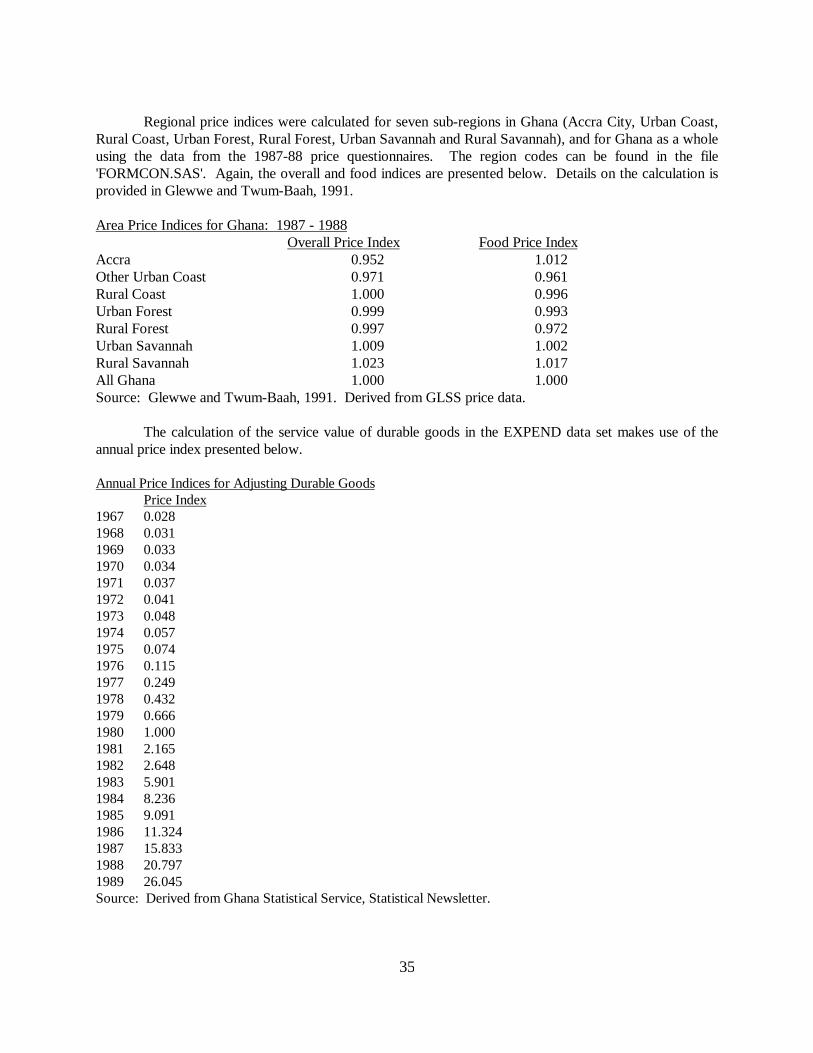
35
Regional price indices were calculated for seven sub-regions in Ghana (Accra City, Urban Coast,Rural Coast, Urban Forest, Rural Forest, Urban Savannah and Rural Savannah), and for Ghana as a wholeusing the data from the 1987-88 price questionnaires. The region codes can be found in the file'FORMCON.SAS'. Again, the overall and food indices are presented below. Details on the calculation isprovided in Glewwe and Twum-Baah, 1991.
Area Price Indices for Ghana: 1987 - 1988Overall Price Index Food Price Index
Accra 0.952 1.012Other Urban Coast 0.971 0.961Rural Coast 1.000 0.996Urban Forest 0.999 0.993Rural Forest 0.997 0.972Urban Savannah 1.009 1.002Rural Savannah 1.023 1.017All Ghana 1.000 1.000Source: Glewwe and Twum-Baah, 1991. Derived from GLSS price data.
The calculation of the service value of durable goods in the EXPEND data set makes use of theannual price index presented below.
Annual Price Indices for Adjusting Durable GoodsPrice Index
1967 0.0281968 0.0311969 0.0331970 0.0341971 0.0371972 0.0411973 0.0481974 0.0571975 0.0741976 0.1151977 0.2491978 0.4321979 0.6661980 1.0001981 2.1651982 2.6481983 5.9011984 8.2361985 9.0911986 11.3241987 15.8331988 20.7971989 26.045Source: Derived from Ghana Statistical Service, Statistical Newsletter.
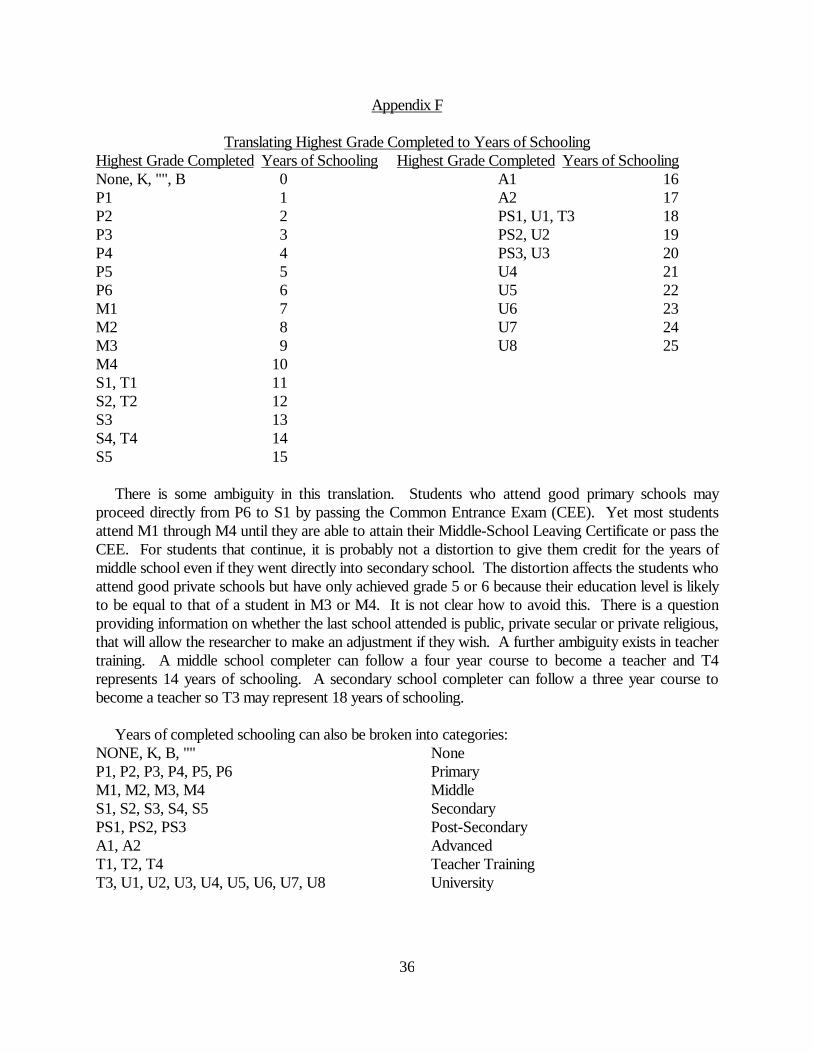
36
Appendix F
Translating Highest Grade Completed to Years of SchoolingHighest Grade Completed Years of Schooling Highest Grade Completed Years of SchoolingNone, K, "", B 0 A1 16P1 1 A2 17P2 2 PS1, U1, T3 18P3 3 PS2, U2 19P4 4 PS3, U3 20P5 5 U4 21P6 6 U5 22M1 7 U6 23M2 8 U7 24M3 9 U8 25M4 10S1, T1 11S2, T2 12S3 13S4, T4 14S5 15
There is some ambiguity in this translation. Students who attend good primary schools mayproceed directly from P6 to S1 by passing the Common Entrance Exam (CEE). Yet most studentsattend M1 through M4 until they are able to attain their Middle-School Leaving Certificate or pass theCEE. For students that continue, it is probably not a distortion to give them credit for the years ofmiddle school even if they went directly into secondary school. The distortion affects the students whoattend good private schools but have only achieved grade 5 or 6 because their education level is likelyto be equal to that of a student in M3 or M4. It is not clear how to avoid this. There is a questionproviding information on whether the last school attended is public, private secular or private religious,that will allow the researcher to make an adjustment if they wish. A further ambiguity exists in teachertraining. A middle school completer can follow a four year course to become a teacher and T4represents 14 years of schooling. A secondary school completer can follow a three year course tobecome a teacher so T3 may represent 18 years of schooling.
Years of completed schooling can also be broken into categories:NONE, K, B, "" NoneP1, P2, P3, P4, P5, P6 PrimaryM1, M2, M3, M4 MiddleS1, S2, S3, S4, S5 SecondaryPS1, PS2, PS3 Post-SecondaryA1, A2 AdvancedT1, T2, T4 Teacher TrainingT3, U1, U2, U3, U4, U5, U6, U7, U8 University

37
Appendix G
Codes Not in Questionnaire
1. Occupation: International Standard Classification of Occupations
0-1 Physical Scientists and Related Technicians0-2/0-3 Architects, Engineers and Related Technicians0-4 Aircraft and Ship's Officers0-5 Life Scientists and Related Technicians0-6 Medical, Dental, Veterinary and Related Workers0-7 Professional Nurses0-8 Statisticians, Mathematicians, Systems Analysts, Related Technicians0-9 Economists
1-1 Accountants1-2 Jurists (e.g. Lawyers, Judges)1-3 Teachers1-4 Workers in Religion1-5 Authors, Journalists and Related Writers1-6 Sculptors, Painters, Photographers and Related Creative Artists1-7 Composers and Performing Artists1-8 Athletes, Sportsmen and Related Workers1-9 Professional, Technical and Related Workers not elsewhere classified
2-0 Legislative Officials and Government Administrators2-1 Managers3-0 Clerical and Related Workers3-1 Government Executive Officials3-2 Stenographers, Typists, and Card and Tape-Punch Machine Operators3-3 Book-keepers, Cashiers and Related Workers3-4 Computing Machine Operators3-5 Transport and Communications Supervisors3-6 Transport Conductors3-7 Mail Distribution Clerks3-8 Telephone and Telegraph Operators3-9 Clerical and Related Workers Not Elsewhere Classified
4-0 Managers (wholesale and Retail Trade)4-1 Working Proprietors (Wholesale and Retail Trade)4-2 Sales Supervisors and Buyers4-3 Technical Salesmen, Commercial Travellers and Manufactures' Agents4-4 Insurance, Real Estate Securities, Business Services, Salesmen, Auctioneers4-5 Salesmen, Shop Assistants and Related Workers4-9 Sales Workers Not Elsewhere Classified
5-0 Managers (Catering, Lodging Services)5-1 Working Proprietors (Catering and Lodging Services)5-2 Housekeeping and Related Service Supervisors5-3 Cooks, Waiters, Bartenders and Related workers5-4 Maids and Related Housekeeping Service Workers Not Elsewhere Classified5-5 Building Caretakers, Charworkers, Cleaners and Related Workers5-6 Launderers, Dry-Cleaners and Pressers5-7 Hairdressers, Barbers, Beauticians and Related Workers5-8 Protective Service Workers5-9 Service Workers Not Elsewhere Classified
6-0 Farm Managers and Supervisors6-1 Farmers6-2 Agricultural and Animal Husbandry Workers6-3 Forestry Workers6-4 Fishermen, Hunters and Related Workers
7-0 Production Supervisors and General Foremen7-1 Miners, Quarrymen, Well Drillers and Related Workers7-2 Metal Processors7-3 Wood Preparation Workers and Paper Makers7-4 Chemical Processors and Related Workers7-5 Spinners, Weavers, Knitters Dyers and Related Workers7-6 Tanners, Fellmongers and Pelt Dressers7-7 Food and Beverage Processors7-8 Tobacco Preparers and Tobacco Products Makers7-9 Tailors, Dressmakers, Sewers, Upholsterers and Related Workers
8-0 Shoemakers and Leather Goods Makers8-1 Cabinetmakers and Related Wood Workers8-2 Stone Carvers and Stone Cutters8-3 Blacksmith, Toolmakers and Machine Tool Operators8-4 Machinery Fitters, Machine Assemblers and Precision-Instrument Makers
(except Electrical)8-5 Electrical Fitters and Related Electrical and Electronics Workers8-6 Broadcasting Station and Sound-Equipment Operators and Cinema
Projectionists8-7 Plumbers, Welders, Sheet-Metal and Structural Metal Preparers and Erectors8-8 Jewelry and Precious Metal Workers8-9 Glass Formers, Potters and Related Workers
9-0 Rubber and Plastics Products Makers9-1 Paper and Paperboard Products Makers9-2 Printers and Related Workers9-3 Painters9-4 Production and Related Workers Not Elsewhere Classified9-5 Bricklayers, Carpenters and Other Construction Workers9-6 Stationary Engine and Related Equipment Operators9-7 Material Handling and Related Equipment Operators, Dockers and Freight
Handlers9-8 Transport Equipment Operators9-9 Labourers Not Elsewhere Classified
X Workers Not Classifiable by OccupationX-1 New Workers Seeking EmploymentX-2 Workers Reporting Occupation Unidentifiable or Inadequately DescribedX-3 Workers Not Reporting any Occupation

38
2. Type of Industry: International Standard Industrial Classification of All Economic Activities
Agriculture, Hunting, Forestry and Fishing111 Agriculture and livestock production112 Agricultural services113 Hunting, trapping and game121 Forestry122 Logging130 Fishing
Mining and Quarrying210 Coal Mining220 Crude Petroleum and Natural Gas Production230 Metal Ore Mining290 Other Mining
Manufacturing311 Food Manufacturers313 Beverage industries314 Tobacco Manufacturers321 Manuf. of Textiles322 Manuf. of wearing apparel, except footwear323 Manuf. of leather and products of leather, except footwear and wearing
apparel324 Manuf. of footwear, except vulcanized or mould rubber or plastic footwear331 Manuf. of wood and cork products, except furniture332 Manuf. of furniture and fixtures except primarily of metal341 Manuf. of paper and paper products342 Printing, publishing and allied industries351 Manuf. of basic industrial chemicals, including fertilizers352 Manuf. of other chemical products353 Petroleum refineries354 Manuf. of miscellaneous products of petroleum and coal355 Manuf. of rubber products356 Manuf. of plastic products not elsewhere classified361 Manuf. of pottery, china and earthenware362 Manuf. of glass and glass products369 Manuf. of other non-metallic mineral products371 Iron and steel basic industries372 Non-ferrous metal basic industries381 Manuf. of fabricated metal products, except machinery and equipment382 Manuf. of machinery except electrical383 Manuf. of electrical machinery apparatus, appliances and supplies384 Manuf. of transport equipment385 Manuf. of professional an scientific equipment, measuring and controlling
instruments not elsewhere classified, and of photographic and optical goods390 Other manufacturing industries
Electricity, Gas and Water410 Electricity, gas and steam420 Water works and supply
Construction500 Construction
Wholesale and Retail Trade, and Restaurants and Hotels610 Wholesale Trade620 Retail Trade631 Restaurants, cafes, other eating and drinking places632 Hotels, rooming houses, camps and other lodging places
Transport, Storage and Communication711 Land Transport712 Water Transport713 Air Transport719 Services allied to Transport720 Communication
Financing, Insurance, Real Estate and Business Services810 Financial Institutions820 Insurance831 Real Estate832 Business Service except machinery rental and leasing833 Machinery rental and leasing
Community, Social and Personal Services910 Public administration and Defence920 Sanitary and similar services931 Education services932 Research and scientific institutes933 Medical, dental, other health and veterinary services934 Welfare institutions935 Business, professional and labour associations939 Other social and related community services941 Motion picture and other entertainment services942 Libraries, museums, botanical and zoological gardens and cultural services
not elsewhere classified949 Amusement and recreational services not elsewhere classified951 Repair services not elsewhere classified952 Laundries, laundry services, and cleaning and dyeing plants953 Domestic Services959 Miscellaneous personal services960 International and other Extra-territorial Bodies
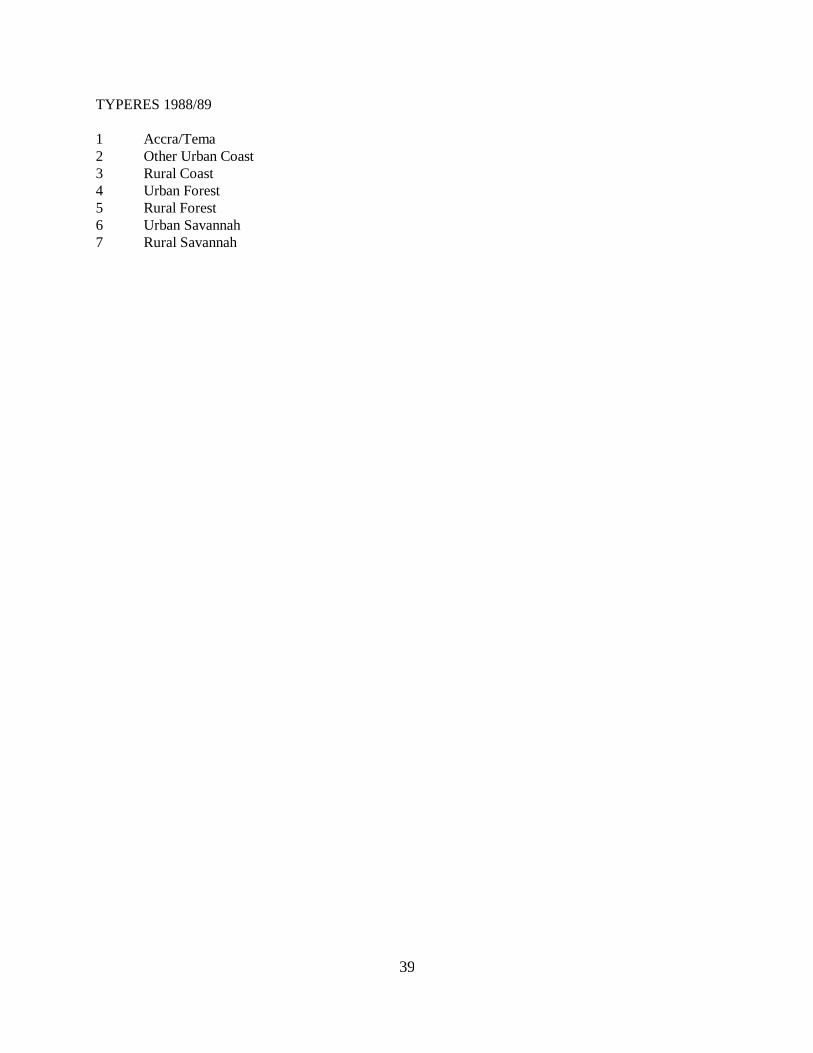
39
TYPERES 1988/89
1 Accra/Tema2 Other Urban Coast3 Rural Coast4 Urban Forest5 Rural Forest6 Urban Savannah7 Rural Savannah
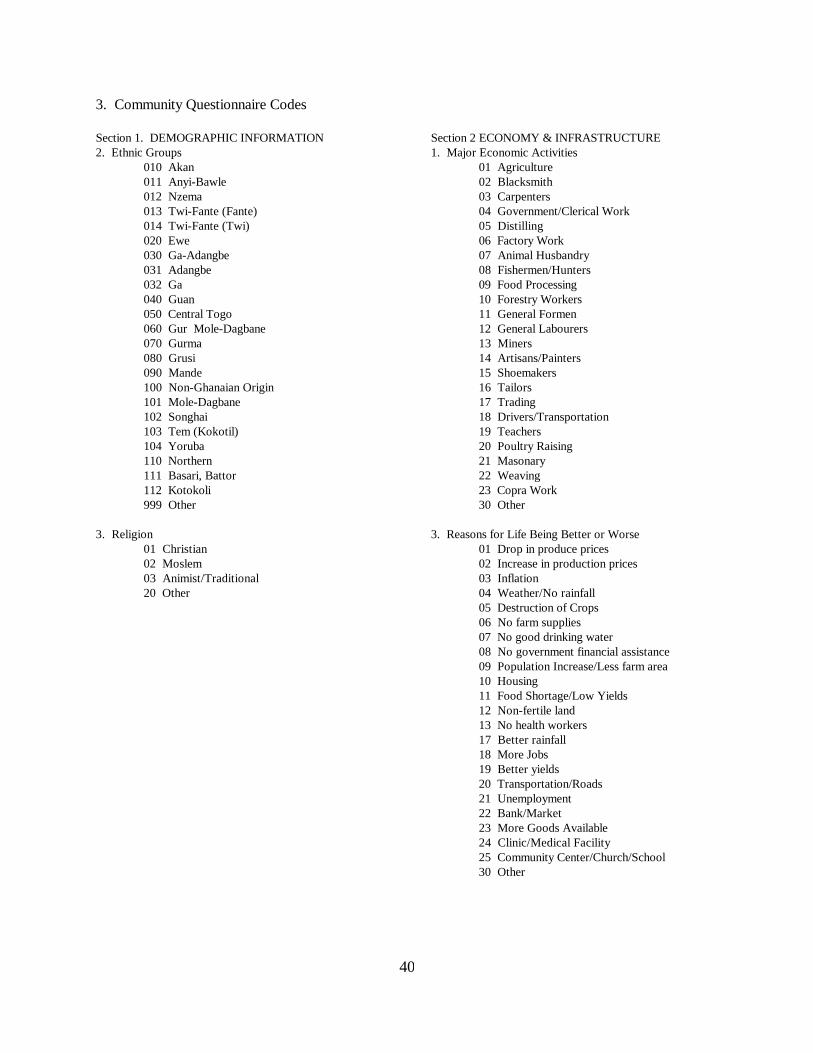
40
3. Community Questionnaire Codes
Section 1. DEMOGRAPHIC INFORMATION2. Ethnic Groups
010 Akan011 Anyi-Bawle 012 Nzema013 Twi-Fante (Fante)014 Twi-Fante (Twi)020 Ewe030 Ga-Adangbe031 Adangbe032 Ga040 Guan050 Central Togo060 Gur Mole-Dagbane070 Gurma080 Grusi090 Mande100 Non-Ghanaian Origin101 Mole-Dagbane102 Songhai103 Tem (Kokotil)104 Yoruba110 Northern111 Basari, Battor112 Kotokoli999 Other
3. Religion01 Christian02 Moslem03 Animist/Traditional20 Other
Section 2 ECONOMY & INFRASTRUCTURE1. Major Economic Activities
01 Agriculture02 Blacksmith03 Carpenters04 Government/Clerical Work05 Distilling06 Factory Work07 Animal Husbandry08 Fishermen/Hunters09 Food Processing10 Forestry Workers11 General Formen12 General Labourers13 Miners14 Artisans/Painters15 Shoemakers16 Tailors17 Trading18 Drivers/Transportation19 Teachers20 Poultry Raising21 Masonary22 Weaving23 Copra Work30 Other
3. Reasons for Life Being Better or Worse01 Drop in produce prices02 Increase in production prices03 Inflation04 Weather/No rainfall05 Destruction of Crops06 No farm supplies07 No good drinking water08 No government financial assistance09 Population Increase/Less farm area10 Housing11 Food Shortage/Low Yields12 Non-fertile land13 No health workers17 Better rainfall18 More Jobs19 Better yields20 Transportation/Roads21 Unemployment22 Bank/Market23 More Goods Available24 Clinic/Medical Facility25 Community Center/Church/School30 Other
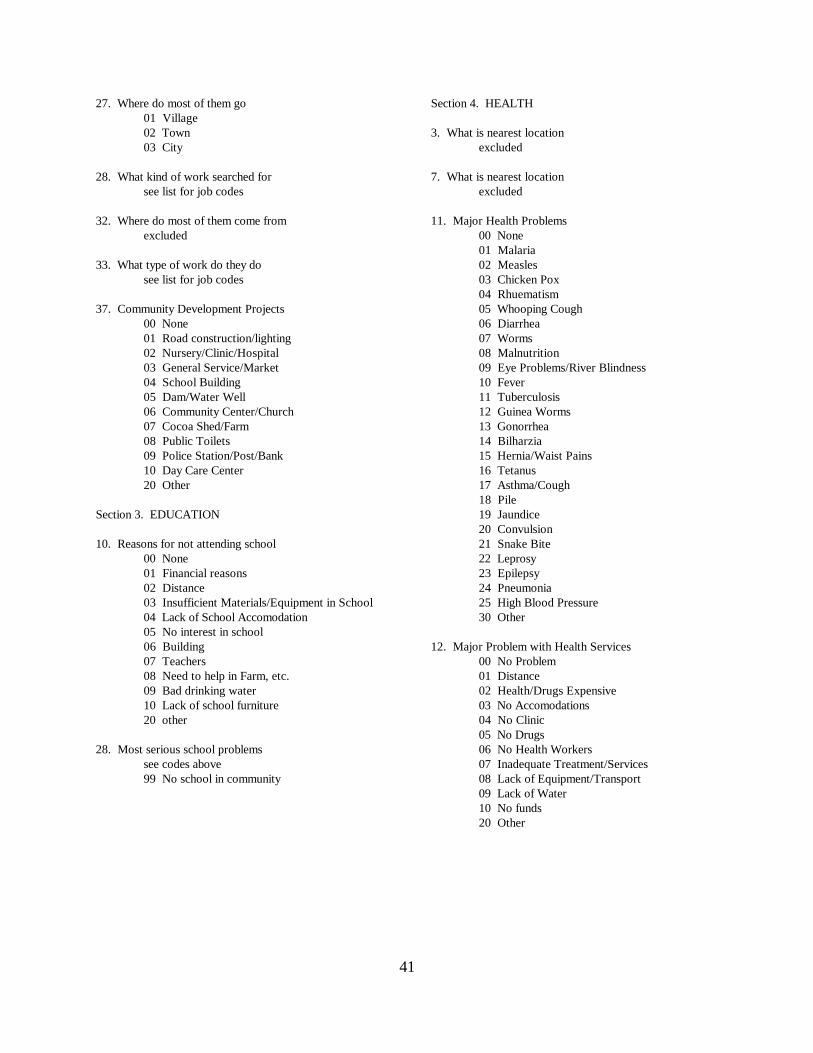
41
27. Where do most of them go01 Village02 Town03 City
28. What kind of work searched forsee list for job codes
32. Where do most of them come fromexcluded
33. What type of work do they dosee list for job codes
37. Community Development Projects00 None01 Road construction/lighting02 Nursery/Clinic/Hospital03 General Service/Market04 School Building05 Dam/Water Well06 Community Center/Church07 Cocoa Shed/Farm08 Public Toilets09 Police Station/Post/Bank10 Day Care Center20 Other
Section 3. EDUCATION
10. Reasons for not attending school00 None01 Financial reasons02 Distance03 Insufficient Materials/Equipment in School04 Lack of School Accomodation05 No interest in school06 Building07 Teachers08 Need to help in Farm, etc.09 Bad drinking water10 Lack of school furniture20 other
28. Most serious school problemssee codes above99 No school in community
Section 4. HEALTH
3. What is nearest locationexcluded
7. What is nearest locationexcluded
11. Major Health Problems00 None01 Malaria02 Measles03 Chicken Pox04 Rhuematism05 Whooping Cough06 Diarrhea07 Worms08 Malnutrition09 Eye Problems/River Blindness10 Fever11 Tuberculosis12 Guinea Worms13 Gonorrhea14 Bilharzia15 Hernia/Waist Pains16 Tetanus17 Asthma/Cough18 Pile19 Jaundice20 Convulsion21 Snake Bite22 Leprosy23 Epilepsy24 Pneumonia25 High Blood Pressure30 Other
12. Major Problem with Health Services00 No Problem01 Distance02 Health/Drugs Expensive03 No Accomodations04 No Clinic05 No Drugs06 No Health Workers07 Inadequate Treatment/Services08 Lack of Equipment/Transport09 Lack of Water10 No funds20 Other
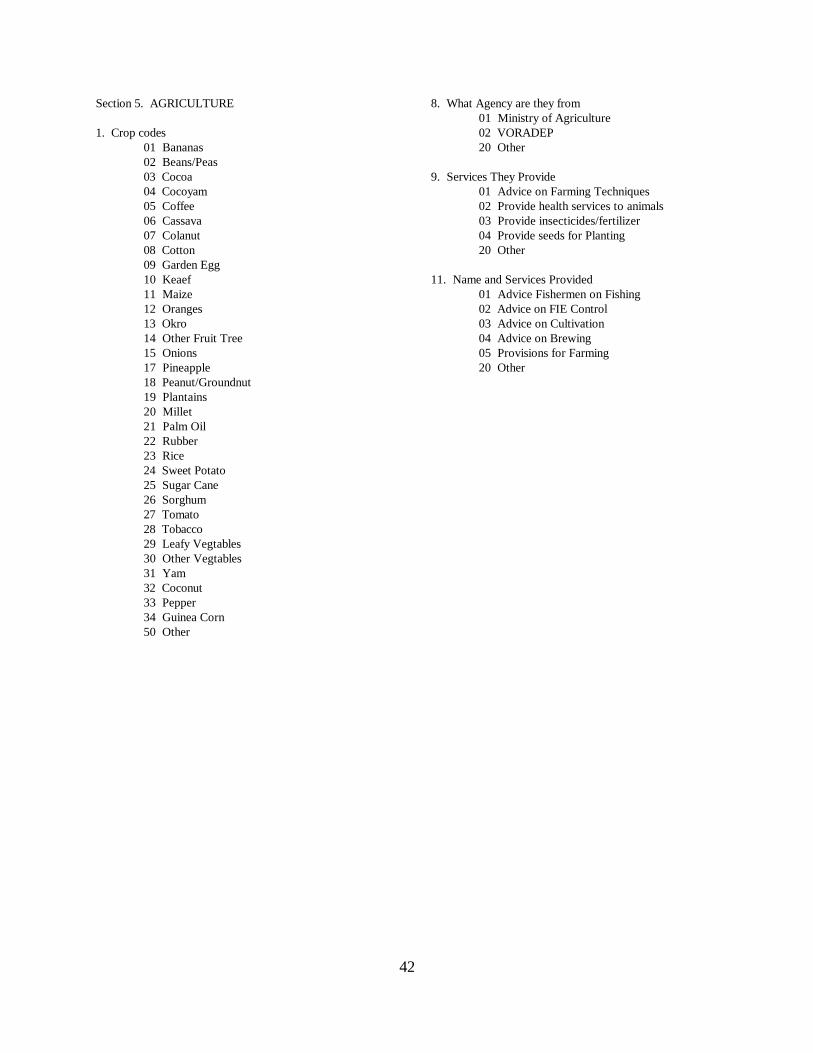
42
Section 5. AGRICULTURE
1. Crop codes01 Bananas02 Beans/Peas03 Cocoa04 Cocoyam05 Coffee06 Cassava07 Colanut08 Cotton09 Garden Egg10 Keaef11 Maize12 Oranges13 Okro14 Other Fruit Tree15 Onions17 Pineapple18 Peanut/Groundnut19 Plantains20 Millet21 Palm Oil22 Rubber23 Rice24 Sweet Potato25 Sugar Cane26 Sorghum27 Tomato28 Tobacco29 Leafy Vegtables30 Other Vegtables31 Yam32 Coconut33 Pepper34 Guinea Corn50 Other
8. What Agency are they from01 Ministry of Agriculture02 VORADEP20 Other
9. Services They Provide01 Advice on Farming Techniques02 Provide health services to animals03 Provide insecticides/fertilizer04 Provide seeds for Planting20 Other
11. Name and Services Provided01 Advice Fishermen on Fishing02 Advice on FIE Control03 Advice on Cultivation04 Advice on Brewing05 Provisions for Farming20 Other
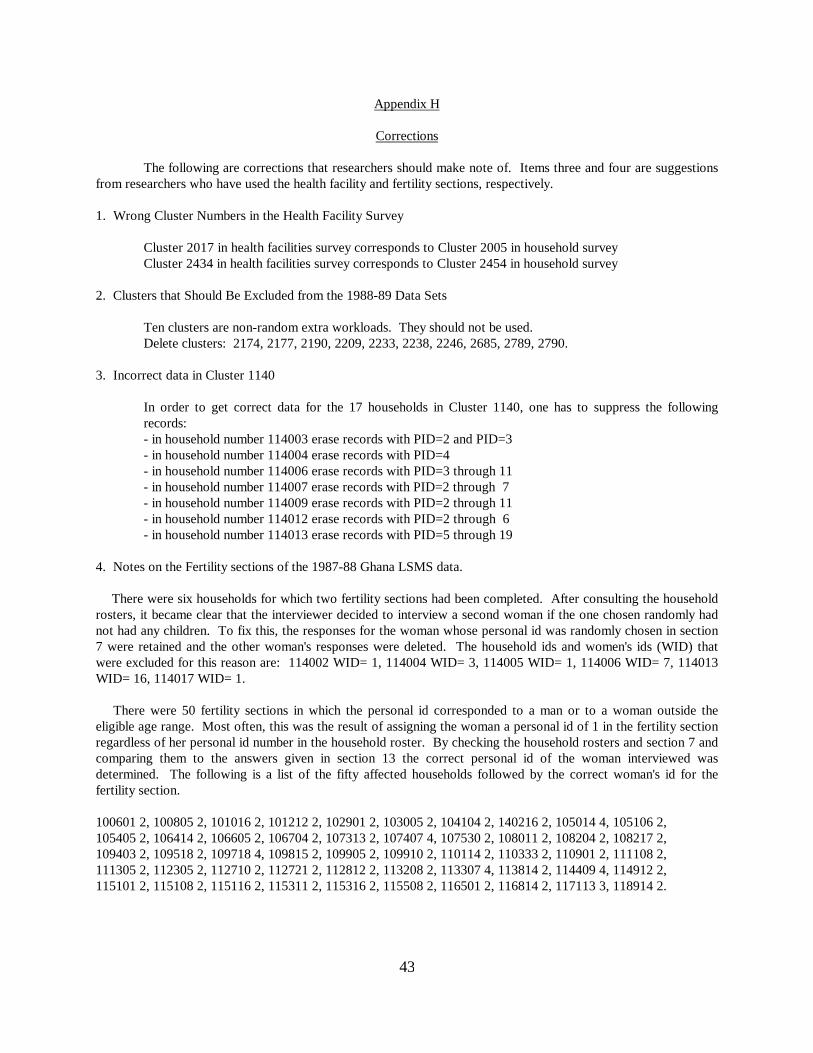
43
Appendix H
Corrections
The following are corrections that researchers should make note of. Items three and four are suggestionsfrom researchers who have used the health facility and fertility sections, respectively.
1. Wrong Cluster Numbers in the Health Facility Survey
Cluster 2017 in health facilities survey corresponds to Cluster 2005 in household surveyCluster 2434 in health facilities survey corresponds to Cluster 2454 in household survey
2. Clusters that Should Be Excluded from the 1988-89 Data Sets
Ten clusters are non-random extra workloads. They should not be used.Delete clusters: 2174, 2177, 2190, 2209, 2233, 2238, 2246, 2685, 2789, 2790.
3. Incorrect data in Cluster 1140
In order to get correct data for the 17 households in Cluster 1140, one has to suppress the followingrecords:- in household number 114003 erase records with PID=2 and PID=3- in household number 114004 erase records with PID=4- in household number 114006 erase records with PID=3 through 11- in household number 114007 erase records with PID=2 through 7- in household number 114009 erase records with PID=2 through 11- in household number 114012 erase records with PID=2 through 6- in household number 114013 erase records with PID=5 through 19
4. Notes on the Fertility sections of the 1987-88 Ghana LSMS data.
There were six households for which two fertility sections had been completed. After consulting the householdrosters, it became clear that the interviewer decided to interview a second woman if the one chosen randomly hadnot had any children. To fix this, the responses for the woman whose personal id was randomly chosen in section7 were retained and the other woman's responses were deleted. The household ids and women's ids (WID) thatwere excluded for this reason are: 114002 WID= 1, 114004 WID= 3, 114005 WID= 1, 114006 WID= 7, 114013WID= 16, 114017 WID= 1.
There were 50 fertility sections in which the personal id corresponded to a man or to a woman outside theeligible age range. Most often, this was the result of assigning the woman a personal id of 1 in the fertility sectionregardless of her personal id number in the household roster. By checking the household rosters and section 7 andcomparing them to the answers given in section 13 the correct personal id of the woman interviewed wasdetermined. The following is a list of the fifty affected households followed by the correct woman's id for thefertility section.
100601 2, 100805 2, 101016 2, 101212 2, 102901 2, 103005 2, 104104 2, 140216 2, 105014 4, 105106 2,105405 2, 106414 2, 106605 2, 106704 2, 107313 2, 107407 4, 107530 2, 108011 2, 108204 2, 108217 2,109403 2, 109518 2, 109718 4, 109815 2, 109905 2, 109910 2, 110114 2, 110333 2, 110901 2, 111108 2,111305 2, 112305 2, 112710 2, 112721 2, 112812 2, 113208 2, 113307 4, 113814 2, 114409 4, 114912 2,115101 2, 115108 2, 115116 2, 115311 2, 115316 2, 115508 2, 116501 2, 116814 2, 117113 3, 118914 2.
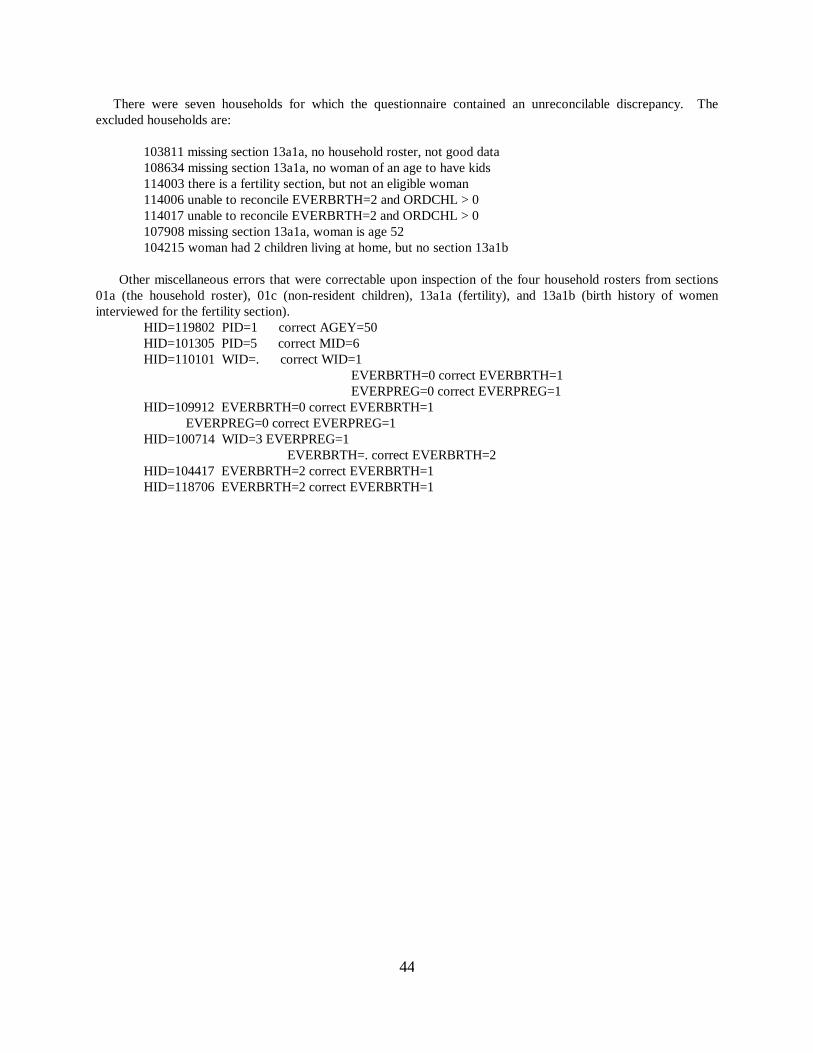
44
There were seven households for which the questionnaire contained an unreconcilable discrepancy. Theexcluded households are:
103811 missing section 13a1a, no household roster, not good data108634 missing section 13a1a, no woman of an age to have kids114003 there is a fertility section, but not an eligible woman114006 unable to reconcile EVERBRTH=2 and ORDCHL > 0114017 unable to reconcile EVERBRTH=2 and ORDCHL > 0107908 missing section 13a1a, woman is age 52104215 woman had 2 children living at home, but no section 13a1b
Other miscellaneous errors that were correctable upon inspection of the four household rosters from sections01a (the household roster), 01c (non-resident children), 13a1a (fertility), and 13a1b (birth history of womeninterviewed for the fertility section).
HID=119802 PID=1 correct AGEY=50HID=101305 PID=5 correct MID=6HID=110101 WID=. correct WID=1
EVERBRTH=0 correct EVERBRTH=1EVERPREG=0 correct EVERPREG=1
HID=109912 EVERBRTH=0 correct EVERBRTH=1 EVERPREG=0 correct EVERPREG=1HID=100714 WID=3 EVERPREG=1
EVERBRTH=. correct EVERBRTH=2HID=104417 EVERBRTH=2 correct EVERBRTH=1HID=118706 EVERBRTH=2 correct EVERBRTH=1
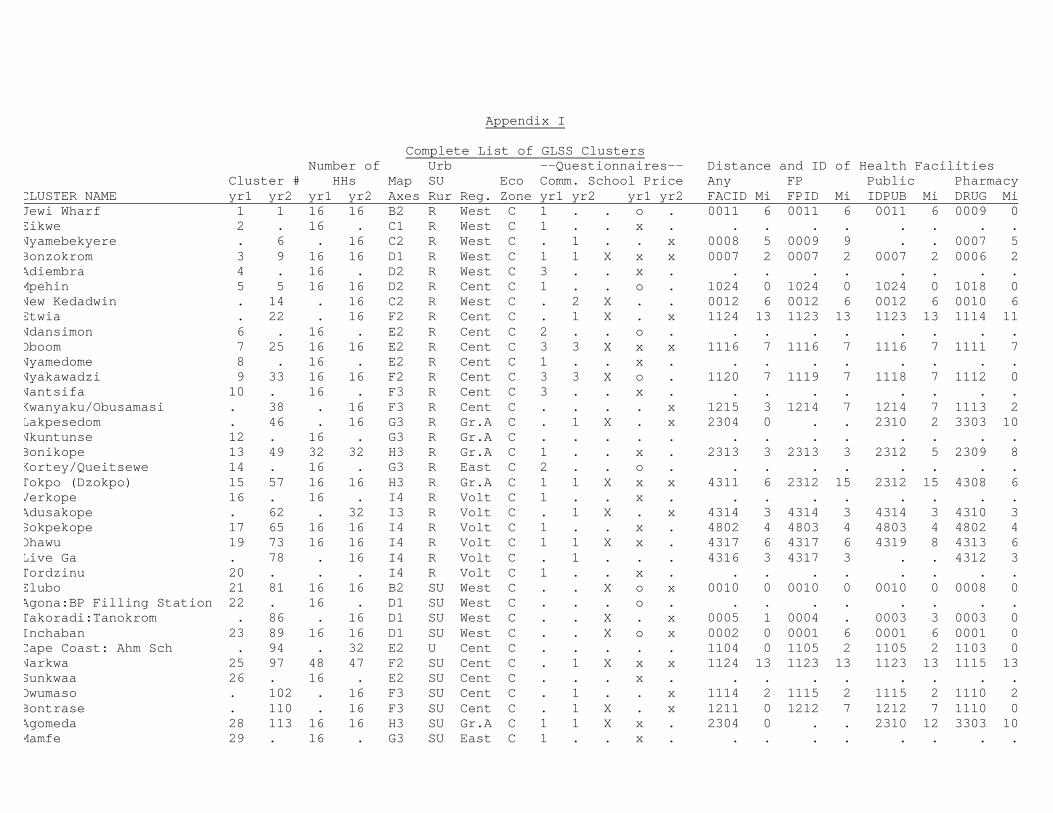
Appendix I
Complete List of GLSS Clusters Number of Urb --Questionnaires-- Distance and ID of Health Facilities Cluster # HHs Map SU Eco Comm. School Price Any FP Public PharmacyCLUSTER NAME yr1 yr2 yr1 yr2 Axes Rur Reg. Zone yr1 yr2 yr1 yr2 FACID Mi FPID Mi IDPUB Mi DRUG MiJewi Wharf 1 1 16 16 B2 R West C 1 . . o . 0011 6 0011 6 0011 6 0009 0Eikwe 2 . 16 . C1 R West C 1 . . x . . . . . . . . .Nyamebekyere . 6 . 16 C2 R West C . 1 . . x 0008 5 0009 9 . . 0007 5Bonzokrom 3 9 16 16 D1 R West C 1 1 X x x 0007 2 0007 2 0007 2 0006 2Adiembra 4 . 16 . D2 R West C 3 . . x . . . . . . . . .Mpehin 5 5 16 16 D2 R Cent C 1 . . o . 1024 0 1024 0 1024 0 1018 0New Kedadwin . 14 . 16 C2 R West C . 2 X . . 0012 6 0012 6 0012 6 0010 6Etwia . 22 . 16 F2 R Cent C . 1 X . x 1124 13 1123 13 1123 13 1114 11Ndansimon 6 . 16 . E2 R Cent C 2 . . o . . . . . . . . .Oboom 7 25 16 16 E2 R Cent C 3 3 X x x 1116 7 1116 7 1116 7 1111 7Nyamedome 8 . 16 . E2 R Cent C 1 . . x . . . . . . . . .Nyakawadzi 9 33 16 16 F2 R Cent C 3 3 X o . 1120 7 1119 7 1118 7 1112 0Nantsifa 10 . 16 . F3 R Cent C 3 . . x . . . . . . . . .Kwanyaku/Obusamasi . 38 . 16 F3 R Cent C . . . . x 1215 3 1214 7 1214 7 1113 2Lakpesedom . 46 . 16 G3 R Gr.A C . 1 X . x 2304 0 . . 2310 2 3303 10Nkuntunse 12 . 16 . G3 R Gr.A C . . . . . . . . . . . . .Bonikope 13 49 32 32 H3 R Gr.A C 1 . . x . 2313 3 2313 3 2312 5 2309 8Kortey/Queitsewe 14 . 16 . G3 R East C 2 . . o . . . . . . . . .Tokpo (Dzokpo) 15 57 16 16 H3 R Gr.A C 1 1 X x x 4311 6 2312 15 2312 15 4308 6Verkope 16 . 16 . I4 R Volt C 1 . . x . . . . . . . . .Adusakope . 62 . 32 I3 R Volt C . 1 X . x 4314 3 4314 3 4314 3 4310 3Sokpekope 17 65 16 16 I4 R Volt C 1 . . x . 4802 4 4803 4 4803 4 4802 4Ohawu 19 73 16 16 I4 R Volt C 1 1 X x . 4317 6 4317 6 4319 8 4313 6Live Ga . 78 . 16 I4 R Volt C . 1 . . . 4316 3 4317 3 . . 4312 3Tordzinu 20 . . . I4 R Volt C 1 . . x . . . . . . . . .Elubo 21 81 16 16 B2 SU West C . . X o x 0010 0 0010 0 0010 0 0008 0Agona:BP Filling Station 22 . 16 . D1 SU West C . . . o . . . . . . . . .Takoradi:Tanokrom . 86 . 16 D1 SU West C . . X . x 0005 1 0004 . 0003 3 0003 0Inchaban 23 89 16 16 D1 SU West C . . X o x 0002 0 0001 6 0001 6 0001 0Cape Coast: Ahm Sch . 94 . 32 E2 U Cent C . . . . . 1104 0 1105 2 1105 2 1103 0Narkwa 25 97 48 47 F2 SU Cent C . 1 X x x 1124 13 1123 13 1123 13 1115 13Sunkwaa 26 . 16 . E2 SU Cent C . . . x . . . . . . . . .Owumaso . 102 . 16 F3 SU Cent C . 1 . . x 1114 2 1115 2 1115 2 1110 2Bontrase . 110 . 16 F3 SU Cent C . 1 X . x 1211 0 1212 7 1212 7 1110 0Agomeda 28 113 16 16 H3 SU Gr.A C 1 1 X x . 2304 0 . . 2310 12 3303 10Mamfe 29 . 16 . G3 SU East C 1 . . x . . . . . . . . .

Adukrom . 118 . 16 G4 U East C . . . . x 3303 0 3303 0 3303 0 3302 0Adidome 30 121 16 16 H4 SU Volt C 1 . . x . 4808 0 4808 0 4808 0 4809 0Tadzewu . 126 . 16 I4 SU Volt C . 1 . . x 4319 5 4320 8 4319 5 4314 0Agbosome/Adina Mornu 31 70 16 16 J4 SU Volt C 1 . . o . 4321 3 4321 3 . . 4315 3Kwesimintsim 32 129 16 16 D1 U West C . . . o . 0006 0 0006 0 0006 0 0005 0Takoradi:Columbia Hot 33 . 16 . D1 U West C . . . x . . . . . . . . .Takoradi:Windy Ridge . 134 . 16 D1 U West C . . X . . 0005 1 0006 2 0006 2 0004 0Sekondi:Effiakuma 34 137 16 16 D1 U West C . . X x x 0005 0 0004 0 0003 2 0002 0Shama 35 . 16 . D2 U West C . . . o . . . . . . . . .Elmina . 142 . 32 E2 U Cent C . . X . x 1103 0 1103 0 1103 0 1102 0Cape Coast:Soc Welfare 36 145 16 16 E2 U Cent C . . X o x 1101 0 1102 0 1102 0 1101 0Moree 37 . 15 . E2 U Cent C . . . o . . . . . . . . .Odoben 38 . 15 . F3 U Cent C . . . x . . . . . . . . .Apam 39 105 15 16 F2 U Cent C . . X x x 1122 0 1121 0 1121 0 1113 0Senya Beraku 40 . 16 . F2 U Cent C . . . x . . . . . . . . .Anomabo . 150 . 16 E2 U Cent C . . . . o 1106 0 1106 0 1106 0 1104 0Bawjiase . 158 . 16 F3 U Cent C . . X . x 1213 0 1212 0 1212 0 1111 0Agona Swedru 41 161 16 16 F3 U Cent C . . . o . 1214 0 1214 0 1214 0 1112 0Medina: Soc Welfare 42 166 16 16 G3 U Gr.A C . . . x . 2205 0 2205 0 . . 2206 0Accra: Chorkor Tea Garden 43 . 16 . G3 U Gr.A C . . . o . . . . . . . . .Accra:Mamprobi 44 . 16 . G3 U Gr.A C . . . o . . . . . . . . .Accra:Dansoman Est . 169 . 16 G3 U Gr.A C . . . . . . . . . . . . .Accra:TownCouncil 45 . 32 . G3 U Gr.A C . . . o . . . . . . . . .Accra:Abossey 46 . 16 . G3 U Gr.A C . . . x . . . . . . . . .Accra:Darkuman 48 . 31 . G3 U Gr.A C . . . x . . . . . . . . .Acc:No Kan Yoga Res 49 193 32 32 G3 U Gr.A C . . X . x 2210 0 2210 0 2209 3 2209 0Accra:Nii Boi Town 50 . 16 . G3 U Gr.A C . . . x . . . . . . . . .Accra:Jamestown Police 51 201 16 16 G3 U Gr.A C . . . x . 2206 0 2206 0 2206 0 2207 0Acc:MAAB MedCenter . 206 . 32 G3 U Gr.A C . . X . x 2204 0 2204 0 2201 2 2204 0Accra:GoBliss 53 . 32 . G3 U Gr.A C . . . o . . . . . . . . .Accra:Osu Busi 54 . 16 . G3 U Gr.A C . . . x . . . . . . . . .Acc:TeshieChrApoChurch 55 . 16 . G3 U Gr.A C . . . o . . . . . . . . .Acc:Teshie Continen 56 . 16 . G3 U Gr.A C . . . o . . . . . . . . .Labadi:SBC . 214 . 16 G3 U Gr.A C . . X . x 2201 0 2201 0 2201 0 2203 0Accra: Teshie CAC . 217 . 16 G3 U Gr.A C . . X . . 2202 0 2201 3 2201 3 2201 0Acc:Teshie Faith Cl . 222 . 32 G3 U Gr.A C . . . . x 2203 0 2203 0 2201 3 2202 0Labadi: Lakpa House 57 225 16 16 G3 U Gr.A C . . X o . 2219 0 2219 0 2201 1 2205 0Acc:East Cantonments 58 . 16 . G3 U Gr.A C . . . x . . . . . . . . .Burma Camp . 230 . 16 G3 U Gr.A C . . X . x . . . . . . 2216 0Accra:Nima market 59 . 16 . G3 U Gr.A C . . . x . . . . . . . . .Accra:Nima Makolanta 60 . 16 . G3 U Gr.A C . . . x . . . . . . . . .Accra:Alajo 62 . 16 . G3 U Gr.A C . . . x . . . . . . . . .
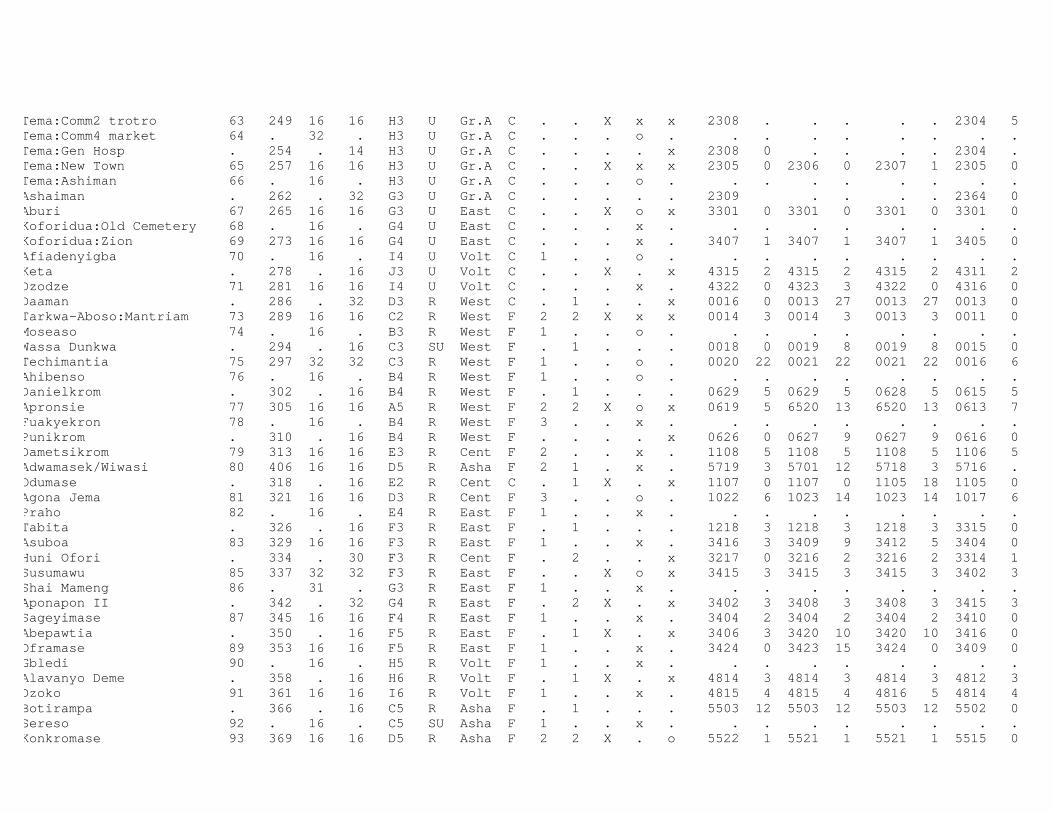
Tema:Comm2 trotro 63 249 16 16 H3 U Gr.A C . . X x x 2308 . . . . . 2304 5Tema:Comm4 market 64 . 32 . H3 U Gr.A C . . . o . . . . . . . . .Tema:Gen Hosp . 254 . 14 H3 U Gr.A C . . . . x 2308 0 . . . . 2304 .Tema:New Town 65 257 16 16 H3 U Gr.A C . . X x x 2305 0 2306 0 2307 1 2305 0Tema:Ashiman 66 . 16 . H3 U Gr.A C . . . o . . . . . . . . .Ashaiman . 262 . 32 G3 U Gr.A C . . . . . 2309 . . . . 2364 0Aburi 67 265 16 16 G3 U East C . . X o x 3301 0 3301 0 3301 0 3301 0Koforidua:Old Cemetery 68 . 16 . G4 U East C . . . x . . . . . . . . .Koforidua:Zion 69 273 16 16 G4 U East C . . . x . 3407 1 3407 1 3407 1 3405 0Afiadenyigba 70 . 16 . I4 U Volt C 1 . . o . . . . . . . . .Keta . 278 . 16 J3 U Volt C . . X . x 4315 2 4315 2 4315 2 4311 2Dzodze 71 281 16 16 I4 U Volt C . . . x . 4322 0 4323 3 4322 0 4316 0Daaman . 286 . 32 D3 R West C . 1 . . x 0016 0 0013 27 0013 27 0013 0Tarkwa-Aboso:Mantriam 73 289 16 16 C2 R West F 2 2 X x x 0014 3 0014 3 0013 3 0011 0Moseaso 74 . 16 . B3 R West F 1 . . o . . . . . . . . .Wassa Dunkwa . 294 . 16 C3 SU West F . 1 . . . 0018 0 0019 8 0019 8 0015 0Techimantia 75 297 32 32 C3 R West F 1 . . o . 0020 22 0021 22 0021 22 0016 6Ahibenso 76 . 16 . B4 R West F 1 . . o . . . . . . . . .Danielkrom . 302 . 16 B4 R West F . 1 . . . 0629 5 0629 5 0628 5 0615 5Apronsie 77 305 16 16 A5 R West F 2 2 X o x 0619 5 6520 13 6520 13 0613 7Fuakyekron 78 . 16 . B4 R West F 3 . . x . . . . . . . . .Punikrom . 310 . 16 B4 R West F . . . . x 0626 0 0627 9 0627 9 0616 0Dametsikrom 79 313 16 16 E3 R Cent F 2 . . x . 1108 5 1108 5 1108 5 1106 5Adwamasek/Wiwasi 80 406 16 16 D5 R Asha F 2 1 . x . 5719 3 5701 12 5718 3 5716 .Odumase . 318 . 16 E2 R Cent C . 1 X . x 1107 0 1107 0 1105 18 1105 0Agona Jema 81 321 16 16 D3 R Cent F 3 . . o . 1022 6 1023 14 1023 14 1017 6Praho 82 . 16 . E4 R East F 1 . . x . . . . . . . . .Tabita . 326 . 16 F3 R East F . 1 . . . 1218 3 1218 3 1218 3 3315 0Asuboa 83 329 16 16 F3 R East F 1 . . x . 3416 3 3409 9 3412 5 3404 0Huni Ofori . 334 . 30 F3 R Cent F . 2 . . x 3217 0 3216 2 3216 2 3314 1Susumawu 85 337 32 32 F3 R East F . . X o x 3415 3 3415 3 3415 3 3402 3Shai Mameng 86 . 31 . G3 R East F 1 . . x . . . . . . . . .Aponapon II . 342 . 32 G4 R East F . 2 X . x 3402 3 3408 3 3408 3 3415 3Sageyimase 87 345 16 16 F4 R East F 1 . . x . 3404 2 3404 2 3404 2 3410 0Abepawtia . 350 . 16 F5 R East F . 1 X . x 3406 3 3420 10 3420 10 3416 0Oframase 89 353 16 16 F5 R East F 1 . . x . 3424 0 3423 15 3424 0 3409 0Gbledi 90 . 16 . H5 R Volt F 1 . . x . . . . . . . . .Alavanyo Deme . 358 . 16 H6 R Volt F . 1 X . x 4814 3 4814 3 4814 3 4812 3Dzoko 91 361 16 16 I6 R Volt F 1 . . x . 4815 4 4815 4 4816 5 4814 4Botirampa . 366 . 16 C5 R Asha F . 1 . . . 5503 12 5503 12 5503 12 5502 0Sereso 92 . 16 . C5 SU Asha F 1 . . x . . . . . . . . .Konkromase 93 369 16 16 D5 R Asha F 2 2 X . o 5522 1 5521 1 5521 1 5515 0
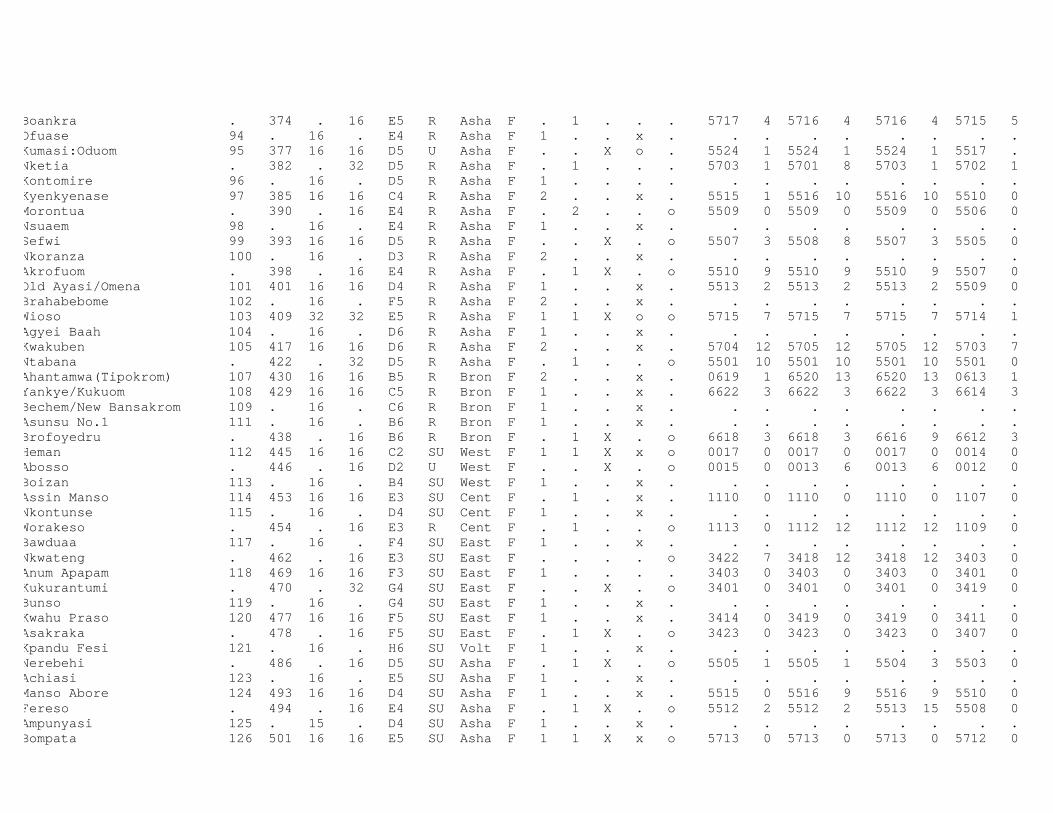
Boankra . 374 . 16 E5 R Asha F . 1 . . . 5717 4 5716 4 5716 4 5715 5Ofuase 94 . 16 . E4 R Asha F 1 . . x . . . . . . . . .Kumasi:Oduom 95 377 16 16 D5 U Asha F . . X o . 5524 1 5524 1 5524 1 5517 .Nketia . 382 . 32 D5 R Asha F . 1 . . . 5703 1 5701 8 5703 1 5702 1Kontomire 96 . 16 . D5 R Asha F 1 . . . . . . . . . . . .Kyenkyenase 97 385 16 16 C4 R Asha F 2 . . x . 5515 1 5516 10 5516 10 5510 0Morontua . 390 . 16 E4 R Asha F . 2 . . o 5509 0 5509 0 5509 0 5506 0Nsuaem 98 . 16 . E4 R Asha F 1 . . x . . . . . . . . .Sefwi 99 393 16 16 D5 R Asha F . . X . o 5507 3 5508 8 5507 3 5505 0Nkoranza 100 . 16 . D3 R Asha F 2 . . x . . . . . . . . .Akrofuom . 398 . 16 E4 R Asha F . 1 X . o 5510 9 5510 9 5510 9 5507 0Old Ayasi/Omena 101 401 16 16 D4 R Asha F 1 . . x . 5513 2 5513 2 5513 2 5509 0Brahabebome 102 . 16 . F5 R Asha F 2 . . x . . . . . . . . .Wioso 103 409 32 32 E5 R Asha F 1 1 X o o 5715 7 5715 7 5715 7 5714 1Agyei Baah 104 . 16 . D6 R Asha F 1 . . x . . . . . . . . .Kwakuben 105 417 16 16 D6 R Asha F 2 . . x . 5704 12 5705 12 5705 12 5703 7Ntabana . 422 . 32 D5 R Asha F . 1 . . o 5501 10 5501 10 5501 10 5501 0Ahantamwa(Tipokrom) 107 430 16 16 B5 R Bron F 2 . . x . 0619 1 6520 13 6520 13 0613 1Yankye/Kukuom 108 429 16 16 C5 R Bron F 1 . . x . 6622 3 6622 3 6622 3 6614 3Bechem/New Bansakrom 109 . 16 . C6 R Bron F 1 . . x . . . . . . . . .Asunsu No.1 111 . 16 . B6 R Bron F 1 . . x . . . . . . . . .Brofoyedru . 438 . 16 B6 R Bron F . 1 X . o 6618 3 6618 3 6616 9 6612 3Heman 112 445 16 16 C2 SU West F 1 1 X x o 0017 0 0017 0 0017 0 0014 0Abosso . 446 . 16 D2 U West F . . X . o 0015 0 0013 6 0013 6 0012 0Boizan 113 . 16 . B4 SU West F 1 . . x . . . . . . . . .Assin Manso 114 453 16 16 E3 SU Cent F . 1 . x . 1110 0 1110 0 1110 0 1107 0Nkontunse 115 . 16 . D4 SU Cent F 1 . . x . . . . . . . . .Worakeso . 454 . 16 E3 R Cent F . 1 . . o 1113 0 1112 12 1112 12 1109 0Bawduaa 117 . 16 . F4 SU East F 1 . . x . . . . . . . . .Nkwateng . 462 . 16 E3 SU East F . . . . o 3422 7 3418 12 3418 12 3403 0Anum Apapam 118 469 16 16 F3 SU East F 1 . . . . 3403 0 3403 0 3403 0 3401 0Kukurantumi . 470 . 32 G4 SU East F . . X . o 3401 0 3401 0 3401 0 3419 0Bunso 119 . 16 . G4 SU East F 1 . . x . . . . . . . . .Kwahu Praso 120 477 16 16 F5 SU East F 1 . . x . 3414 0 3419 0 3419 0 3411 0Asakraka . 478 . 16 F5 SU East F . 1 X . o 3423 0 3423 0 3423 0 3407 0Kpandu Fesi 121 . 16 . H6 SU Volt F 1 . . x . . . . . . . . .Nerebehi . 486 . 16 D5 SU Asha F . 1 X . o 5505 1 5505 1 5504 3 5503 0Achiasi 123 . 16 . E5 SU Asha F 1 . . x . . . . . . . . .Manso Abore 124 493 16 16 D4 SU Asha F 1 . . x . 5515 0 5516 9 5516 9 5510 0Fereso . 494 . 16 E4 SU Asha F . 1 X . o 5512 2 5512 2 5513 15 5508 0Ampunyasi 125 . 15 . D4 SU Asha F 1 . . x . . . . . . . . .Bompata 126 501 16 16 E5 SU Asha F 1 1 X x o 5713 0 5713 0 5713 0 5712 0
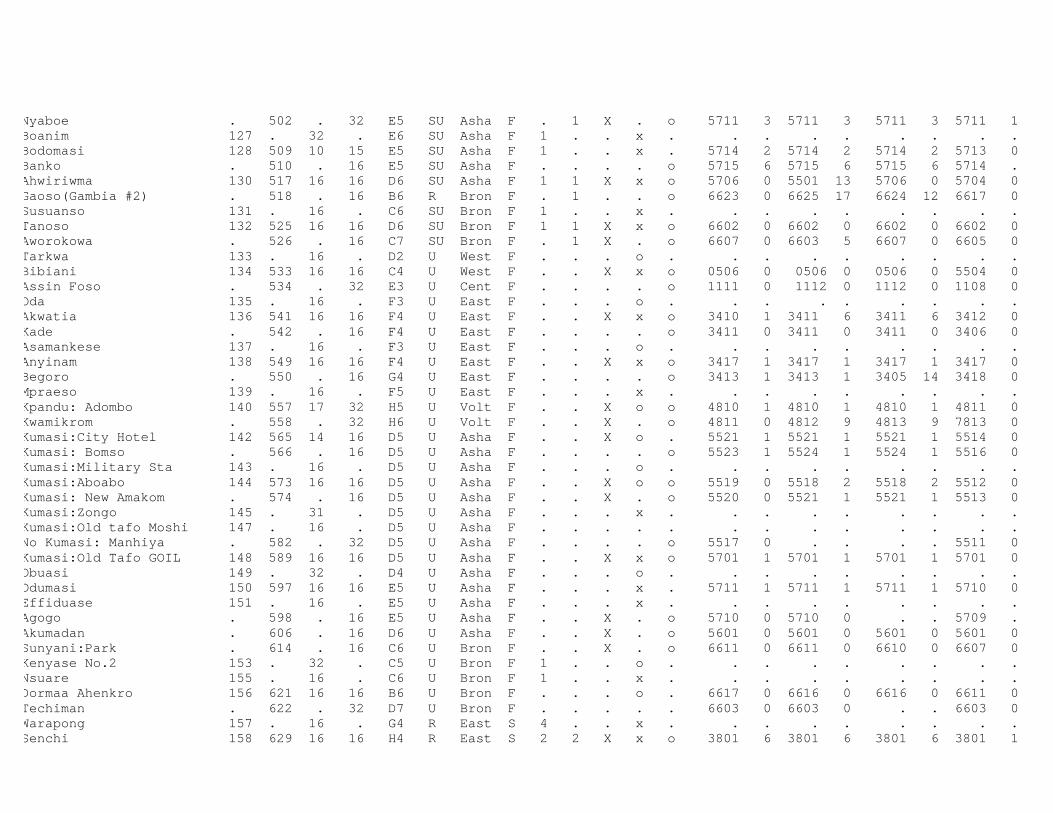
Nyaboe . 502 . 32 E5 SU Asha F . 1 X . o 5711 3 5711 3 5711 3 5711 1Boanim 127 . 32 . E6 SU Asha F 1 . . x . . . . . . . . .Bodomasi 128 509 10 15 E5 SU Asha F 1 . . x . 5714 2 5714 2 5714 2 5713 0Banko . 510 . 16 E5 SU Asha F . . . . o 5715 6 5715 6 5715 6 5714 .Ahwiriwma 130 517 16 16 D6 SU Asha F 1 1 X x o 5706 0 5501 13 5706 0 5704 0Gaoso(Gambia #2) . 518 . 16 B6 R Bron F . 1 . . o 6623 0 6625 17 6624 12 6617 0Susuanso 131 . 16 . C6 SU Bron F 1 . . x . . . . . . . . .Tanoso 132 525 16 16 D6 SU Bron F 1 1 X x o 6602 0 6602 0 6602 0 6602 0Aworokowa . 526 . 16 C7 SU Bron F . 1 X . o 6607 0 6603 5 6607 0 6605 0Tarkwa 133 . 16 . D2 U West F . . . o . . . . . . . . .Bibiani 134 533 16 16 C4 U West F . . X x o 0506 0 0506 0 0506 0 5504 0Assin Foso . 534 . 32 E3 U Cent F . . . . o 1111 0 1112 0 1112 0 1108 0Oda 135 . 16 . F3 U East F . . . o . . . . . . . . .Akwatia 136 541 16 16 F4 U East F . . X x o 3410 1 3411 6 3411 6 3412 0Kade . 542 . 16 F4 U East F . . . . o 3411 0 3411 0 3411 0 3406 0Asamankese 137 . 16 . F3 U East F . . . o . . . . . . . . .Anyinam 138 549 16 16 F4 U East F . . X x o 3417 1 3417 1 3417 1 3417 0Begoro . 550 . 16 G4 U East F . . . . o 3413 1 3413 1 3405 14 3418 0Mpraeso 139 . 16 . F5 U East F . . . x . . . . . . . . .Kpandu: Adombo 140 557 17 32 H5 U Volt F . . X o o 4810 1 4810 1 4810 1 4811 0Kwamikrom . 558 . 32 H6 U Volt F . . X . o 4811 0 4812 9 4813 9 7813 0Kumasi:City Hotel 142 565 14 16 D5 U Asha F . . X o . 5521 1 5521 1 5521 1 5514 0Kumasi: Bomso . 566 . 16 D5 U Asha F . . . . o 5523 1 5524 1 5524 1 5516 0Kumasi:Military Sta 143 . 16 . D5 U Asha F . . . o . . . . . . . . .Kumasi:Aboabo 144 573 16 16 D5 U Asha F . . X o o 5519 0 5518 2 5518 2 5512 0Kumasi: New Amakom . 574 . 16 D5 U Asha F . . X . o 5520 0 5521 1 5521 1 5513 0Kumasi:Zongo 145 . 31 . D5 U Asha F . . . x . . . . . . . . .Kumasi:Old tafo Moshi 147 . 16 . D5 U Asha F . . . . . . . . . . . . .No Kumasi: Manhiya . 582 . 32 D5 U Asha F . . . . o 5517 0 . . . . 5511 0Kumasi:Old Tafo GOIL 148 589 16 16 D5 U Asha F . . X x o 5701 1 5701 1 5701 1 5701 0Obuasi 149 . 32 . D4 U Asha F . . . o . . . . . . . . .Odumasi 150 597 16 16 E5 U Asha F . . . x . 5711 1 5711 1 5711 1 5710 0Effiduase 151 . 16 . E5 U Asha F . . . x . . . . . . . . .Agogo . 598 . 16 E5 U Asha F . . X . o 5710 0 5710 0 . . 5709 .Akumadan . 606 . 16 D6 U Asha F . . X . o 5601 0 5601 0 5601 0 5601 0Sunyani:Park . 614 . 16 C6 U Bron F . . X . o 6611 0 6611 0 6610 0 6607 0Kenyase No.2 153 . 32 . C5 U Bron F 1 . . o . . . . . . . . .Nsuare 155 . 16 . C6 U Bron F 1 . . x . . . . . . . . .Dormaa Ahenkro 156 621 16 16 B6 U Bron F . . . o . 6617 0 6616 0 6616 0 6611 0Techiman . 622 . 32 D7 U Bron F . . . . . 6603 0 6603 0 . . 6603 0Warapong 157 . 16 . G4 R East S 4 . . x . . . . . . . . .Senchi 158 629 16 16 H4 R East S 2 2 X x o 3801 6 3801 6 3801 6 3801 1
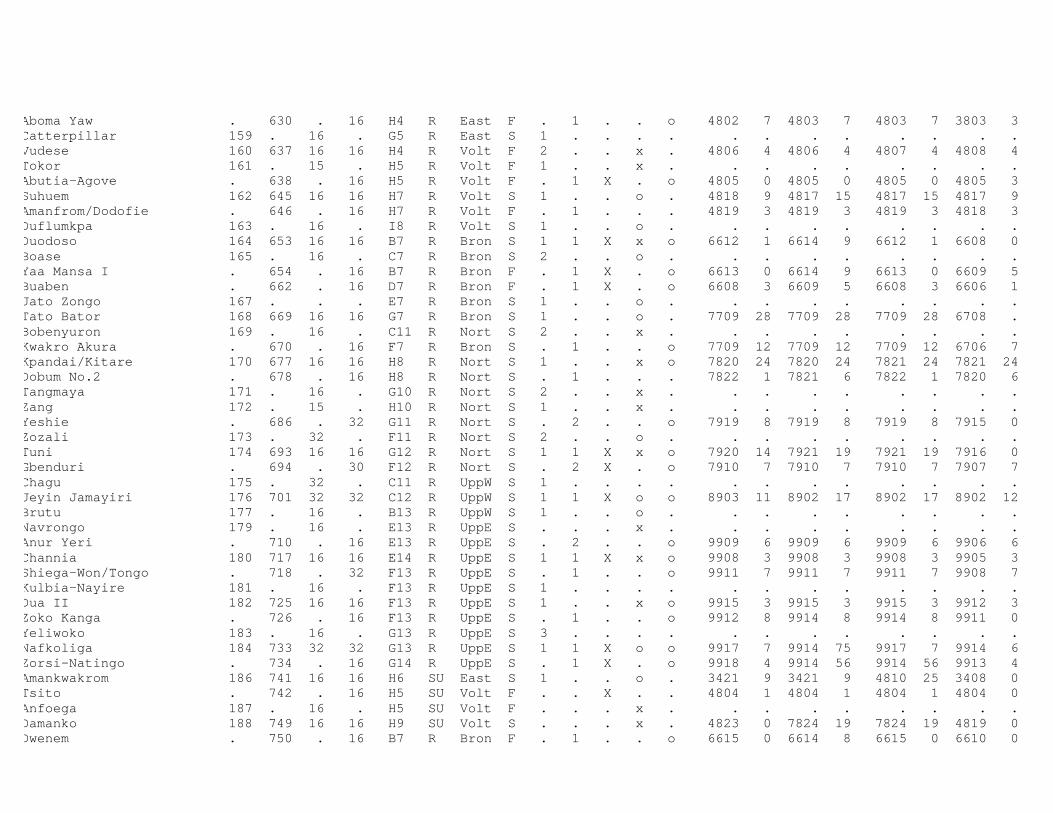
Aboma Yaw . 630 . 16 H4 R East F . 1 . . o 4802 7 4803 7 4803 7 3803 3Catterpillar 159 . 16 . G5 R East S 1 . . . . . . . . . . . .Vudese 160 637 16 16 H4 R Volt F 2 . . x . 4806 4 4806 4 4807 4 4808 4Tokor 161 . 15 . H5 R Volt F 1 . . x . . . . . . . . .Abutia-Agove . 638 . 16 H5 R Volt F . 1 X . o 4805 0 4805 0 4805 0 4805 3Suhuem 162 645 16 16 H7 R Volt S 1 . . o . 4818 9 4817 15 4817 15 4817 9Amanfrom/Dodofie . 646 . 16 H7 R Volt F . 1 . . . 4819 3 4819 3 4819 3 4818 3Duflumkpa 163 . 16 . I8 R Volt S 1 . . o . . . . . . . . .Duodoso 164 653 16 16 B7 R Bron S 1 1 X x o 6612 1 6614 9 6612 1 6608 0Boase 165 . 16 . C7 R Bron S 2 . . o . . . . . . . . .Yaa Mansa I . 654 . 16 B7 R Bron F . 1 X . o 6613 0 6614 9 6613 0 6609 5Buaben . 662 . 16 D7 R Bron F . 1 X . o 6608 3 6609 5 6608 3 6606 1Jato Zongo 167 . . . E7 R Bron S 1 . . o . . . . . . . . .Tato Bator 168 669 16 16 G7 R Bron S 1 . . o . 7709 28 7709 28 7709 28 6708 .Bobenyuron 169 . 16 . C11 R Nort S 2 . . x . . . . . . . . .Kwakro Akura . 670 . 16 F7 R Bron S . 1 . . o 7709 12 7709 12 7709 12 6706 7Kpandai/Kitare 170 677 16 16 H8 R Nort S 1 . . x o 7820 24 7820 24 7821 24 7821 24Dobum No.2 . 678 . 16 H8 R Nort S . 1 . . . 7822 1 7821 6 7822 1 7820 6Tangmaya 171 . 16 . G10 R Nort S 2 . . x . . . . . . . . .Zang 172 . 15 . H10 R Nort S 1 . . x . . . . . . . . .Yeshie . 686 . 32 G11 R Nort S . 2 . . o 7919 8 7919 8 7919 8 7915 0Zozali 173 . 32 . F11 R Nort S 2 . . o . . . . . . . . .Tuni 174 693 16 16 G12 R Nort S 1 1 X x o 7920 14 7921 19 7921 19 7916 0Gbenduri . 694 . 30 F12 R Nort S . 2 X . o 7910 7 7910 7 7910 7 7907 7Chagu 175 . 32 . C11 R UppW S 1 . . . . . . . . . . . .Jeyin Jamayiri 176 701 32 32 C12 R UppW S 1 1 X o o 8903 11 8902 17 8902 17 8902 12Brutu 177 . 16 . B13 R UppW S 1 . . o . . . . . . . . .Navrongo 179 . 16 . E13 R UppE S . . . x . . . . . . . . .Anur Yeri . 710 . 16 E13 R UppE S . 2 . . o 9909 6 9909 6 9909 6 9906 6Channia 180 717 16 16 E14 R UppE S 1 1 X x o 9908 3 9908 3 9908 3 9905 3Shiega-Won/Tongo . 718 . 32 F13 R UppE S . 1 . . o 9911 7 9911 7 9911 7 9908 7Kulbia-Nayire 181 . 16 . F13 R UppE S 1 . . . . . . . . . . . .Dua II 182 725 16 16 F13 R UppE S 1 . . x o 9915 3 9915 3 9915 3 9912 3Zoko Kanga . 726 . 16 F13 R UppE S . 1 . . o 9912 8 9914 8 9914 8 9911 0Yeliwoko 183 . 16 . G13 R UppE S 3 . . . . . . . . . . . .Nafkoliga 184 733 32 32 G13 R UppE S 1 1 X o o 9917 7 9914 75 9917 7 9914 6Zorsi-Natingo . 734 . 16 G14 R UppE S . 1 X . o 9918 4 9914 56 9914 56 9913 4Amankwakrom 186 741 16 16 H6 SU East S 1 . . o . 3421 9 3421 9 4810 25 3408 0Tsito . 742 . 16 H5 SU Volt F . . X . . 4804 1 4804 1 4804 1 4804 0Anfoega 187 . 16 . H5 SU Volt F . . . x . . . . . . . . .Damanko 188 749 16 16 H9 SU Volt S . . . x . 4823 0 7824 19 7824 19 4819 0Dwenem . 750 . 16 B7 R Bron F . 1 . . o 6615 0 6614 8 6615 0 6610 0
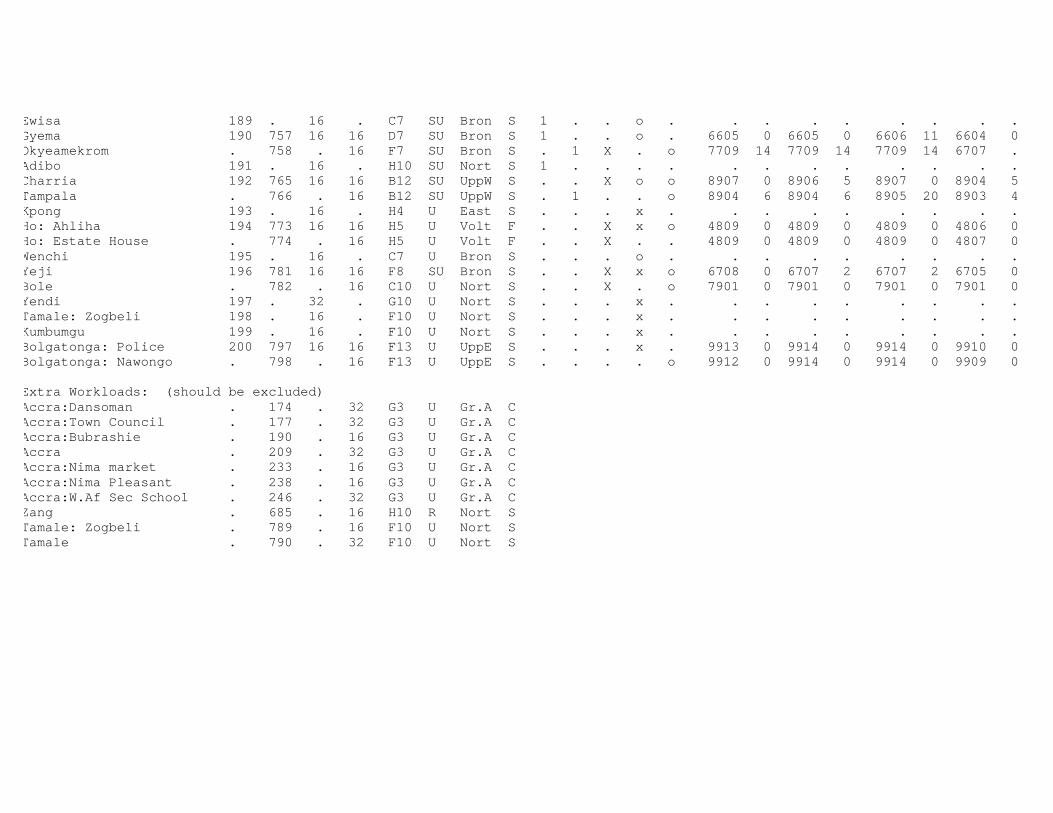
Ewisa 189 . 16 . C7 SU Bron S 1 . . o . . . . . . . . .Gyema 190 757 16 16 D7 SU Bron S 1 . . o . 6605 0 6605 0 6606 11 6604 0Okyeamekrom . 758 . 16 F7 SU Bron S . 1 X . o 7709 14 7709 14 7709 14 6707 .Adibo 191 . 16 . H10 SU Nort S 1 . . . . . . . . . . . .Charria 192 765 16 16 B12 SU UppW S . . X o o 8907 0 8906 5 8907 0 8904 5Tampala . 766 . 16 B12 SU UppW S . 1 . . o 8904 6 8904 6 8905 20 8903 4Kpong 193 . 16 . H4 U East S . . . x . . . . . . . . .Ho: Ahliha 194 773 16 16 H5 U Volt F . . X x o 4809 0 4809 0 4809 0 4806 0Ho: Estate House . 774 . 16 H5 U Volt F . . X . . 4809 0 4809 0 4809 0 4807 0Wenchi 195 . 16 . C7 U Bron S . . . o . . . . . . . . .Yeji 196 781 16 16 F8 SU Bron S . . X x o 6708 0 6707 2 6707 2 6705 0Bole . 782 . 16 C10 U Nort S . . X . o 7901 0 7901 0 7901 0 7901 0Yendi 197 . 32 . G10 U Nort S . . . x . . . . . . . . .Tamale: Zogbeli 198 . 16 . F10 U Nort S . . . x . . . . . . . . .Kumbumgu 199 . 16 . F10 U Nort S . . . x . . . . . . . . .Bolgatonga: Police 200 797 16 16 F13 U UppE S . . . x . 9913 0 9914 0 9914 0 9910 0Bolgatonga: Nawongo . 798 . 16 F13 U UppE S . . . . o 9912 0 9914 0 9914 0 9909 0
Extra Workloads: (should be excluded)Accra:Dansoman . 174 . 32 G3 U Gr.A CAccra:Town Council . 177 . 32 G3 U Gr.A CAccra:Bubrashie . 190 . 16 G3 U Gr.A CAccra . 209 . 32 G3 U Gr.A CAccra:Nima market . 233 . 16 G3 U Gr.A CAccra:Nima Pleasant . 238 . 16 G3 U Gr.A CAccra:W.Af Sec School . 246 . 32 G3 U Gr.A CZang . 685 . 16 H10 R Nort STamale: Zogbeli . 789 . 16 F10 U Nort STamale . 790 . 32 F10 U Nort S
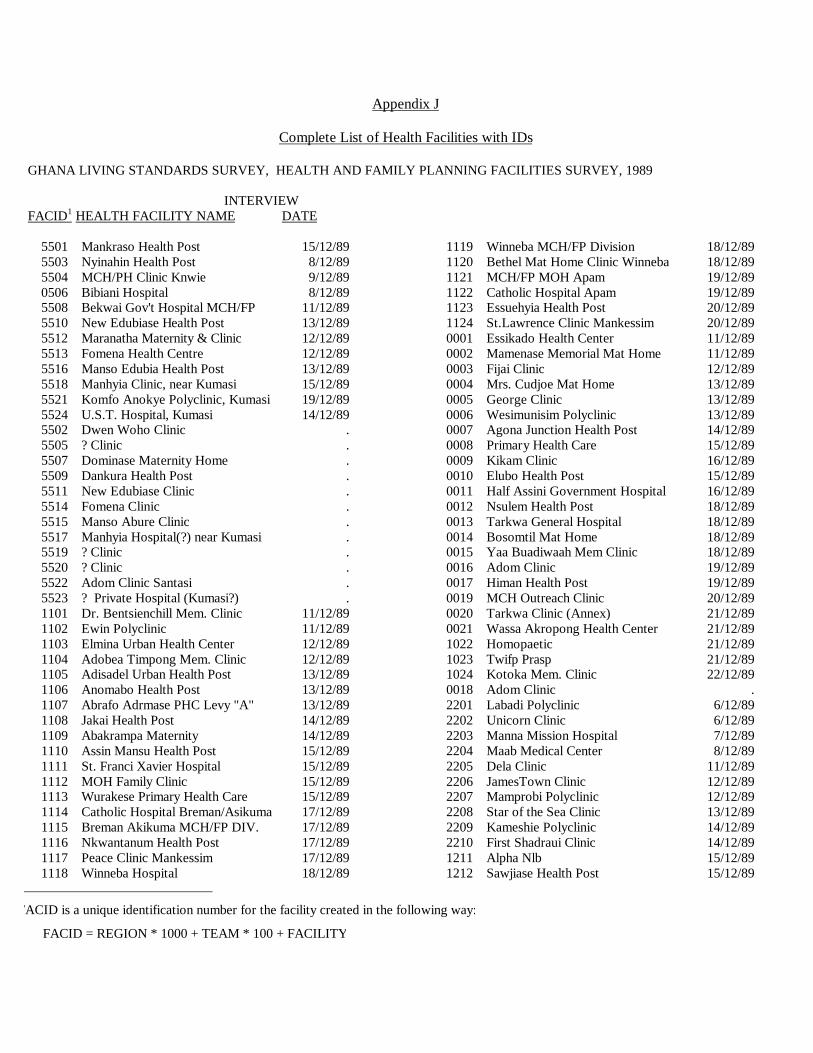
Appendix J
Complete List of Health Facilities with IDs
GHANA LIVING STANDARDS SURVEY, HEALTH AND FAMILY PLANNING FACILITIES SURVEY, 1989
INTERVIEWFACID1 HEALTH FACILITY NAME DATE
FACID is a unique identification number for the facility created in the following way:
FACID = REGION * 1000 + TEAM * 100 + FACILITY
5501 Mankraso Health Post 15/12/895503 Nyinahin Health Post 8/12/895504 MCH/PH Clinic Knwie 9/12/890506 Bibiani Hospital 8/12/895508 Bekwai Gov't Hospital MCH/FP 11/12/895510 New Edubiase Health Post 13/12/895512 Maranatha Maternity & Clinic 12/12/895513 Fomena Health Centre 12/12/895516 Manso Edubia Health Post 13/12/895518 Manhyia Clinic, near Kumasi 15/12/895521 Komfo Anokye Polyclinic, Kumasi 19/12/895524 U.S.T. Hospital, Kumasi 14/12/895502 Dwen Woho Clinic .5505 ? Clinic .5507 Dominase Maternity Home .5509 Dankura Health Post .5511 New Edubiase Clinic .5514 Fomena Clinic .5515 Manso Abure Clinic .5517 Manhyia Hospital(?) near Kumasi .5519 ? Clinic .5520 ? Clinic .5522 Adom Clinic Santasi .5523 ? Private Hospital (Kumasi?) .1101 Dr. Bentsienchill Mem. Clinic 11/12/891102 Ewin Polyclinic 11/12/891103 Elmina Urban Health Center 12/12/891104 Adobea Timpong Mem. Clinic 12/12/891105 Adisadel Urban Health Post 13/12/891106 Anomabo Health Post 13/12/891107 Abrafo Adrmase PHC Levy "A" 13/12/891108 Jakai Health Post 14/12/891109 Abakrampa Maternity 14/12/891110 Assin Mansu Health Post 15/12/891111 St. Franci Xavier Hospital 15/12/891112 MOH Family Clinic 15/12/891113 Wurakese Primary Health Care 15/12/891114 Catholic Hospital Breman/Asikuma 17/12/891115 Breman Akikuma MCH/FP DIV. 17/12/891116 Nkwantanum Health Post 17/12/891117 Peace Clinic Mankessim 17/12/891118 Winneba Hospital 18/12/89
1119 Winneba MCH/FP Division 18/12/891120 Bethel Mat Home Clinic Winneba 18/12/891121 MCH/FP MOH Apam 19/12/891122 Catholic Hospital Apam 19/12/891123 Essuehyia Health Post 20/12/891124 St.Lawrence Clinic Mankessim 20/12/890001 Essikado Health Center 11/12/890002 Mamenase Memorial Mat Home 11/12/890003 Fijai Clinic 12/12/890004 Mrs. Cudjoe Mat Home 13/12/890005 George Clinic 13/12/890006 Wesimunisim Polyclinic 13/12/890007 Agona Junction Health Post 14/12/890008 Primary Health Care 15/12/890009 Kikam Clinic 16/12/890010 Elubo Health Post 15/12/890011 Half Assini Government Hospital 16/12/890012 Nsulem Health Post 18/12/890013 Tarkwa General Hospital 18/12/890014 Bosomtil Mat Home 18/12/890015 Yaa Buadiwaah Mem Clinic 18/12/890016 Adom Clinic 19/12/890017 Himan Health Post 19/12/890019 MCH Outreach Clinic 20/12/890020 Tarkwa Clinic (Annex) 21/12/890021 Wassa Akropong Health Center 21/12/891022 Homopaetic 21/12/891023 Twifp Prasp 21/12/891024 Kotoka Mem. Clinic 22/12/890018 Adom Clinic .2201 Labadi Polyclinic 6/12/892202 Unicorn Clinic 6/12/892203 Manna Mission Hospital 7/12/892204 Maab Medical Center 8/12/892205 Dela Clinic 11/12/892206 JamesTown Clinic 12/12/892207 Mamprobi Polyclinic 12/12/892208 Star of the Sea Clinic 13/12/892209 Kameshie Polyclinic 14/12/892210 First Shadraui Clinic 14/12/891211 Alpha Nlb 15/12/891212 Sawjiase Health Post 15/12/89
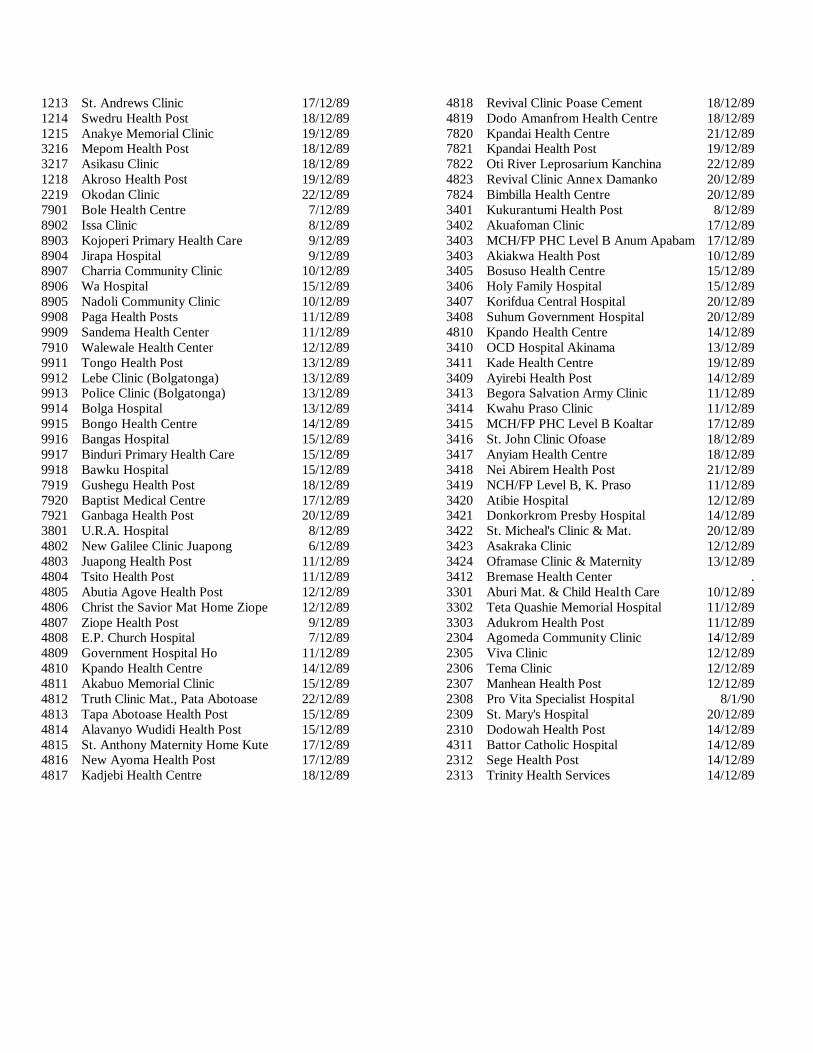
1213 St. Andrews Clinic 17/12/891214 Swedru Health Post 18/12/891215 Anakye Memorial Clinic 19/12/893216 Mepom Health Post 18/12/893217 Asikasu Clinic 18/12/891218 Akroso Health Post 19/12/892219 Okodan Clinic 22/12/897901 Bole Health Centre 7/12/898902 Issa Clinic 8/12/898903 Kojoperi Primary Health Care 9/12/898904 Jirapa Hospital 9/12/898907 Charria Community Clinic 10/12/898906 Wa Hospital 15/12/898905 Nadoli Community Clinic 10/12/899908 Paga Health Posts 11/12/899909 Sandema Health Center 11/12/897910 Walewale Health Center 12/12/899911 Tongo Health Post 13/12/899912 Lebe Clinic (Bolgatonga) 13/12/899913 Police Clinic (Bolgatonga) 13/12/899914 Bolga Hospital 13/12/899915 Bongo Health Centre 14/12/899916 Bangas Hospital 15/12/899917 Binduri Primary Health Care 15/12/899918 Bawku Hospital 15/12/897919 Gushegu Health Post 18/12/897920 Baptist Medical Centre 17/12/897921 Ganbaga Health Post 20/12/893801 U.R.A. Hospital 8/12/894802 New Galilee Clinic Juapong 6/12/894803 Juapong Health Post 11/12/894804 Tsito Health Post 11/12/894805 Abutia Agove Health Post 12/12/894806 Christ the Savior Mat Home Ziope 12/12/894807 Ziope Health Post 9/12/894808 E.P. Church Hospital 7/12/894809 Government Hospital Ho 11/12/894810 Kpando Health Centre 14/12/894811 Akabuo Memorial Clinic 15/12/894812 Truth Clinic Mat., Pata Abotoase 22/12/894813 Tapa Abotoase Health Post 15/12/894814 Alavanyo Wudidi Health Post 15/12/894815 St. Anthony Maternity Home Kute 17/12/894816 New Ayoma Health Post 17/12/894817 Kadjebi Health Centre 18/12/89
4818 Revival Clinic Poase Cement 18/12/894819 Dodo Amanfrom Health Centre 18/12/897820 Kpandai Health Centre 21/12/897821 Kpandai Health Post 19/12/897822 Oti River Leprosarium Kanchina 22/12/894823 Revival Clinic Annex Damanko 20/12/897824 Bimbilla Health Centre 20/12/893401 Kukurantumi Health Post 8/12/893402 Akuafoman Clinic 17/12/893403 MCH/FP PHC Level B Anum Apabam 17/12/893403 Akiakwa Health Post 10/12/893405 Bosuso Health Centre 15/12/893406 Holy Family Hospital 15/12/893407 Korifdua Central Hospital 20/12/893408 Suhum Government Hospital 20/12/894810 Kpando Health Centre 14/12/893410 OCD Hospital Akinama 13/12/893411 Kade Health Centre 19/12/893409 Ayirebi Health Post 14/12/893413 Begora Salvation Army Clinic 11/12/893414 Kwahu Praso Clinic 11/12/893415 MCH/FP PHC Level B Koaltar 17/12/893416 St. John Clinic Ofoase 18/12/893417 Anyiam Health Centre 18/12/893418 Nei Abirem Health Post 21/12/893419 NCH/FP Level B, K. Praso 11/12/893420 Atibie Hospital 12/12/893421 Donkorkrom Presby Hospital 14/12/893422 St. Micheal's Clinic & Mat. 20/12/893423 Asakraka Clinic 12/12/893424 Oframase Clinic & Maternity 13/12/893412 Bremase Health Center .3301 Aburi Mat. & Child Heal th Care 10/12/893302 Teta Quashie Memorial Hospital 11/12/893303 Adukrom Health Post 11/12/892304 Agomeda Community Clinic 14/12/892305 Viva Clinic 12/12/892306 Tema Clinic 12/12/892307 Manhean Health Post 12/12/892308 Pro Vita Specialist Hospital 8/1/902309 St. Mary's Hospital 20/12/892310 Dodowah Health Post 14/12/894311 Battor Catholic Hospital 14/12/892312 Sege Health Post 14/12/892313 Trinity Health Services 14/12/89
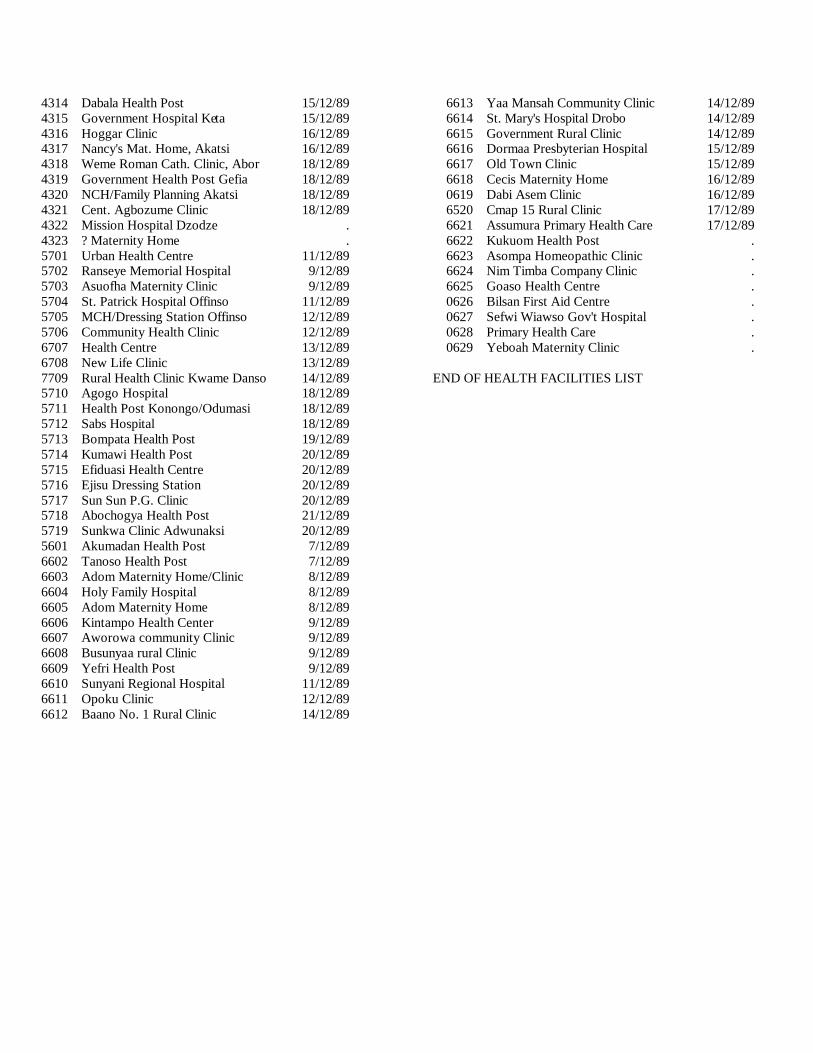
4314 Dabala Health Post 15/12/894315 Government Hospital Keta 15/12/894316 Hoggar Clinic 16/12/894317 Nancy's Mat. Home, Akatsi 16/12/894318 Weme Roman Cath. Clinic, Abor 18/12/894319 Government Health Post Gefia 18/12/894320 NCH/Family Planning Akatsi 18/12/894321 Cent. Agbozume Clinic 18/12/894322 Mission Hospital Dzodze .4323 ? Maternity Home .5701 Urban Health Centre 11/12/895702 Ranseye Memorial Hospital 9/12/895703 Asuofha Maternity Clinic 9/12/895704 St. Patrick Hospital Offinso 11/12/895705 MCH/Dressing Station Offinso 12/12/895706 Community Health Clinic 12/12/896707 Health Centre 13/12/896708 New Life Clinic 13/12/897709 Rural Health Clinic Kwame Danso 14/12/895710 Agogo Hospital 18/12/895711 Health Post Konongo/Odumasi 18/12/895712 Sabs Hospital 18/12/895713 Bompata Health Post 19/12/895714 Kumawi Health Post 20/12/895715 Efiduasi Health Centre 20/12/895716 Ejisu Dressing Station 20/12/895717 Sun Sun P.G. Clinic 20/12/895718 Abochogya Health Post 21/12/895719 Sunkwa Clinic Adwunaksi 20/12/895601 Akumadan Health Post 7/12/896602 Tanoso Health Post 7/12/896603 Adom Maternity Home/Clinic 8/12/896604 Holy Family Hospital 8/12/896605 Adom Maternity Home 8/12/896606 Kintampo Health Center 9/12/896607 Aworowa community Clinic 9/12/896608 Busunyaa rural Clinic 9/12/896609 Yefri Health Post 9/12/896610 Sunyani Regional Hospital 11/12/896611 Opoku Clinic 12/12/896612 Baano No. 1 Rural Clinic 14/12/89
6613 Yaa Mansah Community Clinic 14/12/896614 St. Mary's Hospital Drobo 14/12/896615 Government Rural Clinic 14/12/896616 Dormaa Presbyterian Hospital 15/12/896617 Old Town Clinic 15/12/896618 Cecis Maternity Home 16/12/890619 Dabi Asem Clinic 16/12/896520 Cmap 15 Rural Clinic 17/12/896621 Assumura Primary Health Care 17/12/896622 Kukuom Health Post .6623 Asompa Homeopathic Clinic .6624 Nim Timba Company Clinic .6625 Goaso Health Centre .0626 Bilsan First Aid Centre .0627 Sefwi Wiawso Gov't Hospital .0628 Primary Health Care .0629 Yeboah Maternity Clinic .
END OF HEALTH FACILITIES LIST