Getting Started with Creating a Basic Gantt Chart Using ...
11
1 ehu.ac.uk/techskills Contents Page Edge Hill University Create a Basic Gantt Chart Using Microsoft Excel Contents What is a Gantt chart? ............................................................................................................................ 2 Open Microsoft Excel .............................................................................................................................. 2 Add data to Excel .................................................................................................................................... 3 Select the data ........................................................................................................................................ 4 Select and insert a chart ......................................................................................................................... 5 Set up the chart....................................................................................................................................... 6 Format the Vertical Axis.......................................................................................................................... 7 Format the Horizontal Axis ..................................................................................................................... 8 Format the chart ..................................................................................................................................... 9 Title the chart ........................................................................................................................................ 10 Test the chart functionality................................................................................................................... 11
-
Upload
khangminh22 -
Category
Documents
-
view
0 -
download
0
Transcript of Getting Started with Creating a Basic Gantt Chart Using ...

1 ehu.ac.uk/techskills Contents Page
Edge Hill University Create a Basic Gantt Chart Using Microsoft Excel
Contents What is a Gantt chart? ............................................................................................................................ 2
Open Microsoft Excel .............................................................................................................................. 2
Add data to Excel .................................................................................................................................... 3
Select the data ........................................................................................................................................ 4
Select and insert a chart ......................................................................................................................... 5
Set up the chart ....................................................................................................................................... 6
Format the Vertical Axis .......................................................................................................................... 7
Format the Horizontal Axis ..................................................................................................................... 8
Format the chart ..................................................................................................................................... 9
Title the chart ........................................................................................................................................ 10
Test the chart functionality ................................................................................................................... 11

Edge Hill University | Create a Basic Gantt Chart Using Microsoft Excel
2 ehu.ac.uk/techskills Contents Page
What is a Gantt chart? A chart in which a series of horizontal lines show the amount of work done or production completed in certain periods of time in relation to the amount of time allocated for those periods.
Open Microsoft Excel We will create a basic Gantt chart example that could be used to display and manage the various activities or tasks involved in designing a website.
Open a blank Microsoft Excel worksheet.

Edge Hill University | Create a Basic Gantt Chart Using Microsoft Excel
3 ehu.ac.uk/techskills Contents Page
Add data to Excel To create a basic Gantt chart three columns of data will be used:
A] The individual activity or task carried out as part of the process
B] Start Date (the date the individual activity or task is started)
C] Duration (the number of days the activity or task takes to complete)
Click the top of Column B to select it and change the number format to Short Date.
Enter the data as shown in the image below.
Edge Hill University | Create a Basic Gantt Chart Using Microsoft Excel
4 ehu.ac.uk/techskills Contents Page
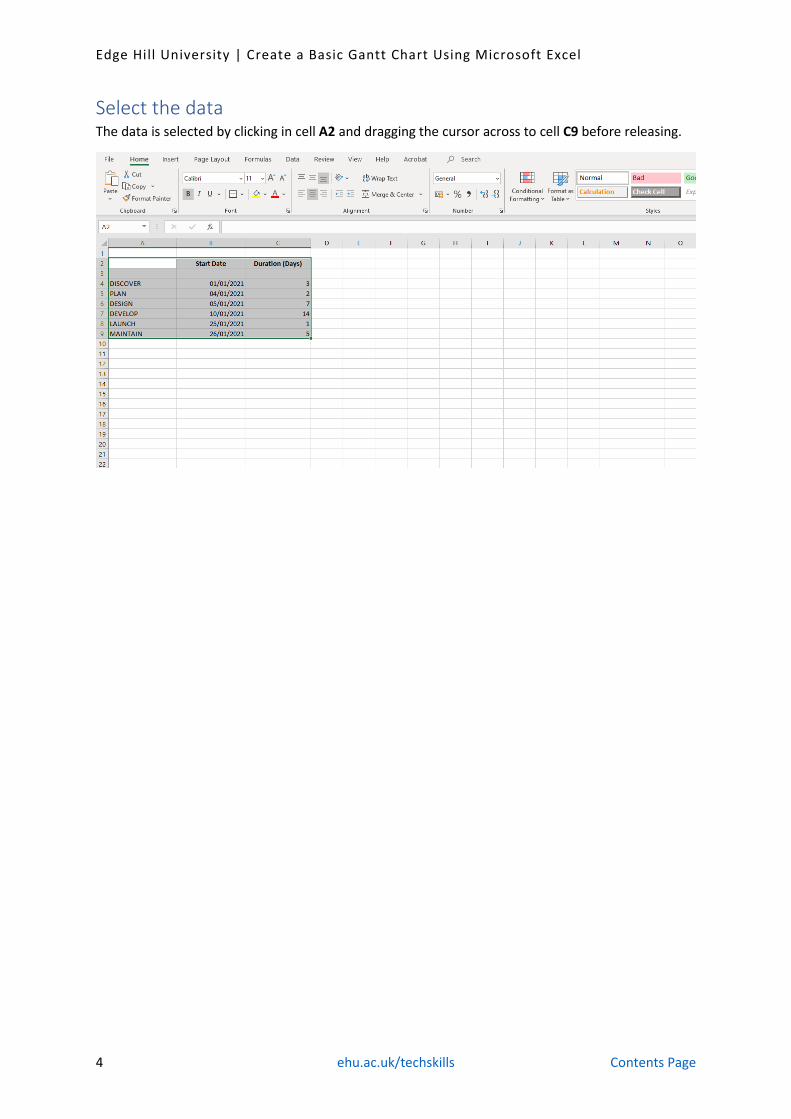
Select the data The data is selected by clicking in cell A2 and dragging the cursor across to cell C9 before releasing.

Edge Hill University | Create a Basic Gantt Chart Using Microsoft Excel
5 ehu.ac.uk/techskills Contents Page
Select and insert a chart With the data selected click on the Insert tab in the ribbon and then click the Column icon.
Now select the Stacked Bar option.
Edge Hill University | Create a Basic Gantt Chart Using Microsoft Excel
6 ehu.ac.uk/techskills Contents Page
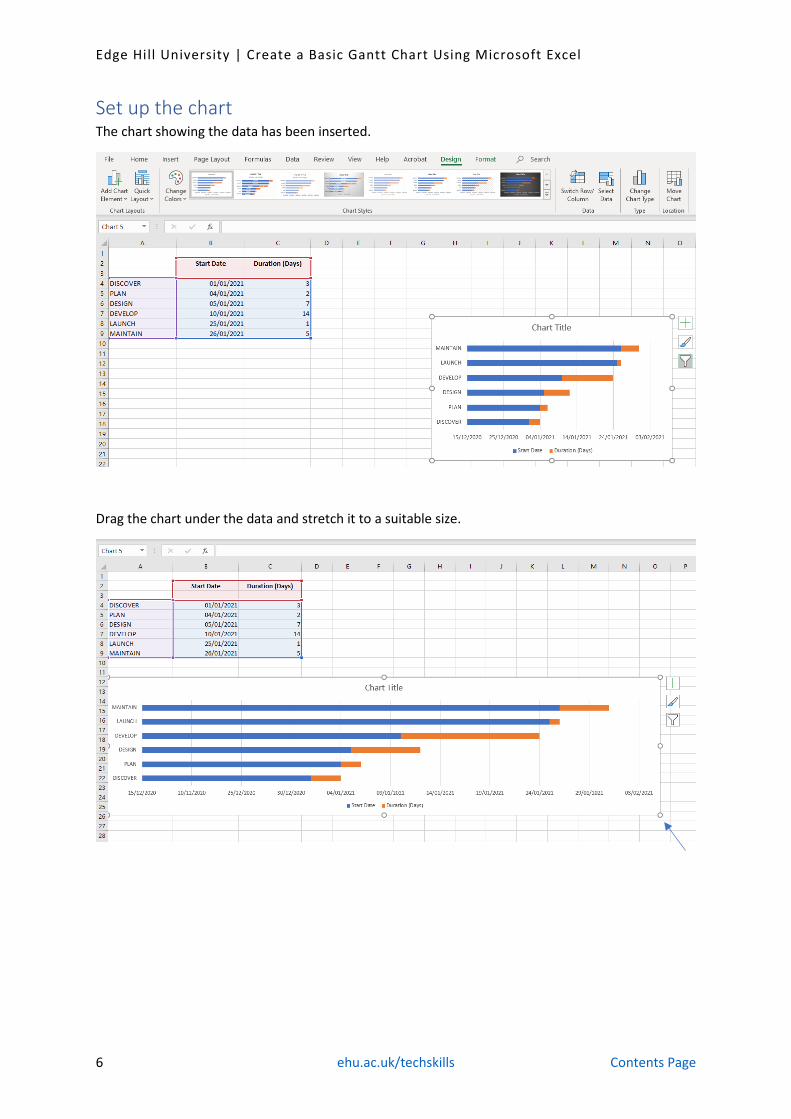
Set up the chart The chart showing the data has been inserted.
Drag the chart under the data and stretch it to a suitable size.
Edge Hill University | Create a Basic Gantt Chart Using Microsoft Excel
7 ehu.ac.uk/techskills Contents Page
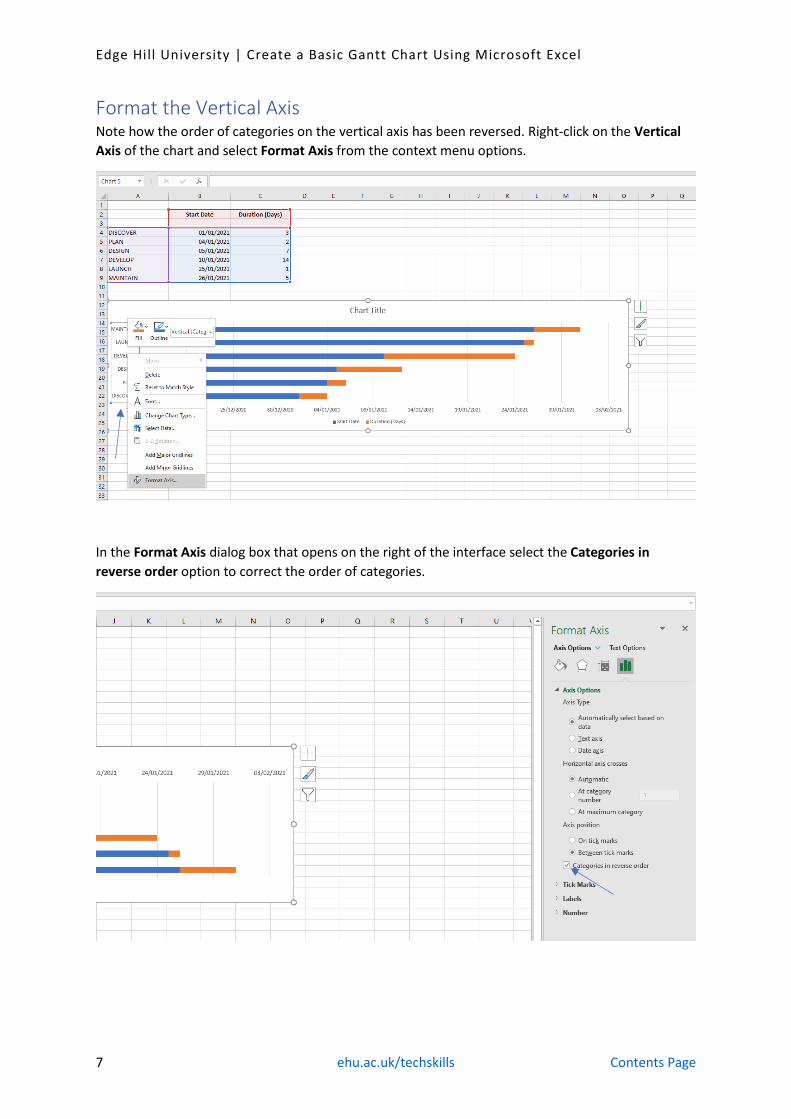
Format the Vertical Axis Note how the order of categories on the vertical axis has been reversed. Right-click on the Vertical Axis of the chart and select Format Axis from the context menu options.
In the Format Axis dialog box that opens on the right of the interface select the Categories in reverse order option to correct the order of categories.

Edge Hill University | Create a Basic Gantt Chart Using Microsoft Excel
8 ehu.ac.uk/techskills Contents Page
Format the Horizontal Axis Right-click on the Horizontal Axis of the chart and select Format Axis from the context menu options.
In the Format Axis dialog box that opens on the right of the interface enter the project start date 01-01-2021 in the Minimum Bounds field. Now enter the project end date 31-01-2021 in the Maximum Bounds field. Enter 7.0 into the Major Units field – this will divide the horizontal axis into 7-day weeks making the chart easier to understand. Excel uses numbers to function so automatically converts the two dates into the number of days since 01-01-1900.

Edge Hill University | Create a Basic Gantt Chart Using Microsoft Excel
9 ehu.ac.uk/techskills Contents Page
Format the chart Right-click on the blue chart bars and select Format Data Series from the context menu options.
Click on the Fill & Line icon then Click the Fill drop down arrow and select No fill from the options.

Edge Hill University | Create a Basic Gantt Chart Using Microsoft Excel
10 ehu.ac.uk/techskills Contents Page
Title the chart Click the chart title and change the text to New Website Project.
Remove the legend at the bottom of the chart by selecting it then pressing Delete.
Edge Hill University | Create a Basic Gantt Chart Using Microsoft Excel
11 ehu.ac.uk/techskills Contents Page
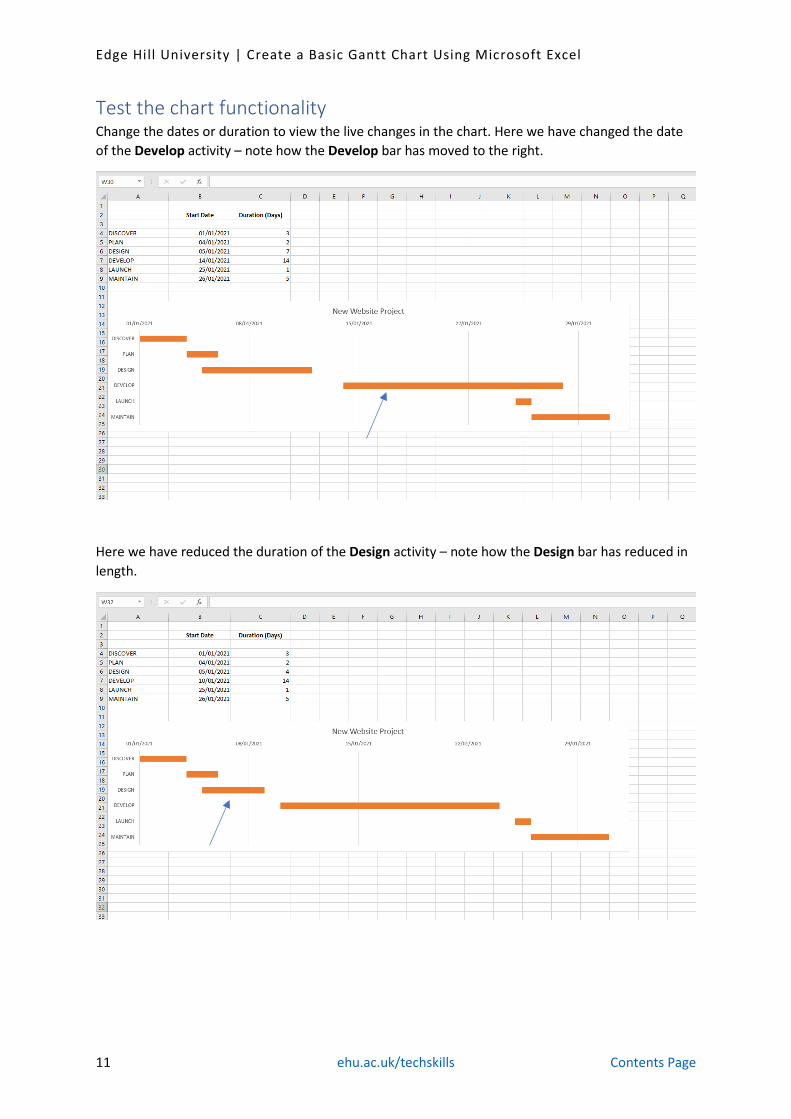
Test the chart functionality Change the dates or duration to view the live changes in the chart. Here we have changed the date of the Develop activity – note how the Develop bar has moved to the right.
Here we have reduced the duration of the Design activity – note how the Design bar has reduced in length.


![[Bulkowski]Getting Started in Chart Patterns(rasabourse.com ...](https://static.fdokumen.com/doc/165x107/6324293cb104cba27a090407/bulkowskigetting-started-in-chart-patternsrasaboursecom-.jpg)