GEORGIA TECH (6-4, 4-3 ACC) VS. VIRGINIA (7-3, 4-2 ACC)
55
GEORGIA TECH (6-4, 4-3 ACC) VS. VIRGINIA (7-3, 4-2 ACC) SATURDAY, NOVEMBER 17, 2018 • 3:30 P.M. ET • ATLANTA, GA. • BOBBY DODD STADIUM (55,000) GEORGIA TECH vs. VIRGINIA 6-4 (4-3 ACC) .............................................................................. Record ..............................................................................7-3 (4-2 ACC) Atlanta, Ga. ................................................................................ Location ....................................................................... Charlottesville, Va. 1885.......................................................................................... Founded ......................................................................................... 1819 29,000..................................................................................... Enrollment .................................................................................... 22,805 Yellow Jackets, Ramblin’ Wreck .................................................. Nickname ................................................................................... Cavaliers Tech Gold and White ..................................................................... Colors ........................................................................... Orange and Blue Atlantic Coast (Coastal Division) ................................................. Conference ................................................. Atlantic Coast (Coastal Division) Bobby Dodd Stadium at Historic Grant Field (55,000) ........... Stadium (Capacity) ...................................................... Scott Stadium (61,500) Paul Johnson ........................................................................... Head Coach .................................................................. Bronco Mendenhall 81-58 (11th season) ................................................ Head Coach’s Record at School .................................................. 15-19 (3rd season) 188-97 (22nd season) ............................................... Head Coach’s Overall Record ................................................ 114-63 (14th season) None ...................................................................................National Ranking................................................................................. NR/RV Spread Option......................................................................... Basic Offense .................................................................................. Multiple 37.6 (3rd/17th) ........................................... Points Per Game (Conference/National Rank).......................................... 28.4 (11th/71st) 362.4 (1st/1st) ..................................... Rushing Yards Per Game (Conference/National Rank) ................................... 175.3 (9th/59th) 88.4 (14th/126th) ................................. Passing Yards Per Game (Conference/National Rank) ................................. 201.1 (11th/91st) 450.8 (5th/32nd) ..................................... Total Yards Per Game (Conference/National Rank) .................................... 376.4 (12th/87th) 3-4 ....................................................................................... Basic Defense ....................................................................................... 3-4 27.5 (7th/67th) .................................... Points Allowed Per Game (Conference/National Rank) ................................... 19.7 (2nd/17th) 138.3 (6th/40th) ........................... Rushing Yards Allowed Per Game (Conference/National Rank) ........................... 136.3 (4th/37th) 218.0 (6th/53rd) ........................... Passing Yards Allowed Per Game (Conference/National Rank) ........................... 192.5 (4th/30th) 356.3 (4th/42nd) ............................. Total Yards Allowed Per Game (Conference/National Rank) ............................ 328.8 (3rd/23rd)) W, 27-21 vs. Miami (Fla.) (Nov. 10) ............................................ Last Game.....................................................W, 45-24 vs. Liberty (Nov. 10) MATCHUP AT A GLANCE • Overall: 6-4 | ACC: 4-3 | Place: 3rd (Coastal) • Home: 3-2 | Away: 3-2 | Neutral: 0-0 | Streak: W3 Date Opponent Time/Result TV Sept. 1 ALCORN STATE W, 41-0 RSN Sept. 8 at USF L, 49-38 ABC/ESPN2 Sept. 15 at Pitt* L, 24-19 RSN Sept. 22 No. 3/2 CLEMSON* L, 49-21 ABC Sept. 29 BOWLING GREEN W, 63-17 RSN Oct. 5 (Fri.) at Louisville* W, 66-31 ESPN Oct. 13 DUKE* L, 28-14 Raycom Oct. 25 (Thu.) at Virginia Tech* W, 49-28 ESPN Nov. 3 at North Carolina* W, 38-28 Raycom Nov. 10 MIAMI (FLA.)* W, 27-21 ESPN2 Nov. 17 VIRGINIA* 3:30 p.m. RSN Nov. 24 at No. 5 Georgia Noon SECN All times Eastern; Home games in BOLD CAPS * ACC game Ranks for past/current games = AP/Coaches ranks at time of game Ranks for future games = current AP/Coaches rank ON THE AIR TV: RSN • Play-by-Play .............................................. Wes Durham • Analyst ....................................................... James Bates • Sideline Reporter ................................... Rebecca Kaple • In Atlanta: Fox Sports South • Online: Fox Sports Go (in-market); WatchESPN.com (out-of-market) RADIO: Georgia Tech IMG Sports Network • Play-by-Play ............................................ Andy Demetra • Analyst ...................................................... Sean Bedford • Sideline Reporter ...................................... Wiley Ballard • In Atlanta: The Fan 680 AM / 93.7 FM • Across Georgia: Visit RamblinWreck.com for 31-station affiliate list • Satellite: Sirius 81 / XM 81 • Mobile App: GT Gameday • TuneIn: buzz.gt/LiveTuneIn 2018 GEORGIA TECH SCHEDULE/RESULTS GEORGIA TECH’S LAST GAME vs. Miami (Fla.) ................................................ W, 27-21 Date .................................................................... Nov. 10 Location........................ Atlanta, Ga. (Bobby Dodd Stadium Total Offense ............................................................ 304 Rushing ........................................................... 231 Passing.............................................................. 73 Turnovers ............................................................ 1 Total Defense ........................................................... 299 Rushing ........................................................... 134 Passing............................................................ 165 Takeaways .......................................................... 3 Passing Leader TaQuon Marshall ........................ 3-4-0, 73 yds., 1 TD Receiving Leaders Jalen Camp......................................... 2 rec., 42 yds. Brad Stewart ............................... 1 rec. 31 yds., 1 TD Rushing Leaders TaQuon Marshall ....................... 24 att., 91 yds., 2 TD Jerry Howard......................................12 att., 56 yds. Defensive Leaders Jalen Johnson ................................ 9 tackles, 3.0 TFL Brant Mitchell .................................. 8 tackles, 1 sack Charlie Thomas ..................... 3 tackles, 1 fumble rec. TOP STORYLINES Average heights and weights of players listed on the depth chart for each team: Georgia Tech Virginia 6-4, 283. ........... Offensive Line/Tight Ends............6-4, 293 6-0, 192 .........Offensive Backs (QB and RB) .......5-11, 208 6-3, 201 .......................... Receivers .........................6-0, 189 6-3, 283 ...................... Defensive Line ..................... 6-3, 272 6-1, 221 ........................ Linebackers .......................6-2, 227 6-1, 193 .................... Defensive Backs....................6-0, 191 TOP PERFORMERS AT A GLANCE PASSING COMP. ATT. INT. YDS. TD Georgia Tech TaQuon Marshall 39 80 4 718 4 Virginia Bryce Perkins 168 263 9 1,996 18 RUSHING ATT. YDS. AVG. TD Georgia Tech Tobias Oliver 133 781 5.9 12 Virginia Jordan Ellis 165 835 5.1 8 RECEIVING NO. YDS. AVG. TD Georgia Tech Clinton Lynch 7 209 29.9 2 Virginia Olamide Zaccheaus 67 807 12.0 6 TACKLES UT AT TT TFL SACK Georgia Tech Malik Rivera 27 23 50 0.5 — Virginia Juan Thornhill 45 24 69 3.0 — TALE OF THE TAPE Series Record (Streak): ................. Georgia Tech leads 20-19-1 (Virginia — W1) at Georgia Tech: ............................................................ Georgia Tech leads 16-7 at Virginia:..........................................................................Virginia leads 12-4-1 Neutral Sites: ...............................................................................................N/A Last Meeting: ..................... Virginia 40, GT 36 (Nov. 4, 2017 - Charlottesville, Va.) SERIES HISTORY • Riding its longest winning streak since 2016, Georgia Tech looks to keep the momentum rolling when it closes out Atlantic Coast Conference play versus Virginia. • Georgia Tech (6-4, 4-3 ACC) has rebounded from a 1-3 start with wins in five of its last six games, including three-straight. • The Yellow Jackets’ three-game winning streak is its longest since they closed the 2016 season with four-straight victories. Included in the season-ending four-game streak in ‘16 was a 31-17 win over Virginia in the home finale at Bobby Dodd Stadium. • Saturday’s matchup features two of the ACC’s hottest teams in Georgia Tech (winner of five of its last six games) and Virginia (7-3, 4-2 ACC — winner of four of its last five). • Georgia Tech reached two significant milestones with last Saturday’s 27-21 triumph over Miami. With the victory, the Yellow Jackets became bowl-eligible for the 20th time in the last 22 seasons. Additionally, the Jackets secured no worse than a .500 ACC record this season, marking the 23rd time in the last 24 seasons that they will finish .500 or better in conference play. • With a win on Saturday, Georgia Tech will be guaranteed to finish no worse than second place in the ACC’s Coastal Division for the seventh time in Paul Johnson’s 11 seasons as head coach. Since Johnson’s arrival on The Flats in 2008, the only ACC teams that have placed first or second in ACC divisional play as many times as the Yellow Jackets (6) are Clemson (8), Florida State (7) and Virginia Tech (7). 126 TH SEASON • 4 NATIONAL CHAMPIONSHIPS • 15 CONFERENCE CHAMPIONSHIPS • 44 BOWL APPEARANCES • 25 BOWL VICTORIES
-
Upload
khangminh22 -
Category
Documents
-
view
0 -
download
0
Transcript of GEORGIA TECH (6-4, 4-3 ACC) VS. VIRGINIA (7-3, 4-2 ACC)

GEORGIA TECH (6-4, 4-3 ACC) VS. VIRGINIA (7-3, 4-2 ACC)SATURDAY, NOVEMBER 17, 2018 • 3:30 P.M. ET • ATLANTA, GA. • BOBBY DODD STADIUM (55,000)
GEORGIA TECH vs. VIRGINIA6-4 (4-3 ACC) .............................................................................. Record ..............................................................................7-3 (4-2 ACC)Atlanta, Ga. ................................................................................ Location .......................................................................Charlottesville, Va.1885.......................................................................................... Founded ......................................................................................... 181929,000..................................................................................... Enrollment .................................................................................... 22,805Yellow Jackets, Ramblin’ Wreck ..................................................Nickname ................................................................................... CavaliersTech Gold and White .....................................................................Colors ...........................................................................Orange and BlueAtlantic Coast (Coastal Division) .................................................Conference ................................................. Atlantic Coast (Coastal Division) Bobby Dodd Stadium at Historic Grant Field (55,000) ...........Stadium (Capacity) ......................................................Scott Stadium (61,500)Paul Johnson ........................................................................... Head Coach ..................................................................Bronco Mendenhall81-58 (11th season) ................................................Head Coach’s Record at School ..................................................15-19 (3rd season)188-97 (22nd season) ...............................................Head Coach’s Overall Record ................................................114-63 (14th season)None ...................................................................................National Ranking .................................................................................NR/RVSpread Option .........................................................................Basic Offense ..................................................................................Multiple37.6 (3rd/17th) ........................................... Points Per Game (Conference/National Rank)..........................................28.4 (11th/71st)362.4 (1st/1st) .....................................Rushing Yards Per Game (Conference/National Rank) ...................................175.3 (9th/59th)88.4 (14th/126th) ................................. Passing Yards Per Game (Conference/National Rank) .................................201.1 (11th/91st)450.8 (5th/32nd) .....................................Total Yards Per Game (Conference/National Rank) ....................................376.4 (12th/87th)3-4 ....................................................................................... Basic Defense ....................................................................................... 3-427.5 (7th/67th) .................................... Points Allowed Per Game (Conference/National Rank) ...................................19.7 (2nd/17th)138.3 (6th/40th) ........................... Rushing Yards Allowed Per Game (Conference/National Rank) ...........................136.3 (4th/37th)218.0 (6th/53rd) ........................... Passing Yards Allowed Per Game (Conference/National Rank) ...........................192.5 (4th/30th)356.3 (4th/42nd) ............................. Total Yards Allowed Per Game (Conference/National Rank) ............................ 328.8 (3rd/23rd))W, 27-21 vs. Miami (Fla.) (Nov. 10) ............................................ Last Game .....................................................W, 45-24 vs. Liberty (Nov. 10)
MATCHUP AT A GLANCE
• Overall: 6-4 | ACC: 4-3 | Place: 3rd (Coastal)• Home: 3-2 | Away: 3-2 | Neutral: 0-0 | Streak: W3
Date Opponent Time/Result TV
Sept. 1 ALCORN STATE W, 41-0 RSN
Sept. 8 at USF L, 49-38 ABC/ESPN2
Sept. 15 at Pitt* L, 24-19 RSN
Sept. 22 No. 3/2 CLEMSON* L, 49-21 ABC
Sept. 29 BOWLING GREEN W, 63-17 RSN
Oct. 5 (Fri.) at Louisville* W, 66-31 ESPN
Oct. 13 DUKE* L, 28-14 Raycom
Oct. 25 (Thu.) at Virginia Tech* W, 49-28 ESPN
Nov. 3 at North Carolina* W, 38-28 Raycom
Nov. 10 MIAMI (FLA.)* W, 27-21 ESPN2
Nov. 17 VIRGINIA* 3:30 p.m. RSN
Nov. 24 at No. 5 Georgia Noon SECN
All times Eastern; Home games in BOLD CAPS * ACC gameRanks for past/current games = AP/Coaches ranks at time of gameRanks for future games = current AP/Coaches rank
ON THE AIRTV: RSN• Play-by-Play .............................................. Wes Durham • Analyst ....................................................... James Bates • Sideline Reporter ................................... Rebecca Kaple • In Atlanta: Fox Sports South• Online: Fox Sports Go (in-market); WatchESPN.com (out-of-market)
RADIO: Georgia Tech IMG Sports Network• Play-by-Play ............................................ Andy Demetra• Analyst ...................................................... Sean Bedford• Sideline Reporter ...................................... Wiley Ballard• In Atlanta: The Fan 680 AM / 93.7 FM• Across Georgia: Visit RamblinWreck.com for 31-station affiliate list • Satellite: Sirius 81 / XM 81• Mobile App: GT Gameday• TuneIn: buzz.gt/LiveTuneIn
2018 GEORGIA TECH SCHEDULE/RESULTS
GEORGIA TECH’S LAST GAMEvs. Miami (Fla.) ................................................ W, 27-21Date ....................................................................Nov. 10Location ........................ Atlanta, Ga. (Bobby Dodd StadiumTotal Offense ............................................................ 304 Rushing ........................................................... 231 Passing .............................................................. 73 Turnovers ............................................................ 1Total Defense ........................................................... 299 Rushing ........................................................... 134 Passing ............................................................ 165 Takeaways .......................................................... 3Passing Leader TaQuon Marshall ........................3-4-0, 73 yds., 1 TDReceiving Leaders Jalen Camp .........................................2 rec., 42 yds. Brad Stewart ...............................1 rec. 31 yds., 1 TDRushing Leaders TaQuon Marshall .......................24 att., 91 yds., 2 TD Jerry Howard ......................................12 att., 56 yds.Defensive Leaders Jalen Johnson ................................9 tackles, 3.0 TFL Brant Mitchell .................................. 8 tackles, 1 sack Charlie Thomas ..................... 3 tackles, 1 fumble rec.
TOP STORYLINESAverage heights and weights of players listed on the depth
chart for each team:Georgia Tech Virginia
6-4, 283. ........... Offensive Line/Tight Ends ............6-4, 293
6-0, 192 .........Offensive Backs (QB and RB) .......5-11, 208
6-3, 201 ..........................Receivers .........................6-0, 189
6-3, 283 ......................Defensive Line .....................6-3, 272
6-1, 221 ........................Linebackers .......................6-2, 227
6-1, 193 .................... Defensive Backs....................6-0, 191
TOP PERFORMERS AT A GLANCEPASSING COMP. ATT. INT. YDS. TDGeorgia TechTaQuon Marshall 39 80 4 718 4VirginiaBryce Perkins 168 263 9 1,996 18 RUSHING ATT. YDS. AVG. TDGeorgia TechTobias Oliver 133 781 5.9 12VirginiaJordan Ellis 165 835 5.1 8 RECEIVING NO. YDS. AVG. TDGeorgia TechClinton Lynch 7 209 29.9 2VirginiaOlamide Zaccheaus 67 807 12.0 6
TACKLES UT AT TT TFL SACKGeorgia TechMalik Rivera 27 23 50 0.5 —VirginiaJuan Thornhill 45 24 69 3.0 —
TALE OF THE TAPE
Series Record (Streak): .................Georgia Tech leads 20-19-1 (Virginia — W1)
at Georgia Tech: ............................................................Georgia Tech leads 16-7
at Virginia: ..........................................................................Virginia leads 12-4-1
Neutral Sites: ...............................................................................................N/A
Last Meeting: ..................... Virginia 40, GT 36 (Nov. 4, 2017 - Charlottesville, Va.)
SERIES HISTORY
• Riding its longest winning streak since 2016, Georgia Tech looks to keep the momentum rolling when it closes out Atlantic Coast Conference play versus Virginia.
• Georgia Tech (6-4, 4-3 ACC) has rebounded from a 1-3 start with wins in five of its last six games, including three-straight.
• The Yellow Jackets’ three-game winning streak is its longest since they closed the 2016 season with four-straight victories. Included in the season-ending four-game streak in ‘16 was a 31-17 win over Virginia in the home finale at Bobby Dodd Stadium.
• Saturday’s matchup features two of the ACC’s hottest teams in Georgia Tech (winner of five of its last six games) and Virginia (7-3, 4-2 ACC — winner of four of its last five). • Georgia Tech reached two significant milestones with last Saturday’s 27-21 triumph over Miami. With the victory, the Yellow Jackets became bowl-eligible for the 20th time in the last 22 seasons. Additionally, the Jackets secured no worse than a .500 ACC record this season, marking the 23rd time in the last 24 seasons that they will finish .500 or better in conference play.
• With a win on Saturday, Georgia Tech will be guaranteed to finish no worse than second place in the ACC’s Coastal Division for the seventh time in Paul Johnson’s 11 seasons as head coach. Since Johnson’s arrival on The Flats in 2008, the only ACC teams that have placed first or second in ACC divisional play as many times as the Yellow Jackets (6) are Clemson (8), Florida State (7) and Virginia Tech (7).
126TH SEASON • 4 NATIONAL CHAMPIONSHIPS • 15 CONFERENCE CHAMPIONSHIPS • 44 BOWL APPEARANCES • 25 BOWL VICTORIES

2
2018 GEORGIA TECH FOOTBALL GAME NOTESGAME 11 vs. VIRGINIA • NOV. 17 • ATLANTA, GA.
GEORGIA TECH MEDIA AVAILABILITY
GEORGIA TECH ATHLETICS COMMUNICATIONS & PUBLIC RELATIONS• Assistant A.D./Communications & P.R. (Primary Football Contact): Mike Flynn Office: (404) 894-5445 • Mobile: (828) 964-6406 Email: [email protected]
• Assistant Director/Communications & P.R. (Secondary Football Contact): Andrew Clausen Office: (404) 894-5445 • Cell: (704) 301-2818 Email: [email protected]
• Associate Director/Communications & P.R. (Football Credentials): Mike Stamus Office: 404-894-5445 • Cell: (404) 218-9723 Email: [email protected]
FOLLOW GEORGIA TECH ONLINEOFFICIAL WEBSITE: www.RamblinWreck.com
@GTAthletics@GeorgiaTechFB@GTPaulJohnson
/GTAthletics/GTFootball
@GTAthletics@GeorgiaTechFB
TogetherWeSwarm
RamblinWreckTube
GEORGIA TECH FOOTBALL BY THE NUMBERS
1Georgia Tech continues to put up unprecedented numbers in its rushing game. The Yellow Jackets are ranked No. 1 nation-ally in rushing offense with 362.4 yards on the ground per game, a whopping 55.2 yards per game more than the nation’s No. 2-ranked rushing offense, Army West Point (307.2 ypg). To put the gap between No. 1 Georgia Tech and No. 2 Army in perspective, the 55.2-yards-per-game gap between the Yellow Jackets and the Black Knights is larger than the gap between Army and No. 10 Pitt (256.9 ypg).
3Georgia Tech has three defensive touchdowns through 10 games this season, which is tied for the most in the ACC (with Miami and Wake Forest) and 10th nationally (Fresno State and Temple lead the nation with five defensive TDs apiece).
5Georgia Tech has already set a new school record with five 400-yard rushing games this season, breaking the previous record of four set just last season.
23Georgia Tech has forced 23 turnovers in 10 games this season after finishing last season with 10 takeaways in 11 games. The Yellow Jackets are currently tied for sixth nationally in takeaways after finishing last season ranked 124th out of 128 NCAA Division I FBS teams.
24Georgia Tech will honor its 24 seniors prior to Saturday’s home finale. The student-athletes being recognized on Senior Day include LB Victor Alexander, DL Desmond Branch, OL Will Bryan, DL Kyle Cerge-Henderson, AB Melvin Davis, PK Shawn Davis*, WR Carson Fletcher*, DB A.J. Gray, OL Cheyenne Hunt, OL Bailey Ivemeyer*, LB Tre Jackson, LB Jalen Johnson, AB Clinton Lynch, DL Antonio Mallard, OL Andrew Marshall, QB TaQuon Marshall, DL Tyler Merriweather, LB Brant Mitchell, DB Malik Rivera, LS Zach Roberts, DL Anree Saint-Amour, AB Qua Searcy, DB Lamont Simmons and WR Brad Stewart.* denotes underclassmen eligibility-wise that plan to graduate and forego their remaining eligibility
26Twenty-six of the 34 400-yard rushing games in Georgia Tech history (including five this season) have come in Paul John-son’s 11 seasons as the Yellow Jackets’ head coach (2008-pres.). Since Johnson’s arrival on The Flats, Georgia Tech has rushed for 400 yards in a game 26 times in 139 contests (once every 5.3 games). Prior to his arrival, the Yellow Jackets had rushed for 400 yards in a game eight times in 1,138 contests (once every 142.3 games). Johnson’s previous team, Navy, is the only NCAA Division I FBS team that has more 400-yard rushing games since 2008 (33). The second-most 400-yard rush-ing games by a Power 5 conference team since ‘08 is 12 by Oregon.
• move it to 7-4 overall;
• be its fifth ACC win of the season (5-3), marking the seventh time in Paul Johnson’s 11 seasons as head coach that the Yellow Jackets have won at least five conference games (prior to Johnson’s arrival in 2008, the Jackets had won five conference games just seven times in 16 seasons since the ACC began playing an eight-game league schedule in 1992);
• ensure that the Yellow Jackets will finish no worse than tied for second in the ACC Coastal Division for the seventh time in Johnson’s 11 seasons as head coach;
• be its fourth-straight victory, which match its longest win-ning streak since 2014 (Tech also won four games in a row to close the 2016 season);
• be its 12th win in its last 15 home games;
• be its fourth-straight home win over Virginia;
• up it to 21-19-1 all-time versus UVA.
A GEORGIA TECH LOSS WOULD ...• drop it to 6-5 overall;
• give it a final ACC record of 4-4;
• give it consecutive losses to Virginia for the first time since 2007-08;
• even the all-time series with UVA at 20-20-1.
A GEORGIA TECH WIN WOULD ...
MON 124 p.m. - First three periods of practice open to local photographers/videographers that regularly cover GT (Rose Bowl Field)
Approx. 5:15 p.m. – 3-4 defensive student-athletes (Bobby Dodd Stadium – Gate 6 Lobby, adjacent to Callaway Plaza)
TUE 1311:30 a.m. - Head coach Paul Johnson weekly press conference (Bobby Dodd Stadium – Letterwinners Lounge)
3:45 p.m. - First three peri-ods of practice open to local photographers/videographers that regularly cover GT (Rose Bowl Field)
Approx. 5:45 p.m. – 3-4 offensive student-athletes (Bobby Dodd Stadium – Gate 6 Lobby, adjacent to Callaway Plaza)
WED 1411:30 a.m. - Head coach Paul Johnson on ACC media teleconference
3:45 p.m. - First three peri-ods of practice open to local photographers/videographers that regularly cover GT (Rose Bowl Field)
Approx. 5:45 p.m. – Head coach Paul Johnson (Bobby Dodd Stadium – Gate 6 Lobby, adjacent to Callaway Plaza)
THU 15NO AVAILABILITY
FRI 16NO AVAILABILITY
SAT 17Postgame press conference - Head coach Paul Johnson and selected student-athletes (Edge/Rice Center museum area – north end of Bobby Dodd Stadium)
SUN 185 p.m. - Head coach Paul Johnson media teleconference

2018 GEORGIA TECH FOOTBALL GAME NOTESGAME 11 vs. VIRGINIA • NOV. 17 • ATLANTA, GA.
3
NOTING LAST WEEK’S WIN OVER MIAMI• For the 20th time in the last 22 years, Georgia Tech became bowl-eligible after dropping visiting Miami (Fla.), 27-21, last Saturday night at Bobby Dodd Stadium.
• Taking the majority of Georgia Tech’s snaps at QB for the first time since sustaining an upper-body injury vs. Duke on Oct. 13, Sr. TaQuon Marshall was responsible for 165 yards (92 rushing, 73 passing) and three touchdowns (two rushing, one passing).
• In addition to his touchdown runs of 28 and 8 yards and a 31-yard TD pass to Sr. WR Brad Stewart, Marshall led the Yellow Jackets on a 12-play drive that milked the final 6:43 off the clock after Miami scored to make it 27-21 in the fourth quarter.
• Marshall and the Jackets converted three third downs on the game-clinching drive, including a pivotal 22-yard pass to Jalen Camp on third-and-6 for the initial first down of the possession.
• Sr. OLB Jalen Johnson led Georgia Tech defensively with a career-high-tying nine tackles and a career-high three tackles for loss, en route to being named ACC Linebacker of the Week.
• The win was Georgia Tech’s third-straight, good for its longest winning streak since it won four games in a row to close the 2016 season.
• Georgia Tech snapped a three-game losing streak against Miami and beat the Hurricanes for the third time in head coach Paul Johnson’s 11 seasons with the Yellow Jackets.
• Georgia Tech had a season-high-tying three takeaways (all fumble recoveries), which led directly to 13 points.
• Georgia Tech’s three fumble recoveries were its most in a game since it recovered six in a 56-28 win at Pittsburgh on Oct. 25, 2014.
• Miami’s three lost fumbles were its most in a game since it lost three in a 52-13 loss at Kansas State on Sept. 8, 2012.
• Georgia Tech Fr. OLB Charlie Thomas’ fumble recovery in the second quarter was his third of the season, the most by a Yellow Jacket in a single season since Quayshawn Nealy in 2014 (3).
• Thomas is only the fourth Yellow Jacket in Johnson’s 11 seasons as Georgia Tech’s head coach with as many as three fumble recoveries in a season (Derrick Morgan – 4, 2008; Jerrard Terrant – 3, 2010; Nealy – 3, 2014).
• Georgia Tech true freshman PK Wesley Wells was 2-of-2 on field-goal attempts (38 and 23 yards), marking the first time in his career that he made multiple field goals in a game.
• Wells also made 3-of-3 PAT attempts and moved to a perfect 39-of-39 on kick attempts this season (4-of-4 on field goals, 35-of-35 on extra points).
NOTING VIRGINIA• Virginia brings a 7-3 overall record (4-2 ACC) into Saturday’s game.
• Virginia’s seven wins are its most since it finished 8-5 in 2011.
• The Cavaliers are still alive for a berth in the ACC Championship game, needing wins over Georgia Tech and Virginia Tech (Nov. 24) and losses by division-leading Pitt to Wake Forest (Saturday) and Miami (Nov. 24) to represent the Coastal Division versus Clemson in the ACC title game on Dec. 1 in Charlotte, N.C.
• Virginia features a defense that is ranked among the nation’s top 25 in scoring (17th - 19.7 ppg) and total defense (23rd - 328.8 ypg).
• The Cavaliers are led defensively by Sr. S Juan Thornhill and Jr. CB Bryce Hall. Thornhill leads the team in tackles (69) and is tied for third nationally with five interceptions. Hall leads the nation with 19 passes defended (two interceptions and 17 pass breakups).
• Additonally, Sr. LB Chris Peace leads UVA with six sacks, 10 tackles for loss, 12 quarterback hurries and two forced fumbles.
• On the offensive side of the ball, the Cavaliers are led by QB Bryce Perkins, a junior transfer from Arizona Western Community College. In his first season at UVA, Perkins has thrown for 1,996 yards and 18 touchdowns and run for 657 yards and a team-high-tying eight scores.
• Perkins leads the ACC and ranks 18th nationally in points responsible for (15.8 per game).
• Perkins’ top target in the passing game is Sr. Olamide Zaccheaus, who has caught 67 passes (6.7 pg - 15th nationally) for 807 yards and six touchdowns.
GEORGIA TECH-VIRGINIA SERIES HISTORY• Georgia Tech and Virginia are squaring off for the 41st time in a series that dates back to 1965 and for the 37th-straight year dating back to 1982, one year prior to Georgia Tech becoming a full-fledged member of the ACC.
• The Yellow Jackets hold a 20-19-1 advantage in the all-time series.
• Georgia Tech is 6-4 versus UVA under head coach Paul Johnson, including wins in four of the last six matchups.
• Overall, the Yellow Jackets have won seven of the last 12 contests versus the Cavaliers.
• Georgia Tech is 16-7 all-time at home versus Virginia, including a 4-1 mark under Johnson.
• The Yellow Jackets have won each of their last four home games against the Cavaliers by an average score of 39-17.
• Virginia head coach Bronco Mendenhall is 3-1 versus Georgia Tech. As head coach at BYU, Mendenhall’s Cougars beat GT in 2012 (41-17) and 2013 (38-20). Since Menden-hall’s arrival at UVA in 2016, the Cavaliers are 1-1 against the Yellow Jackets (a 31-17 loss in 2016 and a 40-36 victory last season).
• On Nov. 3, 1990, Georgia Tech claimed one of the most memorable wins in program history over Virginia, a 41-38 triumph over the top-ranked Cavaliers in Charlottesville, Va. The Yellow Jackets, which trailed 28-14 at halftime, rallied for the win on Scott Sisson’s 37-yard field goal with seven seconds remaining. The victory over No. 1 UVA propelled the Yellow Jackets to their first ACC championship (8-0) and their fourth national title (11-0-1). The win was one of only two that Georgia Tech has ever recorded over the nation’s top-ranked team (the other was a 7-6 triumph over No. 1 Alabama on Nov. 17, 1962).
GEORGIA TECH-VIRGINIA SERIES RESULTS RANK GT RESULTDATE GT UVA H/A W/L/T SCORE11/13/1965 – – H W 42-1911/5/1966 5 – H W 14-1310/5/1974 – – H W 28-2410/2/1976 – – H W 35-1411/6/1982 – – H W 38-3211/3/1983 (TH) – – H W 31-2710/13/1984 20 – A T 20-209/21/1985 – – H L 13-249/20/1986 – – A W 28-1411/7/1987 – – H L 14-239/17/1988 – – A L 16-179/16/1989 – – H L 10-1711/3/1990 16/14 1/1 A W 41-389/19/1991 (TH) 17/19 – H W 24-219/19/1992 22/20 20/19 A L 24-559/16/1993 (TH) – 25/23 H L 14-3510/15/1994 – – H L 7-249/16/1995 – 16/17 A L 14-4110/5/1996 – 12/11 H W 13-711/8/1997 – – A L 31-3510/17/1998 25/25 7/6 H W 41-3811/6/1999 7/7 – A L 38-4511/9/2000 (TH) 24/- – H W 35-011/10/2001 20/17 – A L 38-3910/26/2002 – – H W 23-1511/22/2003 – – A L 17-2911/20/2004 – 18/18 H L 10-3011/12/2005 24/24 – A L 17-279/21/2006 (TH) – – H W 24-79/22/2007 – – A L 23-2810/25/2008 21/21 – H L 17-2410/24/2009 11/13 – A W 34-910/9/2010 – – H W 33-2110/15/2011 12/12 – A L 21-249/15/2012 rv/rv -/rv H W 56-2010/26/2013 – – A W 35-2511/1/2014 – – H W 35-1010/31/2015 – – A L 21-2711/19/2016 – – H W 31-1711/4/2017 – – A L 36-40
2018 ACC STANDINGSCOASTAL DIVISION ACC OVERALL STREAK
Pitt 5-1 6-4 W3
Virginia 4-2 7-3 W1
GEORGIA TECH 4-3 6-4 W3
Duke 3-3 7-3 W2
Virginia Tech 3-3 4-5 L3
Miami 2-4 5-5 L4
North Carolina 1-6 1-8 L6
ATLANTIC DIVISION ACC OVERALL STREAK
Clemson 7-0 10-0 W10
Syracuse 5-2 8-2 W4
Boston College 4-2 7-3 L1
NC State 3-3 6-3 L1
Wake Forest 2-5 5-5 W1
Florida State 2-4 4-6 L3
Louisville 0-7 2-8 L7

4
2018 GEORGIA TECH FOOTBALL GAME NOTESGAME 11 vs. VIRGINIA • NOV. 17 • ATLANTA, GA.
ASSOCIATED PRESS TOP 25 POLL (NOV. 11)Team (1st-place votes) Record Points Trend1 Alabama (61) 10-0 1525 —
2 Clemson 10-0 1459 —
3 Notre Dame 10-0 1406 —
4 Michigan 9-1 1327 —
5 Georgia 9-1 1288 —
6 Oklahoma 9-1 1188 —
7 West Virginia 8-1 1111 —
8 Washington State 9-1 1052 +2
9 Ohio State 9-1 1050 -1
10 LSU 8-2 1019 -1
11 UCF 9-0 983 —
12 Syracuse 8-2 787 +1
13 Texas 7-3 726 +2
14 Utah State 9-1 689 —
15 Florida 7-3 575 +4
16 Penn State 7-3 542 +5
17 Washington 7-3 501 +3
18 Iowa State 6-3 497 +5
19 Cincinnati 9-1 344 +6
20 Kentucky 7-3 337 -8
21 Utah 7-3 307 NR
22 Boston College 7-3 254 -5
23 Boise State 8-2 147 NR
24 Northwestern 6-4 136 NR
25 Mississippi State 6-4 133 -7
Others receiving votes: Army 128, UAB 78, Fresno State 61,
Michigan State 31, NC State 30, Buffalo 29, Pittsburgh 28, Duke
20, Texas A&M 16, Iowa 8, Arizona State 6, Stanford 3, Auburn
3, Troy 1
AMWAY COACHES TOP 25 POLL (NOV. 11)Team (1st-place votes) Points Record Trend1 Alabama (64) 10-0 1624 —
2 Clemson (1) 10-0 1561 —
3 Notre Dame 10-0 1490 —
4 Michigan 9-1 1415 —
5 Georgia 9-1 1369 —
6 Oklahoma 9-1 1273 —
7 West Virginia 8-1 1173 +1
8 Ohio State 9-1 1135 -1
9 Washington State 9-1 1119 —
10 LSU 8-2 1078 —
11 UCF 9-0 1042 —
12 Syracuse 8-2 849 +1
13 Utah State 9-1 698 +3
14 Texas 7-3 662 +5
15 Penn State 7-3 646 +5
16 Florida 7-3 604 +5
17 Washington 7-3 591 +1
18 Iowa State 6-3 403 +7
19 Utah 7-3 387 +5
20 Cincinnati 9-1 383 +3
21 Kentucky 7-3 318 -9
22 Boston College 7-3 309 -8
23 Mississippi State 6-4 219 -8
24 Boise State 8-2 129 NR
25 UAB 9-1 102 NR
Others receiving votes: Northwestern 87, Fresno State 64, Army
58, Buffalo 56, Virginia 44, Duke 38, NC State 37, Pittsburgh
30, Texas A&M 29, Michigan State 20, Auburn 19, Troy 17, Ap-
palachian State 14, Missouri 13, San Diego State 10, Wisconsin 7,
Arizona State 2, Tennessee 1
Georgia Tech opponents in italics
NOTING LAST YEAR’S LOSS AT VIRGINIA• Virginia scored the go-ahead touchdown with 1:22 to go in a 40-36 win over Georgia Tech on Nov. 4, 2017 at Scott Stadium in Charlottesville, Va.
• The heartbreaking loss marked the third time last season that Georgia Tech’s opponent scored the winning points with 82 seconds or less to go in regulation or in overtime.
• The wild game featured four lead changes, including three in the fourth quarter and two in the final 3:10 of the contest.
• Trailing 33-28 with just over seven minutes to play, Geor-gia Tech marched 90 yards in nine plays and took a 36-33 lead on a 33-yard touchdown pass from TaQuon Marshall to Ricky Jeune.
• However, on its subsequent possession, Virginia drove 64 yards in just five plays, capped by a 27-yard touchdown pass from Kurt Benkert to Andre Levrone that gave the Cavs a 40-36 lead with 1:22 to go.
• Highlighted by a 35-yard catch by Jeune on fourth-and-16, the Yellow Jackets drove all the way to the UVA 32 yard line on their final possession but turned the ball over on downs with 15 seconds remaining.
• Marshall accounted for 322 yards (143 rushing, 179 passing) and three touchdowns (two rushing, one passing) in the defeat.
• Making his first-career start, true freshman LB Bruce Jordan-Swilling recorded his first forced fumble, fumble recovery, interception and defensive touchdown. He forced and recovered a fumble on the same play in the second quarter, which led to a Georgia Tech touchdown. On Vir-ginia’s first offensive play of the second half, he returned an interception 27 yards for a touchdown.
GEORGIA TECH vs. NATIONALLY RANKED TEAMS• Georgia Tech has 92 wins in 271 all-time matchups versus teams ranked in the Associated Press Top 25.
• The Yellow Jackets officially own 12 wins over ranked teams in 10 seasons under head coach Paul Johnson. A 13th victory, a 39-34 triumph over No. 25 Clemson in the 2009 ACC Championship Game, was later vacated due to NCAA sanctions.
GEORGIA TECH vs. AP TOP 25UNDER PAUL JOHNSONNov. 1, 2008 No. 16 Florida State W, 31-28Nov. 8, 2008 at No. 19 North Carolina L, 28-7Nov. 20, 2008 No. 23 Miami (Fla.) W, 41-23Nov. 29, 2008 at No. 13 Georgia W, 45-42Sept. 17, 2009 at No. 17 Miami (Fla.) L, 33-17Sept. 26, 2009 No. 22 North Carolina W, 24-7Oct. 17, 2009 No. 4 Virginia Tech W, 28-23Dec. 5, 2009 vs. No. 25 Clemson W, 39-34 #*Jan. 5, 2009 vs. No. 10 Iowa L, 24-14^Nov. 4, 2010 at No. 20 Virginia Tech L, 28-21 Oct. 29, 2011 No. 6 Clemson W, 31-17Nov. 10, 2011 No. 10 Virginia Tech L, 37-26Nov. 26, 2011 No. 13 Georgia L, 31-17Sept. 3, 2012 at No. 16 Virginia Tech L, 20-17 (OT)Oct. 6, 2012 at No. 15 Clemson L, 47-31Nov. 24, 2012 at No. 3 Georgia L, 42-10Dec. 1, 2012 vs. No. 13 Florida State L, 21-15 #Oct. 5, 2013 at No. 14 Miami (Fla.) L, 45-30Nov. 14, 2013 at No. 8 Clemson L, 55-31Nov. 15, 2014 No. 18 Clemson W, 28-6Nov. 29, 2014 at No. 9 Georgia W, 30-24 (OT)Dec. 6, 2014 vs. No. 2 Florida State L, 37-35 #Dec. 31, 2014 vs. No. 8 Mississippi State W, 49-34^Sept. 19, 2015 at No. 8 Notre Dame L, 30-22Oct. 10, 2015 at No. 6 Clemson L, 43-24Oct. 24, 2015 No. 9 Florida State W, 22-16Sept. 22, 2016 No. 5 Clemson L, 26-7Oct. 1, 2016 No. 14 Miami (Fla.) L, 35-21Nov. 5, 2016 at No. 18 North Carolina L, 48-20Nov. 12, 2016 at No. 18 Virginia Tech W, 30-20Sept. 4, 2017 vs. No. 25 Tennessee L, 42-41 (2OT)Oct. 14, 2017 at No. 11 Miami (Fla.) L, 25-24Oct. 28, 2017 at No. 7 Clemson L, 24-10Nov. 11, 2017 vs. No. 17 Virginia Tech W, 28-22Nov. 25, 2017 vs. No. 7 Georgia L, 38-7Sept. 22, 2018 vs. No. 3 Clemson L, 49-21
# ACC Championship Game^ Orange Bowl* Win vacated due to NCAA sanctions
GEORGIA TECH ALL-TIME vs. AP TOP 25 ALL H A N BOWLTop 25 92-173-6 49-76-4 26-84-2 17-13 16-8vs. ACC 29-50 18-20 10-23 1-2 0-0vs. No. 1 2-9-1 1-1-1 1-8 0-0 0-0vs. No. 2 0-10-1 0-5-1 0-4 0-1 0-0vs. No. 3 1-11 0-6 1-5 0-0 0-0vs. No. 4 3-9 2-5 1-4 0-0 0-0vs. No. 5 3-12 1-8 2-4 0-0 0-0vs. No. 6 5-6 3-4 1-2 1-0 1-0vs. No. 7 3-12 2-4 0-6 1-2 1-1vs. No. 8 5-10 3-4 1-6 1-0 1-0vs. No. 9 7-11 4-3 1-6 1-1 1-1vs. No. 10 4-10 0-4 1-5 3-1 3-1vs. No. 11 4-7 1-2 1-4 2-1 2-1vs. No. 12 5-6 2-2 2-4 1-0 1-0vs. No. 13 5-7 2-2 2-3 1-2 1-1vs. No. 14 2-11 1-6 1-5 0-0 0-0vs. No. 15 4-6-2 3-5-1 0-1-1 1-0 1-0vs. No. 16 5-5-2 4-0-1 1-4-1 0-1 0-0vs. No. 17 9-5 6-2 1-1 2-2 2-2vs. No. 18 7-7 4-3 3-4 0-0 0-0vs. No. 19 7-3 2-1 3-2 2-0 2-0vs. No. 20 4-7 3-4 1-3 0-0 0-0vs. No. 21 1-1 1-1 0-0 0-0 0-0vs. No. 22 2-4 2-2 0-2 0-0 0-0vs. No. 23 3-1 1-0 2-0 0-1 0-1vs. No. 24 0-0 0-0 0-0 0-0 0-0vs. No. 25 2-4* 1-2 0-1 1-1 0-0
* Win vacated due to NCAA sanctions
2018 GEORGIA TECH FOOTBALL GAME NOTESGAME 11 vs. VIRGINIA • NOV. 17 • ATLANTA, GA.
5
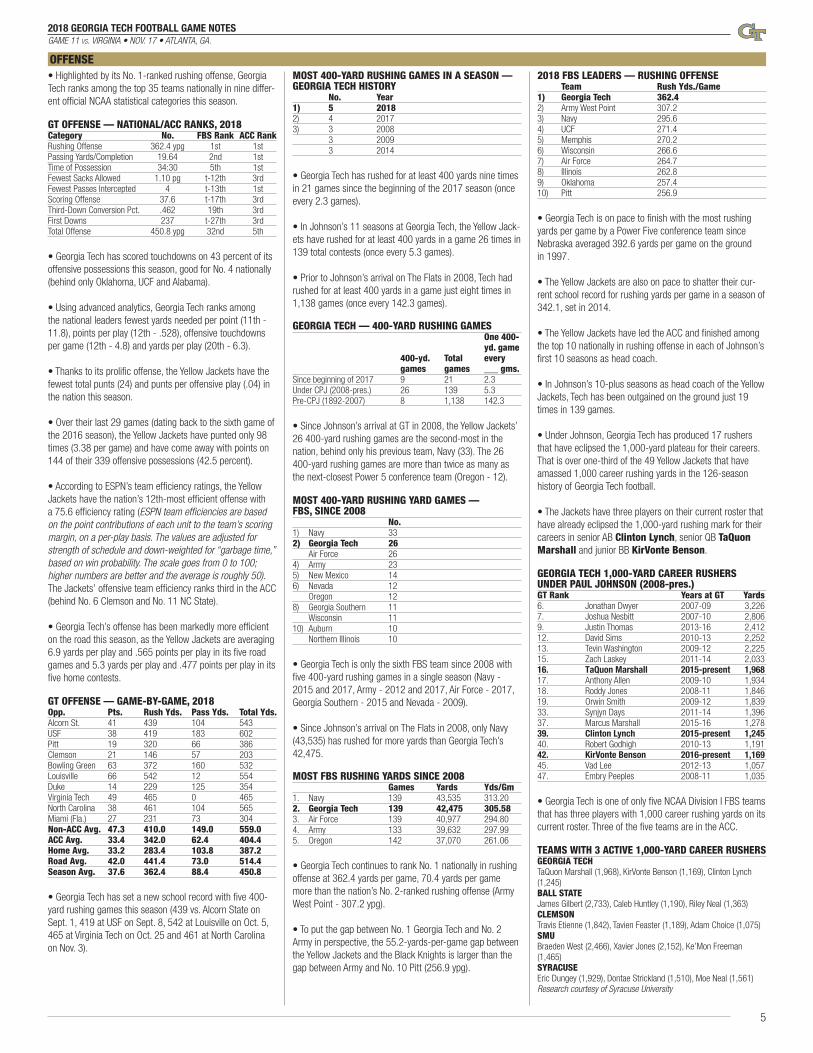
• Highlighted by its No. 1-ranked rushing offense, Georgia Tech ranks among the top 35 teams nationally in nine differ-ent official NCAA statistical categories this season.
GT OFFENSE — NATIONAL/ACC RANKS, 2018Category No. FBS Rank ACC RankRushing Offense 362.4 ypg 1st 1stPassing Yards/Completion 19.64 2nd 1stTime of Possession 34:30 5th 1stFewest Sacks Allowed 1.10 pg t-12th 3rdFewest Passes Intercepted 4 t-13th 1stScoring Offense 37.6 t-17th 3rdThird-Down Conversion Pct. .462 19th 3rdFirst Downs 237 t-27th 3rdTotal Offense 450.8 ypg 32nd 5th
• Georgia Tech has scored touchdowns on 43 percent of its offensive possessions this season, good for No. 4 nationally (behind only Oklahoma, UCF and Alabama).
• Using advanced analytics, Georgia Tech ranks among the national leaders fewest yards needed per point (11th - 11.8), points per play (12th - .528), offensive touchdowns per game (12th - 4.8) and yards per play (20th - 6.3).
• Thanks to its prolific offense, the Yellow Jackets have the fewest total punts (24) and punts per offensive play (.04) in the nation this season.
• Over their last 29 games (dating back to the sixth game of the 2016 season), the Yellow Jackets have punted only 98 times (3.38 per game) and have come away with points on 144 of their 339 offensive possessions (42.5 percent).
• According to ESPN’s team efficiency ratings, the Yellow Jackets have the nation’s 12th-most efficient offense with a 75.6 efficiency rating (ESPN team efficiencies are based on the point contributions of each unit to the team’s scoring margin, on a per-play basis. The values are adjusted for strength of schedule and down-weighted for “garbage time,” based on win probability. The scale goes from 0 to 100; higher numbers are better and the average is roughly 50). The Jackets’ offensive team efficiency ranks third in the ACC (behind No. 6 Clemson and No. 11 NC State).
• Georgia Tech’s offense has been markedly more efficient on the road this season, as the Yellow Jackets are averaging 6.9 yards per play and .565 points per play in its five road games and 5.3 yards per play and .477 points per play in its five home contests.
GT OFFENSE — GAME-BY-GAME, 2018Opp. Pts. Rush Yds. Pass Yds. Total Yds.Alcorn St. 41 439 104 543USF 38 419 183 602Pitt 19 320 66 386Clemson 21 146 57 203Bowling Green 63 372 160 532Louisville 66 542 12 554Duke 14 229 125 354Virginia Tech 49 465 0 465North Carolina 38 461 104 565Miami (Fla.) 27 231 73 304Non-ACC Avg. 47.3 410.0 149.0 559.0ACC Avg. 33.4 342.0 62.4 404.4Home Avg. 33.2 283.4 103.8 387.2Road Avg. 42.0 441.4 73.0 514.4Season Avg. 37.6 362.4 88.4 450.8
• Georgia Tech has set a new school record with five 400-yard rushing games this season (439 vs. Alcorn State on Sept. 1, 419 at USF on Sept. 8, 542 at Louisville on Oct. 5, 465 at Virginia Tech on Oct. 25 and 461 at North Carolina on Nov. 3).
MOST 400-YARD RUSHING GAMES IN A SEASON — GEORGIA TECH HISTORY No. Year1) 5 20182) 4 20173) 3 2008 3 2009 3 2014
• Georgia Tech has rushed for at least 400 yards nine times in 21 games since the beginning of the 2017 season (once every 2.3 games).
• In Johnson’s 11 seasons at Georgia Tech, the Yellow Jack-ets have rushed for at least 400 yards in a game 26 times in 139 total contests (once every 5.3 games).
• Prior to Johnson’s arrival on The Flats in 2008, Tech had rushed for at least 400 yards in a game just eight times in 1,138 games (once every 142.3 games).
GEORGIA TECH — 400-YARD RUSHING GAMES One 400- yd. game 400-yd. Total every games games ___ gms.Since beginning of 2017 9 21 2.3Under CPJ (2008-pres.) 26 139 5.3Pre-CPJ (1892-2007) 8 1,138 142.3
• Since Johnson’s arrival at GT in 2008, the Yellow Jackets’ 26 400-yard rushing games are the second-most in the nation, behind only his previous team, Navy (33). The 26 400-yard rushing games are more than twice as many as the next-closest Power 5 conference team (Oregon - 12).
MOST 400-YARD RUSHING YARD GAMES — FBS, SINCE 2008 No.1) Navy 332) Georgia Tech 26 Air Force 264) Army 235) New Mexico 146) Nevada 12 Oregon 128) Georgia Southern 11 Wisconsin 1110) Auburn 10 Northern Illinois 10
• Georgia Tech is only the sixth FBS team since 2008 with five 400-yard rushing games in a single season (Navy - 2015 and 2017, Army - 2012 and 2017, Air Force - 2017, Georgia Southern - 2015 and Nevada - 2009).
• Since Johnson’s arrival on The Flats in 2008, only Navy (43,535) has rushed for more yards than Georgia Tech’s 42,475.
MOST FBS RUSHING YARDS SINCE 2008 Games Yards Yds/Gm1. Navy 139 43,535 313.202. Georgia Tech 139 42,475 305.583. Air Force 139 40,977 294.804. Army 133 39,632 297.995. Oregon 142 37,070 261.06
• Georgia Tech continues to rank No. 1 nationally in rushing offense at 362.4 yards per game, 70.4 yards per game more than the nation’s No. 2-ranked rushing offense (Army West Point - 307.2 ypg).
• To put the gap between No. 1 Georgia Tech and No. 2 Army in perspective, the 55.2-yards-per-game gap between the Yellow Jackets and the Black Knights is larger than the gap between Army and No. 10 Pitt (256.9 ypg).
OFFENSE2018 FBS LEADERS — RUSHING OFFENSE Team Rush Yds./Game1) Georgia Tech 362.42) Army West Point 307.23) Navy 295.64) UCF 271.45) Memphis 270.26) Wisconsin 266.67) Air Force 264.78) Illinois 262.89) Oklahoma 257.410) Pitt 256.9
• Georgia Tech is on pace to finish with the most rushing yards per game by a Power Five conference team since Nebraska averaged 392.6 yards per game on the ground in 1997.
• The Yellow Jackets are also on pace to shatter their cur-rent school record for rushing yards per game in a season of 342.1, set in 2014.
• The Yellow Jackets have led the ACC and finished among the top 10 nationally in rushing offense in each of Johnson’s first 10 seasons as head coach.
• In Johnson’s 10-plus seasons as head coach of the Yellow Jackets, Tech has been outgained on the ground just 19 times in 139 games.
• Under Johnson, Georgia Tech has produced 17 rushers that have eclipsed the 1,000-yard plateau for their careers. That is over one-third of the 49 Yellow Jackets that have amassed 1,000 career rushing yards in the 126-season history of Georgia Tech football.
• The Jackets have three players on their current roster that have already eclipsed the 1,000-yard rushing mark for their careers in senior AB Clinton Lynch, senior QB TaQuon Marshall and junior BB KirVonte Benson.
GEORGIA TECH 1,000-YARD CAREER RUSHERS UNDER PAUL JOHNSON (2008-pres.)GT Rank Years at GT Yards6. Jonathan Dwyer 2007-09 3,2267. Joshua Nesbitt 2007-10 2,8069. Justin Thomas 2013-16 2,41212. David Sims 2010-13 2,25213. Tevin Washington 2009-12 2,22515. Zach Laskey 2011-14 2,03316. TaQuon Marshall 2015-present 1,96817. Anthony Allen 2009-10 1,93418. Roddy Jones 2008-11 1,84619. Orwin Smith 2009-12 1,83933. Synjyn Days 2011-14 1,39637. Marcus Marshall 2015-16 1,27839. Clinton Lynch 2015-present 1,24540. Robert Godhigh 2010-13 1,19142. KirVonte Benson 2016-present 1,16945. Vad Lee 2012-13 1,05747. Embry Peeples 2008-11 1,035
• Georgia Tech is one of only five NCAA Division I FBS teams that has three players with 1,000 career rushing yards on its current roster. Three of the five teams are in the ACC. TEAMS WITH 3 ACTIVE 1,000-YARD CAREER RUSHERSGEORGIA TECHTaQuon Marshall (1,968), KirVonte Benson (1,169), Clinton Lynch (1,245)BALL STATEJames Gilbert (2,733), Caleb Huntley (1,190), Riley Neal (1,363)CLEMSONTravis Etienne (1,842), Tavien Feaster (1,189), Adam Choice (1,075)SMUBraeden West (2,466), Xavier Jones (2,152), Ke’Mon Freeman (1,465)SYRACUSEEric Dungey (1,929), Dontae Strickland (1,510), Moe Neal (1,561)Research courtesy of Syracuse University

6
2018 GEORGIA TECH FOOTBALL GAME NOTESGAME 11 vs. VIRGINIA • NOV. 17 • ATLANTA, GA.
GEORGIA TECH — MOST SINGLE-GAME POINTS(AP POLL ERA - 1936-PRES.) Pts. Opponent Date1) 70 Navy Sept. 8, 2001 70 Elon Aug. 31, 20133) 69 Samford Sept. 8, 2007 69 Alcorn State Sept. 3, 20155) 68 North Carolina Nov. 10, 20126) 66 Louisville Oct. 5, 2018 66 Kansas Sept. 17, 2011 66 Alabama A&M Nov. 23, 20139) 65 Tulane Sept. 12, 201510) 63 Bowling Green Sept. 29, 2018 63 Wake Forest Nov. 21, 1998 63 Western Carolina Sept. 1, 2011
• The Yellow Jackets’ 66 points against Louisville are tied for the 13th-most scored by an NCAA Division I FBS team this season (most: 79 - Fresno State vs. Idaho, Sept. 1) and the third-most scored against a Power Five conference op-ponent this season (most: 77 - Ohio State vs. Oregon State, Sept. 1 and Clemson vs. Louisville, Nov. 3).
• The Yellow Jackets’ 66 points against Louisville are tied for the third-most ever scored by an ACC team on the road, be-hind only Georgia Tech’s 70 points at Navy on Sept 8, 2001 and Tech’s 68 points at North Carolina on Nov. 10, 2012.
• Georgia Tech rushed for 542 yards against Louisville, the third-highest total in modern school history and the most that it has ever amassed on the ground in a conference game (prev.: 479 at NC State, Nov. 8, 2014).
• The 500-yard rushing game against Louisville was the sixth in modern Georgia Tech history.
GEORGIA TECH — 500-YARD RUSHING GAMES(AP POLL ERA - 1936-PRES.) Rush Yds. Opponent Date1) 604 Kansas Sept. 17, 20112) 558 VMI Oct. 11, 19753) 542 Louisville Oct. 5, 20184) 535 Tennessee Sept. 4, 20175) 518 Tulane Oct. 22, 19776) 510 Air Force Nov. 11, 1978
• GT’s 542 rushing yards against Louisville remain the most in a game by an NCAA Division I FBS team this season (No. 2: 503 - Texas A&M vs. Northwestern State, Aug. 30).
• The Yellow Jackets’ 542 yards on the ground against Lou-isville were the most by an FBS team since Navy ran for 559 yards at SMU on Nov. 11 of last season and were the most by and against a Power Five conference team since Auburn ran for 543 yards at Arkansas on Oct. 22, 2016.
• In its six wins this season, Georgia Tech has turned the ball over a total of seven times (1.17 per game - although all six of the seven came against Alcorn State-3 and North Carolina-3). In their four losses, the Yellow Jackets have turned the ball over nine times (2.25 per game).
• After committing nine turnovers through the first 13 quarters of this season (first three games plus first quarter of Game 4 vs. Clemson), Georgia Tech went 234-consecu-tive plays (offensive snaps plus returns) without a turnover over the next 13 quarters (final three quarters vs. Clemson, full games vs. Bowling Green and Louisville and first two quarters vs. Duke).
• However, that streak came to emphatic halt when the Yellow Jackets lost fumbles on three-straight plays late in the third quarter of its 28-14 loss to Duke on Oct. 13. Those fumbles (by BB Jerry Howard, QB TaQuon Marshall and KR Juanyeh Thomas) led directly to Duke scoring 21 points in the final 1:49 of the third period, turning what was a 7-7 ballgame into a 28-14 defeat.
OFFENSE• A by-product of the Yellow Jackets’ prolific rushing game has been an ultra-efficient, albeit infrequently utilized, pass-ing attack. Over the past two games (Nov. 3 at North Caro-lina and last Saturday vs. Miami), GT has completed 5-of-6 passes for 177 yards and two touchdowns. That is good for 29.5 yards per pass attempt, 35.4 yards per completion and a 441.13 passing efficiency rating.
• Georgia Tech’s first pass completion since the fourth quar-ter of the Duke game (Oct. 13) was an 86-yard touchdown pass.
• The Jackets’ 86-yard touchdown pass from r-Fr. QB Tobias Oliver to Sr. AB Qua Searcy in the second quarter at North Carolina (Nov. 3) was the sixth-longest pass play in school history and Tech’s longest since an 87-yard touchdown pass from Joshua Nesbitt to Embry Peebles vs. Vanderbilt on Oct. 31, 2009.
LONGEST PASS PLAYS — GEORGIA TECH HISTORY Players Yds. Opponent Year1. B. Shaw-C. Rogers 96 (TD) UCF 19962. T. Peebles-D. Hill 90 (TD) Duke 19783. J. Shaw-D. Thomas 88 (TD) Duke 20084. D. Gast-G. Lester 87 (TD) Duke 1987 J. Nesbitt-E. Peebles 87 (TD) Vanderbilt 20096. T. Oliver-Q. Searcy 86 (TD) North Carolina 20187. J. Thomas-C. Lynch 83 (TD) North Carolina 20168. S. Jones-K. Walker 82 (TD) Maryland 1991 T. Washington-S. Hill 82 (TD) Western Carolina 2011 V. Lee-J. Greene 82 (TD) Presbyterian 2012
• In its back-to-back road wins at Virginia Tech (Oct. 25) and North Carolina (Nov. 3), Georgia Tech amassed 1,030 yards of total offense on 152 rushing attempts and just three passes.
• At UNC, the Yellow Jackets compiled 565 yards of offense — 461 yards on 74 carries (6.2 avg.) and 104 yards on 2-of-2 passing (52.0 avg.).
• Georgia Tech rushed on 78 of its 79 plays at Virginia Tech (Oct. 25), compiling 465 rushing yards and zero passing yards in a 49-28 win.
• The Jackets’ 465 rushing yards against Virginia Tech were the most allowed by VT since 1973.
• All seven of Georgia Tech’s touchdowns against Virginia Tech came on the ground, which was tied for the fifth-most rushing touchdowns in GT history and were the most al-lowed by VT since 1974.
MOST RUSHING TDS — GT SINGLE-GAME HISTORY No. Opp. Date 1) 9 Samford Sept. 8, 2007 9 Alcorn State Sept. 3, 20153) 8 Louisville Oct. 5, 2018 8 Alabama A&M Nov. 23, 20135) 7 Virginia Tech Oct. 25, 2018 7 Seven additional times
• Georgia Tech’s 35 first downs and 31 rushing first downs against Virginia Tech were both school records. The 35 first downs were also the most ever allowed by VT.
MOST FIRST DOWNS — GT SINGLE-GAME HISTORY No. Opp. Date 1) 35 Virginia Tech Oct. 25, 20182) 34 Virginia Nov. 9, 20003) 33 Tennessee Sept. 4, 20174) 32 Georgia Nov. 27, 2010 32 Georgia Nov. 29, 2014
• Georgia Tech’s 49 points against Virginia Tech are tied for the seventh-most in a road game in program history.
MOST POINTS IN A ROAD GAME — GT HISTORY No. Opp. Date 1) 70 Navy Sept. 8, 20012) 68 North Carolina Nov. 10, 20123) 66 Louisville Oct. 5, 20184) 56 Vanderbilt Oct. 31, 2009 56 Pittsburgh Oct. 25, 2014 56 NC State Nov. 8, 20147) 49 Virginia Tech Oct. 25, 2018 49 Five additional times
• Georgia Tech also put together impressive back-to-back offensive performances against Bowling Green (Sept. 29) and Louisville (Oct. 5).
• Georgia Tech racked up 129 points, 1,086 yards of total offense and 914 rushing yards in the wins over Bowling Green (63-17 on Sept. 29) and Louisville (66-31 on Oct. 5).
• In all, Tech scored on 17-of-20 offensive possessions dur-ing the two-game stretch (16 TD, 1 FG) — 8-of-10 versus Bowling Green (8 TD) and 9-of-10 at Louisville (8 TD, 1 FG). Of the three possessions that the Jackets didn’t score, two came as they ran out the clock at the end of each game.
• The final possession of each game notwithstanding, the only offensive series during the two-game stretch that didn’t result in points for Georgia Tech came when it punted in the fourth quarter of the 63-17 win over BG on Sept. 29.
GEORGIA TECH — OFFENSIVE POSSESSIONS(VS. BOWLING GREEN, AT LOUISVILLE)Qtr. Opponent Plays-Yds. Result1 Bowling Green 7-69 Touchdown1 Bowling Green 9-76 Touchdown2 Bowling Green 8-72 Touchdown2 Bowling Green 12-86 Touchdown3 Bowling Green 6-93 Touchdown3 Bowling Green 3-16 Touchdown3 Bowling Green 3-51 Touchdown4 Bowling Green 4-18 Punt4 Bowling Green 1-62 Touchdown4 Bowling Green 3-5 End of Game1 Louisville 5-50 Touchdown1 Louisville 5-36 Touchdown1 Louisville 9-76 Touchdown2 Louisville 8-52 Field Goal2 Louisville 9-62 Touchdown3 Louisville 13-79 Touchdown3 Louisville 5-34 Touchdown3/4 Louisville 5-87 Touchdown4 Louisville 8-75 Touchdown4 Louisville 1-3 End of Game20 OFF. POSSESSIONS: 16 TD, 1 FG, 1 PUNT, 2 END OF GAME
• Senior QB TaQuon Marshall led Georgia Tech to points on 14-straight offensive series that he quarterbacked — his final series vs. Clemson on Sept. 22 (TD), all six series vs. BG on Sept. 29 (6 TD) and all seven series at Louisville on Oct. 5 (6 TD, 1 FG).
• Georgia Tech scored touchdowns on each of its four offensive possessions in the first half against Bowling Green, marking the first time under Johnson that it scored touch-downs on every offensive possession of any half.
• As impressive as the offensive output was against Bowling Green, it paled in comparison to what the Jackets accom-plished against Louisville.
• Georgia Tech’s 66 points against Louisville tied for the sixth-most in modern school history (AP poll era - 1936-pres.) and were the second-most that it has ever scored in a conference game (record: 68 at North Carolina, Nov. 10, 2012).
2018 GEORGIA TECH FOOTBALL GAME NOTESGAME 11 vs. VIRGINIA • NOV. 17 • ATLANTA, GA.
7
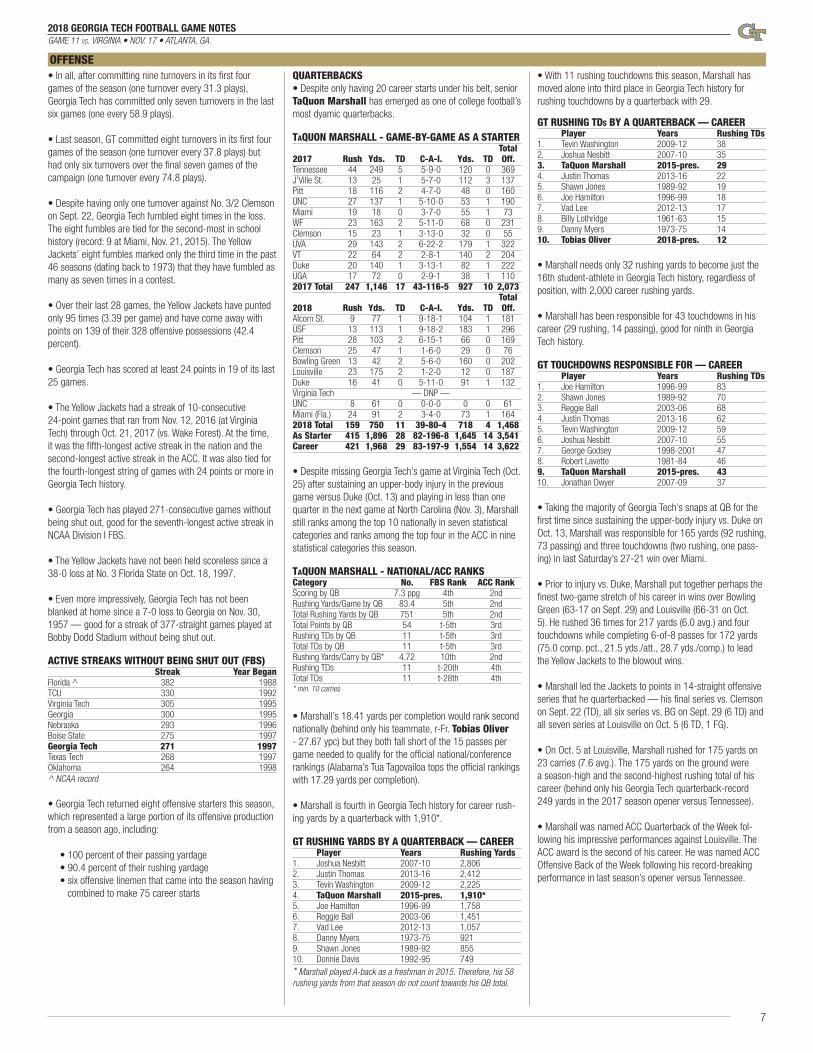
OFFENSE• In all, after committing nine turnovers in its first four games of the season (one turnover every 31.3 plays), Georgia Tech has committed only seven turnovers in the last six games (one every 58.9 plays).
• Last season, GT committed eight turnovers in its first four games of the season (one turnover every 37.8 plays) but had only six turnovers over the final seven games of the campaign (one turnover every 74.8 plays).
• Despite having only one turnover against No. 3/2 Clemson on Sept. 22, Georgia Tech fumbled eight times in the loss. The eight fumbles are tied for the second-most in school history (record: 9 at Miami, Nov. 21, 2015). The Yellow Jackets’ eight fumbles marked only the third time in the past 46 seasons (dating back to 1973) that they have fumbled as many as seven times in a contest.
• Over their last 28 games, the Yellow Jackets have punted only 95 times (3.39 per game) and have come away with points on 139 of their 328 offensive possessions (42.4 percent).
• Georgia Tech has scored at least 24 points in 19 of its last 25 games.
• The Yellow Jackets had a streak of 10-consecutive 24-point games that ran from Nov. 12, 2016 (at Virginia Tech) through Oct. 21, 2017 (vs. Wake Forest). At the time, it was the fifth-longest active streak in the nation and the second-longest active streak in the ACC. It was also tied for the fourth-longest string of games with 24 points or more in Georgia Tech history.
• Georgia Tech has played 271-consecutive games without being shut out, good for the seventh-longest active streak in NCAA Division I FBS.
• The Yellow Jackets have not been held scoreless since a 38-0 loss at No. 3 Florida State on Oct. 18, 1997.
• Even more impressively, Georgia Tech has not been blanked at home since a 7-0 loss to Georgia on Nov. 30, 1957 — good for a streak of 377-straight games played at Bobby Dodd Stadium without being shut out.
ACTIVE STREAKS WITHOUT BEING SHUT OUT (FBS) Streak Year BeganFlorida ^ 382 1988TCU 330 1992Virginia Tech 305 1995Georgia 300 1995Nebraska 293 1996Boise State 275 1997Georgia Tech 271 1997Texas Tech 268 1997Oklahoma 264 1998^ NCAA record
• Georgia Tech returned eight offensive starters this season, which represented a large portion of its offensive production from a season ago, including:
• 100 percent of their passing yardage • 90.4 percent of their rushing yardage • six offensive linemen that came into the season having combined to make 75 career starts
QUARTERBACKS• Despite only having 20 career starts under his belt, senior TaQuon Marshall has emerged as one of college football’s most dyamic quarterbacks.
TAQUON MARSHALL - GAME-BY-GAME AS A STARTER Total2017 Rush Yds. TD C-A-I. Yds. TD Off.Tennessee 44 249 5 5-9-0 120 0 369J’Ville St. 13 25 1 5-7-0 112 3 137Pitt 18 116 2 4-7-0 48 0 160UNC 27 137 1 5-10-0 53 1 190Miami 19 18 0 3-7-0 55 1 73WF 23 163 2 5-11-0 68 0 231Clemson 15 23 1 3-13-0 32 0 55UVA 29 143 2 6-22-2 179 1 322VT 22 64 2 2-8-1 140 2 204Duke 20 140 1 3-13-1 82 1 222UGA 17 72 0 2-9-1 38 1 1102017 Total 247 1,146 17 43-116-5 927 10 2,073 Total2018 Rush Yds. TD C-A-I. Yds. TD Off.Alcorn St. 9 77 1 9-18-1 104 1 181USF 13 113 1 9-18-2 183 1 296Pitt 28 103 2 6-15-1 66 0 169Clemson 25 47 1 1-6-0 29 0 76Bowling Green 13 42 2 5-6-0 160 0 202Louisville 23 175 2 1-2-0 12 0 187Duke 16 41 0 5-11-0 91 1 132Virginia Tech — DNP —UNC 8 61 0 0-0-0 0 0 61Miami (Fla.) 24 91 2 3-4-0 73 1 1642018 Total 159 750 11 39-80-4 718 4 1,468As Starter 415 1,896 28 82-196-8 1,645 14 3,541Career 421 1,968 29 83-197-9 1,554 14 3,622
• Despite missing Georgia Tech’s game at Virginia Tech (Oct. 25) after sustaining an upper-body injury in the previous game versus Duke (Oct. 13) and playing in less than one quarter in the next game at North Carolina (Nov. 3), Marshall still ranks among the top 10 nationally in seven statistical categories and ranks among the top four in the ACC in nine statistical categories this season.
TAQUON MARSHALL - NATIONAL/ACC RANKSCategory No. FBS Rank ACC RankScoring by QB 7.3 ppg 4th 2ndRushing Yards/Game by QB 83.4 5th 2ndTotal Rushing Yards by QB 751 5th 2ndTotal Points by QB 54 t-5th 3rdRushing TDs by QB 11 t-5th 3rdTotal TDs by QB 11 t-5th 3rdRushing Yards/Carry by QB* 4.72 10th 2ndRushing TDs 11 t-20th 4thTotal TDs 11 t-28th 4th* min. 10 carries
• Marshall’s 18.41 yards per completion would rank second nationally (behind only his teammate, r-Fr. Tobias Oliver - 27.67 ypc) but they both fall short of the 15 passes per game needed to qualify for the official national/conference rankings (Alabama’s Tua Tagovailoa tops the official rankings with 17.29 yards per completion).
• Marshall is fourth in Georgia Tech history for career rush-ing yards by a quarterback with 1,910*.
GT RUSHING YARDS BY A QUARTERBACK — CAREER Player Years Rushing Yards1. Joshua Nesbitt 2007-10 2,8062. Justin Thomas 2013-16 2,4123. Tevin Washington 2009-12 2,2254. TaQuon Marshall 2015-pres. 1,910*5. Joe Hamilton 1996-99 1,7586. Reggie Ball 2003-06 1,4517. Vad Lee 2012-13 1,0578. Danny Myers 1973-75 9219. Shawn Jones 1989-92 85510. Donnie Davis 1992-95 749* Marshall played A-back as a freshman in 2015. Therefore, his 58 rushing yards from that season do not count towards his QB total.
• With 11 rushing touchdowns this season, Marshall has moved alone into third place in Georgia Tech history for rushing touchdowns by a quarterback with 29.
GT RUSHING TDS BY A QUARTERBACK — CAREER Player Years Rushing TDs1. Tevin Washington 2009-12 382. Joshua Nesbitt 2007-10 353. TaQuon Marshall 2015-pres. 294. Justin Thomas 2013-16 225. Shawn Jones 1989-92 196. Joe Hamilton 1996-99 187. Vad Lee 2012-13 178. Billy Lothridge 1961-63 159. Danny Myers 1973-75 1410. Tobias Oliver 2018-pres. 12
• Marshall needs only 32 rushing yards to become just the 16th student-athlete in Georgia Tech history, regardless of position, with 2,000 career rushing yards.
• Marshall has been responsible for 43 touchdowns in his career (29 rushing, 14 passing), good for ninth in Georgia Tech history.
GT TOUCHDOWNS RESPONSIBLE FOR — CAREER Player Years Rushing TDs1. Joe Hamilton 1996-99 832. Shawn Jones 1989-92 703. Reggie Ball 2003-06 684. Justin Thomas 2013-16 625. Tevin Washington 2009-12 596. Joshua Nesbitt 2007-10 557. George Godsey 1998-2001 478. Robert Lavette 1981-84 469. TaQuon Marshall 2015-pres. 4310. Jonathan Dwyer 2007-09 37
• Taking the majority of Georgia Tech’s snaps at QB for the first time since sustaining the upper-body injury vs. Duke on Oct. 13, Marshall was responsible for 165 yards (92 rushing, 73 passing) and three touchdowns (two rushing, one pass-ing) in last Saturday’s 27-21 win over Miami.
• Prior to injury vs. Duke, Marshall put together perhaps the finest two-game stretch of his career in wins over Bowling Green (63-17 on Sept. 29) and Louisville (66-31 on Oct. 5). He rushed 36 times for 217 yards (6.0 avg.) and four touchdowns while completing 6-of-8 passes for 172 yards (75.0 comp. pct., 21.5 yds./att., 28.7 yds./comp.) to lead the Yellow Jackets to the blowout wins.
• Marshall led the Jackets to points in 14-straight offensive series that he quarterbacked — his final series vs. Clemson on Sept. 22 (TD), all six series vs. BG on Sept. 29 (6 TD) and all seven series at Louisville on Oct. 5 (6 TD, 1 FG).
• On Oct. 5 at Louisville, Marshall rushed for 175 yards on 23 carries (7.6 avg.). The 175 yards on the ground were a season-high and the second-highest rushing total of his career (behind only his Georgia Tech quarterback-record 249 yards in the 2017 season opener versus Tennessee).
• Marshall was named ACC Quarterback of the Week fol-lowing his impressive performances against Louisville. The ACC award is the second of his career. He was named ACC Offensive Back of the Week following his record-breaking performance in last season’s opener versus Tennessee.

8
2018 GEORGIA TECH FOOTBALL GAME NOTESGAME 11 vs. VIRGINIA • NOV. 17 • ATLANTA, GA.
OFFENSE• Marshall has registered six of the 13 highest single-game rushing totals by a quarterback in Georgia Tech history.
GT RUSHING YARDS BY A QB — SINGLE GAME Player Yards Opponent Year1. TaQuon Marshall 249 Tennessee 20172. Tobias Oliver 215 Virginia Tech 20183. Eddie Prokop 199 Tulsa 1943*4. Justin Thomas 195 Duke 20165. Tevin Washington 176 Clemson 20116. TaQuon Marshall 175 Louisville 20187. Justin Thomas 165 Virginia Tech 20148. TaQuon Marshall 163 Wake Forest 20179. Joshua Nesbitt 151 Virginia Tech 200810. TaQuon Marshall 143 Virginia 201711. TaQuon Marshall 140 Duke 2017 Joshua Nesbitt 140 Florida State 200913. TaQuon Marshall 137 North Carolina 2017 Justin Thomas 137 Georgia Southern 2014* 1944 Sugar Bowl
• Marshall’s six 100-yard rushing games in 2017 were the most ever by a Georgia Tech quarterback and tied for eighth in GT single-season history, regardless of position.
• Despite missing significant time in the second half on Sept. 8 at USF due to a lower-body injury, Marshall passed for a career-high 183 yards (prev.: 179 at Virginia, Nov. 4, 2017) and ran for 113 more. It marked the third time in his career that he rushed and passed for at least 100 yards in the same game and the seventh time that he has rushed and passed for a touchdown.
• Marshall also had the longest completion of his career at USF, an 81-yard touchdown strike to senior AB Clinton Lynch (prev.: 80 to Ricky Jeune vs. Virginia Tech, Nov. 11, 2017).
• While his 183 passing yards at USF remain a season and career high, Marshall’s most efficient passing performance came last Saturday versus Miami, when he completed 3-of-4 passes for 73 yards and a touchdown.
• Marshall’s 310.80 pass-efficiency rating versus Miami was the second-highest of his career (career high: 347.26 vs. Jacksonville State, Sept. 9, 2017) and his highest of the season (prev.: 307.33 vs. Bowling Green, Sept. 29).
• Marshall’s 17 rushing touchdowns last season were the third-most by a quarterback in Georgia Tech single-season history.
GEORGIA TECH RUSHING TDS BY A QUARTERBACK — SINGLE SEASON Player Year Rushing TDs1. Tevin Washington 2012 202. Joshua Nesbitt 2009 183. TaQuon Marshall 2017 174. Tevin Washington 2011 145. Tobias Oliver 2018 12
• With 104.2 rushing yards per game last season, Marshall became the first quarterback and only the third Yellow Jacket overall to average 100 rushing yards per game in a single season in 10 seasons under head coach Paul Johnson, joining Jonathan Dwyer (107.3 ypg - 2008) and Anthony Allen (101.2 ypg - 2010).
• Marshall burst on to the national stage with a record-setting performance versus Tennessee in last year’s season opener. Making the first start of his career, Marshall set three school records and one ACC record against the Vols.
TAQUON MARSHALL - GT/ACC RECORDS vS. TENN., 2017RUSHING YARDS BY A QUARTERBACK — 249Previous GT Record: 199 - Eddie Prokop vs. Tulsa, 1944 Sugar BowlPrevious ACC Record: 226 - Lamar Jackson (L’ville) vs. Texas A&M, 2015 Music City Bowl
RUSHING TOUCHDOWNS (ANY POSITION) — 5Previous GT Record: 4 - five times, most recently: Tevin Washington vs. Middle Tennessee, 2012
RUSHING ATTEMPTS (ANY POSITION) — 44Previous GT Record: 39 - Robert Lavette vs. Tennessee, 1982 and Jerry Mays vs. Georgia, 1989
• Marshall’s 249 rushing yards against Tennessee were also the third-most in Georgia Tech history, regardless of position (behind only 356 by Eddie Lee Ivery vs. Air Force - Nov. 11, 1978 and 307 by P.J. Daniels vs. Tulsa, Humanitarian Bowl - Jan. 4, 2004).
• Marshall’s 249 rushing yards against Tennessee were the fifth-most by an FBS quarterback and tied for the 15th-most by any FBS student-athlete in a game last season.
• Marshall’s five rushing touchdowns against UT were tied for the most in the nation by any student-athlete in a single game last season.
• Marshall is on the official watch list for the 2018 Maxwell Award, presented to “America’s College Player of the Year.” He is joined on the list by Georgia Tech B-back KirVonte Benson.
• Despite being Marshall’s backup for all but one game, redshirt freshman Tobias Oliver has also burst onto the national scene this season, particularly following his performances at Virginia Tech (Oct. 25) and North Carolina (Nov. 3).
• Making his first-career start in place of Marshall, who sustained an upper-body injury in the previous game against Duke (Oct. 13), Oliver rushed for 215 yards on 40 carries (both career highs) and scored three touchdowns (matching a career high) to lead Georgia Tech to a 49-28 victory at VT.
• Oliver’s 215 rushing yards against Virginia Tech were the second-most by a quarterback and seventh-most overall in Georgia Tech single-game history (see previous column for list of top rushing performances by GT QBs).
• Oliver’s 40 carries against VT were the second-most in GT single-game history (behind only Marshall’s 44 vs. Tennes-see, Sept. 4, 2017).
• Oliver’s 215 rushing yards against VT were temporarily the most by an ACC player this season (Wake Forest’s Matt Colburn surpassed Oliver’s total with 243 rushing yards against Louisville on Oct. 27).
• Oliver’s 215 rushing yards against VT remain the second-most by an NCAA Division I FBS quarterback, the most by an FBS QB against an FBS opponent and the 16th-most by any FBS player, regardless of position, this season.
• On Nov. 3 at North Carolina, Oliver replaced Marshall at quarterback before the Yellow Jackets’ fourth offensive series and remained under center for the duration of the 38-28 victory (the score was tied, 7-7, when Oliver entered the game).
• Oliver accounted for 224 yards (120 rushing, 104 passing) and three touchdowns (two rushing, one passing) in the 38-28 win at UNC. He ran 28 times and completed 2-of-2 passes.
• Oliver’s 2-for-2, 104-yard passing effort against UNC in-cluded an 86-yard touchdown pass to Sr. AB Qua Searcy.The touchdown pass was the sixth-longest pass play in Georgia Tech history and the Yellow Jackets’ longest since Joshua Nesbitt threw an 87-yard TD pass to Embry Peeples at Vanderbilt on Oct. 31, 2009.
• Oliver was named ACC Rookie of the Week following the VT and UNC games, becoming the first Yellow Jacket to earn the honor in back-to-back weeks since WR Calvin Johnson in 2004 (Nov. 15 vs. Connecticut and Nov. 22 vs. Virginia).
TOBIAS OLIvER - GAME-BY-GAME Total2018 Rush Yds. TD C-A-I. Yds. TD Off.Alcorn St. 12 72 0 0-0-0 0 0 72USF 18 97 3 0-0-0 0 0 97Pitt — DNP —Clemson 9 34 0 2-2-0 28 1 63Bowling Green 7 115 2 0-1-0 0 0 115Louisville 8 103 2 0-0-0 0 0 103Duke 10 24 0 2-6-0 34 0 58Virginia Tech 40 215 3 0-1-0 0 0 215North Carolina 28 120 2 2-2-0 104 1 124Miami (Fla.) 1 1 0 0-0-0 0 0 1Total 133 781 12 6-12-0 166 2 847
• Despite being on the field for just 32 full series this season (not including abbreviated series at the end of halves), Oliver is atop the nation in three different statistical categories and leads the ACC in six categories.
TOBIAS OLIvER - NATIONAL/ACC RANKSCategory No. FBS Rank ACC RankTotal TDs by QB 12 t-1st 1stScoring by QB 8.0 ppg t-1st t-1stRushing TDs by QB 12 t-2nd t-1stRushing Yards/Game by QB 86.8 4th 1stRushing Yards by QB 780 4th 1stRushing Yards/Carry by QB 5.87 6th 1stRushing TDs 12 t-8th 3rdTotal TDs 12 t-12th t-2ndRushing Yards/Carry 5.91 35th 3rd
• Oliver’s 5.87 yards per rush ranks fifth among all fresh-men nationally (regardless of position) and his 97.5 rushing yards per game rank second among FBS freshmen.
• Oliver’s 27.67 yards per completion would lead the nation but he falls short of the 15 passes per game needed to qualify for the official national/conference rankings (Ala-bama’s Tua Tagovailoa tops the official rankings with 17.36 yards per completion).
• Oliver has led the Yellow Jackets to scores on 20 of the 32 full possessions that he’s led this year (19 touchdowns, one field goal), not including abbreviated series at the end of halves (he has also closed out two touchdown drives that he wasn’t on the field for the start of).
• Oliver was impressive in relief of Marshall in the Yellow Jackets’ wins vs. Bowling Green (Sept. 29) and at Louisville (Oct. 5). He was on the field for a total of just five series in those two games (not including abbreviated series to run out the clock at the end of each game) and led the Yellow Jackets to four touchdowns while running for more than 100 yards in each game (115 vs. BG, 103 at Louisville) and averging a whopping 14.5 yards per carry (218 yards on 15 attempts).
• On Sept. 8 at USF, Oliver replaced Marshall on the third play of the second half and engineered the Jackets’ next three drives. GT scored touchdowns on all three series, with Oliver capping each drive with a touchdown (five, one and one yards).

2018 GEORGIA TECH FOOTBALL GAME NOTESGAME 11 vs. VIRGINIA • NOV. 17 • ATLANTA, GA.
9
OFFENSE• Of the 23 plays that Oliver was on the field for at USF, he carried the ball himself 18 times and accounted for 97 of the 189 yards that the Yellow Jackets gained while he was in the game.
• Oliver finished with 97 yards on 18 carries (5.4 avg.) and three touchdowns, all on the ground, against USF.
• Despite only playing for a little more than a quarter, Oliver’s three touchdowns at USF marked the 48th time in school history that an individual has rushed for three TDs in a game.
• In the win over Louisville (Oct. 5), Marshall and Oliver became the first quarterback tandem in Georgia Tech history to both rush for 100 yards in the same game (Marshall - 175, Oliver - 103).
• Marshall and Oliver are both ranked among the top 20 nationally in rushing touchdowns (Oliver - 12, t-eighth and Marshall - 11, t-20th) and among the top 50 nationally in rushing yards per game (Oliver - 86.8 ypg, 42nd and Mar-shall - 83.4 ypg, 49th). Only one other NCAA Division I FBS team has two quarterbacks even ranked among the top 100 nationally in rushing touchdowns (Navy) or no other team has two QBs even ranked among the top 200 in rushing yards per game. • With a season-ending foot injury sustained by presumed backup quarterback Lucas Johnson during preseason camp, Marshall is the only active quarterback on Georgia Tech’s roster that came into the 2018 season with any col-legiate playing experience.
RUNNING BACKS• Head coach Paul Johnson said prior to the season that the deepest position on Georgia Tech’s roster was likely B-back. That depth has been tetsted and proven through nine games this season.
• The biggest test of Georgia Tech’s depth at the B-back position has been a season-ending knee injury sustained by junior KirVonte Benson during the first quarter of Georgia Tech’s second game of the season at USF (Sept. 8).
• Benson, who ran for 1,053 yards as a sophomore in 2017, had 116 rushing yards and two touchdowns in less than three quarters of action this season before sustaining the season-ending injury at USF.
• Sharing the workload at B-back in Benson’s absence have been redshirt freshman Jordan Mason and sophomore Jerry Howard.
• Mason ranks third on the team (first among non-quarterbacks) with 628 rushing yards and seven rushing touchdowns.
• Mason’s 6.3 yards-per-rush average ranks third on the squad (min. 20 carries).
• Mason’s 6.3 yards per carry ranks second among all freshmen nationally and ranks 22nd in the nation overall.
• Mason’s 62.8 rushing yards per game rank eighth nation-ally among freshmen and 108th overall.
JORDAN MASON - GAME-BY-GAME All-2018 Rush Yds. TD Rec. Yds. TD Purp.Alcorn St. 11 85 1 0 0 0 85USF 13 95 0 0 0 0 95Pitt 10 94 0 1 2 0 96Clemson 4 30 0 0 0 0 30Bowling Green 7 61 2 0 0 0 61Louisville 13 78 1 0 0 0 78Duke 12 39 0 0 0 0 39Virginia Tech 12 82 3 0 0 0 82North Carolina 12 40 0 0 0 0 40Miami (Fla.) 5 24 0 0 0 0 242018 Total 99 628 7 1 2 0 630
• In Georgia Tech’s 49-28 win at Virginia Tech (Oct. 25), Mason set a career high with three rushing touchdowns (5, 14 and 1 yards).
• Mason has scored six touchdowns over the last six games (two vs. Bowling Green on Sept. 29, one at Louisville on Oct. 5, three at VT).
• Howard ranks fourth on the team (second among non-QBs) with 479 rushing yards and four rushing touchdowns this season.
• Last Saturday versus Miami, Howard ran for just 56 yards (his lowest output in five games) but made one of Georgia Tech’s biggest runs of the season when he picked up 11 yards on third-and-4 with 2:53 to go in the game, effectively sealing the Yellow Jackets’ 27-21 win over the Hurricanes.
• Howard rushed for a career-high 90 yards on just 10 car-ries (9.0 avg.) at North Carolina (Nov. 3).
• Howard also hauled in his second reception of the season (and third of his career) at UNC, an 18-yarder.
• Howard has scored a touchdown in four of the last six games — on a 5-yard run versus Bowling Green (Sept. 29), a 2-yard plunge at Louisville (Oct. 5), a 2-yard run versus Duke (Oct. 13) and an 8-yard run at Virginia Tech (Oct. 25).
• In his first extensive action of the year, Howard ran for 82 yards on just eight carries (10.2 avg.) at Pitt (Sept. 15).
• Serving as Benson’s top backup last season, Howard’s 7.6 yards per carry ranked second on the team last season, behind only A-back Nathan Cottrell (8.2 avg.).
JERRY HOWARD - GAME-BY-GAME All-2017 Rush Yds. TD Rec. Yds. TD Purp.Tennessee - DNP -Jax State 6 82 1 0 0 0 82Pitt 3 19 0 0 0 0 19UNC 5 34 0 0 0 0 34Miami - DNP -WF 3 14 1 0 0 0 14Clemson 3 19 0 1 15 0 34UVA 2 7 0 0 0 0 7VT 0 0 0 0 0 0 0Duke 1 0 0 0 0 0 36*UGA 0 0 0 0 0 0 28*2017 Total 23 175 2 1 15 0 254 All-2018 Rush Yds. TD Rec. Yds. TD Purp.Alcorn St. 3 7 0 0 0 0 7USF 1 1 0 0 0 0 1Pitt 8 82 0 0 0 0 82Clemson 10 18 0 0 0 0 18Bowling Green 6 29 1 0 0 0 29Louisville 8 58 1 0 0 0 58Duke 12 62 1 1 16 0 78Virginia Tech 12 76 1 0 0 0 76North Carolina 10 90 0 1 18 0 108Miami (Fla.) 12 56 0 0 0 0 562018 Total 82 479 4 2 34 0 513Career 105 654 6 3 49 0 767
• Benson finished his 2018 season with just 15 carries, averging 7.7 yards per rush.
KIRVONTE BENSON - GAME-BY-GAME All-2017 Rush Yds. TD Rec. Yds. TD Purp.Tennessee 26 124 1 0 0 0 124Jax State 11 26 0 0 0 0 26Pitt 29 196 2 1 9 0 205UNC 18 130 1 0 0 0 130Miami 7 40 0 0 0 0 40WF 26 136 1 1 7 0 143Clemson 16 129 0 0 0 0 129UVA 17 63 1 0 0 0 63VT 22 86 0 0 0 0 86Duke 20 79 0 0 0 0 79UGA 12 44 0 0 0 0 442017 Total 204 1,053 6 2 16 0 1,069 All-2018 Rush Yds. TD Rec. Yds. TD Purp.Alcorn St. 10 75 2 1 (-2) 0 73USF 5 41 0 0 0 0 412018 Total 15 116 2 1 (-2) 0 114Career 219 1,169 8 3 14 0 1,183
• Benson opened the 2018 season by rushing for 75 yards on 10 carries (7.5 avg.) and matching a career-high with two touchdowns (five and eight yards) in a 41-0 win over Alcorn State on Sept. 1. He played just two quarters in the opener, after sitting out the first quarter due to a minor viola-tion of team rules and the fourth quarter when most of GT’s regulars were removed from the game.
• On Sept. 8 at USF, Benson ran for 41 yards on just five carries (8.2 avg.) before sustaining the season-ending injury on Georgia Tech’s second offensive series of the game.
• Benson, who did not have a collegiate carry prior to last season, rushed for 1,053 yards and six touchdowns as a sophomore in 2017. He ranked fifth in the ACC and 35th nationally with 95.7 rushing yards per game last season.
• Benson became only the third B-back in Paul Johnson’s 10 seasons as head coach to rush for 1,000 yards in a season, joining Jonathan Dwyer (2008 and 2009) and Anthony Allen (2010).
• For their careers, Georgia Tech’s veteran A-back trio of fifth-year seniors Clinton Lynch and Qua Searcy and Cottrell, a junior, has combined to rush for 2,672 yards and 18 touchdowns on 335 carries (7.9 avg.) and catch 64 passes for 1,581 yards (24.7 avg.) and 14 touchdowns. As a group, they are averaging 10.7 yards per touch from scrim-mage for their careers.
• Between them, Lynch, Searcy and Cottrell have combined for 1,167 all-purpose yards through the first 10 games of this season — 748 rushing yards on 91 carries (8.2 avg.) and 417 receiving yards on 17 receptions (24.5 avg.). Geor-gia Tech is averaging 10.6 yards per play every time one of them touches the ball in 2018.
GEORGIA TECH’S A-BACKSCLINTON LYNCH - Sr.Yards Per Touch: 10.1 (2018), 12.6 (Career) Rush Yds. TD Avg. Rec. Yds. TD Avg.2018 30 164 2 5.5 7 209 2 20.9Career 143 1,245 9 8.7 37 1,015 11 27.4
QUA SEARCY - Sr.Yards Per Touch: 13.9 (2018), 9.6 (Career) Rush Yds. TD Avg. Rec. Yds. TD Avg.2018 26 291 2 10.4 7 196 1 28.0Career 123 857 6 7.0 24 554 3 23.1
NATHAN COTTRELL - Jr.Yards Per Touch: 8.0 (2018), 8.1 (Career) Rush Yds. TD Avg. Rec. Yds. TD Avg.2018 35 293 3 8.4 3 12 0 4.0Career 69 570 3 8.3 3 12 0 4.0

10
2018 GEORGIA TECH FOOTBALL GAME NOTESGAME 11 vs. VIRGINIA • NOV. 17 • ATLANTA, GA.
• Cottrell (11-yard run), Searcy (86-yard reception) and Lynch (4-yard run) all scored touchdowns at North Carolina (Nov. 3), marking the first time that each member of the A-back trio has ever scored in the same game.
• With a 41-yard reception in the second quarter versus Bowling Green (Sept. 29), Lynch became the first student-athlete in Georgia Tech history with 1,000 rushing yards and 1,000 receiving yards in a career.
• Since the beginning of 2016, 27 of Lynch’s 114 touches have gone for 20 yards or more (12 rushes, 15 receptions — 23.7 percent) and 10 of his 114 touches have gone for 40 yards or more (three rushes, seven receptions).
• On Sept. 8 at USF, Lynch hauled in an 81-yard touchdown reception from quarterback TaQuon Marshall. The play was the second-longest reception of Lynch’s career (long: 83 from Justin Thomas vs. North Carolina, Nov. 5, 2016) and the longest completion of Marshall’s career.
• Lynch is one of only two student-athletes in Georgia Tech history with two receptions of 80 yards or longer in his career, joining Dez White (1997-99).
• Searcy’s 86-yard touchdown reception from r-Fr. QB To-bias Oliver at North Carolina (Nov. 3) was the sixth-longest pass play in school history and the Yellow Jackets’ longest reception since Embry Peeples’ 87-yard catch from Joshua Nesbitt at Vanderbilt on Oct. 31, 2009.
• Searcy ran for two touchdowns (two and one yards) for the first time in his career at Louisville (Oct. 5). The two-TD game was the second of his career — he ran for a touch-down and caught another as a redshirt freshman vs. Tulane on Sept. 12, 2015.
• Searcy’s 91 rushing yards against Mercer on Sept. 10, 2016 remain the most by a Georgia Tech A-back since Robert Godhigh ran for 126 yards in a 55-31 defeat at Clemson on Nov. 14, 2013.
• After not finding the end zone in any of the first 25 games of his career, Cottrell has scored touchdowns in three of the last seven contests — a two-yarder against No. 3/2 Clem-son (Sept. 22), a four-yarder versus Bowling Green (Sept. 29) and an 11-yarder at North Carolina (Nov. 3).
• Cottrell rushed for 90 yards on nine carries (both career highs) in Georgia Tech’s 38-28 win at UNC (Nov. 3).
WIDE RECEIVERS• After catching just four passes as a junior last season, senior wide receiver Brad Stewart has 12 receptions through 10 games this season.
• Stewart hauled in his second touchdown of the season and third of his career last Saturday vs. Miami, a 31-yard TD reception in the third quarter that proved to be the winning points in Georgia Tech’s 27-21 triumph.
• Stewart set a career high four catches against Alcorn State on Sept. 1, surpassing his previous career-high of three, which he achieved three times (twice as a sophomore in 2016, once as a freshman in 2015).
• Stewart’s four catches against Alcorn State included the second touchdown reception of his career when quarterback TaQuon Marshall found him wide open in the corner of the end zone for a 24-yard scoring strike.
• After going the first 33 games of his career without a touchdown catch, Stewart has three TDs in the last 13
OFFENSEgames. On Nov. 11 of last season, Stewart hauled in a 60-yard touchdown pass in the Jackets’ 28-22 win over No. 17 Virginia Tech.
• Stewart has been consistently praised by head coach Paul Johnson throughout the season for the role that his blocking has played in Georgia Tech’s rushing offense, which leads the nation with 362.4 yards per game.
• Stewart was limited to just one reception for 12 yards against Louisville on Oct. 5 (albeit a big catch, as it gave Georgia Tech a first down that set up a touchdown with less than a minuted to go in the first half) but was named one of the Yellow Jackets’ players of the week by the coaching staff. He was recognized not only for his reception but for the role that his blocking played in Georgia Tech’s 542-yard rushing performance and being the holder on all 10 of the Jackets’ successful place kicks (nine PAT and a FG).
• Stewart leads all current Yellow Jackets with 37-consecu-tive starts (the next-longest streak on the team belongs to junior OL Parker Braun, who has made 29-straight starts).
• Stewart has also played in all 46 of Georgia Tech’s games since he arrived on campus in 2015. He is the only student-athlete on the Yellow Jackets’ current roster that has played all 46 games since the beginning of ‘15.
• The starter opposite Stewart is sophomore wideout Jalen Camp. Camp, who had only one reception as a redshirt freshman in 2017, has eight catches in nine games this season.
• Camp matched a career high with two receptions in last Saturday’s 27-21 win over Miami. His second catch was perhaps the biggest of his career to date, a 22-yard pickup on third-and-6 that kept Georgia Tech’s final drive going and allowed the Yellow Jackets to run out the clock in the victory.
• Camp had a career-high 70 receiving yards on two recep-tions (33 and 37 yards) versus Bowling Green (Sept. 29).
• The only true freshman who has seen significant action on offense for Georgia Tech this season is wide receiver Mala-chi Carter. Carter has served as the third wideout behind Stewart and Camp in the Yellow Jackets’ rotation.
• With Camp out due to an upper-body injury, Carter hauled in a 32-yard touchdown (the first of his career) versus Duke (Oct. 13).
OFFENSIVE LINE• Eight different offensive linemen boast starting experience for Georgia Tech. Those eight have combined for a total of 125 starts over 232 career games played.
GEORGIA TECH OFFENSIVE LINE START CHART Career Career 2018 Consec. Games Starts Starts StartsRT/LT Andrew Marshall* 42 18 9 3RG/LG/LT Will Bryan 40 25 2 —LG Parker Braun 34 29 10 29LT/C Jahaziel Lee 29 17 6 —RG Brad Morgan 25 3 3 —C/RG Kenny Cooper 24 16 4 4LT Bailey Ivemeyer 17 2 1 —RG Connor Hansen 11 6 6 6LT Zach Quinney 10 9 9 9TOTALS 232 125 * did not see game action in 2017 due to injury
• The leader of the offensive front is all-ACC and all-America candidate Parker Braun. Braun, a junior left guard, leads the unit and ranks second overall on the team with 29-con-secutive starts.
• Braun turned in perhaps the finest performance of his already illustrious career at Virginia Tech (Oct. 25), when he took a whopping 25 defenders to the ground in just 72 plays (one every 2.9 plays) to help pave the way for Georgia Tech to rush for 465 yards in a 49-28 win.
• In recognition of the dominating effort against VT, Braun was named ACC Offensive Lineman of the Week for the second time this season and fourth time in his career.
• Braun is only the third Yellow Jacket to ever be named ACC Offensive Lineman of the Week as many as four times in a career, joining current New England Patriot Shaq Mason (5 – 2012-15) and former NFL standout Andrew Gardner (4 – 2005-08).
• Braun was named ACC Offensive Lineman of the Week for the first time this season and third time in his career after taking 15 defenders to the ground and helping pave the way for Georgia Tech to rush for 542 yards at Louisville (Oct. 5).
• Braun was named ACC Offensive Lineman of the Week for the second time of his career following Georgia Tech’s 35-17 win over Pitt on Sept. 23, 2016. He took 22 Pitt defenders to the ground and helped Georgia Tech run for 436 yards en route to the honor.
• In 2016, Braun became the first Georgia Tech freshman to ever be named ACC Offensive Lineman of the Week after compiling 10 knockdowns and helping Tech rush for 309 yards in the Yellow Jackets’ 30-20 win at No. 18 Virginia Tech (Nov. 12).
• Led by Braun, Georgia Tech’s offensive line has helped pave the way for the Yellow Jackets rank first nationally in rushing offense (362.4 ypg) and tied for 12th in fewest sacks allowed (1.10/gm).
• Behind its offensive line, Georgia Tech has rushed for 400-plus yards in nine of its last 21 games, dating back to the beginning of last season.
• The Yellow Jackets’ offensive line continues to get a boost from the return of junior Kenny Cooper, who missed all of fall camp and the first two games of the season due to a lower-body injury sustained during spring practice.
• Cooper, who started all 11 games at center in 2017, made his first start of 2018 against Duke (Oct. 13).
• Before getting back into the starting lineup, Cooper made his 2018 debut against Pitt (Sept. 15) and saw action as a reserve at center and right guard for four contests as he worked himself back into game shape.
• Last season, Cooper was named ACC Offensive Lineman of the Week after taking 10 defenders to the ground and helping Georgia Tech run for 403 yards in its 33-7 win over North Carolina (Sept. 30). The award came in Cooper’s fifth-career start.
• Both Braun and Cooper represent Tech on official watch lists for national awards — Braun is a candidate for the Outland Trophy, presented to college football’s top interior lineman, while Cooper is on the watch list for the Rimington Trophy, which is awarded to college football’s top center.
• Additionally, Braun is a candidate for the 2018 Earl Campbell Tyler Rose Award, which is presented to the top offensive student-athlete in NCAA Division I football who was born in, played high-school football in or plays college football in the state of Texas.

2018 GEORGIA TECH FOOTBALL GAME NOTESGAME 11 vs. VIRGINIA • NOV. 17 • ATLANTA, GA.
11
• Saint-Amour’s two interceptions are tied for the national lead among defensive linemen. He is one of only four defen-sive linemen with two interceptions (joining Maryland’s Byron Cowart, Purdue’s Kai Higgns and Toledo’s Jamal Hines. His two INTs are tied for eighth in the ACC and 77th nationally, regardless of position.
• Saint-Amour is tied for 16th nationally with .30 forced fumbles per game.
• Saint-Amour is tied for 18th in the ACC with .40 sacks per game.
• Saint-Amour has been especially impressive of late, with 29 tackles, 8.5 tackles for loss, four sacks, three forced fumbles, six quarerback hurries and two interceptions over the last six games (Sept. 29 vs. Bowling Green, Oct. 5 at Louisville, Oct. 13 vs. Duke, Oct. 25 at Virginia Tech, Nov. 3 at North Carolina, Nov. 10 vs. Miami).
• Saint-Amour had a career day at North Carolina (Nov. 3), tallying nine tackles (career high), three quarterback hurries (career high), a tackle for loss, a pass breakup and an interception in the Yellow Jackets’ 38-28 win.
• Saint-Amour’s interception with less than two minutes to play thwarted a potential game-tying drive for UNC and set up a 22-yard field goal that sealed the Jackets’ victory.
• In recognition of his performance against the Tar Heels, Saint-Amour was named the ACC Defensive Lineman of the Week for the first time in his career. He became the first Yellow Jacket to be named ACC Defensive Lineman of the Week since KeShun Freeman earned the honor following the Yellow Jackets’ 35-10 win over Virginia on Nov. 1, 2014.
• Saint-Amour also had a big day at Louisville (Oct. 5) with a team-high-tying six tackles, including a sack, a quarterback hurry and two forced fumbles. Both forced fumbles led directly to Georgia Tech touchdowns.
• Saint-Amour’s two forced fumbles versus Louisville matched a single-game school record. He is the 10th student-athlete in Georgia Tech history to ever force two fumbles in a single game.
GEORGIA TECH FORCED FUMBLES — SINGLE GAME Player FF Opponent Year1. Anree Saint-Amour 2 Louisville 2018 D.J White 2 Ole Miss 2013 Michael Johnson 2 Duke 2010 Eric Henderson 2 Clemson 2005 James Butler 2 Wake Forest 2003 Tony Hargrove 2 NC State 2001 Cory Collins 2 Navy 2001 Nick Rogers 2 Navy 2000 Maxie Baughan 2 Duke 1959
• Saint-Amour followed up his dominant performance against Louisville with another one against Duke (Oct. 13), finishing with two sacks, a forced fumble and a quarterback hurry that caused an interception and led directly to Georgia Tech’s first touchdown of the game.
• At Virginia Tech (Oct. 25), Saint-Amour tallied two more tackles for loss, marking the third time in the last four games that he’s recorded multiple stops behind the line of scrimmage.
• Saint-Amour’s interception return for a touchdown against Bowling Green was the first by a Georgia Tech defensive lineman since current Cincinnati Bengal and 2018 GT Sports Hall of Fame inductee Michael Johnson returned an INT 26 yards for a score during a 41-23 win at No. 23 Miami (Fla.) on Nov. 20, 2008.
DEFENSETech managed just 258 yards in the Yellow Jackets’ 28-22 win over the No. 17 Hokies on Nov. 11 of last season.
• At Virginia Tech (Oct. 25), Georgia Tech’s defense sur-rendered 216 yards and 21 points on Virginia Tech’s first three possessions of the game, but limited VT to 37 yards and zero points over its next five possessions before the Hokies drove for an inconsequential touchdown on their final offensive series.
• Last Saturday versus Miami, the Yellow Jackets limited the Hurricanes to 299 yards of total offense, 91 yards less than their season averaging going into the game (390.2 ypg). The Jackets were particularly stout against Miami’s run game, surrendering just 134 yards on the ground, 63 less than the Hurricanes’ season average going into the game (197.0 ypg). • Georgia Tech has featured eight first-time starters on defense this season — Jr. NT Brandon Adams, Sr. OLB Jalen Johnson, So. SS Tariq Carpenter, Sr. FS Malik Rivera*, So. CB Jaytlin Askew, redshirt Fr. CB Tre Swill-ing, So. CB Ajani Kerr and Fr. OLB Charlie Thomas. * Rivera started 18 games in three seasons at Wofford before trans-ferring to Georgia Tech as a graduate student for this season.
• Tech has also played a whopping nine true freshmen on defense this season — DL T.K. Chimedza, DL Justice Dingle, LB Jordan Domineck, DL Quon Griffin, LB Quez Jackson, DB Jaylon King, LB Charlie Thomas, DB Juanyeh Thomas and CB Zamari Walton.
• Woody came to The Flats from Appalachian State, where he served as defensive coordinator from 2013-17. Over his last three seasons at App State (2015-17 — the program’s first three campaigns as full-fledged members of FBS), the Mountaineers’ 3-4 scheme had average national rankings of 15th in scoring defense, 19th in total defense, 28th in rushing defense and 28th in passing defense.
• Appalachian also averaged 24 takeaways, 19 interceptions and 35 sacks per season over the last three campaigns, all areas where Georgia Tech ranked among the bottom 20 teams nationally in 2017.
DEFENSIVE LINE• Georgia Tech’s three starting defensive linemen — seniors Desmond Branch, Kyle Cerge-Henderson and Anree Saint-Amour — have combined to play in 110 games and make 58 starts for the Yellow Jackets.
GEORGIA TECH DEFENSIVE LINE START CHART Career Career 2018 Consec. Games Starts Starts StartsDE Anree Saint-Amour 41 17 10 10NT Kyle Cerge-Henderson 39 20 9 9DE Desmond Branch 30 21 10 21TOTALS 110 58
• This season marks the first time that Georgia Tech’s entire starting defensive line is comprised of seniors since 1989, when seniors Willie Burks (DT), Jeff Mathis (NG) and Sean Smith (DT) were the starting linemen for the Jackets’ 7-4 squad under head coach Bobby Ross (one season before Tech won its fourth national championship).
• Saint-Amour has arguably been Georgia Tech’s best defensive player with 38 tackles, 10.5 tackles for loss, four sacks, three forced fumbles, two interceptions and eight quarterback hurries this season. He leads the Yellow Jackets in TFL, sacks, forced fumbles and QB hurries and is tied for the team lead in interceptions.
• Coming into the season, one of the stated goals of new defensive coordinator Nate Woody’s defense was to create turnovers. Through nine games, the Yellow Jackets are much improved in that area.
• Through 10 games, Georgia Tech has already forced 23 turnovers. The Yellow Jackets forced 10 turnovers for the entire 2017 season (11 games).
• Additionally, through 10 games, Georgia Tech’s defense has 12 interceptions. The Yellow Jackets intercepted eight passes for the entire 2017 season.
• Georgia Tech’s 23 takeaways are tied for sixth nationally. Last year, the Yellow Jackets finished 124th out of 128 NCAA Division I FBS teams with 10 takeaways.
• Georgia Tech’s 12 interceptions are tied for 18th nation-ally. Last year, the Yellow Jackets finished 110th nationally with six interceptions.
• Georgia Tech’s 11 fumble recoveries are tied for fifth nationally. Last year, the Yellow Jackets finished 120th nationally with four fumble recoveries.
• The Yellow Jackets have forced a season-high three turnovers in six different games this season — Alcorn State (Sept. 1), Bowling Green (Sept. 29), Louisville (Oct. 5), Duke (Oct. 13), North Carolina (Nov. 3) and Miami (Nov. 10).
• Georgia Tech has recorded three defensive touchdowns this season (David Curry fumble return vs. Alcorn State - Sept. 1; Anree Saint-Amour interception return vs. Bowling Green - Sept. 29; Juanyeh Thomas interception return - Oct. 5), which is tied for first in the ACC and 10th nationally.
• The Jackets’ No. 67 national rank in scoring defense is a bit misleading, as 28 of the 275 points scored against GT this season have been scored on special teams (two kickoff returns at USF on Sept. 8) or by the opponent’s defense (fumble returns vs. Clemson on Sept. 22 and North Carolina on Nov. 3). Without the non-offensive scores, Georgia Tech would be tied for 51st nationally in scoring defense at 24.7 points allowed per game.
• Woody’s 3-4 defense recorded Georgia Tech’s first shutout in 57 games in the Yellow Jackets’ 41-0 victory over Alcorn State on Sept. 1. The shutout was the Yellow Jackets’ first since they blanked Syracuse, 56-0, on Oct. 19, 2013.
• Georgia Tech’s defense also limited Alcorn State to just 146 yards of total offense, which is the second-lowest yard-age total allowed by the Yellow Jackets in head coach Paul Johnson’s 10-plus seasons at the helm. The only time that the Jackets surrendered fewer yards during Johnson’s tenure came in his fifth game at Tech, when they allowed just 132 yards in a 27-0 win over Duke on Oct. 4, 2008.
• On Sept. 15 at Pitt, the Yellow Jackets’ defense allowed 21 points and 215 yards in the opening half but buckled down in the second half, surrendering just three points and 120 yards after the break to allow the Jackets to nearly come back from a 21-0 deficit in an eventual 24-19 defeat.
• Over its final six possessions of the game, Pitt man-aged just three points and 114 yards of offense. Georgia Tech’s defense forced three punts (two three-and-outs) and recorded an interception over those final six series.
• Georgia Tech limited Duke (Oct. 13) to just 304 yards of total offense, which is the fewest yards that Tech has sur-rendered to an NCAA Division I FBS opponent since Virginia

12
2018 GEORGIA TECH FOOTBALL GAME NOTESGAME 11 vs. VIRGINIA • NOV. 17 • ATLANTA, GA.
• Branch has also recorded an interception this season (vs. Clemson on Sept. 22), marking the first time in Paul Johnson’s 11 seasons as Georgia Tech’s head coach that two different defensive linemen have had interceptions in the same season.
LINEBACKERS• The heart and soul of Georgia Tech’s defense is senior co-captain and inside linebacker Brant Mitchell. Mitchell ranks second on the team with 48 tackles this season.
• Mitchell has notched 34 stops over the past six games, including a season-high nine against North Carolina (Nov. 5) and a team-high-tying eight last Saturday against Miami.
• As the Yellow Jackets’ middle linebacker last season, Mitchell ranked fourth on the team with 51 tackles despite playing in only seven full games and parts of two others due to a lower-body injury. His 5.7 tackles per game led the team.
• In his first full game after returning to the lineup against No. 17 Virginia Tech on Nov. 11, Mitchell recorded a team-high nine tackles, including a sack and 1.5 tackles for loss, and was named ACC Co-Linebacker of the Week.
• In all, Georgia Tech went just 1-3 in the four games that Mitchell missed all or part of last season.
• After missing the entire 2017 season due to a foot injury, junior inside linebacker David Curry is tied for seventh on the team with 35 tackles this season.
• Curry, whose career high for tackles coming into the season was three, recorded four (Sept. 1 vs. Alcorn State) and six (Sept. 8 vs. USF) tackles in Georgia Tech’s first two games this season.
• The tally against USF likely would’ve been higher but he was ejected for a targeting call in the fourth quarter of the tough-luck loss on Sept. 8. Due to the ejection, Curry also had to sit out the first half of ACC opener at Pitt on Sept. 15.
• Curry scored Georgia Tech’s first defensive touchdown of the season when he scooped up a fumble forced by nose tackle Brandon Adams and returned it 15 yards for a score early in the third quarter of the shutout win over Alcorn State on Sept. 1. The fumble return for a touchdown was the Yellow Jackets’ first since P.J. Davis returned a fumble 38 yards for a score during the Jackets’ 33-18 win over Kentucky in the 2016 TaxSlayer Bowl.
• Curry’s return to action this season came following a se-ries of injuries that kept him out of action last season (foot) and cost him time this past spring (thumb).
• Sophomore Bruce Jordan-Swilling, who has seen increased action as of late at inside linebacker, led Georgia Tech with a season-high eight tackles against Duke (Oct. 13).
• True freshman Charlie Thomas moved into the starting lineup at the “jack” outside linebacker position against Lou-isville on Oct. 5. In his first five career starts, he has tallied 27 tackles, three fumble recoveries, four quarterback hurries and a pass breakup.
• Thomas recorded his third fumble recovery of the season last Saturday vs. Miami, which are the most fumble recoveries in a season by a Yellow Jacket in a season since Quayshawn Nealy in 2014 (3).
DEFENSE• Thomas is only the fourth Yellow Jacket in head coach Paul Johnson’s 11 seasons as Georgia Tech’s head coach with as many as three fumble recoveries in a season (Derrick Morgan – 4, 2008; Jerrard Terrant – 3, 2010; Nealy – 3, 2014). • Thomas tied a single-game school record by recovering two fumbles in the Yellow Jackets’ 66-31 win at Louisville. He is the 18th Yellow Jacket to recover two fumbles in a game. Both fumble recoveries led directly to Georgia Tech touchdowns.
MOST FUMBLE RECOVERIES — GT SINGLE-GAME HISTORY Player FR Opponent Year1. Charlie Thomas 2 Louisville 2018 Quayshawn Nealy 2 Pittsburgh 2014 Joe Anoa’i 2 Tulsa 2003 Daryl Smith 2 Navy 2000 Jermaine Miles 2 UCF 1995 Ronald Rogers 2 Maryland 1994 Gary Brown 2 Clemson 1993 Willis Crocket 2 VMI 1988 Cedric Stallworth 2 Virginia 1986 Dante Jones 2 Tennessee 1984 Anthony Harrison 2 Tennessee 1983 Seven more tied 2 Pre-ACC era
• Thomas led Georgia Tech with a career-high nine tackles and his first-career sack at Virginia Tech (Oct. 25).
• Despite appearing in only eight games with just five starts, Thomas is tied for fourth on the team with 35 tackles and ranks second on the squad with five quarterback hurries this season.
• Senior OLB Victor Alexander, who made the first five starts of the year at “jack,” has played in all 45-of-46 games since he arrived on campus in 2015. He saw a string of 43-consecutive games played snapped when he did not appear in the Yellow Jackets’ 49-28 victory at Virginia Tech (Oct. 25).
• Alexander turned in his finest statistical performance of the season against No. 3/2 Clemson on Sept. 22, finishing with a season-high seven tackles.
• Georgia Tech’s fourth linebacker position — the “stinger” OLB — is manned largely by two student-athletes that were tabbed for the secondary prior to Woody’s arrival on The Flats — senior Jalen Johnson and junior Christian Campbell.
• Despite previously being limited to the defensive backfield and special teams, Johnson and Campbell have combined for 97 career tackles and 9.5 tackles for loss, including 57 stops and 7.5 TFL through 10 games this season.
• Johnson has been especially impressive over the last two games, totaling 18 tackles and 4.5 tackles for loss in Georgia Tech’s wins over North Carolina (Nov. 3) and Miami (last Saturday).
• Johnson is the reigning ACC Linebacker of the Week after tallying a career-high-tying nine tackles and a career-high 3.0 tackles for loss in last Saturday’s win over Miami.
• Making Johnson’s numbers against Miami even more im-pressive is the fact that Georgia Tech limited the Hurricanes to just 53 offensive plays.
• Johnson also had a career day at North Carolina (Nov. 3), recording a career-high nine tackles (prev. career high: six at USF, Sept. 8) and a then-career-high 1.5 tackles for loss (prev. career high: 1.0, twice - last at USF, Sept. 8).
DEFENSIVE BACKS• Last season, Georgia Tech’s starting secondary was com-prised of five veterans that combined to make 127 starts and play in 218 games.
• However, none of the five members of last year’s starting secondary returned in 2018. Lawrence Austin, Lance Austin, Step Durham and Corey Griffin all graduated while A.J. Gray had to step away from football due to a heart condition.
• In their wake, the defensive backs listed on Georgia Tech’s two-deep combined for zero starts and just 27 games played prior to this season.
• Of the eight DBs listed on Tech’s two-deep, three are sophomores (CB Jaytlin Askew, SS Tariq Carpenter and CB Ajani Kerr), two are redshirt freshmen (CB Tre Swilling and SS Kaleb Oliver) and one is a true freshmen (FS Juanyeh Thomas).
• One of only two upperclassmen in the secondary’s two-deep (and the only full-time starter), graduate student Malik Rivera leads Georgia Tech in tackles (50) and is tied for first in interceptions (two) through nine games this season with Carpenter and Sr. DE Anree Saint-Amour.
• Rivera’s team-high 50 tackles include 10 stops at North Carolina (Nov. 3), which were his most as a Yellow Jacket.
• Rivera came to The Flats as a graduate transfer from Wofford, where he recorded 131 tackles but totaled just one interception over the past three seasons.
• Rivera’s position coach at Wofford the last two seasons (and defensive coordinator in 2017) was Shiel Wood, who now serves as Georgia Tech’s safeties coach.
• A spectacular student, Rivera graduated from Wofford in May as a triple-major in mathematics, finance and computer science. He is pursuing a master’s degree in quantitative and computational finance at Georgia Tech.
• Rivera and Carpenter are tied for 12th in the ACC and with two interceptions this season (.2 per game).
• Rivera’s two INTs came in the Yellow Jackets’ first two ACC games of the season (Sept. 15 at Pitt and Sept. 22 vs. Clemson).
• Carpenter’s two INTs came at USF (Sept. 8) and at North Carolina (Nov. 3). Carpenter’s fourth-quarter INT at UNC set up a 41-yard touchdown drive that saw Georgia Tech take a 35-28 lead with three minutes to go in the ballgame.
• Seven of Georgia Tech’s 12 interceptions this season belong to safeties — Oliver (vs. Alcorn State), Carpenter (at USF, at UNC), Rivera (at Pitt, vs. Clemson) and Thomas (at Louisville).
• Thomas capped the Yellow Jackets’ 66-31 win at Lou-isville (Oct. 5) by returning his first-career interception 95 yards for a touchdown.
• Thomas’ 95-yard interception return is tied for the fifth-longest in school history and the longest by a Yellow Jacket in an ACC game (tied with Ken Swilling - 95 yds. vs. NC State, Sept. 9, 1989). It’s also the longest INT return by a Jacket since Tyler Marcordes had a 95-yarder against Elon on Aug. 31, 2013.

2018 GEORGIA TECH FOOTBALL GAME NOTESGAME 11 vs. VIRGINIA • NOV. 17 • ATLANTA, GA.
13
DEFENSELONGEST INT. RETURNS — GEORGIA TECH HISTORY Player Yds. Opponent Year1. Frank Broyles 100 (TD) Clemson 1944 Jeff Ford 100 (TD) Notre Dame 19693. Bill Eastman 99 (TD) Tulane 19664. Jamal Lewis 97 (TD) Samford 20065. Juanyeh Thomas 95 (TD) Louisville 2018 Ken Swilling 95 (TD) NC State 1989 Tyler Marcordes 95 (TD) Elon 20138. Mario Butler 85 (TD) Duke 2010 Jamal Golden 85 (TD) Clemson 201410. Gerry Bussell 84 (TD) Tennessee 1964 Willie Clay 84 Western Carolina 1989
• Fifth-year senior cornerback Lamont Simmons registered the first interception and fumble recovery of his collegiate career versus Duke (Oct. 13).
• The Yellow Jackets’ other starting cornerback across from Simmons, redshirt freshman Tre Swilling, recorded his first-career interception at North Carolina (Nov. 3) and had a career-high two pass breakups last Saturday vs. Miami.

14
2018 GEORGIA TECH FOOTBALL GAME NOTESGAME 11 vs. VIRGINIA • NOV. 17 • ATLANTA, GA.
• Georgia Tech has blocked 19 kicks since the beginning of the 2013 season, which is tied for the sixth-most by an NCAA Division I FBS team during that span.
MOST BLOCKED KICKS SINCE 2013 (FBS)Temple 25Oklahoma State 23BYU 22Southern California 21Air Force 20GEORGIA TECH 19Rutgers 19Texas A&M 19North Texas 19 Northern Illinois 19 Virginia Tech 18Indiana 18 Alabama 17Arkansas State 17Hawai’i 17Mississippi State 16SMU 16
• Georgia Tech boasts one of the nation’s top punters in sophomore Pressley Harvin III.
• Due to the Yellow Jackets’ offensive proficiency, Harvin has only been called upon to punt 24 times through nine games this season. He is averaging 45.2 yards per punt.
• Nine of Harvin III’s 24 punts this season (including eight of his last 17) have traveled 50-plus yards while 10 of his 24 kicks (including eight of his last 11) have been downed inside the 20-yard line.
• Harvin III does not qualify for official NCAA/ACC statistical rankings because he is far short of the minimum 3.6 at-tempts per game. However, if he did qualify, his 45.2-yard average would lead the ACC and tie for 10th nationally.
• As a team, Georgia Tech leads the ACC and ranks 6th nationally in net punting average (42.25 avg.).
• Additionally, two of Harvin’s booming punts have been muffed over the last three games, which led directly to a touchdown at Virginia Tech (Oct. 25) and a pivotal field goal vs. Miami (last Saturday).
• Harvin was one of only two non-true freshmen on the Yellow Jackets’ travel roster to not see action during Georgia Tech’s 66-31 rout at Louisville (Oct. 5). The other was senior long snapper Zach Roberts, who like Pressley, only goes on the field when the Jackets are forced to punt.
• In fact, Harvin III was called upon only once over a two-game stretch versus Bowling Green (Sept. 29) and Louisville. His lone punt versus BG traveled 53 yards and was downed at the 9-yard line.
• Last season, Harvin III led all NCAA Division I FBS true freshmen, ranked 16th overall nationally and was second in the Atlantic Coast Conference with a 44.1-yard punting average last season.
• Harvin’s 44.1-yard average was also a Georgia Tech freshman record and ranked fifth overall in single-season program history.
GEORGIA TECH PUNTING AVERAGE — SINGLE SEASON Player Year Avg.1. Rodney Williams 1997 45.642. Durant Brooks 2006 45.523. Jason Bender 1994 45.514. Durant Brooks 2007 45.065. Pressley Harvin III* 2017 44.106. Dan Dyke* 1999 43.807. Ryan Rodwell 2016 43.138. Jeff Pierce 1981 42.869. Ron Rice 1982 42.6010. Rodney Williams 1998 42.52* freshman
• Of Harvin’s 50 punts last season, 13 traveled 50-plus yards (26 percent), 16 were downed inside the 20 yard line (32 pct.), 15 were fair-caught (30 pct.) and 29 were not returned (58 pct.).
• Making Harvin’s freshman campaign even more impres-sive was that two of his best performances came in less-than-ideal conditions for punting – he recorded career-bests with a 62-yard punt and four kicks downed inside the 20 yard line at Miami (Fla.) on Oct. 14 and had five punts that traveled 50 yards or more and three downed inside the 20 at Clemson on Oct. 28. The majority of both games were played during heavy rain storms.
• Following his incredible rookie campaign, Harvin III was named freshman all-America by the Football Writers Asso-ciation of America, true freshman all-America by ESPN and was a third-team all-ACC honoree.
• Harvin III is on the official watch list for the Ray Guy Award, which is presented annually to college football’s top punter. He was first added to the list midway through his prolific freshman campaign last fall.
• Harvin became only the third FWAA freshman all-Amer-ican in school history (joining OL Will Jackson, 2010, and PK Travis Bell, 2004) and the first Georgia Tech freshman to earn all-ACC recognition since Calvin Johnson (first-team WR) and Bell (second-team PK) in ’04.
• Replicating Harvin III’s magic as a true freshman special-ist this season is walk-on place kicker Wesley Wells. Wells took over the place-kicking duties after winning an in-practice competition for the job in the week leading up to the Bowling Green game (Sept. 29). Since then, he has made the first 39 kicks of his career — 35-of-35 PATs and 4-of-4 field goals.
• Wells kicked multiple field goals in a game for the first time in his career when he nailed crucial 38- and 23-yard-ers in last Saturday’s 27-21 win over Miami.
• The second field goal of Wells’ career was also a pivotal one, a 22-yarder with 46 seconds remaining that sealed the Yellow Jackets’ 38-28 victory at North Carolina (Nov. 3).
• Wells’ first field goal was a 41-yarder at Louisville. It was the longest made FG by a Yellow Jacket since Brenton King, also a true freshman at the time, made a 42-yarder vs. Wake Forest on Oct. 21, 2017.
• Another true freshman, Juanyeh Thomas, earned the job as Georgia Tech’s primary punt and kickoff returner during fall camp.
SPECIALISTS• Thomas’ 25-yard punt return in the second quarter of the Sept. 1 season opener against Alcorn was Georgia Tech’s longest punt return since Brad Stewart’s 26-yarder versus Miami (Fla.) on Oct. 1, 2016.
• Thomas’ 38-yard kickoff return in the fourth quarter at USF (Sept. 8) was the longest by a Yellow Jacket since Lamont Simmons scooped up an onside kick attempt and returned it 42 yards for a touchdown at Miami (Fla.) on Oct. 14 of last season.
• Thomas also made a huge special-teams play in punt coverage last week versus Miami, when he raced downfield and needed just one arm to shove UM returner Jeff Thomas out of the way and recover a muffed punt at the Miami 10 yard line. The fumble recovery set up a pivotal third-quarter field goal in Georgia Tech’s 27-21 win over the Hurricanes.
• USF’s 266 yards on kickoff returns on Sept. 8 — which included 98- and 97-yard returns for touchdowns by Ter-rence Horne in the first quarter — were the second-most yards that Georgia Tech has ever allowed on kickoff returns in a single game (second only to North Carolina’s 267 yards in a 68-50 GT win on Nov. 10, 2012).
• The two touchdowns allowed on kickoff returns against USF tied an NCAA Division I FBS single-game record.
• In the Yellow Jackets’ 55 kickoffs since Horne’s back-to-back touchdowns at USF (not including an onside kick attempt versus Duke on Oct. 13), Georgia Tech has pinned the opponent at or inside its 25-yard line 34 times (with one of the exceptions being on a squib kick on the first kickoff following the two TD returns at USF). Junior Shawn Davishas taken 53 of those 55 kickoffs (Wells took the final two kickoffs last Saturday vs. Miami).
• Despite Thomas’ and Davis’ high points, Georgia Tech continues to rank among the nation’s bottom 50 teams in both kickoff-return average (18.9 ypr - 88th nationally) and kickoff-return defense (26.74 ypr - 127th).

2018 GEORGIA TECH FOOTBALL GAME NOTESGAME 11 vs. VIRGINIA • NOV. 17 • ATLANTA, GA.
15
• Over the course of their first five games of last season, the Yellow Jackets only trailed for 20:43 of total playing time and just four seconds after halftime — the final four seconds of their 25-24 loss at No. 11/10 Miami (Fla.) on Oct. 14 — but went just 3-2 in those five games.
• With underclassmen (freshmen and sophomores) representing 68.4 percent of its roster, Georgia Tech has the 14th-youngest team in all of NCAA Division I FBS and third-youngest team in the ACC this year.
HIGHEST PERCENTAGE OF UNDERCLASSMEN - 2018School Total Fr. (True/RS) Soph. Team Size Pct.Illinois 78 39 (32/ 7) 39 102 76.5Coastal Carolina 92 68 (40/28) 24 121 76.0 Appalachian State 88 50 (32/18) 38 117 75.2Cincinnati 80 52 (35/17) 28 111 72.1UCLA 76 53 (36/17) 23 106 71.7Virginia 88 62 (44/18) 36 123 71.5Wake Forest 77 54 (29/25) 23 108 71.4Western Michigan 75 50 (30/20) 25 106 70.8Georgia Southern 82 52 (30/22) 30 116 70.7Minnesota 79 60 (33/27) 19 113 69.9UCF 85 57 (33/24) 28 123 69.1Texas State 80 59 (44/15) 21 118 68.7Wisconsin 81 53 (29/24) 28 118 68.6GEORGIA TECH 80 56 (31/25) 24 117 68.4San Diego State 72 50 (28/22) 22 106 67.9Research courtesy of the University of Colorado
• Georgia Tech has played 13 true freshmen so far this season — WR Malachi Carter, DL T.K. Chimedza, DL Justice Dingle, LB Jordan Domineck, QB James Graham, DL Quon Griffin, LB Quez Jackson, DB Jaylon King, BB Christian Malloy, LB Charlie Thomas, DB Juanyeh Thomas, CB Zamari Walton and PK Wesley Wells.
• In 2017, just nine true freshmen saw the field for the Yellow Jackets all season.
MISCELLANEOUS• However, the Jackets have emphatically snapped a seven-game away-from-home skid with impressive wins in each of their last three road games — a 66-31 romp at Louisville (Oct. 5), a 49-28 rout at Virginia Tech (Oct. 25) and a 38-28 triumph at North Carolina (Nov. 3).
• Georgia Tech has won three-straight games away from home since the first time since it won at Virginia Tech (Nov. 12), at Georgia (Nov. 26) and vs. Kentucky at the TaxSlayer Bowl (Dec. 31) to close the 2016 season.
• Georgia Tech has won three-straight true road games for the first time since it won at Pittsburgh (Oct. 25), NC State (Nov. 8) and Georgia (Nov. 29) in 2014.
• Georgia Tech has won three-straight ACC road games for the first time since it won at Duke (Nov. 14, 2009), North Carolina (Sept. 18, 2010) and Wake Forest (Oct. 2, 2010).
• Georgia Tech won three-straight ACC games in a single season for the first time since it won at Florida State (Oct. 10), Virginia (Oct. 24) and Duke (Nov. 14) in 2009. GEORGIA TECH HOME VS. ROAD/NEUTRAL — 2017-18Home Category Road/Neutral8-3 Record 3-7+10.1 Avg. Scoring Margin 0.931.3 Points Per Game 34.2303.8 Rushing Yards Per Game 367.596.2 Passing Yards Per Game 83.6392.6 Total Offense Per Game 451.021.3 Points Allowed Per Game 33.3121.9 Rushing Yards Allowed Per Game 173.1195.7 Passing Yards Allowed Per Game 234.1307.5 Total Yards Allowed Per Game 407.2+5 2019.54 Turnover Margin -3 33:39 Avg. Time of Possession 34:21.488 3rd-Down Conversion Pct. .449.395 3rd-Down Conversion Pct. Allowed .399
• Over the course of the seven-game losing streak in games played away from Bobby Dodd Stadium that spanned from Sept. 4, 2017-Sept. 15, 2018, Georgia Tech squandered double-digit leads in five of the seven defeats.
• Last year, Georgia Tech became only the 10th team in ACC history with two one-point losses in the same season (a 42-41 double-overtime loss to No. 25 Tennessee on Sept. 4 and a 25-24 loss at No. 11 Miami on Oct. 14).
TWO ONE-POINT LOSSES IN A SINGLE SEASON — ACC HISTORYYear Team1964 North Carolina1968 Wake Forest1980 Wake Forest1982 Maryland1994 Duke1995 GEORGIA TECH1995 Virginia2006 Clemson2006 Duke2017 GEORGIA TECH
• Three of the Yellow Jackets’ five defeats last season — Sept. 4 vs. Tennessee, Oct. 11 at Miami (Fla.) and Nov. 4 at Virginia — came by a total of just six points.
• In each of those three defeats, Georgia Tech’s opponent scored the winning points in the final 82 seconds of regula-tion or in overtime.
GEORGIA TECH’S HEARTBREAKING LOSSES IN 2017Opponent Opp. Go-Ahead Score Time Left FInalvs. Tennessee 2-yard TD run 2OT 42-41at Miami (Fla.) 24-yd FG :04 25-24at Virginia 27-yd TD pass 1:22 40-36
• With a win on Saturday vs. Virginia, Georgia Tech will be guaranteed to finish no worse than tied for second in the ACC Coastal Division standings for the seventh time in head coach Paul Johnson’s 11 seasons as head coach and the eighth time in 14 seasons since the ACC split into divisions in 2005.
Year GT Record / Finish Champion2005 5-3 / 3rd Virginia Tech2006 7-1 / 1st Georgia Tech2007 4-4 / 3rd Virginia Tech2008 5-3 / t-1st Virginia Tech2009 7-1 / 1st Georgia Tech2010 4-4 / t-3rd Virginia Tech2011 5-3 / t-2nd Virginia Tech2012 5-3 / 1st Georgia Tech2013 5-3 / t-2nd Duke2014 6-2 / 1st Georgia Tech2015 1-7 / 6th North Carolina2016 4-4 / 5th Virginia Tech2017 4-4 / 3rd Miami (Fla.)
• The only other ACC teams that have finished first or second in their division as many as six times in the 10 seasons since Johnson’s arrival at Georgia Tech in 2008 are Clemson (8), Florida State (7) and Virginia Tech (7).
• Georgia Tech is already guaranteed to finish no worse than .500 in ACC play, marking the 23rd time in the last 24 seasons that the Yellow Jackets will finish with a .500 conference record or better.
• Since 1995, the only time that Georgia Tech hasn’t finished at least .500 in ACC play was 2015, when the injury-ravaged Yellow Jackets were 1-7 in conference action.
• In 35 seasons since officially joining the ACC in 1983, the Jackets have finished .500 or better 30 times.
GEORGIA TECH ACC RECORDS1983: 3-2 1984: 2-2-1 1985: 5-11986: 3-3 1987: 0-6 1988: 0-71989: 4-3 1990: 6-0-1 1991: 5-21992: 4-4 1993: 3-5 1994: 0-81995: 5-2 1996: 4-4 1997: 5-31998: 7-1 1999: 5-3 2000: 6-22001: 4-4 2002: 4-4 2003: 4-42004: 4-4 2005: 5-3 2006: 7-12007: 4-4 2008: 5-3 2009: 7-12010: 4-4 2011: 5-3 2012: 5-32013: 5-3 2014: 6-2 2015: 1-72016: 4-4 2017: 4-4
• Of the teams widely considered to be Georgia Tech’s closest academic peers at the Power 5 level – Duke, Notre Dame, Northwestern, Purdue, Stanford and Vanderbilt – only Stanford (9) has played in more bowl games over the last 10 seasons than the Yellow Jackets (8).
• Bobby Dodd Stadium has been home sweet home for Georgia Tech of late, as it is 11-3 in its last 14 home games, dating back to midway through the 2016 season. The only three home losses during that span have been at the hands of Georgia (Nov. 25, 2017), Clemson (Sept. 22, 2018) and Duke (Oct. 13, 2018).
• The Yellow Jackets’ 28-14 loss to Duke snapped their nine-game winning streak versus unranked opponents at home.
• On the flip side, Georgia Tech has struggled in games played away from its Midtown Atlanta home over the past two seasons. The Yellow Jackets are just 3-7 in games played away from Bobby Dodd Stadium since the beginning of the 2017 season.
2018 HONORS AND AWARDS
ACC Defensive Lineman of the WeekSr. DE Anree Saint-Amour (Nov. 3 at North Carolina)
ACC Linebacker of the WeekSr. OLB Jalen Johnson (Nov. 10 vs. Miami)
ACC Offensive Lineman of the WeekJr. LG Parker Braun (Oct. 5 at Louisville)Jr. LG Parker Braun (Oct. 25 at Virginia Tech)
ACC Quarterback of the WeekSr. QB TaQuon Marshall (Oct. 5 at Louisville)
ACC Rookie of the Weekr-Fr. QB Tobias Oliver (Oct. 25 at Virginia Tech)r-Fr. QB Tobias Oliver (Nov. 3 at North Carolina)
Maxwell Award Watch List (Player)Sr. QB TaQuon MarshallJr. BB KirVonte Benson
Outland Trophy Watch List (Interior Lineman)Jr. OL Parker Braun
Rimington Trophy Watch List (Center)Jr. C Kenny Cooper
Ray Guy Award Watch List (Punter)So. P Pressley Harvin III
Earl Campbell Award Watch List (Offensive Player In or From Texas)Jr. OL Parker Braun
Wuerrfel Trophy Nominee (Community Service)Sr. WR Brad Stewart
Campbell Trophy Semifinalist (Scholar-Athlete)Sr. WR Brad Stewart

16
2018 GEORGIA TECH FOOTBALL GAME NOTESGAME 11 vs. VIRGINIA • NOV. 17 • ATLANTA, GA.
JOHNSON BIOWife: Susan Daughter: Kaitlyn
Born: August 20, 1957 Education: Western Carolina, B.S., ‘79; Appalachian State, M.S., ‘82
YEAR-BY-YEAR HEAD COACHING RECORD1997 Georgia Southern . . . 10-3 .769 SoCon Champions
1998 Georgia Southern . . . 14-1 .933 SoCon Champions I-AA Runner-Up
1999 Georgia Southern . . . 13-2 .867 SoCon Champions I-AA National Champions
2000 Georgia Southern . . . 13-2 .867 SoCon Champions I-AA National Champions
2001 Georgia Southern . . . 12-2 .857 SoCon Champions
GEORGIA SOUTHERN TOTALS (FIVE SEASONS) -- 62-10 (.861)2002 Navy . . . . . . . . . . . . 2-10 .167
2003 Navy . . . . . . . . . . . . . 8-5 .615 EV1.net Houston Bowl
2004 Navy . . . . . . . . . . . . 10-2 .833 Emerald Bowl Champions
2005 Navy . . . . . . . . . . . . . 8-4 .667 Poinsettia Bowl Champions
2006 Navy . . . . . . . . . . . . . 9-4 .692 Meineke Car Care Bowl
2007 Navy . . . . . . . . . . . . . 8-4 .667 Poinsettia Bowl
NAVY TOTALS (SIX SEASONS) -- 45-29 (.608)2008 Georgia Tech . . . . . . . 9-4 .692 Chick-fil-A Bowl
2009 Georgia Tech . . . . . *10-3 .786 ACC Championship Game FedEx Orange Bowl
2010 Georgia Tech . . . . . . . 6-7 .461 Advocare Independence Bowl
2011 Georgia Tech . . . . . . . 8-5 .615 Hyundai Sun Bowl
2012 Georgia Tech . . . . . . . 7-7 .500 ACC Championship Game Hyundai Sun Bowl Champions
2013 Georgia Tech . . . . . . . 7-6 .538 Franklin American Mortgage Music City Bowl
2014 Georgia Tech . . . . . . 11-3 .786 ACC Championship Game Capital One Orange Bowl Champions
2015 Georgia Tech . . . . . . . 3-9 .250
2016 Georgia Tech . . . . . . . 9-4 .692 TaxSlayer Bowl Champions
2017 Georgia Tech . . . . . . . 5-6 .455
2018 Georgia Tech . . . . . . . 6-4 .600
GEORGIA TECH TOTALS (11TH SEASON) -- *81-58 (.583)CAREER TOTALS (22ND SEASON) -- *188-97 (.660)* 2009 ACC Championship later vacated due to NCAA sanctions. Georgia Tech’s on-field record in 2009 was 11-3.
JOHNSON’S ACCOMPLISHMENTS AT GEORGIA TECH• Three-time ACC Coach of the Year (2008, 2009, 2014)
• 2008 National Coach of the Year (CBS Sports)
• Has led Georgia Tech to three ACC Championship Games in his 10 seasons.
• Georgia Tech has finished first or second in the ACC Coastal Division six times in Johnson’s 10 seasons at the helm.
• Has averaged 7.5 wins per season with two of the nine 10-win seasons and one of the five 11-win seasons in school history.
• Has directed seven of the top 10 seasons for total offense and rushing offense in school history.
• Yellow Jackets have led the ACC and ranked among the top 10 nationally in rushing each of his 10 seasons at Georgia Tech. Tech led the nation in rushing in 2010 (323.3 ypg) and 2014 (342.1 ypg) and ranked second nationally in 2011 (316.5 ypg).
• Has coached six players that have rushed for 1,000 yards in a season a total of seven times during his 10-year tenure: Jonathan Dwyer (2008), Dwyer and Joshua Nesbitt (2009), Anthony Allen (2010), Justin Thomas (2014) and TaQuon Marshall and KirVonte Benson (2017).
• Has coached 15 first-team all-ACC honorees.
• Has coached three first-team All-Americans: Michael Johnson (2008), Derrick Morgan (2009) and Shaquille Mason (2014).
• Has coached an ACC Offensive Player of the Year (Dwyer in 2008) and an ACC Defensive Player of the Year (Morgan in 2009).
HEAD COACH PAUL JOHNSON
GEORGIA TECH COACHES ON GAMEDAYON THE FIELDHead Coach:Paul Johnson — 11th season (Western Carolina, 1979)Defensive Coordinator/Outside Linebackers: Nate Woody — First season (Wofford, 1984) Inside Linebackers: Andy McCollum — Ninth season (Austin Peay State, 1981)Defensive Line: Jerome Riase — First season (Miami University, 2004)Cornerbacks: Joe Speed — Ninth season (U.S. Naval Academy, 1996)A-Backs/Special Teams: Lamar Owens — 11th season (Maryland, 2008)Co-Offensive Line: Ron West — Third season (Clemson, 1979)
IN THE BOOTHSafeties: Shiel Wood — First season (Wofford, 2007)Quarterbacks/B-Backs: Craig Candeto — Second season (U.S. Naval Academy, 2004)Wide Receivers: Al “Buzz” Preston — 11th season (Hawai’i, 1982)Offensive Line: Mike Sewak — 11th season (Virginia, 1981)
CAREER VICTORIES — ACTIVE FBS COACHES1. Brian Kelly Notre Dame 2502. Nick Saban Alabama 2283. Bill Snyder Kansas State 2144. Paul Johnson Georgia Tech 1885. Urban Meyer Ohio State 184
RECORD BREAKDOWNCurrent Streak . . . . . . . . . . . . . . . . . . . . . . . . . . . . . . . . . Won 3Current Home Streak . . . . . . . . . . . . . . . . . . . . . . . . . . . . Won 1Current Road Streak . . . . . . . . . . . . . . . . . . . . . . . . . . . . . Won 3Current Neutral Streak . . . . . . . . . . . . . . . . . . . . . . . . . . . Lost 1Last Win . . . . . . . . . . . . . . . . . . . . . 27-21 vs. Miami (11/10/18)Last Home Win . . . . . . . . . . . . . . . . 27-21 vs. Miami (11/10/18)Last Home Loss . . . . . . . . . . . . . . . . . 28-14 vs. Duke (10/13/18)Last Win Away From Home . . . . 38-28 at North Carolina (11/3/18)Last True Road Win . . . . . . . . . 38-28 at North Carolina (11/3/18)Last Road Loss . . . . . . . . . . . . . . . . . . . . 24-19 at Pitt (9/15/18)
2018 JOHNSON ERA*Overall . . . . . . . . . . . . . . . . . . . . . . . . . .6-4 . . . . . . . . . 81-58Playing at home . . . . . . . . . . . . . . . . . . . .3-1 . . . . . . . . . 50-20Playing on the road . . . . . . . . . . . . . . . . .3-2 . . . . . . . . . 27-29Playing at a neutral site . . . . . . . . . . . . . .0-0 . . . . . . . . . . . 4-8In bowl games . . . . . . . . . . . . . . . . . . . . .0-0 . . . . . . . . . . . 3-5In overtime . . . . . . . . . . . . . . . . . . . . . . .0-0 . . . . . . . . . . . 2-5More than 7 days to prepare . . . . . . . . . . .2-0 . . . . . . . . . 20-13
In August . . . . . . . . . . . . . . . . . . . . . . . . .0-0 . . . . . . . . . . . 3-0In September . . . . . . . . . . . . . . . . . . . . . .2-3 . . . . . . . . . 28-15In October . . . . . . . . . . . . . . . . . . . . . . . .2-1 . . . . . . . . . 25-19In November . . . . . . . . . . . . . . . . . . . . . .2-0 . . . . . . . . . 22-17In December . . . . . . . . . . . . . . . . . . . . . .0-0 . . . . . . . . . . . 3-6In January . . . . . . . . . . . . . . . . . . . . . . . .0-0 . . . . . . . . . . . 0-1
Outrushing opponent . . . . . . . . . . . . . . . .6-3 . . . . . . . . . 77-41When rushing for 300 yards . . . . . . . . . . .5-2 . . . . . . . . . 55-16When rushing for 400 yards . . . . . . . . . . .4-1 . . . . . . . . . . 23-3When rushing for 500 yards . . . . . . . . . . .1-0 . . . . . . . . . . . 2-1When rushing for 600 yards . . . . . . . . . . .0-0 . . . . . . . . . . . 1-0Outrushed by opponent . . . . . . . . . . . . . .0-1 . . . . . . . . . . 3-16When allowing 300 yards rushing . . . . . . .0-0 . . . . . . . . . . . 0-2Rushing yards the same . . . . . . . . . . . . . .0-0 . . . . . . . . . . . 0-1Outpassing opponent . . . . . . . . . . . . . . . .1-0 . . . . . . . . . . 16-5When passing for 300 yards . . . . . . . . . .0-0 . . . . . . . . . . . 1-0Outpassed by opponent . . . . . . . . . . . . . .5-4 . . . . . . . . . 65-53When allowing 300 yards passing . . . . . . .2-0 . . . . . . . . . 12-11When allowing 400 yards passing . . . . . . .0-0 . . . . . . . . . . . 2-1
More total offense than opponent . . . . . . .6-3 . . . . . . . . . 68-20When having 400+ total offense . . . . . . . .4-1 . . . . . . . . . 57-22When having 500+ total offense . . . . . . . .4-1 . . . . . . . . . . 29-5When having 600+ total offense . . . . . . . .0-1 . . . . . . . . . . . 5-3Less total offense than opponent . . . . . . .0-1 . . . . . . . . . 13-38When allowing 400+ total offense . . . . . .1-2 . . . . . . . . . 16-34When allowing 500+ total offense . . . . . .0-0 . . . . . . . . . . 5-11
Committing fewer turnovers . . . . . . . . . . .4-1 . . . . . . . . . 44-11Committing more turnovers . . . . . . . . . . .0-2 . . . . . . . . . 15-34Turnovers are even . . . . . . . . . . . . . . . . . .2-1 . . . . . . . . . 22-13
< 30:00 of time of possession . . . . . . . . .1-0 . . . . . . . . . 23-26> 30:00 of time of possession . . . . . . . . .5-4 . . . . . . . . . 58-32
Scoring first . . . . . . . . . . . . . . . . . . . . . . .2-1 . . . . . . . . . 56-18Opponent scores first . . . . . . . . . . . . . . . .4-3 . . . . . . . . . 25-40
Leading after the 1st quarter . . . . . . . . . .4-1 . . . . . . . . . 53-16Trailing after the 1st quarter . . . . . . . . . . .0-3 . . . . . . . . . 10-35Tied after the 1st quarter . . . . . . . . . . . . .2-0 . . . . . . . . . . 18-7Leading at halftime . . . . . . . . . . . . . . . . .6-0 . . . . . . . . . 63-11Trailing at halftime . . . . . . . . . . . . . . . . . .0-3 . . . . . . . . . 12-40Tied at halftime . . . . . . . . . . . . . . . . . . . .0-1 . . . . . . . . . . . 6-7Leading after the 3rd quarter . . . . . . . . . .6-1 . . . . . . . . . 71-10Trailing after the 3rd quarter . . . . . . . . . . .0-3 . . . . . . . . . . 6-46Tied after the 3rd quarter . . . . . . . . . . . . .0-0 . . . . . . . . . . . 4-2
Scoring 0-10 points . . . . . . . . . . . . . . . . .0-0 . . . . . . . . . . 1-11Scoring 11-20 points . . . . . . . . . . . . . . .0-2 . . . . . . . . . . 2-16Scoring 21-30 points . . . . . . . . . . . . . . . .1-1 . . . . . . . . . 22-19Scoring 31-40 points . . . . . . . . . . . . . . . .1-1 . . . . . . . . . 26-10Scoring 41-plus points . . . . . . . . . . . . . . .4-0 . . . . . . . . . . 30-2
Opponent scores 0-10 points . . . . . . . . . .1-0 . . . . . . . . . . 22-0Opponent scores 11-20 points . . . . . . . . .1-0 . . . . . . . . . . 23-5Opponent scores 21-30 points . . . . . . . . .3-1 . . . . . . . . . 26-19Opponent scores 31-40 points . . . . . . . . .1-0 . . . . . . . . . . 7-16 Opponent scores 41-plus points . . . . . . . .0-2 . . . . . . . . . . 3-17
With an individual 100-yard rusher . . . . . .4-2 . . . . . . . . . 50-21With two 100-yard rushers . . . . . . . . . . . .1-0 . . . . . . . . . . 15-2
* does not include vacated win (2009 ACC Championship Game)

2018 GEORGIA TECH FOOTBALL GAME NOTESGAME 11 vs. VIRGINIA • NOV. 17 • ATLANTA, GA.
17
DE 99 DESMOND BRANCH 6-3 270 r-Sr. 89 Antwan Owens 6-4 265 So.
NT 54 KYLE CERGE-HENDERSON 6-1 298 Sr. 90 Brandon Adams 6-2 325 Jr.
DE 94 ANREE SAINT-AMOUR 6-3 245 Sr. 97 Brentavious Glanton 6-3 294 r-Jr.
JACK 45 CHARLIE THOMAS 6-2 203 Fr.or 9 VICTOR ALEXANDER 5-10 237 Sr. ILB 51 BRANT MITCHELL 6-2 233 Sr. 44 Quez Jackson 6-1 220 Fr.
ILB 32 DAVID CURRY 6-2 217 r-Jr. 12 Bruce Jordan-Swilling 6-1 234 So.
STGR 23 JALEN JOHNSON 6-3 215 r-Sr. 10 Christian Campbell 6-2 208 r-Jr.
SS 29 TARIQ CARPENTER 6-2 218 So. 40 Kaleb Oliver 6-4 205 r-Fr.
FS 36 MALIK RIVERA 5-11 200 r-Sr. 28 Juanyeh Thomas 6-3 200 Fr.
CB 6 LAMONT SIMMONS 6-2 197 r-Sr. 33 Jaytlin Askew 5-11 177 So.
CB 3 TRE SWILLING 6-0 195 r-Fr. 38 Ajani Kerr 6-0 190 r-So.
QB 16 TAQUON MARSHALL 5-10 185 Sr. 8 Tobias Oliver 6-2 182 r-Fr.
BB 24 JORDAN MASON 6-1 212 r-Fr.or 15 JERRY HOWARD 6-0 215 So.
AB 1 QUA SEARCY 5-11 174 r-Sr. 31 Nathan Cottrell 5-11 190 r-Jr.
AB 22 CLINTON LYNCH 6-0 192 r-Sr. 2 Omahri Jarrett 5-10 174 r-Jr.
WR 80 JALEN CAMP 6-2 217 Jr. 81 Malachi Carter 6-3 185 Fr.
WR 83 BRAD STEWART 6-1 195 Sr. 84 Stephen Dolphus 6-5 205 r-So.
LT 73 ZACH QUINNEY 6-6 276 r-Fr. 62 Bailey Ivemeyer 6-1 270 r-Jr.
LG 75 PARKER BRAUN 6-3 280 Jr. 72 Charlie Clark 6-4 280 r-Fr.
C 55 KENNY COOPER 6-3 305 Jr.or 53 JAHAZIEL LEE 6-2 287 Jr.
RG 56 CONNOR HANSEN 6-2 310 So. 60 Brad Morgan 6-4 288 r-Jr.
RT 50 ANDREW MARSHALL 6-4 282 r-Sr.or 53 JAHAZIEL LEE 6-2 287 Jr. 70 Will Bryan 6-4 285 Sr.
OFFENSE (Spread Option)
PRONUNCIATION GUIDEStudent-Athletes 1 QUA SEARCY qway SIR-see 2 OMAHRI Jarrett oh-MAR-ee 8 TOBIAS Oliver toe-BYE-us 13 Avery SHOWELL sho-ELL 16 TaQUON Marshall tuh-QWON 18 Rich STANZIONE stan-zee-OWN 20 TIJA’I Whatley TIE-jay 21 ZAMARI Walton zuh-MAR-ee 26 DONTAE Smith DON-tay 27 Josh BLANCATO blahn-COT-oh 28 JUANYEH Thomas won-YAY 29 TARIQ Carpenter tuh-REEK 30 KIRVONTE Benson curr-VON-tay 31 Nathan COTTRELL COT-trill 33 JAYTLIN ASKEW JATE-lynn ASK-you 36 Joseph MACRINA mah-CREEN-uh 38 AJANI Kerr uh-JOHN-ee 39 DAMEON Williams DAY-mee-in 41 JaQUaN Henderson JAY-qwon 53 JAHAZIEL Lee juh-HAY-zull 54 Kyle CERGE-Henderson “surge” 57 Lucas PATELLES puh-TELL-iss 58 Boe TUFELE tu-FELL-uh 59 Jerrod ABEE AY-bee 63 Chet LAGOD luh-GOD 76 DJIMON Brooks JAH-mon 86 JAIR Hawkins-Anderson jah-EER 87 PEJE’ Harris P.J. 93 T.K. CHIMEDZA chih-MED-zuh 94 ANREE SAINT-AMOUR ahn-REE saint uh-MORE 97 BRENTAVIOUS Glanton brent-TAY-vee-us
CoachesCraig CANDETO can-DEE-toeJerome RIASE RIZEMike SEWAK SEE-wahkSHIEL Wood SHEEL
PROJECTED DEPTH CHARTDEFENSE (3-4)
SPECIALISTSPK 38 WESLEY WELLS 6-0 185 Fr. 88 Shawn Davis 6-2 215 r-Jr.
KO 88 SHAWN DAVIS 6-2 215 r-Jr. 38 Wesley Wells 6-0 185 Fr.
P 27 PRESSLEY HARVIN III 6-0 245 So. 88 Shawn Davis 6-2 215 r-Jr.
LS 67 ZACH ROBERTS 6-0 215 r-Sr. 66 Jack Coco 6-3 270 r-Fr.
SS 66 JACK COCO 6-3 270 r-Fr. 67 Zach Roberts 6-0 215 r-Sr.
H 83 BRAD STEWART 6-1 195 Sr. 27 Pressley Harvin III 6-0 245 So.
KR 28 JUANYEH THOMAS 6-3 200 Fr. 33 Jaytlin Askew 5-11 177 So.or 31 Nathan Cottrell 5-11 190 r-Jr.
PR 83 BRAD STEWART 6-1 195 Sr. 28 Juanyeh Thomas 6-3 200 Fr.

18
2018 GEORGIA TECH FOOTBALL GAME NOTESGAME 11 vs. VIRGINIA • NOV. 17 • ATLANTA, GA.
2018 ROSTERSNUMERICAL
NO. NAME POS. HT. WT. CLASS HOMETOWN/HIGH SCHOOL (PREVIOUS COLLEGE) 1 Qua Searcy AB 5-11 174 r-Sr. Barnesville, Ga./Lamar County 2 Omahri Jarrett AB 5-10 174 r-Jr. Douglasville, Ga./New Manchester 3 Tre Swilling DB 6-0 195 r-Fr. New Orleans, La./Brother Martin 4 James Graham QB 6-1 185 Fr. Fitzgerald, Ga./Fitzgerald 5 Carson Fletcher WR 6-1 199 r-Jr. Flowery Branch, Ga./Flowery Branch 6 Lamont Simmons DB 6-2 197 r-Sr. Jacksonville, Fla./Raines (Southern California) 7 Lucas Johnson QB 6-3 210 r-So. San Diego, Calif./Mount Carmel 8 Tobias Oliver QB 6-2 182 r-Fr. Warner Robins, Ga./Northside 9 Victor Alexander LB 5-10 237 Sr. Jacksonville, Fla./Trinity Christian School 9 Keegan Hemingway AB 5-6 185 r-Fr. Boyds, Md./Poolesville 10 Christian Campbell DB/LB 6-2 208 r-Jr. Ponchatoula, La./Ponchatoula 11 Christian Malloy BB 5-10 194 Fr. Lilburn, Ga./Parkview 11 Devin Smith DB 5-10 165 r-Fr. Acworth, Ga./Harrison 12 Bruce Jordan-Swilling LB 6-1 234 So. New Orleans, La./Brother Martin 13 Avery Showell DB 6-1 193 r-Fr. Atlanta, Ga./Cartersville 13 Ryan Lantz QB 6-1 168 Fr. North Palm Beach, Fla./Suncoast Community 14 Jaylon King DB 6-1 175 Fr. La Vergne, Tenn./Ensworth 14 Mark Rew WR 6-1 186 r-So. Columbia, S.C./Ben Lippen 15 Jerry Howard BB 6-0 215 So. Rock Hill, S.C./Northwestern 16 TaQuon Marshall QB 5-10 185 Sr. Hamilton, Ga./Harris County 17 Jaylen Jackson WR 6-0 195 Fr. Brunswick, Ga./Brunswick 18 Rich Stanzione DB 6-0 205 Jr.^ Washington Township, N.J./Williamstown (Stetson) 20 Tija’i Whatley AB 6-2 182 Fr. Rome, Ga./Darlington School 21 Zamari Walton DB 6-3 175 Fr. Melbourne, Fla./Melbourne Central Catholic 22 Clinton Lynch AB 6-0 192 r-Sr. Norcross, Ga./Norcross 23 Jalen Johnson DB/LB 6-3 215 r-Sr.* Oneonta, Ala./Oneonta 23 Melvin Davis AB 6-0 200 r-Sr. Madison, Ga./Morgan County 24 Jordan Mason BB 6-1 212 r-Fr. Gallatin, Tenn./Gallatin 25 Tre’ Jackson LB 5-10 222 r-Sr.* Valdosta, Ga./Lowndes 26 Dontae Smith AB 5-11 175 Fr. Spring Hill, Tenn./Spring Hill 27 Pressley Harvin III P 6-0 245 So. Alcolu, S.C./Sumter 27 Josh Blancato AB 5-10 175 r-Fr. Marietta, Ga./Kell 28 Juanyeh Thomas DB 6-3 200 Fr. Niceville, Fla./Niceville 29 Tariq Carpenter DB 6-2 218 So. Ludowici, Ga./Long County 30 KirVonte Benson BB 5-9 208 r-Jr. Marietta, Ga./Marietta 31 Nathan Cottrell AB 5-11 190 r-Jr. Knoxville, Tenn./Knoxville West 31 Thompson Rudolph DB 6-0 186 Fr. Spartanburg, S.C./Spartanburg 32 David Curry LB 6-2 217 r-Jr. Buford, Ga./Buford 33 Jaytlin Askew DB 5-11 177 So. Douglasville, Ga./McEachern 34 Gentry Bonds DB 6-2 190 r-Fr. Murfreesboro, Tenn./Riverdale 35 Jarett Cole DB 5-10 195 r-So. Norcross, Ga./Norcross 36 Malik Rivera DB 5-11 200 r-Sr.* Jacksonville, Fla./Bartram Trail (Wofford) 36 Joseph Macrina BB 6-0 236 r-So. Suwanee, Ga./Northview 37 Brenton King PK 6-0 170 So. Auburn, Ga./Mill Creek 38 Ajani Kerr DB 6-0 190 r-So. Powder Springs, Ga./McEachern 38 Wesley Wells PK 6-0 185 Fr. Dahlonega, Ga./Lumpkin County 39 Dameon Williams DB 5-10 184 r-Fr. Norcross, Ga./Norcross 39 Austin Nash AB 5-10 177 r-Fr. Grayson, Ga./Grayson 40 Kaleb Oliver DB 6-4 205 r-Fr. La Vergne, Tenn./Oakland 41 Jaquan Henderson LB 6-1 200 So. Covington, Ga./Newton 42 Jordan Domineck LB 6-3 220 Fr. Lakeland, Fla./George Jenkins 43 Tyler Cooksey LB 6-2 232 r-Jr. Suwanee, Ga./Greater Atlanta Christian School 44 Quez Jackson LB 6-1 220 Fr. Fort Valley, Ga./Peach County 45 Charlie Thomas DB/LB 6-2 203 Fr. Thomasville, Ga./Thomasville 46 Xavier Gantt AB 5-8 170 r-So. Buford, Ga./Buford 47 Josh Tukes LB 6-6 215 r-Fr. Covington, Ga./Newton 47 Cliff Gandis PK/P 6-1 196 Fr. Greer, S.C./Christ Church Episcopal School 48 Luke Johns DL 6-5 235 Fr. Dalton, Ga./Southeast Whitfield 49 Jakob Brashear LB 6-0 223 r-So Dacula, Ga./Dacula 50 Andrew Marshall OL 6-4 282 r-Sr.* Cumming, Ga./West Forsyth 51 Brant Mitchell LB 6-2 233 Sr. Knoxville, Tenn./Webb School 52 Justice Dingle DL 6-3 250 Fr. Bowling Green, Ky./Bowling Green 52 Cade Long LS 5-11 210 Fr. Hixson, Tenn./Baylor School 53 Jahaziel Lee OL 6-2 287 Jr. Ponchatoula, La./Ponchatoula 54 Kyle Cerge-Henderson DL 6-1 298 Sr. Tampa, Fla./Plant 55 Kenny Cooper OL 6-3 305 Jr. Calhoun, Ga./Sonoraville 56 Connor Hansen OL 6-2 310 So. Tallahassee, Fla./Chiles 57 Mikey Minihan OL 6-3 275 r-Fr. Honolulu, Hawai’i/Saint Louis
ALPHABETICAL NO. NAME POS. 59 Jerrod Abee LS 90 Brandon Adams DL 9 Victor Alexander LB 33 Jaytlin Askew DB 67 Tad Aycock OL 30 KirVonte Benson BB 27 Josh Blancato AB 34 Gentry Bonds DB 99 Desmond Branch DL 49 Jakob Brashear LB 75 Parker Braun OL 66 Olin Broadway LB 76 Djimon Brooks DL 70 Will Bryan OL 85 Alan Bussoletti WR 89 Liam Byrne WR 80 Jalen Camp WR 10 Christian Campbell DB/LB 29 Tariq Carpenter DB 81 Malachi Carter WR 54 Kyle Cerge-Henderson DL 93 T.K. Chimedza DL 72 Charlie Clark OL 66 Jack Coco OL 35 Jarett Cole DB 43 Tyler Cooksey LB 55 Kenny Cooper OL 31 Nathan Cottrell AB 32 David Curry LB 23 Melvin Davis AB 88 Shawn Davis PK 91 Kelton Dawson DL 78 Jack DeFoor OL 52 Justice Dingle DL 84 Stephen Dolphus WR 42 Jordan Domineck LB 5 Carson Fletcher WR 79 Hinson Fowler DL 47 Cliff Gandis PK/P 46 Xavier Gantt AB 68 Hamp Gibbs OL 97 Brentavious Glanton DL 4 James Graham QB 92 Quon Griffin DL 56 Connor Hansen OL 87 PeJe’ Harris WR 27 Pressley Harvin III P 86 Jair Hawkins-Anderson WR 9 Keegan Hemingway AB 41 Jaquan Henderson LB 15 Jerry Howard BB 64 Cheyenne Hunt OL 62 Bailey Ivemeyer OL 17 Jaylen Jackson WR 44 Quez Jackson LB 25 Tre’ Jackson LB 2 Omahri Jarrett AB 48 Luke Johns DL 23 Jalen Johnson DB/LB 7 Lucas Johnson QB 12 Bruce Jordan-Swilling LB 71 Harrison Jump OL 38 Ajani Kerr DB 37 Brenton King PK 14 Jaylon King DB 63 Chet Lagod OL 13 Ryan Lantz QB 79 William Lay OL

2018 GEORGIA TECH FOOTBALL GAME NOTESGAME 11 vs. VIRGINIA • NOV. 17 • ATLANTA, GA.
19
2018 ROSTERS NO. NAME POS. HT. WT. CLASS HOMETOWN/HIGH SCHOOL (PREVIOUS COLLEGE) 57 Lucas Patelles LS 5-8 190 r-So. Fayetteville, Ga./Starr’s Mill 58 Boe Tufele OL 6-3 315 r-Fr. Harbor City, Calif./Narbonne 59 Scott Morgan OL 6-4 290 r-Jr. Woodstock, Ga./Etowah 59 Jerrod Abee LS 6-1 195 r-Fr. Gainesville, Ga./Lakeview Academy 60 Brad Morgan OL 6-4 288 r-Jr. Woodstock, Ga./Etowah 61 Michael Maye OL 6-3 295 Fr. Hoover, Ala./Hoover 62 Bailey Ivemeyer OL 6-1 270 r-Jr. Snellville, Ga./Brookwood 63 Chet Lagod OL 6-0 275 r-So. Marietta, Ga./Marist 64 Cheyenne Hunt OL 6-0 250 r-Sr.* Springfield, Ga./Effingham County 65 Austin Smith OL 6-5 295 Fr. McDonough, Ga./Ola 66 Jack Coco OL 6-3 270 r-Fr. Johns Creek, Ga./Johns Creek 66 Olin Broadway LB 6-3 217 r-Fr. Atlanta, Ga./St. Pius X 67 Zach Roberts LS 6-0 215 r-Sr.* Magnolia, Texas/Magnolia (Lamar) 67 Tad Aycock OL 6-3 260 Fr. Roswell, Ga./Fellowship Christian School 68 Hamp Gibbs OL 6-3 280 r-Fr. Augusta, Ga./Augusta Prep 69 Zakk Mckeehan OL 6-4 294 Fr. St. Francisville, La./West Feliciana 70 Will Bryan OL 6-4 285 Sr. Lavonia, Ga./Franklin County 71 Harrison Jump OL 6-5 260 Fr. Statham, Ga./Prince Avenue Christian School 72 Charlie Clark OL 6-4 280 r-Fr. Atlanta, Ga./Marist 73 Zach Quinney OL 6-6 276 r-Fr. Savannah, Ga./Savannah Christian Prep 75 Parker Braun OL 6-3 280 Jr. Hallsville, Texas/Hallsville 76 Djimon Brooks DL 6-1 280 r-So. Sandersville, Ga./Washington County 76 Kevin Wolf OL 6-6 265 Fr. Charlotte, N.C./Providence Day School 77 Antonio Mallard DL 6-1 235 r-Sr. Ellenwood, Ga./Stockbridge (Clark Atlanta) 77 Matthew Morgan OL 6-4 300 Fr. Woodstock, Ga./Etowah 78 Jack DeFoor OL 6-5 290 r-So. Calhoun, Ga./Calhoun (Ole Miss) 79 William Lay OL 6-2 283 r-Fr. Bowersville, Ga./Hart County 79 Hinson Fowler DL 6-2 266 Fr. Augusta, Ga./Augusta Prep 80 Jalen Camp WR 6-2 217 Jr. Cumming, Ga./South Forsyth 81 Malachi Carter WR 6-3 185 Fr. Lawrenceville, Ga./Mountain View 82 Adonicas Sanders WR 6-1 185 r-Fr. North Charleston, S.C./Fort Dorchester 83 Brad Stewart WR 6-1 195 Sr. Savannah, Ga./Benedictine Military School 84 Stephen Dolphus WR 6-5 205 r-So. Macon, Ga./Westside 85 Alan Bussoletti WR 6-4 200 r-So. Buford, Ga./Buford 86 Jair Hawkins-Anderson WR 6-1 184 r-So. Suwanee, Ga./Northview 87 PeJe’ Harris WR 6-3 215 Fr. Newnan, Ga./Newnan 88 Shawn Davis PK 6-2 215 r-Jr. McDonough, Ga./Union Grove 89 Antwan Owens DL 6-4 265 So. Tallahassee, Fla./Godby 89 Liam Byrne WR 6-4 192 r-Fr. Woodstock, Ga./Woodstock 90 Brandon Adams DL 6-2 325 Jr. Brentwood, Tenn./Brentwood Academy 91 Kelton Dawson DL 6-3 275 r-Fr. Stockbridge, Ga./Stockbridge 92 Quon Griffin DL 6-0 275 Fr. Rome, Ga./Rome 93 T.K. Chimedza DL 6-3 300 Fr. Dacula, Ga./IMG Academy 94 Anree Saint-Amour DL 6-3 245 Sr. Suwanee, Ga./North Gwinnett 95 Tyler Merriweather DL 6-3 238 r-Sr.* Demopolis, Ala./Demopolis 96 Chris Martin DL 6-1 287 r-So. Loganville, Ga./Grayson 97 Brentavious Glanton DL 6-3 294 r-Jr. Albany, Ga./Monroe Comprehensive 98 Curtis Ryans DL 6-5 245 Fr. Kennesaw, Ga./North Cobb 99 Desmond Branch DL 6-3 270 r-Sr. Rio Rancho, N.M./Cleveland (Trinity Valley Community College)
* graduate student ^ must sit out of game action in 2018 due to NCAA transfer regulations
NO. NAME POS. 53 Jahaziel Lee OL 52 Cade Long LS 22 Clinton Lynch AB 36 Joseph Macrina BB 77 Antonio Mallard DL 11 Christian Malloy BB 50 Andrew Marshall OL 16 TaQuon Marshall QB 96 Chris Martin DL 24 Jordan Mason BB 61 Michael Maye OL 69 Zakk Mckeehan OL 95 Tyler Merriweather DL 57 Mikey Minihan OL 51 Brant Mitchell LB 60 Brad Morgan OL 77 Matthew Morgan OL 59 Scott Morgan OL 39 Austin Nash AB 40 Kaleb Oliver DB 8 Tobias Oliver QB 89 Antwan Owens DL 57 Lucas Patelles LS 73 Zach Quinney OL 14 Mark Rew WR 36 Malik Rivera DB 67 Zach Roberts LS 31 Thompson Rudolph DB 98 Curtis Ryans DL 94 Anree Saint-Amour DL 82 Adonicas Sanders WR 1 Qua Searcy AB 13 Avery Showell DB 6 Lamont Simmons DB 65 Austin Smith OL 11 Devin Smith DB 26 Dontae Smith AB 18 Rich Stanzione DB 83 Brad Stewart WR 3 Tre Swilling DB 45 Charlie Thomas DB/LB 28 Juanyeh Thomas DB 58 Boe Tufele OL 47 Josh Tukes LB 21 Zamari Walton DB 38 Wesley Wells PK 20 Tija’i Whatley AB 39 Dameon Williams DB 76 Kevin Wolf OL
COACHING AND SUPPORT STAFF Head Coach: Paul Johnson (Western Carolina, 1979) — 11th season at Georgia TechDefensive Coordinator/Outside Linebackers: Nate Woody (Wofford, 1984)Quarterbacks/B-Backs: Craig Candeto (U.S. Naval Academy, 2004)Inside Linebackers: Andy McCollum (Austin Peay State, 1981)A-Backs/Special Teams Coord./Recruiting Coord.: Lamar Owens (Maryland, 2008)Wide Receivers: Al “Buzz” Preston (Hawai’i, 1982)Defensive Line: Jerome Riase (Miami University, 2004)Offensive Line: Mike Sewak (Virginia, 1981)Cornerbacks: Joe Speed (U.S. Naval Academy, 1996)Co-Offensive Line: Ron West (Clemson, 1979)Safeties: Shiel Wood (Wofford, 2007)Graduate Assistant Coach: Errin Joe (Georgia Tech, 2014)Graduate Assistant Coach: Trey Money (Appalachian State, 2017)Graduate Assistant Coach: Nick Newsome (Austin Peay, 2011)Graduate Assistant Coach: Tyson Wachenheim (Christopher Newport, 2015)Quality Control Specialist/Offense: Paul Nichols (Davidson, 2003)Quality Control Specialist/Defense: Bryan Cook (Ithaca, 1998)Quality Control Specialist/Special Teams: Tim McGrath (Villanova, 2013)Staff Assistant: Rod Rook-Chungong (Georgia Tech, 2016)
Director of Football Operations: Mike Huff (Dayton, 2007)Assistant Director of Football Operations: Kevin Cone (Georgia Tech, 2010)Director of Player Personnel: Andy Lutz (Pacific, 1991)Associate Director of Player Personnel: Thomas Balkcom (Georgia Tech, 1990)Associate Director of Player Personnel: Paul Hamilton (Appalachian State, 1981)Associate Director of Player Personnel: Cody Moore (Oklahoma Panhandle State, 2004)Associate Director of Player Personnel: Tevin Washington (Georgia Tech, 2012)Recruiting and Marketing Coordinator: Brittany McCormick (Michigan State, 2012)Digital Content Coordinator: Ryan Wise (Bowling Green, 2014)Recruiting Coordinator: Sarah Woodruff (SMU, 2015)Director of Player Development: John Sisk (Western Carolina, 1993)Assistant Director of Player Development: Alex Derenthal (Temple, 2008)Assistant Director of Player Development: Zach Reed (Tennessee Tech, 2001)Assistant Director of Player Development: Curtis Turner (Clemson, 2003)Head Football Athletic Trainer: Mark Smith (SUNY Brockport, 2010)Assistant Football Athletic Trainer: Eric Avila (Slippery Rock, 2010)Equipment Manager: Tom Conner (Alabama, 1980)Assistant Equipment Manager: Punt Windham (Georgia Tech, 1994)Director of Video Operations: Todd McCarthy (VCU, 1992)Administrative Coordinator: Teri Anton (Florida State, 1991)

20
2018 GEORGIA TECH FOOTBALL GAME NOTESGAME 11 vs. VIRGINIA • NOV. 17 • ATLANTA, GA.
CAREER STARTSNAME ‘15 ‘16 ‘17 ‘18 TOT. CONS.B. Stewart 5 13 11 10 39 37B. Mitchell 3 13 9 10 35 13C. Lynch 6 8 6 10 30 13P. Braun - 8 11 10 29 29W. Bryan 6 11 6 2 25 -Q. Searcy - 6 11 10 27 21D. Branch - - 11 10 21 21K. Cerge-Henderson 3 7 1 9 20 9 T. Marshall - - 11 8 19 1J. Lee - 3 8 6 17 -A. Marshall - 9 - 9 18 3A. Saint-Amour - - 7 10 17 10K. Cooper - 1 11 4 16 4V. Alexander - - 10 5 15 -K. Benson - - 11 1 12 -D. Curry - 1 - 9 10 7T. Carpenter - - - 10 10 10B. Glanton - - 10 - 10 -J. Johnson - - - 10 10 10M. Rivera - - - 10 10 10Z. Quinney - - - 9 9 9J. Camp - - - 8 8 2T. Swilling - - - 8 8 5L. Simmons - 2 - 5 7 3C. Hansen - - - 6 6 6J. Askew - - - 5 5 -J. Mason - - - 5 5 1C. Thomas - - - 5 5 5J. Howard - - - 4 4 -N. Cottrell - - 3 - 3 -B. Morgan - - - 3 3 -S. Dolphus - - - 2 2 -B. Ivemeyer - - 1 1 2 -A. Kerr - - - 2 2 -B. Adams - - - 1 1 -C. Campbell - - 1 - 1 -T. Jackson - - 1 - 1 -B. Jordan-Swilling - - 1 - 1 -T. Oliver - - - 1 1 -
NAME ‘14 ‘15 ‘16 ‘17 ‘18 TOT. CONS.B. Stewart - 12 13 11 10 46 46V. Alexander - 12 13 11 9 45 2C. Lynch - 12 13 10 10 45 20B. Mitchell - 12 13 10 10 44 13J. Johnson - 10 11 11 10 43 25A. Marshall 10 12 11 - 9 42 3W. Bryan - 10 13 11 6 40 -A. Saint-Amour - 7 13 11 10 41 38Cerge-Henderson - 6 13 10 10 39 19T. Jackson - 11 13 8 7 39 2Q. Searcy - 3 13 11 10 37 34P. Braun - - 12 11 10 33 33L. Simmons - - 13 11 8 33 4N. Cottrell - - 11 11 10 32 28J. Camp - - 11 11 9 31 3T. Marshall - 9 2 11 8 30 1B. Adams - - 9 11 10 30 23D. Branch - - 9 11 10 30 26C. Campbell - - 9 11 10 30 23J. Lee - - 10 9 9 28 3B. Morgan - - 13 4 8 25 3K. Cooper - - 5 11 8 24 8D. Curry - - 13 - 10 23 10B. Glanton - - 6 11 5 22 -A. Kerr - - - 11 10 21 21K. Benson - - 7 11 2 20 -T. Cooksey - - 4 6 10 20 10P. Harvin III - - - 11 9 20 4J. Henderson - - - 11 8 19 -J. Howard - - - 9 10 19 16B. Jordan-Swilling - - - 11 8 19 8T. Merriweather 5 - 4 9 - 18 6J. Askew - - - 10 8 18 5A. Owens - - - 8 10 18 10O. Jarrett - - 1 10 6 17 -B. Ivemeyer - - 1 8 7 16 -T. Carpenter - - - 6 10 16 14S. Davis - - 1 5 9 15 9B. King - - - 8 4 12 -S. Morgan - - - 3 9 12 3S. Dolphus - - - 3 8 11 -C. Hansen - - - 3 8 11 7M. Carter - - - - 10 10 10Q. Jackson - - - - 10 10 10J. Mason - - - - 10 10 10K. Oliver - - - - 10 10 10Z. Quinney - - - - 10 10 10M. Rivera - - - - 10 10 10J. Thomas - - - - 10 10 10J. Coco - - - - 9 9 3L. Johnson - - - 9 - 9 -J. DeFoor - - - - 9 9 3T. Oliver - - - - 9 9 7 T. Swilling - - - - 9 9 6J. Cole - - - 3 5 8 -Z. Roberts - - - - 8 8 4C. Thomas - - - - 8 8 6C. Martin - - - 2 5 7 -X. Gantt - - - 2 4 6 -J. Tukes - - - - 7 7 5W. Wells - - - - 7 7 6Hawkins-Anderson - - - 3 3 6 -M. Davis - 1 1 1 2 5 -A. Showell - - - - 5 5 - C. Clark - - - - 4 4 -J. Dingle - - - - 4 4 -J. Macrina - - - - 4 4 -A. Mallard - - - - 4 4 1Z. Walton - - - - 4 4 -T.K. Chimedza - - - - 3 3 1J. Domineck - - - - 3 3 -
STARTS AND GAMES PLAYED CAREER GAMES
NAME ‘14 ‘15 ‘16 ‘17 ‘18 TOT. CONS.J. King - - - - 3 3 -J. Brashear - - - 1 1 2 -A. Bussoletti - - - 1 1 2 -L. Byrne - - - - 2 2 1K. Dawson - - - - 2 2 -J. Graham - - - - 2 2 2M. Minihan - - - - 2 2 -A. Sanders - - - - 2 2 -D. Smith - - - - 2 2 -Q. Griffin - - - - 2 2 -J. Blancato - - - - 1 1 -D. Brooks - - - 1 - 1 -C. Hunt - 1 - - - 1 -L. Johns - - - - 1 1 -C. Malloy - - - - 1 1 -

2018 GEORGIA TECH FOOTBALL GAME NOTESGAME 11 vs. VIRGINIA • NOV. 17 • ATLANTA, GA.
21
BRANDON ADAMSTackles: 3, twice - last vs. Duke, Oct. 13, 2018Solo Tackles: 2, three times - last vs. No. 7 Georgia, Nov. 25, 2017Tackles for Loss: 1.0, three times - last at Louisville, Oct. 5, 2018Forced Fumbles: 1 vs. Alcorn State, Sept. 1, 2018Quarterback Hurries: 1 vs. No. 17 Virginia Tech, Nov. 11, 2017Pass Breakups: 1 vs. Pittsburgh, Sept. 23, 2017
VICTOR ALEXANDERTackles: 11 at Virginia, Nov. 4, 2017Solo Tackles: 6, three times - last at No. 7 Clemson, Oct. 28, 2017Tackles for Loss: 1.0, four times - last vs. No. 17 Virginia Tech, Nov. 11, 2017Sacks: 1.0, three times - last vs. Bowling Green, Sept. 29, 2018Fumbles Forced: 1 vs. Bowling Green, Sept. 29, 2018Quarterback Hurries: 1 vs. Jacksonville State, Sept. 9, 2017Pass Breakups: 1 at Virginia, Nov. 4, 2017
JAYTLIN ASKEWTackles: 6 at UCF, Sept. 8, 2018Solo Tackles: 4 at UCF, Sept. 8, 2018Pass Breakups: 1 at Pittsburgh, Sept. 15, 2018
KIRVONTE BENSONRushing Attempts: 29 vs. Pittsburgh, Sept. 23, 2017Rushing Yards: 196 yards vs. Pittsburgh, Sept. 23, 2017Longest Rush: 65 yards at No. 7 Clemson, Oct. 28, 2017Rushing Touchdowns: 2 vs. Pittsburgh, Sept. 23, 2017Receptions: 1, three times - last vs. Alcorn State, Sept. 1, 2018Receiving Yards: 9 yards vs. Pittsburgh, Sept. 23, 2017Longest Reception: 9 yards vs. Pittsburgh, Sept. 23, 2017
JOSH BLANCATORushing Attempts: 1 vs. Alcorn State, Sept. 1, 2018
DESMOND BRANCHTackles: 7 vs. No. 17 Virginia Tech, Nov. 11, 2017Solo Tackles: 5 vs. No. 17 Virginia Tech, Nov. 11, 2017Tackles for Loss: 1.5, twice - last North Carolina, Nov. 3, 2018Sacks: 1.0 at No. 11/10 Miami (Fla.), Oct. 14, 2017Interception: 1 vs No. 3/2 Clemson, Sept. 22, 2018Quarterback Hurries: 1, three times - last at No. 11/10 Miami (Fla.), Oct. 14, 2017Pass Breakups: 1, four times - last vs. Wake Forest, Oct. 21, 2017
JALEN CAMPReceptions: 2, three times - last vs. Miami, Nov. 10, 2018Receiving Yards: 70 yards vs. Bowling Green, Sept. 29, 2018Longest Reception: 49 yards at Virginia, Nov. 4, 2017
CHRISTIAN CAMPBELLTackles: 5 at Virginia, Nov. 4, 2017Solo Tackles: 2 at No. 7 Clemson, Oct. 28, 2017Tackles for Loss: 1.0, three times - last at Louisville, Oct. 5, 2018 Sacks: 1.0, twice - last at Louisville, Oct. 5, 2018Pass Breakups: 1, twice - last vs. Bowling Green, Sept. 29, 2018
TARIQ CARPENTERTackles: 8 vs. No. 3/2 Clemson, Sept. 22, 2018Solo Tackles: 5, twice - last vs. No. 3/2 Clemson, Sept. 22, 2018Tackles for Loss: 1.0 at Pittsburgh, Sept. 15, 2018Interceptions: 1, twice - last at North Carolina, Nov. 3, 2018Pass Breakups: 1, twice - last vs. No. 3/2 Clemson, Sept. 22, 2018Fumbles Forced: 1 vs. Miami, Nov. 10, 2018
MALACHI CARTERReceptions: 1, four times - last vs. Duke, Oct. 13, 2018Receiving Yards: 32 yards vs. Duke, Oct. 13, 2018 Receiving Touchdowns: 1 vs. Duke, Oct. 13, 2018Longest Reception: 32 yards vs. Duke, Oct. 13, 2018
KYLE CERGE-HENDERSONTackles: 7 at Georgia, Nov. 26, 2016Solo Tackles: 3, twice - last vs. Virginia, Nov. 19, 2016Tackles for Loss: 3.0 at USF, Sept. 8, 2018Sacks: 2.0 at USF, Sept. 8, 2018Fumble Recoveries: 1, twice - last vs. Duke, Oct. 13, 2018Quarterback Hurries: 2 vs. Georgia Southern, Oct. 15, 2016Blocked Kicks: 1 vs. Mercer, Sept. 10, 2016 (field goal)
T.K. CHIMEDZATackles: 1 vs. Duke, Oct. 13, 2018
CAREER HIGHSJARETT COLETackles: 1 vs. Alcorn State, Sept. 1, 2018Solo Tackles: 1 vs. Alcorn State, Sept. 1, 2018
TYLER COOKSEYTackles: 1 vs. North Carolina, Sept. 30, 2017Solo Tackles: 1 vs. North Carolina, Sept. 30, 2017
NATHAN COTTRELLRushing Attempts: 9 at North Carolina, Nov. 3, 2018Rushing Yards: 90 yards at North Carolina, Nov. 3, 2018Longest Rush: 69 yards vs. No. 17 Virginia Tech, Nov. 11, 2017Rushing Touchdowns: 1, three times - last at North Carolina, Nov. 3, 2018Receptions: 2 vs. Duke, Oct. 13, 2018Receiving Yards: 6, twice - last vs. Duke, Oct. 13, 2018Longest Reception: 9 yards vs. Duke, Oct. 13, 2018Kickoff Returns: 8 at Virginia, Nov. 4, 2017Kickoff Return Yards: 178 yards at Virginia, Nov. 4, 2017Longest Kick Return: 35 yards at No. 11/10 Miami (Fla.), Oct. 14, 2017Fumble Recoveries: 1 at No. 18/22 Virginia Tech, Nov. 12, 2016
DAVID CURRYTackles: 7 at North Carolina, Nov. 3, 2018Solo Tackles: 4 at USF, Sept. 8, 2018Sacks: 0.5 vs. No. 3/2 Clemson, Sept. 22, 2018Interceptions: 1 vs. Bowling Green, Sept. 29, 2018Fumble Recoveries: 1 vs. Alcorn State, Sept. 1, 2018Touchdowns: 1 vs. Alcorn State, Sept. 1, 2018 (fumble return)
MELVIN DAVISRushing Attempts: 1 vs. Alcorn State, Sept. 1, 2018Rushing Yards: 3 yards vs. Alcorn State, Sept. 1, 2018Longest Rush: 3 yards vs. Alcorn State, Sept. 1, 2018
SHAWN DAVISField Goals Made: 1, twice - last vs. North Carolina, Sept. 30, 2017Longest Field Goal: 34 yards vs. Jacksonville State, Sept. 9, 2017PATs Made: 5, twice - last vs. Pittsburgh, Sept. 23, 2017Points Scored: 7 vs. Jacksonville State, Sept. 9, 2017Kickoff Touchbacks: 4 vs. Jacksonville State, Sept. 9, 2017
KELTON DAWSONTackles: 1 vs. Bowling Green, Sept. 29, 2018
JUSTICE DINGLETackles: 1 at USF, Sept. 8, 2018
STEPHEN DOLPHUSReceptions: 1 vs. Bowling Green, Sept. 29, 2018Receiving Yards: 39 yards vs. Bowling Green, Sept. 29, 2018Long Reception: 39 yards vs. Bowling Green, Sept. 29, 2018
JORDAN DOMINECKTackles: 4 at USF, Sept. 8 2018Solo Tackles: 3 at USF, Sept. 8, 2018
XAVIER GANTTRushing Attempts: 1, twice - last at Virginia Tech, Oct. 25, 2018Rushing Yards: 1 yard, twice - last at Virginia Tech, Oct. 25, 2018Longest Rush: 1 yard, twice - last at Virginia Tech, Oct. 25, 2018
BRENTAVIOUS GLANTONTackles: 6 vs. Wake Forest, Oct. 21, 2017Solo Tackles: 6 vs. Wake Forest, Oct. 21, 2017Tackles for Loss: 1.0, four times - last at No. 7 Georgia, Nov. 25, 2017Sacks: 1.0 vs. Vanderbilt, Sept. 17, 2016Pass Breakups: 1 at Virginia, Nov. 4, 2017
JORDAN GRAHAMRushing Attempts: 2 at Virginia Tech, Oct. 25, 2018Rushing Yards: 25 yards at Virginia Tech, Oct. 25, 2018Longest Rush: 13 yards at Virginia Tech, Oct. 25, 2018
QUAN GRIFFINTackles: 2 vs. Alcorn State, Sept. 1, 2018Solo Tackles: 2 vs. Alcorn State, Sept. 1, 2018
PRESSLEY HARVIN IIIPunt Attempts: 9, twice - last at Virginia, Nov. 4, 2017Highest Punt Avg. (min. 2 att.): 51.5 yards vs. Wake Forest, Oct. 21, 2017Longest Punt: 62 yards, twice - last at USF, Sept. 8, 201850+ Yard Punts: 5 at No. 7 Clemson, Oct. 28, 2017Punts Downed Inside 20: 4, twice - last at Virginia, Nov. 4, 2017
JAQUAN HENDERSONTackles: 3, three times - last vs. Bowling Green, Sept. 29, 2018Solo Tackles: 2, three - last vs. Bowling Green, Sept. 29, 2018
JERRY HOWARDRushing Attempts: 12, three times - last vs. Miami, Nov. 10, 2018Rushing Yards: 90 yards at North Carolina, Nov. 3, 2018Longest Rush: 65 yards vs. Jacksonville State, Sept. 9, 2017Rushing Touchdowns: 1, five times - last vs. Duke, Oct. 13, 2018Receptions: 1, three times - last at North Carolina, Nov. 3, 2018Receiving Yards: 18 yards at North Carolina, Nov. 3, 2018Longest Reception: 18 yards at North Carolina, Nov. 3, 2018Kickoff Returns: 2, twice - last vs. No. 7 Georgia, Nov. 25, 2017Kickoff Return Yards: 36 yards at Duke, Nov. 18, 2017Longest Kick Return: 20 yards vs. No. 7 Georgia, Nov. 25, 2017
BAILEY IVEMEYERTackles: 1, twice - last at Pittsburgh, Sept. 15, 2018
QUEZ JACKSONTackles: 4, twice - last vs. Bowling Green, Sept. 29, 2018Solo Tackles: 2, twice - last vs. Bowling Green, Sept. 29, 2018
TRE’ JACKSONTackles: 2, three times - last vs. Miami, Nov. 10, 2018Solo Tackles: 2 vs. Vanderbilt, Sept. 17, 2016Tackles for Loss: 1.0 vs. Vanderbilt, Sept. 17, 2016Pass Breakups: 1 vs. Vanderbilt, Sept. 17, 2016Fumble Recoveries: 1 vs. Alcorn State, Sept. 1, 2018
OMAHRI JARRETTRushing Attempts: 1, four times - last vs. Bowling Green, Sept. 29, 2018Rushing Yards: 29 yards at Louisville, Oct. 5, 2018Longest Rush: 29 yards at Louisville, Oct. 5, 2018Kickoff Returns: 5 at Duke, Nov. 18, 2017Kickoff Return Yards: 84 yards at Duke, Nov. 18, 2017Longest Kick Return: 24 yards vs. No. 17 Va. Tech, Nov. 11, 2017
JALEN JOHNSONTackles: 9, twice - last vs. Miami, Nov. 10, 2018Solo Tackles: 8 vs. Miami, Nov. 10, 2018Tackles for Loss: 3.0 vs. Miami, Nov. 10, 2018Fumbles Recovered: 1 at Virginia Tech, Oct. 25, 2018
BRUCE JORDAN-SWILLINGTackles: 11 at Virginia, Nov. 4, 2017Solo Tackles: 6 at Virginia, Nov. 4, 2017Tackles for Loss: 1.0, twice - last at Virginia, Nov. 4, 2017Forced Fumbles: 1 at Virginia, Nov. 4, 2017Fumble Recoveries: 1, twice - last vs. Duke, Oct. 13, 2018Interceptions: 1 at Virginia, Nov. 4, 2017Pass Breakups: 1 vs. Pittsburgh, Sept. 23, 2017Quarterback Hurries: 1 at No. 7 Clemson, Oct. 28, 2017Touchdowns: 1 at Virginia, Nov. 4, 2017 (interception return)
AJANI KERRTackles: 8 vs. Bowling Green, Sept. 29, 2018Solo Tackles: 6, twice - last vs. Bowling Green, Sept. 29, 2018Pass Breakups: 1, five times - last at Pittsburgh, Sept. 15, 2018Fumbles Recovered: 1 vs. Miami, Nov. 10, 2018
BRENTON KINGField Goals Made: 2 vs. Wake Forest, Oct. 21, 2017Longest Field Goal: 42 yards vs. Wake Forest, Oct. 21, 2017PATs Made: 5 at USF, Sept. 8, 2018Points Scored: 8, twice - last at USF, Sept. 8, 2018 Kickoff Touchbacks: 1 vs. Wake Forest, Oct. 21, 2017

22
2018 GEORGIA TECH FOOTBALL GAME NOTESGAME 11 vs. VIRGINIA • NOV. 17 • ATLANTA, GA.
CLINTON LYNCHRushing Attempts: 8, twice - last vs. Georgia, Nov. 28, 2015Rushing Yards: 78 yards vs. Georgia, Nov. 28, 2015Rushing Touchdowns: 1, eight times - last at Pittsburgh, Sept. 15, 2018Longest Rush: 49 yards at Virginia, Oct. 31, 2015Receptions: 3, five times - last at USF, Sept. 8, 2018Receiving Yards: 111 yards at USF, Sept. 8, 2018Touchdown Receptions: 2, twice - last vs. Duke, Oct. 29, 2016Longest Reception: 83 yards at No. 18/17 N. Carolina, Nov. 5, 2016
JOSEPH MACRINARushing Attempts: 2, twice - last vs. Bowling Green, Sept. 29, 2018Rushing Yards: 8 yards vs. Alcorn State, Sept. 1, 2018Longest Rush: 4 yards, twice - last vs. Bowling Green, Sept. 29, 2018
CHRISTIAN MALLOYRushing Attempts: 4 at Virginia Tech, Oct. 25, 2018Rushing Yards: 27 at Virginia Tech, Oct. 25, 2018Longest Rush: 10 yards at Virginia Tech, Oct. 25, 2018
TAQUON MARSHALLCompletions: 9, twice - last at USF, Sept. 8, 2018Pass Attempts: 22 at Virginia, Nov. 4, 2017Passing Yards: 183 yards at USF, Sept. 8, 2018Longest Pass: 81 yards at USF, Sept. 8, 2018Passing Touchdowns: 3 vs. Jacksonville State, Sept. 9, 2017Rushing Attempts: 44 vs. No. 25/24 Tennessee, Sept. 4, 2017Rushing Yards: 249 yards vs. No. 25/24 Tennessee, Sept. 4, 2017Longest Rush: 78 yards at Virginia, Nov. 4, 2017Rushing Touchdowns: 5 vs. No. 25/24 Tennessee, Sept. 4, 2017Receptions: 1, three times — last at Duke, Sept. 26, 2015Receiving Yards: 35 yards vs. Tulane, Sept. 12, 2015Longest Reception: 35 yards vs. Tulane, Sept. 12, 2015Touchdown Receptions: 1 vs. Tulane, Sept. 12, 2015
CHRIS MARTINTackles: 3 vs. Bowling Green, Sept. 29, 2018Solo Tackles: 2 vs. Bowling Green, Sept. 29, 2018
JORDAN MASONRushing Attempts: 13, twice - last at Louisville, Oct. 5, 2018Rushing Yards: 95 yards at USF, Sept. 8, 2018Rushing Touchdowns: 3 at Virginia Tech, Oct. 25, 2018Longest Rush: 46 yards at USF,, Sept. 8, 2018Receptions: 1 at Pittsburgh, Sept. 15, 2018Receiving Yards: 2 yards at Pittsburgh, Sept. 15, 2018Longest Reception: 2 yards at Pittsburgh, Sept. 15, 2018TYLER MERRIWEATHERTackles: 2 at No. 18/17 North Carolina, Nov. 5, 2016Solo Tackles: 1, five times - last vs. No. 7 Georgia, Nov. 25, 2017Tackles for a Loss: 0.5 at No. 18/17 North Carolina, Nov. 5, 2016
BRANT MITCHELLTackles: 12 vs. Virginia, Nov. 19, 2016Solo Tackles: 8, twice - last vs. No. 7 Georgia, Nov. 25, 2017Tackles for Loss: 1.0, six times - last vs. No. 17 Virginia Tech, Nov. 11, 2017Sacks: 1.0, three times - last vs. Duke, Oct. 13, 2018Interceptions: 1, four times - last at Georgia, Nov. 26, 2016Pass Breakups: 1, three times - last vs. No. 17 Virginia Tech, Nov. 11, 2017Fumble Recoveries: 1 at Pittsburgh, Oct. 8, 2016Quarterback Hurries: 2 vs. Pittsburgh, Sept. 23, 2017
KALEB OLIVERTackles: 4, twice - last at USF, Sept. 8, 2018Solo Tackles: 2, twice - last at USF, Sept. 8, 2018Tackles for Loss: 1.0, twice - last at Pittsburgh, Sept. 15, 2018Interceptions: 1 vs. Alcorn State, Sept. 1, 2018Pass Breakups: 1, twice - last vs. Bowling Green, Sept. 29, 2018Fumbles Forced: 1 at Pittsburgh, Sept. 15, 2018
TOBIAS OLIVERRushing Attempts: 40 at Virginia Tech, Oct. 25, 2018Rushing Yards: 215 yards at Virginia Tech, Oct. 25, 2018Longest Rush: 65 yards at Louisville, Oct. 5, 2018Rushing Touchdowns: 3, twice - last at Virginia Tech, Oct. 25, 2018Passing Attempts: 6 vs. Duke, Oct. 13, 2018Passing Completions: 2, three times - last at UNC, Nov. 3, 2018Passing Yards: 104 yards at North Carolina, Nov. 3, 2018Passing Touchdowns: 1, twice - last at North Carolina, Nov. 3, 2018Longest Pass: 86 yards at North Carolina, Nov. 3, 2018
CAREER HIGHSANTWAN OWENSTackles: 4 vs. Alcorn State, Sept. 1, 2018Solo Tackles: 4 vs. Alcorn State, Sept. 1, 2018 Tackles For Loss: 1.0 vs. Jacksonville State, Sept. 9, 2017Sacks: 1.0 vs. Jacksonville State, Sept. 9, 2017Rushing Attempts: 1 at Pittsburgh, Sept. 15, 2018
MALIK RIVERATackles: 10, twice - last at North Carolina, Nov. 3, 2018Solo Tackles: 5 at North Carolina, Nov. 3, 2018Tackles For Loss: 0.5 at North Carolina, Nov. 3, 2018Interceptions: 1, twice - last vs. No. 3/2 Clemson, Sept. 22, 2018Longest Interception Return: 42, twice - last vs. No. 3/2 Clemson, Sept. 22, 2018
ANREE SAINT-AMOURTackles: 9 at North Carolina, Nov. 3, 2018Solo Tackles: 4, twice - last at Pittsburgh, Sept. 15, 2018Tackles For Loss: 3.0 vs. Jacksonville State, Sept. 9, 2017Sacks: 2.0, three times - last vs. Duke, Oct. 13, 2018Interceptions: 1, twice - last at North Carolina, Nov. 3, 2018Forced Fumble: 2 at Louisville, Oct. 5, 2018Fumble Recoveries: 1, three times - last vs. Pittsburgh, Sept. 23, 2017Quarterback Hurries: 2, twice - last at Pittsburgh, Sept. 15, 2018Pass Breakups: 1 at North Carolina, Nov. 3, 2018
QUA SEARCYRushing Attempts: 8 at Georgia, Nov. 26, 2016Rushing Yards: 91 yards vs. Mercer, Sept. 10, 2016Rushing Touchdowns: 2 at Louisville, Oct. 5, 2018Longest Rush: 60 yards vs. Virginia, Nov. 19, 2016Receptions: 3 vs. Boston College, Sept. 3, 2016Receiving Yards: 60 yards vs. Boston College, Sept. 3, 2016Touchdown Receptions: 1, three times - last at UNC, Nov. 3, 2018Longest Reception: 86 yards at North Carolina, Nov. 3, 2018Punt Returns: 1 vs. Alcorn State, Sept. 3, 2015
AVERY SHOWELLKick Returns: 1 vs. Bowling Green, Sept. 29, 2018Kick Returns Yards: 14 yards vs. Bowling Green, Sept. 29, 2018Longest Kick Return: 14 yards vs. Bowling Green, Sept. 29, 2018
LAMONT SIMMONSTackles: 7 vs. No. 3/2 Clemson, Sept. 22, 2018Solo Tackles: 4 vs. No. 3/2 Clemson, Sept. 22, 2018Tackles for Loss: 1.0 at Virginia Tech, Oct. 25, 2018Pass Breakups: 1, six times - last vs. No. 3/2 Clemson, Sept. 22, 2018Forced Fumbles: 1 vs. No. 5/3 Clemson, Sept. 22, 2016Interceptions: 1 vs. Duke, Oct. 13, 2018Kickoff Return Touchdowns: 1 at No. 11/10 Miami (Fla.), Oct. 14, 2017 (onside kick)
DEVIN SMITHTackles: 1.0 at Louisville, Oct. 5, 2018Solo Tackles: 1 at Louisville, Oct. 5, 2018
BRAD STEWARTReceptions: 4 vs. Alcorn State, Sept. 1, 2018Receiving Yards: 87 yards at Georgia, Nov. 26, 2016Longest Reception: 64 yards at Georgia, Nov. 26, 2016Touchdown Receptions: 1, three times - last vs. Miami, Nov. 10, 2018Rushing Attempts: 1, twice - last at Pittsburgh, Oct. 8, 2016Punt Returns: 3 vs. Jacksonville State, Sept. 9, 2017Punt Return Yards: 43 yards vs. No. 14 Miami (Fla.), Oct. 1, 2016Long Punt Return: 26 yards vs. No. 14 Miami (Fla.), Oct. 1, 2016
TRE SWILLINGTackles: 6 at Louisville, Oct. 5, 2018Solo Tackles: 4 at Louisville, Oct. 5, 2018Tackles for Loss: 1.0 Sacks: 1.0 vs. Duke, Oct. 13, 2018Sacks: 1.0 vs. Duke, Oct. 13, 2018Interceptions: 1 at North Carolina, Nov. 3, 2018Fumbles Forced: 1 Sacks: 1.0 vs. Duke, Oct. 13, 2018Pass Breakups: 2 vs. Miami, Nov. 10, 2018
CHARLIE THOMASTackles: 9 at Virginia Tech, Oct. 25, 2018Solo Tackles: 6 at Virginia Tech, Oct. 25, 2018Tackles for Loss: 1.0 at Virginia Tech, Oct. 25, 2018Fumbles Forced: 1 vs. Alcorn State, Sept. 1, 2018Fumbles Recovered: 2 at Louisville, Oct. 5, 2018Pass Breakups: 1 Sacks: 1.0 vs. Duke, Oct. 13, 2018
JUANYEH THOMASPunt Returns: 3 vs. Alcorn State, Sept. 1, 2018Punt Return Yards: 31 yards vs. Alcorn State, Sept. 1, 2018Long Punt Return: 25 yards vs. Alcorn State, Sept. 1, 2018Kickoff Returns: 6 at USF, Sept. 8, 2018Kickoff Return Yards: 134 yards at USF, Sept. 8, 2018Long Kickoff Return: 38 yards at USF, Sept. 8, 2018Interceptions: 1 at Louisville, Oct. 5, 2018Longest INT Return: 95 yards at Louisville, Oct. 5, 2018Pass Breakups: 1 at Louisville, Oct. 5, 2018Fumbles Recovered: 1 vs. Miami, Nov. 10, 2018
ZAMARI WALTONTackles: 2, twice - last at Virginia Tech, Oct. 25, 2018Solo Tackles: 2 vs. No. 3/2 Clemson, Sept. 22, 2018Pass Breakups: 2 vs. No. 3/2 Clemson, Sept. 22, 2018
WESLEY WELLSKick PATs: 9, twice - last at Louisville, Oct. 5, 2018Kickoff Touchbacks: 1 vs. Alcorn State, Sept. 1, 2018Field Goals Made: 2 vs. Miami, Nov. 10, 2018Field Goal Attempts: 2 vs. Miami, Nov. 10, 2018Longest Field Goal: 41 yards at Louisville, Oct. 5, 2018
DAMEON WILLIAMSTackles: 1 vs. Bowling Green, Sept. 29, 2018

2018 GEORGIA TECH FOOTBALL GAME NOTESGAME 11 vs. VIRGINIA • NOV. 17 • ATLANTA, GA.
23
STARTING LINEUPS, ETC.
OFFENSIVE STARTERS QB AB AB BB WR WR LT LG C RG RTAlcorn State T. Marshall Lynch Searcy Mason Camp Stewart Bryan Braun Lee B. Morgan A. Marshallat USF T. Marshall Lynch Searcy Benson Camp Stewart Quinney Braun Lee Bryan A. Marshallat Pittsburgh T. Marshall Lynch Searcy Mason Camp Stewart Quinney Braun Lee B. Morgan A. MarshallClemson T. Marshall Lynch Searcy Howard Camp Stewart Quinney Braun Lee B. Morgan A. MarshallBowling Green T. Marshall Lynch Searcy Howard Camp Stewart Quinney Braun Lee C. Hansen A. Marshallat Louisville T. Marshall Lynch Searcy Mason Camp Stewart Quinney Braun Lee C. Hansen A. MarshallDuke T. Marshall Lynch Searcy Mason Dolphus Stewart Quinney Braun Cooper C. Hansen B. Ivemeyerat Virginia Tech T. Oliver Lynch Searcy Mason Dolphus Stewart Quinney Braun Cooper C. Hansen A. Marshallat North Carolina T. Marshall Lynch Searcy Howard Camp Stewart Quinney Braun Cooper C. Hansen A. MarshallMiami (Fla.) T. Marshall Lynch Searcy Mason Camp Strewart Quinney Braun Cpp[er C. Hansen A. MarshallVirginiaat Georgia
DEFENSIVE STARTERS DE DT DE JACK ILB ILB STGR SS FS CB CBAlcorn State Branch Adams Saint-Amour Alexander Mitchell Curry Johnson Carpenter Rivera Askew T. Swillingat USF Branch Cerge-Henderson Saint-Amour Alexander Mitchell Curry Johnson Carpenter Rivera Askew T. Swillingat Pittsburgh Branch Cerge-Henderson Saint-Amour Alexander Mitchell Curry Johnson Carpenter Rivera Askew T. SwillingClemson Branch Cerge-Henderson Saint-Amour Alexander Mitchell Curry Johnson Carpenter Rivera Simmons KerrBowling Green Branch Cerge-Henderson Saint-Amour Alexander Mitchell Curry Johnson Carpenter Rivera Simmons Kerrat Louisville Branch Cerge-Henderson Saint-Amour C. Thomas Mitchell Curry Johnson Carpenter Rivera Askew T. SwillingDuke Branch Cerge-Henderson Saint-Amour C. Thomas Mitchell Curry Johnson Carpenter Rivera Askew T. Swillingat Virginia Tech Branch Cerge-Henderson Saint-Amour C. Thomas Mitchell Curry Johnson Carpenter Rivera Simmons T. Swillingat North Carolina Branch Cerge-Henderson Saint-Amour C. Thomas Mitchell Curry Johnson Carpenter Rivera Simmons T. SwillingMiami (Fla.) Branch Cerge-Henderson Saint-Amour C. Thomas Mitchell Curry Johnson Carpenter Rivera Simmons T. SwillingVirginiaat Georgia
GAME INFORMATION TECH COIN GT GT 1ST GT 1ST OPP. 1ST KICKOFF GAME GT GT GT CAPTAINS TOSS KO/REC. OFF. PLAY POSSESSION POSSESSION TIME LENGTH HELMET JERSEY PANTS Alcorn State T. Marshall, Mitchell ASU KO Mason 7 run TD Punt 12:34 p.m. 2:54 Gold White/Gold Gold at USF T. Marshall, Mitchell USF KO T. Marshall 1 run FG Interception 12:06 p.m. 3:24 Gold White/Blue Whiteat Pittsburgh T. Marshall, Mitchell Pitt KO Searcy 5 run Punt Punt 12:34 p.m. 3:03 White White/Blue WhiteClemson T. Marshall, Mitchell CU Rec. Searcy 20 run Punt Punt 3:30 p.m. 3:17 Gold Blue/White White Bowling Green T. Marshall, Mitchell BG KO Mason 9 run TD FG 12:04 p.m. 3:03 Gold White/Gold Goldat Louisville T. Marshall, Mitchell UL KO T. Marshall pass TD Downs 7:01 p.m. 3:14 White White/Gold WhiteDuke T. Marshall, Mitchell GT KO T. Marshall -9 run Punt Touchdown 12:20 p.m. 3:09 Gold White/Blue Blueat Virginia Tech T. Marshall, Mitchell GT KO Oliver 5 run TD TD 7:31 p.m. 3:06 White White/Gold Whiteat North Carolina T. Marshall, Mitchell GT KO T. Marshall 2 run Fumble Punt 12:15 p.m. 3:10 White White/Blue BlueMiami (Fla.) T. Marshall, Mitchell UM KO J. Howard 5 run TD TD 7:05 p.m. 3:05 White White/Gold WhiteVirginiaat Georgia
* touchdown
GEORGIA TECH TAKEAWAYS PTS. NO. OPP. QTR TURNOVER DEFENDER(S) LED TO OFF1. ASU (3) 2 Interception Kaleb Oliver TD 72. 3 Fumble Brandon Adams (F); David Curry (R) TD* 73. 4 Fumble Charlie Thomas (F); Tre Jackson (R) Fumble 04. USF (1) 1 Interception Tariq Carpenter FG 35. Pitt (1) 3 Interception Malik Rivera TD 66. CU (2) 2 Interception Desmond Branch TD 77. 4 Interception Malik Rivera TD 78. BG (3) 3 Fumble Victor Alexander (F); Antwan Owens (R) TD 79. 4 Interception David Curry Punt 010. 4 Interception Anree Saint-Amour TD* 711. UL (3) 1 Fumble Saint-Amour (F); C. Thomas (R) TD 712. 2 Fumble Saint-Amour (F); C. Thomas (R) TD 713 4 Interception Juanyeh Thomas TD* 714. DU (3) 1 Fumble Swilling (F); Cerge-Henderson (R) Downs 015. 2 Interception Lamont Simmons TD 716. 4 Fumble Saint-Amour (F); Jordan-Swilling (R) Downs 017. VT (1) 2 Fumble J. Johnson (R) TD 718. UNC (3) 1 Interception Tre Swilling TD 719. 4 Interception Tariq Carpenter TD 720. 4 Interception Anree Saint-Amour FG 321. UM (3) 1 Fumble Carpenter (F); Kerr (R) TD 722. 2 Fumble Charlie Thomas (R) FG 3 3 Fumble Juanyeh THomas (R) FG 3* Defensive touchdown Points 116
TURNOVERS
GEORGIA TECH GIVEAWAYS PTS. NO. OPP. QTR TURNOVER OFFENSIVE PLAYER LED TO OFF1. ASU (3) 1 Fumble TaQuon Marshall Punt 02. 2 Interception TaQuon Marshall INT 03. 4 Fumble Josh Blancato Punt 04. USF (3) 2 Interception TaQuon Marshall End Half 05. 4 Fumble Qua Searcy TD 76. 4 Interception TaQuon Marshall TD 77. Pitt (2) 3 Fumble Clinton Lynch INT 08. 4 Interception TaQuon Marshall Punt 09. CU (1) 1 Fumble Qua Searcy TD 7*10. DU (3) 3 Fumble Jerry Howard TD 711. 3 Fumble TaQuon Marshall TD 712. 3 Fumble Juanyeh Thomas TD 713. UNC (3) 1 Fumble Jerry Howard TD* 714. 3 Fumble Jordan Mason FG 315. 4 Fumble Tobias Oliver INT 016. UM (1) 2 Fumble Nathan Cottrell TD 7* Defensive touchdown Points 59

24
2018 GEORGIA TECH FOOTBALL GAME NOTESGAME 11 vs. VIRGINIA • NOV. 17 • ATLANTA, GA.
DRIVES
GEORGIA TECH SCORING DRIVES QTR TD FG PLAYERS PLAY PL YDS TIMEAlcorn State 1 X Jordan Mason 28-yd rush 4 68 1:20 2 X TaQuon Marshall 1-yd rush 9 81 4:25 2 X KirVonte Benson 5-yd rush 8 44 3:45 3 X KirVonte Benson 8-yd rush 3 77 1:23 3 X David Curry 15-yd fumble return 3 X Brad Stewart from TaQuon Marshall 24-yd pass 8 97 3:17USF 1 X Brenton King 35-yd field goal 9 40 6:32 1 X TaQuon Marshall 45-yd run 5 75 2:31 1 X Clinton Lynch from TaQuon Marshall 81-yd pass 1 81 0:17 3 X Tobias Oliver 5-yd run 7 69 3:36‘ 3 X Tobias Oliver 1-yd run 9 75 4:31 4 X Tobias Oliver 1-yd run 7 74 3:12Pitt 3 X TaQuon Marshall 1-yd run 10 75 6:17 3 X TaQuon Marshall 7-yd run 8 56 3:43 4 X Clinton Lynch 3-yd run 14 99 3:31Clemson 2 X TaQuon Marshall 11-yd run 4 23 1:46 3 X Nathan Cottrell 2-yd run 8 75 3:27 4 X Clinton Lynch from Tobias Oliver 5-yd pass 7 33 3:58Bowling Green 1 X Jordan Mason 9-yd run 7 69 3:12 1 X TaQuon Marshall 1-yd run 9 76 4:07 2 X Nathan Cottrell 4-yd run 8 72 3:55 2 X TaQuon Marshall 2-yd run 12 86 5:11 3 X Jordan Mason 33-yd run 6 93 3:27 3 X Tobias Oliver 34-yd run 3 51 1:13 4 X Anree Saint-Amour 3-yd INT return 4 X Tobias Oliver 62-yd run 1 62 0:13Louisville 1 X TaQuon Marshall 32-yd run 5 50 2:08 1 X TaQuon Marshall 1-yd run 5 36 2:24 2 X Wesley Wells 41-yd field goal 8 52 4:36 2 X Qua Searcy 2-yd run 9 62 2:17 3 X Qua Searcy 1-yd run 13 79 6:58 3 X Tobias Oliver 1-yd run 5 34 2:34 4 X Tobias Oliver 5-yd run 5 87 2:22 4 X Jerry Howard 2-yd run 8 75 4:38 4 X Juanyeh Thomas 95-yd INT returnDuke 2 X Malachi Carter from TaQuon Marshall 12-yd pass 4 52 1:17 4 X Jerry Howard 2-yd run 15 75 7:09Virginia Tech 1 X Jerry Howard 8-yd run 12 75 6:30 1 X Tobias Oliver 1-yd run 11 75 5:37 2 X Jordan Mason 5-yd run 2 12 0:18 2 X Tobias Oliver 5-yd run 9 72 4:08 3 X Tobias Oliver 11-yd run 10 75 5:46 3 X Jordan Mason 14-yd run 8 64 4:42 4 X Jordan Mason 1-yd run 6 28 3:40North Carolina 1 X Nathan Cottrell 11-yd run 5 75 2:13 2 X Tobias Oliver 2-yd run 9 45 4:23 2 X Qua Searcy from Tobias Oliver 86-yd pass 1 86 0:13 3 X Clinton Lynch 4-yd run 12 75 6:17 4 X Tobias Oliver 1-yd run 9 41 5:07 4 X Wesley Wells 22-yd field goal 6 14 1:58Miami 1 X TaQuon Marshall 28-yd run 11 75 6:25 1 X TaQuon Marshall 8-yd run 3 23 1:36 2 X Wesley Wells 38-yd field goal 7 18 4:11 3 X Wesley Wells 23-yd field goal 4 5 2:11 3 X Brad Stewart from TaQuon Marshall 31-yd pass 7 62 3:37
OPPONENT SCORING DRIVES QTR TD FG PLAYERS PLAY PL YDS TIMEUSF 1 X Terrence Horne 98-yd KO return 1 X Terrence Horne 97-yd KO return 2 X Darnel Salomon from Blake Barnett 18-yd pass 11 69 4:10 3 X Duran Bell 14-yd run 7 74 2:31 4 X Terrence Horne from Blake Barnett 3 -yd pass 8 76 2:04 4 X Blake Barnett 19-yd run 10 88 2:39 4 X Blake Barnett 5-yd run 5 18 1:34Pitt 1 X Qadree Ollison 31-yd run 5 63 1:41 1 X Darrin Hall 5-yd run 3 26 1:04 2 X Qadree Ollison 8-yd run 4 77 2:08 2 X Alex Kessman 33-yd FG 12 60 6:07Clemson 2 X Hunter Renfrow from Trevor Lawrence 17-yd pass 7 74 2:44 2 X Justyn Ross from Trevor Lawrence 53-yd pass 2 55 0:37 2 X Travis Etienne from Trevor Lawrence 3-yd pass 12 64 1:53 3 X Tavien Feaster 27-yd run 7 75 2:40 3 X Travis Etienne 3-yd run 10 83 4:27 4 X Tee Higgins from Trevor Lawrence 30-yd pass 5 77 2:13Bowling Green 1 X Nate Needham 29-yd FG 13 63 5:51 2 X Deric Phouthavong from Jarret Doege 30-yd pass 10 75 3:08 3 X Jarret Doege 1-yd run 11 78 3:48Louisville 2 X Tut. Atwell from Jawon Pass 29-yd pass 8 71 3:41 2 X Trey Smith 5-yd run 12 75 3:57 2 X Bla. Creque 46-yd FG 5 59 0:32 4 X De. Fitzpatrick from Jawon Pass 42-yd pass 8 74 2:00 4 X Tut. Atwell from Jordan Travis 29-yd pass 6 63 1:50Duke 1 X Deon Jackson 12-yd run 4 52 1:17 3 X T.J. Rahming from Daniel Jones 32-yd pass 2 31 0:48 3 X Davis Koppenhaver from Daniel Jones 1-yd pass 5 34 1:41 3 X Johnathan Lloyd from Daniel Jones 6-yd pass 1 6 0:05Virginia Tech 1 X Tre Turner from Ryan Willis 46-yd pass 5 73 1:34 1 X Damon Hazelton from Ryan Willis 41-yd pass 3 70 0:58 2 X Ryan Willis 1-yd run 11 73 4:40 4 X Jalen Holston 1-yd run 10 65 2:35North Carolina 1 X Malik Carney 20-yd fumble rec. 2 X Freeman Jones 23-yd field goal 15 64 5:39 3 X Carl Tucker from Jace Ruder 9-yd pass 8 85 2:58 3 X Freeman Jones 25-yd field goal 9 64 2:28 4 X Antonio Williams 1-yd run 4 50 1:26Miami 1 X DeeJay Dallas 1-yd run 11 75 5:28 2 X Cam’ron Davis 22-yd run 3 30 0:43 4 X Travis Homer 2-yd run 15 95 4:33
DRIVE CHART DISPLAYED GEORGIA TECH/OPPONENT FGs FGs 80+yard 3 and Possessions TDs Made Missed Fum. Int. Safety Punt Downs Half Game Drives OutAlcorn State 13/13 6/0 0/0 1/0 2/2 1/1 0/0 1/9 1/0 0/1 1/0 3/0 1/4at USF 13/13 5/7 1/0 0/0 2/0 1/1 0/0 2/3 1/1 0/1 1/0 1/1 2/1at Pittsburgh 12/13 3/3 0/1 1/0 1/0 1/1 0/0 4/6 2/0 0/2 0/1 1/0 3/3Clemson 13/13 3/7 0/0 1/0 1/0 0/2 0/0 6/3 1/0 1/1 0/1 0/1 5/1 Bowling Green 11/11 9/2 0/1 0/0 0/1 0/2 0/0 1/3 0/1 1/1 1/0 2/0 0/1at Louisville 11/11 9/4 1/1 0/0 0/2 0/1 0/0 0/2 0/1 1/0 1/0 1/0 0/1Duke 13/13 2/4 0/0 0/0 3/2 0/1 0/0 4/3 3/2 1/1 0/1 0/0 1/1at Virginia Tech 11/10 7/4 0/0 0/0 0/1 0/0 0/0 2/4 0/1 2/0 1/0 0/0 0/2 at North Carolina` 12/13 5/3 1/1 0/0 3/0 0/3 0/0 1/3 2/0 0/2 0/1 1/1 0/1Miami (Fla.) 11/10 3/3 2/0 0/0 1/3 0/0 0/0 3/4 0/0 2/0 1/0 0/1 2/2Virginiaat GeorgiaTOTALS 120/120 52/38 5/5 3/0 13/11 3/12 0/0 24/40 10/6 8/9 6/4 9/4 14/17
TOUCHDOWN DRIVES SUMMARY GT OPPTouchdown plays of 20-plus yards 11 13
Touchdown plays of 50-plus yards 3 1
Touchdown drives of 80-plus yards 4 3
Touchdown drives of 90-plus yards 2 1
Touchdown drives of 20 yards or less 2 2
Touchdown drives of 5:00 or more 10 1
Touchdown drives of 7:00 or more 1
Touchdown drives of 3:00 or less 7 22
Touchdown drives of 2:00 or less 11 15
Touchdown drives of 1:00 or less 4 6
Touchdown drives of 5 plays or less 14 12
Touchdown drives of 10 plays or more 12 13
Touchdown drives of 1 play 3 1
does not include special teams or defensive touchdowns

2018 GEORGIA TECH FOOTBALL GAME NOTESGAME 11 vs. VIRGINIA • NOV. 17 • ATLANTA, GA.
25
OPPONENT BIG PLAYS (20+ YARDS) * TouchdownNO. OPPONENT PLAYER(S) PLAY DOWN-DIST. YDS.1. USF Terrence Horne KO Return 342. Terrence Horne KO Return 98*3. Terrence Horne KO Return 97*4. Terrence Horne KO Return 215. Tyre McCants from Blake Barnett Pass 3-2 246. Blake Barnett Run 2-14 227. Pitt Taysir Mack from Kelly Pickett Pass 1-10 608. Clemson Justyn Ross from Trevor Lawrence Pass 2-8 53*9. Amari Rodgers from Trevor Lawrence Pass 3-15 2110. Tavien Feaster Run 1-10 27*11. Travis Etienne Run 2-5 3012. Tee Higgins from Trevor Lawrence Pass 1-10 30*13. Bowling Green Deric Phouthavong from Jarret Doege Pass 2-8 30*14. Scott Miller from Jarret Doege Pass 3-10 2515. Jordan Wayne-Prather from Jarret Doege Pass 1-10 2016. Ra’veion Hargrove from Jarret Doege Pass 3-10 2717. Louisville Micky Crum from Jawon Pass Pass 1-10 2218. Hassan Hall KO Return 3419. Hassan Hall KO Return 2920. Chatarius Atwell from Jawon Pass Pass 3-11 29*21. Hassan Hall KO Return 2222. Devante Peete from Jawon Pass Pass 2-10 3723. Hassan Hall KO Return 2524. Dez Fitzpatrick from Jawon Pass Pass 4-5 42*25. Jordan Travis Run 1-10 2526. Tyler Harrell KO Return 3727. Tyler Harrell from Jordan Travis Pass 4-7 3128. Chatarius Atwell from Jordan Travis Pass 2-10 2929. Duke Deon Jackson KO Return 4630. Deon Jackson KO Return 2831. T.J. Rahming from Daniel Jones Pass 3-12 48*32. T.J. Rahming from Daniel Jones Pass 1-10 2033. Virginia Tech Ryan Willis from Tre Turner Pass 1-10 46*34. Deshawn McClease KO Return 2435. Steven Peoples Run 2-5 2436. Deshawn McClease KO Return 2637. Deshawn McClease KO Return 2838. North Carolina Anthony Ratliff KO Return 2039. Malik Carney Fum. Return 20*40. Anthony Ratliff KO Return 2341. Anthony Ratliff KO Return 3142. Anthony Ratliff from J. Ruder Pass 1-10 4443. Anthony Ratliff from N. Elliott Pass 2-12 3544. Michael Carter Rush 2-11 5245. Anthony Ratliff KO Return 2946. Miami DeeJay Dallas KO Return 2647. Jeff Thomas KO Return 5248. DeeJay Dallas KO Return 2049. Jeff Thomas from N’Kosi Perry Pass 3-10 2350. Dee Wiggins from N’Kosi Perry Pass 3-10 24
GEORGIA TECH BIG PLAYS (20+ YARDS) * TouchdownNO. OPPONENT PLAYER(S) PLAY DOWN-DIST. YDS.1. Alcorn State Clinton Lynch Rush 1-10 252. Jordan Mason Rush 1-10 28*3. Nathan Cottrell Rush 2-5 254. TaQuon Marshall Rush 1-10 285. Juanyeh Thomas Punt Return 256. Kaleb Oliver INT Return 257. Qua Searcy Rush 1-10 568. Qua Searcy from TaQuon Marshall Pass 2-1 259. Brad Stewart from TaQuon Marshall Pass 1-10 24*10. USF TaQuon Marshall Rush 2-9 45*11. Clinton Lynch from TaQuon Marshall Pass 1-10 81*12. TaQuon Marshall Rush 1-10 3613. Juanyeh Thomas KO Return 3514. TaQuon Marshall Rush 1-10 2615. Qua Searcy Rush 1-10 2816. Jordan Mason Rush 1-10 4617. Juanyeh Thomas KO Return 3818. Clinton Lynch from TaQuon Marshall Pass 3-9 2119. Juanyeh Thomas KO Return 2220. Qua Searcy from TaQuon Marshall Pass 2-10 2121. Pitt Jerry Howard Rush 1-10 4222. Malik Rivera INT Return 4223. Jordan Mason Rush 1-10 3324. Jordan Mason Rush 1-10 2625. Jalen Camp from TaQuon Marshall Pass 2-1 2026. Clemson Qua Searcy Rush 1-10 2027. Jordan Mason Rush 2-7 2428. Clinton Lynch from TaQuon Marshall Pass 1-10 2929. Clinton Lynch from Tobias Oliver Pass 4-7 23 30. Tobias Oliver Rush 2-12 3931. Bowling Green Jalen Camp from TaQuon Marshall Pass 1-10 3332. Qua Searcy Rush 1-10 2133 Jalen Camp from TaQuon Marshall Pass 1-10 3734. Juanyeh Thomas KO Return 2335. Nathan Cottrell Rush 1-10 2336. Clinton Lynch from TaQuon Marshall Pass 2-9 4137. Stepehen Dolphus from TaQuon Marshall Pass 1-10 3938. Jordan Mason Rush 3-3 33*39. Antwan Owens Fum. Return 2140. Tobias Oliver Rush 1-10 34*41. Tobias Oliver Rush 1-10 62*42. Louisville Qua Searcy Rush 1-10 2543. TaQuon Marshall Rush 2-5 33*44. TaQuon Marshall Rush 1-10 3145. Juanyeh Thomas KO Return 2146. Omahri Jarrett Rush 2-5 2947. Tobias Oliver Rush 2-8 6548. Juanyeh Thomas INT Return 95*49. Duke Malachi Carter from TaQuon Marshall Pass 2-11 32*50. TaQuon Marshall Rush 2-8 2651. Brad Stewart from TaQuon Marshall Pass 3-8 2152. Qua Searcy from TaQuon Marshall Pass 1-10 2553. Brad Stewart from Tobias Oliver Pass 2-16 2554. North Carolina TaQuon Marshall Rush 1-10 4455. Qua Searcy from Tobias Oliver Pass 1-10 86*56. Juanyeh Thomas KO Return 2457. Nathan Cottrell Rush 2-4 2358. Qua Searcy Rush 1-10 3559. Miami Jalen Camp from TaQuon Marshall Pass 3-5 2060. TaQuon Marshall Rush 1-10 28*61. Juahyeh Thomas KO Return 2262. Nathan Cottrell Rush 1-10 3463. Juanyeh Thomas KO Return 26
BIG PLAYS
BIG PLAYS FROM SCRIMMAGE SUMMARY RUSH/CATCH 20-29 30-39 40-49 50-59 60-69 70-79 80-89 90-99 TOTQua Searcy 7 (4/3) 1 (1/0) 1 (1/0) 1 (0/1) 10TaQuon Marshall 4 (4/0) 3 (3/0) 2 (2/0) 9Clinton Lynch 4 (1/3) 1 (0/1) 1 (0/1) 6Jordan Mason 3 (3/0) 2 (2/0) 1 (1/0) 6Tobias Oliver 2 (2/0) 2 (2/0) 4Nathan Cottrell 4 (4/0) 4Jalen Camp 1 (0/1) 2 (0/2) 3Brad Stewart 3 (0/3) 3Stephen Dolphus 1 (0/1) 1Jerry Howard 1 (1/0) 1Omahri Jarrett 1 (1/0) 1Malachi Carter 1 (0/1) 1Jalen Camp 1 (0/1) 1Totals 28 (17/11) 12 (8/4) 5 (4/1) 1 (1/0) 2 (2/0) 1 (0/2) 50 (32/18)Opponents 13 (4/9) 7 (1/6) 2 (0/2) 2 (1/1) 1 (0/1) 25 (6/19)
PASSING 20-29 30-39 40-49 50-59 60-69 70-79 80-89 90-99 TOTTaQuon Marshall 9 4 1 1 15Tobias Oliver 2 1 3Totals 11 4 1 2 18Opponents 8 3 2 1 1 15

26
2018 GEORGIA TECH FOOTBALL GAME NOTESGAME 11 vs. VIRGINIA • NOV. 17 • ATLANTA, GA.
THE LAST TIME IT HAPPENED ...
TEAM GEORGIA TECH OPPONENTScored 50 Points Oct. 5, 2018 at Louisville (66) Nov. 14, 2013 by Clemson (55)Scored 50 Points, ACC Game Oct. 5, 2018 at Louisville (66) Nov. 14, 2013 by Clemson (55)Scored 35 Points, Half Oct. 5, 2018 at Louisville (35/2nd) Oct. 10, 2009 by Florida State (35/1st)Scored 28 Points, Quarter Sept. 3, 2015 vs. Alcorn State (34/1st) Dec. 31, 2008 by LSU (28/2nd) (Chick-fil-A Bowl)Scored 0 Points Oct. 18, 1997 at Florida State Sept. 1, 2018 by Alcorn StateScored 0 Points, Half Sept. 15, 2018 at Pitt (1st) Sept. 1, 2018 by Alcorn State (2nd)Overcame 10-Point Deficit, Win Oct. 21, 2017 vs. Wake Forest (10-21) Sept. 8, 2018 by USF (28-38)Overcame 10-Point Halftime Deficit, Win Nov. 29, 2008 at Georgia (12-28) Nov. 30, 2013 by Georgia (2OT) (7-20)40-Point Margin of Victory Sept. 29, 2018 vs. Bowling Green (63-17) Sept. 24, 2005 by Virginia (7-51)30-39-Point Margin of Victory Oct. 5, 2018 at Louisville (66-31) Nov. 25, 2017 by No. 7 Georgia (38-7)Scored 30 Points or more, Loss Sept. 8, 2018 at USF (38) Oct. 5, 2018 by Louisville (31)Scored fewer than 10 Points, Win Nov. 11, 2006 at North Carolina (7-0) Dec. 2, 2006 by Wake Forest (9-6)7 Touchdowns Oct. 25, 2018 at Virginia Tech (7) Sept. 22, 2018 by No. 3/2 Clemson (7)0 Touchdowns Dec. 31, 2008 vs. LSU Sept. 1, 2018 by Alcorn State5+ Rushing Touchdowns Oct. 25, 2018 at Virginia Tech (7) Nov. 5, 2016 by No. 18/17 North Carolina (5)4+ Passing Touchdowns Sept. 13, 2014 vs. Georgia Southern (4) Sept. 22, 2018 by No. 3/2 Clemson (4)Interception Return for Touchdown Oct. 5, 2018 at Louisville Nov. 11, 2017 by No. 17 Virginia Tech Juanyeh Thomas (95 yards) (Jordan Travis pass) Greg Stroman (24 yards) (TaQuon Marshall pass)Fumble Return for Touchdown Sept. 1, 2018 vs. Alcorn State; David Curry (15 yards) Nov. 3, 2018 at North Carolina; Malik Carney (20 yards)Punt Return for Touchdown Sept. 10, 2009 vs. Clemson; Jerrard Tarrant (85 yards) Sept. 23, 2017 by Pittsburgh; Quadree Henderson (80 yards)Blocked Punt Return for Touchdown Sept. 27, 1997 vs. Clemson Sept. 25, 2010 by NC State Block by Ajenavi Eziemefe, Djay Jones recovered for TD Asa Watson blocked and recovered for a touchdownKickoff Return for Touchdown Oct. 14, 2017 vs. No. 11/10 Miami; Lamont Simmons Sept. 8, 2018 by USF; Terrence Horne (98 yards) (42 yards (on-side)) Sept. 8, 2018 by USF; Terrence Horne (97 yards)2 Non-Offensive Touchdowns Nov. 8, 2014 at NC State (INT return, fumble return) Sept. 8, 2018 by USF (2 kickoff returns)4 Field Goals Made Dec. 31, 2016 vs. Kentucky (4) Oct. 14, 2017 by No. 11/10 Miami (4)3 Field Goals Missed Oct. 20, 2012 vs. Boston College (3) Sept, 29, 2007 by Clemson (4)5 Field Goals Attempted Dec. 31, 2011 vs. Utah (5) Nov. 17, 2007 by North Carolina (5)50-yard Field Goal Made Dec. 31, 2016 vs. Kentucky (Harrison Butker, 52) Sept. 23, 2017 by Pittsburgh; Alex Kessman (55 yards)Missed PAT Sept. 15, 2018 at Pitt Nov. 18, 2017 by Duke Missed more than 1 PAT Nov. 3, 2012 at Maryland (2) Nov. 5, 1977 by Notre Dame (2)Made 2-Point Conversion Nov. 4, 2017 at Virginia (TaQuon Marshall rush) Nov. 3, 2018 by North Carolina (N. Elliott pass to A. Ratliff)Failed 2-Point Conversion Sept. 15, 2018 at Pitt (TaQuon Marshall pass failed) Nov. 11, 2017 by No. 17 Virginia Tech (Josh Jackson pass failed)Two+ 2-Point Conversions Attempted Oct. 21, 2017 vs. Wake Forest (2, 2 failed) Nov. 11, 2017 by No. 17 Virginia Tech (2, 2 failed)Defensive Extra Point Scored Oct. 28, 1989 at Duke None recorded Ken Swilling 99-yard INT return (Steve Prince pass)Recorded Safety Sept. 12, 2015 vs. Tulane Nov. 4, 2017 by Virginia Tulane recovered poor snap on punt attempt in end zone GT recovered a fumble in their own end zoneBlocked Field Goal Nov. 12, 2016 at No. 18/22 Virginia Tech Sept. 4, 2017 by No. 25/24 Tennessee (2OT) TEAM blocked Joey Slye’s attempt Paul Bain blocked Shawn Davis’ attemptBlocked PAT Nov. 8, 2014 at NC State (Adam Gotsis) Nov. 18, 2017 by Duke (Mike Ramsay)Blocked Punt Dec. 31, 2016 vs. Kentucky Dec. 31, 2016 by Kentucky Antonio Simmons blocked punt of Lester Coleman Nico Firios blocked punt of Ryan RodwellBlocked 2 Kicks/Punts Dec. 30, 2013 vs. Ole Miss (field goal/PAT) Nov. 4, 1989 by Western Carolina (2 FGAs)30+ First Downs Oct. 25, 2018 at Virginia Tech (35) Nov. 18, 2017 by Duke (30)10 (or fewer) First Downs Oct. 28, 2017 at No. 7 Clemson (10) Sept. 1, 2018 by Alcorn State (9)500-599 Yards Total Offense Oct. 5, 2018 at Louisville (554) Nov. 18, 2017 by Duke (500)600+ Yards Total Offense Sept. 8, 2018 at USF (602) Nov. 5, 2016 by No. 18/17 North Carolina (636)Less than 200 Yards Total Offense Sept. 22, 2016 vs. No. 5/3 Clemson (124) Sept. 1, 2018 by Alcorn State (146)Less than 100 Yards Total Offense Nov. 18, 1961 at Alabama (96) Oct. 9, 2004 by Maryland (82)300+ Yards Total Offense, Half Sept. 8, 2018 at USF (337/2nd) Nov. 12, 2016 by No. 18/22 Virginia Tech (316/2nd)Less than 50 Yards Total Offense, Half Sept. 22, 2016 vs. No. 5/3 Clemson (22/1st) Sept. 9, 2017 by Jacksonville State (45/2nd)90 Offensive Plays Sept. 4, 2017 vs. No. 25/24 Tennessee (2OT) (96) Oct. 26, 2013 by Virginia (93)50 (or fewer) Offensive Plays Nov. 19, 2016 vs. Virginia (41) Oct. 25, 2018 by Virginia Tech (47)300-399 Yards Rushing Sept. 29, 2018 vs. Bowling Green (376) Nov. 18, 2017 by Duke (319)400+ Yards Rushing Nov. 3, 2018 at North Carolina (461) Nov. 27, 1975 by Georgia (431)50 Yards (or less) Rushing Nov. 27, 2004 at Georgia (24) Sept. 23, 2017 by Pittsburgh (37)0 Yards (or less) Rushing 1968 (two times – vs. Notre Dame and Navy) Nov. 2, 2013 by Pittsburgh (-5)60+ Rushing Attempts Oct. 25, 2018 at Virginia Tech (78) Oct. 5, 2002 by Wake Forest (60)30 (or fewer) Rushing Attempts Nov. 1, 2007 vs. Virginia Tech (26) Nov. 10, 2018 by Miami (Fla.)25+ Pass Completions Sept. 10, 2005 vs. North Carolina (25) Sept. 29, 2018 by Bowling Green (29)5 (or fewer) Pass Completions Nov. 3, 2018 at North Carolina (2) Oct. 1, 1994 by NC State (3)40+ Pass Attempts Sept. 22, 2007 at Virginia (40) Oct. 5, 2018 by Louisville (44)10 (or fewer) Pass Attempts Nov. 3, 2018 at North Carolina (2) Nov. 30, 1985 by Georgia (10)Threw 3 Interceptions Nov. 1, 2007 vs. Virginia Tech (5) Nov. 3, 2018 by North Carolina (3)300-399 Yards Passing Sept. 1, 2011 vs. Western Carolina (365) Oct. 5, 2018 by Louisville (370)400+ Yards Passing Nov. 10, 2001 at Virginia (486) Dec. 31, 2014 by Mississippi State (453)100 (or less) Yards Passing Nov. 10, 2018 vs. Miami (Fla.) (73) Sept. 1, 2018 by Alcorn State (69)

2018 GEORGIA TECH FOOTBALL GAME NOTESGAME 11 vs. VIRGINIA • NOV. 17 • ATLANTA, GA.
27
THE LAST TIME IT HAPPENED ...
TEAM GEORGIA TECH OPPONENTCompleted 70 Percent of Pass Attempts Nov. 10, 2018 vs. Miami (Fla.) (.750, 3-of-4) Nov. 25, 2017 by No. 7 Georgia (.706, 12-of-17)5+ Fumbles Oct. 13, 2018 vs. Duke (6) Oct. 25, 2014 by Pittsburgh (7)4+ Fumbles Lost Sept. 23, 2017 vs. Pittsburgh (4) Oct. 25, 2014 by Pittsburgh (6)5 Turnovers Oct. 26, 2013 at Virginia (5) Oct. 25, 2014 by Pittsburgh (6)0 Turnovers Oct. 5, 2018 at Louisville Nov. 25, 2017 by No. 7 Georgia10 Penalties Oct. 12, 2013 at BYU (10) Sept. 22, 2016 by No. 5/3 Clemson (10)2 (or fewer) Penalties Oct. 28, 2017 at No. 7 Clemson (2) Nov. 25, 2017 by No. 7 Georgia (2)100+ Penalty Yards Oct. 20, 2007 vs. Army (110) Oct. 28, 2004 by Virginia Tech (108)10 (or fewer) Penalty Yards Oct. 14, 2017 vs. No. 11/10 Miami (6) Nov. 3, 2018 by North Carolina (10)10 Punts Sept. 29, 2007 vs. Clemson (10) Oct. 11, 2008 by Gardner-Webb (10)0 Punts Oct. 5, 2018 at Louisville Dec. 5, 2009 by Clemson10 Third-Down Conversions Sept. 4, 2017 vs. No. 25/24 Tennessee (2OT) (13) Sept. 29, 2018 by Bowling Green (11)2+ Fourth-Down Conversions Nov. 3, 2018 at North Carolina (2-of-4) Oct. 5, 2018 by Louisville (2-of-3)4 Fourth-Down Attempts Nov. 3, 2018 at North Carolina (2-of-4) Nov. 11, 2017 by No. 17 Virginia Tech (2-of-4)37:00 or higher Time of Possession Oct. 25, 2018 at Virginia Tech (42:18) Nov. 19, 2016 by Virginia (38:37)15 Tackles for Loss Sept. 1, 2007 at Notre Dame (19) None Recorded10 Sacks Oct. 9, 1993 vs. Maryland (11) None Recorded5 Players to Score TD Oct. 5, 2018 at Louisville (6) Nov. 25, 2017 by No. 7 Georgia (5)4 Players to Rush for TD Oct. 5, 2018 at Louisville (5) Nov. 10, 2012 by North Carolina (4)3 Players to Catch TD Pass Sept. 12, 2015 vs. Tulane (3) Sept. 22, 2018 by No. 3/2 Clemson (4)2 Players to Throw TD Pass Sept. 17, 2016 vs. Vanderbilt (2 - Justin Thomas & Matthew Jordan) Oct. 5, 2018 by Louisville (2 - Jawon Pass & Jordan Travis)15-Play+ Touchdown Drive Oct. 13, 2018 vs. Duke (15) Nov. 10, 2018 by Miami (Fla.) (15)8-Minute+ Touchdown Drive Sept. 30, 2017 vs. North Carolina (8:54) Sept. 9, 2017 by Jacksonville State (8:11)90-Yard+ Touchdown Drive Sept. 15, 2018 at Pitt (99) Nov. 10, 2018 by Miami (Fla.) (95)1-Play Touchdown Drive Nov. 3, 2018 at North Carolina (Q. Searcy 86-yd pass from T. Oliver) Oct. 13, 2018 by Duke (J. Lloyd 6-yd pass from D. Jones)Won an Overtime Game Nov. 29, 2014 at Georgia (OT) (30-24) Sept. 4, 2017 by No. 25/24 Tennessee (2OT) (42-41)Game Won on Final Play Oct. 24, 2015 vs. Florida State (Lance Austin 78-yard missed FG return) Sept. 4, 2017 by No. 25/24 Tennessee (2OT) (stop on a 2-pt conversion attempt in the second overtime period)
BOTH TEAMS COMBINED90 Points Oct. 5, 2018 at Louisville (97) (66-31) 100+ Rushing Attempts Oct. 25, 2018 at Virginia Tech (103)20 (or fewer) Points Nov. 28, 2015 vs. Georgia (20) (13-7) 60 (or fewer) Rushing Attempts Sept. 9, 2006 vs. Samford (51)10 (or fewer) Points Nov. 11, 2006 at North Carolina (7) (7-0) 700+ Yards Passing Nov. 10, 2001 at Virginia (813)50 Points in a Half Nov. 23, 2013 vs. Alabama A&M (52/1st) 150 (or fewer) Yards Passing Nov. 3, 2012 at Maryland (146)0 Points in a Half Nov. 11, 2006 at North Carolina (2nd) 50 Pass Completions Sept. 15, 2007 vs. Boston College (50)30 Points in a Quarter Oct. 5, 2018 at Louisville (35/4th) 20 (or fewer) Completions Oct. 25, 2018 at Virginia Tech (15)10+ Touchdowns Oct. 25, 2018 at Virginia Tech (11) 90 Pass Attempts Oct. 26, 2002 vs. Virginia (101)0 Touchdowns Dec. 2, 2006 vs. Wake Forest 30 (or fewer) Pass Attempts Oct. 25, 2018 at Virginia Tech (23)5 Touchdowns in a Quarter Oct. 1, 2016 vs. No. 14 Miami (5/2nd) 5 Passes Intercepted Nov. 1, 2007 vs. Virginia Tech (5)8 Touchdowns in a Half Nov. 10, 2012 at North Carolina (8/1st, 8/2nd) 10 Fumbles Oct. 13, 2018 vs. Duke (10) 6 Field Goals Oct. 24, 2015 vs. Florida State (6) 5 Fumbles Lost Sept. 23, 2017 vs. Pittsburgh (5)4 Field Goals Missed Oct. 20, 2012 vs. Boston College (4) 10 Turnovers Nov. 17, 1990 at Wake Forest (10)8 Field Goals Attempted Nov. 17, 2007 vs. North Carolina (8) 0 Turnovers Oct. 15, 2016 vs. Georgia Southern50 First Downs Oct. 25, 2018 at Virginia Tech (51) 20 Penalties Sept. 10, 2004 vs. Western Carolina (21)25 (or fewer) First Downs Oct. 18, 2008 at Clemson (24) (12-12) 5 (or fewer) Penalties Nov. 3, 2018 at North Carolina (4)1,000+ Yards Total Offense Oct. 5, 2018 at Louisville (1,037) 200 Penalty Yards Sept. 9, 2000 vs. Florida State (254)500 Yards (or fewer) Total Offense Oct. 22, 2011 at Miami (473) 25 (or fewer) Penalty Yards Oct. 22, 2011 at Miami (15)160+ Offensive Plays Oct. 26, 2002 vs. Virginia (165) 15+ Punts Nov. 4, 2017 at Virginia (18)120 (or fewer) Offensive Plays Nov. 10, 2018 vs. Miami (110) 0 Punts Dec. 5, 2009 vs. Clemson600+ Yards Rushing Oct. 5, 2018 at Louisville (655) 10 Sacks Nov. 10, 2007 at Duke (10)150 (or fewer) Yards Rushing Nov. 19, 2005 at Miami (150)

28
2018 GEORGIA TECH FOOTBALL GAME NOTESGAME 11 vs. VIRGINIA • NOV. 17 • ATLANTA, GA.
THE LAST TIME IT HAPPENED ...
INDIVIDUAL GEORGIA TECH OPPONENT30+ Rushing Attempts Oct. 25, 2018 at Virginia Tech, Tobias Oliver (40) Nov. 8, 2003 by Duke, Chris Douglas (30)150-199 Yards Rushing Oct. 5, 2018 at Louisville, TaQuon Marshall (175) Oct. 14, 2017 by No. 11/10 Miami, Travis Homer (170)200+ Yards Rushing Oct. 25, 2018 at Virginia Tech, Tobias Oliver (215) Sept. 29, 2012 by Middle Tennessee St., Benny Cunningham (217)50+ Pass Attempts Oct. 6, 2005 vs. NC State, Reggie Ball (53) Oct. 26, 2013 by Virginia, David Watford (62)40+ Pass Attempts Sept. 22, 2007 at Virginia, Taylor Bennett (40) Sept. 29, 2018 by Bowling Green, Jarret Doege (44)25+ Pass Completions Nov. 8, 2003 vs. Duke, Reggie Ball (27) Sept. 29, 2018 by Bowling Green, Jarret Doege (27)Threw 3 Interceptions Nov. 1, 2007 vs. Virginia Tech, Taylor Bennett (4) Nov. 3, 2018 by North Carolina, Nathan Elliott (3)300-399 Yards Passing Oct. 6, 2007 vs. Maryland, Taylor Bennett (309) Sept. 29, 2018 by Bowling Green, Jarret Doege (305)400+ Yards Passing Nov. 10, 2001 at Virginia, George Godsey (486) Sept. 22, 2012 by Miami, Stephen Morris (436)Rushed and Passed for 100+ Yards Nov. 3, 2018 at North Carolina, Tobias Oliver (120/104) Oct. 3, 2015 by North Carolina, Marquise Williams (148/134)Rushed and Received for 100+ Yards Nov. 14, 2013 at Clemson, Robert Godhigh (126/203) Oct. 30, 1997 by North Carolina, J. Linton (138/137)300-399 Yards Total Offense Nov. 4, 2017 at Virginia, TaQuon Marshall (322) Oct. 14, 2017 by No. 11/10 Miami, Malik Rosier (317)400+ Yards Total Offense Oct. 29, 2016 vs. Duke, Justin Thomas (459) Oct. 6, 2012 by Clemson, Tajh Boyd (460)10+ Receptions Oct. 7, 2006 vs. Maryland, Calvin Johnson (10) Sept. 29, 2018 by Bowling Green, Scott Miller (10)100-199 Yards Receiving Sept. 8, 2018 at USF, Clinton Lynch (111) Sept. 29, 2018 by Bowling Green, Scott Miller (117)200+ Yards Receiving Oct. 4, 2008 vs. Duke, Demaryius Thomas (230) Dec. 29, 2005 by Utah, Travis Latendresse (214)4+ Touchdowns Scored Sept. 4, 2017 vs. No. 25/24 Tennessee (2OT), TaQuon Marshall (5) Sept. 22, 2018 by No. 3/2 Clemson, Trevor Lawrence (4)3+ Touchdowns Rushing Oct. 25, 2018 at Virginia Tech, Tobias Oliver/Jordan Mason (3) Sept. 4, 2017 by No. 25/24 Tennessee (2OT), John Kelly (4)3+ Touchdowns Receiving Sept. 11, 2004 vs. Clemson, Calvin Johnson (3) Nov. 29, 2008 by Georgia, Mohamed Massaquoi (3)4+ Touchdowns Passing Sept. 13, 2014 vs. Georgia Southern, Justin Thomas (4) Sept. 22, 2018 by No. 3/2 Clemson, Trevor Lawrence (4)Rushing and Receiving Touchdowns Oct. 14, 2017 vs. No. 11/10 Miami, J.J. Green (1/1) Oct. 14, 2017 by No. 11/10 Miami, Travis Homer (1/1)Rushing and Passing Touchdowns Nov. 3, 2018 at North Carolina, Tobias Oliver (2/1) Oct. 25, 2018 by Virginia Tech, Ryan Willis (1/2)Passing and Receiving Touchdowns Nov. 17, 2007 vs. North Carolina, Taylor Bennett (1/1) Nov. 18, 2017 by Duke, Shaun Wilson (1/2)4+ Field Goals Dec. 31, 2016 vs. Kentucky, Harrison Butker (4-of-4) Oct. 14, 2017 by No. 11/10 Miami, Michael Badgley (4-of-4)3 Field Goals Nov. 12 2016 at No. 18/22 Virginia Tech, Harrison Butker (3-of-3) Nov.18, 2017 by Duke, Austin Parker (3-of-3)5 Field Goal Attempts Sept. 1, 2007 vs. Notre Dame, Travis Bell (5) Nov. 17, 2007 by North Carolina, Connor Barth (5)Made a 50-yard Field Goal Dec. 31, 2016 vs. Kentucky, Harrison Butker (52) Sept. 23, 2017 by Pittsburgh, Alex Kessman (55)Attempted a 60-yard Field Goal Nov. 24, 2007 vs. North Carolina, Travis Bell (62/miss) Nov. 17, 2007 by North Carolina, Connor Barth (63/miss)10+ Punts Sept. 15, 2007 vs. Boston College, Durant Brooks (10) None recorded60-69 yard Punt Sept. 8, 2018 at USF, Pressley Harvin III (62) Nov. 4, 2017 by Virginia, Lester Coleman (63)70-yard+ Punt Nov. 17, 2007 vs. North Carolina, Durant Brooks (77) Sept. 4, 2017 by No. 25/24 Tennessee (2OT), Trevor Daniel (70)100+ Punt Return Yards Aug. 31, 2002 vs. Vanderbilt, Kelley Rhino (110) None recorded70-89 yard Punt Return Sept. 10, 2009 vs. Clemson, Jerrard Tarrant (85 TD) Sept. 23, 2017 by Pittsburgh, Quadree Henderson (80 TD)Punt Return for a Touchdown Sept. 10, 2009 vs. Clemson, Jerrard Tarrant Sept. 23, 2017 by Pittsburgh, Quadree Henderson90-yard+ Kickoff Return Oct. 8, 2016 at Pittsburgh, J.J. Green (96 TD) Sept. 8, 2018 by USF, Terrence Horne (98 TD, 97 TD)Kickoff Return for a Touchdown Oct. 14, 2017 vs. No. 11/10 Miami, Lamont Simmons (42, on-side) Sept. 8, 2018 by USF, Terrence Horne (98 TD, 97 TD)70-yard+ Interception Return Aug. 31, 2013 vs. Elon, Tyler Marcordes (95) Nov. 9, 2002 by Florida State, S. Samuels (82 TD)15+ Tackles Dec. 30, 2013 vs. Ole Miss, Jemea Thomas (15) Oct. 13, 2018 by Duke, Joe Giles-Harris (15)3.0+ Sacks Nov. 30, 2013 vs. Georgia (2OT), Jeremiah Attaochu (4.0) Oct. 21, 2017 by Wake Forest, Duke Ejiofor (3.0)2+ Interceptions Sept. 30, 2017 vs. North Carolina, A.J. Gray (2) Oct. 26, 2013 by Virginia, Anthony Harris (2)2+ Fumble Recoveries Oct. 5, 2018 at Louisville, Charlie Thomas (2) None recorded2+ Forced Fumbles Oct. 5, 2018 at Louisville, Anree Saint-Amour (2) Nov. 3, 2018 by North Carolina, Cole Holcomb (3)
TWO PLAYERS GEORGIA TECH OPPONENT2 100-yard Rushers Oct. 5, 2018 at Louisville Nov. 28, 2009 by Georgia TaQuon Marsahll (175) and Tobias Oliver (103) Washaun Ealey (183) and Caleb King (166)2 100-yard Receivers Sept. 10, 2005 vs. North Carolina Nov. 14, 2013 by Clemson Damarius Bilbo (131) and Calvin Johnson (114) Martavis Bryant (176) and Sammy Watkins (104)100-yard Rusher/100-yard Receiver Sept. 8, 2018 Sept. 4, 2017 by No. 25/24 Tennessee (2OT) TaQuon Marshall (113) and Clinton Lynch (111) John Kelly (128) and Marquez Callaway (115)250 Combined Yards Rushing Oct. 25, 2018 at Virginia Tech Nov. 26, 2016 by Georgia Tobias Oliver and Jordan Mason (297) Sony Michel and Nick Chubb (258)250 Combined Yards Receiving Jan. 1, 2007 vs. West Virginia Nov. 14, 2013 by Clemson Calvin Johnson and James Johnson (254) Martavis Bryant and Sammy Watkins (280)20 Combined Receptions Nov. 10, 2001 at Virginia Oct. 26, 2013 by Virginia Will Glover and Kerry Watkins (21) Darius Jennings and Tim Smith (23)

2018 GEORGIA TECH FOOTBALL GAME NOTESGAME 11 vs. VIRGINIA • NOV. 17 • ATLANTA, GA.
29
0-1, 0-0
1-0, 0-0
ALCORN STATE 0
GEORGIA TECH 41
Game 1 • Sept. 1, 2018 • Atlanta, Ga. • Bobby Dodd Stadium (39,719)
SCORING SUMMARY 1 2 3 4 FAlcorn State 0 0 0 0 0Georgia Tech 7 13 21 0 41
1st 12:08 GT Jordan Mason 28 yd run (Shawn Davis kick), 4-68, 1:20 GT 7, ASU 02nd 13:49 GT TaQuon Marshall 1 yd run (Shawn Davis kick failed), 9-81, 4:25 GT 13, ASU 0 8:47 GT KirVonte Benson 5 yd run (Brenton King kick), 8-44, 3:45 GT 20, ASU 03rd 13:28 GT KirVonte Benson 8 yd run (Brenton King kick), 3-77, 1:23 GT 27, ASU 0 12:43 GT David Curry 15 yd fumble recovery (Brenton King kick) GT 34, ASU 0 3:07 GT Brad Stewart 24 yd pass from TaQuon Marshall (Brenton King kick), 8-97, 3:17 GT 41, ASU 0
TEAM STATISTICS ASU GTFirst Downs ................................................ 9 .................................................. 25Rushes-Yards ............................................. 28-77 .......................................... 54-439Passing Yards ............................................. 69 ................................................ 104Pass Comp-Att-Int ...................................... 15-23-1 ....................................... 9-18-1Total Offense .............................................. 146 .............................................. 543Fumbles-Lost ............................................. 3-2 .............................................. 2-2Penalties-Yards ........................................... 3-20 ............................................ 3-30Punts-Yards (Avg./Net) ................................ 9-372 (41.3/35.7) ........................ 1-48 (48.0/48.0)Kickoffs-Yards (Avg./Net) ............................. 1-52 (52.0/42.0) .......................... 7-376 (53.7/42.0)Punt Returns (No.-Yds.-TD) .......................... 0-0-0 ........................................... 3-31-0Kickoff Returns (No.-Yds.-TD) ....................... 2-32-0 ......................................... 1-10-0Interceptions (No.-Yds.-TD) .......................... 1-3-0 ........................................... 1-25-0Fumble Returns (No.-Yds.-TD) ...................... 0-0-0 ........................................... 1-15-1Time of Possession ..................................... 28:10 ........................................... 31:50Third-Down Conversions .............................. 2-of-11 ........................................ 8-of-12Fourth-Down Conversions ............................ 0-of-0 .......................................... 0-of-1Red-Zone Scores-Chances .......................... 0-0 .............................................. 3-5Sacks By (No.-Yds.) .................................... 0-0 .............................................. 1-3Field Goals................................................. 0-0 .............................................. 0-1Points Off Turnovers .................................... 0 .................................................. 7
INDIVIDUAL STATISTICSRUSHING: ASU — Simmons 10-47; Johnson 6-21; Waller 3-6; Turner 1-4; Harper 1-3; Marsh 1-0; Forman 6-(-4). GT — Mason 11-85; T. Marshall 9-77; Benson 10-75; T. Oliver 12-72; Searcy 1-56; Lynch 2-27; Cottrell 1-25; Macrina 2-8; Howard 3-7; Jarrett 1-5; Davis 1-3; Blancato 1-(-1).PASSING: ASU — Johnson 10-15-0, 51; Harper 5-8-1, 18.GT — T. Marshall 9-18-1, 104.RECEIVING: ASU — Simmons 3-9; Anderson 2-15; Hughes 2-13; Anthony 2-9; Forman 1-6; Turner 1-6; Pringle 1-6; Wood 1-6; Waller 1-2; Blair 1-(-3).GT — Stewart 4-49; Searcy 2-36; Camp 2-21; Benson 1-(-2).INTERCEPTIONS: ASU — Wilson. GT — Oliver.FUMBLE RECOVERIES: ASU — Kinsler; Hollis.GT — Curry; T. Jackson.FORCED FUMBLES: ASU — None. GT — Adams; C. Thomas.TACKLES FOR LOSS: ASU — Kinsler 1.5-5; Henderson 1.0-4; Ferrell 1.0-3; Herron 0.5-1. GT — Adams 1.0-10; Askew 1.0-5; Campbell 1.0-3; K. Oliver 1.0-3.SACKS: ASU — None. GT — Campbell 1.0-3.
ALCORN1-1, 0-0
2-0, 0-0
GEORGIA TECH 38
USF 49
Game 2 • Sept. 8, 2018 • Tampa, Fla. • Raymond James Stadium (34,182)
SCORING SUMMARY 1 2 3 4 FGeorgia Tech 17 0 14 7 38USF 14 7 7 21 49
1st 7:35 GT Brenton King 35 yd field goal, 9-40, 6:32 GT 3, USF 0 7:23 USF Terrence Horne 98 yd kickoff return (Coby Weiss kick) USF 7, GT 3 4:52 GT TaQuon Marshall 45 yd run (Brenton King kick), 5-75, 2:31 GT 10, USF 7 4:38 USF Terrence Horne 97 yd kickoff return (Coby Weiss kick) USF 14, GT 10 4:21 GT Clinton Lynch 81 yd pass from TaQuon Marshall (Brenton King kick), 1-81, 0:17 GT 17, USF 142nd 10:10 USF Darnel Salomon 18 yd pass from Blake Barnett (Coby Weiss kick), 11-69, 4:10 USF 21, GT 173rd 11:24 GT Tobias Oliver 5 yd run (Brenton King kick), 7-69, 3:36 GT 24, USF 21 USF Duran Bell 14 yd run (Coby Weiss kick), 7-74, 2:31 USF 28, GT 24 GT Tobias Oliver 1 yd run (Brenton King kick), 9-75, 4:31 GT 31, USF 284th 14:15 GT Tobias Oliver 1 yd run (Brenton King kick), 7-74, 3:12 GT 38, USF 28 12:11 USF Terrence Horne 3 yd pass from Blake Barnett (Coby Weiss kick), 8-76, 2:04 GT 38, USF 35 5:08 USF Blake Barnett 19 yd run (Coby Weiss kick), 10-88, 2:39 USF 42, GT 38 2:13 USF Blake Barnett 5 yd run (Coby Weiss kick), 5-18, 1:34 USF 49, GT 38
TEAM STATISTICS GT USFFirst Downs ................................................ 27 ................................................ 29Rushes-Yards ............................................. 57-419 ........................................ 44-224Passing Yards ............................................. 183 .............................................. 202Pass Comp-Att-Int ...................................... 9-18-2 ......................................... 21-31-1Total Offense .............................................. 602 .............................................. 426Fumbles-Lost ............................................. 1-1 .............................................. 0-0 Penalties-Yards ........................................... 8-80 ............................................ 5-36Punts-Yards (Avg./Net) ................................ 2-72 (36.0/36.0) .......................... 3-116 (38.7/28.3)Kickoffs-Yards (Avg./Net) ............................. 7-404 (57.7/16.1) ........................ 8-468 (58.8/35.5)Punt Returns (No.-Yds.-TD) .......................... 1-11-0 ......................................... 1-0-0Kickoff Returns (No.-Yds.-TD) ....................... 6-134-0 ....................................... 6-266-2Interceptions (No.-Yds.-TD) .......................... 1-0-0 ........................................... 2-24-0Fumble Returns (No.-Yds.-TD) ...................... 0-0-0 ........................................... 1-0-0Time of Possession ..................................... 35:32 ........................................... 24:28Third-Down Conversions .............................. 3-of-12 ........................................ 6-of-11Fourth-Down Conversions ............................ 2-of-3 .......................................... 1-of-2Red-Zone Scores-Chances .......................... 4-6 .............................................. 5-6Sacks By (No.-Yds.) .................................... 2-10 ............................................ 2-10Field Goals................................................. 1-1 .............................................. 0-0Points Off Turnovers .................................... 3 .................................................. 14
INDIVIDUAL STATISTICSRUSHING: GT — T. Marshall 13-113; T. Oliver 18-97; Mason 13-95; Searcy 3-52; Benson 5-41; Cottrell 4-20; Howard 1-1.USF — Barnett 16-91; Bell 12-69; Cronkite 9-39; Sands 4-11; Horne 2-8; McCants 1-6.PASSING: GT — T. Marshall 9-18-2, 183.USF — Barnett 21-31-1, 202.RECEIVING: GT — Lynch 3-111; Searcy 2-39; Carter 1-13; Camp 1-8; Stewart 1-6; Cottrell 1-6.USF — McCants 10-99; Salomon 3-37; St. Felix 3-23; Wilcox 2-28; Horne 2-11; Cronkite 1-4.INTERCEPTIONS: GT — CarpenterUSF — Sawtelle; Hoggins.FUMBLE RECOVERIES: GT — None.USF — Sawtelle.FORCED FUMBLES: GT — None. USF — Sanders.TACKLES FOR LOSS: GT — Cerge-Henderson 3.0-11; J. Johnson 1.0-4; Saint-Amour 1.0-2.USF — Black 1.5-4; Bronson 1.5-3; Kegler 1.0-7; Pinkney 0.5-1; Reaves 0.5-1; Hoggins 0.5-0.SACKS: GT — Cerge-Henderson 2.0-10. USF — Kegler 1.0-7; Black 1.0-3.

30
2018 GEORGIA TECH FOOTBALL GAME NOTESGAME 11 vs. VIRGINIA • NOV. 17 • ATLANTA, GA.
1-2, 0-1
2-1, 1-0
GEORGIA TECH 19
PITT 24
Game 3 • Sept. 15, 2018 • Pittsburgh, Pa. • Heinz Field (34,284)
SCORING SUMMARY 1 2 3 4 FGeorgia Tech 0 0 6 13 19Pitt 14 7 3 0 24
1st 8:38 Pitt Qadree Ollison 31 yd run (Alex Kessman kick), 5-63, 1:54 GT 0, Pitt 7 5:20 Pitt D. Hall 5 yd run (Alex Kessman kick), 3-26, 1:04 GT 0, Pitt 142nd 2:59 Pitt Qadree Ollison 8 yd run (Alex Kessman kick), 4-77, 2:08 GT 0, Pitt 213rd 8:43 GT TaQuon Marshall 1 yd run (Brenton King kick failed), 10-75, 6:17 GT 6, Pitt 21 2:36 Pitt Alex Kessman 33 yd field goal, 12-60, 6:07 GT 6, Pitt 244th 13:09 GT TaQuon Marshall 7 yd run (TaQuon Marshall pass failed), 8-56, 3:43 GT 12, Pitt 24 0:37 GT Clinton Lynch 3 yd run (Brenton King kick), 14-99, 3:31 GT 19, Pitt 24
TEAM STATISTICS GT PittFirst Downs ................................................ 22 ................................................ 16Rushes-Yards ............................................. 56-320 ........................................ 31-138Passing Yards ............................................. 66 ................................................ 197Pass Comp-Att-Int ...................................... 6-15-1 ......................................... 16-23-1Total Offense .............................................. 386 .............................................. 335Fumbles-Lost ............................................. 3-1 .............................................. 1-0 Penalties-Yards ........................................... 5-35 ............................................ 4-38Punts-Yards (Avg./Net) ................................ 4-165 (41.2/36.2) ........................ 6-234 (39.0/35.3)Kickoffs-Yards (Avg./Net) ............................. 3-195 (65.0/40.0) ........................ 5-325 (65.0/40.0)Punt Returns (No.-Yds.-TD) .......................... 2-22-0 ......................................... 0-0-0Kickoff Returns (No.-Yds.-TD) ....................... 0-0-0 ........................................... 0-0-0Interceptions (No.-Yds.-TD) .......................... 1-42-0 ......................................... 1-20-0Fumble Returns (No.-Yds.-TD) ...................... 0-0-0 ........................................... 0-0-0Time of Possession ..................................... 31:49 ........................................... 28:11Third-Down Conversions .............................. 4-of13 .......................................... 5-of-12Fourth-Down Conversions ............................ 1-of-3 .......................................... 0-of-0Red-Zone Scores-Chances .......................... 3-3 .............................................. 3-3Sacks By (No.-Yds.) .................................... 0-0 .............................................. 1-8Field Goals................................................. 0-1 .............................................. 1-1Points Off Turnovers .................................... 6 .................................................. 0
INDIVIDUAL STATISTICSRUSHING: GT — T. Marshall 28-103; J. Mason 10-94; Howard 8-82; Q. Searcy 5-39; O. Jarrett 1-3; C. Lynch 3-2; A. Owens 1-(-2).Pitt — Q. Ollison 17-91; D. Hall 7-29; Jacques-Louis 1-9; K. Pickett 2-8; M. Ffrench 2-1; R. Araujo-Lopes 2-1.PASSING: GT — T. Marshall 6-15-1, 66Pitt — K. Pickett 16-23-1, 197.RECEIVING: GT — B. Stewart 3-33; J. Camp 1-20; M. Carter 1-11; J. Mason 1-2.Pitt — R. Araujo-Lopes 6-45; T. Mack 4-95; M. Ffrench 3-25; G. Aston 1-14; A. Mathews 1-12; D. Hall 1-6.INTERCEPTIONS: GT — RiveraPitt — Motley.FUMBLE RECOVERIES: GT — None.Pitt — Weaver.FORCED FUMBLES: GT — Oliver. Pitt — Zeise; Idowu.TACKLES FOR LOSS: GT — Carpenter 1.0-1; Saint-Amour 1.0-2; Oliver 1.0-1.Pitt — Hamlin 2.0-6; Weaver 1.0-2; Wirginis 1.0-8; Medure 1.0-2.SACKS: GT — None. Pitt — Wirginis 1.0-8
4-0, 1-0
1-3, 0-2
#3/2 CLEMSON 49
GEORGIA TECH 21
Game 4 • Sept. 22, 2018 • Atlanta, Ga. • Bobby Dodd Stadium (50,595)
SCORING SUMMARY 1 2 3 4 FClemson 7 21 14 7 49Georgia Tech 0 7 7 7 21
1st 3:42 CU Clelin Ferrell 0 yd fumble recovery, (Greg Huegel kick) CU 7, GT 02nd 9:11 CU Hunter Renfrow 17 yd pass from Trevor Lawrence (Greg Huegel kick), 7-74, 2:44 CU 14, GT 0 7:05 CU Justyn Ross 53 yd pass from Trevor Larence (Greg Huegel kick), 2-55, 0:37 CU 21, GT 0 2:08 GT TaQuon Marshall 11 yd run (Shawn Davis kick), 4-23, 1:46 CU 21, GT 7 0:05 CU Travis Etienne 3 yd run (Greg Huegel kick), 12-64, 1:53 CU 28, GT 73rd 12:20 CU Tavien Feaster 27 yd run (Greg Huegel kick), 7-75, 2:40 CU 35, GT 7 5:10 CU Travis Etienne 3 yd run (Greg Huegel kick), 10-83, 4:27 CU 42, GT 7 1:43 GT Nathan Cottrell 2 yd run (Shawn Davis kick), 8-75, 3:27 CU 42, GT 144th 6:15 GT Clinton Lynch 5 yd pass from Tobias Oliver (Shawn Davis kick), 8-75, 3:27 CU 42, GT 21 4:01 CU Tee Higgins 30 yd pass from Trevor Lawrence (Greg Huegel kick), 5-77, 2:13 CU 49, GT 21
TEAM STATISTICS CU GTFirst Downs ................................................ 25 ................................................ 15Rushes-Yards ............................................. 36-248 ........................................ 56-146Passing Yards ............................................. 232 .............................................. 57Pass Comp-Att-Int ...................................... 19-30-2 ....................................... 3-8-0Total Offense .............................................. 480 .............................................. 203Fumbles-Lost ............................................. 1-0 .............................................. 8-1 Penalties-Yards ........................................... 6-68 ............................................ 4-30Punts-Yards (Avg./Net) ................................ 3-122 (40.7/40.3) ........................ 6-291 (48.5/39.8)Kickoffs-Yards (Avg./Net) ............................. 8-495 (61.9/41.6) ........................ 4-229 (57.2/36.5)Punt Returns (No.-Yds.-TD) .......................... 2-32-0 ......................................... 1-1-0Kickoff Returns (No.-Yds.-TD) ....................... 2-58-0 ......................................... 1-12-0Interceptions (No.-Yds.-TD) .......................... 0-0-0 ........................................... 2-44-0Fumble Returns (No.-Yds.-TD) ...................... 1-4-0 ........................................... 0-0-0Time of Possession ..................................... 23:55 ........................................... 36:05Third-Down Conversions .............................. 5-of-9 .......................................... 4-of-15Fourth-Down Conversions ............................ 0-of-0 .......................................... 2-of-3Red-Zone Scores-Chances .......................... 3-3 .............................................. 3-4Sacks By (No.-Yds.) .................................... 4-26 ............................................ 1-6Field Goals................................................. 0-0 .............................................. 0-1Points Off Turnovers .................................... 7 .................................................. 14
INDIVIDUAL STATISTICSRUSHING: GT — T. Marshall 25-47, 1 TD; T. Oliver 9-50; J. Mason 4-30; J. Howard 10-18; C. Lynch 2-10; Q. Searcy 2-7; N. Cottrell 2-1, 1 TD.CU — T. Etienne 11-122, 1 TD; T. Feaster 8-75, 1 TD; L. Dixon 6-20; A. Choice 5-15; T. Lawrence 1-11; K. Bryant 4-5.PASSING: GT — T. Marshall 1-6-0 29; T. Oliver 2-2-0, 1 TD.CU — T. Lawrence 13-18-1 176, 4 TD; K. Bryant 6-10-0 56; C. Bruce 0-2-1 0.RECEIVING: GT — Lynch 3-57, 1 TD.CU — A. Rodgers 6-60; H. Rendrow 3-28, 1 TD; C. Powell 3-17; T. Chase 2-34; J. Ross 1-53, 1 TD; T. Higgins 1-30, 1 TD; D. Kendrick 1-6; T. Etienne 1-3, 1 TD; M. Richard 1-1.INTERCEPTIONS: GT — Branch, Rivera.CU — None.FUMBLE RECOVERIES: GT — None.CU — Wilkins.FORCED FUMBLES: GT — None. CU — Terrell; Wilkins; Simmons.TACKLES FOR LOSS: GT — Branch 0.5-3; Curry 0.5-3.CU — Davis 1.0-10; Pinckney 1.0-4; Terrell 1.0-5; Wilkins 2.0-13; Bryant 1.0-2; Simmons 1.0-6; Skalski 1.0-1; Mullen 1.0-4; Turner 1.0-1.SACKS: GT — Branch 0.5-3; Curry 0.5-3. CU — Davis 1.0-10; Wilkins 1.0-10; Bryant 1.0-2; Mullen 1.0-4.

2018 GEORGIA TECH FOOTBALL GAME NOTESGAME 11 vs. VIRGINIA • NOV. 17 • ATLANTA, GA.
31
1-4, 0-1
2-3, 0-2
BOWLING GREEN 17
GEORGIA TECH 63
Game 5 • Sept. 29, 2018 • Atlanta, Ga. • Bobby Dodd Stadium (40,740)
SCORING SUMMARY 1 2 3 4 FBowling Green 3 7 7 0 17Georgia Tech 14 14 21 14 63
1st 12:08 GT Jordan Mason 28 yd run (Shawn Davis kick), 4-68, 1:20 GT 7, ASU 01st 09:09 BG Nate Needham 29 yd field goal 13-63, 5:51 BG 3, GT 0 05:48 GT Jordan Mason 9 yd run (Wesley Wells kick), 7-69, 3:12 BG 3, GT 7 00:00 GT TaQuon Marshall 1 yd run (Wesley Wells kick), 9-76, 4:07 BG 3, GT 14 2nd 11:52 BG Deric Phouthavong 30 yd pass from Jarret Doege (NEEDHAM, Nate kick), 10-75, 3:08 BG 10, GT 14 07:50 GT Nathan Cottrell 4 yd run (Wesley Wells kick), 8-72, 3:55 BG 10, GT 21 00:32 GT TaQuon Marshall 2 yd run (Wesley Wells kick), 12-86, 5:11 BG 10, GT 28 3rd 11:17 GT Jordan Mason 33 yd run (Wesley Wells kick), 6-93, 3:27 BG 10, GT 35 07:44 GT Jerry Howard 5 yd run (Wesley Wells kick), 3-16, 1:17 BG 10, GT 42 03:55 BG Jarret Doege 1 yd run (NEEDHAM, Nate kick), 11-78, 3:42 BG 17, GT 42 02:33 GT Tobias Oliver 34 yd run (Wesley Wells kick), 3-51, 1:13 BG 17, GT 49 4th 08:44 GT Anree Saint-Amour 3 yd INT return (Wesley Wells kick) BG 17, GT 56 03:38 GT Tobias Oliver 62 yd run (Wesley Wells kick), 1-62, 0:13 BG 17, GT 63
TEAM STATISTICS ASU GTFirst Downs ................................................ 25 ................................................ 23Rushes-Yards ............................................. 38-63 .......................................... 49-372Passing Yards ............................................. 330 .............................................. 160Pass Att-Comp-Int ...................................... 49-29-2 ....................................... 7-5-0Total Offense .............................................. 393 .............................................. 532Fumble Returns-Yards ................................. 0-0 .............................................. 1-21Punt Returns-Yards ..................................... 0-0 .............................................. 1-3Kickoff Returns-Yards .................................. 5-103 .......................................... 4-76Interception Returns-Yards ........................... 0-0 .............................................. 2-3Punts (Number-Avg) .................................... 3-31.0 ......................................... 1-53.0Fumbles-Lost ............................................. 3-1 .............................................. 1-0Penalties-Yards ........................................... 5-26 ............................................ 3-54Possession Time ......................................... 33:20 ........................................... 26:40Third-Down Conversions .............................. 11 of 19 ....................................... 4 of 7Fourth-Down Conversions ............................ 2 of 3 ........................................... 1 of 1Red-Zone Scores-Chances .......................... 2-3 .............................................. 5-5Sacks By: Number-Yards ............................. 0-0 .............................................. 2-23Field Goals................................................. 0-0 .............................................. 0-1Points Off Turnovers .................................... 0 .................................................. 7
INDIVIDUAL STATISTICSRUSHING: BG — Hargrove, 6-23; Denley, 11-23; Frye, 3-18; Lamar 3-8; Morris, 1-7; Loy, 1-7; Clair, 4-7; Doege, 9-(-30). GT — Oliver 7-115; Mason 7-61; Cottrell 5-46; Qearcy 4-44; T. Marshall 13-42; Howard 6-29; Lynch 3-18; Jarrett 1-10; Macrina 2-6; Gantt 1-1. PASSING: BG — Doege, 27-44-2, 305; Loy, 2-4-0, 25; Team, 0-1-0, 0. GT — T. Marshall 5-6-0, 160; Oliver, 0-1-0, 0.RECEIVING: BG — Miller, 10-117; Wayne-Prather 7-70; Marlow, 4-49; Morris 3-24; Phouthavong, 2-36; Hargrove, 1-27; Sawmiller, 1-4; Denley, 1-3. GT — Camp 2-70; Lynch 1-41; Dolphus 1-39; Searcy 1-10. INTERCEPTIONS: BG — None. GT — Saint-Amour 1-3; Curry 1-0. FUMBLE RECOVERIES: BG — None.GT — Ownes, 1-21FORCED FUMBLES: BG — None. GT — Alexander.TACKLES FOR LOSS: BG — McBride 0.5-1; Harper 0.5-1. GT — Saint-Amour 2.5-11; Alexander 1.0-14; Cerge-Henderson 1.0-1; B. Mitchell 1.0-1; Thomas 0.5-1SACKS: BG — None. GT — Alexander 1.0-14; Saint-Amour 1.0-9.
LOUISVILLE 31
GEORGIA TECH 663-3, 1-2
2-4, 0-3
Game 6 • Oct. 5, 2018 • Louisville, Ky. • Cardinal Stadium (51,658)
SCORING SUMMARY 1 2 3 4 FGeorgia Tech 21 10 14 21 66Louisville 0 17 0 14 31
1st 10:08 GT TaQuon Marshall 33 yd run (Wesley Wells kick), 5-50, 2:08 GT 7 - UL 0 7:15 GT TaQuon Marshall 1 yd run (Wesley Wells kick), 5-36, 2:24 GT 14 - UL 0 0:03 GT Jordan Mason 2 yd run (Wesley Wells kick), 9-76, 5:06 GT 21 - UL 02nd 11:22 LOU Atwell, TuT. 29 yd pass from Pass, Jaw. (Creque, Bla. kick), 8-71, 3:41 GT 21 - UL 7 6:46 GT Wesley Wells 41 yd field goal, 8-52, 4:36 GT 24 - UL 7 2:49 LOU Smith, Trey 5 yd run (Creque, Bla. kick), 12-75, 3:57 GT 24 - UL 14 0:32 GT Qua Searcy 2 yd run (Wesley Wells kick), 9-62, 2:17 GT 31 - UL 14 0:00 LOU Creque, Bla. 46 yd field goal, 5-59, 0:32 GT 31 - UL 173rd 8:02 GT Qua Searcy 1 yd run (Wesley Wells kick), 13-79, 6:58 GT 38 - UL 17 4:19 GT Tobias Oliver 1 yd run (Wesley Wells kick), 5-34, 2:34 GT 45 - UL 174th 13:13 GT Tobias Oliver 5 yd run (Wesley Wells kick), 5-87, 2:22 GT 52 - UL 17 11:13 LOU Fitzpatrick, De 42 yd pass from Pass, Jaw. GT 52 - UL 24 (Creque, Bla. kick), 8-74 2:00 6:35 GT Jerry Howard 2 yd run (Wesley Wells kick), 8-75, 4:38 GT 59 - UL 24 2:18 GT Juanyeh Thomas 95 yd interception return (Wesley Wells kick) GT 66 - UL 24 0:28 LOU Atwell, TuT. 29 yd pass from Travis, Jor. (Creque, Bla. kick), 6-63, 1:50 GT 66 - UL 31
TEAM STATISTICS GT ULFirst Downs ................................................ 28 ................................................ 23Rushes-Yards ............................................. 65-542 ........................................ 23-113Passing Yards ............................................. 12 ................................................ 370Pass Comp-Att-Int ...................................... 1-2-0 ........................................... 27-44-1Total Offense .............................................. 554 .............................................. 483 Fumbles-Lost ............................................. 1-0 .............................................. 2-2Penalties-Yards ........................................... 4-50 ............................................ 4-35Punts-Yards (Avg./Net) ................................ 0-0 (0/0) ...................................... 2-83 (41.5/41.5)Kickoff-Yards (Avg./Net) ............................... 11-717 (65.2/41.0) ...................... 5-295 (59.0/41.2)Punt Returns (No.-Yds.-TD) .......................... 0-0-0 ........................................... 0-0-0Kickoff Returns (No.-Yds.-TD) ....................... 2-39-0 ......................................... 8-191-0Interception (No.-Yds.-TD............................. 1-95-1 ......................................... 0-0-0Fumbles Returns (No.-Yds.-TD) .................... 2-7-0 ........................................... 0-0-0Penalties-Yards ........................................... 4-50 ............................................ 4-35Possession Time ......................................... 33:31 ........................................... 26:29Third-Down Conversions .............................. 6 of 7 ........................................... 7 of 12Fourth-Down Conversions ............................ 0 of 0 ........................................... 2 of 3Red-Zone Scores-Chances .......................... 8-8 .............................................. 1-2Sacks By (No.-Yds.) .................................... 2-12 ............................................ 0-0Field Goals................................................. 1-1 .............................................. 1-1
INDIVIDUAL STATISTICSRUSHING: GT — T. Marshall 23-175; T. Oliver 8-103; J. Mason 13-78; J. Howard 8-58; C. Lynch 5-41; O. Jarrett 1-29; Q. Searcy 3-28; N. Cottrell 3-27; J. Macrina 1-3. Louisville — J. Travis 5-48; T. Smith 5-32; H. Hall 5-23; M. Cunningham 1-11; J. Smith 2-5; C. Wilson 1-2; J. Hawkins 1-1; J. Pass 3-(-9).PASSING: GT — T. Marshall 1-2-0, 12.UL — J. Pass 23-35-0, 299; J. Travis 4-9-1, 75.RECEIVING: GT — B. Stewart 1-12. UL — T. Atwell 4-79; D. Fitzpatrick 4-58; H. Hall 4-33; J. Smith 3-42; D. Peete 2-45; T. Harrell 2-36; M. Crum 2-28; S. Dawkins 2-21; T. Smith 2-7; K. Averett 1-15; E. Spence 1-6. INTERCEPTIONS: GT — J. ThomasUL — None.FUMBLE RECOVERIES: GT — C. Thomas.UL — None.FORCED FUMBLES: GT — Saint-Amour. UL — None.TACKLES FOR LOSS: GT — Saint-Amour 1.0-10; Adams 1.0-6; Campbell 1.0-2.UL — Black 1.5-4; Bronson 1.5-3; Kegler 1.0-7; Pinkney 0.5-1; Reaves 0.5-1; Hoggins 0.5-0.SACKS: GT — Campbell 1.0-2; Saint-Amour 1.0-10.UL — None.

32
2018 GEORGIA TECH FOOTBALL GAME NOTESGAME 11 vs. VIRGINIA • NOV. 17 • ATLANTA, GA.
5-1, 1-1
3-4, 1-3
DUKE 28
GEORGIA TECH 14
Game 7 • Oct. 13, 2018 • Atlanta, Ga. • Bobby Dodd Stadium (41,709)
SCORING SUMMARY 1 2 3 4 FDuke 7 0 21 0 28Georgia Tech 0 7 0 7 14
1st 13:31 Duke Deon Jackson 12 yd run (Collin Wareham kick), 4-52, 1:17 Duke 7, GT 02nd 0:54 GT Malachi Carter 32 yd pass (Wesley Wells kick), 2-31, 0:48 Duke 7, GT 73rd 1:49 Duke T.J. Rahming 48 yd pass from Daniel Jones (Collin Wareham), 4-57, 0:52 Duke 14, GT 7 0:15 Duke Davis Koppenhaver 1 yd pass from Daniel Jones (Collin Wareham), 1-6, 0:05 Duke 21, GT 74th 7:51 GT Jerry Howard 2 yd run (Wesley Wells kick), 15-75, 7:09 Duke 21, GT 14
TEAM STATISTICS Duke GTFirst Downs ................................................ 19 ................................................ 20Rushes-Yards ............................................. 33-98 .......................................... 61-229Passing Yards ............................................. 206 .............................................. 125Pass Comp-Att-Int ...................................... 17-27-1 ....................................... 7-17-0Total Offense .............................................. 304 .............................................. 354Fumbles-Lost ............................................. 4-2 .............................................. 6-3Penalties-Yards ........................................... 3-15 ............................................ 3-18Punts-Yards (Avg./Net) ................................ 3-150 (50.0/46.7) ........................ 4-185 (46.2/45.5)Kickoffs-Yards (Avg./Net) ............................. 5-284 (56.8/49.2) ........................ 3-129 (43.0/18.3)Punt Returns (No.-Yds.-TD) .......................... 1-3-0 ........................................... 2-10-0Kickoff Returns (No.-Yds.-TD) ....................... 2-74-0 ......................................... 3-38-0Interceptions (No.-Yds.-TD) .......................... 0-0-0 ........................................... 1-0-0Fumble Returns (No.-Yds.-TD) ...................... 0-0-0 ........................................... 2-6-0Time of Possession ..................................... 23:40 ........................................... 36:20Third-Down Conversions .............................. 5-of-10 ........................................ 8-of-17Fourth-Down Conversions ............................ 0-of-2 .......................................... 1-of-4Red-Zone Scores-Chances .......................... 3-5 .............................................. 1-3Sacks By (No.-Yds.) .................................... 3-22 ............................................ 4-24Field Goals................................................. 0-0 .............................................. 0-0Points Off Turnovers .................................... 21 ................................................ 7
INDIVIDUAL STATISTICSRUSHING: Duke — D. Jackson 21-98; D. Jones 9-4; TEAM 3-(-4).GT — J. Howard 12-62; T. Marshall 16-41; J. Mason 12-39; C. Lynch 5-32; T. Oliver 10-24; Q. Searcy 3-15; N. Cottrell 2-12; J. Graham 1-4. PASSING: Duke — D. Jones 17-27-1 206.GT — T. Marshall 5-11-0 91; T. Oliver 2-6-0 34. RECEIVING: Duke — T.J. Rahming 4-91; A. Young 3-25; C. Taylor 2-30; D. Helm 2-29; J. Lloyd 2-10; D. Jackson 2-8; J. Bobo 1-12; D. Koppenhaver 1-1. GT — B. Stewart 2-46; N. Cottrell 2-6; M. Carter 1-32; Q. Searcy 1-25; J. Howard 1-16. INTERCEPTIONS: Duke — None.GT — Simmons.FUMBLE RECOVERIES: Duke — Rumph; Mugala; Hill.GT — Jordan-Swilling; Cerge-Henderson; Simmons.FORCED FUMBLES: Duke — Tangelo; Cerenord; Nyembwe; Durant. GT — Saint-Amour; Swilling.TACKLES FOR LOSS: Duke — Humphreys 2.0-4; Rumph II 4.0-14; Jordan 1.0-2; Tangelo 0.5-0; Lucas 1.0-1; Dimukeje 0.5-1; Johnson 2.0-13.GT — Mitchell 1.0-5; Saint-Amour 2.0-12; Swilling 1.0-7; Branch 1.0-2; Adams 1.0-2.SACKS: Duke — Rumph 1.0-9; Johnson 2.0-13. GT — Mitchell 1.0-5; Sait Amour 2.0-12; Swilling 1.0-7.
4-4, 2-3
4-3, 3-1
GEORGIA TECH 49
VIRGINIA TECH 28
Game 5 • Oct. 25, 2018 • Blackburg, Va. • Lane Stadium (65,632)
SCORING SUMMARY 1 2 3 4 FGeorgia Tech 14 14 14 7 49Virginia Tech 14 7 0 7 28
1st 13:26 VT Turner, T 46 yd pass from Willis, R (Johnson, B kick), 5-73 1:34 GT 0, VT 7 6:56 GT Jerry Howard 8 yd run (Wesley Wells kick), 12-75 6:30 GT 7, VT 7 5:52 VT Hazelton, D 41 yd pass from Willis, R (Johnson, B kick), 3-70 0:58 GT 7, VT 14 0:15 GT Tobias Oliver 1 yd run (Wesley Wells kick), 11-75 5:37 GT 14, VT 142nd 10:30 VT Willis, R 1 yd run (Johnson, B kick), 11-73 4:40 GT 14, VT 21 6:57 GT Jordan Mason 5 yd run (Wesley Wells kick), 2-12 0:18 GT 21, VT 21 1:27 GT Tobias Oliver 5 yd run (Wesley Wells kick), 9-72 4:08 GT 28, VT 213rd 9:14 GT Tobias Oliver 11 yd run (Wesley Wells kick), 10-75 5:46 GT 35, VT 21 3:02 GT Jordan Mason 14 yd run (Wesley Wells kick), 8-64 4:42 GT 42, VT 214th 6:23 GT Jordan Mason 1 yd run (Wesley Wells kick), 6-28 3:40 GT 49, VT 21 3:48 VT Holston, J 1 yd run (Johnson, B kick), 10-65 2:35 GT 49, VT 28
TEAM STATISTICS GT VTFirst Downs ................................................ 35 ................................................ 16Rushes-Yards ............................................. 78-465 ........................................ 25-122Passing Yards ............................................. 0 .................................................. 201Pass Comp-Att-Int ...................................... 0-1-0 ........................................... 15-22-0Total Offense .............................................. 465 .............................................. 323Fumbles-Lost ............................................. 1-0 .............................................. 2-1 Penalties-Yards ........................................... 6-50 ............................................ 8-87Punts-Yards (Avg./Net) ................................ 2-85 (42.5/41.0) .......................... 4-166 (41.5/41.5)Kickoffs-Yards (Avg./Net) ............................. 8-500 (62.5/42.2) ........................ 5-325 (65.0/40.0)Punt Returns (No.-Yds.-TD) .......................... 0-0-0 ........................................... 2-3-0Kickoff Returns (No.-Yds.-TD) ....................... 0-0-0 ........................................... 6-137-0Interceptions (No.-Yds.-TD) .......................... 0-0-0 ........................................... 0-0-0Fumble Returns (No.-Yds.-TD) ...................... 0-0-0 ........................................... 0-0-0Time of Possession ..................................... 42:18 ........................................... 17:42Third-Down Conversions .............................. 5-of-9 .......................................... 2-of-8Fourth-Down Conversions ............................ 1-of-1 .......................................... 1-of-2Red-Zone Scores-Chances .......................... 7-7 .............................................. 2-2Sacks By (No.-Yds.) .................................... 1-9 .............................................. 1-5Field Goals................................................. 0-0 .............................................. 0-0Points Off Turnovers .................................... 7 .................................................. 0
INDIVIDUAL STATISTICSRUSHING: GT — T. Oliver 40-215; J. Mason 12-82; J. Howard 12-76; C. Malloy 4-27; J. Graham 2-25; N. Cottrell 3-21; Q. Searcy 2-15; C. Lynch 2-3; X. Gantt 1-1. VT — S. Peoples 6-51; J. Holston 5-29; R. Willis 8-22; H. Grimsley 2-13; D. Hazelton 1-4; D. McClease 3-3. PASSING: GT — T. Oliver 0-1-0 0.VT — R. Willis 15-22-0 201.RECEIVING: GT — None.VT — D. Hazelton 6-81; D. Keene 3-27; T. Turner 2-62; S. Peoples 1-13; H. Grimsley 1-11; E. Kumah 1-5; S. Savoy 1-2. INTERCEPTIONS: GT — None.VT — None.FUMBLE RECOVERIES: GT — J. Johnson.VT — Wilkins.FORCED FUMBLES: GT — None. VT — None.TACKLES FOR LOSS: GT — Thomas 1.0-9; Saint-Amour 2.0-5; Simmons 1.0-2.VT — Ashby 1.0-5; Deablo 0.5-0; Belmar 0.5-1.SACKS: GT — Thomas 1.0-9.VT — Ashby 1.0-5.
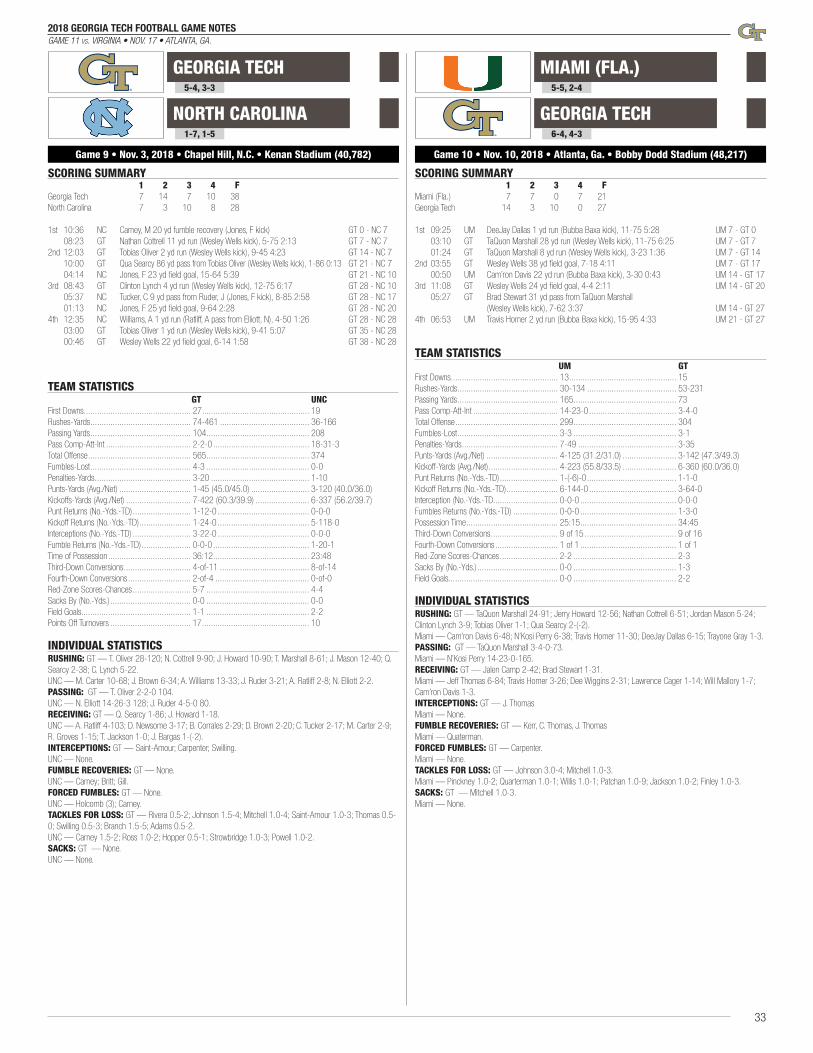
2018 GEORGIA TECH FOOTBALL GAME NOTESGAME 11 vs. VIRGINIA • NOV. 17 • ATLANTA, GA.
33
5-4, 3-3
1-7, 1-5
GEORGIA TECH 38
NORTH CAROLINA 28
Game 9 • Nov. 3, 2018 • Chapel Hill, N.C. • Kenan Stadium (40,782)
SCORING SUMMARY 1 2 3 4 FGeorgia Tech 7 14 7 10 38North Carolina 7 3 10 8 28
1st 10:36 NC Carney, M 20 yd fumble recovery (Jones, F kick) GT 0 - NC 7 08:23 GT Nathan Cottrell 11 yd run (Wesley Wells kick), 5-75 2:13 GT 7 - NC 72nd 12:03 GT Tobias Oliver 2 yd run (Wesley Wells kick), 9-45 4:23 GT 14 - NC 7 10:00 GT Qua Searcy 86 yd pass from Tobias Oliver (Wesley Wells kick), 1-86 0:13 GT 21 - NC 7 04:14 NC Jones, F 23 yd field goal, 15-64 5:39 GT 21 - NC 103rd 08:43 GT Clinton Lynch 4 yd run (Wesley Wells kick), 12-75 6:17 GT 28 - NC 10 05:37 NC Tucker, C 9 yd pass from Ruder, J (Jones, F kick), 8-85 2:58 GT 28 - NC 17 01:13 NC Jones, F 25 yd field goal, 9-64 2:28 GT 28 - NC 204th 12:35 NC Williams, A 1 yd run (Ratliff, A pass from Elliott, N), 4-50 1:26 GT 28 - NC 28 03:00 GT Tobias Oliver 1 yd run (Wesley Wells kick), 9-41 5:07 GT 35 - NC 28 00:46 GT Wesley Wells 22 yd field goal, 6-14 1:58 GT 38 - NC 28
TEAM STATISTICS GT UNCFirst Downs ................................................ 27 ................................................ 19Rushes-Yards ............................................. 74-461 ........................................ 36-166Passing Yards ............................................. 104 .............................................. 208Pass Comp-Att-Int ...................................... 2-2-0 ........................................... 18-31-3Total Offense .............................................. 565 .............................................. 374Fumbles-Lost ............................................. 4-3 .............................................. 0-0 Penalties-Yards ........................................... 3-20 ............................................ 1-10Punts-Yards (Avg./Net) ................................ 1-45 (45.0/45.0) .......................... 3-120 (40.0/36.0)Kickoffs-Yards (Avg./Net) ............................. 7-422 (60.3/39.9) ........................ 6-337 (56.2/39.7)Punt Returns (No.-Yds.-TD) .......................... 1-12-0 ......................................... 0-0-0Kickoff Returns (No.-Yds.-TD) ....................... 1-24-0 ......................................... 5-118-0Interceptions (No.-Yds.-TD) .......................... 3-22-0 ......................................... 0-0-0Fumble Returns (No.-Yds.-TD) ...................... 0-0-0 ........................................... 1-20-1Time of Possession ..................................... 36:12 ........................................... 23:48Third-Down Conversions .............................. 4-of-11 ........................................ 8-of-14Fourth-Down Conversions ............................ 2-of-4 .......................................... 0-of-0Red-Zone Scores-Chances .......................... 5-7 .............................................. 4-4Sacks By (No.-Yds.) .................................... 0-0 .............................................. 0-0Field Goals................................................. 1-1 .............................................. 2-2Points Off Turnovers .................................... 17 ................................................ 10
INDIVIDUAL STATISTICSRUSHING: GT — T. Oliver 28-120; N. Cottrell 9-90; J. Howard 10-90; T. Marshall 8-61; J. Mason 12-40; Q. Searcy 2-38; C. Lynch 5-22. UNC — M. Carter 10-68; J. Brown 6-34; A. Williams 13-33; J. Ruder 3-21; A. Ratliff 2-8; N. Elliott 2-2. PASSING: GT — T. Oliver 2-2-0 104.UNC — N. Elliott 14-26-3 128; J. Ruder 4-5-0 80.RECEIVING: GT — Q. Searcy 1-86; J. Howard 1-18.UNC — A. Ratliff 4-103; D. Newsome 3-17; B. Corrales 2-29; D. Brown 2-20; C. Tucker 2-17; M. Carter 2-9; R. Groves 1-15; T. Jackson 1-0; J. Bargas 1-(-2). INTERCEPTIONS: GT — Saint-Amour; Carpenter; Swilling.UNC — None.FUMBLE RECOVERIES: GT — None.UNC — Carney; Britt; Gill.FORCED FUMBLES: GT — None. UNC — Holcomb (3); Carney.TACKLES FOR LOSS: GT — Rivera 0.5-2; Johnson 1.5-4; Mitchell 1.0-4; Saint-Amour 1.0-3; Thomas 0.5-0; Swilling 0.5-3; Branch 1.5-5; Adams 0.5-2.UNC — Carney 1.5-2; Ross 1.0-2; Hopper 0.5-1; Strowbridge 1.0-3; Powell 1.0-2.SACKS: GT — None.UNC — None.
GEORGIA TECH 27
MIAMI (FLA.) 215-5, 2-4
6-4, 4-3
Game 10 • Nov. 10, 2018 • Atlanta, Ga. • Bobby Dodd Stadium (48,217)
SCORING SUMMARY 1 2 3 4 FMiami (Fla.) 7 7 0 7 21Georgia Tech 14 3 10 0 27
1st 09:25 UM DeeJay Dallas 1 yd run (Bubba Baxa kick), 11-75 5:28 UM 7 - GT 0 03:10 GT TaQuon Marshall 28 yd run (Wesley Wells kick), 11-75 6:25 UM 7 - GT 7 01:24 GT TaQuon Marshall 8 yd run (Wesley Wells kick), 3-23 1:36 UM 7 - GT 142nd 03:55 GT Wesley Wells 38 yd field goal, 7-18 4:11 UM 7 - GT 17 00:50 UM Cam’ron Davis 22 yd run (Bubba Baxa kick), 3-30 0:43 UM 14 - GT 173rd 11:08 GT Wesley Wells 24 yd field goal, 4-4 2:11 UM 14 - GT 20 05:27 GT Brad Stewart 31 yd pass from TaQuon Marshall (Wesley Wells kick), 7-62 3:37 UM 14 - GT 274th 06:53 UM Travis Homer 2 yd run (Bubba Baxa kick), 15-95 4:33 UM 21 - GT 27
TEAM STATISTICS UM GTFirst Downs ................................................ 13 ................................................ 15Rushes-Yards ............................................. 30-134 ........................................ 53-231Passing Yards ............................................. 165 .............................................. 73Pass Comp-Att-Int ...................................... 14-23-0 ....................................... 3-4-0Total Offense .............................................. 299 .............................................. 304 Fumbles-Lost ............................................. 3-3 .............................................. 3-1Penalties-Yards ........................................... 7-49 ............................................ 3-35Punts-Yards (Avg./Net) ................................ 4-125 (31.2/31.0) ........................ 3-142 (47.3/49.3)Kickoff-Yards (Avg./Net) ............................... 4-223 (55.8/33.5) ........................ 6-360 (60.0/36.0)Punt Returns (No.-Yds.-TD) .......................... 1-(-6)-0 ........................................ 1-1-0Kickoff Returns (No.-Yds.-TD) ....................... 6-144-0 ....................................... 3-64-0Interception (No.-Yds.-TD............................. 0-0-0 ........................................... 0-0-0Fumbles Returns (No.-Yds.-TD) .................... 0-0-0 ........................................... 1-3-0Possession Time ......................................... 25:15 ........................................... 34:45Third-Down Conversions .............................. 9 of 15 ......................................... 9 of 16Fourth-Down Conversions ............................ 1 of 1 ........................................... 1 of 1Red-Zone Scores-Chances .......................... 2-2 .............................................. 2-3Sacks By (No.-Yds.) .................................... 0-0 .............................................. 1-3Field Goals................................................. 0-0 .............................................. 2-2
INDIVIDUAL STATISTICSRUSHING: GT — TaQuon Marshall 24-91; Jerry Howard 12-56; Nathan Cottrell 6-51; Jordan Mason 5-24; Clinton Lynch 3-9; Tobias Oliver 1-1; Qua Searcy 2-(-2). Miami — Cam’ron Davis 6-48; N’Kosi Perry 6-38; Travis Homer 11-30; DeeJay Dallas 6-15; Trayone Gray 1-3. PASSING: GT — TaQuon Marshall 3-4-0-73. Miami — N’Kosi Perry 14-23-0-165.RECEIVING: GT — Jalen Camp 2-42; Brad Stewart 1-31. Miami — Jeff Thomas 6-84; Travis Homer 3-26; Dee Wiggins 2-31; Lawrence Cager 1-14; Will Mallory 1-7; Cam’ron Davis 1-3.INTERCEPTIONS: GT — J. ThomasMiami — None.FUMBLE RECOVERIES: GT — Kerr, C. Thomas, J. ThomasMiami — Quaterman.FORCED FUMBLES: GT — Carpenter. Miami — None.TACKLES FOR LOSS: GT — Johnson 3.0-4; Mitchell 1.0-3.Miami — Pinckney 1.0-2; Quarterman 1.0-1; Willis 1.0-1; Patchan 1.0-9; Jackson 1.0-2; Finley 1.0-3.SACKS: GT — Mitchell 1.0-3.Miami — None.

2018 Georgia Tech Football
Georgia Tech Game Results (as of Nov 06, 2018)
All games
Date Opponent Score Overall Conference Time Attend
Sep 01, 2018 ALCORN ST. W 41-0 1-0 0-0 2:54 39719
Sep 08, 2018 at USF L 38-49 1-1 0-0 3:24 34182
*Sep 15, 2018 at Pitt L 19-24 1-2 0-1 3:03 34284
*Sep 22, 2018 #3 CLEMSON L 21-49 1-3 0-2 3:11 50595
Sep 29, 2018 BOWLING GREEN W 63-17 2-3 0-2 3:03 40740
*Oct 05, 2018 at Louisville W 66-31 3-3 1-2 3:14 51658
*Oct 13, 2018 DUKE L 14-28 3-4 1-3 3:09 41709
*Oct 25, 2018 at Virginia Tech W 49-28 4-4 2-3 3:06 65632
*Nov 03, 2018 at North Carolina W 38-28 5-4 3-3 3:10 40782
*Nov 10, 2018 MIAMI (FLA.) W 27-21 6-4 4-3 3:05 48217

2018 Georgia Tech Football
Georgia Tech Overall Team Statistics (as of Nov 13, 2018)
All games
Team Statistics GT OPP
SCORING 376 275
Points Per Game 37.6 27.5
Points Off Turnovers 109 59
FIRST DOWNS 237 194
R u s h i n g 189 85
P a s s i n g 32 98
P e n a l t y 16 11
RUSHING YARDAGE 3623 1383
Yards gained rushing 3829 1568
Yards lost rushing 206 185
Rushing Attempts 603 324
Average Per Rush 6.0 4.3
Average Per Game 362.3 138.3
TDs Rushing 43 17
PASSING YARDAGE 884 2180
C o m p - A t t - I n t 45-92-4 191-303-12
Average Per Pass 9.6 7.2
Average Per Catch 19.6 11.4
Average Per Game 88.4 218.0
TDs Passing 6 16
TOTAL OFFENSE 4507 3563
Total Plays 695 627
Average Per Play 6.5 5.7
Average Per Game 450.7 356.3
KICK RETURNS: #-Yards 21-397 42-1123
PUNT RETURNS: #-Yards 12-91 7-32
INT RETURNS: #-Yards 12-231 4-47
KICK RETURN AVERAGE 18.9 26.7
PUNT RETURN AVERAGE 7.6 4.6
INT RETURN AVERAGE 21.0 11.8
FUMBLES-LOST 30-12 19-11
PENALTIES-Yards 42-402 46-384
Average Per Game 40.2 38.4
PUNTS-Yards 24-1086 40-1581
Average Per Punt 45.2 39.5
Net punt average 42.2 36.2
KICKOFFS-Yards 66-3948 51-3015
Average Per Kick 59.8 59.1
Net kick average 36.7 39.6
TIME OF POSSESSION/Game 3 4 : 3 0 2 5 : 3 0
3RD-DOWN Conversions 55/119 60/121
3rd-Down Pct 46% 50%
4TH-DOWN Conversions 11/21 7/13
4th-Down Pct 52% 54%
SACKS BY-Yards 14-90 11-66
MISC YARDS 0 0
TOUCHDOWNS SCORED 52 37
FIELD GOALS-ATTEMPTS 5-8 5-5
ON-SIDE KICKS 0-1 0-0
RED-ZONE SCORES (41-51) 80% (25-30) 83%
RED-ZONE TOUCHDOWNS (37-51) 73% (21-30) 70%
PAT-ATTEMPTS (49-51) 96% (36-36) 100%
ATTENDANCE 220980 226538
Games/Avg Per Game 5/44196 5/45308
Neutral Site Games 0/0
Score by Quarters 1st 2nd 3rd 4th OT Total
Georgia Tech 94 82 114 86 0 376
Opponents 73 76 62 64 0 275

2018 Georgia Tech Football
Georgia Tech Overall Individual Statistics (as of Nov 13, 2018)
All games
Rushing gp-gs att gain loss net avg td lg avg/g
Tobias Oliver 9 - 1 133 829 48 781 5.9 12 65 86.8
TaQuon Marshall 9 - 9 159 860 110 750 4.7 11 45 83.3
Jordan Mason 10-5 99 629 1 628 6.3 7 46 62.8
Jerry Howard 10-4 82 489 10 479 5.8 4 52 47.9
Nathan Cottrell 10-0 35 294 1 293 8.4 3 34 29.3
Qua Searcy 10-10 28 311 20 29110.4 2 56 29.1
Clinton Lynch 10-10 30 173 9 164 5.5 2 25 16.4
KirVonte Benson 2 - 1 15 119 3 116 7.7 2 17 58.0
Omahri Jarrett 6 - 0 4 47 0 4711.8 0 29 7.8
James Graham 2 - 0 3 29 0 29 9.7 0 13 14.5
Christian Malloy 1 - 0 4 27 0 27 6.8 0 10 27.0
Joseph Macrina 4 - 0 5 17 0 17 3.4 0 4 4.2
Melvin Davis 2 - 0 1 3 0 3 3.0 0 3 1.5
Xavier Gantt 4 - 0 2 2 0 2 1.0 0 1 0.5
Josh Blancato 1 - 0 1 0 1 -1 -1.0 0 0 -1.0
Team 3 - 0 1 0 1 -1 -1.0 0 0 -0.3
Antwan Owens 10-0 1 0 2 -2 -2.0 0 0 -0.2
Total 10 603 3829 206 3623 6.0 43 65362.3
Opponents 10 324 1568 185 1383 4.3 17 46138.3
Passing gp-gs efficcomp-att-in pct yds td lg avg/g
TaQuon Marshall 9 - 9130.64 39-80-4 48.8 718 4 81 79.8
Tobias Oliver 9 - 1221.20 6-12-0 50.0 166 2 86 18.4
Total 10142.45 45-92-4 48.9 884 6 86 88.4
Opponents 10132.98191-303-12 63.0 2180 16 60218.0
Receiving gp-gs no. yds avg td lg avg/g
Brad Stewart 10-10 12 177 14.8 2 31 17.7
Jalen Camp 9 - 8 8 161 20.1 0 37 17.9
Clinton Lynch 10-10 7 209 29.9 2 81 20.9
Qua Searcy 10-10 7 196 28.0 1 86 19.6
Malachi Carter 10-0 3 56 18.7 1 32 5.6
Nathan Cottrell 10-0 3 12 4.0 0 9 1.2
Jerry Howard 10-4 2 34 17.0 0 18 3.4
Stephen Dolphus 8 - 2 1 39 39.0 0 39 4.9
Jordan Mason 10-5 1 2 2.0 0 2 0.2
KirVonte Benson 2 - 1 1 -2 -2.0 0 0 -1.0
Total 10 45 884 19.6 6 86 88.4
Opponents 10 191 2180 11.4 16 60218.0
Punt Returns no. yds avg td lg
Brad Stewart 7 47 6.7 0 15
Juanyeh Thomas 4 4310.8 0 25
Nathan Cottrell 1 1 1.0 0 1
Total 12 91 7.6 0 25
Opponents 7 32 4.6 0 18
Interceptions no. yds avg td lg
Malik Rivera 2 8442.0 0 42
Tariq Carpenter 2 6 3.0 0 6
Anree Saint-Amour 2 19 9.5 1 16
David Curry 1 0 0.0 0 0
Juanyeh Thomas 1 9595.0 1 95
Kaleb Oliver 1 2525.0 0 25
Desmond Branch 1 2 2.0 0 2
Lamont Simmons 1 0 0.0 0 0
Tre Swilling 1 0 0.0 0 0
Total 12 23119.2 2 95
Opponents 4 4711.8 0 22
Kick Returns no. yds avg td lg
Juanyeh Thomas 20 38319.1 0 38
Avery Showell 1 1414.0 0 14
Total 21 39718.9 0 38
Opponents 42 112326.7 2 98
Fumble Returns no. yds avg td lg
Charlie Thomas 1 7 7.0 0 7
Antwan Owens 1 2121.0 0 21
Lamont Simmons 1 0 0.0 0 0
B. Jordan-Swilling 1 6 6.0 0 6
Ajani Kerr 1 3 3.0 0 3
David Curry 1 1515.0 1 15
Total 6 52 8.7 1 21
Opponents 3 24 8.0 2 20

2018 Georgia Tech Football
Georgia Tech Overall Individual Statistics (as of Nov 13, 2018)
All games
PAT
Scoring td fg kick rush rcv pass dx saf pts
Tobias Oliver 12 - - - - - - - 72
TaQuon Marshall 11 - - - - 0-1 - - 66
Wesley Wells - 4-4 35-35 - - - - - 47
Jordan Mason 7 - - - - - - - 42
Jerry Howard 4 - - - - - - - 24
Clinton Lynch 4 - - - - - - - 24
Nathan Cottrell 3 - - - - - - - 18
Qua Searcy 3 - - - - - - - 18
Brenton King - 1-4 10-11 - - - - - 13
KirVonte Benson 2 - - - - - - - 12
Brad Stewart 2 - - - - - - - 12
Malachi Carter 1 - - - - - - - 6
David Curry 1 - - - - - - - 6
Juanyeh Thomas 1 - - - - - - - 6
Anree Saint-Amour 1 - - - - - - - 6
Shawn Davis - - 4-5 - - - - - 4
Total 52 5-8 49-51 - - 0-1 - - 376
Opponents 37 5-5 36-36 - 1 1-1 - - 275
Total Offense g plays rush pass total avg/g
TaQuon Marshall 9 239 750 718 1468163.1
Tobias Oliver 9 145 781 166 947105.2
Jordan Mason 10 99 628 0 628 62.8
Jerry Howard 10 82 479 0 479 47.9
Nathan Cottrell 10 35 293 0 293 29.3
Qua Searcy 10 28 291 0 291 29.1
Clinton Lynch 10 30 164 0 164 16.4
KirVonte Benson 2 15 116 0 116 58.0
Omahri Jarrett 6 4 47 0 47 7.8
James Graham 2 3 29 0 29 14.5
Christian Malloy 1 4 27 0 27 27.0
Joseph Macrina 4 5 17 0 17 4.2
Melvin Davis 2 1 3 0 3 1.5
Xavier Gantt 4 2 2 0 2 0.5
Josh Blancato 1 1 -1 0 -1 -1.0
Team 3 1 -1 0 -1 -0.3
Antwan Owens 10 1 -2 0 -2 -0.2
Total 10 695 3623 884 4507450.7
Opponents 10 627 1383 2180 3563356.3
Field Goals fg pct. 01-19 20-29 30-39 40-49 50-99 lg blk
Brenton King 1-4 25.0 0-0 0-0 1-1 0-1 0-2 35 0
Wesley Wells 4-4 100. 0-0 2-2 1-1 1-1 0-0 41 0
FG Sequence Georgia Tech Opponents
Alcorn St. 50 -
USF (35) -
Pitt 52 (33)
Clemson 43 -
Bowling Green - (29)
Louisville (41) (46)
Duke - -
Virginia Tech - -
North Carolina (22) (23),(25)
Miami (Fla.) (38),(24) -
Numbers in (parentheses) indicate field goal was made.
Punting no. yds avg lg tb fc i2050+ blk
Pressley Harvin III 24 10845.2 62 2 5 10 9 0
Total 24 10845.2 62 2 5 10 9 0
Opponents 40 15839.5 57 2 15 15 5 0
Kickoffs no. yds avg tb ob retn net ydln
Shawn Davis 61 36560.0 15 1
Wesley Wells 5 28957.8 1 0
Total 66 39459.8 16 126.736.7 28
Opponents 51 30159.1 24 118.939.6 25

2018 Georgia Tech Football
Georgia Tech Overall Individual Statistics (as of Nov 13, 2018)
All games
All Purpose g rush rcv pr kr ir total avg/g
Tobias Oliver 9 781 0 0 0 0 781 86.8
TaQuon Mars 9 750 0 0 0 0 750 83.3
Jordan Maso 10 628 2 0 0 0 630 63.0
Juanyeh Tho 10 0 0 43 383 95 521 52.1
Jerry Howard 10 479 34 0 0 0 513 51.3
Qua Searcy 10 291 196 0 0 0 487 48.7
Clinton Lynch 10 164 209 0 0 0 373 37.3
Nathan Cottr 10 293 12 1 0 0 306 30.6
Brad Stewart 10 0 177 47 0 0 224 22.4
Jalen Camp 9 0 161 0 0 0 161 17.9
KirVonte Ben 2 116 -2 0 0 0 114 57.0
Malik Rivera 10 0 0 0 0 84 84 8.4
Malachi Carte 10 0 56 0 0 0 56 5.6
Omahri Jarret 6 47 0 0 0 0 47 7.8
Stephen Dolp 8 0 39 0 0 0 39 4.9
James Graha 2 29 0 0 0 0 29 14.5
Christian Mall 1 27 0 0 0 0 27 27.0
Kaleb Oliver 10 0 0 0 0 25 25 2.5
Anree Saint- 10 0 0 0 0 19 19 1.9
Joseph Macri 4 17 0 0 0 0 17 4.2
Avery Showel 5 0 0 0 14 0 14 2.8
Tariq Carpent 10 0 0 0 0 6 6 0.6
Melvin Davis 2 3 0 0 0 0 3 1.5
Desmond Bra 10 0 0 0 0 2 2 0.2
Xavier Gantt 4 2 0 0 0 0 2 0.5
Team 3 -1 0 0 0 0 -1 -0.3
Josh Blancat 1 -1 0 0 0 0 -1 -1.0
Antwan Owen 10 -2 0 0 0 0 -2 -0.2
Total 10 3623 884 91 397 231 5226522.6
Opponents 10 1383 2180 32 1123 47 4765476.5

2018 Georgia Tech Football
Georgia Tech Overall Defensive Statistics (as of Nov 13, 2018)
All games
Tackles Sacks Pass defense Fumbles blkd
# Defensive Leaders gp-gs ua a tot tfl/yds no-yds int-yds brup qbh rcv-yds ff kick saf
36 Malik Rivera 10-10 27 23 50 0.5-2 . 2-84 . 1 . . . .
51 Brant Mitchell 10-10 25 23 48 4.0-13 2.0-8 . 1 1 . . . .
23 Jalen Johnson 10-10 27 15 42 5.5-12 . . . . 1-0 . . .
94 Anree Saint-Amour 10-10 24 14 38 10.5-45 4.0-31 2-19 1 8 . 3 . .
45 Charlie Thomas 8-5 23 15 38 2.0-10 1.0-9 . 1 5 3-7 1 . .
29 Tariq Carpenter 10-10 25 11 36 1.0-1 . 2-6 4 . . 1 . .
32 David Curry 10-9 20 15 35 0.5-3 0.5-3 1-0 . 1 1-15 . . .
38 Ajani Kerr 10-2 21 7 28 . . . 2 . 1-3 . . .
99 Desmond Branch 10-10 8 16 24 3.0-10 0.5-3 1-2 1 3 . . . .
54 Kyle Cerge-Henderso 10-9 9 15 24 4.0-12 2.0-10 . . 1 1-0 . . .
6 Lamont Simmons 8-5 18 6 24 1.0-2 . 1-0 1 . . . . .
40 Kaleb Oliver 10-0 9 10 19 2.0-4 . 1-25 2 . . 1 . .
12 B. Jordan-Swilling 8-1 13 6 19 . . . . 1 1-6 . . .
33 Jaytlin Askew 8-5 14 4 18 1.0-5 . . 1 . . . . .
9 Victor Alexander 9-5 10 7 17 1.0-14 1.0-14 . . 1 . 1 . .
3 Tre Swilling 9-8 13 4 17 1.5-10 1.0-7 1-0 4 1 . 1 . .
89 Antwan Owens 10-0 10 7 17 . . . . 2 1-21 . . .
90 Brandon Adams 10-1 9 7 16 3.5-20 . . . . . 1 . .
10 Christian Campbell 10-0 9 6 15 2.0-5 2.0-5 . 1 1 . . . .
44 Quez Jackson 10-0 9 6 15 . . . . . . . . .
28 Juanyeh Thomas 10-0 9 3 12 . . 1-95 1 . 1-0 . . .
41 Jaquan Henderson 8-0 8 4 12 . . . . . . . . .
42 Jordan Domineck 3-0 4 1 5 . . . . . . . . .
96 Chris Martin 5-0 2 2 4 . . . . . . . . .
97 Brentavious Glanton 6-0 1 3 4 . . . . . . . . .
21 Zamari Walton 4-0 3 1 4 . . . 3 . . . . .
13 Avery Showell 5-0 3 . 3 . . . . . . . . .
25 Tre Jackson 7-0 2 1 3 . . . . . 1-0 . . .
88 Shawn Davis 10-0 2 . 2 . . . . . . . . .
14 Jaylon King 3-0 2 . 2 . . . . . . . . .
35 Jarett Cole 5-0 1 1 2 . . . . . . . . .
2 Omahri Jarrett 6-0 1 1 2 . . . . . . . . .
92 Quan Griffin 2-0 2 . 2 . . . . . . . . .
52 Justice Dingle 4-0 1 . 1 . . . . . . . . .
53 Jahaziel Lee 9-6 1 . 1 . . . . . . . . .
62 Bailey Ivemeyer 7-1 1 . 1 . . . . . . . . .
67 Zach Roberts 8-0 . 1 1 . . . . . . . . .
93 T.K. Chimedza 3-0 1 . 1 . . . . . . . . .
1S Devin Smith 2-0 1 . 1 . . . . . . . . .
91 Kelton Dawson 2-0 . 1 1 . . . . . . . . .
1 Qua Searcy 10-10 1 . 1 . . . . . . . . .
Total 10 369 236 605 43-168 14-90 12-231 23 26 11-52 9 . .
Opponents 10 451 306 757 53-164 11-66 4-47 6 9 12-24 17 . .

2018 Georgia Tech Football
Georgia Tech Individual Season/Career Statistics (as of Nov 13, 2018)
All games
SEASON CAREER
Rushing gp att gain loss net avg td lg avg/g gp att gain loss net avg td lg avg/g
Tobias Oliver 9 133 829 48 781 5.9 12 65 86.8 9 133 829 48 781 5.9 12 65 86.8
TaQuon Marshall 9 159 860 110 750 4.7 11 45 83.3 31 421 2271 303 1968 4.7 29 78 63.5
Jordan Mason 10 99 629 1 628 6.3 7 46 62.8 10 99 629 1 628 6.3 7 46 62.8
Jerry Howard 10 82 489 10 479 5.8 4 52 47.9 19 105 665 11 654 6.2 6 65 34.4
Nathan Cottrell 10 35 294 1 293 8.4 3 34 29.3 32 69 580 10 570 8.3 3 69 17.8
Qua Searcy 10 28 311 20 291 10.4 2 56 29.1 37 123 931 74 857 7.0 6 60 23.2
Clinton Lynch 10 30 173 9 164 5.5 2 25 16.4 45 143 1283 38 1245 8.7 9 49 27.7
KirVonte Benson 2 15 119 3 116 7.7 2 17 58.0 20 219 1192 23 1169 5.3 8 65 58.5
Omahri Jarrett 6 4 47 0 47 11.8 0 29 7.8 17 4 47 0 47 11.8 0 29 2.8
James Graham 2 3 29 0 29 9.7 0 13 14.5 2 3 29 0 29 9.7 0 13 14.5
Christian Malloy 1 4 27 0 27 6.8 0 10 27.0 1 4 27 0 27 6.8 0 10 27.0
Joseph Macrina 4 5 17 0 17 3.4 0 4 4.2 4 5 17 0 17 3.4 0 4 4.2
Melvin Davis 2 1 3 0 3 3.0 0 3 1.5 5 1 3 0 3 3.0 0 3 0.6
Xavier Gantt 4 2 2 0 2 1.0 0 1 0.5 6 2 2 0 2 1.0 0 1 0.3
Josh Blancato 1 1 0 1 -1 -1.0 0 0 -1.0 1 1 0 1 -1 -1.0 0 0 -1.0
Team 3 1 0 1 -1 -1.0 0 0 -0.3
Antwan Owens 10 1 0 2 -2 -2.0 0 0 -0.2 18 1 0 2 -2 -2.0 0 0 -0.1
Total 10 603 3829 206 3623 6.0 43 65 362.3
Opponents 10 324 1568 185 1383 4.3 17 46 138.3
Passing gp efficcomp-att-int pct yds td lg avg/g gp effic comp-att-int pct yds td lg avg/g
TaQuon Marshall 9 130.64 39-80-4 48.8 718 4 81 79.8 31 126.97 83-197-9 42.1 1654 14 81 53.4
Tobias Oliver 9 221.20 6-12-0 50.0 166 2 86 18.4 9 221.20 6-12-0 50.0 166 2 86 18.4
Total 10 142.45 45-92-4 48.9 884 6 86 88.4
Opponents 10 132.98191-303-12 63.0 2180 16 60 218.0
Receiving gp no. yds avg td lg avg/g gp no. yds avg td lg avg/g
Brad Stewart 10 12 177 14.8 2 31 17.7 46 42 751 17.9 3 64 16.3
Jalen Camp 9 8 161 20.1 0 37 17.9 31 9 210 23.3 0 49 6.8
Clinton Lynch 10 7 209 29.9 2 81 20.9 45 37 1015 27.4 11 83 22.6
Qua Searcy 10 7 196 28.0 1 86 19.6 37 24 554 23.1 3 86 15.0
Malachi Carter 10 3 56 18.7 1 32 5.6 10 3 56 18.7 1 32 5.6
Nathan Cottrell 10 3 12 4.0 0 9 1.2 32 3 12 4.0 0 9 0.4
Jerry Howard 10 2 34 17.0 0 18 3.4 19 3 49 16.3 0 18 2.6
Stephen Dolphus 8 1 39 39.0 0 39 4.9 11 1 39 39.0 0 39 3.5
Jordan Mason 10 1 2 2.0 0 2 0.2 10 1 2 2.0 0 2 0.2
KirVonte Benson 2 1 -2 -2.0 0 0 -1.0 20 3 14 4.7 0 9 0.7
Total 10 45 884 19.6 6 86 88.4
Opponents 10 191 2180 11.4 16 60 218.0
Total Offense g plays rush pass total avg/g g plays rush pass total avg/g
TaQuon Marshall 9 239 750 718 1468 163.1 31 618 1968 1654 3622 116.8
Tobias Oliver 9 145 781 166 947 105.2 9 145 781 166 947 105.2
Jordan Mason 10 99 628 0 628 62.8 10 99 628 0 628 62.8
Jerry Howard 10 82 479 0 479 47.9 19 105 654 0 654 34.4
Nathan Cottrell 10 35 293 0 293 29.3 32 69 570 0 570 17.8
Qua Searcy 10 28 291 0 291 29.1 37 123 857 0 857 23.2
Clinton Lynch 10 30 164 0 164 16.4 45 143 1245 0 1245 27.7
KirVonte Benson 2 15 116 0 116 58.0 20 219 1169 0 1169 58.5
Omahri Jarrett 6 4 47 0 47 7.8 17 4 47 0 47 2.8
James Graham 2 3 29 0 29 14.5 2 3 29 0 29 14.5
Christian Malloy 1 4 27 0 27 27.0 1 4 27 0 27 27.0
Joseph Macrina 4 5 17 0 17 4.2 4 5 17 0 17 4.2
Melvin Davis 2 1 3 0 3 1.5 5 1 3 0 3 0.6
Xavier Gantt 4 2 2 0 2 0.5 6 2 2 0 2 0.3
Team 3 1 -1 0 -1 -0.3
Josh Blancato 1 1 -1 0 -1 -1.0 1 1 -1 0 -1 -1.0
Antwan Owens 10 1 -2 0 -2 -0.2 18 1 -2 0 -2 -0.1
Total 10 695 3623 884 4507 450.7
Opponents 10 627 1383 2180 3563 356.3
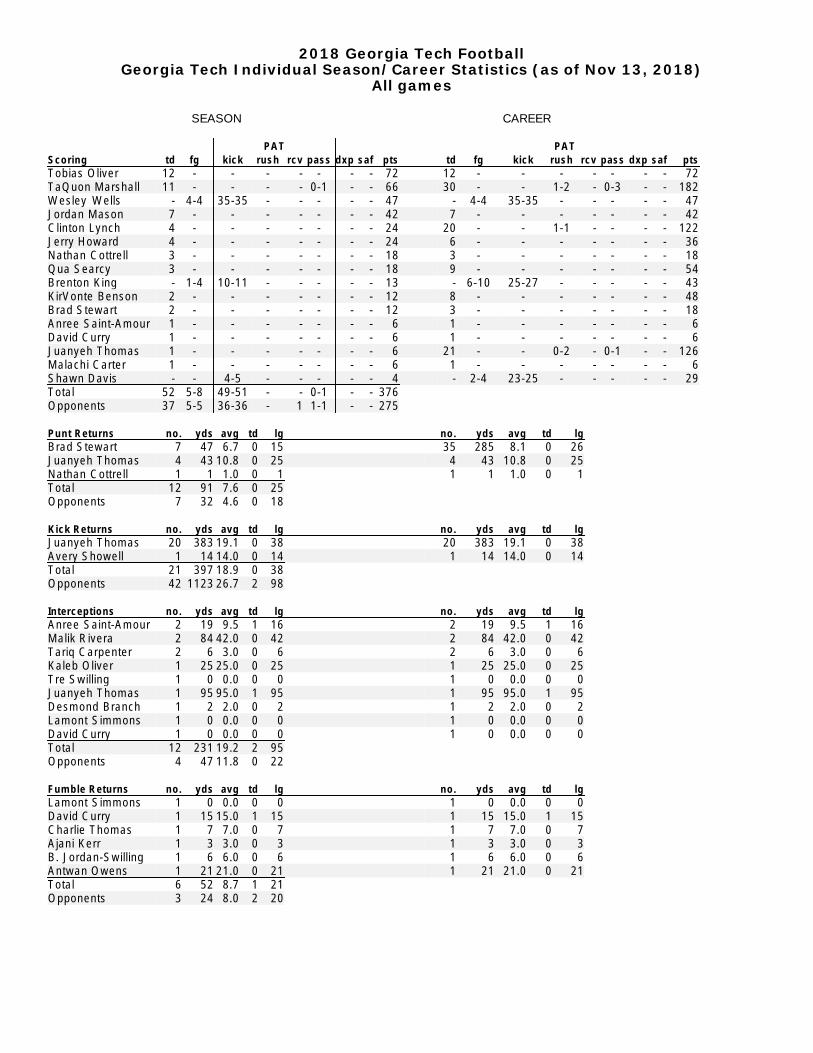
2018 Georgia Tech Football
Georgia Tech Individual Season/Career Statistics (as of Nov 13, 2018)
All games
SEASON CAREER
PAT PAT
Scoring td fg kick rush rcv pass dxp saf pts td fg kick rush rcv pass dxp saf pts
Tobias Oliver 12 - - - - - - - 72 12 - - - - - - - 72
TaQuon Marshall 11 - - - - 0-1 - - 66 30 - - 1-2 - 0-3 - - 182
Wesley Wells - 4-4 35-35 - - - - - 47 - 4-4 35-35 - - - - - 47
Jordan Mason 7 - - - - - - - 42 7 - - - - - - - 42
Clinton Lynch 4 - - - - - - - 24 20 - - 1-1 - - - - 122
Jerry Howard 4 - - - - - - - 24 6 - - - - - - - 36
Nathan Cottrell 3 - - - - - - - 18 3 - - - - - - - 18
Qua Searcy 3 - - - - - - - 18 9 - - - - - - - 54
Brenton King - 1-4 10-11 - - - - - 13 - 6-10 25-27 - - - - - 43
KirVonte Benson 2 - - - - - - - 12 8 - - - - - - - 48
Brad Stewart 2 - - - - - - - 12 3 - - - - - - - 18
Anree Saint-Amour 1 - - - - - - - 6 1 - - - - - - - 6
David Curry 1 - - - - - - - 6 1 - - - - - - - 6
Juanyeh Thomas 1 - - - - - - - 6 21 - - 0-2 - 0-1 - - 126
Malachi Carter 1 - - - - - - - 6 1 - - - - - - - 6
Shawn Davis - - 4-5 - - - - - 4 - 2-4 23-25 - - - - - 29
Total 52 5-8 49-51 - - 0-1 - - 376
Opponents 37 5-5 36-36 - 1 1-1 - - 275
Punt Returns no. yds avg td lg no. yds avg td lg
Brad Stewart 7 47 6.7 0 15 35 285 8.1 0 26
Juanyeh Thomas 4 43 10.8 0 25 4 43 10.8 0 25
Nathan Cottrell 1 1 1.0 0 1 1 1 1.0 0 1
Total 12 91 7.6 0 25
Opponents 7 32 4.6 0 18
Kick Returns no. yds avg td lg no. yds avg td lg
Juanyeh Thomas 20 383 19.1 0 38 20 383 19.1 0 38
Avery Showell 1 14 14.0 0 14 1 14 14.0 0 14
Total 21 397 18.9 0 38
Opponents 42 1123 26.7 2 98
Interceptions no. yds avg td lg no. yds avg td lg
Anree Saint-Amour 2 19 9.5 1 16 2 19 9.5 1 16
Malik Rivera 2 84 42.0 0 42 2 84 42.0 0 42
Tariq Carpenter 2 6 3.0 0 6 2 6 3.0 0 6
Kaleb Oliver 1 25 25.0 0 25 1 25 25.0 0 25
Tre Swilling 1 0 0.0 0 0 1 0 0.0 0 0
Juanyeh Thomas 1 95 95.0 1 95 1 95 95.0 1 95
Desmond Branch 1 2 2.0 0 2 1 2 2.0 0 2
Lamont Simmons 1 0 0.0 0 0 1 0 0.0 0 0
David Curry 1 0 0.0 0 0 1 0 0.0 0 0
Total 12 231 19.2 2 95
Opponents 4 47 11.8 0 22
Fumble Returns no. yds avg td lg no. yds avg td lg
Lamont Simmons 1 0 0.0 0 0 1 0 0.0 0 0
David Curry 1 15 15.0 1 15 1 15 15.0 1 15
Charlie Thomas 1 7 7.0 0 7 1 7 7.0 0 7
Ajani Kerr 1 3 3.0 0 3 1 3 3.0 0 3
B. Jordan-Swilling 1 6 6.0 0 6 1 6 6.0 0 6
Antwan Owens 1 21 21.0 0 21 1 21 21.0 0 21
Total 6 52 8.7 1 21
Opponents 3 24 8.0 2 20

2018 Georgia Tech Football
Georgia Tech Individual Season/Career Statistics (as of Nov 13, 2018)
All games
SEASON CAREER
All Purpose g rush rcv pr kr ir total avg/g g rush rcv pr kr ir total avg/g
Tobias Oliver 9 781 0 0 0 0 781 86.8 9 781 0 0 0 0 781 86.8
TaQuon Mars 9 750 0 0 0 0 750 83.3 31 1968 76 1 0 0 2045 66.0
Jordan Mason 10 628 2 0 0 0 630 63.0 10 628 2 0 0 0 630 63.0
Juanyeh Tho 10 0 0 43 383 95 521 52.1 48 2178 0 43 383 95 2699 56.2
Jerry Howard 10 479 34 0 0 0 513 51.3 19 654 49 0 64 0 767 40.4
Qua Searcy 10 291 196 0 0 0 487 48.7 37 857 554 -2 0 0 1409 38.1
Clinton Lynch 10 164 209 0 0 0 373 37.3 45 1245 1015 0 0 0 2260 50.2
Nathan Cottre 10 293 12 1 0 0 306 30.6 32 570 12 1 657 0 1240 38.8
Brad Stewart 10 0 177 47 0 0 224 22.4 46 -14 751 285 0 0 1022 22.2
Jalen Camp 9 0 161 0 0 0 161 17.9 31 0 210 0 -9 0 201 6.5
KirVonte Ben 2 116 -2 0 0 0 114 57.0 20 1169 14 0 0 0 1183 59.2
Malik Rivera 10 0 0 0 0 84 84 8.4 10 0 0 0 0 84 84 8.4
Malachi Carte 10 0 56 0 0 0 56 5.6 10 0 56 0 0 0 56 5.6
Omahri Jarret 6 47 0 0 0 0 47 7.8 17 47 0 0 144 0 191 11.2
Stephen Dolp 8 0 39 0 0 0 39 4.9 11 0 39 0 0 0 39 3.5
James Graha 2 29 0 0 0 0 29 14.5 2 29 0 0 0 0 29 14.5
Christian Mall 1 27 0 0 0 0 27 27.0 1 27 0 0 0 0 27 27.0
Kaleb Oliver 10 0 0 0 0 25 25 2.5 10 0 0 0 0 25 25 2.5
Anree Saint-A 10 0 0 0 0 19 19 1.9 41 0 0 0 0 19 19 0.5
Joseph Macri 4 17 0 0 0 0 17 4.2 4 17 0 0 0 0 17 4.2
Avery Showell 5 0 0 0 14 0 14 2.8 5 0 0 0 14 0 14 2.8
Tariq Carpent 10 0 0 0 0 6 6 0.6 16 0 0 0 0 6 6 0.4
Melvin Davis 2 3 0 0 0 0 3 1.5 5 3 0 0 0 0 3 0.6
Desmond Bra 10 0 0 0 0 2 2 0.2 30 0 0 0 0 2 2 0.1
Xavier Gantt 4 2 0 0 0 0 2 0.5 6 2 0 0 0 0 2 0.3
Team 3 -1 0 0 0 0 -1 -0.3
Josh Blancato 1 -1 0 0 0 0 -1 -1.0 1 -1 0 0 0 0 -1 -1.0
Antwan Owen 10 -2 0 0 0 0 -2 -0.2 18 -2 0 0 0 0 -2 -0.1
Total 10 3623 884 91 397 231 5226 522.6
Opponents 10 1383 2180 32 1123 47 4765 476.5
Field Goals att good long blkd att good long blkd
Brenton King 4 1 35 0 10 6 42 0
Wesley Wells 4 4 41 0 4 4 41 0
Total 8 5 41 0
Opponents 5 5 46 0
Punting no. yds avg lg blk no. yds avg lg blk
Pressley Harvin III 24 108 45.2 62 0 74 3291 44.5 62 0
Total 24 108 45.2 62 0
Opponents 40 158 39.5 57 0
Kickoffs no. yds avg tb ob no. yds avg tb ob
Shawn Davis 61 365 60.0 15 1 89 5339 60.0 24 2
Wesley Wells 5 289 57.8 1 0 5 289 57.8 1 0
Total 66 394 59.8 16 1
Opponents 51 301 59.1 24 1

2018 Georgia Tech Football
Georgia Tech Individual Season/Career Statistics (as of Nov 13, 2018)
All games
SEASON CAREER
## Defensive Leaders gp ua a total tflsack int pb fr ff blk gp ua a total tfl sack int pb fr ff blk
36 Malik Rivera 10 2 7 2 3 5 0.5 . 2 . . . . 10 2 7 2 3 5 0 0.5 . 2 . . . .
51 Brant Mitchell 10 2 5 2 3 4 4.0 2 . . 1 . . . 44 1 2 8 4 2 0 6 11.0 4 . 0 4 5 1 . .
23 Jalen Johnson 10 2 7 1 5 4 5.5 . . . 1 . . 42 5 0 2 2 7 2 6.5 . . . 1 . .
45 Charlie Thomas 8 2 3 1 5 3 2.0 1 . . 1 3 1 . 8 2 3 1 5 3 8 2.0 1 . 0 . 1 3 1 .
94 Anree Saint-Amour 10 2 4 1 4 310.5 4 . 2 1 . 3 . 41 6 3 3 1 9 4 22.0 1 1 . 5 2 1 3 4 .
29 Tariq Carpenter 10 2 5 1 1 3 1.0 . 2 4 . 1 . 16 2 7 1 1 3 8 1.0 . 2 4 . 1 .
32 David Curry 10 2 0 1 5 3 0.5 0 . 1 . 1 . . 23 2 6 2 1 4 7 0.5 0 . 5 1 . 1 . .
38 Ajani Kerr 10 2 1 7 2 0.0 . . 2 1 . . 21 3 0 8 3 8 0.0 . . 5 1 . .
6 Lamont Simmons 8 1 8 6 2 1.0 . 1 1 . . . 32 3 7 1 5 5 2 1.0 . 1 6 . 1 .
54 Kyle Cerge-Hender 10 9 1 5 2 4.0 2 . . . 1 . . 39 2 9 3 8 6 7 5.5 3 . 0 . . 2 . 1
99 Desmond Branch 10 8 1 6 2 3.0 0 . 1 1 . . . 30 2 3 2 6 4 9 6.5 1 . 5 1 5 . . .
12 B. Jordan-Swilling 8 1 3 6 1 0.0 . . . 1 . . 19 3 5 1 8 5 3 2.0 . 1 1 2 1 .
40 Kaleb Oliver 10 9 1 0 1 2.0 . 1 2 . 1 . 10 9 1 0 1 9 2.0 . 1 2 . 1 .
33 Jaytlin Askew 8 1 4 4 1 1.0 . . 1 . . . 18 1 4 4 1 8 1.0 . . 1 . . .
3 Tre Swilling 9 1 3 4 1 1.5 1 . 1 4 . 1 . 9 1 3 4 1 7 1.5 1 . 0 1 4 . 1 .
89 Antwan Owens 10 1 0 7 1 0.0 . . . 1 . . 18 1 1 9 2 0 1.0 1 . 0 . . 1 . .
9 Victor Alexander 9 1 0 7 1 1.0 1 . . . . 1 . 45 6 9 3 2 1 0 1 5.5 3 . 0 . 1 . 1 .
90 Brandon Adams 10 9 7 1 3.5 . . . . 1 . 30 1 8 1 5 3 3 5.0 . . 1 . 1 .
44 Quez Jackson 10 9 6 1 0.0 . . . . . . 10 9 6 1 5 0.0 . . . . . .
10 Christian Campbell 10 9 6 1 2.0 2 . . 1 . . . 30 1 3 1 2 2 5 3.0 2 . 0 . 2 . . .
28 Juanyeh Thomas 10 9 3 1 0.0 . 1 1 1 . . 48 1 1 3 1 4 0.0 . 1 1 1 . .
41 Jaquan Henderson 8 8 4 1 0.0 . . . . . . 19 1 2 6 1 8 0.0 . . . . . .
42 Jordan Domineck 3 4 1 5 0.0 . . . . . . 3 4 1 5 0.0 . . . . . .
96 Chris Martin 5 2 2 4 0.0 . . . . . . 7 2 2 4 0.0 . . . . . .
97 Brentavious Glanto 6 1 3 4 0.0 . . . . . . 23 2 1 9 3 0 4.0 1 . 0 . 1 . . .
21 Zamari Walton 4 3 1 4 0.0 . . 3 . . . 4 3 1 4 0.0 . . 3 . . .
25 Tre Jackson 7 2 1 3 0.0 . . . 1 . . 39 1 0 2 1 2 1.0 . . 1 1 . .
13 Avery Showell 5 3 . 3 0.0 . . . . . . 5 3 . 3 0.0 . . . . . .
14 Jaylon King 3 2 . 2 0.0 . . . . . . 3 2 . 2 0.0 . . . . . .
35 Jarett Cole 5 1 1 2 0.0 . . . . . . 8 1 1 2 0.0 . . . . . .
92 Quan Griffin 2 2 . 2 0.0 . . . . . . 2 2 . 2 0.0 . . . . . .
2 Omahri Jarrett 6 1 1 2 0.0 . . . . . . 17 1 1 2 0.0 . . . . . .
88 Shawn Davis 10 2 . 2 0.0 . . . . . . 16 2 . 2 0.0 . . . . . .
93 T.K. Chimedza 3 1 . 1 0.0 . . . . . . 3 1 . 1 0.0 . . . . . .
1 Qua Searcy 10 1 . 1 0.0 . . . . . . 37 2 . 2 0.0 . . . . . .
52 Justice Dingle 4 1 . 1 0.0 . . . . . . 4 1 . 1 0.0 . . . . . .
53 Jahaziel Lee 9 1 . 1 0.0 . . . . . . 28 1 . 1 0.0 . . . . . .
67 Zach Roberts 8 . 1 1 0.0 . . . . . . 8 . 1 1 0.0 . . . . . .
91 Kelton Dawson 2 . 1 1 0.0 . . . . . . 2 . 1 1 0.0 . . . . . .
1S Devin Smith 2 1 . 1 0.0 . . . . . . 2 1 . 1 0.0 . . . . . .
62 Bailey Ivemeyer 7 1 . 1 0.0 . . . . . . 16 2 . 2 0.0 . . . . . .
Total 10 3 6 2 3 6 0 43 14 12 2 1 1 9 .
Opponents 10 4 5 3 0 7 5 53 11 4 6 1 2 1 7 .

2018 Georgia Tech Football
Georgia Tech Passing Game-by-Game (as of Nov 06, 2018)
All games
#16 Marshall, T. Comp Att Int Pct Yards TD Long Sacked Effic
Alcorn St. 9 18 1 50.0 104 1 25 0-0 105.76
USF 9 18 2 50.0 183 1 81 2-10 131.51
Pitt 6 15 1 40.0 66 0 20 1-8 63.63
Clemson 1 6 0 16.7 29 0 29 3-19 57.27
Bowling Green 5 6 0 83.3 160 0 41 0-0 307.33
Louisville 1 2 0 50.0 12 0 12 0-0 100.40
Duke 5 11 0 45.5 91 1 32 1-9 144.95
Miami (Fla.) 3 4 0 75.0 73 1 31 0-0 310.80
TOTALS 39 80 4 48.8 718 4 81 7-46 130.64
#8 Oliver, T. Comp Att Int Pct Yards TD Long Sacked Effic
Clemson 2 2 0 100.0 28 1 23 1-2 382.60
Bowling Green 0 1 0 0.0 0 0 0 0-0 0.00
Duke 2 6 0 33.3 34 0 25 2-13 80.93
Virginia Tech 0 1 0 0.0 0 0 0 1-5 0.00
North Carolina 2 2 0 100.0 104 1 86 0-0 701.80
TOTALS 6 12 0 50.0 166 2 86 4-20 221.20

2018 Georgia Tech Football
Georgia Tech Rushing/Receiving Game-by-Game (as of Nov 13, 2018)
All games
RUSHING No-Yds/TD ALCN USF UP CU BG LOU DU VT NC UM
Oliver, T. QB 133-781/12 12-72/0 18-97/3 DNP 9-34/0 7-115/2 8-103/2 10-24/0 40-215/ 28-120/ 1-1/0
Marshall, T. QB 159-750/11 9-77/1 13-113/ 28-103/ 25-47/1 13-42/2 23-175/ 16-41/0 DNP 8-61/0 24-91/2
Mason, J. RB 99-628/7 11-85/1 13-95/0 10-94/0 4-30/0 7-61/2 13-78/1 12-39/0 12-82/3 12-40/0 5-24/0
Howard, J. RB 82-479/4 3-7/0 1-1/0 8-82/0 10-18/0 6-29/1 8-58/1 12-62/1 12-76/1 10-90/0 12-56/0
Cottrell, N. RB 35-293/3 1-25/0 4-20/0 - 2-1/1 5-46/1 3-27/0 2-12/0 3-21/0 9-90/1 6-51/0
Searcy, Q. RB 28-291/2 1-56/0 3-52/0 5-38/0 3-7/0 4-44/0 3-28/2 3-15/0 2-15/0 2-38/0 2--2/0
Lynch, C. RB 30-164/2 2-27/0 - 3-2/1 2-10/0 3-18/0 5-41/0 5-32/0 2-3/0 5-22/1 3-9/0
Benson, K. RB 15-116/2 10-75/2 5-41/0 DNP DNP DNP DNP DNP DNP DNP DNP
Jarrett, O. RB 4-47/0 1-5/0 DNP 1-3/0 - 1-10/0 1-29/0 DNP DNP - DNP
Graham, J. QB 3-29/0 DNP DNP DNP DNP DNP DNP 1-4/0 2-25/0 DNP DNP
Malloy, C. RB 4-27/0 DNP DNP DNP DNP DNP DNP DNP 4-27/0 DNP DNP
Macrina, J. 5-17/0 2-8/0 DNP DNP DNP 2-6/0 1-3/0 DNP - DNP DNP
Davis, M. RB 1-3/0 1-3/0 DNP DNP DNP - DNP DNP DNP DNP DNP
Gantt, X. RB 2-2/0 - - DNP DNP 1-1/0 DNP DNP 1-1/0 DNP DNP
Blancato, J. RB 1--1/0 1--1/0 DNP DNP DNP DNP DNP DNP DNP DNP DNP
Team 1--1/0 DNP DNP DNP 1--1/0 - DNP DNP - DNP DNP
Owens, A. 1--2/0 - - 1--2/0 - - - - - - -
RECEIVING No-Yds/TD ALCN USF UP CU BG LOU DU VT NC UM
Lynch, C. RB 7-209/2 - 3-111/1 - 3-57/1 1-41/0 - - - - -
Searcy, Q. RB 7-196/1 2-36/0 2-39/0 - - 1-10/0 - 1-25/0 - 1-86/1 -
Stewart, B. WR 12-177/2 4-49/1 1-6/0 3-33/0 - - 1-12/0 2-46/0 - - 1-31/1
Camp, J. WR 8-161/0 2-21/0 1-8/0 1-20/0 - 2-70/0 - DNP - - 2-42/0
Carter, M. WR 3-56/1 - 1-13/0 1-11/0 - - - 1-32/1 - - -
Dolphus, S. WR 1-39/0 - - DNP - 1-39/0 - - - - DNP
Howard, J. RB 2-34/0 - - - - - - 1-16/0 - 1-18/0 -
Cottrell, N. RB 3-12/0 - 1-6/0 - - - - 2-6/0 - - -
Mason, J. RB 1-2/0 - - 1-2/0 - - - - - - -
Benson, K. RB 1--2/0 1--2/0 - DNP DNP DNP DNP DNP DNP DNP DNP

2018 Georgia Tech Football
Georgia Tech Total Tackles Game-by-Game (as of Nov 13, 2018)
All games
Total Tackles UA-A Total ALCN USF UP CU BG LOU DU VT NC UM
Rivera, M. DB 27-23 50 0 - 1 4 - 3 1 - 0 6 - 0 2 - 8 1 - 0 4 - 2 1 - 2 5 - 5 3 - 2
Mitchell, B. LB 25-23 48 2 - 1 2 - 1 3 - 2 0 - 3 2 - 6 2 - 2 4 - 0 0 - 1 3 - 6 7 - 1
Johnson, J. DB 27-15 42 2 - 0 4 - 2 1 - 1 2 - 2 1 - 1 0 - 1 0 - 3 4 - 0 5 - 4 8 - 1
Saint-Amour, A. DL 24-14 38 1 - 1 2 - 0 4 - 0 1 - 0 2 - 1 5 - 1 2 - 2 2 - 2 3 - 6 2 - 1
Thomas, C. DB 23-15 38 3 - 0 - D N P D N P 4 - 4 1 - 1 3 - 3 6 - 3 3 - 4 3 - 0
Carpenter, T. DB 25-11 36 0 - 2 1 - 0 5 - 0 5 - 3 5 - 1 1 - 0 2 - 1 3 - 1 - 3 - 3
Curry, D. LB 20-15 35 3 - 1 4 - 2 1 - 1 1 - 2 1 - 1 1 - 4 1 - 0 3 - 0 3 - 4 2 - 0
Kerr, A. DB 21-7 28 2 - 1 6 - 1 2 - 0 2 - 1 6 - 3 1 - 0 1 - 0 - 0 - 1 1 - 0
Branch, D. DL 8-16 24 1 - 0 2 - 2 2 - 0 1 - 4 0 - 1 0 - 2 2 - 1 0 - 1 0 - 4 0 - 1
Cerge-Henderson DL 9-15 24 1 - 1 4 - 2 - 1 - 1 0 - 4 1 - 3 1 - 3 0 - 1 - 1 - 0
Simmons, L. DB 18-6 24 D N P - 1 - 0 4 - 3 4 - 1 D N P 1 - 0 2 - 1 4 - 1 2 - 0
Oliver, K. DB 9-10 19 2 - 2 2 - 2 2 - 1 - 0 - 2 - 0 - 1 3 - 0 0 - 2 -
Jordan-Swilling LB 13-6 19 D N P D N P 3 - 0 1 - 0 2 - 1 1 - 0 3 - 5 3 - 0 - -
Askew, J. DB 14-4 18 1 - 1 4 - 2 2 - 0 D N P D N P 5 - 0 1 - 1 1 - 0 - -
Alexander, V. LB 10-7 17 0 - 1 1 - 1 0 - 1 5 - 2 1 - 2 3 - 0 - D N P - -
Swilling, T. DB 13-4 17 1 - 0 - 1 - 0 D N P - 4 - 2 3 - 0 1 - 0 3 - 2 -
Owens, A. DL 10-7 17 4 - 0 0 - 1 0 - 1 1 - 2 1 - 2 - - 1 - 0 1 - 1 2 - 0
Adams, B. DL 9-7 16 1 - 1 - 1 - 1 1 - 1 2 - 1 1 - 0 1 - 2 1 - 0 0 - 1 1 - 0
Campbell, C. DB 9-6 15 1 - 0 2 - 1 2 - 1 0 - 1 0 - 1 4 - 0 0 - 1 0 - 1 - -
Jackson, Q. LB 9-6 15 1 - 2 2 - 1 1 - 0 - 2 - 2 2 - 0 0 - 1 1 - 0 - -
Thomas, J. DB 9-3 12 - 3 - 0 - 2 - 0 0 - 1 1 - 0 - 1 - 1 2 - 1 -
Henderson, J. LB 8-4 12 2 - 1 1 - 1 0 - 1 3 - 0 2 - 1 - - - D N P D N P
Domineck, J. LB 4-1 5 - 3 - 1 1 - 0 D N P D N P D N P D N P D N P D N P D N P
Martin, C. DL 2-2 4 - 0 - 1 - - 2 - 1 D N P D N P D N P D N P D N P
Glanton, B. DL 1-3 4 - - D N P - 1 - 1 - D N P D N P 0 - 2 D N P
Walton, Z. DB 3-1 4 - - D N P 2 - 0 D N P D N P D N P 1 - 1 D N P D N P
Showell, A. DB 3-0 3 D N P D N P - - - 3 - 0 - D N P D N P D N P
Jackson, T. LB 2-1 3 - D N P - - 1 - 0 - D N P D N P - 1 - 1
Davis, S. 2-0 2 - - - - - 2 - 0 - - - -
King, J. DB 2-0 2 - - D N P D N P 2 - 0 D N P D N P D N P D N P D N P
Cole, J. DB 1-1 2 1 - 0 - - 0 - 1 - D N P D N P D N P D N P D N P
Jarrett, O. 1-1 2 - D N P - - 0 - 1 - D N P D N P 1 - 0 D N P
Griffin, Q. DL 2-0 2 2 - 0 D N P D N P D N P D N P D N P D N P D N P - D N P
Dingle, J. LB 1-0 1 - 1 - 0 - - D N P D N P D N P D N P D N P D N P
Lee, J. 1-0 1 - 1 - 0 - - - - D N P - - -
Ivemeyer, B. 1-0 1 - D N P 1 - 0 - - - - - D N P D N P
Roberts, Z. 0-1 1 - D N P - - - D N P - 0 - 1 - -
Chimedza, T.K. DL 1-0 1 - D N P D N P D N P D N P D N P 1 - 0 D N P D N P -
Smith, Devin DB 1-0 1 D N P D N P D N P D N P - 1 - 0 D N P D N P D N P D N P
Dawson, K. DL 0-1 1 D N P D N P D N P D N P 0 - 1 D N P D N P - D N P D N P
Searcy, Q. 1-0 1 - 1 - 0 - - - - - - - -

2018 Georgia Tech Football
Georgia Tech Team Game-by-Game (as of Nov 06, 2018)
All games
TEAM STATISTICS
Rushing Receiving Passing Kick Returns Punt Returns tot
Date Opponent no. yds td lg no. yds td lg cmp-att-int yds td lg no. yds td lg no. yds td lg off
Sep 01 ALCORN ST. 54 439 4 56 9 104 1 25 9-18-1 104 1 25 1 10 0 10 3 31 0 25 543
Sep 08 at USF 57 419 4 46 9 183 1 81 9-18-2 183 1 81 6 134 0 38 1 11 0 11 602
Sep 15 at Pitt 56 320 3 42 6 66 0 20 6-15-1 66 0 20 0 0 0 0 2 22 0 15 386
Sep 22 CLEMSON 56 146 2 39 3 57 1 29 3-8-0 57 1 29 1 12 0 12 1 1 0 1 203
Sep 29 BOWLING GREEN 49 372 8 62 5 160 0 41 5-7-0 160 0 41 4 76 0 26 1 3 0 3 532
Oct 05 at Louisville 65 542 8 65 1 12 0 12 1-2-0 12 0 12 2 39 0 21 0 0 0 0 554
Oct 13 DUKE 61 229 1 26 7 125 1 32 7-17-0 125 1 32 3 38 0 19 2 10 0 8 354
Oct 25 at Virginia Tech 78 465 7 16 0 0 0 0 0-1-0 0 0 0 0 0 0 0 0 0 0 0 465
Nov 03 at North Carolina 74 461 4 52 2 104 1 86 2-2-0 104 1 86 1 24 0 24 1 12 0 12 565
Nov 10 MIAMI (FLA.) 53 230 2 34 3 73 1 31 3-4-0 73 1 31 3 64 0 26 1 1 0 1 303
Georgia Tech 603 3623 43 65 45 884 6 86 45-92-4 884 6 86 21 397 0 38 12 91 0 25 4507
Opponents 324 1383 17 46 191 2180 16 60 191-303-1 2180 16 60 42 112 2 98 7 32 0 18 3563
Games: 10 • Avg/rush: 6.0 • Avg/catch: 19.6 • Pass effic: 142.45 • KR avg: 18.9 • PR avg: 7.6 • All purpose avg/game: 522.6 • Total offense avg/gm: 450.7
Tackles Sacks Fumble Pass Defense blkd PAT Attempts off
Date Opponent ua a total tfl-yds no-yds ff fr-yds int-yds qbh brup kick kick rush rcv saf t/o pts
Sep 0 ALCORN ST. 31 16 47 4.0-21 1.0-3 2 2-15 1-25 0 1 0 5-6 0 0 0 7 41
Sep 0 at USF 50 24 74 5.0-17 2.0-10 0 0-0 1-0 0 2 0 5-5 0 0 0 3 38
Sep 1 at Pitt 34 10 44 3.0-4 0.0-0 1 0-0 1-42 2 3 0 1-2 0 0 0 6 19
Sep 2 CLEMSON 38 26 64 1.0-6 1.0-6 0 0-0 2-44 1 4 0 3-3 0 0 0 14 21
Sep 2 BOWLING GREEN 43 48 91 6.0-28 2.0-23 1 1-21 2-3 5 4 0 9-9 0 0 0 14 63
Oct 05 at Louisville 40 16 56 3.0-18 2.0-12 2 2-7 1-95 7 3 0 9-9 0 0 0 21 66
Oct 13 DUKE 30 26 56 6.0-28 4.0-24 2 2-6 1-0 2 2 0 2-2 0 0 0 7 14
Oct 25 at Virginia Tech 34 16 50 4.0-16 1.0-9 0 1-0 0-0 2 0 0 7-7 0 0 0 7 49
Nov 0 at North Carolina 33 44 77 7.0-23 0.0-0 0 0-0 3-22 6 1 0 5-5 0 0 0 17 38
Nov 1 MIAMI (FLA.) 36 10 46 4.0-7 1.0-3 1 3-3 0-0 1 3 0 3-3 0 0 0 13 27
Georgia Tech 369 236 605 43.0-168 14.0-90 9 11-52 12-231 26 23 0 49-51 0 0 0 109 376
Opponents 451 306 757 53.0-164 11.0-66 17 12-24 4-47 9 6 0 36-36 0 1 0 59 275
Punting Field Goals Kickoffs
Date Opponent no. yds avg long blkd tb fc 50+ i20 md-att long blkd no. yds avg tb ob
Sep 0 ALCORN ST. 1 48 48.0 48 0 0 1 0 0 0-1 0 0 7 376 53.7 2 0
Sep 0 at USF 2 72 36.0 62 0 0 0 1 0 1-1 35 0 7 404 57.7 1 0
Sep 1 at Pitt 4 165 41.2 47 0 1 2 0 1 0-1 0 0 3 195 65.0 3 0
Sep 2 CLEMSON 6 291 48.5 58 0 1 1 3 1 0-1 0 0 4 229 57.2 1 0
Sep 2 BOWLING GREEN 1 53 53.0 53 0 0 0 1 1 0-0 0 0 10 616 61.6 4 0
Oct 05 at Louisville 0 0 0.0 0 0 0 0 0 0 1-1 41 0 11 717 65.2 3 0
Oct 13 DUKE 4 185 46.2 58 0 0 0 2 3 0-0 0 0 3 129 43.0 0 0
Oct 25 at Virginia Tech 2 85 42.5 43 0 0 0 0 1 0-0 0 0 8 500 62.5 1 1
Nov 0 at North Carolina 1 45 45.0 45 0 0 0 0 1 1-1 22 0 7 422 60.3 1 0
Nov 1 MIAMI (FLA.) 3 142 47.3 54 0 0 1 2 2 2-2 38 0 6 360 60.0 0 0
Georgia Tech 24 1086 45.2 62 0 2 5 9 10 5-8 41 0 66 3948 59.8 16 1
Opponents 40 1581 39.5 57 0 2 15 5 15 5-5 46 0 51 3015 59.1 24 1

2018 Georgia Tech Football
Georgia Tech Opponent Game-by-Game (as of Nov 06, 2018)
All games
OPPONENT STATISTICS
Rushing Receiving Passing Kick Returns Punt Returns tot
Date Opponent no. yds td lg no. yds td lg cmp-att-int yds td lg no. yds td lg no. yds td lg off
Sep 01 ALCORN ST. 28 77 0 10 15 69 0 9 15-23-1 69 0 9 2 32 0 17 0 0 0 0 146
Sep 08 at USF 44 224 3 22 21 202 2 24 21-31-1 202 2 24 6 266 2 98 1 0 0 0 426
Sep 15 at Pitt 31 138 3 31 16 197 0 60 16-23-1 197 0 60 0 0 0 0 0 0 0 0 335
Sep 22 CLEMSON 36 248 2 30 19 232 4 53 19-30-2 232 4 53 2 58 0 32 2 32 0 18 480
Sep 29 BOWLING GREEN 38 63 1 14 29 330 1 30 29-49-2 330 1 30 5 103 0 29 0 0 0 0 393
Oct 05 at Louisville 23 113 1 25 27 370 3 42 27-44-1 370 3 42 8 191 0 37 0 0 0 0 483
Oct 13 DUKE 33 98 1 18 17 206 3 48 17-27-1 206 3 48 2 74 0 46 1 3 0 3 304
Oct 25 at Virginia Tech 25 122 2 24 15 201 2 46 15-22-0 201 2 46 6 137 0 28 2 3 0 3 323
Nov 03 at North Carolina 36 166 1 46 18 208 1 44 18-31-3 208 1 44 5 118 0 31 0 0 0 0 374
Nov 10 MIAMI (FLA.) 30 134 3 22 14 165 0 27 14-23-0 165 0 27 6 144 0 52 1 -6 0 0 299
Opponents 324 1383 17 46 191 2180 16 60 191-303-1 2180 16 60 42 112 2 98 7 32 0 18 3563
Georgia Tech 603 3623 43 65 45 884 6 86 45-92-4 884 6 86 21 397 0 38 12 91 0 25 4507
Games: 10 • Avg/rush: 4.3 • Avg/catch: 11.4 • Pass effic: 132.98 • KR avg: 26.7 • PR avg: 4.6 • All purpose avg/game: 476.5 • Total offense avg/gm: 356.3
Tackles Sacks Fumble Pass Defense blkd PAT Attempts off
Date Opponent ua a total tfl-yds no-yds ff fr-yds int-yds qbh brup kick kick rush rcv saf t/o pts
Sep 0 ALCORN ST. 41 30 71 4.0-13 0.0-0 0 2-0 1-3 1 1 0 0-0 0 0 0 0 0
Sep 0 at USF 48 36 84 6.0-16 2.0-10 1 1-0 2-24 0 2 0 7-7 0 0 0 14 49
Sep 1 at Pitt 46 22 68 5.0-18 1.0-8 2 1-0 1-20 5 1 0 3-3 0 0 0 0 24
Sep 2 CLEMSON 43 22 65 10.0-41 4.0-21 3 1-4 0-0 1 1 0 7-7 0 0 0 7 49
Sep 2 BOWLING GREEN 35 26 61 1.0-2 0.0-0 0 0-0 0-0 0 0 0 2-2 0 0 0 0 17
Oct 05 at Louisville 47 26 73 1.0-4 0.0-0 0 0-0 0-0 0 0 0 4-4 0 0 0 0 31
Oct 13 DUKE 48 42 90 12.0-36 3.0-22 5 3-0 0-0 1 1 0 4-4 0 0 0 21 28
Oct 25 at Virginia Tech 50 34 84 2.0-6 1.0-5 0 0-0 0-0 0 0 0 4-4 0 0 0 0 28
Nov 0 at North Carolina 43 60 103 5.0-10 0.0-0 4 3-20 0-0 0 0 0 2-2 0 1 0 10 28
Nov 1 MIAMI (FLA.) 50 8 58 7.0-18 0.0-0 2 1-0 0-0 1 0 0 3-3 0 0 0 7 21
Opponents 451 306 757 53.0-164 11.0-66 17 12-24 4-47 9 6 0 36-36 0 1 0 59 275
Georgia Tech 369 236 605 43.0-168 14.0-90 9 11-52 12-231 26 23 0 49-51 0 0 0 109 376
Punting Field Goals Kickoffs
Date Opponent no. yds avg long blkd tb fc 50+ i20 md-att long blkd no. yds avg tb ob
Sep 0 ALCORN ST. 9 372 41.3 51 0 1 1 2 4 0-0 0 0 1 52 52.0 0 0
Sep 0 at USF 3 116 38.7 44 0 1 1 0 1 0-0 0 0 8 468 58.5 2 0
Sep 1 at Pitt 6 234 39.0 45 0 0 3 0 2 1-1 33 0 5 325 65.0 5 0
Sep 2 CLEMSON 3 122 40.7 46 0 0 1 0 1 0-0 0 0 8 495 61.9 6 0
Sep 2 BOWLING GREEN 3 93 31.0 41 0 0 1 0 0 1-1 29 0 4 211 52.8 0 0
Oct 05 at Louisville 2 83 41.5 42 0 0 2 0 1 1-1 46 0 5 295 59.0 2 0
Oct 13 DUKE 3 150 50.0 57 0 0 1 2 1 0-0 0 0 5 284 56.8 0 1
Oct 25 at Virginia Tech 4 166 41.5 47 0 0 4 0 1 0-0 0 0 5 325 65.0 5 0
Nov 0 at North Carolina 3 120 40.0 52 0 0 0 1 2 2-2 25 0 6 337 56.2 3 0
Nov 1 MIAMI (FLA.) 4 125 31.2 35 0 0 1 0 2 0-0 0 0 4 223 55.8 1 0
Opponents 40 1581 39.5 57 0 2 15 5 15 5-5 46 0 51 3015 59.1 24 1
Georgia Tech 24 1086 45.2 62 0 2 5 9 10 5-8 41 0 66 3948 59.8 16 1

2018 Georgia Tech Football
Georgia Tech Team Game-by-Game Comparison (as of Nov 06, 2018)
All games
First Downs Rushing Passing Total Offense Return Turn-
Opponent Score Total Rush Pass Pen Number-Yards Comp-Att-Int Yards Plays-Yards Yards Overs
ALCORN ST. 41 - 0 25 / 9 20 / 5 4 / 3 1 / 1 54-439 / 28-77 9-18-1 / 15-23-1 104 / 69 72-543 / 51-146 81 / 35 3 / 3
USF 38 - 49 27 / 29 19 / 13 6 / 13 2 / 3 57-419 / 44-224 9-18-2 / 21-31-1 183 / 202 75-602 / 75-426 145 / 290 3 / 1
Pitt 19 - 24 22 / 16 16 / 6 4 / 8 2 / 2 56-320 / 31-138 6-15-1 / 16-23-1 66 / 197 71-386 / 54-335 64 / 20 2 / 1
CLEMSON 21 - 49 15 / 25 10 / 14 2 / 10 3 / 1 56-146 / 36-248 3-8-0 / 19-30-2 57 / 232 64-203 / 66-480 57 / 94 1 / 2
BOWLING GREEN 63 - 17 23 / 25 16 / 7 5 / 17 2 / 1 49-372 / 38-63 5-7-0 / 29-49-2 160 / 330 56-532 / 87-393 103 / 103 0 / 3
Louisville 66 - 31 28 / 23 27 / 7 1 / 14 0 / 2 65-542 / 23-113 1-2-0 / 27-44-1 12 / 370 67-554 / 67-483 141 / 191 0 / 3
DUKE 14 - 28 20 / 19 14 / 10 5 / 9 1 / 0 61-229 / 33-98 7-17-0 / 17-27-1 125 / 206 78-354 / 60-304 54 / 77 3 / 3
Virginia Tech 49 - 28 35 / 16 31 / 7 0 / 8 4 / 1 78-465 / 25-122 0-1-0 / 15-22-0 0 / 201 79-465 / 47-323 0 / 140 0 / 1
North Carolina 38 - 28 27 / 19 24 / 9 2 / 10 1 / 0 74-461 / 36-166 2-2-0 / 18-31-3 104 / 208 76-565 / 67-374 58 / 138 3 / 3
MIAMI (FLA.) 27 - 21 15 / 13 12 / 7 3 / 6 0 / 0 53-230 / 30-134 3-4-0 / 14-23-0 73 / 165 57-303 / 53-299 68 / 138 1 / 3
Totals 37 - 27 23 / 19 18 / 85 32 / 98 16 / 11 603-362 / 324-138 45-92-4 / 191-303-1 884 / 218 695-450 / 627-356 771 / 1226 16 / 23
3rd Down 4th Down Time of TOP Avg Avg Avg Punting Penalties
Opponent Conversions Conversions Possession Margin Yds/Rush Yds/Pass Yds/Play Number-Avg Number-Yards Sacks
ALCORN ST. 8-12 / 2-11 0-1 / 0-0 31:50 / 28:10 3 : 4 0 8.1 / 2.8 5.8 / 3.0 7.5 / 2.9 1-48.0 / 9-41.3 3-30 / 3-20 1 / 0
USF 3-12 / 6-11 2-3 / 1-2 35:32 / 24:28 1 1 : 0 4 7.4 / 5.1 10.2 / 6.5 8.0 / 5.7 2-36.0 / 3-38.7 8-80 / 5-36 2 / 2
Pitt 4-13 / 5-12 1-3 / 0-0 31:49 / 28:11 3 : 3 8 5.7 / 4.5 4.4 / 8.6 5.4 / 6.2 4-41.2 / 6-39.0 5-35 / 4-38 0 / 1
CLEMSON 4-15 / 5-9 2-3 / 0-0 36:05 / 23:55 1 2 : 1 0 2.6 / 6.9 7.1 / 7.7 3.2 / 7.3 6-48.5 / 3-40.7 4-30 / 6-68 1 / 4
BOWLING GREEN 4-7 / 11-19 1-1 / 2-3 26:40 / 33:20 -6:40 7.6 / 1.7 22.9 / 6.7 9.5 / 4.5 1-53.0 / 3-31.0 3-54 / 5-26 2 / 0
Louisville 6-7 / 7-12 0-0 / 2-3 33:31 / 26:29 7 : 0 2 8.3 / 4.9 6.0 / 8.4 8.3 / 7.2 0-0.0 / 2-41.5 4-50 / 4-35 2 / 0
DUKE 8-17 / 5-10 1-4 / 0-2 36:20 / 23:40 1 2 : 4 0 3.8 / 3.0 7.4 / 7.6 4.5 / 5.1 4-46.2 / 3-50.0 3-18 / 3-15 4 / 3
Virginia Tech 5-9 / 2-8 1-1 / 1-2 42:18 / 17:42 2 4 : 3 6 6.0 / 4.9 0.0 / 9.1 5.9 / 6.9 2-42.5 / 4-41.5 6-50 / 8-87 1 / 1
North Carolina 4-11 / 8-14 2-4 / 0-0 36:12 / 23:48 1 2 : 2 4 6.2 / 4.6 52.0 / 6.7 7.4 / 5.6 1-45.0 / 3-40.0 3-20 / 1-10 0 / 0
MIAMI (FLA.) 9-16 / 9-15 1-1 / 1-1 34:45 / 25:08 9 : 3 7 4.3 / 4.5 18.2 / 7.2 5.3 / 5.6 3-47.3 / 4-31.2 3-35 / 7-49 1 / 0
Totals 55-11 / 60-12 11-21 / 7-13 345:02 / 254:51 9 0 : 1 1 6.0 / 4.3 9.6 / 7.2 6.5 / 5.7 24-45.2 / 40-39.5 42-40 / 46-38 14 / 11
Note: Game totals are displayed in the format TEAM/OPPONENT for each category

2018 Georgia Tech Football
Georgia Tech By-Quarter Statistics (as of Nov 13, 2018)
All games
3rd-Down Conversions
Date Opponent Score Overall 1st Qtr 2nd Qtr 3rd Qtr 4th Qtr Overtime
Sep 01, 201 ALCORN ST. 41-0 8-12 66.7 1-2 50.0 4-5 80.0 1-1 100.0 2-4 50.0
Sep 08, 201 at USF L 38-49 3-12 25.0 1-2 50.0 0-3 0.0 1-1 100.0 1-6 16.7
Sep 15, 201 at Pitt L 19-24 4-13 30.8 0-3 0.0 1-4 25.0 2-4 50.0 1-2 50.0
Sep 22, 201 CLEMSON L 21-49 4-15 26.7 1-4 25.0 1-4 25.0 1-3 33.3 1-4 25.0
Sep 29, 201 BOWLING GREEN 63-17 4-7 57.1 2-3 66.7 1-1 100.0 1-1 100.0 0-2 0.0
Oct 05, 201 at Louisville 66-31 6-7 85.7 2-2 100.0 1-2 50.0 3-3 100.0 0-0 0.0
Oct 13, 201 DUKE L 14-28 8-17 47.1 1-4 25.0 1-4 25.0 2-3 66.7 4-6 66.7
Oct 25, 201 at Virginia Tech 49-28 5-9 55.6 3-4 75.0 0-1 0.0 1-2 50.0 1-2 50.0
Nov 03, 201 at North Carolina 38-28 4-11 36.4 1-2 50.0 1-3 33.3 1-2 50.0 1-4 25.0
Nov 10, 201 MIAMI (FLA.) 27-21 9-16 56.2 2-3 66.7 1-3 33.3 2-4 50.0 4-6 66.7
Georgia Tech 55-11 46.2 14-29 48.3 11-30 36.7 15-24 62.5 15-36 41.7 0-0 0.0
Opponents 60-12 49.6 10-27 37.0 24-42 57.1 11-23 47.8 15-29 51.7 0-0 0.0
4th-Down Conversions
Date Opponent Score Overall 1st Qtr 2nd Qtr 3rd Qtr 4th Qtr Overtime
Sep 01, 201 ALCORN ST. 41-0 0-1 0.0 0-0 0.0 0-0 0.0 0-0 0.0 0-1 0.0
Sep 08, 201 at USF L 38-49 2-3 66.7 0-0 0.0 0-1 0.0 0-0 0.0 2-2 100.0
Sep 15, 201 at Pitt L 19-24 1-3 33.3 0-1 0.0 0-1 0.0 0-0 0.0 1-1 100.0
Sep 22, 201 CLEMSON L 21-49 2-3 66.7 0-0 0.0 0-0 0.0 1-1 100.0 1-2 50.0
Sep 29, 201 BOWLING GREEN 63-17 1-1 100.0 1-1 100.0 0-0 0.0 0-0 0.0 0-0 0.0
Oct 05, 201 at Louisville 66-31 0-0 0.0 0-0 0.0 0-0 0.0 0-0 0.0 0-0 0.0
Oct 13, 201 DUKE L 14-28 1-4 25.0 0-1 0.0 0-1 0.0 0-0 0.0 1-2 50.0
Oct 25, 201 at Virginia Tech 49-28 1-1 100.0 1-1 100.0 0-0 0.0 0-0 0.0 0-0 0.0
Nov 03, 201 at North Carolina 38-28 2-4 50.0 0-0 0.0 1-2 50.0 0-0 0.0 1-2 50.0
Nov 10, 201 MIAMI (FLA.) 27-21 1-1 100.0 1-1 100.0 0-0 0.0 0-0 0.0 0-0 0.0
Georgia Tech 11-21 52.4 3-5 60.0 1-5 20.0 1-1 100.0 6-10 60.0 0-0 0.0
Opponents 7-13 53.8 1-4 25.0 1-2 50.0 0-0 0.0 5-7 71.4 0-0 0.0
Time of Possession
Date Opponent Score Overall 1st Qtr 2nd Qtr 3rd Qtr 4th Qtr Overtime
Sep 01, 201 ALCORN ST. 41-0 31:50 6:30 9:11 5:20 10:49
Sep 08, 201 at USF L 38-49 35:32 10:10 6:05 10:34 8:43
Sep 15, 201 at Pitt L 19-24 31:49 7:15 8:46 8:32 7:16
Sep 22, 201 CLEMSON L 21-49 36:05 11:27 9:10 6:10 9:18
Sep 29, 201 BOWLING GREEN 63-17 26:40 7:28 9:13 6:22 3:37
Oct 05, 201 at Louisville 66-31 33:31 9:38 6:53 10:07 6:53
Oct 13, 201 DUKE L 14-28 36:20 8:18 9:44 7:37 10:41
Oct 25, 201 at Virginia Tech 49-28 42:18 12:07 8:27 10:45 10:59
Nov 03, 201 at North Carolina 38-28 36:12 10:01 6:57 9:26 9:48
Nov 10, 201 MIAMI (FLA.) 27-21 34:45 8:01 7:05 9:12 10:27
Georgia Tech Total 345:02 90:55 81:31 84:05 88:31 0:00
Avg. 34:30 9:05 8:09 8:24 8:51 0:00
Opponents Total 254:58 59:05 68:29 65:55 61:29 0:00
Avg. 25:29 5:54 6:50 6:35 6:08 0:00

2018 Georgia Tech Football
Georgia Tech Red-Zone Results (as of Nov 06, 2018)
All games
Georgia Tech Inside Opponent Red-Zone
Times Times Total Rush Pass FGs Failed to score inside RZ
Date Opponent Score In RZ Score Pts TDs TDs TDs Made FGA Dow Int Fum Half Gam
Sep 01, 201 ALCORN ST. 41-0 5 3 20 3 3 0 0 0 1 0 1 0 0
Sep 08, 201 at USF L 38-49 6 4 24 3 3 0 1 0 0 0 1 1 0
Sep 15, 201 at Pitt L 19-24 3 3 19 3 3 0 0 0 0 0 0 0 0
Sep 22, 201 CLEMSON L 21-49 4 3 21 3 2 1 0 0 1 0 0 0 0
Sep 29, 201 BOWLING GREEN 63-17 5 5 35 5 5 0 0 0 0 0 0 0 0
Oct 05, 201 at Louisville 66-31 8 8 52 7 7 0 1 0 0 0 0 0 0
Oct 13, 201 DUKE L 14-28 3 1 7 1 1 0 0 0 2 0 0 0 0
Oct 25, 201 at Virginia Tech 49-28 7 7 49 7 7 0 0 0 0 0 0 0 0
Nov 03, 201 at North Carolina 38-28 7 5 31 4 4 0 1 0 1 0 1 0 0
Nov 10, 201 MIAMI (FLA.) 27-21 3 2 10 1 1 0 1 0 0 0 0 1 0
Totals 51 41 268 37 36 1 4 0 5 0 3 2 0
41 of 51 (80.4%)
Opponents Inside Georgia Tech Red-Zone
Times Times Total Rush Pass FGs Failed to score inside RZ
Date Opponent Score In RZ Score Pts TDs TDs TDs Made FGA Dow Int Fum Half Gam
Sep 01, 201 ALCORN ST. 41-0 0 0 0 0 0 0 0 0 0 0 0 0 0
Sep 08, 201 at USF L 38-49 6 5 35 5 3 2 0 0 1 0 0 0 0
Sep 15, 201 at Pitt L 19-24 3 3 17 2 2 0 1 0 0 0 0 0 0
Sep 22, 201 CLEMSON L 21-49 3 3 21 3 1 2 0 0 0 0 0 0 0
Sep 29, 201 BOWLING GREEN 63-17 3 2 10 1 1 0 1 0 0 1 0 0 0
Oct 05, 201 at Louisville 66-31 2 1 7 1 1 0 0 0 0 1 0 0 0
Oct 13, 201 DUKE L 14-28 5 3 21 3 1 2 0 0 0 0 2 0 0
Oct 25, 201 at Virginia Tech 49-28 2 2 14 2 2 0 0 0 0 0 0 0 0
Nov 03, 201 at North Carolina 38-28 4 4 21 2 1 1 2 0 0 0 0 0 0
Nov 10, 201 MIAMI (FLA.) 27-21 2 2 14 2 2 0 0 0 0 0 0 0 0
Totals 30 25 160 21 14 7 4 0 1 2 2 0 0
25 of 30 (83.3%)

2018 Georgia Tech Football
Georgia Tech Game Superlatives (as of Nov 13, 2018)
All games
INDIVIDUAL GAME HIGHS
Rushes 40 Tobias Oliver at Virginia Tech (Oct 25, 2018)
Yards Rushing 215 Tobias Oliver at Virginia Tech (Oct 25, 2018)
TD Rushes 3 Tobias Oliver at USF (Sep 08, 2018)
3 Tobias Oliver at Virginia Tech (Oct 25, 2018)
3 Jordan Mason at Virginia Tech (Oct 25, 2018)
Long Rush 65 Tobias Oliver at Louisville (Oct 05, 2018)
Pass attempts 18 TaQuon Marshall vs Alcorn St. (Sep 01, 2018)
18 TaQuon Marshall at USF (Sep 08, 2018)
Pass completions 9 TaQuon Marshall vs Alcorn St. (Sep 01, 2018)
9 TaQuon Marshall at USF (Sep 08, 2018)
Yards Passing 183 TaQuon Marshall at USF (Sep 08, 2018)
TD Passes 1 TaQuon Marshall vs Alcorn St. (Sep 01, 2018)
1 TaQuon Marshall at USF (Sep 08, 2018)
1 Tobias Oliver vs Clemson (Sep 22, 2018)
1 TaQuon Marshall vs Duke (Oct 13, 2018)
1 Tobias Oliver at North Carolina (Nov 03, 2018)
1 TaQuon Marshall vs Miami (Fla.) (Nov 10, 2018)
Long Pass 86 Tobias Oliver at North Carolina (Nov 03, 2018)
Receptions 4 Brad Stewart vs Alcorn St. (Sep 01, 2018)
Yards Receiving 111 Clinton Lynch at USF (Sep 08, 2018)
TD Receptions 1 Brad Stewart vs Alcorn St. (Sep 01, 2018)
1 Clinton Lynch at USF (Sep 08, 2018)
1 Clinton Lynch vs Clemson (Sep 22, 2018)
1 Malachi Carter vs Duke (Oct 13, 2018)
1 Qua Searcy at North Carolina (Nov 03, 2018)
1 Brad Stewart vs Miami (Fla.) (Nov 10, 2018)
Long Reception 86 Qua Searcy at North Carolina (Nov 03, 2018)
Field Goals 2 Wesley Wells vs Miami (Fla.) (Nov 10, 2018)
Long Field Goal 41 Wesley Wells at Louisville (Oct 05, 2018)
Punts 6 Pressley Harvin III vs Clemson (Sep 22, 2018)
Punting Avg 53.0 Pressley Harvin III vs Bowling Green (Sep 29, 2018)
Long Punt 62 Pressley Harvin III at USF (Sep 08, 2018)
Punts inside 20 3 Pressley Harvin III vs Duke (Oct 13, 2018)
Long Punt Return 25 Juanyeh Thomas vs Alcorn St. (Sep 01, 2018)
Long Kickoff Return 38 Juanyeh Thomas at USF (Sep 08, 2018)
Tackles 10 Malik Rivera vs Bowling Green (Sep 29, 2018)
10 Malik Rivera at North Carolina (Nov 03, 2018)
Sacks 2.0 Kyle Cerge-Henderson at USF (Sep 08, 2018)
2.0 Anree Saint-Amour vs Duke (Oct 13, 2018)
Tackles For Loss 3.0 Kyle Cerge-Henderson at USF (Sep 08, 2018)
3.0 Jalen Johnson vs Miami (Fla.) (Nov 10, 2018)
Interceptions 1 Kaleb Oliver vs Alcorn St. (Sep 01, 2018)
1 Tariq Carpenter at USF (Sep 08, 2018)
1 Malik Rivera at Pitt (Sep 15, 2018)
1 Malik Rivera vs Clemson (Sep 22, 2018)
1 Desmond Branch vs Clemson (Sep 22, 2018)
1 David Curry vs Bowling Green (Sep 29, 2018)
1 Anree Saint-Amour vs Bowling Green (Sep 29, 2018)
1 Juanyeh Thomas at Louisville (Oct 05, 2018)
1 Lamont Simmons vs Duke (Oct 13, 2018)
1 Tre Swilling at North Carolina (Nov 03, 2018)
1 Tariq Carpenter at North Carolina (Nov 03, 2018)
1 Anree Saint-Amour at North Carolina (Nov 03, 2018)
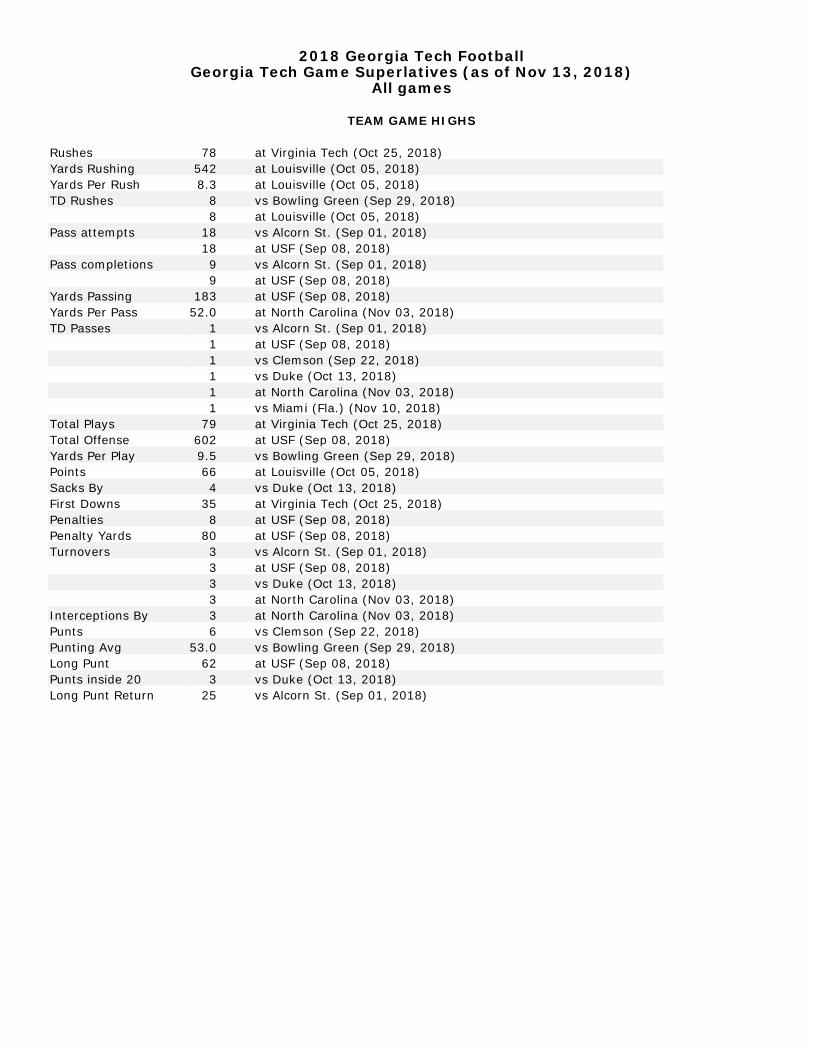
2018 Georgia Tech Football
Georgia Tech Game Superlatives (as of Nov 13, 2018)
All games
TEAM GAME HIGHS
Rushes 78 at Virginia Tech (Oct 25, 2018)
Yards Rushing 542 at Louisville (Oct 05, 2018)
Yards Per Rush 8.3 at Louisville (Oct 05, 2018)
TD Rushes 8 vs Bowling Green (Sep 29, 2018)
8 at Louisville (Oct 05, 2018)
Pass attempts 18 vs Alcorn St. (Sep 01, 2018)
18 at USF (Sep 08, 2018)
Pass completions 9 vs Alcorn St. (Sep 01, 2018)
9 at USF (Sep 08, 2018)
Yards Passing 183 at USF (Sep 08, 2018)
Yards Per Pass 52.0 at North Carolina (Nov 03, 2018)
TD Passes 1 vs Alcorn St. (Sep 01, 2018)
1 at USF (Sep 08, 2018)
1 vs Clemson (Sep 22, 2018)
1 vs Duke (Oct 13, 2018)
1 at North Carolina (Nov 03, 2018)
1 vs Miami (Fla.) (Nov 10, 2018)
Total Plays 79 at Virginia Tech (Oct 25, 2018)
Total Offense 602 at USF (Sep 08, 2018)
Yards Per Play 9.5 vs Bowling Green (Sep 29, 2018)
Points 66 at Louisville (Oct 05, 2018)
Sacks By 4 vs Duke (Oct 13, 2018)
First Downs 35 at Virginia Tech (Oct 25, 2018)
Penalties 8 at USF (Sep 08, 2018)
Penalty Yards 80 at USF (Sep 08, 2018)
Turnovers 3 vs Alcorn St. (Sep 01, 2018)
3 at USF (Sep 08, 2018)
3 vs Duke (Oct 13, 2018)
3 at North Carolina (Nov 03, 2018)
Interceptions By 3 at North Carolina (Nov 03, 2018)
Punts 6 vs Clemson (Sep 22, 2018)
Punting Avg 53.0 vs Bowling Green (Sep 29, 2018)
Long Punt 62 at USF (Sep 08, 2018)
Punts inside 20 3 vs Duke (Oct 13, 2018)
Long Punt Return 25 vs Alcorn St. (Sep 01, 2018)

2018 Georgia Tech Football
Georgia Tech Game Superlatives (as of Nov 13, 2018)
All games
OPPONENT INDIVIDUAL GAME HIGHS
Rushes 21 Jackson, D, vs Duke (Oct 13, 2018)
Yards Rushing 122 ETIENNE, vs Clemson (Sep 22, 2018)
TD Rushes 2 BARNETT, Blake, at USF (Sep 08, 2018)
2 Ollison, Q., at Pitt (Sep 15, 2018)
Long Rush 46 Carter, M, at North Carolina (Nov 03, 2018)
Pass attempts 44 DOEGE, Jarret, vs Bowling Green (Sep 29, 2018)
Pass completions 27 DOEGE, Jarret, vs Bowling Green (Sep 29, 2018)
Yards Passing 305 DOEGE, Jarret, vs Bowling Green (Sep 29, 2018)
TD Passes 4 T. LAWRENCE, vs Clemson (Sep 22, 2018)
Long Pass 60 Pickett, K., at Pitt (Sep 15, 2018)
Receptions 10 McCANTS, Tyre, at USF (Sep 08, 2018)
10 MILLER, Scott, vs Bowling Green (Sep 29, 2018)
Yards Receiving 117 MILLER, Scott, vs Bowling Green (Sep 29, 2018)
TD Receptions 2 Atwell, TuT., at Louisville (Oct 05, 2018)
Long Reception 60 Mack, T., at Pitt (Sep 15, 2018)
Field Goals 2 Jones, F, at North Carolina (Nov 03, 2018)
Long Field Goal 46 Creque, Bla., at Louisville (Oct 05, 2018)
Punts 9 McCullough, C., vs Alcorn St. (Sep 01, 2018)
Punting Avg 50.0 Parker, A, vs Duke (Oct 13, 2018)
Long Punt 57 Parker, A, vs Duke (Oct 13, 2018)
Punts inside 20 4 McCullough, C., vs Alcorn St. (Sep 01, 2018)
Long Punt Return 18 RODGERS, vs Clemson (Sep 22, 2018)
Long Kickoff Return 98 HORNE, Terrence, at USF (Sep 08, 2018)
Tackles 22 Holcomb, C, at North Carolina (Nov 03, 2018)
Sacks 2.0 Johnson, L, vs Duke (Oct 13, 2018)
Tackles For Loss 4.0 Rumph II, C, vs Duke (Oct 13, 2018)
Interceptions 1 Wilson, T., vs Alcorn St. (Sep 01, 2018)
1 HOGGINS, Ronnie, at USF (Sep 08, 2018)
1 SAWTELLE, Nico, at USF (Sep 08, 2018)
1 Motley, P., at Pitt (Sep 15, 2018)

2018 Georgia Tech Football
Georgia Tech Game Superlatives (as of Nov 13, 2018)
All games
OPPONENT TEAM GAME HIGHS
Rushes 44 at USF (Sep 08, 2018)
Yards Rushing 248 vs Clemson (Sep 22, 2018)
Yards Per Rush 6.9 vs Clemson (Sep 22, 2018)
TD Rushes 3 at USF (Sep 08, 2018)
3 at Pitt (Sep 15, 2018)
3 vs Miami (Fla.) (Nov 10, 2018)
Pass attempts 49 vs Bowling Green (Sep 29, 2018)
Pass completions 29 vs Bowling Green (Sep 29, 2018)
Yards Passing 370 at Louisville (Oct 05, 2018)
Yards Per Pass 9.1 at Virginia Tech (Oct 25, 2018)
TD Passes 4 vs Clemson (Sep 22, 2018)
Total Plays 87 vs Bowling Green (Sep 29, 2018)
Total Offense 483 at Louisville (Oct 05, 2018)
Yards Per Play 7.3 vs Clemson (Sep 22, 2018)
Points 49 at USF (Sep 08, 2018)
49 vs Clemson (Sep 22, 2018)
Sacks By 4 vs Clemson (Sep 22, 2018)
First Downs 29 at USF (Sep 08, 2018)
Penalties 8 at Virginia Tech (Oct 25, 2018)
Penalty Yards 87 at Virginia Tech (Oct 25, 2018)
Turnovers 3 vs Alcorn St. (Sep 01, 2018)
3 vs Bowling Green (Sep 29, 2018)
3 at Louisville (Oct 05, 2018)
3 vs Duke (Oct 13, 2018)
3 at North Carolina (Nov 03, 2018)
3 vs Miami (Fla.) (Nov 10, 2018)
Interceptions By 2 at USF (Sep 08, 2018)
Punts 9 vs Alcorn St. (Sep 01, 2018)
Punting Avg 50.0 vs Duke (Oct 13, 2018)
Long Punt 57 vs Duke (Oct 13, 2018)
Punts inside 20 4 vs Alcorn St. (Sep 01, 2018)
Long Punt Return 18 vs Clemson (Sep 22, 2018)