Geographical distribution, tree density and fruit production of Tamarindus indica L.(Fabaceae)...
14
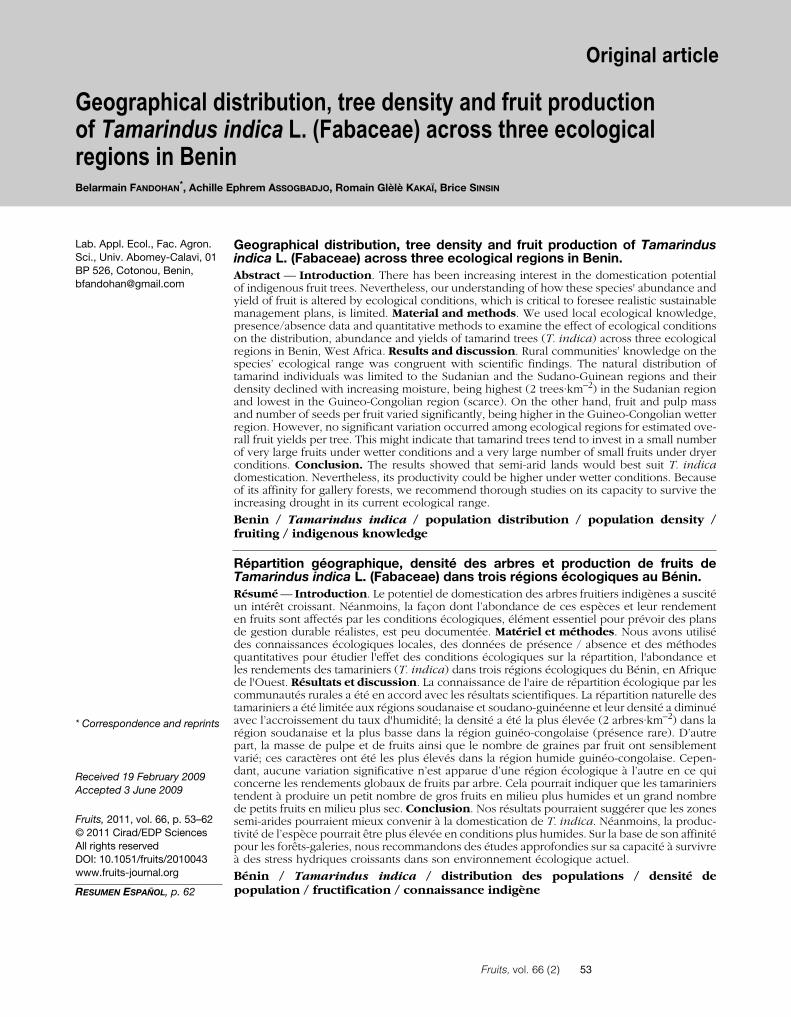
Original article Fruits, vol. 66 (2) 53 Geographical distribution, tree density and fruit production of Tamarindus indica L. (Fabaceae) across three ecological regions in Benin. Abstract –– Introduction. There has been increasing interest in the domestication potential of indigenous fruit trees. Nevertheless, our understanding of how these species' abundance and yield of fruit is altered by ecological conditions, which is critical to foresee realistic sustainable management plans, is limited. Material and methods. We used local ecological knowledge, presence/absence data and quantitative methods to examine the effect of ecological conditions on the distribution, abundance and yields of tamarind trees (T. indica) across three ecological regions in Benin, West Africa. Results and discussion. Rural communities’ knowledge on the species’ ecological range was congruent with scientific findings. The natural distribution of tamarind individuals was limited to the Sudanian and the Sudano-Guinean regions and their density declined with increasing moisture, being highest (2 trees·km –2 ) in the Sudanian region and lowest in the Guineo-Congolian region (scarce). On the other hand, fruit and pulp mass and number of seeds per fruit varied significantly, being higher in the Guineo-Congolian wetter region. However, no significant variation occurred among ecological regions for estimated ove- rall fruit yields per tree. This might indicate that tamarind trees tend to invest in a small number of very large fruits under wetter conditions and a very large number of small fruits under dryer conditions. Conclusion. The results showed that semi-arid lands would best suit T. indica domestication. Nevertheless, its productivity could be higher under wetter conditions. Because of its affinity for gallery forests, we recommend thorough studies on its capacity to survive the increasing drought in its current ecological range. Benin / Tamarindus indica / population distribution / population density / fruiting / indigenous knowledge Répartition géographique, densité des arbres et production de fruits de Tamarindus indica L. (Fabaceae) dans trois régions écologiques au Bénin. Résumé –– Introduction. Le potentiel de domestication des arbres fruitiers indigènes a suscité un intérêt croissant. Néanmoins, la façon dont l’abondance de ces espèces et leur rendement en fruits sont affectés par les conditions écologiques, élément essentiel pour prévoir des plans de gestion durable réalistes, est peu documentée. Matériel et méthodes. Nous avons utilisé des connaissances écologiques locales, des données de présence / absence et des méthodes quantitatives pour étudier l'effet des conditions écologiques sur la répartition, l'abondance et les rendements des tamariniers (T. indica) dans trois régions écologiques du Bénin, en Afrique de l'Ouest. Résultats et discussion. La connaissance de l'aire de répartition écologique par les communautés rurales a été en accord avec les résultats scientifiques. La répartition naturelle des tamariniers a été limitée aux régions soudanaise et soudano-guinéenne et leur densité a diminué avec l’accroissement du taux d'humidité; la densité a été la plus élevée (2 arbres·km –2 ) dans la région soudanaise et la plus basse dans la région guinéo-congolaise (présence rare). D’autre part, la masse de pulpe et de fruits ainsi que le nombre de graines par fruit ont sensiblement varié; ces caractères ont été les plus élevés dans la région humide guinéo-congolaise. Cepen- dant, aucune variation significative n’est apparue d’une région écologique à l’autre en ce qui concerne les rendements globaux de fruits par arbre. Cela pourrait indiquer que les tamariniers tendent à produire un petit nombre de gros fruits en milieu plus humides et un grand nombre de petits fruits en milieu plus sec. Conclusion. Nos résultats pourraient suggérer que les zones semi-arides pourraient mieux convenir à la domestication de T. indica. Néanmoins, la produc- tivité de l’espèce pourrait être plus élevée en conditions plus humides. Sur la base de son affinité pour les forêts-galeries, nous recommandons des études approfondies sur sa capacité à survivre à des stress hydriques croissants dans son environnement écologique actuel. Bénin / Tamarindus indica / distribution des populations / densité de population / fructification / connaissance indigène Lab. Appl. Ecol., Fac. Agron. Sci., Univ. Abomey-Calavi, 01 BP 526, Cotonou, Benin, [email protected] Geographical distribution, tree density and fruit production of Tamarindus indica L. (Fabaceae) across three ecological regions in Benin Belarmain FANDOHAN * , Achille Ephrem ASSOGBADJO, Romain Glèlè KAKAÏ, Brice SINSIN * Correspondence and reprints Received 19 February 2009 Accepted 3 June 2009 Fruits, 2011, vol. 66, p. 53–62 © 2011 Cirad/EDP Sciences All rights reserved DOI: 10.1051/fruits/2010043 www.fruits-journal.org RESUMEN ESPAÑOL, p. 62
-
Upload
leabenin-fsauac -
Category
Documents
-
view
5 -
download
0
Transcript of Geographical distribution, tree density and fruit production of Tamarindus indica L.(Fabaceae)...
Original article
Geographical distribution, tree density and fruit production of Tamarindus indica L. (Fabaceae) across three ecological regions in BeninBelarmain FANDOHAN*, Achille Ephrem ASSOGBADJO, Romain Glèlè KAKAÏ, Brice SINSIN
* Correspondence and reprints
Received 19 February 2009Accepted 3 June 2009
Fruits, 2011, vol. 66, p. 53–62© 2011 Cirad/EDP SciencesAll rights reservedDOI: 10.1051/fruits/2010043www.fruits-journal.org
RESUMEN ESPAÑOL, p. 62
Geographical distribution, tree density and fruit production of Tamarindusindica L. (Fabaceae) across three ecological regions in Benin.Abstract –– Introduction. There has been increasing interest in the domestication potentialof indigenous fruit trees. Nevertheless, our understanding of how these species' abundance andyield of fruit is altered by ecological conditions, which is critical to foresee realistic sustainablemanagement plans, is limited. Material and methods. We used local ecological knowledge,presence/absence data and quantitative methods to examine the effect of ecological conditionson the distribution, abundance and yields of tamarind trees (T. indica) across three ecologicalregions in Benin, West Africa. Results and discussion. Rural communities’ knowledge on thespecies’ ecological range was congruent with scientific findings. The natural distribution oftamarind individuals was limited to the Sudanian and the Sudano-Guinean regions and theirdensity declined with increasing moisture, being highest (2 trees·km–2) in the Sudanian regionand lowest in the Guineo-Congolian region (scarce). On the other hand, fruit and pulp massand number of seeds per fruit varied significantly, being higher in the Guineo-Congolian wetterregion. However, no significant variation occurred among ecological regions for estimated ove-rall fruit yields per tree. This might indicate that tamarind trees tend to invest in a small numberof very large fruits under wetter conditions and a very large number of small fruits under dryerconditions. Conclusion. The results showed that semi-arid lands would best suit T. indicadomestication. Nevertheless, its productivity could be higher under wetter conditions. Becauseof its affinity for gallery forests, we recommend thorough studies on its capacity to survive theincreasing drought in its current ecological range.
Benin / Tamarindus indica / population distribution / population density /fruiting / indigenous knowledge
Répartition géographique, densité des arbres et production de fruits deTamarindus indica L. (Fabaceae) dans trois régions écologiques au Bénin.Résumé –– Introduction. Le potentiel de domestication des arbres fruitiers indigènes a suscitéun intérêt croissant. Néanmoins, la façon dont l’abondance de ces espèces et leur rendementen fruits sont affectés par les conditions écologiques, élément essentiel pour prévoir des plansde gestion durable réalistes, est peu documentée. Matériel et méthodes. Nous avons utilisédes connaissances écologiques locales, des données de présence / absence et des méthodesquantitatives pour étudier l'effet des conditions écologiques sur la répartition, l'abondance etles rendements des tamariniers (T. indica) dans trois régions écologiques du Bénin, en Afriquede l'Ouest. Résultats et discussion. La connaissance de l'aire de répartition écologique par lescommunautés rurales a été en accord avec les résultats scientifiques. La répartition naturelle destamariniers a été limitée aux régions soudanaise et soudano-guinéenne et leur densité a diminuéavec l’accroissement du taux d'humidité; la densité a été la plus élevée (2 arbres·km–2) dans larégion soudanaise et la plus basse dans la région guinéo-congolaise (présence rare). D’autrepart, la masse de pulpe et de fruits ainsi que le nombre de graines par fruit ont sensiblementvarié; ces caractères ont été les plus élevés dans la région humide guinéo-congolaise. Cepen-dant, aucune variation significative n’est apparue d’une région écologique à l’autre en ce quiconcerne les rendements globaux de fruits par arbre. Cela pourrait indiquer que les tamarinierstendent à produire un petit nombre de gros fruits en milieu plus humides et un grand nombrede petits fruits en milieu plus sec. Conclusion. Nos résultats pourraient suggérer que les zonessemi-arides pourraient mieux convenir à la domestication de T. indica. Néanmoins, la produc-tivité de l’espèce pourrait être plus élevée en conditions plus humides. Sur la base de son affinitépour les forêts-galeries, nous recommandons des études approfondies sur sa capacité à survivreà des stress hydriques croissants dans son environnement écologique actuel.
Bénin / Tamarindus indica / distribution des populations / densité depopulation / fructification / connaissance indigène
Lab. Appl. Ecol., Fac. Agron.Sci., Univ. Abomey-Calavi, 01BP 526, Cotonou, Benin,[email protected]
Fruits, vol. 66 (2) 53
54
B. Fandohan et al.
1. Introduction
Until recently, little interest has beenshown in indigenous multipurpose tree spe-cies compared with their industrial timbercounterparts. Available information gener-ally lacks adequate quantitative analysis forthe development of economic opportunitiesbased on local resources as an alternative toexcessive import of exotic products. Thus,initiatives in agroforestry seek to integrateindigenous trees whose products have tra-ditionally been gathered from natural forestsinto tropical farming systems [1]. This is alsoto provide marketable products from farmsthat will generate income for resource-poorrural households. As such, it has led to anincreasing interest in the domesticationpotential of some traditionally valued agro-forestry trees in Africa, i.e., Detarium micro-carpum Harms [2], Irvingia gabonensis(Aubry Lecomte ex O'Rorke) Baill. [3] andSclerocarya birrea (A.Rich.) Hochst.) subsp.caffra (Sond.) [4], to cite just a few.
The growing number of studies on thedomestication potential of indigenous treeshave provided information about morpho-logical and genetic diversity [5, 6], potentialproductivity [7] and nutritional and medici-nal properties [8]. However, as local envi-ronmental conditions influence variation inplants [9], domestication programs shouldalso consider the impact of ecological fac-tors on distribution, abundance and fruitingpotential of the targeted species. Suchaspects are poorly explored but critical foridentification of priority sites for plantingand genetic improvement. In addition, suchinformation may highlight the extent towhich natural populations could supplymarket demand with products (i.e. freshfruit and pulp) depending on ecologicalconditions. Although a number of studieshave demonstrated that the distribution,abundance and fruiting potential of indige-nous multipurpose trees depend on envi-ronmental conditions [7, 10], the effect ofenvironmental conditions may vary withplant species. In addition, the accuracy ofabundance estimation may be stronglydependent on the method used and robuststatistical methods should be used when-ever possible.
T-Square sampling [11] is a distance-based sampling method which has beenused in ecology to estimate sizes and den-sities of many plant populations [12]. It is arobust method that can provide informativeresults even if no prior information existsabout the randomness or the uniformity ofthe spatial pattern of the species studied,and is especially suited to large-scale pop-ulation studies [13]. T-square sampling cantherefore be used to evaluate the abundanceof indigenous fruit trees or multipurposetrees nationwide or regionwide. In addition,recent ethnoecological studies advocate anintegration of local ecological knowledgeand ecological studies to advance ourunderstanding of ecological processes anddevelop better plans for sustainableresource use [14]. To enable such integra-tion, it is important to evaluate the congru-ence of local ecological knowledge withavailable scientific findings [14].
Tamarindus indica L. is a semi-ever-green tree widespread in the tropics (Africa,Asia, Madagascar, South America), featuringprominently in riparian habitats [15]. Inefforts to enhance the species’ geneticresource conservation and utilization, it hasrecently been identified as one of the topten agroforestry tree species to be priori-tized for future crop diversification pro-grams and development in sub-SaharanAfrica [16]. There has been extensive inter-est in tamarind's biochemical, medicinaland nutritional properties, reproductivebiology, morphology, cultivation and genet-ics [17]. Studies on the species in Asia, Africaand Latin America have documented itsdomestication potential in terms of socio-cultural and nutritional values, and aptitudefor seed and vegetative propagation [17].Tamarind’s global distribution map hasgiven strong evidence of its plasticity in thetropics [18]. Studies on the species’ nativepopulations in Africa have provided data onbiochemical analysis of its fruits [19], geneticdiversity, phenology, reproductive biologyincluding pollinators, biometrical charactersof seeds and seedlings [20–23], and impactof habitat type on its conservation status[24]. However, little scientific information isavailable on how ecological conditionslocally influence its distribution, abundance
Fruits, vol. 66 (2)
T. indica in three ecological regions of Benin
and productivity in Africa. In this study, weused LEK and ecological studies to examinethe distribution and productivity of tama-rind trees in Benin as a case study. The fol-lowing questions were addressed: (1) Whatis the distribution range and abundance ofT. indica in relation to the ecological con-ditions it lives in? (2) How do ecological andtree-level factors alter its productivity offresh fruits, pulp and seeds?
2. Materials and methods
2.1. Study area
Our study was conducted in Benin (WestAfrica). Ongoing work on the ecologicalniche of T. indica in Benin has confirmedthe presence of tamarind individuals in thethree ecological regions of the country(the Sudanian, Sudano-Guinean and sub-humid Guineo-Congolian regions [25]).Thus, this study was conducted nationwide(114 673 km²) [26].
In the Sudanian region (9°45’–12°25’ N),rainfall is unimodal. Mean annual rainfall isoften less than 1000 mm, the relative humid-ity varies between 18% and 99% (highest inAugust) and temperature varies between24 °C and 31 °C. The Sudanian region hashydromorphic soils, well-drained soils andlithosols.
In the Sudano-Guinean region (7°30’–9°45’ N), rainfall is unimodal, from May toOctober, and lasts for about 113 days withan annual total rainfall varying between900 mm and 1110 mm. Mean annual tem-perature ranges from 25 °C to 29 °C, and therelative humidity from 31% to 98%. The soilsin this zone are ferruginous.
In the Guineo-Congolian region (6°25’–7°30’ N), rainfall is bimodal with a meanannual rainfall of 1200 mm. Mean annualtemperature varies between 25 °C and 29 °Cand the relative humidity varies between69% and 97%. The soils are either deep fer-rallitic or rich in clay.
The principal ethnic groups are theDendi, Bariba, Fulani, Waama and Gour-mantché in the Sudanian region; the Fon,
Tchabè, Nago, Agnin and Idatcha in theSudano-Guinean region; and the Yoruba,Adja, Tori, Holi, Péda and Xwla in theGuineo-Congolian region. We focused onthese 16 aforementioned ethnic groups dur-ing this study because they were the mostancient in their locations throughout thestudy area.
2.2. Ethnoecological survey
Our survey aimed at documenting localperceptions about the distribution of tama-rind trees in Benin. We applied semi-struc-tured individual interviews to five traditionalhunters / healers and five Fulani herdersrandomly sampled within each of the77 state districts of Benin (770 respond-ents). The sampling was limited to personsof at least fifty, so that only experiencedinformants were questioned. We targetedFulani herders because they are culturallyassociated with the species and usually keepthe fruits during migrations (personal fieldobservation). The healers and hunters werechosen because of their local reputations inplant knowledge. These socio-professionalgroups are more likely to hold very inform-ative knowledge about the past and presentdistribution of the species. The followingquestions were asked: (i) As an indicator ofits presence in earlier times, we askedwhether tamarind had a local name in thelanguage of the most ancient indigenousethnic groups of each district; (ii) Is the spe-cies currently found in the natural vegeta-tion? If yes, in which habitats? (iii) Was thespecies present in the native vegetation inearlier times? If it was present in earlier timesbut is not currently present, then why hasit disappeared?
2.3. Characterizationof the distribution patternsand density of tamarind
In each of the 77 state districts, we madea visual confirmation of the species’ pres-ence/absence within protected areas, for-ests and farmlands, following unfixedtransect lines across natural vegetation, withthe help of transhumants or hunters recom-mended by local leaders.
Fruits, vol. 66 (2
) 55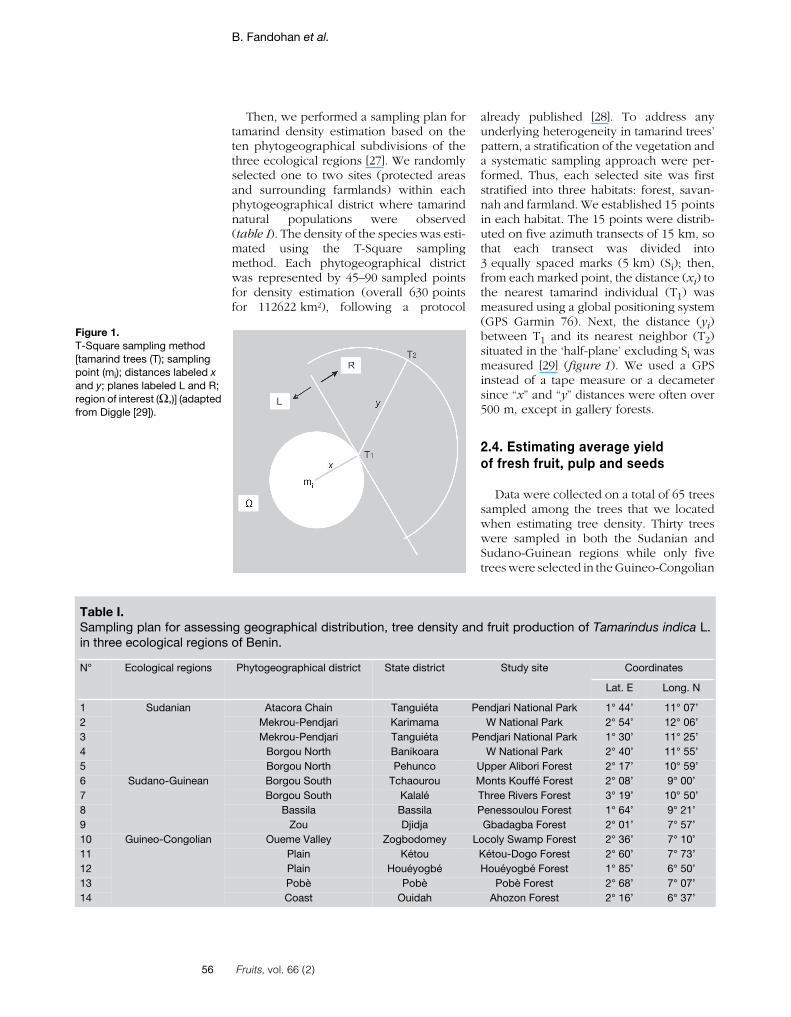
56
B. Fandohan et al.
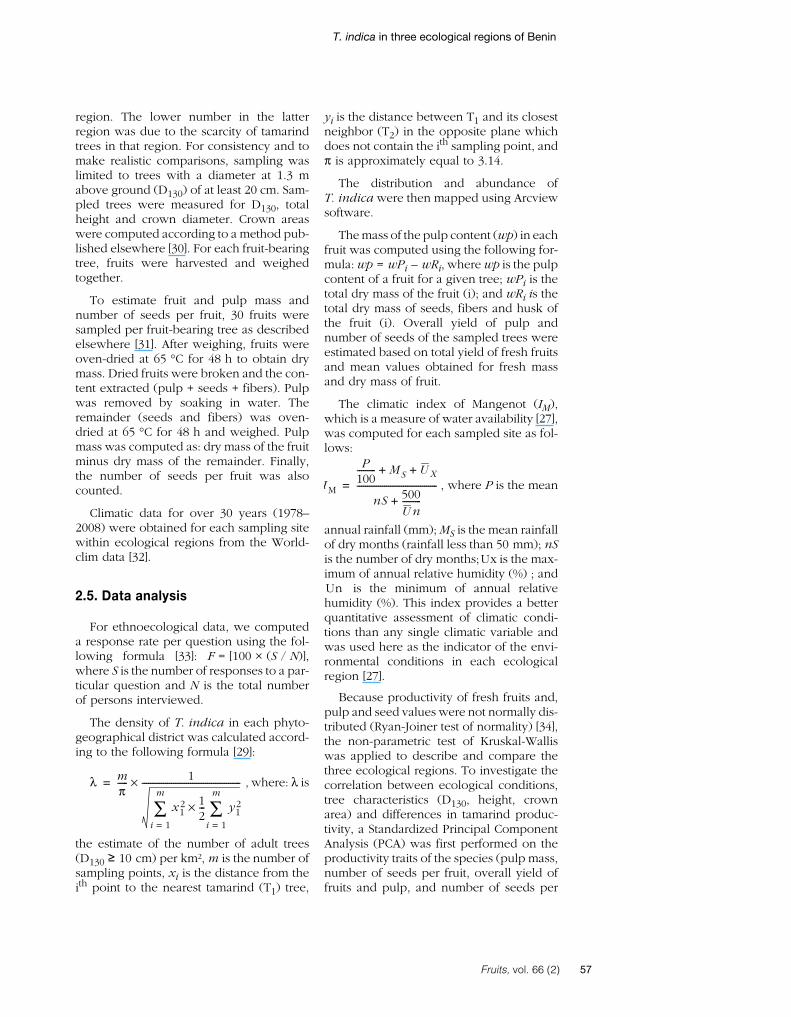
Then, we performed a sampling plan fortamarind density estimation based on theten phytogeographical subdivisions of thethree ecological regions [27]. We randomlyselected one to two sites (protected areasand surrounding farmlands) within eachphytogeographical district where tamarindnatural populations were observed(table I). The density of the species was esti-mated using the T-Square samplingmethod. Each phytogeographical districtwas represented by 45–90 sampled pointsfor density estimation (overall 630 pointsfor 112622 km²), following a protocol
already published [28]. To address anyunderlying heterogeneity in tamarind trees’pattern, a stratification of the vegetation anda systematic sampling approach were per-formed. Thus, each selected site was firststratified into three habitats: forest, savan-nah and farmland. We established 15 pointsin each habitat. The 15 points were distrib-uted on five azimuth transects of 15 km, sothat each transect was divided into3 equally spaced marks (5 km) (Si); then,from each marked point, the distance (xi) tothe nearest tamarind individual (T1) wasmeasured using a global positioning system(GPS Garmin 76). Next, the distance (yi)between T1 and its nearest neighbor (T2)situated in the ‘half-plane’ excluding Si wasmeasured [29] (figure 1). We used a GPSinstead of a tape measure or a decametersince “x” and “y” distances were often over500 m, except in gallery forests.
2.4. Estimating average yieldof fresh fruit, pulp and seeds
Data were collected on a total of 65 treessampled among the trees that we locatedwhen estimating tree density. Thirty treeswere sampled in both the Sudanian andSudano-Guinean regions while only fivetrees were selected in the Guineo-Congolian
ing geographical distribution, tree density and fruit production of Tamarindus indica L.s of Benin.
Phytogeographical district State district Study site Coordinates
Lat. E Long. N
Atacora Chain Tanguiéta Pendjari National Park 1° 44’ 11° 07’Mekrou-Pendjari Karimama W National Park 2° 54’ 12° 06’Mekrou-Pendjari Tanguiéta Pendjari National Park 1° 30’ 11° 25’
Borgou North Banikoara W National Park 2° 40’ 11° 55’Borgou North Pehunco Upper Alibori Forest 2° 17’ 10° 59’Borgou South Tchaourou Monts Kouffé Forest 2° 08’ 9° 00’Borgou South Kalalé Three Rivers Forest 3° 19’ 10° 50’
Bassila Bassila Penessoulou Forest 1° 64’ 9° 21’Zou Djidja Gbadagba Forest 2° 01’ 7° 57’
Oueme Valley Zogbodomey Locoly Swamp Forest 2° 36’ 7° 10’Plain Kétou Kétou-Dogo Forest 2° 60’ 7° 73’Plain Houéyogbé Houéyogbé Forest 1° 85’ 6° 50’Pobè Pobè Pobè Forest 2° 68’ 7° 07’Coast Ouidah Ahozon Forest 2° 16’ 6° 37’
Table I.Sampling plan for assessin three ecological region
N° Ecological regions
1 Sudanian23456 Sudano-Guinean78910 Guineo-Congolian11121314
Figure 1.T-Square sampling method[tamarind trees (T); samplingpoint (mi); distances labeled xand y; planes labeled L and R;region of interest (Ω,)] (adaptedfrom Diggle [29]).
Fruits, vol. 66 (2)
T. indica in three ecological regions of Benin
region. The lower number in the latterregion was due to the scarcity of tamarindtrees in that region. For consistency and tomake realistic comparisons, sampling waslimited to trees with a diameter at 1.3 mabove ground (D130) of at least 20 cm. Sam-pled trees were measured for D130, totalheight and crown diameter. Crown areaswere computed according to a method pub-lished elsewhere [30]. For each fruit-bearingtree, fruits were harvested and weighedtogether.
To estimate fruit and pulp mass andnumber of seeds per fruit, 30 fruits weresampled per fruit-bearing tree as describedelsewhere [31]. After weighing, fruits wereoven-dried at 65 °C for 48 h to obtain drymass. Dried fruits were broken and the con-tent extracted (pulp + seeds + fibers). Pulpwas removed by soaking in water. Theremainder (seeds and fibers) was oven-dried at 65 °C for 48 h and weighed. Pulpmass was computed as: dry mass of the fruitminus dry mass of the remainder. Finally,the number of seeds per fruit was alsocounted.
Climatic data for over 30 years (1978–2008) were obtained for each sampling sitewithin ecological regions from the World-clim data [32].
2.5. Data analysis
For ethnoecological data, we computeda response rate per question using the fol-lowing formula [33]: F = [100 × (S / N)],where S is the number of responses to a par-ticular question and N is the total numberof persons interviewed.
The density of T. indica in each phyto-geographical district was calculated accord-ing to the following formula [29]:
, where: λ is
the estimate of the number of adult trees(D130 ≥ 10 cm) per km², m is the number ofsampling points, xi is the distance from theith point to the nearest tamarind (T1) tree,
yi is the distance between T1 and its closestneighbor (T2) in the opposite plane whichdoes not contain the ith sampling point, andπ is approximately equal to 3.14.
The distribution and abundance ofT. indica were then mapped using Arcviewsoftware.
The mass of the pulp content (wp) in eachfruit was computed using the following for-mula: wp = wPi – wRi, where wp is the pulpcontent of a fruit for a given tree; wPi is thetotal dry mass of the fruit (i); and wRi is thetotal dry mass of seeds, fibers and husk ofthe fruit (i). Overall yield of pulp andnumber of seeds of the sampled trees wereestimated based on total yield of fresh fruitsand mean values obtained for fresh massand dry mass of fruit.
The climatic index of Mangenot (IM),which is a measure of water availability [27],was computed for each sampled site as fol-lows:
, where P is the mean
annual rainfall (mm); MS is the mean rainfallof dry months (rainfall less than 50 mm); nSis the number of dry months; is the max-imum of annual relative humidity (%) ; and
is the minimum of annual relativehumidity (%). This index provides a betterquantitative assessment of climatic condi-tions than any single climatic variable andwas used here as the indicator of the envi-ronmental conditions in each ecologicalregion [27].
Because productivity of fresh fruits and,pulp and seed values were not normally dis-tributed (Ryan-Joiner test of normality) [34],the non-parametric test of Kruskal-Walliswas applied to describe and compare thethree ecological regions. To investigate thecorrelation between ecological conditions,tree characteristics (D130, height, crownarea) and differences in tamarind produc-tivity, a Standardized Principal ComponentAnalysis (PCA) was first performed on theproductivity traits of the species (pulp mass,number of seeds per fruit, overall yield offruits and pulp, and number of seeds per
λ mπ----- 1
x12
i 1=
m
∑ 12--- y1
2
i 1=
m
∑×
-----------------------------------------------×=
I M
P100--------- MS U X+ +
nS 500U n---------+
--------------------------------------=
Ux
Un
Fruits, vol. 66 (2
) 57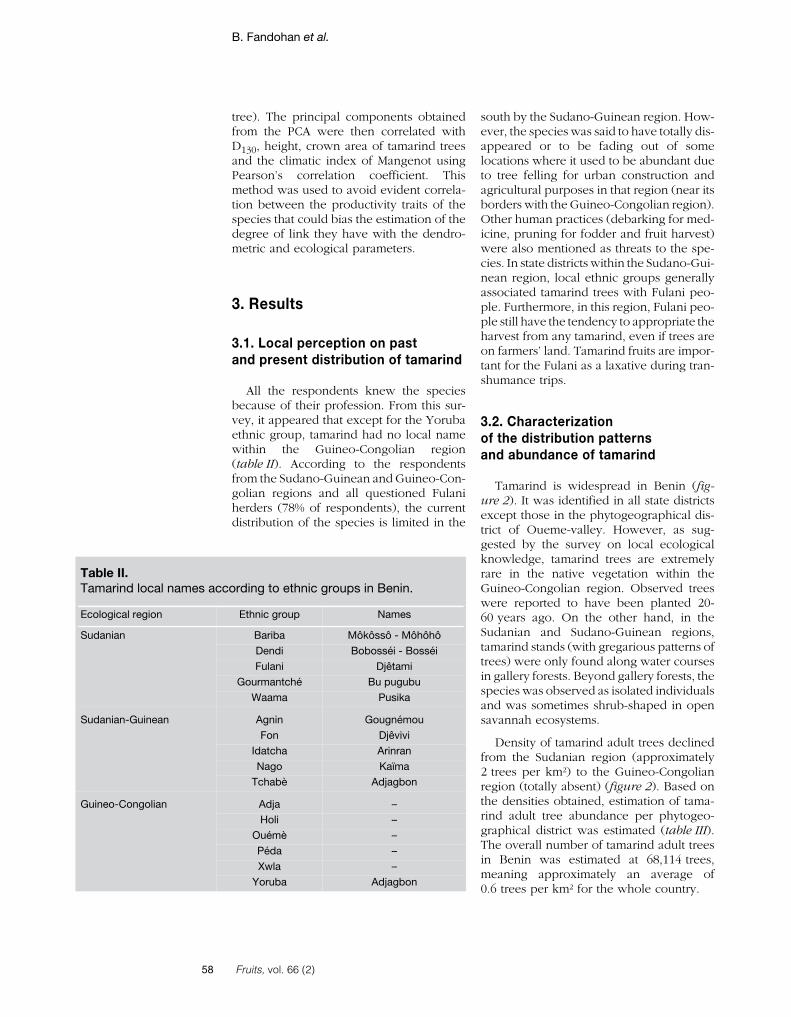
58
B. Fandohan et al.
tree). The principal components obtainedfrom the PCA were then correlated withD130, height, crown area of tamarind treesand the climatic index of Mangenot usingPearson’s correlation coefficient. Thismethod was used to avoid evident correla-tion between the productivity traits of thespecies that could bias the estimation of thedegree of link they have with the dendro-metric and ecological parameters.
3. Results
3.1. Local perception on pastand present distribution of tamarind
All the respondents knew the speciesbecause of their profession. From this sur-vey, it appeared that except for the Yorubaethnic group, tamarind had no local namewithin the Guineo-Congolian region(table II). According to the respondentsfrom the Sudano-Guinean and Guineo-Con-golian regions and all questioned Fulaniherders (78% of respondents), the currentdistribution of the species is limited in the
south by the Sudano-Guinean region. How-ever, the species was said to have totally dis-appeared or to be fading out of somelocations where it used to be abundant dueto tree felling for urban construction andagricultural purposes in that region (near itsborders with the Guineo-Congolian region).Other human practices (debarking for med-icine, pruning for fodder and fruit harvest)were also mentioned as threats to the spe-cies. In state districts within the Sudano-Gui-nean region, local ethnic groups generallyassociated tamarind trees with Fulani peo-ple. Furthermore, in this region, Fulani peo-ple still have the tendency to appropriate theharvest from any tamarind, even if trees areon farmers’ land. Tamarind fruits are impor-tant for the Fulani as a laxative during tran-shumance trips.
3.2. Characterizationof the distribution patternsand abundance of tamarind
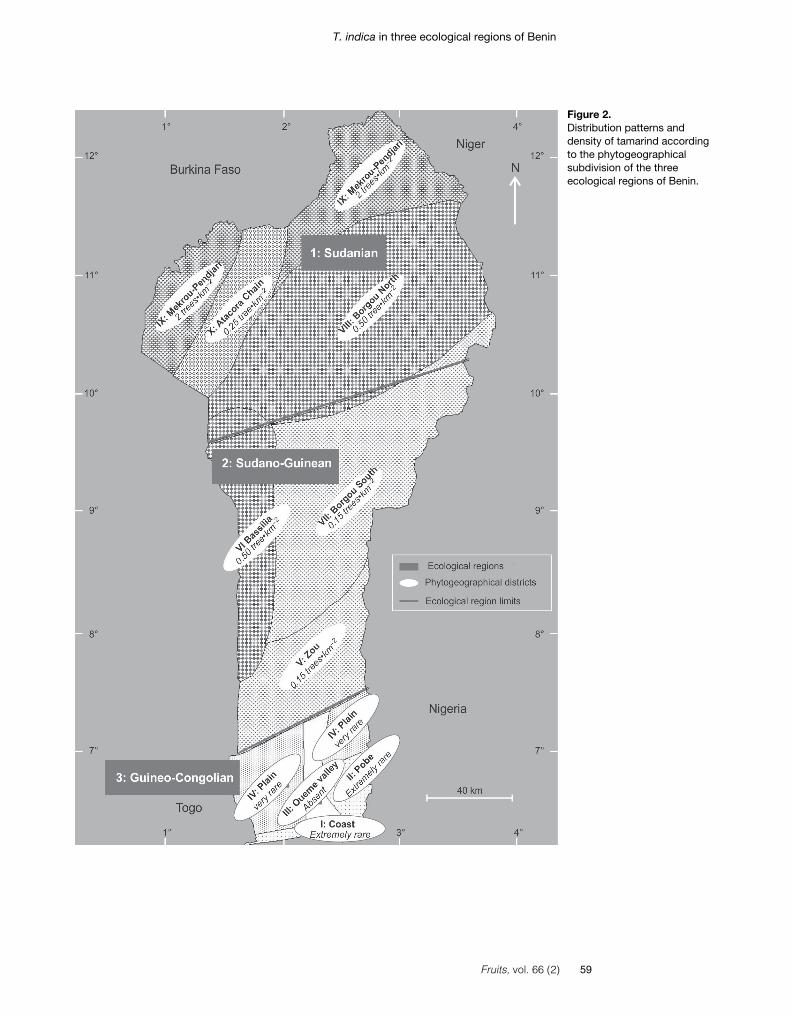
Tamarind is widespread in Benin (fig-ure 2). It was identified in all state districtsexcept those in the phytogeographical dis-trict of Oueme-valley. However, as sug-gested by the survey on local ecologicalknowledge, tamarind trees are extremelyrare in the native vegetation within theGuineo-Congolian region. Observed treeswere reported to have been planted 20-60 years ago. On the other hand, in theSudanian and Sudano-Guinean regions,tamarind stands (with gregarious patterns oftrees) were only found along water coursesin gallery forests. Beyond gallery forests, thespecies was observed as isolated individualsand was sometimes shrub-shaped in opensavannah ecosystems.
Density of tamarind adult trees declinedfrom the Sudanian region (approximately2 trees per km²) to the Guineo-Congolianregion (totally absent) (figure 2). Based onthe densities obtained, estimation of tama-rind adult tree abundance per phytogeo-graphical district was estimated (table III).The overall number of tamarind adult treesin Benin was estimated at 68,114 trees,meaning approximately an average of0.6 trees per km² for the whole country.
cording to ethnic groups in Benin.
Ethnic group Names
Bariba Môkôssô - Môhôhô
Dendi Bobosséi - Bosséi
Fulani Djêtami
Gourmantché Bu pugubu
Waama Pusika
Agnin Gougnémou
Fon Djêvivi
Idatcha Arinran
Nago Kaïma
Tchabè Adjagbon
Adja –
Holi –
Ouémè –
Péda –
Xwla –
Yoruba Adjagbon
Table II.Tamarind local names ac
Ecological region
Sudanian
Sudanian-Guinean
Guineo-Congolian
Fruits, vol. 66 (2)
T. indica in three ecological regions of Benin
Fruits, vol. 66 (2
Figure 2.Distribution patterns anddensity of tamarind accordingto the phytogeographicalsubdivision of the threeecological regions of Benin.
) 59
60
B. Fandohan et al.
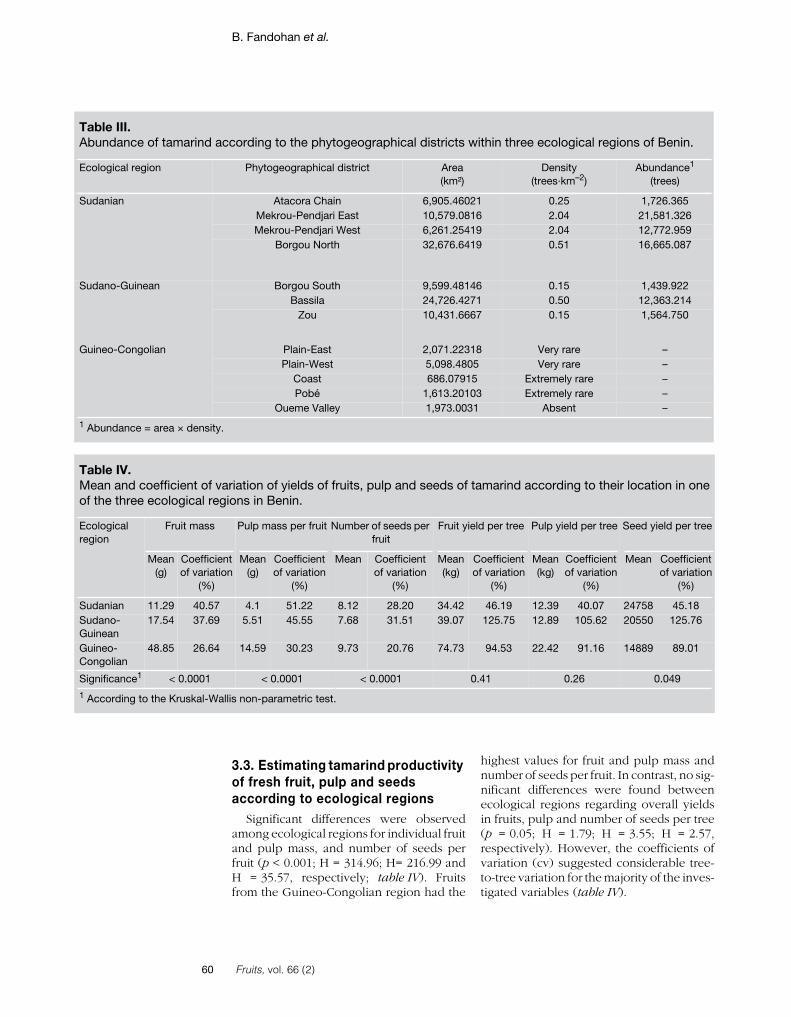
3.3. Estimating tamarind productivityof fresh fruit, pulp and seedsaccording to ecological regions
Significant differences were observedamong ecological regions for individual fruitand pulp mass, and number of seeds perfruit (p < 0.001; H = 314.96; H= 216.99 andH = 35.57, respectively; table IV). Fruitsfrom the Guineo-Congolian region had the
highest values for fruit and pulp mass andnumber of seeds per fruit. In contrast, no sig-nificant differences were found betweenecological regions regarding overall yieldsin fruits, pulp and number of seeds per tree(p = 0.05; H = 1.79; H = 3.55; H = 2.57,respectively). However, the coefficients ofvariation (cv) suggested considerable tree-to-tree variation for the majority of the inves-tigated variables (table IV).
ccording to the phytogeographical districts within three ecological regions of Benin.
Phytogeographical district Area(km²)
Density(trees·km–2)
Abundance1
(trees)
Atacora Chain 6,905.46021 0.25 1,726.365Mekrou-Pendjari East 10,579.0816 2.04 21,581.326Mekrou-Pendjari West 6,261.25419 2.04 12,772.959
Borgou North 32,676.6419 0.51 16,665.087
Borgou South 9,599.48146 0.15 1,439.922Bassila 24,726.4271 0.50 12,363.214
Zou 10,431.6667 0.15 1,564.750
Plain-East 2,071.22318 Very rare –Plain-West 5,098.4805 Very rare –
Coast 686.07915 Extremely rare –Pobé 1,613.20103 Extremely rare –
Oueme Valley 1,973.0031 Absent –
.
ariation of yields of fruits, pulp and seeds of tamarind according to their location in oneions in Benin.
Pulp mass per fruit Number of seeds perfruit
Fruit yield per tree Pulp yield per tree Seed yield per tree
nton
Mean(g)
Coefficientof variation
(%)
Mean Coefficientof variation
(%)
Mean(kg)
Coefficientof variation
(%)
Mean(kg)
Coefficientof variation
(%)
Mean Coefficientof variation
(%)
4.1 51.22 8.12 28.20 34.42 46.19 12.39 40.07 24758 45.185.51 45.55 7.68 31.51 39.07 125.75 12.89 105.62 20550 125.76
14.59 30.23 9.73 20.76 74.73 94.53 22.42 91.16 14889 89.01
< 0.0001 < 0.0001 0.41 0.26 0.049
llis non-parametric test.
Table III.Abundance of tamarind a
Ecological region
Sudanian
Sudano-Guinean
Guineo-Congolian
1 Abundance = area × density
Table IV.Mean and coefficient of vof the three ecological reg
Ecologicalregion
Fruit mass
Mean(g)
Coefficieof variati
(%)
Sudanian 11.29 40.57Sudano-Guinean
17.54 37.69
Guineo-Congolian
48.85 26.64
Significance1 < 0.0001
1 According to the Kruskal-Wa
Fruits, vol. 66 (2)
T. indica in three ecological regions of Benin
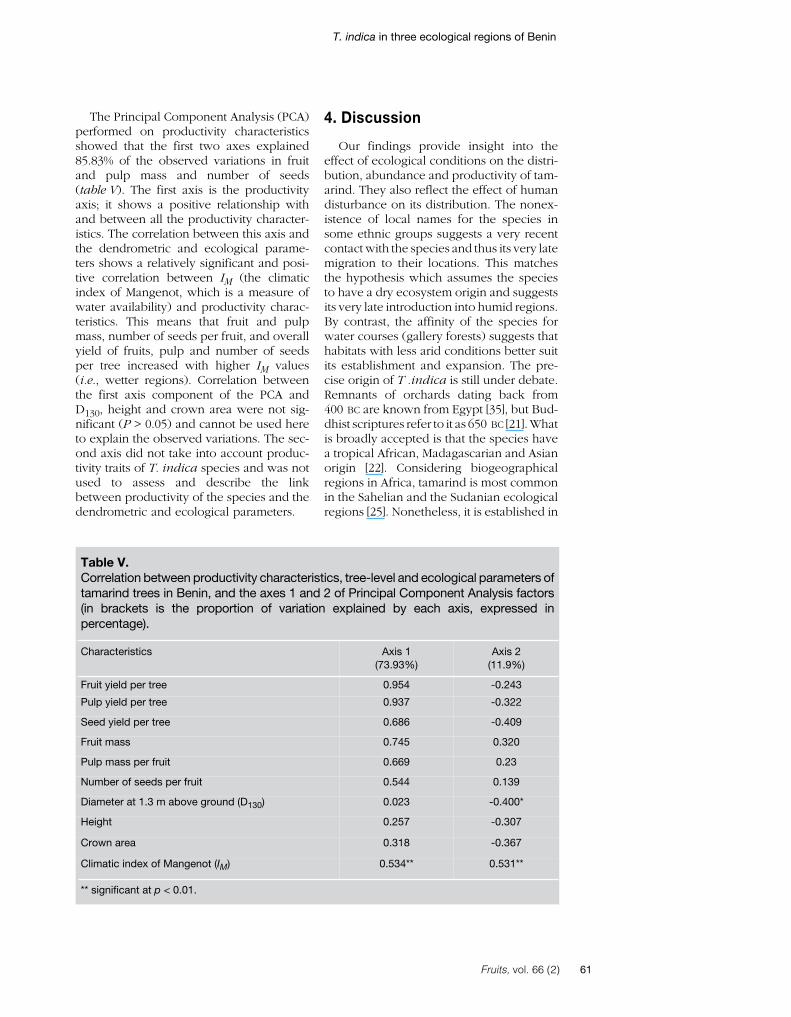
The Principal Component Analysis (PCA)performed on productivity characteristicsshowed that the first two axes explained85.83% of the observed variations in fruitand pulp mass and number of seeds(table V). The first axis is the productivityaxis; it shows a positive relationship withand between all the productivity character-istics. The correlation between this axis andthe dendrometric and ecological parame-ters shows a relatively significant and posi-tive correlation between IM (the climaticindex of Mangenot, which is a measure ofwater availability) and productivity charac-teristics. This means that fruit and pulpmass, number of seeds per fruit, and overallyield of fruits, pulp and number of seedsper tree increased with higher IM values(i.e., wetter regions). Correlation betweenthe first axis component of the PCA andD130, height and crown area were not sig-nificant (P > 0.05) and cannot be used hereto explain the observed variations. The sec-ond axis did not take into account produc-tivity traits of T. indica species and was notused to assess and describe the linkbetween productivity of the species and thedendrometric and ecological parameters.
4. Discussion
Our findings provide insight into theeffect of ecological conditions on the distri-bution, abundance and productivity of tam-arind. They also reflect the effect of humandisturbance on its distribution. The nonex-istence of local names for the species insome ethnic groups suggests a very recentcontact with the species and thus its very latemigration to their locations. This matchesthe hypothesis which assumes the speciesto have a dry ecosystem origin and suggestsits very late introduction into humid regions.By contrast, the affinity of the species forwater courses (gallery forests) suggests thathabitats with less arid conditions better suitits establishment and expansion. The pre-cise origin of T .indica is still under debate.Remnants of orchards dating back from400 BC are known from Egypt [35], but Bud-dhist scriptures refer to it as 650 BC [21].Whatis broadly accepted is that the species havea tropical African, Madagascarian and Asianorigin [22]. Considering biogeographicalregions in Africa, tamarind is most commonin the Sahelian and the Sudanian ecologicalregions [25]. Nonetheless, it is established in
Table V.Correlation between productivity characteristics, tree-level and ecological parameters oftamarind trees in Benin, and the axes 1 and 2 of Principal Component Analysis factors(in brackets is the proportion of variation explained by each axis, expressed inpercentage).
Characteristics Axis 1(73.93%)
Axis 2(11.9%)
Fruit yield per tree 0.954 -0.243
Pulp yield per tree 0.937 -0.322
Seed yield per tree 0.686 -0.409
Fruit mass 0.745 0.320
Pulp mass per fruit 0.669 0.23
Number of seeds per fruit 0.544 0.139
Diameter at 1.3 m above ground (D130) 0.023 -0.400*
Height 0.257 -0.307
Crown area 0.318 -0.367
Climatic index of Mangenot (IM) 0.534** 0.531**
** significant at p < 0.01.
Fruits, vol. 66 (2
) 61
62
B. Fandohan et al.
more humid zones and in coastal regions[36]. Hypotheses have assumed that the cli-matic variation observed from 20,000 to10,000 Before Present and from 2,800 to2,000 Before Present [37], and the subse-quent replacement of dense forests of Equa-torial Africa by savannah landscapes mighthave allowed the natural establishment ofsome savannah tree species (i.e., Adansoniadigita L., Vitellaria paradoxa C.F. Gaertn.,Borassus aethiopum Mart.) within zones ofhigher rainfall [7]. The latter authors havealso suggested that high density of thesespecies within the highest rainfall zone ofBenin may have to do with the DahomeyGap phenomenon which dried the humidgreen forest block. But tamarind might havecolonized these regions before those climatechange periods. During the last two dec-ades, scientific interest has increased in theHolocene vegetational history of West Africa[38–40], and the Dahomey gap in Beninmore specifically [41]. However, none ofthese studies, including studies in areaswhere tamarind is currently found, havementioned T. indica, suggesting a very latemigration of the species. This overlaps withour results on local ecological knowledge.However, the absence of T. indica frompaleobotanical findings might be linked toits erratic occurrence at very low frequen-cies, which might result in a large under-rep-resentation compared with other taxa. Inaddition, considering that tropical trees areoften ecologically highly plastic (at leastwithin the tropics), their natural distributionmay rather be strongly correlated to theirnatural dispersion strategies than local var-iation in environmental conditions. The cor-relation between spatial patterns of plantspecies and their dispersion strategies hasbeen highlighted [42]. Since tamarind is azoochorous species (monkeys and humansare its natural dispersal agents), its distribu-tion out of its native areas might be linkedto monkey and human migrations. It hasbeen illustrated that gene flow related toFulani migrations might explain the lowinter-population genetic diversity noticedwithin tamarind populations in West Africa[21]. The prevalence of some economicallyimportant tree species in the savannahs ofAfrica north of the equator, combined withpaleobotanical and historical evidence, are
strong indicators of human involvement intree dispersal [43]. However, Fulani herders’passings (i.e., transhumance) are very recentin some Sudano-Guinean localities wherenatural and very old tamarind trees wereobserved, and thus transhumance cannotexplain the presence of these trees (Sinsin,pers. commun.). The contribution of humanmigrations to the distribution of T. indicamay be addressed through the study of thepattern of lineages among the species’ pop-ulations across the main migration corridors,using chloroplastic DNA analyses [21]. Withregard to the observed gregarious pattern oftamarind trees along water courses (i.e., gal-lery forests), two questions may need to befurther addressed: which are the factors orevents underlying the affinity of a speciestypical of arid lands for wetter habitats (e.g.,gallery forests)? Was the paleo-climatewhich favored the establishment of the spe-cies wetter than the current climate it is fac-ing? And, in the case of a positive answer,how far could the adaptability of the speciesallow its persistence in arid ecosystems?
The findings from this study confirmedthe species’ erratic distribution in Benin. Themarked reduction of tamarind tree densitybetween phytogeographical districts withinthe Sudanian and the Sudano-Guinianregions might be due to tree felling and mor-tality of natural regeneration caused by fieldburning for agricultural purposes. The nat-ural range of the species (especially in thephytogeographical districts of Borgou Northand Borgou South, as well as Zou) is char-acterized by extensive agriculture such ascotton (Gossypium spp.) production. Inaddition, according to our field surveys, inBorgou South and Zou the species is lessimportant to the people except for theFulani tribes. Thus, tamarind trees were notspared when land was cleaned for agricul-tural purposes. Though it is frequentlyobserved on hillsides, tamarind was foundin low density in landscapes dominated byhills and mountains such as the phytogeo-graphical districts of the Atacora chain andpartly that of Zou. This observation contrastswith findings on baobab trees [7] and maybe linked to the preference of tamarind forwell-drained and deep soils [17]. Three rea-sons may explain the presence of tamarindon hillsides: (i) tamarind seeds might have
Fruits, vol. 66 (2)
T. indica in three ecological regions of Benin
been disseminated by monkeys; and/or (ii)when dry periods start, hillsides have plen-tiful grass plants and are ideal pasture landsfor cattle, so Fulani herders might have dis-seminated tamarind seeds while roamingwith their cattle; (iii) cattle might also havecontributed to the species' dispersion sincethey also feed on its fruits.
Productivity (fruit and pulp mass, andnumber of seeds per fruit) of tamarind treessignificantly varied with ecological condi-tions. This is consistent with other studiesthat have shown that environmental varia-bles can affect fruit size and shape, and ker-nel mass [7, 38]. However, estimated overallfruit yields per tree did not significantly dif-fer across ecological regions, suggesting thattamarind trees may tend to invest in a smallnumber of very large fruits under wetterconditions and a very large number of smallfruits under dryer conditions.
Fresh fruit yield per tamarind tree in thisstudy was 3 to 6 times lower than the figurein East Africa [(150 to 300) kg] [36]. Produc-tivity, including overall fruit yield per tree,was weakly correlated to tree-level factors(diameter, height and crown area) and theresults did not show a linear increase in pro-ductivity with tree size, in contrast withother studies [44, 45]. However, a positivecorrelation was observed with the climaticindex of Mangenot (IM), suggesting produc-tivity to be relatively higher under morehumid conditions. Successful fruiting in oneyear is often followed at the cost of vegeta-tive growth and some woody plants alter-nate supra-annual schedules of low andhigh production years [46]. This may explainthe high tree-to-tree variation revealed bythe coefficients of variation (cv). It can alsoexplain why some trees with greater diam-eter or crown area showed very low fruityield. This also provides strong evidencethat ecological conditions which are muchless variable than production itself are notthe only determinants of variation in tama-rind productivity [47]. For example, disease,herbivores, adverse weather such as high-speed winds, particularly during key phe-nological events such as pollination or fruitdevelopment, seasonal fire [48], and severepruning can reduce yield [49]. Variation in
productivity may also reflect genetic differ-ences [50]. In addition, because tree produc-tivity may greatly fluctuate with time, asingle census study can hardly provide anaccurate estimation. Besides, the results onseed production irrespective of ecologicalregions indicate that the often observed lackof regeneration in the species' populationsis not driven by lack of seed production.Other factors such as insect feeding pressureon seeds and soil degradation and vegeta-tion fire could be involved.
5. Conclusion
Our study has highlighted the difficulty inunderstanding the current distribution oftamarind and the need for greater researchon this topic. It has also provided useful pre-liminary information on the variation in fruityield in tamarind. Savannah landscapeswhere natural populations of the speciesexist (i.e., the phytogeographical districtswithin the Sudanian and the Sudano-Guin-ean regions) are obviously suitable for tam-arind plantation. However, the affinity of thespecies for gallery forests elicits further inter-est in its capacity to survive the increasingdrought stress in its current ecological range.Multi-year census studies are needed to con-sistently model the impact of environmentalcharacteristics (including soil characteris-tics), dendrometric characters, genetic vari-ation and human harvesting pressure(pruning) on the inter-annual variation infruit yield in order to understand the species’productivity better.
Acknowledgments
This study was supported by Domestica-tion and Development of Baobab and Tam-arind (EU-DADOBAT project). Weespecially thank Patrick Van Damme forcomments on an earlier version of the man-uscript. We are very grateful to the Fulaniherders, local hunters and healers for theirhelp during the field survey and the anon-ymous reviewers for their useful commentson improving the manuscript.
Fruits, vol. 66 (2
) 63
B. Fandohan et al.
R
[
[
[
[
[
[
[
[
[
[
[
64
eferences
1] Leakey R.R.B., Simons A.J., The domestica-tion and commercialization of indigenoustrees in agroforestry for the alleviation ofpoverty, Agrofor. Syst. 38 (1998) 165–176.
2] Kouyaté A.M., Van Damme P., Caractères mor-phologiques de Detarium microcarpum Guill.et Perr. au sud du Mali, Fruits 57 (2002) 231–238.
3] AtanganaA.R.,UkaforV.,AnegbehP.,AsaahE.,Tchoundjeu Z., Fondoun J-M., Ndoumbe M.,Leakey R.R.B., Domestication of Irvingiagabonensis: 2. The selection of multiple traitsfor potential cultivars from Cameroon andNigeria, Agrofor. Syst. 55 (2002) 221–229.
4] Leakey R.R.B., Shackleton S., du Plessis P.,Domestication potential of marula (Scleroca-rya birrea subsp. caffra) in South Africa andNamibia: 1. Phenotypic variation in fruittraits, Agrofor. Syst. 64 (2005) 25–35.
5] Bouvet J-M, Kelly B., Sanou H., Allal F., Com-parison of marker- and pedigree-basedmethods for estimating heritability in anagroforestry population of Vitellaria paradoxaC.F. Gaertn. (shea tree), Genet. Resour. CropEvol. 55 (2008) 1291–1301.
6] Ekué M.R.M., Gailing O., Finkeldey R., Transfe-rability of Simple Sequence Repeat (SSR)Markers developed in Litchi chinensis to Bli-ghia sapida (Sapindaceae), Plant. Mol. Biol.Rep. 27 (2009) 570–574.
8] Leakey R., Fuller S., Treloar T., Stevenson L.,Hunter D., Nevenimo T., Binifa J., Moxon J.,Characterization of tree-to-tree variation inmorphological, nutritional and medicinalproperties of Canarium indicum nuts, Agro-for. Syst. 73 (2008) 77–87.
7] Assogbadjo A.E., Sinsin B., Codjia J.T.C., VanDamme P., Ecological diversity and pulp,seed and kernel production of the baobab(Adansonia digitata) in Benin, Belg. J. Bot.138 (1) (2005) 47–56.
9] Schlichting C.D., Pigliucci M., Phenotypic evo-lution: a reaction norm perspective, SinauerAssoc., Sunderland, Mass., U.S.A., 1998.
10] Gaoue O.G., Ticktin T., Impacts of bark andfoliage harvest on Khaya senegalensis(Meliaceae) reproductive performance inBenin, J. Appl. Ecol. 28 (2008) 34–40.
11] Diggle P.J., Robust density estimation usingdistance methods, Biometrika 62 (1) (1975)39–48.
[12] Young L.J., Young, H., Statistical ecology: apopulation perspective, Kluwer Acad. Publ.,Boston, U.S.A., 1998.
[13] Diggle P.J., Besag J., Gleaves J.T., Statisticalanalysis of spatial point by means of distancemethods, Biometrics 32 (1976) 659–667.
[14] Gaoue O.G., Ticktin T., Fulani knowledge ofthe ecological impacts of Khaya senegalensis(Meliaceae) foliage harvest in Benin and itsimplications for sustainable harvest, Econ.Bot. 63 (3) (2009) 256–270.
[15] Maundu P.M., Ngugi G.W., Kabuye C.H.S.,Traditional food plants of Kenya, Natl. Mus.Kenya, Nairobi, Kenya, 1999.
[16] Eyog Matig O., Gaoué O.G., Dossou B.,Réseaux "Espèces Ligneuses Alimentaire",C. R. Prem. Réun. Réseau, 11–13 déc. 2000,CNSF, Ouagadougou, Burkina Faso, Inst.Int. Ressour. Phytogénét., 2002.
[17] El-Siddig K., Gunasena H.P.M, Prasad B.A.Pushpakumara D.K.N.G., Ramana K.V.R.,VijayanandP.,WilliamsJ.T.,Tamarind,Tama-rindus indica L, Southampt., Cent. Underutil.Crops, Southampt., U.K., 2006.
[18] Bowe C., Haq N., Quantifying the global envi-ronmental niche of an underutilized tropicalfruit tree (Tamarindus indica) using herba-rium records, Agric. Ecosyst. Environ. (2010)doi:10.1016/j.agee.2010.06.016.
[19] Soloviev P., Niang T.D., Gaye A., Totte A.,Variabilité des caractères physico-chimiquesdes fruits de trois espèces ligneuses decueillette récoltés au Sénégal : Adansoniadigitata, Balanites aegyptiaca et Tamarindusindica, Fruits 59 (2004) 109–119.
[20] Diallo B.O., Biologie de la reproduction etévaluation de la diversité génétique chez unelégumineuse : Tamarindus indica L. (Caesal-pinioideae), Univ. Montp. II, Sci. Tech. Lan-guedoc, thèse, Montp., France, 2001.
[21] Diallo B.O., Joly H.I., Mckey D., Hossaert-Mckey M., Chevallier M.H., Genetic diversityof Tamarindus indica populations: Any clueson the origin from its current distribution?,Afr. J. Biotechnol. 6 (7) (2007) 853–860.
[22] Diallo B.O., Mckey D., Chevallier M-H., JolyH.I., Hossaert-Mckey M., Breeding systemand pollination biology of the semi-domesti-cated fruit tree, Tamarindus indica L. (Legu-minosae: Caesalpinioideae): Implications forfruit production, selective breeding, andconservation of genetic resources, Afr. J.Biotechnol. 7 (22) (2008) 4068–4075.
Fruits, vol. 66 (2)
T. indica in three ecological regions of Benin
[23] Diallo B.O., Joly H.I., McKey D., Hossaert-McKey, M., Chevallier M.H., Variation descaractères biométriques des graines et desplantules de neuf provenances de Tamarin-dus indica L. (Caesalpinioideae), Fruits 65 (3)(2010 153–167.
[24] Fandohan B., Assogbadjo A.E., Glèlè Kakaï,R., Sinsin, B., Van Damme P., Impact of habi-tat type on the conservation status of tama-rind (Tamarindus indica L.) populations in theW National Park of Benin, Fruits 65(1) (2010)11–19.
[25] White F., The vegetation of Africa, UNESCOParis, France, Nat. Resour. Res. 20 (1983)1–356.
[26] Anon., Troisième recensement général de lapopulation et de l'habitation (RGPH-3),Résultats définitifs : Caractéristiques géné-rales de la population, Inst. Natl. Stat. Appl.Econ. (INSAE), Cotonou, Bénin, 2003.
[27] Adomou C.A, Sinsin B., van der MaesenL.J.G., Phytosociological and chorologicalapproaches to phytogeography: a meso-scale study in Benin, Syst. Geogr. Plants 76(2006) 155–178.
[28] Grais R.F., Coulombier D., Ampuero J., LucasM.E.S., Barretto A.T., Jacquier G., Diaz F.,Balandine S., Mahoudeau C., Brown V., Arerapid population estimates accurate? A fieldtrial of two different assessment methods,Disasters 30 (3) (2006) 364–376.
[29] Diggle P.J., Statistical analysis of spatial pointprocesses, Second ed., Arnold, Lond., U.K.,2003.
[30] Lamien N., Tigabu M., Guinko S., Oden P.C.,Variations in dendrometric and fruiting cha-racters of Vitellaria paradoxa populationsand multivariate models for estimation offruit yield, Agrofor. Syst. (2007) DOI 10.1007/s10457-006-9013-x.
[31] Leakey R.R.B., Fondoun J.-M., Atangana A.,Tchoundjeu Z., Quantitative descriptors ofvariation in the fruits and seeds of Irvingiagabonensis, Agrofor. Syst. 50 (2000) 47–58.
[32] Hijmans R.J., Cameron S.E., Parra J.L., JonesP.G., Jarvis A., The WorldClim interpolatedglobal terrestrial climate surfaces, Vers. 1.3.,http://biogeo.berkeley.edu/, 2004.
[33] Kouyaté A.M., Aspect ethnobotaniques etétude de la variabilité morphologique, biochi-mique et phénologique de Detarium micro-carpum Guill et Perr. au Mali, Univ. Ghent,Thèse, Ghent, Belg., 2005.
[34] Ryan T.A., Joiner B.L., Normal probabilityplots and tests for normality: technical report,Univ. Park, Stat. Dep., Pa. State Univ., StateColl., Pennsylvania, U.S.A., 1976.
[35] Aubréville A., Flore forestière soudano-gui-néenne, AOF-Cameroun-AEF, Soc. Ed. ,Marit. Colon., Paris, France, 1950.
[36] Jama B.A., Mohamed A.M., Mulatya J., NjuiA.N., Comparing the ‘‘Big Five’’: A fra-mework for the sustainable management ofindigenous fruit trees in the drylands of Eastand Central Africa, Ecol. Indic. 8 (2) (2008)170–179.
[37] Maley J., Brenac P., Vegetation dynamics,palaeoenvironments and climatic changes inthe forests of West Cameroon during the last28,000 years, Rev. Palaeobot. Palynol. 99(1998) 157–188.
[38] Salzmann U., Waller M., The Holocene vege-tational history of the Nigerian Sahel basedon multiple pollen profiles, Rev. Palaeobot.Palynol. 100 (1998) 39–72.
[39] Salzmann U., Are savannas degradedforests? A Holocene pollen record from theSudanian zone of NE Nigeria, Veg. Hist.Archaeobot. 9 (2000) 1–15.
[40] Salzmann U., Hoelzmann P., Morczineck I.,Late Quaternary climate and vegetation ofthe Sudanian zone of NE Nigeria, Quat. Res.58 (2002) 73–83.
[41] Salzmann U., Hoelzmann P., The Dahomeygap: Anabrupt climatically induced rain forestfragmentation in West Africa during the lateHolocene, Holocene 15 (2) (2005) 190–199.
[42] Collinet F., Essai de regroupement des princi-pales espèces structurantes d’une forêtdense humide d’après l’analyse de leur répar-tition spatiale (Forêt de Paracou-Guyane),Lab. Biom., Génét. Biol. Popul., UMR CNRS5558, Group. Intérêt Sci. Sylvolab, Guyane,France, 1997.
[43] Maranz S., Wiesman Z., Evidence for indige-nous selection and distribution of the sheatree, Vitellaria paradoxa, and its potentialsignificance to prevailing parkland savannatree patterns in sub-Saharan Africa, north ofthe equator, J. Biogeogr. 30 (2003) 1505–1516.
[44] WadtL.H.O.,KainerK.A.,Gomes-SilvaD.A.P.,Population structure and nut yield of Berthol-letia excelsa stand in southwestern Amazo-nia, For. Ecol. Manag. 211 (2005) 371–384.
[45] Zuidema P.A., Boot R.G.A., Demography ofthe Brazil nut tree (Bertholletia excelsa) in the
Fruits, vol. 66 (2
) 65
T. indica in three ecological regions of Benin
Bolivian Amazon: Impact of seed extractionon recruitment and population dynamics, J.Trop. Ecol. 18 (2002) 1–31.
[46] Kelly D., Sork V.L., Mast seeding in perennialplants: why, how, where?, Annu. Rev. Ecol.Evol. Syst. 33 (2002) 427–447.
[47] Koenig W.D., Knops J.M.H., Patterns ofannual seed production by Northern Hemis-phere trees: a global perspective, Am. Nat.155 (2000) 59–69.
[48] Stephenson A.G., Flower and fruit abortion:Proximate causes and ultimate functions,
Annu. Rev. Ecol. Evol. Syst. 12 (1981)253–279.
[49] Ghosh S.N., Bera B., Kundu A., Roy S., DuttaRay S.K., Fruit production and quality impro-vement in aonla (Emblica Officinalis Gaertn.)through canopy management, J. Agric. Tech-nol. 3 (8) ser. n°21 (2009) 40–43.
[50] Assogbadjo A.E., Kyndt T., Sinsin B., GheysenG., Van Damme, P., Patterns of genetic andmorphometric diversity in Baobab (Adanso-nia digitata) populations across different cli-matic zones of Benin (West Africa), Ann. Bot.97 (2006) 819–830.
Benin / Tamarindus indica / distribución de la población / densidad de lapoblación / ructificación/ conocimiento indígena
Fruits, vol. 66 (2
) 66