Genome-wide screen for asthma in Puerto Ricans: evidence for association with 5q23 region
25
Genome-wide Screen for Asthma in Puerto Ricans: Evidence for Association with 5q23 Region Shweta Choudhry 1,2,3,†,* , Margaret Taub 6,* , Rui Mei 7 , José Rodriguez-Santana 8 , William Rodriguez-Cintron 9 , Mark D. Shriver 10 , Elad Ziv 1,3 , Neil J. Risch 1,5,11 , and Esteban González Burchard 1,2,3,4,11 1 Institute for Human Genetics, University of California, San Francisco, CA 2 Lung Biology Center, University of California, San Francisco, CA 3 Department of Medicine, University of California, San Francisco, CA 4 Department of Biopharmaceutical Sciences, University of California, San Francisco, CA 5 Department of Epidemiology and Biostatistics, University of California, San Francisco, CA 6 Department of Biostatistics, University of California, Berkeley, CA 7 Affymetrix Inc., Santa Clara, CA 8 Centro de Neumologia Pediatrica, CSP, San Juan, PR 9 Veterans Caribbean Health Care System and the University of Puerto Rico School of Medicine, San Juan, PR 10 Department of Anthropology, Pennsylvania State University, University Park, PA 11 Division of Research, Kaiser Permanente, Oakland, CA. USA Abstract While the number of success stories for mapping genes associated with complex diseases using genome-wide association approaches is growing, there is still much work to be done in developing methods for such studies when the samples are collected from a population which may not be homogeneous. Here we report the first genome-wide association study to identify genes associated with asthma in an admixed population. We genotyped 96 Puerto Rican moderate to severe asthma cases and 88 controls as well as 109 samples representing Puerto Rico’s founding populations using the Affymetrix GeneChip Human Mapping 100K array sets. The data from samples representing Puerto Rico’s founding populations was used to identify ancestry informative markers for admixture mapping analyses. In addition, a genome-wide association analysis using logistic regression was performed on the data. Although neither admixture mapping nor regression analysis gave any significant association with asthma after correction for multiple testing, an overlap analysis using the top scoring SNPs from different methods suggested chromosomal regions 5q23.3 and 13q13.3 as potential regions harboring genes for asthma in Puerto Ricans. The validation analysis of these two regions in 284 Puerto Rican asthma trios gave significant association for the 5q23.3 region. Our results provide strong evidence that the previously linked 5q23 region is associated with asthma in Puerto Ricans. The detection of causative variants in this region will require fine mapping and functional validation. †Correspondence and reprint requests: Shweta Choudhry, Ph.D., M.Sc., UCSF/Lung Biology Center, University of California, San Francisco, San Francisco, California 94158-2911; telephone: 415-514-9927, fax: 415-514-4365, e-mail: [email protected]. * These authors contributed equally to the manuscript. NIH Public Access Author Manuscript Hum Genet. Author manuscript; available in PMC 2009 April 2. Published in final edited form as: Hum Genet. 2008 June ; 123(5): 455–468. doi:10.1007/s00439-008-0495-7. NIH-PA Author Manuscript NIH-PA Author Manuscript NIH-PA Author Manuscript
-
Upload
independent -
Category
Documents
-
view
5 -
download
0
Transcript of Genome-wide screen for asthma in Puerto Ricans: evidence for association with 5q23 region
Genome-wide Screen for Asthma in Puerto Ricans: Evidence forAssociation with 5q23 Region
Shweta Choudhry1,2,3,†,*, Margaret Taub6,*, Rui Mei7, José Rodriguez-Santana8, WilliamRodriguez-Cintron9, Mark D. Shriver10, Elad Ziv1,3, Neil J. Risch1,5,11, and EstebanGonzález Burchard1,2,3,4,11
1 Institute for Human Genetics, University of California, San Francisco, CA
2 Lung Biology Center, University of California, San Francisco, CA
3 Department of Medicine, University of California, San Francisco, CA
4 Department of Biopharmaceutical Sciences, University of California, San Francisco, CA
5 Department of Epidemiology and Biostatistics, University of California, San Francisco, CA
6 Department of Biostatistics, University of California, Berkeley, CA
7 Affymetrix Inc., Santa Clara, CA
8 Centro de Neumologia Pediatrica, CSP, San Juan, PR
9 Veterans Caribbean Health Care System and the University of Puerto Rico School of Medicine, San Juan,PR
10 Department of Anthropology, Pennsylvania State University, University Park, PA
11 Division of Research, Kaiser Permanente, Oakland, CA. USA
AbstractWhile the number of success stories for mapping genes associated with complex diseases usinggenome-wide association approaches is growing, there is still much work to be done in developingmethods for such studies when the samples are collected from a population which may not behomogeneous. Here we report the first genome-wide association study to identify genes associatedwith asthma in an admixed population. We genotyped 96 Puerto Rican moderate to severe asthmacases and 88 controls as well as 109 samples representing Puerto Rico’s founding populations usingthe Affymetrix GeneChip Human Mapping 100K array sets. The data from samples representingPuerto Rico’s founding populations was used to identify ancestry informative markers for admixturemapping analyses. In addition, a genome-wide association analysis using logistic regression wasperformed on the data. Although neither admixture mapping nor regression analysis gave anysignificant association with asthma after correction for multiple testing, an overlap analysis usingthe top scoring SNPs from different methods suggested chromosomal regions 5q23.3 and 13q13.3as potential regions harboring genes for asthma in Puerto Ricans. The validation analysis of thesetwo regions in 284 Puerto Rican asthma trios gave significant association for the 5q23.3 region. Ourresults provide strong evidence that the previously linked 5q23 region is associated with asthma inPuerto Ricans. The detection of causative variants in this region will require fine mapping andfunctional validation.
†Correspondence and reprint requests: Shweta Choudhry, Ph.D., M.Sc., UCSF/Lung Biology Center, University of California, SanFrancisco, San Francisco, California 94158-2911; telephone: 415-514-9927, fax: 415-514-4365, e-mail: [email protected].*These authors contributed equally to the manuscript.
NIH Public AccessAuthor ManuscriptHum Genet. Author manuscript; available in PMC 2009 April 2.
Published in final edited form as:Hum Genet. 2008 June ; 123(5): 455–468. doi:10.1007/s00439-008-0495-7.
NIH
-PA Author Manuscript
NIH
-PA Author Manuscript
NIH
-PA Author Manuscript

KeywordsGenome-wide association; Admixture mapping; Puerto Rican; Asthma; Genetics
INTRODUCTIONIn the United States, asthma prevalence is highest in Puerto Ricans (26%) and lowest inMexicans (10%) (Carter-Pokras and Gergen 1993; Homa et al. 2000). This is paradoxical sinceboth groups are considered “Hispanic” or “Latino”. Although there are many potentialexplanations for this observation, including environmental and socioeconomic factors, onelikely explanation is that the genetic predisposition to asthma differs among subgroups withinthe Latino population. Latinos are admixed and share varying proportions of West African,Native American and European ancestry (Choudhry et al. 2006; Hanis et al. 1991). The mixedancestry of Latinos provides unique opportunities in epidemiological and genetic studies andmay be useful in untangling complex gene-gene and gene-environment interactions in diseasesusceptibility (Burchard et al. 2003; Choudhry et al. 2007).
Several recent advances in statistical methods and genotyping techniques have resulted in aparadigm shift in genetic association studies, making it possible to perform a genome-wideassociation analysis, which does not require a priori knowledge of disease associated genes(Hirschhorn and Daly 2005; Kennedy et al. 2003; Matsuzaki et al. 2004; Risch 2000). Analternative yet complementary approach to genome-wide association analysis is admixturemapping (Smith and O’Brien 2005). Admixture mapping is a method for localizing diseasecausing genetic variants that differ in frequency across populations. It is most advantageous toapply this approach to admixed populations such as Latinos, which descended from a recentmix of three ancestral groups that have been geographically isolated for thousands of years.The approach assumes that near a disease causing gene there will be enhanced ancestry fromthe population that has greater risk of getting the disease. Thus if one can calculate the ancestryalong the genome for an admixed sample set, one could use that to identify disease causinggene variants (Chakraborty and Weiss 1988; McKeigue 1997; Pfaff et al. 2001; Stephens etal. 1994). Admixture mapping requires the genotyping of several thousand markers (Smith etal. 2004) while genome-wide association requires genotyping of hundreds of thousands ofmarkers (Hinds et al. 2005). The Affymetrix GeneChip Human Mapping 100K array set cangenotype 116,204 SNPs in a given individual with a single genotyping assay (Kennedy et al.2003). The ease and cost effectiveness of the GeneChip arrays for large-scale genotyping makethem far more attractive than conventional genotyping platforms for genome-wide studies.
We used the Affymetrix 100K arrays to perform genome-wide association and admixturemapping analyses to identify loci associated with asthma in Puerto Ricans. First, we selectedancestry informative markers (AIMs) from the 100K arrays by screening Puerto Rican ancestralpopulations. We then performed three different analyses: 1) genome-wide association analysistesting association between individual SNPs and asthma disease status 2) admixture mappingcomparing cases and controls using the program Admixmap and 3) admixture mapping usinglikelihood ratio test on locus-specific ancestry estimates determined using the programStructure. In all three analyses, we incorporated adjustments to correct for confounding due topopulation stratification. By combining results from these three different analytical methods,we determined a set of most promising candidate regions for asthma in Puerto Ricans. We thenselected the top SNPs from these candidate regions and genotyped them in a second sample ofPuerto Rican families with asthma for validation analysis.
Choudhry et al. Page 2
Hum Genet. Author manuscript; available in PMC 2009 April 2.
NIH
-PA Author Manuscript
NIH
-PA Author Manuscript
NIH
-PA Author Manuscript

MATERIALS AND METHODSStudy Participants
A total of 380 Puerto Rican subjects with asthma and 88 ethnically matched controls wereincluded in this study. The genome-wide analyses included 96 subjects with moderate to severeasthma and 88 healthy controls. The moderate to severe asthma was defined based on baselinelung function (Pre-FEV1) of the asthmatic subject. Subjects with Pre-FEV1 less than 80% ofpredicted were categorized as having “moderate-severe” asthma. The validation analysisincluded 284 Puerto Rican asthma trios (father, mother and affected child). All subjects wererecruited as part of the Genetics of Asthma in Latino Americans (GALA) study. Recruitmentand patient characteristics were described in detail elsewhere(Burchard et al. 2004; Choudhryet al. 2005; Lind et al. 2003) but will be briefly described here. Ethnicity and national originwere self-reported and were ascertained using standardized questions. Puerto Rican subjectswere enrolled only if both biological parents and all four biological grandparents were reportedto be of Puerto Rican ethnicity. Interviews with children were conducted in the presence ofparents. Eligible subjects with asthma had physician-diagnosed asthma and had experiencedtwo or more asthma symptoms (among wheezing, coughing, and shortness of breath) in theprevious two years. All control subjects were screened and considered to be eligible toparticipate if they did not have clinical evidence of asthma, allergies, atopy or any other allergicor pulmonary disease. All subjects (asthmatics and healthy controls) were between the ages of8 and 40 years and were interviewed by bilingual and bicultural field workers and physiciansspecialized in asthma.
Genotyping Using Affymetrix 100K ArraysWe genotyped 37 West African, 42 European and 30 Native American samples using theAffymetrix GeneChip Human Mapping 100K array set to find AIMs relevant to Puerto Rico’sfounding populations. The 37 West African samples are from individuals living in London,U.K. and South Carolina, U.S., who are either non-admixed or have very low levels ofadmixture. The 42 European samples are from Coriell’s North American Caucasian panel. TheNative American samples (Mayan, n = 15 and Nahua, n = 15) were recruited from villages inremote areas of Mexico. Genotyping of Puerto Rican asthma cases and controls was alsoperformed using the Affymetrix 100K arrays. The genotyping was done following standardAffymetrix protocols and the data was processed using the Affymetrix-provided GenotypingConsole Software (GCOS) and GeneChip DNA Analysis Software (GDAS) (Affymetrix Inc.,Santa Clara, CA). Ten samples were run in duplicate to assess for concordance between runs.The concordance rate was > 99.9% and the overall genotyping success rate was > 98.5%.Markers were assessed for Hardy-Weinberg equilibrium using a χ2 goodness-of-fit test. Afterexcluding markers on the X chromosome, markers with minor allele frequency (MAF) < 5%,extreme deviation from Hardy-Weinberg equilibrium (χ2 > 10) or study-wide genotyping callrates < 95%, we retained 97,112 markers for further association analysis.
Selection of Ancestry Informative Markers (AIMs)The genotype data from the parental population samples was used to identify AIMs, whichwere then used to perform admixture mapping and to adjust the analyses for populationstratification. Since the contemporary Puerto Rican population is a mixture of three parentalpopulations, West Africans, Europeans and Native Americans, we used an iterative processfor selecting our AIMs. For each of the three possible pairs of ancestral populations, weidentified markers where the difference in allele frequency (δ) was at least 0.5 between anytwo ancestral populations. Once we identified such markers, we selected a subset that wasadequately distributed across the genome, with the markers being far enough apart that theywere in linkage equilibrium in the ancestral populations. These markers formed our set of 2730AIMs which were then used to estimate individual and locus specific ancestry.
Choudhry et al. Page 3
Hum Genet. Author manuscript; available in PMC 2009 April 2.
NIH
-PA Author Manuscript
NIH
-PA Author Manuscript
NIH
-PA Author Manuscript
Estimation of Individual AncestryThe individual ancestry estimates (IAE) were calculated using two different programs,Admixmap (Hoggart et al. 2003; Hoggart et al. 2004) and Structure (Falush et al. 2003;Pritchard et al. 2000), and the 2730 AIMs. The IAE from these two programs were highlycorrelated (r > 0.9) (results not shown). The IAE from the Structure program were used toadjust for population stratification in the 100K association analysis.
Estimation of Locus Specific Ancestry and Admixture Mapping AnalysisThe admixture mapping analyses were performed using the panel of 2730 AIMs as describedabove and using two different programs, Admixmap and Structure. Admixmap uses a Bayesianprobability model fit using Markov chain Monte Carlo to estimate locus specific ancestry(Hoggart et al. 2004). To run Admixmap, we provided the program with the genotypes of the2730 AIMs for our case and control subjects, as well as for the ancestral representatives.Admixmap performs a test for association between ancestral status and disease status andreturns a p-value for each marker. We also estimated the ancestral proportion at each of the2730 AIMs using the program Structure (Montana and Pritchard 2004). At each marker, alikelihood ratio statistic was computed, testing the null hypothesis of no association betweenancestry and disease status while taking each individual’s overall ancestry estimates intoaccount. Under the null hypothesis, the statistics follow a χ2-distribution and indicates thestrength of deviation in ancestry between cases and controls at each locus. Statisticalsignificance was assessed using a permutation test.
Genome-wide Association Analysis – Regression MethodWe used a logistic regression model to test for association between genotype and disease statusfor 97,112 markers on the 100K arrays assuming an additive model for the disease. In additionto age and gender, IAE estimates using the program Structure were included as covariates inall the regression models to control the inflation of type I error rate due to populationstratification.
Correction for Multiple TestingThe admixture mapping and genome-wide association analyses were corrected for multipletesting using the multtest package in the statistical language R. We used adjusted p-values ascalculated by multtest under the Benjamini & Yekutieli step-up FDR (False Discovery Rate)controlling procedure (Benjamini and Yekutieli 2001).
Identification of Follow-up Regions by Overlap AnalysisTo identify areas of potential interest we used the combined strength of the different analyticalmethods: 1) individual SNP association, 2) admixture mapping using a case-control approachwith the program Admixmap and 3) admixture mapping using likelihood ratio test on locusspecific ancestry estimates from the program Structure. We identified regions for subsequentanalysis by selecting markers that were highly ranked (based on unadjusted p-value orlikelihood ratio test score) in at least two of the three analytical methods.
ValidationTo test the validity of the regions identified through the overlap analysis, we performedvalidation analysis on the most promising markers in these regions on a sample of 284 PuertoRican asthma trios. The genotyping was performed using the fluorescent polarization (FP)method as directed by the manufacturer (PerkinElmer, Waltham, MA) (Chen et al. 1999). Theassociation of the markers with asthma disease status was tested using the transmission-disequilibrium test as implemented in the program FBAT (Laird et al. 2000).
Choudhry et al. Page 4
Hum Genet. Author manuscript; available in PMC 2009 April 2.
NIH
-PA Author Manuscript
NIH
-PA Author Manuscript
NIH
-PA Author Manuscript
RESULTSIdentification of AIMs
Table 1 shows the percent of markers on the Affymetrix 100K arrays informative for WestAfrican-European, West African-Native American and European-Native American ancestriesat different levels of ancestry informativeness as measured by difference in allele frequency(delta, δ). Most markers were only informative for one pair of ancestral populations, whilesome were informative for more than one pair. Among the markers on the 100K arrays, therewere more than 10,000 markers with δ > 0.5 for West African-European, West African-NativeAmerican or European-Native American ancestry (Table 1). We selected a panel of 2730 AIMswhich had a δ value of > 0.5 and were evenly spaced across the genome (inter-marker distancemean: 1 cM, median: 0.79 cM, 1stquartile: 0.67 cM and 3rd quartile: 1.05 cM and the overallinter-marker range: 0.01 cM –26.07 cM) for estimation of individual ancestry estimates andadmixture mapping analysis for asthma (see supporting material, Table 1S).
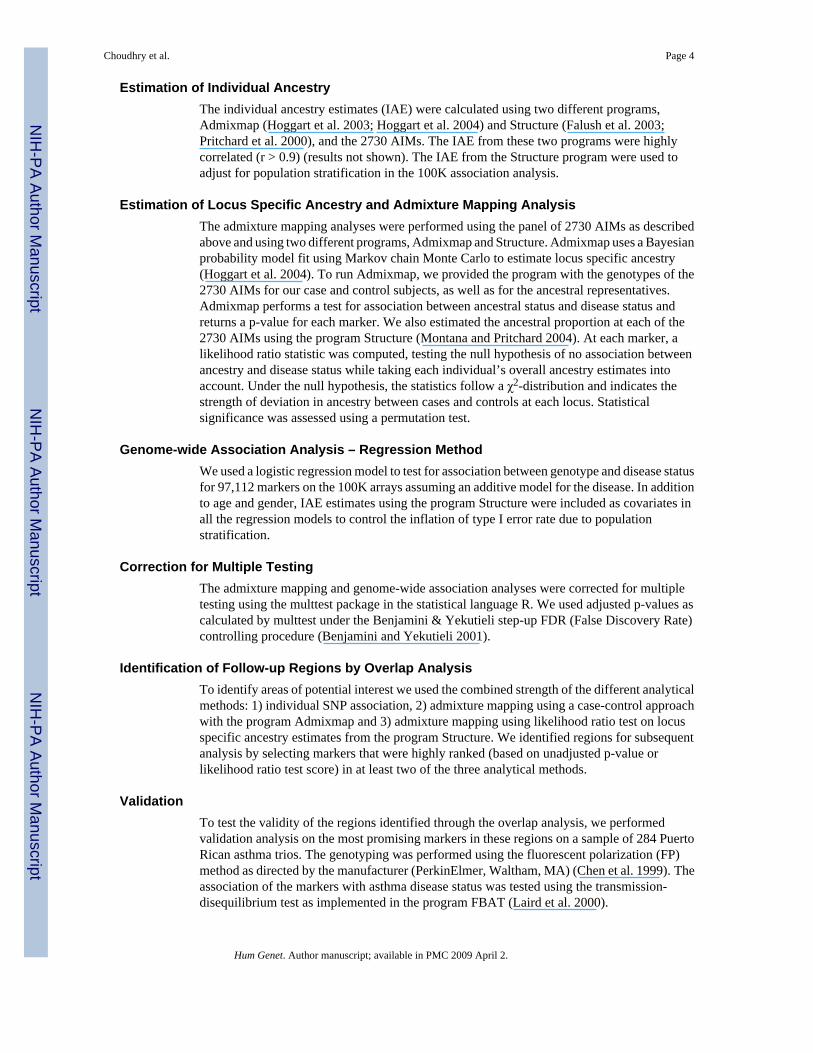
Evidence of Population Stratification in Puerto Rican Asthma Cases and ControlsThe estimated average European and West African ancestry was different between our PuertoRican cases and controls. Figure 1 shows box plots demonstrating differences in estimatedEuropean and West African ancestral proportions between cases (with medians of 62.0% and22.3%, respectively) and controls (medians of 58.1% and 26.0%, respectively). The NativeAmerican ancestry was similar between the two groups (medians of 15.7% in cases and 15.9%in controls) (Figure 1). The summary χ2 test using 2730 AIMs also gave significant results (p= 0.01) suggesting that there are systematic differences in ancestry between our asthma casesand controls that could cause spurious genetic associations if measures of ancestry were notincluded in our analyses.
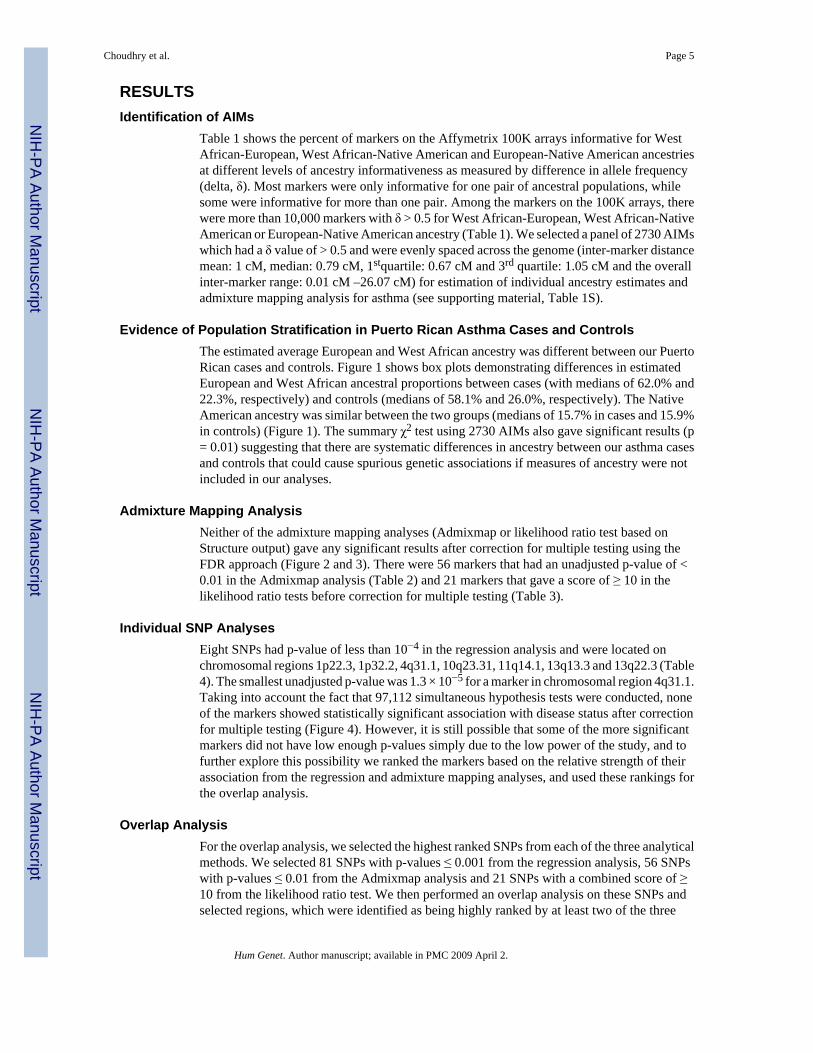
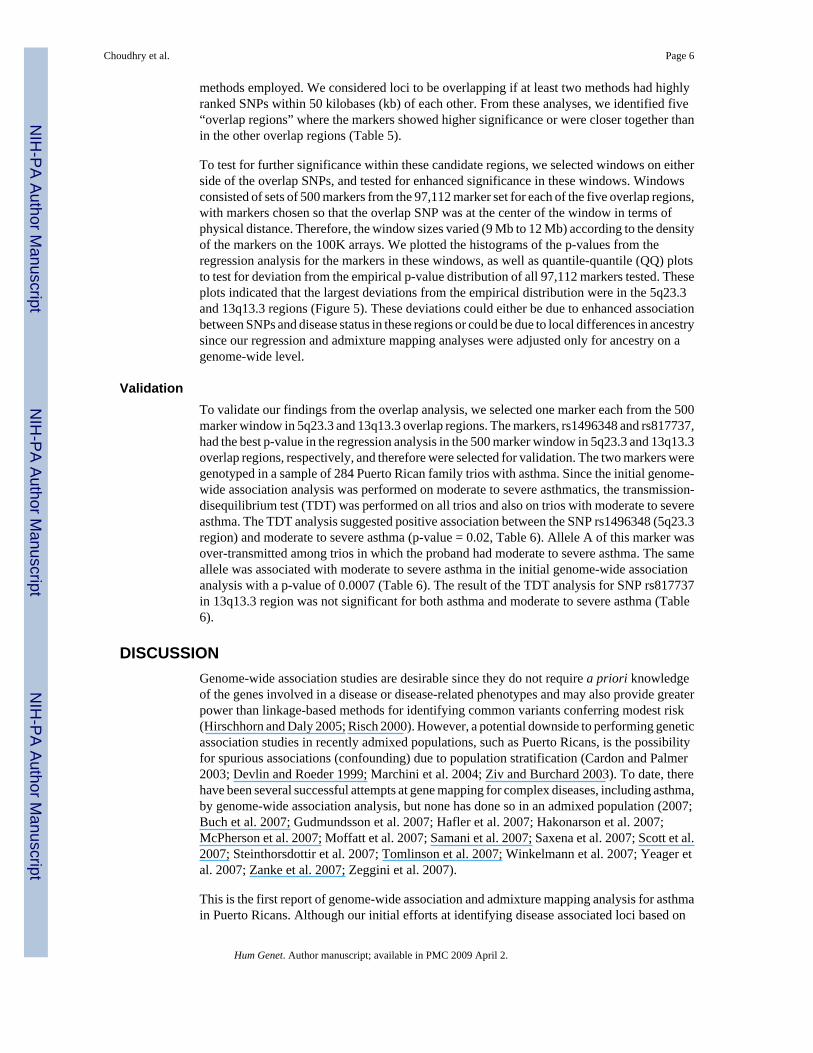
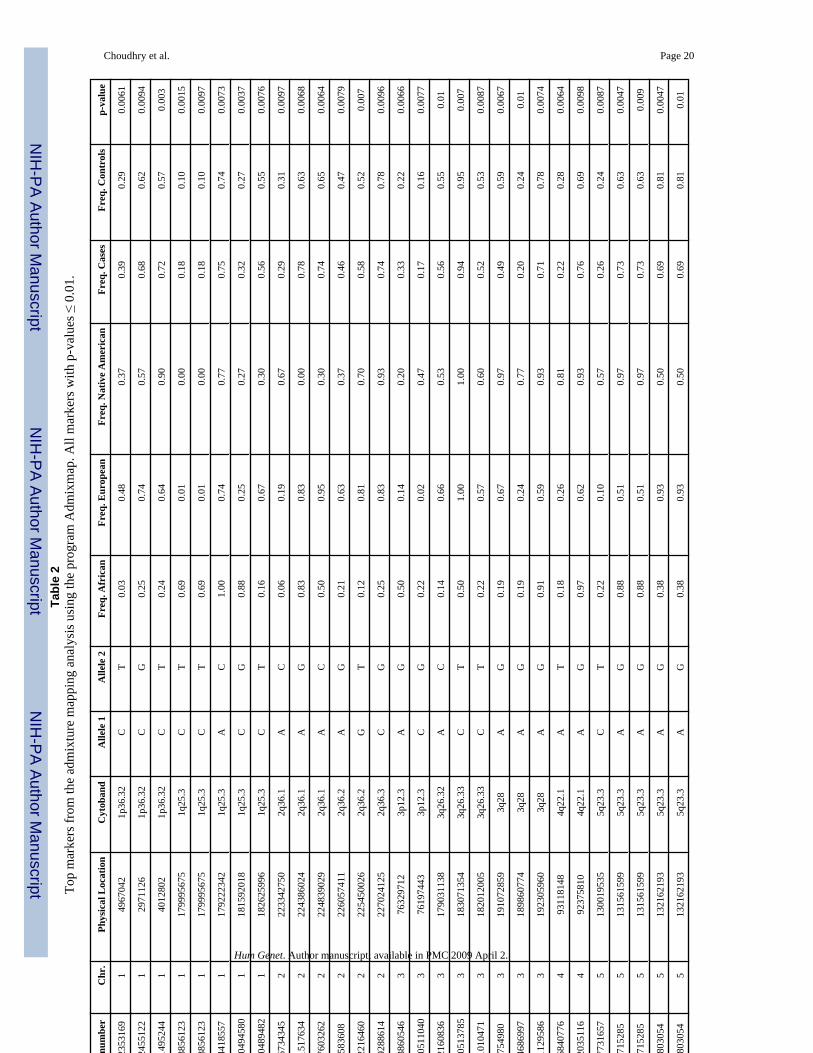
Admixture Mapping AnalysisNeither of the admixture mapping analyses (Admixmap or likelihood ratio test based onStructure output) gave any significant results after correction for multiple testing using theFDR approach (Figure 2 and 3). There were 56 markers that had an unadjusted p-value of <0.01 in the Admixmap analysis (Table 2) and 21 markers that gave a score of ≥ 10 in thelikelihood ratio tests before correction for multiple testing (Table 3).
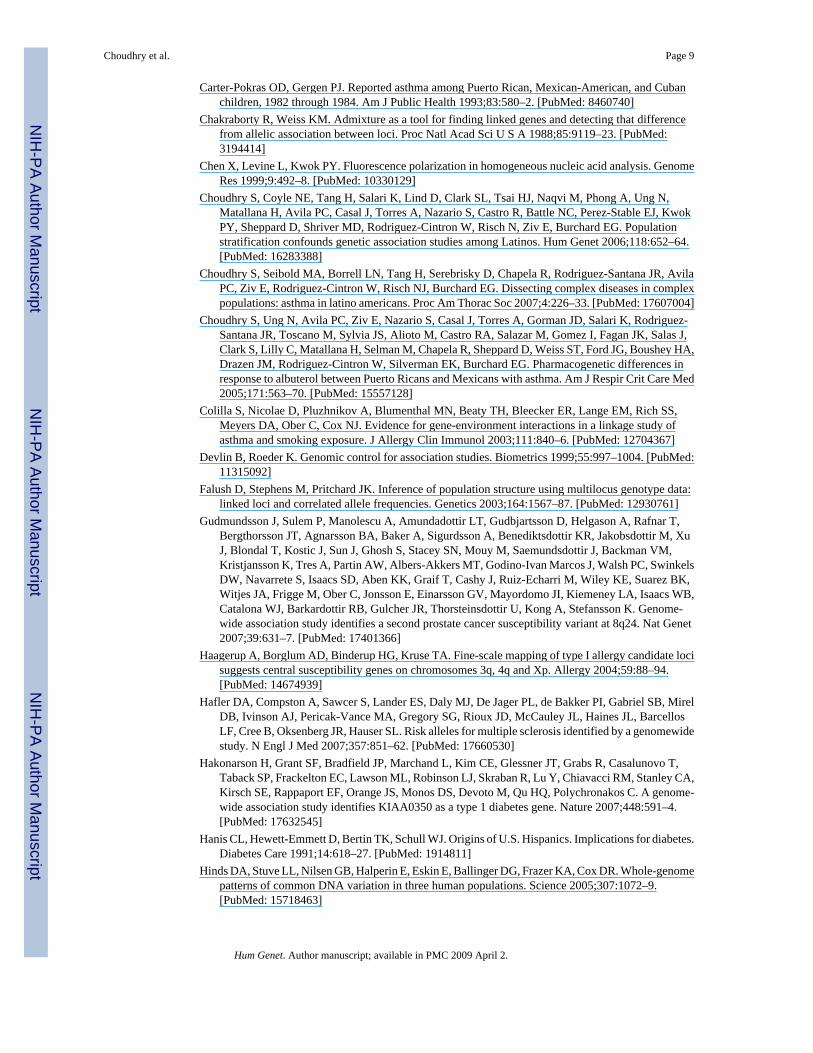
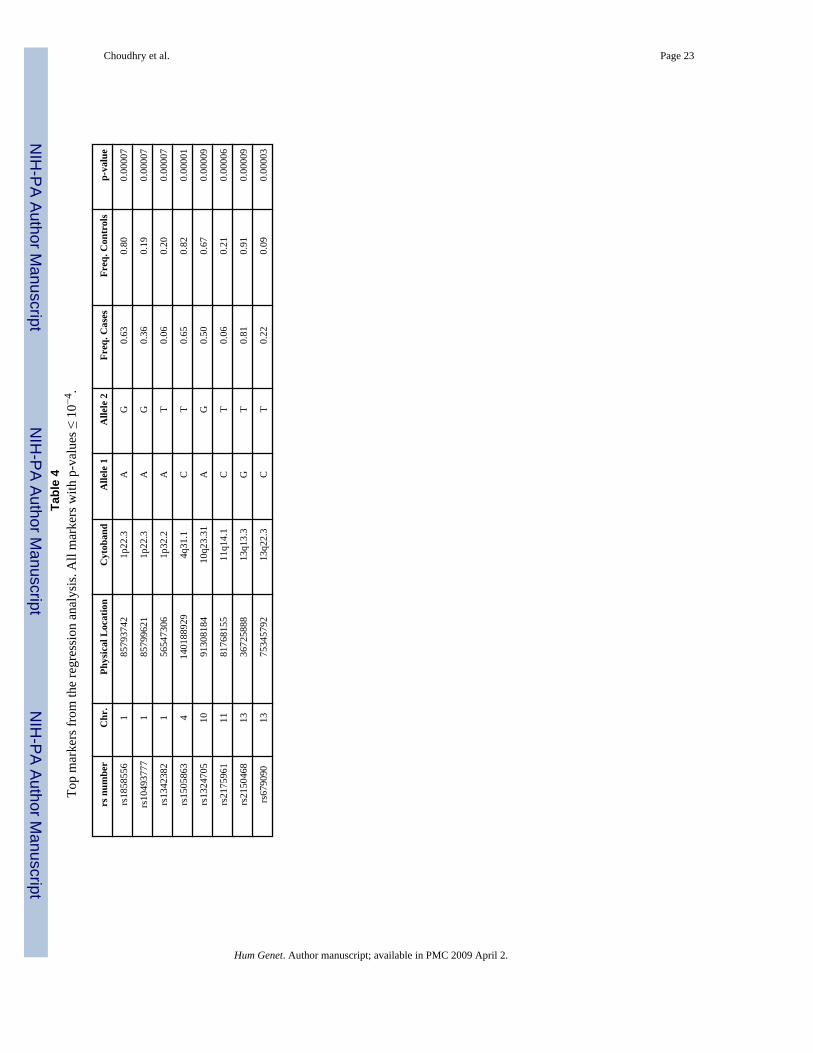
Individual SNP AnalysesEight SNPs had p-value of less than 10−4 in the regression analysis and were located onchromosomal regions 1p22.3, 1p32.2, 4q31.1, 10q23.31, 11q14.1, 13q13.3 and 13q22.3 (Table4). The smallest unadjusted p-value was 1.3 × 10⁻⁵ for a marker in chromosomal region 4q31.1.Taking into account the fact that 97,112 simultaneous hypothesis tests were conducted, noneof the markers showed statistically significant association with disease status after correctionfor multiple testing (Figure 4). However, it is still possible that some of the more significantmarkers did not have low enough p-values simply due to the low power of the study, and tofurther explore this possibility we ranked the markers based on the relative strength of theirassociation from the regression and admixture mapping analyses, and used these rankings forthe overlap analysis.
Overlap AnalysisFor the overlap analysis, we selected the highest ranked SNPs from each of the three analyticalmethods. We selected 81 SNPs with p-values ≤ 0.001 from the regression analysis, 56 SNPswith p-values ≤ 0.01 from the Admixmap analysis and 21 SNPs with a combined score of ≥10 from the likelihood ratio test. We then performed an overlap analysis on these SNPs andselected regions, which were identified as being highly ranked by at least two of the three
Choudhry et al. Page 5
Hum Genet. Author manuscript; available in PMC 2009 April 2.
NIH
-PA Author Manuscript
NIH
-PA Author Manuscript
NIH
-PA Author Manuscript
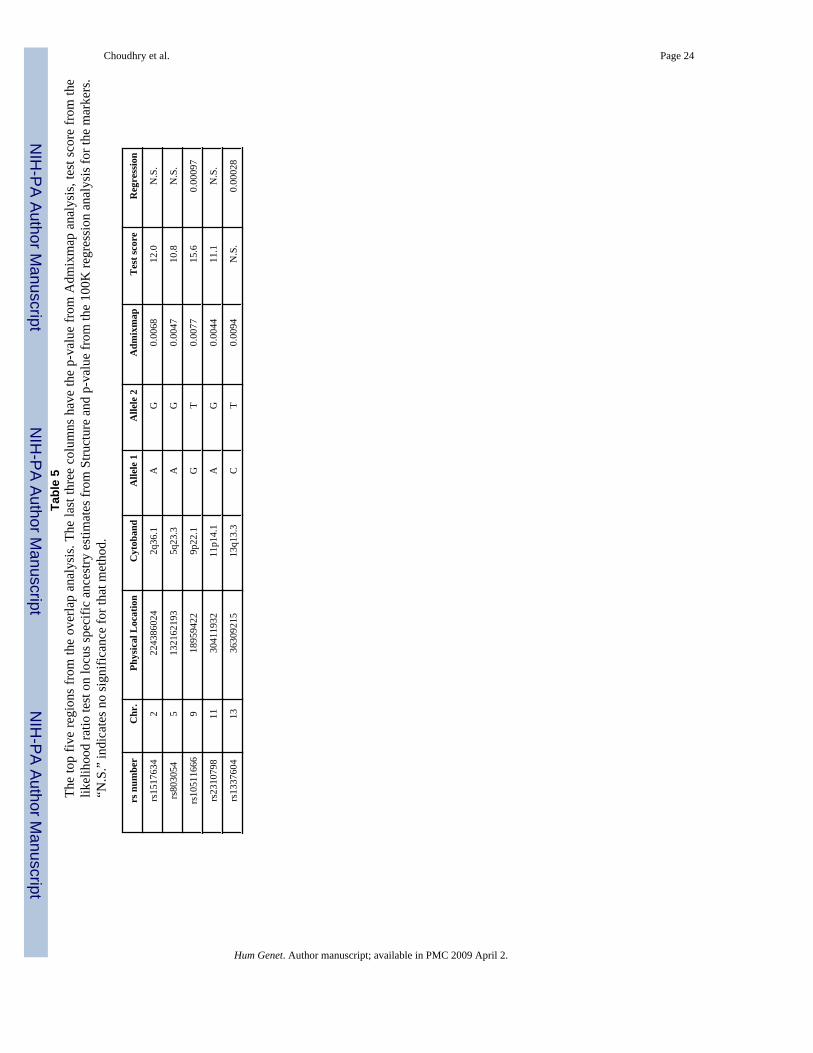
methods employed. We considered loci to be overlapping if at least two methods had highlyranked SNPs within 50 kilobases (kb) of each other. From these analyses, we identified five“overlap regions” where the markers showed higher significance or were closer together thanin the other overlap regions (Table 5).
To test for further significance within these candidate regions, we selected windows on eitherside of the overlap SNPs, and tested for enhanced significance in these windows. Windowsconsisted of sets of 500 markers from the 97,112 marker set for each of the five overlap regions,with markers chosen so that the overlap SNP was at the center of the window in terms ofphysical distance. Therefore, the window sizes varied (9 Mb to 12 Mb) according to the densityof the markers on the 100K arrays. We plotted the histograms of the p-values from theregression analysis for the markers in these windows, as well as quantile-quantile (QQ) plotsto test for deviation from the empirical p-value distribution of all 97,112 markers tested. Theseplots indicated that the largest deviations from the empirical distribution were in the 5q23.3and 13q13.3 regions (Figure 5). These deviations could either be due to enhanced associationbetween SNPs and disease status in these regions or could be due to local differences in ancestrysince our regression and admixture mapping analyses were adjusted only for ancestry on agenome-wide level.
ValidationTo validate our findings from the overlap analysis, we selected one marker each from the 500marker window in 5q23.3 and 13q13.3 overlap regions. The markers, rs1496348 and rs817737,had the best p-value in the regression analysis in the 500 marker window in 5q23.3 and 13q13.3overlap regions, respectively, and therefore were selected for validation. The two markers weregenotyped in a sample of 284 Puerto Rican family trios with asthma. Since the initial genome-wide association analysis was performed on moderate to severe asthmatics, the transmission-disequilibrium test (TDT) was performed on all trios and also on trios with moderate to severeasthma. The TDT analysis suggested positive association between the SNP rs1496348 (5q23.3region) and moderate to severe asthma (p-value = 0.02, Table 6). Allele A of this marker wasover-transmitted among trios in which the proband had moderate to severe asthma. The sameallele was associated with moderate to severe asthma in the initial genome-wide associationanalysis with a p-value of 0.0007 (Table 6). The result of the TDT analysis for SNP rs817737in 13q13.3 region was not significant for both asthma and moderate to severe asthma (Table6).
DISCUSSIONGenome-wide association studies are desirable since they do not require a priori knowledgeof the genes involved in a disease or disease-related phenotypes and may also provide greaterpower than linkage-based methods for identifying common variants conferring modest risk(Hirschhorn and Daly 2005; Risch 2000). However, a potential downside to performing geneticassociation studies in recently admixed populations, such as Puerto Ricans, is the possibilityfor spurious associations (confounding) due to population stratification (Cardon and Palmer2003; Devlin and Roeder 1999; Marchini et al. 2004; Ziv and Burchard 2003). To date, therehave been several successful attempts at gene mapping for complex diseases, including asthma,by genome-wide association analysis, but none has done so in an admixed population (2007;Buch et al. 2007; Gudmundsson et al. 2007; Hafler et al. 2007; Hakonarson et al. 2007;McPherson et al. 2007; Moffatt et al. 2007; Samani et al. 2007; Saxena et al. 2007; Scott et al.2007; Steinthorsdottir et al. 2007; Tomlinson et al. 2007; Winkelmann et al. 2007; Yeager etal. 2007; Zanke et al. 2007; Zeggini et al. 2007).
This is the first report of genome-wide association and admixture mapping analysis for asthmain Puerto Ricans. Although our initial efforts at identifying disease associated loci based on
Choudhry et al. Page 6
Hum Genet. Author manuscript; available in PMC 2009 April 2.
NIH
-PA Author Manuscript
NIH
-PA Author Manuscript
NIH
-PA Author Manuscript

marker-by-marker test statistics were limited by our small sample size, our validation analysisindicates that we could identify and validate regions that have been previously associated withasthma disease status by combining the strength from distinct but complementary analyticalmethods- direct genome wide association and admixture mapping. While the direct genomeassociation analysis can be performed on any population to identify genetic variants (bothethnic-specific and cosmopolitan) associated with a disease, admixture mapping methodologydetects genetic variants in recently admixed populations that are responsible for racialdifferences in disease risk. Compared to direct genome-wide association study designs,admixture mapping exploits long-range linkage disequilibrium that exists in recently admixedpopulations and therefore requires fewer markers (McKeigue 1998; Montana and Pritchard2004), and is more robust to allelic heterogeneity (Terwilliger and Weiss 1998). Although noneof our admixture mapping or genome-wide association analysis showed significant associationafter correction for multiple testing, it is likely that some of the top scoring markers fromdifferent analyses are true associations that did not reach statistical significance due to lowpower of our study. The overlap analysis combining the results of admixture mapping andgenome-wide association analysis did identify two regions, 5q23.3 and 13q13.3, as the mostpromising candidates for asthma in Puerto Ricans. But it is possible that this analysis missedother regions that could be better captured using one of the analytical methods than the other.
For a complex disease like asthma successful identification of causative factors will requirelarge and well characterized samples, as have been used in other successful genome-wideassociation studies for complex diseases. In addition, it should be noted that many differentfactors (genetic or environmental) may exist that contribute to the development and severityof asthma. While every effort was made to ensure homogeneity of the phenotype, the possibilitythat different individuals in our study may have different genetic factors contributing to diseasestill exists.
One lesson our analysis demonstrates is that association studies in admixed populations shouldinclude adjustments for ancestry. We have previously shown that there is evidence ofsubstantial confounding from population stratification in association studies of asthma inLatino populations (Choudhry et al. 2006). Here, we confirm our previous findings using amuch larger set of AIMs (n = 2730) suggesting that any association study of asthma in Latinopopulations should be tested and corrected for population stratification. In addition, we haveidentified AIMs on the Affymetrix 100K arrays for Latino populations, which may be helpfulfor future investigators intending to perform admixture mapping or genome-wide associationstudies in Latino populations, complementing three recent reports of Latino AdmixtureMapping panels (Mao et al. 2007; Price et al. 2007; Tian et al. 2007).
The excess of lower p-values than expected by chance in the 5q23.2 and 13q13.3 chromosomalregions may suggest the existence of asthma susceptibility loci in these regions in Puerto Ricanpopulation (Figure 5). Multiple genome-wide linkage studies for asthma and related atopicphenotypes have been performed in ethnically diverse populations. Although, the results ofthese linkage mappings varied across studies and across racial and ethnic groups, regions 5qand 13q are two of the few most frequently reproduced regions in these studies (Koppelmanet al. 2002;Ober et al. 1998;Ober et al. 2000;Wiltshire et al. 1998;Xu et al. 2000). It is interestingto note that these regions contain the asthma candidate genes IL4, IL13, and TGFβ, which havebeen studied extensively (Bartram and Speer 2004;Basehore et al. 2004;Battle 2007;Camoretti-Mercado and Solway 2005;Howard et al. 2002;Li et al. 2007;Marsh et al. 1994). In addition,these regions contain several new potential asthma candidate genes including IL3, IL5, IL9,SMAD5, IRF1, FBN2 and SMAD9 that warrant further investigation. In addition, our genome-wide association analysis suggests some other regions with low p-values that may be associatedwith asthma including 1p22.3, 1p32.2, 4q31.1, 10q23.31, 11q14.1 and 13q22.3 (Table 4). Someof these regions have been shown to be linked with asthma in previous studies (Colilla et al.
Choudhry et al. Page 7
Hum Genet. Author manuscript; available in PMC 2009 April 2.
NIH
-PA Author Manuscript
NIH
-PA Author Manuscript
NIH
-PA Author Manuscript

2003;Haagerup et al. 2004;Hoffjan and Ober 2002;Huang et al. 2003;Mathias et al. 2006;Pillaiet al. 2006;Postma et al. 2005). The detection of causative variants in these regions will requirefine mapping and functional validation.
Our results provide strong evidence that the previously linked 5q23 region is associated withasthma in Puerto Ricans. By finding an association in a previously identified region we providea “proof-of-principle” for genome-wide association studies in admixed populations. Our studyunderscores the value of applying complementary analytical techniques to admixedpopulations to uncover genetic risk factors for complex traits.
AcknowledgementsThe authors would like to acknowledge the families and the patients for their participation. We would also like tothank the numerous health care providers and community clinics for their support and participation in the GALAStudy. Finally, we would like to especially thank Jeffrey M. Drazen, M.D., Scott Weiss, M.D., Ed Silverman, M.D.,Ph.D., Homer A. Boushey, M.D., Jean G. Ford, M.D. and Dean Sheppard, M.D. for all of their effort towards thecreation of the GALA Study. This work was supported by National Institutes of Health (HL078885), RWJ AmosMedical Faculty Development Award, NCMHD Health Disparities Scholar, Extramural Clinical Research, LoanRepayment Program for Individuals from Disadvantaged Backgrounds, 2001–2003, to EGB), American ThoracicSociety “Breakthrough Opportunities in Lung Disease” (BOLD) Award and Tobacco-Related Disease ResearchProgram New Investigator Award (15KT-0008) to SC, and the Sandler Center for Basic Research in Asthma, theSandler Family Supporting Foundation and the Flight Attendant Medical Research Institute (FAMRI).
ReferencesGenome-wide association study of 14,000 cases of seven common diseases and 3,000 shared controls.
Nature 2007;447:661–78. [PubMed: 17554300]Bartram U, Speer CP. The role of transforming growth factor beta in lung development and disease. Chest
2004;125:754–65. [PubMed: 14769761]Basehore MJ, Howard TD, Lange LA, Moore WC, Hawkins GA, Marshik PL, Harkins MS, Meyers DA,
Bleecker ER. A comprehensive evaluation of IL4 variants in ethnically diverse populations:association of total serum IgE levels and asthma in white subjects. J Allergy Clin Immunol2004;114:80–7. [PubMed: 15241348]
Battle N, Choudhry S, Tsai HJ, Eng C, Kumar G, Beckman K, Naqvi M, Meade K, Watson HG, LeNoirM, González Burchard E. Ethnic Specific Gene-Gene Interaction between IL-13 and IL4R amongAfrican American Asthmatics. Am J Resp Crit Care Med. 2007in press
Benjamini Y, Yekutieli D. The control of the false discovery rate in multiple testing under dependency.The Annals of Statistics 2001;29:1165–88.
Buch S, Schafmayer C, Volzke H, Becker C, Franke A, von Eller-Eberstein H, Kluck C, Bassmann I,Brosch M, Lammert F, Miquel JF, Nervi F, Wittig M, Rosskopf D, Timm B, Holl C, Seeger M,ElSharawy A, Lu T, Egberts J, Fandrich F, Folsch UR, Krawczak M, Schreiber S, Nurnberg P, TepelJ, Hampe J. A genome-wide association scan identifies the hepatic cholesterol transporter ABCG8 asa susceptibility factor for human gallstone disease. Nat Genet 2007;39:995–9. [PubMed: 17632509]
Burchard EG, Avila PC, Nazario S, Casal J, Torres A, Rodriguez-Santana JR, Toscano M, Sylvia JS,Alioto M, Salazar M, Gomez I, Fagan JK, Salas J, Lilly C, Matallana H, Ziv E, Castro R, Selman M,Chapela R, Sheppard D, Weiss ST, Ford JG, Boushey HA, Rodriguez-Cintron W, Drazen JM,Silverman EK. Lower bronchodilator responsiveness in Puerto Rican than in Mexican subjects withasthma. Am J Respir Crit Care Med 2004;169:386–92. [PubMed: 14617512]
Burchard EG, Ziv E, Coyle N, Gomez SL, Tang H, Karter AJ, Mountain JL, Perez-Stable EJ, SheppardD, Risch N. The importance of race and ethnic background in biomedical research and clinical practice.N Engl J Med 2003;348:1170–5. [PubMed: 12646676]
Camoretti-Mercado B, Solway J. Transforming growth factor-beta1 and disorders of the lung. CellBiochem Biophys 2005;43:131–48. [PubMed: 16043890]
Cardon LR, Palmer LJ. Population stratification and spurious allelic association. Lancet 2003;361:598–604. [PubMed: 12598158]
Choudhry et al. Page 8
Hum Genet. Author manuscript; available in PMC 2009 April 2.
NIH
-PA Author Manuscript
NIH
-PA Author Manuscript
NIH
-PA Author Manuscript
Carter-Pokras OD, Gergen PJ. Reported asthma among Puerto Rican, Mexican-American, and Cubanchildren, 1982 through 1984. Am J Public Health 1993;83:580–2. [PubMed: 8460740]
Chakraborty R, Weiss KM. Admixture as a tool for finding linked genes and detecting that differencefrom allelic association between loci. Proc Natl Acad Sci U S A 1988;85:9119–23. [PubMed:3194414]
Chen X, Levine L, Kwok PY. Fluorescence polarization in homogeneous nucleic acid analysis. GenomeRes 1999;9:492–8. [PubMed: 10330129]
Choudhry S, Coyle NE, Tang H, Salari K, Lind D, Clark SL, Tsai HJ, Naqvi M, Phong A, Ung N,Matallana H, Avila PC, Casal J, Torres A, Nazario S, Castro R, Battle NC, Perez-Stable EJ, KwokPY, Sheppard D, Shriver MD, Rodriguez-Cintron W, Risch N, Ziv E, Burchard EG. Populationstratification confounds genetic association studies among Latinos. Hum Genet 2006;118:652–64.[PubMed: 16283388]
Choudhry S, Seibold MA, Borrell LN, Tang H, Serebrisky D, Chapela R, Rodriguez-Santana JR, AvilaPC, Ziv E, Rodriguez-Cintron W, Risch NJ, Burchard EG. Dissecting complex diseases in complexpopulations: asthma in latino americans. Proc Am Thorac Soc 2007;4:226–33. [PubMed: 17607004]
Choudhry S, Ung N, Avila PC, Ziv E, Nazario S, Casal J, Torres A, Gorman JD, Salari K, Rodriguez-Santana JR, Toscano M, Sylvia JS, Alioto M, Castro RA, Salazar M, Gomez I, Fagan JK, Salas J,Clark S, Lilly C, Matallana H, Selman M, Chapela R, Sheppard D, Weiss ST, Ford JG, Boushey HA,Drazen JM, Rodriguez-Cintron W, Silverman EK, Burchard EG. Pharmacogenetic differences inresponse to albuterol between Puerto Ricans and Mexicans with asthma. Am J Respir Crit Care Med2005;171:563–70. [PubMed: 15557128]
Colilla S, Nicolae D, Pluzhnikov A, Blumenthal MN, Beaty TH, Bleecker ER, Lange EM, Rich SS,Meyers DA, Ober C, Cox NJ. Evidence for gene-environment interactions in a linkage study ofasthma and smoking exposure. J Allergy Clin Immunol 2003;111:840–6. [PubMed: 12704367]
Devlin B, Roeder K. Genomic control for association studies. Biometrics 1999;55:997–1004. [PubMed:11315092]
Falush D, Stephens M, Pritchard JK. Inference of population structure using multilocus genotype data:linked loci and correlated allele frequencies. Genetics 2003;164:1567–87. [PubMed: 12930761]
Gudmundsson J, Sulem P, Manolescu A, Amundadottir LT, Gudbjartsson D, Helgason A, Rafnar T,Bergthorsson JT, Agnarsson BA, Baker A, Sigurdsson A, Benediktsdottir KR, Jakobsdottir M, XuJ, Blondal T, Kostic J, Sun J, Ghosh S, Stacey SN, Mouy M, Saemundsdottir J, Backman VM,Kristjansson K, Tres A, Partin AW, Albers-Akkers MT, Godino-Ivan Marcos J, Walsh PC, SwinkelsDW, Navarrete S, Isaacs SD, Aben KK, Graif T, Cashy J, Ruiz-Echarri M, Wiley KE, Suarez BK,Witjes JA, Frigge M, Ober C, Jonsson E, Einarsson GV, Mayordomo JI, Kiemeney LA, Isaacs WB,Catalona WJ, Barkardottir RB, Gulcher JR, Thorsteinsdottir U, Kong A, Stefansson K. Genome-wide association study identifies a second prostate cancer susceptibility variant at 8q24. Nat Genet2007;39:631–7. [PubMed: 17401366]
Haagerup A, Borglum AD, Binderup HG, Kruse TA. Fine-scale mapping of type I allergy candidate locisuggests central susceptibility genes on chromosomes 3q, 4q and Xp. Allergy 2004;59:88–94.[PubMed: 14674939]
Hafler DA, Compston A, Sawcer S, Lander ES, Daly MJ, De Jager PL, de Bakker PI, Gabriel SB, MirelDB, Ivinson AJ, Pericak-Vance MA, Gregory SG, Rioux JD, McCauley JL, Haines JL, BarcellosLF, Cree B, Oksenberg JR, Hauser SL. Risk alleles for multiple sclerosis identified by a genomewidestudy. N Engl J Med 2007;357:851–62. [PubMed: 17660530]
Hakonarson H, Grant SF, Bradfield JP, Marchand L, Kim CE, Glessner JT, Grabs R, Casalunovo T,Taback SP, Frackelton EC, Lawson ML, Robinson LJ, Skraban R, Lu Y, Chiavacci RM, Stanley CA,Kirsch SE, Rappaport EF, Orange JS, Monos DS, Devoto M, Qu HQ, Polychronakos C. A genome-wide association study identifies KIAA0350 as a type 1 diabetes gene. Nature 2007;448:591–4.[PubMed: 17632545]
Hanis CL, Hewett-Emmett D, Bertin TK, Schull WJ. Origins of U.S. Hispanics. Implications for diabetes.Diabetes Care 1991;14:618–27. [PubMed: 1914811]
Hinds DA, Stuve LL, Nilsen GB, Halperin E, Eskin E, Ballinger DG, Frazer KA, Cox DR. Whole-genomepatterns of common DNA variation in three human populations. Science 2005;307:1072–9.[PubMed: 15718463]
Choudhry et al. Page 9
Hum Genet. Author manuscript; available in PMC 2009 April 2.
NIH
-PA Author Manuscript
NIH
-PA Author Manuscript
NIH
-PA Author Manuscript

Hirschhorn JN, Daly MJ. Genome-wide association studies for common diseases and complex traits. NatRev Genet 2005;6:95–108. [PubMed: 15716906]
Hoffjan S, Ober C. Present status on the genetic studies of asthma. Curr Opin Immunol 2002;14:709–17.[PubMed: 12413520]
Hoggart CJ, Parra EJ, Shriver MD, Bonilla C, Kittles RA, Clayton DG, McKeigue PM. Control ofconfounding of genetic associations in stratified populations. Am J Hum Genet 2003;72:1492–1504.[PubMed: 12817591]
Hoggart CJ, Shriver MD, Kittles RA, Clayton DG, McKeigue PM. Design and analysis of admixturemapping studies. Am J Hum Genet 2004;74:965–78. [PubMed: 15088268]
Homa DM, Mannino DM, Lara M. Asthma mortality in U.S. Hispanics of Mexican, Puerto Rican, andCuban heritage, 1990–1995. Am J Respir Crit Care Med 2000;161:504–9. [PubMed: 10673193]
Howard TD, Koppelman GH, Xu J, Zheng SL, Postma DS, Meyers DA, Bleecker ER. Gene-geneinteraction in asthma: IL4RA and IL13 in a Dutch population with asthma. Am J Hum Genet2002;70:230–6. [PubMed: 11709756]
Huang SK, Mathias RA, Ehrlich E, Plunkett B, Liu X, Cutting GR, Wang XJ, Li XD, Togias A, BarnesKC, Malveaux F, Rich S, Mellen B, Lange E, Beaty TH. Asthma CSotGo. Evidence for asthmasusceptibility genes on chromosome 11 in an African-American population. Hum Genet2003;113:71–5. [PubMed: 12664305]
Kennedy GC, Matsuzaki H, Dong S, Liu WM, Huang J, Liu G, Su X, Cao M, Chen W, Zhang J, Liu W,Yang G, Di X, Ryder T, He Z, Surti U, Phillips MS, Boyce-Jacino MT, Fodor SP, Jones KW. Large-scale genotyping of complex DNA. Nat Biotechnol 2003;21:1233–7. [PubMed: 12960966]
Koppelman GH, Stine OC, Xu J, Howard TD, Zheng SL, Kauffman HF, Bleecker ER, Meyers DA,Postma DS. Genome-wide search for atopy susceptibility genes in Dutch families with asthma. JAllergy Clin Immunol 2002;109:498–506. [PubMed: 11897998]
Laird NM, Horvath S, Xu X. Implementing a unified approach to family-based tests of association. GenetEpidemiol 2000;19 Suppl 1:S36–42. [PubMed: 11055368]
Li H, Romieu I, Wu H, Sienra-Monge JJ, Ramirez-Aguilar M, Del Rio-Navarro BE, Del Lara-SanchezIC, Kistner EO, Gjessing HK, London SJ. Genetic polymorphisms in transforming growth factorbeta-1 (TGFB1) and childhood asthma and atopy. Hum Genet. 2007
Lind DL, Choudhry S, Ung N, Ziv E, Avila PC, Salari K, Ha C, Lovins EG, Coyle NE, Nazario S, CasalJ, Torres A, Rodriguez-Santana JR, Matallana H, Lilly CM, Salas J, Selman M, Boushey HA, WeissST, Chapela R, Ford JG, Rodriguez-Cintron W, Silverman EK, Sheppard D, Kwok PY, GonzalezBurchard E. ADAM33 is not associated with asthma in Puerto Rican or Mexican populations. Am JRespir Crit Care Med 2003;168:1312–6. [PubMed: 12958057]
Mao X, Bigham AW, Mei R, Gutierrez G, Weiss KM, Brutsaert TD, Leon-Velarde F, Moore LG, VargasE, McKeigue PM, Shriver MD, Parra EJ. A genomewide admixture mapping panel for Hispanic/Latino populations. Am J Hum Genet 2007;80:1171–8. [PubMed: 17503334]
Marchini J, Cardon LR, Phillips MS, Donnelly P. The effects of human population structure on largegenetic association studies. Nat Genet 2004;36:512–7. [PubMed: 15052271]
Marsh DG, Neely JD, Breazeale DR, Ghosh B, Freidhoff LR, Ehrlich-Kautzky E, Schou C,Krishnaswamy G, Beaty TH. Linkage analysis of IL4 and other chromosome 5q31.1 markers andtotal serum immunoglobulin E concentrations. Science 1994;264:1152–6. [PubMed: 8178175]
Mathias RA, Gao P, Goldstein JL, Wilson AF, Pugh EW, Furbert-Harris P, Dunston GM, Malveaux FJ,Togias A, Barnes KC, Beaty TH, Huang SK. A graphical assessment of p-values from sliding windowhaplotype tests of association to identify asthma susceptibility loci on chromosome 11q. BMC Genet2006;7:38. [PubMed: 16774684]
Matsuzaki H, Dong S, Loi H, Di X, Liu G, Hubbell E, Law J, Berntsen T, Chadha M, Hui H, Yang G,Kennedy GC, Webster TA, Cawley S, Walsh PS, Jones KW, Fodor SP, Mei R. Genotyping over100,000 SNPs on a pair of oligonucleotide arrays. Nat Methods 2004;1:109–11. [PubMed: 15782172]
McKeigue PM. Mapping genes underlying ethnic differences in disease risk by linkage disequilibriumin recently admixed populations. Am J Hum Genet 1997;60:188–96. [PubMed: 8981962]
McKeigue PM. Mapping genes that underlie ethnic differences in disease risk: methods for detectinglinkage in admixed populations, by conditioning on parental admixture. Am J Hum Genet1998;63:241–51. [PubMed: 9634509]
Choudhry et al. Page 10
Hum Genet. Author manuscript; available in PMC 2009 April 2.
NIH
-PA Author Manuscript
NIH
-PA Author Manuscript
NIH
-PA Author Manuscript

McPherson R, Pertsemlidis A, Kavaslar N, Stewart A, Roberts R, Cox DR, Hinds DA, Pennacchio LA,Tybjaerg-Hansen A, Folsom AR, Boerwinkle E, Hobbs HH, Cohen JC. A common allele onchromosome 9 associated with coronary heart disease. Science 2007;316:1488–91. [PubMed:17478681]
Moffatt MF, Kabesch M, Liang L, Dixon AL, Strachan D, Heath S, Depner M, von Berg A, Bufe A,Rietschel E, Heinzmann A, Simma B, Frischer T, Willis-Owen SA, Wong KC, Illig T, Vogelberg C,Weiland SK, von Mutius E, Abecasis GR, Farrall M, Gut IG, Lathrop GM, Cookson WO. Geneticvariants regulating ORMDL3 expression contribute to the risk of childhood asthma. Nature2007;448:470–3. [PubMed: 17611496]
Montana G, Pritchard JK. Statistical tests for admixture mapping with case-control and cases-only data.Am J Hum Genet 2004;75:771–89. [PubMed: 15386213]
Ober C, Cox NJ, Abney M, Di Rienzo A, Lander ES, Changyaleket B, Gidley H, Kurtz B, Lee J, NanceM, Pettersson A, Prescott J, Richardson A, Schlenker E, Summerhill E, Willadsen S, Parry R.Genome-wide search for asthma susceptibility loci in a founder population. The Collaborative Studyon the Genetics of Asthma. Hum Mol Genet 1998;7:1393–8. [PubMed: 9700192]
Ober C, Tsalenko A, Parry R, Cox NJ. A second-generation genomewide screen for asthma-susceptibilityalleles in a founder population. Am J Hum Genet 2000;67:1154–62. [PubMed: 11022011]
Pfaff CL, Parra EJ, Bonilla C, Hiester K, McKeigue PM, Kamboh MI, Hutchinson RG, Ferrell RE,Boerwinkle E, Shriver MD. Population structure in admixed populations: effect of admixturedynamics on the pattern of linkage disequilibrium. Am J Hum Genet 2001;68:198–207. [PubMed:11112661]
Pillai SG, Chiano MN, White NJ, Speer M, Barnes KC, Carlsen K, Gerritsen J, Helms P, Lenney W,Silverman M, Sly P, Sundy J, Tsanakas J, von Berg A, Whyte M, Varsani S, Skelding P, Hauser M,Vance J, Pericak-Vance M, Burns DK, Middleton LT, Brewster SR, Anderson WH, Riley JH. Agenome-wide search for linkage to asthma phenotypes in the genetics of asthma international networkfamilies: evidence for a major susceptibility locus on chromosome 2p. Eur J Hum Genet2006;14:307–16. [PubMed: 16391567]
Postma DS, Meyers DA, Jongepier H, Howard TD, Koppelman GH, Bleecker ER. Genomewide screenfor pulmonary function in 200 families ascertained for asthma. Am J Respir Crit Care Med2005;172:446–52. [PubMed: 15901612]
Price AL, Patterson N, Yu F, Cox DR, Waliszewska A, McDonald GJ, Tandon A, Schirmer C, NeubauerJ, Bedoya G, Duque C, Villegas A, Bortolini MC, Salzano FM, Gallo C, Mazzotti G, Tello-Ruiz M,Riba L, Aguilar-Salinas CA, Canizales-Quinteros S, Menjivar M, Klitz W, Henderson B, HaimanCA, Winkler C, Tusie-Luna T, Ruiz-Linares A, Reich D. A genomewide admixture map for Latinopopulations. Am J Hum Genet 2007;80:1024–36. [PubMed: 17503322]
Pritchard JK, Stephens M, Donnelly P. Inference of population structure using multilocus genotype data.Genetics 2000;155:945–59. [PubMed: 10835412]
Risch NJ. Searching for genetic determinants in the new millennium. Nature 2000;405:847–56. [PubMed:10866211]
Samani NJ, Erdmann J, Hall AS, Hengstenberg C, Mangino M, Mayer B, Dixon RJ, Meitinger T, BraundP, Wichmann HE, Barrett JH, Konig IR, Stevens SE, Szymczak S, Tregouet DA, Iles MM, PahlkeF, Pollard H, Lieb W, Cambien F, Fischer M, Ouwehand W, Blankenberg S, Balmforth AJ, BaesslerA, Ball SG, Strom TM, Braenne I, Gieger C, Deloukas P, Tobin MD, Ziegler A, Thompson JR,Schunkert H. Genomewide association analysis of coronary artery disease. N Engl J Med2007;357:443–53. [PubMed: 17634449]
Saxena R, Voight BF, Lyssenko V, Burtt NP, de Bakker PI, Chen H, Roix JJ, Kathiresan S, HirschhornJN, Daly MJ, Hughes TE, Groop L, Altshuler D, Almgren P, Florez JC, Meyer J, Ardlie K, BengtssonBostrom K, Isomaa B, Lettre G, Lindblad U, Lyon HN, Melander O, Newton-Cheh C, Nilsson P,Orho-Melander M, Rastam L, Speliotes EK, Taskinen MR, Tuomi T, Guiducci C, Berglund A,Carlson J, Gianniny L, Hackett R, Hall L, Holmkvist J, Laurila E, Sjogren M, Sterner M, Surti A,Svensson M, Tewhey R, Blumenstiel B, Parkin M, Defelice M, Barry R, Brodeur W, Camarata J,Chia N, Fava M, Gibbons J, Handsaker B, Healy C, Nguyen K, Gates C, Sougnez C, Gage D, NizzariM, Gabriel SB, Chirn GW, Ma Q, Parikh H, Richardson D, Ricke D, Purcell S. Genome-wideassociation analysis identifies loci for type 2 diabetes and triglyceride levels. Science 2007;316:1331–6. [PubMed: 17463246]
Choudhry et al. Page 11
Hum Genet. Author manuscript; available in PMC 2009 April 2.
NIH
-PA Author Manuscript
NIH
-PA Author Manuscript
NIH
-PA Author Manuscript
Scott LJ, Mohlke KL, Bonnycastle LL, Willer CJ, Li Y, Duren WL, Erdos MR, Stringham HM, ChinesPS, Jackson AU, Prokunina-Olsson L, Ding CJ, Swift AJ, Narisu N, Hu T, Pruim R, Xiao R, Li XY,Conneely KN, Riebow NL, Sprau AG, Tong M, White PP, Hetrick KN, Barnhart MW, Bark CW,Goldstein JL, Watkins L, Xiang F, Saramies J, Buchanan TA, Watanabe RM, Valle TT, KinnunenL, Abecasis GR, Pugh EW, Doheny KF, Bergman RN, Tuomilehto J, Collins FS, Boehnke M. Agenome-wide association study of type 2 diabetes in Finns detects multiple susceptibility variants.Science 2007;316:1341–5. [PubMed: 17463248]
Smith MW, O’Brien SJ. Mapping by admixture linkage disequilibrium: advances, limitations andguidelines. Nat Rev Genet 2005;6:623–32. [PubMed: 16012528]
Smith MW, Patterson N, Lautenberger JA, Truelove AL, McDonald GJ, Waliszewska A, Kessing BD,Malasky MJ, Scafe C, Le E, De Jager PL, Mignault AA, Yi Z, De The G, Essex M, Sankale JL,Moore JH, Poku K, Phair JP, Goedert JJ, Vlahov D, Williams SM, Tishkoff SA, Winkler CA, De LaVega FM, Woodage T, Sninsky JJ, Hafler DA, Altshuler D, Gilbert DA, O’Brien SJ, Reich D. Ahigh-density admixture map for disease gene discovery in african americans. Am J Hum Genet2004;74:1001–13. [PubMed: 15088270]
Steinthorsdottir V, Thorleifsson G, Reynisdottir I, Benediktsson R, Jonsdottir T, Walters GB,Styrkarsdottir U, Gretarsdottir S, Emilsson V, Ghosh S, Baker A, Snorradottir S, Bjarnason H, NgMC, Hansen T, Bagger Y, Wilensky RL, Reilly MP, Adeyemo A, Chen Y, Zhou J, Gudnason V,Chen G, Huang H, Lashley K, Doumatey A, So WY, Ma RC, Andersen G, Borch-Johnsen K,Jorgensen T, van Vliet-Ostaptchouk JV, Hofker MH, Wijmenga C, Christiansen C, Rader DJ, RotimiC, Gurney M, Chan JC, Pedersen O, Sigurdsson G, Gulcher JR, Thorsteinsdottir U, Kong A,Stefansson K. A variant in CDKAL1 influences insulin response and risk of type 2 diabetes. NatGenet 2007;39:770–5. [PubMed: 17460697]
Stephens JC, Briscoe D, O’Brien SJ. Mapping by admixture linkage disequilibrium in human populations:limits and guidelines. Am J Hum Genet 1994;55:809–24. [PubMed: 7942858]
Terwilliger JD, Weiss KM. Linkage disequilibrium mapping of complex disease: fantasy or reality? CurrOpin Biotechnol 1998;9:578–94. [PubMed: 9889136]
Tian C, Hinds DA, Shigeta R, Adler SG, Lee A, Pahl MV, Silva G, Belmont JW, Hanson RL, KnowlerWC, Gregersen PK, Ballinger DG, Seldin MF. A genomewide single-nucleotide-polymorphismpanel for Mexican American admixture mapping. Am J Hum Genet 2007;80:1014–23. [PubMed:17557415]
Tomlinson I, Webb E, Carvajal-Carmona L, Broderick P, Kemp Z, Spain S, Penegar S, Chandler I,Gorman M, Wood W, Barclay E, Lubbe S, Martin L, Sellick G, Jaeger E, Hubner R, Wild R, RowanA, Fielding S, Howarth K, Silver A, Atkin W, Muir K, Logan R, Kerr D, Johnstone E, Sieber O,Gray R, Thomas H, Peto J, Cazier JB, Houlston R. A genome-wide association scan of tag SNPsidentifies a susceptibility variant for colorectal cancer at 8q24.21. Nat Genet 2007;39:984–8.[PubMed: 17618284]
Wiltshire S, Bhattacharyya S, Faux JA, Leaves NI, Daniels SE, Moffatt MF, James A, Musk AW,Cookson WO. A genome scan for loci influencing total serum immunoglobulin levels: possiblelinkage of IgA to the chromosome 13 atopy locus. Hum Mol Genet 1998;7:27–31. [PubMed:9384600]
Winkelmann J, Schormair B, Lichtner P, Ripke S, Xiong L, Jalilzadeh S, Fulda S, Putz B, Eckstein G,Hauk S, Trenkwalder C, Zimprich A, Stiasny-Kolster K, Oertel W, Bachmann CG, Paulus W, PeglauI, Eisensehr I, Montplaisir J, Turecki G, Rouleau G, Gieger C, Illig T, Wichmann HE, Holsboer F,Muller-Myhsok B, Meitinger T. Genome-wide association study of restless legs syndrome identifiescommon variants in three genomic regions. Nat Genet 2007;39:1000–6. [PubMed: 17637780]
Xu J, Postma DS, Howard TD, Koppelman GH, Zheng SL, Stine OC, Bleecker ER, Meyers DA. Majorgenes regulating total serum immunoglobulin E levels in families with asthma. Am J Hum Genet2000;67:1163–73. [PubMed: 11023809]
Yeager M, Orr N, Hayes RB, Jacobs KB, Kraft P, Wacholder S, Minichiello MJ, Fearnhead P, Yu K,Chatterjee N, Wang Z, Welch R, Staats BJ, Calle EE, Feigelson HS, Thun MJ, Rodriguez C, AlbanesD, Virtamo J, Weinstein S, Schumacher FR, Giovannucci E, Willett WC, Cancel-Tassin G, CussenotO, Valeri A, Andriole GL, Gelmann EP, Tucker M, Gerhard DS, Fraumeni JF Jr, Hoover R, HunterDJ, Chanock SJ, Thomas G. Genome-wide association study of prostate cancer identifies a secondrisk locus at 8q24. Nat Genet 2007;39:645–9. [PubMed: 17401363]
Choudhry et al. Page 12
Hum Genet. Author manuscript; available in PMC 2009 April 2.
NIH
-PA Author Manuscript
NIH
-PA Author Manuscript
NIH
-PA Author Manuscript
Zanke BW, Greenwood CM, Rangrej J, Kustra R, Tenesa A, Farrington SM, Prendergast J, OlschwangS, Chiang T, Crowdy E, Ferretti V, Laflamme P, Sundararajan S, Roumy S, Olivier JF, Robidoux F,Sladek R, Montpetit A, Campbell P, Bezieau S, O’Shea AM, Zogopoulos G, Cotterchio M, NewcombP, McLaughlin J, Younghusband B, Green R, Green J, Porteous ME, Campbell H, Blanche H,Sahbatou M, Tubacher E, Bonaiti-Pellie C, Buecher B, Riboli E, Kury S, Chanock SJ, Potter J,Thomas G, Gallinger S, Hudson TJ, Dunlop MG. Genome-wide association scan identifies acolorectal cancer susceptibility locus on chromosome 8q24. Nat Genet 2007;39:989–94. [PubMed:17618283]
Zeggini E, Weedon MN, Lindgren CM, Frayling TM, Elliott KS, Lango H, Timpson NJ, Perry JR, RaynerNW, Freathy RM, Barrett JC, Shields B, Morris AP, Ellard S, Groves CJ, Harries LW, Marchini JL,Owen KR, Knight B, Cardon LR, Walker M, Hitman GA, Morris AD, Doney AS, McCarthy MI,Hattersley AT. Replication of genome-wide association signals in UK samples reveals risk loci fortype 2 diabetes. Science 2007;316:1336–41. [PubMed: 17463249]
Ziv E, Burchard EG. Human population structure and genetic association studies. Pharmacogenomics2003;4:431–41. [PubMed: 12831322]
Choudhry et al. Page 13
Hum Genet. Author manuscript; available in PMC 2009 April 2.
NIH
-PA Author Manuscript
NIH
-PA Author Manuscript
NIH
-PA Author Manuscript
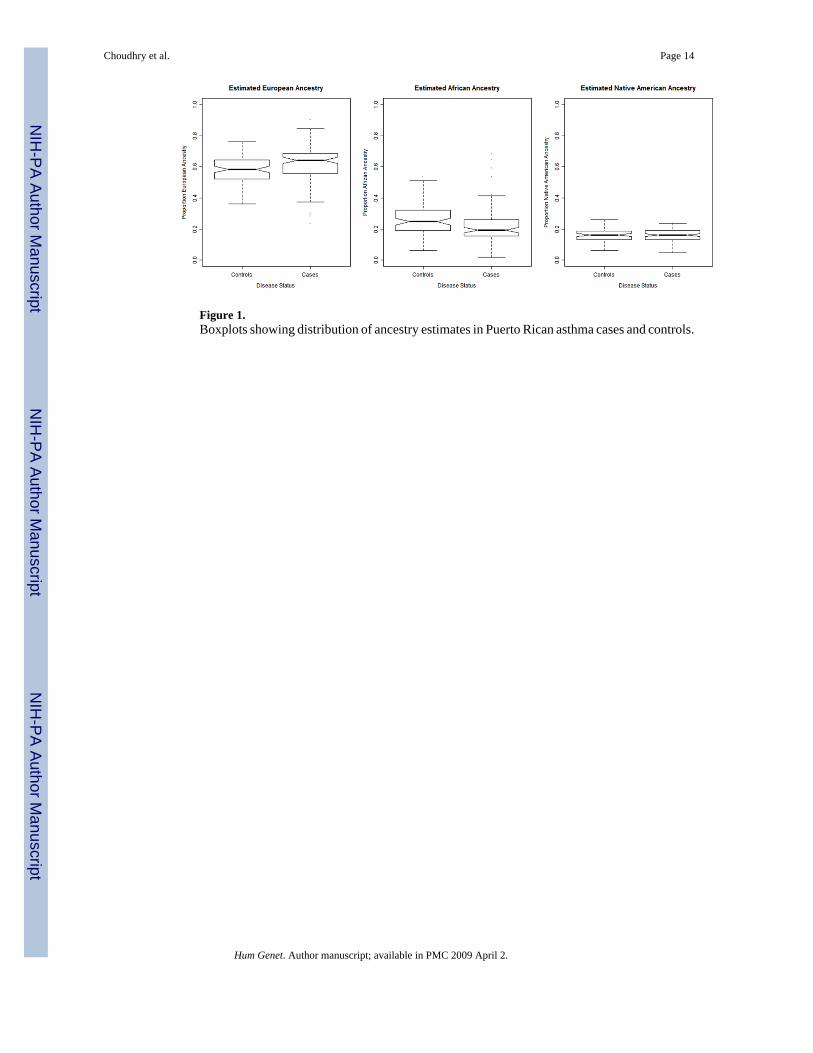
Figure 1.Boxplots showing distribution of ancestry estimates in Puerto Rican asthma cases and controls.
Choudhry et al. Page 14
Hum Genet. Author manuscript; available in PMC 2009 April 2.
NIH
-PA Author Manuscript
NIH
-PA Author Manuscript
NIH
-PA Author Manuscript

Figure 2.Distribution of p-values for 2730 AIMs across the chromosomes from admixture mappinganalysis using the program Admixmap.
Choudhry et al. Page 15
Hum Genet. Author manuscript; available in PMC 2009 April 2.
NIH
-PA Author Manuscript
NIH
-PA Author Manuscript
NIH
-PA Author Manuscript
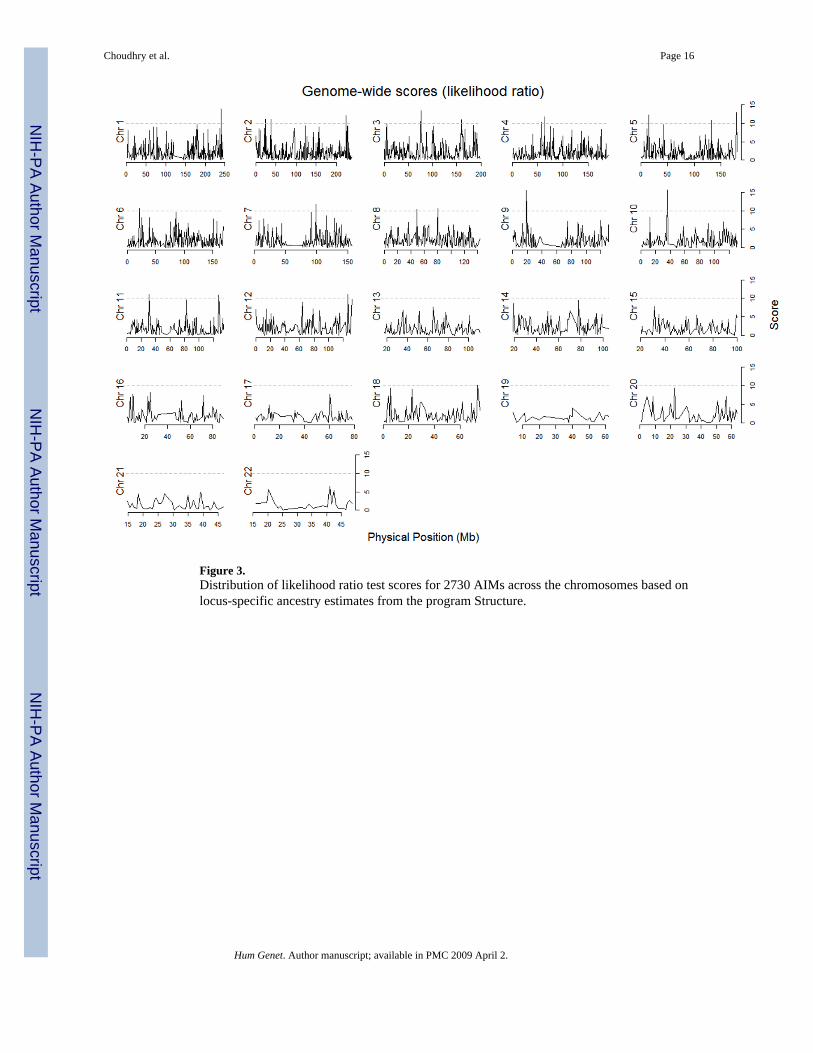
Figure 3.Distribution of likelihood ratio test scores for 2730 AIMs across the chromosomes based onlocus-specific ancestry estimates from the program Structure.
Choudhry et al. Page 16
Hum Genet. Author manuscript; available in PMC 2009 April 2.
NIH
-PA Author Manuscript
NIH
-PA Author Manuscript
NIH
-PA Author Manuscript

Figure 4.Distribution of p-values for 97,112 markers across the chromosomes from asthma case-controlregression analysis.
Choudhry et al. Page 17
Hum Genet. Author manuscript; available in PMC 2009 April 2.
NIH
-PA Author Manuscript
NIH
-PA Author Manuscript
NIH
-PA Author Manuscript

Figure 5.Plots showing histograms of p-values for the markers from the top five regions from the overlapanalysis and quantile-quantile (QQ) plots of these p-values against all p-values from the 100Kregression analysis.
Choudhry et al. Page 18
Hum Genet. Author manuscript; available in PMC 2009 April 2.
NIH
-PA Author Manuscript
NIH
-PA Author Manuscript
NIH
-PA Author Manuscript

NIH
-PA Author Manuscript
NIH
-PA Author Manuscript
NIH
-PA Author Manuscript
Choudhry et al. Page 19Ta
ble
1A
nces
try in
form
ativ
e m
arke
rs (A
IMs)
iden
tifie
d us
ing
the
Aff
ymet
rix G
eneC
hip
Hum
an M
appi
ng 1
00K
arr
ay se
t.
Mar
ker
Info
rmat
iven
ess
Wes
tA
fric
an-
Eur
opea
nan
cest
rype
rcen
t of m
arke
rs
Wes
tA
fric
an-
Nat
ive
Am
eric
anan
cest
rype
rcen
t of m
arke
rsE
urop
ean-
Nat
ive
Am
eric
an a
nces
try
perc
ent o
f mar
kers
δ >
0.5
5781
4.98
%82
427.
09%
5040
4.34
%
δ >
0.4
1081
09.
30%
1281
911
.03%
9602
8.26
%
δ >
0.3
1929
216
.60%
1947
716
.76%
1730
614
.89%
Hum Genet. Author manuscript; available in PMC 2009 April 2.
NIH
-PA Author Manuscript
NIH
-PA Author Manuscript
NIH
-PA Author Manuscript
Choudhry et al. Page 20Ta
ble
2To
p m
arke
rs fr
om th
e ad
mix
ture
map
ping
ana
lysi
s usi
ng th
e pr
ogra
m A
dmix
map
. All
mar
kers
with
p-v
alue
s ≤ 0
.01.
rs n
umbe
rC
hr.
Phys
ical
Loc
atio
nC
ytob
and
Alle
le 1
Alle
le 2
Freq
. Afr
ican
Freq
. Eur
opea
nFr
eq. N
ativ
e A
mer
ican
Freq
. Cas
esFr
eq. C
ontr
ols
p-va
lue
rs23
5316
91
4967
042
1p36
.32
CT
0.03
0.48
0.37
0.39
0.29
0.00
61
rs24
5512
21
2971
126
1p36
.32
CG
0.25
0.74
0.57
0.68
0.62
0.00
94
rs14
9524
41
4012
802
1p36
.32
CT
0.24
0.64
0.90
0.72
0.57
0.00
3
rs38
5612
31
1799
9567
51q
25.3
CT
0.69
0.01
0.00
0.18
0.10
0.00
15
rs38
5612
31
1799
9567
51q
25.3
CT
0.69
0.01
0.00
0.18
0.10
0.00
97
rs44
1855
71
1792
2234
21q
25.3
AC
1.00
0.74
0.77
0.75
0.74
0.00
73
rs10
4945
801
1815
9201
81q
25.3
CG
0.88
0.25
0.27
0.32
0.27
0.00
37
rs10
4894
821
1826
2599
61q
25.3
CT
0.16
0.67
0.30
0.56
0.55
0.00
76
rs67
3434
52
2233
4275
02q
36.1
AC
0.06
0.19
0.67
0.29
0.31
0.00
97
rs15
1763
42
2243
8602
42q
36.1
AG
0.83
0.83
0.00
0.78
0.63
0.00
68
rs76
0326
22
2248
3902
92q
36.1
AC
0.50
0.95
0.30
0.74
0.65
0.00
64
rs58
3608
222
6057
411
2q36
.2A
G0.
210.
630.
370.
460.
470.
0079
rs22
1646
02
2254
5002
62q
36.2
GT
0.12
0.81
0.70
0.58
0.52
0.00
7
rs92
8861
42
2270
2412
52q
36.3
CG
0.25
0.83
0.93
0.74
0.78
0.00
96
rs38
6054
63
7632
9712
3p12
.3A
G0.
500.
140.
200.
330.
220.
0066
rs10
5110
403
7619
7443
3p12
.3C
G0.
220.
020.
470.
170.
160.
0077
rs21
6083
63
1790
3113
83q
26.3
2A
C0.
140.
660.
530.
560.
550.
01
rs10
5137
853
1830
7135
43q
26.3
3C
T0.
501.
001.
000.
940.
950.
007
rs10
1047
13
1820
1200
53q
26.3
3C
T0.
220.
570.
600.
520.
530.
0087
rs75
4980
319
1072
859
3q28
AG
0.19
0.67
0.97
0.49
0.59
0.00
67
rs46
8699
73
1898
6077
43q
28A
G0.
190.
240.
770.
200.
240.
01
rs11
2958
63
1923
0596
03q
28A
G0.
910.
590.
930.
710.
780.
0074
rs68
4077
64
9311
8148
4q22
.1A
T0.
180.
260.
810.
220.
280.
0064
rs20
3511
64
9237
5810
4q22
.1A
G0.
970.
620.
930.
760.
690.
0098
rs77
3165
75
1300
1953
55q
23.3
CT
0.22
0.10
0.57
0.26
0.24
0.00
87
rs71
5285
513
1561
599
5q23
.3A
G0.
880.
510.
970.
730.
630.
0047
rs71
5285
513
1561
599
5q23
.3A
G0.
880.
510.
970.
730.
630.
009
rs80
3054
513
2162
193
5q23
.3A
G0.
380.
930.
500.
690.
810.
0047
rs80
3054
513
2162
193
5q23
.3A
G0.
380.
930.
500.
690.
810.
01
Hum Genet. Author manuscript; available in PMC 2009 April 2.

NIH
-PA Author Manuscript
NIH
-PA Author Manuscript
NIH
-PA Author Manuscript
Choudhry et al. Page 21rs
num
ber
Chr
.Ph
ysic
al L
ocat
ion
Cyt
oban
dA
llele
1A
llele
2Fr
eq. A
fric
anFr
eq. E
urop
ean
Freq
. Nat
ive
Am
eric
anFr
eq. C
ases
Freq
. Con
trol
sp-
valu
e
rs79
8415
513
0769
939
5q23
.3A
C0.
830.
840.
200.
780.
800.
0058
rs10
4912
935
1330
6611
35q
31.1
CG
0.97
0.90
0.47
0.82
0.81
0.00
8
rs13
3911
06
1507
2954
56q
25.1
CG
0.26
0.02
0.25
0.13
0.21
0.00
99
rs35
9819
847
2632
918q
11.1
AG
0.58
0.99
0.50
0.80
0.83
0.00
8
rs69
8460
98
4963
9545
8q11
.21
CT
0.58
0.02
0.17
0.24
0.26
0.00
32
rs13
8483
08
5159
4553
8q11
.21
CT
0.78
0.04
0.23
0.18
0.28
0.00
98
rs78
3074
38
4876
0915
8q11
.21
AG
0.67
1.00
0.30
0.72
0.86
0.00
22
rs13
5675
28
5040
0830
8q11
.21
CT
0.42
0.95
0.97
0.84
0.80
0.00
48
rs48
7310
28
4840
2365
8q11
.21
AG
0.97
0.50
0.70
0.59
0.57
0.00
27
rs10
5116
669
1895
9422
9p22
.1G
T0.
670.
110.
070.
230.
130.
0077
rs92
9879
19
1830
8754
9p22
.2C
G0.
060.
350.
830.
360.
370.
01
rs26
1679
611
3115
2138
11p1
3C
G0.
611.
000.
470.
920.
930.
0049
rs22
4603
1131
9423
2011
p13
CG
0.56
0.26
0.63
0.35
0.45
0.00
24
rs10
0222
911
3201
7316
11p1
3A
T0.
470.
140.
670.
230.
320.
0025
rs10
4887
8811
2944
1909
11p1
4.1
AT
0.19
0.07
0.47
0.14
0.13
0.00
67
rs23
1079
811
3041
1932
11p1
4.1
AG
0.64
0.13
0.07
0.14
0.30
0.00
44
rs49
8080
412
1321
9012
p13.
33C
T0.
140.
520.
700.
490.
350.
0024
rs20
5185
212
8722
8012
p13.
33C
T0.
640.
630.
890.
740.
650.
0024
rs10
4482
512
1771
746
12p1
3.33
GT
0.97
0.43
0.63
0.63
0.60
0.00
74
rs13
3760
413
3630
9215
13q1
3.3
CT
0.75
0.43
0.90
0.56
0.53
0.00
94
rs95
7623
513
3564
8706
13q1
3.3
AG
0.00
0.33
0.60
0.18
0.27
0.00
89
rs21
9787
913
3704
3188
13q1
3.3
AT
0.75
0.29
0.57
0.40
0.45
0.00
72
rs93
1570
313
3792
6845
13q1
4.11
AG
0.75
0.56
0.97
0.54
0.66
0.00
6
rs93
1576
213
3853
9907
13q1
4.11
CT
1.00
0.76
0.47
0.86
0.78
0.00
86
rs97
0254
1533
5721
7815
q14
CT
0.86
0.29
0.07
0.36
0.34
0.00
96
rs89
3131
1532
8069
6815
q14
AG
0.94
0.86
0.20
0.77
0.74
0.00
94
rs63
6842
1531
9846
7215
q14
AC
1.00
0.65
0.53
0.73
0.68
0.00
67
Hum Genet. Author manuscript; available in PMC 2009 April 2.

NIH
-PA Author Manuscript
NIH
-PA Author Manuscript
NIH
-PA Author Manuscript
Choudhry et al. Page 22Ta
ble
3To
p m
arke
rs fr
om th
e ad
mix
ture
map
ping
ana
lysi
s us
ing
the
prog
ram
Stru
ctur
e an
d lik
elih
ood
ratio
test
sta
tistic
. All
mar
kers
with
test
scor
e ≥
10.
rs n
umbe
rC
hr.
Phys
ical
Loc
atio
nC
ytob
and
Alle
le 1
Alle
le 2
Freq
. Afr
ican
Freq
. Eur
opea
nFr
eq. N
ativ
e A
mer
ican
Freq
. Cas
esFr
eq. C
ontr
ols
Tes
t sco
re
rs20
3491
51
2408
2522
71q
44C
T0.
110.
690.
360.
660.
4413
.8
rs18
2230
02
2469
9320
2p23
.3G
T0.
140.
620.
870.
540.
4811
.2
rs13
7419
62
3820
3203
2p22
.2C
T0.
790.
400.
700.
590.
4611
.2
rs15
1763
42
2243
8602
42q
36.1
AG
0.83
0.83
0.00
0.78
0.63
12.0
rs10
5110
403
7619
7443
3p12
.3C
G0.
220.
020.
470.
170.
1613
.5
rs11
1292
43
1600
6392
53q
25.3
2A
G0.
890.
200.
070.
360.
3110
.9
rs25
9306
84
5674
5024
4q12
CT
0.35
0.60
0.23
0.44
0.42
10.3
rs43
4962
94
6396
1550
4q13
.1A
G0.
750.
280.
300.
440.
3011
.8
rs27
761
514
4847
185p
15.2
CT
0.92
0.50
0.37
0.49
0.49
12.3
rs80
3054
513
2162
193
5q23
.3A
G0.
380.
930.
500.
690.
8110
.8
rs93
2907
95
1790
4973
05q
35.3
AG
0.67
0.90
0.07
0.66
0.61
12.9
rs15
5508
26
2145
5152
6p22
.3A
G0.
090.
500.
630.
520.
5310
.6
rs20
3749
97
9892
4050
7q22
.1C
G0.
390.
930.
700.
650.
7111
.7
rs78
3074
38
4876
0915
8q11
.21
AG
0.67
1.00
0.30
0.72
0.86
10.4
rs10
5046
968
8011
0903
8q21
.13
CT
0.14
0.88
0.87
0.69
0.62
10.7
rs10
5116
669
1895
9422
9p22
.1G
T0.
670.
110.
070.
230.
1315
.6
rs10
7640
5810
3609
4529
10p1
1.21
GT
0.59
0.05
0.03
0.12
0.22
15.6
rs23
1079
811
3041
1932
11p1
4.1
AG
0.64
0.13
0.07
0.14
0.30
11.1
rs18
6337
211
1274
2864
211
q24.
3A
C0.
670.
450.
130.
470.
5211
.0
rs40
3462
712
1267
5057
112
q24.
32A
G0.
780.
050.
030.
240.
1811
.0
rs41
3167
218
7337
8961
18q2
3C
G0.
670.
810.
570.
720.
6810
.2
Hum Genet. Author manuscript; available in PMC 2009 April 2.
NIH
-PA Author Manuscript
NIH
-PA Author Manuscript
NIH
-PA Author Manuscript
Choudhry et al. Page 23Ta
ble
4To
p m
arke
rs fr
om th
e re
gres
sion
ana
lysi
s. A
ll m
arke
rs w
ith p
-val
ues ≤
10−
4 .
rs n
umbe
rC
hr.
Phys
ical
Loc
atio
nC
ytob
and
Alle
le 1
Alle
le 2
Freq
. Cas
esFr
eq. C
ontr
ols
p-va
lue
rs18
5855
61
8579
3742
1p22
.3A
G0.
630.
800.
0000
7
rs10
4937
771
8579
9621
1p22
.3A
G0.
360.
190.
0000
7
rs13
4238
21
5654
7306
1p32
.2A
T0.
060.
200.
0000
7
rs15
0586
34
1401
8892
94q
31.1
CT
0.65
0.82
0.00
001
rs13
2470
510
9130
8184
10q2
3.31
AG
0.50
0.67
0.00
009
rs21
7596
111
8176
8155
11q1
4.1
CT
0.06
0.21
0.00
006
rs21
5046
813
3672
5888
13q1
3.3
GT
0.81
0.91
0.00
009
rs67
9090
1375
3457
9213
q22.
3C
T0.
220.
090.
0000
3
Hum Genet. Author manuscript; available in PMC 2009 April 2.
NIH
-PA Author Manuscript
NIH
-PA Author Manuscript
NIH
-PA Author Manuscript
Choudhry et al. Page 24Ta
ble
5Th
e to
p fiv
e re
gion
s fr
om th
e ov
erla
p an
alys
is. T
he la
st th
ree
colu
mns
hav
e th
e p-
valu
e fr
om A
dmix
map
ana
lysi
s, te
st s
core
from
the
likel
ihoo
d ra
tio te
st o
n lo
cus s
peci
fic a
nces
try e
stim
ates
from
Stru
ctur
e an
d p-
valu
e fr
om th
e 10
0K re
gres
sion
ana
lysi
s for
the
mar
kers
.“N
.S.”
indi
cate
s no
sign
ifica
nce
for t
hat m
etho
d.
rs n
umbe
rC
hr.
Phys
ical
Loc
atio
nC
ytob
and
Alle
le 1
Alle
le 2
Adm
ixm
apT
est s
core
Reg
ress
ion
rs15
1763
42
2243
8602
42q
36.1
AG
0.00
6812
.0N
.S.
rs80
3054
513
2162
193
5q23
.3A
G0.
0047
10.8
N.S
.
rs10
5116
669
1895
9422
9p22
.1G
T0.
0077
15.6
0.00
097
rs23
1079
811
3041
1932
11p1
4.1
AG
0.00
4411
.1N
.S.
rs13
3760
413
3630
9215
13q1
3.3
CT
0.00
94N
.S.
0.00
028
Hum Genet. Author manuscript; available in PMC 2009 April 2.

NIH
-PA Author Manuscript
NIH
-PA Author Manuscript
NIH
-PA Author Manuscript
Choudhry et al. Page 25Ta
ble
6V
alid
atio
n an
alys
is. T
he re
sult
of th
e TD
T an
alys
es fo
r mar
kers
in 5
q23.
3 an
d 13
q13.
3 re
gion
s. Th
e ta
ble
also
sho
ws
the
resu
lt of
the
initi
al g
enom
e-w
ide
asso
ciat
ion
(GW
A) a
naly
sis f
or th
e sa
me
mar
kers
.
TD
TG
WA
Mak
er/
Phen
otyp
eO
ver-
Tra
nsm
itted
Alle
le
# of
Info
rmat
ive
Fam
ilies
# of
Tra
nsm
issi
ons
# of
Non
-T
rans
mis
sion
sz-
scor
ep-
valu
eC
oeff.
z-va
lue
p-va
lue
rs14
9634
8(C
h. 5
q23.
3)
Ast
hma
A15
219
510
90.
001.
00
Mod
erat
e to
seve
reA
sthm
a
A24
3513
2.27
0.02
1.02
3.39
0.00
07
rs81
7737
(Ch.
13q
13.3
)
Ast
hma
T14
620
092
0.08
0.94
Mod
erat
e to
seve
reA
sthm
a
T22
3212
1.35
0.18
1.13
3.63
0.00
03
Hum Genet. Author manuscript; available in PMC 2009 April 2.