Cut! that's a wrap: regulating negative emotion by ending emotion-eliciting situations
Upload
independentCategory
view
1download
0
ORIGINAL RESEARCH ARTICLEpublished: 27 February 2012
doi: 10.3389/fnhum.2012.00033
Functional significance of the emotion-related late positivepotentialStephen B. R. E. Brown1,2*, Henk van Steenbergen1,2, Guido P. H. Band1,2, Mischa de Rover1,2 and
Sander Nieuwenhuis1,2
1 Department of Psychology, Cognitive Psychology Unit, Institute of Psychology, Leiden University, Leiden, Netherlands2 Leiden Institute for Brain and Cognition (LIBC), Leiden, Netherlands
Edited by:
Shuhei Yamaguchi, ShimaneUniversity, Japan
Reviewed by:
Hiroshi Nittono, HiroshimaUniversity, JapanTvzetan Popov, University Konstanz,Germany
*Correspondence:
Stephen B. R. E. Brown,Department of Psychology,Cognitive Psychology Unit, Instituteof Psychology, Leiden University,Wassenaarseweg 52, 2333 AK,Leiden, Netherlands.e-mail: [email protected]
The late positive potential (LPP) is an event-related potential (ERP) component overvisual cortical areas that is modulated by the emotional intensity of a stimulus. However,the functional significance of this neural modulation remains elusive. We conductedtwo experiments in which we studied the relation between LPP amplitude, subsequentperceptual sensitivity to a non-emotional stimulus (Experiment 1) and visual corticalexcitability, as reflected by P1/N1 components evoked by this stimulus (Experiment 2).During the LPP modulation elicited by unpleasant stimuli, perceptual sensitivity was notaffected. In contrast, we found some evidence for a decreased N1 amplitude duringthe LPP modulation, a decreased P1 amplitude on trials with a relatively large LPP,and consistent negative (but non-significant) across-subject correlations between themagnitudes of the LPP modulation and corresponding changes in d -prime or P1/N1amplitude. The results provide preliminary evidence that the LPP reflects a global inhibitionof activity in visual cortex, resulting in the selective survival of activity associated with theprocessing of the emotional stimulus.
Keywords: late positive potential, LPP, emotion, perception, ERP, global inhibition
INTRODUCTIONIn recent years, emotion has become an important and well-respected topic of neuroscientific research. One of the most pow-erful neuroscientific methods for assessing emotional processingin the human brain is the study of event-related potentials (ERPs).In the past decade, researchers have identified an ERP component,the late positive potential (LPP), that is strongly modulated by theemotional intensity of a stimulus: Emotional stimuli of either apositive or negative valence elicit a larger (i.e., more positive) LPPthan neutral stimuli (Cuthbert et al., 2000; Keil et al., 2002; Hajcaket al., 2010) and more arousing neutral pictures (e.g., scenes thatinclude people) elicit a larger LPP than less arousing neutralpictures (such as scenes without people; Weinberg and Hajcak,2010). This modulation is most pronounced around 400–600 msfollowing the stimulus (Schupp et al., 2006), but can continuefor up to a second after the offset of the stimulus (Hajcak andOlvet, 2008). The LPP has been used in a range of applied fields.For example, it has been used as an index of abnormal emotionalresponding in both adults and children (Dennis and Hajcak, 2009;Horan et al., 2010; Marissen et al., 2010), to study social biases iningroup/outgroup classification (Hurtado et al., 2009; Crites et al.,2010), and as a tool in criminological lie detection (Matsuda et al.,2009).
The conditions that modulate the amplitude of the LPP havebeen charted extensively (Schupp et al., 2006; Olofsson et al.,2008; Hajcak et al., 2010). For example, stimuli that are rated asmore arousing elicit a larger (i.e., more positive) LPP (Cuthbertet al., 2000; de Rover et al., 2012). Most LPP studies have usedpictures from the International Affective Picture System (IAPS;
Lang et al., 1999), but the emotion-related LPP modulation canalso be evoked by other stimulus types, such as threatening facesor emotional gestures (Schupp et al., 2004b; Flaisch et al., 2011).Although most studies present emotional and neutral picturesfor 5–6 s, an LPP modulation has also been observed with muchshorter presentation times, even down to 120 ms (Schupp et al.,2004a). Furthermore, the LPP is relatively robust to multiplepresentations of the same stimulus material (Codispoti et al.,2007).
Although the antecedent conditions of the LPP have been thor-oughly studied, the functional significance of the LPP remainsrather elusive. As Donchin (1981) argued, in the context of theP3: “I want to emphasize the distinction between an enumer-ation of the antecedent conditions and a process theory of aphenomenon. [. . .] The theory I seek is to be a description ofthe functional significance of this process. The theory shouldelucidate the specific processing activities undertaken by the neu-ronal population whose activity is manifested on the scalp by acomponent.” (p. 498/500). As we will discuss below, emotionalstimuli appear to be able to both enhance and impair visualperception (Bocanegra and Zeelenberg, 2009b). This allows usto formulate two contrasting hypotheses about the functionalsignificance of the LPP.
The implicit or (sometimes) explicit assumption in manyLPP studies is that the LPP reflects a spatially non-specific (i.e.,global), temporary increase in attention, that serves to facilitatethe processing of the affective stimulus that elicited the LPP. Thisenhanced perception hypothesis of the LPP is consistent with theneural generators of the LPP in ventral and dorsal visual areas
Frontiers in Human Neuroscience www.frontiersin.org February 2012 | Volume 6 | Article 33 | 1
HUMAN NEUROSCIENCE
Brown et al. Functional significance of LPP
(Sabatinelli et al., 2007; Frühholz et al., 2009; Baetens et al.,2011; Moratti et al., 2011) and with the typical finding thatemotional stimuli automatically attract attention (Fox et al., 2000;Vuilleumier, 2005) and are processed more efficiently (Zeelenberget al., 2006). Comparable increases in temporal attention havebeen reported in the accessory stimulus paradigm, in whicha task-irrelevant auditory accessory stimulus accompanying avisual target shortens reaction times (RTs) by decreasing the timeneeded to encode the target (e.g., Jepma et al., 2009); and in thetemporal cuing paradigm in which cues that predict the momentof target presentation are used by subjects to optimize RTs, in partby speeding up the encoding of the target (Correa et al., 2005).
Although the enhanced perception hypothesis is plausible, itis not supported by any direct evidence. The fact that emotionalstimuli modulate the LPP and are processed efficiently reflects acorrelation and does not imply a causal relationship. The efficientprocessing of emotional stimuli may be due not to the processunderlying the LPP but to other, earlier processes, some of whichmay be visible in the EEG signal. For example, emotional stimulielicit an early posterior negativity (EPN), an ERP component thatlike the LPP is modulated by the emotional intensity of a stim-ulus, but that peaks earlier than the LPP (Schupp et al., 2006).Improved perception after emotional stimuli has also been relatedto early interactions between the amygdala and the magnocellularprocessing channel (Bocanegra and Zeelenberg, 2009a).
However, while emotional stimuli are generally processed moreefficiently, they often impair the perception of concurrently pre-sented neutral stimuli when they are in spatial competition (e.g.,Pourtois et al., 2005). In addition, Bocanegra and Zeelenberg(2009b) review evidence that, under some circumstances, thepresentation of emotional stimuli can impair the perception ofa subsequent neutral stimulus if the two stimuli are presentedin close temporal proximity. Thus, the capturing of attention byemotional stimuli may be accompanied by and/or followed by aglobal inhibition of other representations in the visual cortex, andthe LPP may reflect this global inhibition. This global inhibitionhypothesis of the LPP is consistent with work by Birbaumer andcolleagues, who have argued, on the basis of biophysical argu-ments, that slow cortical positivities, like the LPP, must reflectdecreased cortical excitability (Birbaumer et al., 1990).
To contrast these two hypotheses of the LPP, we require aparadigm that allows us to differentiate between the effects onperception of the LPP process and other, earlier brain processeslike the EPN by separating the emotional stimulus (that elicitsthe LPP) and a subsequent target (that is used to probe the per-ceptual system). The critical question that can then be asked iswhether the presentation of a non-emotional target during theLPP but after other processes like the EPN, will lead to improvedor impaired perception of that target. Recent behavioral studieshave used this paradigm to demonstrate that early perception ofnon-emotional stimuli is modulated after seeing emotional faces(Phelps et al., 2006; Bocanegra and Zeelenberg, 2009a; for a sim-ilar paradigm, see Bradley et al., 2006). However, these results donot inform the current research question because of the shortstimulus onset asynchronies (SOAs: around 100 ms) used: themodulation of the LPP by emotional faces starts considerablylater.
We conducted two experiments to contrast the enhanced per-ception hypothesis and global inhibition hypothesis of the LPP.In Experiment 1, we examined the relationship between LPPmagnitude and perceptual sensitivity to non-emotional stimulipresented during the LPP. In Experiment 2, we examined therelationship between LPP magnitude and neural signatures ofvisual cortical excitability: the P1 and N1 components of the ERPwaveform evoked by non-emotional stimuli.
EXPERIMENT 1In Experiment 1, we examined the relationship between LPPmagnitude and a behavioral index of perception. We manip-ulated LPP magnitude by varying the emotional valence of aseries of IAPS pictures (negative or neutral valence; each pre-sented for 200 ms) and measured the effect of the pictures onparticipants’ sensitivity to the orientation of a subsequent Gaborpatch. The low spatial frequency of our Gabor patch was basedon Bocanegra and Zeelenberg (2009a), who reported a benefi-cial effect on orientation sensitivity of an immediately precedingfearful face picture (SOA = 100 ms). The SOA between the IAPSpicture and the Gabor target in our experiment was systematicallyvaried between 570, 1070 (both during the LPP modulation) and1570 ms (presumably after the LPP modulation). We used IAPSpictures because they are commonly used in psychophysiologi-cal research on emotion and elicit reliable and pronounced LPPs.We used an orientation discrimination task because orientation isprocessed in ventral and dorsal visual areas where the LPP is gen-erated (Faillenot et al., 2001). To avoid competition for temporalattention between the IAPS picture and the target (cf. Bocanegraand Zeelenberg, 2009b), we chose the shortest SOA to be longerthan the typical attentional blink (Shapiro et al., 1997). We alsotook various measures to avoid competition for spatial attentionbetween the two stimuli (see Methods).
If the emotion-induced LPP modulation reflects increasedglobal perceptual sensitivity, then orientation sensitivity shouldbe enhanced following negative pictures, but only for theshort and medium SOA (i.e., during the LPP modulation).Furthermore, participants with a larger LPP modulation shouldshow a larger increase in orientation sensitivity following nega-tive pictures. In contrast, the global inhibition hypothesis predictsthe opposite pattern of results: orientation sensitivity should bedecreased following negative pictures, and participants with alarger LPP modulation should show a larger decrease in orien-tation sensitivity following negative pictures. We used d′ as anunbiased measure of perceptual sensitivity.
MATERIALS AND METHODSParticipantsTwenty healthy young females, aged 19–28 years, took part in asingle 2-h experimental session in return for course credit ore15.Participants were informed on the research procedures beforetheir inclusion in the study.
TaskParticipants performed a computerized decision-making task,based on that used by Bocanegra and Zeelenberg (2009a). Eachtrial started with a 500 ms fixation point (a white plus sign on
Frontiers in Human Neuroscience www.frontiersin.org February 2012 | Volume 6 | Article 33 | 2

Brown et al. Functional significance of LPP
FIGURE 1 | Sequence of trial events in Experiment 1 (continuous
arrow) and Experiment 2 (discontinuous arrow). The participants’goal was to indicate whether a Gabor patch was tilted
(Experiment 1), or to make a spatially compatible button pressin case two flashes were presented to the left or right of fixation(Experiment 2).
a gray background), followed by the presentation, for 200 ms,of a picture from the IAPS (Lang et al., 1999) of either negative(e.g., mutilations, frightening animals) or neutral (e.g., faces witha neutral expression, clouds) valence (Figure 1). These pictures1
1The following IAPS pictures were used. Neutral valence: 1121 1313 1333 14501610 1616 1670 1675 1910 2038 2102 2104 2190 2191 2200 2210 2214 22202221 2235 2270 2305 2320 2357 2370 2372 2381 2385 2393 2396 2397 24402441 2445 2480 2487 2493 2495 2499 2501 2512 2513 2516 2560 2570 25752579 2580 2593 2620 2745.1 2840 2850 2870 2880 2890 2980 4000 4100 50005020 5030 5120 5130 5200 5390 5410 5471 5500 5510 5520 5530 5532 55335534 5535 5551 5711 5731 5740 5750 5760 5779 5800 5870 5875 5890 58915900 5982 5990 5991 5994 6150 6900 6930 7000 7002 7004 7006 7009 70107020 7025 7030 7031 7034 7035 7036 7037 7038 7039 7040 7041 7042 70437044 7050 7052 7053 7055 7056 7059 7060 7080 7090 7100 7110 7130 71407150 7160 7161 7170 7175 7179 7180 7185 7187 7190 7205 7217 7224 72337234 7235 7490 7491 7500 7545 7547 7550 7595 7640 7700 7705 7900 79508475 9070 9080 9171 9210 9360 9700 9913. Negative valence: 1050 1052 10701111 1114 1120 1200 1201 1205 1220 1240 1270 1300 1310 1321 1525 19301931 1932 2053 2095 2110 2120 2200 2276 2352.2 2455 2490 2683 2688 27032710 2730 2800 2811 2981 3000 3010 3016 3017 3030 3051 3053 3060 30613063 3064 3068 3069 3071 3080 3100 3101 3102 3110 3120 3130 3140 31503160 3168 3170 3180 3181 3191 3215 3220 3225 3230 3261 3266 3300 33503400 3500 3530 3550.1 5971 5972 6020 6021 6022 6190 6200 6210 6212 62136230 6242 6243 6244 6250 6260 6300 6311 6312 6313 6314 6315 6350 63606370 6410 6415 6510 6530 6540 6550 6555 6560 6570 6571 6821 6830 68346836 6838 6840 7359 7380 8230 8480 8485 9040 9042 9050 9140 9160 91809250 9252 9253 9254 9300 9301 9400 9402 9405 9409 9410 9419 9423 94249425 9426 9427 9428 9429 9433 9500 9520 9570 9571 9600 9611 9620 96219622 9630 9635.1 9800 9810 9900 9902 9910 9920 9921.
(166 neutral and 167 negative) were repeated randomly to createa total of 252 trials of either valence. The negative and neu-tral pictures differed in mean normative valence rating (2.59 vs.5.36, t165 = 33.29; p < 0.001) and mean normative arousal rat-ing (6.04 vs. 3.24, t165 = 37.58; p < 0.001; Lang et al., 1999). Theentire task consisted of 504 trials, split up in eight blocks thateach lasted about 5 min. In half of these trials neutral IAPS pic-tures were shown; in the other half, negative pictures. Pictureswere shown in a random order. A yellow rectangle (visual angle13.7◦ × 8.2◦) was overlaid on the IAPS pictures and participantswere instructed not to move their eyes outside of this rectan-gle. This measure was taken to ensure that participants’ attentionstayed focused on the center of the screen, which contained themost salient part of the IAPS picture and the target stimulus,and to preclude eye movements as much as possible. The IAPSpicture was followed by a blank screen of 350–390, 850–890, or1350–1390 ms (equiprobable within each valence, all jittered insteps of 20 ms, with means of 370, 870, and 1370 ms). Then, aGabor stimulus (visual angle 1.8◦ × 1.8◦) was presented in oneof the four corners of the yellow rectangle for 40 ms. Gaborpatches (2◦ Gaussian enveloped sinusoidal gratings) were cre-ated in MATLAB (The MathWorks Benelux), with a Michelsonluminance contrast of 20% and a spatial frequency of 1.98 cyclesper degree. The stimulus onset asynchrony (SOA) between theIAPS picture and the Gabor stimulus was, on average, 570 (shortSOA), 1070 (medium SOA), or 1570 ms (long SOA). The task ofthe participant was to decide whether a Gabor patch was either
Frontiers in Human Neuroscience www.frontiersin.org February 2012 | Volume 6 | Article 33 | 3
Brown et al. Functional significance of LPP
tilted or not and to respond to straight Gabor patches by press-ing a response button with their left hand, and to tilted Gaborpatches by pressing a response button with their right hand. Afterthe Gabor stimulus, a blank screen was presented until the par-ticipant’s response, with a maximum duration of 1500 ms. Thisscreen was followed by a short blank screen, which was presentedfor 250 ms. Finally, a red plus sign was presented for 1500 ms;the participant was instructed to try to blink only during thepresentation of this screen.
Prior to the start of the task, participants first performed ashort practice block (20 trials), in which the tilt of the Gaborpatches was very pronounced (8◦), so as to familiarize the par-ticipants with the purpose of the task. After these trials, theparticipants performed a practice block of 10 trials, in which thetilt of the Gabor patches was 4◦. This block was repeated untilthe participants reached an accuracy of 70% or greater. Once thislevel of accuracy was established, the participants then performed4 blocks of 10 trials each, in which the tilt of the Gabor patchvaried per block (2◦, 3◦, 4◦, or 5◦). After finishing the fourth ofthese blocks, the participants’ accuracy was evaluated per block,and the tilt that was associated with a performance of approxi-mately 70% correct responses was selected to be used in the actualtask. No IAPS stimuli were presented during these practice andtilt-adaptation blocks.
EEG recording and analysesWe recorded EEG from 30 Ag/AgCl scalp electrodes (Fpz, Fz, FC1,FCz, FC2, C3, C1, Cz, C2, C4, CP3, CP1, CPz, CP2, CP4, P7,P5, P3, P1, Pz, P2, P4, P6, P8, PO7, PO3, POz, PO4, PO8, Oz),and from the left and right mastoids. We measured the horizontaland vertical electro-oculogram (EOG) using bipolar recordingsfrom electrodes placed approximately 1 cm lateral of the outercanthi of the two eyes and from electrodes placed approximately1 cm above and below the participant’s right eye. The EEG signalwas pre-amplified at the electrode to improve the signal-to-noiseratio and amplified with a gain of 16× by a BioSemi ActiveTwosystem (BioSemi B.V., Amsterdam). The data were digitized at24-bit resolution with a sampling rate of 512 Hz using a low-pass fifth order sinc filter with a half-power cutoff of 102.4 Hz.Each active electrode was measured online with respect to a com-mon mode sense (CMS) active electrode producing a monopolar(non-differential) channel, and was referenced offline to the aver-age of the left and right mastoids. EEG and EOG were high-passfiltered at 0.01 Hz (24 dB/octave) and low-pass filtered at 15 Hz(24 dB/octave). Both of these filters are fourth-order Butterworthzero-phase filters.
Ocular and eyeblink artifacts were corrected using the methodof Gratton et al. (1983). Epochs with other artifacts (a gradientgreater than 30 μV, spike artifacts [50 μV/2 ms] and slow drifts[300 μV/200 ms]) were also discarded. We extracted single-trialepochs for a period from 100 ms before until 1800 ms after pictureonset. Then, for each participant and stimulus type, we averagedthe EEG epochs to create stimulus-locked ERPs. The average sig-nal during the 100 ms pre-stimulus baseline was subtracted fromeach ERP. In the main analyses, the LPP was defined as the meansignal amplitude in medium- and long-SOA trials (i.e., uncon-founded by target-evoked ERPs) over electrodes CP1, CPz, and
CP2 during the interval 400–1200 ms, where the LPP modulationwas maximal. In follow-up analyses, we computed “local” LPPmodulations corresponding to each SOA, by creating negative—neutral difference scores for three time windows (600–700 ms,1100–1200 ms, and 1600–1700 ms, corresponding to the short,medium, and long SOAs). We conducted 2 (valence) × 3 (SOA)repeated-measures analyses of variance (ANOVAs) on d′ andmean LPP amplitudes. A Greenhouse-Geisser correction wasapplied when appropriate. To examine the participants’ percep-tual sensitivity, we calculated d′ as z(number of hits)—z(numberof false alarms; Stanislaw and Todorov, 1999).
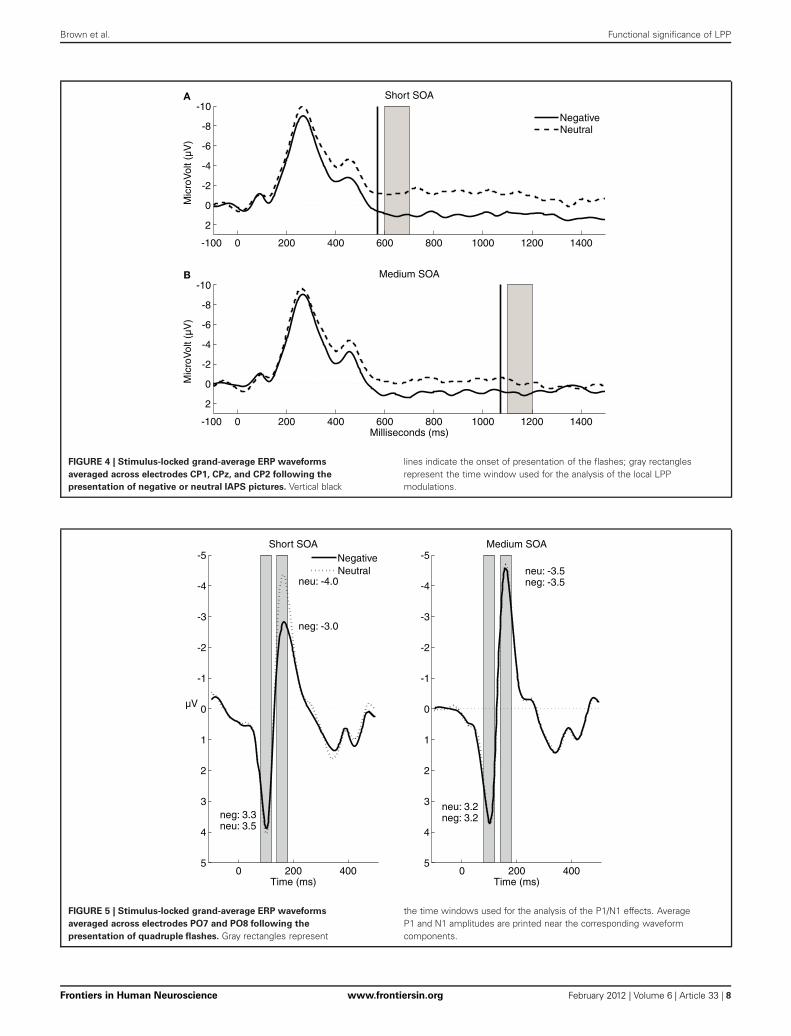
RESULTSLate positive potentialFigure 2 displays the ERPs elicited by the negative and neutralIAPS pictures. For each SOA there is a clear emotion-inducedLPP modulation, starting around 400 ms post-stimulus and end-ing roughly 1 s later. As expected, the mean amplitude of the LPPwas more positive following negative pictures (3.1 μV) than fol-lowing neutral pictures (0.9 μV), F(1, 19) = 81.89, p < 0.0005,η2
p = 0.81. There was no interaction between valence and SOA,
F(2, 38) < 1, p = 0.57, η2p = 0.03. As expected, the local LPP dif-
ference between negative and neutral pictures was significant forthe short (3.9 vs. 0.7 μV, t19 = 7.27, p < 0.0005) and mediumSOAs (1.5 vs. −0.6 μV, t19 = 4.22, p = 0.0005). Contrary to ourexpectations, the local LPP difference for the long SOA was alsosignificant (−0.1 vs. −1.4 μV, t19 = 2.27, p = 0.04).
Behavioral resultsIn line with our methods, error rates were close to 30%: 26%for negative pictures and 25% for neutral pictures. The d′ valuesin each condition are reported in Figure 2. d′ was neither influ-enced by valence, F(1, 19) < 1, p = 0.36, η2
p = 0.05, nor by SOA
duration, F(2, 38) = 1.60, p = 0.22, η2p = 0.08. Furthermore,
although we expected to find increased or decreased perceptualsensitivity during the time of maximal LPP modulation (i.e., forthe short and medium SOAs), the interaction between valenceand SOA was not significant, F(2, 38) < 1, p = 0.50, η2
p = 0.04.These results indicate that visual perception was not improved orimpaired during the LPP modulation.
LPP-behavior correlationsWe calculated negative—neutral d′ difference scores for eachSOA, and calculated cross-subject Pearson correlations betweenthese difference scores and the mean magnitude of the LPP mod-ulation (in the time window 400–1200 ms). In contrast withour expectations, we found no robust relationship between themagnitude of the LPP modulation and d′ difference scores: corre-lations varied between −0.35 and 0.03 (Figure 3A). In addition,we calculated, for each SOA, the correlation between the d′difference score and the corresponding local LPP modulation(Figure 3B). Again, we found no significant correlations, whichindicates that larger LPP modulations following negative pic-tures were not accompanied by commensurate improvements orimpairments in visual perception. However, it is noteworthy thatmost of the reported correlations were negative.
Frontiers in Human Neuroscience www.frontiersin.org February 2012 | Volume 6 | Article 33 | 4

Brown et al. Functional significance of LPP
A
B
C
FIGURE 2 | Stimulus-locked grand-average ERP waveforms averaged
across electrodes CP1, CPz, and CP2 following the presentation of
negative or neutral IAPS pictures. Vertical black lines indicate the onset of
presentation of the Gabor patch; gray rectangles represent the time windowused for the analysis of the local LPP modulations1. d ′ averages for each SOAand valence are printed near the corresponding ERPs.
Within-subject comparisons between LPP amplitude quartilesIn addition to the inter-individual correlations described above,we also exploited intra-individual, trial-to-trial differences in LPPamplitude. We computed single-trial LPP values, using the same“global LPP” definition as in previous analyses. We then binnedthe trials in four quartiles, based on single-trial LPP value, sepa-rately for the negative and neutral IAPS trials, but collapsed acrossthe three SOAs to collect enough trials per bin. Finally, we com-puted the average d′ value for the trials in the first and fourthquartiles, and submitted these to a repeated-measures ANOVAwith quartile (1 vs. 4) and valence as within-subjects factors.Small-LPP trials (quartile 1: d′ = 1.4) and large-LPP trials (quar-tile 4: d′ = 1.4) were associated with a similar d′ value, F < 1, andquartile did not interact with valence.
DISCUSSIONIn Experiment 1, we briefly presented vertically oriented andslightly tilted Gabor patches during and after a robust emotion-induced modulation of the LPP. The results did not provideunequivocal evidence in favor of either the enhanced percep-tion hypothesis or the global competition hypothesis: percep-tual sensitivity to the orientation of the Gabor stimuli wasneither improved nor impaired during the LPP modulation.Furthermore, individuals with larger LPP modulations did notshow more improvement or impairment in d′ after negative pic-tures. If anything, the results seem tentatively compatible withthe global inhibition hypothesis, because all but one of thereported correlations were negative: Individuals with larger LPP
modulations showed a decline in orientation sensitivity afternegative pictures. To examine if these findings were robust acrosstasks and measures, we conducted a second experiment.
Our behavioral results seem at odds with Bocanegra andZeelenberg (2009b), who found that a negative visual stimulus(a briefly presented word, like “rape”) improved perception ofa neutral target word presented ∼1000 ms later. An interestingquestion for future research is whether this discrepancy reflectsthe similarity between the emotional cue and the target stimu-lus, which was low in our experiment and high in Bocanegra andZeelenberg (2009b). These authors did not collect ERP data, so itis unclear whether their emotional cue modulated the LPP.
EXPERIMENT 2In Experiment 2, we investigated the relation between the LPPand direct electrophysiological correlates of perceptual sensitivity.As in the previous experiment, we manipulated LPP amplitude byvarying the emotional valence of a series of briefly presented IAPSpictures. After one of two SOAs (570 or 1070 ms; both duringthe LPP modulation), the IAPS picture was followed by a non-emotional stimulus—a brief high-intensity flash known to elicitsizeable P1 and N1 components. The P1 and N1 reflect the earlyprocessing of stimuli in the visual cortex and are sensitive to spa-tially non-specific increases in attention. For example, increasesin temporal attention after accessory stimuli and temporal cuesare often associated with increased target-evoked P1 and/or N1amplitudes (Correa et al., 2006; Jepma et al., 2009; Böckler et al.,2011). If the emotion-induced LPP modulation reflects increased
Frontiers in Human Neuroscience www.frontiersin.org February 2012 | Volume 6 | Article 33 | 5

Brown et al. Functional significance of LPP
A
B
FIGURE 3 | (A) Cross-subject correlations between a general LPP measure(LPPgen: averaged over a 400–1200 ms time window) and the d ′negative—neutral difference scores for each SOA. Subscripts indicate SOA
length. (B) Correlations between local LPP modulations for each SOA (seeMethods and Figure 2) and the corresponding d ′ negative—neutraldifference scores.
global visual-cortex excitability, then the P1 and N1 to the flashprobes should be larger after negative pictures (during the LPPmodulation). Furthermore, participants with larger LPP modu-lations should show larger emotion-related increases in P1 andN1 amplitude. In contrast, if the LPP modulation reflects globalinhibition of activity in visual cortex, the P1 and N1 amplitudesshould be reduced after negative pictures, and especially so inparticipants with larger LPP modulations.
MATERIALS AND METHODSParticipantsTwenty-five healthy young adults (22 women; no overlap withExperiment 1), aged 18–27 years, took part in a single 2-h exper-imental session in return for course credit or e15. Participantswere informed on the experimental procedures before their inclu-sion in the study.
TaskParticipants performed a straightforward RT task (Figure 1). Oneach trial of this task, participants saw an IAPS picture depict-ing either a neutral event (158 individual pictures), or a negative
event (158 individual pictures)2. The negative and neutral pic-tures differed in mean normative valence rating (2.54 vs. 5.30,t319 = 51.69; p < 0.0001) and mean normative arousal rating(6.09 vs. 3.19, t319 = 54.16; p < 0.0001). Each picture was pre-sented twice during the course of the task, in a randomized order.After a 500 ms fixation stimulus (a white plus sign on a blackbackground) the IAPS picture was presented for 200 ms. As inExperiment 1, a yellow rectangle was overlaid on the IAPS pic-tures and participants were instructed not to move their eyesoutside of this rectangle. The IAPS picture was followed by ablank screen for either 350–390 ms (jittered in steps of 20 ms;mean 370 ms) or 850–890 ms (mean 870 ms). This blank screenwas followed by one of four probe events: two white rectan-gles (“flashes”; visual angle 6.9◦ × 5.7◦) were presented (1) inthe upper and lower left corners of the screen; or (2) in theupper and lower right corners of the screen (lateral flashes);
2We used the same IAPS pictures as in Experiment 1, except for the following:1240 1270 1310 3230 3220 6311 6314 9140 9402 (negative valence) and 25162560 2575 5890 5982 5990 5991 5994 (neutral valence).
Frontiers in Human Neuroscience www.frontiersin.org February 2012 | Volume 6 | Article 33 | 6
Brown et al. Functional significance of LPP
(3) in all four corners of the screen (quadruple flashes); or(4) no white rectangles were presented at all (no flashes). Theprobe stimulus lasted 250 ms, resulting in SOAs between pic-ture onset and flash onset of, on average, 570 ms (short SOA) or1070 ms (medium SOA). These SOAs are identical to the shortand medium SOAs used in Experiment 1. A blank screen followedthe stimulus until the participant’s response, with a maximumof 250 ms. If participants did not respond before terminationof this screen (which happened rarely), the trial was consideredincorrect. Finally, a red plus sign was presented for 2000 ms; par-ticipants were asked to blink only during the presentation ofthis screen. Participants were instructed to respond as quicklyas possible to lateral flashes by pressing a spatially compatiblebutton. The purpose of this task was to actively engage the par-ticipants during the task and to be able to investigate effects ofvalence on RT (cf. Weinberg and Hajcak, 2011). Participants wereinstructed to refrain from responding to quadruple flashes orwhen no flashes were presented. The quadruple-flash trials wereused to measure the flash-elicited P1 and N1, uncontaminatedby response-related ERP components. The no-flash trials wereused to measure the LPP, in a way that is not contaminated byvisual ERP components evoked by the flashes. The task consistedof 640 trials in total: 160 with lateral flashes, 320 with quadru-ple flashes, and 160 with no flashes. There was a short breakafter every 80 trials. The total trial duration was between 3450and 3990 ms.
EEG recording and analysesThe EEG recording and analysis methods were the same as inExperiment 1, with the following exceptions. For the P1 andN1 components, EEG and EOG were high-pass filtered at 3 Hz(24 dB/octave) and low-pass filtered at 15 Hz (24 dB/octave). Bothof these filters are fourth-order Butterworth zero-phase filters.We used a different high-pass filter for the LPP and the P1 andN1 components to make sure that the mean-amplitude measure-ments of the latter high-frequency components were not distortedby simultaneous, unrelated low-frequency shifts. The P1 wasdefined as the mean amplitude over electrodes PO7 and PO8,during the interval 80–120 ms. The N1 was defined as the meanamplitude measured over PO3 and PO4 during the interval 140–180 ms. Both were measured relative to the 100 ms pre-stimulusbaseline. As in Experiment 1, the local LPPs were defined as theaverage signal in the 600–700 and the 1100–1200 ms windows,corresponding to the short and medium SOAs, respectively. Weperformed 2 (valence) × 2 (SOA) repeated-measures ANOVAs onmean RTs and mean P1/N1 amplitudes.
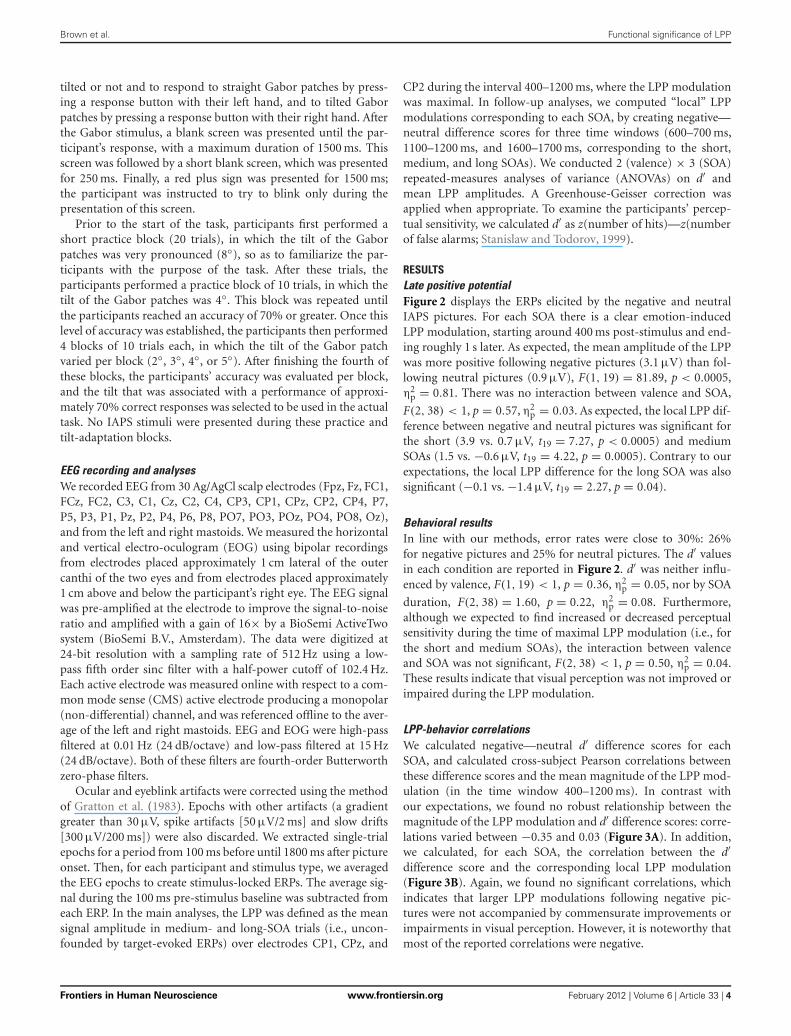
RESULTSLate positive potentialFigure 4 displays the stimulus-locked ERPs for the no-flash tri-als. As expected, the mean amplitude of the LPP was morepositive following negative pictures (0.42 μV) than followingneutral pictures (−1.3 μV), F(1, 24) = 18.02, p < 0.0005, η2
p =0.43. Furthermore, the local LPP difference between negativeand neutral pictures was significant for both the short (1.1 vs.−0.7 μV, t24 = 3.93, p = 0.001) and the medium SOA (0.9 vs.−0.6 μV, t24 = 3.52, p = 0.002).
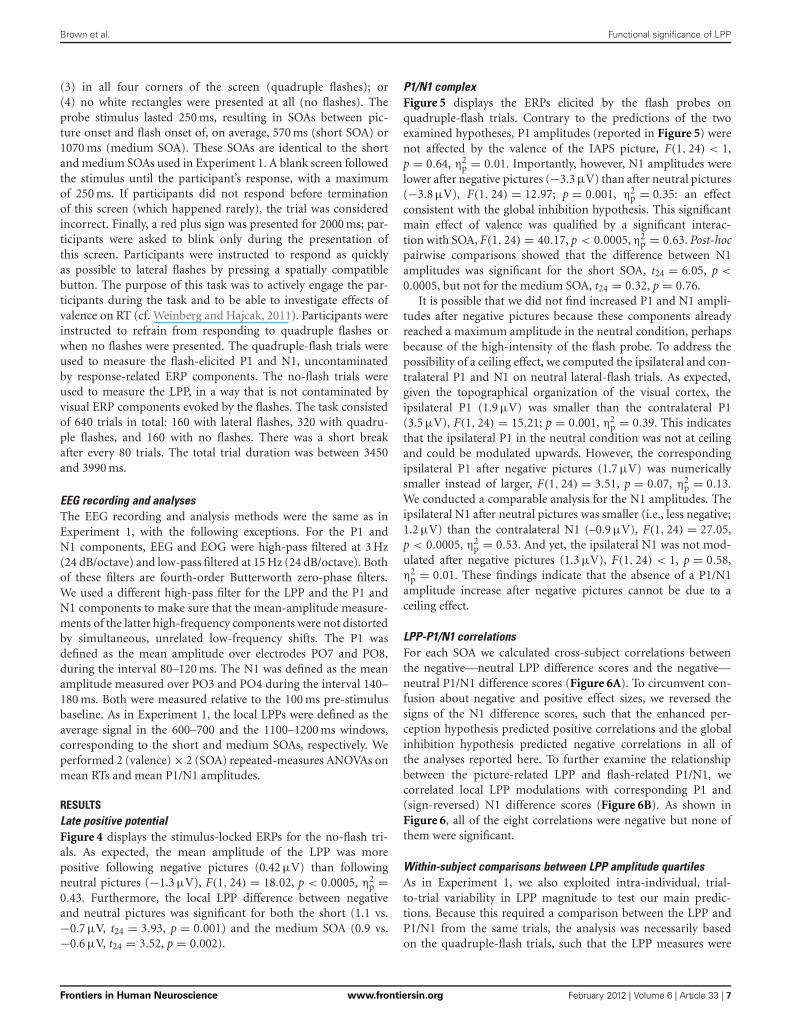
P1/N1 complexFigure 5 displays the ERPs elicited by the flash probes onquadruple-flash trials. Contrary to the predictions of the twoexamined hypotheses, P1 amplitudes (reported in Figure 5) werenot affected by the valence of the IAPS picture, F(1, 24) < 1,p = 0.64, η2
p = 0.01. Importantly, however, N1 amplitudes werelower after negative pictures (−3.3 μV) than after neutral pictures(−3.8 μV), F(1, 24) = 12.97; p = 0.001, η2
p = 0.35: an effectconsistent with the global inhibition hypothesis. This significantmain effect of valence was qualified by a significant interac-tion with SOA, F(1, 24) = 40.17, p < 0.0005, η2
p = 0.63. Post-hocpairwise comparisons showed that the difference between N1amplitudes was significant for the short SOA, t24 = 6.05, p <
0.0005, but not for the medium SOA, t24 = 0.32, p = 0.76.It is possible that we did not find increased P1 and N1 ampli-
tudes after negative pictures because these components alreadyreached a maximum amplitude in the neutral condition, perhapsbecause of the high-intensity of the flash probe. To address thepossibility of a ceiling effect, we computed the ipsilateral and con-tralateral P1 and N1 on neutral lateral-flash trials. As expected,given the topographical organization of the visual cortex, theipsilateral P1 (1.9 μV) was smaller than the contralateral P1(3.5 μV), F(1, 24) = 15.21; p = 0.001, η2
p = 0.39. This indicatesthat the ipsilateral P1 in the neutral condition was not at ceilingand could be modulated upwards. However, the correspondingipsilateral P1 after negative pictures (1.7 μV) was numericallysmaller instead of larger, F(1, 24) = 3.51, p = 0.07, η2
p = 0.13.We conducted a comparable analysis for the N1 amplitudes. Theipsilateral N1 after neutral pictures was smaller (i.e., less negative;1.2 μV) than the contralateral N1 (–0.9 μV), F(1, 24) = 27.05,p < 0.0005, η2
p = 0.53. And yet, the ipsilateral N1 was not mod-ulated after negative pictures (1.3 μV), F(1, 24) < 1, p = 0.58,η2
p = 0.01. These findings indicate that the absence of a P1/N1amplitude increase after negative pictures cannot be due to aceiling effect.
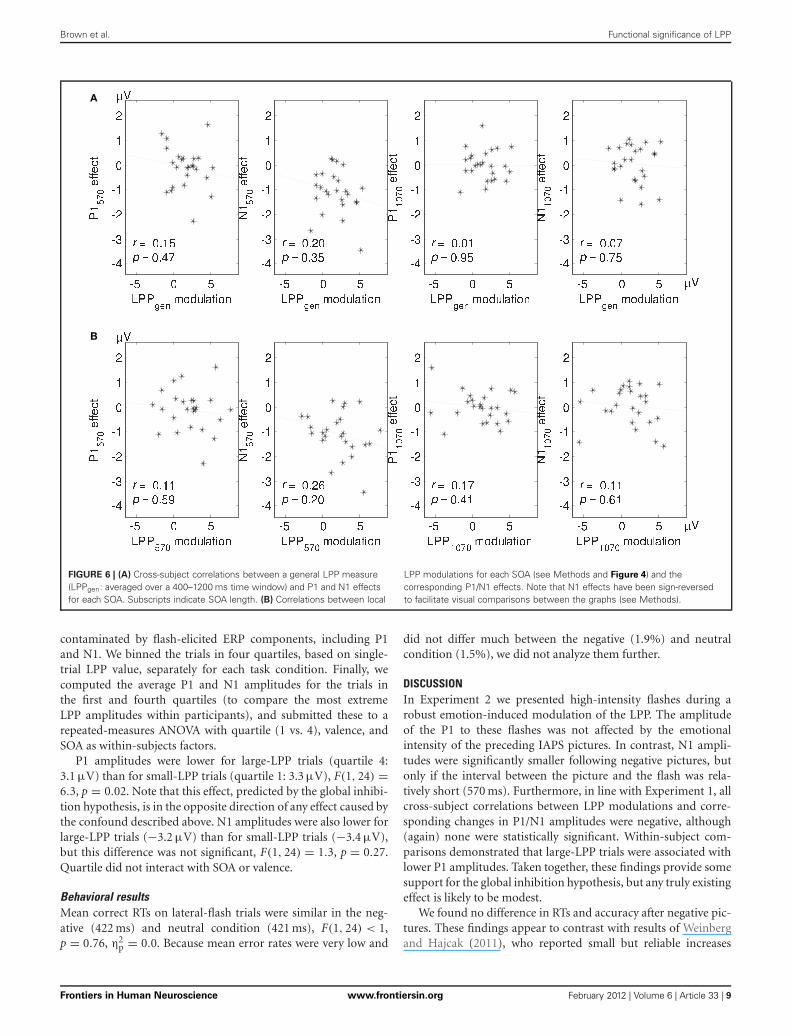
LPP-P1/N1 correlationsFor each SOA we calculated cross-subject correlations betweenthe negative—neutral LPP difference scores and the negative—neutral P1/N1 difference scores (Figure 6A). To circumvent con-fusion about negative and positive effect sizes, we reversed thesigns of the N1 difference scores, such that the enhanced per-ception hypothesis predicted positive correlations and the globalinhibition hypothesis predicted negative correlations in all ofthe analyses reported here. To further examine the relationshipbetween the picture-related LPP and flash-related P1/N1, wecorrelated local LPP modulations with corresponding P1 and(sign-reversed) N1 difference scores (Figure 6B). As shown inFigure 6, all of the eight correlations were negative but none ofthem were significant.
Within-subject comparisons between LPP amplitude quartilesAs in Experiment 1, we also exploited intra-individual, trial-to-trial variability in LPP magnitude to test our main predic-tions. Because this required a comparison between the LPP andP1/N1 from the same trials, the analysis was necessarily basedon the quadruple-flash trials, such that the LPP measures were
Frontiers in Human Neuroscience www.frontiersin.org February 2012 | Volume 6 | Article 33 | 7
Brown et al. Functional significance of LPP
-100 0 200 400 600 800 1000 1200 1400
-10
-8
-6
-4
-2
0
2
Mic
roV
olt (
µV)
Short SOA
NegativeNeutral
-100 0 200 400 600 800 1000 1200 1400
-10
-8
-6
-4
-2
0
2
Milliseconds (ms)
Mic
roV
olt (
µV)
Medium SOA
A
B
FIGURE 4 | Stimulus-locked grand-average ERP waveforms
averaged across electrodes CP1, CPz, and CP2 following the
presentation of negative or neutral IAPS pictures. Vertical black
lines indicate the onset of presentation of the flashes; gray rectanglesrepresent the time window used for the analysis of the local LPPmodulations.
0 200 400
-5
-4
-3
-2
-1
0
1
2
3
4
5
µV
Time (ms)
Short SOA
0 200 400
-5
-4
-3
-2
-1
0
1
2
3
4
5
Time (ms)
Medium SOANegativeNeutral
neu: 3.2neg: 3.2
neu: -3.5neg: -3.5neu: -4.0
neg: -3.0
neg: 3.3neu: 3.5
FIGURE 5 | Stimulus-locked grand-average ERP waveforms
averaged across electrodes PO7 and PO8 following the
presentation of quadruple flashes. Gray rectangles represent
the time windows used for the analysis of the P1/N1 effects. AverageP1 and N1 amplitudes are printed near the corresponding waveformcomponents.
Frontiers in Human Neuroscience www.frontiersin.org February 2012 | Volume 6 | Article 33 | 8
Brown et al. Functional significance of LPP
A
B
FIGURE 6 | (A) Cross-subject correlations between a general LPP measure(LPPgen: averaged over a 400–1200 ms time window) and P1 and N1 effectsfor each SOA. Subscripts indicate SOA length. (B) Correlations between local
LPP modulations for each SOA (see Methods and Figure 4) and thecorresponding P1/N1 effects. Note that N1 effects have been sign-reversedto facilitate visual comparisons between the graphs (see Methods).
contaminated by flash-elicited ERP components, including P1and N1. We binned the trials in four quartiles, based on single-trial LPP value, separately for each task condition. Finally, wecomputed the average P1 and N1 amplitudes for the trials inthe first and fourth quartiles (to compare the most extremeLPP amplitudes within participants), and submitted these to arepeated-measures ANOVA with quartile (1 vs. 4), valence, andSOA as within-subjects factors.
P1 amplitudes were lower for large-LPP trials (quartile 4:3.1 μV) than for small-LPP trials (quartile 1: 3.3 μV), F(1, 24) =6.3, p = 0.02. Note that this effect, predicted by the global inhibi-tion hypothesis, is in the opposite direction of any effect caused bythe confound described above. N1 amplitudes were also lower forlarge-LPP trials (−3.2 μV) than for small-LPP trials (−3.4 μV),but this difference was not significant, F(1, 24) = 1.3, p = 0.27.Quartile did not interact with SOA or valence.
Behavioral resultsMean correct RTs on lateral-flash trials were similar in the neg-ative (422 ms) and neutral condition (421 ms), F(1, 24) < 1,p = 0.76, η2
p = 0.0. Because mean error rates were very low and
did not differ much between the negative (1.9%) and neutralcondition (1.5%), we did not analyze them further.
DISCUSSIONIn Experiment 2 we presented high-intensity flashes during arobust emotion-induced modulation of the LPP. The amplitudeof the P1 to these flashes was not affected by the emotionalintensity of the preceding IAPS pictures. In contrast, N1 ampli-tudes were significantly smaller following negative pictures, butonly if the interval between the picture and the flash was rela-tively short (570 ms). Furthermore, in line with Experiment 1, allcross-subject correlations between LPP modulations and corre-sponding changes in P1/N1 amplitudes were negative, although(again) none were statistically significant. Within-subject com-parisons demonstrated that large-LPP trials were associated withlower P1 amplitudes. Taken together, these findings provide somesupport for the global inhibition hypothesis, but any truly existingeffect is likely to be modest.
We found no difference in RTs and accuracy after negative pic-tures. These findings appear to contrast with results of Weinbergand Hajcak (2011), who reported small but reliable increases
Frontiers in Human Neuroscience www.frontiersin.org February 2012 | Volume 6 | Article 33 | 9

Brown et al. Functional significance of LPP
in RT following positive and negative IAPS pictures. This dis-crepancy is probably due to differences in stimulus duration.Weinberg and Hajcak presented the IAPS pictures for 1000 msimmediately before, and for 400 ms immediately after the targetstimulus, which was presented for 150 ms. That is, direct compe-tition between the IAPS picture and the target for spatial and/ortemporal attention was probably larger than in our study, andthis competition may have been increased for arousing stimuli.Furthermore, subjects were planning and executing their responsewhile the IAPS picture was back on the screen, allowing a directeffect of picture valence on RTs. We note that these response-time effects are of secondary interest to the current purposes,because RTs include the duration of several processes other thanperception.
GENERAL DISCUSSIONWe conducted two experiments to gain insight into the functionalsignificance of the LPP. In particular, we contrasted the enhancedperception hypothesis with the global inhibition hypothesis. Theenhanced perception hypothesis proposes that the LPP reflectsa broadly enhanced perceptual sensitivity throughout the visualfield, a potentially adaptive attentional response to emotionalstimuli. Conversely, the global inhibition hypothesis assumes thatthe LPP reflects a global inhibition of potentially competing rep-resentations in the visual cortex, which may allow more selectiveprocessing of the emotional stimulus. Given that the LPP modula-tion outlasts the presentation duration of the emotional stimulusitself, we assumed that the effect of the underlying process wouldcarry over onto the visual processing of subsequently presentedneutral stimuli (cf. Bocanegra and Zeelenberg, 2009b). However,we found no conclusive evidence for either an improved or animpaired relationship between LPP amplitude and a behavioralmeasure of perceptual sensitivity (Experiment 1) or more directneural signatures of visual cortical excitability (Experiment 2).
Nevertheless, the results seemed to reveal a pattern. InExperiment 1, the behavioral index of perceptual sensitivity (d′)was unaffected by the valence of IAPS stimuli. More specifically,the robust LPP modulation to negative pictures was not accom-panied by enhanced or impaired perception of non-emotionaltargets presented during the LPP modulation. In Experiment 2,however, the N1 (but not P1) elicited by non-emotional stim-uli presented during the LPP modulation was smaller followingnegative than following neutral IAPS stimuli, specifically whenthe interval between the IAPS picture and the flash probe wasrelatively short. Furthermore, the P1 (but not N1) was smalleron trials with a large LPP than on trials with a small LPP.Finally, participants with a larger LPP modulation tended toshow an impairment in perceptual sensitivity (Experiment 1)and a (larger) decrease in P1 and N1 amplitude (Experiment 2).Although these correlations were of small to modest size, and notstatistically significant, 13 out of 14 of the reported correlationswere negative—a striking proportion. Thus, if anything, the pat-tern of results provides tentative support for the global inhibitionhypothesis.
Let us, for the moment, assume that the LPP reflects globalinhibition of activity in visual cortex. What might be the mecha-nism underlying this global inhibition? An interesting possibility
is that the global inhibition reflects the threshold control ofcortical excitability (Elbert and Rockstroh, 1987; Elbert, 1990).According to this account, the presentation of a motivationallysignificant stimulus is immediately followed by an increase inneuronal firing threshold, such that ongoing (pre-stimulus) neu-ral activity will instantaneously drop to a low level, and activitywill survive only in cell assemblies processing the just arrivedstimulus. This interrupt function, while preventing overactivationin a network with primarily excitatory connections, will facili-tate the processing of the motivationally significant stimulus andinhibit cortical excitability elsewhere in the visual cortex. Thisthreshold regulation may be achieved by a local population ofinhibitory interneurons or, more likely, by non-specific thalamo-cortical afferents (Elbert, 1990). Importantly, Birbaumer, Elbertand colleagues have argued that the reflexive up-regulation offiring threshold after an important stimulus, and correspondingdampening of competing neural activity, should manifest at thescalp as a slow positive potential, such as the LPP (Birbaumer et al.,1990). Future studies could test a prediction of this account thatlarger LPPs should be accompanied by an increased threshold foreffects of transcranial magnetic stimulation of the visual cortex.
A perhaps closely related possibility is that the LPP reflects aphase resetting of low-frequency delta oscillations, caused by thepresentation of the emotionally arousing stimulus (cf. Schroederand Lakatos, 2009). Lakatos and colleagues have found that thesmallest visual-evoked responses and the slowest RTs occur whenstimuli are presented around the positive peak of delta oscilla-tions, which they refer to as low-excitability phase (as opposedto the negative peak/high-excitability phase; Lakatos et al., 2008).Thus, we propose that the indications that we found for a globalinhibition of visual processing during the LPP may reflect theconsequences of a positive-amplitude low-excitability phase ofdelta oscillations, reset by the presentation of emotional stimuli.In this case, the evidence for a reduction of P1/N1 amplitudesduring the LPP reflects a case of cross-frequency coupling, withthe power of faster oscillations (reflected in P1/N1 amplitude)modulated by the phase of slower (delta) oscillations. An inter-esting possibility is that phase resetting of delta oscillations is aresult of the threshold-regulation process discussed above.
Although we found very little effects of our manipulations, weare confident that our dependent measures were sufficiently sen-sitive. Bocanegra and Zeelenberg (2009a) have reported emotion-related improvements in orientation sensitivity for the sameGabor stimuli that we used in Experiment 1. P1 and N1 ampli-tude, used in Experiment 2, are broadly accepted measures ofperceptual sensitivity, and we demonstrated that the results couldnot be attributed to ceiling effects on these component ampli-tudes. In theory, it is possible that the manipulation of LPPamplitude was not sufficiently strong to be accompanied byrobust effects on behavior. Our IAPS pictures, presented for only200 ms, yielded LPP modulations of 2.2 μV (Experiment 1) and1.7 μV (Experiment 2). These modulations would probably havebeen larger if the picture duration had been longer. However, ourparadigm required that the IAPS pictures disappeared well beforethe onset of the neutral target stimuli.
We do not understand why negative pictures were followedby a reduction of the probe-related N1 amplitude but not P1
Frontiers in Human Neuroscience www.frontiersin.org February 2012 | Volume 6 | Article 33 | 10

Brown et al. Functional significance of LPP
amplitude. Studies using other temporal-attention tasks, likethe accessory-stimulus task and the temporal-cuing task, havereported similar variable results: at times the P1 is mod-ulated while the N1 is not, and sometimes the reverse isfound (Correa et al., 2006; Jepma et al., 2009; Böckler et al.,2011). However, in these tasks the P1 and/or N1 increased inamplitude under conditions of enhanced temporal attention,whereas in our experiment the probe-related N1 decreased inamplitude. In contrast, Rockstroh et al. (1992) found simi-lar results, using a paradigm that is much more comparableto our paradigm. These authors presented a probe (auditoryclick) during the P3 evoked by an oddball stimulus, and founddecreased probe-related N1 amplitudes compared to probes pre-sented during the small P3 evoked by standard stimuli. Incontrast, the probe-related P1 was relatively unaffected by thesize of the P3. A tentative hypothesis is that the emotionallyarousing effects induced by the IAPS pictures in our study(and oddball stimuli in Rockstroh et al. study) only affect laterstages of perceptual processing (reflected by the N1), which
might account for the unmodulated P1. However, this seemsincompatible with findings that emotion can affect very earlystages of perceptual processing (e.g., Bocanegra and Zeelenberg,2009b). Indeed, the within-subject comparison between trialswith small and large LPP amplitudes (controlled for valence)revealed a reduction of the P1 but not N1 amplitude forlarge-LPP trials.
In sum, our results do not allow us to unequivocally rejector confirm either the enhanced perception hypothesis or theglobal inhibition hypotheses. However, while we found no evi-dence whatsoever for the enhanced perception hypothesis, someaspects of the results are consistent with the global inhibitionhypothesis—the notion that the LPP reflects a dampening ofactivity in visual cortex, perhaps as a result of reflexive thresholdregulation after an emotionally arousing stimulus. In any case, webelieve that our study provides significant clues for future studiesthat will try to link the LPP to cognitive and behavioral functions;we hope that our study will encourage others to study not justwhen the LPP occurs, but also what function it reflects.
REFERENCESBaetens, K., Van der Cruyssen, L.,
Achtziger, A., Vandekerckhove, M.,and Van Overwalle, F. (2011). N400and LPP in spontaneous trait infer-ences. Brain Res. 1418, 83–92.
Bocanegra, B. R., and Zeelenberg, R.(2009a). Emotion improves andimpairs early vision. Psychol. Sci. 20,707–713.
Bocanegra, B. R., and Zeelenberg,R. (2009b). Dissociating emotion-induced blindness and hypervision.Emotion 9, 865–873.
Birbaumer, N., Elbert, T., Canavan, A.G., and Rockstroh, B. (1990). Slowpotentials of the cerebral cortex andbehavior. Physiol. Rev. 70, 1–41.
Böckler, A., Alpay, G., and Stürmer,B. (2011). Accessory stimuli affectthe emergence of conflict, notconflict control. Exp. Psychol. 58,102–109.
Bradley, M. M., Codispoti, M., andLang, P. J. (2006). A multi-processaccount of startle modulationduring affective perception.Psychophysiology 43, 486–497.
Codispoti, M., Ferrari, V., and Bradley,M. M. (2007). Repetition andevent-related potentials: distin-guishing early and late processes inaffective picture perception. J. Cogn.Neurosci. 19, 577–586.
Correa, M., Lupiáñez, J., Madrid, E.,and Tudela, P. (2006). Temporalattention enhances early visual pro-cessing: a review and new evidencefrom event-related potentials. BrainRes. 1076, 116–128.
Correa, A., Lupiáñez, J., and Tudela,P. (2005). Attentional preparationbased on temporal expectancymodulates processing at the
perceptual level. Psychon. Bull. Rev.12, 328–334.
Crites, S. L. Jr., Mojica, A. J., Corral, G.,and Taylor, J. H. (2010). An event-related potential paradigm for iden-tifying (rare negative) attitude stim-uli that people intentionally misre-port. Psychophysiology 47, 984–988.
Cuthbert, B. N., Schupp, H. T., Bradley,M. M., Birbaumer, N., and Lang, P.J. (2000). Brain potentials in affec-tive picture processing: covariationwith autonomic arousal and affec-tive report. Biol. Psychol. 52, 95–111.
Dennis, T. A., and Hajcak, G. (2009).The late positive potential: a neu-rophysiological marker for emotionin children. J. Child Psychol. 50,1373–1383.
de Rover, M., Brown, S. B. R. E.,Boot, N., Hajcak, G., van Noorden,M. S., van der Wee, N. J. A., andNieuwenhuis, S. (2012). Betareceptor-mediated modulationof the late positive potential inhumans. Psychopharmacology 219,971–979.
Donchin, E. (1981). Surprise!. . .Surprise? Psychophysiology 18,493–513.
Elbert, T. (1990). “Slow cortical poten-tials reflect the regulation of cor-tical excitability,” in Slow PotentialChanges of the Human Brain, ed.W. C. McCallum (New York, NY:Plenum Press), 235–251.
Elbert, T., and Rockstroh, B. (1987).Threshold regulation: a key tothe understanding of the com-bined dynamics of EEG and event-related potentials. J. Psychophysiol.1, 317–333.
Faillenot, I., Suneart, S., Van Hecke,P., and Orban, G. A. (2001).
Orientation discrimination ofobjects and gratings compared: anfMRI study. Eur. J. Neurosci. 13,585–596.
Flaisch, T., Häcker, F., Renner, B., andSchupp, H. T. (2011). Emotion andthe processing of symbolic ges-tures: an event-related brain poten-tial study. Soc. Cogn. Affect. Neurosci.6, 109–118.
Fox, E., Lester, V., Russo, R., Bowles,R. J., Pichler, A., and Dutton, K.(2000). Facial expressions of emo-tion: are angry faces detected moreefficiently? Cogn. Emotion 14, 61–92.
Frühholz, S., Fehr, T., and Herrmann,M. (2009). Early and late temporo-spatial effects of contextual inter-ference during perception of facialaffect. Int. J. Psychophysiol. 74, 1–13.
Gratton, G., Coles, M. G. H., andDonchin, E. (1983). A new methodfor off-line removal of ocularartifact. Electroencephalogr. Clin.Neurophysiol. 55, 468–484.
Hajcak, G., MacNamara, A., and Olvet,D. M. (2010). Event-related poten-tials, emotion, and emotion regu-lation: an integrative review. Dev.Neuropsychol. 35, 129–155.
Hajcak, G., and Olvet, D. M. (2008).The persistence of attention to emo-tion: brain potentials during andafter picture presentation. Emotion8, 250–255.
Horan, W. P., Wynn, J. K., Kring, A.M., Simons, R. F., and Green, M.F. (2010). Electrophysiological cor-relates of emotional responding inschizophrenia. J. Abnorm. Psychol.119, 18–30.
Hurtado, E., Haye, A., Gonzáles,R., Manes, F., and Ibáñez, A.(2009). Contextual blending of
ingroup/outgroup face stimuli andword valence: LPP modulation andconvergence of measures. BMCNeurosci. 10, 69.
Jepma, M., Wagenmakers, E-J., Band,G. P. H., and Nieuwenhuis, S. T.(2009). The effects of accessorystimuli on information processing:evidence from electrophysiologyand a diffusion model analysis.J. Cogn. Neurosci. 21, 847–864.
Keil, A., Bradley, M. A., Hauk, O.,Rockstroh, B., Elbert, T., and Lang,P. J. (2002). Large-scale neural cor-relates of affective picture process-ing. Psychophysiology 39, 641–649.
Lakatos, P., Karmos, G., Mehta, A.D., Ulbert, I., and Schroeder, C.E. (2008). Entrainment of neu-ronal oscillations as a mechanismof attentional selection. Science 320,110–113.
Lang, P. J, Bradley, M. M., andCuthberth, B. N. (1999).International Affective PictureSystem (IAPS): Technical Manualand Affective Ratings. Gainesville,Fl. The Center for Research inPsychophysiology, University ofFlorida.
Marissen, M. A. E., Meuleman, L., andFranken, I. H. A. (2010). Alteredemotional information processingin borderline personality disor-der: an electrophysiological study.Psychiatry Res. 181, 226–232.
Matsuda, I., Nittono, H., Hirota, A.,Ogawa, T., and Takasawa, N. (2009).Event-related brain potentials dur-ing the standard autonomic-basedconcealed information test. Int. J.Psychophysiol. 74, 58–68.
Moratti, S., Saugar, C., and Strange,B. (2011). Prefrontal-occipital
Frontiers in Human Neuroscience www.frontiersin.org February 2012 | Volume 6 | Article 33 | 11
Brown et al. Functional significance of LPP
coupling underlies late latencyhuman neuronal responses to emo-tion. J. Neurosci. 31, 17278–17286.
Olofsson, J. K., Nordin, S., Sequeira,H., and Polich, J. (2008). Affectivepicture processing: an integrativereview of the ERP findings. Biol.Psychol. 77, 247–265.
Phelps, E. A., Ling, S., and Carrasco, M.(2006). Emotion facilitates percep-tion and potentiates the perceptualbenefits of attention. Psychol. Sci. 17,292–299.
Pourtois, G., Grandjean, D., Sander,D., and Vuilleumier, P. (2005).Electrophysiological correlates ofrapid spatial orienting towards fear-ful faces. Cereb. Cortex 14, 619–633.
Rockstroh, B., Müller, M., Cohen,R., and Elbert, T. (1992). Probingthe functional brain state duringP300-evocation. J. Psychophysiol. 6,175–184.
Sabatinelli, D., Lang, P. J., Keil,A., and Bradley, M. M. (2007).Emotional perception: correlation
of functional MRI and event-related potentials. Cereb. Cortex 17,1085–1091.
Schroeder, C. E., and Lakatos, P. (2009).Low-frequency neuronal oscilla-tions as instruments of sensoryselection. Trends Neurosci. 32, 9–18.
Schupp, H. T., Flaisch, T., Stockburger,J., and Junghöfer, M. (2006).Emotion and attention: event-related brain potential studies. Prog.Brain Res. 156, 31–51.
Schupp, H. T., Junghöfer, M., Weike,A. I., and Hamm, A. O. (2004a).The selective processing of brieflypresented affective pictures: anERP analysis. Psychophysiology 41,441–449.
Schupp, H. T., Öhman, A., Junghöfer,M., Weike, A. I., Stockburger, J.,and Hamm, A. O. (2004b). Thefacilitated processing of threateningfaces: an ERP analysis. Emotion 4,189–200.
Shapiro, K. L., Arnell, K. M., andRaymond, J. E. (1997). The
attentional blink. Trends Cogn. Sci.8, 291–296.
Stanislaw, H., and Todorov, N. (1999).Calculation of signal detectiontheory measures. Behav. Res.Methods Instrum. Comput. 31,137–149.
Vuilleumier, P. (2005). How brainsbeware: neural mechanisms of emo-tional attention. Trends Cogn. Sci.12, 585–594.
Weinberg, A., and Hajcak, G. (2010).Beyond good and evil: the time-course of neural activity elicited byspecific picture content. Emotion 10,767–782.
Weinberg, A., and Hajcak, G. (2011).The late positive potential predictssubsequent interference with targetprocessing. J. Cogn. Neurosci. 23,2994–3007.
Zeelenberg, R., Wagenmakers, E-J., andRotteveel, M. (2006). The impactof emotion on perception: bias orenhanced processing? Psychol. Sci.17, 287–291.
Conflict of Interest Statement: Theauthors declare that the researchwas conducted in the absence of anycommercial or financial relationshipsthat could be construed as a potentialconflict of interest.
Received: 01 November 2011; accepted:14 February 2012; published online: 27February 2012.Citation: Brown SBRE, van SteenbergenH, Band GPH, de Rover M andNieuwenhuis S (2012) Functional signif-icance of the emotion-related late positivepotential. Front. Hum. Neurosci. 6:33.doi: 10.3389/fnhum.2012.00033Copyright © 2012 Brown, vanSteenbergen, Band, de Rover andNieuwenhuis. This is an open-accessarticle distributed under the terms ofthe Creative Commons Attribution NonCommercial License, which permitsnon-commercial use, distribution, andreproduction in other forums, providedthe original authors and source arecredited.
Frontiers in Human Neuroscience www.frontiersin.org February 2012 | Volume 6 | Article 33 | 12
Copyright © 2022 FDOKUMEN