Forty Years of Civil Jury Verdicts
25
Forty Years of Civil Jury Verdicts Seth A. Seabury, Nicholas M. Pace, and Robert T. Reville* Debate over civil justice reform in the United States frequently centers on the extent to which damage awards granted by juries have been escalating over time. However, past studies on civil juries have been hampered by lack of data on verdicts spanning a sufficiently long time period. Average jury awards tend to be highly variable from year to year, making it difficult to distinguish trends over relatively short periods of time. We use the longest time series of data on jury verdicts ever assembled: 40 years of data on tort cases in San Francisco County, CA and Cook County, IL collected by the RAND Institute for Civil Justice. We find that while there has been a sub- stantial increase in the average award amount in real dollars, much of this trend is explained by changes in the mix of cases, particularly a decreasing fraction of automobile cases and an increase in medical malpractice. Claimed economic losses, in particular claimed medical losses, also explain a great deal of the increase. Although there appears to be some unex- plained growth in awards for certain types of cases, this growth is cancelled out on average by declines in awards in other types of cases. I. INTRODUCTION Juries and the verdicts they render seem to be perpetual hot topics in debates over civil justice reform. It has become standard mantra for proponents of reform to claim that damage awards are simply too high and getting worse, often citing a few high-profile verdicts or some limited statistics to demon- strate a high level of growth in award magnitude. Opponents contest the validity of these statistics or cite their own numbers showing far more limited growth in the size of jury verdicts. The confusion is made possible by a general lack of systematic discussion on the nature and causes of long-term trends in jury awards. 1 *Seabury is an Associate Economist; Pace is an Associate Social Scientist; Reville is a Senior Economist at the RAND Institute for Civil Justice. Address correspondence to Seth Seabury, RAND, 1700 Main St., Santa Monica, CA, 90407; email [email protected]. The authors would like to thank Stephen Carroll, Amitabh Chandra, Steven Garber, David Loughran, Charles Silver, Eric Talley, Ted Eisenberg, two anonymous referees, and seminar par- ticipants at RAND for helpful comments and suggestions. Any errors or omissions are our own. Journal of Empirical Legal Studies Volume 1, Issue 1, 1–25, March 2004
-
Upload
independent -
Category
Documents
-
view
2 -
download
0
Transcript of Forty Years of Civil Jury Verdicts
Forty Years of Civil Jury VerdictsSeth A. Seabury, Nicholas M. Pace, and Robert T. Reville*
Debate over civil justice reform in the United States frequently centers onthe extent to which damage awards granted by juries have been escalatingover time. However, past studies on civil juries have been hampered by lackof data on verdicts spanning a sufficiently long time period. Average juryawards tend to be highly variable from year to year, making it difficult todistinguish trends over relatively short periods of time. We use the longesttime series of data on jury verdicts ever assembled: 40 years of data on tortcases in San Francisco County, CA and Cook County, IL collected by theRAND Institute for Civil Justice. We find that while there has been a sub-stantial increase in the average award amount in real dollars, much of thistrend is explained by changes in the mix of cases, particularly a decreasingfraction of automobile cases and an increase in medical malpractice.Claimed economic losses, in particular claimed medical losses, also explaina great deal of the increase. Although there appears to be some unex-plained growth in awards for certain types of cases, this growth is cancelledout on average by declines in awards in other types of cases.
I. INTRODUCTION
Juries and the verdicts they render seem to be perpetual hot topics in debatesover civil justice reform. It has become standard mantra for proponents ofreform to claim that damage awards are simply too high and getting worse,often citing a few high-profile verdicts or some limited statistics to demon-strate a high level of growth in award magnitude. Opponents contest thevalidity of these statistics or cite their own numbers showing far more limitedgrowth in the size of jury verdicts. The confusion is made possible by ageneral lack of systematic discussion on the nature and causes of long-termtrends in jury awards.
1
*Seabury is an Associate Economist; Pace is an Associate Social Scientist; Reville is a SeniorEconomist at the RAND Institute for Civil Justice. Address correspondence to Seth Seabury,RAND, 1700 Main St., Santa Monica, CA, 90407; email [email protected].
The authors would like to thank Stephen Carroll, Amitabh Chandra, Steven Garber, DavidLoughran, Charles Silver, Eric Talley, Ted Eisenberg, two anonymous referees, and seminar par-ticipants at RAND for helpful comments and suggestions. Any errors or omissions are our own.
Journal of Empirical Legal StudiesVolume 1, Issue 1, 1–25, March 2004
Scholarly work on trends in jury verdict awards has been inconclusive,but generally finds little support for the more pessimistic view of runawayjuries and increasingly generous awards. Shanley and Peterson (1983),Moller (1996), Eisenberg and Henderson (1992), Eisenberg (1999), andMerritt and Barry (1999) all find statistically significant but often minor (oreven negative in the Merritt and Barry study) growth in average, or median,jury awards over time. Daniels and Martin (1995) examine 20 years of juryverdicts and find that the data have too much variability to support anygeneral trends. In general, the data are highly variable and exhibit starklydifferent short-term trends over five-year and even 10-year periods, particu-larly for different types of verdicts (e.g., medical malpractice and productsliability). The variability in short-term trends highlights the need for a longertime series to more thoroughly examine long-term changes in the averagesize of civil jury verdicts.
This article examines the long-term trends in jury verdicts reached intort trials using 40 years of data from San Francisco County, CA and CookCounty, IL. Our data come from the RAND Institute for Civil Justice (ICJ),which has been collecting and analyzing data on jury verdicts for the past20 years.1 However, while the ICJ data include verdicts rendered in somejurisdictions from as far back as 1959, previous reports have focused theiranalysis on smaller time periods of just 20, 10, or 5 years. This report usesverdicts reached in the years 1960–1999 in San Francisco County and CookCounty and, as such, this is the first time all the collections of ICJ data haveever been combined into a single, unified sample for multidecade analysis,albeit for two counties only. The 40 years of data that we analyze here com-prise, to our knowledge, the longest time series on jury decisions ever col-lected in a uniform manner, offering an unprecedented opportunity to studythe long-term behavior of jury verdicts.
Our study is concerned not only with how much jury verdicts havegrown over time, but also with the determinants of that growth. Peterson(1984) showed systematic differences in awards granted to different casetypes (e.g., automobile personal injury cases, medical malpractice cases, etc.)even when the type of injury was controlled for. The results of Chin andPeterson (1985) suggest that some of this difference can be explained by
2 Forty Years of Civil Jury Verdicts
1See, e.g., Peterson and Priest (1982), Shanley and Peterson (1983), Peterson (1984), Chinand Peterson (1985), Hensler et al. (1987), Peterson (1987), Moller (1996), and Moller, Pace,and Carroll (1999).

differences in plaintiff and defendant characteristics. Because the distribu-tion of cases that go to trial is generally not static, we would expect thatchanges in award levels could be driven in part by changes in a variety ofcase characteristics. Using a rich set of control variables, we ask how muchof the change in jury awards over time can be explained by observable char-acteristics. The “left-over” variation in awards over time should incorporatechanges in jury behavior as well as any unobservable factors correlated withawards.
We show in this article that both the average and median jury awardsin tort cases have increased significantly in real terms from 1960–1999.Factors such as the mix of case types and the level of claimed economicdamages have changed noticeably as well. We use regression analysis to iden-tify how much of the trend in average awards can be explained by changesin these observable case characteristics. Although the regression results mustbe interpreted with caution due to the potential for selection bias, growthin awards unexplained by our model can provide some insight as to howmuch jury behavior might have changed since 1960.
Our results are striking. Not only do we show that real average awardshave grown by less than real income over the 40 years in our sample, we alsofind that essentially all of this growth can be explained by changes in observ-able case characteristics and claimed economic losses (particularly claimedmedical costs). However, focusing on the average award masks considerableheterogeneity in the growth rates for different kinds of cases. In particular,we find that the average award in automobile cases declined after control-ling for claimed medical costs, offsetting persistent and unexplained growthin the average awards for other tort cases. In general, though, the growth(or decline) does not appear substantial enough to support claims of radi-cally changing jury behavior over the past 40 years. Rising claimed medicalcosts appear to be one of the most important factors driving increases injury verdicts.
In the following section of this article, we discuss the data that we useand address some issues regarding its reliability and limitations. In the thirdsection we turn to our analysis of the data. In that section, we first presenta descriptive analysis, where we discuss the observed trends in the numberof verdicts, size of awards, and types of verdicts in our sample. Then we moveon to a regression analysis where we examine both the size of the trend andthe determinants of it. The fourth section offers some concluding remarksand suggestions for future research.
Seabury et al. 3
II. DATA
A. ICJ Jury Verdict Data
This article uses data from the ICJ’s Jury Verdicts Coding Project, a data-col-lection effort that has tracked verdicts in selected jurisdictions dating backto 1959. The sources for this database are private publications (generallyknown as “jury verdict reporters”) that are primarily intended for lawyers,insurance adjusters, and others who have a need to keep abreast of whatlocal juries are awarding for specific types of claims. The publications reportrecent jury verdicts within a particular jurisdiction by providing detailedinformation about case and party characteristics and the outcome of eachtrial. The approach to gathering such information used by each jury verdictreporter differs but generally they either use trial reports submitted volun-tarily by attorneys or identify new verdicts through court records and othersources and thereafter survey the attorneys directly.2
Our data for this analysis come from the California Jury Verdicts Weeklyand Cook County Jury Verdict Reporter, publications that have provided infor-mation on trials conducted in California and Cook County, IL, respectively,for more than four decades. In this article, we exclude verdicts from California Jury Verdicts Weekly that originate outside of San Francisco Countybecause San Francisco is the only California county for which 40 years ofcomplete data were recorded by ICJ staff. We also excluded verdicts involv-ing contracts, business, or other types of “financial injury” cases, verdictsresulting from trials conducted in the federal district courts located in California or Illinois, and verdicts rendered in limited jurisdiction courts(e.g., “municipal” or “small claims” courts) of each state. These types of ver-dicts were excluded because the coverage of these in the reporters—espe-cially during the 1960s and 1970s—does not seem as comprehensive as thatfor tort cases in general jurisdiction superior courts.3 Included in our sampleare all medical malpractice, other professional malpractice, product liabil-ity, automobile, common carrier, and premises liability verdicts, as well asother tort cases such as civil rights cases and intentional torts.
4 Forty Years of Civil Jury Verdicts
2Another method that appears to have been employed by at least one reporter in the 1960sand 1970s was to station observers in each courtroom within a particular jurisdiction to recorddetails of any trials they encountered first hand.
3See Moller, Pace, and Carroll (1999).
We combined 40 years of data from the ICJ’s four separate data-col-lection efforts. In the most recent phase of the data-collection project (PhaseIV), a comprehensive data-collection instrument was used to abstract exten-sive information about verdicts rendered in 1995 through 1999 in all of thecounties of California and New York, Cook County (Chicago, IL), HarrisCounty (Houston, TX), King County (Seattle, WA), and the Saint Louis, MOmetropolitan area. A similar approach was taken for previous coding effortsfor verdicts rendered between 1985 and 1994 for these same jurisdictions(Phase III), for California and Cook County cases only for the years of 1980through 1984 (Phase II), and for San Francisco County and Cook Countyonly for the years 1960 through 1979 (Phase I). As such, the only jurisdic-tions available that would cover the maximum range of years were San Francisco County and Cook County.
The core data instruments used in Phase IV and Phase III were largelythe same, differing only by some additional questions included in Phase IV.However, the coding instruments used in Phase I and Phase II were markedlydifferent, both from each other and from the later instruments. Each of thephases collected somewhat different sorts of information from the juryverdict reporters though there were a set of common elements such as partytype, outcome, broad category of litigated issues, and the like. Our strategywas to target a few critical data items that were reported consistently enoughacross the different phases that comparable measures could be calculated.These items include total damage awards, claimed economic losses (some-times referred to as “claimed specials”), the types of issues litigated, andvarious plaintiff and defendant characteristics.4 Once these items werecoded, we merged the verdicts from the different phases to create a data setthat was comparable over the entire 40 years.
B. Estimation Using Data from Jury Verdict Reporters
The use of data from jury verdict reporters in empirical analysis has tradi-tionally been the subject of some controversy.5 One area of concern is thecomprehensiveness of the data collected by jury verdict reporters. Court
Seabury et al. 5
4Unfortunately, we have as yet been unable to create a consistent coding scheme for the typeand severity of any physical or psychological injuries being claimed.
5For example, see Vidmar (1994), Moller, Pace, and Carroll (1999), and Eisenberg (2001).
systems themselves historically do not collect much, if any, detailed dataabout the specific verdicts rendered in their own courtrooms and, in anyevent, no reporter that we are aware of gets all its information from officialcourt records. Rather, jury verdict reporters generally rely on individualattorneys involved in the case to voluntarily provide information. This hasled some to question whether the data collected from reporters are reliablein the sense that they accurately represent the sample of jury verdicts.
Earlier ICJ studies used a sampling of public records to assess the reli-ability of the reporters used in this study for the Phase I data. Peterson andPriest (1982) found that the Cook County Jury Verdict Reporter included at least90 percent of the verdicts in almost every year from 1960–1978. Shanley andPeterson (1983) found that the California Jury Verdicts Weekly includes at least84 percent of the verdicts in San Francisco County in 1974 and 1979. More-over, the verdicts most likely to be omitted were contract and financial injurycases, which is one of the reasons we do not include these cases in this study.Therefore, we feel that the data are suitably reliable for our purposes.
The second issue typically brought up with regards to reporter data is a more general one that applies to all analyses of outcomes at trial: the fact that jury verdicts represent a small fraction of all disputes in the civil justice system. Matters that actually receive a jury verdict are relativelyfew in number, and many of the factors that influence the decision whetherto continue to pursue compensation all the way from initial injury to thefinal verdict stage are probably unobservable, even in a rich data set such asours. Priest and Klein (1984), Eisenberg (1990), Vidmar (1994), Eisenbergand Farber (1997), Eisenberg (2000), and others all suggest that the pretrialbargaining process leads to a nonrandom selection of disputes that aredescribed in data on jury verdicts. If the unobservable factors that influencethe selection of cases proceeding to trial change in any systematic way overtime, this could affect our estimate of the long-term trend in awards.
Speaking more formally, the jury verdicts in our sample represent atruncated sample of all disputes.6 The key to whether our regression analysisof the long-term trend in jury behavior produces an unbiased estimate ofthe trend in jury behavior is that the truncation be exogenous to the levelof damage awards. For us to identify the “true” long-term trend, it must betrue that (1) the sample selection process has remained stationary over timeor (2) any changes in the selection of verdicts is either independent of
6 Forty Years of Civil Jury Verdicts
6For a discussion of estimation in the presence of truncation, see Maddala (1983).
changes in the level of awards or is completely explained by changes in theother observed independent variables in our model.
The primary effect of the selection problem is that it weakens ourability to interpret our estimate of the long-term trend in awards as a causalparameter, that is, as an estimate of changes in the underlying preferencesand behavior of juries. Using the distinction discussed in Clermont andEisenberg (1998), our analysis should be thought of as descriptive ratherthan true inference (unless the assumptions listed above hold). We willdescribe how juries grant awards in the set of cases that actually result in ajury verdict, and the extent to which the observed trend in awards isexplained by changes in observable case characteristics. To this end we hopeto be able to determine whether the data provide any direct evidence thatjuries have been systematically granting higher awards.
III. ANALYSIS
A. Observed Growth in Awards and Changes in Case Characteristics
Our empirical objectives in this study are twofold: to document the growthin average awards over time and to determine how much of this growth isdue to changes in observable characteristics. In this section we provide adescriptive analysis of how the average award and the characteristics of thecases have changed over time. The characteristics that we think influenceaward levels (and that we have data on) include the types of issues litigated,plaintiff and defendant characteristics, and the level of claimed medical andnonmedical economic losses.
Turning first to the level of damage awards, Figure 1 illustrates theaverage and median jury award in Cook County and San Francisco Countyfrom 1960–1999 in Year 2000 dollars. The jury award is the total amount ofdollars awarded to the plaintiff, including all compensatory and punitivedamages. For the purposes of this figure, the data have been “trimmed,” thatis, the top and bottom 1 percent of the data were removed to reduce theimpact of outliers.7
The figure shows the average and median awards conditional on aplaintiff win, which for our purposes is defined simply as some positive dollar
Seabury et al. 7
7This trimming is done purely for aesthetic purposes. The data are not trimmed for the regres-sions presented later, but the qualitative results are identical even if we do trim.

amount awarded to the plaintiff.8 There are two key metrics of jury gen-erosity: the level of awards that they grant and the likelihood with which theyassign liability to the defendant. By looking only at plaintiff wins we are considering trends in the former independently of the latter. If juries have become more or less likely to find for the plaintiff over time, this is an important trend in jury behavior that will not be captured by our analy-sis. Thus, our study should be seen as focusing on only one aspect of jury
8 Forty Years of Civil Jury Verdicts
Figure 1: Average and median damage awards in tort verdicts by year.
0
100
200
300
400
500
600
700
1960 1965 1970 1975 1980 1985 1990 1995
Year
Tho
usan
ds o
f Y
ear
2000
Dol
lars
Average Award Median Award
8Not every plaintiff who receives a nonzero amount of damages from a jury will necessarilybelieve that the outcome of the trial has been a successful one. The damages awarded can some-times be less than the plaintiffs and their attorneys might have hoped for, less than what theymight have expected, and sometimes less than their own costs incurred during litigation andtrial. Thus, “wins” as we have narrowly defined them may occasionally result in very unhappyplaintiffs and very pleased defendants.
NOTE: The figure includes data on all tort verdicts from San Francisco County and CookCounty in which a nonzero award was granted to the plaintiff. The top and bottom 1 percentof awards are trimmed.
behavior, and the assignment of liability is a topic that we leave for futureresearch.
The figure clearly illustrates a trend toward higher jury verdicts in tortcases over the 40 years of our sample. There is modest growth in the averageover the first 25 years, followed by a period of exceptionally rapid growth inthe late 1980s and little or no growth in the 1990s. The median awardchanges little until almost 1990, after which it grows substantially, thoughnot by as much as the average.
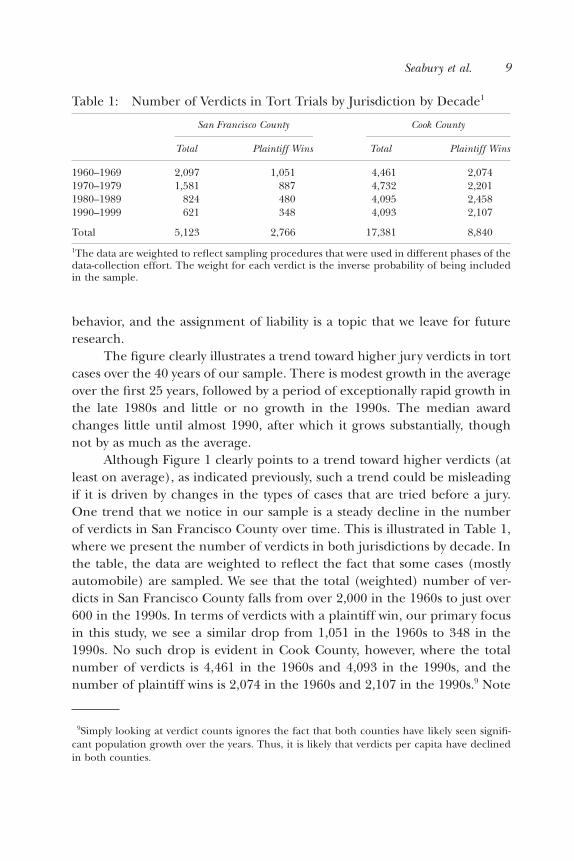
Although Figure 1 clearly points to a trend toward higher verdicts (atleast on average), as indicated previously, such a trend could be misleadingif it is driven by changes in the types of cases that are tried before a jury.One trend that we notice in our sample is a steady decline in the numberof verdicts in San Francisco County over time. This is illustrated in Table 1,where we present the number of verdicts in both jurisdictions by decade. Inthe table, the data are weighted to reflect the fact that some cases (mostlyautomobile) are sampled. We see that the total (weighted) number of ver-dicts in San Francisco County falls from over 2,000 in the 1960s to just over600 in the 1990s. In terms of verdicts with a plaintiff win, our primary focusin this study, we see a similar drop from 1,051 in the 1960s to 348 in the1990s. No such drop is evident in Cook County, however, where the totalnumber of verdicts is 4,461 in the 1960s and 4,093 in the 1990s, and thenumber of plaintiff wins is 2,074 in the 1960s and 2,107 in the 1990s.9 Note
Seabury et al. 9
9Simply looking at verdict counts ignores the fact that both counties have likely seen signifi-cant population growth over the years. Thus, it is likely that verdicts per capita have declinedin both counties.
Table 1: Number of Verdicts in Tort Trials by Jurisdiction by Decade1
San Francisco County Cook County
Total Plaintiff Wins Total Plaintiff Wins
1960–1969 2,097 1,051 4,461 2,0741970–1979 1,581 887 4,732 2,2011980–1989 824 480 4,095 2,4581990–1999 621 348 4,093 2,107
Total 5,123 2,766 17,381 8,840
1The data are weighted to reflect sampling procedures that were used in different phases of thedata-collection effort. The weight for each verdict is the inverse probability of being includedin the sample.
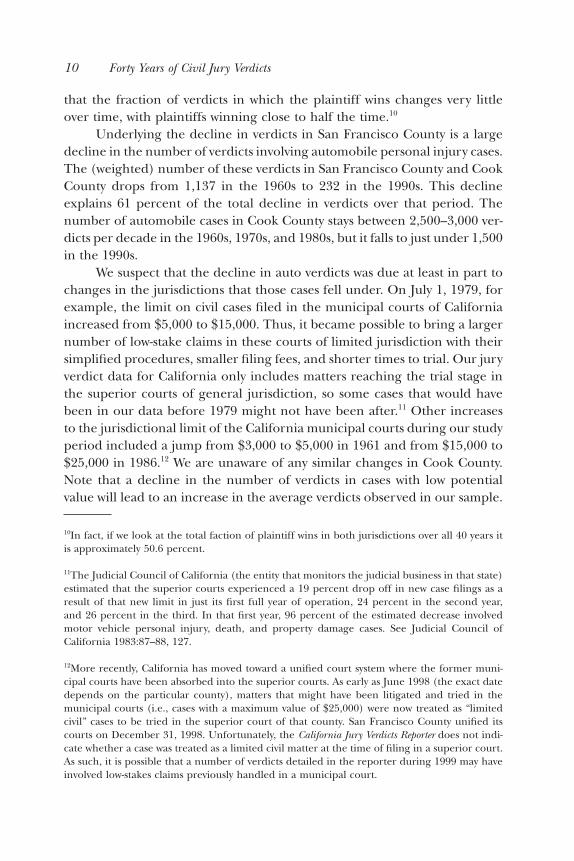
that the fraction of verdicts in which the plaintiff wins changes very littleover time, with plaintiffs winning close to half the time.10
Underlying the decline in verdicts in San Francisco County is a largedecline in the number of verdicts involving automobile personal injury cases.The (weighted) number of these verdicts in San Francisco County and CookCounty drops from 1,137 in the 1960s to 232 in the 1990s. This declineexplains 61 percent of the total decline in verdicts over that period. Thenumber of automobile cases in Cook County stays between 2,500–3,000 ver-dicts per decade in the 1960s, 1970s, and 1980s, but it falls to just under 1,500in the 1990s.
We suspect that the decline in auto verdicts was due at least in part tochanges in the jurisdictions that those cases fell under. On July 1, 1979, forexample, the limit on civil cases filed in the municipal courts of Californiaincreased from $5,000 to $15,000. Thus, it became possible to bring a largernumber of low-stake claims in these courts of limited jurisdiction with theirsimplified procedures, smaller filing fees, and shorter times to trial. Our juryverdict data for California only includes matters reaching the trial stage inthe superior courts of general jurisdiction, so some cases that would havebeen in our data before 1979 might not have been after.11 Other increasesto the jurisdictional limit of the California municipal courts during our studyperiod included a jump from $3,000 to $5,000 in 1961 and from $15,000 to$25,000 in 1986.12 We are unaware of any similar changes in Cook County.Note that a decline in the number of verdicts in cases with low potentialvalue will lead to an increase in the average verdicts observed in our sample.
10 Forty Years of Civil Jury Verdicts
10In fact, if we look at the total faction of plaintiff wins in both jurisdictions over all 40 years itis approximately 50.6 percent.
11The Judicial Council of California (the entity that monitors the judicial business in that state)estimated that the superior courts experienced a 19 percent drop off in new case filings as aresult of that new limit in just its first full year of operation, 24 percent in the second year, and 26 percent in the third. In that first year, 96 percent of the estimated decrease involvedmotor vehicle personal injury, death, and property damage cases. See Judicial Council of California 1983:87–88, 127.
12More recently, California has moved toward a unified court system where the former muni-cipal courts have been absorbed into the superior courts. As early as June 1998 (the exact datedepends on the particular county), matters that might have been litigated and tried in themunicipal courts (i.e., cases with a maximum value of $25,000) were now treated as “limitedcivil” cases to be tried in the superior court of that county. San Francisco County unified itscourts on December 31, 1998. Unfortunately, the California Jury Verdicts Reporter does not indi-cate whether a case was treated as a limited civil matter at the time of filing in a superior court.As such, it is possible that a number of verdicts detailed in the reporter during 1999 may haveinvolved low-stakes claims previously handled in a municipal court.
Later, when we decompose the growth of awards, we will control for thesechanges in municipal limits.
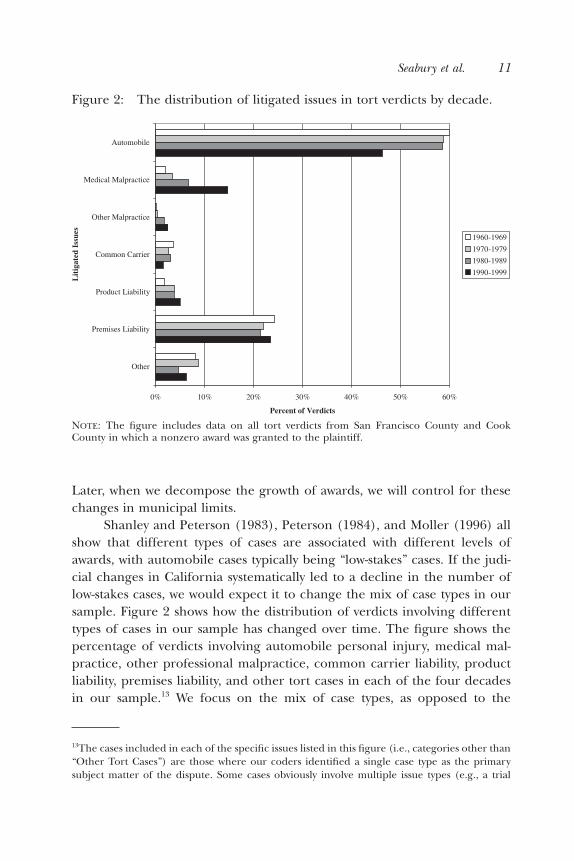
Shanley and Peterson (1983), Peterson (1984), and Moller (1996) allshow that different types of cases are associated with different levels ofawards, with automobile cases typically being “low-stakes” cases. If the judi-cial changes in California systematically led to a decline in the number oflow-stakes cases, we would expect it to change the mix of case types in oursample. Figure 2 shows how the distribution of verdicts involving differenttypes of cases in our sample has changed over time. The figure shows thepercentage of verdicts involving automobile personal injury, medical mal-practice, other professional malpractice, common carrier liability, productliability, premises liability, and other tort cases in each of the four decadesin our sample.13 We focus on the mix of case types, as opposed to the
Seabury et al. 11
Figure 2: The distribution of litigated issues in tort verdicts by decade.
0% 10% 20% 30% 40% 50% 60%
Other
Premises Liability
Product Liability
Common Carrier
Other Malpractice
Medical Malpractice
Automobile
Lit
igat
ed I
ssue
s
Percent of Verdicts
1960-1969
1970-1979
1980-1989
1990-1999
13The cases included in each of the specific issues listed in this figure (i.e., categories other than“Other Tort Cases”) are those where our coders identified a single case type as the primarysubject matter of the dispute. Some cases obviously involve multiple issue types (e.g., a trial
NOTE: The figure includes data on all tort verdicts from San Francisco County and CookCounty in which a nonzero award was granted to the plaintiff.

numbers of verdicts involving particular issues, because we are interested inhow the average case has changed over time. Note that because we are inter-ested in explaining trends in award levels, from now on our analysis focusesexclusively on the set of verdicts in which the plaintiff wins.
From the figure we observe two primary changes in the distributionover time: a drop in the share of verdicts involving automobile cases and anincrease in the share involving medical malpractice. The percent of verdictsinvolving auto cases falls from a high of about 60 percent in the 1960s tojust 46.3 percent in the 1990s. The fraction involving medical malpracticeincreases fairly gradually over the first three decades in the sample, risingfrom 2.1 percent in the 1960s to 6.7 percent in the 1980s, and then increasessharply to 14.7 percent in the 1990s. For verdicts involving other specificcase types, we see moderate but clear increases in the percentage of trialsinvolving other professional malpractice and product liability, and a fairlysteady decline in the proportion of those with common carrier issues.
Changes in the types of issues being litigated suggests a possible expla-nation for at least part of the trend observed in Figure 1. If automobile caseshave lower payments on average and if they declined in frequency over the40 years in our sample, then, ceteris paribus, we would expect an increasein the overall average dollars awarded by juries. Note that this change cannotbe explained just by reforms to San Francisco’s municipal court limitsbecause some of the biggest changes occur in the 1990s when there was nochange in the jurisdictional ceiling.
Another factor that might influence average award amounts is the typeof litigant, specifically whether the defendant is an individual, a corporation,or government entity. Under the “deep pockets” hypothesis, which is essen-tially the notion that juries impose larger damages on defendants withgreater resources because they are better able to bear costs, we would expectthat individual defendants would pay out less in terms of awards even if allother aspects of these cases remained unchanged. If true, then a possibleexplanation for observed trends in jury awards would be changes in the mix
12 Forty Years of Civil Jury Verdicts
where a defendant-doctor is being sued for medical malpractice for negligent insertion of a sili-cone breast implant and where a manufacturer-defendant is being sued in the same case overproducts liability for the defective implant) but our data make it difficult to distinguish primaryfrom secondary issues. Focusing on single-issue cases helps make comparisons of case types asclear as possible. Verdicts in which multiple issues were litigated are included in the “OtherTort Cases” category.
of defendants in these cases over time. Note that we say nothing about plain-tiff characteristics here. Over 90 percent of plaintiffs in our sample are indi-viduals, a fact that remains largely unchanged over time. Thus, while wecontrol for plaintiff types in our multivariate analysis in the next section, weignore it for now.
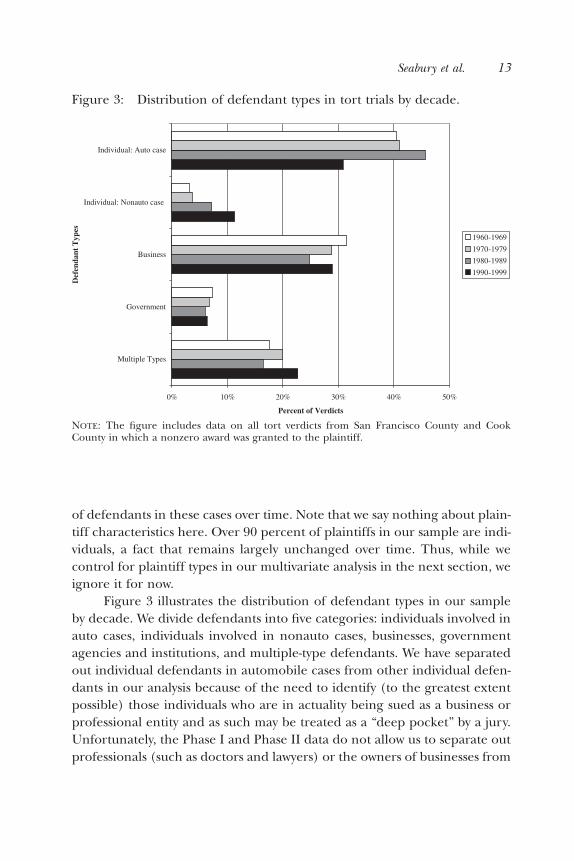
Figure 3 illustrates the distribution of defendant types in our sampleby decade. We divide defendants into five categories: individuals involved inauto cases, individuals involved in nonauto cases, businesses, governmentagencies and institutions, and multiple-type defendants. We have separatedout individual defendants in automobile cases from other individual defen-dants in our analysis because of the need to identify (to the greatest extentpossible) those individuals who are in actuality being sued as a business orprofessional entity and as such may be treated as a “deep pocket” by a jury.Unfortunately, the Phase I and Phase II data do not allow us to separate outprofessionals (such as doctors and lawyers) or the owners of businesses from
Seabury et al. 13
0% 10% 20% 30% 40% 50%
Multiple Types
Government
Business
Individual: Nonauto case
Individual: Auto case
Def
enda
nt T
ypes
Percent of Verdicts
1960-1969
1970-1979
1980-1989
1990-1999
Figure 3: Distribution of defendant types in tort trials by decade.
NOTE: The figure includes data on all tort verdicts from San Francisco County and CookCounty in which a nonzero award was granted to the plaintiff.
other types of individuals.14 Our assumption is that within the case typeslisted in Figure 2, individuals named as defendants in motor vehicle acci-dent cases would be the least likely to be sued for their professional or busi-ness activities.15
Given the decline in automobile cases and rise in medical malpracticecases observed in Figure 2, it is unsurprising that we observe a decline inthe 1990s in the proportion of verdicts in which the defendants are indi-viduals involved in auto accidents and a steady rise in those where the defen-dants are individuals involved in other cases (whom we expect to have agreater likelihood of being a professional or business entity). However, theredoes not appear to be any other clear trend in the mix of defendant typesthat could explain any significant portion of the increase in average awardsreflected in Figure 1 on its own.
A third observable characteristic of cases in our data that may berelated to the potential value of a case (and therefore related to the size ofthe ultimate award) is the level of economic losses claimed by plaintiffs, suchas medical costs and lost wages. A case that involves greater losses by theplaintiff should be associated with higher damage awards, ceteris paribus.Thus, if the level of claimed economic losses has been increasing in casesgenerally, then so should the level of damage awards.
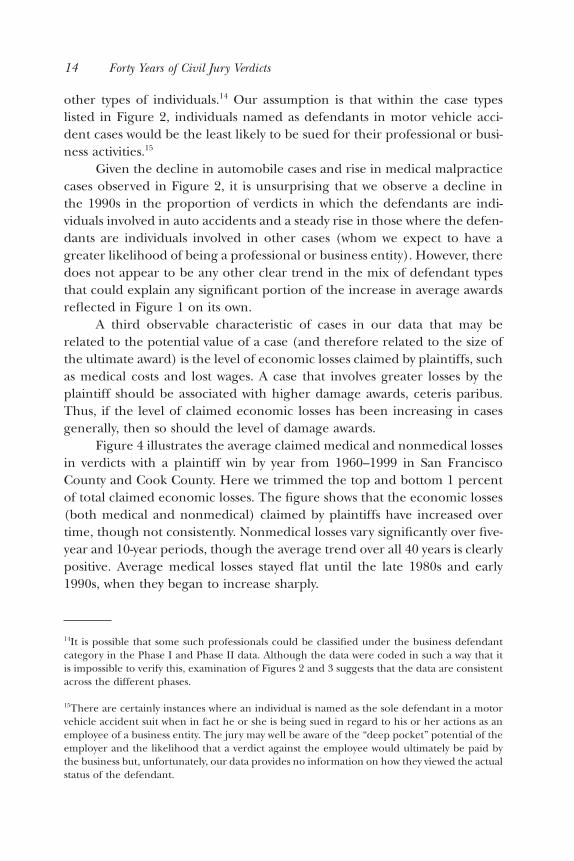
Figure 4 illustrates the average claimed medical and nonmedical lossesin verdicts with a plaintiff win by year from 1960–1999 in San FranciscoCounty and Cook County. Here we trimmed the top and bottom 1 percentof total claimed economic losses. The figure shows that the economic losses(both medical and nonmedical) claimed by plaintiffs have increased overtime, though not consistently. Nonmedical losses vary significantly over five-year and 10-year periods, though the average trend over all 40 years is clearlypositive. Average medical losses stayed flat until the late 1980s and early1990s, when they began to increase sharply.
14 Forty Years of Civil Jury Verdicts
14It is possible that some such professionals could be classified under the business defendantcategory in the Phase I and Phase II data. Although the data were coded in such a way that itis impossible to verify this, examination of Figures 2 and 3 suggests that the data are consistentacross the different phases.
15There are certainly instances where an individual is named as the sole defendant in a motorvehicle accident suit when in fact he or she is being sued in regard to his or her actions as anemployee of a business entity. The jury may well be aware of the “deep pocket” potential of theemployer and the likelihood that a verdict against the employee would ultimately be paid bythe business but, unfortunately, our data provides no information on how they viewed the actualstatus of the defendant.

It is not surprising that claimed medical losses grew in real terms, especially in the last 15 years. From 1960 to 1999, the total Consumer Price Index (CPI) grew at an average rate of approximately 4.6 percent,while the component of the CPI dedicated to medical care grew at anaverage rate of approximately 6.4 percent, a difference of just under 2percent per year.16 The difference in growth rates has increased over timeas well, with the annual growth rate in the medical component being 2.5
Seabury et al. 15
Figure 4: Claimed economic losses in tort verdicts by year.
0
20
40
60
80
100
120
1960 1965 1970 1975 1980 1985 1990 1995
Year
Tho
usan
ds o
f Y
ear
2000
Dol
lars
Nonmedical Medical
16For the base CPI we use “The Consumer Price Index for All Urban Consumers (CPI-U) forthe U.S. City Average for All Items, 1982–84 = 100,” series CUUR0000SA0, while for the com-ponent devoted to medical care we use “The Consumer Price Index for All Urban Consumers(CPI-U) for the U.S. City Average for Medical Care, 1982–84 = 100,” CUUR0000SAM, asreported by the Bureau of Labor Statistics (BLS). For more information on the CPI, visit theBLS website (http://www.bls.gov).
NOTE: The figure includes data on all tort verdicts from San Francisco County and CookCounty in which a nonzero award was granted to the plaintiff. The top and bottom 1 percentof total claimed economic losses (medical plus nonmedical) are trimmed.
percentage points higher on average than the total CPI since 1980. However,the growth in medical costs is not enough to explain the growth in medicallosses. Even if we deflate claimed medical losses using the medical CPI, thepicture is largely unchanged.
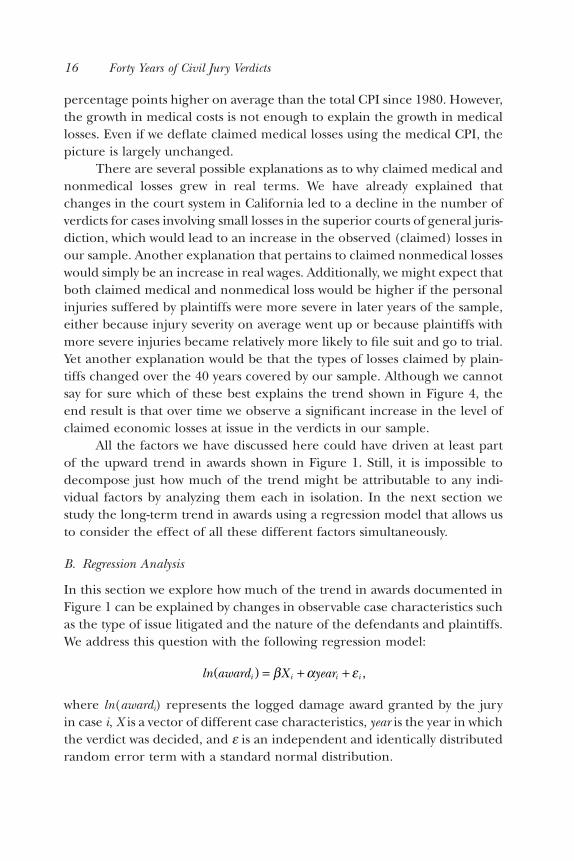
There are several possible explanations as to why claimed medical andnonmedical losses grew in real terms. We have already explained thatchanges in the court system in California led to a decline in the number ofverdicts for cases involving small losses in the superior courts of general juris-diction, which would lead to an increase in the observed (claimed) losses inour sample. Another explanation that pertains to claimed nonmedical losseswould simply be an increase in real wages. Additionally, we might expect thatboth claimed medical and nonmedical loss would be higher if the personalinjuries suffered by plaintiffs were more severe in later years of the sample,either because injury severity on average went up or because plaintiffs withmore severe injuries became relatively more likely to file suit and go to trial.Yet another explanation would be that the types of losses claimed by plain-tiffs changed over the 40 years covered by our sample. Although we cannotsay for sure which of these best explains the trend shown in Figure 4, theend result is that over time we observe a significant increase in the level ofclaimed economic losses at issue in the verdicts in our sample.
All the factors we have discussed here could have driven at least partof the upward trend in awards shown in Figure 1. Still, it is impossible todecompose just how much of the trend might be attributable to any indi-vidual factors by analyzing them each in isolation. In the next section westudy the long-term trend in awards using a regression model that allows usto consider the effect of all these different factors simultaneously.
B. Regression Analysis
In this section we explore how much of the trend in awards documented inFigure 1 can be explained by changes in observable case characteristics suchas the type of issue litigated and the nature of the defendants and plaintiffs.We address this question with the following regression model:
where ln(awardi) represents the logged damage award granted by the juryin case i, X is a vector of different case characteristics, year is the year in whichthe verdict was decided, and e is an independent and identically distributedrandom error term with a standard normal distribution.
ln award X yeari i i i( ) = + +b a e ,
16 Forty Years of Civil Jury Verdicts

The parameter a is our main parameter of interest. We provide nostructural interpretation of this parameter; it simply provides a measure ofthe average annual change in awards. It is important to note that this spec-ification of the model implicitly assumes that each year has an identical effecton awards. This assumption is restrictive (there may be variation in the short-term trend) but we feel that it is appropriate for our purposes because weare primarily interested in explaining what drives the average long-termtrend in awards rather than short-term fluctuations.
We include an extensive set of independent variables in X. First, weinclude variables that indicate case characteristics such as whether theverdict occurred in San Francisco County or Cook County, the types of liti-gated issues involved (using the same categories as Figure 2), the charac-teristics of the defendant(s) (as in Figure 3) in the case, and thecharacteristics of the plaintiff(s) in the case (as individual, business, gov-ernment, or other). We include claimed medical and nonmedical economiclosses as a series of dummy variables that indicate ranges of the size of theclaimed losses (e.g., $0, $1–$10,000, etc.).17 Finally, we include a series ofdummy variables to control for the previously discussed changes in themunicipal court limits in San Francisco.18 These should prevent any trendin awards generated by changes in filings being falsely attributed to otherfactors that might be correlated with the potential value of a case.
We estimate the regression model on the sample of verdicts in whicha positive payment is made to the plaintiff. This is an important point to re-cognize because by doing so we exclude verdicts in favor of the defendant(i.e., no money was awarded to any plaintiff in the case) from our estima-tion. We justify this exclusion under the assumption that juries determineliability issues and damage award levels independently, which is what they
Seabury et al. 17
17The claimed economic loss variables are recorded as dummy variables to account for possi-ble heterogeneity in the cases where no damages are reported. Some of these cases may reportno economic losses but might involve relatively high noneconomic losses, i.e., relatively high“pain and suffering.” Furthermore, cases where economic losses were claimed at trial but notrecorded might be mistakenly coded as zero in our data. Because we cannot distinguish thesedifferent cases, the use of dummy variables should make transparent any inconsistencies oranomalies in the data. If the data are correct, then variables indicating successively higher levelsof damages should have a larger effect on damage awards.
18These variables are dummies that indicate whether a verdict was in San Francisco before 1961,between 1961 and 1979, between 1980 and 1986, and after 1986. Unfortunately, our data donot allow us to pinpoint whether a case was filed before the municipal limits took place, sothere may be a few misclassified cases (but not enough to affect the results).

should be doing, at least in theory. An alternate specification is to considerthe liability decision and the award decision jointly, perhaps using a tobitmodel or a linear specification including plaintiff wins or losses.19 However,we do not believe this is appropriate because it implicitly assumes that theunderlying model for the liability decision and the award decision are iden-tical.20 For our purposes, a violation of the assumption of independencebetween the assignment of liability and the granting of awards would beproblematic if the correlation between award levels and liability changedover time.21 In this article we simply assume that juries decide these issuesindependently, and leave a more detailed investigation of this issue for futureresearch.
We employ a log-linear specification, with the logged dollar amount ofthe award as the dependent variable. In this specification the estimated coef-ficients represent percent changes in the level of awards. Sampling weightsare used to produce consistent estimates of the trend. Unlike the figuresbefore, no trimming is done to the data for the regressions. The qualitativeresults are the same even if we do trim, suggesting that outliers do notpresent a serious problem for our analysis.
Table 2 presents a summary of the regression results, focusing on theestimated value of a. Full regression results and summary statistics are avail-able from the authors upon request. For our purposes it is sufficient to notethat most variables have the predicted signs and are statistically significantat the 5 percent level.22 Columns I–IV of Table 2 each summarize a regres-sion of award amounts on the year of verdict with additional explanatoryvariables added in. The first row in Column I shows the estimated annualincrease in awards when we simply regress the damage award on the yearvariable and a constant term. We can see that the simple model implies a
18 Forty Years of Civil Jury Verdicts
19For an example of the tobit model applied to jury verdicts, see Merrit and Barry (1999).
20In other words, case characteristics that led to higher damages would be required by the modelto have an equal impact on the probability of a plaintiff win.
21For example, if juries were more likely to assign liability to higher-stakes cases in later yearsthan in early years it would cause us to overestimate the long-term trend.
22Notably, the claimed economic loss variables show a monotonic relationship, i.e., higher lossesare uniformly associated with higher damage awards, except at zero. Verdicts where claimedeconomic losses are zero have awards that are relatively low, but still higher than the verdictswhere claimed losses are positive but small. This suggests that there is probably some misre-porting of claimed losses in our data, but that the problem is not too serious.
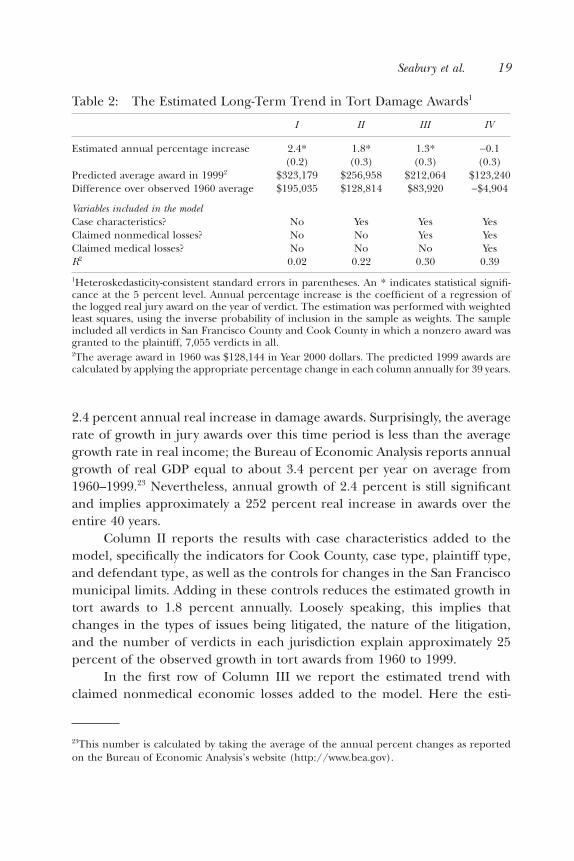
2.4 percent annual real increase in damage awards. Surprisingly, the averagerate of growth in jury awards over this time period is less than the averagegrowth rate in real income; the Bureau of Economic Analysis reports annualgrowth of real GDP equal to about 3.4 percent per year on average from1960–1999.23 Nevertheless, annual growth of 2.4 percent is still significantand implies approximately a 252 percent real increase in awards over theentire 40 years.
Column II reports the results with case characteristics added to themodel, specifically the indicators for Cook County, case type, plaintiff type,and defendant type, as well as the controls for changes in the San Franciscomunicipal limits. Adding in these controls reduces the estimated growth intort awards to 1.8 percent annually. Loosely speaking, this implies thatchanges in the types of issues being litigated, the nature of the litigation,and the number of verdicts in each jurisdiction explain approximately 25percent of the observed growth in tort awards from 1960 to 1999.
In the first row of Column III we report the estimated trend withclaimed nonmedical economic losses added to the model. Here the esti-
Seabury et al. 19
23This number is calculated by taking the average of the annual percent changes as reportedon the Bureau of Economic Analysis’s website (http://www.bea.gov).
Table 2: The Estimated Long-Term Trend in Tort Damage Awards1
I II III IV
Estimated annual percentage increase 2.4* 1.8* 1.3* -0.1(0.2) (0.3) (0.3) (0.3)
Predicted average award in 19992 $323,179 $256,958 $212,064 $123,240Difference over observed 1960 average $195,035 $128,814 $83,920 -$4,904
Variables included in the modelCase characteristics? No Yes Yes YesClaimed nonmedical losses? No No Yes YesClaimed medical losses? No No No YesR2 0.02 0.22 0.30 0.39
1Heteroskedasticity-consistent standard errors in parentheses. An * indicates statistical signifi-cance at the 5 percent level. Annual percentage increase is the coefficient of a regression ofthe logged real jury award on the year of verdict. The estimation was performed with weightedleast squares, using the inverse probability of inclusion in the sample as weights. The sampleincluded all verdicts in San Francisco County and Cook County in which a nonzero award wasgranted to the plaintiff, 7,055 verdicts in all.2The average award in 1960 was $128,144 in Year 2000 dollars. The predicted 1999 awards arecalculated by applying the appropriate percentage change in each column annually for 39 years.
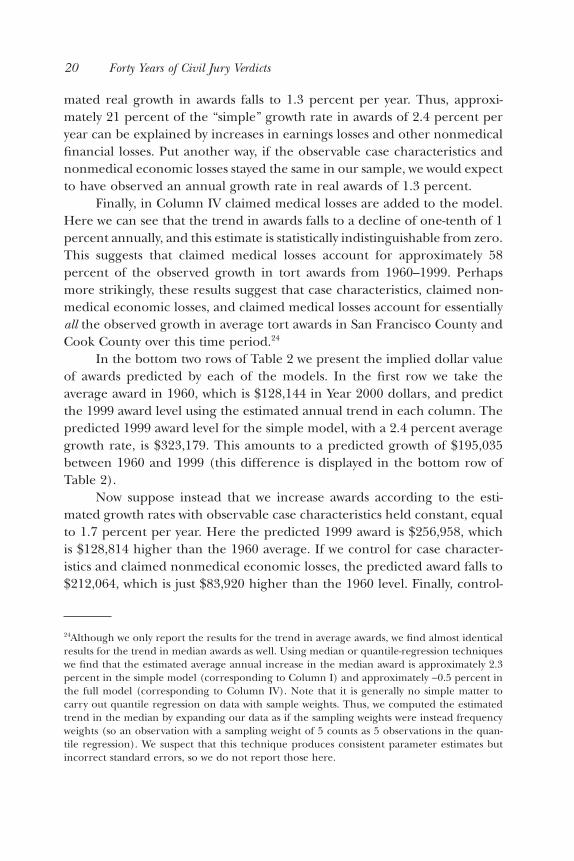
mated real growth in awards falls to 1.3 percent per year. Thus, approxi-mately 21 percent of the “simple” growth rate in awards of 2.4 percent peryear can be explained by increases in earnings losses and other nonmedicalfinancial losses. Put another way, if the observable case characteristics andnonmedical economic losses stayed the same in our sample, we would expectto have observed an annual growth rate in real awards of 1.3 percent.
Finally, in Column IV claimed medical losses are added to the model.Here we can see that the trend in awards falls to a decline of one-tenth of 1percent annually, and this estimate is statistically indistinguishable from zero.This suggests that claimed medical losses account for approximately 58percent of the observed growth in tort awards from 1960–1999. Perhapsmore strikingly, these results suggest that case characteristics, claimed non-medical economic losses, and claimed medical losses account for essentiallyall the observed growth in average tort awards in San Francisco County andCook County over this time period.24
In the bottom two rows of Table 2 we present the implied dollar valueof awards predicted by each of the models. In the first row we take theaverage award in 1960, which is $128,144 in Year 2000 dollars, and predictthe 1999 award level using the estimated annual trend in each column. Thepredicted 1999 award level for the simple model, with a 2.4 percent averagegrowth rate, is $323,179. This amounts to a predicted growth of $195,035between 1960 and 1999 (this difference is displayed in the bottom row ofTable 2).
Now suppose instead that we increase awards according to the esti-mated growth rates with observable case characteristics held constant, equalto 1.7 percent per year. Here the predicted 1999 award is $256,958, whichis $128,814 higher than the 1960 average. If we control for case character-istics and claimed nonmedical economic losses, the predicted award falls to$212,064, which is just $83,920 higher than the 1960 level. Finally, control-
20 Forty Years of Civil Jury Verdicts
24Although we only report the results for the trend in average awards, we find almost identicalresults for the trend in median awards as well. Using median or quantile-regression techniqueswe find that the estimated average annual increase in the median award is approximately 2.3percent in the simple model (corresponding to Column I) and approximately -0.5 percent inthe full model (corresponding to Column IV). Note that it is generally no simple matter tocarry out quantile regression on data with sample weights. Thus, we computed the estimatedtrend in the median by expanding our data as if the sampling weights were instead frequencyweights (so an observation with a sampling weight of 5 counts as 5 observations in the quan-tile regression). We suspect that this technique produces consistent parameter estimates butincorrect standard errors, so we do not report those here.
ling for these factors and claimed medical losses, the model predicts a 1999award of $123,240, which is $4,904 lower than the 1960 average. Ultimately,these results imply that if the types of litigated issues, types of plaintiffs anddefendants, nonmedical economic losses, and medical losses in 1999 wereat the same level as in 1960, we would expect to observe an average damageaward that was roughly the same in real dollars.
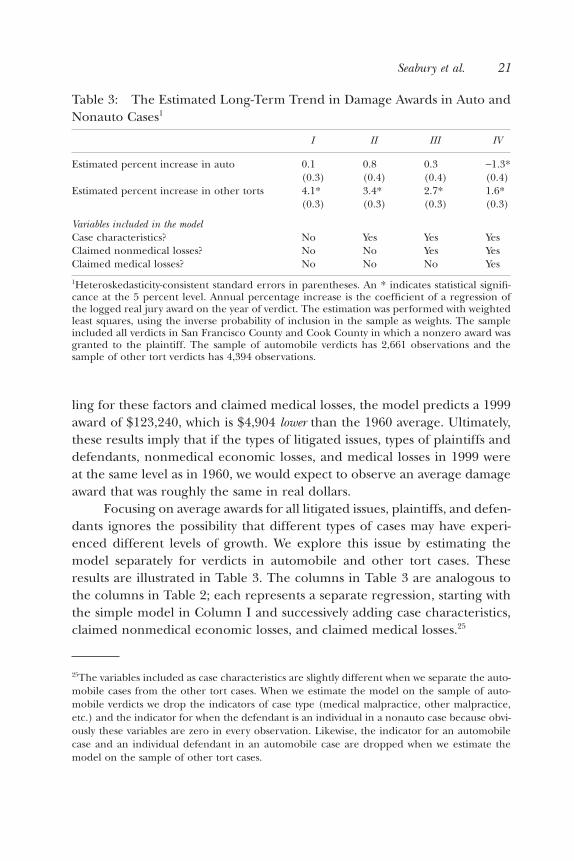
Focusing on average awards for all litigated issues, plaintiffs, and defen-dants ignores the possibility that different types of cases may have experi-enced different levels of growth. We explore this issue by estimating themodel separately for verdicts in automobile and other tort cases. Theseresults are illustrated in Table 3. The columns in Table 3 are analogous tothe columns in Table 2; each represents a separate regression, starting withthe simple model in Column I and successively adding case characteristics,claimed nonmedical economic losses, and claimed medical losses.25
Seabury et al. 21
Table 3: The Estimated Long-Term Trend in Damage Awards in Auto andNonauto Cases1
I II III IV
Estimated percent increase in auto 0.1 0.8 0.3 -1.3*(0.3) (0.4) (0.4) (0.4)
Estimated percent increase in other torts 4.1* 3.4* 2.7* 1.6*(0.3) (0.3) (0.3) (0.3)
Variables included in the modelCase characteristics? No Yes Yes YesClaimed nonmedical losses? No No Yes YesClaimed medical losses? No No No Yes
1Heteroskedasticity-consistent standard errors in parentheses. An * indicates statistical signifi-cance at the 5 percent level. Annual percentage increase is the coefficient of a regression ofthe logged real jury award on the year of verdict. The estimation was performed with weightedleast squares, using the inverse probability of inclusion in the sample as weights. The sampleincluded all verdicts in San Francisco County and Cook County in which a nonzero award wasgranted to the plaintiff. The sample of automobile verdicts has 2,661 observations and thesample of other tort verdicts has 4,394 observations.
25The variables included as case characteristics are slightly different when we separate the auto-mobile cases from the other tort cases. When we estimate the model on the sample of auto-mobile verdicts we drop the indicators of case type (medical malpractice, other malpractice,etc.) and the indicator for when the defendant is an individual in a nonauto case because obvi-ously these variables are zero in every observation. Likewise, the indicator for an automobilecase and an individual defendant in an automobile case are dropped when we estimate themodel on the sample of other tort cases.
The table shows that verdicts in automobile cases experienced virtuallyno growth in real terms. The estimated average increase in automobileawards is just 0.1 percent annually in the simple model (Column I), statisti-cally indistinguishable from zero. Strikingly, controlling for claimed medicaleconomic losses in Column IV produces an estimated 1.3 percent annualdecline in average awards in automobile cases. Things are quite different,however, when we examine other tort cases. The estimated trend for nonau-tomobile torts in the simple model, as shown in Column I of Table 3, isapproximately 4.1 percent per year. Adding case characteristics, claimednonmedical economic losses, and claimed medical losses lowers the trendto a 1.6 percent annual increase (Column IV). Thus, for verdicts in auto-mobile cases there is a persistent decline in average awards and for verdictsin nonautomobile cases there is persistent growth. These changes canceleach other out on average, which explains why the estimated long-termtrend for all cases is essentially zero.
It is not immediately clear why the results should be so different forautomobile and other tort cases. For our purposes here it is enough to notethat there is strong evidence of heterogeneity in the long-term trend for different types of cases, and the factors driving these divergent trends areclearly worthy of further study. It is also important to note that even in thehigher-growth nonautomobile verdicts our model explains a majority(approximately 61 percent) of the observed long-term trend. In general, ourresults suggest that increases in the size of claimed economic losses reportedto juries has driven a great deal of the observed growth in average awardsin tort cases since 1960.
IV. CONCLUSION
We use original data on 40 years of jury awards in tort cases in two countiesto describe the long-term trends in jury awards since 1960. The richness ofour data allow us not only to describe the rate at which awards have changedover time, but also to isolate the factors that have contributed to that change.We believe that our research highlights the need to focus less on simpleobserved changes in awards and more on the underlying factors that drivethose changes.
We find that average damage awards have risen substantially in realterms since 1960, though, surprisingly, we found that the rate of growth wasless than the growth in real GDP that occurred over the same time. The
22 Forty Years of Civil Jury Verdicts

verdicts in our sample displayed other important changes over time thatimpacted the growth in award levels. Most notably, the portion of automo-bile cases dropped off in later years of the sample in favor of “high-stakes”cases such as medical malpractice. Moreover, there was a pronouncedincrease in claimed economic losses over time, particularly medical losses.When we estimate the long-term trend in jury awards and control for thesefactors, we find that these observable factors explain the entire observedincrease in average award levels. However, there is also evidence that thetrend diverged for automobile and nonautomobile tort cases. There appearsto have been growth in nonautomobile tort awards over the past 40 yearsthat cannot be explained solely by changes in observable case characteris-tics. On the other hand, verdicts in automobile cases seemed to decline onaverage once other case characteristics are controlled for.
Our results suggest little evidence to support the hypothesis that juriesare awarding substantially higher awards on average, though they may bedoing so for certain kinds of cases. On the surface, it seems difficult to re-concile this statement with the headline-grabbing awards that have occurredover the past decade. One explanation for this is that, away from the head-lines, the awards in some cases have declined and offset the growth in thelarger and more highly publicized awards. Another explanation is that thesehighly publicized awards are so much larger than we have seen in the pastbecause the scope of liability in the civil justice system has expanded and thestakes involved in these cases have risen dramatically. Additionally, theawards that get the most attention often involve punitive damages, and theseoccur rarely enough that they have a minimal effect on the long-term trendin the awards in our data. Finally, we stress that our results do not imply thatawards in tort trials are not higher than they were 40 years ago; clearly, theyare. We simply argue that a substantial portion of this growth appears to befor changes in the specific types of tort cases being brought to trial and thelevel of economic damages claimed by plaintiffs.
It is important, however, to keep in mind the limitations of data onjury verdicts, which suggest that one should be cautious about interpretingthese results too literally. Although we control for many important case char-acteristics, our data are unable to control for any changes in settlement orclaiming behavior that is not perfectly explained by the variables we observe.Therefore, we believe that the best way to interpret our results is as descrip-tive rather than causal. We show that there is little prima facie evidence tosupport the hypothesis that juries have become increasingly generous overtime on average, but estimating the actual change in jury behavior can be
Seabury et al. 23
done only by dealing with the selection of disputes into jury verdicts moredirectly.
This article raises several interesting topics for future research. Weshowed heterogeneity in the long-term trend between automobile andnonautomobile cases, but future work could explore the issue of hetero-geneity for multiple types of cases as well as for different plaintiff and defen-dant types. Another interesting area to pursue is the extent to which thevariability of awards has changed over time. It is possible for the average ormedian award to stay relatively constant while still experiencing significantchanges in variability, and award variability can have significant implicationsfor both plaintiffs and defendants. Also, in this study we focused narrowlyon only one metric of jury behavior, but it would also be interesting toexamine how juries have changed with regards to the assignment of liabil-ity over time. Additionally, given the fact that the sample used in this articleis limited to two counties, it would be useful to explore the extent to whichthe experiences of San Francisco County and Cook County generalize to therest of the country.26 Finally, an obvious question would be whether the sameresults have held true for business and contracts disputes, an area of litiga-tion that experiences a much higher frequency of punitive damage awardsthan seen in tort cases and possibly one that is more sensitive to changesover time in what juries believe are appropriate levels of compensation.
REFERENCES
Chin, Audrey, & Mark A. Peterson (1985) Deep Pockets, Empty Pockets: Who Wins in CookCounty Jury Trials. RAND, R-3249-ICJ, 1985. Santa Monica, CA: RAND.
Clermont, Kevin M., & Theodore Eisenberg (1998) “Do Case Outcomes ReallyReveal Anything About the Legal System? Win Rates and Removal Jurisdic-tion,” 83 Cornell Law Rev. 581.
Daniels, Stephen, & Joanne Martin (1995) Civil Juries and the Politics of Reform.Evanston, IL: Northwestern Univ. Press.
Eisenberg, Theodore (1990) “Testing the Selection Effect: A New Theoretical Frame-work with Empirical Tests,” 29 J. of Legal Studies 337.
——(1999) “Judicial Decisionmaking in Federal Product Liability Cases, 1978–1997,”49 DePaul Law Rev. 323.
24 Forty Years of Civil Jury Verdicts
26The number and coverage of jury verdict reporters has grown in recent years and some courtsystems are now collecting much better data on verdicts within their own jurisdictions. It ishoped that similar long-term analysis of a much broader collection of counties and even entireregions of the country will be possible by the next decade.
——(2000) “Empirical Methods and the Law,” 95 J. of the American Statistical Association 665.
——(2001) “Damage Awards in Perspective: Behind the Headline-Grabbing Awardsin Exxon Valdez and Engle,” 36 Wake Forest Law Rev. 1129.
Eisenberg, Theodore, & Harry S. Farber (1997) “The Litigious Plaintiff Hypothesis:Case Selection and Resolution,” 28 RAND J. of Economics 592.
Eisenberg, Theodore, & James A. Henderson Jr. (1992) “Inside the Quiet Revolutionin Products Liability,” 39 UCLA Law Rev. 731.
Hensler, Deborah R., Mary E. Vaiana, James S. Kakalik, & Mark A. Peterson (1987)Trends in Tort Litigation: The Story Behind the Statistics. RAND, R-3583-ICJ, 1987.Santa Monica, CA: RAND.
Maddala, G. S. (1983) Limited-Dependent and Qualitative Variables in Econometrics. Cambridge: Cambridge Univ. Press.
Merritt, Deborah Jones, & Kathryn Ann Barry (1999) “Is the Tort System in Crisis?New Empirical Evidence,” 60 Ohio State Law J. 315.
Moller, Erik (1996) Trends in Civil Jury Verdicts Since 1985. RAND, MR-694-ICJ. SantaMonica, CA: RAND.
Moller, Erik K., Nicholas M. Pace, & Stephen J. Carroll (1999) “Punitive Damages inFinancial Injury Jury Verdicts,” 28 J. of Legal Studies 283.
Peterson, Mark A. (1984) Compensation of Injuries: Civil Jury Verdicts in Cook County.RAND, R-3011-ICJ, 1984. Santa Monica, CA: RAND.
——(1987) Civil Juries in the 1980s: Trends in Jury Trials and Verdicts in California andCook County, Illinois. RAND, R-3466-ICJ, 1987. Santa Monica, CA: RAND.
Peterson, Mark A., & George L. Priest (1982) The Civil Jury: Trends in Trials and Ver-dicts, Cook County, Illinois, 1960–1979. RAND, R-2881-ICJ, 1982. Santa Monica,CA: RAND.
Priest, George L., & Benjamin Klein (1984) “The Selection of Disputes for Litigation,” 13 J. of Legal Studies 1.
Shanley, Michael G., & Mark A. Peterson (1983) Comparative Justice: Civil Jury Verdictsin San Francisco and Cook Counties, 1959–1980. RAND, R-3006-ICJ, 1983. SantaMonica, CA: RAND.
Vidmar, Neil (1994) “Making Inferences About Jury Behavior from Jury Verdict Statistics: Cautions about the Lorelei’s Lied,” 18 Law and Human Behavior 599.
Seabury et al. 25