Foreign Direct Investment from China, India and South Africa in Sub-Saharan Africa:: A New Or Old...
28
Copyright © UNU-WIDER 2008 1 Strategy and International Business Group, University of Edinburgh Management School, Scotland, UK; 2 Consultant, United Nations Industrial Development Organization, Vienna, Austria. 3 Chief, Investment Promotion Unit, United Nations Industrial Development Organization, Vienna, Austria. This study has been prepared within the UNU-WIDER project on Southern Engines of Global Growth. UNU-WIDER gratefully acknowledges the financial contributions to the research programme by the governments of Denmark (Royal Ministry of Foreign Affairs), Finland (Ministry for Foreign Affairs), Norway (Royal Ministry of Foreign Affairs), Sweden (Swedish International Development Cooperation Agency—Sida) and the United Kingdom (Department for International Development). ISSN 1810-2611 ISBN 978-92-9230-070-8 Research Paper No. 2008/24 Foreign Direct Investment from China, India and South Africa in sub-Saharan Africa: A New or Old Phenomenon? John Henley, 1 Stefan Kratzsch, 2 Mithat Külür, 3 and Tamer Tandogan 2 March 2008 Abstract The burgeoning literature on outward foreign direct investment from emerging markets has largely focused on analysing the motives of investors as reported by parent companies. This paper, instead, focuses on firm-level investments originating from China, India or South Africa in fifteen host countries in sub-Saharan Africa (SSA). The analysis is based on a sub-set of firms drawn from the overall sample of 1,216 foreign-owned firms participating in the UNIDO Africa Foreign Investor Survey, carried out in 2005. The sample of investments originating from China, India and South Africa is analysed in terms of firm characteristics, past and forecast performance in SSA over three years and management’s perception of ongoing business conditions. Comparisons are made with foreign investors from the North. The paper concludes that while investors in SSA from the three countries are primarily using their investment to target specific markets, they are largely operating in different sub-sectors. While there appear to be specific features that firms from a given country of origin share, there are no obvious operating-level features they all share apart from market seeking. Keywords: South-South FDI, market-seeking, sub-Saharan Africa, China, India, South Africa JEL classification: D21, F23, M16, O55
Transcript of Foreign Direct Investment from China, India and South Africa in Sub-Saharan Africa:: A New Or Old...

Copyright © UNU-WIDER 2008 1 Strategy and International Business Group, University of Edinburgh Management School, Scotland, UK; 2 Consultant, United Nations Industrial Development Organization, Vienna, Austria. 3 Chief, Investment Promotion Unit, United Nations Industrial Development Organization, Vienna, Austria. This study has been prepared within the UNU-WIDER project on Southern Engines of Global Growth. UNU-WIDER gratefully acknowledges the financial contributions to the research programme by the governments of Denmark (Royal Ministry of Foreign Affairs), Finland (Ministry for Foreign Affairs), Norway (Royal Ministry of Foreign Affairs), Sweden (Swedish International Development Cooperation Agency—Sida) and the United Kingdom (Department for International Development). ISSN 1810-2611 ISBN 978-92-9230-070-8
Research Paper No. 2008/24 Foreign Direct Investment from China, India and South Africa in sub-Saharan Africa: A New or Old Phenomenon? John Henley,1 Stefan Kratzsch,2
Mithat Külür,3 and Tamer Tandogan2 March 2008
Abstract The burgeoning literature on outward foreign direct investment from emerging markets has largely focused on analysing the motives of investors as reported by parent companies. This paper, instead, focuses on firm-level investments originating from China, India or South Africa in fifteen host countries in sub-Saharan Africa (SSA). The analysis is based on a sub-set of firms drawn from the overall sample of 1,216 foreign-owned firms participating in the UNIDO Africa Foreign Investor Survey, carried out in 2005. The sample of investments originating from China, India and South Africa is analysed in terms of firm characteristics, past and forecast performance in SSA over three years and management’s perception of ongoing business conditions. Comparisons are made with foreign investors from the North. The paper concludes that while investors in SSA from the three countries are primarily using their investment to target specific markets, they are largely operating in different sub-sectors. While there appear to be specific features that firms from a given country of origin share, there are no obvious operating-level features they all share apart from market seeking.
Keywords: South-South FDI, market-seeking, sub-Saharan Africa, China, India, South Africa
JEL classification: D21, F23, M16, O55

The World Institute for Development Economics Research (WIDER) was established by the United Nations University (UNU) as its first research and training centre and started work in Helsinki, Finland in 1985. The Institute undertakes applied research and policy analysis on structural changes affecting the developing and transitional economies, provides a forum for the advocacy of policies leading to robust, equitable and environmentally sustainable growth, and promotes capacity strengthening and training in the field of economic and social policy making. Work is carried out by staff researchers and visiting scholars in Helsinki and through networks of collaborating scholars and institutions around the world.
www.wider.unu.edu [email protected]
UNU World Institute for Development Economics Research (UNU-WIDER) Katajanokanlaituri 6 B, 00160 Helsinki, Finland Typescript prepared by Janis Vehmaan-Kreula at UNU-WIDER The views expressed in this publication are those of the author(s). Publication does not imply endorsement by the Institute or the United Nations University, nor by the programme/project sponsors, of any of the views expressed.
Acknowledgements
The data used in this paper was generated by a team directed by the Investment Promotion Unit of UNIDO and whose contribution is gratefully acknowledged. However the findings and interpretations in this paper are the responsibility of the authors alone and do not necessarily reflect the views of UNIDO.
Tables and Figures appear at the end of the document.

1
1 Introduction
The literature on outward foreign direct investment (OFDI) from emerging markets usually adopts the position that the universe of motives behind a firm’s decision to undertake FDI is in principal the same as that of a firm from a developed market economy. However, because the ownership specific advantages of different investors are shaped by the context from which firms originate and the time period in which investment occurs, the specific features of OFDI from emerging markets, such as China, India or South Africa (CISA), maybe expected to reflect the social, political and economic history of the country of origin (Filatotchev et al. 2007).
For example, Wells (1977, 1981, 1983) suggests that the reason why what he styles as third world multinational enterprises (TWMNEs), are able to invest abroad successfully is because their growth path typically provides them with four ‘new’ advantages. These are: a less costly management team; technology adjusted to the typical factor endowments of developing countries; the ability to purchase low cost raw materials locally and a range of products developed in the setting of a third world economy. Lall, in a similar vein in 1983, claimed that TWMNEs were able to benefit from localization of technology that more accurately matched the requirements of developing host countries, particularly smaller scale production units to service the small consumer markets of developing countries.
These kinds of arguments were certainly plausible in the 1980s with respect to Africa where markets were generally heavily protected by tariff and non-tariff barriers. The subsidiaries of large transnational corporations (TNCs), mostly European and many tracing their origins back to the colonial era, were well entrenched as clones of their parents. By the end of the 1980s, after a decade of economic stagnation in Africa, the beginnings of economic liberalization and increased competition in the major markets of Europe and North America, many of these older TNCs were beginning to look for exits from the region. The scale factors identified by Lall as a competitive advantage of TWMNEs became a major weakness of TNCs from the North as increased concentration of fast moving consumer goods (FMCG) companies progressed and larger production units located in key markets became the norm.
Corporate strategy groups restructuring TNC parent companies in the North during the 1990s increasingly could no longer accept the high transaction costs associated with operating small, low growth production units in Africa, especially as margins were under pressure from reductions in tariff protection. Moreover, supplying many of these African markets through exports was becoming more attractive as liberalization began to drive down trade barriers. This evolution created new opportunities for smaller, more nimble investors able to serve local markets from a lower cost base, much as Wells and Lall had proposed in 1983, although more than a decade later.
This paper, firstly, briefly reviews the literature on theories of outward foreign investment and their relevance for understanding FDI from CISA. Secondly, the paper examines the descriptive statistics generated from a survey of 1,216 foreign-owned firms and subsidiaries operating in fifteen sub-Saharan African countries carried out by

2
UNIDO in 2005 (UNIDO 2007).1 The sub-set of data from foreign investors declaring their country of origin as being either China, India or South Africa is compared with investors from the North (Europe, North America and Japan); and three regions of the South – Middle East and North Africa (MENA), sub-Saharan Africa (SSA) excluding South Africa, and Asia excluding China and India.2 The final section of the paper attempts to answer the question posed in the introduction: are the characteristics of foreign investors from China, India and South Africa in SSA significantly different from each other or is there some meaningful category ‘FDI from the South’?
2 Theories of foreign direct investment
Theories of outward foreign direct investment have been dominated by the work of John Dunning for more than thirty years. His original eclectic theory, first proposed in 1977, has undergone several modifications. Dunning identifies three variables – ownership specific advantage, location specific advantage and internalization specific advantage – that can be used to explain why a firm chooses to expand into foreign markets through FDI rather than through other less capital intensive means such as via licensing or exporting.
More recently Dunning (2000) has proposed that the eclectic paradigm should be treated as ‘an envelope for economic and business theories of MNE activity’. Perhaps rather wisely, the issue of how the three variables interrelate and, in particular, which of the advantages weighs more in the FDI process is not addressed directly (Moosa 2002). There is an inevitable survivor bias in any population of successful foreign investors and therefore an element of circularity in any attempt to extract normative advice from surveys of firms in order to identify successful combinations of Dunning’s three ‘advantages’. Successful foreign direct investment is rarely a one off event; it is more usually a stream of resource flows, to a greater or lesser extent, stimulated by the interactive relationship between investor and host economy and dependant on the changing motivation of the investor. An important empirical question for host authorities is the extent to which policy interventions can influence an investor’s location decision with positive benefits for the host economy.
The specific ownership advantages required to exploit a given set of location advantages are likely to change over time, not least because of changing economic conditions as well as policy interventions by the host authorities. The World Bank, for example, has invested significant resources through its Doing Business Reports and its Business Environment and Enterprise Performance Survey (BEEPS) activity in encouraging governments in emerging markets to adopt a business-friendly investment environment. UNIDO has been actively supporting national investment promotion agencies in sub-Saharan Africa since 2001 through AfrIPANet. Thus, with increasing liberalization of investment policy regimes in many African countries, newcomers face much lower
1 The survey was carried out in 2005 using a drop-and-pick methodology, followed up by telephone interviewing to clarify ambiguities in responses. The sample of 1,216 firms excluded mining and oil companies on the grounds that investment location choice was exogenously determined.
2 Three parent firms from Brazil and ten registered in Caribbean tax havens were eliminated from the South sub-samples.

3
barriers to FDI than their more established rivals, mostly originating from the North (Yin and Choi 2005; Mathews 2006).
Another approach to explaining FDI is founded on a process theory of internationalization (PTI) and focuses on the processes that firms undertake when embarking on FDI, originally stimulated by the work of Johanson and Vahlne (1977). The basic assumption of this approach is that lack of foreign market knowledge is a major problem for foreign investors, especially for firms at the very early stage in the internationalization process. Johanson and Vahlne (1990) make the distinction between objective knowledge about a given business environment, such as imparted by the World Bank’s Doing Business Reports and operational experience gained from investing and working in a foreign market. The Johanson-Vahlne formulation implies that firms have to reach a certain size before they can invest internationally and that the requisite experiential knowledge is accumulated through superior organizational processes.
The organizational cloning approach adopted by TNCs from the North to exploit highly protected markets in post-colonial Africa in the 1960s and 1970s fits well with the PTI model. The import substitution industrialization policies widely adopted during the period reduced risk and competition for investors through import tariffs, quotas and investment licensing. Protection helped to off-set the diseconomies of operating in small markets. FDI from emerging markets was largely unable to exploit the competitive advantages identified by Wells (1983) and Lall (1983) for although following Johanson and Vahlne (1977), managers from the South should have experienced less psychic and cultural distance from the business environment in SSA markets, their organizational resources were less developed than TNCs from the North.
The global business environment has changed radically since the 1970s. As Autio (2005) points out, the costs of managerial control over foreign operations has dropped dramatically with the development of telecommunications technology enhancing information flow and reducing psychic distance, with falling transportation costs and the increased availability of high level managerial expertise in emerging markets. This now enables less well-resourced investors to confidently employ a range of governance mechanisms as alternatives to operating wholly-owned subsidiaries. As a consequence, it has become possible for smaller firms to internationalize by leveraging resources through alliances and informal networks rather than through full ownership. Nevertheless, the original insight of Johanson and Vahlne (2003) that internationalization is basically a process of learning and reacting still holds, even though the global context has changed beyond recognition since 1977.
The increase in the number of small businesses that internationalize soon after their formation to engage in ‘international entrepreneurship’ (Zahra 2005) has attracted significant research interest. The paper by Oviatt and McDougall (1994) was particularly influential in drawing attention to the phenomenon. By focusing on the founding entrepreneurs’ international competence, vision and awareness of growth opportunities, Oviatt and McDougall took theories of foreign investment beyond pre-occupation with leveraging home-based corporate resources (Autio 2005). By pointing out that international entrepreneurs are able and willing to make strategic choices and take on the risks associated with international expansion but, because of a poverty of resources, usually adopt low cost governance mechanisms such as network structures, they drew attention to a whole range of international business activities largely ignored

4
by the mainstream literature on TNCs (Oviatt and McDougall 2005). This emphasis on the scarcity of resources faced by international entrepreneurs leading to a preference for low cost governance mechanisms, by contrast with larger well-established TNCs following the Johanson and Vahlne (2003) route to internationalization is suggestive of the pattern typically followed by investors from the South. The focus on the international social capital of entrepreneurs and their ability to access and mobilize cross-border resources encourages a re-consideration of the dynamics and potential of private foreign investment from emerging markets. Although Oviatt and McDougall (1994) do not explicitly discuss the role of kinship networks in international entrepreneurship, clearly this is allowed for in their emphasis on low cost governance mechanisms. In other words internationalization may not always be ‘an uphill struggle’ but rather, be a ‘condition for value creation’ (Autio 2005).
By inference then, the international entrepreneurship literature is optimistic about the growth of FDI from emerging markets for as long as there are entrepreneurs willing to look for opportunities for growth through internationalization. Investments by these entrepreneurial firms, usually family-controlled, are rarely recorded as foreign direct investment because they are unlikely to be registered as subsidiaries of companies with headquarters in another country.3 On the other hand, the owners are foreign nationals and many have deep-rooted, if technically informal cross-border links with other firms. Some may be returning members of the diaspora holding foreign passports. As Nanda and Khanna (2007) demonstrate, diasporas stimulate international entrepreneurship by creating cross-border social networks that serve an important role in helping entrepreneurs to circumvent the barriers to business relations and trade arising from imperfect local institutions in developing countries.
Autio et al. (2000) argue that ‘international new ventures’ have the inherent ‘learning advantages of newness’. They predict that because the founder-owner is in control, new knowledge is assimilated quickly and therefore these firms grow much more rapidly than established firms that are more likely to be stifled by bureaucratic decision making procedures. However, as Zahra (2005) asks, do these new ventures actually have the capacity to absorb and assimilate new knowledge and expertise? If many of these foreign-owned firms do not feature in standard measures of FDI flows estimated using balance of payments statistics as in the World Investment Report (UNCTAD 2006), is an important source of economic dynamism missing from accounts of FDI in emerging markets?
Above is presented a brief overview of some of the main strands of the literature on foreign direct investment. This suggests that firms originating from particular countries are likely, in part, to reflect the particular economic, political and social histories of those countries. Dunning’s (2000) ownership advantages are nurtured in specific business environments. Johanson and Vahlne’s (1990) internationalization processes may have generic elements but are also partly contextually determined. Oviatt and McDougall’s (1994) concept of international entrepreneurship is highly dependent on
3 The general definition of FDI from the IMF Balance of Payment Manual (1993) defines FDI as an investment involving long-term relationships and reflecting a lasting interest and control by a resident entity in one economy in an enterprise resident in an economy other than that of the foreign direct investor. An equity capital stake of 10 per cent or more is normally considered as the threshold for control of assets.

5
social capital formation and therefore very much influenced by social networks married to business activity (Nanda and Khanna 2007).
The next section of the paper presents the descriptive statistics relating to the firms investing in fifteen sub-Saharan African countries from China, India and South Africa (CISA) that participated in the UNIDO survey in 2005 (UNIDO 2007).4 In order to identify the distinctive features of these particular investors, they are grouped and compared with each other and with groupings extracted from the complete Survey sample of 1,216 firms. The regional groups used are: Middle East and North Africa (MENA), sub-Saharan Africa (SSA) excluding South Africa, emerging Asia (excluding China and India) and the North (Europe, North America and Japan).
Some of the comparisons need to be treated with caution as the sample sizes are sometimes modest making more robust analysis very difficult; in particular, the samples are not large enough to control for industry sub-sector. However, it is argued that, in the absence of better empirical evidence, it is useful to examine some of the features of investment flows from particular countries and regions to SSA and to begin to sketch out their main features. Hopefully this will encourage further research into the great diversity of FDI in SSA.
3 Results
3.1 Sector and start of operations
At a sectoral level, the major difference between investors from China, India and South Africa operating in SSA is the importance of the South African services sector and the predominance of manufacturers amongst investors from both China and India. Over 60 per cent of investors from South Africa operate in the services sector, the highest proportion for any country of origin grouping, including the sample of firms from the North (Figure 1).
At a sub-sectoral level, nearly a third of Chinese firms manufacture textiles or garments and a similar proportion of Indian companies manufacture chemicals, plastics and rubber (Figures 2-5). The well-documented lack of internationalization of India’s garment or textile industry, largely as a result of past policy interventions by the government of India, stands in contrast to the rest of Asia (Henley 2004). Chinese and other Asian firms are the major exporters (~40 per cent). More than three-quarters of Indian firms, by contrast, only serve the local market (p<0.001) (Figure 6).
The pattern of South African investments most closely matches FDI from the North with the significant exception of the virtual absence of export-oriented investors from South Africa. The most important manufacturing sub-sector for both is food and beverages (Figures 4-5). Trading companies involved in marketing, sales and distribution are important for all source countries and regions.
4 The fifteen countries are: Burkina Faso, Cameroon, Côte d’Ivoire, Ethiopia, Ghana, Guinea, Kenya, Madagascar, Malawi, Mali, Mozambique, Nigeria, Senegal, Tanzania, UR and Uganda. A full account of the survey methodology and an overall analysis of the survey are reported in UNIDO (2007).

6
Over the past three decades, a clear shift is visible in the dominance of FDI from the North in SSA (p<0.001 (Figure 7). Older established firms are mainly from the North and newcomer firms originate from the South. This is reflected in the average age of firms from the North of 21.6 years, three times older that the average Chinese firm (Table 1). Breaking down the population of South origin firms, Chinese firms are the youngest with an average age of seven years in 2005; closely followed by firms from elsewhere in Asia with 7.4 years of operational experience in SSA. Indian and South African firms are on average of similar age: 12 years and 13.1 years respectively (p<0.005). While it is unsurprising that South African firms operating in SSA are younger than firms from the North because of exclusion from most of SSA during the apartheid years, it is striking that Chinese firms are on average much younger than both Indian and South African firms. It is also very noticeable that nearly half of South African investors are using acquisitions as a ‘catch-up’ entry mode in SSA including taking advantage of privatization opportunities (p<0.001) (Figure 8). This is very different from Chinese investors who overwhelmingly favour a greenfield investment strategy.
In the complete UNIDO Survey sample (2007: 35), of 1,200 firms, among those that started operations before 1981, 79 per cent originated from the North. This percentage of North origin companies drops steadily and significantly for each subsequent start up period (p<0.001). Among companies that started operations after 2000, the proportion of North origin firms is only 37 per cent. It is also noticeable that the decade 1981-1990 was a period of very little foreign investment in Africa from any region.
3.2 Sales and assets performance
The average firm from the North achieved sales of US$19.0 million from a book value of US$24.7 million and employed 347 people in SSA (Table 1). A block of 220 North origin firms that have been operating in SSA for over 25 years, many before independence, remains well established in SSA. These firms obtained average sales of over US$34 million from a book value of US$42 million and employed over 600 people in 2004. By contrast, Chinese firms in the sample achieved average sales of US$7 million from a book value of US$5.4 million yet, although much younger, on average employed 660 people. Indian firms are significantly smaller, achieving sales of US$2.6 million from a book value of US$2.6 million and employ 120 people.
South African firms are more comparable to firms from the North in terms of sales and assets, achieving sales of US$11.2 million from an average book value of US$18.1 million and a workforce of 200.5 Overall, South African firms are significantly different from those from China and India in terms of size and capital intensity and their preference for a formal governance structure. 80 per cent of South African firms operating in SSA are formal subsidiaries of a parent company. Indian firms are the smallest on average of all groups of firms originating in the South. Perhaps reflecting their size and low level of financial commitment, more than 80 per cent of Indian firms are owner-managed firms with no formal organizational links with a corporate headquarters in another country. This also appears to confirm the growing importance
5 If MTN-Nigeria is included in the South African sample, average sales per firm increase to US$31 million, book value to US$48 million and employees per firm to 220.

7
of international entrepreneurs in SSA who are responding to the lowering of trade and investment barriers since the 1990s.
South African firms are 50 per cent more capital intensive than the average firm from the North – US$107,000 of assets per worker compared to US$71,500 and achieve sales per worker of US$96,800 compared to US$90,100 obtained by the average Northern firm (Table 2) – reflecting their increasing focus in the emerging services sector. At the other extreme, Chinese companies have an average book value per worker of just US$36,900 and obtain sales per worker of US$15,300. South African firms on average obtained the highest capital productivity in terms of gross sales: 4.0 compared to Northern companies which achieved 3.6. Labour productivity figures also confirm that South African investors are ahead of those from the North despite their relative youthfulness.
The productivity of a typical Indian company is better than that of a Chinese one in terms of sales per dollar of book value and sales per worker, probably reflecting greater operational experience, but is significantly worse than investments from South Africa or from the North (p<0.01) (Table 2).
4 Firm growth and impact on the host economy
4.1 Performance self-evaluation and sales growth
Investors from South Africa were the most bullish of any source country in their performance self-evaluation – 75 per cent reported their performance over the last three years to be in line with or above expectations. Indian firms were also positive in their evaluations of investment performance – 68 per cent. Chinese firms, by contrast, were much less sanguine. Nearly half rated their performance as below expectations.
Paradoxically, in terms of sales growth, Chinese firms and firms from elsewhere in Asia (excluding India) experienced very high growth – 48 per cent and 39 per cent during the previous year (p<0.004) (Figure 9). These firms evidently have very ambitious sales targets since many of their self-evaluations of performance are quite negative. It would appear that twenty of these Chinese investors have set themselves ambitious rates of return targets for establishing what are considered high-risk, short-payback operations, mostly export platforms. South African firms, in contrast, achieved sales growth of 18 per cent, while Indian firms obtained sales growth of just 13 per cent. Interestingly, Indian firms’ sales targets seemed to be quite modest yet satisfaction with performance was quite high. By comparison, North firms achieved sales growth of 15 per cent.
When firms were asked about their expectations for the next three years, the pattern changed to greater optimism amongst all investors except for Chinese companies, with their expectations of sales growth converging with the average for the whole sample. Both Indian and South African firms are anticipating doubling their sales growth over the next three years (Figure 10).
The sub-sectors where sales growth was concentrated in the previous year (2004) are: textiles (50 per cent), garments and leather (42 per cent) and construction (28 per cent), all sub-sectors with high participation by firms from Asia. The next three high growth
8
sub-sectors – financial services, utilities, transport and communications attract market seeking investors from South Africa.
Using more detailed analysis of high sales growth firms, it is apparent that global exporters from China, India and from elsewhere in Asia achieved hyper growth rates. A third of the sales of the average Chinese company, valued at just under US$1 million per firm, are exported (Figure 11). Even this performance is dwarfed by investors from the rest of Asia that achieved average export sales of 47 per cent of output valued at US$4.1 million per firm. When asked about the importance of the US African Growth Opportunities Act (AGOA) in encouraging investment in SSA, investors from Asia including India considered it to be significant in their decision to invest in manufacturing in SSA.
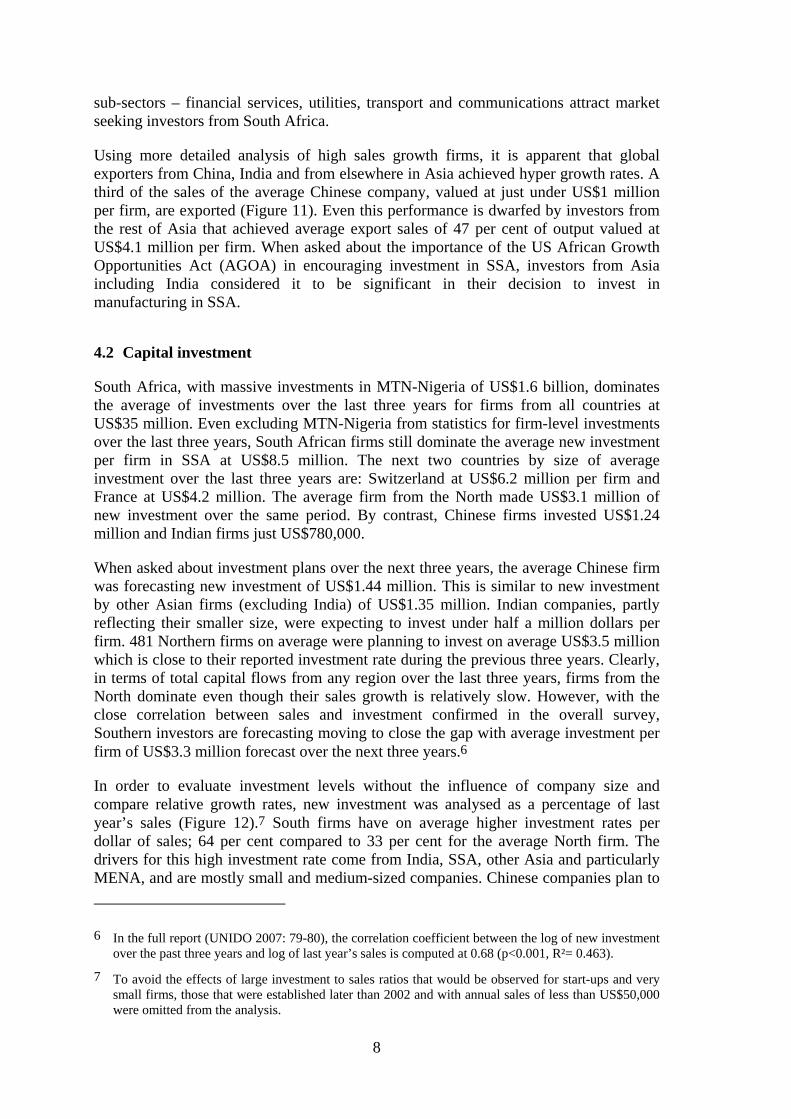
4.2 Capital investment
South Africa, with massive investments in MTN-Nigeria of US$1.6 billion, dominates the average of investments over the last three years for firms from all countries at US$35 million. Even excluding MTN-Nigeria from statistics for firm-level investments over the last three years, South African firms still dominate the average new investment per firm in SSA at US$8.5 million. The next two countries by size of average investment over the last three years are: Switzerland at US$6.2 million per firm and France at US$4.2 million. The average firm from the North made US$3.1 million of new investment over the same period. By contrast, Chinese firms invested US$1.24 million and Indian firms just US$780,000.
When asked about investment plans over the next three years, the average Chinese firm was forecasting new investment of US$1.44 million. This is similar to new investment by other Asian firms (excluding India) of US$1.35 million. Indian companies, partly reflecting their smaller size, were expecting to invest under half a million dollars per firm. 481 Northern firms on average were planning to invest on average US$3.5 million which is close to their reported investment rate during the previous three years. Clearly, in terms of total capital flows from any region over the last three years, firms from the North dominate even though their sales growth is relatively slow. However, with the close correlation between sales and investment confirmed in the overall survey, Southern investors are forecasting moving to close the gap with average investment per firm of US$3.3 million forecast over the next three years.6
In order to evaluate investment levels without the influence of company size and compare relative growth rates, new investment was analysed as a percentage of last year’s sales (Figure 12).7 South firms have on average higher investment rates per dollar of sales; 64 per cent compared to 33 per cent for the average North firm. The drivers for this high investment rate come from India, SSA, other Asia and particularly MENA, and are mostly small and medium-sized companies. Chinese companies plan to
6 In the full report (UNIDO 2007: 79-80), the correlation coefficient between the log of new investment over the past three years and log of last year’s sales is computed at 0.68 (p<0.001, R²= 0.463).
7 To avoid the effects of large investment to sales ratios that would be observed for start-ups and very small firms, those that were established later than 2002 and with annual sales of less than US$50,000 were omitted from the analysis.

9
remain essentially low investment, high employment companies. South African companies, especially in the telecommunication and financial services sector, have rapidly accumulated assets in SSA and are expanding gross sales from an already large base.
4.3 Human capital formation
Chinese employers and investors from elsewhere in Asia (excluding India) manage large labour forces – 660 and 580 respectively, compared with an average payroll of 300 for all units from the South and 350 from the North. In terms of employment growth rates, all groupings of South firms by origin have been expanding on average faster than firms from the North (Figures 13 and 14). South African firms most closely correspond with firms from the North in terms of annual employment growth rates over the last three years; 12 per cent compared to 10 per cent per annum.
Employment in all Asian firms in the sample, including those from China and India, has grown at significantly faster rates than firms from the North and is forecast to continue to grow at more than twice the annual average employment growth rate of firms from the North. Again South African firms are forecasting following a similar employment growth trajectory to firms from the North at 9 per cent per annum. High employment growth firms from Asia are relatively new investors in SSA, concentrated in the garments and textile sectors and based on export platforms supplying primarily global markets outside Africa. These firms are locating in Madagascar and to a lesser extent Kenya, Mozambique and Tanzania. The Chinese cluster is particularly strong in Madagascar. By contrast, Francophone West Africa does not appear to be attracting any of the global exporters from Asia.
The pattern of wages per worker is, as might be expected, the obverse of employment growth. South African firms, heavily concentrated in the services sector, pay average wages per worker much higher than Indian or Chinese employers – US$7,400 compared with, respectively, US$2,100 and US$1,100 annually (p<0.001) (Figure 15). The Northern ‘norm’ is US$5,900 per worker. In the complete sample of 1,216 companies, at a sub-sectoral level, financial services companies pay average wages of US$11,400. Three other services sub-sectors – transport and communications, professional services and energy companies – pay on average more than US$6,000 annually. The three sub-sectors that pay on average less than US$2,000 are export-oriented, labour intensive manufacturing concerns – wood products, textiles and garments. The only host country with a majority of firms participating in the Survey which are global exporters is Madagascar, where the average annual wage was US$1,300 – the lowest average annual wage of the fifteen survey countries.
In the complete survey sample of 1,216 firms, the most important predictor of wage levels is labour productivity at the firm level.8 Specifically, in terms of the manufacturing sector, low wages are associated with larger, younger firms. Chinese firms are on average seven years old and employ three times as many workers as the average South African company and more than five times the number of workers employed by the average Indian business.
8 Correlation = +0.672, (p<0.000), R² = 0.43 (UNIDO 2007: 73).
10
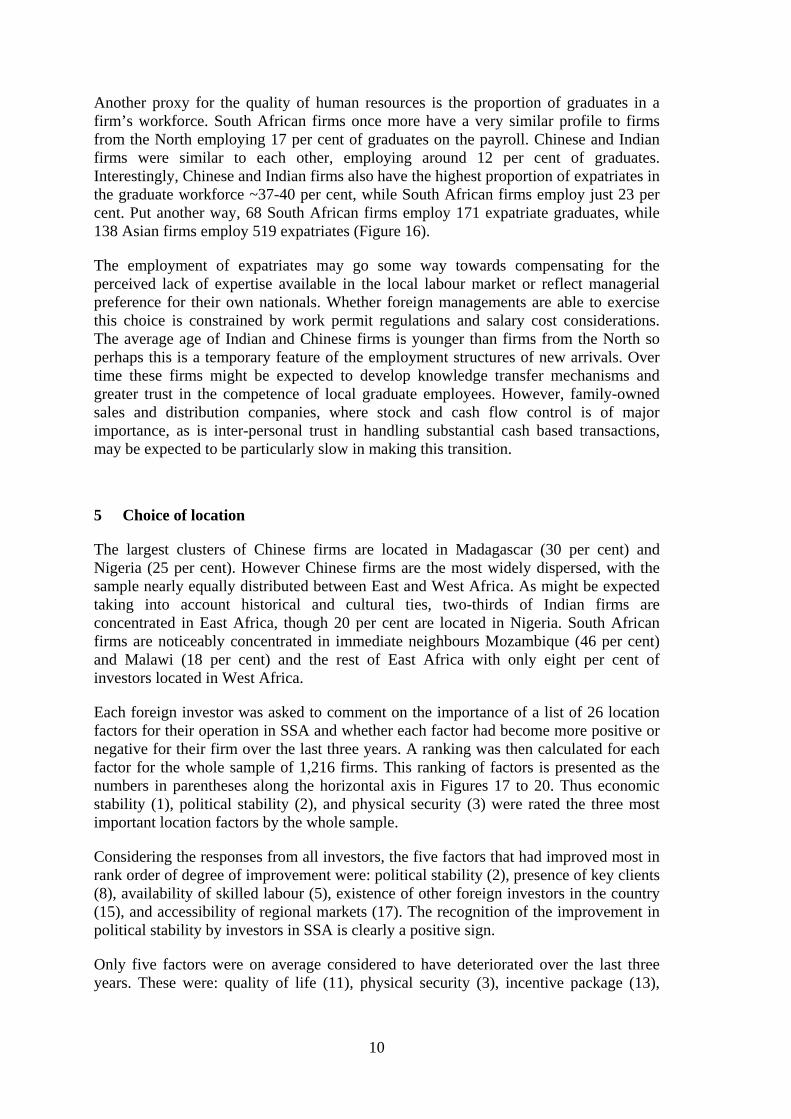
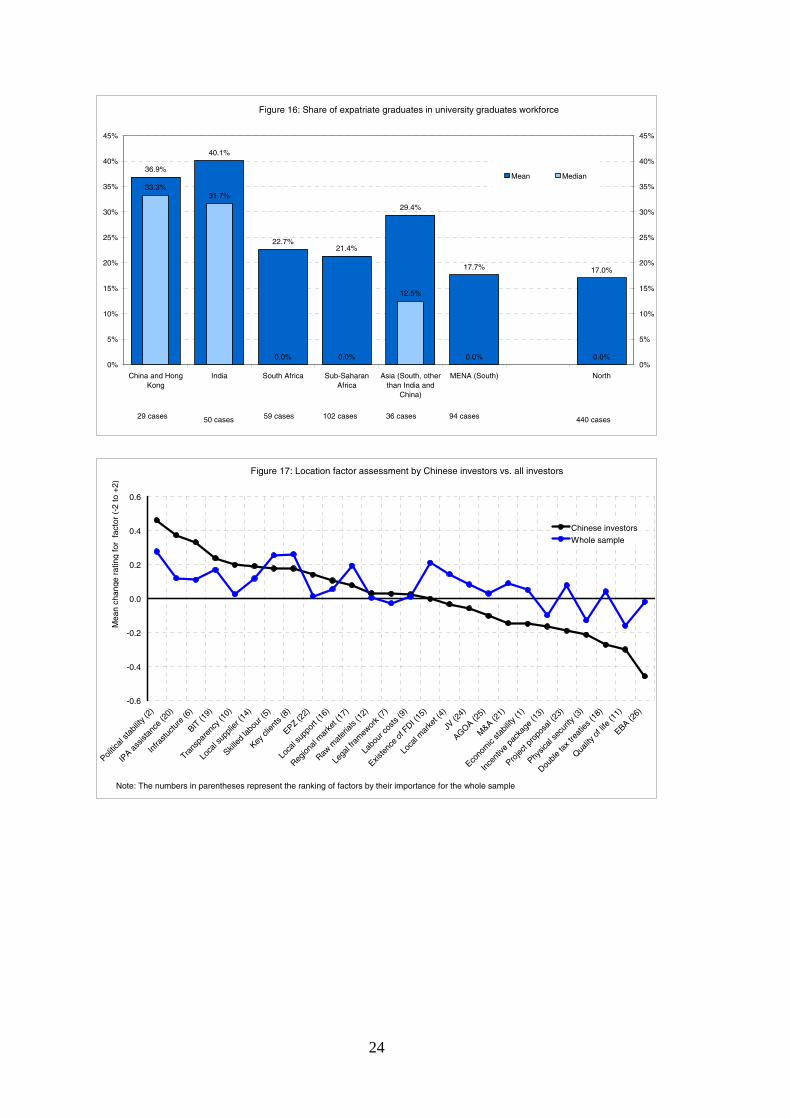
Another proxy for the quality of human resources is the proportion of graduates in a firm’s workforce. South African firms once more have a very similar profile to firms from the North employing 17 per cent of graduates on the payroll. Chinese and Indian firms were similar to each other, employing around 12 per cent of graduates. Interestingly, Chinese and Indian firms also have the highest proportion of expatriates in the graduate workforce ~37-40 per cent, while South African firms employ just 23 per cent. Put another way, 68 South African firms employ 171 expatriate graduates, while 138 Asian firms employ 519 expatriates (Figure 16).
The employment of expatriates may go some way towards compensating for the perceived lack of expertise available in the local labour market or reflect managerial preference for their own nationals. Whether foreign managements are able to exercise this choice is constrained by work permit regulations and salary cost considerations. The average age of Indian and Chinese firms is younger than firms from the North so perhaps this is a temporary feature of the employment structures of new arrivals. Over time these firms might be expected to develop knowledge transfer mechanisms and greater trust in the competence of local graduate employees. However, family-owned sales and distribution companies, where stock and cash flow control is of major importance, as is inter-personal trust in handling substantial cash based transactions, may be expected to be particularly slow in making this transition.
5 Choice of location
The largest clusters of Chinese firms are located in Madagascar (30 per cent) and Nigeria (25 per cent). However Chinese firms are the most widely dispersed, with the sample nearly equally distributed between East and West Africa. As might be expected taking into account historical and cultural ties, two-thirds of Indian firms are concentrated in East Africa, though 20 per cent are located in Nigeria. South African firms are noticeably concentrated in immediate neighbours Mozambique (46 per cent) and Malawi (18 per cent) and the rest of East Africa with only eight per cent of investors located in West Africa.
Each foreign investor was asked to comment on the importance of a list of 26 location factors for their operation in SSA and whether each factor had become more positive or negative for their firm over the last three years. A ranking was then calculated for each factor for the whole sample of 1,216 firms. This ranking of factors is presented as the numbers in parentheses along the horizontal axis in Figures 17 to 20. Thus economic stability (1), political stability (2), and physical security (3) were rated the three most important location factors by the whole sample.
Considering the responses from all investors, the five factors that had improved most in rank order of degree of improvement were: political stability (2), presence of key clients (8), availability of skilled labour (5), existence of other foreign investors in the country (15), and accessibility of regional markets (17). The recognition of the improvement in political stability by investors in SSA is clearly a positive sign.
Only five factors were on average considered to have deteriorated over the last three years. These were: quality of life (11), physical security (3), incentive package (13),

11
legal framework (7) and taking advantage of the EU ‘Everything but Arms’ (EBA) Agreement (26). The perceived deterioration in physical security is worrying.
Figures 17 to 20 present differences in the perspectives of investors by country of origin contrasted against the complete sample of 1,216 firms. The vertical axis shows the mean rating change for each of the 26 factors mapped along the horizontal axis. Figures 18 and 19 compare the perceptions of Indian and South African investors with those of the whole sample. Overall, Indian and South African investors are very positive about the investment environment by comparison with the sample as a whole. Most notably, both groups emphasize improvements in political and economic stability, the local market and infrastructure, factors widely identified as major barriers used to explain SSA’s low share of world FDI (Asiedu 2003a, b; Morisset 2000). Indian and South African investors even acknowledge some improvement in physical security. By contrast, Chinese firms are generally less positive about the investment environment in SSA, with the important exceptions of improvements in political stability and in infrastructure (Figure 17).
The perceptions of Northern investors compared to those of the sample as a whole are presented in Figure 20. In general, Northern investors are more negative about the investment environment in SSA than the sample as a whole. In particular, they share with Chinese investors a concern for what is perceived as the deteriorating quality of life and physical security in African countries.
6 Discussion
This paper has been written on the assumption that it is of value to differentiate between investors on the basis of their country of origin in the South. While this approach does not seem to have been problematic to writers such as Lall and Wells writing in the 1980s, it is more so in an increasingly globalized world economy where corporations can change their country of registration through a shareholder resolution. Nevertheless, ownership specific advantages of firms are created in a particular economic context even if this is sometimes difficult to specify (Filatotchev et al. 2007). Entrepreneurs, even when they establish stand-alone firms in foreign countries and maintain no formal links with a parent company, exploit the expertise and social capital developed, at least in part, in their country of origin. While identifying origins may be problematic, ascribing causality is even more difficult, not least because of the learning over time involved in undertaking FDI in a specific country. Below is presented a summary of the main features of FDI from South Africa, India and China in the fifteen SSA countries participating in the UNIDO Survey of 2005 (UNIDO 2007). Investments from the three countries are significantly different from each other.
6.1 South African investors
In general, South African FDI most closely matches that of FDI from the North. Since South African firms entered SSA markets long after Northern transnational corporations (TNCs) had established their operations in traditional fast moving consumer goods manufacturing, they have tended to spearhead moves into the provision of capital intensive business services of which MTN is perhaps the archetype. Paralleling

12
Northern investments, South African investors have also made inroads into food and beverages manufacturing. They favour the formal governance structure of a parent company with operating subsidiaries in SSA. There are few stand-alone South African investors. Even fewer firms export.
South African subsidiaries are very capital intensive, have made and plan major future investments over the next three years and expect sales to double over that period. Although they have hired only a moderate numbers of employees, a high proportion are local graduates and are well-paid, reflecting the high productivity achieved. Overall, South African foreign investors are very positive about the location of their operations in SSA, even acknowledging positive improvements in physical infrastructure and local markets.
6.2 Indian investors
Perhaps the most distinctive features of Indian-owned firms operating in SSA are that the overwhelming majority are stand-alone, owner-managed firms and are on average much smaller than Chinese or South African firms. In terms of performance, they are similar in capital intensity to Chinese firms but achieve more than two-and-a-half times the dollar value in sales per employee and 30 per cent more sales per dollar invested. They have been operating in SSA on average for twelve years. As might be anticipated from their size, they tend to operate in niches in traditional import substituting sub-sectors such as small-scale chemicals and plastics production and food and beverages.
Although sales growth was below average over the last three years, Indian investors are optimistic about the next three years, expecting to double sales. Reflecting the small average size of firms, investment has been modest in absolute terms but future investment rates as a proportion of sales are expected to be very high. While they may employ on average just 120 people, they have been hiring at twice the rate of South African firms and expect to continue to do so over the next three years. They pay wages of less than a third of that paid by South African firms, even though the capital productivity and sales per employee gap is rather less. Overall, Indian firms are very positive about their firm’s location in SSA. In answer to Zahra’s (2005) questions about the expertise of international entrepreneurs, it would seem that Indian firms are indeed expanding faster than large Northern TNCs operating in SSA, albeit from a much smaller base. Perhaps a better test of their expertise is whether they export and by that criterion they are currently failing.
6.3 Chinese investors
Chinese firms are relatively new arrivals in SSA and are overwhelmingly concentrated in the manufacturing sector, particularly the garments and textile sub-sectors. They are significantly more export-oriented than investors from India and South Africa. The few firms operating in the services sector market and distribute manufactured goods. About half of Chinese firms are owner-managed operations and half are subsidiaries of small TNCs with global sales of less than US$200 million. They are significantly more widely dispersed across SSA than firms from India and South Africa, perhaps reflecting their relatively weak business and cultural links to the region. It may also reflect the influence of the Chinese authorities on the outward foreign investment decisions of

13
Chinese TNCs where the state is a majority shareholder in the parent company (UNCTAD 2006).
A typical Chinese manufacturer is achieving very high sales growth but with modest sales per employee from a large and rapidly expanding workforce. Operations involve moderate capital investment per employee and pay low average wages per employee. Although Chinese firms are expanding their operations very rapidly, they are the least positive among investors from the South about locating in SSA. This perhaps reflects the high growth expectations Chinese firms bring with them from China where doubling sales every year has not been uncommon.
7 Conclusion
It is rather clear from the activities of investors from China, India and South Africa covered by the UNIDO Survey that their motives for establishing operations in SSA are driven primarily by market seeking rather than efficiency considerations (Dunning 1993). Paradoxically, even recently arrived Chinese global exporters are setting up export platforms in East Africa incentivized by third country trade regimes (mostly the USA and to a lesser extent the EU). While Chinese firms may be very focused on efficiency considerations at an operational level, it seems rather unlikely they would locate in Africa without AGOA and EBA. Some, however, may be using outward FDI as a means of escaping from home country institutional constraints (Witt and Lewin 2007). At one level then, the pattern of FDI from the three countries is definitely not a new phenomenon and follows the well-trodden path of European investment in SSA. Indeed, the density of trading and distribution companies in the population of firms from the major investing countries, whether from the North or the South, seems to confirm the longevity of a very old pattern of trade driven business relations with SSA.
An interesting topic for further investigation might be the business dynamics of trading companies in SSA as an indicator of whether foreign investors are increasing or decreasing their commitment to Africa (Johanson and Vahlne 1977). Certainly, the 289 firms, mostly from the North and operational in SSA before 1981, covered by the UNIDO Survey, were able to achieve 24 per cent better sales performance per dollar of assets than the overall average of the Survey sample as a whole. This suggests that persistence and the accumulation of operational experience over the long run yields higher capital productivity in SSA.
To be sure, the investment and trade policy regimes typically found in SSA today are very different from the protectionist policies prevailing in the 1960s and 1970s that attracted the older generation of Northern investors to SSA. However, the small size of domestic markets (apart from Nigeria) means that there remains limited scope for competition for well-established firms from other local producers. Competition, rather, comes from imports. The ubiquity of FDI from all three countries in the marketing, sales and distribution services sub-sector is evidence of the significance of import trade. Whether these trading firms progress through the stages proposed by Johanson and Vahlne in 1977 and become committed manufacturers in SSA or remain marginal trading outposts of the world’s manufacturers remains to be seen. Unfortunately a necessary pre-condition – the development of efficient regional markets in Africa –
14
continues to be hampered by both domestic market conditions and ‘between-the-border’ factors inhibiting cross-border trade (Broadman 2007).
One question raised indirectly in this paper that requires further research is the role of corporate governance in initiating and sustaining FDI in SSA. Indian companies are typically owner-managed, well-established but small, yet compared to larger, newer vintage Chinese firms, achieve high levels of capital efficiency and productivity. Is this simply an experience effect or is this due to the superior focus and networking capabilities of Indian family firms that helps them cope better with the information asymmetries and opaque business environment found in many SSA countries (Wright et al. 2006)?
South African investors in SSA, on the evidence of the UNIDO Survey (UNIDO 2007) seem to have rapidly established an enviable position in many of the markets they now serve. They have managed to raise, by African standards at least, large amounts of capital which they have deployed more efficiently than established investors from the North, pay higher wages, employ significant numbers of local graduates and invest in training their employees. Chinese firms, by contrast, absorb large numbers of workers but invest very little in fixed assets, pay low wages and spend very little on training. South African investors are relying on the growth of the domestic markets of SSA, the Chinese on preferential access to US and EU markets. In many ways, the last decade has become increasingly benign for all foreign investors in SSA. It will be interesting to observe which of the three countries’ investors flourish in the next decade.
15
References
Asiedu, E. (2003a). ‘Foreign Direct Investment to Africa: The Role of Government Policy, Governance and Political Instability’.
http://www.wider.unu.edu/conference/conference-2003-3-papers/Asiedu-0708.pdf
Asiedu, E. (2003b). ‘Policy Reform and Foreign Direct Investment to Africa: Absolute Progress but Relative Decline’. Development Policy Review 22(1): 41–8.
Autio, E. (2005). ‘Creative Tension: The Significance of Ben Oviatt’s and Patricia McDougall’s Article ‘Toward a Theory of International New Ventures’. Journal of International Business Studies 36(1): 9–19.
Autio, E., H. Sapienza, and J. Almeida (2000). ‘Effects of Age at Entry, Knowledge Intensity and Imitability on International Growth’. Academy of Management Journal 43(5): 909–1014.
Broadman, H. G. (2007). Africa’s Silk Road: China and India’s New Economic Frontier. Washington DC: World Bank.
Dunning, J. H. (1993). Multinational Enterprises and the Global Economy. Wokingham: Addison Wesley.
Dunning, J. H. (2000). ‘The Eclectic Paradigm as an Envelope for Economic and Business Theories of MNE Activity’. International Business Review 9: 163–90.
Filatotchev, I., R. Strange, J. Piesse, and Y.-C. Lien (2007). ‘FDI by Firms from Newly Industrialised Economies in Emerging Markets: Corporate Governance, Entry Mode and Location’. Journal of International Business Studies 38(4): 556–72.
Henley, J. S. (2004). ‘Chasing the Dragon: Accounting for the Under-Performance of India by Comparison with China in Attracting Foreign Direct Investment’. Journal of International Development 16: 1039–52.
IMF (1993). Balance of Payments Manual, Fifth edition. Washington DC: IMF.
Johanson, J., and J.-E. Vahlne (1977). ‘The Internationalization Process of the Firm: A Model of Knowledge Development and Increasing Foreign Market Commitments’. Journal of International Business Studies 8(1): 23–32.
Johanson, J., and J.-E. Vahlne (1990). ‘The Mechanism of Internationalization’. International Marketing Review 7(4): 11–24.
Johanson, J., and J.-E. Vahlne (2003). ‘Business Relationships, Learning and Commitment in the Internationalization Process’. Journal of International Entrepreneurship 1: 83–101.
Lall, S. (1983). Third World Multinationals. Chichester: John Wiley.
Mathews, J. A. (2006). ‘Dragon Multinationals: New Players in 21st Century Globalization’. Asia Pacific Journal of Management 23: 5–27.
Moosa, I. A. (2002). Foreign Direct Investment Theory, Evidence and Practice. New York: Palgrave Macmillan.
Morisset, J. (2000). ‘Foreign Direct Investment in Africa: Policies also Matter’. Transnational Corporations 9(2): 107–125.
16
Nanda, R., and T. Khanna (2007). ‘Diaspora and Domestic Entrepreneurs: Evidence from the Indian Software Industry’. Working Paper, Harvard Business School, June.
Oviatt, B. M., and P. P. McDougall (1994). ‘International New Ventures’. Journal of International Business Studies 25: 45–64.
Oviatt, B. M., and P. P. McDougall (2005). ‘The Internationalization of Entrepreneurship’. Journal of International Business Studies 36(1): 2–8.
UNCTAD (2006). World Investment Report 2006. New York and Geneva: United Nations.
UNIDO (2007). Africa Foreign Investor Survey 2005. Vienna: UNIDO. Available at http://www.unido.org/afripanet
Wells, L. T. (1977). ‘The Internationalization of Firms from Developing Countries’. In T. Agnon, and P. Kindleberger (eds) Multinationals from Small Countries. Cambridge, MA: MIT Press, pp. 133–56.
Wells, L. T. (1981). ‘Foreign Investors from the Third World’. In K. Kumar, and M. G. McLeod (eds) Multinationals from Developing Countries. Lexington, MA: D. C. Heath, pp. 23–36.
Wells, L. T. (1983). Third World Multinational: the Rise of Foreign Investment from Developing Countries. Cambridge, MA: MIT Press.
Witt, M. A., and A. Y. Lewin (2007). ‘Outward Foreign Direct Investment as Escape Response to Home Country Institutional Constraints’. Journal of International Business Studies 38(4): 579–94.
World Bank (2006). Doing Business in 2007 – How to Reform. Washington DC: World Bank.
Wright, M., I. Filatotchev, R. Hoskisson, and M. Peng (2006). ‘Strategy Research in Emerging Economies: Challenging the Conventional Wisdom’. Journal of Management Studies 42(1): 1–33.
Yin, E., and C. J. Choi (2005). ‘The Globalization Myth: The Case of China’. Management International Review 45 (special issue).
Zahra, S. A. (2005). ‘A Theory of International New Ventures: A Decade of Research’. Journal of International Business Studies 36(1): 20–8.

17
Table 1: Characteristics of foreign investment in sub-Saharan Africa (mean values)
Investor origin Age (years) Book value (US$mn)
Sales (US$mn)
Employees
China 7.0 5.39 6.99 657
India 12.0 2.60 2.59 119
South Africa* 13.1 18.1 11.2 200
North 21.6 24.7 19.0 347
Note: * Excluding MTN Nigeria.
Table 2: Firm performance
Investor origin Last year’s sales per employee
(US$)
Last year’s sales per US$ of book
value
Book value per employee (US$)
China N Mean
37 15,300
27 2.43
32 36,900
India N Mean
58 38,000
51 3.17
53 39,700
South Africa N Mean
72 96,800
63 3.96
66 107,000
The North N Mean
571 90,100
487 3.63
512 71,500
Complete sample N Mean
1011 74,000
868 3.43
934 75,500

18
4 1 6 51 31
36 43
3161
2980
280
11 19
51 84
18 44
329
0%
20%
40%
60%
80%
100%
China andHong Kong
India South Africa Sub-SaharanAfrica
Asia (South,other thanIndia and
China)
MENA(South)
North
Tertiary
Secondary
Primary
Figure 1: Sectors
Chemical, Plastic & Rubber
15%(7 firms)
Garment, apparel & leather, 11%
(5 firms)
Auto, Machinery & Equipm.
15%(7 firms)
Other21%
(10 firms)
Textile21%
(10 firms)
Marketing, Sales & Distribution
17%(8 firms)
Figure 2: Sub-sectors, investors from China

19
Figure 3: Sub-sectors, investors from India
Financial intermediation5% (3 firms)
Agric., Fish, & Nat. Resources
6% (4 firms)
Chemical, Plastic & Rubber
31%(21 firms)
Marketing, Sales & Distribution
17%(11 firms)
Food, Beverages & Tobacco
12%(8 firms)
Professional Services5% (3 firms)
Other24%
(16 firms)
Figure 4: Sub-sectors, investors from South Africa
Financial Intermediation
11%(9 firms)
Professional services,
10%(8 firms)
Food, Beverage & Tobacco
12% (10 firms)
Other29%
(24 firms)
Transport & Communication
13%(11 firms)
Marketing, sales & distribution
25% (21 firms)

20
Figure 5: Sub-sectors, investors from North
Other32%
209 firms
Agric., fish, & nat. resources5%
31 firms
Professional services8%
52 firms
Financial intermediation8%
50 firms
Transport & communication9%
57 firms
Hotel & restaurant5%
31 firms
Marketing, sales & distribution
19%121 firms
Food, beverages & tobacco14%
89 firms
Figure 6: Market orientation
26
5072
110
22
96433
4
5
6
18
4
16
10114
91
14
20
796
0%
10%
20%
30%
40%
50%
60%
70%
80%
90%
100%
China andHong Kong
India South Africa Sub-SaharanAfrica
Asia (South,other than India
and China)
MENA (South) North
Globalmarketseeking
Regionalmarketseeking
Localmarketseeking
2 6 12 14 4 13
220
3
9 28
1
17
69
16
31 50
6925
51
237
25
1818
57 2143
108
0%
10%
20%
30%
40%
50%
60%
70%
80%
90%
100%
China and HongKong
India South Africa Sub-SaharanAfrica
Asia (South,other than India
and China)
MENA (South) North
2001 andafter
1991-2000
1981-1990
1980 andbefore
Figure 7: Start-up period

21
110
2523
4 9117
3
4
11
62 11
37
3848
43
11241 92
417
0%
10%
20%
30%
40%
50%
60%
70%
80%
90%
100%
China andHong Kong
India South Africa Sub-SaharanAfrica
Asia (South,other thanIndia and
China)
MENA(South)
North
G.Field
Privatization
M&A
Figure 8: Mode of entry and ownership
Figure 9: Last year's sales growth
48.3%
17.6%20.5%
39.0%
12.6%13.0%
14.6%
20.0%
10.0%12.5%
23.0%
15.0%
9.5% 10.5%
0%
5%
10%
15%
20%
25%
30%
35%
40%
45%
50%
China and HongKong
India South Africa Sub-SaharanAfrica
Asia (South,other than India
and China)
MENA (South) North0%
5%
10%
15%
20%
25%
30%
35%
40%
45%
50%
Mean
Median
36 cases 60 cases 67 cases 124 cases 37 cases 98 cases 560 cases
28.8%
42.9%
21.0%
47.8%
40.6%
25.7%
31.3%
24.3%
13.9%16.0%
24.2%
11.8%
16.0%
19.6%
0%
5%
10%
15%
20%
25%
30%
35%
40%
45%
50%
China and HongKong
India South Africa Sub-Saharan Africa Asia (South, otherthan India and
China)
MENA (South) North
0%
5%
10%
15%
20%
25%
30%
35%
40%
45%
50%
Mean
Median
38 cases 62 cases 66 cases 134 cases 39 cases 107 cases554 cases
Figure 10: Future annual sales growth (over next 3 years)

22
33.7%
13.5%
3.3%
15.4%
46.8%
11.2%
18.9%
5.0%
30.0%
3%
8%
13%
18%
23%
28%
33%
38%
43%
48%
China and HongKong
India South Africa Sub-Saharan Africa Asia (South, otherthan India and
China)
MENA (South) North
MEAN
MEDIAN
41 cases 61 cases 63 cases 124 cases 35 cases 104 cases 546cases
Figure 11: Exports as % of sales
27.9%
70.7%
27.4%
61.3%
39.5%
113.7%
32.7%
2.5%7.7% 8.0% 8.0%
3.0%7.3%7.6%
0%
20%
40%
60%
80%
100%
120%
China and HongKong
India South Africa Sub-Saharan Africa Asia (South, otherthan India and
China)
MENA (South) North0%
20%
40%
60%
80%
100%
120%
Mean
Median
27 cases 41 cases 51 cases 91 cases 22 cases 65 cases 430 cases
Figure 12: Investment rate over the next 3 years (as % of sales)
16.4%
23.1%
12.1%
17.7%
32.4%
16.7%
10.2%
5.0%6.4%
4.2%
6.5%
19.6%
6.7%
2.0%
0%
5%
10%
15%
20%
25%
30%
35%
China and HongKong
India South Africa Sub-Saharan Africa Asia (South, otherthan India and
China)
MENA (South) North
0%
5%
10%
15%
20%
25%
30%
35%
Mean
Median
40 cases 58 cases 66 cases 128 cases 38 cases 97 cases 554 cases
Figure 13: Past annual employment growth (over past 3 years)

23
16.0%
17.7%
8.7%
9.7%
18.6%
11.3%
8.7%
7.0%
8.7%
5.2%
7.1%
11.0%
5.3%
2.4%
0%
2%
4%
6%
8%
10%
12%
14%
16%
18%
20%
China and Hong Kong India South Africa Sub-Saharan Africa Asia (South, otherthan India and China)
MENA (South) North
0%
2%
4%
6%
8%
10%
12%
14%
16%
18%
20%
Mean
Median
39 cases 62 cases 65 cases 126 cases 44 cases 109 cases546 cases
Figure 14: Future annual employment growth (over next 3 years)
$1,104
$2,106
$7,426
$4,462
$2,338$2,054
$5,869
$1,557
$4,398
$2,029
$1,228 $1,163
$3,380
$697
0
1000
2000
3000
4000
5000
6000
7000
8000
China and HongKong
India South Africa Sub-Saharan Africa Asia (South, otherthan India and
China)
MENA (South) North
US
D
0
1000
2000
3000
4000
5000
6000
7000
8000
US
D
Mean Median
41 cases 53 cases 69 cases 126 cases 39 cases 119 cases 540 cases
Figure 15: Annual wage per worker (in USD)
24
36.9%
40.1%
22.7%21.4%
29.4%
17.7% 17.0%
33.3%31.7%
0.0% 0.0%
12.5%
0.0% 0.0%0%
5%
10%
15%
20%
25%
30%
35%
40%
45%
China and HongKong
India South Africa Sub-SaharanAfrica
Asia (South, otherthan India and
China)
MENA (South) North
0%
5%
10%
15%
20%
25%
30%
35%
40%
45%
Mean Median
29 cases 50 cases 59 cases 102 cases 36 cases 94 cases 440 cases
Figure 16: Share of expatriate graduates in university graduates workforce
-0.6
-0.4
-0.2
0.0
0.2
0.4
0.6
Politic
al sta
bility
(2)
IPA a
ssist
ance
(20)
Infra
stuctu
re (6
)
BIT (1
9)
Trans
pare
ncy (
10)
Loca
l sup
plier
(14)
Skilled
labo
ur (5
)
Key cl
ients
(8)
EPZ (22)
Loca
l sup
port
(16)
Region
al m
arke
t (17
)
Raw m
ater
ials (
12)
Lega
l fram
ewor
k (7)
Labo
ur co
sts (9
)
Existe
nce
of F
DI (15
)
Loca
l mar
ket (
4)
JV (2
4)
AGOA (25)
M&A (2
1)
Econo
mic
stabil
ity (1
)
Ince
ntive
pac
kage
(13)
Projec
t pro
posa
l (23
)
Physic
al se
curit
y (3)
Double
tax t
reat
ies (1
8)
Quality
of li
fe (1
1)
EBA (26)
Chinese investors
Whole sample
Mea
n ch
ange
rat
ing
for
fact
or (
-2 to
+2)
Note: The numbers in parentheses represent the ranking of factors by their importance for the whole sample
Figure 17: Location factor assessment by Chinese investors vs. all investors

25
-0.3
-0.2
-0.1
0.0
0.1
0.2
0.3
0.4
0.5
0.6
0.7
Existe
nce
of F
DI (15
)
Politic
al sta
bility
(2)
Loca
l mar
ket (
4)
Econo
mic
stabil
ity (1
)
Infra
stuctu
re (6
)
Region
al m
arke
t (17
)
Key cl
ients
(8)
Trans
pare
ncy (
10)
Skilled
labo
ur (5
)
Quality
of li
fe (1
1)
Physic
al se
curit
y (3)
IPA a
ssist
ance
(20)
Loca
l sup
port
(16)
Labo
ur co
sts (9
)
Loca
l sup
plier
(14)
BIT (1
9)
AGOA (25)
Raw m
ater
ials (
12)
JV (2
4)
EPZ (22)
Lega
l fram
ewor
k (7)
M&A (2
1)
Projec
t pro
posa
l (23
)
EBA (26)
Double
tax t
reat
ies (1
8)
Ince
ntive
pac
kage
(13)
Indian investorsWhole sample
Mea
n ch
ange
rat
ing
for
fact
or (
-2 to
+2)
Note: The numbers in parentheses represent the ranking of factors by their importance for the whole sample
Figure 18: Location factor assessment by Indian investors vs. all investors
-0.2
-0.1
0.0
0.1
0.2
0.3
0.4
0.5
0.6
Loca
l mar
ket (
4)
Politic
al sta
bility
(2)
Skilled
labo
ur (5
)
Key ci
ents
(8)
Existe
nce
of F
DI (15
)
Infra
stuctu
re (6
)
Econo
mic
stabil
ity (1
)
Region
al m
arke
t (17
)
JV (2
4)
Projec
t pro
posa
l (23
)
M&A (2
1)
Labo
ur co
sts (9
)
Loca
l sup
plier
(14)
Physic
al se
curit
y (3)
Raw m
ater
ials (
12)
BIT (1
9)
AGOA (25)
Quality
of li
fe (1
1)
IPA a
ssist
ance
(20)
Loca
l sup
port
(16)
Double
tax t
reat
ies (1
8)
Trans
pare
ncy (
10)
Ince
ntive
pac
kage
(13)
Lega
l fram
ewor
k (7)
EBA (26)
EPZ (22)
SouthAfricaWhole
Mea
n ch
ange
rat
ing
for
fact
or (
-2 to
+2)
Note: The numbers in parentheses represent the ranking of factors by their importance for the whole sample
Figure 19: Location factor assessment by South African investors vs. all investors

26
-0.3
-0.2
-0.1
0.0
0.1
0.2
0.3
Skilled
labo
ur (5
)
Key cl
ients
(8)
Politic
al sta
bility
(2)
BIT (1
9)
JV (2
4)
Existe
nce
of F
DI (15
)
Region
al m
arke
t (17
)
M&A (2
1)
Projec
t pro
posa
l (23
)
Double
tax t
reat
ies (1
8)
Loca
l sup
plier
(14)
Loca
l mar
ket (
4)
IPA a
ssist
ance
(20)
Loca
l sup
port
(16)
EPZ (22)
AGOA (25)
EBA (26)
Econo
mic
stabil
ity (1
)
Trans
pare
ncy (
10)
Raw m
ater
ials (
12)
Labo
ur co
sts (9
)
Infra
stuctu
re (6
)
Lega
l fram
ewor
k (7)
Ince
ntive
pac
kage
(13)
Quality
of li
fe (1
1)
Physic
al se
curit
y (3)
North
Whole sample
Mea
n ch
ange
rat
ing
for
fact
or (
-2 to
+2)
Note: The numbers in parentheses represent the ranking of factors by their importance for the whole sample
Figure 20: Location factor assessment by North investors vs. all investors