Findings from ICILS 2013 and beyond - HKU
189
-
Upload
khangminh22 -
Category
Documents
-
view
0 -
download
0
Transcript of Findings from ICILS 2013 and beyond - HKU
E-Learning Pedagogy and School Leadership Practices to Improve Hong Kong Students’
Computer and Information Literacy:
Findings from ICILS 2013 and beyond
Nancy LAW, Johnny YUEN, Yeung LEE Centre for Information Technology in Education, University of Hong Kong

Copyright © Centre for Information Technology in Education First published 2015
Published by Centre for Information Technology in Education (CITE) Faculty of Education The University of Hong Kong
The book is published with open access at icils.cite.hku.hk
Open Access. This book is distributed under the terms of the Creative Commons Attribution Noncommercial License which permits any noncommercial use, distribution, and reproduction in any medium, provided the original author(s) and source are credited. All commercial rights are reserved by the Publisher, whether the whole or part of the material is concerned, specifically the rights of translation, reprinting, re-use of illustrations, recitation, broadcasting, reproduction on microfilms or in any other way, and storage in data banks. Duplication of this publication or parts thereof is permitted only under the provisions of the Copyright Law of the Publisher’s location, in its current version, and permission for commercial use must always be obtained from the Publisher. Violations are liable to prosecution under the respective Copyright Law. The use of general descriptive names, registered names, trademarks, etc. in this publication does not imply, even in the absence of a specific statement, that such names are exempt from the relevant protective laws and regulations and therefore free for general use.
The National Research Centre for the Hong Kong participation in ICILS 2013 would like to acknowledge the financial support provided by the Hong Kong Quality Education Fund (QEF).
E-Learning Pedagogy and School Leadership Practices to Improve Hong Kong Students’ Computer and Information Literacy: Findings from ICILS 2013 and beyond/ by Nancy Law, Johnny Yuen and Yeung Lee.
ISBN 978-988-18659-6-0
Cover design by Debbie Pang
i
Acknowledgements
Hong Kong’s participation in ICILS 2013 would not have been possible without the
funding support for the project. We are very grateful to the support given by all the
principals, teachers, ICT coordinators and students who participated in the pilot
and main studies. Without their participation, it would have been possible to
complete the study so successfully and smoothly.
We need to highlight the enormous help we received from our Honorary
Consultant, Mrs Grace Kwok, who worked tirelessly to help us with liaison with
school principals.
We are also very thankful for the generous support given by the Education Bureau
and her staff, especially for helping the project to ensure participation from schools.
We are also indebted to steering committee for their valuable advice over the
duration of the project.
Finally, we would also like to extend our hearty thanks for all the colleagues
involved in various stages in this project. In particular, we would like to
acknowledge the contribution from a number of colleagues and students: Dr. Zhan
Wang for her contribution to the analysis of the data, Dr. Ling Li for her copy-
editing of the English version of this book and Mr Leming Liang for copy-editing
and formatting the Chinese version. We are also grateful to Mrs Liliana Farias for
her careful formatting of the English version.

ii
Project Team
Project Leader
Prof. Nancy LAW
Deputy Director, CITE, Faculty of Education, The University of Hong Kong
Research Team Members
Dr. Y. LEE
Assistant Director, CITE, Faculty of Education, The University of Hong Kong
Dr. Johnny YUEN
Research Officer, CITE, Faculty of Education, The University of Hong Kong (2013-
2015)
Dr. Emily OON
Research Officer, CITE, Faculty of Education, The University of Hong Kong (2011-
2013)
Ms. Ada TSE
Research Assistant, CITE, Faculty of Education, The University of Hong Kong
Mrs. Grace Kwok
Honorary Consultant: School Liaison
Test Administrators
AU Lok Yee AU Suet Yee CHAN Ka Lai
CHAN Ki Yan CHENG Kwan Yee CHEUNG Sau Ping
CHIANG Lai Hang CHOW Yan FUNG Hiu Tung
FUNG Lik Yan KAN Wai Kit LAM Wai Sum
LEE Ying Yin LIU Sin Yi NGAI Yik Long
WONG Chi Lai YAU Hiu Ying YUNG Man Yi

iii
Steering Committee Mr. Danny CHENG
Ex- Chairman, The Hong Kong Association for Computer Education
Mr. K. W. LAM
Ex- Chairman, Hong Kong Direct Subsidy Scheme Schools Council
Mr. Y.T. LAU (10/2014 - 09/2015)
CCDO, Information Technology in Educational Section, Education Bureau
Mr. S. T. LEUNG
Chairman, Hong Kong Aided Primary School Heads Association
Mr. A. C. LIU
Ex- Chairman, Hong Kong Subsidized Secondary Schools Council
Mrs. K. Y. LIU NG
Chairperson, Union of Government Primary School Headmasters and
Headmistresses
Ms. M. M. NG
Ex- CEO, HKEdCity
Mr. S. K. NG
Ex- Vice-Chairman, Hong Kong Association of Heads of Secondary Schools
Mr. M. SHE (08/2011 - 10/2014)
Ex- CCDO, Information Technology in Educational Section, Education Bureau
Mr. George TAM
Ex- Chairman, Hong Kong Grant School Council
Mr. Albert WONG
Chairman, Association of IT Leaders in Education (AiTLE)

iv
v
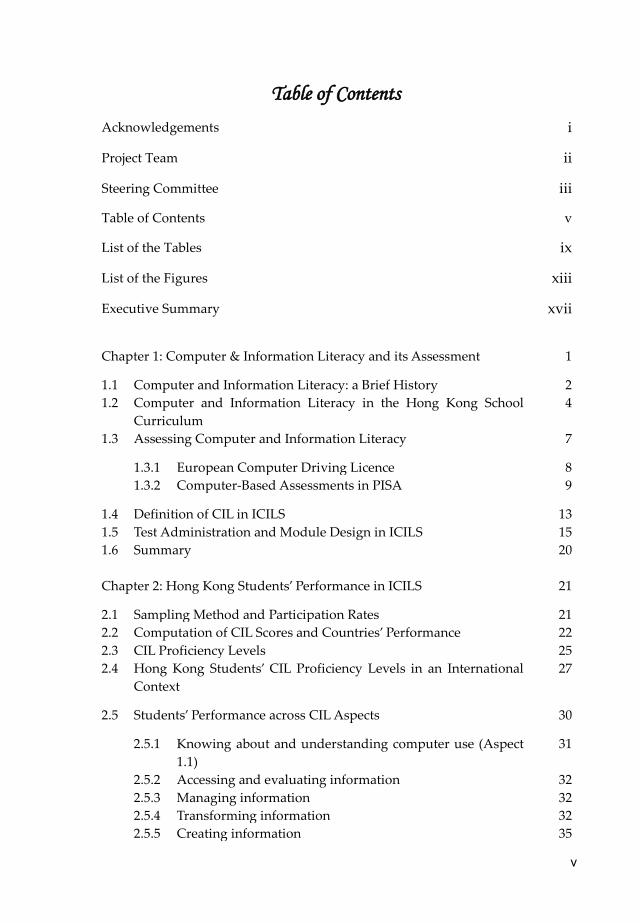
Table of Contents
Acknowledgements i
Project Team ii
Steering Committee iii
Table of Contents v
List of the Tables ix
List of the Figures xiii
Executive Summary xvii
Chapter 1: Computer & Information Literacy and its Assessment 1
1.1 Computer and Information Literacy: a Brief History 2 1.2 Computer and Information Literacy in the Hong Kong School
Curriculum 4
1.3 Assessing Computer and Information Literacy 7
1.3.1 European Computer Driving Licence 8 1.3.2 Computer-Based Assessments in PISA 9
1.4 Definition of CIL in ICILS 13 1.5 Test Administration and Module Design in ICILS 15 1.6 Summary 20 Chapter 2: Hong Kong Students’ Performance in ICILS 21
2.1 Sampling Method and Participation Rates 21 2.2 Computation of CIL Scores and Countries’ Performance 22 2.3 CIL Proficiency Levels 25 2.4 Hong Kong Students’ CIL Proficiency Levels in an International
Context 27
2.5 Students’ Performance across CIL Aspects 30
2.5.1 Knowing about and understanding computer use (Aspect 1.1)
31
2.5.2 Accessing and evaluating information 32 2.5.3 Managing information 32 2.5.4 Transforming information 32 2.5.5 Creating information 35

vi
2.5.6 Sharing information 36
2.5.7 Using information safely and securely 37
2.5.8 Students’ performance across CIL aspects and proficiency levels
40
2.6 Students’ CIL proficiency trajectories 42
2.6.1 Hong Kong students’ improvements in competency profile
as they move to higher CIL proficiency levels
44
2.6.2 Australian and Korean students’ improvements in competency profile as they move to higher CIL proficiency
levels
45
2.7 Summary 47
Chapter 3: Influence of Students’ Background and ICT Use Experience
on their CIL
49
3.1 Contextual Factors Derived from the Student Survey 50
3.2 Influence of Students’ Personal and Family Background 51
3.2.1 Gender and CIL achievement 52
3.2.2 Educational aspirations and CIL achievement 53
3.2.3 Immigrant status and CIL achievement 54
3.2.4 Language use at home and CIL achievement 55
3.2.5 Socioeconomic background and CIL achievement 56
3.2.6 Home ICT resources and CIL achievement 57
3.3 Influence of Students’ ICT Self-efficacy and Interest 58
3.3.1 Self-efficacy in basic ICT skills and CIL achievement 58
3.3.2 Self-efficacy in advanced ICT skills and CIL achievement 60
3.3.3 Interest and enjoyment in using ICT and CIL achievement 61
3.4 Influence of Students’ ICT Use Experience at Home and in School 64
3.4.1 Computer experience and CIL achievement 64
3.4.2 Use of computers for and at school 67
3.4.3 Use of computers outside school 74
3.5 Students’ Contextual Factors and Their CIL Achievement 79
3.5.1 Contextual factors and overall CIL score 79
3.5.2 Contextual factors and the seven CIL aspect scores 82
3.6 Summary 85

vii
Chapter 4: How Do Schools Influence Students’ CIL Achievement? 87
4.1 ICT infrastructure and resources in schools 88 4.1.1 Digital learning resources 88 4.1.2 Computer resources for teaching and/or learning 91 4.1.3 Student: Computer ratios 92 4.1.4 Summary 93
4.2 School Policies and Practices Regarding ICT Use 94
4.2.1 Principals’ views on educational purposes of ICT use 94 4.2.2 Principals’ expectations of teachers’ knowledge and skills in
professional use of ICT 95
4.2.3 The extent to which principals monitored teachers’ ICT use to achieve different learning outcomes
96
4.2.4 The extent to which principals took main responsibility for ICT management and implementation
100
4.2.5 The extent to which schools had measures regarding ICT access and use
101
4.2.6 The extent to which teachers participated in different forms of professional development as reported by principals
103
4.2.7 Principal’s priorities for facilitating use of ICT 105 4.2.8 Obstacles that hinder school’s capacity to realize its e-
Learning goals 107
4.3 Teacher’s ICT-using Pedagogy 108
4.3.1 Teacher confidence in using ICT 110 4.3.2 Teachers’ reported use of ICT tools in teaching 112 4.3.3 Teachers’ reported student use of ICT in different learning
tasks 114
4.3.4 Teachers’ reported use of ICT for various types of teaching and learning activities
116
4.3.5 Teachers’ emphasis on developing students’ information literacy
118
4.4 School Level Factors and Hong Kong Student’s CIL Achievement 120 4.4.1 School level factors and overall CIL score 121 4.4.2 School level factors and the seven CIL aspect scores 125 4.5 Summary 126
Chapter 5: Learning & Assessment Designs to foster students’ CIL 129

viii
5.1 Principles of Learning Design for CIL Development 129 5.2 Principles of Assessment Design 130 5.3 Learning Designs Targeting Specific CIL Aspects 132 5.3.1 Learning designs to foster skills for accessing and
evaluating information 132
5.3.2 Learning designs to foster skills for managing information 138 5.3.3 Learning designs to foster skills for transforming
information 141
5.3.4 Designs to foster skills for sharing information 142
5.4 An Extended Learning Design to Foster Learning in Multiple CIL Aspects
146
5.5 Summary 154
References 155

ix
List of Tables Table 1.1 The key standards areas specified in the 1998 and
2007 NETS 3
Table 1.2 The Computer and Information Literacy Framework adopted in ICILS
14
Table 1.3 A comparison of the IL assessment framework adopted by the ILPA Study in Hong Kong (Law et al. 2008) and that used in ICILS
15
Table 1.4 Overview of the short tasks in the After-School Exercise module
17
Table 1.5 Summary of the performance expectation and associated CIL aspect for each of the score point criteria in the After-School Exercise long task module
19
Table 2.1 Allocation of module score points to the ICILS assessment framework
23
Table 2.2 Country averages for CIL, years of schooling, average age, ICT Index, student–computer ratios and percentile graph
24
Table 2.3 Descriptions of students’ typical performance capabilities at the different levels of the CIL scale
26
Table 2.4 Examples of ICILS test items mapped to the four CIL proficiency levels based on their item difficulty
28
Table 2.5 The percentages correct (S.D.) and relative difficulty for the seven CIL aspects for Hong Kong, Australia and Korea
30
Table 2.6 Sample responses from Hong Kong students to the three tasks related to the phishing email
38
Table 2.7 Samples of Hong Kong students’ responses to the short task on problems that may arise by making one’s email address public
40
Table 2.8 Percentage of students who have correctly answered each short task in the After-school Exercise module (mapped to CIL assessment aspect and level)
41
Table 2.9 Percentage of students who have achieved partial or full score for each assessment criterion (mapped to CIL level) in the poster design large-task
42
Table 3.1 List of key context variables* derived from the student questionnaire
51
Table 3.2 Gender differences in CIL 52
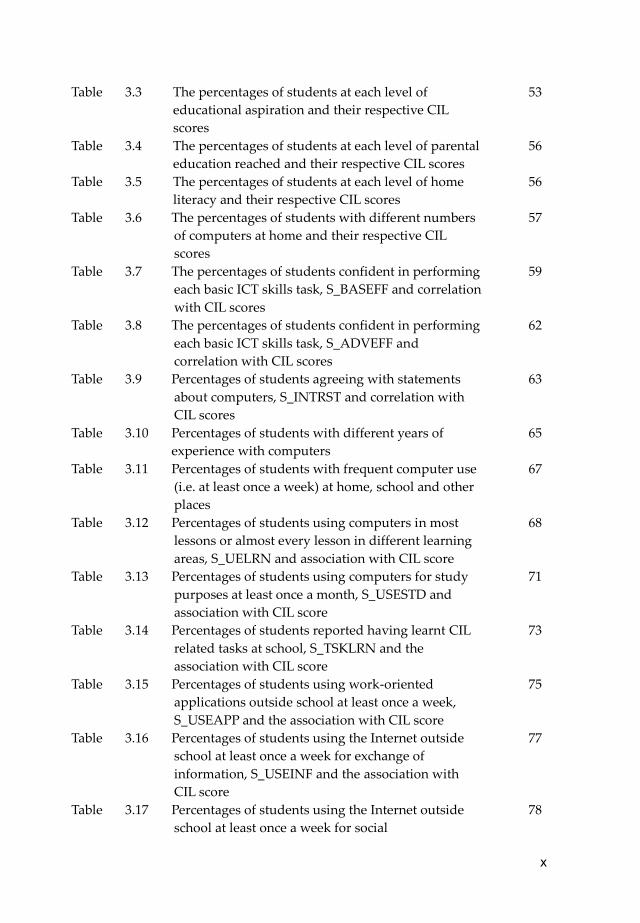
x
Table 3.3 The percentages of students at each level of educational aspiration and their respective CIL scores
53
Table 3.4 The percentages of students at each level of parental education reached and their respective CIL scores
56
Table 3.5 The percentages of students at each level of home literacy and their respective CIL scores
56
Table 3.6 The percentages of students with different numbers of computers at home and their respective CIL scores
57
Table 3.7 The percentages of students confident in performing each basic ICT skills task, S_BASEFF and correlation with CIL scores
59
Table 3.8 The percentages of students confident in performing each basic ICT skills task, S_ADVEFF and correlation with CIL scores
62
Table 3.9 Percentages of students agreeing with statements about computers, S_INTRST and correlation with CIL scores
63
Table 3.10 Percentages of students with different years of experience with computers
65
Table 3.11 Percentages of students with frequent computer use (i.e. at least once a week) at home, school and other places
67
Table 3.12 Percentages of students using computers in most lessons or almost every lesson in different learning areas, S_UELRN and association with CIL score
68
Table 3.13 Percentages of students using computers for study purposes at least once a month, S_USESTD and association with CIL score
71
Table 3.14 Percentages of students reported having learnt CIL related tasks at school, S_TSKLRN and the association with CIL score
73
Table 3.15 Percentages of students using work-oriented applications outside school at least once a week, S_USEAPP and the association with CIL score
75
Table 3.16 Percentages of students using the Internet outside school at least once a week for exchange of information, S_USEINF and the association with CIL score
77
Table 3.17 Percentages of students using the Internet outside school at least once a week for social
78

xi
communication, S_USECOM and the association with CIL score
Table 3.18 Percentages of students using the Internet outside school at least once a week for recreation, S_USEREC and the association with CIL score
80
Table 3.19 Multilevel model results for students’ CIL scores using student context variables as level 1 predictors
81
Table 3.20 Multilevel model results for each of the seven standardized CIL aspect scores using student context variables as level 1 predictors
84
Table 3.21 List of key student context scale variables and their correlation with CIL scores for Hong Kong
85
Table 4.1 Percentages of students studying at schools with available internet-related teaching and learning resources
89
Table 4.2 Percentages of students studying at schools with available software resources for teaching and/or learning
90
Table 4.3 Percentages of students at schools with computer resources for teaching and/or learning
91
Table 4.4 Percentages of students at schools with school computers at different locations
93
Table 4.5 Percentages of students at schools where the principals consider ICT use as very important for achieving different educational outcomes
95
Table 4.6 Percentages of students at schools where the principals expect and require teachers to have different technological pedagogical knowledge and communication skills
97
Table 4.7 Percentages of students at schools where the principals use various means to monitor teachers’ ICT use to develop students’ advanced ICT skills
99
Table 4.8 Percentages of students at schools where the principals use various means to monitor teachers’ ICT use
99
Table 4.9 Percentages of students at schools where the principals took main responsibilities for different aspects of ICT management and implementation
100
Table 4.10 Percentages of students at schools where the principals took main responsibilities for different aspects of ICT management
102
xii
Table 4.11 Percentages of students at schools where teachers
participate in different ICT- related professional
development as reported by their principals
104
Table 4.12 Percentages of students at schools where principals
indicate medium or high priority to ways of
facilitating use of ICT in teaching and learning
106
Table 4.13 Percentages of Hong Kong principals who indicate
“somewhat” or “a lot” of hindrance cause by issues
listed to their school’s capacity to realize e-Learning
capacity
109
Table 4.14 Percentages of teachers expressing confidence in
doing different computer tasks
111
Table 4.15 Percentages of teachers using ICT tools in most,
almost every, and every lessons
113
Table 416 Percentages of teachers who indicate students often
using ICT for teaching activities in classrooms
115
Table 4.17 Percentages of teachers often using ICT for teaching
practices in classrooms
117
Table 4.18 Percentages of teachers put strong or some
emphasis to develop students’ ICT-based
119
Table 4.19a Table 4.19a List of key school-level variables*
derived from the principal
121
Table 4.19b List of key school-level variables* derived from the
teacher questionnaire
122
Table 4.20 Multilevel model res0.0ults for students’ CIL scores using school-level variables as level 2 predictors (z-
scores)
124
Table 4.21 Multilevel model results for each of the seven
standardized CIL aspect scores using school level
variables as level 2 predictors
127
Table 5.1 Assessment rubrics for evaluating “creating information”
131
Table 5.2 An assessment checklist for “creating information” in a poster creation task
132
Table 5.3 An assessment rubric for students’ work on evaluating information
135
Table 5.4 A self-evaluation checklist and associated
assessment rubric for the website evaluation task
137
Table 5.5 Assessment criteria for the poster and route map 141
Table 5.6 An assessment rubric for peer review type of forum
postings
145

xiii
List of Figures Figure 1.1 Logo for European Computer Driving Licence
Foundation (ECDL)
1
Figure 1.2 National Education Technology Standards. 8
Figure 1.3 The seven pillars of information literacy according
to SCONUL.
4
Figure 1.4 Relationship of IL to lifelong learning 4
Figure 1.5 Modules included in the Information Technology
Learning Targets guideline
5
Figure 1.6 The nine generic skills specified in the Reform
Proposal
5
Figure 1.7 Consultation documents published by the
Education Commission in 2000 with a focus on
preparing students for lifelong and lifewide
learning
6
Figure 1.8 The Information Literacy Framework released by
the EMB in 2005 and the graphical representation
for information literacy used in the document
6
Figure 1.9 Graphical representations of the Information
Literacy and Scientific Inquiry frameworks used by
the ILTOOLS team
7
Figure 1.10 The Australian ICT Literacy Assessment
framework
8
Figure 1.11 An item in the Primary 5 and Secondary 2 ILPA
generic test that assesses the ‘integrate’ dimension
10
Figure 1.15 An item in the Primary 5 ILPA mathematics test
that assesses the ‘integrate’ dimension
11
Figure 1.13 Screen dumps for a task in the Secondary 2 ILPA
Science test that assesses the ‘integrate’ dimension
12
Figure 1.14 A sample screen in an ICILS test module showing
the functions for different sections of the screen
16
Figure 1.15 The poster design environment, information
resources, instructions and assessment criteria
provided to students for working on the large task
18
Figure 2.1 Percentages of Hong Kong, Australia and Korea
students performing at each CIL proficiency level
29
Figure 2.2 The three tasks that test students’ ability to navigate to a designated webpage using different
forms of instruction
31
Figure 2.3 A poster designed by a Hong Kong student 32

xiv
Figure 2.4 Sample poster designed by Hong Kong student 32 Figure 2.5 Screenshot of the short task in After-school
Exercise that tests students’ ability to change the sharing setting of a web document
33
Figure 2.6 Sample poster designed by a Hong Kong student 34 Figure 2.7 Sample poster designed by a Hong Kong student 35 Figure 2.8 The short task that assessed students’ awareness of
risks in making personal information public 37
Figure 2.9 The phishing email with three suspicious elements, A, B and C
39
Figure 2.10 A radar diagram of the mean percentages correct per CIL aspect
43
Figure 2.11 A radar diagram showing the mean percentages correct per CIL aspect for Hong Kong students at each of the five CIL proficiency levels
44
Figure 2.12 A radar diagram showing the mean percentages correct per CIL aspect for Australian students at each of the five CIL proficiency levels
46
Figure 2.13 A radar diagram showing the mean percentages correct per CIL aspect for Korean students at each of the five CIL proficiency levels
47
Figure 3.1 Contextual factors influencing students’ CIL outcomes
50
Figure 5.1 Sample* of students’ submitted work on ancient calculating tools
132
Figure 5.2 Figure 5.2 Sample of the comic strips created by the students
134
Figure 5.3 A P.6 student’s work on evaluating information from news reports
135
Figure 5.4 A Secondary 3 student’s work on evaluating information from websites
136
Figure 5.5 Sample of P. 2 students’ work on managing information
138
Figure 5.6 Samples of P. 5 students’ template for recording experimental data
139
Figure 5.7 Data collection template resubmitted by Group 3 140 Figure 5.8 A sample poster and field trip route on Google
map produced by a group of P.5 students 143
Figure 5.9 Google calendar used by some students to plan their work schedule
144

xv
Figure 5.10 An example of a Learning Management System customized to support shared reading and peer commenting of essays
144
Figure 5.11 A discussion forum where students commented on the lyrics written by their classmates
145
Figure 5.12 Postings of information on the discussion forum in
Stage 1, demonstrating students’ ability to use keywords to access information, use the forum to manage and share information
147
Figure 5.13 The target shop, route plan and interview questions prepared by one group of students in Stage 2, demonstrating their abilities to access, manage and transform information
148
Figure 5.14 In Stage 3, students conducted the interview during the field trip, then posted the collected information and their own reflections online after the visit
150
Figure 5.15 Artefacts created by students in Stage Four: The group mind map and a 3D paper model created by a student who completed his essay writing early. These artefacts demonstrate students’ ability to transform and create information
151
Figure 5.16 An essay written by one of the students, demonstrating his ability to transform and create information
152
Figure 5.17 The rubric for self- and peer- assessment of the essays, and the peer feedback given by students to their peers online
153

xvi

xvii
Executive Summary Background
As the title of this book indicates, the focus of this publication is to help teachers,
principals, education policy makers, teacher educators and members of the
community concerned about student learning to understand Hong Kong students’ levels of Computer Information Literacy (CIL) achievement in comparison with
their international peers, and what e-learning pedagogy and e-leadership practices
in schools will help to foster students’ ability to make use of ICT tools productively
for lifelong learning in the 21st century. The core of this book is an in-depth analysis
of the Hong Kong results from the International Computer and Information
Literacy Study 20131 (ICILS2013), drawing on comparisons with the international,
Australian, and Korean data. Findings from this analysis will help us to understand
the strengths and weaknesses of Hong Kong students’ CIL achievement, as well as
the contextual factors (personal, family, teacher and school leadership factors) that
influence them. This book also provides curriculum exemplars to illustrate the key
characteristics of pedagogical and assessment designs that are conducive to
enhancing students’ CIL, drawing on past and current CITE projects.
The International Computer and Information Literacy Study 2013 2
(ICILS2013) is the first large-scale international comparative study on students’ ability to make use of computer and information technology to conduct inquiry,
create, communicate and use information safely at home, school and different
social and workplace contexts. Including Hong Kong, a total of 21 countries and
education systems participated in this study, which was conducted under the
auspices of the International Association for the Evaluation of Educational
Achievement (IEA). The Hong Kong component of the ICILS 2013 study was
conducted by the Centre for Information Technology in Education (CITE) of The
University of Hong Kong, funded by the Quality Education Fund (QEF). The actual
data collection took place between March and July of 2013.
Computer and Information Literacy—concept and test design
The assessment framework for ICILS 2013 (Fraillon et al., 2013) comprises two
strands of abilities. The first strand, collecting and managing information, can be
further differentiated into three aspects: knowing about and understanding
computer use, accessing and evaluating information, and managing information.
1 Hong Kong ICILS 2013 Study website: http://icils.cite.hku.hk/ 2 ICILS 2013 International Study website: http://www.iea.nl/icils_2013.html

xviii
The second strand, producing and exchanging information, encompasses four aspects: transforming information, creating information, sharing information, and using information safely and securely.
The performance assessment was conducted on computers located in the computer labs of the sampled schools. The student test consisted of questions and tasks presented in four 30-minutes modules. Each participating student was randomly assigned to complete two of the test modules. Each module comprises multiple-choice items and constructed responses pertaining to authentic tasks, designed according to the CIL assessment framework.
Similar to all IEA studies of student achievement, the ICILS2013 CIL scale has an average score set to 500 and standard deviation to 100. In addition, students’ CIL performance are categorized into five proficiency levels in descending order: level 4, level 3, level 2, level 1, and below level 1. Table 2 presents detail descriptions of the five CIL proficiency levels.
ICILS 2013 Study design and HK participation statistics
ICILS 2013 requires the following from all participating systems: x School sample: A random sample of at least 150 secondary schools from
the target population of schools that offer grade 8 classes in the 2012-13 academic year.
x School questionnaire data collection: Online questionnaire to be completed by the school principal, the ICT coordinator, and 15 teachers who teach grade 8 classes in the 2012-13 academic year (~20-30 minutes).
x Student sample: 20-25 students randomly sampled from all grade 8 students in each participating school.
x Student data collection: Computerized student CIL test (60 minutes) and student questionnaire (20 minutes).
In Hong Kong data, 118 secondary schools participated in the ICILS 2013 study. A total of 2089 Secondary 2 students, 1338 Secondary 2 teachers, 115 principals and 105 ICT coordinators from the sampled schools took part in the study. Overall participation rates, after weighting and replacement, are: students 68.6%, teachers 58.3%, schools 70.8%. The Hong Kong set of data is considered as belonging to category 2, and does not meet the IEA standards for statistical comparisons across countries (category 1), which require overall participation rates after weighting and replacement to be at least 75%.
Students’ CIL achievement Hong Kong Secondary 2 students’ overall average CIL score is 509, slightly above the ICILS 2013 average of 500. However, this is lower than all the economically developed participating educational systems.

xix
HK’s ICT Development Index is ranked fifth among the 21 participating systems, but unfortunately, this strength in our ICT infrastructure contrasts with our students’ relatively low CIL scores.
Analysis of HK student’s CIL performance across the items in the two CIL strands indicates a relatively weaker performance in strand 2 (producing and exchanging information). Further in-depth analysis of each of the seven aspects of CIL show that Hong Kong students performed better in CIL tasks on knowing about and understanding computer use, as well as using information safely and securely. Their performance are poorest if they had to process the information collected, that is, evaluating information, transforming information, sharing information, as well as managing information.
Of the five proficiency levels of CIL competence defined by IEA on the basis of the students’ performance, a student need to be able to perform at least at level 3 in order to be able to cope with the CIL needs for everyday needs. However, this amounts to only 26% for Hong Kong, compared to 34% for Australia and 35% for Korea. At the same time 38% of Hong Kong students achieved level 1 or below, which is relatively high among all economically developed participating systems. A total of 15% of HK students were assessed to be below level 1 CIL proficiency, which is very poor in comparison with Australia (5%) and Korea (9%). The standard error of HK students’ mean CIL score is the second highest among all participating systems, indicating large variations in CIL among HK students.
By comparing the comparative improvements in mean percentage scores for each of the seven aspects for students from below level 1 (mean CIL score below 407) to level 4 (mean CIL score above 661). We find that Australian and Korean students generally showed balanced advancement in all seven aspects as we examine the means CIL aspect score from lower to higher proficiency levels. On the other hand, Hong Kong students were not able to show similar magnitude of advancement in all seven CIL aspects. In particular, no significant advancement could be found between level 3 and level 4 students in the two CIL aspects that Hong Kong students were poorest at: managing information and sharing information. Clearly, helping students to improve on their performance in these CIL aspects is a high priority.
HK students’ personal and home background, and how these relate to their CIL performance
SES
Similar to most other countries participating in the study, the CIL score of HK Secondary 2 female students is significantly higher than their male counterparts. Not surprisingly, there is a statistically significant positive correlation between HK students’ family social economic status (SES) and their CIL scores.

xx
However the effect of SES on CIL achievement for Hong Kong students is not as high as in other education systems.
ICT access
Access to at least one computer at home (including desktop, notebook, or tablet computer) by surveyed students is high, at 98%. The mean CIL score of students with no computer at home is significantly lower, at CIL proficiency level 1. Students with at least one computer at home have mean CIL score at CIL proficiency level 2. The influence of having more than one computer at home on CIL performance is relatively minor. It is also observed that only less than 1% of the participating students reported not having Internet access at home, suggesting that some students could only access the Internet at home using smartphones.
Student level contextual factors and CIL achievement
We investigated whether and to what extent Hong Kong students’ personal and family context affect their achievement in CIL. Correlational analyses show that students’ CIL scores correlate with all student level contextual factors. However, many of these context factors are themselves highly correlated. Multilevel analyses using student level factors show that only student’s self-efficacy in basic ICT skills has the largest positive significant influence on student’s CIL achievement. In addition, students’ educational aspirations and their reports on opportunities to learn CIL-related tasks at school also significant positive coefficients. On the contrary, students’ self-efficacy in advanced ICT skills and reported use of ICT during lessons at school had significant negative coefficients in predicting students’ CIL achievement. Further multilevel modeling of the relationship between student’s context variables and their performance in each of the seven CIL aspects show similar results. These findings indicate that CIL proficiency is different from advanced ICT skills, and that the use of ICT during lessons in Hong Kong schools, even when it happened, was not conducive to the development of students’ CIL proficiency. Hence it is important to explore the school level factors that contribute positively to students’ CIL.
School factors and their influence students’ CIL achievement
Students’ e-learning opportunities and experiences are very much determined by the ICT infrastructure and digital learning resources available, as well as the nature and intensity of ICT use in pedagogical practices in their schools. In this study, three types of school level factors were explored: the ICT infrastructure and resources available, school policies and practices regarding ICT use and teachers’ ICT-using pedagogy.
xxi
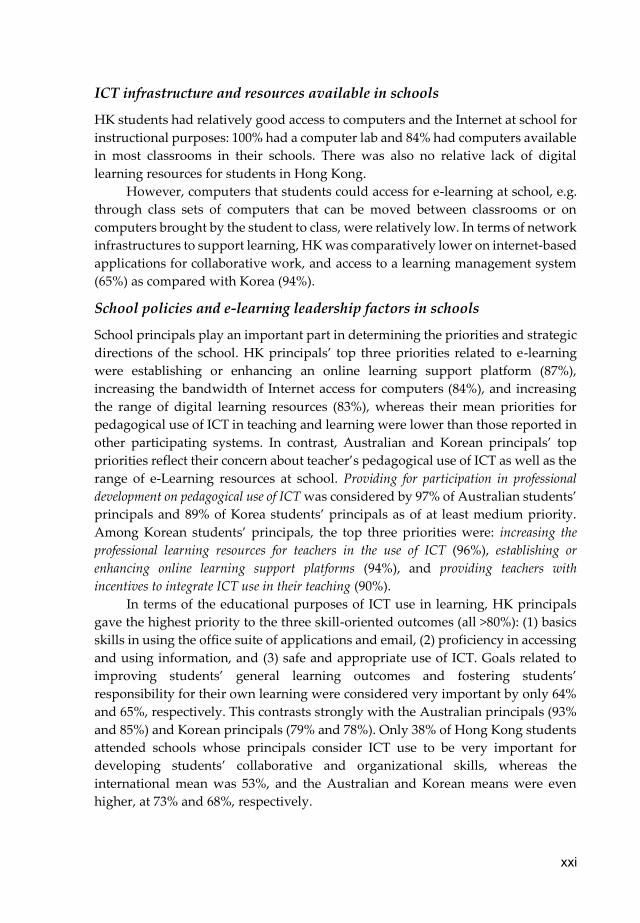
ICT infrastructure and resources available in schools
HK students had relatively good access to computers and the Internet at school for
instructional purposes: 100% had a computer lab and 84% had computers available
in most classrooms in their schools. There was also no relative lack of digital
learning resources for students in Hong Kong.
However, computers that students could access for e-learning at school, e.g.
through class sets of computers that can be moved between classrooms or on
computers brought by the student to class, were relatively low. In terms of network
infrastructures to support learning, HK was comparatively lower on internet-based
applications for collaborative work, and access to a learning management system
(65%) as compared with Korea (94%).
School policies and e-learning leadership factors in schools
School principals play an important part in determining the priorities and strategic
directions of the school. HK principals’ top three priorities related to e-learning
were establishing or enhancing an online learning support platform (87%),
increasing the bandwidth of Internet access for computers (84%), and increasing
the range of digital learning resources (83%), whereas their mean priorities for
pedagogical use of ICT in teaching and learning were lower than those reported in
other participating systems. In contrast, Australian and Korean principals’ top priorities reflect their concern about teacher’s pedagogical use of ICT as well as the range of e-Learning resources at school. Providing for participation in professional development on pedagogical use of ICT was considered by 97% of Australian students’ principals and 89% of Korea students’ principals as of at least medium priority. Among Korean students’ principals, the top three priorities were: increasing the professional learning resources for teachers in the use of ICT (96%), establishing or enhancing online learning support platforms (94%), and providing teachers with incentives to integrate ICT use in their teaching (90%).
In terms of the educational purposes of ICT use in learning, HK principals
gave the highest priority to the three skill-oriented outcomes (all >80%): (1) basics
skills in using the office suite of applications and email, (2) proficiency in accessing
and using information, and (3) safe and appropriate use of ICT. Goals related to
improving students’ general learning outcomes and fostering students’ responsibility for their own learning were considered very important by only 64%
and 65%, respectively. This contrasts strongly with the Australian principals (93%
and 85%) and Korean principals (79% and 78%). Only 38% of Hong Kong students
attended schools whose principals consider ICT use to be very important for
developing students’ collaborative and organizational skills, whereas the
international mean was 53%, and the Australian and Korean means were even
higher, at 73% and 68%, respectively.

xxii
It is thus evident that Hong Kong principals’ views on the role of ICT for
learning and teaching were still focused on traditional outcomes, and gave much
lower priority to ICT use in fostering 21st century skills.
HK principals have moderate to low expectations of teachers’ ICT-related
knowledge and skills, except on their ability to use ICT to communicate with other
staff, at 86%. The highest expectation was on teachers’ ability to integrate ICT into
teaching and learning, at 68%. Only 57% expected their teachers to be able to
collaborate with other teachers via ICT.
The lowest expectations were related to the use of ICT for assessment and
monitoring of students, neither of which had a percentage higher than 30%. In
particular, the percentage of students whose principals expected teachers to be able
to use ICT to develop authentic (real-life) assignments for students was only 16%.
This is very disappointing as bringing authentic contexts into the classroom is one
of the potential strengths that ICT use could offer.
Not all principals would monitor teachers’ ICT use in teaching. In Hong Kong and internationally, the most popular means principals use to monitor teachers’ ICT use in teachers was classroom observations. Another means of monitoring was
through teacher self-reflection.
Internationally, the aspect of ICT implementation that had the highest
proportion of principals taking key responsibility for was implementing ICT-based
approaches in administration, with a mean of 81%. Compared to the international
and Australian means, the percentages of Hong Kong principals taking main
responsibility for the various aspects of ICT management were relatively low,
except for the implementation of ICT-based approaches in administration. In
general, principals were least likely to take main responsibility for ICT
maintenance issues. It is interesting to note that none of the respective percentages
for Korean principals were higher than 25%, indicating that for Korean schools,
most of the ICT-specific management and implementation responsibilities were
devolved to other staff members.
In terms of having measures regarding ICT access and use by students in
school, HK principals were most concerned about ensuring that students would
not access unauthorized or inappropriate sites, and that they would honour
intellectual property rights—100% reported having measures to ensure these
conditions. Internationally, these are also the aspects that a vast majority of
students’ principals reported having implemented relevant measures. HK
principals were least concerned about restricting the total number of hours
students were allowed to sit in front of a computer, with only 33% of students’ principals reported having measures in place regarding this. An even lower
percentage of Australian students’ principals reported having this type of measures in place (18%), whereas the respective percentage for Korea was much
higher, at 64%.

xxiii
Based on the principals’ reporting, the most popular form of ICT-related
professional development activity was courses provided by the school, followed
by informal discussions within groups of teachers as well as discussions on ICT use
as a regular item embedded into staff meetings. In both Hong Kong and Korea, the
most popular professional development activities were courses provided by the
school and observing colleagues using ICT in their teaching. However, the levels
of participation reported by Hong Kong principals were very much lower than
even the international average. This may be one of the reasons for the low levels of
ICT adoption in teaching and student learning reported by teachers in Hong Kong.
The top issues that HK principals indicated as hindrances to their school were
pedagogy related, for example: insufficient time for teachers to implement e-Learning
(59%) is the number one hindrance as perceived by HK principals, followed by
insufficient budget for the needs of ICT implementation (e.g. LMS) (46%) as well as
insufficient qualified technical personnel to support the use of ICT (35%). More than one
third (34%) of HK principals indicated that pressure to score highly on
standardized tests was an obstacle. The data further suggest that lack of hardware
or general ICT skills among teachers were not perceived as big obstacles to e-
learning implementation in their schools by HK principals.
Teacher’s ICT-using Pedagogy
Teachers play the biggest role in determining the learning experiences of students.
One factor that potentially impact on teachers’ use of ICT in their pedagogical
practices is their confidence in the use of ICT. A large majority of HK teachers
surveyed knew how to perform general and some advanced ICT tasks, with
percentages higher than the international average. This stands in stark contrasts to
the teachers’ self-reported competence in ICT use for pedagogically related tasks,
namely monitoring students’ progress (52%), and assessing students’ learning (58%), which were much lower than the corresponding percentages reported by
Australian (respectively 86% and 83%) and Korean (respectively 62% and 82%)
teachers.
HK teachers reported very low usage of ICT by the Secondary 2 students for
learning activities in the classroom, with most of the learning activities surveyed at
only a single digit percentage. The highest percentages recorded were for working
on extended projects (i.e. over several weeks) (12%), and searching for information
on a topic using outside resources (11%). Hong Kong students’ ICT usages in all
types of learning activities were either equal to, or lower than the corresponding
international averages. On the other hand, the corresponding percentages reported
by Australian teachers were generally higher than the international mean, with
often use of ICT reported by more than 30% in three activities: working on
extended projects, submitting completed work for assessment and searching for
information on a topic using outside resources.

xxiv
HK teachers reported a somewhat higher-level use of ICT in their teaching activities as opposed to ICT use by students for learning. However, only one aspect of ICT use by Hong Kong teachers in the classroom is higher than the ICILS international average, namely presenting information through direct class instruction (38%). All other types of ICT usage in teaching activities by Hong Kong teachers were lower than the ICILS international averages by 1% to 8%. The greatest differences between the Hong Kong and ICILS average (8%) were found in two kinds of teacher use of ICT to support students’ collaborative inquiry activities: collaboration among students (8%) and supporting inquiry learning (6%), which are often considered as important pedagogical activities to foster 21st century learning outcomes.
HK teachers also reported much lower emphasis on developing their students’ ICT-based capabilities compared to the international average. The largest gaps are found in teacher’s emphasis on developing student’s ICT-based capabilities for (1) exploring a range of digital resources when searching for information (33% for Hong Kong compared to the international mean of 53%); (2) evaluating the relevance of digital information (36% compared to 52%); and (3) evaluating the credibility of digital information (also 36% compared to 52%). Only two out of the list of ICT-based capabilities were reported as emphasized by more than 50% of Hong Kong teachers, namely, accessing information efficiently (53%) and using computer software to construct digital work products (51%). In contrast, more than 50% of Australian teachers reported giving emphasis to the development of 11 out of the 12 ICT-based capabilities surveyed, and more than 50% of Korean teachers reported giving emphasis to helping their students to develop ICT-based capabilities in 9 out of the 12 surveyed.
HK teachers’ reported usage of ICT for collaboration among fellow teachers is in general lower than the international average. Specifically, only 39% of HK Secondary 2 teachers have collaborated with peers to develop lessons involving use of ICT, compared to the international average of 58%.
Status of e-learning related school level factors in Hong Kong
In summary, the Study reveal that HK principals in general gave relatively lower priority to pedagogical use of ICT, particularly with respect to the use of ICT for developing students’ 21st century skills such as collaborative and organizational skills. HK teachers’ participation in ICT-related professional development activities was very much lower than the corresponding international average. Their reported use of ICT for teaching and learning were also very low. For most of the student learning activities surveyed, less than 10% of teachers reported that their Secondary 2 students often use ICT for those activities. HK teachers also reported low emphasis on developing their students’ CIL capabilities.
xxv
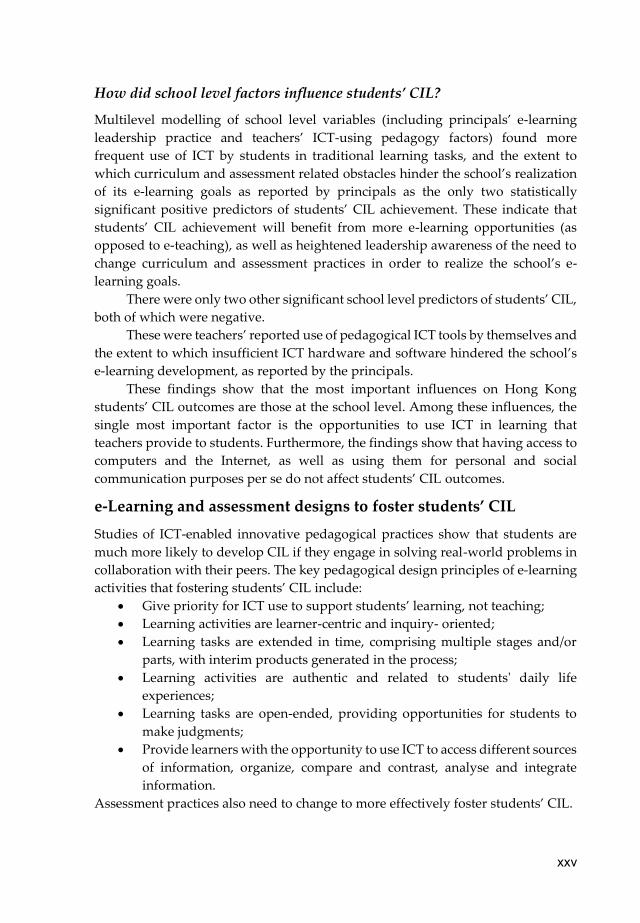
How did school level factors influence students’ CIL?
Multilevel modelling of school level variables (including principals’ e-learning
leadership practice and teachers’ ICT-using pedagogy factors) found more
frequent use of ICT by students in traditional learning tasks, and the extent to
which curriculum and assessment related obstacles hinder the school’s realization
of its e-learning goals as reported by principals as the only two statistically
significant positive predictors of students’ CIL achievement. These indicate that
students’ CIL achievement will benefit from more e-learning opportunities (as
opposed to e-teaching), as well as heightened leadership awareness of the need to
change curriculum and assessment practices in order to realize the school’s e-
learning goals.
There were only two other significant school level predictors of students’ CIL, both of which were negative.
These were teachers’ reported use of pedagogical ICT tools by themselves and
the extent to which insufficient ICT hardware and software hindered the school’s e-learning development, as reported by the principals.
These findings show that the most important influences on Hong Kong
students’ CIL outcomes are those at the school level. Among these influences, the
single most important factor is the opportunities to use ICT in learning that
teachers provide to students. Furthermore, the findings show that having access to
computers and the Internet, as well as using them for personal and social
communication purposes per se do not affect students’ CIL outcomes.
e-Learning and assessment designs to foster students’ CIL
Studies of ICT-enabled innovative pedagogical practices show that students are
much more likely to develop CIL if they engage in solving real-world problems in
collaboration with their peers. The key pedagogical design principles of e-learning
activities that fostering students’ CIL include:
x Give priority for ICT use to support students’ learning, not teaching; x Learning activities are learner-centric and inquiry- oriented;
x Learning tasks are extended in time, comprising multiple stages and/or
parts, with interim products generated in the process;
x Learning activities are authentic and related to students' daily life
experiences;
x Learning tasks are open-ended, providing opportunities for students to
make judgments;
x Provide learners with the opportunity to use ICT to access different sources
of information, organize, compare and contrast, analyse and integrate
information.
Assessment practices also need to change to more effectively foster students’ CIL.

xxvi
Assessment as learning conceptualizes assessment as an integral part of learning and teaching, with students actively involved in this process. Assessment as learning occurs when students reflect on and monitor their own progress to inform their formulation of future learning goals and take responsibility for their own past and future learning. Traditional paper and pencil tests are not suitable for assessment as learning. Assessment rubrics and self-evaluation checklists are two of the most commonly used instruments in performance assessment. Rubrics are essential instruments for implementing Assessment as Learning. These are descriptive scoring tools for rating authentic student work qualitatively. Apart from rubrics, self-evaluation checklists are often used in the context of self- and peer- evaluation. A checklist provides a list of measurable categories and indicators for project, product and performance, allowing students to judge their own or peer’s performance and determine whether they have met the established criteria of a task. The size of a learning unit often limits the complexity of the learning tasks that can be presented to students.
Longer learning units that span days or weeks involving tasks that need to be conducted both in school and at home often provide more opportunities for students to develop higher level CIL outcomes. These often require students to exercise skills in multiple CIL aspects in a meaningful and holistic fashion.
It is desirable for students to be provided with the same technology platform for learning in different subject matter contexts and tasks. It takes time for both teachers and students to get accustomed to the interfaces and functionalities of a new technology, creating additional cognitive and organizational burdens for all involved. This additional effort would be minimized if the same technology were used throughout the course of a student’s learning.
Conclusion
Hong Kong’s participation in the ICILS 2013 Study provided us with a good overview of how Hong Kong students’ proficiency in computer and information literacy and how it compared with their international counterparts. The picture we get from the many different analyses is consistent. Our students’ CIL proficiency compared to all economically developed countries participating in the study is low. This is despite the overall ICT development index as well as the level of ICT provisions in schools in Hong Kong is internationally relatively high. Students’ access to computers and the Internet at home is almost 100%, which also compares extremely well with other participating countries.
Hong Kong has the second highest standard deviation in CIL score (second only to the City of Buenos Aires, Argentina), indicating a very wide spread in students’ CIL proficiency. On the other hand, students’ SES background has amongst the lowest relationship with their CIL scores amongst all the participating countries. This indicates that school factors have major influence on students’ CIL achievement.
xxvii
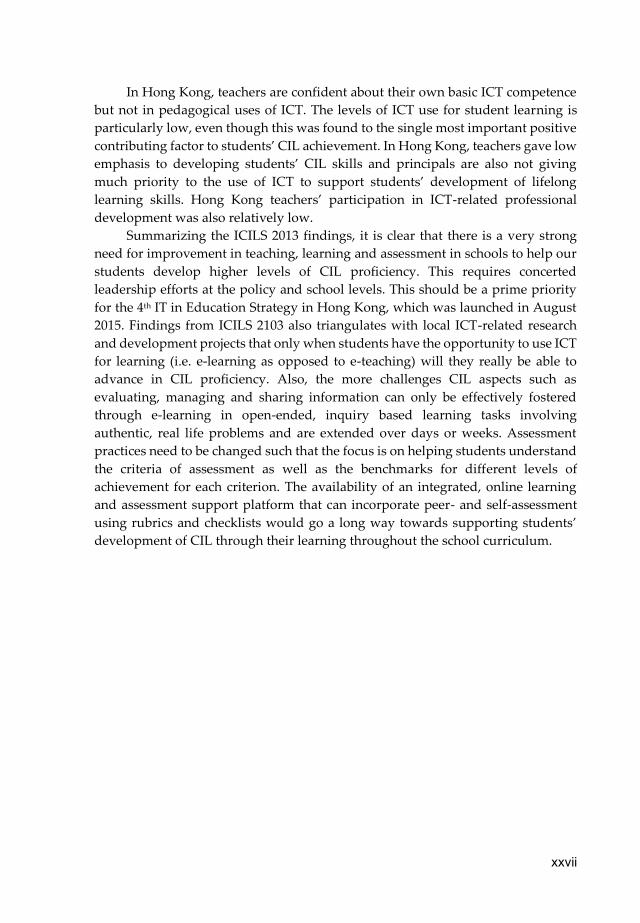
In Hong Kong, teachers are confident about their own basic ICT competence
but not in pedagogical uses of ICT. The levels of ICT use for student learning is
particularly low, even though this was found to the single most important positive
contributing factor to students’ CIL achievement. In Hong Kong, teachers gave low emphasis to developing students’ CIL skills and principals are also not giving much priority to the use of ICT to support students’ development of lifelong learning skills. Hong Kong teachers’ participation in ICT-related professional
development was also relatively low.
Summarizing the ICILS 2013 findings, it is clear that there is a very strong
need for improvement in teaching, learning and assessment in schools to help our
students develop higher levels of CIL proficiency. This requires concerted
leadership efforts at the policy and school levels. This should be a prime priority
for the 4th IT in Education Strategy in Hong Kong, which was launched in August
2015. Findings from ICILS 2103 also triangulates with local ICT-related research
and development projects that only when students have the opportunity to use ICT
for learning (i.e. e-learning as opposed to e-teaching) will they really be able to
advance in CIL proficiency. Also, the more challenges CIL aspects such as
evaluating, managing and sharing information can only be effectively fostered
through e-learning in open-ended, inquiry based learning tasks involving
authentic, real life problems and are extended over days or weeks. Assessment
practices need to be changed such that the focus is on helping students understand
the criteria of assessment as well as the benchmarks for different levels of
achievement for each criterion. The availability of an integrated, online learning
and assessment support platform that can incorporate peer- and self-assessment
using rubrics and checklists would go a long way towards supporting students’ development of CIL through their learning throughout the school curriculum.

1
Chapter 1
Computer & Information Literacy and its Assessment
Serious discussions at the policy level about computer and information literacy (CIL) as an important student learning outcome began to appear in the West in the 1990s. In Hong Kong, around the same time, two policy documents regarding this were also published by Education and Manpower Bureau as part of the Second IT in Education Strategy of the HKSAR government. These policy documents have led to a series of curriculum initiatives to foster students’ CIL and have also raised issues concerning how CIL can actually be assessed. The International Computer and Information Literacy Study (ICILS), which was conducted under the auspices of the International Association for the Evaluation of Educational Achievement (IEA) in 2013, was the first international comparative study that assesses students’ performance in CIL. Hong Kong was among the 21 countries/systems, which
participated in ICILS 2013. The aim of this book is to report on the findings from ICILS 2013, which are of particular relevance to Hong Kong in comparison with its international peers. Students’ learning outcomes can be influenced by personal and family background as well as school and system level factors, which are also explored within the design of the Study. In order that the research findings can be easily understood by
teachers, principals, teacher educators, policy-makers, parents, e-Learning technology providers and anyone who is concerned about student learning in the 21st century, this publication is not structured as a formal research report. Instead, that the focus is to bring in the relevant local and international policy and contextual backgrounds to highlight the key concepts and findings relevant to the education community and the general public. For readers who are interested to learn the specific research methodology and data analyse techniques adopted in the study, they can refer to the ICILS 2013 International Report (Fraillon et al., 2014) and the associated Technical Report (Fraillon et al., 2015).
Figure 1.1 Logo for European Computer Driving Licence Foundation (ECDL)
2
This book is structured around five chapters.
Chapter 1 starts with a brief review of the
historical development of the concepts of CIL
both in an international context and in Hong
Kong. This is followed by a section introducing
respectively the assessment framework adopted
in ICILS 2013, and the assessment design of the
performance test booklets used in the study to
provide coverage for the various CIL aspects of
the framework. Chapter 2 reports on students’ performance in ICILS 2013, with a special focus
on Hong Kong students’ performance, giving a detailed breakdown of their strengthens and
weaknesses in comparison with two selected
high-performing, developed countries,
Australia and Korea. Chapter 3 focuses on
how students’ personal and family background as well as ICT use experience within and outside schools influenced their CIL learning outcomes. The findings
reported in this chapter draws on analyses of the Hong Kong, International,
Australian and Korean data collected through the survey questionnaire
administered to students immediately after they submitted their CIL performance
test. The sampling method and participation rates for students are also explained.
Chapter 4 reports on analyses of the data collected from the teacher and
principal questionnaires to examine how school level factors influence students’ CIL outcomes. A brief introduction of the principles underpinning the design of
the questionnaires and the sampling methods for the principal and teacher
questionnaires is also reported.
As a main objective of this Study is to help contribute to improving students’ CIL, the core focus of Chapter 5 is to recommend and describe learning and
assessment designs that will foster students’ CIL. The designs described in this
chapter are selected from case studies conducted by CITE in past and on-going
research projects on e-Learning in Hong Kong schools.
1.1 Computer and Information Literacy: a Brief History
Computer and Information Literacy actually comprises two interrelated types of
literacy: Computer Literacy (CL) and Information Literacy (IL). CL is the original
term used in this field. The European Computer Driving Licence (ECDL) launched
in 1995 is among the earliest certification programs of its kind, which focuses on
individuals’ technical skills in using basic applications, such as Office and email, as well as their basic knowledge about computers and information technology (IT)
security.
Figure 1.2 National Education Technology Standards (NETS), 1998
3
Underpinning this certification programme is the idea that the possession of basic computer skills is just as necessary in a digital society as being literate in reading and writing.
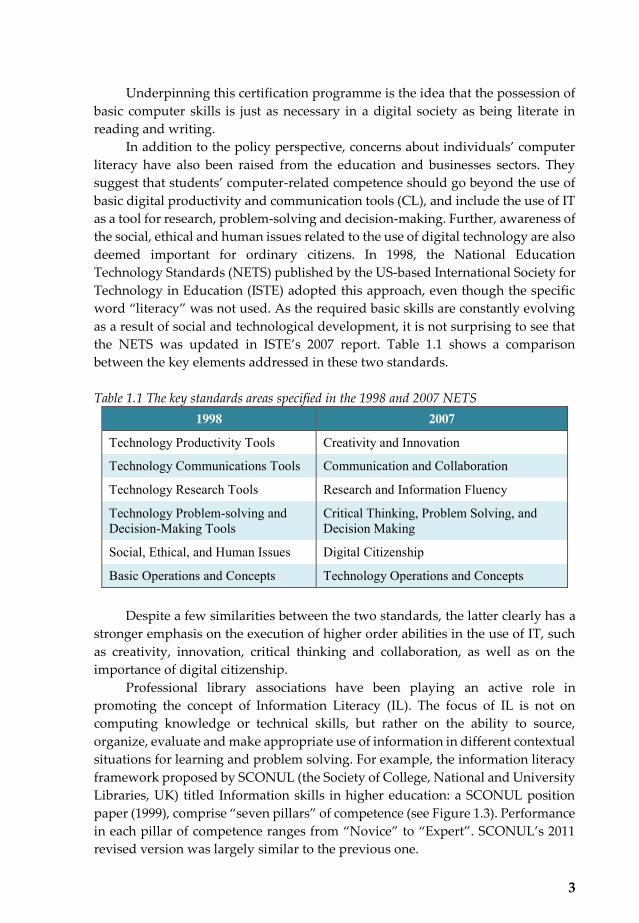
In addition to the policy perspective, concerns about individuals’ computer literacy have also been raised from the education and businesses sectors. They suggest that students’ computer-related competence should go beyond the use of basic digital productivity and communication tools (CL), and include the use of IT as a tool for research, problem-solving and decision-making. Further, awareness of the social, ethical and human issues related to the use of digital technology are also deemed important for ordinary citizens. In 1998, the National Education Technology Standards (NETS) published by the US-based International Society for Technology in Education (ISTE) adopted this approach, even though the specific word “literacy” was not used. As the required basic skills are constantly evolving as a result of social and technological development, it is not surprising to see that the NETS was updated in ISTE’s 2007 report. Table 1.1 shows a comparison between the key elements addressed in these two standards.
Table 1.1 The key standards areas specified in the 1998 and 2007 NETS
1998 2007
Technology Productivity Tools Creativity and Innovation
Technology Communications Tools Communication and Collaboration
Technology Research Tools Research and Information Fluency
Technology Problem-solving and Decision-Making Tools
Critical Thinking, Problem Solving, and Decision Making
Social, Ethical, and Human Issues Digital Citizenship
Basic Operations and Concepts Technology Operations and Concepts
Despite a few similarities between the two standards, the latter clearly has a
stronger emphasis on the execution of higher order abilities in the use of IT, such as creativity, innovation, critical thinking and collaboration, as well as on the importance of digital citizenship.
Professional library associations have been playing an active role in promoting the concept of Information Literacy (IL). The focus of IL is not on computing knowledge or technical skills, but rather on the ability to source, organize, evaluate and make appropriate use of information in different contextual situations for learning and problem solving. For example, the information literacy framework proposed by SCONUL (the Society of College, National and University Libraries, UK) titled Information skills in higher education: a SCONUL position paper (1999), comprise “seven pillars” of competence (see Figure 1.3). Performance in each pillar of competence ranges from “Novice” to “Expert”. SCONUL’s 2011 revised version was largely similar to the previous one.

4
The only difference is in the naming of the seven pillars, which was shortened
to one word per pillar for easier
memorisation: identify scope, plan,
gather, evaluate, manage and present.
The global interest in information
literacy education was spurred by the
growing recognition that students need
to be prepared for lifelong learning to
participate effectively in a society in
which information and knowledge are
increasing at an exponential rate.
In the IL Framework published by
the Australian and New Zealand
Institute for Information Literacy, IL is
conceptualized as personal
empowerment (Bundy 2004) and
depicted as a subset of independent
learning skills nested within lifelong
learning skills (see Figure 1.4).
1.2 Computer and Information Literacy in the Hong Kong School Curriculum
In Hong Kong, Computer Studies was introduced into the upper secondary school
curriculum as an elective subject in 1982. Following the launch of the first
Information Technology in Education Strategy (EMB, 1998). The Information
Technology Learning Targets (ITLT) were put forward in 2000 by a working group
formed under the Curriculum Development Institute. The ITLT documents the
knowledge, skills and attitudes that students are expected to obtain at five different
key stages in using IT tools respectively.
(in SCONUL (2004), p. 4) Figure 1.3 The seven pillars of information literacy according to SCONUL.
Figure 1.4 Relationship of IL to lifelong learning (Bundy, 2004, p. 5)
5
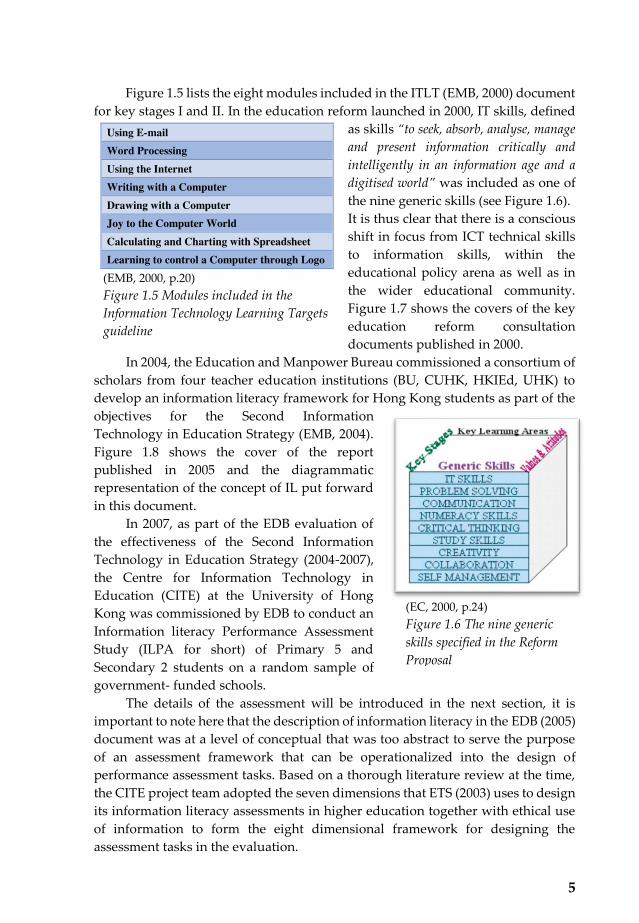
Figure 1.5 lists the eight modules included in the ITLT (EMB, 2000) document for key stages I and II. In the education reform launched in 2000, IT skills, defined
as skills “to seek, absorb, analyse, manage
and present information critically and intelligently in an information age and a digitised world” was included as one of the nine generic skills (see Figure 1.6). It is thus clear that there is a conscious shift in focus from ICT technical skills to information skills, within the educational policy arena as well as in the wider educational community. Figure 1.7 shows the covers of the key education reform consultation documents published in 2000.
In 2004, the Education and Manpower Bureau commissioned a consortium of scholars from four teacher education institutions (BU, CUHK, HKIEd, UHK) to develop an information literacy framework for Hong Kong students as part of the objectives for the Second Information Technology in Education Strategy (EMB, 2004). Figure 1.8 shows the cover of the report published in 2005 and the diagrammatic representation of the concept of IL put forward in this document.
In 2007, as part of the EDB evaluation of the effectiveness of the Second Information Technology in Education Strategy (2004-2007), the Centre for Information Technology in Education (CITE) at the University of Hong Kong was commissioned by EDB to conduct an Information literacy Performance Assessment Study (ILPA for short) of Primary 5 and Secondary 2 students on a random sample of government- funded schools.
The details of the assessment will be introduced in the next section, it is important to note here that the description of information literacy in the EDB (2005) document was at a level of conceptual that was too abstract to serve the purpose of an assessment framework that can be operationalized into the design of performance assessment tasks. Based on a thorough literature review at the time, the CITE project team adopted the seven dimensions that ETS (2003) uses to design its information literacy assessments in higher education together with ethical use of information to form the eight dimensional framework for designing the assessment tasks in the evaluation.
(EC, 2000, p.24) Figure 1.6 The nine generic skills specified in the Reform Proposal
(EMB, 2000, p.20) Figure 1.5 Modules included in the Information Technology Learning Targets guideline
Using E-mail Word Processing Using the Internet Writing with a Computer Drawing with a Computer Joy to the Computer World Calculating and Charting with Spreadsheet Learning to control a Computer through Logo

6
Figure 1.7 Consultation documents published by the Education Commission in 2000 with a focus on preparing students for lifelong and lifewide learning
Figure 1.8 The Information Literacy Framework released by the EMB in 2005 and the graphical representation for information literacy used in the document
The results of the assessment (Law, Lee and Yuen, 2010) showed generally
unsatisfactory performance of the assessed students; and large disparities in students’ achievement across schools (Law et al. 2007).
In view of these findings, the EDB further commissioned CITE to conduct a one year design-based research and development project with primary and secondary school teachers, in order to develop (1) curriculum designs that promote students’ IL and (2) tools for assessing students’ IL outcomes (http://iltools.cite.hku.hk/ referred to as ILTOOLS for short).

7
The students’ IL framework (EMB, 2005) recommends that “IL assessment should be formative and developmental […] [and should be] designed for developing the capability of learners in learning different subject disciplines …” (p. 18). As such, the ILTOOLS project was commissioned to focus on IL within the Science KLA.
In order to support easy operationalization of the EMB (2005) IL framework for curriculum and assessment integration, the CITE project team crystalized students’ IL into an eight-element framework used in ILTOOLS (define, access, manage, integrate, create, communicate, evaluate and ethical use) for working with information, and provided explicit links between this framework and the 12 inquiry skills suggested in the Science curriculum guide (EDB 2006). Figure 1.9 shows a graphical representation of the IL framework and the scientific inquiry skills framework produced by the ILTOOLS team.
(http://iltools.cite.hku.hk/). Figure 1.9 Graphical representations of the Information Literacy and Scientific Inquiry frameworks used by the ILTOOLS team
1.3 Assessing Computer and Information Literacy
Assessing computer and information literacy often involve test takers to work in simulated environments. As the Internet is becoming the major source of information, assessing test takers’ operation proficiency on a simulated Internet environment is one of the major means of CIL assessment.

8
In the case of the European Computer Driving Licence, which focuses on
technical skills in basic computer applications, testing is arranged on a module
basis. Testing is conducted on a simulated Windows/Microsoft Office
environment, which records mouse movements and keystrokes and reports the
results of the test immediately upon test completion.
1.3.1 European Computer Driving Licence
Since 2005, the Australian National Assessment Program has been conducting ICT
literacy assessment on a sample of Year 6 and Year 10 students every three years
(referred to as the NAP-ICT literacy
assessment). In this assessment, ICT
literacy is considered as a generic ability
of the students (i.e. independent of the
subject domain). Three strands are
included in this assessment framework,
namely, working with information,
creating and sharing information, and
using ICT responsibly. These strands are
assessed through six processes as
depicted in Figure 1.10. The NAP-ICT
literacy assessment was delivered in
schools via online modules supported by
purpose-built software applications. The
assessment modules usually comprise a
sequence of simulated tasks in a variety
of response formats, such as multiple choice, drag and drop, execution of simple
software commands, short constructed text responses and construction of
information products such as a poster. The NAP-ICT literacy assessment
instruments were designed and developed by the Australian Council for
Educational Research (ACER), which is also the team that took responsibility for
designing the ICILS assessment instrument. Hence, there is great similarity
between the NAP-ICT literacy assessment and the ICILS assessment. The latter will
be described in the next section.
As aforementioned, information literacy, as a generic ability, could enhance
students’ learning outcomes in different subject areas according to the IL framework in Hong Kong. The assessment of IL, therefore, can be subject
dependent. However, there are no well-known examples of performance
assessment of IL in subject-based contexts. The Program for International Student
Assessment (PISA) conducted by OECD introduced computer-based assessment
(CBA) as an additional option for participating countries since 2009. In PISA 2012,
countries could opt to participate in CBA of problem-solving, mathematics and
reading literacy.
Figure 1.10 The Australian ICT Literacy Assessment framework (ACARA, 2015, p.4)

9
However, the PISA CBA does not assess subject-specific information literacy.
It only assessed students’ ability to accomplish subject-based tasks, using
computers as the medium instead of paper. Exactly the same set of competence is
being assessed in the paper-based and computer-based assessments of Reading
and Mathematics. For problem solving, the assessment framework of CBA is
essentially the same as that of paper-based assessment, except that for CBA the
nature of the problem situation can be interactive (i.e. not all information is
disclosed and the student has to uncover some of the information by exploring,
such as clicking particular buttons).
1.3.2 Computer-Based Assessments in PISA
As mentioned in the previous section, the assessment of students’ IL was conducted by the CITE team IN 2007 as part of the evaluation of the effectiveness
of the Second IT in Education Strategy in Hong Kong (Law et al., 2007). The goal
and design of the study, Information Literacy Performance Assessment (ILPA),
followed ETS’s (2003) IL framework and assessed IL in both generic and subject-specific problem solving contexts. The evaluation was carried out at two grade
levels. At the primary 5 level, students were assessed on their generic IL skills and
their ability to use IL tools to solve subject-specific problems in Chinese Language
and Mathematics that they would otherwise not be able to do based on the P. 5
curriculum for these two subjects. At the secondary 2 level, the evaluation included
assessing students’ generic IL skills and their ability to use IL tools to solve subject- specific problems in Chinese Language and Science that are beyond the respective
secondary 2 curriculum requirements. Hence, three tests were administered at each
grade level. The same generic IL test was administered to Primary 5 and Secondary
2 students in order to compare the generic skills levels for these two levels of
students. As a result, a total of five different tests were developed in the ILPA
Study.
Figures 1.11 to 1.13 present examples of the questions in ILPA, which were
used to assess students’ ability to integrate information in the generic mathematics
and science tests respectively. Integrate information relates to the ability to interpret
and represent information by using ICT tools to synthesize, summarize, compare
and contrast information from multiple sources. As shown by the examples,
although the three questions were all designed to assess students’ ability to integrate information, they differ in the kinds of tools adopted and the
understanding needed to complete the question.
The question shown in Figure 1.11 asks students to create a PowerPoint
presentation on a one-day trip in Hong Kong that includes two scenic spots
suitable. Students can use the Internet to search for information about the
appropriate places to visit, their opening hours, traffic routes, and descriptions
about the scenic spots in those places.

10
Figure 1.11 An item in the Primary 5 and Secondary 2 ILPA generic test that assesses the ‘integrate’ dimension
In the ILPA Mathematics test, the question assessing students’ ability to
integrate information for mathematical problem solving was related to geometry (see Figure 1.12). Students were asked to work out the maximum area that can be encompassed by a rectangle with a fixed perimeter.
Students were given a Java applet to explore the areas inside differently configured rectangles with the same perimeter. With the applet, Primary 5 students should be able to arrive at the optimal configuration (a square) if they can record the areas when the length of the rectangle is systematically varied. This problem can only be solved analytically by using calculus, which would prove challenging even for senior secondary students.
In this item, students need to create a PowerPoint presen tation on a PLAN for a day trip for the elderly to visit in Hong Kong. They were assessed on their ability to synthesize, compare and contrast information as well as summarizing information from muliple digital sources.

11
Figure 1.12 An item in the Primary 5 ILPA mathematics test that assesses the ‘integrate’
dimension In the ILPA Science test, the task assess Secondary 2 students’ ability to
integrate information in scientific problem solving was about population dynamics in pond ecosystems.
In the question, shown in Figure 1.13, students were asked to use a visual dynamic simulation tool to explore and observe how adding a foreign species to a local pond will affect the population size of different species living in the pond ecosystem over a given period of time. With the simulation tool, students can observe changes in the number of species through iconic visualization of the species in the pond as well as through the line graphs showing the actual numbers of each species over time. Originally, there were four species living in the simulated pond ecosystem: water plants, shrimps, fish and ducks.
In this item, students can manipulate an interactive applet to observe changes in the area of a rectangle with a fixed length perimeter using the applet. Students’ performance is assessed on the comprehensiveness of the students’ manipulations and observations, and the correctness of the students’ interpretations.

12
In this task, students were provided with a dynamic simulation tool to explore the effect of adding red shrimps (a foreign species) to the local pond ecosystem. Students were assessed on their ability to make observations of the critical changes in population through both the iconic grid and the graph (see figure below) and their ability to make appropriate interpretation and conclusion.
This is the screen of the simulation pond ecosystem for students to conduct “ecological experiments”. The upper part of the main screen shows the changes in the population size of the different species in the pond in iconic form, and the lower section shows the same informa- tion in graphic format. Instruction is given in the lower left-hand corner.
Figure 1.13 Screen dumps for a task in the Secondary 2 ILPA Science test that assesses the ‘integrate’ dimension.

13
At the beginning of the task, students were asked to observe and describe how the numbers of different species change over 200 days. Then “a visitor brought 20 red shrimps to add to the pond. He thinks this will increase the biodiversity of this pond ecology.” At this point, 20 red shrimps also appear in the simulated ponds.
The students were then asked to observe the changes over another 600 days. They could also click on the species icons on the upper left hand panel to learn about their behavior. They were then asked to answer four questions, three of which pertain to integrating information, as follows:
Why did most (or all) of the shrimps die? Why did most (or all) of the fish die? What are the possible impacts of adding a foreign species to an ecosystem?
The topic of this task is the concept of competition among species that share the same niche. Hence, the introduction of foreign species to an indigenous ecology may lead to the extinction of not only the species they compete with, but also those that feed on the local species that are driven to extinction. This is a very challenging task even for high schools and university students. Using the simulation tool, students would be able to collate their observation of the relations in trend data across the species and to point out that the indigenous shrimps slowly die off as a result of the increase of the red shrimps. They found that the fish, which feed on the indigenous shrimps (but not the red shrimps), actually went extinct even before the indigenous shrimps. Hence, just as in the Mathematics task above, in this example, by using the simulation tool, Secondary 2 students with the requisite IL skills were able to learn about some important concepts in science, which would otherwise be inaccessible.
The above three example assessment tasks show that different kinds of items need to be designed to assess students’ ability to integrate information as a generic IL skill or as IL skills in specific subject learning contexts. Similarly, each of the ILPA generic and subject specific IL tests (five different tests were designed and administered in the Study as described earlier) contain items that assessed each of the seven IL dimensions, which include define, access, manage, create, communicate and evaluate, in addition to integrate, which is already described. Findings from ILPA show that when students’ IL performance in the different tests is correlated, students’ prior learning experience with subject-specific tools for learning purposes matters (Law et al., 2007).
1.4 Definition of CIL in ICILS
ICILS 2013 only assesses CIL as a generic skill, and does not make any explicit assumption about whether performance in IL is subject matter dependent. The assessment framework used in ICILS measures CIL according to two broad conceptual categories named strands: collecting and managing information and

14
producing and exchanging information (Fraillon, et. al., 2014). Each strand is further categorized into skills categories labelled as aspects. Table 1.2 provides a brief description of the CIL strands and aspects. Table 1.2 The Computer and Information Literacy Framework adopted in ICILS
CIL strand & aspect Assessment focus Strand 1: collecting and managing information
1.1 Knowing about and under- standing computer use
Basic technical knowledge and skills needed to work with information using computers.
1.2 Accessing and evaluating information
Ability to find, retrieve, and make judgments about the relevance, integrity, and usefulness of computer-based information.
1.3 Managing information Ability to adopt and adapt schemes of information classification and organization to arrange and store information for efficient use and/or re-use.
Strand 2: Producing and exchanging information
2.1 Transforming information
Ability to use computers to vary the presentation of information to achieve clarity suitable for specific audiences and purposes.
2.2 Creating information Ability to use computers to design and generate new or derived information products for specific audiences and purposes.
2.3 Sharing information Ability to use computers to communicate and exchange information with others.
2.4 Using information safely and securely
Understanding of the legal and ethical issues of digital communication from the perspectives of both information producer and consumer.
If we compare the above CIL assessment framework with the assessment
framework adopted in ILPA, which was based on the IL framework for students in Hong Kong published by the EDB (EMB, 2005), we can see that they are in fact very similar. Table 1.3 provides a comparison across the two assessment frameworks.
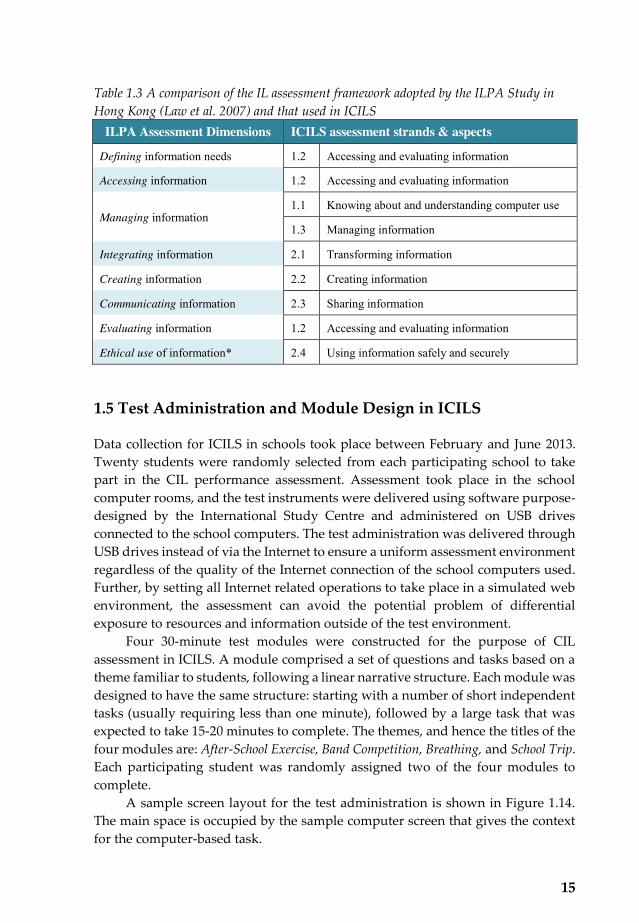
15
Table 1.3 A comparison of the IL assessment framework adopted by the ILPA Study in
Hong Kong (Law et al. 2007) and that used in ICILS
ILPA Assessment Dimensions ICILS assessment strands & aspects
Defining information needs 1.2 Accessing and evaluating information
Accessing information 1.2 Accessing and evaluating information
Managing information 1.1 Knowing about and understanding computer use
1.3 Managing information
Integrating information 2.1 Transforming information
Creating information 2.2 Creating information
Communicating information 2.3 Sharing information
Evaluating information 1.2 Accessing and evaluating information
Ethical use of information* 2.4 Using information safely and securely
1.5 Test Administration and Module Design in ICILS
Data collection for ICILS in schools took place between February and June 2013.
Twenty students were randomly selected from each participating school to take
part in the CIL performance assessment. Assessment took place in the school
computer rooms, and the test instruments were delivered using software purpose-
designed by the International Study Centre and administered on USB drives
connected to the school computers. The test administration was delivered through
USB drives instead of via the Internet to ensure a uniform assessment environment
regardless of the quality of the Internet connection of the school computers used.
Further, by setting all Internet related operations to take place in a simulated web
environment, the assessment can avoid the potential problem of differential
exposure to resources and information outside of the test environment.
Four 30-minute test modules were constructed for the purpose of CIL
assessment in ICILS. A module comprised a set of questions and tasks based on a
theme familiar to students, following a linear narrative structure. Each module was
designed to have the same structure: starting with a number of short independent
tasks (usually requiring less than one minute), followed by a large task that was
expected to take 15-20 minutes to complete. The themes, and hence the titles of the
four modules are: After-School Exercise, Band Competition, Breathing, and School Trip.
Each participating student was randomly assigned two of the four modules to
complete.
A sample screen layout for the test administration is shown in Figure 1.14.
The main space is occupied by the sample computer screen that gives the context
for the computer-based task.

16
The bottom part of the screen gives instructions on what the student is required to do. The narrow upper right panel gives a visual indication of how many tasks the student has completed (red boxes) relative to the entire set of tasks (green boxes).
Figure 1.14 A sample screen in an ICILS test module showing the functions for different sections of the screen
There are two item formats in the short tasks found in the ICILS test modules:
close-ended and open-ended. Responses to close-ended short tasks include multiple choice and test environment operations (i.e. mouse clicks to carry out certain tasks in the simulated test environment), which were recorded and scored automatically. Open-ended short tasks required students to enter their responses in their own words, and were scored by trained local expert scorers according to the scoring rubric. Slightly more than half of the score points were allocated to the satisfactory completion of the large task for each of the modules. The work submitted for the large tasks were scored according to the scoring criteria, which were presented to the students at the start of the large task, and remain accessible throughout the duration of the task. After-School Exercise, one of the four assessment modules of ICILS, is made public and a computer-based demonstration can be accessed at http://www.iea.nl/icils_2013_example_module.html.

17
In order to illustrate the structure of the test modules, a summary of the short tasks and large task involved in the After-School Exercise module are described here. Table 1.4 gives a brief description of the short tasks, responses required and the assessed aspect according to the CIL framework.
Table 1.4 Overview of the short tasks in the After-School Exercise module Task no. Description Response type Assessed
aspect
1 Given a sample email, identify the recipients. MC*, tick all that apply 2.3
2 Follow the URL given in plain text in the email message to access a site.
Copy & paste URL to task bar of simulated web 1.1
3
In creating a user account on a public website, identify which personal information is most risky to include in a public profile.
MC*, select one. 2.4
4 Given an email alert on the simulated web, open the email via the hyperlink.
Click the hyperlink on the screen. 1.1
5
You received an email that tries to trick you into giving your password to the sender (phishing email). Identify the suspicious feature in the sender address.
Type explanation that identifies the suspicious domain name.
2.4
6 Based on the email message in Task 5, identify the suspicious feature in the greeting.
Explanation: there is no personal identifier. 2.4
7 Based on the email message in Task 5, identify the suspicious feature in the password reset URL link.
Explanation: the URL is not the correct one. 2.4
8 Explain one problem that may result from making one’s email address publicly available.
Explanation: unwanted email, lose privacy 2.4
9
Given a document on a social networking site, make use of the sharing settings to give “can edit” access to a specified person
Use the sharing function to add new user and set access right to “can edit”.
1.1
* MC refers to multiple choice objective type questions. In this test module, students were asked to design a poster to advertise the
After-School Exercise program and attract fellow students to participate. The exercise program should take about 30 minutes and should be suitable for students over the age of 12. The students had to select a suitable exercise by visiting the simulated websites provided.
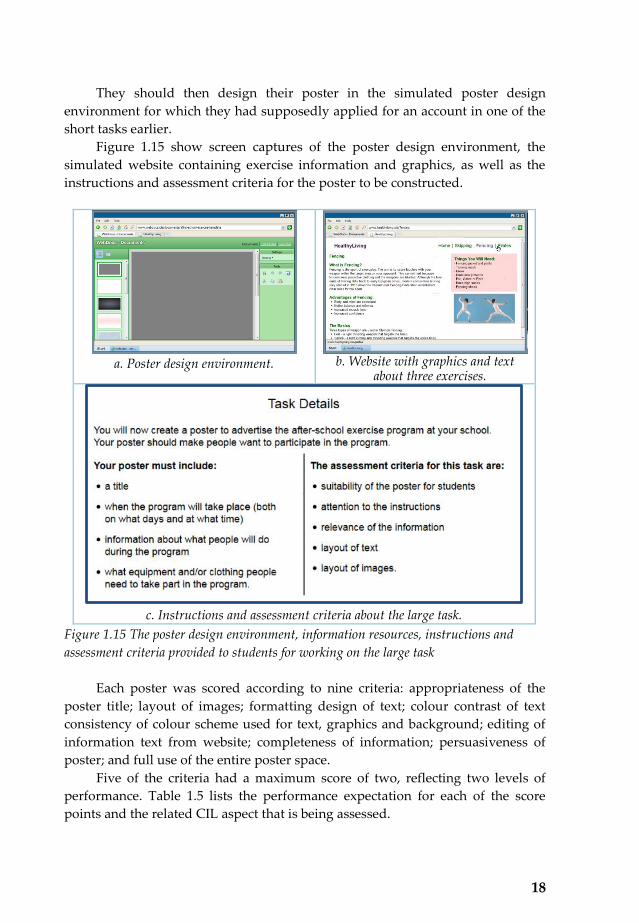
18
They should then design their poster in the simulated poster design environment for which they had supposedly applied for an account in one of the short tasks earlier.
Figure 1.15 show screen captures of the poster design environment, the simulated website containing exercise information and graphics, as well as the instructions and assessment criteria for the poster to be constructed.
a. Poster design environment.
b. Website with graphics and text
about three exercises.
c. Instructions and assessment criteria about the large task.
Figure 1.15 The poster design environment, information resources, instructions and assessment criteria provided to students for working on the large task
Each poster was scored according to nine criteria: appropriateness of the
poster title; layout of images; formatting design of text; colour contrast of text consistency of colour scheme used for text, graphics and background; editing of information text from website; completeness of information; persuasiveness of poster; and full use of the entire poster space.
Five of the criteria had a maximum score of two, reflecting two levels of performance. Table 1.5 lists the performance expectation for each of the score points and the related CIL aspect that is being assessed.

19
Table 1.5 Summary of the performance expectation and associated CIL aspect for each of the score point criteria in the After-School Exercise long task module
Criterion Score/ max. score
Performance expectation Assessed aspect
1 Title design 1/2 A relevant title has been added and placed in a
prominent position. 2.2
2/2 A relevant title has been added and formatted to make its role clear. 2.1
2 Image layout 1/1 One or more images are well aligned with the other elements on the page and appropriately sized. 2.2
3 Text layout & formatting
1/2 Formatting tools have been used to some degree to show the role of the different text elements. 2.2
2/2 Formatting tools have been used consistently throughout the poster to show the role of the different text elements.
2.2
4 Colour contrast 1/2 The text mostly contrasts sufficiently with the
background to support reading. 2.2
2/2 There is sufficient contrast to enable all text to be seen and read easily. 2.1
5 Color consistency 1/1 The poster shows evidence of planning regarding the use of color to denote the role of the text, background, and images in the poster.
2.3
6 Information adaptation
1/2 Some useful information has been copied from the resources and edited to improve ease of comprehension and relevance.
2.3
2/2 The relevant key points from the resources have been rephrased using student's own words. 2.3
7 Information completeness
1/2 Two of the three required pieces of information about the program (when, where, and what equip- ment is required) have been included in the poster.
1.2
2/2 All required information about the program (when, where, and what equipment is required) has been included in the poster.
1.2
8 Persuasiveness 1/1 Uses some emotive or pesuasive language to make the program appealing to readers. 2.1
9 Use of full page 1/1 Uses full page when creating poster 2.1
Except for the two criteria connected with colour use, which were machine
scored, scoring of the posters created by students was carried out by locally trained expert scorers according to the scoring rubrics, similar to the case with the open-ended short tasks.
20
1.6 Summary
This chapter has provided a historical overview of the development of the key concepts of CIL both in an international context and in Hong Kong. They are computer literacy, information literacy, and computer and information literacy. The CIL framework used in the assessment design in ICILS is similar to the one used in the Hong Kong ILPA Study, which was developed based on the IL framework published by the US Educational Testing Service (ETS. 2003).
While there are several survey instruments designed to gather information that may reflect an individual’s CIL, this chapter focused only on those that involve computer-based performance assessment of CIL. We expressly differentiated general computer-based performance assessments (e.g. CBA in the PISA studies) from those with particular focus on CIL (such as ICILS or ILPA). Further, based on the IL frameworks published by well-known library associations and the students’ IL framework published by the EDB in 2005, we pointed out that IL should not be viewed only as a generic skill, but also as a skill that supports learning in different disciplinary areas. ICILS assesses CIL only as a generic skill, although it is conceivable that assessment of IL can be conducted both as a generic skill in general problem solving and in subject-specific learning contexts.
The ICILS test design gave a stronger emphasis on Strand 2 aspects, which were assessed through a large task set within a real-life context familiar to students. Machine scoring was limited to close-ended short tasks that require multiple-choice answers or test environment operations, and scoring of constructed artefacts with reference to colour contrasts. The majority of the tasks were scored by trained human experts based on set criteria. The quality of scoring was ensured through inter-coder reliability check on doubled scored samples.

21
Chapter 2
Hong Kong Students’ Performance in ICILS
A total of 21 countries and educational systems participated in ICILS 2013. These include, besides Hong Kong, Australia, the City of Buenos Aires (Argentina), Chile, Croatia, the Czech Republic, Denmark, Germany, Korea, Lithuania, the Netherlands, Norway, Newfoundland and Labrador (Canada), Ontario (Canada), Poland, the Russian Federation, the Slovak Republic, Slovenia, Switzerland, Thailand, and Turkey. The student population for ICILS was defined as students in Grade 8, provided that the average age of the students was at least 13.5 at the time when the assessment was carried out. If the average age of Grade 8 students was below 13.5, Grade 9 students would then become the targeted population. Norway was the only country that had Grade 9 students tested in ICILS 2013. In Hong Kong, Secondary Two was the targeted student population for the Study.
In order to provide the necessary background for understanding and interpretation of Hong Kong students’ performance in ICILS, this chapter begins with a brief introduction of the sampling method and criteria of ICILS. This is followed by an illustration of how the CIL scores were computed and linked to different levels of CIL proficiency. Next, the CIL scores and proficiency profiles of all participating systems will be reported, together with an in-depth analysis of the strengths and weaknesses in Hong Kong students’ CIL performance. For reference and comparison purposes, we also analyse and report on the results of Australia and Korea, which have a similar level of economic and social development as Hong Kong.
2.1 Sampling Method and Participation Rates
As mentioned in Chapter 1, the targeted student population in ICILS is Grade 8, which is equivalent to Secondary 2 in Hong Kong. Student sampling was conducted in two stages. During the first stage of sampling, 150 schools1 were randomly sampled using PPS procedures (probability proportional to size as measured by the number of students enrolled in a school).
1 The number of schools required in the sample to achieve the necessary statistical precision were estimated on the basis of national characteristics, and ranged from 138 to 318 across countries. Countries were asked to plan for a minimum sample of 150 schools, which was adopted as the sample size in Hong Kong.

22
Twenty students were then randomly sampled from all students enrolled in the targeted grade in each sampled school. In schools with fewer than 20 students in Grade 8, all students were invited to participate. During the sampling process, replacement schools with sizes closest to the sampled school were also sampled to serve as replacements when the sampled school refused to participate.
The participation rates required for each country were 85% of the selected schools and 85% of the selected students within the participating schools, or a weighted overall participation of 75%.
In Hong Kong, 118 schools participated in the student performance assessment and survey, giving a weighted school participation rate of 77%. Within the participating schools, a total of 2089 students participated in the online performance assessment, giving a weighted student participation rate of 89.1%. The weighted overall student participation rate was computed to be 68.6%, which was below the 75% required by IEA for the results to be considered as meeting the statistical precision required for international comparison of students’ achievement.
Hence, the Hong Kong results are listed in the international report under the category “countries not meeting sample requirements”, alongside with Denmark, Netherlands and Switzerland.
2.2 Computation of CIL Scores and Countries’ Performance
The four test modules comprise a total of 62 discrete questions and tasks, with a total of 81 score points. As introduced in Section 1.5, only a limited set of tasks was machine scored, and the remainder were scored by trained expert scorers according to set criteria. Just under half of the score points were derived from the short tasks. The test modules did not give the same emphasis to each of the seven aspects in the assessment framework (described in section 1.4). Instead, about twice as many score points were assigned to Strand 2 (producing and exchanging information) as compared to Strand 1 (collecting and managing information). The first three aspects in Strand 2 were primarily assessed through the large tasks.
The allocation of score points to the aspects and strands in the framework is presented in Table 2.1. The established practice in all IEA studies of student achievement is to use Rasch IRT (item response theory, Rasch, 1960) to construct the achievement scale with a mean of 500 and a standard deviation of 100.
The same process was applied to compute the cognitive scale of CIL scores with a mean of 500 and a standard deviation of 100, based on students’ performance data on the 62 questions and tasks in the four modules and equally weighted national samples.
As each student was randomly assigned one of the twelve possible combinations of two out of the four modules (the same two modules presented with a different order of appearance was considered as a different combination in order to control for the influence of module sequence on difficulty), plausible value
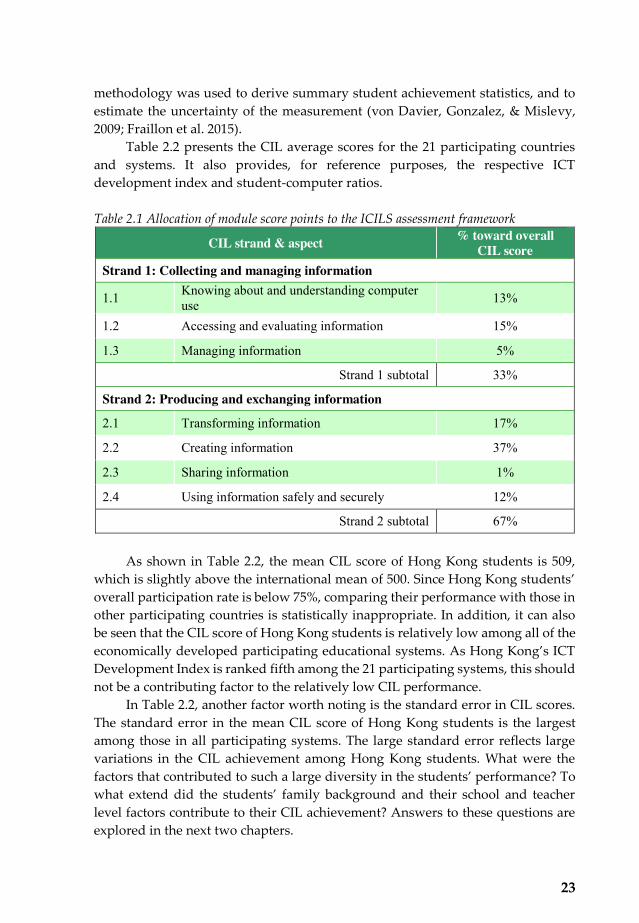
23
methodology was used to derive summary student achievement statistics, and to estimate the uncertainty of the measurement (von Davier, Gonzalez, & Mislevy, 2009; Fraillon et al. 2015).
Table 2.2 presents the CIL average scores for the 21 participating countries and systems. It also provides, for reference purposes, the respective ICT development index and student-computer ratios. Table 2.1 Allocation of module score points to the ICILS assessment framework
CIL strand & aspect % toward overall CIL score
Strand 1: Collecting and managing information
1.1 Knowing about and understanding computer use 13%
1.2 Accessing and evaluating information 15%
1.3 Managing information 5%
Strand 1 subtotal 33%
Strand 2: Producing and exchanging information
2.1 Transforming information 17%
2.2 Creating information 37%
2.3 Sharing information 1%
2.4 Using information safely and securely 12%
Strand 2 subtotal 67%
As shown in Table 2.2, the mean CIL score of Hong Kong students is 509,
which is slightly above the international mean of 500. Since Hong Kong students’ overall participation rate is below 75%, comparing their performance with those in other participating countries is statistically inappropriate. In addition, it can also be seen that the CIL score of Hong Kong students is relatively low among all of the economically developed participating educational systems. As Hong Kong’s ICT Development Index is ranked fifth among the 21 participating systems, this should not be a contributing factor to the relatively low CIL performance.
In Table 2.2, another factor worth noting is the standard error in CIL scores. The standard error in the mean CIL score of Hong Kong students is the largest among those in all participating systems. The large standard error reflects large variations in the CIL achievement among Hong Kong students. What were the factors that contributed to such a large diversity in the students’ performance? To what extend did the students’ family background and their school and teacher level factors contribute to their CIL achievement? Answers to these questions are explored in the next two chapters.

24
Ta
ble 2
.2 C
ount
ry a
vera
ges f
or C
IL, y
ears
of s
choo
ling,
ave
rage
age
, IC
T In
dex,
stud
ent–
com
pute
r rat
ios a
nd p
erce
ntile
gra
ph
Educ
atio
nal s
yste
ms
ICT
Dev
elop
men
t In
dex
scor
e (a
nd
coun
try
rank
)Cz
ech
Repu
blic
814
.355
3(2
.1)
▲6.
40 (3
4)10
(0.3
)A
ustr
alia
814
.054
2(2
.3)
▲7.
90 (1
1)3
(0.3
)Po
land
814
.853
7(2
.4)
▲6.
31 (3
7)10
(0.5
)N
orw
ay (G
rade
9)
914
.853
7(2
.4)
▲8.
13 (6
)2
(0.1
)Re
publ
ic o
f Kor
ea8
14.2
536
(2.7
)▲
8.57
(1)
20(2
.3)
Ger
man
y8
14.5
523
(2.4
)▲
7.46
(19)
11(0
.8)
Slov
ak R
epub
lic8
14.3
517
(4.6
)▲
6.05
(43)
9(0
.5)
Russ
ian
Fede
rati
on8
15.2
516
(2.8
)▲
6.19
(40)
17(1
.0)
Croa
tia
814
.651
2(2
.9)
▲6.
31 (3
8)26
(0.8
)Sl
oven
ia8
13.8
511
(2.2
)▲
6.76
(28)
15(0
.5)
Lith
uani
a8
14.7
494
(3.6
)5.
88 (4
4)13
(0.7
)Ch
ile8
14.2
487
(3.1
)▼
5.46
(51)
22(4
.7)
Thai
land
813
.937
3(4
.7)
▼3.
54 (9
5)14
(0.9
)Tu
rkey
814
.136
1(5
.0)
▼4.
64 (6
9)80
(16.
0)
Educ
atio
nal s
yste
ms
not
mee
ting
sam
plin
g re
quir
emen
tsD
enm
ark
815
.154
2(3
.5)
8.35
(4)
4(0
.4)
Hon
g Ko
ng (S
AR)
814
.150
9(7
.4)
7.92
(10)
8(0
.8)
Net
herl
ands
814
.353
5(4
.7)
8.00
(7)
5(0
.8)
Swit
zerl
and
814
.752
6(4
.6)
7.78
(13)
7(0
.6)
Benc
hmar
king
par
tici
pant
s
New
foun
dlan
d an
d La
brad
or, C
anad
a8
13.8
528
(2.8
)7.
38 (2
0)²
6(0
.0)
Ont
ario
, Can
ada
813
.854
7(3
.2)
7.38
(20)
²6
(0.3
)
Benc
hmar
king
par
tici
pant
s no
t m
eeti
ng s
ampl
ing
requ
irem
ents
City
of B
ueno
s A
ires
, Arg
enti
na8
14.2
450
(8.6
)5.
36 (5
3)¹
33(9
.4)
▲ ▼
() S
tan
da
rd e
rro
rs a
pp
ea
r in
pa
ren
the
ses.
Be
cau
se r
esu
lts a
re r
ou
nd
ed
to
th
e n
ea
rest
wh
ole
nu
mb
er,
so
me
to
tals
ma
y a
pp
ea
r in
con
sist
en
t.
Ave
rage
s fo
r C
IL E
duca
tion
al s
yste
ms,
yea
rs o
f sc
hoo
ling,
ave
rage
age
, IC
T In
dex
and
perc
enti
le g
raph
Ach
ieve
me
nt
sig
nifi
can
tly h
igh
er
tha
n I
CIL
S a
vera
ge
Ach
ieve
me
nt
sig
nifi
can
tly lo
we
r th
an
IC
ILS
ave
rag
e
Stud
ent
- com
pute
r ra
tios
Year
s of
sc
hool
ing
Ave
rage
ag
e
Com
pute
r an
d In
form
atio
n Li
tera
cy S
core
Ave
rage
CIL
sc
ore
* IC
T D
eve
lop
me
nt
Ind
ex
Sco
re a
nd
co
un
try
ran
k d
ata
20
12
(S
ou
rce
: h
ttp
://w
ww
.itu
.int/
ITU
-D/ic
t/p
ub
lica
tion
s/id
i/in
de
x.h
tml [
27
/02
/14
])
10
02
00
30
04
00
50
06
00
70
0
100
200
300
400
500
600
700
10
02
00
30
04
00
50
06
00
70
0
5th
Pe
rce
ntil
es
of
Pe
rfo
rma
nce
25
th7
5th
95
th
Me
an
an
d C
on
fide
nce
Inte
rva
l
Belo
w L
1L3
L1
L2
L4
10
02
00
30
04
00
50
06
00
70
0

25
2.3 CIL Proficiency Levels
Fraillon et al. (2014) report on their analysis of the achievement data from ICILS 2013 to find out if the measurement data for different strands and aspects revealed that these were in fact belonging to different dimensional scales. The analysis resulted in an extremely high latent correlation (96%) between the students’ achievement scores on strands 1 and 2, indicating that it is appropriate to report CIL as a single achievement scale.
A more descriptive CIL achievement scale was developed in order to provide a more qualitatively meaningful understanding of the performance levels of students with different achievement scores. To establish such a scale, an “item map” was produced to rank the items (a unit of analysis that derives a score associated with a question or task) from the least to the most difficult. The item map and student achievement data were further analyzed to establish proficiency levels with a width of 85 scale points and level boundaries at 407, 492, 576, and 661 scale points.
The scale is hierarchical in that a student located at a higher position on the scale will be able to successfully complete tasks up to that level of achievement. The scale is constructed so that students achieving a score at the lower boundary of a level should have answered about 50% of the items in that level correctly. For anyone with a score higher than the level boundary, he/she should have answered more than 50% of the items at their respective level. Table 2.3 describes what a typical student at each of the levels would be able to do in terms of Strand 1 and Strand 2 capabilities.
At Level 1, students are able to use a basic range of software commands to access files and complete routine layout tasks and basic editing of text. They are also able to recognize potential risks associated with misuse by unauthorized use of computers. Students working at a level below Level 1 are likely to require support and guidance to be able to create digital information products.
At Level 2, students are able to locate explicit information from given digital sources, have basic abilities to select and add content to information products with some rudimentary ability to follow layout conventions. They are also aware of the mechanisms to protect personal information and the consequential risks of public access to personal information. The key difference between Level 2 and higher levels of proficiency is in students’ ability to work autonomously and critically when accessing and using information to create information products.
At Level 3, students are able to search for, select and work with information appropriately to edit and create information products. They are aware of potential biases, inaccuracy and unreliability of information sources, and are able to control the layout and design of their digital products.
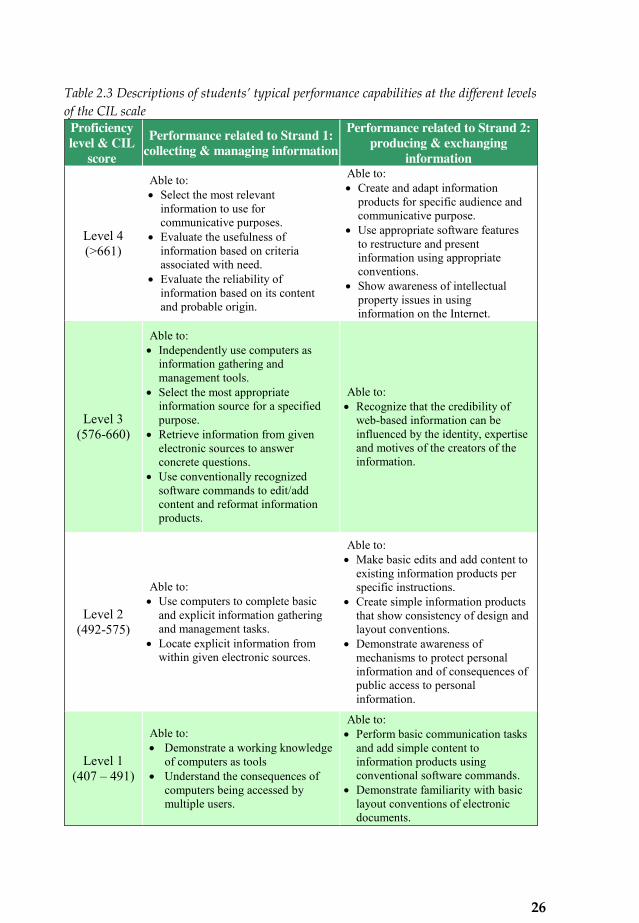
26
Table 2.3 Descriptions of students’ typical performance capabilities at the different levels
of the CIL scale Proficiency level & CIL
score
Performance related to Strand 1: collecting & managing information
Performance related to Strand 2: producing & exchanging
information
Level 4 (>661)
Able to: x Select the most relevant
information to use for communicative purposes.
x Evaluate the usefulness of information based on criteria associated with need.
x Evaluate the reliability of information based on its content and probable origin.
Able to: x Create and adapt information
products for specific audience and communicative purpose.
x Use appropriate software features to restructure and present information using appropriate conventions.
x Show awareness of intellectual property issues in using information on the Internet.
Level 3 (576-660)
Able to: x Independently use computers as
information gathering and management tools.
x Select the most appropriate information source for a specified purpose.
x Retrieve information from given electronic sources to answer concrete questions.
x Use conventionally recognized software commands to edit/add content and reformat information products.
Able to: x Recognize that the credibility of
web-based information can be influenced by the identity, expertise and motives of the creators of the information.
Level 2 (492-575)
Able to: x Use computers to complete basic
and explicit information gathering and management tasks.
x Locate explicit information from within given electronic sources.
Able to: x Make basic edits and add content to
existing information products per specific instructions.
x Create simple information products that show consistency of design and layout conventions.
x Demonstrate awareness of mechanisms to protect personal information and of consequences of public access to personal information.
Level 1 (407 – 491)
Able to: x Demonstrate a working knowledge
of computers as tools x Understand the consequences of
computers being accessed by multiple users.
Able to: x Perform basic communication tasks
and add simple content to information products using conventional software commands.
x Demonstrate familiarity with basic layout conventions of electronic documents.

27
Compared to those at lower levels of proficiency, students operating at Level
4 have a higher level of precision in information search and selection, and more
sophisticated control in layout and formatting to meet the specific communicative
purpose of the digital products. They also demonstrate awareness of the
commercial potential of information products and issues related to intellectual
property rights of electronically sourced information.
Based on the above description, it can be argued that those students operating
below Level 3 do not have adequate CIL proficiency to cope with the challenges
they face in working with information in their everyday life and work.
Just as a student's level of proficiency in CIL is reflected by his/her scaled CIL
score, the item difficulty of questions and tasks indicates the probability of the item
being successfully answered by students—the higher the item difficulty, the lower
the proportion of submitted answers being successful. Table 2.4 provides a
description of the questions and tasks that students operating at each proficiency
level were typically able to answer correctly at least 50% of the time. These
questions and tasks hence provide a more vivid illustration of students’ capabilities at each level. It also provides a helpful reference for students, teachers and other
educators alike on the more challenging tasks that students need to be able to tackle
in order to move to the next level of CIL proficiency.
2.4 Hong Kong Students’ CIL Proficiency Levels in an International Context
The CIL proficiency level of each ICILS student participant can be computed based
on his/her CIL score. In order to take advantage of the possibility of interpreting
the findings from the Hong Kong results in the international context, and without
burdening our readers with too much information, we have selected two other
participating countries that are economically developed and familiar to people in
Hong Kong for the purpose of comparison.
Figure 2.1 is a pie chart showing the percentages of students performing at
each of the four proficiency levels, and those that performed at below Level 1 in
Hong Kong, Australia and Korea. It can be seen that Level 2 is the proficiency level
with the highest percentage of students in all three systems. In fact, even for Czech
Republic which is the country with the highest average CIL score and the highest
percentage of students operating above Level 2, that percentage was only 37%. If
we take the perspective that Level 3 is the minimum CIL for adequate functioning
in the information world around us, then even for the highest performing countries,
there is a lot that needs to be done in terms of promoting students’ CIL proficiency. In Hong Kong, the situation is even less promising, with only 3% achieving Level
4 and 23% achieving Level 3.

28
Table 2.4 Examples of ICILS test items mapped to the four CIL proficiency levels based on their item difficulty
CIL level*
Matched Strand 1 items: collecting & managing
information
Matched Strand 2 items: producing & exchanging information
Level 4
x Evaluate the reliability of information intended to promote a product on a commercial website.
x Select, from a large set of results returned by a search engine, a result that meets the specified search criteria
x Select relevant images from electronic sources to represent a three-stage process.
x Select from sources and adapt text for a presentation to suit a specified audience and purpose.
x Appropriate use of colour in a presentation suited to the communicative purpose.
x Suitable use of text layout and formatting in different elements in an information poster.
x Balanced layout of text and images for an information sheet.
x Recognize the difference between legal, technical, and social requirements when using images on a website.
Level 3
x Evaluate the reliability of information presented on a crowd-sourced website
x Select an appropriate website navigation structure for a given content;
x Use generic online mapping software to represent text information as a route map.
x Select relevant information according to given criteria to include in a website.
x Select and adapt some relevant information from given sources when creating a poster.
x Demonstrate control of image layout when creating a poster.
x Demonstrate control of color and contrast to support readability of a poster
x Demonstrate control of text layout when creating a presentation
x Aware that a generic email greeting indicates sender does not know the recipient’s identity
Level 2
x Navigate to a URL presented as plain text.
x Locate simple information within a multi-page website.
x Add contacts to a collaborative workspace. x Insert information to a specified cell in a
spreadsheet. x Differentiate between paid and organic search
results returned by a search engine. x Use formatting and location to denote text with
the role of title in an information sheet. x Use the full page when laying out a poster. x Demonstrate basic control of text layout and color
use when creating a presentation. x Explain a potential problem if a personal email
address is publicly available.
Level 1 x Open a link in a new
browser tab. x Insert an image into a
document
x Use software to crop an image. x Place a title prominently on a webpage. x Create a suitable title for a presentation. x Identify email recipients on carbon copy list. x Name risk(s) in not logging out after using a
publicly accessible computer.

29
* There were a few items that had scaled difficulties below Level 1. These only involve execution of the most basic skills, such as clicking on a hyperlink.
Figure 2.1 Percentages of Hong Kong, Australia and Korea students performing at each CIL proficiency level
An even more worrisome picture emerges if we look at the percentages of students that were assessed to perform at below Level 1. There were 15% of students in Hong Kong who were assessed to perform at below Level 1. Only four systems had a higher percentage of students operating at below Level 1: Turkey, Thailand, City of Buenos Aires (Argentina) and Chile. Clearly, there is a serious mismatch between our students’ CIL proficiency level and Hong Kong’s overall ICT development index as 10th in the world and 5th among the 21 participating systems. Clearly, improving the CIL proficiency level is one of the critical educational priorities for Hong Kong if we are to have a workforce and a citizenry that are CIL proficient for life and work in a highly digitized world. In the next section, we are going to explore the students’ strengths and weakness across the seven Aspects within the two CIL Strands at each of the seven CIL levels in order to seek a better understanding of the possible trajectory of development in CIL as students’ progress up the various levels.

30
2.5 Students’ Performance across CIL Aspects
As explained in section 1.4, the CIL assessment framework in this Study has two strands, which can be further differentiated into a total of seven aspects. Each of the items in the assessment was designed to assess one of the seven aspects. Hence, it is possible to compute the mean percentage correct for each student for each set of items in a particular aspect and from these percentage scores to compute the mean performance of the entire population of students for each CIL aspect. Table 2.5 presents the percentage of correct answers and the relative difficulty for each aspect for students in Hong Kong, Australia and Korea. The results clearly show that while these three systems differ greatly in the students’ overall performance, they all find accessing and evaluating information, and transforming information to be the most difficult; whereas items related to knowing about and understanding computer use and using information safely and securely were the easiest. Table 2.5 The percentages correct (S.D.) and relative difficulty for the seven CIL aspects for Hong Kong, Australia and Korea
CIL strand & aspect HK AUS KOR % (S.D.) D* % (S.D.) D* % (S.D.) D*
Strand 1: Collecting and managing information 1.1 Knowing about and understanding
computer use 71 (23) 7 76 (23) 7 74 (22) 7
1.2 Accessing and evaluating information 38 (31) 2 42 (31) 1 40 (31) 1
1.3 Managing information 43 (43) 4 45 (43) 3 49 (41) 5
Strand 2: Producing and exchanging information
2.1 Transforming information 36 (25) 1 48 (26) 2 46 (27) 2
2.2 Creating information 53 (28) 5 59 (24) 5 56 (27) 4
2.3 Sharing information 39 (37) 3 49 (35) 4 44 (38) 3 2.4 Using information safely and
securely 58 (25) 6 61 (25) 6 62 (22) 6
D* is the relative difficulty of the aspect in comparison with the others. 1 is most difficult. In the remainder of this section, we will report on the common errors and
difficulties that Hong Kong students had in completing the tasks in each of the CIL aspects through the analysis of the students’ answers to the tasks and questions in the released module, After-school Exercise.
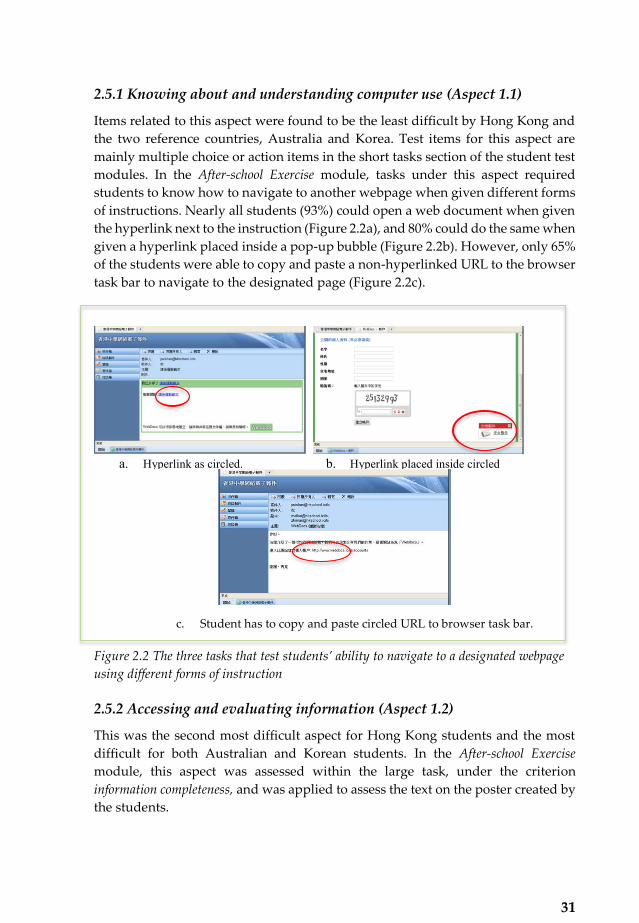
31
2.5.1 Knowing about and understanding computer use (Aspect 1.1)
Items related to this aspect were found to be the least difficult by Hong Kong and the two reference countries, Australia and Korea. Test items for this aspect are mainly multiple choice or action items in the short tasks section of the student test modules. In the After-school Exercise module, tasks under this aspect required students to know how to navigate to another webpage when given different forms of instructions. Nearly all students (93%) could open a web document when given the hyperlink next to the instruction (Figure 2.2a), and 80% could do the same when given a hyperlink placed inside a pop-up bubble (Figure 2.2b). However, only 65% of the students were able to copy and paste a non-hyperlinked URL to the browser task bar to navigate to the designated page (Figure 2.2c).
Figure 2.2 The three tasks that test students’ ability to navigate to a designated webpage using different forms of instruction
2.5.2 Accessing and evaluating information (Aspect 1.2)
This was the second most difficult aspect for Hong Kong students and the most difficult for both Australian and Korean students. In the After-school Exercise module, this aspect was assessed within the large task, under the criterion information completeness, and was applied to assess the text on the poster created by the students.
a. Hyperlink as circled. b. Hyperlink placed inside circled bubble.
c. Student has to copy and paste circled URL to browser task bar.
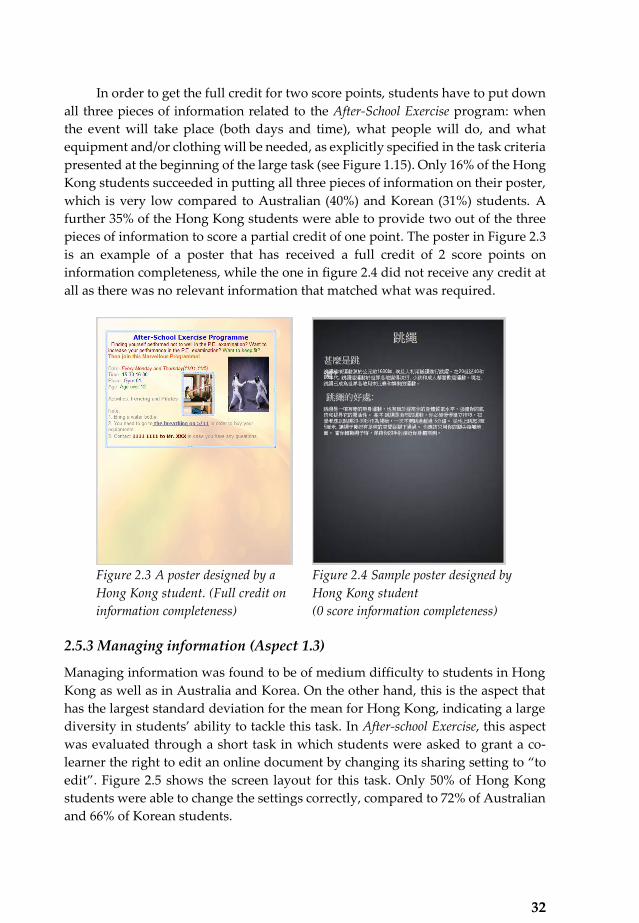
32
In order to get the full credit for two score points, students have to put down all three pieces of information related to the After-School Exercise program: when the event will take place (both days and time), what people will do, and what equipment and/or clothing will be needed, as explicitly specified in the task criteria presented at the beginning of the large task (see Figure 1.15). Only 16% of the Hong Kong students succeeded in putting all three pieces of information on their poster, which is very low compared to Australian (40%) and Korean (31%) students. A further 35% of the Hong Kong students were able to provide two out of the three pieces of information to score a partial credit of one point. The poster in Figure 2.3 is an example of a poster that has received a full credit of 2 score points on information completeness, while the one in figure 2.4 did not receive any credit at all as there was no relevant information that matched what was required.
Figure 2.3 A poster designed by a Hong Kong student. (Full credit on information completeness)
Figure 2.4 Sample poster designed by Hong Kong student (0 score information completeness)
2.5.3 Managing information (Aspect 1.3)
Managing information was found to be of medium difficulty to students in Hong Kong as well as in Australia and Korea. On the other hand, this is the aspect that has the largest standard deviation for the mean for Hong Kong, indicating a large diversity in students’ ability to tackle this task. In After-school Exercise, this aspect was evaluated through a short task in which students were asked to grant a co-learner the right to edit an online document by changing its sharing setting to “to edit”. Figure 2.5 shows the screen layout for this task. Only 50% of Hong Kong students were able to change the settings correctly, compared to 72% of Australian and 66% of Korean students.

33
Figure 2.5 Screenshot of the short task in After-school Exercise that tests students’ ability to change the sharing setting of a web document
2.5.4 Transforming information (Aspect 2.1)
As evident from Table 2.5, transforming information was found to be the most difficult CIL aspect by Hong Kong students, and the second most difficult by Australian and Korean students. In the After-school Exercise module, this was assessed via four separate criteria in the poster design task: title design, colour contrast, persuasiveness of the poster and use of the full page. Title Design: The title design was evaluated against two performance expectations (see Table 1.5), one of which relates to this aspect: whether a relevant title has been added and formatted to make its role clear. This requires the title to be placed in a prominent position and the text formatting to make it distinctive by capitalizing, using larger font size, bolding, etc. The posters in Figures 2.3, 2.4 and 2.6 have met this criterion. In Figure 2.7, even though the title “FENCING” was capitalized, bolded and underlined, it was not placed in the middle in a sufficiently prominent position to signal that it was a title, and hence failed to meet this criterion in the assessment. In summary, 49% of Hong Kong students submitted posters that met this criterion, compared to 64% of Australian and 50% of Korean students respectively.
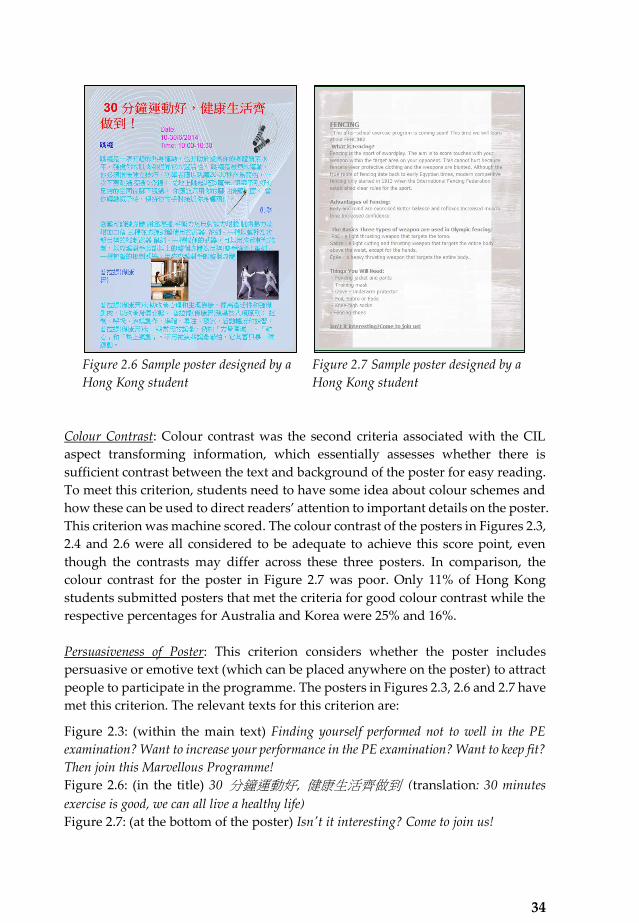
34
Figure 2.6 Sample poster designed by a
Hong Kong student
Figure 2.7 Sample poster designed by a
Hong Kong student
Colour Contrast: Colour contrast was the second criteria associated with the CIL
aspect transforming information, which essentially assesses whether there is
sufficient contrast between the text and background of the poster for easy reading.
To meet this criterion, students need to have some idea about colour schemes and
how these can be used to direct readers’ attention to important details on the poster. This criterion was machine scored. The colour contrast of the posters in Figures 2.3,
2.4 and 2.6 were all considered to be adequate to achieve this score point, even
though the contrasts may differ across these three posters. In comparison, the
colour contrast for the poster in Figure 2.7 was poor. Only 11% of Hong Kong
students submitted posters that met the criteria for good colour contrast while the
respective percentages for Australia and Korea were 25% and 16%.
Persuasiveness of Poster: This criterion considers whether the poster includes
persuasive or emotive text (which can be placed anywhere on the poster) to attract
people to participate in the programme. The posters in Figures 2.3, 2.6 and 2.7 have
met this criterion. The relevant texts for this criterion are:
Figure 2.3: (within the main text) Finding yourself performed not to well in the PE
examination? Want to increase your performance in the PE examination? Want to keep fit?
Then join this Marvellous Programme!
Figure 2.6: (in the title) 30 分鐘運動好, 健康生活齊做到 (translation: 30 minutes
exercise is good, we can all live a healthy life)
Figure 2.7: (at the bottom of the poster) Isn't it interesting? Come to join us!

35
Only 10% of Hong Kong students received the score point for the
persuasiveness criterion, as compared to 38% of Australian and 60% of Korean
students respectively.
Use of full page: This is a relative simple criteria, assessed by checking whether the
students have made use of the full area of the poster to display the information.
Half of the students in Hong Kong (50%) met this criterion, while in Australia and
Korea the corresponding figures were 61% and 57% respectively. Figure 2.3 and
Figure 2.4 did not received any credit in this area.
Overall, it can be seen that even though transforming information is also a
relatively difficult CIL aspect for Australia and Korea, Hong Kong students are
achieving a much lower level compared to their Australian and Korean
counterparts.
2.5.5 Creating information (Aspect 2.2)
Creating information was a comparatively well-answered CIL aspect for Hong
Kong students. It was assessed through four of the poster design criteria: title
design, image layout, text layout and formatting, and colour contrast. As can be
seen from Table 1.5, two of these criteria, title design and colour contrast, also
applied to the transforming information aspect. In both cases, the level of
performance for achieving the creating information criterion is lower than that for
transforming information, as will be explained below.
Title Design: A poster will be assessed to have achieved the creating information
criterion if a relevant title has been added and placed in a prominent position.
Hence, satisfying this criterion for the title design is a necessary prerequisite for it
to be further considered against the criterion for transforming information. Thus,
the titles in the posters in Figures 2.3, 2.4 and 2.6 all satisfy the creating information
criterion, and the title in Figure 2.7 does not. The percentages of students meeting
this criterion for Hong Kong, Australia and Korea are respectively 69%, 80% and
71%.
Image layout: This criterion requires that one or more images are well aligned with
the other elements on the poster and appropriately sized. The posters in Figure 2.4
and 2.7 do not contain images and do not satisfy this criterion. The images in Figure
2.3 are well laid out and aligned with the meaning of the text in the poster, which
thus gained the full score for this criterion. In comparison, the images in Figure 2.6
overlap with the main text on the poster, and did not satisfy this criterion. Only
32% of Hong Kong students submitted posters that satisfied this criterion, while
the corresponding performance of Australian and Korean students were 50% and
49% respectively.
36
Text layout and formatting: This criterion concerns whether the students have used formatting tools to show the role of different text elements on the poster. The assessment differentiates between two levels of performance. At the lower level, a student needs to demonstrate basic control of text layout on the poster. A higher level of performance requires that a consistent layout format has been used to show the roles of different text elements. Hence, the poster in Figure 2.4 only received one score point (assessed to be at a lower level of performance) as the formatting was relatively basic. On the other hand, the poster in Figure 2.3 was able to demonstrate the use of different formatting features for different text elements, and received a full score of two points. Only 11% of Hong Kong students received the full score on this criterion, compared to the corresponding figures of 19% and 27% by Australian and Korean students respectively. Another 41% of the students in Hong Kong were assessed to perform at the lower level for this criterion, while the corresponding figures for Australia and Korea were both 46%.
2.5.6 Sharing information (Aspect 2.3)
In the After-school Exercise module, sharing information was assessed through one short task and two poster design assessment criteria, colour consistency and information adaptation. For the short task, the students were simply assessed on whether they could identify who received an email via carbon copy. This item was relatively well answered by Hong Kong students with 69% correct, while the respective figures for Australia and Korea were 80% and 57% respectively. Colour consistency: This criterion evaluates whether a poster shows evidence of planning regarding the use of colour to denote the role of text, background and images on the poster. The default setting of the poster creation software was such that if the students did not at least change either the background colour or the text colour, the text would be very difficult to read because of poor contrast. The scoring follows a very simple principle: colour should be used intentionally to suit the purpose of the text within the poster, and not just randomly or decoratively. It is not necessary to use multiple colours to receive credit for this criterion as readability is the primary concern. All four posters shown in Figures 2.3, 2.4, 2.6 and 2.7 received full score for this criterion. A total of 76% of Hong Kong students met this criterion, compared to 67% of Australian and 76% of Korean students. Information adaptation: This criterion assesses the extent to which useful information has been identified and suitably presented using the student’s own words on the poster. No credit would be awarded if chunks of text were directly copied from the given resources and pasted with no or very minimal editing. One score point would be awarded if some editing were done to improve ease of comprehension and relevance. Full score (two points) would be awarded if the student rephrased

37
all the key points on the poster using his/her own words. Information adaptation is the weakest area for Hong Kong students, with only 8% gaining at least one score point (i.e. having done some level of editing), and a dismal 1% scoring two score points by doing substantial rephrasing. This stands in stark contrast with Australia, which has corresponding figures of 52% and 13%, and Korea with 63% and 33% respectively.
None of the four posters shown earlier scored even one point on this criterion. Figure 2.3 does not provide any detail about either of the sports listed on the poster. On the other three posters (Figures 2.4, 2.6, and 2.7), all the text about the sports were copied directly from the given resources and pasted with no editing.
2.5.7 Using information safely and securely (Aspect 2.4)
This CIL aspect was assessed through five short tasks in the After-school Exercise module. The tasks and students’ responses are described below. Risks in revealing personal information: In short task 3, students were asked which of four kinds of personal information would be the most risky to make public in one’s profile information when opening an account on a public website: name, gender, home address and nationality (see Figure 2.8). For this item, Hong Kong students had excellent performance, with 96% being able to choose “home address” as the correct answer. This compares very well with the corresponding performance of Australian and Korean students, at 95% and 90% respectively.
Detecting fraudulent (phishing) emails: The short tasks 5, 6 and 7 all referred to the email in Figure 2.9, and ask the student to point out why each of the three elements A, B and C (denoting two URLs, C1 and C2) suggest that this is a phishing email. Samples of Hong Kong students’ answers are presented in Table 2.6.
Figure 2.8 The short task that assessed students’ awareness of risks in making personal information public

38
Table 2.6 Sample responses from Hong Kong students to the three tasks related to the phishing email
Responses scoring “0” Responses scoring “1”
Task 5: suspicious sender email
Can only say that the email is suspicious, e.g.: x I don’t know the sender x Fake email x Not an official website
Can explain that the email did not originate from Webdocs, e.g.: x Email is not sent by Webdocs x This is not commercial/
professional email x There is the word “freemail”.
Security would not use this word
Task 6: suspicious greeting
Unclear answers, such as: x Should not use “Dear” x There should not be a yellow
highlight x My name is not WEBDOCS
Can clearly state that the greeting does not have the name of the client, e.g.: x If real, should use name: XXX x Should use customer’s name
Task 7: suspicious URL
Unclear answers, such as: x No www x No “.com” and no “.hk” x Has “reset”
Can identify the problem, e.g.: x Not sure that the reset password
website belong to the Webdocs company
x The URL links to freeweb x They are different websites
A is the email sender’s address. The student should point out that the domain
name of the purported sender’s address does not correspond to that of the purported sending organization’s domain. 24% of the Hong Kong students were able to answer this item correctly, compared to 19% and 21% of Australian and Korean students respectively.
B is the greeting to the person receiving this email. If this email actually came from the purported organization, it should have the name of the receiver and so the greeting should be personal. In Hong Kong, only 24% of the students were able to point out that the greeting in B was not a personal one. The percentage of Korean students who answered this question correctly was similar to that of Hong Kong, at 27%, while Australian students performed much better, with 60% correct.

39
Figure 2.9 The phishing email with three suspicious elements, A, B and C The third short task related to this phishing email asks students to identify
why the two URLs identified by C may be suspicious, and they should point out that the explicit URL address C1 is not the same as the URL of the actual hyperlink as indicated by C2. Hong Kong students’ performance in this item is similarly poor as in the previous two, with only 24% correct. On the other hand, this item proves to be the most difficult out of the three on this phishing email for Australian students, with only 15% getting the item correct, while the performance of Korean students was similar to that of Hong Kong, with 23% correct. Problem of making one’s email address public: The final short task in this module that assesses the CIL aspect “using information safely and securely” asks the students to name one problem that may arise if one’s email address is made public. Any response indicating either that this may result in getting unwanted email such as spam and advertising email, or that this may lead to loss of privacy such as being contacted by strangers or stalkers would be acceptable answers. However, some students also mistakenly thought that this might lead to one’s account being hacked, or one’s information being stolen. Samples of students’ incorrect and correct responses are presented in Table 2.7.
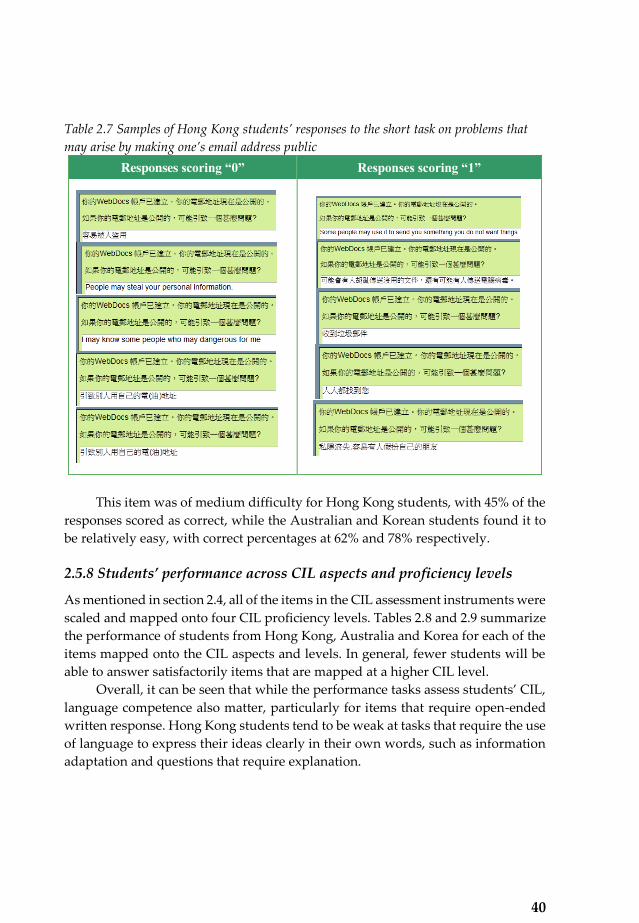
40
Table 2.7 Samples of Hong Kong students’ responses to the short task on problems that
may arise by making one’s email address public Responses scoring “0” Responses scoring “1”
This item was of medium difficulty for Hong Kong students, with 45% of the
responses scored as correct, while the Australian and Korean students found it to
be relatively easy, with correct percentages at 62% and 78% respectively.
2.5.8 Students’ performance across CIL aspects and proficiency levels
As mentioned in section 2.4, all of the items in the CIL assessment instruments were
scaled and mapped onto four CIL proficiency levels. Tables 2.8 and 2.9 summarize
the performance of students from Hong Kong, Australia and Korea for each of the
items mapped onto the CIL aspects and levels. In general, fewer students will be
able to answer satisfactorily items that are mapped at a higher CIL level.
Overall, it can be seen that while the performance tasks assess students’ CIL, language competence also matter, particularly for items that require open-ended
written response. Hong Kong students tend to be weak at tasks that require the use
of language to express their ideas clearly in their own words, such as information
adaptation and questions that require explanation.
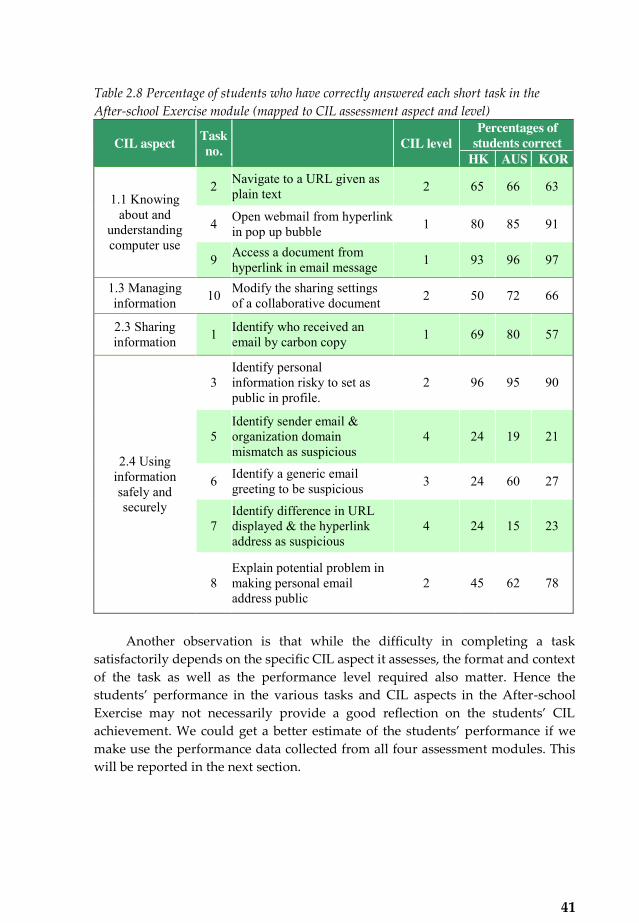
41
Table 2.8 Percentage of students who have correctly answered each short task in the After-school Exercise module (mapped to CIL assessment aspect and level)
CIL aspect Task no. CIL level
Percentages of students correct
HK AUS KOR
1.1 Knowing about and
understanding computer use
2 Navigate to a URL given as plain text 2 65 66 63
4 Open webmail from hyperlink in pop up bubble 1 80 85 91
9 Access a document from hyperlink in email message 1 93 96 97
1.3 Managing information 10 Modify the sharing settings
of a collaborative document 2 50 72 66
2.3 Sharing information 1 Identify who received an
email by carbon copy 1 69 80 57
2.4 Using information safely and securely
3 Identify personal information risky to set as public in profile.
2 96 95 90
5 Identify sender email & organization domain mismatch as suspicious
4 24 19 21
6 Identify a generic email greeting to be suspicious 3 24 60 27
7 Identify difference in URL displayed & the hyperlink address as suspicious
4 24 15 23
8 Explain potential problem in making personal email address public
2 45 62 78
Another observation is that while the difficulty in completing a task
satisfactorily depends on the specific CIL aspect it assesses, the format and context of the task as well as the performance level required also matter. Hence the students’ performance in the various tasks and CIL aspects in the After-school Exercise may not necessarily provide a good reflection on the students’ CIL achievement. We could get a better estimate of the students’ performance if we make use the performance data collected from all four assessment modules. This will be reported in the next section.

42
Table 2.9 Percentage of students who have achieved partial or full score for each assessment criterion (mapped to CIL level) in the poster design large-task
Criterion Score/ max. score CIL aspect CIL level
Percentages of students correct
HK AUS KOR
1. Title design 1/2 2.2 Creating information 2 69 80 71
2/2 2.1 Transforming information 2 49 64 50
2. Image layout 1/1 2.2 Creating information 3 32 50 49
3. Text layout & formatting
1/2 2.2 Creating information 2 52 65 73
2/2 2.2 Creating information 4 11 19 27
4. Color contrast 1/2 2.2 Creating information 1 66 76 73
2/2 2.1 Transforming information 3 11 25 16
5. Color consistency 1/1 2.3 Sharing information 1 76 67 76
6. Information adaptation
1/2 2.3. Sharing information 3 8 52 63
2/2 2.3. Sharing information 4 1 13 33
7. Information completeness
1/2 1.2. Accessing & eval. information 2 51 65 63
2/2 1.2. Accessing & eval. information 3 16 40 31
8. Persuasiveness 1/1 2.1. Transforming information 3 10 38 60
9. Use of full page 1/1 2.1. Transforming information 2 50 61 57
2.6 Students’ CIL proficiency trajectories
From a pedagogical point of view, it would be useful to know the strengths and weaknesses of a student’s CIL beyond his/her performance at an item level. In this section, we will explore the relative strengths and weaknesses of students’ performance in each of the seven aspects, and to understand how students at various proficiency levels differ in terms of their achievements in each of the seven aspects. Such knowledge would help to provide some initial information about students’ trajectory of improvement across the CIL aspects, which may be used to guide teachers in designing programs of CIL learning for students. We will also compare such “trajectories” for Hong Kong, Australia and Korea to examine whether such trajectories are generally applicable or whether these are actually dependent on the educational and cultural context of individual countries. Figure 2.10 is a graphic representation of the percentages correct for each of the seven CIL aspects for Hong Kong, Australian and Korean students presented in Table 2.5.

43
Figure 2.10 A radar diagram of the mean percentages correct per CIL aspect
The key areas of concern in terms of the low percentages correct (below 40%)
are aspects 1.2 (Accessing and evaluating information), 2.1 (transforming information), and 2.3 (sharing information). It can also be seen that while the two comparison countries are both high performing systems in ICILS, Hong Kong’s achievement in some of the aspects are not too far behind. The key areas that Hong Kong students lag behind are aspects 2.1 (transforming information), 2.3 (sharing information) and 1.3 (managing information). In the remainder of this section, we will explore how the profile of competence differs across the five groups of students from below Level 1 to Level 4. These profiles will help us understand how students’ CIL competence develops from the lowest to the highest level.

44
2.6.1 Hong Kong students’ improvements in competency profile as they move to higher CIL proficiency levels
Figure 2.11 is the graphic representation of the profiles for Hong Kong students at
each of the five CIL proficiency levels. The group of students at Below Level 1
(comprising 15% of the Hong Kong student population) can be considered as the
least CIL “educated” group of students. It can be seen that even for this group, CIL aspects 1.1 and 2.4 are relatively well developed.
Figure 2.11 A radar diagram showing the mean percentages correct per CIL aspect for Hong Kong students at each of the five CIL proficiency levels
Since Hong Kong students have extremely high computer (98%) and Internet
(99%) access at home, and there is pervasive use of Internet technology in the
society at large for social communications and entertainment, the relatively high
achievement in these two aspects of CIL competence are probably unrelated to
students’ educational experiences in schools. Comparing the CIL competency
profile between this group and the Level 1 group, we can see that there is a marked
increase in competency for the latter in all seven CIL aspects.

45
As Fraillon et al. (2014) mentioned, students performing below Level 1 were in fact outside of the competence level that the ICILS assessment was designed for. Clearly, the fact that we still have such a large proportion of students in Hong Kong operating at such a low level is very worrying. Further, there is a need to find ways to help this group of students comprehensively in all 7 CIL aspects in order to reach at least Level 1 proficiency.
The developmental picture becomes rather different when we compare the competency profiles beyond Level 1. From Level 1 to Level 4, the improvements in aspects 1.1 (knowing about and understanding computer use) and 2.4 (using information safely and securely) were much smaller in between any two adjacent levels. In two of the other five aspects, 1.2 (accessing and evaluating information) and 2.1 (transforming information), there continued to be marked improvements in students’ competence going up the proficiency levels.
However, for the remaining three CIL aspects 1.3 (managing information), 2.2 (creating information), and 2.3 (sharing information), there were close to no improvement between Level 3 to Level 4. This means that our highest performing students were not able to advance further in competence in these three CIL aspects. This is particularly worrying for sharing information (aspect 2.3) and managing information (aspect 1.3) for which the highest mean for Level 4 students were below 60% and below 70% respectively.
2.6.2 Australian and Korean students’ improvements in competency profile as they move to higher CIL proficiency levels
It is useful to find out if other countries show similar developmental patterns in CIL competency as students advance in their CIL proficiency levels. Figures 2.12 and 2.13 show the corresponding developmental profiles for Australian and Korean students respectively.
Comparing the three Figures 2.11 to 2.13, there is clear resemblance in profile across the three systems among students at Below Level 1 proficiency, and that the improvement from Below Level 1 to Level 1 are similarly marked in all seven aspects.
On the other hand, Australia appear to have the most balanced improvement in all seven CIL aspects such that their students at Level 4 achieve a minimum mean percentage correct of 70% for the lowest performing aspect, sharing information (aspect 2.3); and except for managing information (aspect 1.3), this group of highest performing students achieve a mean of at least 80% correct in all the other five aspects.

46
Figure 2.12 A radar diagram showing the mean percentages correct per CIL aspect for Australian students at each of the five CIL proficiency levels
Korean students also show a more balanced improvement profile compared to Hong Kong, though less so than Australia. Korean students at proficiency level 4 also achieved a minimum mean percentage correct above 70% in all seven aspects.
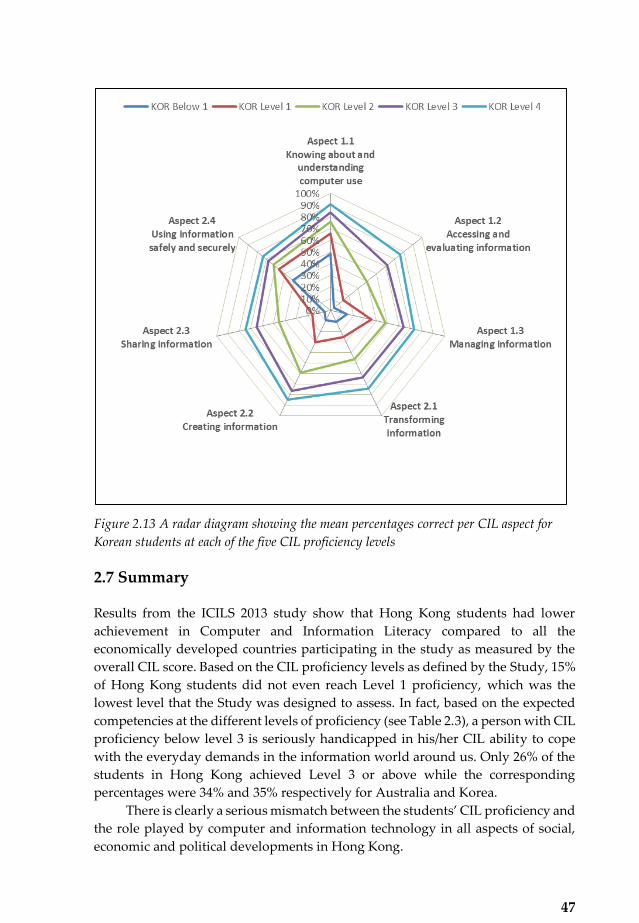
47
Figure 2.13 A radar diagram showing the mean percentages correct per CIL aspect for Korean students at each of the five CIL proficiency levels
2.7 Summary
Results from the ICILS 2013 study show that Hong Kong students had lower
achievement in Computer and Information Literacy compared to all the
economically developed countries participating in the study as measured by the
overall CIL score. Based on the CIL proficiency levels as defined by the Study, 15%
of Hong Kong students did not even reach Level 1 proficiency, which was the
lowest level that the Study was designed to assess. In fact, based on the expected
competencies at the different levels of proficiency (see Table 2.3), a person with CIL
proficiency below level 3 is seriously handicapped in his/her CIL ability to cope
with the everyday demands in the information world around us. Only 26% of the
students in Hong Kong achieved Level 3 or above while the corresponding
percentages were 34% and 35% respectively for Australia and Korea.
There is clearly a serious mismatch between the students’ CIL proficiency and the role played by computer and information technology in all aspects of social,
economic and political developments in Hong Kong.

48
A more refined analysis reveals important differences in students’ achievement across the seven CIL aspects in the assessment framework. Hong Kong students had the poorest performance in accessing and evaluating information, transforming information and sharing information, with a mean of lower than 40% correct in each of these three aspects, and in managing information (43% correct). Through comparing students’ competence profiles across the five proficiency levels from Below Level 1 to Level 4, it was found that Hong Kong students were not able to show similar advancement in all seven CIL aspects, whereas their Australian and Korean counterparts showed much more balanced improvement in all seven aspects. In particular, there was no significant advancement between Levels 3 and 4 in two of the lowest performing aspects, managing information and sharing information. This indicates that even for the highest performing students in Hong Kong, their learning experiences within and outside of the school did not help them to improve in critical CIL aspects. Clearly, these are issues of serious concern. In chapters 3 and 4, we will further explore the school level conditions and personal background characteristics that influence students’ CIL achievement.
49
Chapter 3
Influence of Students’ Background and ICT Use Experience on their CIL
Students’ CIL achievement is influenced by hierarchically embedded contextual factors at multiple levels, namely, the personal level (e.g. ability, interest), family level (e.g. socio- economic status (SES) factors such as parental occupation and education), school level (e.g. teachers’ qualifications) and system level (e.g. curriculum). The factors at each level can be further categorized into antecedents or processes. Process factors are those that directly influence students’ learning in CIL, such as their opportunities to use ICT at home and in school, and their teachers’ pedagogical ICT competences. Antecedent factors are those that influence the process factors. Examples of antecedents include students’ family SES, the school’s student intake and provisions for teachers’ professional development. Data pertaining to antecedent and process factors were collected through two approaches. The first is through the surveys of students, teachers, principals and ICT coordinators. The second is through a national context survey completed by each national research centre. These survey data allow us to investigate how factors at different levels may affect students’ CIL achievement.
3.1 Contextual Factors Derived from the Student Survey
Figure 3.1 depicts the conceptual framework adopted in ICILS 2013, based on which the context questionnaires were designed. This chapter reports on the findings related to the contextual data gathered through the student survey. All participating students, after completing the one-hour CIL performance assessment, were invited to take part in a 20-minutes online survey.
This survey was designed to collect information on the students’ personal and family background, as well as their use of and engagement with ICT at home and in school.

50
(Fraillon et al 2014, p.37) Figure 3.1 Contextual factors influencing students’ CIL outcomes
Table 3.1 lists the set of 13 variables derived from the student survey. Six of
these are antecedents (S_SEX, S_ISCED, S_NISB, S_BASEFF, S_ADVEFF,
S_INTRST), while the remaining seven can be considered as process indicators
(S_TSKLRN, S_USEAPP, S_USELRN, S_USESTD, S_USEREC, S_USECOM and
S_USEINF). Conceptually speaking, one may differentiate between antecedent and
process factors, but actually they mutually influence each other. For example, more
opportunities to learn to use ICT may help to develop students’ stronger interest and self-efficacy. In this chapter, we first report on the basic descriptive statistics
of these context variables and how they relate to the students’ CIL scores. This will be followed by multilevel analysis to explore how these factors together influence
the overall CIL score and the standardized scores of each of the seven CIL aspects
of a student.
Data collected through the student survey reflects the students’ experiences, and the classroom and school level conditions as perceived by the students. It is
important to note that variables derived from data collected through the student
survey may also reflect conditions at other levels. For example, students’ reported ICT usage in learning at school may be considered as a reflection of their teachers’ pedagogical use of ICT. However, for simplicity, we will initially treat all these
variables/factors as student level factors.
Also, we have limited our cross-national comparisons to only two countries,
Australia and Korea, so as to provide a sharper focus on systems that are of
stronger interest and familiarity to readers in Hong Kong.
Reports on the entire set of results from all of the 21 participating countries
can be found in Preparing for life in a digital age: The IEA International Computer and Information Literacy Study international report (Fraillon et al., 2014).

51
Table 3.1 List of key context variables* derived from the student questionnaire Context variable Description
S_SEX Gender of the student
S_ISCED Students’ own expected highest level of education reached
S_NISB National index of students’ socioeconomic background
S_BASEFF Self-efficacy in basic ICT skills (e.g. edit documents/photos, filing)
S_ADVEFF Self-efficacy in advanced ICT skills (e.g. handle viruses, create macro)
S_INTRST Interest and enjoyment in using ICT
S_TSKLRN Learning of CIL-related tasks at school (e.g. accessing, organizing and presenting information)
S_USEAPP Use of work-oriented ICT applications (incl. Office suite, programming, graphics and academic software)
S_USELRN Use of ICT during lessons at school in major, non-ICT school subjects
S_USESTD Use of ICT for study purposes (e.g. prepare assignments, collaborate)
S_USEREC Use of ICT for recreation (e.g. music, news, video, reading reviews)
S_USECOM Use of ICT for social communication (incl. texting & social media)
S_USEINF Use of ICT for exchanging information (e.g. posting on forums, blogs)
* Note: All except the first two variables are scaled indices derived from multiple item responses in the survey. For details of the construction of these scales, see Fraillon et al (2015) pp. 187-197.
3.2 Influence of Students’ Personal and Family Background
There were two questions in the student survey that collected personal background variables: gender of the student, and the highest level of education that the student expected himself/herself to reach. There were four kinds of family background variables elicited by the survey: whether the student has recent immigrant status, language spoken at home with respect to the language used in the CIL assessment, socioeconomic status (SES) and the availability of ICT resources at home. Findings related to these variables are reported in this section.

52
3.2.1 Gender and CIL achievement
In past IEA studies, gender differences in reading literacy were mostly in favour of female students while achievements in science and math were more commonly in favour of male students, though such trends are also changing and vary across countries. From the results of ICILS 2013, we find that girls perform better than boys in all participating countries, and such differences were significant in all but four countries. Table 3.2 presents the gender differences in the mean CIL score for Hong Kong, Australia and Korea against the international average. It shows that female students achieved an average of 25 score points higher than their male counterparts. This difference is higher than the international average, which is only an 18 point differences, but similar to that found in Australia. Table 3.2 Gender differences in CIL
3.2.2 Educational aspirations and CIL achievement
One of the questions in the student survey asked the student to indicate the highest level of educational qualification he/she expects to attain. Usually, students with higher academic achievement in school tend to have higher educational aspirations. Hence it is not surprising that in all participating countries, students with higher educational aspirations achieve significantly higher CIL scores. However, it is worth noting that this difference is lowest in Hong Kong. Table 3.3 shows the results for Hong Kong in comparison with the international mean and the two comparison countries.
Hong Kong (SAR) 498 (9.2) 523 (7.5) 25 (8.3)
ICILS 2013 average 491 (1.0) 509 (1.0) 18 (1.0)
Australia 529 (3.3) 554 (2.8) 24 (4.0)
Republic of Korea 517 (3.7) 556 (3.1) 38 (4.1)
* Statistically significant (p<0.05) coefficients in bold.
Gender difference
Gender
Educational systemsDifference(Females -
Males)
() Standard errors appear in parentheses. Because some results are rounded to the nearest w hole number, some totals may appear inconsistent.
MalesMean Scale
Score
FemalesMean Scale
Score 0 25 50
FemalesScoreHigher
Gender difference statistically
Gender difference not statistically signif icant.

53
Hon
g K
ong
(SA
R)
14(1
.2)
479
(13.
8)8
(0.8
)45
4(1
0.6)
15(0
.8)
494
(9.9
)63
(1.8
)52
8(5
.9)
48(1
1.1)
ICIL
S 2
013
aver
age
8(0
.2)
439
(2.6
)24
(0.3
)46
6(1
.4)
17(0
.2)
493
(1.4
)51
(0.4
)52
7(0
.9)
89(2
.6)
Aus
tralia
6(0
.4)
463
(7.0
)18
(0.9
)50
7(3
.7)
16(0
.7)
524
(3.2
)60
(1.2
)56
6(2
.4)
103
(7.3
)
Kor
ea, R
ep. o
f4
(0.4
)47
2(9
.8)
9(0
.7)
489
(7.0
)13
(0.7
)52
2(5
.2)
74(1
.0)
548
(2.9
)76
(9.8
)
* S
tatis
tical
ly s
igni
fican
t (p<
0.05
) coe
ffici
ents
in b
old.
Uppe
r-sec
onda
ry
educ
atio
nPo
st-s
econ
dary
non
-un
iver
sity
edu
catio
nTe
rtiar
y un
iver
sity
ed
ucat
ion
Scor
e po
int d
iffer
ence
be
twee
n lo
wes
t and
hig
hest
ca
tego
ry
Educ
atio
nal s
yste
ms
CIL
scor
e di
ffere
nce
(Ter
tiary
ed
ucat
ion
- lo
wer
se
cond
ary
or
belo
w)
Stud
ents
' exp
ecte
d ed
ucat
ion
leve
l
Low
er-s
econ
dary
ed
ucat
ion
or lo
wer
() S
tand
ard
erro
rs a
ppea
r in
pare
nthe
ses.
Bec
ause
som
e re
sults
are
roun
ded
to th
e ne
ares
t who
le n
umbe
r, so
me
tota
ls m
ay a
ppea
r in
cons
iste
nt.
Mea
n CI
L sc
ore
%M
ean
CIL
scor
e%
Mea
n CI
L sc
ore
%M
ean
CIL
scor
e%
025
5075
100
125
Diff
eren
ce s
tatis
tical
ly si
gnifi
cant
at .
05 le
vel.
Diff
eren
ce n
otst
atis
tical
ly si
gnifi
cant
.
Stud
ents
in
hi
ghes
tca
tego
rysc
ore
high
er
than
in
lowe
st
Tabl
e 3.3
The
per
cent
ages
of s
tude
nts a
t eac
h le
vel o
f edu
catio
nal a
spir
atio
n an
d th
eir r
espe
ctiv
e CIL
scor
es
54
3.2.3 Immigrant status and CIL achievement
With increasing globalization and population mobility, many studies, including
ICILS 2013, seek to find out the extent to which students’ immigrant status affects their academic achievement.
Immigrant status is often associated with lower achievement for two key
reasons: the language of instruction and testing may not be the language used at
home; and the fact that recent immigrants may have a lower socioeconomic status.
In ICILS 2013, there are three sets of questions to elicit these three background
factors separately.
A student with immigrant background is defined in this Study as one for
whom both parents (if in a two-parent household) or the one parent (if in single-
parent household) were born in another country. As can be expected, the
percentage of students with an immigrant background differs greatly across
countries. In some countries, this figure could be close to zero, as in the case of
Korea. Hong Kong students reported the highest percentage with an immigrant
background, at 37%. Australia also has a relatively high percentage of students
(25%) reporting an immigrant background. Internationally, students with an
immigrant background scored on average 29 points lower than those without.
However, for Hong Kong and Australia, students with immigrant background
scored slightly higher than those without, but statistically non-significant.
3.2.4 Language use at home and CIL achievement
While 37% of the participating students in Hong Kong reported having an
immigrant background, only 11% reported that the test language was not the
language spoken at home. This is probably because in Hong Kong each student
could choose to do their performance assessment in either English or Chinese,
irrespective of the language medium of instruction used in their school. Most of
the students with immigrant background were from Mainland China. Most of the
non-ethnic Chinese students studying in publicly funded schools in Hong Kong
come from South Asian countries such as Nepal, Bangladesh, Pakistan and India.
Hong Kong students who did not speak the test language at home had a
significantly lower CIL score (26 points) compared with those who did. This
difference is similar to the international average, which is 31 points lower.
Australia has 11% of their students reporting an immigrant background, who also
scored lower than those without immigrant background.
However, the difference in score was only 8, and was not statistically
different. For Korea, only 1% of their students did not speak the test language at
home, and the sample size for this group was too small to give a reliable estimate
of the CIL score.
55
3.2.5 Socioeconomic background and CIL achievement
Socioeconomic status (SES) is an important construct often found in the education literature, but there is no commonly agreed method for how to construct measures of SES. In ICILS 2013, there were three sets of questions related to SES: highest level of parental education reached, parent’s occupation status and home literacy resources (i.e. number of books at home). Based on students’ responses to these questions, the international research team computed an index of students’ socioeconomic background (S_NISB). The exact computation for this index differs across countries, depending on the principal component analysis of the variables.
Tables 3.4 and 3.5 show the percentages of students at different parental education levels and with different levels of home literacy respectively, and the mean CIL score for each of the SES groups. For Hong Kong in comparison to Australia, Korea and the international mean.
As expected, in all the participating countries, students with higher SES were found to perform better than those with lower SES. However, similar to the case of the students’ educational aspiration, Hong Kong students had the smallest difference in CIL scores between the lowest and highest SES category, and this is true irrespective of which of the three SES indicators, parental education, parental occupation or home literacy is used.
3.2.6 Home ICT resources and CIL achievement
ICT resources at home can be very broad, and can include access to computers and the Internet as well as learning resources and support available at home. The present study has taken a simple approach and used only two indicators for this construct: the number of computers at home and access to the Internet at home. By computers, the survey included desktops, notebooks, netbooks and tablets. Internet access included dial-up connection, broadband and mobile phone network. There is wide variation across countries in terms of home ICT resources.
Table 3.6 presents the percentages of students with different numbers of computers at home and their respective CIL scores Internationally, 48% of students reported that they have three or more computers at home while 6% reported having none. Of the 21 systems participating in ICILS 2013, there are six systems where more than 80% of students have three or more computers at home, including Australia. For Hong Kong this figure is 55%, which is much higher than the corresponding percentage in Korea, which is only 32%. Table 3.3 further shows that in both Hong Kong and Korea, 2% of the students did not have any computer at home while the corresponding figure for Australia was only 1%. In all cases, on average, students with a higher number of computers at home had higher CIL scores, which probably is a result that confounds with the SES of the students

56
Hon
g K
ong
(SAR
)19
(1.4
)49
6(8
.7)
50(1
.3)
511
(6.4
)10
(1.0
)52
3(9
.2)
21(1
.5)
516
(11.
9)20
(9.3
)
ICIL
S 2
013
aver
age
15(0
.2)
453
(2.9
)33
(0.3
)49
0(1
.2)
17(0
.2)
504
(1.5
)35
(0.3
)52
5(1
.3)
72(3
.1)
Aust
ralia
11(0
.7)
506
(5.1
)22
(0.7
)51
8(3
.5)
22(0
.8)
539
(3.3
)46
(1.0
)56
4(2
.8)
58(5
.4)
Kor
ea, R
ep. o
f1
(0.3
)50
7(1
6.2)
31(1
.3)
525
(3.7
)9
(0.6
)51
9(6
.3)
59(1
.6)
545
(3.1
)39
(16.
0)*
Sta
tistic
ally
sig
nific
ant (
p<0.
05) c
oeffi
cien
ts in
bol
d.
Scor
e po
int d
iffer
ence
be
twee
n lo
wes
t and
hig
hest
ca
tego
ry
%
CIL
scor
e di
ffere
nce
(Uni
vers
ity
educ
atio
n -
low
er
seco
ndar
y or
be
low
)%
Mea
n CI
L sc
ore
%M
ean
CIL
scor
eM
ean
CIL
scor
e%
Mea
n CI
L sc
ore
High
est P
aren
t Edu
catio
n
Low
er-s
econ
dary
ed
ucat
ion
or lo
wer
Uppe
r-sec
onda
ry
educ
atio
nPo
st-s
econ
dary
non
-un
iver
sity
edu
catio
nTe
rtiar
y un
iver
ity
educ
atio
n
Educ
atio
nal s
yste
ms
() S
tand
ard
erro
rs a
ppea
r in
pare
nthe
ses.
Bec
ause
som
e re
sults
are
roun
ded
to th
e ne
ares
t who
le n
umbe
r, so
me
tota
ls m
ay a
ppea
r inc
onsi
sten
t.
025
5075
100
125
150
Diff
eren
ce s
tatis
tical
ly si
gnifi
cant
at .
05 le
vel.
Diff
eren
ce n
otst
atis
tical
ly si
gnifi
cant
.Stud
ents
in
high
est
cate
gory
scor
ehi
gher
tha
n in
lowe
st
Tabl
e 3. 4
The
per
cent
ages
of s
tude
nts a
t eac
h le
vel o
f par
enta
l edu
catio
n re
ache
d an
d th
eir r
espe
ctiv
e CIL
scor
es
Hon
g K
ong
(SAR
)14
(1.3
)47
4(9
.1)
23(1
.2)
504
(9.3
)33
(1.2
)51
9(5
.5)
31(1
.8)
519
(9.8
)44
(7.7
)
ICIL
S 2
013
aver
age
11(0
.2)
453
(1.9
)23
(0.3
)47
9(1
.3)
32(0
.3)
505
(1.0
)35
(0.3
)52
3(1
.4)
70(2
.1)
Aust
ralia
9(0
.5)
482
(5.3
)13
(0.7
)51
0(4
.5)
31(0
.9)
539
(3.2
)47
(1.1
)56
3(2
.2)
82(5
.5)
Kor
ea, R
ep. o
f7
(0.5
)47
0(6
.5)
6(0
.5)
512
(9.0
)21
(0.8
)53
1(3
.9)
66(1
.0)
547
(2.7
)76
(6.6
)
* Sta
tistic
ally
sign
ifica
nt (p
<0.0
5) c
oeffi
cien
ts in
bol
d.()
Sta
ndar
d er
rors
app
ear i
n pa
rent
hese
s. B
ecau
se s
ome
resu
lts a
re ro
unde
d to
the
near
est w
hole
num
ber,
som
e to
tals
may
app
ear i
ncon
sist
ent.
Scor
e po
int d
iffer
ence
be
twee
n lo
wes
t and
hig
hest
ca
tego
ry
%M
ean
CIL
scor
e%
Mea
n CI
L sc
ore
%M
ean
CIL
scor
e%
Mea
n CI
L sc
ore
Hom
e Li
tera
cy
Cate
gory
1
(0 to
10
book
s)Ca
tego
ry 2
(11
to 2
5 bo
oks)
CIL
scor
e di
ffere
nce
(hig
hest
- lo
wes
t hom
e lit
erac
y ca
tego
ry)
Educ
atio
nal s
yste
ms
Cate
gory
3(2
6 to
100
boo
ks)
Cate
gory
4(>
100
book
s)
025
5075
100125150
Diff
eren
ce s
tatis
tical
ly si
gnifi
cant
at .
05 le
vel.
Diff
eren
ce n
otst
atis
tical
ly si
gnifi
cant
.Stud
ents
in
high
est
cate
gory
scor
ehi
gher
tha
n in
lowe
st
Tabl
e 3.5
The
per
cent
ages
of s
tude
nts a
t eac
h le
vel o
f hom
e lite
racy
and
thei
r res
pect
ive C
IL sc
ores

57
Hon
g K
ong
(SAR
)2
(0.4
)42
2(2
0.6)
19(1
.1)
501
(8.2
)24
(1.0
)50
5(7
.9)
55(1
.6)
518
(8.1
)95
(20.
1)
ICIL
S 2
013
aver
age
6(0
.2)
420
(3.9
)21
(0.3
)48
5(2
.0)
24(0
.2)
502
(1.2
)48
(0.3
)51
7(1
.2)
94(4
.0)
Aust
ralia
1(0
.2)
440
(14.
8)4
(0.4
)48
7(9
.0)
10(0
.6)
523
(4.4
)85
(0.8
)54
8(2
.2)
108
(15.
0)
Rep
ublic
of K
orea
2(0
.2)
474
(16.
1)33
(1.0
)52
7(3
.7)
33(1
.0)
539
(3.8
)32
(1.0
)54
6(3
.4)
72(1
5.0)
* S
tatis
tical
ly s
igni
fican
t (p<
0.05
) coe
ffici
ents
in b
old.
() S
tand
ard
erro
rs a
ppea
r in
pare
nthe
ses.
Bec
ause
som
e re
sults
are
roun
ded
to th
e ne
ares
t who
le n
umbe
r, so
me
tota
ls m
ay a
ppea
r inc
onsi
sten
t.
Scor
e po
int d
iffer
ence
bet
wee
n lo
wes
t and
hig
hest
cat
egor
y
%M
ean
CIL
scor
e
CIL
scor
e di
ffere
nce
(hig
hest
- lo
wes
t hom
e lit
erac
y ca
tego
ry)
No c
ompu
ter
One
com
pute
rTw
o co
mpu
ters
Thre
e or
mor
e co
mpu
ters
%M
ean
CIL
scor
e%
Mea
n CI
L sc
ore
%M
ean
CIL
scor
eEd
ucat
iona
l sys
tem
s0
2550
75100125150
Stu
dent
s in
hi
ghes
t ca
tego
rysc
ore
high
er th
an in
lo
wes
t
Diff
eren
ce s
tatis
tical
ly si
gnifi
cant
at .
05 le
vel.
Diff
eren
ce n
otst
atis
tical
ly si
gnifi
cant
.
Tabl
e 3.6
The
per
cent
ages
of s
tude
nts w
ith d
iffer
ent n
umbe
rs o
f com
pute
rs a
t hom
e and
thei
r res
pect
ive C
IL sc
ores

58
Figures in Table 3.6 also show that the biggest difference is between students
who have no computers at home and those who have access to at least one
computer. For both Hong Kong and Korea, the increases in mean CIL scores with
increasing numbers of computers were relatively small.
There were only 1% of students in Hong Kong who reported not having
Internet access at home, which is lower than the 2% who reported not having a
computer at home. This indicates that for some Hong Kong students, their access
to the Internet at home was only via their mobile phones. As the actual number for
this group of students was too small, it was not possible to obtain a reliable estimate
for their CIL. In addition to whether there is access, the means by which students
gain access to the Internet at home may also have influence on their CIL
achievement. However, responses from students indicate that many of them were
not clear about their exact means of access at home. Hence, any finer level of
analysis is not pursued.
3.3 Influence of Students’ ICT Self-efficacy and Interest
In addition to students’ personal and family background, their own self-perceived
competence with respect to ICT skills and interest in ICT use would likely have
impact on their CIL achievement. Questions with multiple items requiring
responses on a Likert scale were used to generate scale scores for each of these
perception related constructs.
3.3.1 Self-efficacy in basic ICT skills and CIL achievement
In the survey, students were asked to indicate how well they thought they could
handle each of 13 computer-based tasks on a Likert scale with three response
categories: “I know how to do this”, “I could work out how to do this”, and “I do not think I could do this”. Two scales can be constructed from these 13 tasks, one on Self-efficacy in Basic ICT Skills (S_BASEFF) from responses to six basic level tasks,
and the other on Self-efficacy in Advanced ICT Skills (S_ADVEFF) from responses to
seven relatively more advanced tasks. The six tasks comprising the S_BASEFF scale
are:
x Search for and find a file on your computer;
x Edit digital photographs or other graphic images;
x Create or edit documents (for example assignments for school);
x Search for and find information you need on the Internet;
x Create a multimedia presentation (with sound, pictures, or video); and
x Upload text, images or video to an online profile.

59
79(1
.4)
65
(1.3
)
75(1
.5)
79
(1.5
)
66(1
.5)
72
(1.5
)48
(0.5
)0.
40(0
.03)
87(0
.2)
73(0
.3)
81(0
.2)
89(0
.2)
64(0
.3)
77(0
.3)
50(0
.1)
0.32
(0.0
1)
91(0
.6)U
69(0
.7)V
90(0
.6)U
94(0
.5)U
73(0
.8)U
83(0
.7)U
52(0
.2)×
0.36
(0.0
2)
87(0
.7)
61(1
.1)T
80(0
.8)
87(0
.7)V
52(1
.1)T
73(1
.0)V
49(0
.2)Ø
0.42
(0.0
2)*
Perc
enta
ges
refle
ct s
tude
nts
that
sel
ecte
d "c
onfid
ent"
* St
atis
tical
ly s
igni
fican
t (p<
0.05
) coe
ffic
ient
s in
bol
d.( )
St
anda
rd e
rror
s ap
pear
in p
aren
thes
es. B
ecau
se s
ome
resu
lts a
re ro
unde
d to
the
near
est w
hole
num
ber,
som
e to
tals
may
app
ear i
ncon
sist
ent. #
Mea
n of
sca
le s
core
=50
SM
ore
than
10
perc
enta
ge p
oint
s ab
ove
ICIL
S av
erag
eÏ
Mor
e th
an 3
sco
re p
oint
s ab
ove
ICIL
S av
erag
eU
Sign
ifica
ntly
abo
ve IC
ILS
aver
age
×Si
gnifi
cant
ly a
bove
ICIL
S av
erag
eV
Sign
ifica
ntly
bel
ow IC
ILS
aver
age
ØSi
gnifi
cant
ly b
elow
ICIL
S av
erag
eT
Mor
e th
an 1
0 pe
rcen
tage
poi
nts
belo
w IC
ILS
aver
age
ÐM
ore
than
3 s
core
poi
nts
belo
w IC
ILS
aver
age
Ove
rall
stud
ents
' av
erag
e sc
ale
scor
e fo
r sel
f-ef
ficac
y in
ba
sic
ICT
skill
s (S
_BA
SEFF
) #
Corr
elat
ion
coef
ficie
nts
for
CIL
with
S_
BASE
FF
Aust
ralia
Kor
ea, R
ep. o
f
Stud
ents
' sel
f-effi
cacy
in b
asic
ICT
skill
s th
at a
re in
clud
ed in
sca
le s
core
S_B
ASE
FF
Crea
te a
mul
ti-m
edia
pr
esen
tatio
n (w
ith s
ound
, pi
ctur
es, o
r vi
deo)
Sear
ch fo
r and
fin
d a
file
on
your
com
pute
r
Edit
digi
tal
phot
ogra
phs
or
othe
r gra
phic
im
ages
Crea
te o
r edi
t do
cum
ents
(for
ex
ampl
e as
sign
men
ts fo
r sc
hool
)
Sear
ch fo
r and
fin
d in
form
atio
n yo
u ne
ed o
n th
e In
tern
et
Uplo
ad te
xt,
imag
es o
r vi
deo
to a
n on
line
prof
ileEd
ucat
iona
l Sys
tem
Hon
g K
ong
(SAR
)
ICIL
S 2
013
aver
age
Tabl
e 3.7
The
per
cent
ages
of s
tude
nts c
onfid
ent i
n pe
rfor
min
g ea
ch b
asic
ICT
skill
s tas
k, S
_BA
SEFF
and
cor
rela
tion
with
CIL
scor
es
60
To compute students’ self-confidence in each of the above tasks, students
who responded “I could work out how to do this” and “I do not think I could do this” were collapsed into one category as not confident. Table 3.7 presents the percentages of students who reported to be confident in each of these six tasks. It
can be seen that internationally and in Hong Kong, students had the highest
confidence in file searching on their own computers and information search on the
Internet. There is somewhat more variations in terms of which tasks students were
least confident in. Overall, students found editing digital photographs or other
graphic images and creating multimedia presentations to be the most difficult. In
Hong Kong, each of the six task areas had at least 65% of students claiming
confidence in their ability to perform them. Further, this self-proclaimed
confidence was relatively uniform across tasks for Hong Kong students.
In terms of the overall self-efficacy score for basic ICT skills (S_BASEFF,
coefficient alpha=0.76), Hong Kong is very similar to the international average, as
are both Australia and Korea. Furthermore this score significantly correlates with
the students’ CIL scores for all participating countries. The correlation coefficient is about 0.4 for all three systems, as presented in Table 3.7.
3.3.2 Self-efficacy in advanced ICT skills and CIL achievement
Seven tasks were included in the construction of the Self-efficacy in Advanced ICT Skills scale (S_ADVEFF):
x Use software to find and get rid of viruses;
x Create a database (for example using [Microsoft Access ®]);
x Build or edit a webpage;
x Change the settings on your computer to improve the way it operates or to
fix problems;
x Use a spreadsheet to do calculations, store data or plot a graph;
x Create a computer program or macro (for example in [Basic]); and
x Set up a computer network.
Table 3.8 presents the percentages of students who reported to be confident
in each of the seven advanced ICT tasks. It is clear that these percentages are much
lower compared to those in Table 3.7 for the basic ICT tasks. The task that students
were least confident about is to create a computer program or macro. Interestingly,
students in two of the highest ICILS performing countries, Australia and Korea,
reported a lower level of confidence in this task compared to the international
average. Hong Kong students report the second highest confidence in this task
(28%), which is below that of Turkey and the same as Slovenia. It is thus apparent
that countries with high CIL performance did not put emphasis on the teaching of
programming.

61
There are two advanced ICT tasks for which more than half of the students
internationally have confidence in handling: changing the settings on a computer
to fix problems or improve its performance, and using a spreadsheet for
computation or graphing. Interestingly, less than 40% of Korean students reported
having confidence in either of these two tasks, indicating that these two skills may
be curriculum related. Generally, Hong Kong students report a higher level of
confidence than the international average in all of the advanced ICT tasks, except
for setting up a computer network. It is noteworthy that Korea is the only country
for which more than half of the students (56%) reported having confidence in
setting up a computer network. An index for self-efficacy in advanced ICT skills
was similarly computed (S_ADVEFF, coefficient alpha=0.80) with an international
mean of 50 and one standard deviation of 10 points. Results in Table 3.8 show that
the national means for all the participating countries were very close to 50, which
is similar to the case with S_BASEFF. However, the picture becomes very different
when we examine the correlation coefficients between students’ S_ADVEFF and CIL scores, which were much lower than those for S_BASEFF and were smaller
than 0.1 for most countries. The correlation coefficient was significant for only half
of the countries, with eight of these being negative out of the 21 participating
countries. As the advanced ICT tasks are more specialized, students are most likely
to have learnt them through specialized instruction, especially through computer-
related subjects. The low correlation of S_ADVEFF with students’ CIL scores indicates that (1) teaching about how to use computers is not adequate in fostering
students’ CIL abilities, and (2) it is not necessary to possess advanced ICT skills to
be competent in CIL.
3.3.3 Interest and enjoyment in using ICT and CIL achievement
Data on students’ interest and enjoyment in using ICT was gathered through responses to seven statements on a four-point Likert scale (response categories:
“strongly agree,” “agree,” “disagree,” “strongly disagree”). The seven statements are as follows:
x It is very important to me to work with a computer;
x I think using a computer is fun;
x It is more fun to do my work using a computer than without a computer;
x I use a computer because I am very interested in the technology;
x I like learning how to do new things using a computer;
x I often look for new ways to do things using a computer; and
x I enjoy using the Internet to find out information.
Table 3.9 presents the percentages of students who indicated “agree” or “strongly agree” with each of the above statements and the scale scores for the interest and enjoyment in computing scale (S_INTRST, coefficient alpha ≥ 0.74 for all countries).

62
Tabl
e 3.8
The
per
cent
ages
of s
tude
nts c
onfid
ent i
n pe
rfor
min
g ea
ch b
asic
ICT
skill
s tas
k, S
_AD
VEF
F an
d co
rrel
atio
n w
ith C
IL sc
ores
53(1
.2)
37
(1.4
)
42(1
.2)
59
(1.4
)
64(1
.5)
28
(1.3
)
29(1
.3)
51
(0.3
)
0.09
(0.0
)
47(0
.3)
30(0
.3)
38(0
.3)
57(0
.3)
54(0
.3)
21(0
.3)
35(0
.3)
50(0
.1)
0.04
(0.0
)
32(0
.9)T
24(0
.9)V
31(1
.0)V
59(0
.8)
50(1
.1)V
17(0
.7)V
27(0
.8)V
48(0
.2)Ø
0.04
(0.0
)
55(1
.0)U
25(0
.9)V
37(0
.8)
38(1
.0)T
35(1
.0)T
16(0
.8)V
56(1
.0)S
52(0
.2)×
0.13
(0.0
)*
Perc
enta
ges
refle
ct s
tude
nts
that
sel
ecte
d "c
onfid
ent"
* St
atis
tical
ly s
igni
fican
t (p<
0.05
) coe
ffic
ient
s in
bol
d.( )
St
anda
rd e
rror
s ap
pear
in p
aren
thes
es. B
ecau
se s
ome
resu
lts a
re ro
unde
d to
the
near
est w
hole
num
ber,
som
e to
tals
may
app
ear i
ncon
sist
ent.
#M
ean
of s
cale
sco
re =
50S
Mor
e th
an 1
0 pe
rcen
tage
poi
nts
abov
e IC
ILS
aver
age
ÏM
ore
than
3 s
core
poi
nts
abov
e IC
ILS
aver
age
USi
gnifi
cant
ly a
bove
ICIL
S av
erag
e×
Sign
ifica
ntly
abo
ve IC
ILS
aver
age
VSi
gnifi
cant
ly b
elow
ICIL
S av
erag
eØ
Sign
ifica
ntly
bel
ow IC
ILS
aver
age
TM
ore
than
10
perc
enta
ge p
oint
s be
low
ICIL
S av
erag
eÐ
Mor
e th
an 3
sco
re p
oint
s be
low
ICIL
S av
erag
e
Ove
rall
stud
ents
' av
erag
e sc
ale
scor
e fo
r sel
f-ef
ficac
y in
ad
vanc
ed IC
T sk
ills
(S_A
DVEF
F) #
Corr
elat
ion
coef
ficie
nts
for
CIL
with
S_
ADV
EFF
Kor
ea, R
ep. o
f
Use
a sp
read
shee
t to
do c
alcu
latio
ns,
stor
e da
ta o
r plo
t a
grap
h
Crea
te a
co
mpu
ter
prog
ram
or
mac
ro (f
or
exam
ple
in
[Bas
ic, V
isua
l Ba
sic]
)
Use
softw
are
to
find
and
get r
id o
f vi
ruse
s
Crea
te a
da
taba
se (f
or
exam
ple
usin
g [M
icro
soft
Acce
ss ®
])Bu
ild o
r edi
t a
web
page
Chan
ge th
e se
tting
s on
you
r co
mpu
ter t
o im
prov
e th
e w
ay
it op
erat
es o
r to
fix p
robl
ems
Stud
ents
' sel
f-effi
cacy
in a
dvan
ced
ICT
skill
s th
at a
re in
clud
ed in
sca
le s
core
S_A
DVEF
F
Educ
atio
nal S
yste
m
Hon
g K
ong
(SAR
)
ICIL
S 2
013
aver
age
Aust
ralia
Set u
p a
com
pute
r ne
twor
k

63
Tabl
e 3.9
Per
cent
ages
of s
tude
nts a
gree
ing
with
stat
emen
ts a
bout
com
pute
rs, S
_IN
TRST
and
cor
rela
tion
with
CIL
scor
es
92(0
.7)
92
(1.0
)
77(1
.0)
69
(1.3
)
86(1
.1)
80
(1.1
)
93(0
.8)
50(0
.4)
0.12
(0.1
)
89(0
.2)
91(0
.2)
83(0
.2)
63(0
.3)
91(0
.2)
78(0
.2)
92(0
.2)
50(0
.1)
0.08
(0.0
)
88(0
.6)
93(0
.5)U
85(0
.6)U
65(0
.9)U
91(0
.5)
75(0
.8)V
93(0
.5)
49(0
.2)Ø
0.11
(0.0
)
79(0
.9)T
88(0
.6)V
76(0
.9)V
42(1
.3)T
86(0
.8)V
67(0
.9)T
88(0
.7)V
46(0
.3)Ð
0.11
(0.0
)*
Perc
enta
ges
refle
ct s
tude
nts
that
sel
ecte
d "S
trong
ly A
gree
" or "
Agr
ee".
* St
atis
tical
ly s
igni
fican
t (p<
0.05
) coe
ffic
ient
s in
bol
d.( )
St
anda
rd e
rror
s ap
pear
in p
aren
thes
es. B
ecau
se s
ome
resu
lts a
re ro
unde
d to
the
near
est w
hole
num
ber,
som
e to
tals
may
app
ear i
ncon
sist
ent.
#M
ean
of s
cale
sco
re =
50S
Mor
e th
an 1
0 pe
rcen
tage
poi
nts
abov
e IC
ILS
aver
age
ÏM
ore
than
3 s
core
poi
nts
abov
e IC
ILS
aver
age
USi
gnifi
cant
ly a
bove
ICIL
S av
erag
e×
Sign
ifica
ntly
abo
ve IC
ILS
aver
age
VSi
gnifi
cant
ly b
elow
ICIL
S av
erag
eØ
Sign
ifica
ntly
bel
ow IC
ILS
aver
age
TM
ore
than
10
perc
enta
ge p
oint
s be
low
ICIL
S av
erag
eÐ
Mor
e th
an 3
sco
re p
oint
s be
low
ICIL
S av
erag
e
Aust
ralia
Kor
ea, R
ep. o
f
I ofte
n lo
ok
for n
ew w
ays
to d
o th
ings
us
ing
a co
mpu
ter
It is
ver
y im
port
ant t
o m
e to
wor
k w
ith a
co
mpu
ter
I thi
nk u
sing
a
com
pute
r is
fun
It is
mor
e fu
n to
do
my
wor
k us
ing
a co
mpu
ter
than
with
out a
co
mpu
ter
I use
a
com
pute
r be
caus
e I a
m
very
in
tere
sted
in
the
tech
nolo
gy
I lik
e le
arni
ng
how
to d
o ne
w th
ings
us
ing
a co
mpu
ter
Corr
elat
ion
coef
ficie
nts
for
CIL
with
S_
INTR
ST
Stud
ents
' int
eres
t and
enj
oym
ent i
n us
ing
com
pute
rs th
at a
re in
clud
ed in
sca
le s
core
S_I
NTRS
T
Educ
atio
nal S
yste
m
Hon
g K
ong
(SAR
)
ICIL
S 2
013
aver
age
I enj
oy u
sing
th
e In
tern
et
to fi
nd o
ut
info
rmat
ion
Ove
rall
stud
ents
' av
erag
e sc
ale
scor
e fo
r in
tere
st a
nd
enjo
ymen
t in
usin
g co
mpu
ters
(S
_INT
RST)
#
64
It is interesting to note that the statement “I use a computer because I am very interested in the technology” had the lowest percentage agreement among all seven statements from students in all participating countries. Furthermore, international results presented in Fraillon et al. (2014, p.162) show that countries scoring the highest agreement for this statement (reaching 79% and above) were also countries that had the highest percentages of students not having access to any computer at home: Thailand (28%), Chile (7%) and Turkey (31%). This indicates that interest in the technology per se wears off for some students once they have ready access to computers. Over 90% of the students in Hong Kong find it important and fun to use a computer and enjoy finding information on the Internet.
Results in Table 3.9 also show that Hong Kong students’ overall interest and enjoyment in computing scale score is similar to the international average. It is also observed that students’ S_INTRST scores were positively correlated with their CIL scores for most countries. For Hong Kong, Australia and Korea, the correlation coefficients were statistically significant at around 0.11 to 0.12.
3.4 Influence of Students’ ICT Use Experience at Home and in School
Other than eliciting students’ perceptions of their own self-efficacy in ICT skills, and interest and enjoyment in computing, the survey also asked about students’ use of computers within and outside of school. In this section, we will report on how Hong Kong students’ computer use compares with Australia, Korea and the international means, and if computer use correlates with students’ CIL achievement.
3.4.1 Computer experience and CIL achievement
Students’ history of using computers affects their familiarity with ICT and hence also their CIL proficiency. Table 3.10 presents the number of years of using computers as reported by the students. It shows clearly that students have generally used computers for a very substantial period of time. Internationally, 64% of students reported having used computers for at least five years. This figure is even higher for Hong Kong, at 72%, which is lower than Australia (78%) but slightly higher than Korea (69%). The percentages of students reporting less than one year of computing experience is at a low, single digit, except for Thailand (23%) and Turkey (22%). The average length of time these millennials, aged about 14, had been using computers was six, clearly matching the description of being the digital generation from this respect.

65
2(0
.4)
7(0
.7)
19(0
.9)
27(1
.0)
45(1
.4)
6(0
.1)
6(1
.2)
2(0
.8)
5(0
.2)
9(0
.2)
20(0
.2)
29(0
.3)
36(0
.3)
6(0
.0)
9(0
.3)
6(0
.3)
1(0
.2)
5(0
.4)
15(0
.6)
28(0
.8)
50(1
.1)
6(0
.0)
10(0
.7)
6(0
.9)
5(0
.4)
11(0
.7)
15(0
.8)
25(0
.9)
44(1
.1)
6(0
.1)
10(0
.7)
7(1
.0)
* St
atis
tical
ly s
igni
fican
t (p<
0.05
) coe
ffic
ient
s in
bol
d.( )
St
anda
rd e
rror
s ap
pear
in p
aren
thes
es. B
ecau
se s
ome
resu
lts a
re ro
unde
d to
the
near
est w
hole
num
ber,
som
e to
tals
may
app
ear i
ncon
sist
ent.
Leng
th o
f tim
e us
ing
com
pute
rsAv
erag
e le
ngth
of
time
usin
g co
mpu
ters
(y
ears
)
Effe
ct o
f com
pute
r ex
perie
nce
on
CIL
scor
e
Less
than
on
e ye
ar
At le
ast o
ne
year
but
le
ss th
an
thre
e ye
ars
At le
ast
thre
e ye
ars
but l
ess
than
five
At le
ast f
ive
year
s bu
t le
ss th
an
seve
n ye
ars
Seve
n or
m
ore
year
s
Diffe
renc
e in
sco
re
poin
ts p
er
year
of
Varia
nce
expl
aine
dEd
ucat
iona
l Sys
tem
Hon
g K
ong
(SAR
)
ICIL
S 2
013
aver
age
Aust
ralia
Kor
ea, R
ep. o
f
Tabl
e 3.1
0 Pe
rcen
tage
s of s
tude
nts w
ith d
iffer
ent y
ears
of e
xper
ienc
e with
com
pute
rs

66
The last two columns in Table 3.10 show the bivariate regression results
between students’ years of computer experience and their CIL scores. In all
countries, there is a positive association between years of computer experience and
CIL score, which is statistically significant except for Germany. There is an average
increase of nine score points associated with one additional year of computer
across all countries, with years of computer experience accounting for 6% of the
total CIL score variance. For Hong Kong, the association is lower, with an increase
of six score points per additional year of computer experience.
In addition to finding out about students’ years of computer experience, the survey asked students about the frequency with which they use computers at
various locations. Defining computer use at least once a week as frequent use,
Table 3.11 records the percentages of students who reported frequent computer
use at home, at school and at other places (such as local library, Internet café).
Across all countries, a majority of students used computers at home at least
once a week (average=87%), whereas only 54% did so at school, and only 13% used
computers frequently at other places.
Australia had the highest percentage of students with frequent computer use
at school, at 81%. Korea and Thailand had the highest percentage of students
reporting frequent use of computers outside of the home or school, at 30% and 31%
respectively.
Korea stands out as the only country where more students reported frequent
use of computers at places other than school. This could be related to the high levels
of participation of school children in private tutoring and the Korean government’s efforts to reduce the financial burden of private tutoring by launching in 2004 the
Cyber Home Learning System (CHLS) to reduce the need for fee-paying tutoring
(Bray and Lykins, 2012). In 2013, an average of 60.2% of Korean students from
Elementary to High School and 50.5% middle school students participated in after-
school programs (KOSIS, 2014).
For Hong Kong, the percentages of students reporting frequent use of
computers at various locations were very similar to the international average, and
the percentage of students using computers frequently in places other than at home
or school were lower than the international average.

67
Table 3.11 Percentages of students with frequent computer use (i.e. at least once a week) at home, school and other places
3.4.2 Use of computers for and at school
While it is expected that the number of years of computer use experience and the frequency of use would influence students’ CIL proficiency, the nature and purposes of use probably also affect their CIL outcomes. In this section, we report on the context, purpose and tasks for students’ use of computers at school, and how these factors influence their CIL scores. Use of computers in different subject areas (S_USELRN): The survey asked students how often they used computers during lessons in eight subject areas, giving them five response options: “never,” “in some lessons,” “in most lessons,” “in every or almost every lesson,” and “I don’t study this subject/these subjects.” Table 3.12 presents the percentages of students who responded that they used computers “in most lessons” or “in every or almost every lesson.” Those responding, “I don’t study this subject/these subjects,” are treated as missing responses.
The results of the survey show that internationally, for nearly all school subject areas, the percentages of students who reported that computers were used in most or almost every lesson were relatively low, between 11% and 21%. The only exception was computer related subjects such as information technology, registering 56%.
88 (1.0) 57 (2.0) 8 (0.7)
87 (0.2) 54 (0.5) 13 (0.2)
87 (0.7) 81 (1.3) S 9 (0.5) V
71 (1.2) T 18 (2.1) T 30 (1.3) S
( ) Standard errors appear in parentheses. Because some results are rounded to the nearest w hole number, some totals may appear inconsistent.
S More than 10 percentage points above ICILS averageU Signif icantly above ICILS averageV Signif icantly below ICILS averageT More than 10 percentage points below ICILS average
At home At school
Percentage of students using a computer at least once a week
At other places (for example local library,
internet cafe)
Educational System
Hong Kong (SAR)
ICILS 2013 average
Australia
Korea, Rep. of

68
12(1
.1)
13
(1.2
)
9(1
.2)
15
(1.1
)
15(1
.4)
45
(0.5
)-0
.13
(0.0
)11
(1.1
) 81
(1.6
)
8(1
.0)
16(0
.3)
17(0
.3)
14(0
.3)
21(0
.3)
20(0
.3)
50(0
.1)
0.00
(0.0
)11
(0.2
)56
(0.4
)11
(0.2
)
34(1
.8)S
24(1
.9)U
23(1
.8)U
34(1
.8)S
42(1
.7)S
57(0
.3)Ï
0.15
(0.0
)14
(0.9
)U
58(1
.8)
14(0
.8)
U
25(1
.2)U
37(1
.2)S
15(1
.0)
30(1
.2)U
22(1
.2)
49(0
.3)Ø
0.13
(0.0
)18
(0.8
)U
33(1
.7)T
19(0
.9)
U
*Pe
rcen
tage
s re
flect
stu
dent
s th
at s
elec
ted
"in m
ost l
esso
ns" o
r "in
eve
ry o
r alm
ost e
ery
less
on"
*St
atis
tical
ly s
igni
fican
t (p<
0.05
) coe
ffic
ient
s in
bol
d.( )
St
anda
rd e
rror
s ap
pear
in p
aren
thes
es. B
ecau
se s
ome
resu
lts a
re ro
unde
d to
the
near
est w
hole
num
ber,
som
e to
tals
may
app
ear i
ncon
sist
ent.
#M
ean
of s
cale
sco
re =
50S
Mor
e th
an 1
0 pe
rcen
tage
poi
nts
abov
e IC
ILS
aver
age
ÏM
ore
than
3 s
core
poi
nts
abov
e IC
ILS
aver
age
USi
gnifi
cant
ly a
bove
ICIL
S av
erag
e×
Sign
ifica
ntly
abo
ve IC
ILS
aver
age
VSi
gnifi
cant
ly b
elow
ICIL
S av
erag
eØ
Sign
ifica
ntly
bel
ow IC
ILS
aver
age
TM
ore
than
10
perc
enta
ge p
oint
s be
low
ICIL
S av
erag
eÐ
Mor
e th
an 3
sco
re p
oint
s be
low
ICIL
S av
erag
e
Hong
Kon
g (S
AR)
ICIL
S 2
013
aver
age
Aust
ralia
Kor
ea, R
ep. o
f
Stud
ents
' use
of I
CT d
urin
g le
sson
s at
sch
ool t
hat a
re in
clue
d in
sca
le s
core
S_
USEL
RN
Lang
uage
arts
: te
st la
ngua
ge
Lang
uage
arts
: fo
reig
n or
oth
er
natio
nal
lang
uage
sM
athe
mat
ics
Scie
nces
(g
ener
al
scie
nce
and/
or
phys
ics,
ch
emis
try,
biol
ogy,
ge
olog
y, e
arth
sc
ienc
es)
Educ
atio
nal S
yste
m
Crea
tive
arts
(v
isua
l arts
, m
usic
, dan
ce,
dram
a et
c.)
Info
rmat
ion
tech
nolo
gy,
com
pute
r st
udie
s or
si
mila
r
Oth
er (p
ract
ical
or
voca
tiona
l sub
ject
s,
mor
al/e
thic
s, p
hysi
cal
educ
atio
n, h
ome
econ
omic
s, p
erso
nal
and
soci
al
deve
lopm
ent)
Hum
an
scie
nces
/H
uman
ities
(h
isto
ry,
geog
raph
y,
civi
cs, l
aw,
econ
omic
s et
c.)
Ove
rall
stud
ents
' av
erag
e sc
ale
scor
e fo
r use
of
ICT
durin
g le
sson
s at
sc
hool
(S
_USE
LRN)
#
Corr
elat
ion
coef
ficie
nts
for
CIL
with
S_
USEL
RN
Tabl
e 3.1
2 Pe
rcen
tage
s of s
tude
nts u
sing
com
pute
rs in
mos
t les
sons
or a
lmos
t eve
ry le
sson
in d
iffer
ent l
earn
ing
area
s, S
_UEL
RN
and
as
soci
atio
n w
ith C
IL sc
ore
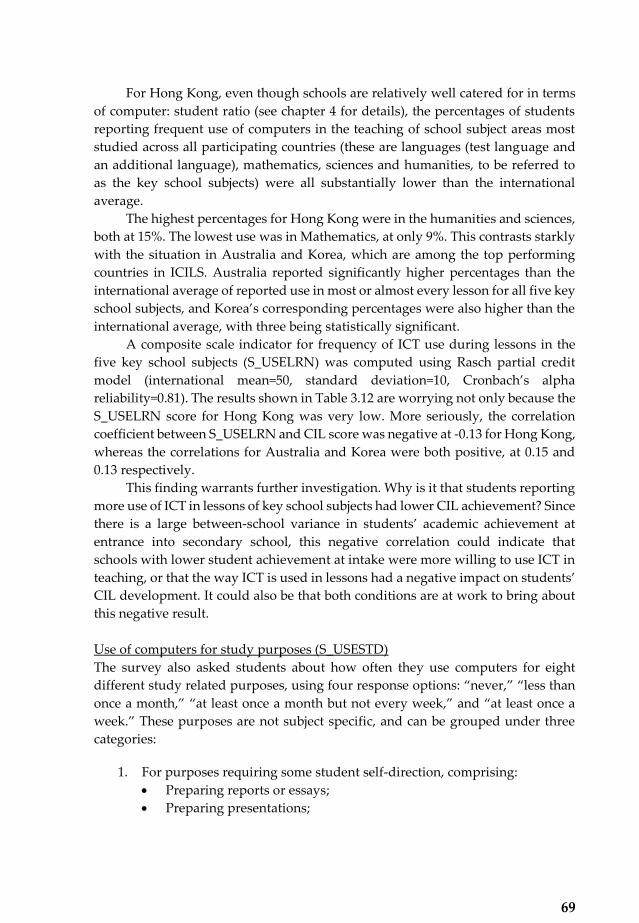
69
For Hong Kong, even though schools are relatively well catered for in terms of computer: student ratio (see chapter 4 for details), the percentages of students reporting frequent use of computers in the teaching of school subject areas most studied across all participating countries (these are languages (test language and an additional language), mathematics, sciences and humanities, to be referred to as the key school subjects) were all substantially lower than the international average.
The highest percentages for Hong Kong were in the humanities and sciences, both at 15%. The lowest use was in Mathematics, at only 9%. This contrasts starkly with the situation in Australia and Korea, which are among the top performing countries in ICILS. Australia reported significantly higher percentages than the international average of reported use in most or almost every lesson for all five key school subjects, and Korea’s corresponding percentages were also higher than the international average, with three being statistically significant.
A composite scale indicator for frequency of ICT use during lessons in the five key school subjects (S_USELRN) was computed using Rasch partial credit model (international mean=50, standard deviation=10, Cronbach’s alpha reliability=0.81). The results shown in Table 3.12 are worrying not only because the S_USELRN score for Hong Kong was very low. More seriously, the correlation coefficient between S_USELRN and CIL score was negative at -0.13 for Hong Kong, whereas the correlations for Australia and Korea were both positive, at 0.15 and 0.13 respectively.
This finding warrants further investigation. Why is it that students reporting more use of ICT in lessons of key school subjects had lower CIL achievement? Since there is a large between-school variance in students’ academic achievement at entrance into secondary school, this negative correlation could indicate that schools with lower student achievement at intake were more willing to use ICT in teaching, or that the way ICT is used in lessons had a negative impact on students’ CIL development. It could also be that both conditions are at work to bring about this negative result. Use of computers for study purposes (S_USESTD) The survey also asked students about how often they use computers for eight different study related purposes, using four response options: “never,” “less than once a month,” “at least once a month but not every week,” and “at least once a week.” These purposes are not subject specific, and can be grouped under three categories:
1. For purposes requiring some student self-direction, comprising: x Preparing reports or essays; x Preparing presentations;

70
2. Organizing your time and work; and x Writing about your learning. x For collaboration, comprising: x Working with other students from your own school; and x Working with other students from other schools.
3. For drill and practice type of purpose, comprising: x Completing worksheets or exercises; and x Completing tests.
Table 3.13 presents the percentages of students who report using computers
at least once a month for each of the above purposes. The Table also presents the composite scale score for the extent of using computers for school-related purposes (S_USESTD, computed using Rasch partial credit model with international average=50, standard deviation=10, and Cronbach’s alpha scale reliability=0.83), and the correlation of the scale scores with students’ CIL scores.
Internationally, the highest reported use is for preparation of reports or essays, and Australia reported the highest percentage for this purpose, at 70%. On the other hand, Hong Kong students reported the highest percentage use for completing worksheets or exercises (51%), which is also the only purpose for which more than half of the students reported using computers at least once a month.
A more careful examination shows that Hong Kong students’ computer use frequency for all four study purposes that require some student self-direction were lower than the international average, while use for collaboration with students from within or outside the students’ own school were both higher than the international mean. It is interesting to note that the percentage of computer use for study purposes reported by Korean students were all significantly lower than the international average, while the opposite was true for Australian students except for collaborating with students from other schools.
Despite the wide variations in frequency of computer use for study purposes across Hong Kong, Australia and Korea, all three systems record a similarly fixed and positive correlation between S_USESTD, which is much higher than that for the corresponding international correlation.
This indicates that at least for these three systems, students’ use of computers for study purposes has a positive association with CIL scores, irrespective of the exact level of average use. Furthermore, it may not be meaningful to consider the international correlation coefficient due to the wide differences in the actual levels of use across different countries.

71
43(1
.7)
36
(1.4
)
25(1
.4)
17
(1.1
)
44(1
.8)
19
(1.2
)
51(1
.3)
27
(1.3
)50
(0.4
)0.
11(0
.0)
45(0
.3)
44(0
.4)
30(0
.3)
19(0
.2)
40(0
.3)
13(0
.2)
39(0
.3)
33(0
.3)
50(0
.1)
0.04
(0.0
)
70(1
.0)S
68(1
.1)S
45(1
.2)S
22(0
.9)U
56(1
.2)S
11(0
.6)V
64(1
.3)S
44(1
.1)S
54(0
.3)Ï
0.15
(0.0
)
21(1
.0)T
23(1
.1)T
17(0
.8)T
16(0
.7)V
16(0
.8)T
11(0
.7)V
20(0
.8)T
17(0
.8)T
44(0
.3)Ð
0.13
(0.0
)*
Perc
enta
ges
refle
ct s
tude
nts
that
sel
ecte
d "A
t lea
st o
nce
a m
onth
but
not
eve
ry w
eek"
& "A
t lea
st o
nce
a w
eek"
*St
atis
tical
ly s
igni
fican
t (p<
0.05
) coe
ffic
ient
s in
bol
d.( )
St
anda
rd e
rror
s ap
pear
in p
aren
thes
es. B
ecau
se s
ome
resu
lts a
re ro
unde
d to
the
near
est w
hole
num
ber,
som
e to
tals
may
app
ear i
ncon
sist
ent.
#M
ean
of s
cale
sco
re =
50S
Mor
e th
an 1
0 pe
rcen
tage
poi
nts
abov
e IC
ILS
aver
age
ÏM
ore
than
3 s
core
poi
nts
abov
e IC
ILS
aver
age
USi
gnifi
cant
ly a
bove
ICIL
S av
erag
e×
Sign
ifica
ntly
abo
ve IC
ILS
aver
age
VSi
gnifi
cant
ly b
elow
ICIL
S av
erag
eØ
Sign
ifica
ntly
bel
ow IC
ILS
aver
age
TM
ore
than
10
perc
enta
ge p
oint
s be
low
ICIL
S av
erag
eÐ
Mor
e th
an 3
sco
re p
oint
s be
low
ICIL
S av
erag
e
Kor
ea, R
ep. o
f
Ove
rall
stud
ents
' av
erag
e sc
ale
scor
e fo
r use
of
ICT
for s
tudy
pu
rpos
es
(S_U
SEST
D) #
Corr
elat
ion
coef
ficie
nts
for
CIL
with
S_
USES
TD
Educ
atio
nal S
yste
m
Hon
g K
ong
(SAR
)
ICIL
S 2
013
aver
age
Aust
ralia
Wor
king
with
ot
her s
tude
nts
from
oth
er
scho
ols
Com
plet
ing
wor
kshe
ets
or
exer
cise
sCo
mpl
etin
g te
sts
Stud
ents
' use
of I
CT fo
r stu
dy p
urpo
ses
that
are
incl
uded
in s
cale
sco
re S
_USE
STD
Prep
arin
g re
ports
or
essa
ys
Prep
arin
g pr
esen
tatio
ns
Org
anis
ing
your
tim
e an
d w
ork
Writ
ing
abou
t yo
ur le
arni
ng
Wor
king
with
ot
her s
tude
nts
from
you
r ow
n sc
hool
Tabl
e 3.1
3 Pe
rcen
tage
s of s
tude
nts u
sing
com
pute
rs fo
r stu
dy p
urpo
ses a
t lea
st o
nce a
mon
th, S
_USE
STD
and
ass
ocia
tion
with
CIL
scor
e

72
Learning of CIL related tasks at school (S_TSKLRN) There is one question in the survey that asked students whether or not they have learnt each of the following eight CIL-related tasks at school, which could be categorized according to the two CIL competency strands:
1. Collecting and managing information:
x Accessing information with a computer; x Looking for different types of digital information on a topic; x Deciding where to look for information about an unfamiliar topic; x Working out whether to trust information from the Internet; x Deciding what information is relevant to include in school work; x Organizing information obtained from Internet sources.
2. Producing and exchanging information x Presenting information for a given audience or purpose with a computer; x Providing references to Internet sources.
Table 3.14 presents the percentages of students reporting having learnt each
of these tasks at school. The results show that in Hong Kong and internationally, accessing information with a computer was the one task that more than 80% of students have learnt in school. This was also the task with the highest percentage of students reporting having learnt at school, although that was only 74%. The task that Hong Kong students were least prepared for was on evaluating information—working out whether to trust information from the Internet, with only 53% reporting having an opportunity to learn this at school. Australian students reported significantly higher percentages of having learnt in school all of the eight CIL- related tasks compared to the international means, whereas all the corresponding percentages for Korean students were significantly lower than the international means. This observation is similar to the statistics on the percentages of students using computers for study purposes at least once a month reported earlier.
Rasch partial credit model was also applied to compute a scale on students having learnt CIL-related tasks at school (S_TSKLRN, international average=50, standard deviation=10, and Cronbach’s alpha scale reliability=0.81). Hong Kong’s score is below the international mean at 48, and Korea is even lower, at 46, while Australian is significantly higher, at 54. The correlation coefficients between S_TSKLRN and CIL scores were positive internationally and for the three systems listed in Table 3.13. However, this coefficient is much higher for Hong Kong and Australia, both at 0.22, which is also higher than the correlation coefficient between S_USESTD and CIL scores. This is not surprising as S_TSKLRN registers the learning of CIL specific tasks.

73
72(1
.4)
81
(1.4
)
66(1
.9)
53
(1.4
)
70(1
.7)
74
(1.4
)
71(1
.8)
64
(1.8
)48
(0.1
)0.
22(0
.0)
73(0
.3)
85
(0.2
)
76(0
.3)
70
(0.3
)
75(0
.3)
73
(0.3
)
72(0
.3)
67
(0.3
)
50(0
.1)
0.
08(0
.0)
87(0
.9)S
96(0
.4)S
92(0
.6)S
82(0
.8)S
91(0
.5)S
83(0
.8)S
77(0
.9)U
74(1
.0)U
54(0
.2)Ï
0.22
(0.0
)
70(1
.0)V
74(1
.0)T
60(1
.1)T
60(1
.0)V
60(1
.1)T
67(1
.1)V
59(1
.0)T
54(1
.1)T
46(0
.3)Ð
0.07
(0.0
)*
Perc
enta
ges
refle
ct s
tude
nts
that
sel
ecte
d "Y
es"
*St
atis
tical
ly s
igni
fican
t (p<
0.05
) coe
ffic
ient
s in
bol
d.( )
St
anda
rd e
rror
s ap
pear
in p
aren
thes
es. B
ecau
se s
ome
resu
lts a
re ro
unde
d to
the
near
est w
hole
num
ber,
som
e to
tals
may
app
ear i
ncon
sist
ent.
#M
ean
of s
cale
sco
re =
50S
Mor
e th
an 1
0 pe
rcen
tage
poi
nts
abov
e IC
ILS
aver
age
ÏM
ore
than
3 s
core
poi
nts
abov
e IC
ILS
aver
age
USi
gnifi
cant
ly a
bove
ICIL
S av
erag
e×
Sign
ifica
ntly
abo
ve IC
ILS
aver
age
VSi
gnifi
cant
ly b
elow
ICIL
S av
erag
eØ
Sign
ifica
ntly
bel
ow IC
ILS
aver
age
TM
ore
than
10
perc
enta
ge p
oint
s be
low
ICIL
S av
erag
eÐ
Mor
e th
an 3
sco
re p
oint
s be
low
ICIL
S av
erag
e
Ove
rall
stud
ents
' av
erag
e sc
ale
scor
e fo
r le
arni
ng o
f ICT
ta
sks
at s
choo
l (S
_TSK
LRN)
#
Corr
elat
ion
coef
ficie
nts
for
CIL
with
S_
TSKL
RNPr
ovid
ing
refe
renc
es to
In
tern
et
sour
ces
Acce
ssin
g in
form
atio
n w
ith a
co
mpu
ter
Pres
entin
g in
form
atio
n fo
r a
give
n au
dien
ce o
r pu
rpos
e w
ith a
co
mpu
ter
Wor
king
out
w
heth
er to
trus
t in
form
atio
n fro
m th
e In
tern
et
Deci
ding
wha
t in
form
atio
n is
re
leva
nt to
in
clud
e in
sc
hool
wor
k
Org
anis
ing
info
rmat
ion
obta
ined
from
In
tern
et
sour
ces
Deci
ding
whe
re
to lo
ok fo
r in
form
atio
n ab
out a
n un
fam
iliar
topi
c
Look
ing
for
diffe
rent
type
s of
dig
ital
info
rmat
ion
on
a to
pic
Stud
ents
' lea
rnin
g of
ICT
task
s at
sch
ool t
hat a
re in
clud
ed in
sca
le s
core
S_T
SKLR
N
Educ
atio
nal S
yste
m
Hon
g K
ong
(SAR
)
ICIL
S 2
013
aver
age
Aust
ralia
Kor
ea, R
ep. o
f
Tabl
e 3.1
4 Pe
rcen
tage
s of s
tude
nts r
epor
ted
havi
ng le
arnt
CIL
rela
ted
task
s at s
choo
l, S_
TSKL
RN a
nd th
e ass
ocia
tion
with
CIL
scor
e

74
3.4.3 Use of computers outside school
There were four sets of questions in the student survey that collected information about students’ ICT use outside school, one of which was about students’ use of work-oriented ICT applications while the other three were about their use for various personal purposes. For all questions related to outside school use of ICT, students were given five response options: “never,” “less than once a month,” “at least once a month but not every week,” “at least once a week but not every day,” and “every day” to indicate their frequency of engagement. In the following four subsections, we report in table format the percentages of students engaging in each of the relevant type of computer use outside of school at least once a week. In addition, for each category of use, a scale was constructed using Rasch partial credit model with an international mean of 50 and standard deviation of 10. Work-oriented ICT applications (S_USEAPP) There was only one question in the student survey that asked about students’ use of specific ICT applications, which were all work-oriented, and students were most likely to be using them for the purpose of doing schoolwork:
x Creating or editing documents (for example to write stories or assignments);
x Using a spreadsheet to do calculations, store data or plot graphs (for example using [Microsoft EXCEL®]);
x Creating a simple “slideshow” presentation (for example using [Microsoft PowerPoint®]);
x Creating a multi-media presentation (with sound, pictures, video); x Using education software that is designed to help with your school study
(for example mathematics or reading software); x Writing computer programs, macros or scripts (for example using [Logo,
Basic or HTML]); and x Using drawing, painting or graphics software. Table 3.15 presents the percentages of students reporting having used each
of these applications outside of school at least once a week. The results show that in nearly all countries, creating or editing documents for writing purposes was the one with the highest percentage of students reporting use at least once a week (the only exception was Lithuania), with an international mean of only 28%. In general, using programming languages to write applications was the least popular application, with 13 systems out of 21 registering less than 10% of students doing so at least once a week; and for Hong Kong, this percentage was only 8%. The second most popular type of ICT application used by students on a weekly basis outside of school was educational software designed to help with school studies, at 18% internationally and only 15% for Hong Kong.
75
26(1
.6)
11
(0.7
)
10(0
.8)
13
(0.8
)
15(1
.0)
8
(0.5
)
12(0
.7)
48(0
.4)
0.15
(0.0
)
28(0
.3)
11(0
.2)
17(0
.3)
15(0
.2)
18(0
.2)
10(0
.2)
18(0
.2)
50(0
.1)
0.09
(0.0
)
48(1
.3)S
9(0
.5)V
20(1
.0)U
15(0
.6)
28(1
.2)U
14(0
.7)U
19(0
.7)
52(0
.2)×
0.13
(0.0
)
13(0
.8)T
5(0
.4)V
5(0
.5)T
7(0
.5)V
11(0
.6)V
5(0
.5)V
8(0
.5)T
45(0
.3)Ð
0.22
(0.0
)*
Perc
enta
ges
refle
ct s
tude
nts
that
sel
ecte
d "A
t lea
st o
nce
a w
eek
but n
ot e
very
day"
& "E
very
day"
*St
atis
tical
ly s
igni
fican
t (p<
0.05
) coe
ffic
ient
s in
bol
d.( )
St
anda
rd e
rror
s ap
pear
in p
aren
thes
es. B
ecau
se s
ome
resu
lts a
re ro
unde
d to
the
near
est w
hole
num
ber,
som
e to
tals
may
app
ear i
ncon
sist
ent.
#M
ean
of s
cale
sco
re =
50S
Mor
e th
an 1
0 pe
rcen
tage
poi
nts
abov
e IC
ILS
aver
age
ÏM
ore
than
3 s
core
poi
nts
abov
e IC
ILS
aver
age
USi
gnifi
cant
ly a
bove
ICIL
S av
erag
e×
Sign
ifica
ntly
abo
ve IC
ILS
aver
age
VSi
gnifi
cant
ly b
elow
ICIL
S av
erag
eØ
Sign
ifica
ntly
bel
ow IC
ILS
aver
age
TM
ore
than
10
perc
enta
ge p
oint
s be
low
ICIL
S av
erag
eÐ
Mor
e th
an 3
sco
re p
oint
s be
low
ICIL
S av
erag
e
Educ
atio
nal S
yste
m
Hon
g K
ong
(SAR
)
ICIL
S 2
013
aver
age
Aust
ralia
Kor
ea, R
ep. o
f
Corr
elat
ion
coef
ficie
nts
for
CIL
with
S_
USEA
PP
Stud
ents
' use
of c
ompu
ters
for s
peci
fic IC
T ap
plic
atio
ns th
at a
re in
clud
ed in
sca
le s
core
S_U
SEA
PP
Crea
ting
or
editi
ng
docu
men
ts (f
or
exam
ple
to
writ
e st
orie
s or
as
sign
men
ts)
Usin
g a
spre
adsh
eet t
o do
cal
cula
tions
, st
ore
data
or
plot
gra
phs
(for
exam
ple
usin
g [M
icro
soft
EXCE
L ®
])
Crea
ting
a si
mpl
e “slid
esho
w”
pres
enta
tion
(for e
xam
ple
usin
g [M
icro
soft
Pow
erPo
int ®
])
Crea
ting
a m
ulti-
med
ia
pres
enta
tion
(with
sou
nd,
pict
ures
, vid
eo)
Usin
g ed
ucat
ion
softw
are
that
is
desi
gned
to
help
with
you
r sc
hool
stu
dy
(for e
xam
ple
mat
hem
atic
s or
re
adin
g so
ftwar
e)
Writ
ing
com
pute
r pr
ogra
ms,
m
acro
s or
sc
ripts
(for
ex
ampl
e us
ing
[Log
o, B
asic
or
HTM
L])
Usin
g dr
awin
g,
pain
ting
or
grap
hics
so
ftwar
e
Ove
rall
stud
ents
' av
erag
e sc
ale
scor
e fo
r use
of
com
pute
rs fo
r sp
ecifi
c IC
T ap
plic
atio
ns
(S_U
SEA
PP) #
Tabl
e 3.1
5 Pe
rcen
tage
s of s
tude
nts u
sing
wor
k-or
ient
ed a
pplic
atio
ns o
utsi
de sc
hool
at l
east
onc
e a w
eek,
S_U
SEAP
P an
d th
e ass
ocia
tion
with
CIL
scor
e
76
Similar to the other computer use statistics, Korea also reports significantly lower than the international average in terms of percentages of students reporting weekly outside school use of all seven ICT applications. For Australia, the trend was somewhat different compared to the previously reported use statistics, with only four applications showing significantly higher percentages than the international mean, and significantly lower than the international average for using a spreadsheet at least once a week. For Hong Kong, the mean percentages remain similar and slightly lower than the corresponding international means, except for the use of spreadsheets, which was the same as the international mean of 11%.
The scale reflecting level of use of these seven applications, S_USEAPP, had a Cronbach’s alpha reliability of 0.80. The scale scores for Hong Kong and Korea were both lower than the international mean at 48 and 46 respectively, while the score for Australia was significantly higher at 52. The correlation coefficient between S_USEAPP and CIL score was also found to be positive for all three systems, with Korea having the highest correlation of 0.22, following by Hong Kong at 0.15 and Australia at 0.13. Use of ICT for exchanging information (S_USEINF) Students may also engage in information exchange activities outside of school for personal rather than study purposes. The survey included the following four activities belonging to this category:
x Asking questions on forums or [question and answer] websites; x Answering other peoples’ questions on forums or websites; x Writing posts for your own blog; and x Building or editing a webpage. Table 3.16 shows the percentages of students reporting using the Internet for
each of these activities at least once a week. It can be seen that the percentages in this Table is somewhat higher than those in Table 3.15, indicating that students are more likely to engage in these information exchange activities than in using work-oriented ICT applications, even though the percentages are still relatively low. Answering other peoples’ questions on forums or websites was the most popular information exchange activity internationally as well as in Hong Kong, at 24% and 30% of the student population respectively.
On the other hand, writing posts for your own blog was the most popular use in this category for Australian students, at 22%, while for Korean students it was asking questions on forums or [question and answer] websites at 18%. While the most popular information exchange activity differs across countries, building or editing a webpage was the least popular information exchange activity in all countries.

77
It is also interesting to note that unlike the other types of computer use
reported earlier, the percentages of Australian students reported engaging in the
three activities other than blogging were significantly lower than the international
mean.
Table 3.16 Percentages of students using the Internet outside school at least once a week for exchange of information, S_USEINF and the association with CIL score
Further, though the percentages of Korean students engaging in information
exchange activities outside school remain significantly lower than the international
average, their scale score for this category of use, S_USEINF, was in fact higher
than Australia. Hong Kong’s S_USEINF score was similar to the international average, at 50. Another very surprising observation is that the correlation between
S_USEINF score and CIL score is in fact negative, though small, for Hong Kong,
Australia and the international mean.
Use of ICT for social communication (S_USECOM)
Using social media to communicate with others has become a very popular activity
many people use their computers to do. The student survey contained four items
of social media based communication activity to find out how often students
engage in this type of activity:
x Communicating with others using messaging or social networks (for
example instant messaging or [status updates]);
x Posting comments to online profiles or blogs;
x Uploading images or video to an [online profile] or [online community]
(for example Facebook or YouTube); and
x Using voice chat (e.g. Skype) to chat with friends or family online.
23 (1.0) 30 (0.9) 13 (0.8) 9 (0.8) 50 (0.2) -0.03 (0.0)
22 (0.3) 24 (0.3) 21 (0.2) 11 (0.2) 50 (0.1) -0.02 (0.0)
17 (0.8) V 13 (0.5) T 22 (0.7) 8 (0.5) V 48 (0.2) Ø -0.09 (0.0)
18 (0.8) V 16 (0.7) V 11 (0.6) T 5 (0.4) V 49 (0.1) Ø 0.07 (0.0)* Percentages reflect students that selected "At least once a w eek but not every day" & "Every day"* Statistically signif icant (p<0.05) coefficients in bold.
( ) Standard errors appear in parentheses. Because some results are rounded to the nearest w hole number, some totals may appear inconsistent. # Mean of scale score =50S More than 10 percentage points above ICILS average Ï More than 3 score points above ICILS averageU Signif icantly above ICILS average × Signif icantly above ICILS averageV Signif icantly below ICILS average Ø Signif icantly below ICILS averageT More than 10 percentage points below ICILS average Ð More than 3 score points below ICILS average
Correlation coefficients for
CIL with S_USEINF
Korea, Rep. of
Writing posts for your own
blog
Building or editing a webpage
Asking questions on
forums or [question and
answer] websites
Answering other peoples’ questions on
forums or websites
Overall students'
average scale score for use of
ICT for exchanging information
(S_USEINF) #
Students' use of ICT for exchanging information that are included in scale score S_USEINF
Educational System
Hong Kong (SAR)
ICILS 2013 average
Australia
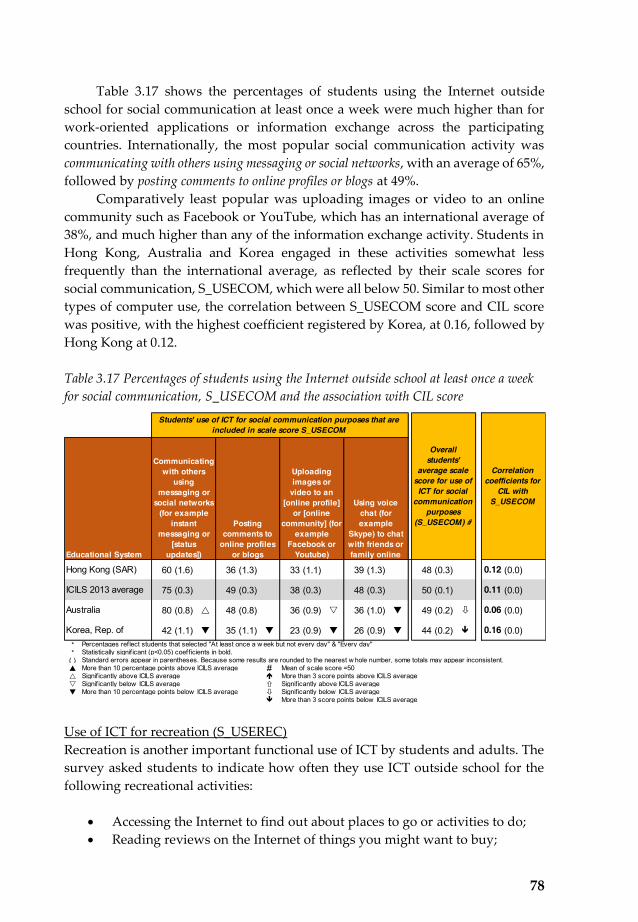
78
Table 3.17 shows the percentages of students using the Internet outside
school for social communication at least once a week were much higher than for
work-oriented applications or information exchange across the participating
countries. Internationally, the most popular social communication activity was
communicating with others using messaging or social networks, with an average of 65%,
followed by posting comments to online profiles or blogs at 49%.
Comparatively least popular was uploading images or video to an online
community such as Facebook or YouTube, which has an international average of
38%, and much higher than any of the information exchange activity. Students in
Hong Kong, Australia and Korea engaged in these activities somewhat less
frequently than the international average, as reflected by their scale scores for
social communication, S_USECOM, which were all below 50. Similar to most other
types of computer use, the correlation between S_USECOM score and CIL score
was positive, with the highest coefficient registered by Korea, at 0.16, followed by
Hong Kong at 0.12.
Table 3.17 Percentages of students using the Internet outside school at least once a week for social communication, S_USECOM and the association with CIL score
Use of ICT for recreation (S_USEREC)
Recreation is another important functional use of ICT by students and adults. The
survey asked students to indicate how often they use ICT outside school for the
following recreational activities:
x Accessing the Internet to find out about places to go or activities to do;
x Reading reviews on the Internet of things you might want to buy;
60 (1.6) 36 (1.3) 33 (1.1) 39 (1.3) 48 (0.3) � 0.12 (0.0)
75 (0.3) 49 (0.3) 38 (0.3) 48 (0.3) 50 (0.1) � 0.11 (0.0)
80 (0.8) U 48 (0.8) 36 (0.9) V 36 (1.0) T 49 (0.2) Ø 0.06 (0.0)
42 (1.1) T 35 (1.1) T 23 (0.9) T 26 (0.9) T 44 (0.2) Ð 0.16 (0.0)* Percentages reflect students that selected "At least once a w eek but not every day" & "Every day"* Statistically signif icant (p<0.05) coefficients in bold.
( ) Standard errors appear in parentheses. Because some results are rounded to the nearest w hole number, some totals may appear inconsistent. S More than 10 percentage points above ICILS average # Mean of scale score =50U Signif icantly above ICILS average Ï More than 3 score points above ICILS averageV Signif icantly below ICILS average × Signif icantly above ICILS averageT More than 10 percentage points below ICILS average Ø Signif icantly below ICILS average
Ð More than 3 score points below ICILS average
Australia
Korea, Rep. of
Uploading images or
video to an [online profile]
or [online community] (for
example Facebook or
Youtube)
Using voice chat (for example
Skype) to chat with friends or family online
Communicating with others
using messaging or
social networks (for example
instant messaging or
[status updates])
Posting comments to
online profiles or blogs
Correlation coefficients for
CIL with S_USECOM
Students' use of ICT for social communication purposes that are included in scale score S_USECOM
Educational System
Hong Kong (SAR)
ICILS 2013 average
Overall students'
average scale score for use of ICT for social
communication purposes
(S_USECOM) #

79
x Playing games;
x Listening to music;
x Watching downloaded or streamed video (for example movies, TV shows
or clips); and
x Using the Internet to get news about things I am interested in.
The results, as presented in Table 3.18, show that recreation is indeed a very
popular use of computers by students outside school. Listening to music is the single
most popular ICT-based recreational activity for all participating countries, with a
minimum percentage of 63% in Korea, and the highest in Denmark, at 92%. The
second most popular ICT-using recreation differs across countries, and was
generally either watching downloaded or streamed video, using the Internet to get news about things I am interested in, or playing games. The least popular ICT-using
recreation was accessing the Internet to find out about places to go or activities to do,
which technically is not recreation, but finding out information about recreation.
The level of ICT use by Hong Kong and Australian students for recreational
purposes were similar to the international average, both with a scale score of 50 for
S_USEREC. Korean students showed a lower level of engagement, with a scale
score of 48 only. S_USEREC is again positively correlated with students’ CIL score. However, the correlation coefficients differ greatly, with a very low and
insignificant one for Hong Kong, at 0.03, and the highest for Korea, at 0.15.
3.5 Students’ Contextual Factors and Their CIL Achievement
While we can see from the foregoing sections that some of the student level
contextual factors are significantly correlated with their CIL scores, these factors
are often not independently of each other.
Further, as mentioned in section 3.1, it is important to note that there may
also be school effects on some of these variables collected through the student
survey. In this section we will explore how the totality of the key context variables
listed in Table 3.1 influence students’ CIL achievement. To identify school level
effects, we have adopted multilevel analysis using HLM, even though all the
context variables are collected at one level through the student survey.
3.5.1 Contextual factors and overall CIL score
First of all, we will investigate the following two research questions for the Hong
Kong CIL results:
1. Do any of the context variables collected through the student survey
significantly influence their CIL achievement scores?
2. What percentage of the total between-school and within-school variance
can these variables account for?
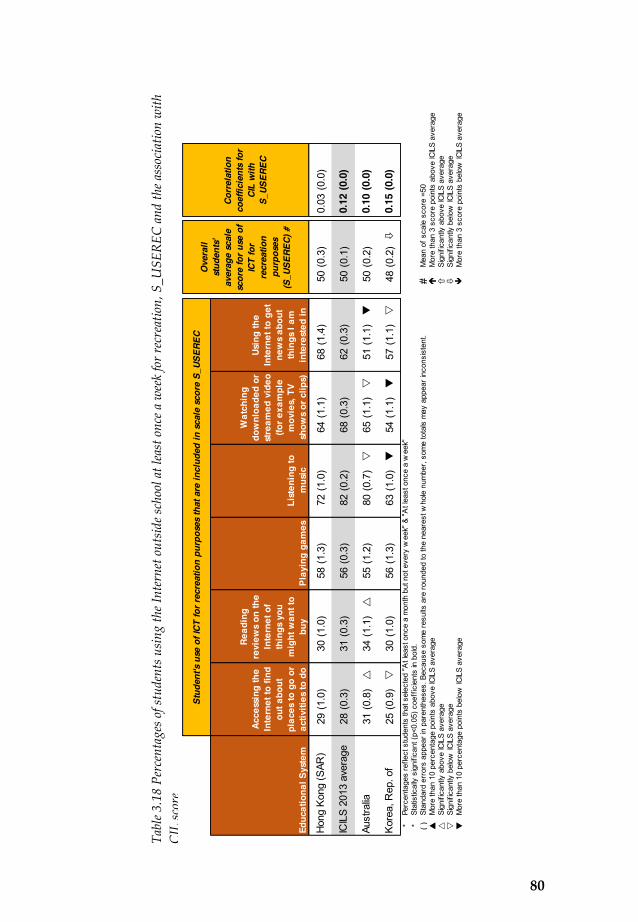
80
29(1
.0)
30
(1.0
)
58(1
.3)
72
(1.0
)
64(1
.1)
68
(1.4
)50
(0.3
)0.
03(0
.0)
28(0
.3)
31(0
.3)
56(0
.3)
82(0
.2)
68(0
.3)
62(0
.3)
50(0
.1)
0.12
(0.0
)
31(0
.8)U
34(1
.1)U
55(1
.2)
80(0
.7)V
65(1
.1)V
51(1
.1)T
50(0
.2)
0.10
(0.0
)
25(0
.9)V
30(1
.0)
56(1
.3)
63(1
.0)T
54(1
.1)T
57(1
.1)V
48(0
.2)Ø
0.15
(0.0
)*
Perc
enta
ges
refle
ct s
tude
nts
that
sel
ecte
d "A
t lea
st o
nce
a m
onth
but
not
eve
ry w
eek"
& "A
t lea
st o
nce
a w
eek"
*St
atis
tical
ly s
igni
fican
t (p<
0.05
) coe
ffic
ient
s in
bol
d.( )
St
anda
rd e
rror
s ap
pear
in p
aren
thes
es. B
ecau
se s
ome
resu
lts a
re ro
unde
d to
the
near
est w
hole
num
ber,
som
e to
tals
may
app
ear i
ncon
sist
ent.
#M
ean
of s
cale
sco
re =
50S
Mor
e th
an 1
0 pe
rcen
tage
poi
nts
abov
e IC
ILS
aver
age
ÏM
ore
than
3 s
core
poi
nts
abov
e IC
ILS
aver
age
USi
gnifi
cant
ly a
bove
ICIL
S av
erag
e×
Sign
ifica
ntly
abo
ve IC
ILS
aver
age
VSi
gnifi
cant
ly b
elow
ICIL
S av
erag
eØ
Sign
ifica
ntly
bel
ow IC
ILS
aver
age
TM
ore
than
10
perc
enta
ge p
oint
s be
low
ICIL
S av
erag
eÐ
Mor
e th
an 3
sco
re p
oint
s be
low
ICIL
S av
erag
e
Educ
atio
nal S
yste
m
Hon
g K
ong
(SAR
)
ICIL
S 2
013
aver
age
Aust
ralia
Kor
ea, R
ep. o
f
Corr
elat
ion
coef
ficie
nts
for
CIL
with
S_
USER
EC
Stud
ent's
use
of I
CT fo
r rec
reat
ion
purp
oses
that
are
incl
uded
in s
cale
sco
re S
_USE
REC
List
enin
g to
m
usic
Wat
chin
g do
wnl
oade
d or
st
ream
ed v
ideo
(fo
r exa
mpl
e m
ovie
s, T
V sh
ows
or c
lips)
Acce
ssin
g th
e In
tern
et to
find
ou
t abo
ut
plac
es to
go
or
activ
ities
to d
o
Read
ing
revi
ews
on th
e In
tern
et o
f th
ings
you
m
ight
wan
t to
buy
Play
ing
gam
es
Usin
g th
e In
tern
et to
get
ne
ws
abou
t th
ings
I am
in
tere
sted
in
Ove
rall
stud
ents
' av
erag
e sc
ale
scor
e fo
r use
of
ICT
for
recr
eatio
n pu
rpos
es
(S_U
SERE
C) #
Tabl
e 3.1
8 Pe
rcen
tage
s of s
tude
nts u
sing
the I
nter
net o
utsi
de sc
hool
at l
east
onc
e a w
eek
for r
ecre
atio
n, S
_USE
REC
and
the a
ssoc
iatio
n w
ith
CIL
scor
e

81
The first step in multilevel modelling is to conduct a variance component analysis to obtain information on the Null model regarding the total variances at the student and school levels respectively. The results show that under the null model, the within school (level 1) variance is 4009.67 and the between school (level 2) variance is 3929.95, which means that about half of the variance in Hong Kong students’ CIL test scores relates to school level differences. Table 3.19 Multilevel model results for students’ CIL scores using student context
variables as level 1 predictors
Category Coefficient Error p-valueINTRCPT Intercept 508.86 8.23 0.00
Students’ Personal and Family Background
Z_ISCED Z: expected education by student 7.73 2.14 0.00
Z_ADVEFF Z: ICT self-efficacy advanced skills -8.81 3.81 0.03Z_BASEFF Z: ICT self-efficacy basic skills 25.67 3.34 0.00Z_INTRST Z: interest and enjoyment in using ICT - - -
Z_TSKLRN Z: learning of ICT tasks at school 5.52 2.49 0.03Z_USEAPP Z: use of specific ICT applications - - -Z_USELRN Z: use of ICT during lessons at school -5.37 2.50 0.04Z_USEREC Z: use of ICT for recreation - - -Z_USESTD Z: use of ICT for study purposes - - -Z_USECOM Z: use of ICT for social communication - - -Z_USEINF Z: use of ICT for exchanging information - - -
Between School Variance & Percentage 3925.95 49.5%
Within School Variance & Percentage 4009.67 50.5%
Between School 2846.80 27.5%
Within School 3555.52 11.3%
* All independent variables were transformed into zscores# The dependent variables (i.e. 5 plausible values) were in their original score format (Mean=509, SD=7.4 for HK sample)^ The dependent variable (i.e. CIL aspect scores) were presented in chapter 2.6. "Variance explained" refers to the percentage of variance the set of variables in the model has accounted for level 2 total variance."-" indicates variables that were not input into the specific model due to negligibly small effects on students' CIL scores (the outcome variable).Variables highlighted have p-value <=0.05
Variance explained by model and their percentages
Model: Student contextual factors and overall CIL Scores #
Students’ ICT Self-efficacy and Interest
Students’ ICT Use Experience at Home
and in School
Scale
Null Model
82
We then conducted Random Intercepts Fixed Slope modelling using all the
variables listed in Table 3.1 as level 1 predictor variables. The HLM results for the
analysis after reaching convergence is presented in Table 3.19. The results indicate
that only five variables remain statistically significant at the end of the modelling
process. Three of these have positive coefficients: Self-efficacy in basic ICT skills
(Z_BASEFF) has the highest coefficient of 25.67, followed by Educational
aspiration (ZS_ISCED, 7.73) and Learning of ICT tasks at school (ZS_TSKLRN,
5.52). The two factors that have negative coefficients are Self-efficacy in advanced
ICT skills (Z_ADVEFF, -.8.81) and Use of ICT in non-ICT lessons (Z_USELRN, -5.37).
The correlation of these two factors with CIL scores when computed
independently were relatively low, though not negative (as described in the
previous two sections). The negative coefficients indicate significant correlation
among the student context variables. It is also important to note that although
gender and SES variables were significantly correlated with CIL scores when
computed independently, they are no longer significant in the analysis results,
again due to their high correlation with other context variables.
Examining the variance explained by this model, we find that the between
school variance explained is much higher (at 27.5%) than the within school
variance explained (at 11.3%). This indicates that there is much similarity among
students within the same school in terms of their personal and family context as
well as their ICT use experience that contributes to explaining 27.5% of the between
school variance in students’ CIL scores. On the other hand, these student level differences can only explain 11.3% of the variations in CIL scores within the same
school.
3.5.2 Contextual factors and the seven CIL aspect scores
In chapter 2, in addition to reporting on students’ achievement in terms of their
overall CIL scores, we have also reported on their percentage scores for each of the
seven CIL aspects. Furthermore, we find that Hong Kong students’ performance was particularly poor in accessing and evaluating information, transforming
information, sharing information and managing information. Hence in this
section, we further employ Random Intercepts Fixed Slope modelling using HLM
to find out, for each CIL aspect.
1. Do any of the context variables collected through the student survey
significantly influence their CIL achievement scores?
2. What percentage of the total between-school and within-school variance
can these variables account for?
Since gender and SES dropped out from the multilevel model in very early
iterations in the previous analysis with the overall CIL score as the independent
variable, we have decided to remove these two from the current set of analyses,

83
with standardized z-scores of the percentages correct for each of the seven CIL aspects. Before discussing the results of the seven multilevel models presented in Table 3.20, we need to caution that the seven standardized CIL aspect scores differ greatly in the quality of their psychometric properties. This is primarily because the Study itself was designed to develop a single CIL achievement scale. The seven-aspects framework was used to guide the development of the assessment tasks, but the assessment design was not developed sufficiently to warrant a fully formed scale for each of the aspects, given the testing time is only limited to an hour.
A closely related limitation is that not all of the booklets include items from all seven aspects, which means the sample size for the multilevel analysis for some of the aspects could be smaller. This large variability in the quality of the seven standardized aspect scores is also reflected in the very large differences in distribution of total variance across between-school and within-school variance in the seven null models in Table 3.20. Keeping in mind the above cautions, the results reported here are only for exploratory purposes. There are nevertheless some interesting observations. First of all, consistent with the finding reported in section 3.4, we find that self-efficacy in basic ICT skills (Z_BASEFF) is significant for all seven models with a positive coefficient of at least 0.11, which is bigger than any of the other coefficients, indicating that this is a most important antecedent for students to develop their CIL skills. The second most important factor across the board is students’ educational aspirations (ZS_ISCED). All coefficients for this factor are positive, and are statistically significant, except the aspect transforming information. Interest and enjoyment in using ICT (ZS_INTRST) is also a relatively important positive contributing factor, having positive coefficients for the aspects knowing about and understanding computer use, managing information, and transforming information. Learning of ICT tasks in school (ZS_TSKLRN) similarly has positive significant coefficients for three aspects: knowing about and understanding computer use, creating information and sharing information.
The factor with the third highest number of significant coefficients is self-efficacy in advanced ICT skills (Z_ADVEFF). However, similar to the findings reported in section 3.4, all of the coefficients are negative, and are significant for four aspects: accessing and evaluating information, transforming information, creating information, and using information securely and safely.
One prominent observation is that three types of reported use of ICT have not recorded a single instance of a significant coefficient in any of the CIL aspects. These are: use of ICT for recreation (Z_USEREC), use of work-oriented ICT applications (Z_USEAPP) and use of ICT for study purposes (Z_USESTD). Apparently, ICT use at school and for study purposes have not contributed much to students’ CIL achievement. Similar to the multilevel analysis results for the overall CIL score, students’ context variables can only explain a substantial percentage of the between-school variance but not the within-school variance in student achievement for all seven CIL aspects.

84
Ta
ble 3
.20
Mul
tilev
el m
odel
resu
lts fo
r eac
h of
the s
even
stan
dard
ized
CIL
asp
ect s
core
s usi
ng st
uden
t con
text
var
iabl
es a
s lev
el 1
pre
dict
ors
Va
riabl
esB
rief d
escr
iptio
n
Coe
ffici
ent
Erro
rp-
valu
eC
oeffi
cien
tEr
ror
p-va
lue
Coe
ffici
ent
Erro
rp-
valu
eC
oeffi
cien
tEr
ror
p-va
lue
Coe
ffici
ent
Erro
rp-
valu
eC
oeffi
cien
tEr
ror
p-va
lue
Coe
ffici
ent
Erro
rp-
valu
eIN
TRC
PT1
-0.0
40.
050.
36-0
.10
0.06
0.09
-0.0
60.
040.
10-0
.09
0.06
0.15
-0.1
20.
080.
12-0
.05
0.03
0.14
-0.0
50.
060.
36Z_
ISC
EDZ:
exp
ecte
d ed
ucat
ion
by s
tude
nt0.
090.
030.
010.
060.
030.
010.
060.
030.
020.
040.
020.
130.
090.
020.
000.
090.
020.
000.
060.
030.
03Z_
ADVE
FFZ:
ICT
self-
effic
acy
adva
nced
ski
lls-
--
-0.1
10.
030.
00-0
.05
0.04
0.15
-0.1
50.
030.
00-0
.10
0.03
0.00
-0.0
40.
040.
25-0
.10
0.03
0.01
Z_BA
SEFF
Z: IC
T se
lf-ef
ficac
y ba
sic
skills
0.17
0.03
0.00
0.23
0.03
0.00
0.12
0.04
0.00
0.25
0.03
0.00
0.24
0.03
0.00
0.11
0.03
0.00
0.19
0.04
0.00
Z_TS
KLR
NZ:
lear
ning
of I
CT
task
s at
sch
ool
0.06
0.03
0.04
0.03
0.03
0.19
0.02
0.03
0.45
0.03
0.03
0.20
0.08
0.02
0.00
0.08
0.02
0.00
0.03
0.03
0.25
Z_U
SEAP
PZ:
use
of s
peci
fic IC
T ap
plic
atio
ns0.
060.
030.
060.
030.
030.
22-
--
0.05
0.03
0.15
--
-0.
020.
030.
530.
020.
040.
63Z_
USE
LRN
Z: u
se o
f IC
T du
ring
less
ons
at s
choo
l-0
.04
0.02
0.12
-0.0
90.
030.
00-0
.07
0.03
0.01
-0.0
30.
030.
34-0
.02
0.02
0.33
-0.0
40.
020.
07-0
.01
0.03
0.64
Z_U
SER
ECZ:
use
of I
CT
for r
ecre
atio
n-
--
--
--
--
-0.0
30.
030.
35-0
.04
0.02
0.10
-0.0
10.
030.
79-0
.02
0.03
0.48
Z_U
SEST
DZ:
use
of I
CT
for s
tudy
pur
pose
s-
--
0.04
0.03
0.15
--
-0.
000.
020.
85-
--
0.00
0.02
0.84
0.05
0.03
0.17
Z_U
SEC
OM
Z: u
se o
f IC
T fo
r soc
ial c
omm
unic
atio
n0.
050.
040.
20-
--
0.05
0.03
0.05
0.05
0.04
0.15
0.08
0.03
0.01
0.06
0.05
0.23
0.06
0.04
0.18
Z_IN
TRST
Z: in
tere
st a
nd e
njoy
men
t in
usin
g IC
T0.
070.
030.
03-
--
0.09
0.03
0.00
0.05
0.02
0.04
0.03
0.02
0.27
-0.0
10.
020.
730.
010.
020.
75Z_
USE
INF
Z: u
se o
f IC
T fo
r exc
hang
ing
info
rmat
ion
-0.0
30.
030.
28-0
.04
0.02
0.07
-0.0
90.
030.
00-0
.01
0.04
0.78
-0.0
50.
030.
05-0
.09
0.04
0.03
--
-
Betw
een
Scho
ol V
aria
nce
& Pe
rcen
tage
0.13
0011
.7%
0.29
3529
.6%
0.07
727.
9%0.
2970
29.1
%0.
4299
39.9
%0.
0709
7.2%
0.15
8315
.5%
With
in S
choo
l Var
ianc
e &
Perc
enta
ge0.
9772
88.3
%0.
6989
70.4
%0.
8994
92.1
%0.
7249
70.9
%0.
6471
60.1
%0.
9100
92.8
%0.
8634
84.5
%
Betw
een
Scho
ol0.
0585
54.9
7%0.
1830
37.6
6%0.
0324
58.0
5%0.
1887
36.4
8%0.
2825
34.2
9%0.
0288
59.4
0%0.
1060
33.0
6%
With
in S
choo
l0.
8863
9.30
%0.
6746
3.47
%0.
9000
-0.0
7%0.
6966
3.91
%0.
5924
8.44
%0.
9007
1.02
%0.
8350
3.29
%
* All
inde
pend
ent v
aria
bles
wer
e tra
nsfo
rmed
into
zsc
ores
# Th
e de
pend
ent v
aria
bles
(i.e
. 5 p
laus
ible
val
ues)
wer
e in
thei
r orig
inal
sco
re fo
rmat
(Mea
n=50
9, S
D=7
.4 fo
r HK
sam
ple)
^ Th
e de
pend
ent v
aria
ble
(i.e.
CIL
asp
ect s
core
s) w
ere
pres
ente
d in
cha
pter
2.6
. "V
aria
nce
expl
aine
d" re
fers
to th
e pe
rcen
tage
of v
aria
nce
the
set o
f var
iabl
es in
the
mod
el h
as a
ccou
nted
for l
evel
2 to
tal v
aria
nce.
"-" i
ndic
ates
var
iabl
es th
at w
ere
not i
nput
into
the
spec
ific
mod
el d
ue to
neg
ligib
ly s
mal
l effe
cts
on s
tude
nts'
CIL
sco
res
(the
outc
ome
varia
ble)
.Va
riabl
es h
ighl
ight
ed h
ave
p-va
lue
<=0.
05
Null
Mod
el
Varia
nce
expl
aine
d b
y m
odel
and
thei
r pe
rcen
tage
s
Mod
el: S
tude
nt c
onte
xtua
l fac
tors
and
the
7 CI
L as
pect
sco
res^
Aspe
ct 1
.1
Kno
win
g ab
out a
nd
unde
rsta
ndin
g co
mpu
ter u
se
Aspe
ct 1
.2
Asse
ssin
g &
Ev
alua
ting
Info
rmat
ion
Aspe
ct 1
.3
Man
agin
g In
form
atio
n
Aspe
ct 2
.1
Tran
sfor
min
g In
form
atio
n
Aspe
ct 2
.2
Cre
atin
g in
form
atio
nAs
pect
2.3
Sh
arin
g In
form
atio
n
Aspe
ct 2
.4
Usi
ng in
form
atio
n se
cure
ly &
saf
ely
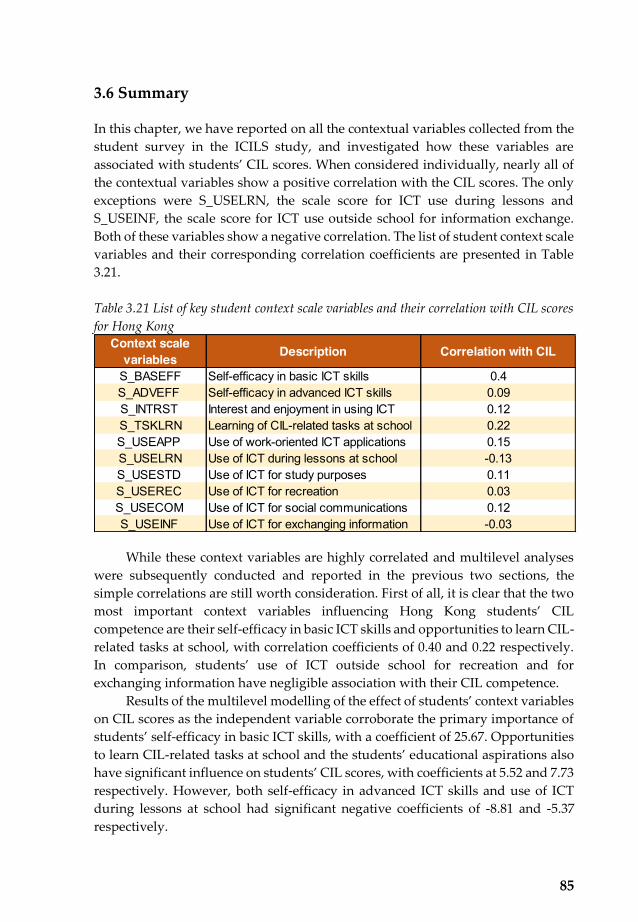
85
3.6 Summary
In this chapter, we have reported on all the contextual variables collected from the student survey in the ICILS study, and investigated how these variables are associated with students’ CIL scores. When considered individually, nearly all of the contextual variables show a positive correlation with the CIL scores. The only exceptions were S_USELRN, the scale score for ICT use during lessons and S_USEINF, the scale score for ICT use outside school for information exchange. Both of these variables show a negative correlation. The list of student context scale variables and their corresponding correlation coefficients are presented in Table 3.21. Table 3.21 List of key student context scale variables and their correlation with CIL scores for Hong Kong
While these context variables are highly correlated and multilevel analyses
were subsequently conducted and reported in the previous two sections, the simple correlations are still worth consideration. First of all, it is clear that the two most important context variables influencing Hong Kong students’ CIL competence are their self-efficacy in basic ICT skills and opportunities to learn CIL-related tasks at school, with correlation coefficients of 0.40 and 0.22 respectively. In comparison, students’ use of ICT outside school for recreation and for exchanging information have negligible association with their CIL competence.
Results of the multilevel modelling of the effect of students’ context variables on CIL scores as the independent variable corroborate the primary importance of students’ self-efficacy in basic ICT skills, with a coefficient of 25.67. Opportunities to learn CIL-related tasks at school and the students’ educational aspirations also have significant influence on students’ CIL scores, with coefficients at 5.52 and 7.73 respectively. However, both self-efficacy in advanced ICT skills and use of ICT during lessons at school had significant negative coefficients of -8.81 and -5.37 respectively.
Context scale variables Description Correlation with CIL
S_BASEFF Self-efficacy in basic ICT skills 0.4S_ADVEFF Self-efficacy in advanced ICT skills 0.09S_INTRST Interest and enjoyment in using ICT 0.12S_TSKLRN Learning of CIL-related tasks at school 0.22S_USEAPP Use of work-oriented ICT applications 0.15S_USELRN Use of ICT during lessons at school -0.13S_USESTD Use of ICT for study purposes 0.11S_USEREC Use of ICT for recreation 0.03S_USECOM Use of ICT for social communications 0.12S_USEINF Use of ICT for exchanging information -0.03

86
These findings tell us that Hong Kong students’ use of ICT in lessons and for study-related purposes are relatively low compared to their international counterparts, and that such experiences have not contributed positively to their CIL development.
Further multilevel analysis of the influence of students’ context variables on each of the seven CIL aspect scores show similar findings as for that of the overall CIL score. These findings are valuable in informing us of how schools can help students enhance their CIL competence. The teaching of CIL-related tasks in school, and helping students to develop basic ICT skills efficacy will contribute to enhancing CIL competence.
Another important finding is that students’ SES index had no significant effect on their CIL scores in the multilevel analysis results. Furthermore, all the student context variables combined only explained 11.3% of the within school variance in students’ CIL scores, but explained 27.5% of the between school variance. This, coupled with the fact that Hong Kong has among the largest between school variance in student CIL achievement, indicates that the school a student attends has an extremely important association with the student’s CIL score. In the next section, we will explore the school effects through analysing the data collected from the school and teacher questionnaires.

87
Chapter 4
How Do Schools Influence Students’ CIL Achievement?
Apart from home, school is the most important venue where students develop their knowledge and understanding of the world. Compared to home, the school environment is more prone to changes, driven by the availability of human capital or financial resources, as well as territory wide education policies. Given the significance of the school environment, this chapter sets up to investigate the influence of school level factors on students’ CIL achievement.
School level factors that influence students’ achievement can be categorized into direct or indirect ones. Direct factors are those that contribute directly to students’ development of CIL, such as the overall quality of the learning environment, including the availability of ICT resources and support, and students’ learning opportunities. Indirect factors are those that influence students’ learning outcomes through their effect on the direct factors. An example of an indirect factor is the leadership characteristics of the principal, who makes important decisions on infrastructure development and resource allocation, as well as the curriculum goals and strategic priorities.
In ICILS 2013, in each of the sampled schools, the school principal, ICT coordinator, and 15 randomly sampled teachers who teach grade 8 classes were invited to complete a questionnaire. The school principal questionnaire collected information about the principals’ views and management practices regarding ICT use in their schools. The ICT coordinator questionnaire collected information about the ICT resources available and the obstacles encountered in implementing ICT use in the school. The teacher questionnaire gathered data on the teachers’ ICT background as well as their views and practices related to ICT in teaching and learning. Sampling of teachers and students in the same sampled school was conducted independently, and no data was collected on the specific grade 8 classes that the surveyed teachers taught in their school. Hence, data collected from the teacher questionnaire cannot be directly linked to the students. This implies that there cannot be any relational or causal analysis that connects these two sets of data at the individual level. Instead, the teacher questionnaire data collected from each school is aggregated such that the teachers’ responses would serve as school level indicators. A total of 1338 grade 8 teachers and 115 principals participated in the ICILS-HK study. The overall participation rate after replacement and weighting for teachers was 58.3%, which was, unfortunately, lower than the IEA

88
requirement of 75%. Hence, similar to the results from the Hong Kong student data,
the school level findings for Hong Kong are marked as of category 2 quality and
were not included in the calculation of the ICILS international averages presented
in the international report published by the IEA.
In this chapter, we will first report on the condition of schools in Hong Kong
with regard to the three categories of direct and indirect factors: (1) school level
infrastructure and resource provisions, (2) principals’ e-Learning leadership
practices, and (3) teachers’ ICT-using pedagogy. Similar to the strategy of our
reporting in Chapter 3, corresponding statistics for the international, Australian,
and South Korean data collected in ICILS 2013 are presented here to provide
relevant reference for comparative purposes.
In order to explore how the various school level factors influence students’ CIL outcomes, we need to derive reliable scales for these factors from the
questionnaire returns. We have not used the scales developed by the IEA for this
purpose as school contexts differ greatly across countries, and hence the factor
structure and the relationship between school factors and students’ CIL outcomes would probably be very different. Since we are primarily interested in exploring
these for Hong Kong, we have conducted confirmatory factor analysis on the data
collected from the principal and teacher questionnaires to identify reliable scales
for use for multilevel modelling in section 4.4. The specific factors we have
identified and used in the multilevel modelling are also reported together with the
reporting of the related descriptive statistics.
Based on findings from the multilevel analysis, we will discuss at the end of
this chapter how the school level factors influence both the overall CIL score as
well as the scores for each of the seven CIL aspects of Hong Kong students.
4.1 ICT infrastructure and resources in schools
Data from the ICT coordinator questionnaire provide an overall picture of the ICT
infrastructure and resources available in the schools in Hong Kong and of how
these compare with those in other countries. In addition to the level of resources
available, the data also reflect the allocation and arrangement of ICT resources in
schools.
4.1.1 Digital learning resources
Some of the digital learning resources are web-based, while others are not.
Table 4.1 shows the percentages of students studying at schools where the
following internet-related teaching and learning resources were available:
x Computer-Based Information Resources (e.g., Wikis, Encyclopedias,
Websites,);
x Interactive Digital Learning Resources (e.g., Learning Objects);
x Access to the World Wide Web;

89
x Access to an Education Site or Network Maintained by an Education System;
x Email Accounts for Teachers; and x Email Accounts for Students.
Table 4.1 Percentages of students studying at schools with available internet-related teaching and learning resources
It can be seen from Table 4.1 that the percentages in Hong Kong are higher
than the international mean in all of the above provisions, at above 90%, except for email accounts for students (89%), and much higher than Korea in the provisions of interactive digital learning resources, email accounts for teachers and email accounts for students. The status of non-Internet based software resources for learning was similar. Table 4.2 shows the percentages of students studying at schools where the following software resources were available:
x Tutorial Software or [Practice Programs]; x Digital Learning Games; x Wordprocessing, Databases, Spreadsheets (e.g., Microsoft© Office Suite); x Multimedia Production Tools (e.g., Media Capture and Editing, Web
Production); x Data-Logging and Monitoring Tools; x Simulations and Modeling Software; x Presentation Software (e.g. Microsoft PowerPoint®, Keynote ®); x Communication Software (e.g., Email, Chat, Blogs, Other Social Media);
and x Graphing or Drawing Software.
83 (4.0) 65 (5.5) 64 (6.0) 86 (3.2) 84 (3.8) 38 (5.3)81 (1.2) 56 (1.4) 64 (1.5) 82 (1.2) 82 (1.3) 53 (1.5)79 (3.2) 85 (2.5) S 93 (1.7) S 95 (1.5) S 94 (1.5) S 73 (6.3) S
81 (5.6) 78 (5.2) S 79 (5.0) S 85 (4.1) 87 (3.7) 68 (7.1) S
( )
S More than 10 percentage points above ICILS averageU Significantly above ICILS averageV Significantly below ICILS averageT More than 10 percentage points below ICILS average
Standard errors appear in parentheses. Because some results are rounded to the nearest whole number, some totals may appear inconsistent.
Developing students' computer
skills, such as word
processing, spreadsheet operations, and email
Developing collaborative
and organisational
skills
Using ICT for facilitating students’
responsibility for their own
learning
Using ICT to augment and
improve students’ learning
Developing students’
understanding and skills relating to safe and
appropriate use of ICT
Developing students’
proficiency in accessing and
using information
with ICT
Educational System
Hong Kong (SAR)ICILS 2013 averageAustraliaKorea, Rep. of

90
Tabl
e 4.2
Per
cent
ages
of s
tude
nts s
tudy
ing
at sc
hool
s with
ava
ilabl
e sof
twar
e res
ourc
es fo
r tea
chin
g an
d/or
lear
ning
91(3
.5)
65
(4.9
)
100
(0.0
)
100
(0.0
)
83(4
.1)
63
(5.3
)
100
(0.0
)
94(2
.8)
98
(1.4
)88
(0.7
)76
(0.8
)98
(0.3
)80
(0.8
)54
(1.1
)41
(1.0
)99
(0.2
)91
(0.6
)87
(0.7
)92
(2.2
)95
(1.7
)S
100
(0.0
)U
99(0
.3)S
85(2
.4)S
85(2
.8)S
100
(0.0
)U
98(1
.0)U
99(0
.6)S
88(2
.5)
78(3
.5)
98(1
.1)
87(3
.0)U
56(4
.4)
38(4
.0)
99(0
.9)
94(1
.9)
89(2
.6)
*P
erce
ntag
es re
flect
teac
hers
that
sel
ecte
d "I
n ev
ery
or a
lmos
t eve
ry le
sson
" & "I
n m
ost l
esso
ns"
( )
Sta
ndar
d er
rors
app
ear i
n pa
rent
hese
s. B
ecau
se s
ome
resu
lts a
re ro
unde
d to
the
near
est w
hole
num
ber,
som
e to
tals
may
app
ear i
ncon
sist
ent.
SM
ore
than
10
perc
enta
ge p
oint
s ab
ove
ICIL
S a
vera
geU
Sig
nific
antly
abo
ve IC
ILS
ave
rage
VS
igni
fican
tly b
elow
ICIL
S a
vera
geT
Mor
e th
an 1
0 pe
rcen
tage
poi
nts
belo
w IC
ILS
ave
rage
Educ
atio
nal
Syst
emH
ong
Kon
g (S
AR)
ICIL
S 2
013
aver
age
Aust
ralia
Kor
ea, R
ep. o
f
Pres
enta
tion
softw
are
(e.g
. [M
icro
soft
Pow
erPo
int
®],
[Key
note
®
])
Com
mun
icat
ion
softw
are
(e.g
. em
ail,
chat
, blo
gs,
othe
r soc
ial
med
ia)
Gra
phin
g or
dr
awin
g so
ftwar
e
Tuto
rial
softw
are
or
[pra
ctic
e pr
ogra
ms]
Digi
tal
lear
ning
ga
mes
Wor
d-pr
oces
sing
, da
taba
ses,
sp
read
shee
ts
(e.g
. [M
icro
soft©
of
fice
suite
])
Mul
timed
ia
prod
uctio
n to
ols
(e.g
. m
edia
ca
ptur
e an
d ed
iting
, web
pr
oduc
tion)
Data
-lo
ggin
g an
d m
onito
ring
tool
s
Sim
ulat
ions
an
d m
odel
ling
softw
are
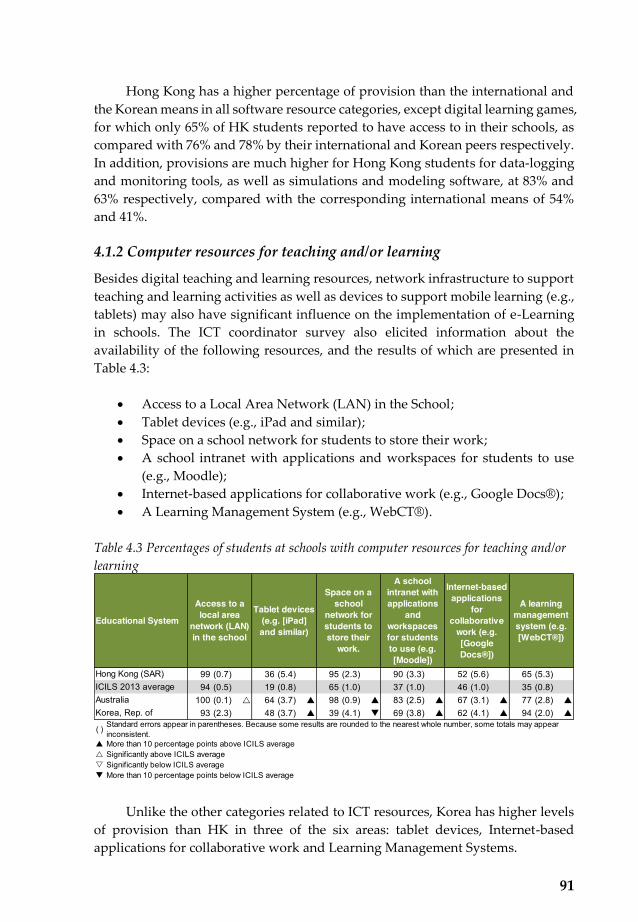
91
Hong Kong has a higher percentage of provision than the international and
the Korean means in all software resource categories, except digital learning games,
for which only 65% of HK students reported to have access to in their schools, as
compared with 76% and 78% by their international and Korean peers respectively.
In addition, provisions are much higher for Hong Kong students for data-logging
and monitoring tools, as well as simulations and modeling software, at 83% and
63% respectively, compared with the corresponding international means of 54%
and 41%.
4.1.2 Computer resources for teaching and/or learning
Besides digital teaching and learning resources, network infrastructure to support
teaching and learning activities as well as devices to support mobile learning (e.g.,
tablets) may also have significant influence on the implementation of e-Learning
in schools. The ICT coordinator survey also elicited information about the
availability of the following resources, and the results of which are presented in
Table 4.3:
x Access to a Local Area Network (LAN) in the School;
x Tablet devices (e.g., iPad and similar);
x Space on a school network for students to store their work;
x A school intranet with applications and workspaces for students to use
(e.g., Moodle);
x Internet-based applications for collaborative work (e.g., Google Docs®);
x A Learning Management System (e.g., WebCT®).
Table 4.3 Percentages of students at schools with computer resources for teaching and/or learning
Unlike the other categories related to ICT resources, Korea has higher levels
of provision than HK in three of the six areas: tablet devices, Internet-based
applications for collaborative work and Learning Management Systems.
99 (0.7) 36 (5.4) 95 (2.3) 90 (3.3) 52 (5.6) 65 (5.3) 94 (0.5) 19 (0.8) 65 (1.0) 37 (1.0) 46 (1.0) 35 (0.8)
100 (0.1) U 64 (3.7) S 98 (0.9) S 83 (2.5) S 67 (3.1) S 77 (2.8) S
93 (2.3) 48 (3.7) S 39 (4.1) T 69 (3.8) S 62 (4.1) S 94 (2.0) S
( )
S More than 10 percentage points above ICILS averageU Significantly above ICILS averageV Significantly below ICILS averageT More than 10 percentage points below ICILS average
Standard errors appear in parentheses. Because some results are rounded to the nearest whole number, some totals may appear inconsistent.
Access to a local area
network (LAN) in the school
Tablet devices (e.g. [iPad] and similar)
Space on a school
network for students to store their
work.
A school intranet with applications
and workspaces for students to use (e.g. [Moodle])
Internet-based applications
for collaborative
work (e.g. [Google Docs®])
A learning management system (e.g. [WebCT®])
Educational System
Hong Kong (SAR)ICILS 2013 averageAustraliaKorea, Rep. of
92
In particular, 94% of Korean students attended schools that provide LMS, which is much higher even when compared to the already high Australian mean of 77%. This reflects a stronger emphasis on using ICT in learning activities in Korean schools compared with Hong Kong.
4.1.3 Student: Computer ratios
In the ICT coordinator survey, computers refer to desktops, laptops, netbooks, tablets as well as terminals with a keyboard and a screen, but not including those used as a server. Internationally, for urban schools, the mean was 20. The highest provision was reported in Norway, with a ratio of 2, followed by Australia, with a ratio of 3; while the lowest ratio was found in Turkey, at 80. Hong Kong schools had an above average ratio of 8, while the figure for Korea was 20, the same as the international average. Percentages of students at schools with school computers at different locations In the ICT coordinator survey, the percentages of students with school computers at the following locations were explored:
x In Most Classrooms (80% or More). x In Computer Laboratories. x As Class Sets of Computers That Can Be Moved Between Classrooms x In the Library. x In Other Places Accessible to Students (e.g., Cafeteria, Auditorium, Study
Area); and x Student Computers (School-Provided or Student-Owned) Brought by
Students to Class.
From the figures in Table 4.4, we can see that Hong Kong is higher than the international mean in all of these different types of computer provisions except for “Student computers brought by students to class” (11%) as compared with the international mean of 18%.
Across all the schools that participated in ICILS 2013, computer laboratories is the location where most students (95%) have access to computers in schools, followed by the school library (64%). The percentage of students with access to computers that can be moved between classrooms was 34%, and those in schools that had computers located in most classrooms amounted to 33%. The lowest percentages in terms of the type of access were in other places in school (17%) and students bringing their own computers to the school (18%).
Obviously, there were wide variations across the countries, and the overall international means may not be representative of the situations in individual countries.

93
Table 4.4 Percentages of students at schools with school computers at different locations
As mentioned, the library was the second most common location, after
computer laboratories, where most students could gain access to computers in schools (64%). In Hong Kong, 93% of students could access computers in libraries, which is the highest system average in the Study. The percentage of students who could access computers in the school library was 90% in Australia and 80% in Korea.
Hong Kong also has the highest percentage of students who are in schools with computers set up in most classrooms, at 84%. In contrast, the corresponding figures for Australia and Korea were only 20% and 40%, respectively. Instead of installing computers in most classrooms, which are most likely to be machines for teacher presentation, more than half of the Australian Grade 8 students (58%) had access to sets of computers that can be moved between classrooms. Such mobile sets of computers allow students to engage in hands-on e-learning activities. In Korea, the percentage of students with access to mobile classroom computer sets was 41%, similar to the percentage with computers in most classrooms in the school (40%). The between-system variations in access were greatest in the percentage of students whose school allows students to bring their own computers to their schools. This figure was highest in Western countries: Australia (53%), Norway (48%), Denmark (83%), and Ontario (56%), as well as Newfoundland and Labrador (52%) in Canada. The corresponding figures for Hong Kong and Korea were much lower, at 11% and 4%, respectively.
4.1.4 Summary
HK students had relatively good access to computers and the Internet at school for instructional purposes: 100% had a computer lab and 84% had computers available in most classrooms in their schools. There was also no relative lack of digital learning resources for students in Hong Kong.
However, computers that students could access for e-learning at school, e.g. through class sets of computers that can be moved between classrooms or on
100 (0.0) 93 (2.7) 32 (4.8) 84 (4.3) 34 (5.3) 11 (3.4) 95 (0.4) 64 (0.9) 34 (1.0) 33 (1.0) 17 (0.8) 18 (0.8)85 (2.5) V 90 (2.1) S 58 (3.7) S 20 (2.6) T 24 (3.0) U 53 (3.9) S87 (2.5) V 80 (3.4) S 41 (4.2) 40 (3.3) U 21 (3.2) 4 (1.6) T
( )
S More than 10 percentage points above ICILS averageU Significantly above ICILS averageV Significantly below ICILS averageT More than 10 percentage points below ICILS average
Standard errors appear in parentheses. Because some results are rounded to the nearest whole number, some totals may appear inconsistent.
Student computers
(school-provided or
student-owned)
brought by students to
class
In most classrooms
(80% or more)
In computer laboratories
As class sets of computers that can be
moved between
classrooms
In the library
In other places
accessible to students (e.g.
cafeteria, auditorium, study area)
Educational System
Hong Kong (SAR)ICILS 2013 averageAustraliaKorea, Rep. of
94
computers brought by the student to class, were relatively low. In terms of network infrastructures to support learning, HK was comparatively lower on internet-based applications for collaborative work, and access to a learning management system (65%) as compared with Korea (94%).
4.2 School Policies and Practices Regarding ICT Use
In the principal questionnaire, there were four main categories of data collected: 1) the principal’s personal background and his/her personal use of ICT, 2) the school’s ICT demographics, 3) the school’s policies and practices with regard to ICT use for teaching and learning and 4) the management of ICT in the school. Preliminary analyses reveal that the most important factors are those related to leadership practices in schools. As mentioned at the beginning of this chapter, we have identified some scales that are of interest for further exploration based on the principals’ questionnaire responses on e-learning leadership practices. In this section, we will report the findings on the principals’ views about ICT use in their schools, as well as the policies and practices that they have initiated in coherent groups of questionnaire items. Where the group of items give rise to a scale score, we will put the variable name of the corresponding scale score in the title of the related subsection. However, the scale scores would not be further discussed as a descriptive statistic, and will only be explored further in section 4.4 as an integral part of the multilevel analysis results.
4.2.1 Principals’ views on educational purposes of ICT use
Principals were asked to indicate the importance of ICT use for achieving each of the following outcome goals, using a 3-point Likert scale, namely, not important, somewhat important, or very important:
x Developing students' computer skills, such as word processing, spreadsheet operations, and email;
x Using ICT for facilitating students’ responsibility for their own learning; x Using ICT to augment and improve students’ learning; x Developing students’ understanding and skills relating to safe and
appropriate use of ICT; x Developing students’ proficiency in accessing and using information with
ICT; and x Developing collaborative and organisational skills.
Hong Kong principals gave the highest priority to the three skill-oriented
outcomes (all >80%): (1) basics skills in using the office suite of applications and email, (2) proficiency in accessing and using information, and (3) safe and appropriate use of ICT.

95
These percentages are similar to the international means profile. Goals
related to improving students’ general learning outcomes and fostering students’ responsibility for their own learning were considered very important by only 64%
and 65%, respectively. This contrasts strongly with the Australian principals (93%
and 85%) and Korean principals (79% and 78%). Only 38% of Hong Kong students
attended schools whose principals consider ICT use to be very important for
developing students’ collaborative and organizational skills, whereas the international mean was 53%, and the Australian and Korean means were even
higher, at 73% and 68%, respectively. It is thus evident that Hong Kong principals’ views on the role of ICT for learning and teaching were still focused on traditional
outcomes, and gave much lower priority to ICT use in fostering 21st century skills.
Table 4.5 Percentages of students at schools where the principals consider ICT use as very important for achieving different educational outcomes
4.2.2 Principals’ expectations of teachers’ knowledge and skills in professional use of ICT (P_EXPTPK)
What are the ICT-related knowledge and skills that principals expect and/or
require teachers in their schools to possess? The principals were asked to indicate
which one of three responses (not expected, expected but not required, expected
and required) applied to the following two categories of skills:
(a) Communication skills:
x Communicating with other staff via ICT ;
x Collaborating with other teachers via ICT; and
(b) Technological pedagogical content knowledge (TPCK)
x Integrating Web-based learning in their instructional practice;
x Using ICT-based forms of student assessment;
x Using ICT for monitoring student progress;
83 (4.0) 65 (5.5) 64 (6.0) 86 (3.2) 84 (3.8) 38 (5.3)81 (1.2) 56 (1.4) 64 (1.5) 82 (1.2) 82 (1.3) 53 (1.5)79 (3.2) 85 (2.5) S 93 (1.7) S 95 (1.5) S 94 (1.5) S 73 (6.3) S
81 (5.6) 78 (5.2) S 79 (5.0) S 85 (4.1) 87 (3.7) 68 (7.1) S
( )
S More than 10 percentage points above ICILS averageU Significantly above ICILS averageV Significantly below ICILS averageT More than 10 percentage points below ICILS average
Standard errors appear in parentheses. Because some results are rounded to the nearest whole number, some totals may appear inconsistent.
Developing students' computer
skills, such as word
processing, spreadsheet operations, and email
Developing collaborative
and organisational
skills
Using ICT for facilitating students’
responsibility for their own
learning
Using ICT to augment and
improve students’ learning
Developing students’
understanding and skills relating to safe and
appropriate use of ICT
Developing students’
proficiency in accessing and
using information
with ICT
Educational System
Hong Kong (SAR)ICILS 2013 averageAustraliaKorea, Rep. of
96
x Integrating ICT into teaching and learning; x Using subject-specific learning software (e.g. tutorials, simulations); x Using e-portfolios for assessment; and x Using ICT to develop authentic (real-life) assignments for students.
Table 4.6 presents the percentages of students whose principals expect and
require their teachers to have the above skills. Interestingly, in Hong Kong and Australia, the TPCK that principals most cared about was the ability to use ICT to communicate with other staff, at 86% and 82% respectively, which is much higher than the use of ICT to collaborate with other teachers. In comparison, Hong Kong principals had relatively low expectations of teachers’ TPCK in other areas, with the highest being the integration of ICT into teaching and learning, with a percentage of only 68%. The lowest expectations were related to the use of ICT for assessment and monitoring of students, none of which had a percentage higher than 30%. In particular, the percentage of students whose principals expected teachers to be able to use ICT to develop authentic (real-life) assignments for students was only 16%. This is very disappointing as bringing authentic contexts into the classroom is one of the potential strengths that ICT use could offer.
4.2.3 The extent to which principals monitored teachers’ ICT use to achieve different learning outcomes
Principals were asked whether and how they monitor teachers’ ICT use for students’ learning or for developing students’ advanced ICT skills. Monitoring of teachers’ ICT use for more general aspects of student learning (P_MONSULRN) The questionnaire asked principals whether they monitor teachers’ ICT usage for the following aspects of students’ learning:
x Developing students’ computer skills, such as word-processing, spreadsheet operations, and email;
x Using ICT for facilitating students' responsibility for their own learning; and
x Using ICT to augment and improve students’ learning. If the answer was “yes”, the principals were further asked to indicate
whether the monitoring was done through reviewing lesson plans, teacher self-evaluation, observing classrooms or other means. Table 4.7 presents the percentages of students at schools where the principal monitors teachers’ ICT usage for students’ learning. These three items form a reliable scale and is labelled as P_MONSULRN.

97
Tabl
e 4.6
Per
cent
ages
of s
tude
nts a
t sch
ools
whe
re th
e pri
ncip
als e
xpec
t and
requ
ire t
each
ers t
o ha
ve d
iffer
ent t
echn
olog
ical
ped
agog
ical
kn
owle
dge a
nd c
omm
unic
atio
n sk
ills
52(4
.6)
30(5
.1)
23(4
.8)
86(3
.3)
57(5
.9)
26(4
.5)
68(5
.1)
40(5
.6)
30(5
.0)
16(3
.5)
55(1
.6)
33(1
.3)
40(1
.4)
51(1
.5)
47(1
.5)
35(1
.3)
66(1
.5)
42(1
.6)
20(1
.1)
26(1
.2)
42(6
.4)
T36
(5.2
)63
(6.3
)S
82(3
.9)S
60(5
.1)
S34
(4.6
)81
(3.3
)S
36(5
.6)
6(1
.7)T
20(4
.2)
54(1
0.5)
28(5
.8)
37(7
.2)
50(8
.8)
56(1
0.7)
32(6
.9)
55(9
.7)
54(1
0.7)
33(7
.7)
34(6
.7)
*P
erce
ntag
es re
flect
prin
cipa
ls th
at s
elec
ted
"Exp
ecte
d &
requ
ired"
#Th
ese
scal
e sc
ores
for H
K w
ere
cons
truct
ed b
ased
on
conf
irmat
ory
fact
or a
naly
ses
resu
lts o
n th
e H
K d
ata.
( )
Sta
ndar
d er
rors
app
ear i
n pa
rent
hese
s. B
ecau
se s
ome
resu
lts a
re ro
unde
d to
the
near
est w
hole
num
ber,
som
e to
tals
may
app
ear i
ncon
sist
ent.
SM
ore
than
10
perc
enta
ge p
oint
s ab
ove
ICIL
S a
vera
geU
Sig
nific
antly
abo
ve IC
ILS
ave
rage
VS
igni
fican
tly b
elow
ICIL
S a
vera
geT
Mor
e th
an 1
0 pe
rcen
tage
poi
nts
belo
w IC
ILS
ave
rage
Educ
atio
nal S
yste
m
Hon
g K
ong
(SAR
)IC
ILS
201
3 av
erag
eAu
stra
liaK
orea
, Rep
. of
Prin
cipal
's ex
pect
ed e
-lear
ning
skill
s & k
now
ledg
e of
teac
hers
that
are
inclu
ded
in sc
ale
scor
e P_
EXPT
PK#
Usin
g IC
T to
de
velo
p au
then
tic (r
eal-
life)
as
sign
men
ts
for s
tude
nts
Inte
grat
ing
ICT
into
teac
hing
an
d le
arni
ng
Usin
g su
bjec
t-sp
ecifi
c le
arni
ng
softw
are
(e.g
. tu
toria
ls,
sim
ulat
ion)
Usin
g e-
portf
olio
s fo
r as
sess
men
t
Inte
grat
ing
Web
-ba
sed
lear
ning
in
thei
rin
stru
ctio
nal
prac
tice
Usin
g IC
T-ba
sed
form
s of
stu
dent
asse
ssm
ent
Usin
g IC
T fo
r m
onito
ring
stud
ent
prog
ress
Com
mun
icat
ing
with
oth
er
staf
f via
ICT
Colla
bora
ting
with
oth
er
teac
hers
via
ICT
Com
mun
icat
ing
with
par
ents
vi
a IC
T

98
First of all, classroom observation is the most common method that principals use to monitor teachers’ ICT use for two of the aspects in students’ learning: developing students’ computer skills, and using ICT to augment and improve students’ learning with 57% and 51% respectively of the participating students’ principals reported doing so. Similar percentages were also observed in Australia, and Korea.
On the other hand, the steps taken by principals to monitor teacher’s ICT usage to facilitate students’ responsibility for their own learning were more diversified across different countries. Internationally, 47% of students were in schools where this was monitored through classroom observations. Among the three education systems compared in this publication, 66% of the Korean students’ schools monitored teachers’ ICT usage for this aspect through classroom observations. In contrast, most Australian students’ schools monitor this through teacher self-evaluation (55%), while most Hong Kong students’ schools monitor this through other means (48%). Monitoring of teachers’ ICT use for more advanced/specific areas of learning (P_MONSUADV) A similar question on whether and how school principals monitor teachers’ usage of ICT for developing the following more advanced/specific areas of learning:
x Developing students’ understanding and skills relating to safe and appropriate use of ICT;
x Developing students’ proficiency in accessing and using information with ICT; and
x Developing collaborative and organizational skills.
Findings from the above question is presented in Table 4.8. Among the 21 ICILS 2013 participating education systems, classroom observation was the main way that school principals used to monitor these three aspects of teacher ICT use. On the other hand, the most popular means of monitoring adopted in different countries were diverse.
The most popular means of monitoring for all of the above three types of ICT usage was through teacher self-evaluation for Australia (at 55% to 58%), and through classroom observations for Korea (at 44% to 48%). For Hong Kong, the monitoring of teachers’ ICT use for developing students’ collaborative and organizational skills was mostly done through classroom observations (43%), while the most popular means of monitoring for the other two types of ICT usages were by other means (46% to 48%). The scale score formed from responses to these three items collected from Hong Kong is labelled P_MONSUADV.

99
23(5
.5)
26(3
.7)
33(4
.6)
46(6
.5)
22(4
.7)
35(4
.4)
45(5
.5)
48(6
.3)
26(4
.8)
27(4
.6)
43(4
.9)
37(4
.9)
26(1
.3)
25(1
.3)
47(1
.7)
38(1
.7)
25(1
.3)
27(1
.3)
52(1
.6)
37(1
.7)
17(1
.2)
25(1
.3)
42(1
.6)
36(1
.6)
16(2
.4)V
55(5
.9)S
46(6
.0)
46(5
.6)
21(3
.0)
58(5
.7)S
53(5
.6)
44(6
.2)
15(2
.3)
58(5
.7)S
44(5
.3)
36(5
.3)
8(3
.0)T
18(4
.9)
44(9
.7)
32(1
2.5)
7(2
.5)T
16(4
.5)T
48(9
.6)
31(1
2.5)
7(2
.4)T
12(3
.4)T
48(8
.3)
32(1
0.2)
#Th
ese
scal
e sc
ores
for H
K we
re c
onst
ruct
ed b
ased
on
conf
irmat
ory
fact
or a
nalys
es re
sults
on
the
HK d
ata.
( )
Sta
ndar
d er
rors
app
ear i
n pa
rent
hese
s. B
ecau
se s
ome
resu
lts a
re ro
unde
d to
the
near
est w
hole
num
ber,
som
e to
tals
may
app
ear i
ncon
sist
ent.
SM
ore
than
10
perc
enta
ge p
oint
s ab
ove
ICIL
S av
erag
eU
Sign
ifica
ntly
abov
e IC
ILS
aver
age
VSi
gnifi
cant
ly be
low
ICIL
S av
erag
eT
Mor
e th
an 1
0 pe
rcen
tage
poi
nts
belo
w IC
ILS
aver
age
Hong
Kon
g (S
AR)
Yes,
by
revi
ewin
g le
sson
pl
ans
Yes,
thro
ugh
teac
her s
elf-
eval
uatio
n
Yes,
thro
ugh
obvs
ervi
ng
class
room
s
Educ
atio
nal
Syst
em
ICIL
S 20
13 a
vera
geAu
stra
liaKo
rea,
Rep
. of
Yes,
by o
ther
m
eans
Prin
cipal
's m
onito
ring o
f tea
cher
s' IC
T us
e fo
r dev
elop
ing s
tude
nts'
adva
nced
ICT
skill
s tha
t are
inclu
ded
in sc
ale
scor
e P_
MON
SUAD
V#
Yes,
by
revi
ewin
g le
sson
pla
ns
Yes,
thro
ugh
teac
her s
elf-
eval
uatio
n
Deve
loping
stud
ents’ u
nderstan
ding
and
skills
rela
ting
to sa
fe a
nd a
ppro
pria
te u
se o
f ICT
Deve
loping
stud
ents’ p
rofic
ienc
y in accessin
g an
d using inform
ation with
IC
TDe
velo
ping
colla
bora
tive
and
orga
niza
tiona
l ski
lls
Yes,
thro
ugh
obvs
ervi
ng
class
room
s
Yes,
by o
ther
m
eans
Yes,
by
revi
ewin
g le
sson
pl
ans
Yes,
thro
ugh
teac
her s
elf-
eval
uatio
n
Yes,
thro
ugh
obvs
ervi
ng
class
room
s
Yes,
by o
ther
m
eans
Tabl
e 4.8
Percentages of students at schools where the principals use various means to m
onitor teachers’ ICT use
36(5
.6)
41(5
.5)
55(4
.5)
38(5
.5)
17(4
.0)
30(4
.0)
36(4
.8)
48(6
.2)
22(4
.8)
39(4
.6)
53(6
.1)
33(4
.7)
42(1
.6)
30(1
.4)
57(1
.6)
23(1
.3)
20(1
.3)
24(1
.2)
47(1
.6)
30(1
.4)
31(1
.4)
29(1
.4)
51(1
.7)
31(1
.7)
36(6
.2)
41(5
.8)
53(5
.6)
32(5
.2)
14(2
.6)V
55(5
.2)S
44(5
.6)
30(5
.2)
32(6
.7)
51(5
.1)S
55(5
.7)
32(5
.2)
10(3
.4)T
12(3
.2)T
64(8
.0)
10(2
.9)T
6(2
.7)T
12(3
.5)T
66(8
.5)S
17(5
.0)
T9
(3.1
)T
14(4
.2)T
54(9
.6)
26(1
1.7)
#Th
ese
scal
e sc
ores
for H
K w
ere
cons
truct
ed b
ased
on
conf
irmat
ory
fact
or a
naly
ses
resu
lts o
n th
e H
K d
ata.
( )
Sta
ndar
d er
rors
app
ear i
n pa
rent
hese
s. B
ecau
se s
ome
resu
lts a
re ro
unde
d to
the
near
est w
hole
num
ber,
som
e to
tals
may
app
ear i
ncon
sist
ent.
SM
ore
than
10
perc
enta
ge p
oint
s ab
ove
ICIL
S a
vera
geU
Sig
nific
antly
abo
ve IC
ILS
ave
rage
VS
igni
fican
tly b
elow
ICIL
S a
vera
geT
Mor
e th
an 1
0 pe
rcen
tage
poi
nts
belo
w IC
ILS
ave
rage
Prin
cipal
's m
onito
ring o
f tea
cher
s' IC
T us
e fo
r stu
dent
lear
ning
that
are
inclu
ded
in sc
ale
scor
e P_
MON
SULR
N#
Yes,
by
revi
ewin
g le
sson
pla
ns
Yes,
thro
ugh
teac
her s
elf-
eval
uatio
n
Yes,
thro
ugh
obvs
ervi
ng
class
room
s
Yes,
by o
ther
m
eans
Yes,
by
revi
ewin
g le
sson
pl
ans
Yes,
thro
ugh
teac
her s
elf-
eval
uatio
n
Yes,
thro
ugh
obvs
ervi
ng
class
room
s
Yes,
by o
ther
m
eans
Yes,
by
revi
ewin
g le
sson
pl
ans
Yes,
thro
ugh
teac
her s
elf-
eval
uatio
n
Usin
g ICT to aug
men
t and
improv
e stud
ents’ lea
rning
Usin
g IC
T fo
r fac
ilita
ting
stud
ents
' res
pons
ibili
ty fo
r the
ir ow
n le
arni
ngDe
veloping
stud
ents’ com
puter s
kills
(suc
h as
wor
d-pr
oces
sing,
spre
adsh
eet o
pera
tions
, and
em
ail)
Educ
atio
nal
Syst
emH
ong
Kon
g (S
AR)
ICIL
S 2
013
aver
age
Aust
ralia
Kor
ea, R
ep. o
f
Yes,
thro
ugh
obvs
ervi
ng
class
room
s
Yes,
by o
ther
m
eans
Tabl
e 4. 7
Per
cent
ages
of s
tude
nts a
t sch
ools
where the principals use various means to m
onitor teachers’ ICT use to develop
students’ advanced IC
T skills

100
4.2.4 The extent to which principals took main responsibility for ICT management and implementation (P_RESICTM and P_RESICTU)
Principals were asked in the survey to indicate who within their schools took the
main responsibility for different aspects of ICT management connected with ICT
hardware and software management (purchasing/supplying ICT equipment,
selecting software to be used and maintaining ICT equipment), and ICT use aspects
(choosing whether ICT is used in teaching, implementing ICT-based approaches in
teaching and implementing ICT-based approaches in administration). Table 4.9
presents the related descriptive results, which gave rise to two scales, P_RESICTM
and P_RESICTU.
Table 4.9 Percentages of students at schools where the principals took main responsibilities for different aspects of ICT management and implementation
Internationally, the aspect of ICT implementation that had the highest
proportion of principals taking key responsibility for was implementing ICT-based
approaches in administration, with a mean of 81%. Compared to the international
and Australian means, the percentages of Hong Kong principals taking main
responsibility for the various aspects of ICT management were relatively low,
except for the implementation of ICT-based approaches in administration. In
general, principals were least likely to take main responsibility for ICT
maintenance issues.
It is also interesting to note that none of the respective percentages for Korean
principals were higher than 25%, indicating that for Korean schools, most of the
ICT-specific management and implementation responsibilities were devolved to
other staff members.
33 (5.5) 21 (5.8) 5 (2.1) 29 (5.8) 36 (6.2) 80 (4.8)67 (1.5) 41 (1.5) 26 (1.3) 56 (1.6) 45 (1.5) 81 (1.2)51 (5.3) T 28 (5.2) T 20 (4.9) 49 (6.1) 53 (5.3) 89 (3.6)25 (5.7) T 13 (3.3) T 8 (2.5) T 6 (2.1) T 5 (1.7) T 19 (4.5) T
* Percentages reflect principals that selected "Yes taking main responsibility"# These scale scores for HK were constructed based on confirmatory factor analyses results on the HK data. ( ) Standard errors appear in parentheses. Because some results are rounded to the nearest whole number,
some totals may appear inconsistent. S More than 10 percentage points above ICILS averageU Significantly above ICILS averageV Significantly below ICILS averageT More than 10 percentage points below ICILS average
Educational System
Hong Kong (SAR)ICILS 2013 averageAustraliaKorea, Rep. of
Implementing ICT based
approaches in administration
Principal's responsibility for ICT soft and hardware management that are included in
scale score P_RESICTM#
Principal's responsibility for e-Learning curriculum issues that are included in scale
score P_RESICTU#
Purchasing/supplying ICT equipment
Selecting software to be
used
Maintaining ICT equipment
Choosing whether ICT is
used in teaching
Implementing ICTbased
approaches in teaching

101
4.2.5 The extent to which schools had measures regarding ICT access and use (P_ProvStACC)
Principals were asked if they had implemented measures with regard to the
following aspects of ICT access and use:
x Setting up security measures to prevent unauthorised system access or
entry;
x Restricting the number of hours students are allowed to sit at a computer;
x Student access to school computers outside class hours (but during school
hours);
x Student access to school computers outside school hours;
x Honouring of intellectual property rights (e.g. software copyrights);
x Prohibiting access to inappropriate material (e.g. pornography, violence);
x Playing games on school computers;
x Giving the local community (parents and/or others) access to school
computers and/or the Internet; and
x Providing students with their own laptop computers and/or other mobile
learning devices for use at school and at home.
Hong Kong principals were most concerned about ensuring that students
would not access unauthorized or inappropriate sites, and that they would honour
intellectual property rights; all reported having measures to ensure these
conditions. Internationally, these are also the aspects that a vast majority of
students’ principals reported having implemented relevant measures.
Hong Kong principals were least concerned about restricting the total
number of hours students were allowed to sit in front of a computer, with only 33%
of students’ principals reported having measures in place regarding this. An even lower percentage of Australian students’ principals reported having this type of measures in place (18%), whereas the respective percentage for Korea was much
higher, at 64%. Table 4.10 presents the mean percentages of students in schools
with measures in place for the above aspects of ICT access and use. The table also
indicates the three items that contributed to the construction of the scale
P_ProvStACC.
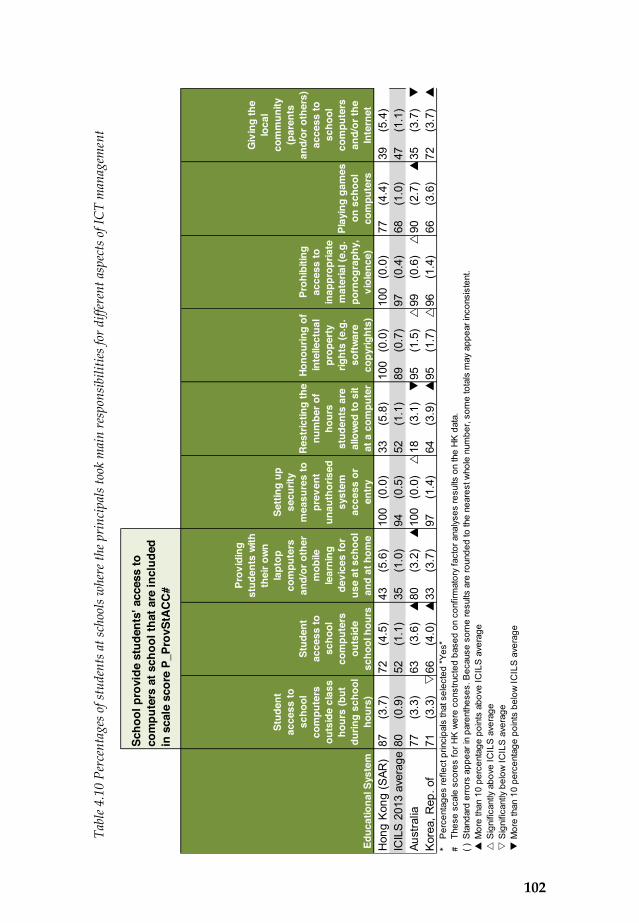
102
Tabl
e 4.1
0 Pe
rcen
tage
s of s
tude
nts a
t sch
ools
whe
re th
e pri
ncip
als t
ook
mai
n re
spon
sibi
litie
s for
diff
eren
t asp
ects
of I
CT
man
agem
ent
87(3
.7)�
72(4
.5)�
43(5
.6)
100
(0.0
)�
33(5
.8)�
100
(0.0
)�
100
(0.0
)�
77(4
.4)�
39(5
.4)�
80(0
.9)
52(1
.1)
35(1
.0)
94(0
.5)
52(1
.1)
89(0
.7)
97(0
.4)
68(1
.0)
47(1
.1)
77(3
.3)
63(3
.6)S
80(3
.2)S
100
(0.0
)U
18(3
.1)T
95(1
.5)U
99(0
.6)U
90(2
.7)S
35(3
.7)T
71(3
.3)V
66(4
.0)S
33(3
.7)
97(1
.4)
64(3
.9)S
95(1
.7)U
96(1
.4)
66(3
.6)
72(3
.7)S
* P
erce
ntag
es re
flect
prin
cipa
ls th
at s
elec
ted
"Yes
"#
Thes
e sc
ale
scor
es fo
r HK
wer
e co
nstru
cted
bas
ed o
n co
nfirm
ator
y fa
ctor
ana
lyse
s re
sults
on
the
HK
dat
a.
( ) S
tand
ard
erro
rs a
ppea
r in
pare
nthe
ses.
Bec
ause
som
e re
sults
are
roun
ded
to th
e ne
ares
t who
le n
umbe
r, so
me
tota
ls m
ay a
ppea
r inc
onsi
sten
t. S
Mor
e th
an 1
0 pe
rcen
tage
poi
nts
abov
e IC
ILS
ave
rage
US
igni
fican
tly a
bove
ICIL
S a
vera
geV
Sig
nific
antly
bel
ow IC
ILS
ave
rage
TM
ore
than
10
perc
enta
ge p
oint
s be
low
ICIL
S a
vera
ge
Educ
atio
nal S
yste
mH
ong
Kon
g (S
AR)
ICIL
S 2
013
aver
age
Aust
ralia
Kor
ea, R
ep. o
f
Play
ing
gam
es
on s
choo
l co
mpu
ters
Giv
ing
the
loca
l co
mm
unity
(p
aren
ts
and/
or o
ther
s)
acce
ss to
sc
hool
co
mpu
ters
an
d/or
the
Inte
rnet
Prov
idin
g st
uden
ts w
ith
thei
r own
la
ptop
co
mpu
ters
an
d/or
oth
er
mob
ile
lear
ning
de
vice
s fo
r us
e at
sch
ool
and
at h
ome
Setti
ng u
p se
curit
y m
easu
res
to
prev
ent
unau
thor
ised
sy
stem
ac
cess
or
entry
Rest
rictin
g th
e nu
mbe
r of
hour
s st
uden
ts a
re
allo
wed
to s
it at
a c
ompu
ter
Stud
ent
acce
ss to
sc
hool
co
mpu
ters
ou
tsid
e cl
ass
hour
s (b
ut
durin
g sc
hool
ho
urs)
Stud
ent
acce
ss to
sc
hool
co
mpu
ters
ou
tsid
e sc
hool
hou
rs
Hono
urin
g of
in
telle
ctua
l pr
oper
ty
right
s (e
.g.
softw
are
copy
right
s)
Proh
ibiti
ng
acce
ss to
in
appr
opria
te
mat
eria
l (e.
g.
porn
ogra
phy,
vi
olen
ce)
Scho
ol p
rovi
de s
tude
nts'
acc
ess
to
com
pute
rs a
t sch
ool t
hat a
re in
clud
ed
in s
cale
sco
re P
_Pro
vStA
CC#
103
4.2.6 The extent to which teachers participated in different forms of professional development as reported by principals (P_TPDpart)
Making provisions for teacher learning regarding ICT use is one major strategic area in any ICT in education policy. These could be organized as formal courses taught by experts, as school-based peer taught events, or as practice oriented events such as peer class observations, or meetings and informal discussions. Principals were asked to indicate how many teachers in their schools participated in the following forms of professional development about ICT for teaching and learning using a four point Likert scale (none or almost none, some, many, all or almost all):
x Participating in courses on the use of ICT in teaching provided by the school;
x Working with another teacher who has attended a course and then trains other teachers;
x Discussing the use of ICT in education as a regular item during meetings of the teaching staff;
x Observing colleagues using ICT in their teaching; x Discussing within groups of teachers about using ICT in their teaching; x Participating in a [community of practice] concerned with ICT in teaching; x Participating in courses conducted by an external agency or expert; and x Participating in professional learning programs delivered through ICT.
Table 4.11 shows the percentage of students whose principals responded that
either “many” or “all or almost all” of their schools’ teachers have participated in each kind of professional development activities. All these items were included in the construction of the scale P_TPDpart.
Internationally, the most popular form of ICT-related professional development activity was courses provided by the school, followed by informal discussions within groups of teachers as well as discussions on ICT use as a regular item embedded into staff meetings. Australian principals reported high participation in all forms of professional development, particularly the three forms of professional development that are also internationally most popular. In both Hong Kong and Korea, the most popular professional development activities were courses provided by the school and observing colleagues using ICT in their teaching.
However, the levels of participation reported by Hong Kong principals were very much lower than even the international average. This may be one of the reasons for the low levels of ICT adoption in teaching and student learning reported by teachers in Hong Kong.
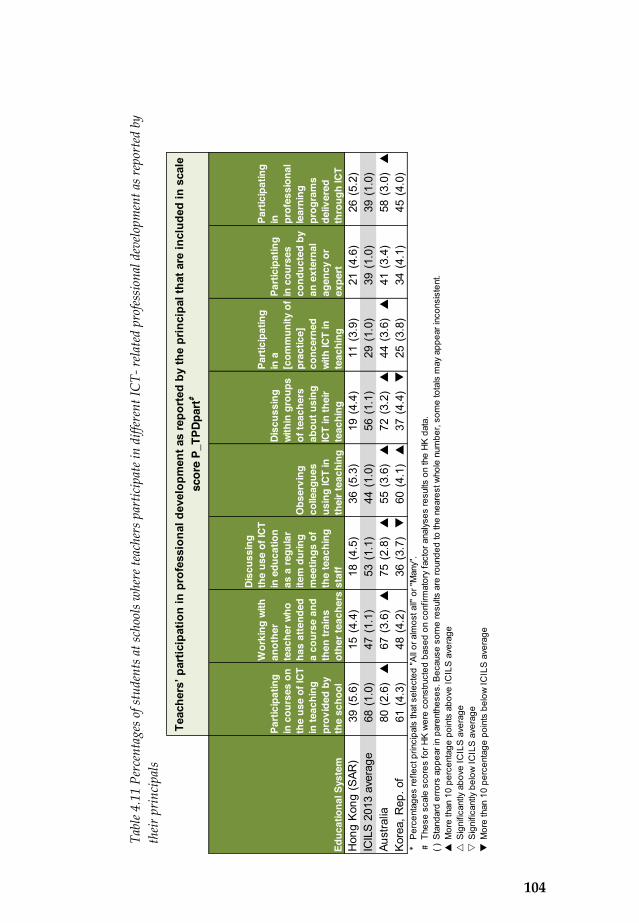
104
Tabl
e 4.1
1 Pe
rcen
tage
s of s
tude
nts a
t sch
ools
whe
re te
ache
rs p
artic
ipat
e in
diffe
rent
ICT-
rela
ted
prof
essi
onal
dev
elop
men
t as r
epor
ted
by
thei
r pri
ncip
als
39(5
.6)
15(4
.4)
18(4
.5)
36(5
.3)
19(4
.4)
11(3
.9)
21(4
.6)
26(5
.2)
68(1
.0)
47(1
.1)
53(1
.1)
44(1
.0)
56(1
.1)
29(1
.0)
39(1
.0)
39(1
.0)
80(2
.6)S
67(3
.6)S
75(2
.8)S
55(3
.6)S
72(3
.2)S
44(3
.6)S
41(3
.4)
58(3
.0)S
61(4
.3)
48(4
.2)
36(3
.7)T
60(4
.1)S
37(4
.4)T
25(3
.8)
34(4
.1)
45(4
.0)
* P
erce
ntag
es re
flect
prin
cipa
ls th
at s
elec
ted
"All
or a
lmos
t all"
or "
Man
y".
#Th
ese
scal
e sc
ores
for H
K w
ere
cons
truct
ed b
ased
on
conf
irmat
ory
fact
or a
naly
ses
resu
lts o
n th
e H
K d
ata.
( )
Sta
ndar
d er
rors
app
ear i
n pa
rent
hese
s. B
ecau
se s
ome
resu
lts a
re ro
unde
d to
the
near
est w
hole
num
ber,
som
e to
tals
may
app
ear i
ncon
sist
ent.
SM
ore
than
10
perc
enta
ge p
oint
s ab
ove
ICIL
S a
vera
geU
Sig
nific
antly
abo
ve IC
ILS
ave
rage
VS
igni
fican
tly b
elow
ICIL
S a
vera
geT
Mor
e th
an 1
0 pe
rcen
tage
poi
nts
belo
w IC
ILS
ave
rage
Educ
atio
nal S
yste
mH
ong
Kon
g (S
AR)
ICIL
S 2
013
aver
age
Aust
ralia
Kor
ea, R
ep. o
f
Teac
hers’ p
artic
ipation in profess
iona
l dev
elop
men
t as repo
rted by
the principa
l tha
t are in
clud
ed in
sca
le
scor
e P_
TPDp
art#
Parti
cipa
ting
in c
ours
es
cond
ucte
d by
an
ext
erna
l ag
ency
or
expe
rt
Parti
cipa
ting
in
prof
essi
onal
le
arni
ng
prog
ram
s de
liver
ed
thro
ugh
ICT
Parti
cipa
ting
in c
ours
es o
n th
e us
e of
ICT
in te
achi
ng
prov
ided
by
the
scho
ol
Wor
king
with
an
othe
r te
ache
r who
ha
s at
tend
ed
a co
urse
and
th
en tr
ains
ot
her t
each
ers
Disc
ussi
ng
the
use
of IC
T in
edu
catio
n as
a re
gula
r ite
m d
urin
g m
eetin
gs o
f th
e te
achi
ng
staf
f
Obs
ervi
ng
colle
ague
s us
ing
ICT
in
thei
r tea
chin
g
Disc
ussi
ng
with
in g
roup
s of
teac
hers
ab
out u
sing
IC
T in
thei
r te
achi
ng
Parti
cipa
ting
in a
[c
omm
unity
of
prac
tice]
co
ncer
ned
with
ICT
in
teac
hing

105
4.2.7 Principal’s priorities for facilitating use of ICT (P_PriAcComp,
P_PriELRes and P_PriPedaUse)
Principals play a major role in many important decisions regarding resource
allocation and staffing that affect ICT use in schools. Principals were asked in the
questionnaire to indicate the priorities they gave to the following to facilitate the
use of ICT in teaching and learning in their schools through a 4-point Likert scale
(not a priority, low priority, medium priority, high priority):
x Increasing the numbers of computers per student in the school;
x Increasing the number of computers connected to the Internet;
x Increasing the bandwidth of Internet access for the computers connected
to the Internet;
x Increasing the range of digital learning resources;
x Establishing or enhancing an online learning support platform;
x Providing for participation in professional development on pedagogical
use of ICT;
x Increasing the availability of qualified technical personnel to support the
use of ICT;
x Providing teachers with incentives to integrate ICT use in their teaching;
x Providing more time for teachers to prepare lessons in which ICT is used;
and
x Increasing the professional learning resources for teachers in the use of
ICT.
Table 4.12 presents the percentages of principals who indicated medium or
high priority given to the ways of facilitation listed above. From the table, it is clear
that internationally, a large majority of surveyed students’ principals found all of the measures listed above to be at least of medium priority (varying between 78%
and 93%). Furthermore, the profile of priorities indicate that digital learning
resources, providing for participation in professional development on pedagogical use of ICT and increasing the professional learning resources for teachers in the use of ICT were
considered to be of priority by a greater percentage of students’ principals
compared to computer access and Internet connectivity.
On the other hand, the priorities given by Hong Kong students’ principals were lower than the international average, except for establishing or enhancing an online learning support platform, which was 87% as compared to 79% for the
international average. In fact, establishing or enhancing online learning support platform also given high priorities by principals of Australian and Korea students,
at 90% and 94% respectively. In addition, the priorities given by Hong Kong
students’ principals to supporting professional learning of teachers were lower than that given to increasing the bandwidth of Internet connections in the school.

106
50(4
.3)
74
(5.1
)
84(3
.9)
83
(4.3
)
87(3
.3)
79
(3.7
)
68(5
.0)
69
(4.8
)
55(6
.0)
80
(4.1
)88
(0.7
)89
(0.7
)89
(0.7
)93
(0.6
)79
(0.9
)91
(0.6
)84
(0.9
)86
(0.7
)78
(0.9
)91
(0.6
)81
(2.8
)V
79(3
.0)T
84(2
.6)V
93(2
.0)
90(2
.1)S
97(1
.2)U
80(2
.8)
68(3
.6)T
54(4
.0)T
90(2
.2)
65(3
.6)T
71(3
.5)T
75(3
.8)T
89(2
.7)
94(2
.0)S
89(2
.5)
84(3
.1)
90(2
.6)
87(2
.7)U
96(1
.7)U
*P
erce
ntag
es re
flect
prin
cipa
ls th
at s
elec
ted
"Hig
h pr
iorit
y" o
r "M
ediu
m p
riorit
y".
#Th
ese
scal
e sc
ores
for H
K w
ere
cons
truct
ed b
ased
on
conf
irmat
ory
fact
or a
naly
ses
resu
lts o
n th
e H
K d
ata.
( )
Sta
ndar
d er
rors
app
ear i
n pa
rent
hese
s. B
ecau
se s
ome
resu
lts a
re ro
unde
d to
the
near
est w
hole
num
ber,
som
e to
tals
may
app
ear i
ncon
sist
ent.
mor
e th
an 3
sco
re p
oint
s ab
ove
ICIL
S a
vera
geS
Mor
e th
an 1
0 pe
rcen
tage
poi
nts
abov
e IC
ILS
ave
rage
US
igni
fican
tly a
bove
ICIL
S a
vera
geV
Sig
nific
antly
bel
ow IC
ILS
ave
rage
mor
e th
an 3
sco
re p
oint
s be
low
ICIL
S a
vera
geT
Mor
e th
an 1
0 pe
rcen
tage
poi
nts
belo
w IC
ILS
ave
rage
Prio
ritie
s giv
en to
impr
ove
acce
ss to
com
pute
rs a
nd
inte
rnet
in sc
hool
that
are
incl
uded
in sc
ale
scor
e P_
PriA
cCom
p#
Prio
ritie
s giv
en to
incr
ease
the
rang
e of
e-L
earn
ing
reso
urce
s in
scho
ol th
at a
re in
clud
ed in
scal
e sc
ore
P_Pr
iELR
es#
Prio
ritie
s giv
en to
impr
ove
supp
orts
for t
each
ers o
n pe
dago
gica
l use
of
ICT
in sc
hool
that
are
incl
uded
in sc
ale
scor
e P_
PriP
edaU
se#
Prov
idin
g fo
r pa
rtic
ipat
ion
in
prof
essi
onal
de
velo
pmen
t on
pe
dago
gica
l us
e of
ICT
Incr
easi
ng th
e pr
ofes
sion
al
lear
ning
re
sour
ces
for
teac
hers
in
the
use
of IC
T
Incr
easi
ng th
e av
aila
bilit
y of
qu
alifi
ed
tech
nica
l pe
rson
nel t
o su
ppor
t the
us
e of
ICT
Prov
idin
g te
ache
rs w
ith
ince
ntiv
es to
in
tegr
ate
ICT
use
in th
eir
teac
hing
Prov
idin
g m
ore
time
for
teac
hers
to
prep
are
less
ons
in
whi
ch IC
T is
us
ed
Incr
easi
ng th
e nu
mbe
rs o
f co
mpu
ters
pe
r stu
dent
in
the
scho
ol
Incr
easi
ng th
e nu
mbe
r of
com
pute
rs
conn
ecte
d to
th
e In
tern
et
Incr
easi
ng th
e ba
ndw
idth
of
Inte
rnet
ac
cess
for t
he
com
pute
rs
conn
ecte
d to
th
e In
tern
et
Aust
ralia
Kor
ea, R
ep. o
f
Incr
easi
ng th
e ra
nge
of
digi
tal l
earn
ing
reso
urce
s
Esta
blis
hing
or
enh
anci
ng
an o
nlin
e le
arni
ng
supp
ort
plat
form
Educ
atio
nal S
yste
m
Hon
g K
ong
(SAR
)IC
ILS
201
3 av
erag
e
Tabl
e 4.1
2 Pe
rcen
tage
s of s
tude
nts a
t sch
ools
whe
re p
rinc
ipal
s ind
icat
e med
ium
or h
igh
prio
rity
to w
ays o
f fac
ilita
ting
use o
f IC
T in
te
achi
ng a
nd le
arni
ng
107
In contrast, Australian and Korean principals’ top priorities reflect their concern about teacher’s pedagogical use of ICT as well as the range of e-Learning
resources at school. Providing for participation in professional development on pedagogical use of ICT was considered by 97% of Australian students’ principals and 89% of Korea students’ principals as of at least medium priority. Among Korean students’ principals, the top three priorities were: increasing the professional learning resources for teachers in the use of ICT (96%), establishing or enhancing online learning support platforms (94%), and providing teachers with incentives to integrate ICT use in their teaching (90%). Interestingly, only 68-69% of Australian and Hong Kong
students’ principals indicated providing teachers with incentives to integrate ICT
use in their teaching as of medium or high priority.
Three scale scores on principals’ priorities were constructed from responses to the items in this question as presented in Table 4.12: improving computer and
Internet access (P_PriAcComp), increasing the range of learning resources
(P_PriELRes), and improving support for teachers on pedagogical use of ICT
(P_PriPedaUse) in the school.
4.2.8 Obstacles that hinder school’s capacity to realize its e-Learning goals (NP_ObsInsufH&S, NP_ObsbyTs, NP_ObsCurr, NP_InsufRes)
The Hong Kong version of ICILS principal questionnaire contains one national
item that invited principals to rate whether the issues listed below pose hindrance
(Not at all, a little, somewhat, a lot or not applicable) to their school’s capacity to realize its e-Learning goals:
x Insufficient qualified technical personnel to support the use of ICT;
x Insufficient number of computers connected to the Internet;
x Insufficient Internet bandwidth or speed;
x Insufficient ICT equipment for student use in learning;
x Computers are out of date;
x Teachers' lack of ICT skills;
x Insufficient time for teachers to implement e-learning;
x Teachers do not have sufficient knowledge to implement new pedagogical
approaches for e-learning;
x Pressure to score highly on standardised tests;
x Prescribed curricula are too strict;
x Insufficient or inappropriate space to accommodate the school's
pedagogical approaches;
x Insufficient budget for the needs of ICT implementation (e.g. LMS); and
x Using ICT for teaching and/or learning is not a goal of our school.

108
Table 4.13 reports the percentages of principals who indicate “somewhat” or “a lot” hindrance to the issues listed. The top issues that Hong Kong principals indicated as hindrances to their school were pedagogy related, for example:
insufficient time for teachers to implement e-Learning (59%) is the number one
hindrance as perceived by Hong Kong principals, followed by insufficient budget for the needs of ICT implementation (e.g. LMS) (46%) as well as insufficient qualified technical personnel to support the use of ICT (35%). More than one third (34%) of Hong
Kong principals indicated that pressure to score highly on standardized tests was
an obstacle.
The data further suggest that lack of hardware or general ICT skills among
teachers were not big obstacles to Hong Kong principals. Only 13%-19% of Hong
Kong students’ principals indicated insufficient computers (13%), Internet bandwidth (14%), and ICT equipment (19%) were obstacles to their school.
Teacher’s lack of ICT skills was also not a major concern among Hong Kong principals, as only 11% of principals included this as an obstacle in their responses.
Four scales related to the nature of the obstacles to implementing e-learning
as perceived by principals’ were constructed: insufficient hard- and soft- ware
(NP_ObsInsufH&S), teacher-related obstacles (NP_ObsbyTs), curriculum and
assessment related obstacles (NP_ObsCurr) and inadequate budget and/or other
resources (NP_InsufRes). Their respective compositions are presented in Table 4.13.
4.3 Teacher’s ICT-using Pedagogy
Teachers play the biggest role in determining the learning experiences of students.
The role that ICT plays in the learning lives of students could play an important
role in influencing students’ CIL outcomes. In the ICILS 2013 teacher questionnaire, we asked teachers to report on what
they use and how they use ICT in their teaching and in their students’ learning. In addition, we tried to find out about their confidence in various general purpose
and pedagogical uses of ICT, as well as the extent to which they put emphasis on
supporting their students’ development of various CIL capabilities. The descriptive results from the teacher questionnaire are reported in this section to
provide a comprehensive picture of teachers’ ICT-using pedagogy in Hong Kong,
and in comparison with their international, Australian and Korean counterparts.
Similar to the reporting on scale scores constructed from the relevant
questionnaire responses, we also identify the scales constructed from the teacher
questionnaire responses in the sections where the relevant related descriptive
statistics.

109
Tabl
e 4.1
3 Pe
rcen
tage
s of H
ong
Kon
g principals who indicate “somew
hat” or “a lot” of hindran
ce cau
se by issues listed to their school’s
capa
city
to re
aliz
e e-L
earn
ing
capa
city
35(4
.4)
13(3
.3)
14(3
.2)
19(4
.2)
28(4
.8)
11(2
.9)
59(5
.5)
26(4
.3)
34(5
.5)
22(4
.6)
31(4
.6)
46(5
.8)
9(3
.1)
*P
erce
ntag
es re
flect
prin
cipa
ls th
at s
elec
ted
"A lo
t".#
Thes
e sc
ale
scor
es fo
r HK
wer
e co
nstru
cted
bas
ed o
n co
nfirm
ator
y fa
ctor
ana
lyse
s re
sults
on
the
HK
dat
a.
( ) S
tand
ard
erro
rs a
ppea
r in
pare
nthe
ses.
Bec
ause
som
e re
sults
are
roun
ded
to th
e ne
ares
t who
le n
umbe
r, so
me
tota
ls m
ay a
ppea
r inc
onsi
sten
t.
Hon
g K
ong
(SAR
)
Insu
fficien
t ICT
hard an
d so
ftware hind
er th
e sc
hool’s cap
acity
to
real
ize
its e
-Lea
rnin
g go
als
that
are
incl
uded
in s
cale
sco
re
NP_O
bsIn
sufH
&S#
Insu
ffici
ent
qual
ified
te
chni
cal
pers
onne
l to
supp
ort t
he
use
of IC
T
Insu
ffici
ent
num
ber o
f co
mpu
ters
co
nnec
ted
to th
e In
tern
et
Insu
ffici
ent
Inte
rnet
ba
ndw
idth
or
spe
ed
Insu
ffici
ent
ICT
equi
pmen
t fo
r stu
dent
us
e in
le
arni
ng
Com
pute
rs
are
out o
f da
teEd
ucat
iona
l Sy
stem
Insu
ffici
ent b
udge
t, sp
ace,
or
mismatch
of g
oals hinde
r the
sch
ool’s
ca
paci
ty to
real
ize
its e
-Lea
rnin
g go
als
that
are
incl
uded
in s
cale
sco
re
NP_I
nsuf
Res#
Insu
ffici
ent
or
inap
prop
riat
e sp
ace
to
acco
mm
oda
te th
e sc
hool
's
peda
gogi
cal
appr
oach
es
Insu
ffici
ent
budg
et fo
r th
e ne
eds
of
ICT
impl
emen
tat
ion
(e.g
. LM
S)
Usin
g IC
T fo
r tea
chin
g an
d/or
le
arni
ng is
no
t a g
oal o
f ou
r sch
ool
Teac
hers
' la
ck o
f ICT
sk
ills
Insu
ffici
ent
time
for
teac
hers
to
impl
emen
t e-
lear
ning
Teac
hers
do
not h
ave
suffi
cien
t kn
owle
dge
to
impl
emen
t ne
w
peda
gogi
cal
appr
oach
es
for e
-le
arni
ng
Obs
tacl
es fa
ced
by te
ache
rs h
inde
r the
sc
hool’s cap
a-city to
realize its
e-
Lear
ning
goa
ls th
at a
re in
clud
ed in
sc
ale
scor
e NP
_Obs
byTs
#
Pres
crib
ed
curr
icul
a ar
e to
o st
rict
Pres
sure
to
scor
e hi
ghly
on
st
anda
rdis
ed
test
s
Curr
icul
um a
nd
asse
ssm
ent r
elat
ed
obst
acle
s hi
nder
the
scho
ol’s cap
acity
to
real
ize
its e
-Lea
rnin
g go
als
that
are
incl
uded
in
scal
e sc
ore
NP_O
bsCu
rr#

110
4.3.1 Teacher confidence in using ICT (T_EFGen, T_EFAdv, T_EFPeda)
The ICILS teacher questionnaire invited teachers to indicate their confidence in their own ability to carry out a number of tasks on a computer by themselves using three points Likert scale, (I know how to do this, I could work out how to do this, I do not think I could do this). These tasks ranged from general computer operations to pedagogical uses of ICT:
x Producing a letter using a word-processing program; x E-mailing a file as an attachment; x Storing your digital photos on a computer; x Filing digital documents in folders and sub-folders; x Producing presentations (e.g. [Microsoft PowerPoint®] or a similar
program), with simple animation functions; x Finding useful teaching resources on the Internet; x Using a spreadsheet program (e.g. [Lotus 1 2 3 ®, Microsoft Excel ®]) for
keeping records or analysing data; x Contributing to a discussion forum/user group on the Internet (eg. a wiki
or blog); x Using the Internet for online purchases and payments; x Collaborating with others using shared resources such as [Google Docs®] x Installing software; x Monitoring students' progress; x Preparing lessons that involve the use of ICT by students; and x Assessing student learning.
Table 4.14 reports the percentages of teachers who have indicated “I know
how to do” the listed tasks in the survey. The results indicate that a large majority of Hong Kong teachers surveyed knew how to perform general and some advanced ICT tasks, with percentages higher than the international average. This stands in stark contrasts to the teachers’ self-reported competence in ICT use for pedagogically related tasks, namely monitoring students’ progress (52%), and assessing students’ learning (58%), which were much lower than the corresponding percentages reported by Australian (respectively 86% and 83%) and Korean (respectively 62% and 82%) teachers. Three scales were derived from confirmatory analysis on responses to this question related to teachers’ ICT-related self-efficacy: in general ICT tasks (T_EFGen), in advanced ICT skills (T_EFAdv), and in pedagogical use of ICT (T_EFPeda), as indicated in Table 4.14.

111
94(1
.1)
97
(0.6
)
93(1
.0)
92
(0.9
)
92(0
.8)
94
(0.6
)
74(1
.5)
66
(1.6
)
80(1
.2)
45
(1.5
)
69(1
.5)
52(1
.5)
74
(1.2
)
58(1
.4)
89
(0.3
)89
(0.3
)82
(0.3
)84
(0.3
)76
(0.4
)92
(0.3
)59
(0.4
)58
(0.5
)77
(0.4
)44
(0.5
)47
(0.4
)65
(0.5
)73
(0.4
)71
(0.5
)98
(0.3
)U
98(0
.3)U
93(0
.5)S
94(0
.6)U
87(0
.6)S
96(0
.5)U
74(1
.2)S
60(1
.1)
95(0
.5)S
48(1
.8)U
69(1
.1)S
86(0
.8)S
90(0
.7)S
83(0
.9)S
95(0
.8)U
97(0
.9)U
96(0
.9)S
94(0
.7)U
68(2
.0)V
95(1
.8)
69(1
.1)U
66(1
.5)U
94(0
.8)S
35(1
.1)V
66(1
.8)S
62(1
.7)
84(1
.2)S
82(2
.0)S
*P
erce
ntag
es re
flect
teac
her w
ho h
ave
sele
cted
"I k
now
how
to d
o th
is".
#Th
ese
scal
e sc
ores
for H
K w
ere
cons
truct
ed b
ased
on
conf
irmat
ory
fact
or a
naly
ses
resu
lts o
n th
e H
K d
ata.
( )
Sta
ndar
d er
rors
app
ear i
n pa
rent
hese
s. B
ecau
se s
ome
resu
lts a
re ro
unde
d to
the
near
est w
hole
num
ber,
som
e to
tals
may
app
ear i
ncon
sist
ent.
SM
ore
than
10
perc
enta
ge p
oint
s ab
ove
ICIL
S a
vera
geU
Sig
nific
antly
abo
ve IC
ILS
ave
rage
VS
igni
fican
tly b
elow
ICIL
S a
vera
geT
Mor
e th
an 1
0 pe
rcen
tage
poi
nts
belo
w IC
ILS
ave
rage
Educ
atio
nal S
yste
mH
ong
Kon
g (S
AR)
ICIL
S 2
013
aver
age
Aust
ralia
Kor
ea, R
ep. o
f
Mon
itorin
g st
uden
ts'
prog
ress
Cont
ribut
ing
to a
di
scus
sion
fo
rum
/use
r gr
oup
on th
e In
tern
et (e
g. a
wi
ki o
r blo
g)
Teac
her’s
self-e
ffica
cy in
ped
agog
ical
use
of IC
T th
at a
re in
clud
ed in
sca
le
scor
e T_
EFPe
da#
Inst
allin
g so
ftwar
e
Asse
ssin
g st
uden
t le
arni
ng
Teac
her’s
self-e
ffica
cy in
gen
eral IC
T task
s th
at a
re in
clud
ed in
sca
le s
core
T_E
FGen
#
Prod
ucin
g a
lette
r usi
ng a
wo
rd-
proc
essi
ng
prog
ram
E-m
ailin
g a
file
as a
n at
tach
men
t
Stor
ing
your
di
gita
l pho
tos
on a
com
pute
r
Filin
g di
gita
l do
cum
ents
in
fold
ers
and
sub-
fold
ers
Usin
g a
spre
adsh
eet
prog
ram
(e.g
. [L
otus
1 2
3 ®
, M
icro
soft
Exce
l ®])
for
keep
ing
reco
rds
or
anal
ysin
g da
ta
Find
ing
usef
ul
teac
hing
re
sour
ces
on
the
Inte
rnet
Colla
bora
ting
with
oth
ers
usin
g sh
ared
re
sour
ces
such
as
[Goo
gle
Docs
®]
Teac
her’s
self-e
ffica
cy in
adv
ance
d ICT sk
ills
that
are
incl
uded
in s
cale
sco
re T
_EFA
dv#
Prod
ucin
g pr
esen
tatio
ns
(e.g
. [M
icro
soft
Powe
rPoi
nt®]
or
a s
imila
r pr
ogra
m),
with
si
mpl
e an
imat
ion
func
tions
Usin
g th
e In
tern
et fo
r on
line
purc
hase
s an
d pa
ymen
ts
Prep
arin
g le
sson
s th
at
invo
lve
the
use
of IC
T by
st
uden
ts
Tabl
e 4.1
4 Pe
rcen
tage
s of t
each
ers e
xpre
ssin
g co
nfid
ence
in d
oing
diff
eren
t com
pute
r tas
ks

112
4.3.2 Teachers’ reported use of ICT tools in teaching (T_USEPedaT)
The survey asked teachers to indicate the frequency of their use of the following
ICT tools in teaching using a 4-point Likert scale (never, in some lessons, in most
lessons, in every or almost every lesson):
x Tutorial software or [practice programs];
x Digital learning games;
x Spreadsheets (e.g. [Microsoft Excel®]);
x Interactive digital learning resources (e.g. learning objects)
x e-portfolios;
x Word-processors or presentation software (e.g. [Microsoft Word ®],
[Microsoft PowerPoint ®]);
x Multimedia production tools (e.g. media capture and editing, web
production);
x Concept mapping software (e.g. [Inspiration ®], [Webspiration ®]);
x Data logging and monitoring tools ;
x Simulations and modelling software;
x Social media (e.g. Facebook, Twitter);
x Communication software (e.g. email, blogs);
x Computer-based information resources (e.g. encyclopaedia, wikis,
websites); and
x Graphing or drawing software.
Table 4.15 reports on the percentages of teachers indicating frequent use of
ICT tools (that is, in most lessons, or in every or almost every lesson). Results show
that the highest reported frequent usage is with the use word-processors or
presentation software internationally (30%) as well as in Hong Kong (52%),
Australia (41%) and Korea (47%). Tutorial software, interactive digital resources,
and computer-based information resources had somewhat “medium” usage, being reported for frequent usage by more than 10% of by Hong Kong teachers. Most of
the other ICT tools surveyed, such as e-portfolios and concept mapping software,
require deeper pedagogical integration for their use and were reported as
frequently used by single digit percentages of teachers in Hong Kong and
elsewhere. A scale related to teachers’ reported use of pedagogical ICT tools,
T_USEPedaT, was constructed from five of the items in this question, as indicated
in Table 4.15.

113
22(1
.2)
3
(0.6
)
9(1
.0)
13
(1.1
)
2(0
.4)
52(1
.9)
11
(1.0
)
3(0
.6)
3
(0.6
)
3(0
.5)
3
(0.6
)
9(1
.1)
13
(1.0
)
6(0
.7)
15
(0.4
)5
(0.2
)7
(0.3
)15
(0.4
)4
(0.2
)30
(0.4
)8
(0.3
)4
(0.2
)6
(0.2
)3
(0.1
)4
(0.2
)10
(0.3
)23
(0.4
)7
(0.3
)7
(0.6
)V
6(0
.6)
5(0
.5)V
15(0
.8)
3(0
.4)V
41(1
.2)S
10(0
.6)
2(0
.3)V
5(0
.5)
4(0
.5)
1(0
.3)V
15(1
.4)U
31(1
.1)U
5(0
.5)V
28(1
.9)S
7(1
.0)
10(0
.8)U
11(0
.6)V
6(0
.9)
47(1
.9)S
17(2
.0)U
3(0
.7)
5(0
.9)
6(0
.7)U
5(0
.8)U
12(1
.2)
20(1
.0)V
20(2
.4)S
*P
erce
ntag
es re
flect
teac
her w
ho h
ave
sele
cted
"In
mos
t les
sons
" and
"In
ever
y or
alm
ost e
very
less
on".
#Th
ese
scal
e sc
ores
for H
K w
ere
cons
truct
ed b
ased
on
conf
irmat
ory
fact
or a
naly
ses
resu
lts o
n th
e H
K d
ata.
( )
Sta
ndar
d er
rors
app
ear i
n pa
rent
hese
s. B
ecau
se s
ome
resu
lts a
re ro
unde
d to
the
near
est w
hole
num
ber,
som
e to
tals
may
app
ear i
ncon
sist
ent.
SM
ore
than
10
perc
enta
ge p
oint
s ab
ove
ICIL
S a
vera
geU
Sig
nific
antly
abo
ve IC
ILS
ave
rage
VS
igni
fican
tly b
elow
ICIL
S a
vera
geT
Mor
e th
an 1
0 pe
rcen
tage
poi
nts
belo
w IC
ILS
ave
rage
Kor
ea, R
ep. o
f
Teac
her’s
repo
rted us
e of ped
agog
ical IC
T tools
that
are
incl
uded
in s
cale
sco
re T
_USE
Peda
T#
Educ
atio
nal S
yste
m
Inte
ract
ive
digi
tal
lear
ning
re
sour
ces
(e.g
. le
arni
ng
obje
cts)
Hon
g K
ong
(SAR
)IC
ILS
201
3 av
erag
eAu
stra
lia
Conc
ept
map
ping
so
ftwar
e (e
.g.
[Insp
iratio
n ®
], [W
ebsp
irati
on ®
])
Data
lo
ggin
g an
d m
onito
ring
tool
s
Tuto
rial
softw
are
or
[pra
ctic
e pr
ogra
ms]
Digi
tal
lear
ning
ga
mes
Wor
d-pr
oces
sors
or
pr
esen
tatio
n so
ftwar
e (e
.g.
[Mic
roso
ft W
ord
®],
[Mic
roso
ft Po
wer
Poin
t ®
])
Spre
adsh
eet
s (e
.g.
[Mic
roso
ft Ex
cel®
])
Mul
timed
ia
prod
uctio
n to
ols
(e.g
. m
edia
ca
ptur
e an
d ed
iting
, web
pr
oduc
tion)
Com
pute
r-ba
sed
info
rmat
ion
reso
urce
s (e
.g.
web
site
s,
wik
is,
ency
clop
aed
ia)
Gra
phin
g or
dr
awin
g so
ftwar
ee-
portf
olio
s
Sim
ulat
ions
an
d m
odel
ling
softw
are
Soci
al
med
ia (e
.g.
Face
book
, Tw
itter
)
Com
mun
icat
ion
softw
are
(e.g
. em
ail,
blog
s)
Tabl
e 4.1
5 Pe
rcen
tage
s of t
each
ers u
sing
ICT
tool
s in
mos
t, al
mos
t eve
ry, a
nd ev
ery
less
ons

114
4.3.3 Teachers’ reported student use of ICT in different learning tasks (T_StUInno, T_StUTrad, T_StUExt)
The survey also invited teachers to report on frequencies of students’ usage of ICT (never, sometimes, often) in different types of learning activities, as listed below:
x Working on extended projects (i.e. over several weeks) x Undertaking open-ended investigations or field work x Reflecting on their learning experiences (e.g. by using a learning log) x Communicating with students in other schools on projects x Planning a sequence of learning activities for themselves x Processing and analysing data x Evaluating information resulting from a search x Working on short assignments (i.e. within one week) x Explaining and discussing ideas with other students x Submitting completed work for assessment x Working individually on learning materials at their own pace x Seeking information from experts outside the school x Searching for information on a topic using outside resources
Table 4.16 reports the percentages of teachers who reported that their grade
8 students often use ICT for learning activities in the classroom. The results for most of the learning activities surveyed were very low, at only a single digit percentage. The highest percentages recorded were for working on extended projects (i.e. over several weeks) (12%), and searching for information on a topic using outside resources (11%), Hong Kong students’ ICT usages in all types of learning activities were either equal to, or lower than the corresponding international averages.
The difference in percentage between the Hong Kong and international means was largest for students’ use of ICT to search for information on a topic using outside resources, at 18%. The percentages reported by Korean teachers were also lower than the international average for most of the ICT-using students’ learning activities surveyed, though these averages were still higher than the corresponding one for Hong Kong, except for one activity, which is to use ICT to work on extended projects. This figure was 12% for Hong Kong and 9% for Korea. On the other hand, the corresponding percentages reported by Australian teachers were generally higher than the international mean, with often use of ICT reported by more than 30% in three activities: working on extended projects, submitting completed work for assessment and searching for information on a topic using outside resources. Three scales were constructed from responses to this question on students’ ICT use: in innovative student-centred learning tasks (T_StUInno), in traditional learning tasks (T_StUTrad), and in accessing external resources and experts (T_StUExt), as presented in Table 4.16.

115
12(1
.1)
3
(0.7
)
2(0
.5)
2
(0.6
)
2(0
.6)
5
(0.8
)
4(0
.8)
5(0
.7)
5
(0.7
)
7(0
.8)
5
(0.6
)
2(0
.5)
11
(1.2
)
12(0
.3)
8(0
.3)
6(0
.3)
3(0
.2)
11(0
.3)
11(0
.4)
14(0
.4)
20(0
.4)
12(0
.3)
18(0
.4)
16(0
.3)
7(0
.3)
29(0
.5)
31(1
.3)S
16(1
.0)U
6(0
.6)
4(0
.5)
3(0
.4)V
7(0
.7)V
15(0
.9)
31(1
.5)S
15(1
.0)U
32(1
.3)S
28(1
.2)S
4(0
.4)V
32(1
.4)U
9(1
.3)V
5(0
.7)V
4(0
.6)V
4(0
.7)
5(0
.8)V
10(1
.4)
7(1
.0)V
13(1
.4)V
8(0
.9)V
11(0
.9)V
11(1
.2)V
15(1
.7)U
19(2
.1)V
*Pe
rcen
tage
s re
flect
teac
her w
ho h
ave
indi
cate
d "O
ften"
.#
Thes
e sc
ale
scor
es fo
r HK
were
con
stru
cted
bas
ed o
n co
nfirm
ator
y fa
ctor
ana
lyses
resu
lts o
n th
e HK
dat
a.
( ) S
tand
ard
erro
rs a
ppea
r in
pare
nthe
ses.
Bec
ause
som
e re
sults
are
roun
ded
to th
e ne
ares
t who
le n
umbe
r, so
me
tota
ls m
ay a
ppea
r inc
onsi
sten
t. S
Mor
e th
an 1
0 pe
rcen
tage
poi
nts
abov
e IC
ILS
aver
age
USi
gnifi
cant
ly ab
ove
ICIL
S av
erag
eV
Sign
ifica
ntly
belo
w IC
ILS
aver
age
TM
ore
than
10
perc
enta
ge p
oint
s be
low
ICIL
S av
erag
e
Teac
her’s
repo
rted
stud
ent
use o
f ICT
to ac
cess
exte
rnal
re
sour
ces a
nd ex
perts
that
ar
e inc
lude
d in
scal
e sco
re
T_St
UExt
#
Teac
her’s
repo
rted
stud
ent u
se of ICT
in tr
adition
al le
arning
ta
sks t
hat a
re in
clude
d in
scal
e sco
re T_
StUT
rad#
Teac
her’s
repo
rted
stud
ent u
se of ICT
in in
nova
tive stud
ent-‐c
entered learning
task
s tha
t are in
clude
d in
scal
e sco
re T_
StUI
nno#
Wor
king
on
exte
nded
pr
ojec
ts (i
.e.
over
sev
eral
w
eeks
)
Wor
king
on
shor
t as
sign
men
ts
(i.e.
with
in
one
wee
k)
Expl
aini
ng
and
disc
ussi
ng
idea
s w
ith
othe
r st
uden
ts
Subm
ittin
g co
mpl
eted
w
ork
for
asse
ssm
ent
Wor
king
in
divi
dual
ly
on le
arni
ng
mat
eria
ls a
t th
eir o
wn
pace
Unde
rtaki
ng
open
-end
ed
inve
stig
atio
ns o
r fie
ld
wor
k
Refle
ctin
g on
thei
r le
arni
ng
expe
rienc
es
(e.g
. by
usin
g a
lear
ning
lo
g)
Plan
ning
a
sequ
ence
of
lear
ning
ac
tiviti
es fo
r th
emse
lves
Proc
essi
ng
and
anal
ysin
g da
ta
Sear
chin
g fo
r in
form
atio
n on
a to
pic
usin
g ou
tsid
e re
sour
ces
Eval
uatin
g in
form
atio
n re
sulti
ng
from
a
sear
ch
Com
mun
icat
ing
with
st
uden
ts in
ot
her
scho
ols
on
proj
ects
Seek
ing
info
rmat
ion
from
exp
erts
ou
tsid
e th
e sc
hool
Educ
atio
nal
Syst
em
Hong
Kon
g (S
AR)
ICIL
S 20
13 a
vera
geAu
stra
liaKo
rea,
Rep
. of
Tabl
e 4.1
6 Pe
rcen
tage
s of t
each
ers w
ho in
dica
te st
uden
ts o
ften
usin
g IC
T fo
r tea
chin
g ac
tiviti
es in
cla
ssro
oms

116
4.3.4 Teachers’ reported use of ICT for various types of teaching and learning activities (T_UseTrad, T_UseA&F, T_UseStdColl)
ICILS also studied teachers’ use of ICT in various types of teaching and learning activities. Teachers were asked to indicate their frequency of ICT use for the
following types of activities through a 3-point Likert scale (never, sometimes, and
often):
x Presenting information through direct class instruction;
x Providing remedial or enrichment support to individual students or small
groups of students;
x Enabling student-led whole-class discussions and presentations;
x Assessing students' learning through tests;
x Providing feedback to students;
x Reinforcing learning of skills through repetition of examples;
x Supporting collaboration among students;
x Mediating communication between students and experts or external
mentors;
x Enabling students to collaborate with other students (within or outside
school); and
x Collaborating with parents or guardians in supporting students’ learning
x Supporting inquiry learning.
Table 4.17 reports the percentages of teachers who indicated often use of ICT
in the surveyed activities. From the table, only one aspect of ICT use by Hong Kong
teachers in the classroom is higher than the ICILS international average, namely
presenting information through direct class instruction (38%). All other types of
ICT usage in teaching activities by Hong Kong teachers were lower than the ICILS
international averages by 1% to 8%. The greatest differences between the Hong
Kong and ICILS average (8%) were found in two kinds of teacher use of ICT to
support students’ collaborative inquiry activities: collaboration among students (8%) and supporting inquiry learning (6%), which are often considered as
important pedagogical activities to foster 21st century learning outcomes. Based on
teachers’ responses to this question, we have developed three scales related to teachers’ use of ICT in teaching: in traditional teaching (T_UseTrad), in assessment and giving feedback (T_UseA&F), and in supporting students’ collaborative inquiry (T_UseStdColl). The compositions for each of these three scales are
presented in Table 4.17.

117
38(1
.6)
9
(0.9
)
8(0
.8)
12
(1.1
)
15(1
.5)
16
(1.3
)
8(0
.9)
3
(0.5
)
5(0
.7)
3
(0.6
)
6(0
.7)
33(0
.5)
15(0
.3)
15(0
.4)
16(0
.4)
17(0
.4)
21(0
.5)
16(0
.4)
4(0
.2)
7(0
.3)
10(0
.3)
14(0
.4)
46(1
.6)S
19(0
.9)U
18(0
.9)U
10(0
.8)V
17(0
.8)
20(1
.1)
14(1
.0)V
3(0
.4)V
7(0
.6)
9(0
.7)
18(1
.0)U
42(1
.9)U
22(1
.0)U
10(1
.2)V
12(0
.7)V
15(1
.7)
20(2
.0)
8(1
.0)V
5(0
.9)
8(0
.8)
4(0
.8)V
10(1
.4)V
*P
erce
ntag
es re
flect
teac
hers
who
hav
e in
dica
ted
"Ofte
n".
#Th
ese
scal
e sc
ores
for H
K w
ere
cons
truct
ed b
ased
on
conf
irmat
ory
fact
or a
naly
ses
resu
lts o
n th
e H
K d
ata.
( )
Sta
ndar
d er
rors
app
ear i
n pa
rent
hese
s. B
ecau
se s
ome
resu
lts a
re ro
unde
d to
the
near
est w
hole
num
ber,
som
e to
tals
may
app
ear i
ncon
sist
ent.
SM
ore
than
10
perc
enta
ge p
oint
s ab
ove
ICIL
S a
vera
geU
Sig
nific
antly
abo
ve IC
ILS
ave
rage
VS
igni
fican
tly b
elow
ICIL
S a
vera
geT
Mor
e th
an 1
0 pe
rcen
tage
poi
nts
belo
w IC
ILS
ave
rage
Med
iatin
g co
mm
unic
atio
n be
twee
n st
uden
ts
and
expe
rts
or e
xter
nal
men
tors
Enab
ling
stud
ents
to
colla
bora
te
with
oth
er
stud
ents
(w
ithin
or
outs
ide
scho
ol)
Col
labo
rati
ng w
ith
pare
nts
or
guar
dian
s in
su
ppor
ting
stud
ents’
lear
ning
Supp
ortin
g in
quiry
le
arni
ng
Teac
her’s
repo
rted
use
of ICT for
asse
ssm
ent a
nd fe
edba
ck th
at a
re
incl
uded
in s
cale
sco
re T
_Use
A&
F#
Teac
her’s
repo
rted
use
of ICT to sup
port stude
nts'
colla
bora
tive
inqu
iry th
at a
re in
clud
ed in
sca
le s
core
T_
Use
StdC
oll#
Tea
cher’s re
ported
use
of ICT in
trad
ition
al te
achi
ng th
at a
re in
clud
ed
in s
cale
sco
re T
_Use
Trad
#
Pres
entin
g in
form
atio
n th
roug
h di
rect
cla
ss
inst
ruct
ion
Prov
idin
g re
med
ial o
r en
richm
ent
supp
ort t
o in
divi
dual
st
uden
ts o
r sm
all g
roup
s of
stu
dent
s
Enab
ling
stud
ent-l
ed
who
le-c
lass
di
scus
sion
s an
d pr
esen
tatio
ns
Ass
essi
ng
stud
ents
' le
arni
ng
thro
ugh
test
s
Prov
idin
g fe
edba
ck to
st
uden
ts
Rei
nfor
cing
le
arni
ng o
f sk
ills
thro
ugh
repe
titio
n of
ex
ampl
es
Supp
ortin
g co
llabo
ratio
n am
ong
stud
ents
Educ
atio
nal
Syst
em
Hon
g K
ong
(SAR
)IC
ILS
201
3 av
erag
eAu
stra
liaK
orea
, Rep
. of
Tabl
e 4.1
7 Pe
rcen
tage
s of t
each
ers o
ften
usin
g IC
T fo
r tea
chin
g pr
actic
es in
cla
ssro
oms
118
4.3.5 Teachers’ emphasis on developing students’ information literacy (T_EMPStIL)
In the ICILS teacher questionnaire, teachers’ emphasis (strong, some, little, no emphasis) on developing the following ICT-based capabilities among students was
investigated:
x Accessing information efficiently;
x Sharing digital information with others;
x Using computer software to construct digital work products (e.g.
presentations, documents, images and diagrams);
x Evaluating their approach to information searches;
x Providing digital feedback on the work of others (such as classmates);
x Exploring a range of digital resources when searching for information;
x Providing references for digital information sources;
x Understanding the consequences of making information publically
available online;
x Evaluating the relevance of digital information;
x Displaying information for a given audience/purpose;
x Evaluating the credibility of digital information; and
x Validating the accuracy of digital information.
Table 4.18 reports percentages of teachers who indicated placing strong or
some emphasis on developing the above listed ICT-based capabilities among
students. The results show that the percentages of Hong Kong teachers who
reported giving at least some emphasis to developing students’ ICT-based
capabilities were all lower than the ICILS international average in all of the 12
surveyed aspects, with the differences varying between 5% to 20%.
The largest differences are found in teacher’s emphasis on developing student’s ICT-based capabilities for (1) exploring a range of digital resources when searching for information (33% for Hong Kong compared to the international mean
of 53%); (2) evaluating the relevance of digital information (36% compared to 52%); and
(3) evaluating the credibility of digital information (also 36% compared to 52%). Only
two out of the list of ICT-based capabilities were reported as emphasized by more
than 50% of Hong Kong teachers, namely, accessing information efficiently (53%) and
using computer software to construct digital work products (51%).
In contrast, more than 50% of Australian teachers reported giving emphasis
to the development of 11 out of the 12 ICT-based capabilities surveyed (the only
exception was providing digital feedback on the work of others (such as classmates), at
28%). For Korean teachers, more than 50% of them reported giving emphasis to
helping their students to develop 9 out of the list of 12 surveyed ICT-based
capabilities).

119
53(1
.7)
38
(1.8
)
51(1
.6)
36
(1.5
)
27(1
.5)
33
(1.6
)
40(1
.4)
45
(2.0
)36
(1.6
)
42(1
.5)
36
(1.6
)
36(1
.5)
63
(0.5
)43
(0.5
)56
(0.5
)48
(0.5
)34
(0.5
)53
(0.5
)49
(0.5
)51
(0.5
)52
(0.5
)54
(0.5
)52
(0.5
)51
(0.5
)76
(1.0
)S
53(1
.3)U
72(1
.1)S
53(1
.1)U
28(1
.7)V
62(1
.1)U
58(1
.3)U
51(1
.6)
66(0
.9)S
70(1
.0)S
62(1
.0)U
58(0
.9)U
62(1
.4)
50(1
.4)U
54(1
.7)
48(2
.8)
40(1
.5)U
57(1
.2)U
56(1
.1)U
47(1
.1)V
55(1
.5)
50(1
.3)V
51(1
.8)
50(1
.6)
*P
erce
ntag
es re
flect
teac
hers
who
hav
e in
dica
ted
"Ofte
n".
#Th
ese
scal
e sc
ores
for H
K w
ere
cons
truct
ed b
ased
on
conf
irmat
ory
fact
or a
naly
ses
resu
lts o
n th
e H
K d
ata.
( )
Sta
ndar
d er
rors
app
ear i
n pa
rent
hese
s. B
ecau
se s
ome
resu
lts a
re ro
unde
d to
the
near
est w
hole
num
ber,
som
e to
tals
may
app
ear i
ncon
sist
ent.
SM
ore
than
10
perc
enta
ge p
oint
s ab
ove
ICIL
S a
vera
geU
Sig
nific
antly
abo
ve IC
ILS
ave
rage
VS
igni
fican
tly b
elow
ICIL
S a
vera
geT
Mor
e th
an 1
0 pe
rcen
tage
poi
nts
belo
w IC
ILS
ave
rage
Tea
cher’s re
ported
emph
asis on de
veloping
stud
ents' infor
mation literacy
that
are
inclu
ded
in sc
ale
scor
e T_
EMPS
tIL#
Unde
rsta
ndi
ng th
e co
nseq
uen
ces
of
mak
ing
info
rmat
ion
publ
ical
ly
avai
labl
e on
line
Valid
atin
g th
e ac
cura
cy o
f di
gita
l in
form
atio
n
Acce
ssin
g in
form
atio
n ef
ficie
ntly
Eval
uatin
g th
e re
leva
nce
of d
igita
l in
form
atio
n
Disp
layi
ng
info
rmat
ion
for a
gi
ven
audi
ence
/pu
rpos
e
Eval
uatin
g th
e cr
edib
ility
of
dig
ital
info
rmat
ion
Prov
idin
g di
gita
l fe
edba
ck o
n th
e w
ork
of
othe
rs (s
uch
as
clas
smat
es)
Expl
orin
g a
rang
e of
di
gita
l re
sour
ces
whe
n se
arch
ing
for
info
rmat
ion
Prov
idin
g re
fere
nces
fo
r dig
ital
info
rmat
ion
sour
ces
Eval
uatin
g th
eir
appr
oach
to
in
form
atio
n se
arch
es
Shar
ing
digi
tal
info
rmat
ion
with
oth
ers
Usin
g co
mpu
ter
softw
are
to
cons
truct
di
gita
l wor
k pr
oduc
ts
(e.g
. pr
esen
tatio
ns,
docu
men
ts,
imag
es a
nd
diag
ram
s)
Educ
atio
nal
Syst
em
Hon
g K
ong
(SAR
)IC
ILS
201
3 av
erag
eAu
stra
liaK
orea
, Rep
. of
Tabl
e 4.1
8 Percentages of teachers put strong or some em
phasis to develop students’ IC
T-b
ased

120
Based on the Hong Kong teachers’ responses to eight of the items in this question, we were able to construct one scale on teachers’ emphasis on developing students’ information literacy, T_EMPStIL, as indicated in Table 4.18.
4.4 School Level Factors and Hong Kong Student’s CIL Achievement
In the previous sections, we have reported on the school level conditions,
principals’ leadership practices and teachers’ ICT-using pedagogy in schools.
These factors are not independent of each other. In order to explore the plausible
influence of the totality of school effects on student’s CIL achievement, multilevel analysis using HLM has been conducted.
Usually, teacher factors are considered as nested within schools so that data
from the teacher questionnaire would be treated as level 2 factors (students (level
1) within the same class taught by the same teacher (level 2)), and data from the
principal questionnaire treated as level 3. However, as mentioned earlier, the
sampling of students in ICILS 2013 was conducted randomly among the entire
population of grade 8 students within the same school, there is no information
about the relationship between the sampled students and the sampled teachers.
Hence, in the multilevel analysis, the teachers’ responses from the same school are
averaged to form school level variables, even though the content is about teachers.
In summary, there are only two levels of variables in the multilevel modelling
reported in this section: student and school.
Table 4.19 lists the set of 25 variables derived from the principal and teacher
surveys that were used in the multilevel analysis: 14 principal’s e-Learning
leadership practice variables (P_EXPTPK, P_MONSULRN, P_MONSUADV,
P_RESICTM, P_RESICTU, P_ProvStACC, P_TPDpart), and 11 teachers’ ICT-using
pedagogy variables (T_EFGen, T_EFAdv, T_EFPeda, T_USEPedaT, T_StUInno,
T_StUTrad, T_StUExt, T_UseTrad, T_UseA&F, T_UseStdColl, T_EMPStIL). A list
of these variables, their meanings in brief and the relevant section where these are
presented are summarized in Tables 19a and 19b.
4.4.1 School level factors and overall CIL score
This section aims to investigate further how the various principal- and teacher-
related factors at the school level contribute to the CIL outcomes of Hong Kong
students. Specifically, the following two research questions are explored:
1. Do any of the scale variables constructed from the principal and teacher
surveys relate significantly to Hong Kong students’ CIL achievement scores?
2. What percentages of the total between-school and within-school variance
can these scale variables account for?

121
Table 4.19a List of key school-level variables* derived from the principal
Principal’ e-Learning Leadership Practice factors derived from the school questionnaire
Variable name Variable label (construct) Section in chapter 4
P_EXPTPK Extent to which the principal expects teachers to possess pedagogical knowledge and skills in e-Learning
4.2.2
P_MONSULRN Extent to which the school monitors teachers’ ICT use for students' learning
4.2.3
P_MONSUADV Extent to which the school monitors teachers’ ICT use for developing students' advanced ICT skills
P_RESICTM Extent to which the principal takes responsibility for ICT soft and hardware management 4.2.4
P_RESICTU Extent to which the principal takes responsibility for e-Learning curriculum issues
P_ProvStACC Extent to which the school makes provisions for student access to computers in and out of school 4.2.5
P_TPDpart Extent of teachers’ participation in professional development as reported by the principal. 4.2.6
P_PriAcComp Priority given to improve access to computers and internet in school
4.3.1 P_PriELRes Priorities given to increase the range of e-Learning resources in school
P_PriPedaUse Priorities given to improve supports for teachers on pedagogical use of ICT in school
NP_ObsInsufH&S
The extent to which insufficient ICT hard and software hinder the school’s capacity to realize its e-Learning goals
4.3.2
NP_ObsbyTs The extent to which obstacles faced by teachers hinder the school’s capa-city to realize its e-Learning goals
NP_ObsCurr The extent to which curriculum and assessment related obstacles hinder the school’s capacity to realize its e-Learning goals
NP_InsufRes The extent to which insufficient budget, space, or mismatch of goals hinder the school’s capacity to realize its e-Learning goals

122
Table 4. 19b List of key school-level variables* derived from the teacher questionnaire
Teacher’s ICT-using Pedagogy factors derived from the teacher questionnaire
Variable name Variable label (construct) Section in chapter 4
T_EFGen Teacher’s self-efficacy in general ICT tasks
4.4.1 T_EFAdv Teacher’s self-efficacy in advanced ICT skills
T_EFPeda Teacher’s self-efficacy in pedagogical use of ICT
T_USEPedaT Teacher’s reported use of pedagogical ICT tools 4.4.2
T_StUInno Teacher’s reported student use of ICT in innovative student-centered learning tasks
4.4.3 T_StUTrad Teacher’s reported student use of ICT in
traditional learning tasks
T_StUExt Teacher’s reported student use of ICT to access external resources and experts
T_UseTrad Teacher’s reported use of ICT in traditional teaching
4.4.4 T_UseA&F Teacher’s reported use of ICT for assessment
and feedback
T_UseStdColl Teacher’s reported use of ICT to support students' collaborative inquiry
T_EMPStIL Teacher’s reported emphasis on developing students' information literacy 4.4.5
Similar to the procedure described in section 3.5, the first step in multilevel
modelling is to conduct a variance component analysis to obtain information on
the Null model about the total variances at the student and school levels.
Conceptually, if all students were randomly assigned to all schools such that all
schools will have the same mean CIL, then all the variations in CIL score would be
within-school variations. At the other extreme, if all students were strictly ranked
according to their CIL scores and then assigned sequentially to schools strictly
according to this rank ordering, then each school would be as homogenous as
possible in students’ CIL achievement and all variations in students’ CIL score will be predicted by the between-school variations. In real life, the distribution of the
variance across within-school and between-school variances depends very much
on the homogeneity of schools within the specific system, and hence varies greatly
across countries.
Results returned by HLM under the null model show that the within-school
(level 1) variance is 4814.74, while the between school (level 2) variance is 5072.11.
This means that more than half of the total variance in students’ CIL achievement (51.3%) is between-school variations. In fact, Hong Kong has amongst the highest
percentage of between-school variance (Fraillon et al, 2014). This means that the
123
school a student attends is a strong predictor of the students’ CIL outcome, and that Hong Kong schools differ greatly from each other in this respect. It is well
known through other international comparative studies of student achievement
such as TIMSS, PIRLS and PISA that Hong Kong schools are highly non-
homogenous, due to highly differentiated student in-take. At the same time, school
level factors such as leadership and pedagogy would also contribute to variations
in students’ achievement. This is explored using Random Intercepts Fixed Slope
modelling using all the variables listed in Table 4.19 as level 2 predictor variables.
The HLM results for the analysis after reaching convergence is presented in Table
4.20.
The results in Table 4.20 show that only four variables remain as statistically
significant predictors of students’ CIL scores at the end of the modelling process,
two of which are scales derived from the principal questionnaire on obstacles
encountered in the implementation of e-learning and two scales related to ICT use
from the teacher questionnaire. Of these four scale factors, two have positive
coefficients: teachers’ reported student use of ICT in traditional learning tasks (T_StUTrad) with a coefficient of 21.35, and the extent to which curriculum and
assessment related obstacles hinder the school’s capacity to realize its e-learning
goals as reported by principals (NP_ObsCurr) with a coefficient of 18.83.
It is noteworthy that taking all the various factors into account, it is students’ actual use of ICT in learning that contributes most important to students’ CIL outcomes. One may find it surprising that the other two reported types of uses of
ICT by students did not have significant coefficients, especially since the other two
types of uses (for student-centred learning tasks and for reaching out to external
resources and experts) are likely to contribute even more to CIL outcomes. The
most likely reason is that these two types of ICT use by students are relatively
infrequent and so the variation across a low average is not large enough to produce
a statistically significant coefficient. In fact, Table 4.20 shows that student ICT use
in student-centered learning tasks also has a sizeable positive correlation of 16.94,
although it is not statistically significant (p=0.16).
It may look counter-intuitive that a reported obstacle, NP_ObsCurr, has a
positive coefficient, which means that the more strongly the principal reported
curriculum and assessment related obstacles, the higher the CIL score of the
students. We interpret this result to indicate that the principals who reported this
type of obstacles more strongly are those who have really given more thoughts to
the necessary changes in curriculum and assessment practices in order to realize
the school’s e-learning goals. Such awareness at the leadership level should also
bring different implementation practices that influence students’ CIL outcomes, though these other changes at the school may not be captured by the principal
questionnaire.

124
Table 4.20 Multilevel model res0.0ults for students’ CIL scores using school-level variables as level 2 predictors (z-scores)
There are two factors that have significant negative coefficients. One is the
extent to which insufficient ICT hardware and software hinders the school’s capacity to realize its e-Learning goals, NP_ObsInsufH&S, with a coefficient of -15.88.
Variables Brief description Coefficient (Error) P-ValueINTERCEPT 507.23 (6.33) 0.00
P_MONSULRN P: monitors ICT use for students' learning - - -
P_MONSUADV P: monitors ICT use for students' advanced ICT skills
8.31 (6.47) 0.20
P_RESICTM P: takes responsibility for ICT management - - -
P_RESICTU P: takes responsibility for e-Learning curriculum issues
-12.78 (6.62) 0.06
P_MONStACC P: makes provisions for student ICT access -9.97 (6.04) 0.10
P_TPDpart P: T participation in ICT-related professional development
10.40 (7.43) 0.17
P_PriAcComp P priority: improve ICT access in school - - -
P_PriELRes P priority: increase e-Learning resources - - -
P_PriPedaUse P priority: improve pedagogical support for T - - -NP_ObsInsufH&S P obstacle: insufficient ICT infrastructure -15.88 (6.46) 0.02
NP_ObsbyTs P obstacle: Teacher factors - - -
NP_ObsCurr P obstacle: curriculum & assessment related 18.83 (6.84) 0.01
NP_InsufRes P obstacle: Insufficient resources -12.52 (7.04) 0.08
T_EFGen T: general ICT self-efficacy - - -
T_EFAdv T: advanced ICT self-efficacy - - -
T_EFPeda T: pedagogical ICT self-efficacy 11.95 (6.47) 0.07
T_USEPedaT T: pedagogical use of ICT tools -21.91 (8.71) 0.01
T_StUInno T: student ICT use in student-centered learning tasks
16.94 (11.93) 0.16
T_StUTrad T: student ICT use in traditional learning tasks 21.35 (8.39) 0.01T_StUExt T: student ICT use to reach out - - -
T_UseTrad T: ICT use in traditional teaching - - -
T_UseA&F T: ICT use for assessment and feedback - - -
T_UseStdColl T: ICT use to support students' collaborative inquiry
-14.94 (9.15) 0.11
T_EMPStIL T: emphasis on developing students' IL -10.35 (10.28) 0.32
Between School Variance & Percentage 5072.11 51.3%
Within School Variance & Percentage 4814.74 48.7%
Between School 1924.06 37.93%
Within School 0.01 0.00%
* All independent variables were transformed into zscores# The dependent variables (i.e. 5 plausible values) were in their original score format (Mean=509, SD=7.4 for HK sample) ̂The dependent variable (i.e. CIL aspect scores) were presented in chapter 2.6.
"Variance explained" refers to the percentage of variance the set of variables in the model has accounted for level 2 total variance."-" indicates variables that were not input into the specific model due to negligibly small effects on students' CIL scores (the outcome variable).Bolded variables are significant with p-value <=0.05
Variance explained by
model and their
Model: School level factors and overall CIL score#
Null Model

125
This finding is reasonable. It is important to note that this scale factor is
different in nature from the actual level of ICT resources available in schools. A
principal in a relatively less well–resourced school in terms of ICT infrastructure
may not report this as an obstacle if the demand/desire to use the facilities for
teaching and learning is low. Conversely, the principal of a relatively well-
resourced school may still find hardware and software availability to be a serious
obstacle if most of the teachers are actively seeking to leverage the use of ICT for
student learning.
Another factor with a negative coefficient (-21.91) is the teachers’ reported use of pedagogical ICT tools, T_USEPedaT. This is an interesting contrast to the
factors on students’ ICT use for learning. Our interpretation of this finding is that the negative coefficient may not be related to ICT use per se, but that this scale
score is highly correlated with a teacher-centred, traditional pedagogy, which is
not conducive to students’ development of CIL.
Examining the variance explained by this model, we find that this model
explains 37.93% of the total between-school variance in CIL score, which is a
substantial proportion of the between-school variance. On the other hand, the
within-school variance explained is 0.00%, which is appropriate as all the factors
considered operate at the school level only.
4.4.2 School level factors and the seven CIL aspect scores
Similar to our exploration in section 3.5.2, we are interested in investigating the
plausible influence of school factors on Hong Kong students’ seven CIL aspect scores. Again, Random Intercepts Fixed Slope modelling (using HLM) was used
for each CIL aspect to discover:
1. Do any of the context variables collected through the student survey
significantly influence each of their seven CIL aspect scores?
2. What percentage of the total between-school and within-school variance
can these variables account for?
In order to be comparable to the model presented in the previous section, the
same set of principal e-Learning leadership factors (14 variables) and teacher ICT-
usage pedagogy factors (11 variables) were used in each of the models created to
analyse the plausible influence of school level factors on the seven aspects of CIL.
Once again, these models face exactly the same set of limitations that originated
from the design of the test booklets described in section 3.5.2. Hence, results
reported here should be interpreted with caution and are for exploratory purposes
only.
Among the 25 school level factors investigated, the four factors having
significant coefficients in the model for overall CIL achievement scores as reported
in the previous section (NP_ObsInsufH&S, T_USEPedaT, NP_ObsCurr, and

126
T_StUTrad) were found to be significant in more CIL aspect models than other
school level factors. First of all, the factor NP_ObsInsufH&S, indicating the lack of
hardware and software as an obstacle, is significant in all seven models with
negative coefficients ranging from -0.02 to -0.05. The second most important factor
is teachers’ reported use of pedagogical ICT tools (T_USEPedaT). All coefficients for this factor, similar to the model in 4.4.1, are negative and are statistically
significant in five CIL aspect models, with the exception of the models of creating information (p=.09) and using information securely and safely (p=.07).
Curriculum and assessment related obstacles (NP_ObsCurr), as reported by
principals, is another important factor having positive coefficients for four CIL
aspects, namely assessing and evaluating information, transforming information, creating information, and using information securely and safely.
In addition, the teacher factor that reported student use of ICT in traditional
learning tasks (T_StUTrad) has positive significant coefficients in models of three
CIL aspects, including assessing and evaluating information, creating information, and
sharing information.
Last but not least, similar to the multi-level analysis results for the overall CIL
score, school level factors can only explain a substantial percentage of the between-
school variance but not the within-school variance in student achievement for all
seven CIL aspects.
4.5 Summary
In this chapter, school level factors collected through principal and teacher
questionnaires have been reported. Overall, Hong Kong schools had better than
the ICILS international average level of ICT infrastructure and resources, but the
level of ICT use for teaching and learning were still low. In particular, the
opportunities for students to use ICT for learning were much lower than their
international counterparts, especially in ICT use for student-centered learning
tasks. Teachers generally had high confidence in their general use of ICT, but lower
in their own pedagogical ICT competence.
We have also investigated whether and how these factors associate with
student CIL scores. ICT infrastructure and resources in Hong Kong schools,
principal’s e-Learning leadership practices, as well as teachers’ ICT-using
pedagogy have been reported and explored in different sections of this chapter.
Models generated from multi-level analysis suggest that the effect of school level
factors on Hong Kong students’ CIL scores as the independent variables corroborate the importance of students’ use of ICT in traditional learning tasks (T_StUTrad, coefficient=21.35), and principals’ awareness of the curriculum and
assessment related issues (obstacles) involved in the realization of e-learning goals

127
CoefficientError
P-Value
CoefficientError
P-Value
CoefficientError
P-Value
CoefficientError
P-Value
CoefficientError
P-Value
CoefficientError
P-Value
CoefficientError
P-Value
0.70(0.01)
0.00
0.37(0.01)
0.00
0.42(0.02)
0.00
0.3
6(0
.01
)0
.00
0.5
3(0
.02
)0
.00
0.3
9(0
.01
)0
.00
0.5
7(0
.01
)0
.00
--
---
---
--
--
--
--
--
--
---
---
---
--
--
--
--
--
0.0
2(0
.01
)0
.02
--
---
---
--
--
--
--
--
--
--0.02(0.01)
0.05
-0.02(0.01)
0.10
-0.03(0.01)
0.03
-0.0
2(0
.01
)0
.13
-0.0
2(0
.02
)0
.18
-0.0
1(0
.01
)0
.25
-0.0
2(0
.01
)0
.10
-0.02(0.01)
0.01
-0.02(0.02)
0.10
-0.020.01
0.19
-0.0
3(0
.01
)0
.04
-0.0
3(0
.02
)0
.06
-0.0
3(0
.01
)0
.02
--
-0.01(0.01)
0.16
--
-0.020.02
0.33
0.0
2(0
.01
)0
.07
0.0
4(0
.02
)0
.05
0.0
2(0
.01
)0
.12
--
---
---
--0.020.02
0.16
--
--
--
-0.0
2(0
.01
)0
.08
--
---
---
---
--
--
--
--
--
--
-0.03(0.01)
0.01
0.02(0.02)
0.31
0.030.02
0.06
--
--
--
0.0
2(0
.01
)0
.08
0.0
1(0
.01
)0
.19
-0.02(0.01)
0.05
-0.05(0.01)
0.00
-0.04(0.01)
0.01
-0.0
4(0
.01
)0
.01
-0.0
4(0
.02
)0
.01
-0.0
4(0
.01
)0
.00
-0.0
3(0
.01
)0
.00
--
---
---
--
--
--
--
--
--
-0.02(0.01)
0.08
0.05(0.02)
0.00
0.030.02
0.09
0.0
4(0
.01
)0
.01
0.0
4(0
.02
)0
.02
0.0
2(0
.01
)0
.08
0.0
4(0
.01
)0
.00
-0.02(0.01)
0.02
-0.03(0.02)
0.10
-0.020.02
0.23
-0.0
2(0
.01
)0
.08
-0.0
4(0
.02
)0
.06
--
--0
.02
(0.0
1)
0.1
1--
-0.03(0.02)
0.07
--
--
--
0.0
2(0
.02
)0
.28
--
--
--
--
---
---
--
--
--
--
--
--
---
---
---
--
--
--
--
--
--
-0.01(0.01)
0.20
0.02(0.02)
0.30
0.030.01
0.05
0.0
2(0
.01
)0
.07
0.0
3(0
.02
)0
.10
0.0
3(0
.01
)0
.03
0.0
1(0
.01
)0
.22
-0.02(0.01)
0.02
-0.04(0.02)
0.04
-0.05(0.02)
0.01
-0.0
5(0
.01
)0
.00
-0.0
4(0
.02
)0
.09
-0.0
4(0
.01
)0
.00
-0.0
2(0
.01
)0
.07
--
-0.07(0.04)
0.07
0.05(0.02)
0.02
0.0
3(0
.02
)0
.15
0.0
5(0
.03
)0
.15
--
-0
.03
(0.0
2)
0.1
50.02(0.01)
0.10
0.05(0.02)
0.03
--
-0
.03
(0.0
2)
0.0
50
.08
(0.0
2)
0.0
00
.03
(0.0
2)
0.0
30
.02
(0.0
1)
0.1
4--
--0.02(0.02)
0.16
--
--
--
-0.0
3(0
.02
)0
.13
--
--
--
--
---
---
--
--
--
--
--
-0.0
2(0
.01
)0
.11
0.03(0.02)
0.09
--
-0.030.02
0.15
0.0
2(0
.02
)0
.18
--
-0
.03
(0.0
2)
0.1
5-
--
-0.02(0.01)
0.07
-0.05(0.02)
0.07
-0.05(0.02)
0.03
-0.0
4(0
.02
)0
.02
-0.0
5(0
.02
)0
.05
-0.0
3(0
.02
)0
.13
--
--0.02(0.01)
0.15
-0.03(0.02)
0.15
--
--
--
-0.0
4(0
.03
)0
.13
--
--0
.02
(0.0
1)
0.1
2
Betw
een
Sch
oo
l V
ari
an
ce
& P
erc
en
tag
e0.0
067
11.7
%0.0
277
29.6
%0.0
147
7.9
%0.0
182
29.1
%0.0
345
39.9
%0.0
104
7.2
%0.0
094
15.5
%
Wit
hin
Sch
oo
l V
ari
an
ce
& P
erc
en
tag
e0.0
505
88.3
%0.0
659
70.4
%0.1
711
92.1
%0.0
444
70.9
%0.0
519
60.1
%0.1
340
92.8
%0.0
515
84.5
%
Betw
een
Sch
oo
l0.0
030
45.0
1%
0.0
116
41.8
3%
0.0
061
41.5
5%
0.0
075
41.3
1%
0.0
131
38.0
3%
0.0
057
54.1
2%
0.0
036
37.8
2%
Wit
hin
Sch
oo
l0.0
000
0.0
0%
0.0
000
0.0
0%
0.0
000
0.0
0%
0.0
000
0.0
0%
0.0
000
0.0
0%
0.0
000
0.0
0%
0.0
000
0.0
0%
* A
ll in
dep
en
den
t va
riab
les w
ere
tra
nsfo
rmed
in
to z
score
s# T
he d
ep
en
den
t va
riab
les (
i.e.
5 p
lau
sib
le v
alu
es)
were
in
th
eir o
rig
inal score
form
at
(Mean
=509,
SD
=7.4
for
HK
sam
ple
)^ T
he d
ep
en
den
t va
riab
le (
i.e.
CIL
asp
ect
score
s)
were
pre
sen
ted
in
ch
ap
ter
2.6
. "V
arian
ce e
xpla
ined
" re
fers
to t
he p
erc
en
tag
e o
f va
rian
ce t
he s
et
of
variab
les in
th
e m
od
el h
as a
ccou
nte
d f
or
leve
l 2 t
ota
l va
rian
ce.
"-"
ind
icate
s v
ariab
les t
hat
were
not
in t
he m
od
el d
ue t
o n
eg
ligib
ly s
mall e
ffects
on
stu
den
ts' C
IL s
core
s (
the o
utc
om
e v
ariab
le).
Variab
les h
igh
ligh
ted
hh
ave
p-v
alu
e <
=0.0
5
Mo
del:
Sch
oo
l le
vel fa
cto
rs &
th
e 7
CIL
asp
ect
sco
res^
Mo
del:
Sch
oo
l le
vel fa
cto
rs a
nd
th
e 7
CIL
asp
ect
sco
res^
Asp
ect
2.1
Tra
nsfo
rmin
g
Info
rmati
on
Asp
ect
2.2
C
reati
ng
in
form
ati
on
Asp
ect
2.3
S
hari
ng
In
form
ati
on
Asp
ect
2.4
U
sin
g in
form
ati
on
secu
rely
& s
afe
ly
Asp
ect
1.1
K
no
win
g a
bo
ut
an
d
un
ders
tan
din
g c
om
pu
ter
use
Asp
ect
1.2
A
ssessin
g &
Ev
alu
ati
ng
In
form
ati
on
Asp
ect
1.3
M
an
ag
ing
In
form
ati
on
Vari
an
ce
exp
lain
ed
b
y
mo
del
an
d t
heir
p
erc
en
tag
es
INTRCPT
P_MONSU
LRN
P_MONSU
ADV
P_RESICTM
P_RESICTU
P_MONStACC
P_TPDpart
P_PriAcComp
P_PriELRes
P_PriPedaUse
NP_ObsInsufH&S
NP_ObsbyTs
NP_ObsCurr
NP_InsufRes
P_EXPTPK
T_EMPStIL
Nu
ll M
od
el
T_StUTrad
T_StUExt
T_UseTrad
T_UseA&F
T_UseStdColl
T_EFG
en
T_EFA
dv
T_EFPeda
T_USEPedaT
T_StUInno
Tabl
e 4.2
1 M
ultil
evel
mod
el re
sults
for e
ach
of th
e sev
en st
anda
rdiz
ed C
IL a
spec
t sco
res u
sing
scho
ol le
vel
vari
able
s as l
evel
2 p
redi
ctor
s

128
(NP_ObsCurr, coefficient=18.83) are the two statistically significant positive contributors to students’ CIL outcomes. The fact that both of the significant positive school level factors are not directly related to ICT resources nor ICT-using pedagogy in schools flags that Hong Kong schools should also take initiatives to integrate ICT into parts of the school curriculum previously not explored with ICT-using pedagogy.
The analysis also found two factors with significant negative coefficients. Teachers’ reported use of pedagogical ICT tools (T_USEPedaT, coefficient=-21.91), which can also be referred to as e-teaching, had a negative contribution to students’ CIL. Another negative factor was the extent to which insufficient ICT hardware and software hinders the school’s capacity to realize its e-Learning goals (NP_ObsInsufH&S, coefficient=-15.88).
Further multilevel analysis of the influence of principal and teacher factors on each of the seven CIL aspect scores show findings that are similar to those suggested by the multilevel model on overall CIL scores. These findings have important implications for policy and practice related to e-learning if the development of CIL is an important goal.

129
Chapter 5
Learning & Assessment Designs to foster students’ CIL
The findings from ICILS 2013 reported in the earlier chapters show that the most
important influences on Hong Kong students’ CIL outcomes are those at the school level. Among these influences, the single most important factor is the opportunities
to use ICT in learning that teachers provide to students. Furthermore, the findings
show that having access to computers and the Internet, as well as using them for
personal and social communication purposes per se do not affect students’ CIL outcomes.
Another important finding from ICILS 2013 is that neither the teachers’ reported use of ICT for teaching, nor the extent of their self-reported emphasis on
developing students’ information literacy has any significant relationship with
their students’ CIL scores. In the evaluation study of the e-Learning Pilot Study
that CITE conducted for the Education Bureau (CITE, 2014), five out of the 61 pilot
schools were also among the sampled ICILS schools. Analysis shows that the
distribution of scores for these five schools is not outstanding compared to the
overall performance of the Hong Kong schools. Qualitative findings from that
study also show that even teachers in the IT pilot schools generally do not
understand the exact meaning of CIL, and have very little knowledge of how to
design learning tasks that would foster students’ CIL and of how to assess CIL outcomes.
In this chapter, we draw on a number of design-based research and
development projects that CITE has undertaken with Hong Kong schools to foster
students’ information literacy, inquiry and self-directed learning skills in order to
identify design principles and sample designs for learning and assessment of CIL.
This chapter firstly introduces several design principles. It then shows sample
learning designs of varying complexity in different subject areas.
5.1 Principles of Learning Design for CIL Development
With the support of appropriate digital technology, learning can take place
anywhere and anytime. This has made learning a continuous process and lifelong
learning skills a key competence for the 21st century. CIL is the basic competency
underpinning ‘learning how to learn’ (ALA, 1989; Bundy, 2004). Studies of ICT-
enabled innovative pedagogical practices show that the extent to which students
130
are able to demonstrate 21st century skills in the process of learning depends on whether certain critical characteristics are found in the learning activities they engage in (Law, Lee and Chow, 2002; SRI, 2011). Students are much more likely to develop CIL if they engage in solving real-world problems in collaboration with their peers. The following are the key design principles that these studies identified for fostering students’ CIL:
x Priority for ICT use is given to students’ learning, not teaching; x Learning activities are learner-centric and inquiry- oriented; x Learning tasks are extended in time, comprising multiple stages and/or
parts, with interim products generated in the process; x Learning activities are authentic and related to students' daily life
experiences; x Learning tasks are open-ended, providing opportunities for students to
make judgements; and x Provide learners with the opportunity to use ICT to access different
sources of information, organize, compare and contrast, analyse and integrate information.
5.2 Principles of Assessment Design
Traditionally, assessment is perceived and designed as a step that takes place at the end of the learning process for summative purposes. This concept of assessment is inadequate to evaluate learning outcomes, which are not static knowledge and skills, but capacities, such as CIL, that enable students to dynamically handle new situations and problems.
Contemporary curriculum theories advocate the concept of “assessment as learning” (Dann, 2002), which considers assessment as an integral part of learning and teaching, with students actively involved in this process. Assessment as learning occurs when students reflect on and monitor their own progress to inform their formulation of future learning goals and take responsibility for their own past and future learning.
Traditional paper and pencil tests are not suitable for assessment as learning. Performance assessment that requires students to demonstrate their knowledge and skills through task completion as in ICILS is considered to be appropriate for evaluating students’ CIL (Knight, 2006; Helvoort, 2010). Assessment rubrics and self-evaluation checklists are two of the most commonly used instruments in performance assessment. Rubrics are essential instruments for implementing Assessment as Learning. These are descriptive scoring tools for rating authentic student work qualitatively.

131
Rubrics use specific criteria as a basis for evaluating or assessing student
performance, and provide narrative descriptions that are separated into levels of
possible performance related to a given task (Aster & McTighe, 2001; Moskal, 2000).
Many benefits associated with the use of rubric-based assessment have been
reported (Goodrich, 1997; Heman, Aschbacher & Winters, 1992; Moskal, 2000):
x It serves as a powerful communication tool among teachers, students and
parents, helping them to reach a common understanding on the criteria
and expected level of performance;
x It helps students to develop a clear understanding of what constitutes
excellence and how to evaluate their own work;
x The explicit assessment criteria helps students to develop plans for
improving their own performance; and
x It helps teachers or other raters to be accurate, unbiased and consistent in
scoring.
Table 5.1 below shows an example assessment rubric for evaluating a poster
creation task, which clearly describes the criteria for different levels of performance.
Table 5.1 Assessment rubrics for evaluating “creating information” Level Task Novice Basic Proficient Advanced
Creating a poster
Graphics/ image is not used or is not related to the
topic
Some graphics/ images are used, but the resolution and/or size is/are not appropriate
Some relevant graphics/ images are used, most
with appropriate size and
resolution
All the graphics/ images are
relevant to the topic and with
appropriate size and resolution
Apart from rubrics, self-evaluation checklists are often used in the context of
self- and peer- evaluation. A checklist provides a list of measurable categories and
indicators for project, product and performance, allowing students to judge their
own or peer’s performance and determine whether they have met the established criteria of a task.
The use of checklists has been found to foster metacognitive skills, enhance
the development of appropriate learning strategies and the ability to learn how to
learn (Bransford, Brown and Cocking, 1999; Stenmark, 1993; Stergar, 2005).
Checklists are more concrete, easier to understand and operationalize, and are
especially useful for younger learners. Table 5.2 is an example of a checklist for
evaluating a poster from the creating information perspective, based on the rubric
in Table 5.1.

132
Table 5.2 An assessment checklist for “creating information” in a poster creation task Self-evaluation checklist-creating poster Please ✓ where appropriate
☐ The poster contains a title that clearly reflects the topic or theme
☐ The poster contain relevant and accurate information
☐ Graphic elements, such as pictures, photographs, charts, tables, scientific drawing, etc. add to the overall effectiveness of the poster
☐ There is a coherent , flowing organization to the poster with the various elements (graphic, text..) working well together
☐ The poster is skillfully designed and crafted using appropriate graphic design tools
☐ The content is not directly copied from books/ internet
☐ The fonts are easy to read and the font size varies appropriately for headings and text
☐ Graphics are of proper size and resolution and are strategically placed to enhance comprehension
5.3 Learning Designs Targeting Specific CIL Aspects
The assessment framework used in ICILS comprises two strands: collecting and managing information, and producing and exchanging information, which can be further broken down into a total of seven CIL aspects, as shown in Table 1.2. Results from ICILS 2013 show that Hong Kong students’ performance is especially weak in three aspects: accessing and evaluating information, managing information, and sharing information. Relatively short and focused learning and assessment activities, usually in the form of an exercise, can be designed to help novice students develop competence in a specific CIL aspect.
More complex tasks set within authentic contexts, such as an extended project requiring competence in several CIL aspects operating in concert, are more effective in fostering higher levels of competence. In this section, we will present sample designs for learning and assessment that target the three weakest aspects in Hong Kong students’ ICILS performance.
5.3.1 Learning designs to foster skills for accessing and evaluating information
Accessing information With so much information that can be easily accessible through the Internet with little or no effort, it is a common observation that students are prone to direct copying of information without real understanding.
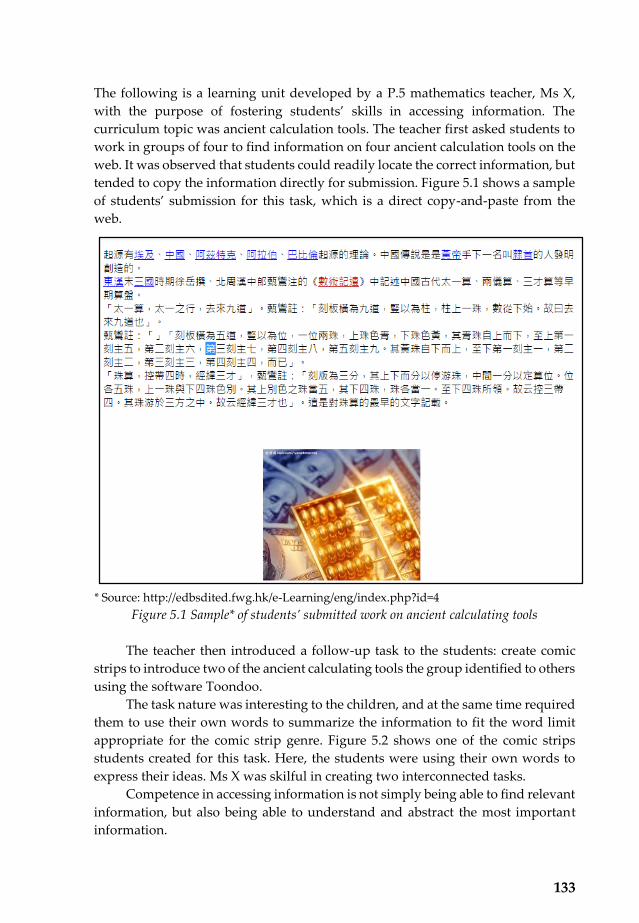
133
The following is a learning unit developed by a P.5 mathematics teacher, Ms X, with the purpose of fostering students’ skills in accessing information. The curriculum topic was ancient calculation tools. The teacher first asked students to work in groups of four to find information on four ancient calculation tools on the web. It was observed that students could readily locate the correct information, but tended to copy the information directly for submission. Figure 5.1 shows a sample of students’ submission for this task, which is a direct copy-and-paste from the web.
* Source: http://edbsdited.fwg.hk/e-Learning/eng/index.php?id=4 Figure 5.1 Sample* of students’ submitted work on ancient calculating tools
The teacher then introduced a follow-up task to the students: create comic
strips to introduce two of the ancient calculating tools the group identified to others using the software Toondoo.
The task nature was interesting to the children, and at the same time required them to use their own words to summarize the information to fit the word limit appropriate for the comic strip genre. Figure 5.2 shows one of the comic strips students created for this task. Here, the students were using their own words to express their ideas. Ms X was skilful in creating two interconnected tasks.
Competence in accessing information is not simply being able to find relevant information, but also being able to understand and abstract the most important information.
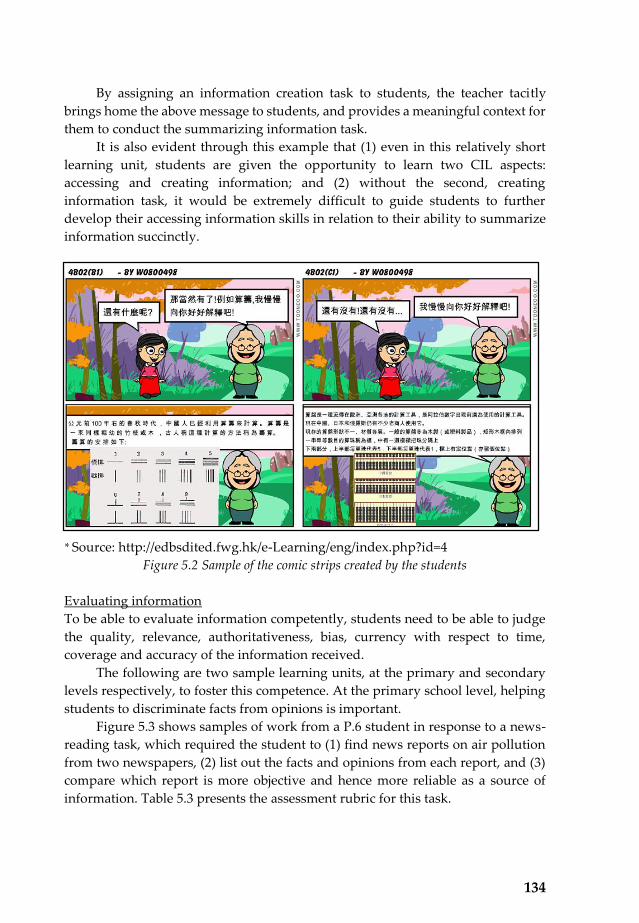
134
By assigning an information creation task to students, the teacher tacitly
brings home the above message to students, and provides a meaningful context for
them to conduct the summarizing information task.
It is also evident through this example that (1) even in this relatively short
learning unit, students are given the opportunity to learn two CIL aspects:
accessing and creating information; and (2) without the second, creating
information task, it would be extremely difficult to guide students to further
develop their accessing information skills in relation to their ability to summarize
information succinctly.
* Source: http://edbsdited.fwg.hk/e-Learning/eng/index.php?id=4
Figure 5.2 Sample of the comic strips created by the students
Evaluating information
To be able to evaluate information competently, students need to be able to judge
the quality, relevance, authoritativeness, bias, currency with respect to time,
coverage and accuracy of the information received.
The following are two sample learning units, at the primary and secondary
levels respectively, to foster this competence. At the primary school level, helping
students to discriminate facts from opinions is important.
Figure 5.3 shows samples of work from a P.6 student in response to a news-
reading task, which required the student to (1) find news reports on air pollution
from two newspapers, (2) list out the facts and opinions from each report, and (3)
compare which report is more objective and hence more reliable as a source of
information. Table 5.3 presents the assessment rubric for this task.
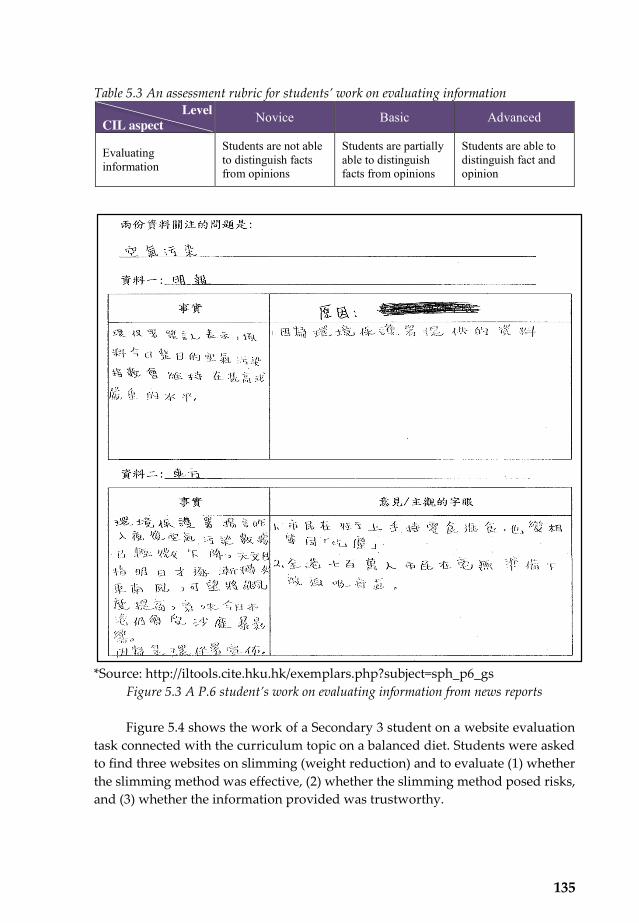
135
Table 5.3 An assessment rubric for students’ work on evaluating information Level
CIL aspect Novice Basic Advanced
Evaluating information
Students are not able to distinguish facts from opinions
Students are partially able to distinguish facts from opinions
Students are able to distinguish fact and opinion
*Source: http://iltools.cite.hku.hk/exemplars.php?subject=sph_p6_gs Figure 5.3 A P.6 student’s work on evaluating information from news reports Figure 5.4 shows the work of a Secondary 3 student on a website evaluation
task connected with the curriculum topic on a balanced diet. Students were asked to find three websites on slimming (weight reduction) and to evaluate (1) whether the slimming method was effective, (2) whether the slimming method posed risks, and (3) whether the information provided was trustworthy.
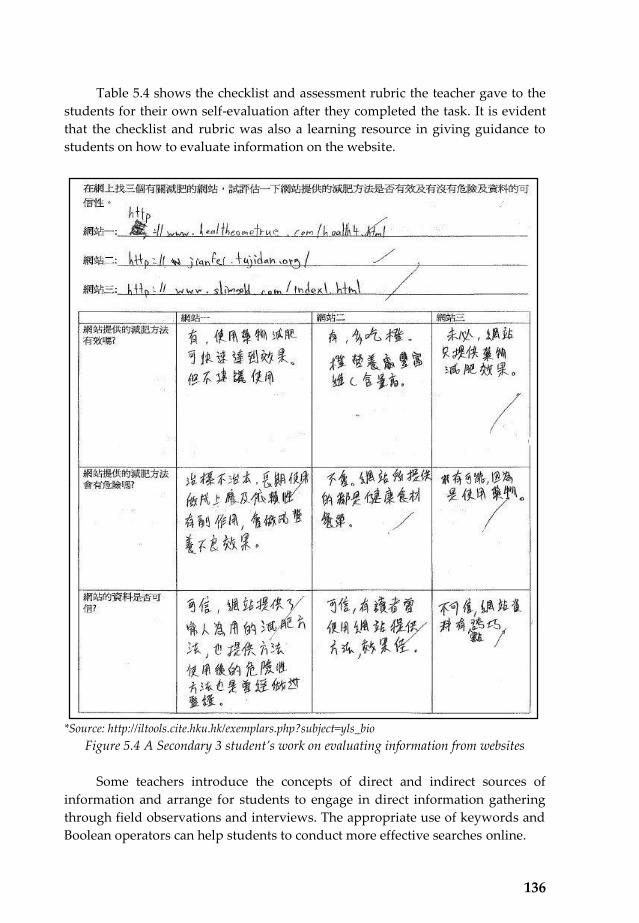
136
Table 5.4 shows the checklist and assessment rubric the teacher gave to the students for their own self-evaluation after they completed the task. It is evident that the checklist and rubric was also a learning resource in giving guidance to students on how to evaluate information on the website.
*Source: http://iltools.cite.hku.hk/exemplars.php?subject=yls_bio Figure 5.4 A Secondary 3 student’s work on evaluating information from websites
Some teachers introduce the concepts of direct and indirect sources of
information and arrange for students to engage in direct information gathering through field observations and interviews. The appropriate use of keywords and Boolean operators can help students to conduct more effective searches online.

137
Other useful learning activities include getting students to ask themselves the six “W” questions (what, when, where, who, why and how), engage in outlining and brainstorming. Mind-mapping can be used in conjunction with the above activities or as a standalone activity to foster students’ ability to access and evaluate information. Online mind-mapping tools allow students to collaborate and share their mind maps.
Evaluation of information is relatively unfamiliar and challenging for Hong Kong students. For novice students such as primary school children, the provision of an itemized list of what needs to be done, similar to that used in Table 5.4, would be helpful. For example, in an activity to find information about a country park, primary two students were able to access the targeted information without much difficulty by using a list of items (name of the country park, the route and common plants and animals found in that park) provided by their teacher.
Table 5.4 A self-evaluation checklist and associated assessment rubric for the website evaluation task
Self-evaluation checklist-creating poster Please ✓ where appropriate
☐ I have checked the accuracy of the content, e.g. there is no wrong spelling.
☐ I have considered the relevance of this website, e.g. whether the information meets my expectation.
☐ I have considered when the information on this website was created/last updated, and whether it is up-to-date.
☐ I have considered the objectiveness of this website, e.g. whether the information provided is biased towards particular positions.
☐ I have considered the authoritativeness of this website, e.g. whether the author is an authority on this subject matter.
☐ I have considered whether complete information has been provided on the website, e.g. on authorship and publishing organization.
☐ I have considered the comprehensiveness of the information provided, e.g. supporting evidence and links to other related information.
Assessment rubric for website evaluation
Novice ☐ Basic ☐ Proficient ☐ Advanced ☐ Fails to evaluate the information on the website
Can use one criterion to evaluate the website information
Can use two criteria to evaluate the website information
Can apply more than two criteria for website evaluation

138
5.3.2 Learning designs to foster skills for managing information
Managing information refers to students’ ability to adopt and adapt schemes of information classification and organization to arrange and store information for efficient use and/or re-use. Figure 5.5 shows a sample of P.2 students’ work in an English class. The focal learning task was to interview some classmates about their favorite festivals.
After the interview, they had to record, analyse and organize the interview data online, give an oral presentation on their classmates' favorite festivals, and finally write an online report. In this example, the teacher skilfully designed and used Google-forms to help her students to analyse, organize and make use of their collected data.
Figure 5.5 Sample of P. 2 students’ work on managing information Figure 5.6 presents samples of students’ work requiring the skills of
managing information collected from an experiment. In this task, P.5 students designed and conducted an experiment to compare the water absorption capacity of several brands of tissue paper. They then had to design an appropriate template and use that to record their data. As can be seen from Figure 5.6, all three groups were able to design a table for capturing the experimental data. However, there are also some observable differences.

139
Figure 5.6 Samples of P. 5 students’ template for recording experimental data

140
Group 1 had a novice approach to measurement and considered the time necessary for absorbing a given amount of water as the only criterion for ranking the performance of the three brands of tissue paper. Group 2 identified the need to compare the designed absorption capacity as indicated on the package against the measured absorption capacity for each brand. Group 3’s design was a variation of group 1’s. They considered when a piece of tissue paper could not absorb the designated amount of water, and used the number of tissue papers needed to completely absorb the “spilt water” as the needed measurement.
It is clear from this example that when the teacher opened up the decision on what to measure to the students, new opportunities became available to the students to learn from reviewing the answers of others.
In this example, the teacher further extended the learning opportunities by inviting students to revise and re-submit their work after getting peers’ and/or teacher’s feedback. Figure 5.7 shows the work resubmitted by Group 3 after receiving feedback.
Figure 5.7 Data collection template resubmitted by Group 3

141
5.3.3 Learning designs to foster skills for transforming information
As reported in Chapter Two, transforming information is found to be one of the most challenging CIL aspects for Hong Kong students. Activities that require students to synthesize, summarize, compare and contrast information from multiple sources have been found to be conducive to fostering skills in information transformation.
The following is one such curriculum example observed in a P.5 General Studies classroom. The topic for the learning unit was Our Community, and was organized in the form of a group project. The task was to plan a one-day field trip for a group of Primary 5 exchange students from Mainland China to visit their local region. The students were taught how to use Google Maps to draw the route and mark interesting sights for the trip, which may include historical attractions, landmarks, natural ecological attractions, local foods and food outlets, restaurants, religious buildings such as temples, and locations for the region’s unique cultural events or practices.
After completing the design for the field trip, students had to create a poster to publicize it and to invite registration. Figure 5.8 is the poster and field trip route map produced by one of the student groups, and Table 5.5 presents the rubric used for their assessment.
Table 5.5 Assessment criteria for the poster and route map
Checklist for assessing the poster
� Provides appropriate sightseeing locations � Includes time allocation in trip planning � At least 10 % of the text are written in students’ own words � Cites sources of information where relevant
Assessment criteria for the route map (Synthesizing information)
Novice ☐ Basic ☐ Proficient ☐ Advanced ☐
Not able to use Google Maps to locate the route
Able to use Google Maps to locate the route
Able to use Google Maps to locate the route and include some of the landscape photos
Able to use Google Maps to locate the route and include all of the landscape photos

142
The poster in Figure 5.8 demonstrates that the students were able to:
x Choose images relevant for the poster;
x Include relevant information in the poster;
x Maximize the use of the full page to create the poster; and
x Find information from various sources and use their own words to
summarize the information.
The route map in Figure 5.8 demonstrates the students’ ability to:
x Integrate information to plan a route for the trip;
x Using Google map to create visually a route on a map; and
x Overlay the map on a landscape photo.
5.3.4 Designs to foster skills for sharing information
Communications technologies such as emails and discussion forums, and social
networking tools such as Facebook, Twitter and WhatsApp have been adopted
pervasively to mediate all kinds of formal and informal communication for
different purposes, including work, socializing and learning. Sharing information
is a major function of these communication activities.
In this section, we will introduce some examples of how collaborative tools
have been used in Hong Kong classrooms to support students’ information sharing
for collaborative learning purposes. Figure 5.9 shows an image of the Google
calendar used by a group of students from several schools in planning their work
schedule to prepare for a creative drama competition.
Learning Management Systems (LMS) usually also provide support for
sharing and collaboration among learners. Figure 5.10 also indicates that the use of
LMS facilitated students’ information sharing. In this example all the students’ assignments in Chinese composition were uploaded to the platform for further
sharing among students. Students can read others’ work, make comments as well as select good ones to save in their personal collection for further review.

143
Figu
re 5
.8 A
sam
ple p
oste
r and
fiel
d tr
ip ro
ute o
n G
oogl
e map
pro
duce
d by
a g
roup
of P
.5 st
uden
ts

144
Figure 5.9 Google calendar used by some students to plan their work schedule
Figure 5.10 An example of a Learning Management System customized to support shared reading and peer commenting of essays

145
Discussion forums are also frequently used to facilitate sharing of information and peer review. Figure 5.11 shows a screen-capture of one such discussion forum in which a group of students commented on the lyrics of a song written by one of their classmates. Table 5.6 shows one rubric that can be used for the assessment of a peer review type of forum postings.
Figure 5.11 A discussion forum where students commented on the lyrics written by their classmates Table 5.6 An assessment rubric for peer review type of forum postings
Novice Basic Proficient Advanced
Not able to post ideas on the forum.
Able to post some ideas on the forum.
Able to post ideas and give meaningful feedback to 1-2 peers.
Able to post ideas and give meaningful feedback to >2 peers.
146
5.4 An Extended Learning Design to Foster Learning in Multiple CIL Aspects
The size of a learning unit often limits the complexity of the learning tasks that can be presented to students. Longer learning units that span days or weeks involving tasks that need to be conducted both in school and at home often provide more opportunities for students to develop higher level CIL outcomes. These often require students to exercise skills in multiple CIL aspects in a meaningful and holistic fashion. In this section, we describe one such learning design that was collaboratively planned and jointly developed by Chinese Language teachers in two primary schools in one of the e-Learning Pilot Scheme projects (2011-14) in Hong Kong.
The duration of this learning unit was one month and the goal was for the students to write an essay or a prose on one shop of their choice in the Western District, which sells traditional products that have become relatively less popular in Hong Kong, such as paper craft shops (紙扎舖 ). The teachers wanted the students to have some experiential understanding, and preferably also some affective connections with the topic that they were to write on. To achieve this, the teachers designed a variety of activities culminating in a field trip to a shop of the students’ choosing to collect first hand information about the topic they were to write about.
The entire learning unit comprised five stages. In Stage One, the teacher introduced the Chinese prose genre 抒情文 giving several sample articles related to Hong Kong cultural artefacts and practices. A discussion forum was also created on the school LMS for students to post and share related articles and pictures. Students then had to decide individually which kind of traditional shop they would like to write about, and search for information about that kind of shop. Sample postings made by students on the discussion forum in this Stage shown in Figure 5.12 demonstrate their ability to use keywords to access information, as well as using the forum to manage and share information.
In Stage Two, students with similar interests were grouped to work together and decide on which shops to visit, plan the route for the visit and construct questions for the interview they were to conduct during the field trip. Students were asked to post and share their field trip plan on the forum. Teachers and students then read and gave suggestions and comments on plans posted by students from both schools. Figure 5.13 shows the target shop, route plan and interview questions prepared by one group of students in Stage 2. It shows that the students were able to use search engines to access information and decide on the specific shop to visit, manage route information using Google Maps, and transform information in designing the interview questions using their own words. Each group further planned detailed work allocation to ensure that the plan could be carried out smoothly during the field trip.

147
Figu
re 5
.12
Post
ings
of i
nfor
mat
ion
on th
e dis
cuss
ion
foru
m in
Stage 1, d
emon
strating students’ ability to use keywords to
acce
ss in
form
atio
n, u
se th
e for
um to
man
age a
nd sh
are i
nfor
mat
ion
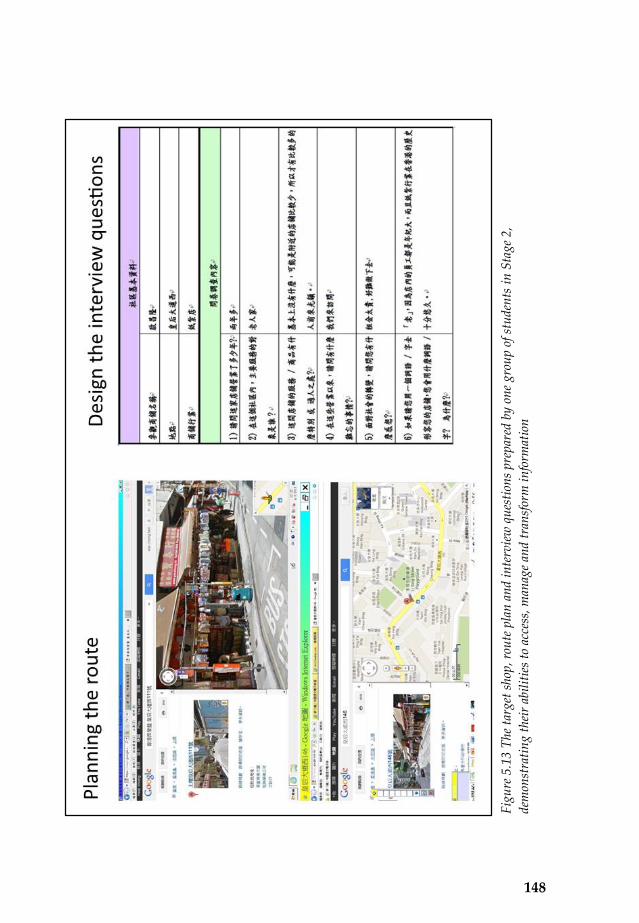
148
Figu
re 5
.13
The t
arge
t sho
p, ro
ute p
lan
and
inte
rvie
w q
uest
ions
pre
pare
d by
one
gro
up o
f stu
dent
s in
Sta
ge 2
, de
mon
stra
ting
thei
r abi
litie
s to
acce
ss, m
anag
e and
tran
sfor
m in
form
atio
n

149
Stage Three was the field trip. Students in the two schools met and travelled together to the Western District to visit the shop according to their plan and to interview the owner of the shop. Parents participated in the field trip as volunteers to assist the teachers in looking after the students.
During the field trip, students used various technologies such as digital cameras and oral dictation Apps on their mobile phones to record data. They then used GoogleDoc to enter and organize their collected data.
Figure 5.14 shows a photo of students conducting an interview with the shop-owner, the postings of information collected and their reflections on the field trip experience. The students’ work during this stage shows their ability to manage and share information as well as evaluate information.
In Stage Four, back in the classroom, students were asked to work with their group mates to construct an outline of their essay about the shop using a mind-map. After this, each student then write their own essay on the shop and post that to the LMS. Both tasks requires students to transform the information gathered and to create their own group and individual artefacts. Figures 5.15 and 5.16 show samples of the artefacts created by students during this stage
Finally, in Stage Five, students in the two schools were given opportunities to undertake self- and peer- evaluation of the essays uploaded to the LMS. They could read as many of their peers’ uploaded essays as they wished. In reading peers’ essays, students could post comments, click “like” to indicate approval, and also choose to “collect” particularly good ones to put into one’s own private collection for future review. On the LMS, both teachers and students could see, for each posted essay, the number of times the essay has been viewed, liked, and collected by other students.
Figure 5.17 shows the rubrics for self- and peer- assessment of the essays, and the peer feedback given by students to their peers online. These artefacts demonstrate students’ ability to evaluate and share information.

150
Figu
re 5
.14
In S
tage
3, s
tude
nts c
ondu
cted
the i
nter
view
dur
ing
the f
ield
trip
, the
n po
sted
the c
olle
cted
info
rmat
ion
and
thei
r ow
n re
flect
ions
onl
ine a
fter t
he v
isit
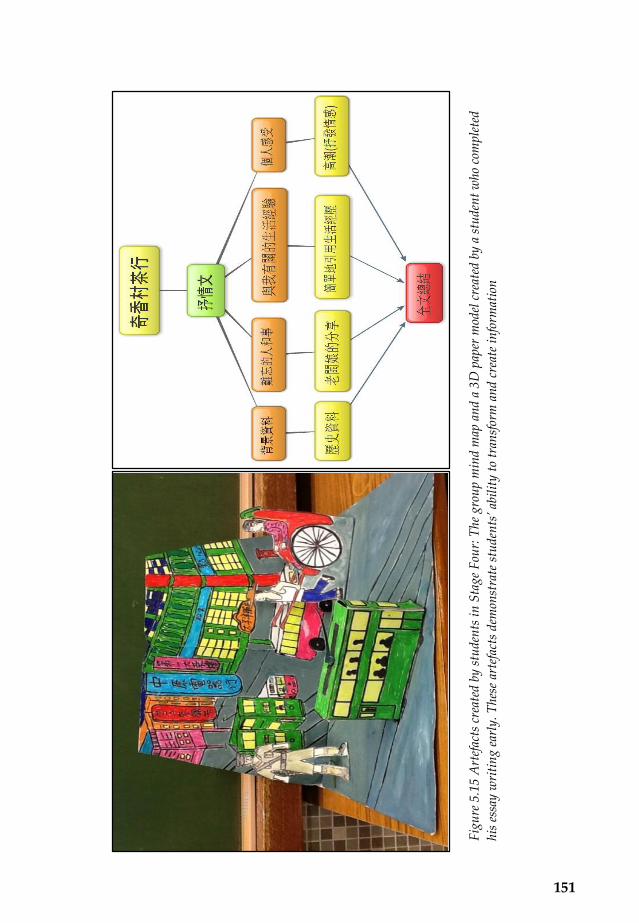
151
Figu
re 5
.15
Art
efac
ts c
reat
ed b
y st
uden
ts in
Sta
ge F
our:
The g
roup
min
d m
ap a
nd a
3D
pap
er m
odel
cre
ated
by
a st
uden
t who
com
plet
ed
his e
ssay
wri
ting early. These artefacts dem
onstrate students’ ability to tran
sform and create info
rmat
ion

152
Figu
re 5
.16
An
essa
y w
ritt
en b
y on
e of t
he st
uden
ts, d
emon
stra
ting
his a
bilit
y to
tran
sfor
m a
nd c
reat
e in
form
atio
n
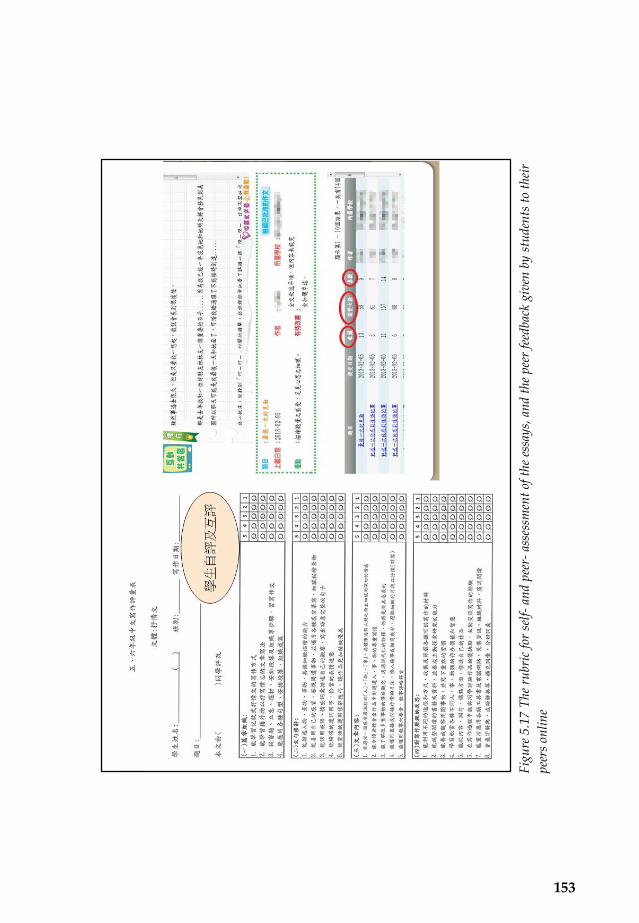
153
Figu
re 5
.17
The r
ubri
c fo
r sel
f- an
d pe
er- a
sses
smen
t of t
he es
says
, and
the p
eer f
eedb
ack
give
n by
stu
dent
s to
thei
r pe
ers o
nlin
e

154
5.5 Summary
In this chapter, we have introduced a number of learning designs and assessment instruments collected from the classrooms and schools in Hong Kong in which teachers aimed to foster students’ information literacy skills, covering all six CIL aspects (i.e. all except knowing about and understanding computer use). Actually, even this last aspect is implicitly included in the learning tasks but was not explicitly assessed.
In all these cases, a crucial feature of the learning tasks is the openness of the tasks, which provided students with the opportunities to explore and inquire. Another feature is that the technologies used are not highly sophisticated. In fact these were relatively general, but would need the availability of an LMS and other social networking software to support collaboration, communication and sharing of information.
Another important observation is the advantage of an extended learning design, which gives students rich experiences in learning subject matter knowledge and information literacy in context. Such authentic learning contexts generally stimulate intrinsic motivation in learners, enhancing the effectiveness of the learning.
A third observation is that it is desirable for students to be provided with the same technology platform for learning in different subject matter contexts and tasks. It takes time for both teachers and students to get accustomed to the interfaces and functionalities of a new technology, creating additional cognitive and organizational burdens for all involved. This additional effort would be minimized if the same technology were used throughout the course of a student’s learning.

155
References
ACARA (Australian Curriculum, Assessment and Reporting Authority) (2015). National Assessment Program – ICT Literacy Years 6 & 10 Assessment
Framework 2014. Sydney: ACARA. Retrieved August 25, 2015, from http://www.nap.edu.au/verve/_resources/NAP-ICT_Assessment_Framework_2014.pdf
American Library Association. (1989). Presidential Committee on Information
Literacy: Final Report. : American Library Association. Arter, J., & McTighe, J. (2001). Scoring Rubrics in the Classroom: Using Performance
Criteria for Assessing and Improving Student Performance. Thousand Oaks, California: Corwin Press Inc.
Bransford, J. D., Brown, A. L., & Cocking, R. R. (1999). How people learn: Brain,
mind, experience, and school (expanded edition). Washington, DC: National Academies Press.
Bray, M., & Lykins, C. (2012). Shadow Education Private Supplementary Tutoring and
Its Implications for Policy Makers in Asia. Mandaluyong City, Philippines: Asian Development Bank.
Bundy, A. (2004). Australian and New Zealand information literacy framework:
principles, standards and practice (2nd ed.). Adelaide: Australian and New Zeal and Institute for Information Literacy (ANZIIL).
Dann, R. (2002). Promoting assessment as learning: Improving the learning process.
London: Routledge/Falmer. European Commission (2000). Communication from the commission to the council and
the European Parliament: The elearning action plan - Designing tomorrow’s
education. Brussels: Commission of the European Communities. Education and Manpower Bureau (EMB). (2005). A study on the development of an
information literacy framework for Hong Kong students. Hong Kong: Government printings.

156
Education and Manpower Bureau (EMB) (1998). Information technology for learning
in a new era: five-year strategy 1998/99 to 2002/03. Hong Kong: Education
and Manpower Bureau, Hong Kong SAR Government. Retrieved August
17, 2009, from
http://www.edb.gov.hk/index.aspx?langno=1&nodeID=425.
Education and Manpower Bureau (EMB), (2000) Information Learning target: A
guideline for schools to organize teaching and learning activities to develop our
students’ capacity in using IT. [Electronic Version]. Retrieved September 11,
2015, from http://www.edb.gov.hk/attachment/en/curriculum-
development/4-key-tasks/it-for-interactive-learning/it-learning-
targets/ITLT-e.pdf
Education and Manpower Bureau (EMB) (2004). Empowering learning and teaching
with information technology. Hong Kong: Education and Manpower
Bureau, Hong Kong SAR Government. Retrieved August 17, 2009, from
http://www.edb.gov.hk/index.aspx?langno=1&nodeID=2497.
Education Bureau (EDB) (2008). Right technology at the right time for the right task.
Hong Kong: Education Bureau (EDB), Hong Kong SAR Government.
Retrieved August 17, 2015, from http://www.edb.gov.hk/en/edu-
system/primary-secondary/applicable-to-primary-secondary/it-in-
edu/consultation-3rd-ited.html
Education Bureau (EDB) (2006). The Learning Outcomes Framework (LOF) in the
Science Key Learning Area. Hong Kong: Government printings. Retrieved
August 17, 2009, from
http://cd1.edb.hkedcity.net/cd/science/lof_e/index.htm
Educational Testing Service (ETS) (2003). Succeeding in the 21st century: What
higher education must do to address the gap in information and communication
technology proficiencies. Princeton: NJ: Author.
Fraillon, J., Ainley, J., Schulz, W., Friedman, T., & Gebhardt, E. (2014). Preparing
for life in a digital age: The IEA International Computer and Information Literacy
Study International Report: Springer Open.
Fraillon, J., Schulz, W., & Ainley, J. (2013). International Computer and Information
Literacy Study: Assessment framework. Amsterdam: IEA.

157
Fraillon, J., Schulz, W., Friedman, T., Ainley, J., & Gebhardt, E. (2015). International Computer and Information Literacy Study 2013 technical report. Amsterdam, the Netherlands: International Association for the Evaluation of Educational Achievement (IEA).
Goodrich, H. (1997). Understanding rubrics. Educational Leadership, 54(4), 14–17. Helvoort, J. v. (2010). A scoring rubric for performance assessment of information literacy in Dutch Higher Education. Journal of Information Literacy, 4(1), 22-39. Herman, J., Aschbacher, P., & Winters, L. (1992). A practical guide to alternative
assessment. Alexandria, VA: Association for Supervision and Curriculum Development.
International Society for Technology for Education (ISTE) (1998). National
educational standards for students (NETS) 1998 [Electronic Version]. Retrieved April 11, 2003, from http://www.iste.org/Content/NavigationMenu/NETS/ForStudents/1998Standards/ NETS_for_Students_1998_Standards.pdf
International Society for Technology for Education. (2007). National Educational Technology Standards (NETS.S) and Performance Indicators for Students. Retrieved August 25, 2015, from http://smsd.us/webpages/swilliams/files/NETS_for_Students_2007_Standards1.pdf
KOSIS (Korean Statistical Information Service) (2014). After-school programs participation rate, Statistical Database. Retrieved August 28, 2015, from http://kosis.kr/eng/statisticsList/statisticsList_01List.jsp?vwcd=MT_ETITLE&parentId=C#SubCont
Knight, L. A. (2006). Using rubrics to assess information literacy. Reference Services Review, 34 (1), 43-55.
Law, N., Lee, Y., & Chow, A. (2002). Practice characteristics that lead to "21st
century learning outcomes". Journal of Computer Assisted Learning, 18(4), 415-426.
Law, N., Lee, Y., & Yuen, A. (2010). Assessing the effects of ICT in education. In
Friedrich Scheuermann and Francesc Pedró. (ed) Assessing the effects of ICT in education: indicators, criteria and benchmarks for international comparisons (pp.143-164) Luxembourg: European Commission

158
Law, N., Yuen, A., Shum, M., & Lee, Y. ( 2007). Phase (II) Study on Evaluating the Effectiveness of the ‘Empowering Learning and Teaching with Information Technology’ strategies (2004/2007) Final Report. [Electronic Version]. Retrieved July, 2015, from http://www.edb.gov.hk/en/edu-system/primary-secondary/applicable-to-primary-secondary/it-in-edu/phase-II-study-on-2nd-ited.html
Moskal, B. M. (2000). Scoring Rubrics: What, when, and how? [Electronic
Version]. Practical Assessment, Research, and Evaluation, 7(3). Rasch, G. (1960). Probabilistic models for some intelligence and achievement tests.
Copenhagen, Denmark: Danish Institute for Educational Research. SCONUL. (1999). Information Skills in Higher Education: A SCONUL Position Paper
[Electronic Version]. Retrieved March 24, 2003, from http://www.sconul.ac.uk/activities/inf_lit/papers/Seven_pillars.html.
SCONUL (2004), Information Support for eLearning: Principles and Practice, Rev. ed.,
Society of College, National and University Libraries, London, [Electronic Version]. Retrieved June 24, 2007, from http://www.sconul.ac.uk/publications/pubs/info_support_elearning.pdf
SRI. (2011). Innovative Teaching and Learning Research 2011 Findings and
Implications. Stanford, CA: SRI. Stenmark, J. (1991). Mathematics Assessment: Myths, Models, Good Questions, and
Practical Suggestions. Reston, VA: NCTM. Stergar, C. (2005). Performance tasks, checklists, and rubrics. Glenview, IL:
LessonLab. Von Davier, M., Gonzalez, E., & Mislevy, R. (2009). What are plausible values and
why are they useful. IERI monograph series, 2, 9-36.

8659607898819
ISBN 978988186596090000 >
People in Hong Kong generally assume that students in our schools now have fairly well-developed computer skills since they start playing with computer technology almost from birth, and are often referred to as “digital natives”. However, do these use experiences with digital devices mean that our students already have the competence to engage in life-long learning to tackle problems using ICT as a core 21st century skill? At the same time, schools in Hong Kong have experienced the launch of four IT in education strategies since 1998. Are teachers prepared to implement e-learning pedagogy, and are principals prepared to lead e-learning innovations in schools to foster the development of computer and information literacy (CIL) in their students? This book aims to identify the strengths and weaknesses of Hong Kong students’ Computer and Information Literacy (CIL) in comparison with their international counterparts through in-depth analysis of the data collected in the ICILS 2013 Study. The final chapter provides curriculum exemplars to illustrate the key characteristics of pedagogical and assessment designs that are conducive to enhancing students’ CIL. These exemplars were generated in primary and secondary schools in Hong Kong from past and current CITE projects. We hope that this book will be a useful resource for primary and secondary school teachers, principals, education policy-makers, teacher educators and members of the community who are interested in helping students learn how to use ICT tools productively for lifelong learning in the 21st century.