Financial Plan - Frankston City Council
60
2021-2031 Financial Plan | 1 Frankston City. Our next chapter. Financial Plan 2021-2031
-
Upload
khangminh22 -
Category
Documents
-
view
1 -
download
0
Transcript of Financial Plan - Frankston City Council

2021-2031 Financial Plan | 1
Frankston City. Our next chapter.
Financial Plan 2021-2031

2021-2031 Financial Plan | 2
Mark Nakia Moonblood Brown Guramang (Gooramung) – Leather Back Turtle
Wominjeka
Welcome to Frankston City
Acknowledgement
Frankston City Council acknowledges the Bunurong
people of the Kulin Nation as the Traditional
Custodians of the lands and waters in and around
Frankston City, and value and recognise local
Aboriginal and Torres Strait Islander cultures,
heritage and connection to land as a proud part of
a shared identity for Frankston City.
Council pays respect to Elders past and present
and recognises their importance in maintaining
knowledge, traditions and culture in our
community.
Council also respectfully acknowledges the
Bunurong Land Council as the Registered
Aboriginal Party responsible for managing the
Aboriginal cultural heritage of the land and waters
where Frankston City Council is situated.
2021-2031 Financial Plan | 3
Contents
Message from the Mayor 4
Message from the CEO 5
About the Financial Plan 6
Frankston city risks and challenges 10
Financial Policies 13
Financial Strategy 14
Financial Statements 21
Managing our Performance 40
Appendix 50
OLIVER’S HILL LOOKOUT

2021-2031 Financial Plan | 4
Message from the Mayor I am delighted to present Frankston City Council’s proposed 2021-2031 Financial Plan, which demonstrates how Council will continue to responsibly deliver community services and infrastructure while maintaining a sound financial position over the next decade.
Council’s focus is on delivering services, maintaining assets and investing in new infrastructure that will support our growing population while cementing Frankston City as the Lifestyle Capital of Victoria and moving towards achieving our 2040 Vision as being the place on the Bay to learn, live, work and play in a vibrant and socially supportive community.
Council has again successfully risen to the challenge of preparing a sound ten year Financial Plan that is capable of withstanding the Victorian Government’s imposed rate cap, which will undoubtedly continue to restrict Council’s income, risking our ability to deliver the vital services and infrastructure our community needs.
While this is a long-term Financial Plan that spans a decade, Council is also aware of the potential serious immediate and possible long-term impacts of the COVID-19 pandemic on the Plan.
As a Council, we have responded quickly to the changing needs of the community with our Relief and Recovery Package (part of the 2020–2021 Annual Budget), which includes a $3.86 million investment in vital community supports – taking the total to $9.128 million in ongoing assistance for our community.
Council is committed to delivering the best for our community, with an exciting $575 million Capital Works program planned over the ten years. This is complemented by a significant $293 million investment into maintain and expand existing infrastructure and to safeguard its future use.
Council has also invested in transforming the way we deliver our services to the community with our Future Ready Frankston Program. We have also worked hard to find savings and keep costs down without compromising on the quality of the services that Council delivers.
Council will continue to passionately advocate to Victorian and Federal Governments alongside our community for funding towards projects that continue this transformation into the perfect place to live, learn, work, invest and enjoy.
I encourage you to read this document and provide feedback on how we can continue to shape the future of Frankston City as a liveable, innovative and proud community and work towards achieving our shared vision.
Kris Bolam Mayor

2021-2031 Financial Plan | 5
Message from the CEO This proposed 2021-2031 Financial Plan has been prepared after significant consultation with the community, elected Members and Council staff.
It focuses on ensuring that Council continues to invest in core infrastructure, deliver key services and reinforce the City of Frankston’s resilience to future challenges.
It has also been designed to align with six key areas, promoting healthy and safe communities, community strength, a sustainable environment, a well-planned and liveable city, a thriving economy and a progressive and engaged city that you, our community told us were of value and importance to you.
Our journey in developing this document began with an unprecedented community consultation that ran throughout 2020 and early 2021, and included the creation of our first-ever Community Panel.
This panel was independently selected to represent the diverse needs of our community and developed the Community Vision Frankston 2040.
Councillors and Council officers’ workshopped current and future challenges for Frankston City and opportunities to create the municipality that our residents have told us they want to live in.
Covid-19 has had a major impact on the Council’s finances and like many households, we have to make savings to our day-to-day spending on operating and maintaining our services and infrastructure.
At the heart of Council’s decision making is the goal of promoting community wellbeing and transforming the way we deliver our services. Balancing our environmental goals and responsibilities with building a caring, welcoming and prosperous community often means making hard decisions.
We’ve considered what you’ve told us is important to you – delivering the basics and doing it better – and what we need to do to continue making progress.
This Financial Plan represents our best option for how we navigate the balance between meeting our City’s needs and maintaining a strong financial position.
If we try to spend more, we won’t be able to deliver on our ambitions, and will leave ourselves less financial headroom in the event of another unplanned event like the pandemic. If we try to spend less, the condition of our infrastructure assets and the
quality of the services we deliver would be at risk. We also need to play our role in stimulating the economic and social recovery after the pandemic.
Given there is no simple solution to address our current financial situation, we have looked at a selection of “levers’ available to us:
Focusing on what we can afford and actually delivering our capital works.
Finding permanent efficiencies in our day-to-day spending (what we call operational spending).
Borrowing for new projects that have a long term value, ensuring that the debt repayments are spread fairly across the generations of ratepayers who will benefit from them.
This plan includes targeted recurrent savings of $0.5 million each year, which equate to $32.6 million cumulative savings over ten years. These savings will be achieved mainly through our Future Ready Frankston Program which will ensure that we transform the way we deliver our services without compromising on the quality of the service.
The Future Ready Frankston Program will focus on four critical performance areas, culture, capability, connectivity and customer which will enable us to deliver better outcomes for our community.
Some of the initiatives we will be carrying out in the future include:
Continuing to engage with our community to understand the key services we deliver and the method of delivery;
Asset rationalisation and establishing target service levels;
Collaborative procurement initiatives and joint services;
Finding alternative revenue streams; and
Increased advocacy to fund existing projects. You will find our proposed plan in the next few pages along with the financial strategies that we have that will enable us to deliver on what we are proposing. Council wants to hear your feedback – what you think of our proposed plan. You can influence the decisions we make, and we want to hear from you. I strongly encourage you to have your say.
Phil Cantillon CEO

2021-2031 Financial Plan | 6
About the Financial Plan
The Financial Plan defines the broad financial boundaries for Council over the next ten years. The plan is broken up into three main sections:
Financial Policies that set out the financial targets that ensure Council remains financially sustainable
Financial Strategy identifies the approach Council intends to take to achieve the financial policies; and
Financial Statements apply the financial strategy to a ten year financial model to ensure Council meets their Financial Policy targets.
The Local Government Act 2020 (The Act) requires Councils to prepare a ten year Financial Plan in the year following a general election through the introduction of governance and supporting principles which include an integrated approach to planning, monitoring and performance reporting.
Governance Principles The Financial Plan is developed in the context of the following governance principles:
Council decisions are made and actions taken in accordance with the relevant law.
Priority is given to achieving the best outcomes for the municipal community, including future generations.
The economic, social and environmental sustainability of the municipal district, including mitigation and planning for climate change risks, is promoted.
The municipal community is engaged in strategic planning and strategic decision making.
Innovation and continuous improvement is pursued.
Collaboration with other Councils and Governments and statutory bodies is sought.
The ongoing financial viability of the Council is ensured.
Regional, state and national plans and policies are to be taken into account in strategic planning and decision making.
The transparency of Council decisions, actions and information is to be ensured.
In giving effect to the overarching governance principles, a Council must also take into account the following supporting principles: The Strategic Planning Principles The Financial Plan is developed in the context of the following strategic planning principles:
Council has an integrated approach to planning, monitoring and performance reporting.

2021-2031 Financial Plan | 7
Council Financial Plan addresses the Community Vision by funding the aspirations of the Council Plan. The Council Plan aspirations and actions are formulated in the context of the Community Vision.
The Financial Plan statements articulate the 10-year financial resources necessary to implement the goals and aspirations of the Council Plan to achieve the Community Vision.
Council's strategic planning principles identify and address the risks to effective implementation of the Financial Plan.
The Financial Plan provides for the strategic planning principles of ongoing monitoring of progress and reviews to identify and adapt to changing circumstances.
The Financial Management Principles The Financial Plan demonstrates the following financial management principles:
Revenue, expenses, assets, liabilities, investments and financial transactions are managed in accordance with Council's financial policies and strategic plans.
Management of the following financial risks: o Failure to adequately identify, plan and deliver services to the
approved service standards that the community needs. o Failure to plan for and manage Council's finances (Long Term
Financial Sustainability).
Financial policies and strategic plans are designed to provide financial stability and predictability to the community.
Council maintains accounts and records that explain its financial operations and financial position.
The Service Performance Principles The Financial Plan demonstrates the following service performance principles:
Services are provided in an equitable manner and are responsive to the diverse needs of the community.
The Council Plan is designed to identify the key services and projects to be delivered to the community. The Financial Plan provides the mechanism to demonstrate how the service aspirations within the Council Plan will be funded.
Services are accessible to the relevant users within the community.
Council provides quality services that provide value for money to the community. The Local Government Performance Reporting Framework (LGPRF) is designed to communicate council’s performance regarding the provision of quality and efficient services.
Council is developing a performance monitoring framework to continuously improve its service delivery standards.
Council is developing a service delivery framework that considers and responds to community feedback and complaints regarding service provision.
The Community Engagement Principles The Financial Plan demonstrates the following community engagement principles:
A community engagement with a clearly defined objective and scope. Participants in community engagement have access to objective,
relevant and timely information to inform their participation. Participants in community engagement are representative of the
persons and groups affected by the matter that is the subject of the community engagement.
Participants in community engagement we provided reasonable support to enable meaningful and informed engagement.
Participants in community engagement were informed of the ways in which the community engagement process will influence Council decision making.

2021-2031 Financial Plan | 8
Our Ideal Community Landscape Our Financial Plan provides clear direction on the allocation, management and use of financial resources. This is to keep our Council financially sustainable over the short, medium and long-term as we maintain services and assets, respond to growth and deliver on our strategic priorities, identifying steps to take now – for today – to remain financially sustainable into the next decade and beyond – for tomorrow, working towards our ideal community landscape.
Future-proofing our City today ….
• Increasing rates revenue at the rate cap and targeting the funds raised to those residents and businesses needing the most assistance in our community.
• Adjusting some services identified as a lower priority to enable a keener focus on core services.
• A service delivery framework developed with customer in mind. • Investing in the Future Ready Frankston program which will focus on
automating our processes with customer in mind, build our capability and enhance connectivity.
• Continuing to find efficiency savings on top of significant savings already delivered through a robust ‘bottom up’ budgeting process.
• Keeping fees and charges affordable, with those directly benefiting from or causing the expenditure making an appropriate contribution to the service, balanced by the capacity of people to pay.
• Prioritising capital expenditure utilising improved asset management practices when addressing essential infrastructure maintenance and renewal.
• Asset rationalisation and consolidation.
Means that tomorrow … • Our Council continues to deliver the services that are needed by our
community. • Our Council continues to be a low-debt Council. • Investment in technology has improved our services while
producing further savings and benefits. • Strategic investment in our public space, assets and infrastructure
has supported growth. • There are lower costs to ratepayers, as Council has addressed cost
challenges rising above the rates cap. • A continuing surplus remains to deal with the financial risks that are
likely to occur and place additional fiscal stress on the City.

2021-2031 Financial Plan | 9
Highlights from the Financial Statements Financial Plan sets out to achieve long-term financial sustainability that
resources the strategic plans working towards our ideal community
landscape. Highlights from the Financial Statements are below:
Balanced financial position across the next ten years
Total Revenue
less
Total Expenditure
Capital Works Expenditure
plus
Targeted Underlying Surplus
Estimated operational savings of $0.5 million per
annum over ten years – 2021-2031
$575 million investment in capital works
$293 million
investment in
renewing and
expanding assets
$150 million
investment in
upgrading existing
assets
$132 million
investment in new
assets
Including the following major projects:
$7 million
Bruce Park Pavilion
$25-28 million
Pines Pool Redevelopment
$23.5 million Early years reform including
Langwarrin and Seaford Early
Learning Centres
$25-30 million
Frankston Basketball & Regional
Gymnastics Redevelopment
ELC

2021-2031 Financial Plan | 10
Frankston City risks and challenges
Strategic Risks The Financial Plan achieves financial sustainability over the next ten years. However, our Council faces several strategic and financial risks that could impact short-term financial performance and financial sustainability over the longer-term. These include:
“Failure to plan for and manage Council's finances (Long Term Financial Sustainability)”
The challenges for Council in achieving Long term financial sustainability will be addressed in this plan. The strategic actions and controls contained within this plan mitigate and reduce this risk.
“Failure to adequately identify, plan and deliver services to the approved service standards that the community needs”
The challenges for Council in identifying, planning and delivering services that the community needs will be addressed in this plan. The strategic actions and controls contained within this plan mitigate and reduce this risk.
Challenges
1. Ongoing impacts of COVID While there are high levels of advantage and favourable health outcomes in Frankston, extreme disadvantage and poorer health outcomes exist in some neighbourhoods. The COVID-19 pandemic exacerbated this disadvantage and created challenges for others who up until that point had been doing relatively well. Financial stress and job losses were significant over the last 12 months, with further economic impacts expected as Government support is reduced. The timeframe for economic recovery is unknown and the social, health and wellbeing impacts on our community will likely be felt well into the next decade.
Response - Recover Provide assistance to the community to recover from the impacts of COVID and the economic shock associated with responding to the pandemic and the impact on the local economy. Key issues requiring attention were:
• Mental health • Community support • Business support • Investment attraction.
In the short term Council has invested $9.128m in recovery packages since the pandemic emerged. A $3.86M recovery package for 2021-2022 has been allocated to focus on reactivating the vibrancy of the municipality, local business support and support for those vulnerable members of the community. Medium to longer term Council has planned for adequate reserves to ensure we can respond to unexpected events.

2021-2031 Financial Plan | 11
2. Rate cap The key challenge over the next decade will be keeping rates affordable by meeting the rate cap as pressure on other revenue sources combine with key service and construction costs grow quicker than the cap. Council is confident that it can continue to manage the rates capping challenge in the 2021-2031 financial years. The challenge has been addressed through the identification of efficiency savings and a disciplined budget preparation process. The Financial Plan has been revised on the assumption that rates and charges will not increase by more than 2.00 per cent over the life of the plan. To maintain financial sustainability in the face of the above challenge, Council also needs to fundamentally review its approach to service delivery. Council will need to assess what levels of services can be provided for a given maximum rate rise under rate capping. Some of the main outcomes from the Financial Plan is the quantification of the initiatives included in the council plan, cost of existing service requirements and the associated long term cash flow implications to maintain those service levels. This allows for the ongoing review of the affordability of existing service levels and their priority relative to emerging service demands and the capacity and willingness to pay of the community.
Response – Revenue and Rating Plan Strategy in the Revenue and Rating Plan is to seek alternative sources of funding and reduce Council reliance on rates funding.
The Revenue and Rating Plan is a key informer to the Financial Plan and Budget.
3. Investing in infrastructure and maintaining our assets Making the right decisions about capital investment and asset management is critical for Council to continue to meet its annual asset renewal targets as well as providing critical assets for service delivery to the Frankston Community. The Community expects a strong focus on the future needs for this City and there are a number of key projects that need to be considered. Major capital works projects involves significant expenditure. Council must maintain its existing assets and meet the asset renewal challenges.
Response – Asset Strategy Council aims to make the right decisions about capital investment and asset management through the delivery of their Asset Management Strategy and development of an Asset Plan (due 2022). These plans all feed into and inform the Long Term Infrastructure Plan and a core component of this Financial Plan. The Asset Strategy statements in this plan identifies how we upgrade and maintain or rationalise our asset portfolio which is critical to service delivery, ensuring our assets are fit for purpose and used as efficiently as possible. Refer to page 18 Assets for more information on the Asset Strategy statements.
4. Composition of the workforce One of the biggest operational expenditure items in the Financial Plan is cost of labour. We need to balance attracting and retaining skilled staff that could continue to deliver on the services that are valued by our community, by paying salaries and wages that are on par with similar organisations whilst keeping costs low. Our employees are our key resource. We have a diverse workforce of committed individuals with an extensive range of skills and experience. We are also one of the biggest employers of the municipality with more than 65 per cent of staff living locally. Council’s current enterprise agreement ends in 2023-24, and future increases have been pegged to the rate cap.
Response – Service Strategy The Local Government Act requires the development of a Workforce plan by 2021. The delivery of this plan in included in our Service Strategy Statement as it connected closely with our Service Planning. Refer to page 17 Services for more information on the Service statements.

2021-2031 Financial Plan | 12
5. Service levels vs community expectation Constantly changing Community needs and expectations mean that Council may be delivering services the community doesn’t need or over-servicing the Community. Our community have told us that they expect high quality, efficient public services and meaningful opportunities to communicate and engage with Council. This means we need to keep improving and innovating how we communicate and deliver our services. There are also increasing expectations around transparency of information and our decision-making processes.
Response – Community Strategy and Service Strategy Council seeks a better understanding of how our community receives and uses Council services and infrastructure that will help us to plan and prepare to better meet current needs and future demands.
Improvements in how we engage with the community will be used to better inform integrated planning and decision making.
The implementation of the service planning framework is facilitating an evidence based approach to make decisions around service levels and to influence the short and medium impacts. Service planning data will be used as base information for development of our key strategic plans; such as the Council Plan and Budget.
Council is committed to automating processes and improving customer experience. Transformation, continuous improvement and benefit realisation a big component of our transformation program - Future Ready Frankston. Council has outlined an efficiency target of $0.5 million operational savings each year in this plan.
The development of our Community Engagement Framework and Service Planning Framework is included in our Community
Strategy and Service Strategy Statements. Refer to pages 16 and 17 for more information on these strategies.
6. Volatility of the Waste Industry More household waste is being generated in our City as increased numbers of residents work from home and our population grows. This additional waste means extra costs to our community. Service costs are expected to rise when the Victorian Government’s landfill levy jumps from $65.90 per tonne in 2019-20 to $105.90 per tonne from 1 July 2021 and then to $125.90 per tonne in 2022. Shifting recycling markets and increased processing costs, including the cost of contamination, are also placing pressure on costs, which are rising faster than the Consumer Price Index (CPI) and rates cap. ‘Recycling Victoria, a new economy’ is the Victorian Government’s 10-year circular economy policy and action plan, which includes a $300 million investment to transform the waste and resource recovery sector in Victoria. This includes a new ‘Waste Act’ and an administering authority that will set the legislative framework for upcoming household recycling reforms. These reforms will require all Victorian councils to provide access to a four-service waste model: garbage, recycling, separated glass (by 2027) and food and garden organics (by 2030). Councils and the Victorian Government are working together to explore new technologies to reduce reliance on landfills. Advanced waste processing is a promising potential option for the future. Despite Council offering waste management services, dumped waste continues to be an issue. The cost of managing waste put out illegally by people, often when they are moving, is significant and poses amenity issues.
Response - Recover Waste charges are recovered as a full cost recovery, user pay model. Diversion of waste from landfill is a priority for Council that has been recognised in the adopted Council Plan.

2021-2031 Financial Plan | 13
Financial Policies This section defines the measures that demonstrates Council's financial sustainability in order to fund the aspirations of the Community Vision and the Council Plan.
Policy statement Measure Target Justification
Consistent underlying surplus result Adjusted underlying result / adjusted underlying revenue greater than 2.5%
>2.5% The adjusted underlying surplus is calculated by backing out non recurrent capital grants and contributions from its operating surplus. In a rate capping environment, where Council does not have much control in setting rates and where income from other revenue streams are low (i.e. parking and rental income), a 2.5% target is more realistic to achieve as this means that Council could continue to deliver the same services and still have sufficient reserves to fund part of its capital works program, without having to rely on borrowings entirely.
Ensure Council maintains sufficient working capital to meet its debt obligations as they fall due
Current Assets / Current Liabilities greater than 1.1
>1.1 This indicator measures Council’s ability to pay existing liabilities in the next 12 months.
Ensures that Council could repay long term obligations from the income it generates internally
Non-current liabilities / own source revenue to remain below 60%
<60% This measures Council’s ability to pay its long term obligations with the revenue it generates internally (i.e. excludes external grants and contributions). Council is well below the target KPI of 60 per cent and the level of long term obligations can easily be met without relying on external funding sources to repay its debt commitments.
Ensures that Council could repay its borrowing commitment from the rate income and growth in the Municipality
Interest and principal repayments on interest bearing loans and borrowings / rate revenue below 10%
<10% This measures Council’s ability to pay its debt obligations with the rate revenue it generates. Council is well below the target KPI of 10 per cent for this indicator (except in 2025-26) which means that Councils can pay its loan repayments and interest from rates instead of looking at alternative funding streams.
Ensures that Council could repay its interest commitment from the rate income and growth in the Municipality
Interest payments / rate revenue below 5%
<5% This measures Council’s ability to pay its interest bearing loan obligations with the rate revenue it generates. Council is well below the target KPI of 60 per cent for this indicator and has the ability to borrow to fund major capital works projects in the future.
That Councils applies loan funding to new capital and maintain total borrowing in line with rate income and growth of the municipality
Total Indebtedness / rate revenue
<60% This measures Council’s ability to pay its long term obligations with the revenue it generates internally (i.e. excludes external grants and contributions). Council is well below the target KPI of 60 per cent and the level of long term obligations can easily be met without relying on external funding sources to repay its debt commitments.
Council maintains sufficient restricted cash to ensure ongoing liquidity as well as to address unforeseen cash imposts if required
Unrestricted cash / current liabilities to be maintained above 20%
>20% This measures Council’s ability to pay existing liabilities in the next 12 months using cash reserves that are not restricted like trust funds and statutory reserves. Basically it assesses the ability that Council has to pay its bills on time without utilising cash that are held to fund specific activities.
Allocate adequate funds towards renewal capital in order to replace assets and infrastructure as they reach the end of their service life
Asset renewal and upgrade expenses / depreciation above 100%
>100% This measures the renewal and upgrade expenditure that Council incurs on its existing asset base compared to depreciation expense. This assesses whether Council’s assets are being renewed or upgraded as planned and compares the rate of spending on existing assets through renewing, restoring, replacing or upgrading existing assets with depreciation expense.
Ten year projections of these measures are included in the Financial Statement’s section of this document on page 40.

2021-2031 Financial Plan | 14
Financial Strategy
Our financial strategy identifies the approach Council intends to take to achieve its financial policies, and financial sustainability. The four key components identified in this approach are identified below:
An understanding of the requirements and expectations of our community is considered through the planning for our Services and Assets, helping to inform and resource our Integrated Planning and Reporting framework A responsible Financial Plan requires us to prioritise and strengthen the work we do in each of these areas, taking great care to connect all elements throughout our planning and reporting cycles.
This will help us ensure:
Services provided by Council are appropriate and valued by our community
Services are delivered in an optimal and contemporary manner, whilst considering different methods of delivery and sources of procurement
An understanding of service cost across Council’s service portfolio
A complete and accurate picture of our assets, maintenance and renewal costs over the longer term
Allocation of resources against immediate and future requirements, and prioritising the requirements and expectations of the community
Staff understand and implement Council’s strategies and priorities, working towards an aligned and common strategic goal
Long term financially sustainable outcome.

2021-2031 Financial Plan | 15
01 Community Community Engagement Framework
Community Vision
Community Panel
Advocacy Community Engagement Framework Council has developed a Community Engagement Framework that uses six engagement principles to develop a consistent and coordinated approach to community engagement.
The Framework demonstrates Frankston City Council’s commitment to:
developing a consistent and coordinated approach to community engagement
increase participation and involvement in Council decisions and projects
improve awareness of community engagement as central to Council decision making
Community Panel and the Community Vision In 2020 residents were invited to be part of a Community Panel. A physical invitation delivered to every household in the municipality, asking for expressions of interest. One hundred and eighty people responded and nominated to be part of our Community Panel, and Council engaged with this group on a range of consultations and forums. A smaller panel of 46 members was formed from the larger panel. This smaller panel of local residents ranging in age, gender, local area and background was selected independently using specific methodology to ensure it accurately represented the diversity of our community. The targeted panel met in facilitated workshops to undertake deliberative engagement on the Community Vision and Council Plan. The panel met on six occasions between November 2020 and February 2021 to discuss and agree themes and priorities used to form the Community Vision Frankston City 2040. The Vision and suggested priorities were presented to Councillors, to help shape their decision-making process through the 2021–2025 strategic planning cycle - considering the Council Plan, Financial Plan, Budget and Long Term Infrastructure Plan. Each theme in the Community Vision is represented as an Outcome in the Council Plan.
Frankston City Community Vision 2040 2021-2025 Council Plan and Budget Healthy Families and Communities Healthy and safe communities
Vibrant and inclusive communities Community strength
Natural Environment and Climate Action Sustainable environment
Connected Places and Spaces Well planned and liveable city
Industry, Employment and Education Thriving economy
Advocacy, Governance and Innovation Progressive and engaged city

2021-2031 Financial Plan | 16
Deliberative Engagement on the Financial Plan The Local Government Act 2020 requires that Council develop or review the
Financial Plan in accordance with its deliberative engagement practices.
In June 2021, the Community Panel was reconvened to provide direction on community priorities to feed in to the Financial Plan. The objectives of the engagement were:
Service priorities
Seeking advice on how to engage in the future
Council’s role in specific areas
When asked for opinions on how the wider community should be engaged the responses below were provided:
More awareness of future financial initiatives
Annual community surveys
Open communication and clear and unambiguous messaging and seeking periodic feedback
Seeking periodic feedback on how budget is used
Outlining priorities with the community that includes resident businesses and community groups
Engaging through the Community Panel members Public exhibition of the 2021-2031 Financial Plan for a four week period seeking feedback from the community. Advocacy
Council aims to reduce the reliance on rate income, therefore Council will
advocate to other levels of government for grant funding to support the
delivery of important infrastructure and service outcomes for the community.
When preparing its financial plan, Council considers its project proposal
pipeline, advocacy priorities, upcoming grant program opportunities, and co-
funding options to determine what grants to apply for.
Our Advocacy Campaign 2021-2025 underpins a key strategic direction of
Council to reduce our reliance on rates and charges revenue and source
alternate revenue streams.
Our Draft Advocacy Priorities align to the Council Plan outcomes and are;
Investing in our Prosperity
Enhancing our environment and liveability
Strengthening our community
Strategy statements – Community 1.1 That the community engagement framework is used to inform the
development of the financial plan. 1.2 Advocacy priorities are considered in developing the financial plan.

2021-2031 Financial Plan | 17
02 Services Service Planning Framework
Service Plans and Reviews
Transformation, Continuous improvement, Benefits realisation
Workforce Planning
Service Planning Service Planning helps Council to make strategic decisions about what services can be delivered based on the current and future needs of the community and the resources available to Council. Service Plans enable Council a better understanding of our service portfolio and provide opportunity for better informed decision making. Workforce plans are due to be delivered in 2022 and are strongly integrated with Service Plans. Service Planning Framework
Transformation Council is investing in a Future Ready Frankston program which will focus on automating our processes with customer in mind, build our capability and enhance connectivity. Benefits realisation of the program are set to deliver planned operational savings across the ten years.
Strategy statements – Services
2.1 That the service planning framework is used to inform the development of the financial plan.
2.2 Operational savings target of $0.5 million is set as an efficiency target through implementation of a transformation program.

2021-2031 Financial Plan | 18
03 Assets Asset Management Strategy
Asset Management Framework
Asset Plan
Long Term Infrastructure Plan
Asset Plan Integration Integration to the Asset Plan is a key principle of the Council’s strategic financial planning principles. The purpose of this integration is designed to ensure that future funding is allocated in a manner that supports service delivery in terms of the plans and the effective management of Council’s assets into the future. The Asset Plan identifies the operational and strategic practices which will ensure that Council manages assets across their life cycle in a financially sustainable manner. The Asset Plan, and associated asset management policies, provide council with a sound base to understand the risk associated with managing its assets for the community’s benefit. The Asset Plan is designed to inform the Financial Plan by identifying the amount of capital renewal, backlog and maintenance funding that is required over the life of each asset category. The level of funding will incorporate knowledge of asset condition, the risk assessment issues as well as the impact of reviewing and setting intervention and service levels for each asset class. In addition to identifying the operational and strategic practices that ensure that Council manages assets across their life cycle in a financially sustainable manner, the Asset Plan quantifies the asset portfolio and the financial implications of those practices. Together the Financial Plan and Asset Plan seek to balance projected investment requirements against projected budgets. Service planning and the setting of service levels enables Council to develop Asset Management Plans and practices that support desired service outcomes. Without Service Plans, Council’s Asset Management Plans can only reliably predict future
funding requirements to safely retain assets in a condition that is compliant with relevant regulatory requirements and fit for use, but not necessarily fit for purpose. Asset Management Framework The asset management framework illustrates the relationship between Council’s strategic objectives and asset planning at the strategic, tactical and operational levels.
Strategy statements – Assets
3.1 That Council seeks to make the right decisions about capital investment and asset management through the Asset Management Framework and alignment to the Integrated Planning and Reporting Framework and Service Planning Framework.
3.2 That Council annually reviews the asset renewal gap and ensures adequate measures are in place to manage it.
3.3 That asset renewal cannot be funded by non-renewable funding sources such as asset sales, reserve funds or loan funds
3.4 That Council seeks to prioritise renewal, compliance and maintenance work

2021-2031 Financial Plan | 19
04 Integrated Planning and Reporting Integrated Planning and Reporting Framework
Review, monitor, report
Governance principles
Other key strategies and plans
Integrated Planning and Reporting Council has developed an integrated, long-term and transparent approach to planning to support Council in strategic decision making. An Integrated Planning and Reporting framework has been implemented and takes into consideration Councils legislative requirements, including the Governance principles and supporting principles in the Local Government Act 2020:
The community engagement principles
The public transparency principles
The strategic planning principles
The financial management principles
The service performance principles Key strategies and plans include:
Municipal Planning strategy
Risk Management Plan
Financial Plan
Revenue and Rating Plan
Infrastructure Plan
Asset Plan
Workforce Plan
Health and Wellbeing Plan
Future Ready Frankston (Corporate Strategy)
Master plans
Action Plans
Integrated Planning and Reporting Framework The following diagram demonstrates our Integrated Planning and Reporting Framework. The golden thread approach aims to integrate key strategic plans across Council, along with regular community engagement and performance reporting.

2021-2031 Financial Plan | 20
Strategy statements – Integrated Planning and Reporting
4.1 That Council implements the strategic actions in the adopted 2021-2025 Revenue and Rating Plan
4.2 That Council implements the strategic actions to address strategic risk in the Risk Management Plan
4.3 That Council develops an integrated, longer-term and transparent approach to planning that supports Council in leading strategic decision making.
4.4 That the Financial Plan be developed in accordance with the Governance Principles in the Local Government Act; including the supporting principles.
4.5 That the economic, social and environmental sustainability of the municipal district, including mitigation and planning for climate change risks, is to be promoted
4.5 That Council approves the principle of loan funding as a viable and equitable mechanism of:
• Funding new/significantly upgraded major assets that provide a broad community benefit; or
• Funding capital projects that provide a financial return above annual loan funding costs; or
• Funding of one-off extraordinary operating items in excess of $1 million
4.6 The following financial strategy statements be enacted in the development of the Financial Plan:
• 4.6.1 That reserve funds be drawn down to fund expenditure that is consistent with the purpose of the reserve as noted in the section on reserves strategy.
• 4.6.2 That surplus cash reserves in excess of $0.5 million be transferred to the strategic assets reserve to fund major capital works projects and funding of one-off extraordinary operating items in the future.
• 4.6.3 Proceeds from sale of land are not to be utilised to fund operational expenditure.
• 4.6.4 That Council consider the application of the rate cap as per the Minister Local Government directive
• 4.6.5 That Council considers on an annual basis whether to make application to the Essential Service Commission (ESC) for a variation to
the rate capping framework based on the outcomes contained in the Financial Plan and future infrastructure requirements.

2021-2031 Financial Plan | 21
Financial Statements This section presents information regarding the Financial Plan Statements and Statement of Human Resources for the ten years from 2021-2031.
The following financial statements have been prepared in accordance with the Local Government Act 2020 and Local Government (Planning and Reporting).
Financial Statements o Comprehensive Income Statement o Balance Sheet o Statement of Changes in Equity o Statement of Cash Flows o Statement of Capital Works o Statement of Human Resources
Borrowing Requirements
Reserves

2021-2031 Financial Plan | 22
Comprehensive Income Statement
Actual
2020-21 2021-22 2022-23 2023-24 2024-25 2025-26 2026-27 2027-28 2028-29 2029-30 2030-31
$’000 $’000 $’000 $’000 $’000 $’000 $’000 $’000 $’000 $’000 $’000
Income
Rates and charges 130,729 134,698 138,782 142,887 147,039 151,245 155,506 159,821 164,203 168,641 173,143
Statutory fees and fines 4,872 6,093 6,215 6,339 6,466 6,595 6,727 6,862 6,999 7,139 7,282
User fees 14,536 27,777 28,711 29,628 30,660 31,043 31,863 33,005 33,819 34,456 35,366
Grants - Operating 20,552 18,777 18,965 19,154 19,346 19,539 19,735 19,932 20,131 20,333 20,536
Grants - Capital 6,667 19,153 19,008 14,725 14,286 14,310 13,613 13,416 2,119 1,623 1,126
Contributions - monetary 1,858 1,000 2,317 1,785 2,000 2,000 2,700 2,000 2,000 2,000 2,000
Contributions - non-monetary 4,400 800 800 800 800 800 800 800 800 800 800
Net gain/(loss) on disposal of property,
infrastructure, plant and equipment258 574 517 477 453 690 353 375 468 508 486
Other income 3,236 4,531 4,683 4,818 4,854 4,927 5,002 5,078 5,156 5,235 5,316
Total income 187,108 213,403 219,998 220,613 225,904 231,149 236,299 241,289 235,695 240,735 246,055
Expenses
Employee costs 77,204 85,958 88,402 90,873 93,521 96,327 98,735 101,203 103,734 106,326 108,985
Materials and services 58,946 68,649 69,991 71,520 73,088 74,675 76,302 77,970 79,679 81,432 83,229
Depreciation 33,186 31,738 32,859 35,137 36,527 37,929 38,814 39,980 40,668 41,322 41,861
Amortisation - intangible assets 718 943 886 - - - - - - - -
Amortisation - right of use assets 547 512 177 - - - - - - - -
Bad and doubtful debts 137 220 220 220 220 220 220 220 220 300 300
Borrowing costs 1,452 1,467 1,573 1,583 1,713 1,647 1,621 1,809 1,684 1,563 1,356
Finance Costs - leases 59 40 5 - - - - - - - -
Other expenses 6,146 5,201 4,522 4,647 4,776 4,907 5,042 5,181 5,323 5,469 5,619
Efficiency Factor - (1,068) (1,500) (2,000) (2,500) (3,000) (3,500) (4,000) (4,500) (5,000) (5,500)
Total expenses 178,395 193,660 197,135 201,980 207,345 212,705 217,234 222,363 226,808 231,412 235,850
Surplus/(deficit) for the year 8,713 19,743 22,863 18,633 18,559 18,444 19,065 18,926 8,887 9,323 10,205
Other comprehensive income
Items that will not be reclassified to
surplus or deficit in future periods
Net asset revaluation increment
/(decrement)17,215 - - - - - - - - - -
Total comprehensive result 25,928 19,743 22,863 18,633 18,559 18,444 19,065 18,926 8,887 9,323 10,205

2021-2031 Financial Plan | 23
Balance Sheet
Actual
2020-21 2021-22 2022-23 2023-24 2024-25 2025-26 2026-27 2027-28 2028-29 2029-30 2030-31
$’000 $’000 $’000 $’000 $’000 $’000 $’000 $’000 $’000 $’000 $’000
Assets
Current assets
Cash and cash equivalents 82,029 50,185 33,229 32,214 35,718 24,759 28,382 32,714 37,467 41,840 47,021
Trade and other receivables 23,522 20,530 21,095 21,675 22,271 22,883 23,512 24,159 24,823 25,506 26,207
Other financial assets 36,517 34,881 25,000 20,000 20,550 21,115 21,696 22,293 22,906 23,536 24,183
Inventories 154 202 208 214 220 226 232 238 245 252 259
Other assets 2,838 2,941 3,022 3,105 3,190 3,278 3,368 3,461 3,556 3,654 3,754
Total current assets 145,060 108,739 82,554 77,208 81,949 72,261 77,190 82,865 88,997 94,788 101,424
Non-current assets
Trade and other receivables 613 550 425 1,500 1,375 1,250 1,125 1,000 875 750 625
Other financial assets - 1,000 7,500 7,500 7,500 7,500 7,500 7,500 7,500 7,500 7,500
Property, infrastructure, plant &
equipment1,755,953 1,789,690 1,835,471 1,861,322 1,880,177 1,901,353 1,925,439 1,945,525 1,945,288 1,945,902 1,943,828
Right-of-use assets 982 339 - - - - - - - - -
Intangible assets 1,150 1,448 1,414 1,597 1,747 1,897 2,047 2,197 2,347 2,497 2,647
Total non-current assets 1,758,698 1,793,027 1,844,810 1,871,919 1,890,799 1,912,000 1,936,111 1,956,222 1,956,010 1,956,649 1,954,600
Total assets 1,903,758 1,901,766 1,927,364 1,949,127 1,972,748 1,984,261 2,013,301 2,039,087 2,045,007 2,051,437 2,056,024
Liabilities
Current liabilities
Trade and other payables 19,699 19,770 20,166 20,568 20,978 21,397 21,826 22,264 22,710 23,164 23,623
Trust funds and deposits 6,705 6,659 6,842 7,031 7,224 7,423 7,627 7,837 8,052 8,273 8,504
Provisions 34,612 16,618 13,370 13,771 14,184 14,610 14,975 15,349 15,733 16,126 16,529
Interest-bearing liabilities 3,250 688 1,498 1,915 17,490 2,446 4,042 5,421 5,697 5,556 5,252
Lease liabilities 584 357 - - - - - - - - -
Total current liabilities 64,850 44,092 41,876 43,285 59,876 45,876 48,470 50,871 52,192 53,119 53,908
Non-current liabilities
Provisions 1,396 2,103 2,177 2,242 2,309 2,378 2,437 2,498 2,560 2,624 2,690
Interest-bearing liabilities 27,084 28,890 33,796 35,452 23,856 30,856 38,178 42,576 38,226 34,342 27,869
Lease liabilities 639 29 - - - - - - - - -
Total non-current liabilities 29,119 31,022 35,973 37,694 26,165 33,234 40,615 45,074 40,786 36,966 30,559
Total liabilities 93,969 75,114 77,849 80,979 86,041 79,110 89,085 95,945 92,978 90,085 84,467
Net assets 1,809,789 1,826,652 1,849,515 1,868,148 1,886,707 1,905,151 1,924,216 1,943,142 1,952,029 1,961,352 1,971,557
Equity
Accumulated surplus 729,990 764,977 805,054 829,015 844,042 873,413 888,730 903,188 907,175 911,964 916,818
Reserves 1,079,799 1,064,555 1,047,341 1,042,013 1,045,545 1,034,618 1,038,366 1,042,834 1,047,734 1,052,268 1,057,619
Total equity 1,809,789 1,829,532 1,852,395 1,871,028 1,889,587 1,908,031 1,927,096 1,946,022 1,954,909 1,964,232 1,974,437

2021-2031 Financial Plan | 24
Statement of Changes in Equity
Total Accumulated
Surplus Revaluation
Reserve Other
Reserves
$’000 $’000 $’000 $’000
2021 Actual
Balance at beginning of the financial year 1,783,861 724,276 975,374 84,211
Surplus/(deficit) for the year 8,713 8,713 - -
Net asset revaluation increment/(decrement) 17,215 - 17,215 -
Transfers to other reserves - 16,569 - (16,569)
Transfers from other reserves - (19,568) - 19,568
Balance at end of the financial year 1,809,789 729,990 992,589 87,210
2022
Balance at beginning of the financial year 1,809,789 729,990 992,589 87,210
Surplus/(deficit) for the year 19,743 19,743 - -
Transfers to other reserves - 17,497 - (17,497)
Transfers from other reserves - (2,253) - 2,253
Balance at end of the financial year 1,829,532 764,977 992,589 71,966
2023
Balance at beginning of the financial year 1,829,532 764,977 992,589 71,966
Surplus/(deficit) for the year 22,863 22,863 - -
Transfers to other reserves - 20,528 - (20,528)
Transfers from other reserves - (3,314) - 3,314
Balance at end of the financial year 1,852,395 805,054 992,589 54,752
2024
Balance at beginning of the financial year 1,852,395 805,054 992,589 54,752
Surplus/(deficit) for the year 18,633 18,633 - -
Transfers to other reserves - 11,271 - (11,271)
Transfers from other reserves - (5,943) - 5,943
Balance at end of the financial year 1,871,028 829,015 992,589 49,424
Total Accumulated
Surplus Revaluation
Reserve Other
Reserves
$’000 $’000 $’000 $’000
2025
Balance at beginning of the financial year 1,871,028 829,015 992,589 49,424
Surplus/(deficit) for the year 18,559 18,559 - -
Transfers to other reserves - 5,444 - (5,444)
Transfers from other reserves - (8,876) - 8,876
Balance at end of the financial year 1,889,587 844,042 992,589 52,956
2026
Balance at beginning of the financial year 1,889,587 844,042 992,589 52,956
Surplus/(deficit) for the year 18,444 18,444 - -
Transfers to other reserves - 16,959 - (16,959)
Transfers from other reserves - (5,932) - 5,932
Balance at end of the financial year 1,908,031 873,413 992,589 42,029
2027
Balance at beginning of the financial year 1,908,031 873,413 992,589 42,029
Surplus/(deficit) for the year 19,065 19,065 - -
Transfers to other reserves - 1,661 - (1,661)
Transfers from other reserves - (5,309) - 5,309
Balance at end of the financial year 1,927,096 888,730 992,589 45,777
2028
Balance at beginning of the financial year 1,927,096 888,730 992,589 45,777
Surplus/(deficit) for the year 18,926 18,926 - -
Transfers to other reserves - 844 - (844)
Transfers from other reserves - (5,212) - 5,212
Balance at end of the financial year 1,946,022 903,188 992,589 50,245

2021-2031 Financial Plan | 25
Statement of Changes in Equity (contd.)
Total Accumulated
Surplus Revaluation
Reserve Other
Reserves
$’000 $’000 $’000 $’000
2029
Balance at beginning of the financial year 1,946,022 903,188 992,589 50,245
Surplus/(deficit) for the year 8,887 8,887 - -
Transfers to other reserves - 873 - (873)
Transfers from other reserves - (5,673) - 5,673
Balance at end of the financial year 1,954,909 907,175 992,589 55,145
2030
Balance at beginning of the financial year 1,954,909 907,175 992,589 55,145
Surplus/(deficit) for the year 9,323 9,323 - -
Transfers to other reserves - 808 - (808)
Transfers from other reserves - (5,242) - 5,242
Balance at end of the financial year 1,964,232 911,964 992,589 59,679
2031
Balance at beginning of the financial year 1,964,232 911,964 992,589 59,679
Surplus/(deficit) for the year 10,205 10,205 - -
Transfers to other reserves - 726 - (726)
Transfers from other reserves - (5,977) - 5,977
Balance at end of the financial year 1,974,437 916,818 992,589 65,030

2021-2031 Financial Plan | 26
Statement of Cash Flows
Actual
2020-21 2021-22 2022-23 2023-24 2024-25 2025-26 2026-27 2027-28 2028-29 2029-30 2030-31
$’000 $’000 $’000 $’000 $’000 $’000 $’000 $’000 $’000 $’000 $’000
Inflows Inflows Inflows Inflows Inflows Inflows Inflows Inflows Inflows Inflows Inflows
(Outflows) (Outflows) (Outflows) (Outflows) (Outflows) (Outflows) (Outflows) (Outflows) (Outflows) (Outflows) (Outflows)
Rates and charges 127,295 134,698 138,782 142,887 147,039 151,245 155,506 159,821 164,203 168,641 173,143
Statutory fees and fines 4,581 6,093 6,215 6,339 6,466 6,595 6,727 6,862 6,999 7,139 7,282
User fees 14,691 27,777 28,711 29,628 30,660 31,043 31,863 33,005 33,819 34,456 35,366
Grants - operating 22,510 18,777 18,965 19,154 19,346 19,539 19,735 19,932 20,131 20,333 20,536
Grants - capital 18,896 19,153 19,008 14,725 14,286 14,310 13,613 13,416 2,119 1,623 1,126
Contributions - monetary 1,858 1,000 2,317 1,785 2,000 2,000 2,700 2,000 2,000 2,000 2,000
Interest received 818 1,000 1,100 1,200 1,200 1,200 1,200 1,200 1,200 1,200 1,200
Other receipts 3,551 3,531 3,841 7,931 3,626 3,695 3,677 3,742 3,809 3,874 3,946
Employee costs (74,614) (85,958) (88,402) (90,873) (93,521) (96,327) (98,735) (101,203) (103,734) (106,326) (108,985)
Materials and services (55,319) (68,869) (70,211) (71,740) (73,308) (74,895) (76,522) (78,190) (79,899) (81,732) (83,529)
Other payments (4,846) (18,921) (4,522) (4,647) (4,776) (4,907) (5,042) (5,181) (5,323) (5,469) (5,619)
Efficiency Factor - 1,068 1,500 2,000 2,500 3,000 3,500 4,000 4,500 5,000 5,500
Net cash provided by/(used in)
operating activities 59,421 39,349 57,304 58,389 55,518 56,498 58,222 59,404 49,824 50,739 51,966
(49,431) (67,074) (79,415) (60,871) (55,233) (58,956) (62,749) (59,915) (40,281) (41,786) (39,638)
Investment in joint ventures12 - - - - - - - - - -
533 1,024 1,017 977 953 1,190 853 875 968 1,008 986
15,498 - - - - - - - - - -
Net cash provided by/ (used in)
investing activities (33,388) (66,050) (78,398) (59,894) (54,280) (57,766) (61,896) (59,040) (39,313) (40,778) (38,652)
Finance costs (1,452) (1,467) (1,573) (1,583) (1,713) (1,647) (1,621) (1,809) (1,684) (1,563) (1,356)
Proceeds from borrowings 2,930 2,750 7,007 3,600 6,430 10,800 13,500 11,500 2,000 2,500 -
Repayment of borrowings (345) (3,506) (1,291) (1,527) (2,451) (18,844) (4,582) (5,723) (6,074) (6,525) (6,777)
Repayment of lease liabilities (522) - - - - - - - - - -
Interest paid - lease liability (59) (40) (5) - - - - - - - -
Net cash provided by/(used in)
financing activities 552 (2,263) 4,138 490 2,266 (9,691) 7,297 3,968 (5,758) (5,588) (8,133)
Net increase/(decrease) in cash & cash
equivalents 26,585 (28,964) (16,956) (1,015) 3,504 (10,959) 3,623 4,332 4,753 4,373 5,181
55,444 82,029 53,065 36,109 35,094 38,598 27,639 31,262 35,594 40,347 44,720
82,029 53,065 36,109 35,094 38,598 27,639 31,262 35,594 40,347 44,720 49,901
Cash flows from investing activities
Payments for property, infrastructure,
plant and equipment
Proceeds from sale of property,
infrastructure, plant and equipment
Proceeds from sale of investments
Cash flows from financing activities
Cash and cash equivalents at the
beginning of the financial year
Cash and cash equivalents at the end of
the financial year
Cash flows from operating activities

2021-2031 Financial Plan | 27
Statement of Capital Works Actual
2020-21 2021-22 2022-23 2023-24 2024-25 2025-26 2026-27 2027-28 2028-29 2029-30 2030-31
$’000 $’000 $’000 $’000 $’000 $’000 $’000 $’000 $’000 $’000 $’000
Property
Buildings 16,742 22,721 38,548 24,376 12,431 14,819 18,435 9,697 10,640 8,748 5,500
Total buildings 16,742 22,721 38,548 24,376 12,431 14,819 18,435 9,697 10,640 8,748 5,500
Total property 16,742 22,721 38,548 24,376 12,431 14,819 18,435 9,697 10,640 8,748 5,500
Plant and equipment
2,581 5,152 2,411 2,210 2,041 2,612 1,986 1,829 1,852 1,653 1,506
Fixtures, fittings and furniture 246 557 1,204 407 229 194 419 264 208 343 350
Computers and telecommunications 3,576 4,294 1,537 2,061 2,515 1,288 1,643 1,375 1,687 1,398 1,131
Library books 435 726 720 720 783 803 823 844 866 888 910
Total plant and equipment 6,838 10,729 5,872 5,398 5,568 4,897 4,871 4,312 4,613 4,282 3,897
Infrastructure
Roads 4,859 8,645 6,647 5,096 5,056 5,357 6,368 6,902 5,698 5,754 6,700
Bridges 269 690 208 442 454 465 477 489 502 515 528
Footpaths and cycleways 2,680 3,346 3,621 3,732 3,107 2,960 3,627 2,886 2,786 3,084 1,790
Drainage 2,092 1,673 4,795 3,573 4,598 7,466 3,317 2,092 6,110 7,247 7,270
Recreational, leisure and community
facilities6,251 7,103 6,811 7,532 16,792 20,007 15,447 23,739 3,690 4,792 6,360
Waste management 85 560 1,291 673 836 150 5,000 - 150 - -
6,284 9,839 9,358 8,441 6,147 3,365 3,979 4,440 3,661 7,339 8,337
Off street car parks 508 350 1,519 1,601 1,076 530 1,267 2,138 1,413 722 330
Other infrastructure 2,734 2,618 2,245 1,507 668 440 1,461 4,720 2,518 803 426
Total infrastructure 25,762 34,824 36,495 32,597 38,734 40,740 40,943 47,406 26,528 30,256 31,741
Total capital works expenditure 49,342 68,274 80,915 62,371 56,733 60,456 64,249 61,415 41,781 43,286 41,138
Represented by:
New asset expenditure 19,849 21,473 14,703 13,755 18,903 16,536 20,469 10,824 6,019 6,531 5,990
Asset renewal expenditure 21,763 25,043 26,518 25,171 26,182 29,077 27,228 28,454 27,359 27,222 27,658
Asset expansion expenditure - 4,776 1,807 1,826 3,593 4,715 3,374 3,518 113 224 582
Asset upgrade expenditure 7,730 16,982 37,887 21,619 8,055 10,128 13,178 18,619 8,290 9,309 6,908
Total capital works expenditure 49,342 68,274 80,915 62,371 56,733 60,456 64,249 61,415 41,781 43,286 41,138
Grants 6,667 19,153 19,008 14,725 14,286 14,310 13,613 13,416 2,119 1,623 1,126
Contributions 92 - 583 - - - 700 - - - -
Council cash 42,533 46,371 54,317 44,046 36,017 35,346 36,436 36,499 37,662 39,163 40,012
Borrowings 50 2,750 7,007 3,600 6,430 10,800 13,500 11,500 2,000 2,500 -
Total capital works expenditure 49,342 68,274 80,915 62,371 56,733 60,456 64,249 61,415 41,781 43,286 41,138
Plant, machinery and equipment
Parks, open space and streetscapes
Funding sources represented by:

2021-2031 Financial Plan | 28
Statement of Human Resources
Actual
Staff expenditure 2020-21 2021-22 2022-23 2023-24 2024-25 2025-26 2026-27 2027-28 2028-29 2029-30 2030-31
$’000 $’000 $’000 $’000 $’000 $’000 $’000 $’000 $’000 $’000 $’000
Total staff expenditure
Male 32,702 36,856 37,911 38,985 40,154 41,359 42,393 43,453 44,539 45,652 46,794
Female 40,931 46,131 47,401 48,617 49,909 51,405 52,641 53,905 55,199 56,524 57,881
Self-described gender - - - - - - - - - - -
Casual staff 4,976 5,912 6,031 6,212 6,399 6,592 6,757 6,927 7,101 7,280 7,463
less Capitalised costs (1,405) (2,941) (2,941) (2,941) (2,941) (3,028) (3,056) (3,082) (3,105) (3,130) (3,152)
Total staff expenditure 77,204 85,958 88,402 90,873 93,521 96,327 98,735 101,203 103,734 106,326 108,985
Permanent full time
Male 29,749 33,528 34,489 35,460 36,524 37,620 38,560 39,524 40,512 41,525 42,563
Female 25,798 29,076 29,842 30,595 31,346 32,286 33,044 33,818 34,609 35,420 36,249
Self-described gender - - - - - - - - - - -
Total 55,547 62,604 64,331 66,055 67,870 69,905 71,604 73,342 75,122 76,945 78,812
Permanent part time
Male 2,953 3,328 3,422 3,525 3,630 3,739 3,833 3,928 4,027 4,127 4,230
Female 15,133 17,055 17,559 18,022 18,563 19,119 19,597 20,087 20,590 21,104 21,632
Self-described gender - - - - - - - - - - -
Total 18,086 20,383 20,981 21,547 22,193 22,859 23,430 24,016 24,616 25,232 25,862

2021-2031 Financial Plan | 29
Note: The actual 2020-21 FTE numbers contain details of staff that were employed by Council as of 30 June 2021 and excludes vacant positions that are currently either being filled by
contract agency staff or in the process of being recruited. Please refer to the Appendix on the detailed movement in FTE numbers between 30 June 2021 and budgeted 2021-22.
Actual
Staff numbers 2020-21 2021-22 2022-23 2023-24 2024-25 2025-26 2026-27 2027-28 2028-29 2029-30 2030-31
FTE FTE FTE FTE FTE FTE FTE FTE FTE FTE FTE
Total staff numbers
Male 274 344 340 340 340 340 340 340 340 340 340
Female 361 436 433 431 431 431 431 431 431 431 431
Self-described gender - - - - - - - - - - -
Casual staff 80 79 79 79 79 79 79 79 79 79 79
Total staff numbers 715 858 851 849 849 849 849 849 849 849 849
Permanent full time
Male 250 306 303 303 303 303 303 303 303 303 303
Female 207 246 243 242 242 242 242 242 242 242 242
Self-described gender - - - - - - - - - - -
Total 457 552 546 545 545 545 545 545 545 545 545
Permanent part time
Male 24 38 37 37 37 37 37 37 37 37 37
Female 154 190 190 189 189 189 189 189 189 189 189
Self-described gender - - - - - - - - - - -
Total 178 227 226 225 225 225 225 225 225 225 225

2021-2031 Financial Plan | 30
Male Female Self-described Total Male Female Self-described Total
$'000 $'000 $'000 $'000 $'000 $'000 $'000 $'000
Chief Executive Officer 413 166 - 579 - - - -
Chief Financial Officer 2,075 5,079 - 7,154 50 450 - 500
Communities 8,995 13,491 - 22,486 2,742 13,674 - 16,416
Business Innovation and Culture 3,450 5,395 - 8,845 234 2,106 - 2,340
Infrastructure and Operations 17,791 3,139 - 20,930 43 166 - 209
Peninsula Leisure Pty Ltd 804 1,806 - 2,610 259 659 - 918
Total permanent staff expenditure 33,528 29,076 - 62,604 3,328 17,055 - 20,383
Casuals, temporary and other expenditure - - - 5,912 - - - -
Capitalised labour costs (2,941)
Total staff 33,528 29,076 - 65,575 3,328 17,055 - 20,383
Department
Permanent Full Time Permanent Part Time

2021-2031 Financial Plan | 31
Planned Human Resource Expenditure
Actual
2020-21 2021-22 2022-23 2023-24 2024-25 2025-26 2026-27 2027-28 2028-29 2029-30 2030-31
$'000 $'000 $'000 $'000 $'000 $'000 $'000 $'000 $'000 $'000 $'000
Permanent - Full time 520 579 599 617 636 655 671 688 705 723 741
Female 149 166 172 177 182 188 192 197 202 207 212
Male 371 413 427 440 453 467 479 491 503 516 528
Total Chief Executive Officer 520 579 599 617 636 655 671 688 705 723 741
Permanent - Full time 6,425 7,154 7,404 7,627 7,855 8,091 8,293 8,501 8,713 8,931 9,154
Female 4,562 5,079 5,257 5,414 5,577 5,744 5,888 6,035 6,186 6,341 6,499
Male 1,864 2,075 2,148 2,212 2,278 2,347 2,405 2,466 2,527 2,590 2,655
Permanent - Part time 449 500 518 533 549 565 580 594 609 624 640
Female 404 450 466 480 494 509 522 535 548 562 576
Male 46 50 52 53 55 57 58 59 61 62 64
Total Chief Financial Officer 6,875 7,654 7,922 8,160 8,404 8,656 8,873 9,095 9,322 9,555 9,794
Permanent - Full time 20,196 22,486 23,107 23,800 24,514 25,250 25,881 26,528 27,191 27,871 28,568
Female 12,117 13,491 13,885 14,302 14,731 15,172 15,552 15,941 16,339 16,748 17,166
Male 8,079 8,995 9,222 9,498 9,784 10,077 10,329 10,587 10,852 11,123 11,402
Permanent - Part time 14,744 16,416 16,972 17,417 17,939 18,477 18,939 19,413 19,898 20,396 20,906
Female 12,281 13,674 14,153 14,513 14,948 15,397 15,782 16,176 16,581 16,995 17,420
Male 2,463 2,742 2,819 2,904 2,991 3,081 3,158 3,236 3,317 3,400 3,485
Total Communities 34,940 38,902 40,079 41,217 42,454 43,727 44,820 45,941 47,089 48,267 49,473
Permanent - Full time 7,944 8,845 9,155 9,376 9,581 9,869 10,115 10,368 10,627 10,893 11,165
Female 4,846 5,395 5,584 5,698 5,793 5,967 6,116 6,269 6,425 6,586 6,751
Male 3,099 3,450 3,571 3,678 3,788 3,902 3,999 4,099 4,202 4,307 4,415
Permanent - Part time 2,102 2,340 2,339 2,409 2,482 2,556 2,620 2,685 2,753 2,821 2,892
Female 1,892 2,106 2,097 2,160 2,225 2,291 2,349 2,407 2,468 2,529 2,592
Male 210 234 242 249 257 265 271 278 285 292 299
Total Business Innovation and Culture 10,046 11,185 11,494 11,785 12,063 12,425 12,735 13,054 13,380 13,714 14,057
Permanent - Full time 18,798 20,930 21,496 22,077 22,739 23,421 24,006 24,607 25,222 25,852 26,499
Female 2,819 3,139 3,194 3,290 3,389 3,490 3,578 3,667 3,759 3,853 3,949
Male 15,979 17,791 18,302 18,787 19,350 19,931 20,429 20,940 21,463 22,000 22,550
Permanent - Part time 188 209 216 223 229 236 242 248 255 261 267
Female 149 166 172 177 182 188 192 197 202 207 212
Male 39 43 45 46 47 49 50 51 52 54 55
Total Infrastructure and Operations 18,986 21,139 21,712 22,300 22,968 23,657 24,249 24,855 25,476 26,113 26,766
Permanent - Full time 2,344 2,610 2,570 2,557 2,545 2,620 2,637 2,651 2,663 2,675 2,686
Female 1,622 1,806 1,750 1,713 1,675 1,724 1,718 1,709 1,698 1,686 1,672
Male 722 804 820 845 870 896 919 941 965 989 1,014
Permanent - Part time 825 918 936 964 993 1,023 1,049 1,075 1,102 1,129 1,158
Female 592 659 672 692 713 735 753 772 791 811 831
Male 232 259 264 272 280 289 296 303 311 319 327
Total Peninsula Leisure Pty Ltd 3,169 3,528 3,507 3,522 3,538 3,644 3,686 3,726 3,765 3,804 3,843
Casuals, temporary and other expenditure 4,976 5,912 6,031 6,212 6,399 6,592 6,757 6,927 7,101 7,280 7,463
Less capital expenditure (2,308) (2,941) (2,941) (2,941) (2,941) (3,028) (3,056) (3,082) (3,105) (3,130) (3,152)
Total staff expenditure 77,204 85,958 88,402 90,873 93,521 96,327 98,735 101,203 103,734 106,326 108,985
Peninsula Leisure Pty Ltd
Infrastructure and Operations
Business Innovation and Culture
Chief Executive Officer
Chief Financial Officer
Communities

2021-2031 Financial Plan | 32
Planned Human Resources - FTEs
2020-21 2021-22 2022-23 2023-24 2024-25 2025-26 2026-27 2027-28 2028-29 2029-30 2030-31
FTE FTE FTE FTE FTE FTE FTE FTE FTE FTE FTE
Chief Executive Officer
Permanent - Full time 2.0 2.0 2.0 2.0 2.0 2.0 2.0 2.0 2.0 2.0 2.0
Female 1.0 1.0 1.0 1.0 1.0 1.0 1.0 1.0 1.0 1.0 1.0
Male 1.0 1.0 1.0 1.0 1.0 1.0 1.0 1.0 1.0 1.0 1.0
Total Chief Executive Officer 2.0 2.0 2.0 2.0 2.0 2.0 2.0 2.0 2.0 2.0 2.0
Chief Financial Officer
Permanent - Full time 47.0 59.0 59.0 59.0 59.0 59.0 59.0 59.0 59.0 59.0 59.0
Female 34.0 42.0 42.0 42.0 42.0 42.0 42.0 42.0 42.0 42.0 42.0
Male 13.0 17.0 17.0 17.0 17.0 17.0 17.0 17.0 17.0 17.0 17.0
Permanent - Part time 6.6 4.8 4.8 4.8 4.8 4.8 4.8 4.8 4.8 4.8 4.8
Female 5.8 4.0 4.0 4.0 4.0 4.0 4.0 4.0 4.0 4.0 4.0
Male 0.8 0.8 0.8 0.8 0.8 0.8 0.8 0.8 0.8 0.8 0.8
Total Chief Financial Officer 53.6 63.8 63.8 63.8 63.8 63.8 63.8 63.8 63.8 63.8 63.8
Communities
Permanent - Full time 154.0 191.0 188.0 188.0 188.0 188.0 188.0 188.0 188.0 188.0 188.0
Female 93.0 113.0 111.0 111.0 111.0 111.0 111.0 111.0 111.0 111.0 111.0
Male 61.0 78.0 77.0 77.0 77.0 77.0 77.0 77.0 77.0 77.0 77.0
Permanent - Part time 135.8 183.7 182.7 181.7 181.7 181.7 181.7 181.7 181.7 181.7 181.7
Female 118.9 153.1 153.1 152.1 152.1 152.1 152.1 152.1 152.1 152.1 152.1
Male 16.9 30.6 29.6 29.6 29.6 29.6 29.6 29.6 29.6 29.6 29.6
Total Communities 289.8 374.7 370.7 369.7 369.7 369.7 369.7 369.7 369.7 369.7 369.7
Business Innovation and Culture
Permanent - Full time 54.0 68.0 68.0 67.0 67.0 67.0 67.0 67.0 67.0 67.0 67.0
Female 35.0 41.0 41.0 40.0 40.0 40.0 40.0 40.0 40.0 40.0 40.0
Male 19.0 27.0 27.0 27.0 27.0 27.0 27.0 27.0 27.0 27.0 27.0
Permanent - Part time 21.2 24.9 24.9 24.9 24.9 24.9 24.9 24.9 24.9 24.9 24.9
Female 18.7 22.4 22.4 22.4 22.4 22.4 22.4 22.4 22.4 22.4 22.4
Male 2.5 2.5 2.5 2.5 2.5 2.5 2.5 2.5 2.5 2.5 2.5
Total Business Innovation and Culture 75.2 92.9 92.9 91.9 91.9 91.9 91.9 91.9 91.9 91.9 91.9
Infrastructure and Operations
Permanent - Full time 174.0 206.0 203.0 203.0 203.0 203.0 203.0 203.0 203.0 203.0 203.0
Female 26.0 31.0 30.0 30.0 30.0 30.0 30.0 30.0 30.0 30.0 30.0
Male 148.0 175.0 173.0 173.0 173.0 173.0 173.0 173.0 173.0 173.0 173.0
Permanent - Part time 2.9 2.1 2.1 2.1 2.1 2.1 2.1 2.1 2.1 2.1 2.1
Female 2.3 1.7 1.7 1.7 1.7 1.7 1.7 1.7 1.7 1.7 1.7
Male 0.6 0.4 0.4 0.4 0.4 0.4 0.4 0.4 0.4 0.4 0.4
Total Infrastructure and Operations 176.9 208.1 205.1 205.1 205.1 205.1 205.1 205.1 205.1 205.1 205.1
Peninsula Leisure Pty Ltd
Permanent - Full time 26 26 26 26 26.0 26.0 26.0 26.0 26.0 26.0 26.0
Female 18.0 18 18 18 18 18.0 18.0 18.0 18.0 18.0 18.0
Male 8.0 8 8 8 8 8.0 8.0 8.0 8.0 8.0 8.0
Permanent - Part time 12 12 12 12 12 11.7 11.7 11.7 11.7 11.7 11.7
Female 8.3 8 8 8 8 8.4 8.4 8.4 8.4 8.4 8.4
Male 3.3 3 3 3 3 3.3 3.3 3.3 3.3 3.3 3.3
Total Peninsula Leisure Pty Ltd 38 38 38 38 38 38 38 38 38 38 38
Casuals 80.1 78.8 78.8 78.8 78.8 78.8 78.8 78.8 78.8 78.8 78.8
Total staff numbers 715.2 858.0 851.0 849.0 849.0 849.0 849.0 849.0 849.0 849.0 849.0

2021-2031 Financial Plan | 33
Borrowing Requirements
The following table highlights Council’s projected loan balance, including new loans and loan repayments for the 10 years of the Financial Plan.
Borrowings are estimated to fund the following major projects:
Actual
2020-21 2021-22 2022-23 2023-24 2024-25 2025-26 2026-27 2027-28 2028-29 2029-30 2030-31
$’000 $’000 $’000 $’000 $’000 $’000 $’000 $’000 $’000 $’000 $’000
Opening balance 27,749 30,334 29,578 35,294 37,367 41,346 33,302 42,220 47,997 43,923 39,898
Plus new loans 2,930 2,750 7,007 3,600 6,430 10,800 13,500 11,500 2,000 2,500 -
Less Principal repayment (345) (3,506) (1,291) (1,527) (2,451) (18,844) (4,582) (5,723) (6,074) (6,525) (6,777)
Closing balance 30,334 29,578 35,294 37,367 41,346 33,302 42,220 47,997 43,923 39,898 33,121
Interest payment 1,455 1,467 1,573 1,583 1,713 1,647 1,621 1,809 1,684 1,563 1,356
Project Title 2021-22 2022-23 2023-24 2024-25 2025-26 2026-27 2027-28 2028-29 2029-30Grand
Total
Kevin Collopy Pavilion Upgrade at Jubilee Park 1,500 1,457 - - - - - - - 2,957
Eric Bell Reserve Pavilion Upgrade 100 2,650 3,500 - - - - - - 6,250
Ballam Park Regional Playspace Upgrade 1,100 1,650 - - - - - - - 2,750
Ballam Park- North East Precinct Improvement 50 1,250 - - - - - - - 1,300
Bruce Park - Pavilion -New - Bruce Park Pavilion - - 100 400 4,000 2,500 - - - 7,000
Langwarrin Child & Family Centre - - - 3,330 - - - - - 3,330
New Seaford Child & Family Centre - - - 560 1,800 - - - - 2,360
Belvedere Community Hub, Kindergarten,
Maternal and Child Health service - - - - - 2,000 - - - 2,000
Basketball & Gymnastics Centre Concept Design - - - 2,140 5,000 - - - - 7,140
Frankston Pines Aquatic Centre Upgrade Concept
Design - - - - - 3,000 5,000 - - 8,000
Kerbside glass bin roll-out - - - - - 2,500 - - - 2,500
Riviera Reserve - Pavilion - New - - - - - 2,500 - - - 2,500
Redevelopment of synthetic hockey facility - - - - - 1,000 5,000 - - 6,000
Langwarrin Equestrian Clubrooms - - - - - - 1,500 - - 1,500
Peninsula Hockey Pavilion - - - - - - - 2,000 - 2,000 Yamala Reserve - Pavilion - Tennis/Bowls - New - - - - - - - - 2,500 2,500
Total estimated borrowings 2,750 7,007 3,600 6,430 10,800 13,500 11,500 2,000 2,500 60,087

2021-2031 Financial Plan | 34
Reserves
Reserve Usage Projections
The table below discloses the balance and annual movement for each reserve over the 10-year life of the Financial Plan.
Actual
ReservesRestricted /
Discretionary2020-21 2021-22 2022-23 2023-24 2024-25 2025-26 2026-27 2027-28 2028-29 2029-30 2030-31
$’000 $’000 $’000 $’000 $’000 $’000 $’000 $’000 $’000 $’000 $’000
Public Resort & Recreation Restricted
7,230 7,639 5,901 3,780 915 3 1,107 1,968 3,646 5,332 7,084
Transfer to reserve 1,766 1,000 1,734 1,785 2,000 2,000 2,000 2,000 2,000 2,000 2,000
Transfer from reserve (1,357) (2,738) (3,855) (4,650) (2,912) (896) (1,139) (322) (314) (248) (166)
Closing balance 7,639 5,901 3,780 915 3 1,107 1,968 3,646 5,332 7,084 8,918
Native Vegetation Restricted
456 339 239 79 79 79 79 79 79 79 79
Transfer to reserve - - - - - - - - - - -
Transfer from reserve (117) (100) (160) - - - - - - - -
Closing balance 339 239 79 79 79 79 79 79 79 79 79
Subdivision Roadworks Restricted
133 133 133 133 133 133 133 133 133 133 133
Transfer to reserve - - - - - - - - - - -
Transfer from reserve - - - - - - - - - - -
Closing balance 133 133 133 133 133 133 133 133 133 133 133
Infrastructure Reserve Restricted
74 74 74 74 74 74 74 74 74 74 74
Transfer to reserve - - - - - - - - - - -
Transfer from reserve - - - - - - - - - - -
Closing balance 74 74 74 74 74 74 74 74 74 74 74
Carparking Restricted
10 10 10 10 10 10 10 10 10 10 10
Transfer to reserve - - - - - - - - - - -
Transfer from reserve - - - - - - - - - - -
Closing balance 10 10 10 10 10 10 10 10 10 10 10
Opening balance
Opening balance
Opening balance
Opening balance
Opening balance

2021-2031 Financial Plan | 35
Actual
ReservesRestricted /
Discretionary2020-21 2021-22 2022-23 2023-24 2024-25 2025-26 2026-27 2027-28 2028-29 2029-30 2030-31
$’000 $’000 $’000 $’000 $’000 $’000 $’000 $’000 $’000 $’000 $’000
Total Restricted Restricted
7,903 8,195 6,357 4,076 1,211 299 1,403 2,264 3,942 5,628 7,380
Transfer to reserve 1,766 1,000 1,734 1,785 2,000 2,000 2,000 2,000 2,000 2,000 2,000
Transfer from reserve (1,474) (2,838) (4,015) (4,650) (2,912) (896) (1,139) (322) (314) (248) (166)
Closing balance 8,195 6,357 4,076 1,211 299 1,403 2,264 3,942 5,628 7,380 9,214
Unexpended Grants Reserve Discretionary
13,220 5,796 5,796 5,796 5,796 5,796 5,796 5,796 5,796 5,796 5,796
Transfer to reserve - - - - - - - - - - -
Transfer from reserve (7,424) - - - - - - - - - -
Closing balance 5,796 5,796 5,796 5,796 5,796 5,796 5,796 5,796 5,796 5,796 5,796
Capital Projects Reserve Discretionary
5,618 4,459 3,363 3,363 1,970 414 414 414 414 414 414
Transfer to reserve 80 - - - - - - - - - -
Transfer from reserve (1,239) (1,096) - (1,393) (1,556) - - - - - -
Closing balance 4,459 3,363 3,363 1,970 414 414 414 414 414 414 414
Strategic Asset Reserve Discretionary
32,776 43,716 31,133 15,140 13,461 19,275 20,439 22,154 23,736 25,744 28,336
Transfer to reserve 15,064 - - 3,029 5,814 1,164 1,715 1,582 2,008 2,592 3,327
Transfer from reserve (4,124) (12,583) (15,993) (4,708) - - - - - - -
Closing balance 43,716 31,133 15,140 13,461 19,275 20,439 22,154 23,736 25,744 28,336 31,663
PARC Asset Management and
Strategic Asset ReserveDiscretionary
12,434 12,765 12,535 12,765 12,995 12,769 13,903 15,075 16,283 17,489 17,679
Transfer to reserve 2,639 750 750 750 750 1,655 1,694 1,730 1,765 750 750
Transfer from reserve (2,308) (980) (520) (520) (976) (521) (522) (522) (559) (560) (560)
Closing balance 12,765 12,535 12,765 12,995 12,769 13,903 15,075 16,283 17,489 17,679 17,869
Resource Efficiency Fund Discretionary
55 74 74 74 74 74 74 74 74 74 74
Transfer to reserve 19 - - - - - - - - - -
Transfer from reserve - - - - - - - - - - -
Closing balance 74 74 74 74 74 74 74 74 74 74 74
Opening balance
Opening balance
Opening balance
Opening balance
Opening balance
Opening balance

2021-2031 Financial Plan | 36
Actual
ReservesRestricted /
Discretionary2020-21 2021-22 2022-23 2023-24 2024-25 2025-26 2026-27 2027-28 2028-29 2029-30 2030-31
$’000 $’000 $’000 $’000 $’000 $’000 $’000 $’000 $’000 $’000 $’000
LGFV (Sinking Fund) Discretionary
12,205 12,205 12,708 13,538 13,917 14,329 - - - - -
Transfer to reserve - 503 830 379 412 1,213 - - - - -
Transfer from reserve - - - - - (15,542) - - - - -
Closing balance 12,205 12,708 13,538 13,917 14,329 - - - - - -
Total Discretionary Discretionary
76,308 79,015 65,609 50,676 48,213 52,657 40,626 43,513 46,303 49,517 52,299
Transfer to reserve 17,802 1,253 1,580 4,158 6,976 4,032 3,409 3,312 3,773 3,342 4,077
Transfer from reserve (15,095) (14,659) (16,513) (6,621) (2,532) (16,063) (522) (522) (559) (560) (560)
Closing balance 79,015 65,609 50,676 48,213 52,657 40,626 43,513 46,303 49,517 52,299 55,816
Reserves SummaryRestricted &
Discretionary2020-21 2021-22 2022-23 2023-24 2024-25 2025-26 2026-27 2027-28 2028-29 2029-30 2030-31
84,211 87,210 71,966 54,752 49,424 52,956 42,029 45,777 50,245 55,145 59,679
Transfer to reserve 19,568 2,253 3,314 5,943 8,976 6,032 5,409 5,312 5,773 5,342 6,077
Transfer from reserve (16,569) (17,497) (20,528) (11,271) (5,444) (16,959) (1,661) (844) (873) (808) (726)
Closing balance 87,210 71,966 54,752 49,424 52,956 42,029 45,777 50,245 55,145 59,679 65,030
Opening balance
Opening balance
Opening balance

2021-2031 Financial Plan | 37
Reserves Strategy
Victorian local government councils have traditionally operated with reserve funds that are amounts of money set aside for specific purposes in later years. In general, these funds do not have bank accounts of their own but are a theoretical split up of the cash surplus that Council has on hand. The following section provides a description of what reserve funds Council holds and their purpose. The current reserve funds utilised by Frankston City Council and the purpose of each reserve are:
Public resort and recreation reserve The public resort and recreation reserve is established to hold funds contributed by developers for works associated with developing improved open space and recreational facilities within Frankston City Council. Funds are contributed in accordance with Section 18 of the Subdivision Act and transfers are restricted to the purpose of creating open space such as parks, playgrounds, pavilions and other such items where it is deemed that these works should occur at a later point than the initial development. Separate locations have been established to record revenues received from developers that are to be applied specifically to undertaking future capital works within these locations. Typical sources of inflows and outflows: Inflows are solely composed of contributions from subdividers in lieu of the 5 per cent Public Open Space requirement. In terms of outflows, Council considers the following position in terms of utilising these funds as stated below:
“That Council maintain an annual balance of $0.3 million in the Public Resort and Recreation Reserve and utilise the remaining funds in delivering capital works in accordance with the Reserve purpose.”
Council has a large amount of undeveloped open space and this Financial Plan has been based on the principle that these funds in this reserve should be utilised for the combined purposes of developing this land for passive recreation and for significant upgrade works within structured recreation. The current financial statements do not include the full expenditure of this reserve fund to the extent noted above. Further reviews are currently being undertaken to provide an accurate assessment of what work can realistically be undertaken in the financial periods over the life of this Financial Plan.
Native vegetation reserve The purpose of this reserve is to enable Council under the native vegetation framework to demonstrate that where there has been a loss of remnant vegetation it has been off set in a location that is sustainable and can be protected into the future. The income and expenditure will occur over different years. Typical sources of inflows and outflows: Inflows will be typically from developments where due to site constraints the remnant vegetation cannot be protected on site and the state requires these to be offset and maintained over a 10 year period. Outflows from this reserve will be in the form of agreed expenditure over the life of this reserve.
Infrastructure reserve The purpose of this reserve is to set aside funding for roads and drains in growth areas. Typical sources of inflows and outflows: Outflows from this reserve will be in the form of agreed projects for roads and drains.
Unexpended grants reserve The purpose of this reserve is to quarantine operating Federal and Victorian government funding relating received in prior periods for work to be carried out in future periods. With the changes in Accounting Standards that came into effect in 2019-20, any unspent grant that is received for a specific purpose is recognised as a liability in the balance sheet and only unspent funding that is not tied to a specific purpose is transferred to the reserve at the end of the year. Typical sources of inflows and outflows: Inflows are solely composed of significant grant funds received prior to 2019-20 and restricted for specific projects or expenditure in future periods. Outflows from this reserve will be transfers back to operations or specific projects as per unexpended grant listing.

2021-2031 Financial Plan | 38
Capital projects The capital projects reserve has been established by Council and represents funding allocated to capital projects that have not been delivered in a prior year. Typical sources of inflows and outflows: Inflows are solely composed of funding allocated to capital projects that have not been delivered in a prior year as the delivery is either delayed or project is not going ahead. Outflows from this reserve will be transfers back to specific projects as per long term infrastructure plan.
Strategic assets The strategic projects reserve has been established by Council with the proceeds to fund works considered by Council to be of a strategic nature. Typical sources of inflows and outflows: Inflow to this reserve will typically be from the sale of Council land and when Council achieves a surplus outcome at the conclusion of financial years and resolves to transfer surplus funds into this reserve. The development of a new Council Plan for 2021-2025 has set 20 strategic priorities for the next four years that will require careful financial planning to see Frankston City reach a vision as the lifestyle capital of Victoria. In order to deliver community infrastructure such as a revitalised City, regional sporting facilities, further development of the Frankston Stations Precinct and re-development of the existing Frankston Arts Centre, a financially sustainable Council must exist. Each of these projects in themselves is extremely significant and involves expenditure in the tens of millions. At the same point, Council must maintain its existing assets and meet the asset renewal challenges, continue to provide a strong suite of operational services to its residents and provide for the ongoing capital development of Council across a broad range of items in addition to the major priorities mentioned above. In the future, outflows are anticipated to be for the funding of major capital works projects or where Council is required to source major funding where there is no option but to utilise cash reserves.
Resource efficiency The purpose of this reserve is to provide Council with an opportunity to set aside funds and highlight the benefit of energy conservation measures to save money and achieve Council’s greenhouse reduction goals. Typical sources of inflows and outflows: Inflows to this reserve are the annual expected savings from energy reduction projects. Outflows from this reserve will be the reinvestment in future years for further works to minimise energy consumption. Whilst the Financial Plan presently does not show any outflows, this is simply due to uncertainty in respect of when they are likely to arise and it is expected the reserve will be accessed over the life of this plan.
Local Government Funding Vehicle (sinking fund) The purpose of this reserve is to partly provide for the principal repayments required on maturity of the interest-only Local Government Funding Vehicle (LGFV) and to provide future borrowing capacity for major infrastructure projects. Typical sources of inflows and outflows: Inflows will comprise savings derived from annual loan repayments and interest savings compared to the original budget provision of these items. Inflows will also include ‘transfers in’ required to fund debt redemption commitments (interest expense and principal repayments).
PARC asset management This reserve has been established to provide a source of funding for the portion of the PARC asset management plan that Council is responsible for. Typical sources of inflows and outflows: Inflows are composed of funding that is transferred annually from the accumulated surplus to cover the expenditure contained in the PARC asset management plan. Outflows from this reserve will be transfers back to operations or specific projects as may be determined by Council and PARC.

2021-2031 Financial Plan | 39
Other reserves These reserves have been established to provide a source of funding for car parking and subdivisional works. Typical sources of inflows and outflows: Inflows are composed of funding for car parking and subdivisional works. Outflows from this reserve will be transfers back to operations or specific projects as may be determined by Council.

2021-2031 Financial Plan | 40
Measuring our performance We measure our performance against our Financial Policy Statements, the Local Government Performance Reporting Framework (LGPRF) and the Victorian Auditor General
Office (VAGO) assessment of financial sustainability indicators.
Financial Policy Statements
This section models the key results relating to the Financial Policy statements explained earlier on page 13. These measures demonstrates Council's financial sustainability to fund the aspirations of the Community Vision and the Council Plan. Below are the key measures that we use to ensure that Council is financially sustainable in to the future.
Guide to risk of not achieving financial sustainability: Low Risk Medium Risk High Risk
Actual
Policy Statement Measure 2020-21 2021-22 2022-23 2023-24 2024-25 2025-26 2026-27 2027-28 2028-29 2029-30 2030-31
Consistent underlying surplus result
Adjusted underlying result / adjusted underlying
revenue greater than 2.5% >2.5% (0.6%)*
0.3% 1.6% 1.9% 2.0% 1.9% 2.1% 2.4% 2.9% 3.2% 3.7%
Ensure Council maintains sufficient working capital
to meet its debt obligations as they fall due
Current Assets / Current Liabilities greater than
1.1 >1.1 2.2 2.5 2.0 1.9 1.4 1.6 1.7 1.7 1.8 1.8 1.9
Ensures that Council could repay long term
obligations from the income it generates internally
Non-current liabilities / own source revenue to
remain below 60% <60% 19% 18% 20% 20% 14% 17% 20% 22% 19% 17% 14%
Ensures that Council could repay its borrowing
commitment from the rate income and growth in the
Municipality
Interest and principal repayments on interest
bearing loans and borrowings / rate revenue
below 10% <10% 1.4% 3.7% 2.1% 2.2% 2.8% 13.5%*
4.0% 4.7% 4.7% 4.8% 4.7%
Ensures that Council could repay its interest
commitment from the rate income and growth in the
Municipality Interest payments / rate revenue below 5% <5% 1.1% 1.1% 1.1% 1.1% 1.2% 1.1% 1.0% 1.1% 1.0% 0.9% 0.8%
That Councils applies loan funding to new capital and
maintain total borrowing in line with rate income and
growth of the municipality Total Indebtedness / rate revenue <60% 23% 22% 25% 26% 28% 22% 27% 30% 27% 24% 19%
Council maintains sufficient restricted cash to ensure
ongoing liquidity as well as to address unforeseen
cash imposts if required
Unrestricted cash / current liabilities to be
maintained above 20% >20% 69% 91% 60% 62% 52% 41% 44% 47% 51% 55% 60%
Allocate adequate funds towards renewal capital in
order to replace assets and infrastructure as they
reach the end of their service life
Asset renewal and upgrade expenses /
depreciation above 100% >100% 89% 132% 196% 133% 94% 103% 104% 118% 88% 88% 83%
Ta
rge
t
* The negative result for the adjusted underlying result relates to the impact caused by Covid-19 and the investment in the Future Ready Frankston Program, where benefits will flow through in later years. The 13.7% adverse result in interest and principal repayments relate to the repayment of the low interest bearing loan of $15 million that Council obtained from the Local Government funding vehicle. Money to pay off this loan has been transferred to a reserve each year, and the debt will be redeemed from the reserve instead of general cash reserves. Detailed explanation of the results of these indicators and other key performance indicators are in the section on Measuring our Performance.

2021-2031 Financial Plan | 41
LGPRF indicators
Key to Forecast Trend:
Forecasts improvement in Council's financial performance/financial position indicator
Forecasts that Council's financial performance/financial position indicator will be steady
Forecasts deterioration in Council's financial performance/financial position indicator
Actual Trend
Indicator Measure 2020-21 2021-22 2022-23 2023-24 2024-25 2025-26 2026-27 2027-28 2028-29 2029-30 2030-31
Operating positionAdjusted underlying result Adjusted underlying surplus (deficit) /
Adjusted underlying revenue (0.6%) 0.3% 1.6% 1.9% 2.0% 1.9% 2.1% 2.4% 2.9% 3.2% 3.7%
LiquidityWorking capital Current assets / current liabilities 223.7% 253.2% 204.0% 185.0% 141.7% 163.8% 165.2% 168.6% 176.0% 183.9% 193.5%
Unrestricted cash Unrestricted cash/ current liabilities 69.4% 90.8% 60.2% 62.0% 51.9% 41.0% 44.1% 46.8% 51.1% 54.7% 59.7%
ObligationsLoans and borrowings Interest bearing loans and borrowings /
rate revenue 23.0% 21.9% 25.4% 26.2% 28.1% 22.0% 27.2% 30.0% 26.7% 23.7% 19.1%
Loans and borrowings repayments Interest and principal repayments on
interest bearing loans and borrowings /
rate revenue 1.4% 3.7% 2.1% 2.2% 2.8% 13.5% 4.0% 4.7% 4.7% 4.8% 4.7%
Indebtedness Non-current liabilities / own source
revenue 19.0% 17.9% 20.1% 20.5% 13.8% 17.1% 20.4% 22.0% 19.4% 17.1% 13.8%
Asset renewal and upgrade Asset renewal and upgrade expenses /
depreciation 88.9% 132.4% 196.0% 133.2% 93.7% 103.4% 104.1% 117.7% 87.7% 88.4% 82.6%
StabilityRates concentration Rate revenue / adjusted underlying
revenue 73.7% 69.4% 69.3% 69.4% 69.5% 69.8% 70.1% 70.2% 70.3% 70.5% 70.7%
Rates effort Rate revenue / CIV of rateable properties
in the municipality 0.3% 0.3% 0.3% 0.3% 0.4% 0.4% 0.4% 0.4% 0.4% 0.4% 0.4%
EfficiencyExpenditure level Total expenses / No. of property
assessments $2,796 $3,036 $3,060 $3,104 $3,155 $3,204 $3,240 $3,284 $3,316 $3,350 $3,380
Rate revenue level Rate revenue / No. of property
assessments $1,604 $1,645 $1,678 $1,708 $1,737 $1,766 $1,794 $1,822 $1,849 $1,875 $1,902
Sustainability capacity indicatorsOwn-source revenue per head of
municipal population
Own-source revenue / Municipal
population $1,072 $1,198 $1,221 $1,243 $1,265 $1,285 $1,303 $1,326 $1,346 $1,365 $1,386
Recurrent grants per head of
municipal population Recurrent grants / Municipal population $136 $135 $135 $134 $134 $134 $134 $134 $133 $133 $133
Expenses per head of municipal
population Total expenses / Municipal population $1,245 $1,336 $1,346 $1,364 $1,385 $1,405 $1,419 $1,437 $1,450 $1,463 $1,475
Infrastructure per head of municipal
population
Value of infrastructure / Municipal
population $6,550 $6,647 $6,831 $6,885 $6,908 $6,966 $7,037 $7,079 $6,996 $6,896 $6,775

2021-2031 Financial Plan | 42
-1.0%
0.0%
1.0%
2.0%
3.0%
4.0%
Adjusted underlying result
Net result margin (%) Target
-
0.5
1.0
1.5
2.0
2.5
3.0
Working capital
Working Capital Target
This measures Council’s ability to generate a surplus in the ordinary course of business, and excludes external funding received for capital works projects. The negative result in 2020-21 of the plan is due to the financial impact caused by Covid-19 and the investment in the Future Ready Frankston Program, where benefits will flow through in later years. This indicator improves with the cost efficiencies that Council has projected in the future years.
This indicator measures Council’s ability to pay existing liabilities in the next 12 months. Although Council’s working capital ratio is above the target over the next ten years, it trends downwards in the medium term of the Financial Plan due to the additional borrowings of $60.8 million factored in. The indicator improves in the longer term due to repayments of borrowings and the recurrent efficiencies that will be achieved from the Future Ready Frankston Program.
This measures Council’s ability to pay existing liabilities in the next 12 months using cash reserves that are not restricted like trust funds and statutory reserves. Basically it assesses the ability that Council has to pay its bills on time without utilising cash that are held to fund specific activities. Other Financial assets which include term deposits over 90 days are not considered as unrestricted cash in this indicator. Again although, the ratio is above the target over ten years, it is trending downwards in the medium term and improves in the longer term similar to the working capital ratio.

2021-2031 Financial Plan | 43
This measures Council’s ability to pay its long
term obligations with the revenue it generates
internally (i.e. excludes external grants and
contributions). Council is well below the target
KPI of 60 per cent and the level of long term
obligations can easily be met without relying on
external funding sources to repay its debt
commitments.
This measures Council’s ability to pay its interest bearing loan obligations with the rate revenue it generates. Council is well below the target KPI of 60 per cent for this indicator and has the ability to borrow to fund major capital works projects in the future.
This measures Council’s ability to pay its debt obligations with the rate revenue it generates. Council is well below the target KPI of 10 per cent for this indicator (except in 2025-26) which means that Councils can pay its loan repayments and interest from rates instead of looking at alternative funding streams. The one off expenditure in 2025-26 is the repayment of the low interest bearing loan of $15 million that Council obtained from the Local Government funding vehicle. Money to pay off this loan has been transferred to a reserve each year, and the debt will be redeemed from the reserve instead of general cash reserves. Please refer to the Reserves Strategy section for more information.

2021-2031 Financial Plan | 44
This measures the renewal and upgrade expenditure that Council incurs on its existing asset base compared to depreciation expense. This assesses whether Council’s assets are being renewed or upgraded as planned and compares the rate of spending on existing assets through renewing, restoring, replacing or upgrading existing assets with depreciation expense. A measure above 100 per cent indicates that there is less risk of insufficient spending on Council’s existing asset base. Council’s spending on renewal is based on its asset renewal and asset management strategy. Council maintains a healthy ratio in most of the years with the measure dipping slightly in a few years of the Financial Plan. Council has focussed on bringing down its asset renewal backlog with consistent expenditure incurred on renewal over the years. The backlog has been reduced to a manageable level of approximately $8.8 million by the end of 2020 and plans to reduce the gap further over the life of the Financial Plan.
This indicator assesses whether Council can generate revenue from a range of sources, excluding grants and contributions received for capital works to fund services and activities. A low percentage indicates that Council is not entirely reliant on rate income to fund services. This indicator is fairly stable over the ten years averaging around 70 per cent which is not too dissimilar to other metropolitan Councils providing similar services and receiving lower grant funding from State and Federal Governments.
This indicator assesses whether Councils set rates at an appropriate level. A lower ratio indicates a reduced burden to the community. This indicator is fairly stable over the life of the Financial Plan with Council estimating that future rate caps will be limited to 2 per cent and that Council will deliver existing services by meeting the rate cap.

2021-2031 Financial Plan | 45
This indicator assesses whether resources are being used efficiently to deliver services. Council’s performance of this indicator over the ten years is fairly static. Council is committed to targeting service delivery based on the needs of the community and is confident that the Future Ready Frankston program and the newly developed service delivery methodology will bring in more efficiencies in the future.
This indicator assesses whether resources are being used efficiently to deliver services. Council’s estimated rate revenue increase is tied to the rate cap which is estimated at 2 per cent over the life of the plan. Council is committed to keeping rates as low as possible whilst continuing to deliver high quality services that are valued by the community.

2021-2031 Financial Plan | 46
Victorian Auditor General Office indicators
Guide to risk of not achieving financial sustainability: Low Risk Medium Risk High Risk
Actual
Indicator Measure 2020-21 2021-22 2022-23 2023-24 2024-25 2025-26 2026-27 2027-28 2028-29 2029-30 2030-31
Net Result Margin (%) Net result / Total revenue 4.7% 9.3% 10.4% 8.4% 8.2% 8.0% 8.1% 7.8% 3.8% 3.9% 4.1%
Adjusted underlying result (%)
Adjusted underlying surplus (deficit) /
Adjusted underlying revenue (0.6%) 0.3% 1.6% 1.9% 2.0% 1.9% 2.1% 2.4% 2.9% 3.2% 3.7%Liquidity (ratio) Current assets / Current liabilities 2.2 2.5 2.0 1.9 1.4 1.6 1.7 1.7 1.8 1.8 1.9
Internal financing (%)
Net operating cash flow / Net capital
expenditure 120.2% 58.7% 72.2% 95.9% 100.5% 95.8% 92.8% 99.1% 123.7% 121.4% 131.1%
Indebtedness (%)
Non-current liabilities / Own-sourced
revenue 19.0% 17.9% 20.1% 20.5% 13.8% 17.1% 20.4% 22.0% 19.4% 17.1% 13.8%
Capital replacement (ratio)
Cash outflows for the addition of new
infrastructure, property, plant and
equipment / Depreciation 1.5 2.1 2.4 1.7 1.5 1.6 1.6 1.5 1.0 1.0 0.9
Renewal gap (ratio)
Renewal and upgrade expenditure /
Depreciation 0.9 1.3 2.0 1.3 0.9 1.0 1.0 1.2 0.9 0.9 0.8
Ovearall assessment Long term financial sustainability - Low risk

2021-2031 Financial Plan | 47
This is a basic measure that a positive result indicates a surplus, and the larger the percentage the stronger the result. A negative result indicates that insufficient revenue is generated to fund operations and asset renewal. Council has budgeted to have surpluses in all ten years of the Financial Plan and is well above the 0 per cent that VAGO uses as a low risk assessment.
This measures Council’s ability to generate a surplus in the ordinary course of business and similar to the LGPRF indicator on adjusted underlying surplus, excludes non-recurrent capital grants, non-monetary asset contributions, and other contributions to fund capital expenditure from the net result. Council is of the opinion that the result of 5 per cent that VAGO uses as an indication of a low risk assessment is too high. In a rate capping environment, where Council does not have much control over rate increases and is committed to keeping fees for Council controlled events and services as low as possible to reduce burden to the community whilst, continuing to deliver existing services. . The negative result in 2020-21 of the plan is due to the financial impact of Covid-19 and the investment in the Future Ready Frankston Program, where benefits will flow through in later years. This indicator improves with the cost efficiencies that Council has projected in the future years.
This indicator measures Council’s ability to pay existing liabilities in the next 12 months. A ratio greater than one means that there are more cash and liquid assets than short-term liabilities. Although Council’s liquidity ratio is above the target over the next ten years, , it trends downwards in the medium term of the Financial Plan due to the additional borrowings of $60.8 million factored in. The indicator improves in the longer term due to repayments of borrowings and the recurrent efficiencies that will be achieved from the Future Ready Frankston Program.
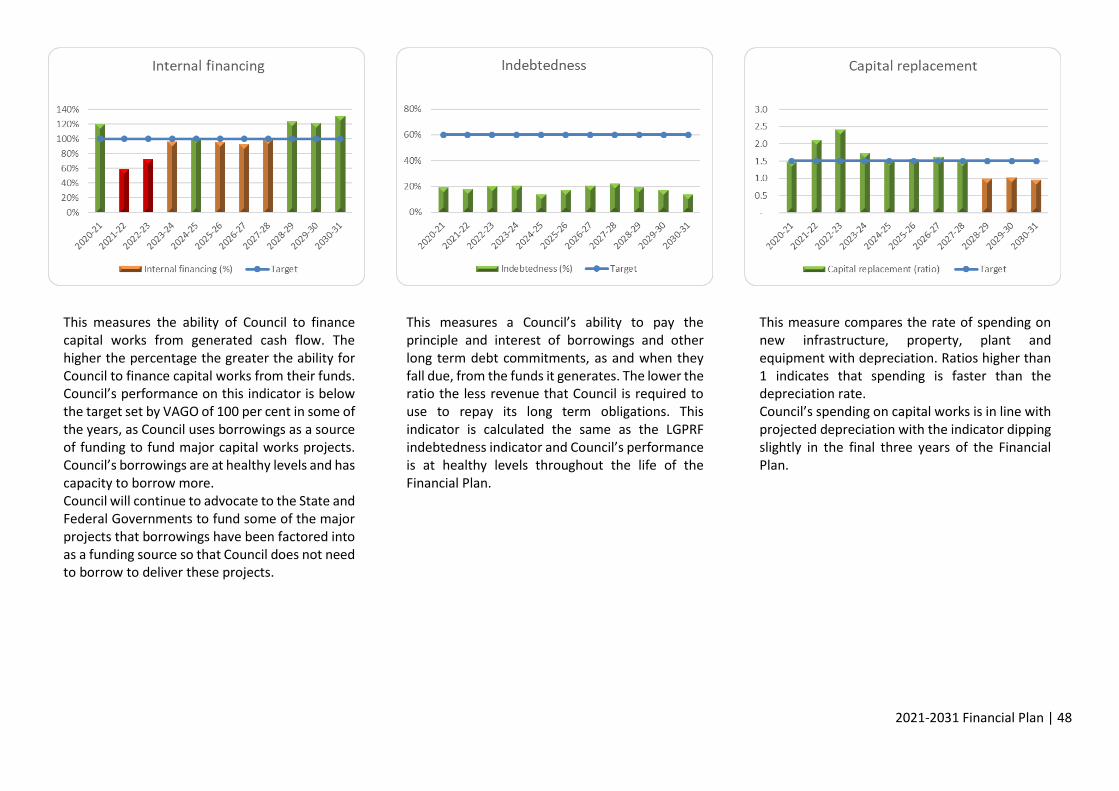
2021-2031 Financial Plan | 48
This measures the ability of Council to finance capital works from generated cash flow. The higher the percentage the greater the ability for Council to finance capital works from their funds. Council’s performance on this indicator is below the target set by VAGO of 100 per cent in some of the years, as Council uses borrowings as a source of funding to fund major capital works projects. Council’s borrowings are at healthy levels and has capacity to borrow more. Council will continue to advocate to the State and Federal Governments to fund some of the major projects that borrowings have been factored into as a funding source so that Council does not need to borrow to deliver these projects.
This measures a Council’s ability to pay the principle and interest of borrowings and other long term debt commitments, as and when they fall due, from the funds it generates. The lower the ratio the less revenue that Council is required to use to repay its long term obligations. This indicator is calculated the same as the LGPRF indebtedness indicator and Council’s performance is at healthy levels throughout the life of the Financial Plan.
This measure compares the rate of spending on new infrastructure, property, plant and equipment with depreciation. Ratios higher than 1 indicates that spending is faster than the depreciation rate. Council’s spending on capital works is in line with projected depreciation with the indicator dipping slightly in the final three years of the Financial Plan.

2021-2031 Financial Plan | 49
This compares the rate of spending on existing assets through renewing, restoring, and replacing existing assets with depreciation. Council maintains a healthy ratio in most of the years with the measure dipping slightly in a few years of the Financial Plan.

2021-2031 Financial Plan | 50
APPENDIX
Assumptions to the Financial Plan statements This section presents information regarding the assumptions to the Comprehensive Income Statement for the 10 years from 2021-22 to 2030-31. The assumptions comprise the annual escalations / movement for each line item of the Comprehensive Income Statement. Following each statement are notes of the assumptions specifically applied to produce the long-term outlook. The notes are referenced in the financial statements. A commentary is also provided on the information relayed by the statements and what they mean for Frankston City Council. In a more global sense however, it is worthwhile detailing the approach to the modelling process as broad percentages have not been universally applied. Certain accounts were coded for manual adjustment rather than broad percentage increases (e.g. non recurrent grant income, contributions and election income). It is therefore not possible to simply multiply the previous year’s base by a percentage and achieve the same outcomes as presented. The table below highlights the broader parameters used in the calculation of this Financial Plan. These parameters are discussed in more detail below:

2021-2031 Financial Plan | 51
Rates and charges and growth Base rate revenue will increase by 1.5 per cent for the 2021-22 year, based on the state government rate cap, and with estimated annual increase of 1.75 per cent based on State Government estimate of CPI for 2022-23 and 2 per cent per annum for the ensuing years thereafter of the Financial Plan. In addition, it is expected that over the life of the plan, a further increase of 1 per cent per annum will be received for growth (additional properties) as a result of supplementary rates. Council’s general waste charges have increased by 5.6 per cent compared to 2020-21, due to the increased service cost resulting from the pressures impacting the recycling industry. The industry continues to be challenged by the contamination standards required by the international markets using recycled products. Recycling processors have progressed with installing infrastructure with funding from the increased recycling charges to lower the contamination and improve the quality of recycled products for reuse.
Council has allowed for a blanket hard waste collection for the term of the Financial Plan and will retain an “at call” service for the convenience of residents and ratepayers. The Frankston Regional Resource and Recycling Centre provides residents with an “all year round” facility for the disposal of hard and other waste. The costs of green waste services have not increased compared to 2020-21. Future years’ waste charges are estimated to increase in line with cost escalations of 2.5 per cent to ensure Council continues to recover the full costs of providing waste services. For further information please refer to Council’s adopted 2021-2025 Revenue and Rating Plan. Statutory fees and fines Victorian Government statutory fees are set by legislation and are frequently not indexed on an annual basis. An estimated increase of 2.00 per cent has been allowed for statutory fee income.
Escalation Factors % movement 2021-22 2022-23 2023-24 2024-25 2025-26 2026-27 2027-28 2028-29 2029-30 2030-31
CPI 1.50% 1.75% 2.00% 2.00% 2.00% 2.00% 2.00% 2.00% 2.00% 2.00%
Growth 1.00% 1.00% 1.00% 1.00% 1.00% 1.00% 1.00% 1.00% 1.00% 1.00%
Rate Revenue Cap 1.50% 1.75% 2.00% 2.00% 2.00% 2.00% 2.00% 2.00% 2.00% 2.00%
Fees and Charges - Statutory 2.00% 2.00% 2.00% 2.00% 2.00% 2.00% 2.00% 2.00% 2.00% 2.00%
Fees and Charges - Council 2.75% 2.75% 2.75% 2.75% 2.75% 2.75% 2.75% 2.75% 2.75% 2.75%
Grants - Operating 1.00% 1.00% 1.00% 1.00% 1.00% 1.00% 1.00% 1.00% 1.00% 1.00%
Grants - Capital Based on committed funding
Contributions - monetory Based on committed funding
Contributions - non-monetory 0.00% 0.00% 0.00% 0.00% 0.00% 0.00% 0.00% 0.00% 0.00% 0.00%
Other Income 2.00% 2.00% 2.00% 2.00% 2.00% 2.00% 2.00% 2.00% 2.00% 2.00%
Employee costs 3.50% 3.50% 3.00% 3.00% 3.00% 2.50% 2.50% 2.50% 2.50% 2.50%
Materials and Services - General 2.00% 2.00% 2.00% 2.00% 2.00% 2.00% 2.00% 2.00% 2.00% 2.00%
Gas 5.00% 5.00% 5.00% 5.00% 5.00% 5.00% 5.00% 5.00% 5.00% 5.00%
Water 5.00% 5.00% 5.00% 5.00% 5.00% 5.00% 5.00% 5.00% 5.00% 5.00%
Electricity 5.00% 5.00% 5.00% 5.00% 5.00% 5.00% 5.00% 5.00% 5.00% 5.00%
Insurance 3.80% 3.80% 3.80% 3.80% 3.80% 3.80% 3.80% 3.80% 3.80% 3.80%
Depreciation and Amortisation Based on level of capital expenditure
Other expenses 2.75% 2.75% 2.75% 2.75% 2.75% 2.75% 2.75% 2.75% 2.75% 2.75%

2021-2031 Financial Plan | 52
User fees Council has reviewed fees in detail to determine accepted pricing principles and set levels that fully recover the cost of providing the service, unless the overriding policy is in favour of subsidisation. In addition, considerations of community factors are required such as encouraging use of a service and ability to pay. Therefore fees have been adjusted based on this methodology rather than a blanket increase. Council will continue to seek opportunities to maximise revenue from fees and charges through a thorough review across the organisation to ensure that ‘Best Value’ principles including service cost and quality standards, value for money are balanced with the affordability and accessibility of these services. Grants Council currently receives grants for tied (specific purpose grants) and un-tied Financial Assistance grant funding received via the Victorian Local Government Grants Commission (VLGGC). Operational Grants and subsidies have been budgeted with a conservative economic outlook at 1 per cent. This low increase in grant revenue is to manage cost-shifting that is likely to occur on an annual basis with grants seldom increasing at an equivalent rate to the cost of providing the subsidised services. Capital grants have been forecast in conjunction with the estimates provided on specific capital projects. Currently there is only one type of capital grant that Council is able to forecast with some certainty over the life of the Financial Plan. That grant is from the Commonwealth Government under the Roads to Recovery Program towards local roads. The current Roads to Recovery Program commenced on 1 July 2019 and ends on 30 June 2024. Certain conditions must be followed and annual reports must be submitted. It is assumed that the program will continue over the life of the Financial Plan. Contributions Council receives monetary contributions mainly from developers. These contributions represent funds to enable council to provide the necessary infrastructure and infrastructure improvements to accommodate
development growth. The contributions are for specific purposes and often require Council to outlay funds for infrastructure works often before receipt of this income source. Contributions received from developers are statutory contributions and are transferred to a restricted reserve until utilised for a specific purpose through the capital works program or delivered as works in kind by developers. Council also receives minor contributions from various sporting clubs towards various projects in the capital works program. Other income Interest on investments comprises of interest earned from cash invested with financial institutions, interest charge to ratepayers for rates in arrears and interest received on special charge income. Also included under this heading is income received from recoveries of infringements (formerly Perin Court) costs (relating to parking infringements) and recoveries from State Revenue Office of valuation costs. Employee costs Enterprise Bargaining Agreement No.9 (EBA9) will expire on 1 July 2023. This Financial Plan has been developed based on subsequent increases being linked to the rate cap and a further 0.50 per cent to account for banding increments. Superannuation guarantee charge increases were announced as part of the 2014 Federal Budget and this Financial Plan assumes that superannuation will increase progressively from 9.5 per cent in 2019-2020 to 12.0 per cent by 2025-26. The cost of provision of Council services is very heavily based on labour costs which account for approximately 45 per cent of total operational spending. Materials and services Material costs include items required for the maintenance and repairs of Council buildings, roads, drains and footpaths which are more governed by market forces based on availability than CPI. Other associated costs included under this category are utilities, materials for the supply of meals on wheels and consumable items for a range of services.

2021-2031 Financial Plan | 53
Council also utilises external expertise on a range of matters, including legal services and audit. Council has significant ongoing contracts for delivery of services such as waste management and maintenance of parks and gardens. Council also engages contractors for building maintenance and general valuations. All these contracts are negotiated at near CPI levels as far as possible. General materials and services excluding utility costs are expected to increase by 2 per cent in line with CPI. Outside of the broad parameters, there have been a number of manually assessed items in this area, including election expenses, valuation contract amounts, insurance costs and waste costs. Electricity and Gas market expectations indicate a stable increase of 5 per cent over the term of the Financial Plan. These costs will be closely monitored. Water costs have stabilised compared to previous years and have been estimated to increase by 5.00 per cent over the term of this Financial Plan. These costs will be closely monitored. Bad and doubtful debts Bad and doubtful debts are expected to increase marginally over the life of the Financial Plan and primarily relates to parking fines forwarded to the Infringement Court (formerly Perin Court) for collection and a consequent reduction in collection rates. Council has improved its debt management processes to ensure that collection is timely. Depreciation and amortisation Depreciation estimates have been based on the projected capital spending contained within this Financial Plan and projected depreciation of existing assets. Borrowing costs Borrowing costs comprise the interest expense to service Council's loan portfolio. Details on borrowings are covered in greater detail on the section on Borrowing Strategy.
Other expenses Other expenses include administration costs such as Councillor allowances, election costs, sponsorships, partnerships, community grants, lease expenditure, fire services property levy, audit costs and other costs associated with the day to day running of Council.

2021-2031 Financial Plan | 54
Explanation of the movement in FTEs
and increase in staff costs Council is required to follow the prescribed formatting of Local Government Victoria’s model financial plan, which compares the forecast position of the current financial year (Actual 2020-21) to the budget. The actual FTEs include only information of staff that were employed by Council as at 30 June 2021 and excludes vacant positions. The budget has been set based on a full establishment, which includes vacant positions. The budget also excludes temporary work arrangements of staff where they salary sacrifice for additional leave. The following table explains the reasons for the difference in staff FTEs between actual numbers and the budget.
2020-21
(Actual)
2021-22
(Budget)
Increase /
(decrease)
FCC
Permanent staff 597.5 741.5 144.0
Casual staff 65.4 - -65.4
662.9 741.5 78.6
Peninsula Leisure
Permeant staff 38.0 38.0 0.0
Casual staff 14.71 78.8 64.1
52.71 116.8 64.1
Total 715.6 858.3 142.7
Variance due to:
Vacant FTEs 75.1
Change due to temporary work arrangements
where staff have reduced the actual hours
worked 3.6
Reduction in casual staff employed at
Peninsula Leisure due to Covid-19 pandemic 64.1
142.7

2021-2031 Financial Plan | 55
Definitions
Act Local Government Act 2020
Accounting Standards
Australian accounting standards are set by the Australian Accounting Standards Board (AASB) and have the force of law for Corporations law entities under S 296 of the Corporations Act 2001. They must also be applied to all other general purpose financial reports of reporting entities in the public and private sectors.
Advocacy Work done by Council on behalf of community to access and secure government funding – State and Federal – to deliver infrastructure, facilities and services that are beyond Council’s responsibility to fund.
Annual report Report prepared by Council under sections 98-100 of the Act. The annual report to the community contains a report of operations and audited financial and performance statements.
Asset expansion expenditure
Expenditure that extends the capacity of an existing asset to provide benefits to new users at the same standard as is provided to beneficiaries.
Asset renewal expenditure
Expenditure on an existing asset or on replacing and existing asset that returns the service capability of the asset to its original capability.
Asset upgrade expenditure
Expenditure that:
(a) enhances an existing asset to provide a higher level of service; or
(b) Increases the life of the asset beyond its original life.
Balance sheet Shows the expected net current asset, net non-current asset and net asset positions in the forthcoming year compared to the forecast actual in the current year. The balance sheet should be prepared in accordance with the requirements of AASB101 Presentation of Financial Statements and the Local Government Model Financial Report.
Borrowing strategy The process by which the Council's current external funding requirements can be identified, managed and future requirements monitored.
Budget Plan under Section 94 of the Act setting out the services and initiatives to be funded for the financial year and how they will contribute to achieving the strategic objectives specified in the Council Plan.
Business Continuity Plans
Outlines procedures and instructions Council must follow in the face of disaster, whether fire, flood or cyberattack, so Council can continue to function with as little disruption as possible.
Capital expenditure Capital expenditure is relatively large (material) expenditure that produces economic benefits expected to last for more than 12 months. A pre-determined 'threshold' may be used which indicates the level of expenditure deemed to be material in accordance with Council's policy. Capital expenditure includes renewal, expansion and upgrade. Where capital projects involve a combination of renewal, expansion and upgrade expenditures, the total project cost needs to be allocated accordingly.
Capital Improved Value (CIV)
The value of the land plus buildings on it and any other substantial improvements made to the property.
Capital works program
Regulation 10 requires that the budget contains a detailed list of capital works expenditure and sets out how that information is to be disclosed by reference to asset categories, asset expenditure type and funding sources.
Carry forward capital works
Carry forward capital works are those that are incomplete in the current budget year and will be completed in the following budget year.
Community Engagement
Seeking feedback from the local community on decisions that interests and / or impacts them

2021-2031 Financial Plan | 56
Comprehensive income statement
Shows the expected operating result in the forthcoming years and should be prepared in accordance with the requirements of AASB101 Presentation of Financial Statements and the Local Government Model Financial Report.
Council Plan A plan setting out the medium-term strategic objectives, strategies, strategic indicators and aspirations of the community in the next four years and prepared in accordance with Section 90 of the Act.
Deliberative Community Engagement
An approach which encourages community members to critically test, weigh up and consider a range of information, perspectives, inputs and evidence to reach a consensus or make recommendations to Council.
Discretionary reserves
Discretionary reserves are funds earmarked by Council for various purposes.
Enterprise Bargaining Agreement
A form of collective bargaining, in which wages and working conditions are negotiated between Council and the employee trade union acting on behalf of employees. Once established, they are legally binding on employers and employees that are covered by the Enterprise bargaining agreement.
External influences in the preparation of a budget
Matters arising from third party actions over which Council has little or no control e.g. Change in legislation.
Financial risk Potential for finance loss from transactions and uncertainty about its extent
Financial Statements
Sections 91 of the Act and Section 5 of the Local Government (Planning and Reporting) Regulations 2020, require the following statements to be included in the Financial Plan. These statements are jointly referred to as financial statements
- Comprehensive Income Statement
- Balance Sheet
- Statement of Changes in Equity
- Statement of Cash Flows
- Statement of Capital Works
The financial statements must be in the form set out in the Local Government Model Financial Plan.
Financial sustainability
Ability to serve community by achieving Council’s vision and strategic objectives and maintain resources over time.
Financing activities Those activities which relate to changing the size and composition of the financial structure of the entity, including equity and borrowings not falling within the definition of cash.
Internal influences in the preparation of the budget
Matters arising from Council actions over which there is some element of control (e.g. approval of unbudgeted capital expenditure).
Investing activities Those activities which relate to acquisition and disposal of non-current assets, including property, plant and equipment and other productive assets, and investments not falling within the definition of cash.
Key assumptions When preparing a balance sheet of financial position, key assumptions upon which the statement has been based should be disclosed in the budget to assist the reader when comparing movements in assets, liabilities and equity between budget years.
Legislative framework
The Act, Regulations and other laws and statutes which set a Council's governance, planning and reporting requirements.
Local Government (Planning and Reporting) Regulations 2020
Regulations, made under S.325 of the Local Government Act 2020. prescribe:
(a) The content and preparation of the financial statements of a Council
(b) the performance indicators and measures to be included in the budget, revised budget and annual report of a Council
(c) The information to be included in a Financial Plan, budget, revised budget and annual report
(d) Other matters required to be prescribed under Part 4 of the Act.

2021-2031 Financial Plan | 57
Local Government Performance Reporting Framework (LGPRF)
This is a mandatory system of performance reporting for all Victorian councils. It ensures that councils are measuring and reporting on their performance in a consistent way to promote transparency and accountability in the local government sector.
The framework is made up of a range of measures, including roads, planning, animal management and waste. It is complemented by a Governance and Management checklist of 24 items, which shows the policies, plans and procedures in place at each council. Together, they build a comprehensive picture of council performance which can be viewed on the Know Your Council website.
Local Government Community Satisfaction survey
This is a state-wide telephone survey which collects direct feedback from the community about councils.
It covers:
•council's overall performance
•community consultation and engagement
•customer service
•overall council direction
The survey is conducted by the Department of Jobs, Precincts and Regions on behalf of participating councils. A minimum of 400 local residents and ratepayers in each municipality over 18 years of age are selected at random.
Local Government Model Financial Report
Local Government Model Financial Report published by Local Government Victoria which Councils are required to follow in preparing their financial statements.
Long Term Infrastructure Plan
A report covering a detailed list of capital works expenditure planned to be delivered over 10 years. This is not a mandatory requirement, but, Council publishes this information along with the Financial Plan.
New asset expenditure
Expenditure that creates a new asset that provides a service that does not currently exist.
Non-financial resources
Means the resources other than financial resources required to deliver the services and initiatives in the budget.
Non-recurrent grants
Means a grant obtained on the condition that it be expended in a specified manner and is not expected to be received again during the period covered by a Council's Strategic Resource Plan.
Operating activities Operating activities means those activities that relate to the provision of goods and services.
Operating expenditure
Operating expenditure is defined as consumptions or losses of future economic benefits, in the form of reductions in assets or increases in liabilities; and that result in a decrease in equity during the reporting period.
Operating performance
This statement shows the expected operating result as compared to the budget result in the current year separating operating and capital components of revenue and expenditure.
Operating revenue Operating revenue is defined as inflows or other enhancements or savings in outflows of future economic benefits in the form of increases in assets or reductions in liabilities and that result in an increase in equity during the reporting period.
Own-source revenue
Revenue that Council generates internally and excludes external sources of income like Government grants and contributions.
Rating strategy A rating strategy is the process by which the Council's rate structure is established and how the total income generated through rates and charges is allocated across properties in the municipality. Decisions regarding the quantum or rate levels and increases from year to year are made as part of Council's long term financial planning processes and with consideration of Council's other sources of income and the planned expenditure on services and works to be undertaken for its community.
Recurrent grant A grant from Government that is expected to be received on a continuing basis
Regulations Local Government (Planning and Reporting) Regulations 2020
Restricted cash Cash and cash equivalents, within the meaning of Australian Accounting Standards, that are not available for use other than a purpose for which it is restricted, and includes cash to be used to fund capital works expenditure from the previous financial year and trust funds and bonds that are held.

2021-2031 Financial Plan | 58
Revenue and Rating Plan
A Plan that determines the most appropriate and affordable revenue and rating approach for Council which in conjunction with other income sources will adequately finance the objectives in the council plan.
Strategies outlined in this plan align with the objectives contained in the Council Plan and feed into the budget and the Financial Plan, as well as other strategic planning documents under Council’s strategic planning framework.
Statement of capital works
The statement of capital works shows the expected internal and external funding for capital works expenditure and the total proposed capital works expenditure for the forthcoming years. The statement of capital works should be prepared in accordance with the Local Government (Planning and Reporting) Regulations 2020 and the Local Government Model Financial Plan.
Statement of cash flows
The statement of cash flows shows the expected net cash inflows and outflows in the forthcoming year in the form of a reconciliation between the opening and closing balances of total cash and investments for the year. The cash flow statement should be prepared in accordance with the requirements of AASB 107 Statement of Cash Flows and the Local Government Model Financial Report.
Statement of changes in equity
The statement of changes in equity shows the expected movement in accumulated surplus and reserves for the years. The statement of changes in equity should be prepared in accordance with the requirements of AASB 101 Presentation of Financial Statements and the Local Government Model Financial Report.
Statement of Human Resources
A statement which shows all Council staff expenditure and the number of full time equivalent Council staff.
Statutory reserves Statutory reserves are funds set aside for specified statutory purposes in accordance with various legislative requirements. These reserves are not available for other purposes.
Strategic risk Risks that arise from fundamental decisions that Council takes on long term objectives
Unrestricted cash All cash and cash equivalents other than restricted cash.
Workforce plans A plan developed and maintained by the Chief Executive Officer of a Council under section 46(4)(a) of the Act that:
(i) describes the organisational structure of the Council;
(ii) specifies the projected staffing requirements for a period of at least 4 years; and
(iii) sets out measures to seek to ensure gender equality, diversity and inclusiveness.

2021-2031 Financial Plan | 59
Our cover displays street art that was created for The Big Picture Fest Frankston 2020. For more
information or to take a street art walking tour of Frankston please visit thebigpicturefest.com.au
This art can be found at Stiebel Place, Frankston.
Artist PichiAvo (Juan Antonio Sánchez Santos and Álvaro Hernández Santaeulalia)
@pichiavo
PichiAvo is Juan Antonio Sánchez Santos (Pichi, b. 1977) and Álvaro Hernández Santaeulalia (Avo,
b.1985), a duo of street artists from Valencia (Spain).
Recognised for their skill at creating connections between painting and sculpture in urban settings,
they adopt a thoroughly innovative approach in their artistic fusions. A balanced combination of
classical art and the most contemporary urban art can be identified in their work. From the outset
PichiAvo shunned artistic individuality, joining forces to create an absolutely unique body of work using
a conceptually urban idiom, both in the street and in the studio.
They trained in Fine Art and in Design and met on the graffiti art scene in Valencia, forming the
PichiAvo duo in 2007. From that moment they worked on developing joint projects, pursuing an
unremitting search for a style of their own. To achieve this they went through various stages as
painters, focusing initially on skill and technique until they reached the point of needing to express
themselves through what most defines them today: graffiti and classical art. They work both outside
and inside the studio, in painting, sculpture and installation, embracing a wide and versatile range of
material and painterly approaches.
In 2015 PichiAvo produced their first large mural in the North West Walls Festival in Belgium, having
been invited by fellow artist Arne Quinze. This work launched their international career. From then on,
they have carried out projects at some of the leading venues in international urban art, such as
Wynwood Walls (2015) and the Hard Rock Stadium (2016), both in Miami, and the Houston Bowery
Wall in New York (2017), where theirs was the first painting intervention by European artists. In 2019
they created a monumental 26m high sculpture for the Fallas Festival in Valencia and held their first
major exhibition in a public art centre. In April 2019 they executed the second largest mural in the
world in the city of Porto, in collaboration with the celebrated Portuguese artist Vhils.
PichiAvo’s career has attained artistic recognition and popularity on an international scale, establishing
them among the most prominent street artists on the current urban art scene.
Photography by Steve Brown

2021-2031 Financial Plan | 60
How to contact us
Online: frankston.vic.gov.au In person: 30 Davey Street Frankston VIC 3199 Australia Telephone: 1300 322 322 +61 3 9784 1094 Business hours, Monday to Friday (Public holidays excluded) Fax: +61 3 9784 1094 In writing: Frankston City Council PO Box 490 Frankston VIC 3199
Interpreter services We cater for people of all backgrounds Please call 131 450 National Relay Service If you are deaf, hard of hearing and/or have a speech impairment you can contact the Council using the National Relay Service. Teletypewriter (TTY) 133 677 Voice Relay 1300 555 727 SMS Relay 0423 677 767