Final Report: North Kenwood/Oakland
34
Mapping Communitybased Information Networks to Enable the Chicago Climate Action Plan Final Report: North Kenwood/Oakland Science of Networks in Communities (SONIC) Research Lab Northwestern University Research Team: Dr. Noshir Contractor Dr. Willem Pieterson Lindsay Young * Yuli Patrick Hsieh Hua Wang * For questions or comments pertaining to this report please contact Lindsay Young, Doctoral student at Northwestern University, at [email protected] .
-
Upload
khangminh22 -
Category
Documents
-
view
0 -
download
0
Transcript of Final Report: North Kenwood/Oakland
Mapping Community-‐based Information Networks to Enable the Chicago Climate Action Plan
Final Report: North Kenwood/Oakland
Science of Networks in Communities (SONIC) Research Lab Northwestern University
Research Team: Dr. Noshir Contractor Dr. Willem Pieterson Lindsay Young * Yu-‐li Patrick Hsieh Hua Wang
* For questions or comments pertaining to this report please contact Lindsay Young, Doctoral student at Northwestern University, at [email protected].
Science of Networks in Communities (SONIC) Research Lab NKO Research Report 2
Executive Summary Project Overview
Northwestern University’s Science of Networks in Communities (SONIC) Research Lab conducted a computer-‐based social network survey in the North Kenwood/Oakland (NKO) neighborhood to map the existing communication and knowledge networks in the area. As part of a larger initiative to engage diverse communities in the Chicago Climate Action Plan (CCAP), the primary objective of the survey was to determine which organizations, media, and peers residents would turn to for information about environmental issues. In addition to mapping the networks in the community, another goal of the study was to provide the City of Chicago Department of Environment (DOE) and other parties involved in the CCAP initiative with recommendations to enable these networks to create greater awareness of and engagement in the Chicago Climate Action Plan. SONIC’s field research in the NKO community lasted four months between November 2009 and February 2010. More then 250 residents were surveyed and 218 surveys were usable. The results of the network study add to the insights generated by The Field Museum’s ethnographic work in two ways. First, the study quantifies and strengthens many of the qualitative findings of the ethnography, adding to the robustness of the study. Second it creates new insights into the information networks that go beyond the work done by The Field Museum. The social network approach allows one to analyze and visualize the network structures in the NKO area and will help the Department of Environment (DOE) devise successful climate change strategies, for example by using the proper information source and communication channels to reach and engage with the NKO community. Key Findings
SONIC’s research in the NKO community yielded the following findings regarding the patterns that inhere in residents’ environmental information-‐seeking behaviors and their overall attitudes toward community and climate change. These findings highlight a wealth of social assets within the NKO community that can serve as the foundation for the City of Chicago’s efforts to inform, educate, and engage community residents in their own unique climate change action plan. 1) Community-‐based Organizational Sources
When asked to name the organizations they would consult if they needed information about environmental issues, the five most mentioned organizations were ComEd, CTA, The Chicago Urban League, the Ward 4 Office, and The Resource Center.
Given NKO residents’ general distrust in external groups like corporations and government
agencies, identifying those organizations that residents do trust is vital for successfully engaging the community in the CCAP initiative. In NKO more than 40 percent of respondents named Komed-‐Holman Health Center, the Rainbow PUSH Coalition, the Kenwood Oakland Community Organization (KOCO), Kennicott Park Fieldhouse, and ComEd as trusted organizations.
In some instances, organizations that are highly trusted, such as the churches included in the organizational sample, are not organizations that people would naturally think to go to for environmental information. However, as trusted organizations, these groups have the potential to be influential.

Science of Networks in Communities (SONIC) Research Lab NKO Research Report 3
Respondents were asked name the organizations they were affiliated with and with whom their organizations collaborated. Based on these responses, the most prominent organizational collaborators were the Chicago Urban League, Centers for New Horizons, the Bronzeville Community Market, Little Black Pearl Art & Design Center, and the Kenwood-‐Oakland Community Organization (KOCO).
2) Media Sources
When asked to name the media they would consume if they needed information about environmental issues, respondents indicated they would rely most on mainstream media outlets, particularly network television and regional press. The five most mentioned sources include: ABC (Ch7), Chicago Sun Times, CW (Ch9), CBS (Ch2), Chicago Tribune, Fox Chicago (Ch12).
In terms of overall trust in media, more than 50 percent of respondents named the Chicago
Tribune, Chicago Sun Times, Chicago Defender, CW (Ch9), Fox Chicago (Ch12), and PBS (Ch11) as trusted media. Missing from the list of highly trusted media outlets are the three major TV networks (ABC, NBC, and CBS) as well as digital media.
Comparing the media people thought they would most likely to use to get environmental information and the media they trust in general, it seems apparent that the relationship between how trusted a media source is and how often it is cited as a source of information is far more tenuous than was the case with organizational sources. Other factors aside from trust may be at play in motivating people’s media preferences, such as their consumption habits and ease of use.
3) Peer Sources
Respondents indicated that they would primarily rely on “strong ties” for environmental information, such as family and friends, as opposed to “weak ties”, such as acquaintances, neighbours, and co-‐workers.
Respondents tended to name peers that were different from them in terms of occupation,
education, and age. However, when it came to gender, respondents tended to name peers of the same gender.
Respondents’ peer networks tended to be quite dense, meaning that the peers they named as sources of information were themselves connected (i.e., they knew one another). An advantage of density is that information tends to diffuse rapidly with little concerted effort. For example, in a network where everyone has a direct relationship with one another, if one of those people is interested in environmental issues, then one can reasonably assume that they’ll hear about such information.
4) Channels of Communication
Regarding communication with organizations, respondents indicated a preference for communicating via more traditional, intimate channels, like face-‐to-‐face and the telephone, followed by using websites as a means of access.
When it came to communicating with their peers, respondents preferred using traditional means of communication like face-‐to-‐face and telephone as well as e-‐mail.

Science of Networks in Communities (SONIC) Research Lab NKO Research Report 4
5) Community and Climate Change Sentiments
Relative to other issues, environmental issues are not top priorities. The top three concerns were health, jobs & employment, and education. Despite the low priority of explicit environmental issues as compared to other concerns, several of the issues that were more prominent have environmental implications, for example health and housing.
On average, respondents tended to agree that the effects of climate change have already begun to occur, that it is a serious problem, that they understand how it happens, and that they personally worry about it. Mean scores begin to dip when asked about their willingness to pay more for things that would help mitigate climate change, like renewable energy.
Key Recommendations
The results listed above inform the following recommendations, which are discussed in further detail at the end of the report. 1) Enlist trusted organizations and media to disseminate information about climate change action
Harnessing the influence that trusted sources of information wield over community residents is vital to a social change campaign like CCAP. It is recommended that the City of Chicago work with these sources as it unravels its plan in order to help them disseminate environmental information, raise awareness about climate change, and promote mitigation and adaptation programs in the community. 2) Understand and leverage the existing inter-‐organizational infrastructure
In a government led initiative like CCAP that seeks to influence people’s attitudes and behaviors, the community-‐based inter-‐organizational network often serves as the infrastructure for information dissemination, knowledge building, and social influence. Thus, it is important for an outside entity like the Department of Environment that is looking to influence and encourage community-‐level change to leverage the collaborative relationships that bind this network together. 3) Leverage the value of existing interpersonal network structures
This study found that respondents tend to have dense interpersonal information networks, meaning that they tend to be embedded in peer networks that are highly connected. Dense networks can also be leveraged to serve information diffusion. For example, if an individual is embedded in a dense network, where everyone has a direct relationship with one another and where at least one of those people is interested in environmental issues, then there is an excellent chance that he/she will become aware of such information. In NKO many of the respondents who had highly dense information networks were residents of Lake Park Crescent (LPC), a mixed-‐income housing development in the area. As the City of Chicago unravels its campaign, it might be fruitful to work through a place of residence like LPC to diffuse information that it wants people in the community to have access to. 4) Invest in residents’ preferred communication channels
Attempts to raise awareness and influence change in communities must take advantage of residents’ preferred channels of communication. For example, community-‐based organizations that are involved in the CCAP campaign should make information available “on location” as well as through websites, given respondents’ preferences to access organizations in-‐person and via websites. Efforts to raise awareness through the media should include city-‐wide and local TV advertisements and public service announcements in light of their preferences for TV-‐based media.

Science of Networks in Communities (SONIC) Research Lab NKO Research Report 5
5) Build on existing concerns
Relative to other issues facing the community, environmental issues were not top priorities. However, despite the low priority of explicit environmental issues like air quality, waste, and climate change there still exists an excellent opportunity to encourage eco-‐practices by building on what is of concern to NKO community members. For example, environmental considerations are implicated in issues like health, jobs, and housing, which were found to be top concerns for many NKO residents.

Science of Networks in Communities (SONIC) Research Lab NKO Research Report 6
Data Source and Sample The Survey Instrument
Information about residents’ environmental information-‐seeking behaviors was collected using a four-‐part structured questionnaire. The first three parts of the questionnaire were designed to elicit information about individuals’ organizational, mediated, and peer-‐based sources of information, respectively. In both the organization and media sections, respondents were asked to generate a list of sources they would go to for environmental information from a prescribed list of relevant community-‐based organizations and media outlets. Based on the list of sources individuals created, they were then asked to provide information about their perceptions of trust and expertise regarding each source, how frequently they interacted with the sources, and the communication channels they would most likely use to make contact with the sources. The same questions were asked of peer-‐based sources of information, however the list of peers respondents would consult for information was developed using a name generator technique, whereby each respondent was asked to name the people they would rely on for assistance with environmental concerns. The name-‐generator was then followed by a series of questions that elicited information about the demographic characteristics of each source and the nature of the relationship between the respondent and her sources. Finally, the fourth section of the survey included questions regarding environmental attitudes and sense of community as well as personal demographics. The surveys were administered to the respondents by trained interviewers who themselves lived in the North Kenwood/Oakland community, all of whom share high levels of knowledge and understanding about the social structure of NKO. Using indigenous interviewers was considered crucial to the recruitment process in a community that feels over-‐studied by academics and has a general distrust of outsiders. The interviews were primarily conducted in public places within the community, such as cafes, libraries, and community centers, however when necessary interviews were carried out in private residences. Population Sample
Participants were recruited using both quota and convenience sampling. First, demographics of the community were surmised using 2000 census tract data. Then, interviewers were instructed to use that information to inform their recruitment of participants so that the sample was more representative of the community population as a whole. Recruits were solicited at public places, such as cafes, community centers, public markets, public meetings, as well as through local businesses, community-‐based organizations, and the Lake Park Crescent mixed-‐income housing development in the neighborhood. As a result of the sampling strategy, we derived a total sample size of 281 residents. However, due to errors made in data capture, 63 surveys were deemed inadequate for analysis, leaving a final sample size of 218. The characteristics of the final sample are presented in Table 1.

Science of Networks in Communities (SONIC) Research Lab NKO Research Report 7
Table 1. Demographic Characteristics of NKO Sample (N=218)
% % Gender Household Income Male 38.9 Less than 10,000 30.4 Female 61.1 10,000 to 19,999 12.2
Age 20,000 to 29,999 13.6 19 to 29 19.4 30,000 to 39,999 16.8 30 to 39 22.2 40,000 to 49,999 10.3 40 to 49 23.2 50,000 to 59,999 10.8 50 to 64 25.9 60,000 to 99,999 3.3 65 and older 9.3 100,0000 and above 2.8
Race/Ethnicity Occupation African American 90.7 Blue collar 20.1 Caucasian 6.3 Unemployed 19.6 Hispanic/Latino 1.5 White collar 16.2 Other 1.5 Retired 12.8 Education Business owner/self-‐employed 10.8 Less than High School 2.0 Student 7.4 High School 23.1 Community Worker 5.9 Some college 37.2 Pink collar 2.5 College degree 30.2 Other 4.9 Advanced degree 7.5
The sample population reflects the census proportions (within 10%) for most demographic categories with a few exceptions. Those between the ages of 50 and 64, those with less than a high school degree, some college experience and a college degree were all over or under sampled by more than 10 percent.1 In terms of occupation, blue-‐collar work is most typical among respondents, closely followed by unemployment. However, the sample includes people from most occupational groups, ranging from white-‐collar workers to retired people, students, and business owners. On average residents earned about $28,000 per year. However, approximately 40% of the respondents earn less than $20,000 a year while only 6 percent earn more than $60,000 a year.
1 The age disparity is likely due to the demographic makeup of our interviewers, many who were retired, whereas the oversampling of education levels may be due to the locations from which respondents were recruited. During data collection, many community-‐based meetings were used to solicit participants. In North Kenwood/Oakland it has been found that those of higher socio-‐economic status tend to be more involved in community organizations, which might explain the disparities in those areas.

Science of Networks in Communities (SONIC) Research Lab NKO Research Report 8
Sources I: Organizations
Summary
This section focuses on the organizational sources of information in the NKO community. In the survey, respondents were asked to name the organizations that they trust in general, that they would consult if they needed information about environmental issues, and that they would consult for specific information pertaining to energy efficiency, transportation options, and waste reduction. Information was also elicited about organizational affiliations and collaborations in order to map the inter-‐organizational network within the NKO area. Below is a summary of key findings.
Most trusted organizations: More than 40 percent of respondents named Komed-‐Holman Health Center, the Rainbow PUSH Coalition, the Kenwood Oakland Community Organization (KOCO), Kennicott Park Fieldhouse, and ComEd as trusted organizations.
Most mentioned sources of environmental information: The five most mentioned organizational sources of environmental information were ComEd, CTA, The Chicago Urban League, the Ward 4 Office, and The Resource Center.
Most prominent organizational collaborators – In the inter-‐organizational network the most prominent collaborators were the Chicago Urban League, Centers for New Horizons, the Bronzeville Community Market, Little Black Pearl Art & Design Center, and the Kenwood-‐Oakland Community Organization (KOCO).
Organizational Sources Respondents were first asked a series of questions regarding the organizational sources of information in their community. Prior to data collection, a definitive list of relevant community-‐based organizations (CBOs) and service providers was generated with guidance from ethnographers from The Field Museum's study. This iterative process yielded a final list of 30 organizations, shown in Table 2.
Table 2. NKO Community-‐based Organizations
Stateway Community Partners (SCP) Kenwood Oakland Community Organization (KOCO) Bronzeville Community Partnership Komed-‐Holman Health Center SOUL NKO Community Conservation Council Bronzeville Community Market Quad Communities Development Corp. (QCDC) Z & H Deli Local Initiatives (LISC) New Communities Bronzeville Alliance Rainbow PUSH Coalition Blacks in Green (BIG) St. Ambrose Church Little Black Pearl Art and Design Center U of C Charter School, NKO Elementary Sensual Steps Kennicott Park Fieldhouse U of C Charter School, Donoghue School St. James United Methodist Church Civic Knowledge Project (CKP) CTA Ain’t She Sweet Café ComEd Center for New Horizon (CNH) Ward 4 Office Chicago Urban League The Resource Center Kenwood United Church-‐Christ
Based on the prescribed list, respondents were first asked to to select those organizations they would consult if they needed information about environmental issues, with the opportunity to write-‐

Science of Networks in Communities (SONIC) Research Lab NKO Research Report 9
in the names of organizations not included on the list. 2 On average, respondents mentioned 4.24 organizations and the number of organizations mentioned ranged from 1 to 20. Nearly 85 percent of the respondents named less than 7 organizational sources, while two respondents named 16 and 20 organizations, respectively. Figure 1 shows the distribution of this data.
Figure 1. Distribution of the number of organizations a respondent would consult for environmental information
Respondents were also asked which organizations from the pre-‐determined list they trust in general. As opposed to familiarity, which is simply having knowledge of an organization and they work that they do, trust involves an assessment of reliability. However, this assessment tends to be highly subjective and is considered by many to be difficult to empirically measure and to motivate. In order to accommodate individualistic determinations of what trust is and how it is assigned, the term was not defined in the phrasing of the question but rather left purposely vague so as not to emphasize one particular interpretation of the word over another. Figure 2 shows the percentage of respondents selecting each organization for both questions. Respondents were permitted to select as many organizations as applied, therefore the aggregated percentages exceed 100 percent. The red bars represent the percentage of respondents that mentioned each organization as a source they would consult for environmental information while the blue bars represent the percentage of respondents that trust each organization. As one can see, ComEd, CTA, The Chicago Urban League, the Ward 4 Office, and The Resource Center rounded out the top five organizational sources that respondents would consult if they were interested in learning more about environmental issues. When asked to name the organizations they trust in general, respondents demonstrated preferences for Komed-‐Holman Health Center, the Rainbow PUSH Coalition, the Kenwood Oakland Community Organization (KOCO), Kennicott Park Fieldhouse, and ComEd. When one compares respondents’ choices for both questions several things become apparent. While respondents tended to named external service providers like ComEd and CTA as organizations
2 In that many respondents may not be incredibly concerned about environmental issues and, hence, would have little past experience seeking information about such issues, the question was asked in hypothetical terms (i.e, which organizations would you consult if you needed information?).

Science of Networks in Communities (SONIC) Research Lab NKO Research Report 10
they would consult for information, this choice is likely motivated more by their obvious expertise than trust. When queried about perceived expertise, respondents named ComEd and CTA most frequently as environmental experts. However, an examination of the most trusted organizations reveals that respondents tended to place more trust in community-‐based groups, like the Komed-‐Holman Health Center and the North Kenwood Oakland Community Organization (KOCO), as well as advocacy groups active in the community like the Rainbow PUSH Coalition.
Figure 2. Organizations that respondents trust & would consult for environmental information
However, for the most part, trust seems to be a relevant motivator for respondents’ choices for where they would go for environmental information. As Figure 2 shows, with the exception of ComEd and The Chicago Urban League, people tend to name organizations as potential sources of environmental information that just as many respondents, if not more, trust in general. A correlation analysis of both variables shows that there is a positive significant relationship (r=.367, p<.05) between the two variables, meaning that for each organization the number of people who would consult that organization and the number of people who trust that organization tend to co-‐vary in the same positive direction. What is particularly interesting is that in some instances, organizations that are highly trusted, such as the churches included in the organizational sample, are not organizations that people would naturally think to go to for environmental information. However, as trusted organizations, these groups have the potential to be influential, which would make working with such organizations, especially as communication intermediaries, an effective strategy for the CCAP initiative. Finally, in order to ascertain where respondents would go for more specific environmental information, respondents were also asked to select the organizations they would consult if they needed information about three specific climate change related issues -‐-‐ energy efficiency, transportation options, and waste reduction. This time the response set from which respondents made their selections was the list of organizations they would consult for general environmental information that they had generated earlier. As is shown in Figure 3, respondents view some organizations as vital sources for all three climate change issues. For example, approximately 20 percent of the respondents identified the Ward 4 Office, the Chicago Urban League, and the Rainbow PUSH Coalition as relevant sources for all three issues. Other organizations that respondents indicate as important for all three issues but less so

Science of Networks in Communities (SONIC) Research Lab NKO Research Report 11
than the aforementioned three are the Resource Center, Stateway Community Partners, and the Bronzeville Community Partnership program.
Figure 3. Organizations that respondents would consult if they needed information about energy efficiency, transportation options, and waste reduction
On the other hand, some organizations like CTA and ComEd, are primarily targeted for more specialized information regarding transportation options and energy efficiency, respectively, as one would expect given their specialties. The Resource Center would be considered a specialist in waste reduction issues. However, as Figure 3 shows, respondents indicated that they would be more likely to consult the Ward 4 Office or the Chicago Urban League for assistance such issues. This may indicate that despite The Resource Center’s specialization in waste reduction, many residents are not familiar with what they do or are aware of their presence in the community. The Inter-‐organizational Network In a government led initiative like CCAP that seeks to influence people’s attitudes and behaviors, the community-‐based inter-‐organizational network often serves as the infrastructure for information dissemination, knowledge building, and social influence. Furthermore, the collaborative ties between organizations are like resource conduits, providing one organization’s patrons with access to resources provided by another. These connections are particularly useful for those living in low-‐income communities, where access to local resources are generally hard to come by. Thus, it is important to have an accurate conception of the members of the organizational network and the collaborative relationships that bind them together. With this in mind, respondents were asked a series questions designed to provide the data to generate a map of the inter-‐organizational network. First, they were asked whether or not they were affiliated with any of the community-‐based organizations they had been asked about previously. An affiliation was defined as working for, being a member of, or regularly volunteering with an organization. Answers were recorded using a simple yes/no choice set. Those who answered yes to the previous question were then asked to name the organizations they had an affiliation with. And finally, for each of the organizations they were affiliated with each respondent was asked to name their organizational collaborators. Figure 4 shows the visualization of the North Kenwood/Oakland inter-‐organizational network, as perceived by the respondents. Nodes represent the organizations that respondents are affiliated

Science of Networks in Communities (SONIC) Research Lab NKO Research Report 12
with and/or their organizational collaborators; thus the tie between two organizations is a collaboration tie. The nodes are weighted by degree; the larger the node the more collaboration ties the organization has.
Figure 4. NKO Inter-‐organizational Network
Based on the size of the node, one can see that the most prominent collaborators in the organizational network are The Chicago Urban League, Centers for New Horizons, the Bronzeville Community Market, Little Black Pearl Art & Design Center, and the Kenwood-‐Oakland Community Organization (KOCO). However, caution must be used when interpreting this network graph. One must realize that there is a bias toward those organizations that the respondents were affiliated with. This means that in this network those organizations that appear to have few collaborative ties, like St. Ambrose Church, were more than likely not represented by any of the survey participants. Instead, they were probably only named by a respondent as a collaborator. Future studies would benefit from gathering more detailed information regarding the inter-‐organizational network. Administering separate network surveys to representatives from all community-‐based organizations would provide such data.

Science of Networks in Communities (SONIC) Research Lab NKO Research Report 13
Sources II: Media Outlets
Summary
This section focuses on the media sources of information in the NKO community. In the survey, respondents were asked to name the media that they trust in general, that they would consume if they needed information about environmental issues, and that they would consume for specific information pertaining to energy efficiency, transportation options, and waste reduction. Below is a summary of key findings.
Most trusted media: More than 50 percent of respondents named the Chicago Tribune, Chicago Sun Times, Chicago Defender, CW (Ch9), Fox Chicago (Ch12), and PBS (Ch11) as trusted media.
Most mentioned sources of environmental information: Respondents indicated they would rely most on mainstream media outlets, particularly network television and regional press. The five most mentioned sources include: ABC (Ch7), Chicago Sun Times, CW (Ch9), CBS (Ch2), Chicago Tribune, Fox Chicago (Ch12).
Media Sources As was the case for organizations, respondents were first asked to select the media they would consult if they needed information about environmental issues. Prior to data collection a list of relevant media outlets was generated with guidance from ethnographers from The Field Museum's study. This iterative process yielded a final list of 23 media sources, shown in Table 3. Repsondents were also given the opportunity to write-‐in media sources that did not appear on the master list.
Table 3. Media Sources NBC (Ch5) National News Magazines CBS (Ch2) N’digo ABC (Ch7) Ebony/Jet CW (Ch9) Streetwise FOX Chicago (Ch12) Red Eye/Time Out/Chicago Reader PBS (Ch11) FM Public Radio Cable News Channels FM Music Stations Chicago Tribune AM Talk Stations Chicago Defender Search engine (e.g. Google) Hyde Park Herald/Lakefront Outlook Web Portal (e.g. Yahoo) Chicago Sun Times Wikipedia National Newspapers
On average, respondents mentioned 5.82 media and the number of media mentioned ranged from 1 to 24. Figure 5 reveals the distribution of this data. As can be seen, a majority of respondents (53.5%) named five media sources or less, with nearly 30 percent of those naming three media sources. However, a second peak in the data occurs in the number of respondents who named 8-‐10 media sources (24.4%). There are also some extreme cases present in the distribution; four respondents named more than 15 sources.
Science of Networks in Communities (SONIC) Research Lab NKO Research Report 14
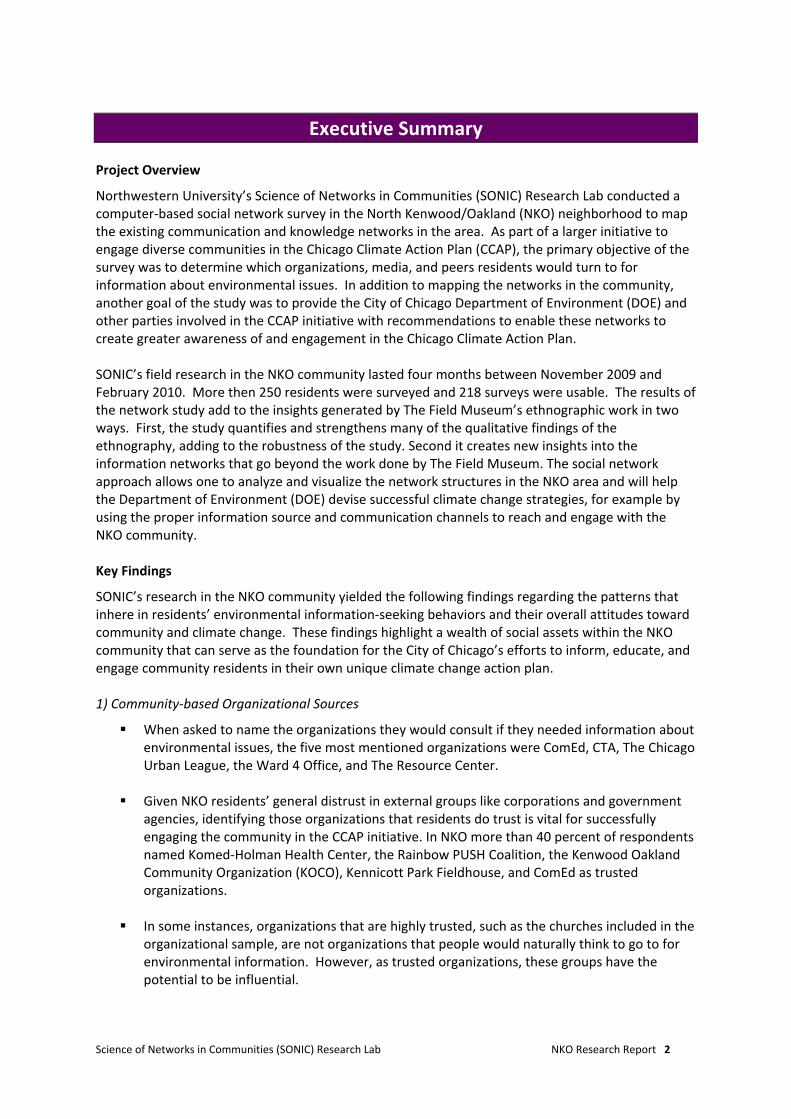
Figure 5. Distribution of the number of media a respondent would turn to for information about environmental issues
Respondents were also asked which media from the pre-‐determined list they trust in general. Figure 6 shows the percentage of respondents selecting each media outlet for both questions. As was the case for organizational sources, respondents were permitted to select as many media sources as applied, therefore the aggregated percentages exceed 100 percent. The red bars represent the percentage of respondents that mentioned each media outlet as a source they would likely use to get environmental information while the blue bars represent the percentage of respondents that trust each organization.
Figure 6. Media that respondents trust & would consult for environmental information
As one can see, respondents indicate that they would be more likely to rely on traditional media sources, such as network television and regional newspapers, as opposed to digital media (e.g., Wikipedia and web portals), national newspapers and news magazines, and local press (e.g., Hyde Park Herald and Streetwise). Given that nearly 70% of our respondents indicated that they had

Science of Networks in Communities (SONIC) Research Lab NKO Research Report 15
access to the internet at home and that information has been made more accessible via such means, it is telling that digital media were not mentioned more often as sources of information. A possible explanation for this could be that accesing information via digital media outlets is likely to be an option only for those who are active information-‐seekers as opposed to those who tend to be passively exposed to information. Respondents may have answered this question in terms of which media they thought would expose them to information about the environment, as opposed to which media they would actively use to get information about the environment. A slightly different picture is presented when responses to the trust question are examined. Asked to name the media they trust in general, respondents still showed preferences for more traditional media like regional newspapers and television stations. However the local press (e.g., the Chicago Defender and Hyde Park Herald/Lakefront Outlook), non-‐commercial media (e.g., PBS and FM public radio) and national press are also highly trusted by NKO residents. Missing from the list of highly trusted media outlets are the three major TV networks (ABC, NBC, and CBS) as well as digital media. Comparing participants’ responses to both questions, it seems apparent that the relationship between how trusted a media source is and how often it is cited as a source of information is far more tenuous than was the case with organizational sources. A correlation analysis of both variables indicates only a weakly positive, non-‐significant relationship between the two factors. In that trust plays a non-‐significant role in why particular media sources are selected as sources of environmental information, further analysis would be necessary in order to identify the antecedents driving respondents’ choices. For example, respondents may have selected media outlets that they habitually use. Finally, based on the list of media sources a respondent would likely use to obtain environmental information, respondents were asked to choose those they would use if they needed information regarding energy, transportation and waste related issues. Responses to these questions are shown in Figure 7.
Figure 7. Media that respondents would consult if they needed information about energy efficiency, transportation options, and waste reduction

Science of Networks in Communities (SONIC) Research Lab NKO Research Report 16
Unlike organizational sources that can be differentiated based on specialty areas, media outlets tend to be more general. This may explain why a clear media leader for each of the three specialty areas was not indicated in respondents’ selections. Furthermore, the relative ranking of each media source shows little change when compared to the outcome of the previous question regarding environmental information more generally.

Science of Networks in Communities (SONIC) Research Lab NKO Research Report 17
Sources III: People
Summary
This section focuses on the people – the peer sources -‐-‐ respondents would consult if they needed information about environmental issues. In the survey respondents were asked to name the people they would talk to if they needed information about environmental issues as well as a series of demographic and relational questions about these people. Below is a summary of key findings.
Typical role relations of people sources: Respondents indicated that they would primarily rely on “strong ties” for environmental information, such as family and friends, as opposed to “weak ties”, such as acquaintances, neighbours, and co-‐workers.
Network Diversity: Respondents tended to name peers that were different from them in
terms of occupation, education, and age. However, when it came to gender, respondents tended to name peers of the same gender.
Network Density: Respondents’ peer networks tended to be quite dense, meaning that the peers they named as sources of information were themselves connected (i.e., they knew one another). An advantage of density is that information tends to diffuse rapidly with little concerted effort. For example, in a network where everyone has a direct relationship with one another, if one of those people is interested in environmental issues, then one can reasonably assume that they’ll hear about such information.
Peer Sources Respondents were first asked to name the people they would communicate with about environmental issues. On average, respondents mentioned 2.43 peers and the number of peers mentioned ranged from 1 to 7. Figure 8 reveals the distribution of this data. Figure 8. Distribution of the number of peers a respondent would consult for information about environmental issues
Nearly 40 percent of respondents named only one peer as a potential source of environmental information, while 13 percent (n=26) named 5 or more peers.
Science of Networks in Communities (SONIC) Research Lab NKO Research Report 18
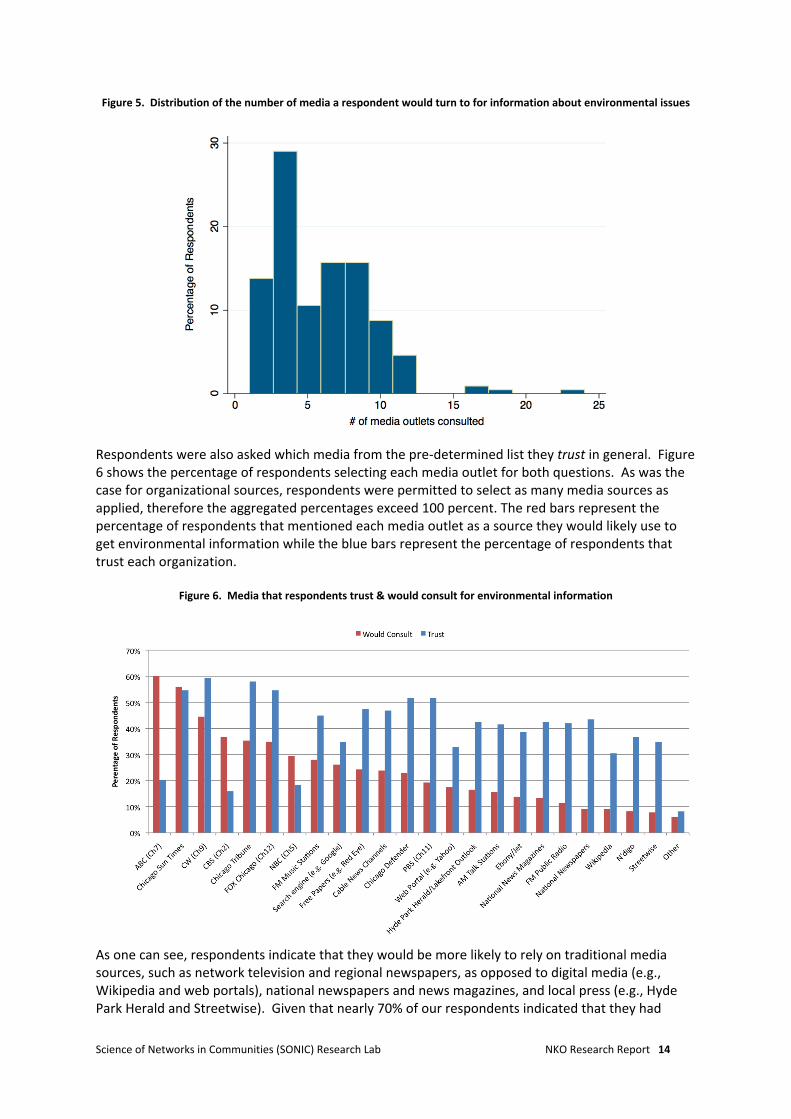
Following the name generator question, respondents were asked to provide information about each peer source, including gender, age, race/ethnicity, educational attainment, occupation, and the nature of the relationship (i.e, friend, family, neighbour, acquaintance, or co-‐worker). The characteristics of peer sources are shown in Table 4.
Table 4. Demographic Characteristics of Peer Sources (N=485) % Gender Male 47.6 Female 52.4
Age 12 to 18 2.2 19 to 29 9.4 30 to 39 26.5 40 to 49 32.7 50 to 64 23.5 65 and older 5.8
Race/Ethnicity African American 78.4 Caucasian 15.8 Hispanic/Latino 1.9 Other 3.9 Education Less than High School 0.2 High School 21.0 Some college 31.1 College degree 33.3 Advanced degree 14.4
Occupation Blue collar 23.0 Unemployed 12.4 White collar 28.3 Retired 7.2 Business owner/self-‐employed 7.8 Student 4.1
Community Worker 5.0 Pink collar 4.8 Other 7.4 Role Relation Friend 44.7 Family 26.7 Neighbour 3.9 Acquaintance 22.1 Co-‐worker 4.6
Gender. Respondents indicated that they would be slightly more likely to turn to women for information as opposed to men, however the difference is small (5%). Comparing this to the gender demographics of respondents, one can see that the gender differential for peer sources is 4 times smaller than the differential for respondents (22%).
Age. On average, the people that respondents named were between the ages of 40 and 49 and the majority tended to be between the ages of 30 and 64. In comparison to the respondents themselves, fewer peer sources fell between the ages of 19 and 29, suggesting that respondents might be looking to others with more life experience to assist them with environmental concerns.

Science of Networks in Communities (SONIC) Research Lab NKO Research Report 19
Race/Ethnicity. Like respondents, peer sources were primarily African-‐American (78%). Next to African-‐Americans, Caucasian peers were the second most named source of environmental information, claiming nearly 16 percent of the total. This is more than twice the percentage of Caucasian respondents. In a one-‐way comparison of race across these two groups, race/ethnicity differences were shown to be significant (p<.05). Education. Survey respondents named peer sources with all levels of education from less than high school to an advanced degree. While more respondents indicated having some college experience than any other level of educational attainment, peer resources tended to have college degrees more than any other level of education (33%). Furthermore, approximately 14 percent of total peer sources had advanced degrees, which is nearly twice the percentage of respondents with the same level of educational attainment. Likewise, 2 percent of respondents had less than a high school degree, while only 0.2 percent of peer sources had the same. In a one-‐way comparison of “highest level of education” across peer and respondent groups, a statistically significant difference was found (p<.05). The educational differences between respondents and their peer sources may be suggestive of a pattern of striving for “upper reachability” in the types of peers that respondents would consult for environmental information. In other words, respondents are seemingly reaching upward (in terms of education) when thinking about whom they would go to for a specific type of information that they themselves do not possess. Occupation. While blue-‐collar workers (20%) and the unemployed (20%) were represented most in the respondent sample, more peer sources were white collar (28%) and blue-‐collar (23%) workers than any other occupational category. While nearly 20 percent of respondents were unemployed, only about 12 percent of peer sources were likewise unemployed. These trends provide further support for the observation of “upper reachability” discussed previously. Role Relation. In the case that respondents would need assistance with environmental concerns, they indicated that they would primarily rely on “strong ties” for environmental information, such as family and friends. “Strong ties” are characterized by higher levels of intimacy, emotional investment and obligation than “weak ties” such as neighbours, acquaintances and co-‐workers. “Strong ties” also tend to be more trusted, which may be why respondents named them more frequently as sources of information. However, there is a downfall to relying on “strong ties” for access to unique resources. An individual’s “strong tie” contacts tend to be similar to the individual and are often themselves highly connected. By virtue of this, “strong tie” contacts are more likely to provide access to redundant information – information that the individual him/herself already possesses or information that all of one’s close contacts share. On the other hand, an individual’s “weak tie” contacts tend to be more dissimilar than similar to the individual and are often not connected themselves. This means that they tend to serve as bridges to other social circles and provide access to unique resources that are not already embedded in an individual’s more immediate social circle. Ego-‐network Composition Further analysis was conducted at the network level in order to identify trends in the overall composition of respondents’ information networks. One way to characterize network composition is to determine how homogeneous it is on the basis of different member attributes. In order to do this, the mean similarity between the respondent and the peer sources he/she named was

Science of Networks in Communities (SONIC) Research Lab NKO Research Report 20
computed on the basis of four demographic variables: gender, education, age cohort, and occupational status.3 Figure 9 shows the results of these calculations.
Figure 9. Mean demographic similarity of peer networks
Mean similarity values range from 0 to 1. A value of “0” represents a network that is characterized by completely dissimilar relationships while a value of “1” indicates a network comprising completely similar relationships. If a mean similarity score of .5 is considered the threshold above which a network becomes more similar than dissimilar, we can see that gender is the only demographic that exceeds that threshold. This suggests that on average respondents more often than not named peer sources of the same gender. The relevance of the extent to which personal information networks are characterized by demographic similarity or diversity has to do with the types of resources one can reasonably expect to have access to when embedded in such networks. If we assume that individual characteristics like education, occupation, age, and gender speak to the types of resources one brings to a network, then being embedded in a network comprised of people who are similar to you has the potential to make your network redundant. For example, if John, a construction worker, is embedded in a network with other construction workers, then it is probable that many of the resources he will have access to through this network are similar to those which he already personally possesses. Given that this study is concerned with the conditions that facilitate access to unique information (i.e., information that an individual does not personally possess), it is encouraging to see that, with the exception of gender, respondents’ personal information networks were characterized by more diversity than similarity as this is a potential sign of information breadth.
3 Mean network similarity values were calculated using the following method. First, at the dyadic level, in the instance that a respondent had a tie with an peer source with the same demographic characteristic (i.e., gender, education level, age bracket, and occupational status) that tie was given a value of “1”. Otherwise the tie was assigned a value of “0.” Then, in order to generate a network level variable, a mean similarity score was calculated for each respondent for each demographic by aggregating the similar ties in each category and dividing by the total number of per sources named. Mean scores range from 0, indicating a perfectly dissimilar network and 1, indicating a perfectly homogeneous network.

Science of Networks in Communities (SONIC) Research Lab NKO Research Report 21
In order to determine whether a relationship existed between particular demographic attributes of a respondent and the extent of demographic homogeneity in their network (e.g., whether being female is associated with having more or less network homogeneity), four separate correlations were computed between each mean demographic similarity variable and the corresponding demographic trait. The only correlation that revealed a significant relationship was between the educational attainment of a respondent and the mean education similarity (r=.145, p<.05) of their peer network. The positive direction of the relationship means that as an individual’s education increases there is a tendency for the educational homogeneity of their personal network to increase as well. The relationship between educational attainment and mean educational similarity supports arguments made about the context-‐specific benefits of homophilous interactions (Lin 1999, 2001). According to the principle of homophily, social interactions tend to take place among individuals with similar lifestyles and socioeconomic characteristics, like education. Assuming that one’s education is a measure of the quality of resources he/she possesses, it has been argued that homophilous interactions will only benefit someone looking to gain access to better quality resources if they themselves are of a higher educational status. An individual who has a lower level of educational attainment and seeks better quality resources is thought to benefit more from relationships with those who have higher education levels. Given these arguments, it makes sense that a positive relationship was found between a respondent’s level of educational attainment and the degree of educational homogeneity in their network; those of a higher educational status are simply more likely to benefit from having ties to similarly educated others because it affords them access to better quality resources like information.4 Ego-‐network Structure Another way to characterize the interpersonal information networks of respondents is to examine network structure. The value derived from being embedded in particular types of network structures that are likely to provide an individual with strategic advantages for achieving productive outcomes is a form of social capital. Burt (1992) argues that social capital is the value accrued by filling or investing in structural holes. As the absence of a tie between two unconnected actors, a structural hole represents an opportunity for a third party to fill that hole, thereby gaining access to the non-‐redundant resources that each unconnected party offers. For example, consider “Smith, J” (SJ), one of the survey respondents. When asked about the people she would communicate with about environmental issues, SJ named four people, none of whom knew each other. The fact that her contacts were otherwise unconnected is an important one, for it means that the information that SJ is likely to receive from one contact will differ from what she receives from another. Therefore, as the broker between her unconnected contacts, SJ has the advantage of having access to four unique sources of information. From the description above regarding the advantages of being embedded in an open network, like SJ’s, it seems logical to assume that network closure might be a bad thing. If all of an individual’s information sources know one another, then the information of one source will likely be known or shared by the others, thereby providing the individual access to redundant information. However, other social capital theorists like Coleman (1988) have argued that being embedded in dense, closed networks provides people with the most value due to the ease through which trust is built and information can be accessed. Consider “Cartwright, J” (CJ), another survey respondent. Unlike SJ,
4 This argument was presented as a means of explaining why the positive relationship between educational attainment and mean educational similarity was expected. The argument was not presented in order to make a values-‐based claim about ideal interaction tendencies in information-‐seeking situations. Furthermore, this argument clearly obfuscates the value of having access to different resources (as opposed to better resources) discussed previously.

Science of Networks in Communities (SONIC) Research Lab NKO Research Report 22
CJ named seven contacts, all of whom knew one another. In fact several of CJ’s contacts were family members, which increases the familiarity each contact has with one another. While the probability is high that CJ will encounter some redundant information in his quest for environmental information, CJ will also experience the benefits of having access to trusted sources of information and rapid diffusion of information (more on this below). Figure 10 depicts visualizations of the ego-‐networks of four different survey respondents, each of which varies in density. The density of an ego-‐network is calculated by taking the number of observed ties (not including ego) divided by the total number of possible ties (not including ego). This yields a value from 0 to 1, where a value of “0” indicates a completely open network, where none of a respondent’s contacts are themselves connected and a value of “1” indicates a completely closed network, whereby everyone is connected to everyone else.
Figure 10. Ego-‐networks with varying densities
Network (a) represents a completely open network like SJ’s. This is a network where the respondent (in red) is embedded in multiple structural holes and therefore is likely to have access to non-‐redundant information. Conversely, network (d) represents a completely closed network like CJ’s where the respondent has relationships with people who themselves are connected, making it a more redundant. This study found that respondents tend to have dense information networks. The average density was .823, indicating high levels of closure. Overall 74.5 percent of the respondents were embedded in information networks that were completely closed, where each peer source knew every other peer source. Conversely, 8.5 percent of the respondents revealed completely open networks, which means that they are filling structural holes and more likely to have access to non-‐redundant, unique forms of information. Ultimately, which type of network structure presents better outcomes for an individual depends on the context of their information retrieval situation. If an individual wants access to unique, non-‐

Science of Networks in Communities (SONIC) Research Lab NKO Research Report 23
redundant sources of information it is probably best to be in a more open network. However, if that individual is not really interested in environmental issues per se but is more interested in being informed about environmental actions in the community that are likely to have an effect on him, then being embedded in a dense network will have its advantages. Think about CJ’s network for a moment. In that CJ’s information sources are clustered, where everyone has a direct relationship with one another, if one of his contacts is interested in environmental issues, then he can reasonably assume that he’ll hear about such information. Furthermore, in that everyone is directly connected in a dense network, information does not have to pass through intermediaries to get to a person; thus less information loss is likely to occur in a closed network. Many of the respondents with highly dense networks are residents of Lake Park Crescent (LPC). As the city of Chicago unravels its campaign, it might be fruitful to work through a place of residence like LPC to diffuse information that it wants people in the community to have access to. Because many people who reside there know one another, trust one another, and would go to each other for information, the probability that residents will receive the information that the city wants people to have is quite high.

Science of Networks in Communities (SONIC) Research Lab NKO Research Report 24
Channels of Communication
Summary
This section addresses the channels of communication that respondents would use to communicate with the organizations and peers they named in the survey. Channel options included: face-‐to-‐face, telephone, website, e-‐mail, letter, blog, social networking site, online chat, text message/SMS and other. Below is a summary of key findings.
Preferred Channels for Organizational Sources: Regarding communication with organizations, respondents indicated a preference for communicating via more traditional, intimate channels, like face-‐to-‐face and the telephone, followed by using websites as a means of access.
Preferred Channels for Peer Sources: When it came to communicating with their peers, respondents preferred using traditional means of communication like face-‐to-‐face and telephone as well as e-‐mail.
Preferred Channels In addition to asking respondents about which organizations, media outlets, and peers they would consult if they needed information about environmental issues, respondents were also queried about the channels, or means, through which they would communicate with different sources. For each organizational and peer source that respondents mentioned, they were also asked to select the communication channel they would use to access that source. The options included: face-‐to-‐face, telephone, website, e-‐mail, letter, blog, social networking site, online chat, text message/SMS and other. The top five channel preferences for communicating with both organizations and peers are shown in Figure 11.5
Figure 11. Preferred channels of communication for organizational and peer sources
5 Less than 2% of respondents indicated that they preferred communicating with organizations via blogs, social networking sites, online chat rooms and text-‐messaging.

Science of Networks in Communities (SONIC) Research Lab NKO Research Report 25
Regarding communication with organizations, respondents indicated a preference for communicating via more traditional, intimate channels, like face-‐to-‐face and the telephone, followed by using websites as a means of access. This preference may reflect the nature of the task (i.e, seeking information), which is likely to necessitate two-‐way communication, immediate feedback, and a channel that can convey rich content that other, quicker means of communication may not be able to provide. Another possible explanation for why respondents seemingly prefer using more intimate means to communicate is the familiarity they have with many of these organizations being that they are co-‐located within the same community. Likewise, when it came to communicating with their peers, respondents preferred using traditional means of communication like face-‐to-‐face and telephone. However, respondents also indicated a preference for using e-‐mail to communicate with peers. Surprisingly text-‐messaging was only selected .9 percent of the time as a preferred means of communication with peers. This may be a result of the mean age of our sample (nearly 60 percent of our respondents were 40 years and over). It is reasonable to assume that this is a demographic that is less likely to use texting on a regular basis. Furthermore, the question asked the respondent to indicate the channel they would prefer using to communicate about environmental issues, a task that requires a medium that can convey a richness of content that text-‐messaging cannot.

Science of Networks in Communities (SONIC) Research Lab NKO Research Report 26
Community and Climate Change Sentiments
Summary
This section focuses on respondents’ attitudes about their community, personal self-‐efficacy and climate change. Specifically, respondents were asked about the degree to which they feel connected to their community, the extent to which they feel confident in their ability to find environmental information should they need it, the social issues that concern them most, and their beliefs, attitudes and behavioral intentions regarding climate change. Below is a summary of key findings.
Sense of Community: On average respondents “slightly agreed” to each of the five “sense of community” statements, indicating that they feel some connection to their community. The presence of different community perspectives discussed in the ethnographic findings could be in part responsible for the lukewarm sense of community found in the network survey. Given the diversity of perspectives in NKO, a campaign like the CCAP would be wise to recognize the varying perspectives and integrate them into their efforts to effect change at the community level rather than assuming a “one size fits all approach.”
Community Concerns: Relative to other issues, environmental issues are not top priorities. The top three concerns were health, jobs & employment, and education. Despite the low priority of environmentally related issues as compared to other concerns, there still exists an excellent opportunity to encourage eco-‐practices by building on what is of concern to NKO community members.
Climate Change Attitudes: On average, respondents tended to agree that the effects of climate change have already begun to occur, that it is a serious problem, that they understand how it happens, and that they personally worry about it. Mean scores begin to dip when asked about their willingness to pay more for things that would help mitigate climate change, like renewable energy.
Predictors of Climate Change Attitudes: Education was found to be a significant predictor of
climate change attitudes. Specifically, being more educated increases the odds of understanding climate change, of being more willing to pay more for utilities generated from renewable sources, and agreeing that they would follow the lead of friends who adopt more environmentally friendly practices.
Sense of Community How people feel about their community can have a substantial impact on the success of a social change campaign like CCAP. The extent to which residents of NKO feel positively about their community was ascertained by asking respondents about their shared sense of commitment to the community with others, their intentions to stay in the neighborhood for a long time, their perception of NKO as being a good place to live, whether they feel the need to fit in, and if they feel that the community can overcome obstacles as a unit. Responses were recorded on a 7-‐point scale from strongly disagree to strongly agree. As one can see in Figure 12, on average respondents “slightly agreed” to each of the five “sense of community” statements, indicating that they feel some connection to their community.

Science of Networks in Communities (SONIC) Research Lab NKO Research Report 27
Figure 12. Sense of Community Indicators
However, there may be some things going on in the community that are frustrating the development of stronger community cohesion. Previous ethnographic studies of NKO, including The Field Museum’s work in this area, report “sharp differences (real or perceived) between lower and upper income residents, old-‐timers and newcomers, and homeowners and renters” (The Field Museum report on NKO, p 7). These schisms have managed to challenge the community’s aspirations for renewal. The presence of different perspectives informed by these various identities could be, in part responsible for the lukewarm sense of community found in the network survey. Given the diversity of perspectives in NKO, a campaign like CCAP would be wise to recognize the varying perspectives and integrate them into their efforts to effect change at the community level rather than assuming a “one size fits all approach.” Self-‐Efficacy Scholars like Nan Lin (2001) have correctly pointed out that there is a difference between simply having access to resources and having the ability and confidence to mobilize those resources toward productive outcomes. This study is primarily focused on the former in that the goal is to identify the organizations, media, and people that provide residents with access to environmentally related information. Whether or not the potential access one has to information is actually mobilized is beyond the purview of the study. However, an important indicator of an individual’s ability to mobilize resources is their self-‐efficacy. Self-‐efficacy is the confidence one has in their ability to achieve a desired or intended result. Thus, one can have access to information, but without the self-‐efficacy that they can mobilize that information toward something, little can reasonably be expected to come of the access to information that an individual’s network provides. Self-‐efficacy was measured in this study by asking respondents to indicate the extent to which they agreed to two statements: (1) If I am interested in learning more about environmental issues, I am confident that I am able to access the information I need, and (2) If I have a personal problem that
!"#"$% &"'()*% &)*"+*",% -),.%)/%.0"%+*"% 1'234,%
5678%
5695%
569:%
56:%
56;<%
=% <% 5% 7% ;%
>)2%)?"@%()%4)A%$"(AB"%4)A$%0"3+@C%."*D"$3.A$"%E4%3%/"2%
("C$"",F%
>)2%)?"@%()%4)A%.A$@%)G%.0"%23."$%20H'"%4)A%E$A,0%4)A$%."".0F%
>)2%)?"@%()%4)A%$"D'3B"%@)$*3'%'HC0.%EA'E,%2H.0%"@"$C4%"IBH"@.%
EA'E,F%
>)2%)?"@%()%4)A%A,"%DAE'HB%.$3@,D)$.3+)@%H@,."3(%)/%($H#H@CF%
>)2%)?"@%()%4)A%#H,H.%DAE'HB%D3$J,F%

Science of Networks in Communities (SONIC) Research Lab NKO Research Report 28
involves environmental considerations, I am confident that I can find the information I need to solve the problem on my own. The former speaks to a person’s ability to find relevant information to satisfy an interest in learning more while the later underscores a person’s ability to find information specifically to be used to solve a problem. Responses were recorded on a 7 pt scale from strongly disagree to strongly agree and then recoded into a more general Disagree, Neutral, Agree scale. Figure 13 shows the distribution of responses to each question.
Figure 13. Respondent Self-‐efficacy
Overall, the responses suggest that a majority of participants were confident in their ability to find and use relevant information to satisfy their interest in learning more about environmental issues and to solve a personal problem related to the environment. However, when it came to assessing their ability to access and apply information toward solving a particular problem on their own, the percentage of respondents who expressed lack of confidence increased by nearly 5 percent. A possible explanation for this change in confidence could be that the extra task of applying the information toward solving a problem may be considered more difficult. As one would expect, those who express high levels of self-‐efficacy are probably more likely to exert more agency in pursuing a resource like information when they need it. However, for those who lack in self-‐efficacy, information may be accessible through their social ties but not mobilized. In such cases, an individual’s ties to community organizations may offset their lack of agency and self-‐efficacy by brokering access to resources for them without exerting much agency in the process (Small 2009). For example, an organization like Stateway Community Partners, an important broker in the NKO community due to its partnerships with external groups, is likely to provide its patrons with the means to acquire a multitude of resources without the patron having to exert much agency in the process. Community Concerns Second, from a list of 20 social issues respondents were asked to select the top three issues about which they are most concerned. As Figure 14 shows, respondents named health, jobs & employment, education and crime as their most prominent concerns. Relative to other issues, environmental issues (indicated by the green bars) are not top priorities. Despite the low priority of environmentally related issues as compared to other concerns, there still exists an excellent opportunity to encourage eco-‐practices by building on what is of concern to NKO community members. For example, environmental considerations are implicated in issues like health, jobs, and housing, all of which were mentioned more frequently than obvious environmental issues, like air quality and climate change.

Science of Networks in Communities (SONIC) Research Lab NKO Research Report 29
Figure 14. Community Concerns in the North Kenwood/Oakland Neighborhood
Climate Change Attitudes The next set of questions was designed to gather information regarding participants’ attitudes regarding climate change. On a 5-‐point scale from strongly disagree to strongly agree, respondents were first asked to assess the extent to which they agreed with a series of statements designed to a assess their beliefs, attitudes, values, and behavioural inclinations regarding climate change. The mean responses for each statement are shown in Figure 15.
Figure 15. Climate Change Attitudes
!"#$%
&"''%
&"$(%
&")'%
&"()%
&"#&%
&"*$%
&"*+%
'% !% &% $% )%
,-./0-%12.%34-%56/.47387%7.%6-%72589%:%;2.<0=%>238?-%6@%A-23B5.4%7.%2-0/%;7./%
72-%>05637-%C4.6%>238?58?%
:%1.<0=%A-%150058?%7.%/3@%6.4-%C.4%<D05D-;%5C%72-@%1-4-%?-8-437-=%A@%4-8-13A0-%;.<4>-;%059-%;.034%.4%158=%-8-4?@%
:E%/-4;.8300@E%>38%=.%3%0.7%3A.<7%4-=<>58?%>05637-%>238?-%
:C%72-%/-./0-%12.%34-%56/.47387%7.%6-%A->.6-%6.4-%-8B54.86-87300@%C45-8=0@%:%
1500%=.%72-%;36-%
:%=.%/-4;.8300@%1.44@%3A.<7%>05637-%>238?-%
:%<8=-4;738=%72-%5;;<-%.C%>05637-%>238?-%F;.6-D6-;%30;.%4-C-44-=%7.%3;%G?0.A30%
134658?GH%
:8%6@%B5-1E%>05637-%>238?-%5;%3%B-4@%;-45.<;%/4.A0-6%
I2-%-J->7;%.C%>05637-%>238?-%23B-%304-3=@%A-?<8%7.%23//-8%
K74.8?0@%L5;3?4--% L5;3?4--% M-<7430% N?4--% K74.8?0@%N?4--%
!"#
$!"#
%!"#
&!"#
'!"#
(!"#
)!"#
*!"#
+,-./0#
12345,67.286,9/#
:;<=->29#
?@A6,#
+2<4A9B#
+AB0#?24/#2C#.ADA9B#
E2D,@/8#
F@-9472@/->29#
:9,@B8#,G
=A,9=8#
H2</0#
I26,4>=#JA2.,9=,#
KA@#L<-.A/8#
M,9A2@#M,@DA=,4#
N2D,@96,9/#
O-P#,9C2@=,6,9/#
Q-4/,#
?.A6-/,#?0-9B,#
K@/45?<./<@,#
N@,,9#R234#
S22;#K==,44#
!"#$"%
&'(")*+),
"-.*
%/"%
&-)

Science of Networks in Communities (SONIC) Research Lab NKO Research Report 30
On average, respondents tended to agree that the effects of climate change have already begun to occur, that it is a serious problem, that they understand how it happens, and that they personally worry about it. Mean scores begin to dip when asked about their willingness to pay more for things that would help mitigate climate change, like renewable energy. The extent to which one is willing to pay is often used as a measure of environmental concern. However, some scholars have argued that “willingness to pay” questions tend to produce biased results when asked of low-‐income individuals (Brechin & Kempton, 1994; Dunlap & Mertig, 1995). Brechin & Kempton (1994) argue that when such questions use non-‐monetary costs, like time, as an indicator of one’s willingness to sacrifice this yields responses that suggest low-‐income individuals can be just as willing to “pay” as those who are wealthy. Future studies would benefit from including questions about environmental concern measured in both monetary and non-‐monetary terms in order to compare responses. Finally, respondents erred on the side of disagreeing that they were surrounded by a circle of people who place pressure on them to act in environmentally friendly ways. However, if a respondent’s close contacts were to become more environmentally friendly, respondents suggested that they would be inclined to do the same. In order to determine which, if any, demographic variables influence the likelihood of agreeing to each of the attitudinal statements, a binary logistic regression model was estimated for each of the climate change attitudes. In that original responses were recorded on a 5-‐pt scale, responses were dichotomized, assigning a value of “1” to anyone who agreed or strongly agreed with each statement and a value of “0” otherwise. The model estimation yielded significant education and age effects (p<.05) for three of the statements. Specifically, being more educated increases the odds of understanding climate change by 50.6 percent, net of other variables. Being more educated also increases the odds that someone thinks they would be willing to pay more for utilities generated from renewable sources by 97.5 percent, net of other variables. And finally, increases in both education and age increase the odds of agreeing that they would follow the lead of friends who adopt more environmentally friendly practices by 55.4 and 2.5 percent, respectively.
Science of Networks in Communities (SONIC) Research Lab NKO Research Report 31
Recommendations RECOMMENDATION #1: Enlist trusted organizations and media to disseminate information about climate change action
As previously discussed, respondents tend to name organizations that they would go to for environmental information that they also trust in general. However, what is particularly interesting is that in some instances, organizations that are highly trusted, such as the churches included in the organizational sample, are not organizations that people would naturally think to go to for environmental information. However, as trusted organizations they have the potential to be influential, which makes working with such organizations, especially as communication intermediaries, an effective strategy for the CCAP initiative. The same is true of media sources. There are particular media outlets that are more trusted than others but which were not considered by respondents to be the most likely sources of environmental information. Some of these highly trusted outlets include regional and local media outlets like the Chicago Defender, PBS Channel 11 (WBEZ), FM Public Radio (WBEZ), and the Lake Front Outlook/Hyde Park Herald. In that these sources are highly trusted, working with them to help disseminate information and raise awareness about climate change and to promote mitigation and adaptation programs in the Chicago area would be an effective strategy. RECOMMENDATION #2: Understand and leverage the existing inter-‐organizational infrastructure to facilitate trust-‐building and influence within the community
In a government led initiative like CCAP that seeks to influence people’s attitudes and behaviors, the community-‐based inter-‐organizational network often serves as the infrastructure for information dissemination, knowledge building, and social influence. Thus, it is important for an outside entity like the Department of Environment that is looking to influence and encourage community-‐level change to leverage the collaborative relationships that bind this network together. Based on the survey questions regarding respondents’ organizational affiliations and collaborations, the most prominent collaborators in the organizational network were The Chicago Urban League, Centers for New Horizons, the Bronzeville Community Market, Little Black Pearl Art & Design Center, and the Kenwood-‐Oakland Community Organization (KOCO). However, as noted, these results are biased toward the organizations that had representatives in the survey sample. Future studies would benefit from administering separate network surveys to an official representative from each of the organizations in the NKO community in order to gather more detailed information about the frequency and nature of each organization’s collaborations. RECOMMENDATION #3: Leverage the value of existing interpersonal network structures in order to facilitate efficient information diffusion
This study found that respondents tend to have dense interpersonal information networks, meaning that they tend to be embedded in peer networks that are highly connected. Overall 74.5 percent of the respondents were embedded in information networks that were completely closed, where each peer source knew every other peer source in a respondent’s network. Conversely, 8.5 percent of the respondents revealed completely open networks, where each peer source was only indirectly connected to another via the respondent. It is generally thought that open networks are more advantageous to an individual if they want to access unique, non-‐redundant sources of information. However, dense networks can also be

Science of Networks in Communities (SONIC) Research Lab NKO Research Report 32
leveraged to serve information diffusion. For example, if an individual is embedded in a dense network, where everyone has a direct relationship with one another and where at least one of those people is interested in environmental issues, then there is an excellent chance that he/she will become aware of such information. Moreover, in that everyone is directly connected in a dense network, information does not have to pass though intermediaries; thus a closed network may diffuse higher quality information. In North Kenwood/Oakland many of the respondents who indicated belonging to highly dense information networks are residents of Lake Park Crescent (LPC). As the City of Chicago unravels its campaign, it might be fruitful to work through a place of residence like LPC to diffuse information that it wants people in the community to have access to. Because many people who reside there know one another, trust one another, and would go to each other for information, the probability is quite high that these residents will be exposed to information that the city wants them to have. RECOMMENDATION #4: Invest in residents’ preferred communication channels
In a communication campaign like the CCAP initiative, an effective information diffusion strategy must take advantage of the communication channels utilized most by the target audience. Furthermore, an effective communication strategy must also recognize that people are likely to utilize different communication channels when communicating with different types of sources. Survey respondents showed clear preferences for communicating with organizations and peers through traditional, more intimate channels like face-‐to-‐face and telephone. However, electronic channels like websites and email were also revealed to be preferred channels for communicating with organizations and peers, respectively. Attempts to raise awareness and influence change in communities must take advantage of these preferred channels of communication. For example, community-‐based organizations (CBOs) that are involved in the CCAP campaign should make information available “on location” as well as through websites. One way that organizations broker relationships between the City of Chicago and community residents is by serving as physical and digital repositories of information. Therefore, making information available and accessible within the actual physical space that the organization occupies would be a simple, yet strategic way to reach out to those who prefer in-‐person contact with community-‐based organizations. And, to suit those preferring digital access, it would be most effective to encourage CBOs to post information about CCAP and provide links to the DOE and other relevant CCAP partners on their websites, which would also help build a digital information repository built around a web of connections fostered by the Internet. And finally, in terms of receiving information from the media, respondents suggested that they would likely do so via TV, which means efforts to raise awareness through the media should include city-‐wide and local advertisements and public service announcements. RECOMMENDATION #5: Build on existing concerns
Relative to other issues facing the community, environmental issues were not top priorities. However, despite the low priority of explicit environmental issues like air quality, waste, and climate change there still exists an excellent opportunity to encourage eco-‐practices by building on what is of concern to NKO community members. For example, environmental considerations are implicated in issues like health, jobs, and housing, which were found to be top concerns for many NKO residents. An example of this type of integrative strategy can be found in the platform espoused by environmental health advocates. Environmental health is “the branch of public health that is

Science of Networks in Communities (SONIC) Research Lab NKO Research Report 33
concerned with all aspects of the natural and built environment that may affect human health” (World Health Organization). Thus, the platform is predicated on the notion that humans are as likely to be victims of environmental pollution and climate change as they are causes of it. Climate change is thought to affect human health by exacerbating aero-‐allergens, air pollution and respiratory disease, extreme weather events, heat waves, mental health, vector-‐borne disease, and water and food-‐borne disease. Furthermore, the effects of climate change and other forms of environmental pollution tend to have a disproportionate effect on children, the elderly, and the poor. In that nearly 60 percent of the respondents indicated that health was a primary concern, it would be prudent to attempt to use “health” as a catalyst to get people talking about and motivated to do something about environmentally related issues, like climate change.

Science of Networks in Communities (SONIC) Research Lab NKO Research Report 34
About SONIC
The Science of Networks in Communities (SONIC) Research Lab helps organizations understand and meet the needs of diverse communities, using social network theories, methods, and tools. The group develops cutting-‐edge techniques to study and improve social and knowledge networks in large communities, such as distributed working groups, virtual teams, and online communities. Using a comprehensive methodology, SONIC researchers model, assess, validate, and enable the emergence of social and knowledge networks. SONIC also helps communities discover their existing communication and knowledge networks, diagnose their network’s health by measuring its robustness, connectedness, bottlenecks, etc., and design the social incentives and technical infrastructure needed for networks to function at optimal effectiveness. Project Team: Dr. Noshir Contractor Dr. Willem Pieterson Lindsay Young * Yu-‐Li Patrick Hsieh Hua Wang * For questions or comments pertaining to this report please contact Lindsay Young, Doctoral student at Northwestern University, at [email protected].