FINAL REPORT - Ministry of Minority Affairs
182
FINAL REPORT For CONDUCTING IMPACT AND EVALUATION STUDY OF THE CENTRAL SECTOR SCHEMEs BEING IMPLEMENTED BY MINISTRY OF MINORITY AFFAIRS, GOVERNMENT OF INDIA FOR THE SCHEME “SEEKHO AUR KAMAO” For MINISTRY OF MINORITY AFFAIRS 11 th Floor, Pt. Deendayal Antyodaya Bhawan, CGO Complex, Lodhi Road, New Delhi – 110003 Submitted by Prof Anjali Kaushik Prof Amit Kumar Gupta Prof Niva Bhandari Date: 09 October 2020 MANAGEMENT DEVELOPMENT INSTITUTE, GURGAON
-
Upload
khangminh22 -
Category
Documents
-
view
0 -
download
0
Transcript of FINAL REPORT - Ministry of Minority Affairs

FINAL REPORT
For
CONDUCTING IMPACT AND EVALUATION STUDY OF THE CENTRAL SECTOR SCHEMEs BEING IMPLEMENTED BY MINISTRY OF MINORITY AFFAIRS,
GOVERNMENT OF INDIA
FOR THE SCHEME “SEEKHO AUR KAMAO”
For
MINISTRY OF MINORITY AFFAIRS
11th Floor, Pt. Deendayal Antyodaya Bhawan,
CGO Complex, Lodhi Road, New Delhi – 110003
Submitted by
Prof Anjali Kaushik Prof Amit Kumar Gupta
Prof Niva Bhandari
Date: 09 October 2020
MANAGEMENT DEVELOPMENT INSTITUTE, GURGAON

2
TABLE OF CONTENTS
S no TITLE Page Number
1 Preface 11 2 Executive Summary 13 3 OVERVIEW OF THE SCHEME
3.1 About Ministry of Minority Affairs 18 3.2 Brief Background about the Scheme 18 3.3 Importance of the Scheme in Terms of National Priorities 19 3.4 Trends/Key Drivers of Intended Outcomes of the Scheme 20 3.5 Mechanism of Implementation 21 3.6 Issue and Implementation Challenges 23 3.7 Structure & Stakeholders
23
3.8 Role of the Private Sector 24 3.9 Contribution to the economy, job creation, and inclusion 24
3.10 Scheme performance on key metrics
24 3.11 Issues & Challenges 24 3.12 Past Studies Undertaken
24 3.13 Way Forward
25 4 STUDY OBJECTIVES
4.1 Scope of the Evaluation Study 26 4.2 Objective of the evaluation study
26
4.3 Outline of the Project Report
29 4.4 Concluding Remarks 30 5 STUDY APPROACH AND METHODOLOGY
5.1 Introduction
31 5.2 Methodology
31
5.3 Universe and sampling framework of the study
34 5.4 Demography details of the beneficiary
35
5.4.1 Beneficiaries: Gender 35 5.4.2 Beneficiary: Age
36
5.4.3 Beneficiary: Location Rural/Urban
37 5.4.4 Beneficiary: Minority category
38
5.4.5 Beneficiary: Training/ Trade Name – Overall
39 5.4.6 Beneficiary: Marital Status 40 5.4.7 Beneficiary: Disabled 40 5.4.8 Beneficiary: Educational qualification 41 5.4.9 Beneficiary: BPL cardholder 42
5.4.10 Beneficiary: Any Other Training Attended 42 5.4.11 Beneficiary: MGNREGA job card, Antodaya Card, etc 43
5.4.12 Conclusion 43 6 STUDY OBJECTIVES (BENEFICIARIES)
6.1 Introduction
44
6.2 Awareness and Encouragement 44

3
6.3 Scheme Performance Analysis (Relevance/ Effectiveness)
45 6.3.1 Drop out from School 45 6.3.2 School drop-out level 46 6.3.3 Reasons for School dropout 47 6.3.4 Reasons for Joining Seekho Aur Kamao Scheme 47 6.3.5 Reasons for Selecting the Job Role 48 6.3.6 Duration of the Course 49 6.3.7 Certificate Received 49 6.3.8 Challenges in joining the Seekho Aur Kamao Scheme 50 6.3.9 Skill Set Before and After attending the Training 50
6.3.10 Work Experience Before and After 51 6.3.11 Impact of Training on Type of Work 52 6.3.12 Impact of Training on Salary 52 6.3.13 Satisfaction/ Effectiveness: Quality of the Training
53
6.3.14 Satisfaction/ Effectiveness: Living Standard (does it fulfill the
54 6.3.15 Satisfaction/ Effectiveness: Job After Training 55 6.3.16 Satisfaction/ Effectiveness: Increase in Income After Training 56
6.3.17 Status of Employment: Placement / Self Employed 57 6.3.18 If got Placement, Private or Government 59 6.3.19 Is the income continuous or occasional 60 6.3.20 Employed in Organized or Unorganized Sector 61 6.3.21 If Self Employed, indicate the Sector 61 6.3.22 If Self Employed Have Trade Licence, Udyog Aadhar
62 6.3.23 Reasons for Leaving the Job 63 6.3.24 Distance of Job Location from Native Place 63 6.3.25 Willingness to accept a job at a place far away from the
65
6.3.26 Post Placement Support by the PIA 65 6.3.27 Has the Training been helpful in getting you Employment 66 6.3.28 Has the Training been helpful in enhancing your Business 67 6.3.29 Do You feel there is a Requirement of Skill Training Again 68
6.4 Feedback Section 69 6.4.1 Feedback on Teachers/ Trainers 69
6.4.2 Feedback on Course Material 70 6.4.3 Feedback on Staff 70 6.4.4 Feedback on Infrastructure 71 6.4.5 Feedback on Boarding/ Lodging 71 6.5 Suggestions for Improvement 72
6.5.1 Suggestions for Improvement in Course Material 72 6.5.2 Suggestions for Improvement in Teaching Methodology
73 6.6 Stipend Section 74
6.6.1 The Stipend was transferred timely into your bank account 74
6.6.2 Received the complete stipend, or it was less than the
75
6.6.3 Number of days to receive the Stipend 76

4
6.6.4 If delay in disbursement delay, what are the reasons 76 6.7 Conclusion 77 7 STUDY OBJECTIVES (PIA & STAKEHOLDERS)
7.1 Introduction
78
7.2 Sample Coverage 78 7.3 Demographics 79
7.3.1 Classification or Type of PIA 79 7.3.2 PIA Years of Experience in Training and Placement 80 7.3.3 Number of Trainings Conducted 81 7.3.4 Number of Batches Conducted in a Year 83 7.3.5 Biometric Attendance at PIA 84 7.4 Awareness and Mobilization 84
7.4.1 Special efforts made by PIA for Selection of Women 85 7.4.2 Special efforts made by PIA for Selection of Economically
86
7.4.3 Different selection method opted for the selection of trainees 88
7.4.4 Engaged NGO’s and Community in the administration of the
89 7.4.5 Role of NGO’s and Community in the administration of the
90
7.4.6 Is the Training Centre in Minority Concentrated Area 91 7.5 Identification and Selection of beneficiaries 92
7.5.1 External Linkage Provided by the PIA 92 7.5.2 Issues and Challenges faced in synchronizing activities with
93
7.5.3 Introduction of Entrepreneurship related Courses 94
7.5.4 If yes, how many hours of Course should be introduced? 95 7.6 Placements and Tracking 96
7.6.1 Number of allotted seats, Trainee trained, Trainee dropped,
96
7.6.2 Average Placement Salary Maximum Salary, and Minimum Salary, obtained through Placement
98
7.6.3 Most common skills opted by beneficiaries 100
7.6.4 Placement in Traditional/Modern Sector 101 7.6.5 Placement in Organized Sector 102 7.6.6 Reasons for drop out of Trainees from Seekho Aur Kamao
S h 103
7.6.7 Reasons for not taking Placement under from Seekho Aur K S h
104
7.6.8 Placement tie ups of PIA’s 104 7.6.9 Different methods used to keep track of trainees post
105
7.6.10 Reasons for losing contact with the trainee after the program 106
7.7 Documentation 106 7.7.1 Do you identify and document best practices and home-
106
7.7.2 Use of Case Studies in course material
107
7.7.3 Please share some examples of dissemination 107 7.7.4 Do you have any system of rewards for beneficiaries /
109

5
7.8 Issues and Challenges 110
7.8.1 Awareness Generation 110 7.8.2 Selection of beneficiaries 112 7.8.3 Linking with NSDC 112 7.8.4 Delivering Training Courses/ designing Training material 113 7.8.5 Getting Trainers 113 7.8.6 Managing Infrastructure 114 7.8.7 Managing hostel / Boarding/ Lodging facilities 115 7.8.8 Placement Tie ups 115 7.8.9 Post Placement Tracking 117
7.8.10 Financial Management and release of fund to beneficiaries 118 7.8.11 Capacity of staff with regard to communication skills and
120
7.8.12 Documentation and monitoring including reporting 121
7.8.13 Interaction and fund flow from government 122 7.8.14 Areas of Concern 123
7.9 Suggestions for Improvement 123 7.9.1 Monitoring System and Indicators used for that 123 7.9.2 Linking with NSDC 124 7.9.3 Placements 125 7.9.4 Documentation and reporting (and other governance related
126
7.9.5 Alternative means of certification of trainees through
127
7.10 Assets Created Services Provided Under the Scheme 128
7.10.1 Assets Created /Services increased in last 3 years 128 7.10.2 Turnover and Number of training centers (2017-18, 2018-19) 128 7.10.3 Number of States in which you are providing Training 129 7.11 TRAINERS 130
7.11.1 Trainers covered in the Survey 130 7.11.2 Qualification of Trainers 130
7.11.3 Monthly Salary of Trainers 131 7.11.4 Give individual short term and long term projects to Trainers 132 7.11.5 Challenges faced in giving training at the Institute: in terms of
132
7.11.6 For increasing entrepreneurship, do you think element of entrepreneurship related courses should be adopted
133
7.11.7 If Yes, how many hours of Training Course Check with beneficiary
133
7.11.8 Any other form of Training Provided at the Institute 134 7.11.9 Challenges faced by you in terms of Quality of Trainees 134
7.11.10 Have you attended Training of Trainers under NSDC 135 7.11.11 Suggestions for Improvement of Seekho Aur Kamao Training
136
7.12 EMPLOYERS 138
7.12.1 Sample Coverage 138 7.12.2 No. of trainees have you taken on employment from Seekho
138
7.12.3 Feedback: Quality of Trainees 139
7.12.4 Feedback: Training Curriculum/Course design 139

6
7.13 Conclusion 140 8 SUMMARY AND RECOMMENDATIONS
8.1 Introduction
141
8.2 Strategic Fit of the “Seekho Aur Kamao” Scheme vis-à-vis
141 8.2.1 Scheme performance analysis 141 8.2.2 Overall Findings from the PIAs, Trainers and Employers 152 8.3 Suggestions and Recommendations 155 8.4 Conclusion 156
LIST OF ANNEXURES ANNEXURE I: Name of the PIAs where the beneficiaries (respondents) have attended the Course: Overall ANNEXURE II: Name of PIA’s covered ANNEXURE III: Beneficiary Stories ANNEXURE IV: Beneficiary Questionnaire ANNEXURE V: PIA Questionnaire ANNEXURE VI: Trainer Questionnaire ANNEXURE VII: Employer Questionnaire LIST OF TABLES Table 3.1: Budgetary Outlay of Seekho Aur Kamao Table 3.2: Different processes to be undertaken by PIAs Table 5.1: Sample of Beneficiaries selected from the target states Table 5.2: Percentage of Beneficiaries (respondents) of different gender Table 5.3: Percentage of beneficiaries from a different location Table 5.4: Percentage of Beneficiaries (Respondents) of Different minorities category Table 5.5: Statewise educational Qualifications of the beneficiary (Respondents) Table 5.6. Percentage of beneficiary and Name of the other Training Attended Table 6.1: State-wise percentage of employment of respondents in the different sectors Table 6.2: Percentage of self-employed beneficiaries working for different sector Table 6.3: Percentage of Respondent who had registration or license required for self-employment Table 6.4: State-wise percentage of respondents who travel a distance to job location from native place Table 6.5: State-wise percentage of suggestion given by the respondents related to course materials Table 7.1: Sample of PIAs selected from the target states Table 7.2: State-wise percentage of PIAs Type belonging to the different registered entity Table 7.3: State-wise percentage of years of experience of the PIAs Table 7.4: State-wise number of training conducted by the PIAs Table7.5: State-wise number of batches trained in a year by the PIAs Table 7.6: State-wise Different selection criteria opted for the selection of trainees Table 7.7: State-wise Percentage of PIAs engage NGOs and Community in the administration of the scheme Table 7.8: State-wise percentage of training centers located in the minority concentrated area

7
Table 7.9: State-wise External linkages provided by the PIA Table 7.10: State-wise consent on adopting a course on entrepreneurship course Table 7.11: State-wise recommendations of course hours on entrepreneurship Table 7.12: Summary of enrollment and Placement Record of Beneficiaries from target states Table 7.13: State-wise percentage of Enrollment and Placements record Table 7.14: State-wise percentage Average Placement salary Table 7.14 A: Trade-wise percentage Average Placement salary Table 7.15: State-wise and overall actual Average, maximum, and minimum placement salary Table 7.16: State-wise turnover and number of training centers between 2017-18 and 2018-19 Table 7.17: State-wise average salary of the trainers selected for study
LIST OF FIGURES Figure 5.1: Methodology Figure 5.2: Represent beneficiaries selected from each target states Figure 5.3: Overall distribution of the Age of the beneficiaries Figure 5.4: States wise distribution of the Age of the beneficiaries Figure 5.5: Overall minorities category of beneficiaries (respondents) Figure 5.6: Graphical display of minorities category in different states Figure 5.7: Trade Name in which beneficiaries (respondents) were trained Figure 5.8: State-wise data of trade name received by beneficiaries (respondents) Figure 5.9: Marital status of the respondents (beneficiaries) Figure 5.10: Graphical representation of respondents' physical condition Figure 5.11: Overall educational Qualifications of the beneficiary (Respondents)
Figure 5.12: State wise beneficiaries (respondents) with BPL Card
Figure 5.13: Overall percentage of Beneficiary who Have another card like MGNREGA job card, Antodaya Card, etc. Figure 6.1: Overall distribution of respondents as per the source of Information for the “Seekho aur Kamao” Scheme Figure 6.2: Overall percentage of respondents who dropped out of the schools Figure 6.3: Statewise percentage of respondents dropped out of the schools Figure 6.4: Overall percentage of respondents dropouts at a different level Figure 6.5: Overall percentage of beneficiaries gave reasons for drop out of the school Figure 6.6: Overall percentage of respondent gave reasons for joining the scheme Figure 6.7: Overall reason for selecting the Job Role Figure 6.8: Reason for selecting the Job Role: Statewise Figure 6.9: Reason for selecting the Job Role: Statewise Figure 6.10: Certificate Received for Training Figure 6.11: Overall percentage of respondents mentioned the challenges in joining the scheme Figure 6.12: Overall Percentage of respondent impacted of training in skillset: Before and after training

8
Figure 6.13: Overall percentage of respondents had the impact of training in their work experience Figure 6.14: Overall percentage of respondents had the impact of training in the type of work Figure 6.15: Overall percentage of the respondents had a salary before and after training Figure 6.16: Overall percentage of respondents mentions satisfaction level on quality of training programme Figure 6.17: State-wise percentage of respondents mentions satisfaction level on quality of training program Figure 6.18: Overall percentage of respondents mentions satisfaction level on the living standard of family Figure 6.19: State-wise percentage of respondents mentions satisfaction level on the living standard of the family
Figure 6.20: Overall percentage of respondents mentions satisfaction level with the job after training
Figure 6.21: State-wise percentage of respondents mentions satisfaction level with the job after training Figure 6.22: Overall percentage of respondents mentions satisfaction level with the increase in income after training Figure 6.23: State-wise percentage of respondents mentions satisfaction level with the increase in income after training Figure 6.24: Overall percentage status of employments of the respondents Figure 6.25: State-wise percentage status of employments of the respondents Figure 6.25 A: Trade-wise percentage employments status of the respondents Figure 6.26: Overall percentage of respondents mentions the status of continuity in income Figure 6.27: State-wise percentage of respondents mentions the status of continuity in income Figure 6.28: Overall percentage of respondents Employed in Organized or Unorganized Sector Figure 6.29: State-wise percentage of respondents employed in Organized or Unorganized Sector Figure 6.30: Overall percentage of respondents: reason for leaving the job Figure 6.31: Overall percentage of respondents who travel a distance to job location from native place Figure 6.32: Overall percentage of respondents who are willing to travel far for Jobs Figure 6.33: State-wise percentage of respondents who are willing to travel far for Jobs Figure 6.34: Overall percentage of respondents responded on PPS Figure 6.35: State-wise percentage of respondents responded on PPS Figure 6.36: Overall percentage of respondents who responded whether the training is helpful for the employment Figure 6.37: State-wise percentage of respondents who responded whether the training is helpful for the employment Figure 6.38: Overall percentage of respondents who responded whether the training helps enhance business Figure 6.39: State-wise percentage of respondents who responded whether the training helps enhance business Figure 6.40: Percentage of respondents enquired about the requirement for skill training again

9
Figure 6.41: Overall feedback of the respondents on the different attribute of the Trainer/Teacher Figure 6.42: Overall Percentage of respondents gave feedbacks on different parameters of course material Figure 6.43: Overall percentage of respondents gave feedbacks on different attributes of staffs Figure 6.44: Overall percentage of respondents gave feedbacks on different facilities of building infrastructure Figure 6.45: Overall percentage of respondents gave feedbacks on Hotel and mess facilities Figure 6.46: Overall percentage of suggestion given by the respondents related to course materials Figure 6.47: Overall percentage of suggestions given by the respondents related to teaching methodology Figure 6.48: Overall percentage of respondent who responded on the timely transfer of stipend Figure 6.49: State-wise percentage of respondent who responded on the timely transfer of stipend Figure 6.50: Overall percentage of respondent receive the complete stipend Figure 6.51: State-wise percentage of respondent receive the complete stipend Figure 6.52: Overall percentage of respondent who mentioned the no. of days delay in stipend Figure 6.53: Overall percentage of respondent who gave the reasons for the delay in stipend Figure 7.1: Percentage of Sample of PIAs selected from the target states Figure 7.2 Overall percentage of PIAs Type belonging to the different registered entity Figure 7.3: Overall Percentage of years of experience of the PIAs Figure 7.4: Overall number of training conducted by the PIAs Figure 7.5: Overall number of batches trained in a year by the PIAs Figure 7.6: Overall percentage of PIAs having Biometric attendance Figure 7.7: Overall percentage of PIA uses the channels for spreading Awareness Figure 7.8: Overall Different selection criteria opted for the selection of trainees Figure 7.9: Overall Percentage of PIAs engage NGOs and Community in the administration of the scheme Figure 7.10: Percentage of training centers located in the minority concentrated area Figure 7.11: Overall External linkages provided by the PIA Figure 7.12: Overall consent on adopting a course on entrepreneurship course Figure 7.13: Overall recommendation of course hours on entrepreneurship Figure 7.14: Overall percentage Enrollment and Placements record Figure 7.15: Overall Average Placement salary Figure 7.16: Overall most common skills opted by Beneficiaries Figure 7.17: Overall percentage of placements in modern/traditional sectors Figure 7.18: State-wise percentage of placements in modern/traditional sectors Figure 7.19: Overall percentage of placements in Organized/unorganized sectors Figure 7.20: State-wise percentage of placements in Organized/unorganized sectors Figure 7.21: Reasons for dropping out of the training program Figure 7.22: Reasons for not getting Placements under the seekho aur Kamao program Figure 7.23: Different channels used by the PIAs for providing placements Figure 7.24: Different Methods used to keep track of trainee post placement after the course Figure 7.25: Reasons for losing the contact with the trainee after the program

10
Figure 7.26: Documentation maintained by PIAs related to best practices and innovation in form of case study Figure 7.27: State-wise documentation maintained by PIAs related to best practices and innovation in form of case study Figure 7.28: Use of developed case study as course materials Figure 7.29: Different area of concerns faced by the PIAs Figure 7.30: the asset and service created or increased in last 3 years Figure 7.31: Overall Turnover and number of training centers between 2017-18 and 2018-19 Figure 7.32: Number of state in which PIAs are providing trainings Figure 7.33: Percentage of trainer covered in the target states Figure 7.34: Educational qualification of Trainers selected for the study Figure 7.35: Overall average salary of the trainers selected for study Figure 7.36: Trainers who give individual short and long projects to the trainees Figure 7.37: Challenges faced in giving training at the institute on different factors Figure 7.38: Response of trainers regarding adopting entrepreneurship in the course Figure 7.39: Hours of entrepreneurship course as suggested by trainers Figure 7.40 Any other form of training provided for placements Figure 7.41: Percentage of trainers attended the training of trainers under NSDC Figure 7.42: Distribution of employers Figure 7.43: Number of trainee recruited by the employers Figure 7.44: Feedback on quality of trainee by the employers Figure 7.45: Employers feedback on training curriculum/course design

11
Preface
The study conducts impact and evaluation of Central sector scheme “SEEKHO AUR KAMO (LERAN and EARN)” being implemented by Ministry of Minorities Affairs (MoMA), Government of India, for the benefit of the notified minority communities. The ‘Seekho Aur Kamao’ scheme is a placement linked skill development scheme implemented since 2013-14 for minorities aiming to upgrade the skills of minority youth in various modern/traditional skills depending upon their qualification, present economic trends and market potential, which can earn them suitable employment or make them suitably skilled to go for self-employment. The Scheme is for six notified minority communities under National Commission for Minorities Act 1992(Muslims, Christians, Sikhs, Buddhists, Jains and Parsis).The scheme is primarily implemented by the Project Implementing Agencies (PIAs), who provide skill training in compliance with the National Skills Qualifications Framework (NSQF) and National Skill development corporation (NSDC). Why was the scheme introduced
• To bring down unemployment rate of minorities during 12th Plan period (2012-17). • To conserve and update traditional skills of minorities and establish their linkages with the
market. • To improve employability of existing workers, school dropouts etc. and ensure their
placement. • To generate means of better livelihood for marginalized minorities and bring them in the
mainstream. • To enable minorities to avail opportunities in the growing market. • To develop potential human resource for the country.
Features of this scheme
• Placement linked training programme for modern trades. • Skills Training Programme for Traditional Trades. • The training programme also includes soft skills training, basic Information and Technology
(I.T) and English training. • Project implementing agencies to ensure 75 percent employment and out of that 50 percent
in organized sector. • Mechanism for placement and post placement support. • 100 percent assistance by Ministry of Minority affairs of Government of India.
Impact and Evaluation Study Management Development Institute Gurgaon was selected the consultant to carry out the impact and evaluation study wide letter number 17011/1/2019-SAK-MoMA dated 13th July 2020. The

12
objective was to critically examine the impact of the training program on the Socio-economic status of the beneficiaries and their family, Performance of the PIAs, and constraints faced by the PIAs in executing the scheme on the ground, etc. The impact and evaluation study was done in nine Indian states. Questionnaires were developed to collect data from beneficiaries, PIAs, Trainers, and Employers using stratifies sampling method. The sample size was 1044 for beneficiaries and 52 for PIAs, 84 Employers and 120 Trainers. Beneficiaries were selected as per the guidelines of TOR. The detailed objectives of the scheme, research methodology, data analysis collected from beneficiaries, PIAs, Trainer, and employers, and finally findings of the study and recommendation are done in the respective chapters of the report.

13
Executive Summary
The Ministry of Minorities Affairs, GoI was carved out of the Ministry of Social Justice & Empowerment and created on 29th January 2006 to ensure a more focused approach towards the notified minority communities, namely Muslim, Christian, Buddhist, Sikhs, Parsis, and Jain. Based on the recommendations of the working group on “Empowerment of Minorities” for t h e 12th Five Year Plan, the Ministry of Minority Affairs launched the “Seekho Aur Kamao” Scheme (“Learn and Earn” Scheme) in the year 2013-14, a comprehensive skill development scheme to support productive employment among Minority youth in the age group of 14-45 years with a minimum of 5th-grade pass. Under the scheme, a minimum of 33% of seats are earmarked for girls/women trainees.
The objective of the scheme is to upgrade the skills of minority youth in various modern/traditional skills depending upon their qualification, present economic trends, and market potential, which can earn them suitable employment or make them suitably skilled to go for self-employment. The scheme is primarily implemented by the Project Implementing Agencies (PIAs), who provide skill training in compliance with the National Skills Qualifications Framework (NSQF) and National Skill development corporation (NSDC).
Ministry of Minorities Affairs (MoMA) has, vide letter No. 24/01/2019-Coord, Ministry of minorities affairs, dated 16.01.2020, proposed to conduct an “Impact and Evaluation study of central sector Scheme “SEEKHO AUR KAMAO” being implemented by MoMA across India.” The objective was to critically examine the impact of the training program on the Socio-economic status of the beneficiaries and their family, Performance of the PIAs, and constraints faced by the PIAs in executing the scheme on the ground, etc. The key impact areas need to be explored, and evidence-based information should be provided. The areas include (i) Skills enhancement, (ii) Improved quality of self and family of beneficiaries, (iii) Contribution of the scheme to Skill India Mission, and (iv) What difference it is making in beneficiaries’ life – a comparative study. Besides, the study should bring out success factors in the processes adopted during the Implementations, such as: (i) Mobilization and selection of beneficiaries, (ii) Identification and selection of skill development courses, (iii) placement tie-ups, placement, and tracking, and post-placement support and retention, (iv) documentation and reporting, and (v) Financial management and release of stipend to beneficiaries. A specific set of 'Terms of Reference (ToR)' for conducting the study on the implementation of Seekho aur Kamao across Indian states was a follows:
a. Scheme performance analysis i. To understand the status of the scheme performance in the country on key intended outputs and
outcomes ii. To qualitatively and quantitatively (based on a meta-analysis, if possible) map the actual
contribution against the intended contribution of a scheme to National Development Priorities and SDGs
b. Identification of problems/roadblocks in the implementation of the programme by the PIAs and suggestions to address them.
c. Assess the relevance, efficiency, effectiveness, equity, and sustainability of the scheme: i. Relevance/Appropriateness

14
• How do the PIAs see themselves in the role of agents of change, and are they able and willing to take on this role? What are their constraints? Is the situation conducive enough for the skill teachers to become agents of change?
• How are community members being engaged in the implementation at ground level? Who are the key stakeholders? What are their roles? Do they function well? How is cooperation in the skill centers? What kind of improvements have they introduced?
• How does the dropped-out student see themselves? Are they willing and capable of going through the process? What have been the challenges? How have they overcome these challenges?
ii. Effectiveness • Assess management and related aspects of the project. Have the objectives been attained? • Is the capacity of the teachers involved in skills training sufficient? • Are the training centers established in the Minority Concentrated Areas, if not? How far is the
center from MCAs? Why? • Are the training sessions being interactive? What are the best practices adopted? • Assess the capacities of the staff with regard to communication skills. Assess the extent to which
the staff understands the basic principles of an integrated scheme of skills. • Does the monitoring system function satisfactorily? Is there room for improvement? Are the
indicators used sufficient and adequate to evaluate the impact of the program? What should be adapted?
• What were the advantages and disadvantages of the project being part of a larger intervention? How is the programme being co-ordinated in the case of PIA who got projects in multiple states and run the scheme simultaneously in other states?
• Is allotting projects to PIAs in multiple states desirable, if so, on what conditions? What are the lessons learned?
• Is allotment of the project to be made to states or a Minority Concentrated Area (MCA) or a group of MCAs.
iii. Impact
• Can the present project design achieve the expected impact: can it be an effective catalyst to influence to contribute in Skill India Mission?
• Has the PIA/ Staff /teachers developed attitudes and skills to handle drop-out Minority youth and transforms them from unskilled to skilled man-power?
• To analyze the input use efficiency of the scheme, i.e., planned IEC activities for stakeholders and beneficiaries, institutional mechanism, fund flow (adequacy & timeliness) & utilization through public expenditure tracking, policy guidelines, and human resources allocated for the implementation of the schemes at central, state, district, block, and village, mechanisms to identify and reward best practices within the scheme design as well as M&E systems.
• To assess the coverage of the scheme in terms of eligible beneficiaries, geographies, etc. • To identify the key bottlenecks/issues & challenges in the implementation mechanisms
(governance mechanisms, awareness generation, stakeholder engagement & their roles & responsibilities, process & resource flow, capacities) of various development schemes.

15
• To assess the quality of assets created/services provided under the scheme and to see how far these assets/services benefitted the end beneficiaries.
• To assess the intended and actual convergence of the scheme to other developmental programmes of the Central and the State Governments as well as with private sector, CSR efforts, international multilateral and bilateral aid, etc.
• Also, identify gaps in the scheme outcomes in light of national priorities/SDGs not being addressed due to (a) absence of interventions or (b) non- performance of existing schemes/interventions
d. Cross-sectional Thematic Assessment
Assess the scheme on various cross-sectional themes like: i. Accountability and transparency
ii. Direct/indirect employment generation iii. Gender mainstreaming iv. Role of Indigenous People Development Policy v. Role of in mainstreaming of Tribal and Scheduled Caste population
vi. Use of IT/Technology in driving efficiency vii. Stakeholder & beneficiary behavioral change
viii. Research and Development ix. Unlocking Synergies x. Reforms & Regulations
xi. Impact on and role of the private sector, community, and civil society in the scheme
e. Best Practices and Externalities To identify and highlight any scalable best practices and home-grown innovations, if any, use and create case studies out of them to disseminate it for replication in other schemes/programmes. Also, capture the unintended consequences/negative externalities of scheme implementation and how these were triggered. Also, map them against the environmental and social safeguards in the scheme design.
f. Program Harmonization
Based on the above, analyze the need to continue the scheme in their existing form, modify, scaleup, scale-down, or close down the scheme. In case if they need to be modified, suggest revisions in the scheme design for the effective implementation in the future
The impact and evaluation study on the above points across the Indian states, questionnaires were developed to collect data from beneficiaries, PIAs, Trainers, and Employers. The sample size was 1044 for beneficiaries and 52 for PIAs. Beneficiaries were selected as per the guidelines of TOR.
Some of the observations are as follows:

16
• Challenge in joining the Seekho Aur Kamao Scheme: Lack of awareness (40%) about the scheme is the critical challenge of the scheme, though 34% and 26% of respondents also pointed the location of training centers and selection process adopted by the PIA, respectively as other challenges.
• Skill Set Before and After attending the Training: More than 3/4th of the respondents reported improvement in skill set after undergoing training in the Seekho Aur Kamao Scheme. Thus the scheme has been beneficial in enhancing the skill set.
• Impact of Training on Salary: Most of the respondents (92%) were not earning anything, but after undergoing the training through the “Seekho aur Kamao” Scheme, almost 70% of the respondent started to get a salary. The Scheme is seen to have a positive impact on the salary of the beneficiaries.
• Overall majority (77%) of the respondent were helped by the PIAs for getting the employments, either through placement or self-employment. Majority of the respondents (84%) were continuously getting the income even though most of the jobs were in the Private sector. It was observed that 66% of the overall beneficiaries (respondents) got placements in the organized sector (where workers were given salary slips). The scheme encourages the beneficiaries for self-employment. Up to 52% of the beneficiaries who choose self-employment generally engage in home-based work.
• Approximately 63% of the beneficiaries (respondents) reported that the training has been helpful in getting them the employment.
• The feedback on teachers/ trainers revealed that most of the beneficiaries are satisfied with counseling facilities (86%), the number of teacher/trainer (99%), interactive sessions (96%), and capabilities of teachers/trainers (98%).
• The feedback received on infrastructure from the beneficiaries (respondents) showed that majority (more than 80%) of the beneficiaries (respondents) found all the facilities associated with building infrastructure as suitable.
• The beneficiaries (respondents) were asked if the stipend is transferred into the bank account in a timely manner. Only 61% of the beneficiaries (respondents) reported to have received the stipend on time. It was observed that, overall, 39% of the respondent did not receive their stipend on time. The most important reason observed is the delay by the government in releasing the fund. The other major reason was related to delay in assessment.
• Most of the state PIA’s reported that the community engagement team especially encourages women candidates to apply for the training programs. The team conducts the house visits, meets the parents/guardians and briefs them about the program and its outcomes in detail.
• Overall, only 46% of the PIAs (respondents) engage the NGOs and communities in administration for better evaluation and improvement of the scheme as well as the better spread of the scheme among the minority community. The role of NGOs and communities can be improved.
• Some concerns were reported on the response-delays from SSC and at times from the Ministry. The SMART accreditation process itself is a little longer that involves scheme approval from the department before proceeding for Desktop assessment. The challenges reported were around the long alignment process of the centers with Ministry of Minority Affairs. Second challenge reported was the difficulty of procuring code for Aadhaar Based Biometric Attendance from the department. Third concern reported by the PIAs is about the delay in uploading batches in Skill India Portal due to unavailability of the scheme details on Skill India Portal at the time of filling information.

17
• The PIAs were asked if a course on entrepreneurship should be introduced. It was found that 94% of the PIAs respondents felt that a course on entrepreneurship should be introduced.
• Almost 96% of the beneficiaries trained through target PIAs got an average salary of more than Rs 5000, while 33% trainees got more than Rs 10000 as average salary. Overall average salary obtained by the trainees was more than Rs 9500.
• About 80% of the target PIAs indicated following reasons for the dropout of trainees from the Seekho Aur Kamao Programme (i) Family problem including health of family members (21%), (ii) Early marriage (21%), (iii) Poverty/low family income and need to support family (19%), and (iv) Migration/shifted to another place.
Some of the suggestions for improvement of the Seekho aur Kamao scheme based on this study are as follows:
• External linkages with the NSDC for skill training, with other PIAs to provide more options to the trainees related to skill selection and with NMDFC for funding may be improved
• There should be better integration between MoMA, NSDC and SSC to avoid any delay related to accreditation and assessment, possibly through making the interdepartmental workflow online. There should be timeliness at ministry level also.
• At least one-fourth of the PIA’s (respondents) reported problems related to Interaction and fund flow from the government. It is recommended that a PMU be set up at MoMA to take care of interaction with the stakeholders. There should be proper timeliness for assessments and other deliverable. PIA gave good example as Nayi Manzil scheme for such action.
• Most of the PIA’s also reported tracking of information related to beneficiaries as a problem. It is suggested that a proper database of beneficiaries enrolled in the Scheme, linked to Aadhar number, and a proper MIS which can support analytics be worked upon. PIAs may be provided access for Seekho aur kamao portal so that they can verify beneficiaries’ details and past scholarship availed by them. Where ever required PIAs may be given right to access to enter data in MoMA database.
• A course on entrepreneurship may be considered going forward. The course duration may be between 30-60 hours. The Employers also stressed upon provisioning for OJT and training on soft skills.
• PIAs also suggested for a Special coordination officer needed to be designated for better coordination between all stake holders as part of PMU.
It is felt that the scheme has immense potential to benefit all minority categories of the population if the scheme is administered properly. It has scope for further improvement. It is expected that the findings shared in the study shall help to improve the performance of the scheme across all Indian States.

18
CHAPTER-3
OVERVIEW OF THE SCHEME
3.1 About Ministry of Minority Affairs The Ministry of Minority Affairs was carved out of the Ministry of Social Justice & Empowerment and created on 29th January 2006 to ensure a more focused approach towards issues relating to the notified minority communities, namely Muslim, Christian, Buddhist, Sikhs, Parsis, and Jain. The mandate of the Ministry includes the formulation of overall policy and planning, coordination, evaluation, and review of the regulatory framework and development programmes for the benefit of the minority communities
Vision of Ministry of Minority Affairs Empowering the minority communities and creating an enabling environment for strengthening the multi-racial, multi-ethnic, multi-cultural, multi-lingual and multi-religious character of our nation
Mission To improve the socio-economic conditions of the minority communities through affirmative action and inclusive development so that every citizen has equal opportunity to participate actively in building a vibrant nation. To facilitate an equitable share for minority communities in education, employment, economic activities and to ensure their upliftment. 3.2 Brief Background about the Scheme The Ministry of Minority Affairs launched the “Seekho Aur Kamao” Scheme (“Learn and Earn” Scheme) in the year 2013-14 based on the recommendations of the Working Group on “Empowerment of Minorities” for t h e 12th Five Year Plan. “Seekho aur Kamao is a comprehensive skill development scheme to support productive employment among Minority youth in the age group of 14-45 years with at least 5th-grade pass. Under the scheme, a minimum of 33% of seats are earmarked for girl/women trainees.The objective of the scheme is to upgrade the skills of minority youth in various modern skills depending upon their qualification, present economic trends, and market potential, which can earn them suitable employment or make them suitably skilled to go for self-employment. The scheme is primarily being implemented by the Project Implementing Agencies (PIAs), who provide skill training in compliance with the National Skills Qualifications Framework (NSQF). However, exemption from Common Norms has been sought on provisions regarding ‘Stipend’ and ‘Post Placement Support’ which are being provided under the scheme. The exemption of Stipend and Post Placement Support from MSDE has been obtained. The main instrument for implementing the scheme will be results-oriented Performance Agreements between the Ministry of Minority Affairs (MoMA) and the PIAs to (i) provide support to eligible Minority youth to enroll and undertake training and assessment as per

19
applicable guidelines; (ii) impart high-quality skills training including soft skills leading to productive employment; and (iii) provide post-placement support to assist in obtaining sustainable employment for those students who enter the job market. 3.3 Importance of the Scheme in Terms of National Priorities India has experienced impressive growth in the past decade, and between 2005- 2012, nearly 138 million people were lifted out of poverty. These successes in human development, however, have not benefitted all sections of the Indian population equitably. Many of India’s marginalized citizens were yet to benefit from economic growth, and some groups continued to lag behind other groups in their access to a range of opportunities. The development indicators for Minorities are lower than the national average, and Muslims, constituting more than 75% of all Minorities, have lower labor market participation and earning attainment compared to other minorities. Indicators for other minority categories are relatively better, but there are substantial regional disparities. In Rural areas, the Workers Population Ration (WPR) among the males of all ages in 2004-05 was the highest among Christians (56%), followed by Hindus (55%), and then Muslims were the lowest (50%). Similarly, WPR for Females for Christians (36%) and Hindus (34%) was much higher than that for Muslims (18%). In Rural India, the unemployment rate was higher in Christians (44%), followed by Muslims (23%) and Hindus (15%). Similarly, in Urban India, the unemployment rate was highest among Christians (86%), followed by Hindus (44%) and Muslims (41%). According to reports of t h e Directorate General of Employment and Training (DGE&T)1, a majority of t h e Indian workforce does not possess a marketable skill, which is an impediment to getting decent employment and improving their economic condition. While India has a large young population, only 10% of the Indian labor forces – 8% informally and 2% formally have acquired vocational skills. About 63% of the school students drop out at different stages, reaching class- X. Only about 3.1 million vocational training seats are available in the country, whereas about 12.8 million persons enter the labor market every year. Even out of these training places, very few are available for early school dropouts. This signifies that a large number of school dropouts do not have access to skill development for improving their employability at one side and the availability of 12.8 million jobs on the other side. As per estimates of 2011, in India, there is a skill gap of about 244 million across 21 key sectors. According to Sachar Committee Recommendations, the country is going through a high growth
1 Directorate General of Employment and Training (DGE&T), 2020. Modular Employable Skills Training. Accessed at http://techedu.hp.gov.in/?q=mes-scheme#:~:text=A%20majority%20of%20Indian%20workforce,and%20improving%20their%20economic%20condition.&text=The%20main%20objective%20of%20the,workers%2C%20ITI%20graduates%2C%20etc.

20
phase. This is a time to help the underprivileged to utilize new opportunities through Skill development and education. A large segment of the Muslim community is engaged in self-employment activities. Besides, a significant proportion, especially women, is actually engaged in home-based work. While some of these workers are engaged in sectors that have experienced growth, many are engaged in occupations/ sectors that are stagnant. The policy intervention needs to help workers engaged in growth- oriented sectors to become part of the larger network of market-oriented firms involved in that sector. For those caught in the stagnant sectors, a transition path will have to be evolved. Skill up-gradation and credit availability will have an important role in both these strategies. National Skill Development Policy envisages that the skills and knowledge are the driving forces of economic growth and social development for any country. Countries with higher and better levels of skills adjust more effectively to the challenges and opportunities.2 India is in the transition to a knowledge-based economy, and its competitive edge will be determined by the abilities of its people to create, share, and use knowledge more effectively. This transition will require India to develop workers into knowledge workers who will be more flexible, analytical, adaptable, and multi-skilled. India has the advantage of a “demographic dividend. Harnessing the demographic dividend through appropriate skill development efforts would provide an opportunity to achieve inclusion and productivity within the country and also a reduction in the global skill shortages. Large scale skill development is thus an imminent imperative. 3.4 Trends/Key Drivers of Intended Outcomes of the Scheme The budgetary outlay of the scheme The Seekho Aur Kamao Scheme was launched in the year 2013-14. The budgetary outlay for 2013-14, 2014-15, 2015-16, 2016-17, 2017-18, 2018-19 and 2019-2020 are as follows:
Table 3.1: Budgetary Outlay of Seekho Aur Kamao
Financial Year Budget (in Crore) Allocated Expenditure (in Crore) 2013-14 17.0 17.0 2014-15 46.23 46.21 2015-16 192.45 191.96 2016-17 210.00 204.93 2017-18 200.00 199.80
2 National Skill Development Policy, 2009. Accessed at http://www.msde.gov.in/sites/default/ files/2019-09/National-Skill -Development-Policy-March-09.pdf

21
2018-19 250.00 175.21 2019-20 250.00 54.03*
*As on 30th September 2019 3.5 Mechanism of Implementation The scheme can be taken up anywhere in the country, but preference is given to organizations which aim at imparting training and propose the program for identified minority concentration district/ towns/ blocks. The trainee should belong to t h e Minority community as notified under the National Commission for Minorities Act 1992 (viz. Muslims, Christians, Sikhs, Buddhists, Jains, and Parsis). In the States/UTs where some other minority communities notified by respective State/UT Governments exist, they may also be considered eligible for the program. Certain particular pockets of concentration of minority populations within a non-minority district or city will also be considered. The trainee’s age between 14-45 years of age and 33% of the beneficiary seats will be earmarked for girl/women candidates. PIAs mobilized eligible beneficiaries to enroll for the Seekho Aur Kamao scheme through various strategies appropriate to their culture. The implementing agencies designed and undertook Advocacy / Information, Education & Communication (IEC), and awareness generation programs to catch the attention of maximum stakeholders. Different community mobilization methods were adopted, such as conducting meetings with community leaders, door to door home visits, setting up kiosks at popular places, local promotional and awareness camps, etc. The mobilized provided counseling in order to conduct a pre-selection screening of the candidates to identify appropriate skilling intervention needed and form batches accordingly. PIAs have to ensure that there was adequate support for students, ranging from counseling to learning assistance. Innovative teaching methods have also been adopted to make learning more effective, and students should be given adequate flexibility in terms of learning hours. All these factors were necessary in order to retain the candidates in the learning process. PIAs select courses that are National Skills Qualification Framework (NSQF) compliant. PIAs also adopt any other courses specific to local industry requirements that are NSQF compliant. The NSQF is a quality assurance framework in India that lays down nationally recognized competency standards for all qualifications.3 Seekho aur Kamao scheme applies a special focus on skill courses that are aligned to better jobs in the market. The PIAs are required to place successful candidates in regular employment in the sector in which he/she was trained. Employment in the formal sector is desirable, however, if that is not 3 Document for Credit Framework, Skills and education and NSQF, (2014). Department of Higher Education, MHRD, http://mhrd.gov.in

22
possible, then the PIA should ensure that the job provides for minimum wages as mandated in the state for semi-skilled workers, and the employer should provide for Provident Fund, Employment State Insurance (ESI), Pradhan Mantri Jeevan Jyoti Beema Yojana (PMJJBY) and other benefits to its staff. In order to attract employers, the PIA would establish regular contact with the industries in the local area and conduct job fairs either on its own or in partnership with the State Skill Development Mission. Placement assistance and counseling will be offered to all candidates, and placement must be ensured for a minimum of 70% of certified candidates, including self-employment and/or admission for higher studies and at least 50% in the organized sector. The timely distribution of monetary support to candidates is one of the key responsibilities of the PIA under Post Placement Support (PPS). The PIAs are also responsible for tracking and supporting the student for one year after they have completed the program. Post-placement support will include regular counseling to support candidates in their transition into the workplace and help them settle into their new jobs/vocation. PIA can do so either through visits at the workplace, or phone calls to candidates or any other method that is convenient.4 The different processes to be undertaken by PIAs in imparting skills training are presented as under:
Table 3.2: Different processes to be undertaken by PIAs Process Description
Skill Gap Assessment
a. PIAs should conduct a Skill Gap Study/Assessment to map the available skills among the youth in the catchment area, vis-à-vis the skills demanded in the job market.
b. Mapping the requirements of the beneficiaries and program objectives vis-à-vis market demand. The Skill Gap Study can be taken as a base for this.
Selection of Trade
a. Each participant will undergo a skill-based training program based on his/her aptitude and capability. This would also include relevant soft-skills and life-skills. The sector for skill training will be market relevant as assessed by the PIA during the skill gap study undertaken for the project.
b. Identify the level of the skill certification as prescribed in the NSQF. c. Identify the category of trade (Category I/II/III) as notified by the Common
Norms for Skill Development Schemes, GOI. The per- beneficiary cost for training will be determined accordingly.
Timing and duration of training
As notified by the Common Norms for Skill Development Schemes, GOI.
4 Seekho aur Kamao, 2020. Ministry of Minority Affairs, Government of India, 2020. New Delhi, India.

23
Teaching Dedicated teachers with domain knowledge of the relevant trades/sectors will be available Syllabus: For the skills training program, the syllabus would be as per / Qualification Pack-National Occupational Standard (QP-NOS) compliant with National Skills Qualification Framework (NSQF)
Language of teaching: English/ Hindi/any other local language
Learning materials: As prescribed by DGT/SSCs as well as PIA’s innovative teaching modules
Assessment and
The process of assessment and certification would be as per the stipulation of the Ministry of Skill Development and Entrepreneurship.
3.6 Issue and Implementation Challenges
a. Mobilization issues b. Certification of skill training c. Employment in the organized sector
3.7 Structure & Stakeholders
The key Stakeholders are: a. Ministry of minorities Affairs: Scheme formulization, PIA selection, Funding provisions,
course allocation, beneficiary allocation, and monitoring are ensured through the “ Seekho aur Kamao” scheme. Ministry also helps in center accreditation and assessment of beneficiary in collaboration with NSDC.
b. National Skill Development Corporation (NSDC): NSDC prepares for Course (Skill trade), PIA training facilities accreditations, monitoring of training program, and Assessments.
c. Project Implementing Agencies (PIAs): The scheme is implemented on the ground by the Project Implementing Agencies. PIA ensures mobilization and selection of beneficiary, Training Center preparation, Trainer selection, Training of the beneficiary, help for placements and self-employment, post-placement help, tracking of beneficiary post-placements, etc. As prescribed under the scheme, these PIAs could be Society of State Government/UT Administrations registered under Societies Registration Act, Any Private recognized/ registered professional institution of repute, Industry Association, Any institution of Central/State Governments including PSU and Training Institute, Civil Society / NGO meeting the specified criteria.
d. Beneficiary: Minority youth in the age group of 14-45 years with at least 5th-grade pass. Under the scheme, a minimum of 33% of the seats are earmarked for girl/women trainees. Th e Minority community, as notified under the National Commission for Minorities Act 1992 is Muslims, Christians, Sikhs, Buddhists, Jains, and Parsis.
e. Trainers and Employers: Trainers are selecting based on the guidelines given by the NSDC. Employers help in recruiting trained beneficiaries.

24
3.8 Role of the Private Sector The private sectors are helping or can help in the following ways
a. The private sector can be the project implementing agencies b. The private sectors are important employers in the scheme.
3.9 Contribution to the economy, job creation, and inclusion
The scheme aims to upgrade the skills of minority youth in various modern/traditional skills depending upon their qualification, present economic trends, and market potential, which can earn them suitable employment or make them suitably skilled to go for self-employment. Thus, since the inception of the scheme “SEEKHO AUR KAMAO,” around 4.6 Lakhs (2018-19) were selected for training. Around 3 Lacs (2017-18) beneficiary received the training, while more than 1 Lakh (2016-17) was placed.
3.10 Scheme performance on key metrics a. Quality of training programs and course module adopted b. Certification of trainees and certifying agencies c. Employment status of trainees d. Income level of trainees or their families before and after training and
changes/improvement in social/family aspects of the trainees e. To bring out the benefits accrued to the minority youth in terms of employment and
change in family income, if any. f. The challenges, including the social challenges being faced by PIAs in mobilization,
placement, and retention in the job during the post-placement tracking period. g. Assessment of satisfaction level of program h. The outcomes and recommendations to be analyzed keeping in view the national-level
socio-economic parameters of minorities.
3.11 Issues & Challenges a. Mobilization of trainee b. Placements/Employments: industrial exposure for the trainees (OJT), Organized sector. c. Course materials: Local language materials not available. d. Certification e. Monitoring and Inspection f. Fund flow and management g. Post placement support and tracking
3.12 Past Studies undertaken National Productivity Council (NPC), an autonomous body under the Department of Industrial Policy, has conducted t he evaluation and impact assessment of t h e “Seekho aur Kamao (Learn & Earn) scheme, a skill development scheme for minorities, including minority women.

25
The study was conducted in 8 States viz. Uttar Pradesh, Punjab, West Bengal, Assam, Bihar, Gujarat, Kerala, and Manipur for the period 2013-14 to 2015-16. Based on the study, it was found that more than 86% of trainees certified under the scheme have been employed based on the information made available by Project Implementing Agencies. The employment rate after training has increased to 93% in t h e case of male candidates and 83% in t h e case of female candidates. About 96% and 84% of the male and female candidates reported improvement in their living standards after placement. Besides, the employment rate of candidates who have undergone training in modern trade was reportedly 35% in the organized sector and 64% in the unorganized sector. In t h e case of candidates from traditional trade, 18% were employed in t h e organized sector and 82% in the unorganized sector. 3.13 Way Forward It is evident from the outcome of the evaluation and impact assessment carried out by past studies that the Scheme has been well accepted by the targeted beneficiaries and has been able to generate gainful employment besides improving the economic condition of minority communities. It has also emerged that it meets the skill up-gradation requirement of minority youths in modern and traditional trades besides empowering them to face the market challenges and avail employment opportunities. The real challenge now lies in increasing the scale of the scheme and its adoption in delivery through the private and public sectors. In view of above, it is opined that the ‘Seekho aur Kamao’ scheme has achieved its outlined objective to a considerable extent so far.

26
CHAPTER-4
STUDY OBJECTIVES
4.1. Scope of the Evaluation Study Scope of the study is to evaluate the scheme “Seekho aur Kamao” (“Learn & Earn”) in nine (9) States suggested by MoMA. The assessment of the scheme is based on the Beneficiary, PIAs data provided by MoMA for selected nine (9) States of Uttar Pradesh, Punjab, Delhi/Harayana (NCR), West Bengal, Rajasthan, Gujarat, Kerala, and Tripura. a. Possible area of inquiry
The central purpose of the evaluation study is to assess the contribution of the scheme to the enhancement of livelihoods of the targeted minority youth. The key impact areas need to be explored, and evidence-based information should be provided. The areas include:
i. Skills enhancement ii. Improved quality of self and family of beneficiaries
iii. Contribution of the scheme to Skill India Mission iv. What difference it is making in beneficiaries’ life – a comparative study
Besides, the study should bring out success factors in the processes adopted during the Implementations, such as:
i. Mobilization and selection of beneficiaries ii. Identification and selection of skill development courses
iii. Placement tie-ups iv. Placement and tracking v. Post-placement support and retention
vi. Documentation and reporting vii. Financial management and release of stipend to beneficiaries
Further, the study should overall identify the areas of improvement for enhancing the impacts under the scheme. This would be mainly with the issues and challenges, if any, faced by the PIAs in synchronizing their activities with Skill India Mission and coordinating with Sector Skill Councils. The study should identify ways, means in which Ministry can improve the coordination of main stakeholders and, if necessary, provide alternative means of certification of trainees through authorized entities.
4.2. Objective of the evaluation study g. Scheme performance analysis iii. To understand the status of the scheme performance in the country on key intended
outputs and outcomes

27
iv. To qualitatively and quantitatively (based on a meta-analysis, if possible) map the actual contribution against the intended contribution of a scheme to National Development Priorities and SDGs
b. Identification of problems/roadblocks in the implementation of the programme by the PIAs and suggestions to address them.
c. Assess the relevance, efficiency, effectiveness, equity, and sustainability of the scheme: i. Relevance/Appropriateness
• How do the PIAs see themselves in the role of agents of change, and are they able and willing to take on this role? What are their constraints? Is the situation conducive enough for the skill teachers to become agents of change?
• How are community members being engaged in the implementation at ground level? Who are the key stakeholders? What are their roles? Do they function well? How is cooperation in the skill centers? What kind of improvements have they introduced?
• How does the dropped-out student see themselves? Are they willing and capable of going through the process? What have been the challenges? How have they overcome these challenges?
ii. Effectiveness • Assess management and related aspects of the project. Have the objectives been
attained? • Is the capacity of the teachers involved in skills training sufficient? • Are the training centers established in the Minority Concentrated Areas, if not? How
far is the center from MCAs? Why? • Are the training sessions being interactive? What are the best practices adopted? • Assess the capacities of the staff with regard to communication skills. Assess the
extent to which the staff understands the basic principles of an integrated scheme of skills.
• Does the monitoring system function satisfactorily? Is there room for improvement? Are the indicators used sufficient and adequate to evaluate the impact of the program? What should be adapted?
• What were the advantages and disadvantages of the project being part of a larger intervention? How is the programme being co-ordinated in the case of PIA who got projects in multiple states and run the scheme simultaneously in other states?
• Is allotting projects to PIAs in multiple states desirable, if so, on what conditions? What are the lessons learned?
• Is allotment of the project to be made to states or a Minority Concentrated Area (MCA) or a group of MCAs.

28
iii. Impact • Can the present project design achieve the expected impact: can it be an effective
catalyst to influence to contribute in Skill India Mission? • Has the PIA/ Staff /teachers developed attitudes and skills to handle drop-out
Minority youth and transforms them from unskilled to skilled man-power? • To analyze the input use efficiency of the scheme, i.e., planned IEC activities for
stakeholders and beneficiaries, institutional mechanism, fund flow (adequacy & timeliness) & utilization through public expenditure tracking, policy guidelines, and human resources allocated for the implementation of the schemes at central, state, district, block, and village, mechanisms to identify and reward best practices within the scheme design as well as M&E systems.
• To assess the coverage of the scheme in terms of eligible beneficiaries, geographies, etc.
• To identify the key bottlenecks/issues & challenges in the implementation mechanisms (governance mechanisms, awareness generation, stakeholder engagement & their roles & responsibilities, process & resource flow, capacities) of various development schemes.
• To assess the quality of assets created/services provided under the scheme and to see how far these assets/services benefitted the end beneficiaries.
• To assess the intended and actual convergence of the scheme to other developmental programmes of the Central and the State Governments as well as with private sector, CSR efforts, international multilateral and bilateral aid, etc.
• Also, identify gaps in the scheme outcomes in light of national priorities/SDGs not being addressed due to (a) absence of interventions or (b) non- performance of existing schemes/interventions
d. Cross-sectional Thematic Assessment Assess the scheme on various cross-sectional themes like: xii. Accountability and transparency
xiii. Direct/indirect employment generation xiv. Gender mainstreaming xv. Role of Indigenous People Development Policy
xvi. Role of in mainstreaming of Tribal and Scheduled Caste population xvii. Use of IT/Technology in driving efficiency
xviii. Stakeholder & beneficiary behavioral change xix. Research and Development xx. Unlocking Synergies
xxi. Reforms & Regulations xxii. Impact on and role of the private sector, community, and civil society in the scheme

29
e. Best Practices and Externalities To identify and highlight any scalable best practices and home-grown innovations, if any, use and create case studies out of them to disseminate it for replication in other schemes/programmes. Also, capture the unintended consequences/negative externalities of scheme implementation and how these were triggered. Also, map them against the environmental and social safeguards in the scheme design.
f. Program Harmonization Based on the above, analyze the need to continue the scheme in their existing form, modify, scaleup, scale-down, or close down the scheme. In case if they need to be modified, suggest revisions in the scheme design for the effective implementation in the future
4.3. Outline of the Project Report The report consists of an executive summary and eight chapters including the chapter on Overview of the scheme, which embodies the brief background about the Scheme along with its brief features, the importance of the scheme in terms of National Priorities, Mechanism of implementation, Structure & Stakeholders of the scheme, and scheme performance on key metrics Chapter 5 embodies the detailed methodology adopted by the project team. These details are about the target population (Beneficiaries, PIAs & other Stakeholders), target sample units for collection of data from the four sets of the population (Beneficiaries, PIAs, Trainers, and ), Meta-analysis plan, Focus group discussion, data collection instruments/ methods (structured or semi-structured questionnaires), preparation of the analysis plan and sampling design, triangulation of the data of different sources, coding and cleaning of data for the purpose of analysis, demographic representation of beneficiaries (mainly in the form of frequency distribution/ tabulation, and graphical). Chapter 6 presents the analysis of data collected from 1044 beneficiaries of the Seekho aur Kamao scheme covered under this study. These beneficiaries are from the nine states of India. The data was collected using a structured and semi-structured questionnaire given in the Annexure. Analysis of the data is presented in subsequent sections of this chapter. The brief of these sections i s listed as under: Analysis of awareness and encouragement is discussed in section 6.1, while scheme Performance Analysis (Relevance/ Effectiveness) is covered in section 6.2. Beneficiary feedback on PIAs resources and infrastructure are discussed in section 6.3, feedback on Teachers/ Trainers, course material, staff, infrastructure, boarding/ Lodging of the scheme in 6.4; suggestions for Improvement in course material, teaching methodology adopted by Trainers is

30
covered in section 6.5; the status of stipends to the beneficiaries is elaborated in section 6.6 and the last section 6.7 is on conclusion. Chapter 7 presents the analysis of data collected from the Project implementing agency (PIA) and other stakeholders. This Chapter is covered in two Parts. Part I covers the data collected from PIAs, and the Part II covers data collected from the Trainers/teachers and Employers. In Part I, background in the form of Demographics are covered in section 7.1, Analysis of awareness and mobilizations is discussed in section 7.2, while identification and selection of beneficiaries in section 7.3. Analysis of placements and tracking are done in section 7.4, issue and challenges faced by PIAs in section 7.5, suggestions for policymakers for improving the performance of the scheme in 7.6. analysis of assets created and services provided by PIAs are covered in section 7.7. In Part II, the analysis of information collected from trainers on different parameters are covered in section 7.8. analysis of feedback received from employers, related to the trainee, PIAs, course, and training are covered in section 7.9. Chapter 8 consists of finding and recommendation with respect to various objectives of the assignment. These findings are based on three sets of data, i.e., (i) data collected from different stakeholders, (ii) data collected from beneficiaries on almost similar parameters, and (iii) data collected from different secondary resources. 4.4. Concluding Remarks This chapter has tried to discuss the Scope of the evaluation study of the scheme “Seekho aur kamao.” The chapter describes the areas of inquiry and objectives of the evaluation study for the “Seekho aur Kamao” scheme (2018-19) required to be covered as part of the evaluation study. The next chapter of the report will discuss the detailed research methodology applied in this study.

31
CHAPTER-5
BENEFICIARIES RESPONSE DATA ANALYSIS
5.1. Introduction This chapter primarily deals with the methodology of data collection, data analysis, and data presentation in the subsequent sections of this chapter. Four sets of data were collected for the purpose of t h e evaluation of the Seekho Aur Kamao scheme across India. The first set of data was about Project Implementation Agencies (PIA’s). The second set of data was collected about beneficiaries of the “Seekho Aur Kamao” scheme. The third set of data was collected from trainers conducting the training under the “Seekho Aur Kamao” scheme. The fourth set of data was collected from the Employers who had provided placement opportunities to beneficiaries under the scheme. 5.2. Methodology The methodology involves meta-analysis, designing of the discussion guides for focus group discussions, interview guides for in-depth interviews, and structured questionnaires/schedules for studies, Preparation of the analysis plan and Sampling design. The steps are elaborated in the following paragraphs.
A. Meta-analysis The data and methods will involve a review of:
a. National and International development goals and scheme documents; b. Financial data on allocation and expenditures of the scheme; c. Annual reports of the ministry/department for output and outcome assessment; d. Available evaluation reports for output and outcomes assessment; e. Annual progress reports and implementation documents to assess the institutional
arrangements; f. Available evaluation reports are done at the district and state level, for the
states/districts covered under field study, if applicable; g. Evaluations are done by non-government agencies.
Based on meta-analysis and key informant interviews, and community, the evaluation study will provide insights into reasons for the success and failure of scheme design, institutional arrangements, human resources, political economy considerations, among others. The study will also provide strategic insights into:
a. Gaps between intended and actual outcomes both due to lack of specific interventions and failure or poor outcomes of existing schemes;
b. Institutional and human resource failures and best practices;

32
c. Institutional provisions for monitoring and evaluation; d. Degree of adoption of the outcome-output framework5; e. Adoption of technology for effective scheme implementation; f. Political economy constraints and scheme design constraints/provisions, among others.
Figure 5.1: Methodology
B. Designing of the discussion guides for focus group discussions, interview guides for in-depth interviews, and structured questionnaires/schedules for studies
a. Key informant interviews & focus group discussions: Herein, it is proposed that key informant interviews with ministry/department personnel at the national level, officials/teaching staff of project implementing Agencies, other stakeholders supporting implementation or indirectly involved in enabling the scheme’s success such as National Skill Development Corporation and employers and other opinion makers at different levels are contacted. Additionally, focus group discussions will be conducted, involving implementing stakeholders, opinion-makers as well as selected beneficiaries. National level key informants should also include national-level think tanks, institutions, prominent non-profit organizations, government officials.
b. Focused Group Discussion (FGD) The team has conducted TWO Focus Group Discussions (FGD). Each FGD comprised of 15-20 Beneficiary, and 15-20 PIAs, approx. Five employers and 5 Trainers/teachers.
The main purpose of the FGD I. Requirement of RFP
II. Gather information through discussions to understand the issues and challenges faced by the PIA’s and beneficiaries and to discuss improvements in the “SEEKHO AUR KAMAO” Scheme.
III. Pretest the questionnaire.
5 Output Outcome Framework, 2019. For major central sector and Centrally Sponsored Schemes. Available at: http://mohua.gov.in/upload/uploadfiles/files/output% 20outcome%20frame%20work%202019-2020.pdf. Accessed on 07-07-2020.
Data Collection from PIA/Beneficiaries across 8-9 states through Survey
and Face to Face discussions. (within the
scope of study)
Cleansing and Validation of Data
Data Analysis and
Preparation of Report
Questionnaire designing and
Validation

33
The Team has conducted the FGD on 19th and 24th August 2020; in mutual consultation with the MoMA. Officials from MoMA were also present and helped the team during the interactions. c. Questionnaire Design: A qualitative study backed with extensive meta-analysis may be adopted to provide the scheme assessment. The questionnaire (structure) will be formed in consultation with MoMA. A focus group interview will also be conducted with the help of MoMA. Probable information required through the questionnaire will address all the objectives of the study, Like
I. Demographics including socio-economic status (Trainee) II. Information on infrastructure, facilities, and resources (PIAs).
III. Problem and issues related to enrolment, placements, and training (PIAs) IV. Income and social status of trainees before and after the training (trainee).
Separate questionnaires were created for I. Beneficiary
II. PIA III. Employers IV. Trainer/Teachers
C. Preparation of the analysis plan and Sampling design
a. Field Study Method Sampling Method –
I. The stratified sampling method is adopted based on the • Percentage of Beneficiary and PIA concentration in a Geographical coverage • Percentage of Religious group concentration
II. Survey Administration is done by the local Marketing research expert in local languages.
III. Due to the Covid-19 Scenario Mixed survey channel may have opted (some state is following complete lockdown, and some states have critical case rate): Personal, on-Phone, online video meetings, etc.
IV. b. Proposed Sample size
I. The study will be conducted in 8-9 States (states are decided in consultation with MoMA).
II. More than 50 PIAs are contacted in total. III. A total of more than 900 beneficiaries have interacted across the selected states IV. Around 100 Teachers/Trainers are also interacted
34
c. States selected for the Field Study: The team has contacted the stakeholders for the study across the following states:
I. North: Uttar Pradesh; Punjab; Delhi/ Haryana (NCR) II. West: Gujarat; Rajasthan
III. East: West Bengal IV. North East: Manipur V. South: Kerala
d. Beneficiary Household surveys: A selected sample of household surveys was conducted to assess the beneficiary-level impact of the scheme. However, this household survey design may be quasi-quantitative in nature. Additionally, the key information areas to be covered in the discussion guides/questionnaires for key informant interviews and beneficiary surveys should cover data points included but not limited to NITI Aayog’s Output-Outcome Monitoring Framework for corresponding schemes. Collecting and compiling the quality data from selected areas and Collation and data cleaning. Data collected are validated through phonic calls or through personal visits to the concerned PIAs. Data, once collected, are compiled and cleaned using different statistical techniques and tools for finding unengaged respondents, inconsistency, capture sensitivity, and univariate & multivariate outliers. Excel tools and other statistical packages may be employed for the purpose.
D. Running data analysis
The collected data, cleaned through the cleansing process, is used to analyze the key performance indicators using Qualitative techniques like trend analysis, Pareto, etc. and statistical tools like SPSS, Stata, MS-Excel.
5.3. Universe and sampling framework of the study The actual sample size for this study was 1044 beneficiaries. The sample coverage is as shown in Table 5.1. The study included survey of 52 Project Implementation Agencies (PIA), 120 Trainers and 84 Employers. The criteria for selecting sampling units were as per guidelines listed in the ToR concerning the ratio of beneficiaries given to the implementing agencies, sectors of the projects/units, the social background of the beneficiaries, etc.
Table 5.1: Sample of Beneficiaries selected from the target states
State No. of
Beneficiaries No. of Beneficiaries
(%)

35
The number of beneficiaries from each state covered for collecting data of beneficiaries is also in Table 5.1 and graphically represented in Figure 5.2.
Figure 5.2: Represent beneficiaries selected from each target states
5.4. Demography details of the beneficiary This section covers the data analysis of the demography of the beneficiaries. The demographic selected for the study were (a)Age, (b)gender, (c)marital status, (d) education level, (e) religion, (f)location, (g) minority concentrated districts, (h) Trade type, (i) BPL cardholders
5.4.1. Beneficiaries- Gender The beneficiaries were asked their gender in the questionnaire. The scheme has a 33% reservation for female beneficiaries. As shown in Table 5.2, the total percentages of female and male beneficiaries administered are 36% and 64%, respectively.
10% 12% 11% 10% 10% 12% 14% 11% 10%
0% 5%
10% 15%
Sample Coverage: No. of Beneficiaries
Delhi 105 10%
Gujarat 127 12%
Haryana 119 11%
Kerala 101 10%
Manipur 103 10%
Punjab 125 12%
Rajasthan 142 14%
Uttar Pradesh 119 11%
West Bengal 103 10%
Total Beneficiaries
1044 100%

36
Table 5.2: Percentage of Beneficiaries (respondents) of different gender
Beneficiaries: Gender Male (%) Female (%)
Delhi/ Haryana(NCR) 64% 36% Gujarat 69% 31% Kerala 59% 41%
Manipur 49% 51% Punjab 44% 56%
Rajasthan 47% 53% Uttar Pradesh 58% 42% West Bengal 49% 51%
Total Beneficiaries 64% 36%
5.4.2. Beneficiary: Age The beneficiaries were asked to share their age in the questionnaire. Figure 5.3 and 5.4 represents the distribution of Age overall and statewide, respectively. The majority of the beneficiaries (40%) belong to the age groups of 22-25 years. Beneficiaries from most of the states are in the age group of “up to 21” to “22-25” years. Beneficiaries in the age group “more than 35 years” are merely 2%.
Figure 5.3: Overall distribution of the Age of the beneficiaries
33%
40%
17%
8%
2% Overall distribution of the Age of the beneficiaries
Upto 21 years 22 to 25 years 26 to 30 years 31 to 35 years More than 35 years

37
Figure 5.4: States wise distribution of the Age of the beneficiaries
5.4.3. Beneficiary: Location Rural/Urban The evaluation study of the scheme requires an assessment of beneficiaries (respondents) belonging to both Urban and rural areas. The total percentage of respondents from rural and urban areas was 37% and 63%, respectively. As shown in Table 5.3, maximum percentages of the rural respondents (58%) were from Haryana while maximum percentage of urban respondents were from Manipur (73%).
Table 5.3: Percentage of beneficiaries from a different location
Beneficiaries: Location Urban (%) Rural (%)
Delhi 48% 52% Haryana 42% 58% Gujarat 71% 29% Kerala 68% 32%
Manipur 73% 27% Punjab 72% 28%
Rajasthan 56% 44% Uttar Pradesh 62% 38% West Bengal 84% 16%
Total Beneficiaries 63% 37%
0%
10%
20%
30%
40%
50%
60%
70%
80%
Delhi Haryana Gujarat Kerala Manipur Punjab Rajasthan Uttar Pradesh
West Bengal
Age of beneficiaries: Statewise (Years)
Upto 21 years 22 to 25 years 26 to 30 years 31 to 35 years More than 35 years

38
5.4.4. Beneficiary: Minority category The “Seekho aur Kamao” scheme aims at upgrading or imparting the skills to the minority youths. This minority category consists of Muslims, Christians, Sikhs, Buddhists, Parsis, and Jains. The scheme also considers 15% of beneficiaries belonging to BPL families of the non-minority community. The beneficiaries (respondents) were mostly from the Muslim minority category (57%).
Table 5.4: Percentage of Beneficiaries (Respondents) of Different minority’s category
Minority Category Muslim Christian Buddhist Sikh Jain Hindu
Delhi 95% 0% 0% 5% 0% 0% Haryana 67% 20% 0% 6% 6% 2% Gujarat 75% 0% 0% 19% 1% 5% Kerala 59% 37% 0% 0% 0% 4%
Manipur 40% 60% 0% 0% 0% 0% Punjab 10% 0% 0% 88% 2% 1%
Rajasthan 65% 0% 0% 26% 8% 1% Uttar Pradesh 83% 0% 0% 13% 0% 4% West Bengal 14% 24% 32% 0% 0% 30%
Total Beneficiaries
57% 14% 3% 19% 2% 5%
Buddhist respondents were mostly from West Bengal (32%), while Sikh (88%) and Christians (60%) were from Punjab and Manipur, respectively. Jain respondents were mostly from Rajasthan (8%) and Haryana (6%). Non-minorities beneficiaries (respondent), i.e., Hindus, were mainly from West Bengal, as shown in Table 5.4, Figure 5.5, and Figure 5.6.
Figure 5.5: Overall: Minority category of beneficiaries (respondents)
57%
14% 3%
19%
2% 5%
0%
20%
40%
60%
Muslim Christian Buddhist Sikh Jain Hindu
Beneficiaries: Minority Category - Overall

39
Figure 5.6: Graphical display of minority category in different states
5.4.5. Beneficiary: Training/ Trade Name – Overall The beneficiaries are trained with different sets of trade skills as accredited by NSDC. Figures 5.7 and 5.8 represents beneficiaries (respondents) trained in different skill type, i.e., Accounting/tally, Tailoring, plumbing, beauty parlor, etc. The maximum beneficiary (respondents) were trained in tailoring (19%), electricians (14%), computers (11%), aviation (10%) and nursing (9%) as shown in Figure 5.7.
Figure 5.7: Trade Name in which beneficiaries (respondents) were trained
As shown in Figure 5.8, the beneficiaries received training in Gujarat, Utter Pradesh, Delhi, West Bengal, Haryana are Mechanic & construction, plumbing & basic medical operator, Home furnishing & nursing, Food and beverages & BPO, and Accounting/tally respectively.
0% 10% 20% 30% 40% 50% 60% 70% 80% 90% 100%
Delhi Haryana Gujarat
Kerala Manipur
Punjab Rajasthan
Uttar Pradesh West Bengal
Beneficiaries: Minority Category - Statewise
Muslim Christian Buddhist Sikh Jain Hindu
6% 17%
2% 4% 4%
1% 11%
5% 14%
2% 10%
6% 1%
9% 6%
2%
0% 2% 4% 6% 8% 10% 12% 14% 16% 18%
Accounting/ Tally Apparel/ Tailor
Basic Medical Operator/ MIHRT Beauty Parlour
BPO - Non Voice English Speaking
DCA/ Computer Courses Construction
Electrician Plumber
Avaition/GDA Home Furnishing
Hotel/Food & Beverages Nursing/MHIRT
Retail Mechanic
Trade Name in which beneficiaries (respondents)

40
Figure 5.8: State-wise data of trade name received by beneficiaries (respondents)
5.4.6. Beneficiary: Marital Status Beneficiaries were asked to inform their marital status. The marital status of the beneficiaries chosen for the study is graphically represented in Figure 5.9. Most of the beneficiaries (respondents) (79%) were unmarried, and about 21% are married.
Figure 5.9: Marital status of the respondents (beneficiaries)
5.4.7. Beneficiaries: Disabled The scheme “Seekho aur Kamao” has a reservation of about 2.5% for a disabled person belonging to the minority category. Figure 5.10 shows the percentage of the respondent with and without
0% 10% 20% 30% 40% 50% 60% 70% 80% 90% 100%
Accounting/ Tally Apparel/ Tailor
Basic Medical Operator/ MIHRT Beauty Parlour
BPO - Non Voice English Speaking
DCA/ Computer Courses Construction
Electrician Plumber
Avaition/GDA Home Furnishing
Hotel/Food & Beverages Nursing/MHIRT
Retail Mechanic
Training/Trade Name: Statewise
Delhi Haryana Gujarat Kerala Manipur Punjab Rajasthan Uttar Pradesh West Bengal
21%
79%
Marital status of the respondents (beneficiaries)
Married Unmarried

41
disabilities assessed for the study. The respondents with disabilities selected for the study are 2% of the total sample, as shown in Figure 5.10.
Figure 5.10: Graphical representation of respondents' physical condition
5.4.8. Beneficiary: Educational qualification The beneficiaries (respondents) were asked to mention their education level in the questionnaire. The distribution of the respondents based on the educational level is shown in Figure 5.11 and Table 5.5. As observed in Figure 5.11, most of the beneficiaries (respondents) are either 12th pass (45%) or graduates (36%).
Figure 5.11: Overall educational Qualifications of the beneficiary (Respondents)
As shown in Table 5.5, the Respondents from Kerala are mostly graduates (93%), and 78% of respondents from Manipur are 12th pass. Respondents from Punjab are mostly 10th (36%) or 12th (34%) pass.
Table 5.5: State wise educational Qualifications of the beneficiary (Respondents)
Educational Qualifications
5th Pass
8th Pass
10th Pass
12th Pass
Graduate and above
Delhi 0% 3% 11% 50% 35%
2%
98%
Physical Condition of the Respondents
Yes No
1%
6% 12%
45%
36%
Overall educational Qualifications of the beneficiary (Respondents)
5th Pass 8th Pass 10th Pass 12th Pass Graduate and above

42
Haryana 0% 0% 7% 54% 39% Gujarat 4% 29% 5% 55% 8% Kerala 0% 0% 0% 7% 93%
Manipur 0% 0% 4% 78% 18% Punjab 0% 7% 36% 34% 22%
Rajasthan 1% 4% 14% 39% 42% Uttar Pradesh 0% 8% 9% 41% 41% West Bengal 0% 2% 17% 48% 33%
Total Beneficiaries 1% 6% 12% 45% 36%
5.4.9. Beneficiary: BPL cardholder The scheme is for the marginalized minorities as well as 15% of non-minorities having a BPL card. The beneficiaries (respondents) were asked to mention whether they have a BPL card. As shown in Figure 5.12, majority of the beneficiaries (respondents) from Kerala (77%), Manipur(79%), Punjab(76%), Utter Pradesh(64%), and West Bengal (64%) are BPL cardholders.
Figure 5.12: State wise beneficiaries (respondents) with BPL Card
5.4.10. Beneficiary: Any Other Training Attended The beneficiaries were asked if they have attended any other training program apart from training received through the “Seekho aur Kamao” scheme. As shown in Table 5.7, the Beneficiaries (respondents) from Kerala (100%), Rajasthan (78%), Utter Pradesh (77%), and overall (79%) had already undergone training in Basic computer. Similarly, 22% of respondents from Rajasthan and 23% from Utter Pradesh had already received training through Kausal Vikash.
Table 5.6: Percentage of beneficiary and Name of the other Training Attended
Name of another training attended
Basic Computer Course Kaushal Vikash
32% 41%
8%
77% 79% 76%
41%
64% 64% 68% 59%
92%
23% 21% 24%
59%
36% 36%
0%
20%
40%
60%
80%
100% State wise beneficiaries (respondents) with BPL Card
Yes No

43
Delhi 0% 0% Haryana 0% 0% Gujarat 0% 0% Kerala 100% 0% Manipur 0% 0% Punjab 0% 0% Rajasthan 78% 22% Uttar Pradesh 77% 23% West Bengal 0% 0% Total Beneficiaries 79% 21%
5.4.11. Beneficiary: MGNREGA job card, Antodaya Card, etc The beneficiaries were asked to mention the ID card details. ID details were recorded for minorities status clarification, economic status, and for the database of the trainee who received the benefit of the scheme “Seekho aur Kamao.” As shown in Figure 5.13, maximum respondents (90%) have either of ID cards like MGNREGA job card, Antodaya card, etc.
Figure 5.13: Overall percentage of Beneficiary who Have another card like MGNREGA job card, Antodaya Card, etc.
5.4.12. Conclusion This chapter focused on the methodology of the study and the analysis of the demographic details of the beneficiaries. Methodology covered Sampling design, including Meta-analysis, Focused group discussion, questionnaire design, sample size, and target beneficiary states. The chapter also analyzed the demographics of the beneficiaries in terms of their Age, Gender, Marital status, educational classification, minority categories, location, trade of training, minority concentration districts, disabilities, BPL cardholders, Any other similar training attended, and beneficiary carrying other cards like MGNREGA job card, Antodaya Card, etc. In the next chapter, an analysis of the evaluation study based on key performance indicators is performed using information received from the beneficiaries.
10%
90%
Have another Card: Beneficiaries
Yes No

44
CHAPTER-6
BENEFICIARIES RESPONSE DATA ANALYSIS
6.1 Introduction The objectives of the Seekho Aur Kamao Scheme are ( i ) to bring down the unemployment rate of minorities (Muslims, Christians, Sikhs, Buddhists, Jains, and Parsis), (ii) to conserve and update the modern and traditional skills of minorities and establish their linkages with the JOB market, (iii) to improve the employability of existing workers, school dropouts, etc. and ensure their placement, (iv) to generate means of better livelihood for marginalized minorities and bring them in the mainstream, (v) to enable minorities to avail opportunities in the growing market, (vi) to develop potential human resource for the country. Keeping these objectives of the scheme and terms of reference in view, data was collected on the different parameters/dimensions of the schemes. These dimensions/ parameters are ( i ) level of awareness and encouragement for “Seekho aur Kamao” scheme, (ii) scheme Performance Analysis (Relevance/ Effectiveness), (iii) beneficiary feedback on PIAs resources and infrastructure, (iv) suggestions for policymakers for improving the performance of the scheme, (v) status of stipends to the beneficiaries. In all, 1044 beneficiaries were part of this study from nine states across India. The data was collected in August-September 2020, having personal interviews with beneficiaries. The data is collected using a structured and semi-structured questionnaire.
Analysis of the data is presented in subsequent sections of this chapter. Analysis of awareness and encouragement is discussed in section 6.1, while scheme Performance Analysis (Relevance/ Effectiveness) is covered in section 6.2. Beneficiary feedback on PIAs resources and infrastructure are discussed in section 6.3, suggestions for policymakers for improving the performance of the scheme in 6.4. Finally, the status of stipends to the beneficiaries is elaborated in section 6.5.
6.2 Awareness and Encouragement Sources of Awareness of the Seekho Aur Kamao Scheme
The beneficiaries (respondents) were asked regarding the sources of awareness of the “Seekho Aur Kamao” Scheme. As shown in Figure 6.1, word of mouth is a critical source of awareness (approx. 24%) followed by awareness through the newspaper (15%), pamphlet/poster/banner (12%) and then Internet (12%). Awareness through camps by Government Agencies can be improved, which is currently at 7%. Use of social media should be encouraged to increase awareness about the scheme amongst the potential beneficiaries.
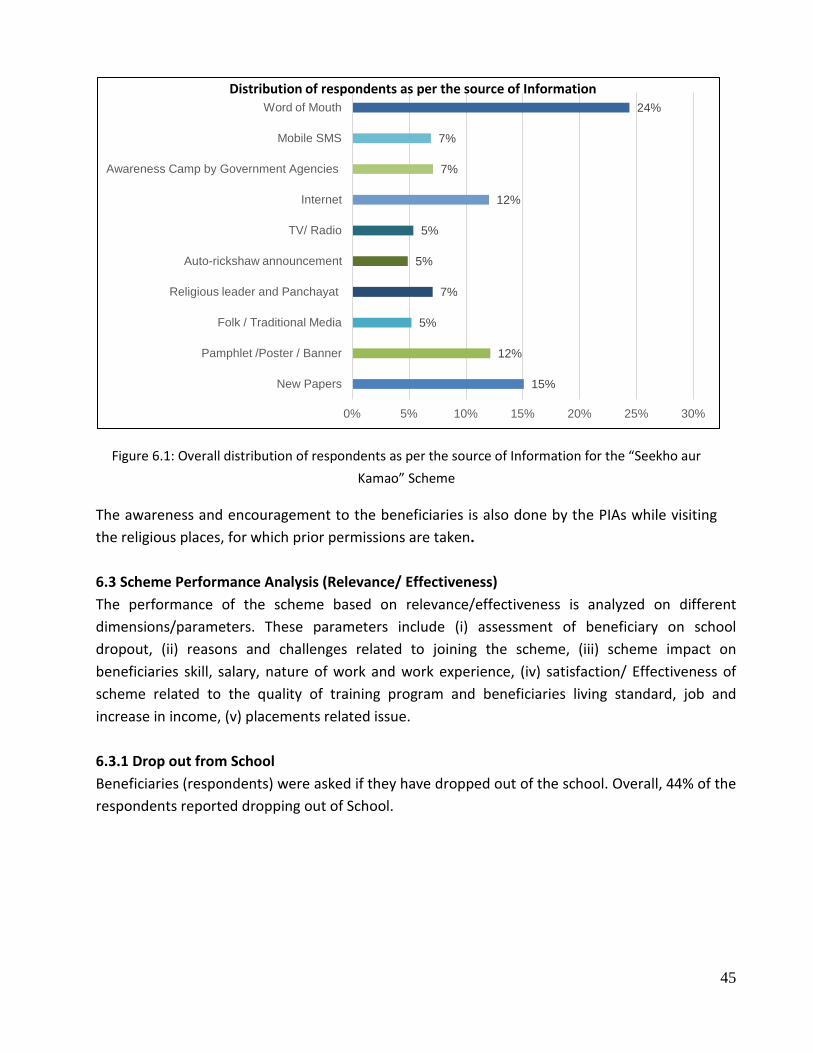
45
Figure 6.1: Overall distribution of respondents as per the source of Information for the “Seekho aur Kamao” Scheme
The awareness and encouragement to the beneficiaries is also done by the PIAs while visiting the religious places, for which prior permissions are taken.
6.3 Scheme Performance Analysis (Relevance/ Effectiveness) The performance of the scheme based on relevance/effectiveness is analyzed on different dimensions/parameters. These parameters include (i) assessment of beneficiary on school dropout, (ii) reasons and challenges related to joining the scheme, (iii) scheme impact on beneficiaries skill, salary, nature of work and work experience, (iv) satisfaction/ Effectiveness of scheme related to the quality of training program and beneficiaries living standard, job and increase in income, (v) placements related issue. 6.3.1 Drop out from School Beneficiaries (respondents) were asked if they have dropped out of the school. Overall, 44% of the respondents reported dropping out of School.
15%
12%
5%
7%
5%
5%
12%
7%
7%
24%
0% 5% 10% 15% 20% 25% 30%
New Papers
Pamphlet /Poster / Banner
Folk / Traditional Media
Religious leader and Panchayat
Auto-rickshaw announcement
TV/ Radio
Internet
Awareness Camp by Government Agencies
Mobile SMS
Word of Mouth Distribution of respondents as per the source of Information

46
Figure 6.2: Overall percentage of respondents who dropped out of the schools
The respondent from Punjab (72%) included the maximum percentage of school dropouts while respondents of Kerala (5%) had the lowest percentage of school dropouts, as shown in Figure 6.3.
Figure 6.3: Statewise percentage of respondents dropped out of the schools
6.3.2 School drop-out level The scheme is meant to upgrade or impart the skill to these marginalized minorities to better their livelihood. Most of the respondents selected for the study (63%) have dropped out in the 12th grade while 1% in 5th or before, as shown in Figure 6.4. The figure 6.4 also shows that atleast 65% of the respondents completed and studied beyond class X.
44% 56%
School dropout beneficiaries: Overall
Yes No
60% 53% 38%
5%
41%
72%
33% 50%
36%
40% 47% 62%
95%
59%
28%
67% 50%
64%
0%
20%
40%
60%
80%
100%
120%
Delhi Haryana Gujarat Kerala Manipur Punjab Rajasthan Uttar Pradesh
West Bengal
Statewide percentage of respondents dropped out of the schools
Yes No

47
Figure 6.4: Overall percentage of respondent’s dropouts at a different level
6.3.3 Reasons for School dropout The beneficiaries were asked to provide the reasons for dropping out of the school. Figure 6.5 summarises the different reasons for the school dropouts. Family problems (including the health of family members)(30%) and poverty/low family earning & need to support by working immediately/forced to work (38%) are the critical reasons for dropping out of the schools.
Figure 6.5: Overall percentage of beneficiaries gave reasons for drop out of the school 6.3.4 Reasons for Joining Seekho Aur Kamao Scheme The scheme is meant to uplift the livelihood of the marginalized minorities by imparting a different set of skills. The beneficiary may be joining the scheme due to various reasons. Thus, respondents are requested to express their reasons for joining the program. Figure 6.6 summarize the overall
1%
14%
0%
19%
2%
63%
0%
10%
20%
30%
40%
50%
60%
70%
5th or before 8th 9th 10th 11th 12th
Percentage of respondent’s dropouts at a different level
5th or before 8th 9th 10th 11th 12th
38%
30%
7%
6%
4%
4%
5%
6%
0% 5% 10% 15% 20% 25% 30% 35% 40% 45%
Poverty/ Low family earning and need to support by working immediately/ Forced to work
Family problems (including health of family members etc)
Self Health Problems
School far in distance
Non availability of girls toilet
Migration/ shifted to another place
Take care of brother or sister (sibling)
Early marriage Reasons for School dropout

48
reasons for joining the program. Most of the respondents (27%) pointed to skill enhancement as the main reason. However, other reasons like improvement in salary(24%), education(25%), and job/role change (24%) are also there for joining the Seekho aur Kamao Scheme.
Figure 6.6: Overall percentage of respondent gave reasons for joining the scheme
6.3.5 Reasons for Selecting the Job Role The beneficiaries were asked to provide the reasons for selecting the Job role. Figure 6.7 summarises the different reasons for selecting the Job role. Better salary (39%) was reported as the main reason followed by prior experience/ education as the other main reason for selecting a Job role (34%). Family background and convenience also emerged as the other reasons.
Figure 6.7: Overall reason for selecting the Job Role
24%
27%
24%
25%
21%
22%
23%
24%
25%
26%
27%
28%
Job/ role change Enhancement of Skill Improvement in Salary Improvement in Education
Reason to join Seekho Aur Kamao Programme: Overall
39%
34%
20%
6%
Reason for selecting the job role: Overall
Better Salary Prior Experience/ Education Family Background Convenience

49
Figure 6.8 represents the reasons for selecting a job role state wise. In Kerala state, salary is seen to be the main driver for selecting the job role. While discussing with the Beneficiaries, it was observed that PIAs recommendations and Placement is also the reason for selecting a job role.
Figure 6.8: Reason for selecting the Job Role: State wise
6.3.6 Duration of the Course The beneficiaries were asked to share the duration of the course that they have attended. As can be seen in Figure 6.9, 32% of the beneficiaries reported to have attended a course upto 3 months, 34% attended a course between 3-6 months and 21% between 6-9 months.
Figure 6.9: Reason for selecting the Job Role: Statewise 6.3.7 Certificate Received The beneficiaries were asked to share if they have received a certificate for the course. As can be seen in Figure 6.10, majority of the respondents (60%) reported to have received a certificate as part of the training programme.
0%
20%
40%
60%
80%
100%
Delhi Haryana Gujarat Kerala Manipur Punjab Rajasthan Uttar Pradesh
West Bengal
Reason for selecting the job role: Statewise
Better Salary Prior Experience/ Education Family Background Convenience
33%
34%
21%
2% 11%
Duration of the Course
upto 3 months 3-6 months 6-9 months
9-12 months More than 12 months

50
Figure 6.10: Certificate Received for Training 6.3.8 Challenges in joining the Seekho Aur Kamao Scheme Apart from the reasons for joining the scheme, beneficiaries face challenges in joining the scheme. Thus, the respondents were asked to mention the challenges they faced while joining the “Seekho aur Kamao” scheme. Lack of awareness (40%) about the scheme is the critical challenge of the scheme, though 34% and 26% of respondents also pointed the location of training centers and selection process adopted by the PIA, respectively as other challenges, as shown in Figure 6.11.
Figure 6.11: Overall percentage of respondents mentioned the challenges in joining the scheme
6.3.9 Skill set before and after attending the Training The main objectives of the scheme to uplift the overall social-economic status of the minority categories. The respondents were assessed on key performance indicators. Since the scheme is related to imparting the skill-based training, thus one of the questions asked in the questionnaire was on skill improvements. It was observed from Figure 6.12 that respondents before joining the
60%
40%
Certificate received: Overall
Yes No
40%
26%
34%
Challenge in joining the Seekho Aur Kamao Scheme: Overall
Lack of Awareness Selection process for adopting for training by PIA was difficult. Location

51
scheme either did not had any knowledge of skill (41%) or had a basic knowledge of skill (59%). But After receiving the training through the “Seekho aur Kamao” Scheme, respondents' skill is improved (23%) or became professional (77%). More than 3/4th of the respondents reported improvement in skill set after undergoing training in the Seekho Aur Kamao Scheme. Thus the scheme has been beneficial in enhancing the skill set.
Figure 6.12: Overall Percentage of respondent impacted of training in skillset: Before and after training
6.3.10 Work Experience Before and After To measure the impact of the scheme, the respondents were asked to mention their job experience status before and after joining the scheme. As can be observed from Figure 6.13, majority of the respondents did not have any job experience (81%) before joining the scheme. But After receiving the training through the “Seekho aur Kamao” Scheme, respondents with no experience reduced to 24%. Therefore, it may be interpreted that the scheme has helped in getting jobs and has positively impacted the beneficiaries.
Figure 6.13: Overall percentage of respondents had the impact of training in their work experience
41%
59%
23%
77%
0% 10% 20% 30% 40% 50% 60% 70% 80% 90%
Does not have any knowledge
Basic knowledge Skilled has been improved Become Professional
Skill set_BEFORE JOINING the Scheme Skill Set_AFTER TRAINING the Scheme
Impact of training in skill set: Before training and after training: Overall
81%
9% 4% 2% 4%
24%
8%
20%
33%
15%
0% 10% 20% 30% 40% 50% 60% 70% 80% 90%
No experience
Upto 3 months
3 to 6 months
6 to 12 months
more than 12 months
No experience
Upto 3 months
3 to 6 months
6 to 12 months
more than 12 months
Work Experience_Before joining the training Work Experience_after the training
Impact of training in the work experience of Beneficiaries

52
6.3.11 Impact of Training on Type of Work The nature or type of work is another performance indicator used for the impact assessment. The respondents were asked to mention their nature or type of work before and after undergoing the training. The respondents who were either studying (29%) or were doing nothing (54%) after the Seekho aur Kamao training programme became skilled (50%) or certified professional workers (27%), as shown in Figure 6.14. Therefore, the nature of job is seen to change and there has been a positive impact of training on this parameter.
Figure 6.14: Overall percentage of respondents had the impact of training in the type of work
6.3.12 Impact of Training on Salary The impact of salary is another performance indicator; thus, respondents (beneficiaries) were asked to mention their salary before and after the training program. As can be seen in figure 6.15, most of the respondents (92%) were not earning anything, but after undergoing the training through the “Seekho aur Kamao” Scheme, almost 70% of the respondent started to get a salary. The Scheme is seen to have a positive impact on the salary of the beneficiaries.
54%
29%
14% 14%
50%
27% 23%
0%
10%
20%
30%
40%
50%
60%
Nothing Study Skilled work Unskilled work Skilled has been improved
& become skilled worker
Become certified
professional worker
Basic knowledge improved
Type of Work_BEFORE JOINING the Scheme Type of Work_AFTER TRAINING the Scheme
Impact of Training on the Type of Work of Beneficiaries

53
Figure 6.15: Overall percentage of the respondents had a salary before and after training.
6.3.13 Satisfaction/ Effectiveness: Quality of the Training Programme The beneficiaries were asked regarding the satisfaction with the quality of the training programme. The respondents were asked to rate the scheme on the satisfaction scale based on different parameters. As can be seen in figure 6.16, overall 92% of the respondents expressed satisfaction with the quality of the training programme.
Figure 6.16: Overall percentage of respondents mentions satisfaction level on quality of training programme
Most of the states reported that the respondents were satisfied with the quality of the training programmes. However, more number of respondents from Punjab (28%) reported dissatisfaction with the quality of the training programme (see figure 6.17).
92%
2%
3%
2%
23%
14%
35%
27%
0% 10% 20% 30% 40% 50% 60% 70% 80% 90% 100%
Nil
upto Rs 5000
Rs. 5000 to 10000
More than Rs 10000
Nil
upto Rs 5000
Rs. 5000 to 10000
More than Rs 10000 Sa
lary
_Bef
ore
join
ing
the
sche
me
Sala
ry_a
fter
the
Trai
ning
Salary Before and After Training
8% 10%
8%
50%
23%
Satisfaction: Quality of Training Programme
Not at all Satisfied Less satisfied Moderately satisfied
Very satisfied Most satisfied

54
Figure 6.17: State-wise percentage of respondents mentions satisfaction level on quality of training program
6.3.14 Satisfaction/ Effectiveness: Living Standard (does it fulfill the livelihood requirement of the Family) The respondents were asked to rate the scheme on the satisfaction scale based on the parameter of Living Standard of the family i.e does the scheme fulfil the livelihood requirement of the family. As shown in Figure 6.18, 89% of the respondents reported satisfaction on the enhancements of the living standard of the family.
Figure 6.18: Overall percentage of respondents mentions satisfaction level on the living standard of family
0%
20%
40%
60%
80%
100%
120%
Delhi Gujarat Haryana Kerala Manipur Punjab Rajasthan Uttar Pradesh
West Bengal
Satisfaction: Quality of the Training Programme
Not at all Satisfied Less satisfied Moderately satisfied Very satisfied Most satisfied
11%
9%
12%
48%
20%
Satisfaction/ Effectiveness: Living Standard (does it fulfil the livelihood requirement of the family)
Not at all Satisfied Less satisfied Moderately satisfied
Very satisfied Most satisfied

55
As can be seen in Figure 6.19, most of the states reported high satisfaction with the improvement in the family living standard while satisfaction was seen to be lower from the respondents from Punjab.
Figure 6.19: State-wise percentage of respondents mentions satisfaction level on the living standard of the family
6.3.15 Satisfaction/ Effectiveness: Job After Training The respondents were asked to rate the scheme on the satisfaction scale based on the nature of the job. As can be seen in Figure 6.20, majority (82%) of the respondents were satisfied with the improvement of the nature of the job after undergoing the training programme
Figure 6.20: Overall percentage of respondents mentions satisfaction level with the job after training
0% 20% 40% 60% 80%
100% 120%
Delhi Gujarat Haryana Kerala Manipur Punjab Rajasthan Uttar Pradesh
West Bengal
Satisfaction/ Effectiveness: Living Standard (does it fulfil the livelihood requirement of the family)
1.Not at all Satisfied 2.Slightly satisfied 3.Moderately satisfied
4.Very satisfied 5.most satisfied
18%
6%
14%
33%
29%
Satisfaction: Job after Training
Not at all Satisfied Less satisfied Moderately satisfied
Very satisfied Most satisfied

56
While majority of the respondents from states reported satisfaction, with improvement in the job after training, 51% of the respondents from Punjab were dissatisfied with the nature of the job after training.
Figure 6.21: State-wise percentage of respondents mentions satisfaction level with the job after training
6.3.16 Satisfaction/ Effectiveness: Increase in Income After Training The respondents were requested to rate the scheme on the satisfaction scale based on the increase in income after completing the training. As can be seen in Figure 6.22, majority (80%) of the respondents were satisfied or neutral with the rise in income after the training programme.
Figure 6.22: Overall percentage of respondents mentions satisfaction level with the increase in income after training
0%
20%
40%
60%
80%
100%
120%
Delhi Gujarat Haryana Kerala Manipur Punjab Rajasthan Uttar Pradesh
West Bengal
Satisfaction: Job after Training
Not at all Satisfied Less satisfied Moderately satisfied
Very satisfied Most satisfied
20%
4%
13%
41%
23%
Satisfaction: Increase in Income After Training
Not at all Satisfied Less satisfied Moderately satisfied
Very satisfied Most satisfied

57
Similarly, as shown in Figure 6.23, state-wise observation showed that majority of the respondents from states reported satisfaction with the increase in the income after training, while respondents from Punjab were dissatisfied (55%). Some respondents from Delhi, Rajasthan, and Uttar Pradesh also reported less satisfaction in terms of an increase in the income after training.
Figure 6.23: State-wise percentage of respondents mentions satisfaction level with the increase in income after training
6.3.17 Status of Employment: Placement / Self Employed This section is on status of employment, whether it is placement or self employed and covers related aspects such as whether the employment is in traditional or non-traditional sector; in organized or unorganized sector and whether the income is continuous.
Placement Assistance in getting Employment The data was collected to know the employment status of the beneficiaries (respondents) after the completion of the training programme. As can be seen in Figure 6.24, overall majority (77%) of the respondent were helped by the PIAs for getting the employments, either through placement or self-employment. Beneficiaries shared that the training centers also helped them in preparing for placements.
0%
20%
40%
60%
80%
100%
120%
Delhi Gujarat Haryana Kerala Manipur Punjab Rajasthan Uttar Pradesh
West Bengal
Satisfaction: Increase in Income after Training
Not at all Satisfied Less satisfied Moderately satisfied Very satisfied Most satisfied

58
Figure 6.24: Overall percentage status of employments of the respondents
Similarly, the state-wise status of employment is summarized in Figure 6.25. It can be observed that 100% of beneficiaries (respondents) of Kerala and Manipur were either placed or helped through self-employment. Similarly in West Bengal up to 97% of the beneficiaries were having some means of earning. The status of employment with respect to Punjab (31%) was seen to be lower and may require more effort from the PIAs.
Figure 6.25: State-wise percentage status of employments of the respondents
Figure 6.25 A represents trade-wise employment status. Beneficiaries opted to take training in trades like fashion design, hotel management, machine maintenance, nursing and interior designing got 100% employments, either through placements or self-employments.
43%
34%
23%
Status of Employment: Placement / Self Employed
placement self_employed unemployed
31% 37% 37%
64% 67%
25% 30% 27%
58%
42% 34% 38%
36% 33%
5%
28% 49%
39% 27% 29% 25%
0% 0%
69%
42% 24%
3%
0%
20%
40%
60%
80%
100%
120%
Dehi Gujarat Haryana Kerala Manipur Punjab Rajasthan Uttar Pradesh
West Bengal
State-wise percentage status of employments of the respondents
placement self_employed unemployed

59
Figure 6.25 A: Trade-wise percentage employments status of the respondents
6.3.18 If got Placement, Private or Government Based on the data collected from the beneficiaries (respondents) related to the sector in which the placements are done, it was found that overall, most of the placements helped through PIAs are in the Private sector (99%). As can be seen in Table 6.1, Rajasthan (5%) and Delhi (3%) are the only states where some placements are done government sector.
Table 6.1: State-wise percentage of employment of respondents in the different sectors If yes above, indicate employed
in Private Government
Delhi 97% 3%
Haryana 100% 0%
Gujarat 100% 0%
Kerala 100% 0%
Manipur 100% 0%
Punjab 100% 0%
Rajasthan 95% 5%
50%
11% 35%
80%
11%
63% 38%
8% 35% 45%
60% 61% 75%
60%
5%
80% 73%
7%
47%
1%
65% 43%
50%
39% 0%
0%
44%
0% 37%
38%
52% 45% 25% 15%
25% 40%
47%
15% 27%
87%
49%
37%
35%
34%
0%
50% 65%
20% 44% 37% 25%
54%
13% 11% 15% 24% 0% 0%
47%
5% 0% 7% 5%
62%
0% 23%
0%
20%
40%
60%
80%
100%
120%
Trade-wise employment status
Placement Self-employed Un-employed

60
Uttar Pradesh 100% 0%
West Bengal 100% 0%
Total Beneficiaries 99% 1%
6.3.19 Is the income continuous or occasional The scheme also aims at providing sustained income to its beneficiaries. Thus to check this aspect, beneficiaries (respondents) were asked to mention the continuity status of their income. As can be seen in Figure 6.26, majority of the respondents (84%) were continuously getting the income.
Figure 6.26: Overall percentage of respondents mentions the status of continuity in income West Bengal (65%) had more respondents who were not getting income on a continuous basis ( See Figure 6.27).
Figure 6.27: State-wise percentage of respondents mentions the status of continuity in income
84%
16%
Status of Income : Continuous or Occasional
Continuous Occasional
79% 84% 100% 100% 97% 100% 95%
80%
35% 21% 16%
0% 0% 3% 0% 5% 20%
65%
0%
20%
40%
60%
80%
100%
120%
Delhi Haryana Gujarat Kerala Manipur Punjab Rajasthan Uttar Pradesh
West Bengal
Is the Income Continuous or Occasional: Statewise
Continuous Occasional

61
6.3.20 Employed in Organized or Unorganized Sector One of the requirements from PIAs in the scheme is to place 50% of the beneficiaries in the organized sector. From Figure 6.28, it was observed that 66% of the overall beneficiaries (respondents) got placements in the organized sector (where workers were given salary slips).
Figure 6.28: Overall percentage of respondents Employed in Organized or Unorganized Sector When the data was analyzed statewise, it did not give a similar trend. Beneficiaries from Punjab (15%) and West Bengal (6%) did not satisfy the requirement of 50% in organized sectors (see Figure 6.29)
Figure 6.29: State-wise percentage of respondents employed in Organized or Unorganized Sector 6.3.21 If Self Employed, indicate the Sector
66%
34%
Employed in Organized or Unorganized Sector
Organized (with salary slip) Unorganized (without salary slip)
69% 63%
88% 97%
89%
15%
55%
93%
6%
31% 38%
12% 3%
11%
85%
45%
7%
94%
0%
20%
40%
60%
80%
100%
120%
Delhi Haryana Gujarat Kerala Manipur Punjab Rajasthan Uttar Pradesh
West Bengal
State-wise percentage of respondents employed in Organized or Unorganized Sector
Organized (with salary slip) Unorganized (without salary slip)

62
The scheme encourages the beneficiaries for self-employment. Upto 52% of the beneficiaries who choose self-employment generally engage in home-based work, as shown in Table 6.2. State-wise Gujarat (62%), Punjab(59%), Kerala(82%), Rajasthan (68%), and West Bengal (58%) reported more than 50% respondents as self-employed for Home-based work.
Table 6.2: Percentage of self-employed beneficiaries working for different sector If self-employed,
indicate the sector Agriculture Labour
Home-based work
Skilled worker
Delhi 2% 53% 44% 0%
Haryana 0% 70% 25% 5%
Gujarat 0% 38% 62% 0%
Kerala 18% 0% 82% 0%
Manipur 6% 53% 38% 3%
Punjab 0% 29% 59% 12%
Rajasthan 0% 26% 68% 6%
Uttar Pradesh 3% 66% 29% 3%
West Bengal 3% 36% 58% 3%
Total Beneficiaries 5% 40% 52% 3%
6.3.22 If Self Employed Have Trade Licence, Udyog Aadhar Registration, MSME Registration, got Mudra Loan, Registered or Linked with any SHGs Beneficiaries who opted for self-employment were requested to give information on the trade license, Udyog Aadhar registration, MSME registration, got Mudra Loan or registered or linked with any SHGs. Information shared by the respondents is summarized in Table 6.3. Apart from some of the beneficiaries having Trade licenses (36%), not much effort on getting other licenses, registration, or even applying for Mudra loans is done.
Table 6.3: Percentage of Respondent who had registration or license required for self-employment
Registration Type ->
Udyog Aadhar Registration
Trade License
MSME Registration
Applied or got Mudra loan
Registered or linked with
any SHG STATES Yes No Yes No Yes No Yes No Yes No
Delhi 5% 95% 42% 58% 7% 93% 2% 98% 0% 100%

63
Haryana 3% 98% 5% 95% 3% 98% 0% 100% 0% 100% Gujarat 0% 100% 0% 100% 0% 100% 0% 100% 0% 100% Kerala 59% 41% 95% 5% 34% 66% 9% 91% 7% 93%
Manipur 0% 100% 3% 97% 3% 97% 6% 94% 0% 100% Punjab 0% 100% 18% 82% 0% 100% 0% 100% 0% 100%
Rajasthan 14% 86% 44% 56% 8% 92% 3% 97% 6% 94% Uttar Pradesh 8% 92% 41% 59% 10% 90% 3% 97% 0% 100% West Bengal 0% 100% 31% 69% 0% 100% 0% 100% 0% 100%
Total Beneficiaries 13% 87% 36% 64% 9% 91% 3% 97% 2% 98%
6.3.23 Reasons for Leaving the Job Beneficiaries were asked reason for not continuing on the job they got after training. Such instances, to an extent, impact the effectiveness of the scheme. Thus, the data was collected from the beneficiaries (respondents) related to the reasons for leaving the job. All the reasons so collected are in Figure 6.30. It was observed that Self-employment (43%) is a major reason followed by education (25%) as reason for leaving the job.
Figure 6.30: Overall percentage of respondents: reason for leaving the job 6.3.24 Distance of Job Location from Native Place During the focus group discussion with the different stakeholders of the scheme, the distance of beneficiaries' location to the job location was given emphasis for beneficiaries accepting and staying with the job. Thus, the beneficiaries (respondents) were asked to mention the distance of the job place from their native place. It was found that almost 71% of the respondents had their native place within 10 km. As in Figure 6.31, only 29% of beneficiaries used to come to their job location from a distance of more than 10 km,
43%
11%
8%
3%
25%
10%
0% 5% 10% 15% 20% 25% 30% 35% 40% 45% 50%
Self Employed
Location far away
Less Salary
Layed off because of Lockdown
To continue Education
Family Problem Reason for leaving the job

64
Figure 6.31: Overall percentage of respondents who travel a distance to job location from native place
State-wise, except for Manipur (21%) and West Bengal (32%), more than 80% of the beneficiaries travel less than 10 km for their job place, as shown in Table 6.4.
Table 6.4: State-wise percentage of respondents who travel a distance to job location from native place The distance of Job location from
native place Upto 2 km 2-5 km 5-10 km
More than 10 km
Delhi 57% 29% 4% 11%
Haryana 10% 18% 53% 20%
Gujarat 91% 3% 0% 6%
Kerala 54% 28% 18% 0%
Manipur 5% 3% 14% 79%
Punjab 22% 41% 22% 16%
Rajasthan 50% 31% 0% 19%
Uttar Pradesh 63% 21% 16% 0%
West Bengal 0% 29% 2% 68%
Total Beneficiaries 35% 21% 15% 29%
35%
21%
15%
29%
Percentage of respondents who travel a distance to job location from native place
Upto 2 km 2-5 km 5-10 km More than 10 km

65
6.3.25 Willingness to accept a job at a place far away from the Native Place Respondents’ were asked if they were willing to travel for a longer distance to Job location. As can be observed in Figure 6.32, 83% of the beneficiaries (respondents) showed their desire to travel far distance for Jobs.
Figure 6.32: Overall percentage of respondents who are willing to travel far for Jobs
State wise data also shows a similar trend except for West Bengal (60%), though the percentage is good but is less than the overall percentage, as shown in below Figure 6.33. The major concern of the beneficiaries not willing to work far away is transportation constraints and cost.
Figure 6.33: State-wise percentage of respondents who are willing to travel far for Jobs
6.3.26 Post Placement Support by the PIA One of the mandatory aspects of the scheme is to provide post-placement support to the beneficiaries for the next two months. PIA’s are responsible for such support. In respect to this, beneficiaries were asked regarding the Post placement support provided by the PIA’s. As
83%
17%
Willingness to accept a job at a place far away from the Native Place
Yes No
92%
72% 76%
100% 90% 91%
82% 76% 60%
8%
28% 24%
0% 10% 9%
18% 24% 40%
0%
20%
40%
60%
80%
100%
120%
Delhi Haryana Gujarat Kerala Manipur Punjab Rajasthan Uttar Pradesh
West Bengal
Accept a job at a place far away from your native place: Statewise
Yes No

66
observed in Figure 6.34, 78% of the respondents agreed on receiving post-placement support from the PIA’s.
Figure 6.34: Overall percentage of respondents responded on PPS
State wise data on post placement support is shared in the Figure 6.35. More beneficiaries (respondents) from Haryana (47%), Punjab (47%) and Rajasthan (33%) reported not receiving post placement support from the PIAs.
Figure 6.35: State-wise percentage of respondents responded on PPS
6.3.27 Has the Training been helpful in getting you Employment The beneficiaries (respondents) were asked if the training has been helpful in getting them employment. As can be seen in Figure 6.36, 63 % of the beneficiaries (respondents) reported that the training has been helpful in getting them the employment.
78%
22%
Post Placement Support by the PIA
Yes No
92%
53%
85% 100%
81%
53% 67%
88% 77%
8%
47%
15% 0%
19%
47% 33%
12% 23%
0%
20%
40%
60%
80%
100%
120%
Delhi Haryana Gujarat Kerala Manipur Punjab Rajasthan Uttar Pradesh
West Bengal
Provided with PPS (post Placement Support) by the PIA: Statewise
Yes No

67
Figure 6.36: Overall percentage of respondents who responded whether the training is helpful for the employment
As observed in Figure 6.37, majority of the beneficiaries (respondents) from Gujarat (95%), Kerala (87%), and Manipur (84%) felt that training is helpful for getting employment. In comparison, the percentage of respondents was lower from Delhi (57%) and Punjab (62%).
Figure 6.37: State-wise percentage of respondents who responded whether the training is helpful for the employment
6.3.28 Has the Training been helpful in enhancing your Business The beneficiaries (respondents) were asked if the training had been helpful in enhancing the business. As can be seen in Figure 6.38, 57% of the beneficiaries (respondents) agreed with the effectiveness of training for enhancing the business.
63%
37%
Has the Training been helpful in getting you Employment
Yes No
43% 54%
95% 87% 84%
38% 52% 65% 53%
57% 46%
5% 13% 16%
62% 48% 35% 47%
0%
20%
40%
60%
80%
100%
120%
Delhi Haryana Gujarat Kerala Manipur Punjab Rajasthan Uttar Pradesh
West Bengal
Has the Training been helpful in getting you Employment
Yes No

68
Figure 6.38: Overall percentage of respondents who responded whether the training helps enhance business
When the data was observed state-wise (as in Figure 6.39), majority (more than 80%) of the beneficiaries (respondents) from Gujarat (95%) and Kerala (93%) felt that training has helped to enhance the business. The percentage was lower for respondents from Delhi (53%), Manipur (71%), Punjab (60%), and West Bengal (64%).
Figure 6.39: State-wise percentage of respondents who responded whether the training helps enhance business
6.3.29 Do You feel there is a Requirement of Skill Training Again Respondents were also asked whether they require any repeat skill training. More percentage of respondents (57%) did not express such requirement (see Figure 6.40).
57%
43%
Has the Training been helpful in enhancing your Business
Yes No
47% 55%
95% 93%
29% 40% 53% 70%
36%
53% 45%
5% 7%
71% 60% 47% 30%
64%
0%
20%
40%
60%
80%
100%
120%
Delhi Haryana Gujarat Kerala Manipur Punjab Rajasthan Uttar Pradesh
West Bengal
Has the Training Been Helpful in Enhancing Business
Yes No

69
Figure 6.40: Percentage of respondents enquired about the requirement for skill training again 6.4 Feedback Section In this section, feedback is taken on the following aspects (i) trainer/teacher capabilities and dissemination method, (ii) availability and quality of course materials, (iii) capability, scheme awareness, and communication of staff, (iv) sufficiency in infrastructure, and (v) boarding and lodging. 6.4.1 Feedback on Teachers/ Trainers Trainers and teachers are the most important stakeholder for the execution of the training. Thus feedback related to teachers/trainers' capabilities, number of trainer/teacher, communication skills, expertise, dissemination method, etc. were taken from the beneficiaries (respondents). As can be observed from Figure 6.41 most of the beneficiaries are satisfied with counseling facilities (86%), the number of teacher/trainer (99%), interactive sessions (96%), and capabilities of teachers/trainers (98%).
43%
57%
Do You feel there is a Requirement of Skill Training Again
Yes No

70
Figure 6.41: Overall feedback of the respondents on the different attribute of the Trainer/Teacher
6.4.2 Feedback on Course Material Beneficiaries (respondents) were asked to provide feedback on different parameters related to course materials. Based on the feedback received, as shown in Figure 6.42, most of the beneficiaries found Audio/video materials (78%) and reading course materials (98%) useful. Similarly, most of the beneficiaries (respondents) were happy with the course materials being available (98%), available in the local language (79%), and well structured (95%). However, attention must be given towards the more use of Audio/Video and providing course materials in the local language as still, 22% and 21% of beneficiaries, respectively, are not satisfied on that parameter.
Figure 6.42: Overall Percentage of respondents gave feedbacks on different parameters of course material
6.4.3 Feedback on Staff
98%
96%
99%
86%
75% 80% 85% 90% 95% 100%
Is the capability of the teachers involved in skills training sufficient
Are the training sessions being interactive? (involving, enjoyable etc)
Are the number of teachers/ trainer adequate
Is counseling facility (for Job/ Self Employment) available in the institute, for getting job or self-
employment
Feedback on Teachers/ Trainers
98%
95%
79%
98%
78%
0% 50% 100% 150%
Course material was available
Course Material used for training was well structured
Course Material was available in Local Language
Course material for reading was useful
Audio/Video presentation material was useful
Feedback on Course Material

71
Feedback was taken from the respondents (beneficiaries) on staff’s guiding capabilities, understanding of the scheme, and communication skills. As can be observed in Figure 6.43, most of the beneficiaries found guiding capabilities (98%), scheme understanding (98%), and communication skills (98%) of the staff as excellent.
Figure 6.43: Overall percentage of respondents gave feedbacks on different attributes of staffs
6.4.4 Feedback on Infrastructure Beneficiaries (respondents) were asked to provide feedback on Infrastructure. Based on the feedback received, as shown in Figure 6.44, majority (more than 80%) of the beneficiaries (respondents) found all the facilities associated with building infrastructure as suitable. However, attention can be given towards the canteen facility and raw material for practical/lab as still, 15% and 11 % of beneficiaries (respondents), respectively, are not happy with the facilities.
Figure 6.44: Overall percentage of respondents gave feedbacks on different facilities of building infrastructure
6.4.5 Feedback on Boarding/ Lodging Feedback related to facilities in the hostel and Mess for outstation beneficiaries was taken from the beneficiaries (respondents). As can be seen in Figure 6.45, most of the beneficiaries from Delhi (47%), Haryana (34%), Punjab (36%), and West Bengal (15%) have very limited or no hostel
98%
98%
98%
0% 20% 40% 60% 80% 100% 120%
The communication skills-way of speaking/ understanding is good
The staff is able to understand the scheme
The staff is capable of guiding
Feedback on Staff
98% 98%
99% 97%
98% 96%
85% 92%
94% 89%
75% 80% 85% 90% 95% 100% 105%
No of rooms lights
Furniture Blackboard
Drinking Water Separate toilets for girls & boys
Canteen Power-backup available Lab/Training Equipment
raw material for practical/labs
Feedback on Infrastructure

72
facilities. However, States like Gujarat (94%), Kerala (100%), and Manipur (81) are either residential based training centers or have sufficient hostel and mess facilities. Similarly, mess facilities at Haryana (28%), Punjab (35%), and West Bengal (15%) are limited or not available. Overall, this is one area which can be improved if residential programmes are to be conducted.
Figure 6.45: Overall percentage of respondents gave feedbacks on Hostel and mess facilities
6.5 Suggestions for Improvement In this section, suggestions for improvement were taken on the following aspects (i) Improvement in course materials, and (ii) Improvement in Teaching Methodology adopted by Trainers. 6.5.1 Suggestions for Improvement in Course Material Suggestions provided by the beneficiaries (respondents) are summarized in Figure 6.46. The following suggestions were given by the beneficiaries (i) Materials should be in English, and local language, (ii) not good and not useful, (iii) Materials are not available in sufficient quantity, and (iv) complete materials, machine, etc. were available and useful. Among the suggestion given, the course materials should be made available in the local language was found important and should be implemented by the PIAs.
45% 34%
94% 100%
81%
36%
60%
82%
15%
70%
28%
92% 100%
82%
35%
65% 74%
15%
0%
20%
40%
60%
80%
100%
120%
Delhi Haryana Gujarat Kerala Manipur Punjab Rajasthan Uttar Pradesh
West Bengal
Feedback on Hostel and Mess Facilities
Facilities in Girls/ Boys hostel for outstation beneficiaries are enough
Mess Facilities for outstation beneficiaries are fine

73
Figure 6.46: Overall percentage of suggestion given by the respondents related to course materials
Similarly, looking into the state-wise information (as shown in Table 6.5), beneficiaries (respondents) from Delhi (30%), Punjab (30%), Uttar Pradesh (26%), and West Bengal (29%) suggested that the course material be provided in the local language.
Table 6.5: State-wise percentage of suggestion given by the respondents related to course materials
Complete material, machine etc. were
available and useful
Not available in sufficient
quantity
Not good and not useful
The material should be in
English and Local Langauge also.
Delhi 47% 22% 2% 30%
Haryana 65% 10% 2% 21%
Gujarat 78% 5% 3% 13%
Kerala 69% 6% 3% 22%
Manipur 71% 8% 2% 19%
Punjab 50% 14% 6% 30%
Rajasthan 70% 9% 6% 15% Uttar
Pradesh 55% 18% 1% 26% West
Bengal 57% 10% 4% 29%
Overall 63% 11% 3% 22%
6.5.2 Suggestions for Improvement in Teaching Methodology adopted by Trainers The beneficiaries (respondents) were asked if they had any suggestions related to improvement in teaching methodology adopted by the trainers. As can be seen in Figure 6.47, almost all respondents (97%) are satisfied with the teaching methodology adopted by the trainers.
63%
11%
3%
22%
0% 20% 40% 60% 80%
Complete material, machine etc were available and useful
Not avilable in sufficient quantity
Not good and not really useful
Material should be in English and Local Langauge also.
Suggestions for Improvement in Course Material

74
Figure 6.47: Overall percentage of suggestions given by the respondents related to teaching methodology.
6.6 Stipend Section The “Seekho aur Kamao” scheme has a provision of providing a stipend to the beneficiaries. A stipend of two thousand per month for non-residential and one thousand per month for the residential training program are given to the beneficiaries
6.6.1 The Stipend was transferred timely into your bank account The beneficiaries (respondents) were asked if the stipend is transferred into the bank account in a timely manner. As can be observed from Figure 6.48, only 61% of the beneficiaries (respondents) reported to have received the stipend on time.
Figure 6.48: Overall percentage of respondent who responded on the timely transfer of stipend State-wise stipends (as shown in Figure 6.49) are received on time by most of the beneficiaries (respondents) belonging to Kerala (100%), Manipur (89%), and Punjab (90%). More than 70% of the respondents from Delhi (76%), Haryana (72%), and Gujarat (77%) received the stipend on time. However, more than 30% of respondents from Rajasthan (32%), Uttar Pradesh (43%), and West Bengal (40%) did not receive their stipend on time.
2%
97%
Suggestions for Improvement in Teaching Methodology adopted by Trainers
Dissatisfied
Neutral
Satisfied
61%
39%
Timely Transfer of Stipend
Yes No

75
Figure 6.49: State-wise percentage of respondent who responded on the timely transfer of stipend
6.6.2 Received the complete stipend, or it was less than the promised amount Similarly, the study also records the information related to the amount received by respondents as stipends. Overall, 80% of the beneficiaries (Respondents) consented on receiving the stipend in full (see Figure 6.50).
Figure 6.50: Overall percentage of respondent receive the complete stipend
State-wise stipends (as shown in Figure 6.51) are received in full by most of the beneficiaries (respondents) belonging to Kerala (100%), Manipur (89%), and Punjab (90%). More than 70% of the respondents from Delhi (76%), Haryana(72%), and Gujarat (77%) received the stipend in Full. However, more than 30% of respondents from Rajasthan (32%), Uttar Pradesh (43%), and West Bengal (40%) did not receive their complete stipend.
Delhi Haryana Gujarat Kerala Manipur Punjab Rajasthan Uttar Pradesh
West Bengal
No 33% 38% 17% 25% 5% 38% 17% 20% 20% Yes 67% 62% 83% 75% 95% 63% 83% 80% 80%
67% 62% 83% 75% 95% 63% 83% 80% 80% 0%
20%
40%
60%
80%
100%
120% Timely Transfer of Stipend
80%
20%
Overall percentage of respondent receive the complete stipend
Yes No

76
Figure 6.51: State-wise percentage of respondent receive the complete stipend
6.6.3 Number of days to receive the Stipend It was observed that, overall, 39% of the respondent did not receive their stipend on time. The study also tried to find the extent of delay in receiving the stipend. Figure 6.52 summarizes the period of delay in getting the stipend. 37% of the respondent who received a delayed stipend got the stipend in up to 60 days. More than 43% got a delay in stipend of more than 90 days, while 3 % denied getting any stipend.
Figure 6.52: Overall percentage of respondent who mentioned the no. of days delay in stipend
6.6.4 If delay in disbursement, what are the reasons The beneficiaries were requested to give the reasons they perceived or provided by the PIAs related to the delay in disbursement of stipend. The most important reason observed is the delay by the government in releasing the fund, as shown in Figure 6.53.
Delhi Haryana Gujarat Kerala Manipur Punjab Rajasthan Uttar Pradesh West Bengal
No 33% 38% 17% 25% 5% 38% 17% 20% 20%
Yes 67% 62% 83% 75% 95% 63% 83% 80% 80%
67% 62% 83% 75% 95% 63% 83% 80% 80% 0%
20%
40%
60%
80%
100%
120% Overall percentage of respondent receive the complete stipend
4%
33%
23%
12% 13%
3%
9%
3%
0%
5%
10%
15%
20%
25%
30%
35%
Upto 30 days 31 to 60 days 61 to 90 days 91 to 120 days
121 to 150 days
151 to 180 days
More than 180 days
Didn't Received
Number of days to receive the stipend: Overall

77
Figure 6.53: Overall percentage of respondent who gave the reasons for the delay in stipend
6.7 Conclusion This chapter has tried to analyze the sources of awareness of the Seekho Aur Kamao Scheme, scheme performance analysis, drop out from School, school drop-out level, reasons for school dropout, reasons for joining Seekho Aur Kamao Scheme, reasons for selecting the job role, duration of the course, challenges in joining the Seekho Aur Kamao Scheme, skill set before and after attending the Training, work experience before and after, impact of Training on type of work, impact of Training on salary, satisfaction with Quality of the Training programme, living standard (does it fulfill the livelihood requirement of the Family), job after Training, increase in Income after Training, status of employment: Placement / Self Employed, employed in organized or unorganized Sector, reasons for Leaving the Job, distance of Job Location from native place, willingness to accept a job at a place far away from the native place, post placement support by the PIA, feedback on Teachers/ Trainers, course material, staff, infrastructure, boarding/ Lodging, suggestions for Improvement in course material, teaching methodology adopted by Trainers, stipend was transferred timely into the bank account, paid as promised, number of days to receive the stipend, reasons for disbursement delay, etc In the next chapter responses from the stakeholders such as Project Implementing Agencies (PIA’s, Trainers, Employers) will be analyzed.
28%
15%
22%
10%
16%
9%
0% 5% 10% 15% 20% 25% 30%
No reasons given by PIA
Lengthy and difficult process
Delayed by the government to release the funds
Bank account Opening process
Assessment is pending
received partial payment, not received complete payements
Reasons for delay in Stipend

78
CHAPTER-7
STAKEHOLDERS RESPONSE DATA ANALYSIS
7.1 Introduction The “Seekho aur Kamao” scheme is implemented on the ground by the Project Implementing Agencies (PIAs). Data was collected on the different parameters/dimensions of the schemes from PIAs running the training centers in different locations of the sample nine states. These dimensions/ parameters are (i) background of the PIAs, (ii) initiatives taken by PIAs related to awareness/ mobilization/ selection of beneficiaries, (iii) issues related to identification, selection, and linkage of skill development courses, (iv) issues related to placements and tracking, (v) issues related to documentation, (vi) challenges faced during program implementation, (vii) suggestions for improvement of the scheme, and (viii) assets created/services provided under the scheme. In all, 52 PIAs, 84 Employers and 120 Trainers were part of this study form the nine states across India. The data was collected, having personal interviews with PIAs. The information is collected using a structured and semi-structured questionnaire. This chapter also analyze information obtained from other stakeholder i.e. Trainers and employers, related to trainees, courses, additional courses relevant for placements & self-employments, infrastructure (building, IT, Labs etc), and overall training program. Analysis of the data is presented in subsequent sections of this chapter. Background in the form of Demographics are covered in section 7.1, Analysis of awareness and mobilizations is discussed in section 7.2, while identification and selection of beneficiaries in section 7.3. Analysis of placements and tracking are done in section 7.4, issue and challenges faced by PIAs in section 7.5, suggestions for policymakers for improving the performance of the scheme in 7.6. analysis of assets created and services provided by PIAs are covered in section 7.7. analysis on information collected from trainers on different parameters are covered in section 7.8. analysis of feedback received related to trainee, PIAs, course and trainings are done in section 7.9. and finally concluded in section 7.10. 7.2 Sample Coverage The Proposed sample size for PIAs for the study was 45, but the actual sample size for this study collected is 52 PIAs. The sample coverage is as shown in Table 7.1. The number of PIAs from each state covered for collecting data of beneficiaries is also in Table 7.1 and graphically represented in figure 7.1.
Table 7.1: Sample of PIAs selected from the target states
State PIA (No.) PIA (%)

79
Delhi 6 12% Gujarat 5 10% Haryana 6 12% Kerala 4 8%
Manipur 2 4% Punjab 8 15%
Rajasthan 6 12% Uttar Pradesh 10 19% West Bengal 5 10%
Total PIA 52 100% The study follows the stratified sampling method with a proportionate sample based on the size of the state and availability of PIAs in the states, as shown in Figure 7.1.
Figure 7.1: Percentage of Sample of PIAs selected from the target states
7.3 Demographics This section covers the data analysis of the background of the PIAs. The demographic selected for the study were (a) classification (type), (b)Years of experience in training and placements, (c) Number of Training Conducted, (d) Number of Batches Conducted in a Year, education level, (e) Biometric Attendance. 7.3.1. Classification or Type of PIA Any registered entity, with minimum set criteria, can be selected as Project implementing agency. This section targets the entity mostly engaged in such a training scheme with the Ministry of Minorities Affairs (MoMA). Overall, 50% of the PIAs are registered private institution with 3 years of experience, as shown in Figure 7.2.
12% 10%
12%
8%
4%
15%
12%
19%
10%
0%
5%
10%
15%
20%
25%
Delhi Gujarat Haryana Kerala Manipur Punjab Rajasthan Uttar Pradesh
West Bengal

80
Figure 7.2: Overall percentage of PIAs Type belonging to the different registered entity
Similarly, state-wise, more than 80% of the PIAs of states, Kerala (100%), Manipur (100%), Rajasthan (83%), and West Bengal (80%), are the private institution with three years of experience. 80% of the PIAs in Gujarat state are the society under the societies registration act. More than 30 % of PIAs of states Punjab (38%) and Utter Pradesh (30%) are Civil society/NGOs, as shown in Table 7.2.
Table 7.2: State-wise percentage of PIAs Type belonging to the different registered entity
Type of PIA Society under Societies Registration Act
Private Institution with 3 yrs
experience
Civil Society/NGOs
Delhi 17% 67% 17% Gujarat 80% 0% 20% Haryana 33% 67% 0% Kerala 0% 100% 0%
Manipur 0% 100% 0% Punjab 25% 38% 38%
Rajasthan 17% 83% 0% Uttar Pradesh 30% 40% 30% West Bengal 20% 80% 0%
Total PIA 27% 58% 15%
7.3.2 PIA Years of Experience in Training and Placement Experience is an important criterion for being selected as a PIA. This section summarizes the experience of the overall and state-wise PIAs. Figure 7.3 contains a summary of the experience of
27%
58%
15% Classification of PIA's
Society under Societies Registration Act Private Institution with 3 yrs experience Civil Society/NGOs

81
overall PIAs. The minimum required experience is three years. 58% the PIAs selected for the study from the target states had more than ten years of experience, as shown in Figure 7.3.
Figure 7.3: Overall Percentage of years of experience of the PIAs
Similarly, state-wise, more than 50% of the PIAs of states, Kerala (100%), West Bengal (100%), and Punjab (50%), are having experience up to 10 years. 50% of the PIAs in Delhi state have experience more than 20 years. More than 60 % of PIAs of states Delhi(67%), Gujarat(100%), Haryana(67%), Manipur(100%), Rajasthan(67%), and Utter Pradesh(70%) are having experience more than ten years, as shown in Table 7.3.
Table 7.3: : State-wise percentage of years of experience of the PIAs
Years of experience in training & placement
Upto 10 years
11 to 15 years
16 to 20 years
More than 20
years Delhi 33% 0% 17% 50%
Gujarat 0% 20% 40% 40% Haryana 33% 17% 33% 17% Kerala 100% 0% 0% 0%
Manipur 0% 50% 50% 0% Punjab 50% 13% 25% 13%
Rajasthan 33% 50% 17% 0% Uttar Pradesh 30% 20% 30% 20% West Bengal 100% 0% 0% 0%
Total PIA 42% 17% 23% 17%
7.3.3 Number of Trainings Conducted Experience in similar activities and the number of training undertaken by the entity is also an essential criterion for being selected as a PIA. This section summarizes the number of training
42%
17%
23%
17%
Upto 10 years 11 to 15 years 16 to 20 years More than 20 years

82
conducted by the overall percentage and state-wise percentage of PIAs. Figure 7.4 contains the summary of the number of training conducted by the overall PIAs. 65% of the PIAs selected for the study from the target states had conducted more than five training, as shown in Figure 7.4
Figure 7.4: Overall number of training conducted by the PIAs
Similarly, state-wise, more than 50% of the PIAs of states, Kerala (100%), Gujarat (60%), Haryana(50%), Manipur (50%), Rajasthan (67%), Uttar Pradesh (58%), and West Bengal (75%) have conducted more than five training. More than equal to 50% of the PIAs in Haryana (50%), Manipur(50%), and Punjab (57%) have conducted up to 5 training. 50% PIAs of Delhi and 40% PIAs of Gujarat state has conducted more than 20 training, as shown in Table 7.4.
Table 7.4: State-wise number of training conducted by the PIAs
Number of Training
conducted
Up to 5 training
6 to 10 training
11 to 15 training
16 to 20 training
More than 20
training
Delhi 0% 17% 0% 33% 50% Gujarat 40% 20% 0% 0% 40% Haryana 50% 17% 17% 17% 0% Kerala 0% 75% 25% 0% 0%
Manipur 50% 50% 0% 0% 0% Punjab 57% 14% 14% 0% 14%
Rajasthan 33% 50% 0% 17% 0% Uttar
Pradesh 42% 17% 8% 8% 25%
West Bengal 25% 50% 25% 0% 0%
Total PIA 35% 29% 10% 10% 17%
35%
29%
10% 10%
17%
0% 5%
10% 15% 20% 25% 30% 35% 40%
Upto 5 trainings 6 to 10 trainings 11 to 15 trainings 16 to 20 trainings More than 20 trainings

83
7.3.4 Number of Batches Conducted in a Year This section summarizes the number of batches trained in a year by the PIAs (respondents). Figure 7.5 contains the summary of the number of batches trained by the overall PIAs. 85% of the PIAs selected for the study from the target states had trained more than five batches a year, while more than 60% of PIAs have trained more than 20 batches in a year, as shown in Figure 7.5.
Figure 7.5: Overall number of batches trained in a year by the PIAs
Similarly, state-wise, more than 60% of the PIAs of all states except Gujarat (40%), have conducted training for more than five batches a year. More than equal to 30% of the PIAs in states like Delhi(33%), Haryana (33%), Gujarat (40%), Kerala (40%), and West Bengal (40%) have conducted training for more than 50 batches a year, as shown in Table 7.5.
Table 7.5: State-wise number of batches trained in a year by the PIAs
No. of batches conducted in a
year
1 to 5 batches
6 to 10 batches
11 to 20 batches
21 to 30 batches
31 to 40 batches
41 to 50 batches
More than 50 batches
Delhi 0% 0% 0% 33% 17% 17% 33% Gujarat 60% 0% 0% 0% 0% 0% 40% Haryana 0% 17% 33% 0% 17% 0% 33% Kerala 0% 0% 0% 25% 25% 0% 50%
Manipur 0% 0% 0% 50% 50% 0% 0% Punjab 0% 13% 13% 13% 25% 13% 25%
Rajasthan 33% 17% 17% 17% 0% 0% 17% Uttar Pradesh 30% 20% 10% 10% 30% 0% 0%
West Bengal 0% 0% 20% 40% 0% 0% 40% Total PIA 15% 10% 12% 17% 17% 4% 25%
15%
10% 12%
17% 17%
4%
25%
0%
5%
10%
15%
20%
25%
30%
1 to 5 batches
6 to 10 batches
11 to 20 batches
21 to 30 batches
31 to 40 batches
41 to 50 batches
More than 50 batches

84
7.3.5 Biometric Attendance at PIA This section summarizes the overall percentage of PIAs having a biometric attendance system. Figure 7.6 reflects the overall percentage of PIAs, ensuring Biometric attendance. It can be observed that 98% of the PIAs have a system of Biometric attendance.
Figure 7.6: Overall percentage of PIAs having Biometric attendance
7.4 Awareness and Mobilization PIAs (respondents) were asked regarding the different methods and channels used by the PIAs for spreading awareness and mobilization of beneficiaries. Figure 7.7 summarizes the technique employed by the PIAs related to awareness and mobilization. Overall, more than 75% of the PIAs uses channels like Newspaper (100%), Pamphlet /Poster / Banner (100), Religious leader and Panchayat (87%), Auto-rickshaw announcement (79%), Internet (75%), mobile SMS (79%), and word of mouth (96%). The awareness camps by government for Seekho aur Kamao are low and more camps may be set up. The use of Mobile SMS can also be improved to spread awareness of the scheme.
Figure 7.7: Overall percentage of PIA uses the channels for spreading Awareness
98%
2%
Yes No
100% 100%
27%
87% 79%
13%
75%
37%
79% 96%
0% 20% 40% 60% 80%
100% 120%

85
7.4.1 Special efforts made by PIA for Selection of Women
The overall insights across the states covered as part of the survey include • Conduct the house visits, meet the parents/guardians • Encouraged to visit the training institute and see the facilities • Ensure safety aspects for Women • Conducted Awareness camps, paper advertisement, word of mouth • Took help of local social workers, elected representatives of the people, religious leaders • College pass-out data and drop-out data is collected for mobilization of Women • Targeted divorcee, school/college dropouts from lower-middle-class families looking for a
job to support their families • Enrolled them for a mock training session • Provided training on job roles suitable for women like self-employed Tailor • Hired female mobilizers for door to door mobilization of women in co-operation with
Aasha workers. • Scheduled training during afternoon hours for them to attend training freely. • Approached the head of the community/ panchayat heads • School and college teachers were engaged during selection, data from local anganwadis
was collected • One to one sessions were conducted, female counselors, were appointed • Awareness through women welfare organizations
State-wise, some of the insights are elaborated below: Most of the state PIA’s reported that the community engagement team especially encourages women candidates to apply for the training programs. The team conducts the house visits, meets the parents/guardians and briefs them about the program and its outcomes in detail. In most cases, the parents are encouraged to visit the training institute and see the facilities being provided. This creates trust amongst the community. Besides, safety aspects for women are also ensured during the training program. West Bengal state PIA’s reported that it follows a very simple and effective method to identify and enroll the females from the target group. First, a plan is drafted to mark the areas consisting of economically poor background families belongs to the minority community. Then a visit is made to the local social workers, elected representatives of the people, religious leaders, SHG group members to brief them about the scheme and the benefits. Also, the women are briefed about the career prospects of the course, the secure environment of the organization, agreement/MoU for the employment of the candidates with external organizations. The PIA also visit door to door and speak to the guardians for better understanding. Basically, the PIAs target divorcee,
86
school/college dropouts from lower-middle-class families looking for a job to support their families. After one to one conversation, the PIA grade them as per their need for free training and their willingness to pursue career opportunity after completion of training. After the initial scrutiny, the PIA enrolls them for a mock training session and finalize their name on the basis of their attendance, punctuality, and interest on the course. In Punjab and Haryana, female mobilizers were hired & door to door mobilization of women in co-operation with Aasha/ Aanganwadi workers. In Rajasthan, school and college Teachers were engaged during selection, data from local Anganwadis was collected, female counselors were appointed. In Gujarat and Rajasthan, the state also conducts awareness camps for scheme awareness. Manipur state PIA’s reported that the marketing & admissions strategy is established to represent maximum women from across the NE States. The identified strengths and opportunities of the programs for a girl child student are kept at the forefront. A detailed marketing plan is developed, which incorporates the emphasis on female candidates. The state of Manipur also reported the use of online promotion, television ads, newspapers, & banners, distributing leaflets, respectively. It also reported the mobilization through district level administration.
7.4.2 Special efforts made by PIA for Selection of Economically Poorer Sections of Majority Community The overall insights across the states covered as part of the survey include
• Preference is given to unemployed youth from the weaker minority community or from lower-middle-class families
• Liaison with the local community leaders to identify the target group • Conduction of a baseline survey for the residential locations of economically poorer
families • Contact marginalized social groups like girl child students & students from the BPL category
of majority community • Contact Gram Pradhan and the Sarpanch to mobilize participants • Contact workers & community development organizers • Use of newspaper advertisements, distribution of leaflets and pamphlets in rural and urban
areas • Awareness campaigns • Counseling provided for livelihood and importance of job
State-wise, some of the insights are elaborated below: In Kerala and West Bengal, PIAs reported that admission preference was granted to unemployed youth hailing from minority community and from economically weaker sections of the society or from lower middle class families. The PIA team conducts social assessment of the family of the

87
potential candidates and assesses the need as well as requirement of the training program. Some of these candidates have either left their study or couldn’t pursue any professional course after completion of school/college education. The PIAs liaise with the local community leaders to identify the target group or sometimes trainees from previous batches or candidates who had enrolled themselves with the PIA’s earlier volunteer in the mobilization process. This way the PIA’s ensure that admission is given to genuine and needy people who have intention to attend classes on regular basis. Stipend is reported to have been released to these candidates. The PIAs also provide counseling on life growth path, livelihood counseling, importance of job & being independent. In Haryana, the PIAs reported to have contacted the Gram Pradhan and the sarpanch to mobilize the admission process of deserving candidates from minority community for the scheme. Data was collected from various sources to identify the deserving (BPL) candidates in their respective areas. Once the target population was identified then they were counseled on the career and financial benefits of the scheme. In Punjab, the PIAs have reportedly contacted the Panchayat, reaching out to the Gram Pradhan and the Sarpanch to mobilize the process of admission of deserving minority community applicants. With the help of the Sarpanch and the village development officer (VDO), the PIAs marked BPL household among minorities for mobilization. Once they were identified, group discussions were conducted with them, counseling them on the financial benefits of the scheme. Thereafter, one on one session with their families were initiated, where they learned as to how this scheme would help them improve their livelihoods. In Rajasthan, the PIAs reported to have started with conduction of a Baseline Survey for the residential locations of economically poorer families. Awareness camps were held to counsel them well, special counselors were appointed. In Uttar Pradesh, PIAs reported that meetings with Sarpanch, self-help groups (SHGs) were conducted to identify ways to identify the target population. Counselors were arranged to enroll the needy, poor and deserving candidates. For the purpose of mobilizing the deserving candidates, newspaper advertisements, distribution of leaflets and pamphlets in rural and urban areas were distributed in order to reach the wider audience. Events were organized with an organization to run awareness campaign about the programme and motivate candidates to join the courses. In Gujarat, PIAs reported that information on the trainee population from minority community and weaker section was collected from Aanganwadi workers & community development organizers. They conducted awareness programmes in such weaker section populated regions in order to encourage the candidates to seek admission in this training scheme. In Manipur, PIAs reportedly had adopted a comprehensive strategy for such mobilization of the trainees. Preference was given to marginalized social groups like girl child students & students

88
from the BPL category of majority community too. For this purpose, PIAs reportedly conducted meetings with Sarpanchs and Self-help groups; counselors were arranged to enroll minority community candidates, especially for the weaker sections of the society. The candidates were identified and selected to meet the requirements of the industry, in consultation and support of local self-government bodies and other stakeholders. In Delhi, the PIAs mobilized the admission process by reaching out to the poorer section of the minority community. Once identified, they made one to one interaction and held counseling sessions with the candidates. The PIAs reportedly made an effort to pick a centrally located training center to benefit the EWS community.
7.4.3 Different selection method opted for the selection of trainees PIAs use different selection criteria for the selection of trainees into the training programs. Out of the listed criteria in Figure 7.8, all the PIAs at least checks the required documents apart most of them, 90% of PIAs, indicated for conducting viva voce.
Figure 7.8: Overall Different selection criteria opted for the selection of trainees
Similarly, Manipur (100%), West Bengal (80%), and to some extent, Kerala (75%), uses almost all three criteria for selecting the trainees, as shown in Table 7.6.
Table 7.6: State-wise Different selection criteria opted for the selection of trainees
States Written Exam Viva Voce Documentations
Delhi 67% 100% 100% Gujarat 60% 80% 100% Haryana 67% 100% 100% Kerala 75% 75% 100%
Manipur 100% 100% 100% Punjab 38% 100% 100%
Rajasthan 33% 83% 100%
56%
90% 100%
0%
20%
40%
60%
80%
100%
120%
Written Exam Viva Voce Documentations

89
Uttar Pradesh 40% 90% 100%
West Bengal 80% 80% 100%
Total PIA 56% 90% 100%
Though PIAs adhere to checking of the documents, they generally find difficulty in getting the school's certificates of those beneficiaries who dropped out of the school.
7.4.4 Engaged NGO’s and Community in the administration of the Scheme The PIAs were asked if they are engaging NGOs and communities in administration of the scheme as well better spread of the scheme among the minority community. As can be seen in Figure 7.9, overall, only 46% of the PIAs (respondents) engage the NGOs and communities. The role of NGOs and communities can be improved.
Figure 7.9: Overall Percentage of PIAs engage NGOs and Community in the administration of the
scheme
State-wise information from PIAs indicates that Gujarat (100%) and Rajasthan (83%) have maximum engagements and States like Utter Pradesh (60%) and Haryana (50%) have a fair engagement of NGOs and Communities, as shown in Table 7.7 Table 7.7: State-wise Percentage of PIAs engage NGOs and Community in the administration of the
scheme States Yes No
Delhi 0% 100%
Gujarat 100% 0%
Haryana 50% 50%
Kerala 25% 75%
46%
54%
Percentage of PIAs engage NGOs and Community in the administration of the scheme
Yes No

90
Manipur 0% 100%
Punjab 38% 63%
Rajasthan 83% 17%
Uttar Pradesh 60% 40%
West Bengal 20% 80%
Total PIA 46% 54%
7.4.5 Role of NGO’s and Community in the administration of the Scheme and how they are
engaged The overall insights across the states covered as part of the survey include • Engaged community representatives like Gram Pradhans to spread awareness • Engaged with and invited the local community leaders, organizers, and NGOs to frequently visit
the training center and provide their feedback • Participation of community leaders and teachers, doctors, social workers etc together with
district/block government officials • Tie-ups and networking with few NGOs and community leaders • Mobilized candidates from religious places like Temples/Mosques/Churches etc State-wise, some of the insights are elaborated below: In Kerala and West Bengal, PIAs reported that most of their training centers are located in rural or semi-urban areas. The team ensured the creation of a steady network. A committee of community leaders and other prominent people from the community, such as teachers, doctors, social workers, etc. together with district/block government officials, meets and participates in such meetings on a quarterly basis. In Uttar Pradesh, the PIAs mobilized candidates from religious places like Temples/Mosques/Churches. The PIAs provided employment-based education to the underprivileged students so that every student can earn their livelihood and be self-reliant. The PIAs engaged with community representatives like Gram Pradhans in spreading awareness of the scheme to the deserving candidates, thus generating inquiries for the course, which were later converted into admissions. In Rajasthan and Haryana, PIAs reported that they engaged NGOs/CBOs and other community-based organizations for mobilization and awareness generation among the target community about the scheme. They engaged leaders from various minorities to mobilize candidates from religious places like Temples/Mosques/Churches etc. This also led their parents to support them in joining this training programme. The PIAs also have tie-ups and networking with few NGOs and community leaders working for poor minority youth. These NGOs help them to create awareness of the scheme amongst the community and give counsel to the students as well as the parents about the scheme and organization. In Gujarat, the PIAs engage with and invite the local community leaders, organizers, and NGOs to visit the training center and

91
provide their feedback frequently. The NGO & Community helps the scheme by bringing awareness. Few PIAs have used them for helping in mobilization and awareness activities. 7.4.6 Is the Training Centre in Minority Concentrated Area The PIAs (respondents) were asked if the training center is located in minority concentrated area. Based on the information gather related to the location of the existing training centers, it is found that 87% of the Training centers are located in the minority concentrated area, as shown in Figure 7.10.
Figure 7.10: Percentage of training centers located in the minority concentrated area
Similarly, state-wise collected information, as shown in Table 7.8, also confirms that most of the training centers in the states like Delhi (100%), Gujrat (100%), Haryana(100%), Punjab (88%), Uttar Pradesh (90%), West Bengal (80%) and Kerala (75%) are located in the minority concentrated area. Only Manipur (50%-50%) have an equal percentage of the training center in the minority and the non-minority regions.
Table 7.8: state-wise percentage of training centers located in the minority concentrated area
States Yes No
Delhi 100% 0%
Gujarat 100% 0%
Haryana 100% 0%
Kerala 75% 25%
Manipur 50% 50%
Punjab 88% 13%
Rajasthan 67% 33%
Uttar Pradesh 90% 10%
West Bengal 80% 20%
Total PIA 87% 13%
87%
13%
Yes No

92
7.5 Identification and Selection of beneficiaries 7.5.1 External Linkage Provided by the PIA This section intended to collect the information related to external linkage the PIAs have and provides to the Beneficiaries for their post-training help. It can be observed from Figure 7.11 that 85% of the PIAs have linkage with the NSDC for skill training. 56% of the PIAs (respondents) also have connections with the banks, which could help trainees going for self-employments. Merely 19% of the PIAs have linkages with other PIAs; this could be enhanced to provide more options to the trainees related to skill selection. Similarly, the linkage with NMDFC for funding may also be improved.
Figure 7.11: Overall External linkages provided by the PIA
State-wise collected information also reflects similar to overall, excepts PIAs from Manipur (100%) and Delhi (100%) who have linkages with other PIAs and Bank, respectively, as in Table 7.9.
Table 7.9: State-wise External linkages provided by the PIA
States NMDFC for funding Banks NSDC for Skill
Training With other
PIAs
Delhi 50% 100% 33% 17% Gujarat 40% 80% 100% 40% Haryana 33% 33% 83% 0% Kerala 25% 50% 100% 0%
Manipur 50% 50% 100% 100% Punjab 38% 50% 75% 13%
Rajasthan 50% 33% 100% 17% Uttar
Pradesh 50% 60% 90% 30%
West Bengal 20% 40% 100% 0%
40%
56%
85%
19%
0% 10% 20% 30% 40% 50% 60% 70% 80% 90%
NMDFC for funding
Banks
National Skill Development Corporation for Skill Training
With other PIAs

93
Total PIA 40% 56% 85% 19%
7.5.2 Issues and Challenges faced in synchronizing activities with Skill India Mission and Coordinating with Sector Skill Councils The overall insights across the states covered as part of the survey include
• Delays were reported in the SMART accreditation process • Delays from Sector Skill Council • Delay in response from the Ministry • The physical inspection takes a long time • Support at village and block level required for mobilizations of trainee and awareness of
program • PIAs requested norms to be relaxed for far-flung Areas • Delays in conducting train the trainer programme for trainers in each skill course • Delay in scheme approval, PFMS mapping reported • Delays in payment of 2nd & 3rd installments reported • Assessment was not carried out timely. Assessment of beneficiaries has also taken time
ranging from 2-5 months to 1 year at times. The word of mouth publicity goes negative in such cases, affecting the next admission cycle.
In Kerala and West Bengal, as reported by the PIAs, the skills training implemented under Seekho Kamao is largely aligned to the Skill India Mission. Other than minor operational issues, the coordination with SSC is found to be smooth under the program. The SMART accreditation process itself is a little longer that involves scheme approval from the department before proceeding for desktop assessment. Some PIAs reported that the physical inspection at times takes an even longer time. Since the fund release depends on the SMART accreditation, it sometimes results into a cause for financial distress for the PIAs. The candidates however, in most of the cases were provided with SSC certificates. Few PIAs also reported that the assessment was not carried out timely and sometimes there is a delay in declaring the results too.
The PIAs across most states appreciated the support of the SSC as well as the Ministry of Minority Affairs. Some concerns were reported on the response-delays from SSC and at times from the Ministry. The challenges reported were around the long alignment process of the centres with Ministry of Minority Affairs. Second challenge reported was the difficulty of procuring code for Aadhaar based biometric attendance from the department. Third concern reported by the PIAs is about the delay in uploading batches in Skill India Portal due to unavailability of the scheme details on Skill India Portal at the time of filling information. PIAs also expected to gain support from SSC in the execution of training and placement of the candidates, which they reported as missing now. Role of Government functionaries at village level, block level are also required for support mechanism in mobilizations of trainee and awareness of program.

94
They indicated that Manual uploading of certificates, coordination between NSDC, Sector Skill Councils & MOMA is a little tedious and time taking a process. Some PIAs desired the norms to be relaxed for far flung Areas. They also indicated that Training of Trainers (ToT) for each skill course is conducted quite late. The Inspection fee, continuous monitoring fees and fees for the center accreditation is very high and the process is time consuming. New specifications with updation every year brings new rules and norms into picture and causes confusion in center development, scheme alignment and job role selection.
In Gujarat, the PIAs suggested synchronization between MoMA, PFMS, SSC & NSDC as a challenge. They expressed the need for a special coordination officer to be designated for better coordination between all stake holders. They were of the view that a mechanism should be established for a quicker response of emails. The delay areas have been scheme approval, PFMS mapping & payment of 2nd & 3rd instalments. Similarly, SMART accreditation got delayed many a times due to policy change & process improvement. Because of these delays certain PIAs had to get assessment in the next year. Inspection fees, continuous monitoring fees and centre accreditation fees are very high and time consuming. Due to transfer process of SDMS portal to Skill India Portal, the portal was shut down for almost 7 months in year 2019, causing delay in uploading batches on the portal and hence, commencement of the program.
In Uttar Pradesh and Delhi, PIAs stated that the ToT is carried out quite late for each training course. Inspection fees, continuous monitoring fees and centre accreditation fees are very high and time consuming. Due to migration process of SDMS portal to Skill India Portal, delay was observed in making the centres. SMART on-boarding is a tedious and time consuming process with manual uploading of certificates. On the other hand, coordination between NSDC, Sector Skill Councils & MoMA and Sector Skill Councils needs attention. Some concerns were reported on the response-delays from SSC and at times from the Ministry.
7.5.3 Introduction of Entrepreneurship related Courses The PIAs were asked if a course on entrepreneurship should be introduced. It was found that 94% of the PIAs respondents felt that a course on entrepreneurship should be introduced. State-wise collected information also confirms on adopting the course on entrepreneurship except the PIAs from Delhi where 33% disagree in floating such a course.

95
Figure 7.12: Overall consent on adopting a course on entrepreneurship course
State-wise collected information also confirms on adopting the course on entrepreneurship except the PIAs from Delhi where 33% disagree in floating such course, as shown in Table 7.10.
Table 7.10: State-wise consent on adopting a course on entrepreneurship course
States Yes No
Delhi 67% 33%
Gujarat 100% 0%
Haryana 100% 0%
Kerala 100% 0%
Manipur 100% 0%
Punjab 88% 13%
Rajasthan 100% 0% Uttar
Pradesh 100% 0%
West Bengal 100% 0%
Total PIAs 94% 6%
7.5.4 If yes, how many hours of Course should be introduced? While 61% of the target PIAs suggested that a course of more than 60 hours be introduced on entrepreneurship, 39% of the target PIAs recommended up to 60 hours of the course, as summarized in Figure 7.13.
94%
6%
Entrepreneurship related Courses
Yes No

96
Figure 7.13: Overall recommendation of course hours on entrepreneurship
100% target PIAs from Gujarat and Haryana proposed for more than 90 hours of course, while all target PIAs from Manipur recommended less than 60 hours to the course as compiled in Table 7.11.
Table: 7.11 State-wise recommendation of course hours on entrepreneurship
States Up to 60 hours
61 to 90 hours
91 to 120 hours
120 to 240 hours
More than 240 hours
Delhi 25% 50% 25% 0% 0% Gujarat 0% 0% 60% 0% 40% Haryana 0% 0% 20% 20% 60% Kerala 50% 25% 25% 0% 0%
Manipur 100% 0% 0% 0% 0% Punjab 33% 17% 0% 0% 50%
Rajasthan 40% 0% 0% 0% 60%
Uttar Pradesh 70% 0% 0% 0% 30%
West Bengal 40% 20% 40% 0% 0%
Total PIAs 39% 11% 17% 2% 30%
7.6 Placements and Tracking This section summarizes the information collected from PIAs related to placements and method & issue while tracking the Beneficiaries post-placements. It has been envisaged under the scheme that the placement assistance and counseling should be offered to all candidates and placement must be ensured for a minimum of 75% candidates with at least 50% of them in the organized sector.
7.6.1 Number of allotted seats, Trainee trained, Trainee dropped, Skill Certificates received, and Trainee placed
39%
11% 17% 2%
30%
Course hours on Entrepreneurship
Upto 60 hours 61 to 90 hours 91 to 120 hours 120 to 240 hours More than 240 hours

97
The information collected from PIAs related to the number of trainees allocated, actual training trained, the number of trainees dropped the training, the number of trainees received the skill certificates, and the number of trainees placed is summarized in Table 7.12.
Table 7.12: Summary of enrollment and Placement Record of Beneficiaries from target states
States Allotted seats
Actual Trainee Trained
Trainee dropped
Trainees received
certification
Trainee Placed
Delhi 5600 5510 90 5428 4457 Gujarat 3960 3796 164 3708 3225 Haryana 13920 13812 108 13678 10512 Kerala 1770 1750 20 1740 1396
Manipur 800 800 0 800 707 Punjab 4140 4125 15 3960 3257
Rajasthan 8320 8202 118 8104 6183 Uttar Pradesh 4730 4600 130 4161 3280 West Bengal 2635 2631 4 2489 1925
Grand Total 45875 45226 649 44068 34942
Overall, 99 % of the enrolled trainees finished the training thus suggesting a 1% dropout from the training. Similarly, out of those who are trained, overall, 97% got the skill certificates. 79% of the trainee got the placements after completing the training. The reason for the 3% deficit between actual trainee and skill certificate could be due to delay in assessments or the trainee not appearing for evaluation after training.
Figure 7.14: Overall percentage Enrollment and Placements record
99%
1%
97%
79%
0% 20% 40% 60% 80% 100% 120%
Actual Trainee trained
Trainee dropped
Trainees received certification
Trainee Placed

98
The summary of state-wise information is in Table 7.13. According to the report, states like Manipur, Punjab, and West Bengal have no dropout. Similarly, all trainee from Manipur received their skill certificates. The states like Delhi (82%), Gujarat (87%), Manipur (88%), and Punjab (82%) have more than 80% placements, as shown in Table 7.13.
Table 7.13: State-wise percentage of Enrollment and Placements record
States Actual
Trainee trained
Trainee dropped
Trainees received
certification
Trainee Placed
Delhi 98% 2% 99% 82% Gujarat 96% 4% 98% 87% Haryana 99% 1% 99% 77% Kerala 99% 1% 99% 80%
Manipur 100% 0% 100% 88% Punjab 100% 0% 96% 82%
Rajasthan 99% 1% 99% 76%
Uttar Pradesh 97% 3% 90% 79%
West Bengal 100% 0% 95% 77%
Grand Total 99% 1% 97% 79%
The overall and stat-wise average placement information received from the target PIAs are more than the Minimum requirement of the “Seekho aur Kamao” scheme Guidelines. However, slightly lower placements could also be due to COVID-19 or delay in assessments. 7.6.2 Average Placement Salary Maximum Salary, and Minimum Salary, obtained through
Placement This section is summarizing the salary-related information as collected from the target PIAs. It can be seen from the Figure 7.16 that almost 96% of the beneficiaries trained through target PIAs got an average salary of more than 5000, while 33% trainee got more than 10000 on an average. The overall average salary obtained by the trainee was more than 9500, as observed from Table 7.16.

99
Figure 7.15: Overall Average Placement salary
State-wise report reflects that all most all trainee from Delhi, Gujrat, Haryana, Kerala, Manipur, Punjab, and Uttar Pradesh received average salary more than Rs. 5000, while only 17% and 20% of trainee from Rajasthan and West Bengal received average salary less than Rs. 5000, as shown in Table 7.14, but none of the training center of any state have provided average salary less than 7300, as deduced from Table 7.15
Table 7.14: State-wise percentage Average Placement salary
States Up to Rs.5000 per month
Rs.5001 to 10000
More than
Rs.10000 Delhi 0% 33% 67%
Gujarat 0% 80% 20% Haryana 0% 71% 29% Kerala 0% 100% 0%
Manipur 0% 50% 50% Punjab 0% 71% 29%
Rajasthan 17% 67% 17%
Uttar Pradesh 0% 63% 38%
West Bengal 20% 60% 20%
Total PIAs 4% 63% 33%
Trade wise average placements salary is summarized in Table 7.14 A. Average salary across different trade ranged from approx. 5000 (Hotel management) to approx. 24000 (aviation).
Table 7.14 A: Trade-wise percentage Average Placement salary Job Role Average salary
Hotel management 4875 Machine Maintenance Mechanic 6500
Electrician 7875 Electronics 8000
4%
63%
33%
Average placement salary
Upto Rs.5000 per month Rs.5001 to 10000 More than Rs.10000

100
Apparel 8000 Call center 9053 Plumbing 9214
Medical laboratory technician 9655 Beauty Parlour 9900
Supervisor Interior Designer 10175 Data Entry 10903
MEPSC 11000 Sampling Tailor 11140
Construction 11700 Accountant 12314
Tally 12350 Nursing 12551
Retail management 13125 Aviation 23948
Overall Average 10646
Manipur (Rs. 17000) provided highest average salary as compare all other states, followed by Delhi with more than Rs. 11000. Maximum salary overall received to the trainees was more than Rs 16000, while Minimum salary overall was more than Rs. 7700. Here, also Manipur had highest maximum (Rs. 40000) and minimum (Rs. 12250) salary at the target PIAs training centers.
Table 7.15: State-wise and overall actual Average, maximum, and minimum placement salary
States Average salary
Maximum salary
Minimum salary
Delhi 11133 15667 8983 Gujarat 7367 13333 4833 Haryana 9367 11667 7600 Kerala 7300 12000 6575
Manipur 17000 40000 12250 Punjab 9333 11750 7767
Rajasthan 9100 13375 8225 Uttar Pradesh 9829 14786 8229 West Bengal 7750 12425 5175 Grand Total 9798 16111 7737
7.6.3 Most common skills opted by beneficiaries The scheme provide different types of skill based training to the beneficiaries align with National Skills Qualifications Framework (NSQF) and approved by National Skill Development Corporation

101
(NSDC). There huge set of traditional and modern trades approved by NSDC and NSQF. This section outlines the trades mostly opted by the trainees and subsequently trained at different training centers. As can be observed in Figure 7.16, Most common skills in which training is imparted is Tailoring/embroidery (47%), followed by Plumbing (32%), Retails (28%), Office assistance (28%), electricians (26%), makeup/beauty Parlor (23%), Technicians (20%), etc.
Figure 7.16: Overall most common skills opted by Beneficiaries
7.6.4 Placement in Traditional/Modern Sector Previous section, 7.4.3 outlined the common trade opted by the trainee, where it reflected that trainee opts both traditional as well as modern trade. But, on whole number of trainee selecting modern trades are more as compared to the traditional trade. This section outlines the sectors i.e. modern or traditional, in which placements are done. Figure 7.17 compiles the overall placement related to sectors in which trainees were placed. It can be observed that overall most of the placements say, 71% happens in modern sectors as compare to 29% in traditional sectors.
13%
5%
5%
11%
26%
9%
13%
18%
23%
15%
28%
32%
28%
47%
20%
0% 5% 10% 15% 20% 25% 30% 35% 40% 45% 50%
Account/Tally Aviation
Construction Data Entry Electrician
Food & Beverage General Duty Assistant
ICT Makeup/ beauty parlor
Medical Laboratory Technician Office Assistance
Plumber Retails
Tailer/Emboridery Technician

102
Figure 7.17: Overall percentage of placements in modern/traditional sectors
State-wise also impacts are same except Punjab and Uttar Pradesh, were placement in both the sectors: Traditional and modern are similar; 44% and 56%, respectively, as shown in Figure 7.18
Figure 7.18: State-wise percentage of placements in modern/traditional sectors
7.6.5 Placement in Organized Sector The scheme requires that at least 50% of trainee must be placed in the organized sectors. Organized sectors are classified as organization which provides salary slips with other facilities. Figure 7.19 reflects the overall compiled information received from the Target PIAs, which outline that overall 65% target PIAs have placed their trainees in the organized sectors as compared to 35% in the unorganized sectors. This confirms the requirements of 50%.
29%
71%
Placements in modern/traditional sectors
Placed traditional sectors Placed Modern Sector
34% 23%
34% 30% 18%
44%
16%
44%
21% 29%
66% 77%
66% 70% 82%
56%
84%
56%
79% 71%
0%
20%
40%
60%
80%
100%
120%
Delhi Gujarat Haryana Kerela Manipur Punjab Rajasthan Uttar Pradesh
West Bengal
Grand Total
Placements in modern/traditional sectors
Placed traditional sectors Placed Modern Sector

103
Figure 7.19: Overall percentage of placements in Organized/unorganized sectors
State-wise also a criterion of 50% was maintained at all the target PIAs. However, there are states like Punjab (52%), Kerala (56%) and Haryana (59%) which have lower percentage of placements in organized sector as compared to overall percentage, as depicted in Figure 7.20
Figure 7.20: State-wise percentage of placements in Organized/unorganized sectors
7.6.6 Reasons for drop out of Trainees from Seekho Aur Kamao Scheme The dropout from the program in this study are observed very low (Section 7.4.1), i.e. in the range of 1%. The PIA’s (respondents) were asked for the reason for such dropout and the information is summarized in Figure 7.21. About 80% of the target PIAs indicated following important reasons (i) Family problem including health of family members (21%), (ii) Early marriage (21%), (iii) Poverty/low family income and need to support family (19%), and (iv) Migration/shifted to another place, as shown in Figure 7.21.
65%
35%
Placements in Organized/unorganized sectors
Placed Organized Sector (with salary slip) Placed unorganized Sector
71% 69% 59% 56%
81%
52%
77% 62% 63%
29% 31% 41% 44%
19%
48%
23% 38% 37%
0%
20%
40%
60%
80%
100%
120%
Delhi Gujarat Haryana Kerela Manipur Punjab Rajasthan Uttar Pradesh
West Bengal
Placements in Organized/unorganized sectors
Placed Organized Sector (with salary slip) Placed unorganized Sector

104
Figure 7.21: Reasons for dropping out of the training program
7.6.7 Reasons for not taking Placement under from Seekho Aur Kamao Scheme The PIA’s (respondents) were asked the reason “of beneficiaries not taking up the placements”. The reasons included not getting a suitable company for placements (32%), need to look after the family (21%), and language problem in going to another place/relocating (18%). These three together are reasons given by 60% of the target PIAs (see Figure 7.22).
Figure 7.22: Reasons for not getting Placements under the seekho aur Kamao program
7.6.8 Placement tie ups of PIA’s
21%
21%
19%
16%
11%
8%
3%
2%
0% 5% 10% 15% 20% 25%
Family problems (including health of family members …
Early marriage
Poverty/ Low family earning and need to support by …
Migration/ shifted to another place
Self Health Problems
Take care of brother or sister (sibling)
Training Centre is in far distance
Non availability of girls toilet Dropping out of the training program
3%
12%
14%
18%
21%
32%
0% 5% 10% 15% 20% 25% 30% 35%
Self-employment (not interested in placement)
Salary/wages not sufficient
Not interested to leave their home town and relocate
Language problem in going to another place/ relocating
Need to look after family
Not getting a suitable company for placement
Reasons for not getting Placements

105
The different strategy and channels are opted by the PIAs for providing the placements to the beneficiaries. Different channel opted by most of the target PIAs are the Company tie ups(98%), Tie ups with placement agency (83%), Campus Placements (75%), Job fairs (79%), and Job counseling (90%) (see Figure 7.23).
Figure 7.23: Different channels used by the PIAs for providing placements
7.6.9 Different methods used to keep track of trainees post placement after the course The PIAs (respondents) were asked regarding the methods used to monitor the performance of the beneficiaries for next one year, post-placements. This is the mandatory requirement of the scheme. The various measures taken by the PIAs (respondents) are summarized in Figure 7.25. More than 80%n of the PIAs uses measures like (i) Frequent call on mobile phone and sending SMS (96%), (ii) Visits from PIA to the candidates (90%), and (iii) inviting candidates on special occasions. However, only 42% of the PIAs constantly sends emails and keep the candidates aware about the program, as shown in Figure 7.24.
Figure 7.24: Different Methods used to keep track of trainee post placement after the course
98% 83% 75% 79%
90%
0%
20%
40%
60%
80%
100%
120%
Tie up with Company
Tie up with Placement
agency
Campus Placements
Job fairs Job Counselling
Placement tie ups of PIAs
96%
42%
90%
85%
0% 20% 40% 60% 80% 100% 120%
Frequent call on Mobile phone and sending SMS
Constantly sending Emails and keeping aware about the program
Visits from PIA to the Candidate
Inviting them on special occasions
Different methods used to keep track of trainees post placement after the course

106
7.6.10 Reasons for losing contact with the trainee after the program This section explores the reasons for losing the contact with the beneficiaries after the Training. Figure 7.25 outlines three reasons of which 88% of the PIAs gave “frequent mobile number change” as the important reasons for losing the contact.
Figure 7.25: Reasons for losing the contact with the trainee after the program
7.7 Documentation 7.7.1 Do you identify and document best practices and home-grown innovations in the form of
case studies This section is related to identification and documentation of best practices and home-grown innovation in the form of case studies by the PIAs. Figure 7.26, signifies that almost 76% of the target PIAs maintains documents for such activities. But, still 24% of target PIAs did not maintain, thus such PIAs may be encouraged to documents such activities in future.
Figure 7.26: Documentation maintained by PIAs related to best practices and innovation in form of case
study
88%
49%
9%
0% 20% 40% 60% 80% 100%
Frequent mobile number change
Frequent Job change
Other reasons
Reasons for losing contact with the trainee after the program
76%
24%
Documentation of Case Studies and Best Practices
Yes No

107
State-wise, more than 80% of the target PIAs of all states except Delhi (67%), Haryana (62%), and Punjab (63%), documents the best practices and innovation in form of case studies, as in Figure 7.27.
Figure 7.27: State-wise documentation maintained by PIAs related to best practices and innovation in form of case study
7.7.2 Use of Case Studies in course material This section explores whether the case studies developed through documenting the best practices and home grown-innovation are used during the training in form of course materials. Around 79% of the target PIAs reported the usage of the case studies so developed as a course material (see Figure 7.28). More PIAs can be encouraged to document such activities in future.
Figure 7.28: Use of developed case study as course materials
7.7.3 Please share some examples of dissemination The overall insights across the states covered as part of the survey include
Delhi Haryana Gujarat Kerala Manipur Punjab Rajasthan Uttar Pradesh
West Bengal
No 33% 38% 17% 25% 5% 38% 17% 20% 20% Yes 67% 62% 83% 75% 95% 63% 83% 80% 80%
67% 62% 83% 75%
95%
63% 83% 80% 80%
0%
20%
40%
60%
80%
100%
120%
79%
21%
Use of Case Studies in Course Material
Yes No

108
• Bringing out a batch magazine containing all the information of candidates trainees • Paid transport allowance and one day salary to the invited alumni • Documented case studies of successful Alumni after completion of training. • PIAs call their placed candidate to the centers to share their experiences before and after
training with the current trainees • Sharing of case studies through power point presentation during in-house events
In Gujarat, as told by one PIA, one of the beneficiaries from Indore started her own work into providing beauty care facility at clients’ houses. She started this by getting print pamphlets and distributing/pasting it in nearby colony. Gradually she grew her client base and then opened her own beauty parlor. In Haryana and Rajasthan, the PIAs shared case studies through power point presentation during in-house events. Alumni meets were organized and Alumni were invited from past successful batches to share their experiences with the candidates of current batches. A success story in the community helps the trainees move in the right direction towards a goal.
In Kerala, according to the PIAs, the success stories are prepared and put up on the notice board of the institute which can be seen by the students, parents and other visitors, thus sending a positive message amongst the community, thereby more youth joining the courses. The success stories are shared with the Ministry or funding agencies as well. Certain other PIAs document case studies of candidates who have achieved success in career progress after completion of training. Brief of one or two pages is prepared on the same and circulated among the ongoing class candidates using social media. Also, occasionally video conferencing sessions are arranged in the classroom with these alums, so that they can have a direct face to face interaction and understand the possible benefits of the scheme. Other efforts made are towards conducting guest lecture from the Industry and placement tie up before the course. One or two PIAs have prepared their own software to manage training and placement related activities.
In Manipur and Uttar Pradesh, PIAs call their placed candidate to the centers to share their experiences before and after training with the current trainees, thus motivating them to perform better and gear up for placements. Some of these PIAs also pay TA and one day salary to these alumni who come to center for sharing their success stories. Similarly the entrepreneurs come and share the story of their start up as to how they started their work with almost no back up. Some PIAs reported that for every batch trained and placed they bring out a Batch Magazine, containing all the information. The same is shared with all the candidates, their parents and also with the sponsoring department.
In West Bengal, the success stories are prepared and placed on the institute notice board, which can be seen by students and others, sending a positive message to the community, bringing more young people to the courses. The stories of success are also shared with the ministry or funding agencies. Some other PIAs document case studies of candidates who, following completion of

109
training, have achieved success in career progress. A one or two-page brief is prepared on the same page and circulated using social media among the ongoing class candidates. For example training was provided to Mr. X in electrician trade under the seekho our kamao project. He remained a very sincere trainee in his batch. After his training got over he got a job as a machine operator for seven months. After this, he opened an electric repairing shop from which he is earning is about Rs 20000 to Rs 25000 per month. Other efforts from PIAs reportedly are made to conduct industry guest lectures and to tie up the placement before the course. To manage training and placement related activities, one or two PIAs have prepared their own software.
7.7.4 Do you have any system of rewards for beneficiaries / Trainers? Please share The overall insights across the states covered as part of the survey include
• Beneficiaries were rewarded basis their scores and attendance • Sincere trainee/s got a prize for best trainee of the centre • Trainers were rewarded basis student feedback, good results in assessment and
placements. • Posting their name and photograph on the centre notice board • Trainers & beneficiaries were rewarded in front of the class • Appreciated Trainers were sent to Train the Trainers programmes • Student of the month, student of the batch, best placement of the batch, best faculty, and
faculty of best placed batch • Rewards were also given based on monthly progress report and assessment
In Gujarat, the trainers & beneficiaries were encouraged by rewarding them in front of the class and center to enable social motivation. Another form of reward was acknowledging their contribution by posting their name and photograph on the centre notice board. PIAs also reported to have organized interaction programmes for new trainees to interact with old ones. Employers are also invited to talk about the job roles they offer, thus leading to trainees’ motivation. To increase the enthusiasm of beneficiaries and trainers some PIAs also gave prizes or mementos. Some PIAs brought out monthly progress report and assessment. Others came out with campaigns like AISECT Kaushal Championship to spread awareness about the skill development as well as to recognize and facilitate talents based on their skills.
In Delhi, PIAs reported that when the trainees are placed then they are provided support with guidance regarding their job role and the PIAs counsel them as and when required. Afterwards also, they are tracked and their performance is noted and guidance provided and appreciated. Rewards are given to trainees on their scores and attendance. The mode of rewards to trainers is multifarious based on student feedbacks and best results in placements.
In Haryana and Punjab, PIAs reported to have organized ToT for trainers and also conduct some appreciation events to boost their morale and skills. Skill competitions were organized and winner trainers & beneficiaries were encouraged by rewarding them. Sincere trainees were awarded with

110
a prize for best trainees of the centre. Other than this, some PIAs also told that successful trainees willing to setup a self-sustained means of livelihood are supported in various ways i.e. financially, through training and guidance, support in documentation and help in completing the process of setting up the business. Other PIAs also reported that they reward Student of the month, student of the batch, best placement of the batch, best faculty, and faculty of best placed batch. In Kerala and West Bengal, certain PIAs reported to have awarded the successfully placed and working candidates with a Certificate of Appreciation, thus encouraging them to continue working and progressing in their lives. Another form of reward was to acknowledge their contribution by posting on the centre notice board their name and photograph. The reward for trainers is reported to be based on least dropouts & best results of the students. Hence, the number of students enrolling vis-à-vis successfully completing the training matters even to the trainers too. Good track record and good attendance also fetches rewards to the trainers. The students’ placement and their continuing at their workplace is also a criteria for reward for the trainers. The reward system is based on the percentage achievement by the trainers. Some PIAs reward the highest marks holder in the internal assessments.
In Manipur, PIAs have reported gifting and awarding to punctual candidates with Best Candidates award. They also reward good performance in monthly assessments. Best Trainers awards are given for the Best Performance, and they are also featured in the annual magazine.
In Rajasthan and Uttar Pradesh, PIAs reported that Skill competitions were organized and winner trainers & beneficiaries were encouraged by rewarding them. Sincere trainees were awarded with a prize for best trainees of the centre. Best Trainers awards are given for the Best Performance. Some PIAs brought out monthly progress report and assessment. Some PIAs reward the highest marks holder in the internal assessments. Good track record and good attendance also fetches rewards to the trainers.
7.8 Issues and Challenges 7.8.1 Awareness Generation The overall insights across the states covered as part of the survey include
• Language barrier posed challenge • Orthodox families of female candidates do not allow to send them for training/job • Locals not interested in going outside for training or job • Involvement of local administration requested by PIAs • Word of mouth publicity • Scattered population and geographical challenges in reaching out to the most needy • Many start supporting their family early by dropping out from the studies • PIAs who have been working since long have established their credibility

111
In Delhi, the PIAs reported that since less widely heard, the local people were not confident in the PIAs and the scheme. They are also not interested in sending their girls outside for training or job. It needs one to one counseling to convince them to join the programme.
In Gujarat, PIAs reported that since less widely heard, the local people were not confident in the PIAs and the scheme. They are also not interested in going outside for training or job. Most of the beneficiaries would engage in increasing family income from very low age hence skilling does not matter much to them. Interestingly, the local authorities are not even aware of the scheme. The orthodox families of female candidates also face a challenge.
In Punjab, Haryana and Rajasthan, the PIAs reportedly did a door-to - door awareness campaign to make the target population aware of the scheme and its benefits. The concept of skills being heard less often, the locals did not trust the PIAs and the scheme. Interestingly, even the local authorities are not aware of the scheme. The Muslim families of female candidates are also challenging, as they do not allow their girls to go out and work. The language barrier also posed a challenge. It is difficult for residents to believe that participants will receive a scholarship from the Skills Training Programme. The Orthodox families of female candidates are also facing a challenge. However, some PIAs have been working for a long time and have established their credibility. Placement results spoke for itself, and word of mouth publicity is now working the best. Scattered population and geographical challenges in reaching out most needy was also seen.
In Kerala, the PIAs were not reportedly confronted with a challenge in generating awareness. They reported that they have a well-established community team and a good network of their organisations. The PIAs reported use of a variety of media to reach out to the candidates in order to explain the scheme and its benefits. They opined that the involvement of local administration will make this task much structured and easy creating a greater impact. PIAs argued that mobilizing female candidates is kind of challenging, as they are afraid to leave their homes and guardians are also not ready to send them for training. They also try to influence other community members with their negative opinions.
In Manipur, many PIAs said that the prime responsibility for the mobilization of trainees for this Programme rests with the partnering institutions. Many of them reported that their process of student selection entails a series of steps starting from orientation Programmes. The publicity campaign is conducted through print and visual media and applications are accepted through website as well as physical means. PIAs suggested that the Ministry must also make the public at large aware of the scheme through different modes of communication viz., newspaper, advertisement, television etc. The PIAs shared their challenge with the time duration allotted for mobilization. They also suggested the support of the district administration in mobilizing candidates. For example, District level skill expos and campaigns may be organized which showcase the importance of skilling to the candidates.

112
In Punjab, the PIAs reportedly did door to door awareness campaign to make the target population aware of the scheme and its benefits. Approaching and convincing the community head also works towards paving way to convince the target population. In turn the community heads also ask for creating a different section for their ladies for classroom. Overall, there has been observed lack of awareness of the scheme in the community and with local authorities.
In Uttar Pradesh, the PIAs reported that people are unaware of this scheme of the Government. Therefore, PIAs suggested that the ministry must make awareness campaigning of the scheme through different mode of communication it could be newspaper, advertisement, television etc. The locals find it hard to believe that a skills training programme will also provide stipend to the participants. Language barrier presented a challenge. The Muslim families of female candidates also pose a challenge since they do not allow their girls to go out and do job. Coming from the backward community and weaker section of the society, most beneficiaries would want to support their family by dropping out from the studies. Thus, motivating them for continuation of studies through skilling is a challenge too.
In West Bengal, PIAs have not reportedly faced challenge in generating awareness. They reported to have an established team of community engagement and good network of their organizations that help in mobilization of the candidates. A variety of media is used to make the target population aware of the scheme and the benefit thereof.
7.8.2 Selection of beneficiaries The overall insights across the states covered as part of the survey include
• Home visits, community interaction and counseling were conducted • Many PIAs selected only those candidates who were really in need • Selected those who were serious about their career • Parents have low interest to let their wards join the skill training since these wards are
earning daily wages or taking care of the household and siblings • Parents do not want to send their wards outside for training or job purposes. • Parents want separate batches for females • Many beneficiaries show their eagerness to do the course but they drop out in the initial
few days of the course and hence right in the beginning twice the number of target beneficiaries have to be mobilized
• Beneficiaries reluctant to relocate for a good job post training. • Documents pertaining to their education and otherwise are not there • Duration of in-taking the students is very short • Lack of allotment numbers but more trainees available
7.8.3 Linking with NSDC

113
The overall insights across the states covered as part of the survey include • There is difficulty in assessment to be done from NSDC in coordinating with SSC's • Now a days MoMA training is executing at the centres which are SMART accredited. This is
how the programme is automatically linked with NSDC. The challenge is to get accreditation of a particular centre and starting the training programme under the scheme in a timely manner. Linking the MoMA project with the NSDC SMART portal is also an issue.
• In the far flung areas Internet is an issue hence linking with NSDC is not easy
7.8.4 Delivering Training Courses/ designing Training material The overall insights across the states covered as part of the survey include
• Self-designed and SSC approved course material delivered to the candidates • Developed a dynamic web-based Training Management Information System (TMIS) and all
database of the trainees • Feedback from prospective employers is taken on areas of development • Milestones chart (also called as the routine) created to track training progress • Parent faculty meet is introduced by some PIAs • The target beneficiaries are mostly school dropouts, therefore, pre requisite fundamentals
are taught first • Courses in regional languages are not available • Many new trades were not listed at the time of start of training • In many regions, it’s difficult to maintain 80 percent of candidates’ participation due to
distances • Challenges are faced while procuring course material • In case of female candidates, parents do not allow her to go for training few kilometres
from her own village. • Mid-term evaluation as well as end of the project impact assessment is done by some PIAs • PIAs use a self-designed and SSC approved course material • PIAs use additional multimedia content and videos for delivering the course material, • The trainers stressed on the practical knowledge and ensured that the candidates are
optimally skilled
7.8.5 Getting Trainers The overall insights across the states covered as part of the survey include
• Availability of qualified trainers remains a challenge • For common job roles PIAs do not face any challenge to get trainers • Training of Trainers (ToT) certification is essential for Trainers • Trainers are selected on merit basis after couple of interview rounds

114
• Neither Sector Skill Council nor any other agency has a buffer of trained and qualified trainers to support the PIA.
• Owing to the travel issues of the beneficiary, the center needs to be set up in minority concentrated areas. Then the challenge is to find qualified trainers ready to travel to such distances.
In, Gujarat, PIAs reported that many efforts needed to be made to get qualified trainers. Owing to the travel issues of the beneficiary, the center needs to be set up in minority concentrated areas. Then the challenge is to find qualified trainers ready to travel to such distances. Many PIAs opined that trainers necessarily need to be ToT certified to add value to the trainings given to the beneficiaries. In Haryana and Punjab, PIAs reported a challenge to get qualified trainers. They hired them from urban areas and relocated them to the rural training centers. They also reported that neither Sector Skill Council nor any other agency has a buffer of trained and qualified trainers to support the PIA. In Kerala and West Bengal, many of the PIAs reported that since most of their training institutes are located in rural or semi-urban areas, the availability of qualified trainers remains a challenge. The trainers are periodically trained by internal academic team as well so as to keep them informed about changing market trends. The PIAs said that for common job roles, they do not face any challenge to get trainers. Rajasthan and Uttar Pradesh, one PIA reported to have an internal HR department that takes care of the Trainers requirements issues. 7.8.6 Managing Infrastructure The overall insights across the states covered as part of the survey include
• Infrastructure and equipments are put into place as per NSDC and SSC Guidelines • Dedicated centre managers at all training centres to manage infrastructure • Minority concentrated areas densely populated with very small spaces available and
therefore, finding and managing infrastructure in minority concentrated area is difficult • Finding big premises as per SMART accreditation requirement is difficult • SSC has not defined any infrastructure guidelines for the respective job roles
In Kerala and West Bengal, most PIAs reported that the regional admin team takes care of the infrastructure requirements of all training centres in the state. This team also takes care of the up-gradation of infrastructure requirements as well. They reported that with hiring a housekeeping staff for dusting and cleaning purposes, they are not facing any major challenges to manage the infrastructure. In Manipur, one PIA reported that since they have been into Training and Placement for approx 18 years now, they have developed a Framework for Facility Management at their training centers. With this the process of managing and operating the centres simplified a lot. They have a proper budget allocation & human resource towards managing the same. They

115
have reportedly hired a dedicated centre manager at all training centres to oversee day to day activities as well as ensure proper infrastructure for the training purposes.
In Rajasthan, PIAs reported that all the equipments and other items are put into place as per NSDC and SSC Guidelines. The center is managed by a dedicated team for the said purpose. 7.8.7 Managing hostel / Boarding/ Lodging facilities The overall insights across the states covered as part of the survey include
• PIAs did not face any challenges in managing hostel, boarding and lodging facilities • Many PIAs’ organization have their own hostel facility and infrastructure • Many other PIAs conduct only non-residential training under Seekho-Aur-Kamao
In Haryana, PIAs reported that they have not faced any challenges in managing hostel, boarding and lodging facilities as the organisation has its own infrastructure for this purpose. In Kerala, PIAs reported that they had not provided training for residential programmes and that they had not provided any accommodation facilities to the beneficiaries. They conduct only non-residential training under Seekho-Aur-Kamao. In Manipur, PIAs reported that they have state-of-the-art hostel boarding & lodging facility for trainees. In Punjab and Rajasthan, PIAs reported that they had not provided the recipients with any lodging facilities as they were only conducting non-residential training. In West Bengal and Uttar Pradesh, PIA reported that they had not provided the beneficiaries with any accommodation facilities. They conduct only non-residential training under Seekho-Aur-Kamao. 7.8.8 Placement Tie ups The overall insights across the states covered as part of the survey include
• The local placement tie-ups are done during the training period itself since every industry has a requirement of good candidates
• The training centers have MoU with various companies • Some PIAs have been working in skill development since last 12 years; they have good
relations with corporate, industries and placement consultancy firms. • Issue in local tie-ups as local unorganized sector do not offer proper salary package to the
candidates • Placement tie up also depends upon the demand of manpower and trades during the
training period • Difficult to identify employers in the same sector in the local areas. • Networking with corporates process includes the designing and printing of the placement
brochure, developing an electronic copy, interaction with potential recruiters, developing and maintaining student resume books

116
• Some got Placement team at the National level and at the State level which takes care of all the placement requirements of the candidates
• Candidates were reported to be preferring any local random jobs near their homes • The candidates do not gain good employment at times, because of lack of Industry
exposure • Employers reportedly preferred multi skilled candidates
In Delhi, the PIAs have placements tie-ups with various industries for placement of candidates. Many other PIAs said that they have dedicated placement cell and their training center has MOU with various companies. In Gujarat, the PIAs reported that local placement tie-ups are done during the training period itself since every industry has a requirement of good candidates. In Haryana and Punjab, the PIAs reportedly work on placement through backward integration with the employers which help the employers to choose the right candidate as per their requirement. There is an issue regarding local tie-ups as local unorganized sector do not offer proper salary package to the candidates. In Kerala, the PIAs reported to have a placement team at the National level and at the State level which takes care of the all placement requirements of the candidates. The team interacts with the candidates at various instances during the training duration especially at the start and towards the end of the training duration. The candidates are oriented about various companies and future prospects. The PIAs found sending trainees to their workplace outside of their hometown as challenging. This happens because it is difficult to identify employers in the same sector in the local areas. In Manipur, PIAs reported that their training centre helps the students acquire the best possible employability and entrepreneurship skills. Accordingly PIAs organize various well designed and tailor made training programmers both by industry experts as well as professionals, to equip the students with Soft skills, Interview techniques, Group Discussion skills, Personality Development Skills, Written/Aptitude/On-line test skills etc. Interaction with Corporate and Companies, & Industry networking is taken up without most care. However, whenever a Corporate or Company is called to the Campus, the Training and Placement cell (TnP) and various other Faculty members facilitate and provide the guidance to the students & prepare them for the Selection Process. The networking process includes the designing and printing of the Placement brochure, developing an electronic copy, interaction with potential recruiters, developing and maintaining student resume books, Allocation of companies to student and monitoring the progress of Placement activities at regular intervals. Efforts are undertaken to promote Overseas Placement The remuneration offered in International Placement is an important factor which attracts the youth, apart from the

117
nature of the job. The package differs from Country to Country and industry. The salaries are offered in the form of CTC (cost to the company), which includes besides basic salary, many allowances and incentives In Rajasthan, the PIAs have Placement tie ups with other companies to make sure more than 50 % trained candidates are placed. Some PIAs stated that placement tie up also depends upon the demand of manpower and trades during the training period. Some of the PIAs have been working in skill development since last 12 years, so they have good relations with corporate, industries and placement consultancy firms. In Uttar Pradesh, the PIAs stated that their dedicated placement cell insures that each of the successful candidates gets employment after completion of the training program. They have a placement team at the national level and at the state level which takes care of the all placement requirements of the candidates. The team interacts with the candidates at various instances during the training duration especially at the start and towards the end of the training duration. The candidates are oriented about various companies and future prospects. Some PIAs reportedly faced a challenge with the unwillingness of the trainee to relocate for job. Candidate were reported to be preferring any local random jobs near their homes. PIAs also reported that they faced difficulty to identify employers in the same sector in the local areas. The candidates do not gain good employment at times, because of lack of Industry exposure. Employers reportedly preferred multi skills candidates. 7.8.9 Post Placement Tracking The overall insights across the states covered as part of the survey include
• Techniques adopted are direct calling by trainer/placement officer, calling through call centre, SMS and employer visits
• Some PIA said that they have robust MIS systems and dedicated call centre facilities in place
• Few trainees migrate and change their contact details thus going out of touch In Delhi, PIA reported that post placement, the trainees’ status had been tracked a few times. Some PIA said that they have robust MIS systems and dedicated call centre facilities in place. As reported, the major difficulties they face in tracking are that some students migrate and change their contact details / mobile numbers, which makes it difficult to reach them. In Gujarat, PIA stated that post placement tracking is very difficult because students very often change their mobile numbers due to frequent job changes or migration / shifting to new locations as a result of job changes.

118
In states like Uttar Pradesh, Haryana and Punjab some PIAs reported that they follow a systematic post-placement mechanism. PIAs also reported that the candidates do not share their placement details and documents post placement, but the PIAs are making continuous efforts to collect these documents from the candidates time to time. However, it is widely reported by PIAs from other states such as Kerala, Manipur, West Bengal and Gujarat etc. that the majority of recipients are in the lower income group and they move from one location to another and the continuous change in their mobile numbers / contact details poses a major challenge in tracking post-placement candidates. Also, parents do not cooperate to obtain their new contact details. In Kerala, PIAs reported that for post-placement follow-up, the trainer and the placement officer jointly tracks the progress and tries to keep in touch with the post-placement candidates. Techniques used by the team to track these candidates are direct calling by trainer / placement officer, call through call centre teams, SMS and employer visits. In Manipur, one PIA reported that the Institute has a defined Post Tracking Methodology (Placed Student Tracking System)—PSTS is a custom database that records case management information for students who have undergone the programme. PSTS maintains student databases. The PSTS officer is the human face of the PSTS programme and receives all enquiries concerning students who regularly change their jobs and communicate with them. In Rajasthan, PIAs reported that a tracking sheet was maintained by a dedicated post placement tracking team. PIAs also stated that every month they track students by telephone, on-the-job visits, organize certain functions at their training centre and keep in touch with candidates and provide them with support and motivation for up to 12 months of post-training. PIA reported the beneficiaries change their mobile numbers and no updated data is available to them for new contact details. They also stated that most of the beneficiaries are from a lower income group and move from one place to another in search of livelihoods, and some of them live in rented houses, which make it difficult to track them after a long period of training. In West Bengal, PIAs stated that the trainer and placement officer jointly track the candidates after the placement and remain in touch with them. Techniques adopted by the team to track the candidates are direct calling by trainer/placement officer, calling through call centre, SMS and employer visits. Also PIA reported that if the trainees leave their jobs then it is very difficult to track the trainees and sometimes they do not provide proper information of their placement and residences. 7.8.10 Financial Management and release of the fund to beneficiaries The overall insights across the states covered as part of the survey include

119
• After initial releasing of funds, there is a long process involved before releasing of 2nd installment from Ministry of Minority Affairs
• Stipend is transferred to each beneficiary personal bank account • The stipend is issued late to beneficiaries approx. after 3-4 months, till the first stipend is
given. • The candidates either don’t have a bank account or their account is not active. • The management of finances remains a challenge as the subsequent installments of the
project are not released on time. • PFMS portal and mapping is main issue from the department side. PFMS help-center is too
slow in responding to the queries. In Gujarat, PIAs reported that the candidates either don’t have a bank account or their account is not active. So, at every centre, account opening facility has to be provided. Additionally, PFMS portal and mapping is the main issue from the department side. In some cases on the job training was conducted for two months and a stipend made for Rs 2500 per month. In Delhi, Many PIAs reported that Second installment was delayed, hence they faced an issue. In Haryana, PIAs said that stipend is transferred to each beneficiary personal account and details are available on PFMS and soft copies and bank statements. The management of finances remains a challenge as the subsequent installments of the project are not released on time. The delay in the release of subsequent installments leads the PIAs to take up loans and keep the operations going. PIAs reported that though it’s shown in guidelines that the stipend is on monthly basis but the PIAs get only 2 installments from Ministry of Minority Affairs. Now the courses are not limited to the 3 months courses so stipend amount should be disbursed on monthly basis as per actual training duration. In Kerala, West Bengal and Uttar Pradesh, most PIAs said that after initial releasing of funds, there is a long process involved before releasing of 2nd installment. Within this time period, maintaining the centre infrastructure, payment of manpower, maintaining regular supply of raw materials till the training completes, becomes an expensive affair. If release of 2nd installment happens without delay, training providers can be benefitted. The PIAs suggested that the stipend should get directly transferred to the beneficiaries’ Bank account from the department. As the beneficiaries are from poor families, they expect complete stipend and post placement support altogether, so the Ministry should release the said amount along with the 1st installment itself. In Punjab, the PIAs observed issues related with inactive and closure of trainees’ bank accounts, so new accounts were opened for them and then the stipend was transferred to those accounts. Also, observed delays in 2nd installment. For the release of stipend PIAs reportedly used PFMS module recommended by the Ministry of Minority Affairs and release the stipend on time.

120
In Rajasthan, the PIAs shared that PFMS help-center is too slow and lethargic in responding to the queries. It was observed that majority of the PIAs did give Placement support in terms of vocational guidance, arranging for interviews, sending beneficiaries for interviews, helping beneficiaries settle at their new workplaces. But no stipend was given as placement support. 7.8.11 Capacity of staff with regard to communication skills and understanding the scheme The overall insights across the states covered as part of the survey include
• PIAs conduct a review meeting of all teaching, administration and field staff on a fortnightly basis.
• Staff meet and share the issues and revised plans for smooth conduction • The institute team are thoroughly aligned with the objectives and outcomes of the scheme
in advance • A thorough workflow and team responsibilities are prepared to facilitate the achievement
of project objectives within the timelines • Regular TOTs were conducted for the trainers • Not all trainers are good at speaking English or soft skills therefore, training on soft skills
should be mandatory for these trainers
In Delhi, PIAs reported that their staff had no problem with the communication skills and understanding of the scheme. Regular TOTs were conducted for the development of knowledge and training skills. In Gujarat and Haryana, PIAs reported that to reduce the language and culture barrier, they hired local staff. In Kerala and West Bengal, most PIAs reported that prior to the start of the training programme, institute team were thoroughly aligned with the objectives and outcomes of the scheme. A thorough workflow and team responsibilities are prepared to facilitate the achievement of project objectives within the timelines. In Manipur and Uttar Pradesh, PIAs reported that they do not face any challenges as they hire well-educated and experienced staff to implement the scheme. In Punjab, PIA reported that a professional team is hired to look after the staff with regard to communication skills and understanding of the scheme. The orientation of the programme is carried out before the start of the training programme. They stated that all of their staff members are competent in terms of communication skills and understanding of the scheme. In Rajasthan, PIA reported that the staff was informed about the scheme and its objective. Communication skills and personality development sessions were conducted by experienced and qualified trainers. They conducted a review meeting of all teaching, administration and field staff

121
on a fortnightly basis. All staff members meet and share the issues and challenges they face, and revised plans are made to run the project more smoothly. 7.8.12 Documentation and monitoring including reporting The overall insights across the states covered as part of the survey include • PIAs reported an issue with there being no SPOC at the Ministry for the PIA to coordinate or
discuss their problems. • Separate Q-Team for monitoring of Project guidelines • MIS portal to manage the data and documents of trainees as per the NSDC & SSC SOP. • Separate folder maintained for candidates’ documents, trainers’ CV and all other related
information in both soft and hard copy. In Delhi PIAs reported no issue. In Gujarat, one PIA reported an issue of their 2017-18 data loss of student data and placement data from the Seekho aur Kamao portal. In Haryana, Uttar Pradesh, and Punjab PIAs reported to have appointed an MIS officer. The weekly and monthly reports are available with PIA. The PIAs reported an issue with there being no SPOC at the ministry for the PIA to coordinate or discuss their problems. In Kerala, the PIAs reported to maintain individual records of the candidates in a batch file. The registration form along with supporting documents of the candidates such as identity proof, educational documents, written examination etc. are maintained properly in the batch file. For trainer position, they make it a point to hire candidates with full knowledge about domain and good in communication skills in English, as well as, in local languages. It was observed by the PIAs that sometimes trainer for technical courses do not possess good English communication skill. So, they always make it a point to hire additional trainer for soft skill and IT skills to fulfill the gap. About understanding of the scheme, they arrange a special Train the Trainer and train the staff session before official starting of batch so that all the concerned persons who are involved with the scheme can be on same page. In Manipur and Rajasthan, PIAs reported no Issue since they have proper MIS team for maintaining documentation and separate Q-Team for monitoring of project guidelines. They have MIS portal also to manage the data and documents of trainees as per the NSDC & SSC SOP. In West Bengal, the PIAs reported to maintain individual records of the candidates in a batch file. The registration form along with supporting documents of the candidates such as identity proof, educational documents, written examination etc. are maintained properly in the batch file. They maintain separate folder for candidates’ documents, trainers’ CV and all other related information in both soft and hard copy. They keep the folder accessible till the end of the training. But sometimes the long pending process of fully closing of training can lead to loss of previous data as

122
the new training program initiate and maintenance of new documents and making space for them can lead to unintentional missing of data. Also, sometimes technical issues like system breakdown, backup affected by virus, resignation of old manpower causes trouble to retrieve old database after certain point of time. 7.8.13 Interaction and fund flow from government The overall insights across the states covered as part of the survey include
• PIA’s face issues with release of 2nd and 3rd installments from MoMA even after submitting all required documents both via email and hard copy.
• Fund flow from the government is a bit erratic • Need clarity on the process & documents required to be submitted at the beginning of the
project
In Gujarat, almost all PIAs reported issue with release of 2nd and 3rd installments even after submitting all required documents both via email and hard copy. In Haryana, PIAs reported that there are delays in fund release from government end which affect the trainees motivation towards training programme. No one-time contact assigned for PIA for direct interaction with the ministry. Some PIAs reported issues with delay of 2nd Installment. In Kerala, PIAs suggested that they should get clarity for the process & documentation required to submit at the beginning of the project. They reported that the fund flow from the government is a bit erratic and takes time in release of funds. This creates a financial burden on the organization to sustain the operational cost of the project. In Manipur, the PIAs reported that amid other challenges the one that makes things more difficult is the release of funds from the relevant department/Ministry from time to time. Late payment to PIAs often leads to many critical situations such as difficulties in managing people's salary, on-time payment of various rents like premises, hostels, labs, and continuous supply of food in hostels to name a few. The PIAs reported on many occasions they were deprived of on time release of funds despite fulfilling all procedural technicalities by the Ministry. Delays in payments makes it extremely difficult to accomplish the projects. In Punjab, the PIAs reported that they have not received 2nd installment (50%) pending due from one year. The release of 2nd installment is still pending after completion of training a year which causes operation losses and stipend payment to beneficiaries. PIAs reported that there is no SPOC from the Ministry side. In Rajasthan, the PIAs said that release of installments are too slow even after submitting all required documents both via email and hard copy. Funds for scheme executed in the year 2015-16

123
are still pending though all the documents and UTC have been submitted. In UP, PIAs faced no such challenges. Ministry of Minority Affairs has been really supportive throughout the project and the Fund flow was smooth from their end. PIAs reported that there is no SPOC from the Ministry side. In West Bengal, PIAs reported that they usually start their training after releasing of 1st installment as per the terms written on MoU. They had completed the Training & Assessment and also provided placement and still not received the next installment. The next release of payment is delayed from department due to various reasons which has an adverse effect to carry out centre related all the operations. Also, after completion of one project they receive a new target late (sometimes after 1 or 2 Years) and due to this the PIAs need to close the centres as without any activity it is always difficult to maintain all the training centres at a time. PIAs reported that the fund flow from the Government is always an issue. Hence PIAs say that it will be better, if they can get clarity on the process & documents required to be submitted at the beginning of the project 7.8.14 Areas of Concern The PIAs (respondents) were asked regarding the areas of concern in the implementation of the Seekho Aur Kamao Scheme. The PIAs reported problems related to Interaction and fund flow from the government (23%), Post Placement Tracking (20%), Linking with the NSDC (19%), and (iv) Selection of Beneficiaries (9%) (see Figure 7.29).
Figure 7.29: Different area of concerns faced by the PIAs
7.9 Suggestions for Improvement 7.9.1 Monitoring System and Indicators used for that The overall insights across the states covered as part of the survey include
• Inspection from Ministry should happen before training, so that PIAs do not incur extra cost of running the centre
• Smart accreditation of training centre & bio metric attendance is self-sufficient for monitoring
• Seekho aur Kamao portal data loss should be retrievable from the server
23% 20%
19% 9%
8% 7%
6% 5%
4%
0% 5% 10% 15% 20% 25%
Interaction and fund flow from government Post Placement Tracking
Linking with NSDC Selection of beneficiaries
Getting good quality teachers/ trainers Courses/ designing course material
Placement Tie-Ups Infrastructure-classes, labs, toilets etc and …
Capacity of the staff with regard to …

124
• Reporting process must be online and synchronized. • A SPOC (Single point of contact) should be assigned from Ministry so as to communicate
the monitoring system • Inspection should be conducted quarterly by authorities. • A Proper SOP with milestones should be prepared and followed. • A mobile application should be launched
In Haryana, the PIAs reported that Inspection from Ministry should have been done before training, so that PIAs do not incur extra cost of running the centre. Monthly progress report and biometric attendance has been in place. Smart accreditation of training centre & bio metric attendance is self-sufficient for monitoring. In Kerala, the PIAs reported that Seekho aur Kamao portal data loss should be retrievable from the server. They suggested that Reporting process must be online and synchronized. In Punjab, the PIAs opined that there is a need to develop community based mechanism. In Rajasthan, the PIAs reported that A SPOC (single point of contact) should be assigned from Ministry so as to communicate the monitoring system. PIAs also suggested that inspection should be conducted quarterly by authorities. In UP, the PIAs reported that a proper SOP with milestones should be prepared and followed. One SPOC should be appointed from Ministry side for coordination with PIAs. Some PIAs said that it needs to be more user-friendly interface, guidelines for each component’s timelines. In West Bengal, the PIAs suggested that a mobile application should be launched. 7.9.2 Linking with NSDC The overall insights across the states covered as part of the survey include
• Beneficiaries do not wish to remain engaged in any activity like linking with NSDC • PIAs reported time delay related issues • PIAs faced difficulty in assessment • PIAs reported that NSDC portal charges are too high for every step of center accreditation. • In far flung areas Internet is an issue hence linking with NSDC not easy • Faced issues for approval of scheme by Ministry of Minority Affairs, either due to a
technical glitch or the process was too lengthy.
In Delhi, PIAs reported to have faced no issue in linking with NSDC. They said that all systems have been developed and are in place. Some PIAs reported time related issues. Few others mentioned the difficulty in assessment which has to be done from NSDC, also challenges in coordinating with SSCs. In Gujarat, the PIAs reported that after the training and placement, the beneficiaries do not

125
wish to remain engaged in any activity like linking with NSDC etc. Mobile numbers for contact purposes are usually provided by the parents and that is one reason why it becomes difficult to stay in touch with the beneficiaries. Some PIAs reported problems in linking with NSDC. Others indicated issue with skill portal as there has been reported lack of information about portal updation. It was also reported that NSDC portal charges are too high for every step of center accreditation. In Haryana, PIAs mentioned the requirement of timely response from the NSDC. Some PIAs faced issues for approval of scheme by Ministry of Minority Affairs which was either due to a technical glitch or the process was too lengthy. In Kerala and West Bengal, most of the PIAs reported that now a day’s training is being executed at the centres which are SMART accredited and this links the programme directly with NSDC. The challenge reportedly faced by PIA is to get accreditation of a particular centre and start the training timely. Some PIAs said that linking the Seekho aur Kamao project with the NSDC SMART portal is an issue. The PIAs reported to have faced a time-based challenge in the scheme approval process in NSDC Skill India Portal. In Manipur, the PIAs did face issue when New Skill India portal was in the implementation stage since the PIAs had their scheduled assessment of the Batch. With the interference of the CEO of NSDC, issue was resolved and now there is no major issue with NSDC. The PIAs in Punjab reported that the center accreditation is tough to get through on the portal for example the PIA is running Aesthetic Dermatology Trainer (BWS/Q0503) trade, but it is not available on the portal of NSDC. In Rajasthan and Uttar Pradesh, the PIAs face issue linking NSDC since in far flung areas, Internet is an issue. Others indicated issue with skill portal as there is lack of information on the portal updation. Some PIAs are facing a technical challenge in uploading data on the NSDC portal. 7.9.3 Placements The overall insights across the states covered as part of the survey include
• PIAs suggested that a wider range of impact would be achieved if the local administration body facilitated the process and organized Job fairs
• During bulk placements, placement of a specific community sometimes becomes difficult • The self-employment ratio should be increased from 20% • Trainees should place in local areas and that new start-ups should be encouraged • Self-help groups should be given priority in rural areas • Candidates who do not want to move to another location due to family problems want to
work in their hometown even if on a lower salary. • MOMA should share the placement requirements of Pan India so that beneficiaries can
benefit.

126
• Some PIAs suggested that the placement tie-ups should be done by the Ministry to assist PIA. Central linkages with large employers can be made directly by the SSC / Minister for the placement of candidates according to the minimum wage criteria that will help to improve the percentage of the placement.
• Placement Tie-ups, post-placement support, relocation incentive, placement counseling camps may be provided.
In Delhi, PIAs stated that the programme's placements are set at 75%, including 20% self-employed. However, taking into account the challenges of implementing the programme for a specific community, the placement sometimes becomes difficult, especially during bulk placements. Also, candidates who do not want to move to another location due to family problems want to work in their hometown even if on a lower salary. Such placements should also be given equal importance and considered in the context of the programme. PIAs suggested that if local administration body facilitated and organized Job Fairs then this will give better results. In Haryana, PIA suggested that self-help groups should be given priority in rural areas, and MOMA should share the placement requirements of Pan India so that beneficiaries can benefit. In Kerala, PIAs suggested that placement should be made in local areas and that new start-ups should be encouraged. In Punjab, PIAs suggested that local placement and self-sustaining employment should be encouraged in COVID time. In order to improve the placement record, PIA suggested adding extra hours under the head of soft skills that include not only basic computer skills training & information but also how to be presentable and show work ethics at the workplace. In Rajasthan, PIAs suggested that under the placement calculation, the self-employment ratio should be increased as migrants would not move to other places of employment until the pandemic goes away, which would also lead to Aatmanirbhar Bharat. In other words, more weightage can be given to self-employment. The Ministry should arrange for job fairs or other arrangements to support the placement of candidates in reputable organizations. In Uttar Pradesh, PIAs suggested that the placement tie-ups should be done by the Ministry to assist PIA. Central linkages with large employers can be made directly by the SSC / Minister for the placement of candidates according to the minimum wage criteria that will help to improve the percentage of the placement. Government should also organize job fairs. The main concern for placements is that the salary is lower than the recommended salary if the PIAs are tied up in local areas where most of the candidates prefer to be placed. Placement Tie-ups, Post placement support, relocation incentive, placement counseling camp may be provided. 7.9.4 Documentation and reporting (and other governance related issues)

127
The overall insights across the states covered as part of the survey include • A Single point of contact should be assigned for daily communication for reporting and
documentation • Documentation and reporting of the program should be automated and monitored through
the portal. • Reporting process must be online and synchronized. • Issues reported in the portal. • Time lines should be clearly mentioned. • Proper SOP with milestones, reporting formats and timelines should be prepared and followed
for the Scheme. • Helpline number is required for each operational and technical issue. Currently no helpline
number or phone or email address exists for this purpose.
In Delhi, the PIAs reported that the documentation and reporting of the program should be automated and monitored through the portal. They suggested that it would also help if the release of the payment is also managed through the portal or online system. In Haryana and West Bengal, the PIAs suggested that Online documentation and online reporting must be encouraged. They also suggested that time lines should be clearly mentioned. In Kerala, the PIAs suggested that, Ministry should prefer soft copy email documents rather than hard copy. Reporting process must be synchronized. Helpline number is required for each operational and technical issue. Currently no helpline number or phone or email address exists for this purpose. PIAs reported many issues in the portal. In Rajasthan, the PIAs suggested that a Single point of contact should be assigned for daily communication for reporting and documentation. In Uttar Pradesh, the PIAs reported that a proper SOP with milestones, reporting formats and timelines should be prepared and followed. They also said that one SPOC should be appointed from ministry side for each PIA for the coordination. 7.9.5 Alternative means of certification of trainees through authorized entities. • PIAs suggested that third party assessment agencies approved by SSC can be allowed to
conduct mid-term as well as final assessment • Other PIAs did not reportedly support third party certification.
In Delhi the PIAs suggested that the certification from the SSC affiliated third party assessment agencies must also be considered and authorized to conduct the assessment under the program. PIAs opined that Government Certification is the best choice for certifying the trainees. In Haryana, PIAs felt that the best way is Sector Skill Council – SSC certification. They did not support third party certification.

128
In Kerala, Punjab and Manipur, PIAs supported Third party certification. They said Third Party Assessment Certification should be allowed to the candidates where SSC Certification got delayed. In Rajasthan, West Bengal and Uttar Pradesh, PIAs suggested that Third Party assessment agencies approved by SSC can be allowed to conduct mid-term as well as final assessment 7.10 Assets Created Services Provided Under the Scheme 7.10.1 Assets Created /Services increased in last 3 years This section assesses the growth in PIAs due to the Scheme in terms of Asset created or increased. The Information collected from the target PIAs are summarized in Figure 7.30. Except the Hostel capacity and course module, more than 90% of the PIAs have created or increased the assets in term (i) Building infrastructure, (ii) class room facilities, (iii) lab facilities, (iv) IT infrastructure, (v) Number of trainee and trainings, (vi) Placements, etc., as shown in Figure 7.30
Figure 7.30: The asset and service created or increased in last 3 years
7.10.2 Turnover and Number of training centers (2017-18, 2018-19) across all the Schemes The PIA’s (respondents) were asked the turnover and number of training centers in last two years (2017-18 and 2018-19) across all the schemes. Overall turnover on crores of the PIAs of target states has changed from Rs 511 crore in 2017-18 to Rs. 690 Crores in 2018-19, an increase of 35% in turnover. Similarly, number of training centers PIAs of target states had in 2017-18 was 847 that rose to 1034 in 2018-19, again an increase of 22% in number of training centers, as summarized in Figure 7.31
98% 98% 98% 98% 96% 85%
98%
67% 65%
98% 98% 98% 98%
0% 20% 40% 60% 80%
100% 120%
The asset and service increased in last 3 years

129
Figure 7.31: Overall Turnover and number of training centers between 2017-18 and 2018-19
State-wise information collected also gave the same reflection where PIAs of state Manipur (102%) and Punjab (117%) have double their turnover. Similarly, PIAs from Kerala (221%) and West Bengal (194%) have tripled the number of training centers over couple of years, as indicated in Table 7.16
Table 7.16: State-wise turnover and number of training centers between 2017-18 and 2018-19
Turnover(in Crores) Training Centers
States 2017-18 2018-19 Change in turnover 2017-18 2018-19
Change in training centers
Delhi 42 72 72% 63 122 94% Gujarat 133 144 8% 222 270 22% Haryana 84 109 30% 41 41 0% Kerala 3 5 63% 14 45 221%
Manipur 5 10 102% 6 7 17% Punjab 50 108 117% 165 153 -7%
Rajasthan 80 104 30% 81 90 11% Uttar
Pradesh 90 107 18% 239 259 8%
West Bengal 25 33 30% 16 47 194%
Grand Total 511 690 35% 847 1034 22%
7.10.3 Number of States in which you are providing Training
511
690
847
1034
0
200
400
600
800
1000
1200
2017-18 2018-19 2017-18 2018-19
Turnover(in Crores) Training Centers

130
The section summarizes the information about number of states in which PIAs have their training centers or provide trainings. Figure 7.32, indicates that more than 70% of the PIAs operates the training programs in multiple states, while 30% operates in 5 or more states.
Figure 7.32: Number of state in which PIAs are providing trainings
7.11 TRAINERS 7.11.1 Trainers covered in the Survey
The distribution of Trainers interviewed in the target states is summarized in Figure 7.33. The data was data collected from 120 trainers/teachers.
Figure 7.33: Percentage of trainer covered in the target states
7.11.2 Qualification of Trainers The educational qualification of the Trainers selected for the study is summarized in Figure 7.34. All of the Trainers selected for the study were graduates, of which 31% were postgraduate and 3% Ph.D.
29%
15% 15%
10% 6%
25%
0%
5%
10%
15%
20%
25%
30%
35%
1 state 2 states 3 states 4 states 5 states More than 5 states
5% 4% 9%
12%
2% 1%
8% 12%
1%
28%
18%
0% 5%
10% 15% 20% 25% 30%
Trainers covered in the survey

131
Figure 7.34: Educational qualification of Trainers selected for the study
7.11.3 Monthly Salary of Trainers Overall average salary received by the Trainer are summarized in Figure 7.35. 73% of the trainer received overall an average salary more than Rs. 15000, while more than 30% of the trainer received more than Rs. 20000. However, there are 4% of the trainers received less than Rs. 10000.
Figure 7.35: Overall average salary of the trainers selected for study State-wise, More than 80% of the trainer from states AP, ASSAM, Delhi, and Telangana, have received average salary of more than Rs. 15000. Similarly, more than 50% of the trainers from the states AP, Assam, Delhi, Gujrat, received average salary more than Rs. 20000. However, more than 10% of trainers from the states Assam and Punjab received average salary less than Rs. 10000, as shown in Table 7.17.
Table 7.17: State-wise average salary of the trainers selected for study
67%
31%
3%
Gaduate Post Graduate PhD
4%
23%
33% 29%
5%
0%
5%
10%
15%
20%
25%
30%
35%
Upto Rs.10000 Rs.10001 to 15000 Rs.15001 to 20000 Rs.20001 to 25000 More than Rs.25000
Average monthly salary of trainers

132
Salary (monthly)
Up to Rs.10000
Rs.10001 to 15000
Rs.15001 to 20000
Rs.20001 to 25000
More than
Rs.25000
Andhra Pradesh 0% 17% 33% 50% 0%
Assam 20% 0% 0% 20% 60% Delhi 0% 9% 27% 27% 36%
Gujarat 0% 0% 29% 36% 36% Haryana 0% 50% 50% 0% 0% Madhya Pradesh 0% 100% 0% 0% 0%
Punjab 10% 60% 10% 20% 0%
Rajasthan 7% 21% 29% 29% 14%
Telangana 0% 0% 100% 0% 0% Uttar
Pradesh 3% 24% 41% 32% 0%
West Bengal 5% 27% 41% 27% 0% Total
Trainers 4% 23% 33% 29% 5%
7.11.4 Give individual short term and long term projects to Trainers It was found out that trainees were given short and long projects during the training program. The Trainers who used project in the course are summarized in Figure 7.36. 94% of the trainer used project in the course against only 6% who did not use the projects.
Figure 7.36: Trainers who give individual short and long projects to the trainees
7.11.5 Challenges faced in providing training at the Institute: in terms of infrastructure/ facilities/ payments etc
94%
6%
Yes No

133
Figure 7.37: Challenges faced in giving training at the institute on different factors
7.11.6 For increasing entrepreneurship, do you think the element of entrepreneurship-related courses should be adopted
The Trainers were asked if an entrepreneurship course be included as part of the curriculum and to encourage self-employment. Around 61% of the trainers agree that an entrepreneurship course be included in the curriculum (See Figure 7.38)
Figure 7.38: Response of trainers regarding adopting entrepreneurship in the course
7.11.7. If Yes, how many hours of Training Course Check with beneficiary
26%
28%
30%
33%
29%
27%
27%
28%
26%
30%
33%
37%
17%
0% 5% 10% 15% 20% 25% 30% 35% 40%
Designing the Course material etc
Coordination/ cooperation with staff at the Institute
Timely payments
Building infrastructure is adequate-no of rooms etc
Furniture is adequate
Blackboard
Drinking Water
Toilets
Canteen
Lab/Training Equipment facilities at the institute
Machinery, Tools & Equipments for entire batch etc
Whether the required raw material for conductance …
Any other issue faced
Challenges faced in giving training at the Institute: in terms of infrastructure/ facilities/ payments etc
61%
39%
Yes No

134
Overall, 41% of the trainers suggested a course of 30-60 hours duration (see Figure 7.39). The suggestion given by trainers are similar to suggestion given by the selected PIAs (Section 7.3.3).
Figure 7.39: Hours of entrepreneurship course as suggested by trainers
7.11.8 Any other form of Training Provided at the Institute This section ensures whether some soft and IT course are taken in the training for helping trainee prepare for placements. The information’s are collected from the trainers and summarized in Figure 7.40. All most all trainers agree that the course like (i) Basic IT Training, (ii) Basic Etiquettes, (iii) English Speaking, and (iv) soft skill, were taught in the training program.
Figure 7.40: Any other form of training provided for placements
7.11.9 Challenges faced by you in terms of Quality of Trainees The overall insights across the states covered as part of the survey include
• The candidates were not aware of the job-roles • Challenge was also the lack of knowledge of Hindi language especially from North East • Challenges faced in the writing skills, vocabulary and learning levels of the trainees • Challenge was faced in teaching them English speaking and computers
1%
41%
26%
10%
22%
0% 5%
10% 15% 20% 25% 30% 35% 40% 45%
Upto 30 hours 31 to 60 hours 61 to 120 hours 121 to 240 hours More than 240 hours
97%
98%
100%
98%
95% 96% 97% 98% 99% 100% 101%
Soft Skill
English Speaking
Basic Etiquettes
Basic IT Training
Any other form of training provided for placement

135
• They needed continuous motivation • Trainers had to focus more on trainees’ basic etiquette and mannerisms as well as the
development of personality In Haryana, Andhra Pradesh and Delhi, most PIAs reported that no challenges were faced by them for quality of trainees and even no challenges were faced while training the trainees. In Manipur, PIAs reported that one of the challenges faced by the trainees was the lack of knowledge of and experience in the Hindi language. PIAs also stated that there was a lack of confidence in students when they joined, but that it gradually improved during the training period. They felt that the overall quality of the trainees was good since they were all selected through the selection process adopted. They also said that trainees were interested in training, but it was difficult to get used-to the tools and the course. Some PIAs reported that they had no challenges to the quality of trainees. In Gujarat and West Bengal, PIAs shared that some of the students who came to train were not mature enough, so it was difficult to maintain discipline throughout the training programme. In West Bengal, few PIAs reported that the initial selection of candidates was a challenge because candidates were not aware of the roles of the job. It took a month of demo-training to make them aware of and get interested in the role of the job and its future prospect. Students were also from different areas and locations, so it was difficult for them to manage them initially. Trainers had to focus more on trainees’ basic etiquette and mannerisms as well as the development of personality. Some PIAs reported that the trainees were good and eager to learn in the training as they came from a field and background where they needed this training to get a job to earn. In Madhya Pradesh, PIAs reported that majorly time management related issues and Communication problems in English-speaking were observed in the trainees. In Punjab and Uttar Pradesh, PIAs reported that sometimes coordination between the trainees was difficult due to lack of cooperation amongst the trainees themselves. Also the candidates were mostly drop-outs and from rural background, therefore, many of them were not clear about the basics of the course. These candidates were given special focus and extra classes to match with other candidates. PIAs also stated that most of the candidates had dropped out of school so that the challenge was to retain candidates for complete training and to teach them English speaking, etiquettes and computers, and that they needed continuous motivation. In Rajasthan, PIAs reported that they faced challenges in the writing skills, vocabulary and education/learning levels of the trainees. Due to poor knowledge, lack of qualifications, the PIAs had to focus more on the development of personality. 7.11.10 Have you attended Training of Trainers under NSDC

136
It is required the trainer should have attended the training of trainers under NSDC. It was found that 73% of the trainers had attended the training (See Figure 7.41).
Figure 7.41: Percentage of trainers attended the training of trainers under NSDC
7.11.11 Suggestions for Improvement of Seekho Aur Kamao Training Programme The overall insights across the states covered as part of the survey include • More number of non-minority candidates belonging to BPL, SC, ST, OBC should be allowed • A module on how to deal with employment in COVID should be introduced. • More courses should be introduced in the sectors which can create more job opportunities.
For this, it is suggested that there should be survey of the demand for jobs and accordingly skill training should be planned.
• The programme should lay more emphasis and give more time on practical sessions. On the job training and sessions from industry should be there so that the participants are ready for the industry.
• A module of 30-60 hours on Entrepreneurship skills should be added to give up boost to the skill learning for self employment
• Extra hours of training on soft skills required • Need more targets in rural areas • Course material should be available easily in local language. In Manipur, PIAs reported that they help in procuring bank loan for trainees for self-employment. PIAs reported that The Training has been very successful for the students of North East and has helped students to fulfill their dreams. In Delhi, PIAs suggested that more number of non-minority candidates belonging to BPL, SC, ST, OBC should be allowed. PIAs suggested that the trainers should be allowed to increase and decrease the batch size as per course. PIAs suggested that a module on how to deal with employment in COVID should be introduced. Some PIAs suggested that the practice hours and on job training should be increased. They also suggested that Government should arrange the placement for the talented student in Government Job also.
73%
27%
Yes No

137
In Gujarat, PIAs suggested that the government should help PIAs to give placements. More such programmes should be introduced by the Government of India. They opined that the Seekho aur Kamao Yojana is a good initiative from Government of India, through this many students are getting job and livelihood. This scheme should be promoted more and more. More courses must be introduced in the sectors which can create more job opportunities and for this an assessment of market demand should be there. Some PIAs suggested that the programme should lay more emphasis and give more time on practical sessions. In Haryana and Madhya Pradesh, the PIAs reported the scheme to be very useful for the minority youth who need employment. PIAs suggested that a module of 30-60 hours on Entrepreneurship should be added to give boost to the skill learning along with extra hours of training on soft skills. Additionally the PIAs said that the Ministry should start more schemes like this to cover more beneficiaries. In Punjab, the PIAs suggested that more craft work trade should be added in this course like embroidery (handcraft & machinery), knitting & crochet etc. The PIAs suggested that we need more targets in rural areas especially those where the financially weak can be helped to upgrade themselves and make their lives better. PIAs suggested that course material should be available easily in local language. Stipend should be on monthly basis instead of 3 months only because training duration is long so candidates have to arrange their own amount after 3 months for conveyance. Further PIAs suggested that for the improvement of the Seekho aur Kamao, Training of Trainers for the particular trade must be arranged by the MOMA. Separate batches may be arranged for female trainees as in remote areas parents demand. In Rajasthan, PIAs suggested that more training and practice hours should be given, since this is skill training and entirely experiential in nature. Increasing the training hours will help the trainee get more knowledge related to the trade. The exposure and confidence of the trainees gets built up with more industrial visits, internships and On-the-job training. The same feedback was received from many employers who had hired beneficiaries in the past. English spoken & personality Development should be added. Basic Arithmetic language and personality development must be added as mandatory curriculum in the existing Seekho aur Kamao skill training modules. In Telangana, the PIAs suggested that procedure should be developed to provide the loan to trainees for self-employment. In Uttar Pradesh, the PIAs suggested that more number of non-minority candidates belonging to BPL, SC, ST, OBC should be allowed to take part in this scheme. There is need to be more focussed on the EWS community. More trades such as craft work in knitting, dress making can be added. In West Bengal, the PIAs suggested more Grooming & pre placement activities to be conducted during the course. Practical orientation program needs to be introduced in more frequent manner.

138
Industry visit at least for 3 times in every course. Government can make efforts to arrange immediate job placement after the training. PIAs suggested support of the loan without any collateral so the trainees can start their own startup and generate the employment for others as well. PIAs also suggested more measures by the Government to bring awareness about the programme. 7.12 EMPLOYERS 7.12.1 Sample Coverage Distribution of employers selected for study is summarized in Figure 7.42
Figure 7.42: distribution of employers
7.12.2 No. of trainees have you taken on employment from Seekho aur Kamao scheme Employers selected for the study were asked to provide information related to number of trainee recruited through placement. The information collected is summarized in Figure 7.43. 52% of the employers recruited more than 5 trainees. More than 15% of the recruiter employed more than 20 trainees.
Figure 7.43: Number of trainee recruited by the employers
7% 4%
51%
5% 1% 1% 1% 4% 1% 6% 5% 13%
1% 0%
10% 20% 30% 40% 50% 60%
No. of Employers
48%
24%
13% 10%
6%
0%
10%
20%
30%
40%
50%
60%
Upto 5 6 to 10 11 to 20 21 to 30 More than 30
No. of trainees have you taken on emloyment from seekho aur kamao scheme

139
7.12.3 Feedback: Quality of Trainees The employers were asked to give their feedback on satisfaction on the quality of the trainees. Information received is summarized in Figure 7.44. 82% of the employer were satisfied with the quality of the trainees.
Figure 7.44: Feedback on quality of trainee by the employers
7.12.4 Feedback: Training Curriculum/Course design Feedback was also taken from the employers related to the training curriculum and course design. The feedback received is compiled in Figure 7.45. Based on the feedback received, 83% of the employers are satisfied with the training curriculum and course design.
Figure 7.45: Employers feedback on training curriculum/course design
7.13 Conclusion This chapter analyzed the information collected from the PIAs in terms of (i) measures taken for Analysis of awareness and mobilizations, (ii) initiative and steps taken for identification and
11% 7%
82%
Not satisfied Neutral Satisfied
6% 11%
83%
Not satisfied Neutral Satisfied

140
selection of beneficiaries, (iii) Analysis on the measures taken and final outcome related to the placements and tracking, (iv) issue and challenges faced by PIAs in implementing the training program on the ground (v) suggestions given for the improvement of the training program, which may help policymakers for improving the performance of the scheme, (vi) improvement or increase in assets and services provided by the PIAs. This chapter analyzed the information collected from the Trainer and employers related to (i) Quality of trainee (ii) course curriculum and course design, (III) Individual short and long project, (iv) course related to placements i.e. English, Soft skill, IT, etc, (v) Issue, challenges faced in the scheme, (vi) Suggestion given for scheme improvement. The next chapter will cover conclusion and recommendation of the study.

141
CHAPTER 8
SUMMARY AND RECOMMENDATIONS
8.1 Introduction “Seekho Aur Kamao” Scheme (“Learn and Earn” Scheme) is a nodal scheme of the Ministry of Minority Affairs to improve the socio-economic conditions of the minority communities through affirmative action and inclusive development so that every citizen has equal opportunity to participate actively in building a vibrant nation and to facilitate an equitable share for minority communities in education, employment, economic activities and to ensure their upliftment. The evaluation of “Seekho Aur Kamao” Scheme across nine states was conducted in August-September 2020. The central purpose of the evaluation study is to assess the contribution of the scheme to the enhancement of livelihoods of the targeted minority youth. The assessment of the scheme is based on the Beneficiary, PIAs data provided by MoMA for selected nine (9) States of Uttar Pradesh, Punjab, Delhi/Haryana (NCR), West Bengal, Rajasthan, Gujarat, Kerala, and Tripura. The evaluation study encompassed field trips; designing of questionnaires and data collection instruments; interactions with beneficiaries, validation, and analysis of overall functioning of the scheme. The survey was conducted impartially as MDI Gurgaon approached the beneficiaries independently and not through the PIA’s. The study also included extensive analysis of secondary data and stakeholder perception data. 8.2. Strategic Fit of the “Seekho Aur Kamao” Scheme vis-à-vis Objectives of This Study The key objectives of the “Seekho Aur Kamao” scheme and their linkage with the objectives of this study has been discussed in the following section: 8.2.1. Scheme performance analysis Stated objectives of the scheme and outcome analysis based on the impact and evaluation study of Seekho Aur Kamao Scheme from 2017-18 to 2019-20 are briefly summarized in the following section. (RO1) To understand the status of the scheme performance in the country on key intended outputs and outcomes6 To understand the status of the scheme performance in the country, data was collected from the beneficiaries of the nine Indian statesfrom year 2017-18 to 2019-20. Scheme performance on key
6 As per Document for Credit Framework, Skills and education and NSQF, (2014), Department of Higher Education, MHRD, http://mhrd.gov.in /sites/upload_files/mhrd/files/upload_document/ Book_Credit_Framework_111114.pdf

142
indicators are covered in section 6.3 of this report. Output- outcome on key performance indicators are summarized below.
• Skill Set Before and After attending the Training: More than 3/4th of the respondents reported improvement in skill set after undergoing training in the Seekho Aur Kamao Scheme. Thus the scheme has been beneficial in enhancing the skill set.
• Work Experience Before and After: majority of the respondents did not have any job experience (81%) before joining the scheme. But After receiving the training through the “Seekho aur Kamao” Scheme, respondents with no experience reduced to 24%. Therefore, it may be interpreted that the scheme has helped in getting jobs and has positively impacted the beneficiaries.
• Impact of Training on Type of Work: The respondents who were either studying (29%) or were doing nothing (54%) after the training program became skilled (50%) or certified professional workers (27%), as shown in Figure 6.15. Therefore, the nature of job is seen to change and there has been a positive impact of training on this parameter.
• Impact of Training on Salary: Most of the respondents (92%) were not earning anything, but after undergoing the training through the “Seekho aur Kamao” Scheme, almost 70% of the respondent started to get a salary. The Scheme is seen to have a positive impact on the salary of the beneficiaries.
• Satisfaction/ Effectiveness: Living Standard (does it fulfill the livelihood requirement of the Family): The respondents were asked to rate the scheme on the satisfaction scale based on the parameter of Living Standard of the family. 89% of the respondents reported satisfaction on the enhancements of the living standard of the family. Most of the states reported high satisfaction with the improvement in the family living standard while satisfaction was seen to be lower from the respondents from Punjab.
• Satisfaction/ Effectiveness: Job After Training: The respondents were asked to rate the scheme on the satisfaction scale based on the nature of the job. Majority (82%) of the respondents were satisfied with the improvement of the nature of the job after undergoing the training programme. While majority of the respondents from states reported satisfaction, with improvement in the job after training, 51% of the respondents from Punjab were dissatisfied with the nature of the job after training.
• Satisfaction/ Effectiveness: Increase in Income After Training: majority (80%) of the respondents were satisfied or neutral with the rise in income after the training programme. Respondents from Punjab reported dissatisfaction (55%). Some respondents from Delhi, Rajasthan, and Uttar Pradesh also reflected their dissatisfaction in terms of an increase in the income after training.
• Placement Assistance in getting Employment: The data was collected to know the employment status of the beneficiaries (respondents) after the completion of the training programme. Overall majority (77%) of the respondent were helped by the PIAs for getting the employments, either through placement or self-employment. Statewide, all the

143
beneficiaries (respondents) of Kerala and Manipur were either placed or helped through self-employment. Similarly, in West Bengal also up to 97% of the beneficiaries were having some means of earning. The status of employment with respect to Punjab (31%) was seen to be lower and may require more effort from the PIAs.
• Majority of the respondents (84%) were continuously getting the income even though most of the jobs were in the Private sector. West Bengal (65%) had more respondents who were not getting income on a continuous basis.
• One of the requirements from PIAs in the scheme is to place 50% of the beneficiaries in the organized sector. It was observed that 66% of the overall beneficiaries (respondents) got placements in the organized sector (where workers were given salary slips). Beneficiaries from Punjab (15%) and West Bengal (6%) did not satisfy the requirement of 50% in organized sectors.
• The scheme encourages the beneficiaries for self-employment. Up to 52% of the beneficiaries who choose self-employment generally engage in home-based work.
(RO2) Identification of problems/roadblocks in the implementation of the program by the PIAs and suggestions to address them.
For the identification of problems/roadblocks in the implementation of the program by the PIAs, data was collected from the PIAs of the nine Indian states from year 2017-18 to 2019-20. Problem/roadblocks faced by the PIAs and subsequent suggestion are covered in section 7.8 and 7.9 of this report. Roadblock/problems faced by the PIAs are summarized below.
• Areas of Concern: The PIAs (respondents) were asked regarding the areas of concern in the implementation of the Seekho Aur Kamao Scheme. The PIAs reported problems related to Interaction and fund flow from the government (23%), Post Placement Tracking (20%), Linking with the NSDC (19%), and (iv) Selection of Beneficiaries (9%).
• Other issues are related to beneficiaries dropping out from program or not taking placements. About 80% of the target PIAs indicated following reasons for the dropout of trainees from the Seekho Aur Kamao Programme (i) Family problem including health of family members (21%), (ii) Early marriage (21%), (iii) Poverty/low family income and need to support family (19%), and (iv) Migration/shifted to another place.The PIA’s (respondents) were asked the reason “of beneficiaries not taking up the placements”. The reasons included not getting a suitable company for placements (32%), need to look after the family (21%), and language problem in going to another place/relocating (18%). These three together are reasons given by 60% of the target PIAs.

144
(RO3) How do the PIAs see themselves in the role of agents of change, and are they able and willing to take on this role? What are their constraints? Is the situation conducive enough for the skill teachers to become agents of change?
To study the effort of PIAs for the success of the scheme, Information were collected from PIAs related to their effort towards motivating the beneficiaries and other involved stakeholders. Analysis reacted to these efforts are covered in section 7.4 and 7.5 of this report. Important such efforts taken and constraints faced by the PIAs are summarized below.
• Awareness Camps: The awareness camps by the government for Seekho aur Kamao are low and more camps may be set up. The use of Mobile SMS can also be improved to spread awareness of the scheme.
• Special efforts made by PIA for Selection of Women: State-wise, some of the insights are elaborated: Most of the state PIA’s reported that the community engagement team especially encourages women candidates to apply for the training programs. The team conducts the house visits, meets the parents/guardians and briefs them about the program and its outcomes in detail. In most cases, the parents are encouraged to visit the training institute and see the facilities being provided. This creates trust amongst the community. Besides, safety aspects for women are also ensured during the training program. Some of the PIAs target divorcee, school/college dropouts from lower-middle-class families looking for a job to support their families. PIAs in some states take the help of Aasha/ Aanganwadi workers.
• Special efforts made by PIA for Selection of Economically Poorer Sections of Majority Community: The overall insights across the states covered as part of the survey include
a. Preference is given to unemployed youth from the weaker minority community or from lower-middle-class families
b. Liaison with the local community leaders to identify the target group c. Conduction of a baseline survey for the residential locations of economically poorer families d. Contact marginalized social groups like girl child students & students from the BPL category
of majority community e. Contact Gram Pradhan and the Sarpanch to mobilize participants f. Contact workers & community development organizers g. Use of newspaper advertisements, distribution of leaflets and pamphlets in rural and urban
areas h. Awareness campaigns
• Engaging NGOs and Communities: Overall, only 46% of the PIAs (respondents) engage the NGOs and communities in administration for better evaluation and improvement of the scheme as well as the better spread of the scheme among the minority community. The role of NGOs and communities can be improved. State-wise, some of the insights are elaborated: PIAs reported that most of their training centers are located in rural or semi-urban areas. The team ensured the creation of a steady

145
network. A committee of community leaders and other prominent people from the community, such as teachers, doctors, social workers, etc. together with district/block government officials, meets and participates in such meetings on a quarterly basis. The PIAs engaged with community representatives like Gram Pradhan’s in spreading awareness of the scheme to the deserving candidates. PIAs reported that they engaged NGOs/CBOs and other community-based organizations for mobilization and awareness generation among the target community about the scheme. They engaged leaders from various minorities to mobilize candidates from religious places like Temples/Mosques/Churches etc. This also led their parents to support them in joining this training programme. The PIAs also have tie-ups and networking with few NGOs and community leaders working for poor minority youth. The PIAs engage with and invite the local community leaders, organizers, and NGOsto visit the training center and provide their feedback frequently. The NGO & Community helps the scheme by bringing awareness. Few PIAs have used them for helping in mobilization and awareness activities.
• Linkage with the NSDC and other External entities: 85% of the PIAs have linkage with the NSDC for skill training. Merely 19% of the PIAs have linkages with other PIAs; this could be enhanced to provide more options to the trainees related to skill selection. Similarly, the linkage with NMDFC for funding may also be improved. Some concerns were reported on the response-delays from SSC and at times from the Ministry. The SMART accreditation process itself is a little longer that involves scheme approval from the department before proceeding for Desktop assessment. Since the fund release depends on the SMART accreditation, it sometimes results into a cause for financial distress for the PIAs. The candidates however, in most of the cases were provided with SSC certificates. Few PIAs also reported that the assessment was not carried out timely and sometimes there is delay in declaring the results too. The challenges reported were around the long alignment process of the centers with Ministry of Minority Affairs. Second challenge reported was the difficulty of procuring code for Aadhaar Based Biometric Attendance from the department. Third concern reported by the PIAs is about the delay in uploading batches in Skill India Portal due to unavailability of the scheme details on Skill India Portal at the time of filling information. PIAs also expected to gain support from SSC in the execution of training and placement of the candidates, which they reported as missing now. Role of Government functionaries at village level, block level is also required for support mechanism in mobilizations of trainee and awareness of program. PIAs indicated that Manual uploading of Certificates, Coordination between NSDC, Sector Skill Councils & MOMA is a little tedious and time taking a process. Some PIAs desired the norms to be relaxed for far flung Areas. They also indicated that Training of Trainers (ToT) for each skill course is conducted quite late. The Inspection fee, Continuous Monitoring Fees and fees for the center accreditation are very high and the process is time consuming. New specifications with updation every year

146
brings new rules and norms into picture and causes confusion in center development, scheme alignment and job role selection. PIAs also suggested for a Special coordination officer needed to be designated for better coordination between all stake holders. They were of the view that a mechanism should be established for a quicker response of emails. The delay areas have been scheme approval, PFMS mapping & payment of 2nd & 3rd installments.
• Trainee Numbers: Overall, 99 % of the enrolled trainees finished the training thus suggesting a 1% dropout from the training. Similarly, out of those who are trained, overall, 97% got the skill certificates. 79% of the trainee got the placements after completing the training. The reason for the 3% deficit between actual trainee and skill certificate could be due to delay in assessments or the trainee not appearing for evaluation after training.
(RO4) How are community members being engaged in the implementation at ground level? Who are the key stakeholders? What are their roles? Do they function well? How is cooperation in the skill centers? What kind of improvements have they introduced?
Information was collected from the PIAs related to the engagement of NGO and community members. This is covered in section 7.4.4 and 7.4.5 of this report. Summary of the finding as mentioned belowThePIAs were asked if they are engaging NGOs and communities in administration of the scheme as well better spread of the scheme among the minority community. overall, only 46% of the PIAs (respondents) engage the NGOs and communities. The role of NGOs and communities can be improved.
(RO5)How does the dropped-out student see themselves? Are they willing and capable of going through the process? What have been the challenges? How have they overcome these challenges?
The beneficiaries were requested to furnish information on how beneficial and helpful they find this scheme specially after school dropout. Challenges and they faced and how they overcome those challenges. The analysis of the data is done in section 6.3 of this report. Finding is summarized below.
• Reasons for Joining Seekho Aur Kamao Scheme: Most of the respondents (27%) pointed to skill enhancement as the main reason for joining Seekho aur Kamao Scheme. However, other reasons like improvement in salary (24%), education (25%), and job/role change (24%) also emerged in the study for joining the Scheme.
• Reasons for Selecting the Job Role: Better salary (39%) was reported as the main reason followed by prior experience/ education as the other main reason for selecting a Job role (34%). Family background and convenience also emerged as the other reasons.

147
• Challenge in joining the Seekho Aur Kamao Scheme: Lack of awareness (40%) about the scheme is the critical challenge of the scheme, though 34% and 26% of respondents also pointed the location of training centers and selection process adopted by the PIA, respectively as other challenges.
• Approximately 63% of the beneficiaries (respondents) reported that the training has been helpful in getting them the employment. Majority of the beneficiaries (respondents) from Gujarat, Kerala, and Manipur felt that training is helpful for getting employment. In comparison, the percentage of respondents was lower from Delhi and Punjab.
• About 57% of the beneficiaries (respondents) agreed with the effectiveness of training for enhancing the business. When the data was observed state wise majority (more than 80%) of the beneficiaries (respondents) from Gujarat and Kerala felt that training has helped to enhance the business. The percentage was lower for respondents from Delhi, Manipur, Punjab and West Bengal.
(RO6) Is the capacity of the teachers involved in skills training sufficient?
A feed-back from the beneficiaries were recorded related to the Teacher and trainers. Analysis is covered in section 6.4 of this project. The feedback on teachers/ trainers revealed that most of the beneficiaries are satisfied with counseling facilities (86%), the number of teacher/trainer (99%), interactive sessions (96%), and capabilities of teachers/trainers (98%).
The overall insights across the states covered as part of the survey include • PIAs conduct a review meeting of all teaching, administration and field staff on a
fortnightly basis. • Staff meet and share the issues and revised plans for smooth conduction • The institute team are thoroughly aligned with the objectives and outcomes of the scheme
in advance • A thorough workflow and team responsibilities are prepared to facilitate the achievement
of project objectives within the timelines • Regular TOTs were conducted for the trainers • Not all trainers are good at speaking English or soft skills therefore, training on soft skills
should be mandatory for these trainers
(RO7) Are the training centers established in the Minority Concentrated Areas, if not? How far is the center from MCAs? Why?
The PIAs (respondents) were asked if the training center is located in minority concentrated area. Based on the information gather related to the location of the existing training centers, it is found that 87% of the Training centers are located in the minority concentrated area. Similarly, state-wise collected information also confirms that most of the training centers in the states like Delhi

148
(100%), Gujarat (100%), Haryana (100%), Punjab (88%), Uttar Pradesh (90%), West Bengal (80%) and Kerala (75%) are located in the minority concentrated area. Only Manipur (50%-50%) have an equal percentage of the training center in the minority and the non-minority regions. The beneficiaries (respondents) were asked to mention the distance of the job place from their native place. It was found that almost 71% of the respondents had their native place within 10 km.
(RO8) Are the training sessions being interactive? What are the best practices adopted? Assess the capacities of the staff with regard to communication skills. Assess the extent to which the staff understands the basic principles of an integrated scheme of skills.
Almost all beneficiaries (97%) are satisfied with the teaching methodology adopted by the trainers. 96% of the beneficiaries found the training sessions being interactive. Feedback was taken from the respondents (beneficiaries) on staff’s guiding capabilities, understanding of the scheme, and communication skills. Most of the beneficiaries found guiding capabilities (98%), scheme understanding (98%), and communication skills (98%) of the staff as excellent. Documentation of best practices: Almost 76% of the PIAs (respondents) document best practices and home-grown innovations in the form of case studies. More PIAs can be encouraged to document such activities in future. The documentation is lacking more in Punjab, Haryana and Delhi. PIAs reported conduction of events and the cases shared were examples of Kaushal vikas yatra, Rojgar Mantra job portal and Rojgar Mela. The success stories are prepared and put up on the notice board of the institute which can be seen by the students, parents and other visitors, thus sending a positive message amongst the community. Some other PIAs document case studies of candidates who, following completion of training, have achieved success in career progress. A one or two-page brief is prepared on the same page and circulated using social media among the ongoing class candidates. Other important documentation related aspects are pointed below.
• Bringing out a batch magazine containing all the information of candidates trainees • Paid transport allowance and one day salary to the invited alumni • Documented case studies of successful Alumni after completion of training. • PIAs call their placed candidate to the centers to share their experiences before and after
training with the current trainees • Sharing of case studies through power point presentation during in-house events
(RO9) Does the monitoring system function satisfactorily? Is there room for improvement? Are the indicators used sufficient and adequate to evaluate the impact of the program? What should be adapted?

149
The overall insights across the states covered related to the monitoring systems, as part of the survey include • PIAs reported an issue with there being no SPOC at the Ministry for the PIA to coordinate or
discuss their problems. • Separate Q-Team for monitoring of Project guidelines • MIS portal to manage the data and documents of trainees as per the NSDC & SSC SOP. • Separate folder maintained for candidates’ documents, trainers’ CV and all other related
information in both soft and hard copy.
Suggestion related to the monitoring covered as part of the survey include • Inspection from Ministry should happen before training, so that PIAs do not incur extra
cost of running the centre • Smart accreditation of training centre & bio metric attendance is self-sufficient for
monitoring • Seekho aur Kamao portal data loss should be retrievable from the server • Reporting process must be online and synchronized. • A SPOC (Single point of contact) should be assigned from Ministry so as to communicate
the monitoring system • Inspection should be conducted quarterly by authorities. • A Proper SOP with milestones should be prepared and followed. • A mobile application should be launched
(RO11) Is allotting projects to PIAs in multiple states desirable, if so, on what conditions? What are the lessons learned?
More than 70% of the PIAs operate the training programs in multiple states, while 30% operates in 5 or more states. The turnover and number of training centers (2017-18, 2018-19) of PIAs both show an increasing trend year on year. This shows that the Scheme has been doing well on the overall indicators.
(RO13) To analyze the input use efficiency of the scheme, i.e., planned IEC activities for stakeholders and beneficiaries, institutional mechanism, fund flow (adequacy & timeliness) & utilization through public expenditure tracking, policy guidelines, and human resources allocated for the implementation of the schemes at central, state, district, block, and village, mechanisms to identify and reward best practices within the scheme design as well as M&E systems.
Suggestions for Improvement of Seekho Aur Kamao Training Programme :The overall insights across the states covered as part of the survey include

150
• More number of non-minority candidates belonging to BPL, SC, ST, OBC should be allowed
• A module on how to deal with employment in COVID should be introduced. • More courses should be introduced in the sectors which can create more job
opportunities. For this, it is suggested that there should be survey of the demand for jobs and accordingly skill training should be planned.
• The programme should lay more emphasis and give more time on practical sessions. On the job training and sessions from industry should be there so that the participants are ready for the industry.
• A module of 30-60 hours on Entrepreneurship skills should be added to give up boost to the skill learning for self employment
• Extra hours of training on soft skills required • Need more targets in rural areas • Course material should be available easily in local language.
The overall insights across the states covered related to fund flow, as part of the survey include
• After initial releasing of funds, there is a long process involved before releasing of 2nd installment from Ministry of Minority Affairs
• Stipend is transferred to each beneficiary personal bank account • The stipend is issued late to beneficiaries approx. after 3-4 months, till the first stipend is
given. • The candidates either don’t have a bank account or their account is not active. • The management of finances remains a challenge as the subsequent installments of the
project are not released on time. • PFMS portal and mapping is main issue from the department side. PFMS help-center is too
slow in responding to the queries. The overall insights across the states related to system of rewards for beneficiaries / Trainers are covered as part of the survey include
• Beneficiaries were rewarded basis their scores and attendance • Sincere trainee/s got a prize for best trainee of the centre • Trainers were rewarded basis student feedback, good results in assessment and
placements. • Posting their name and photograph on the centre notice board • Trainers & beneficiaries were rewarded in front of the class • Appreciated Trainers were sent to Train the Trainers programmes • Student of the month, student of the batch, best placement of the batch, best faculty, and
faculty of best placed batch • Rewards were also given based on monthly progress report and assessment

151
(RO14) To identify the key bottlenecks/issues & challenges in the implementation mechanisms (governance mechanisms, awareness generation, stakeholder engagement & their roles & responsibilities, process & resource flow, capacities) of various development schemes.
• The overall insights across the states covered as part of key bottlenecks /issues include a. Delays were reported in the SMART accreditation process b. Delays from Sector Skill Council c. Delay in response from the Ministry d. The physical inspection takes a long time e. Support at village and block level required for mobilizations of trainee and awareness of
program f. PIAs requested norms to be relaxed for far-flung Areas g. Delays in conducting train the trainer programme for trainers in each skill course h. Delay in scheme approval, PFMS mapping reported i. Delays in payment of 2nd & 3rd installments reported j. Assessment was not carried out timely. Assessment of beneficiaries has also taken time
ranging from 2-5 months to 1 year at times. The word of mouth publicity goes negative in such cases, affecting the next admission cycle.
• Concern related to awareness generation: The overall insights across the states covered as part of the survey include
a. Language barrier posed challenge b. Orthodox families of female candidates do not allow to send them for training/job c. Locals not interested in going outside for training or job d. Involvement of local administration requested by PIAs e. Word of mouth publicity f. Scattered population and geographical challenges in reaching out to the most needy g. Many start supporting their family early by dropping out from the studies
• Concern related to managing infrastructure.The overall insights across the states covered as
part of the survey include a. Infrastructure and equipments are put into place as per NSDC and SSC Guidelines b. Dedicated centre managers at all training centres to manage infrastructure c. Minority concentrated areas densely populated with very small spaces available and
therefore, finding and managing infrastructure in minority concentrated area is difficult d. Finding big premises as per SMART accreditation requirement is difficult e. SSC has not defined any infrastructure guidelines for the respective job roles

152
• Concern related to managing infrastructure. The overall insights across the states covered as part of the survey include
a. The local placement tie-ups are done during the training period itself since every industry has a requirement of good candidates
b. The training centers have MoU with various companies c. Some PIAs have been working in skill development since last 12 years; they have good
relations with corporate, industries and placement consultancy firms. d. Issue in local tie-ups as local unorganized sector do not offer proper salary package to
the candidates e. Placement tie up also depends upon the demand of manpower and trades during the
training period f. Difficult to identify employers in the same sector in the local areas. g. Networking with corporates process includes the designing and printing of the
placement brochure, developing an electronic copy, interaction with potential recruiters, developing and maintaining student resume books
h. Some got Placement team at the National level and at the State level which takes care of all the placement requirements of the candidates
i. Candidates were reported to be preferring any local random jobs near their homes j. The candidates do not gain good employment at times, because of lack of Industry
exposure k. Employers reportedly preferred multi skilled candidates
• Concern related to post-placement tracking.The overall insights across the states covered as part of the survey include
a. Techniques adopted are direct calling by trainer/placement officer, calling through call centre, SMS and employer visits
b. Some PIA said that they have robust MIS systems and dedicated call centre facilities in place
c. Few trainees migrate and change their contact details thus going out of touch
(RO15) To assess the quality of assets created/services provided under the scheme and to see how far these assets/services benefitted the end beneficiaries.
The growth in PIAs due to the Scheme in terms of Asset created or increased. The Information collected from the target PIAs. Except the Hostel capacity and course module, more than 90% of the PIAs have created or increased the assets in term (i) Building infrastructure, (ii) class room facilities, (iii) lab facilities, (iv) IT infrastructure, (v) Number of trainee and trainings, (vi) Placements, etc
153
8.2.2. Besides, the study should bring out success factors in the processes adopted during the Implementations, such as:
(RO18) Identification and selection of skill development courses PIAs are given or select the SKILL based courses approved by NSDC. The PIA for selection of courses conduct a market survey of the district location of training centers. This study found that overall Most common skills in which training is imparted is Tailoring/embroidery (47%), followed by Plumbing (32%), Retails (28%), Office assistance (28%), electricians (26%), makeup/beauty Parlor (23%), Technicians (20%), etc (RO19)Placement tie-ups The different strategy and channels are opted by the PIAs for providing the placements to the beneficiaries. Different channel opted by most of the target PIAs are the ComFpany tie ups(98%), Tie ups with placement agency (83%), Campus Placements (75%), Job fairs (79%), and Job counseling (90%) (RO20) Placement and tracking Placement Assistance in getting Employment: The data was collected to know the employment status of the beneficiaries (respondents) after the completion of the training programme. Overall majority (77%) of the respondent were helped by the PIAs for getting the employments, either through placement or self-employment. Statewide, all the beneficiaries (respondents) of Kerala and Manipur were either placed or helped through self-employment. Similarly, in West Bengal also up to 97% of the beneficiaries were having some means of earning. The status of employment with respect to Punjab (31%) was seen to be lower and may require more effort from the PIAs.More placements (up to 71%) happen in modern sectors as compare to 29% in traditional sectors. The scheme requires that at least 50% of trainees must be placed in the organized sectors. Organized sectors are classified as organization which provides salary slips with other facilities. Overall 65% of target PIAs have placed their trainees in the organized sectors as compared to 35% in the unorganized sectors. This confirms the requirements of 50%. State-wise also a criterion of 50% was maintained at all the target PIAs. However, there are states like Punjab (52%), Kerala (56%) and Haryana (59%) which have lower percentage of placements in organized sector as compared to overall percentage. Salary: Almost 96% of the beneficiaries trained through target PIAs got an average salary of more than Rs 5000, while 33% trainees got more than Rs 10000 as average salary. Overall average salary obtained by the trainees was more than Rs 9500. Manipur (Rs. 17000) provided highest average salary as compared to all other states, followed by Delhi with more than Rs. 11, 000. Maximum salary overall received to the trainees was more than Rs 16, 000, while Minimum salary overall

154
was more than Rs. 7700. Here, also Manipur had highest maximum (Rs. 40000) and minimum (Rs. 12250) salary at the target PIAs training centers. Tracking: Various measures adopted by the PIAs to keep track of trainees post placement after the course include: Frequent call on mobile phone and sending SMS , visits from PIA to the candidates and inviting candidates on special occasions. However, emails as a method to update/ keep the beneficiaries aware needs to be utilized more. PIAs gave “frequent mobile number change” as the important reasons for losing the contact with the beneficiaries after the training. (RO21) Post-Placement Support One of the mandatory aspects of the scheme is to provide post-placement support to the beneficiaries for the next two months. 78% of the respondents agreed on receiving post-placement support from the PIA’s. More beneficiaries (respondents) from Haryana, Punjab and Rajasthan reported not receiving post placement support from the PIAs.
(RO22) Financial management and release of stipend to beneficiaries. The Stipend was transferred timely into your bank account: The “Seekho aur Kamao” scheme has a provision of providing a stipend to the beneficiaries. A stipend of two thousand per month for non-residential and one thousand per month for the residential training program are given to the beneficiaries The beneficiaries (respondents) were asked if the stipend is transferred into the bank account in a timely manner. Only 61% of the beneficiaries (respondents) reported to have received the stipend on time.The study also records the information related to the amount received by respondents as stipends. Overall, 80% of the beneficiaries (Respondents) consented on receiving the stipend in full. It was observed that, overall, 39% of the respondent did not receive their stipend on time. The study also tried to find the extent of delay in receiving the stipend. Figure 6.53 summarizes the period of delay in getting the stipend. 37% of the respondent who received a delayed stipend got the stipend in up to 60 days. More than 43% got a delay in stipend of more than 90 days, while 3 % denied getting any stipend.The beneficiaries were requested to give the reasons they perceived or provided by the PIAs related to the delay in disbursement of stipend. The most important reason observed is the delay by the government in releasing the fund. The other major reason was related to delay in assessment. 8.2.3. Other important finding of the study from Beneficiaries and PIAs perspectives are
• Beneficiaries were asked the reason for not continuing on the job they got after training. It was observed that Self-employment (43%) is a major reason followed by education (25%) for leaving the job.
• The feedback on different parameters related to course materials revealed that most of the beneficiaries found Audio/video materials (78%) and reading course materials (98%) useful. Similarly, most of the beneficiaries (respondents) were happy with the course materials

155
being available (98%), available in the local language (79%), and well structured (95%). However, attention must be given towards the more use of Audio/Video and providing course materials in the local language as still, 22% and 21% of beneficiaries respectively, are not satisfied on that parameter.
• The feedback received on infrastructure from the beneficiaries (respondents) showed that majority (more than 80%) of the beneficiaries (respondents) found all the facilities associated with building infrastructure as suitable. However, attention can be given towards the canteen facility and raw material for practical/lab as still, 15% and 11 % of beneficiaries (respondents), respectively are not happy with the facilities.
• Feedback related to facilities in the hostel and Mess for outstation beneficiaries revealed that most of the beneficiaries from Delhi (47%), Haryana (34%), Punjab(36%), and West Bengal (15%) have very limited or no hostel facilities. However, States like Gujarat (94%), Kerala (100%), and Manipur (81) are either residential based training centers or have sufficient hostel and mess facilities. Similarly, mess facilities at Haryana (28%), Punjab(35%), and West Bengal (15%) are limited or not available. Overall, this is one area which can be improved if residential programmes are to be conducted.
• A lot of beneficiaries (respondents) suggested that the course materials should be made available in the local language and it is suggested that this should be implemented by the PIAs.
• The Ministry may incentivize the PIA’s in Minority Concentrated Areas (MCA) since this will reduce the overall travel time for the beneficiaries.
• Course on Entrepreneurship: The PIAs were asked if a course on entrepreneurship should be introduced. It was found that 94% of the PIAs respondents felt that a course on entrepreneurship should be introduced. State-wise collected information also confirms on adopting the course on entrepreneurship except the PIAs from Delhi where 33% disagree in floating such a course. While 61% of the target PIAs suggested that a course of more than 60 hours be introduced on entrepreneurship, 39% of the target PIAs recommended up to 60 hours of the course. The Trainers were also asked if an entrepreneurship course be included as part of the curriculum and to encourage self-employment. Around 61% of the trainers agree that an entrepreneurship course be included in the curriculum.
• Training of Trainer course: It is required the trainer should have attended the training of trainers under NSDC. It was found that 73% of the trainers had attended the training.
8.3. Suggestions and Recommendations Apart from the discussion on the research objectives above as per the Terms of Reference, major suggestions for beneficiaries, stakeholders and a few overall recommendations are as below:
• Seekho aur Kamao is the only scheme giving stipend for skilling and this is a big motivator for participants to come for skilling. The awareness camps by government for Seekho aur

156
Kamao are low and more camps may be set up. The use of Mobile SMS can also be improved to spread awareness of the scheme.
• External linkages with the NSDC for skill training, with other PIAs to provide more options to the trainees related to skill selection and with NMDFC for funding may be improved.
• A course on entrepreneurship may be considered going forward. The course duration may be between 30-60 hours.
• At least one-fourth of the PIA’s (respondents) reported problems related to Interaction and fund flow from the government. It is recommended that a PMU be set up at MoMA to take care of interaction with the stakeholders. There should be proper timeliness for assessments and other deliverables. PIA gave good example as Nayi Manzil scheme for such action. The PMU should be professionally managed with professionals from institutes like TISS with relevant experience.
• Most of the PIA’s also reported tracking of information related to beneficiaries as a problem. It is suggested that a proper database of beneficiaries enrolled in the Scheme, linked to Aadhar number, and a proper MIS which can support analytics be worked upon. This would again be possible once the PMU is set up.
• There should be better integration between MoMA, NSDC and SSC to avoid any delay related to accreditation and assessment, possibly through making the interdepartmental workflow online.
• The criteria and guidelines for Direct Benefit Transfer (DBT) need to be clearly defined based on parameters such as enrollment, attendance, assessment and post placement status.
• PIAs may be provided access for Seekho aur kamao portal so that they can verify beneficiaries’ details and past scholarship availed by them. Where ever required PIAs may be given right to access to enter data in MoMA database.
• The Ministry should incentivize the PIA’s in Minority Concentrated Areas (MCA) since this will reduce the overall travel time for the beneficiaries.
• Awareness camps by NMDFC at PIAs location of Seekho Aur Kamao can be organized. • Online module of training may be developed or obtained from other departments /
Ministries where it exists (NSIC, M/o MSME etc). • The Training of Trainer courses figures are currently low and need to be improved. MoMA
may consider imparting and increasing role in Training of Trainers. • The job role requirements in a state should be worked out from employment perspective
(demand led). If required, a survey to grasp the local context and market demand may be conducted to decide on job roles or data may be taken from agencies such as NSIC. In addition to existing courses, some local skill based courses may be promoted e.g. Kashmir related to shawl making, Jaipur related carpet weaving, etc. New skills like solar may be considered.

157
8.4 Conclusion The study has evaluated the performance of the nine Indian states by systematic study of 1044, beneficiaries, 52 PIAs, 120 trainers and 80 employers as per the sample suggested by MoMA, GoI, New Delhi. All the objectives as per ToR have been studied in detail and the findings have been discussed in this chapter. The recommendations for the improvement of the scheme across the Indian states have also been shared. It is felt that the scheme has immense potential to benefit the all categories of the minorities’ population if administered properly. It is expected that the findings shared in the study shall help to improve the performance of the scheme across the Indian states.

158
BIBLIOGRAPHY
1. Agarwal, T. (2013). Vocational Education and Training programs : An Asian Perspective, Asia-Pacific Journal of Cooperative Education, 14(1), 15-26, ttps://www.ijwil.org/files/APJCE_14_1 _15_26.pdf
2. Asian Development Bank. Results Framework. http://www.adb.org/ Documents/Policies/ADB-Results-Framework/r166-08.pdf
3. AusAid (Australian Agency for International Development). 2005. Using the Results Framework Approach. AusGuideline. Accessed at http://www.ausaid.gov. au/ausguide/pdf/ausguideline2.2.pdf
4. Berlia, S., 2007. Technical Vocational Education & Training (Existing Systems, Schemes, Models and Best Practices). Accessed at : www.aserf.org.in/articles/Paper_TVET.doc
5. Chenoy, D., 2013. Skill Development in India : A transformation in the making, Private Sector in Education pp 199-207,
6. Directorate General of Employment and Training (DGE&T), 2020. Modular Employable Skills Training. Accessed at http://techedu.hp.gov.in
7. Dobbs, R. Madgavkar, A. Barton, D. Labaye, E. Manyika, J. Roxurgh, C. Lund, S. Madhav, S. (2012). The world at work: Jobs, pay and skills for 3.5 billion people, McKinsey Global Institute, https://www.mckinsey.com/~/media/McKinsey/Featured%20Insights/ Employment%20 and%20Growth/The%20world%20at%20work/MGI%20Global_labor_Full_Report_June_2012.ashx
8. Document for Credit Framework, Skills and education and NSQF, (2014), Department of Higher Education, MHRD, http://mhrd.gov.in /sites/upload_files/mhrd/files/upload_document/ Book_Credit_Framework_111114.pdf
9. Ernest and Young LLP. 2016. Skill Development in Andhra Pradesh: Vision 2029. Skill Development Sector Paper – AP Vision 2029 Project. Kolkata: E&Y LLP.
10. FICCI report on Skill Development in India, 2015. 11. FICCI-KPMG report, Re-engineering the skill ecosystem, Available:
http://ficci.in/spdocument/20762/Re-engineering-the-skillecosystem.pdf. 12. IAMR, Planning Commission, Govt. of India. 2010, The Challenges Facing Skill Development in India:
An Issue Paper. 13. ICRA Management Consulting Services Limited August. 2010, The Skill Development Landscape in
India and Implementing Quality Skills Training. 14. Independent Evaluation Group Monitoring and Evaluation Capacity Development.
http://www.worldbank.org/ieg/ecd/ 15. Indian Council for Research on International Economic Relations. Forthcoming. Skill and
Entrepreneurship Development Initiatives in the North East. Draft Report Submitted to NITI Aayog. New Delhi: ICRIER.
16. International Labour Organization (ILO), 2000. Training for employment: Social inclusion, productivity and youth Employment.
17. International Labour Organization (2012): Global Employment Trends - Preventing a Deeper Jobs Crisis, Geneva: ILO.
18. International Labour Organization (ILO), 2016. Rural Development through skill development. Skills for Rural Development Policy briefs.

159
19. Khuntia, P.A., 2017. Skill Development of Youth in North East India: Way Forward. NLI Research Studies Series No.124/2017. Noida: V.V. Giri National Labour Institute.
20. Laura Brewer (2013): Enhancing Youth Employability: What? Why? and How?: Guide to Core Work Skills, Skills and Employability Department, International Labour Organization, Geneva.
21. MDI Gurgaon, 2020. Various rounds of Focussed group Discussions with Seekho aur Kamao scheme PIAs, Beneficiaries, Trainers and Employers from all across the country.
22. Ministry of Development of North Eastern Region. 2008. North Eastern Region Vision 2020, New Delhi: India.
23. Ministry of Home Affairs, 2011. Census of India: 2011. Delhi: India. 24. Ministry of Human Resource Development (1998): “National Policy on Education 1986 (as
modified in 1992)”, Government of India, New Delhi. 25. Ministry of Minority Affairs, Government of India. 2020. Seekho aur Kamao program Guidelines.
New Delhi, India. 26. Ministry of Skill Development and Entrepreneurship, 2015. National Policy for Skill Development
and Entrepreneurship 2015. New Delhi: India. Accessed at http://www.skilldevelopment.gov.in/assets/images/Skill%20India/policy%20booklet-%20Final.pdf
27. Ministry of Statistics and Programme Implementation, Government of India. 2014. Employment and Unemployment Situation in India. NSS Report No. 554. Accessed at: http://mail.mospi.gov.in/index.php/catalog/143/related_materials
28. National Policy for Skill Development and Entrepreneurship (MSDE), (2015). Accessed at https://www.msde.gov.in/National–Policy -2015.html
29. National Sample Survey Office (2015): “Status of Education and Vocational Training in India, NSS 68th Round (2011-12)”, Ministry of Statistics & Programme Implementation, Government of India, New Delhi.
30. National Skill Development Corporation. Human Resource and Skill Requirements in the IT and ITES Industry Sector (2022) – A Report. New Delhi: India.
31. National Skill Development Corporation, 2012-13. Skill gap report. https://www.nsdcindia.org/nsdcreports. Retrieved on 01.10.2020.
32. National Skill Development Policy, 2009. Accessed at http://www.msde.gov.in/sites/ default/files/2019-09/National-Skill -Development-Policy-March-09.pdf
33. Neetha, N., 2003. Migration, Social Networking, and Employment: A Study of Domestic Workers in Delhi. NLI Research Study Series no. 37. Noida: VV Giri National Labour Institute.
34. NITI Aayog (n.d.) Skilling for Employability: Best Practices. New Delhi: India. 35. Okada, A., 2012. Skills Development for Youth in India: Challenges and Opportunities. Journal of
International Cooperation in Education 15(2), pp.69-193. 36. Output Outcome Framework, 2019. For major central sector and Centrally Sponsored Schemes.
Available at: http://mohua.gov.in/upload/uploadfiles/files/output% 20outcome%20frame%20work%202019-2020.pdf. Accessed on 07-07-2020.
37. Primer on Employer led models of job creation : Perspectives and case studies (2016), FICCI, http://ficci.in/spdocument /22952 /Employer-Led-Models-of-Job-Creation_Final_.pdf

160
38. Overcoming India’s skill challenge: Transforming India into a High Performance Nation, (2013). Accenture & NSDC, https://www.accenture.com/.../Accenture/.../Accenture-Skills –Challenge-Transforming...
39. Planning Commission, Government of India, 2012.Creating a Vibrant Entrepreneurial Ecosystem in India. New Delhi.
40. Sanghi, S. and Srija, A., 2015. Skill Development and Productivity of the Workforce. Economy Matters. Confederation of Indian Industry November-December 2015, pp. 36- 51.
41. Skilling India, No time to Lose, 2018. National Council of Applied Economic Research (NCAER), Accessed at : www.ncaer.org
42. The India Skills Report, 2014. CII Report on Skill Development 43. United Nations, 2015a. The World Population Prospects: The 2015 Revisions. New York: Population
Division. 44. United Nations. 2015b. Transforming our World: the 2030 Agenda for Sustainable Development.
Report No. A/RES/70/1, New York: United Nations General Assembly. 45. World Economic Outlook Database, October 2015. Report for Selected Countries and Subjects.
International Monetary Fund (IMF).

161
Annexure-I
Name of the PIAs where the beneficiaries (respondents) have attended the Course: Overall
11% 1% 0%
1% 3%
0% 9%
4% 4%
2% 17%
3% 6%
1% 2%
5% 0% 1%
4% 3%
3% 2%
9% 3%
5% 1%
0% 2% 4% 6% 8% 10% 12% 14% 16% 18%
Academy for Computer Training Pvt. Ltd BASIX Academy for Building Lifelong Employability …
Bharat Mata Welfare Britti Prosikshan Pvt. Ltd.
Bi Able Comptech Institute of Society
CPIT Edutech Pvt. Ltd. Datapro Computers Pvt Ltd
Future Shape ICA Edu Skills Pvt Ltd
IL&FS Skills Development Corporation Ltd. Indian Institute of Skill Development
Infovalley Educational & Research (P) Ltd (Jettwings) Mahila Mandal Barmer Agor (MMBA)
Madeeha Educational Welfare Society Nirmal Foundation
Om Vijay Charitable Trust People Human Society
S E Biz Infotech Pvt. Ltd. Shree Gujarat Education
Shri Govind Singh Vidya Mandhir Skill Development Society
Srijan Sansthan Surbhi India
JITM The Institute of Civil Engineers Society
Name of the PIAs where the beneficiaries (respondents) have attended the Course: Overall

162
Annexure-II
Name of PIA’s Covered State name Name of PIA
Delhi
Divyam Education Trust
JITM Skills Pvt Ltd
Surabhi India Technology Pvt Ltd
St. Jones Education Society
Sachdeva college Ltd
Gujarat
Shree Gujarat Education Trust
Academy for Computer Training (Guj.) Pvt. Ltd.
All India Society for Electronics and Computer Technology (AISECT)
Nirmal Foundation
The People’s Humane Society
Haryana
Bharat Mata Welfare Foundation
CPIT Edutech Pvt Ltd
G&G Skills Developers Pvt Ltd
ICA EduSkills Pvt Ltd
Indian Institute of Skill Development Pvt Ltd
S E Biz Infotech Pvt Ltd
Kerala
Ascensive Educare Pvt Ltd
Britti Prosikshan Pvt Ltd
Edujobs Academy Pvt Ltd
Learnet Skills Limited (Formerly IL&FS Skills Development Corporation Ltd)
Manipur
Datapro Computers Pvt Ltd
Infovalley Educational & Research (P) Ltd
Punjab
Bharat Mata Welfare Foundation
Ch Ramesh Chand Charitable Trust
CPIT Edutech Pvt Ltd
Doric Multimedia Pvt Ltd
ICA EduSkills Pvt Ltd
The Institution of Civil Engineers Society
Divyam Education Trust

163
Om Vijay Charitable Trust
Rajasthan
Basix Academy For Building Lifelong Employability Limited (B-Able)
Comtech Institute of Technology Under Comtech IT Educational Trust
CPIT Edutech Pvt Ltd
Indian Institute of Skill Development Pvt Ltd
Mahila Mandal Barmer Agor
Srijan Sansthan
Uttar Pradesh
Aroma Broadbase
Basix Academy For Building Lifelong Employability Limited (B-Able)
Centre Of Technology And Entrepreneurship Development
Divyam Education Trust
Doric Multimedia Pvt Ltd
ICA EduSkills Pvt Ltd
PMT Physics College
Skill Development Society
Yug Shakti Shaikshanik Evam Samajik Vikas Sanstha
Madeeha Educational Welfare Society
West Bengal
All India Society for Electronics and Computer Technology (AISECT)
Ascensive Educare Pvt Ltd
Britti Prosikshan Pvt Ltd
Edujobs Academy Pv Ltd
Learnet Skills Limited (Formerly IL&FS Skills Development Corporation Ltd)


Annexure-IV
Evaluation Study of Seekho Aur Kamao Scheme Ministry of Minority Affairs, Govt. of India has awarded above mentioned project to MDI Gurgaon. The study requires feedback from beneficiaries with a view to assess and improve working of the Seekho Aur Kamao scheme. You are requested to answer the following questions to the best of your knowledge. (The information will be kept confidential and will be used as input to the evaluation study)
SECTION-I: DEMOGRAPHICS/ BENEFICIARY PROFILE
1. Name
2. Trade ID Type and Number
3. PAN Number or Aadhar number
4. Training Job Role 5. Trade Name
6. Reason for selecting the above job role? (Tick all applicable) a. Better Salary b. Prior experience/ education c. family background d. Convenience e. Any other (Pl specify..)
7. Date of Application (DD/MM/YYYY)
8. Date of Admission
(DD/MM/YYYY)
9. Date of Assessment 10. Duration of course
11. Certificate Received Yes=1; No=2 12. Type of
certification Certificate=1; Diploma=2
13. Gender Male Female Others 14. Age (in years)
15. Marital Status Married unmarried Others 16. Are you physically disabled?
YES=1; NO=2
17. Educational Qualifications
5th Pass 8th pass 10th pass 12th pass Graduate and above
18. Caste OBC SC ST General Others
19. Minority Category Muslim
1
Christian
2
Buddhist
3
Sikh
4
Jain
5
Parsis
6
Hindu
7
20. CONTACT DETAILS OF THE BENEFICIARY:
a. Location Rural=1 Urban=2 b. Phone (Mobile)
c. Email
d. Village/City/Taluka e. District f. State
21. CONTACT DETAILS OF PIA a. Name of PIA where training course attended

168
b. State: c. District:
d. Is the District a Minority Concentrated District (MCD)? Yes/ No?
22. A. Have you attended any other similar skill Training course by Central / State Government earlier? Yes=1; No=2 21. B. If Yes, Pl specify…)
22. Do you have BPL card? Yes=1; No=2 23. A. Do you hold any other card like MGNREGA job card, Antodaya Card, etc? Yes=1; No=2 24. B. If Yes, Pl specify…)
SECTION-II: AWARENESS
1. What has been the source of information for the “Seekho Aur Kamao” Programme? TICK ALL APPLICABLE
S. No SOURCE OF INFORMATION YES NO a Newspaper 1 2 b Pamphlet /Poster / Banner 1 2 c Folk / Traditional Media 1 2 d Religious leader and Panchayat 1 2 e Auto-rickshaw announcement 1 2 f TV/radio 1 2 g Internet 1 2 h Awareness Camp by Government Agencies 1 2 j Mobile SMS 1 2 k Word of Mouth 1 2 l Any of Other (Pl specify…)
SECTION-III: SCHEME PERFORMANCE ANALYSIS (RELEVANCE/ EFFECTIVENESS)
1. Did you drop out of school? YES=1; NO=2 2. At which level did you drop out from school
5th or before 6th 7th 8th 9th 10th 11th 12th
3. Reason for drop out from school? TICK ALL APPLICABLE
REASONS YES NO a Poverty/ Low family earning and need to support by
working immediately/ Forced to work 1 2
b Family problems (including health of family members etc) 1 2 c Self Health Problems 1 2 d School in far distance 1 2 e Non availability of girls toilet 1 2 f Migration/ shifted to another place 1 2 g Take care of brother or sister (sibling) 1 2 h Early marriage 1 2 j Any Other (Pl Specify…)

169
5. Why did you join Seekho Aur Kamao Programme? TICK ALL APPLICABLE
REASONS YES NO a Job/ role change 1 2 b Enhancement of Skill 1 2 c Improvement in Salary 1 2 d Improvement in Education 1 2 e Any Other (Pl Specify…)
6. What was your challenge in joining the Seekho Aur Kamao Scheme? TICK ALL APPLICABLE REASONS YES NO
a Lack of Awareness 1 2 b Selection process for adopting for training by PIA was difficult 1 2 c Location 1 2 d Any Other (Pl Specify…)
Please answer the Questions below (7-16) ONLY IF YOU HAVE FINISHED Training ELSE MOVE DIRECTLY TO SECTION IV
7. Please provide the following information: S.No PARAMETERS BEFORE JOINING the Scheme AFTER TRAINING the Scheme a Skill set b Work Experience (in Months) c Type of Work d Salary
8. Satisfaction/ Effectiveness: What has been your satisfaction level on the following parameters after
the training (on a scale of 5: where ‘1’ is Not at all Satisfied and ‘5’ is most satisfied)
Not at all Satisfied……………Most Satisfied a Quality of Training Programme 1 2 3 4 5 b Living Standard (does it fulfil the
livelihood requirement of the family) 1 2 3 4 5
c Job after Training 1 2 3 4 5 d Increase in income after training 1 2 3 4 5
9. Placement: Have you got the employment after placement assistance from PIA (1. YES, 2. NO) 10. If yes above, indicate employed in (1. Private, 2. Govt) 11. Is the income continuous or occasional (1. Continuous 2. Occasional) 12. Employed in
Organized (with salary slip) Unorganized (without salary slip) 1 2
13. If in organized Sector, please provide the following
a). Are you still continuing with the job in organized sector? (1. YES; 2. NO) b). If No above, why did you leave the job?____________________ c). How far is the Job location from your native place_______km

170
d). Would you accept a job at a place far away from your native place? (1. YES, 2. NO) e). Were you provided with PPS (post Placement Support) by the PIA? (1. YES, 2. NO) f). Employer details (Name and Phone number of Contact person: ______________________________________________________
14. A. If self employed, indicate the sector Agriculture Labor Home based work Any Other (Pl Specify…)
1 2 3 4
14 b). If self employed, please answer the following
PLEASE ANSWER YES NO a Have trade license 1 2 b Have Udyog Aadhar Registration 1 2 c Have MSME registration 1 2 d Got Mudra loan 1 2 e Registered or linked with any SHGs 1 2 f Got loan from other source 1 2 j Any Other (Pl Specify…)
15. Has the training been helpful in getting you the employment (1. YES, 2. NO) 16. Has the training been helpful in enhancing your business (1. YES, 2. NO) 17. Do you feel that there is a requirement for skill training again? (1. YES, 2. NO)
SECTION-IV: FFEDBACK SECTION
1. FEEDBACK ON TEACHERS/ TRAINERS Yes No
a Is the capability of the teachers involved in skills training sufficient? 1 2
b Are the training sessions being interactive? (involving, enjoyable etc) 1 2
c Are the number of teachers/ trainer adequate? 1 2
d Is counseling facility (for Job/ Self Employment) available in the institute, for getting job or self-employment?
1 2
4. FEEDBACK ON INFRASTRUCTURE Yes No
a Building infrastructure is adequate-no of rooms etc 1 2 b The rooms had adequate lights 1 2 c Furniture is adequate 1 2 d Blackboard 1 2
2. FEEDBACK ABOUT COURSE MATERIAL Yes No a Course Material was available? 1 2 b Course Material used for training was well structured? 1 2 c Course Material was available in Local Language? 1 2 d Course material for reading was useful 1 2 e Audio/Video presentation material was useful 1 2
3. FEEDBACK ON STAFF Yes No
a The communication skills-way of speaking/ understanding is good 1 2
b The staff is able to understand the scheme 1 2
c The staff is capable of guiding 1 2

171
e Drinking Water 1 2 f Separate toilets for girls and boys 1 2 g Canteen 1 2
h Power-backup available 1 2
Lab/Training Equipment facilities at the institute (e.g.: Machinery, Tools & Equipments for entire batch etc )
1 2
Whether the required raw material for conductance of practicals/laboratory work is available 1 2 5. FEEDBACK ON BOARDING / LODGING Yes No
a Facilities in Girls/ Boys hostel for outstation beneficiaries are enough 1 2 b Mess Facilities for outstation beneficiaries are fine 1 2
6. Suggestions for Improvement in a). Course Material________________________________________________________________________ b). Teachers/ Trainers________________________________________________________________________ c). Staff Performance________________________________________________________________________ d). Infrastructure___________________________________________________________________________
e). Boarding/ Lodging________________________________________________________________________
7. RATE THE FOLLOWING Extremely Poor Poor Fair Good Excellent a Teaching methodology/presentation method adopted by trainers 1 2 3 4 5 b Ability of Trainers for imparting training 1 2 3 4 5 c knowledge of the trainers for imparting training 1 2 3 4 5 d Quality/effectiveness/usefulness of counselling 1 2 3 4 5
SECTION-V: STIPEND SECTION
1. The stipend was transferred timely into your bank account? (YES=1; NO=2) 2. Did you receive the complete stipend or was it less than the promised amount? (YES=1; NO=2) 3. Number of days to receive the stipend_______________days 4. Where do you receive your stipend? Pl specify. (CASH=1; CHEQUE=2; BANK ACCOUNT=3) 5. If stipend disbursement delays, what are the reasons thereof
__________________________________________________________________________________
Thank you for your valuable time. It will help in achieving the objectives of the project.

172
Annexure-V
Evaluation Study of Seekho Aur Kamao Scheme Ministry of Minority Affairs, Govt. of India has awarded above mentioned project to MDI Gurgaon. The study requires feedback from PIA’s with a view to assess and improve working of the Seekho Aur Kamao scheme. You are requested to answer the following questions to the best of your knowledge. (The information will be kept confidential and will be used as input to the evaluation study). PLEASE TAKE ATLEAST TWO PICTURES OF PIA FACILITY FOR RECORD PLEASE TAKE A LIST OF ATLEAST 5 EMPLOYERS WITH CONTACT DETAILS AND PHONE NUMBERS
SECTION-I: DEMOGRAPHICS
1. Name of the PIA
2. District where centre is located 3. State where Centre is located 4. Address (Registered office)
with Pin Code
5. Contact Person with designation
6. Telephone No. 7. E-mail ID
8. Type of PIA (√)
(a) Society under Societies Registration Act
(b) Private Institution with 3 yrs experience
(c) Association ASSOCHAM, CII, FICCI etc
(d) Institution of Central/State Govt. including PSUs
(e) Civil Society/NGOs
9. Date of establishment
10. Registration No. & Details 11. Years of experience in training
& placement
12. Number of Trainings Conducted 13. Number of batches conducted in a
year
14. List the Training Programmes conducted at your Institute
15. Are you having bio-metrics attendance? YES=1; NO=2 16. If No, should there be biometric attendance? YES=1; NO=2
SECTION-II: AWARENESS/ MOBILIZATION/ SELECTION
1. How did you spread awareness for the Training Programmes S.No SOURCE OF INFORMATION YES NO a Newspaper 1 2 b Pamphlet /Poster / Banner 1 2 c Folk / Traditional Media 1 2 d Religious leader and Panchayat 1 2 e Auto-rickshaw announcement 1 2 f TV/radio 1 2 g Internet 1 2 h Awareness Camp by Government Agencies 1 2

173
j Mobile SMS 1 2 k Word of Mouth 1 2 l Any of Other (Pl specify…)
2. What special efforts are made by the PIA for the selection of
a). Women______________________________________ b) Economically poorer sections of majority community___________________
3. What are different selection method opted for the selection of trainees? Selection method opted for the selection of trainees YES NO a Written exam 1 2 b Viva-voce 1 2 c Documentation/Certificate based 1 2 d Any other (Pl specify….)
4. Please answer the following PLEASE ANSWER THE FOLLOWING FOR TRAINEES YES NO a Do you provide online/offline counselling to the trainee before admission? 1 2 b Do you use IT systems to manage records of candidates and for documentation? 1 2 c Do you maintain a database of the trainees who have been trained by your
organization in the past? 1 2
PLEASE ANSWER THE FOLLOWING FOR TRAINERS/ TEACHERS d Is there a mechanism / eligibility criteria for selection of Trainer’s/ Teachers? 1 2 e If yes above, is the eligibility criteria is in line with the NSQF (National Skills
Qualification Framework) 1 2
5. a. Have you engaged NGO’s and Community in administration of the Scheme? (YES=1; NO=2) 5. b. What has been the role of NGO’s and Community in administration of the Scheme and how are they
engaged? _______________________________________________________________________________
6. Is the Training Centre in Minority concentrated Area? (YES=1; NO=2) 7. How far is the Training Centre from the minority concentrated areas_______________Km 8. Please give your suggestion on project allotment should be made at what level for
better scheme administration Project Allotment should be made at YES NO a State level 1 2 b Minority Concentrated Area 1 2 c Group of Minority Concentrated Area (MCA) 1 2

174
SECTION-III: IDENTIFICATION, SELECTION AND LINKAGE OF SKILL DEVELOPMENT COURSES
1. External Linkages provided by the PIA YES NO a NMDFC for funding 1 2 b Banks 1 2 c National Skill Development Corporation for Skill Training 1 2 d With other PIAs 1 2 e Any Other (Pl Specify…)
2. Issues and challenges, if any, faced by the PIAs in synchronizing their activities with Skill India Mission and coordinating with Sector Skill Councils. ____________________________________________________________________________________ 3.a. For increasing entrepreneurship, do you think element of entrepreneurship related courses should be adopted? (YES=1; NO=2) 3. b. if yes above, please tell how many hours of course? _____________________ 4. What are the most common skills opted by beneficiaries-List top three?
Top three skills Number of Beneficiaries Enrolled Number of beneficiaries placed a b c
SECTION-IV: PLACEMENTS AND TRACKING
1 Please answer the following a Number of allotted seats b Number of trainee enrolled overall c Number of trainee dropped out d Number of trainees who received skill certification e Number of trainee got the placements f. Average placement salary g. Maximum salary obtained through placements h. Minimum salary obtained through placements
2. Approximately specify what percentage got placed in traditional and modern sectors
a. Traditional Sector _______________________________ b. Modern Sector _________________________________
3. Approximately specify what percentage got placed in Organized and Unorganized Sector c. Organized Sector (with salary slip) _______________________________ d. Unorganized Sector _____________________________

175
4. List the reasons for drop-out of trainees from the Seekho Aur Kamao programme? REASONS YES NO
a Poverty/ Low family earning and need to support by working immediately/ Forced to work
1 2
b Family problems (including health of family members etc) 1 2 c Self Health Problems 1 2 d Training Centre is in far distance 1 2 e Non availability of girls toilet 1 2 f Migration/ shifted to another place 1 2 g Take care of brother or sister (sibling) 1 2 h Early marriage 1 2 j Any Other (Pl Specify…)
5. List the reasons for not getting placement under the Seekho Aur Kamao programme? Reason for not getting placed YES NO a Not interested to leave their home town and relocate 1 2 b Need to look after family 1 2 c Language problem in going to another place/ relocating 1 2 d Self-employment (not interested in placement) 1 2 e Not getting a suitable company for placement 1 2 f Salary/wages not sufficient 1 2 g Please specify if other……….
6. Number of companies PIA Is having placements tie-ups: (Sector-wise) Method opted for Placements YES NO
a Tie up with Company 1 2 b Tie up with Placement agency 1 2 c Campus Placements 1 2 d Job fairs 1 2 e Job Counselling 1 2 f Any other (Pl specify..)
7. Different methods used to keep track of trainees post placement after the course TRACKING OF CANDIDATES POST PLACEMENT YES NO a Frequent call on Mobile phone and sending SMS 1 2 b Constantly sending Emails and keeping aware about the program 1 2 c Visits from PIA to the Candidate 1 2 d Inviting them on special occasions 1 2 e Pl specify if other….
8. Reasons for losing the contact with the trainee after the program
Reasons for losing contact YES NO a Frequent mobile number change 1 2 b Frequent job change 1 2 d Specify if any other……….

176
SECTION-V: DOCUMENTATION
1. Do you identify and document best practices and home-grown innovations in the form of case studies YES=1; NO=2
2. Do you disseminate these case studies to beneficiaries/ use them in course material / share them in any form? YES=1; NO=2
3. Can you give an example? _________________________________________________
4. Do you have any system of rewards for beneficiaries/ Trainers? If yes, please tell more about it______________________
SECTION-VI: ISSUES AND CHALLENGES
1. Issues and Challenges faced by you in following aspects of the Scheme
a) Awareness Generation
___________________________________________________________________________________ ___________________________________________________________________________________
b) Selection of beneficiaries __________________________________________________________________________________ __________________________________________________________________________________
c) In Linking with NSDC __________________________________________________________________________________ __________________________________________________________________________________ c). Delivering Training/ Courses/ designing course material
__________________________________________________________________________________ __________________________________________________________________________________ d). In getting Trainers
__________________________________________________________________________________ __________________________________________________________________________________
e) Is the quality of the teachers involved in skills training sufficient?
__________________________________________________________________________________ __________________________________________________________________________________
f) Managing Infrastructure (blackboard, drinking water, toilets, furniture, canteen, lab and training
equipment, raw material for training purpose) __________________________________________________________________________________ __________________________________________________________________________________

177
g) Managing hostel/ boarding/ lodging facilities
__________________________________________________________________________________ __________________________________________________________________________________ h). Placement Tie-Ups
__________________________________________________________________________________ __________________________________________________________________________________ j). Post Placement Tracking
__________________________________________________________________________________ __________________________________________________________________________________
k). Financial management and release of stipend to beneficiaries
__________________________________________________________________________________ __________________________________________________________________________________
l). Capacity of the staff with regard to communications skills and understanding the scheme __________________________________________________________________________________ __________________________________________________________________________________
m). Documentation and monitoring including reporting (and other governance related issues)
__________________________________________________________________________________ __________________________________________________________________________________
l) Interaction and fund flow from government __________________________________________________________________________________ __________________________________________________________________________________
2. Which of these is an Area of Concern? YES NO a Selection of beneficiaries 1 2 b Courses/ designing course material 1 2 c Getting good quality teachers/ trainers 1 2 d Infrastructure-classes, labs, toilets etc and managing them 1 2 e Placement Tie-Ups 1 2 f Post Placement Tracking 1 2
g Capacity of the staff with regard to communications skills and understanding the scheme
1 2
h Linking with NSDC 1 2 J Interaction and fund flow from government 1 2

178
SECTION-VII: SUGGESTIONS FOR IMPROVEMENT
1. Please suggest improvements in the following areas a) Monitoring System and the indicators used for that
b) In linking with NSDC
c) Placements
d) documentation and reporting (and other governance related issues)
e) Alternative means of certification of trainees through authorised entities.
f) Any other Suggestion for improvement with respect to the Problems specified above and overall improvement in the Scheme
SECTION-VIII: ASSETS CREATED/SERVICES PROVIDED UNDER THE SCHEME
1. The asset and service increased in last 3 years Yes No Quantity
a Building infrastructure is adequate-no of rooms etc 1 2 b Furniture is adequate 1 2 c Blackboard 1 2 d Drinking Water 1 2 e Toilets 1 2 f Canteen 1 2
g Lab/Training Equipment facilities at the institute (e.g.: Machinery, Tools & Equipments for entire batch etc )
1 2
h Capacity in hostels 1 2
i Course module 1 2
j Trainee 1 2
k IT infrastructure 1 2
l Number of training center 1 2
m Placement collaboration 1 2
2. Turnover/ No of Training Centre’s for the last three years across centres
Parameters 2017-2018 2018-2019 2019-2020 Turnover Number of Training Centres

179
3. Number of states in which you are providing Training ________ 4. If the number of states/ location is more than one, how do you coordinate and what are the
challenges/ important lessons ______________________________________________________________________________________________________________________________________________________ ___________________________________________________________________________
Thank you for your valuable time. It will help in achieving the objectives of the project.

180
Annexure-VI
Evaluation Study of Seekho Aur Kamao Scheme Ministry of Minority Affairs, Govt. of India has awarded above mentioned project to MDI Gurgaon. The study requires feedback from Trainers/ Teachers with a view to assess and improve working of the Seekho Aur Kamao scheme. You are requested to answer the following questions to the best of your knowledge. (The information will be kept confidential and will be used as input to the evaluation study)
SECTION-I: DEMOGRAPHICS AND GENERAL FEEDBACK
17. Name of the Trainer
18. Qualification a. Graduate b. Post Graduate c. Ph.D
19. District 20. State
21. Mobile 22. E-mail ID
23. Salary
24. Do you give individual short and long term projects to the trainees? YES=1; NO=2 25. What are the challenges faced in giving training at the Institute: in terms of
infrastructure/ facilities/ payments etc FEEDBACK ON INFRASTRUCTURE Yes No
a Designing the Course material etc 1 2 b Coordination/ cooperation with staff at the Institute 1 2 c Timely payments 1 2 d Building infrastructure is adequate-no of rooms etc 1 2 e Furniture is adequate 1 2 f Blackboard 1 2 g Drinking Water 1 2 h Toilets 1 2 j Canteen 1 2
k Lab/Training Equipment facilities at the institute (e.g.: Machinery, Tools & Equipments for entire batch etc )
1 2
l Whether the required raw material for conductance of practicals/laboratory work is available 1 2
m Any other issue faced?
10.a. For increasing entrepreneurship, do you think element of entrepreneurship related courses should be adopted? (YES=1; NO=2) 26. b. if yes above, please tell how many hours of course? _____________________
27. What any other form of training provided for placement?
TRAININGS PROVIDED Yes No
a Soft Skill 1 2 b English Speaking 1 2 c Basic Etiquettes 1 2 d Basic IT Training 1 2
e Any Other…

181
28. What are the challenges faced by you in terms of quality of trainees?
29. Have you attended Training of Trainers under NSDC? YES=1; NO=2
30. Please give your suggestions for improvement of the Seekho Aur Kamao Training programme?
Thank you for your valuable time. It will help in achieving the objectives of the project.

182
Annexure-VII Evaluation Study of Seekho Aur Kamao Scheme
Ministry of Minority Affairs, Govt. of India has awarded above mentioned project to MDI Gurgaon. The study requires feedback from Employers with a view to assess and improve working of the Seekho Aur Kamao scheme. You are requested to answer the following questions to the best of your knowledge. (The information will be kept confidential and will be used as input to the evaluation study)
SECTION-I: DEMOGRAPHICS AND GENERAL FEEDBACK
31. Name of the Employer
32. Website
33. CIN Number
34. District 35. State
36. Mobile 37. E-mail ID
38. How many trainees have you taken on employment from Seekho aur Kamao
Scheme_________________ 39. Please give your feedback on the following
a. Quality of Trainees
b. Training Curriculum/ course design
40. Please give your suggestions for improvement of the Seekho Aur Kamao Training programme?
Thank you for your valuable time. It will help in achieving the objectives of the project.