Feeding ecology of the deep-sea lanternshark Etmopterus pusillus (Elasmobranchii: Etmopteridae) in...
10
Feeding ecology of the deep-sea lanternshark Etmopterus pusillus (Elasmobranchii: Etmopteridae) in the northeast Atlantic JOSÉ C. XAVIER 1 , CÁTIA VIEIRA 2 , CARLOS ASSIS 3 , YVES CHEREL 4 , SIMEON HILL 5 , ESMERALDA COSTA 2 , TERESA C. BORGES 2 and RUI COELHO 2 1 Institute of Marine Research (IMAR-CMA), Department of Life Sciences, University of Coimbra, 3004-517 Coimbra, Portugal. 2 Centre of Marine Sciences (CCMAR), University of Algarve. Campus de Gambelas, 8000-139 Faro, Portugal. E-mail: [email protected] 3 Department of Animal Biology and Institute of Oceanography, Faculty of Sciences, University of Lisbon. Campo Grande, 1749-016 Lisbon, Portugal. 4 Centre d´Etudes Biologiques de Chizé, UPR 1934 du Centre National de la Recherche Scientifique, BP 14, 79360 Villiers-en-Bois, France. 5 British Antarctic Survey, High Cross, Madingley Road, CB3 0ET, Cambridge, UK. SUMMARY: This study provides the first description of the feeding ecology of the smooth lanternshark Etmopterus pu- sillus based on stomach contents of specimens caught as bycatch in the Algarve (southern Portugal) with bottom trawling and bottom longline. The diet of E. pusillus consists mainly of fish (dry weight (% W)=87.1%; frequency of occurrence (%FO)=28.6%; number (%N)=30.3%), crustaceans (%W=7.7%; %FO=36.7%; %N=3.4%) and cephalopods (%W=4.7%; %FO=11.3%; %N=11.1%). The diet did not vary between sexes. Ontogenic changes were detected: crustaceans decreased in importance as the sharks increased in size and fish became dominant in the diet of adults. Combining two fishing methods provided broad information on the diet of E. pusillus, as bottom trawling caught smaller specimens and longlines caught larger individuals. E. pusillus feeds mainly on non-commercial species, and therefore does not compete directly with com- mercial fisheries. Finally, E. pusillus feeds in various parts of the water column and thus it can access a wide range of prey; however, this also means that it can be caught by both gears, making it more vulnerable in terms of conservation. Keywords: deep-sea fisheries, elasmobranch, Etmopterus pusillus, feeding ecology, lanternshark. RESUMEN: Ecología alimentaria del tiburón tollo lucero liso ETMOPTERUS PUSILLUS (Elasmobranchii: Etmopte- ridae) en el Atlántico Nordeste. – Se proporciona la primera descripci�n de la ecolog�a alimentaria del tibur�n tollo lu- Se proporciona la primera descripci�n de la ecolog�a alimentaria del tibur�n tollo lu- cero liso Etmopterus pusillus mediante el análisis de contenidos estomacales de individuos capturados accidentalmente en el Algarve (sur de Portugal) mediante arrastre y palangre de fondo. La dieta de E. pusillus consiste mayoritariamente en peces (%W=87.1%; %FO=28.6%; %N=30.3%), crustáceos (%W=7.7%; %FO=36.7%; %N=53.4%) y cefal�podos (%W=4.7%; %FO=11.3%; %N=11.1%; % W=peso seco, %FO=Frecuencia de aparici�n, %N=Número). No se observaron diferencias entre sexos en su dieta, pero s� cambios ontogénicos, con los crustáceos disminuyendo en importancia a medida que el tibur�n alcanza tallas mayores, y los peces dominando la dieta de los adultos. Ambos tipos de pesquer�a proporcionaron informaci�n adecuada sobre la dieta de E. pusillus, con el arrastre capturando tallas menores, y el palangre capturando ani- males mayores. Al alimentarse mayoritariamente de especies sin interés comercial, este tibur�n no compite activamente con ninguna pesquer�a para obtener recursos alimentarios. Finalmente, E. pusillus se alimenta en varios niveles de la columna del agua, lo que le aporta mayor diversidad de presas, aunque también significa que puede ser capturado por ambos artes de pesca, convirtiéndolo en más vulnerable en términos de conservaci�n. Palabras clave: pesquer�as demersales, elasmobranquios, Etmopterus pusillus, ecolog�a alimentaria, tibur�n tollo lucero liso. SCIENTIA MARINA 76(2) June 2012, 301-310, Barcelona (Spain) ISSN: 0214-8358 doi: 10.3989/scimar.03540.07B
Transcript of Feeding ecology of the deep-sea lanternshark Etmopterus pusillus (Elasmobranchii: Etmopteridae) in...

Feeding ecology of the deep-sea lanternshark Etmopterus pusillus (Elasmobranchii: Etmopteridae)
in the northeast Atlantic
JOSÉ C. XAVIER 1, CÁTIA VIEIRA 2, CARLOS ASSIS 3, YVES CHEREL 4, SIMEON HILL 5, ESMERALDA COSTA 2, TERESA C. BORGES 2 and RUI COELHO 2
1 Institute of Marine Research (IMAR-CMA), Department of Life Sciences, University of Coimbra, 3004-517 Coimbra, Portugal.
2 Centre of Marine Sciences (CCMAR), University of Algarve. Campus de Gambelas, 8000-139 Faro, Portugal. E-mail: [email protected]
3 Department of Animal Biology and Institute of Oceanography, Faculty of Sciences, University of Lisbon. Campo Grande, 1749-016 Lisbon, Portugal.
4 Centre d´Etudes Biologiques de Chizé, UPR 1934 du Centre National de la Recherche Scientifique, BP 14, 79360 Villiers-en-Bois, France.
5 British Antarctic Survey, High Cross, Madingley Road, CB3 0ET, Cambridge, UK.
SUMMARY: This study provides the first description of the feeding ecology of the smooth lanternshark Etmopterus pu-sillus based on stomach contents of specimens caught as bycatch in the Algarve (southern Portugal) with bottom trawling and bottom longline. The diet of E. pusillus consists mainly of fish (dry weight (% W)=87.1%; frequency of occurrence (%FO)=28.6%; number (%N)=30.3%), crustaceans (%W=7.7%; %FO=36.7%; %N=3.4%) and cephalopods (%W=4.7%; %FO=11.3%; %N=11.1%). The diet did not vary between sexes. Ontogenic changes were detected: crustaceans decreased in importance as the sharks increased in size and fish became dominant in the diet of adults. Combining two fishing methods provided broad information on the diet of E. pusillus, as bottom trawling caught smaller specimens and longlines caught larger individuals. E. pusillus feeds mainly on non-commercial species, and therefore does not compete directly with com-mercial fisheries. Finally, E. pusillus feeds in various parts of the water column and thus it can access a wide range of prey; however, this also means that it can be caught by both gears, making it more vulnerable in terms of conservation.
Keywords: deep-sea fisheries, elasmobranch, Etmopterus pusillus, feeding ecology, lanternshark.
RESUMEN: Ecología alimentaria del tiburón tollo lucero liso EtmoptErus pusillus (Elasmobranchii: Etmopte-ridae) en el Atlántico Nordeste. – Se proporciona la primera descripci�n de la ecolog�a alimentaria del tibur�n tollo lu-Se proporciona la primera descripci�n de la ecolog�a alimentaria del tibur�n tollo lu-cero liso Etmopterus pusillus mediante el análisis de contenidos estomacales de individuos capturados accidentalmente en el Algarve (sur de Portugal) mediante arrastre y palangre de fondo. La dieta de E. pusillus consiste mayoritariamente en peces (%W=87.1%; %FO=28.6%; %N=30.3%), crustáceos (%W=7.7%; %FO=36.7%; %N=53.4%) y cefal�podos (%W=4.7%; %FO=11.3%; %N=11.1%; % W=peso seco, %FO=Frecuencia de aparici�n, %N=Número). No se observaron diferencias entre sexos en su dieta, pero s� cambios ontogénicos, con los crustáceos disminuyendo en importancia a medida que el tibur�n alcanza tallas mayores, y los peces dominando la dieta de los adultos. Ambos tipos de pesquer�a proporcionaron informaci�n adecuada sobre la dieta de E. pusillus, con el arrastre capturando tallas menores, y el palangre capturando ani-males mayores. Al alimentarse mayoritariamente de especies sin interés comercial, este tibur�n no compite activamente con ninguna pesquer�a para obtener recursos alimentarios. Finalmente, E. pusillus se alimenta en varios niveles de la columna del agua, lo que le aporta mayor diversidad de presas, aunque también significa que puede ser capturado por ambos artes de pesca, convirtiéndolo en más vulnerable en términos de conservaci�n.
Palabras clave: pesquer�as demersales, elasmobranquios, Etmopterus pusillus, ecolog�a alimentaria, tibur�n tollo lucero liso.
Scientia Marina 76(2)June 2012, 301-310, Barcelona (Spain)
ISSN: 0214-8358doi: 10.3989/scimar.03540.07B

302 • J.C. XAVIER et al.
SCI. MAR., 76(2), June 2012, 301-310. ISSN 0214-8358 doi: 10.3989/scimar.03540.07B
INTRODUCTION
Many shark species play a key role as top preda-tors in marine ecosystems (Cortés and Gruber 1990, Cortés 1999), preying on organisms throughout the food web or acting as scavengers (Sims and Quayle 1998, Stevens et al. 2000, Hantz 2003). Furthermore, they exploit a wide range of habitats, from epipelagic to deep-sea benthic environments, where they play an important role in the regulation of lower trophic levels (Cortés 1999, Stevens et al. 2000).
There is growing concern about potential top-down cascade effects that could be caused by the overfish-ing of sharks (Pauly et al. 1998, Lehodey and Maury 2003). Most sharks have K-selected life history strate-gies (Stevens et al. 2000), and as such they are highly susceptible to rapid overexploitation (Moore and Mace 1999). Studies are therefore necessary on the role played by poorly understood shark species in marine ecosystems, including studies on their feeding ecology.
Determining the food and feeding ecology of sharks is of paramount importance in order to clarify the re-lationships between sharks, prey availability and fish-eries. Modelling relationships with fisheries requires detailed information on the biology of the sharks and their prey. Furthermore, it is important to evaluate the diet of sharks according to sex because juveniles, adult males and adult females may aggregate in separate groups (Springer 1967, Myrberg and Gruber 1974, Sims 2005).
Portugal is the third greatest shark fishing nation in Europe and has the second largest fishing fleet (FAO 2006, Gibson et al. 2008). Around 60 shark species oc-cur in the Algarve region (southern Portugal, northeast Atlantic), and several deep water species, including Etmopterus spp., are commonly caught as bycatch and discarded (Monteiro et al. 2001, Coelho et al. 2005).
The smooth lanternshark Etmopterus pusillus (Lowe, 1839) is a deep water lanternshark with a global distribution that is caught in large quantities in some areas, but is discarded as it has low or no com-mercial value (Coelho et al. 2003, Coelho and Erzini 2007). It is distributed on the continental shelves and upper slopes at depths between about 300 and 1000 m (Whitehead et al. 1986). As it is always discarded, E. pusillus catches are not recorded, and the species is not listed in the fisheries statistics of Portugal (Coelho and Erzini 2005). Consequently, it is very difficult to gather information on the status of this species, and informa-tion on its biology has only recently become available (Coelho and Erzini, 2005, 2007, 2008a, b). Moreover, there is no detailed information on the feeding ecology of E. pusillus in any part of the world.
In southern Portugal, E. pusillus is caught both by bottom trawlers targeting crustaceans and bottom longliners targeting bony fish (Monteiro et al. 2001, Coelho et al. 2005). Trawling usually catches a broader range of species and size groups than passive gears like longlines because the latter relies on attraction to bait
(Cotton et al. 2005) and excludes very small fish which cannot ingest the hooks (FAO 2006). The use of both bottom trawls and bottom longlines as sampling gears could provide insight into ontogenic shifts in feeding habits as a wide range of shark sizes can be sampled.
The main goal of the present study was to describe the feeding ecology of E. pusillus in the northeastern Atlantic waters (Algarve, Portugal) using two differ-ent fishing methods. The questions addressed were: 1) What is the overall diet of E. pusillus? 2) Are there sex related differences in the diet? 3) Are there ontogenic differences in the diet? 4) Are there any differences between the diets of the specimens sampled by the two different fishing gears? and, finally, 5) What do these results imply for shark conservation and management?
MATERIALS AND METHODS
Sample collection
Specimens of E. pusillus were recovered from bot-tom longlines (targeting wreckfish (Polyprion america-nus), European conger (Conger conger), redfish (Heli-colenus dactylopterus) and emperors (Beryx spp.)) and bottom trawls (targeting high-value crustaceans like deepwater rose shrimp (Parapenaeus longirostris) and Norway lobster (Nephrops norvegicus)). Both gears were employed off the coast at depths between 200 and 700 m (Borges et al. 2001, Xavier et al. 2010) (Fig. 1).
Trawling took place from February to December 1998, February-September 1999, February-September 2000 and February-October 2003. Longline sampling was carried out between May 2003 and March 2004. At least 30 individuals were recovered each month dur-ing these periods. The specimens were cooled immedi-ately after capture and frozen at –18°C upon arrival at the laboratory.
Laboratory methodology
In the laboratory, all specimens were measured for total length, weighed and sexed. The maturity stage of each specimen was determined with a macroscopic examination of the gonads and claspers. The stomachs were removed and kept in plastic containers, labeled and immersed in 10% formalin solution buffered with sodium tetraborate for 48 h (Sá et al. 2006). They were subsequently stored in 70% ethanol solution.
All components were removed from the stomachs, weighed and sorted into categories (cephalopods, crustaceans and fish) in a tray following Xavier et al. (2010). Each item was individually analysed. In order to avoid digestion biases, prey items were identified mainly based on fresh hard parts (e.g. fish otoliths, cephalopod beaks, crustacean carapaces/parts) and flesh, to the lowest taxonomic level possible. The taxa identified to a low taxonomic level were displayed in figures and tables in order to provide as much detail as

FEEDING ECOLOGY OF THE SMOOTH LANTERNSHARK • 303
SCI. MAR., 76(2), June 2012, 301-310. ISSN 0214-8358 doi: 10.3989/scimar.03540.07B
possible (i.e. the authors preferred to mention the taxa identified as Sepiolidae and Ommastrephidae rather than including all these taxa in a broader taxa, in this example, the class Cephalopoda, as this illustrates some prey selection by the studied sharks). Chub mackerel Scomber japonicus was used as bait for the longliners, and therefore any food item identified as bait (usually clearly cut in half, with evidence of hook damage and in extremely good condition) was excluded from the analysis.
The samples were placed in an oven at 60°C for at least 48 h (depending on the size and composition of the prey) until a constant dry weight was obtained. Samples were weighed on an analytical balance precise to 0.0001 g.
Data analysis
The quantity and quality of the diet was described using the following metrics: by number (%N; number of individuals of a certain species divided by the total number of individuals analysed ×100), by frequency of occurrence (%FO; number of stomach samples with a certain species present divided by the total number of individuals analysed ×100), and by dry weight (%W; estimated mass of all individuals of a certain species divided by the total estimated mass for all individuals analysed ×100) following Hureau (1970). The total weight of each prey was also estimated based on the reconstructed mass (%MR) of the prey by taxonomic group using allometric equations (see below). Cumu-
lative richness curves were constructed to determine whether the number of specimens with food in their stomachs was sufficient to characterize the diet of E. pusillus. The number of samples was sufficient to de-scribe the diet (using a model to replicate 100 cumu-lative curves by choosing the specimen to be studied first randomly; see Xavier et al. 2005). For the trawling gear, the mean number of samples needed in order to determine the maximum number of prey was 198±0.4 (range: 113-213; 295 stomachs containing food were analysed in this study). For the longline gear, the mean number of samples needed was 46±0.2 (range 18-55; 148 stomachs containing food were analysed). Com-bining these two gears, the mean number of specimens needed to characterize the diet was well below the number of specimens containing food: 122±1.7 sam-ples (range: 18-213; a total of 443 stomachs with food were analysed).
When the degree of digestion allowed it, the total length of the prey was determined. Fish species were identified and their reconstructed mass and length were estimated based on otoliths following Assis (2000). Beaks of cephalopods were identified using reference collections and the reconstructed mass and length of cephalopods were estimated using the following equa-tions (Clarke 1986, Xavier et al. 2010, Xavier, Borges and Sendão, unpublished data):
Illex coindetii: ML=31.80367 × LRL + 20.42327
(r2=0.88, n=204; ML=56-278 mm);
Fig. 1. – Location of the longline (black circles) and trawl (grey circles) sets that provided Etmopterus pusillus samples for this study.

304 • J.C. XAVIER et al.
SCI. MAR., 76(2), June 2012, 301-310. ISSN 0214-8358 doi: 10.3989/scimar.03540.07B
LN M (g) = 2.167534 × LN (LRL) 1.570273 (r2=0.80, n=203 (4-559 g);
Todaropsis eblanae: ML= 22.59283 × LRL + 5.673228 ( r2=0.79, n=89; ML=55-147 mm);
LN M (g)=2.506635 × LN (LRL) 0.777538 (r2=0.85, n=89 (14-205 g))
where ML is the mantle length, M the estimated mass and LRL is the rostral length of the lower beak.
The prey items were categorized according to their ecological group (GE; categories used: demersal, mes-opelagic, pelagic and benthic) following Cortés (1997). To assess the importance of different prey in the diet, and facilitate comparisons between different samples or studies, the following combined indexes were used: the index of relative importance (IRI; IRI=(%N+ %W) × %FO; %IRI=IRI of a given prey divided by the total values of IRI for all prey x 100) and food coefficient (Q; Q=%N×%W, with Q values >200 classified as “preferential prey”, 20≤ Q≤200 as “secondary prey” and Q<20 as “occasional prey”) (Hureau 1970).
In order to analyse the quantitative variations in the diet with the predator’s feeding activity, the proportion of empty stomachs (CV; CV=total number of empty stomachs divided by the total number of stomachs ana-lysed x 100) was calculated following Hureau (1970). In addition, the diversity of prey species consumed by this predator was calculated with the Shannon-Wiener index (Shannon and Weaver 1949). The trophic level and the ontogeny variation were calculated following Cortés (1999).
The similarities of the diet of E. pusillus between length classes and sexes were evaluated based on the abundance of prey and using the Bray-Curtis similar-ity coefficient in the “PRIMER 6” software (Clarke and Warwick, 2001). The resulting array of similarity values was plotted using non-metric multidimensional scaling (MDS). The square root transformed numeri-cal abundance of each prey item (Clarke and War-wick 2001) was assigned to major taxonomic groups (Myctophidae, Gadiformes, other Teleosts, Natantia, other Crustaceans, Ommastrephidae, Sepiolidae, other cephalopods) and used to calculate the similar-ity matrix. Statistical inference was carried out using the ANOSIM (Analysis of Similarities) procedure (Clarke and Warwick 2001) available in the “PRIMER 6” software. The groups of size classes with different diets were individually assessed and compared for the importance of different types of prey in the diet using the index of relative importance (%IRI), the Shannon-Wiener diversity index and the trophic level (Cortés 1999). Finally, differences between sexes and between the two fishing methods were also considered. The MDS analyses on the relationship between sexes, size classes and their diet were not conducted due to the limited number of individuals.
All values given in the results are stated as mean ± standard error unless otherwise stated.
RESULTS
General description of the diet
A total of 600 E. pusillus specimens were analysed, comprising 264 females and 336 males, of which 26.1% had empty stomachs (number of specimens with
Table 1. – Number of male and female Etmopterus pusillus caught by longline and trawl gears, categorized by stomach status.
Longline Trawl Empty Not Empty Empty Not Empty Total
Females 77 62 9 116 264Males 62 86 9 179 336
Total 139 148 18 295 600
Fig. 2. – Length frequency distribution of Etmopterus pusillus spec-imens (with food or empty), caught by trawling (above), longlines
(middle) and the two gears combined (bottom).

FEEDING ECOLOGY OF THE SMOOTH LANTERNSHARK • 305
SCI. MAR., 76(2), June 2012, 301-310. ISSN 0214-8358 doi: 10.3989/scimar.03540.07B
empty stomachs=157; total length of specimens with empty stomachs =12.0-48.5 cm; 37.7±0.5 cm; Table 1; Fig. 2). Females with food in their stomachs had a similar range of total lengths (14.3-50.2 cm; 31.5±0.6 cm) as males (14.8-45.5 cm; 31.3±0.4 cm) (t-test=0.32; p=0.74). The mean number of prey per stomach was 1.7±0.01 items.
A total of 459 prey items were analysed corre-sponding to 26 taxa (Tables 2, 3 and 4). E. pusillus fed mostly on mesopelagic and demersal prey. The only prey species considered to be benthic (the crustacean Plesionika sp.) made a reduced contribution to the diet (Table 2). Fish were the most important component in the diet according to dry weight (87.1%), and the second according to number (30.3%) and frequency of occurrence (28.6%) (Table 2). The blue whiting Mi-cromesistius poutassou was the most important iden-tifiable species according to various indices, including dry weight (21.2%), frequency of occurrence (4.7%) and number (5.0%) (Table 2). This species was also classified as the only secondary prey, whereas all the other taxa were classified as occasional. Fish were also the main taxon in the diet according to reconstructed mass (76%). The apparent importance of cephalopods indicated by the %MR was five times that indicated by the dry weight (Table 2). The trophic diversity was 1.8, and the trophic level was 4.3.
Sex related differences
There were no significant differences in the diet of male and female E. pusillus. The MDS plot did not show any evidence of differences (ANOSIM statistic, R=0.007, p=0.208). The trophic diversity was similar for the two sexes (females=1.7, males=1.8).
Ontogenic differences
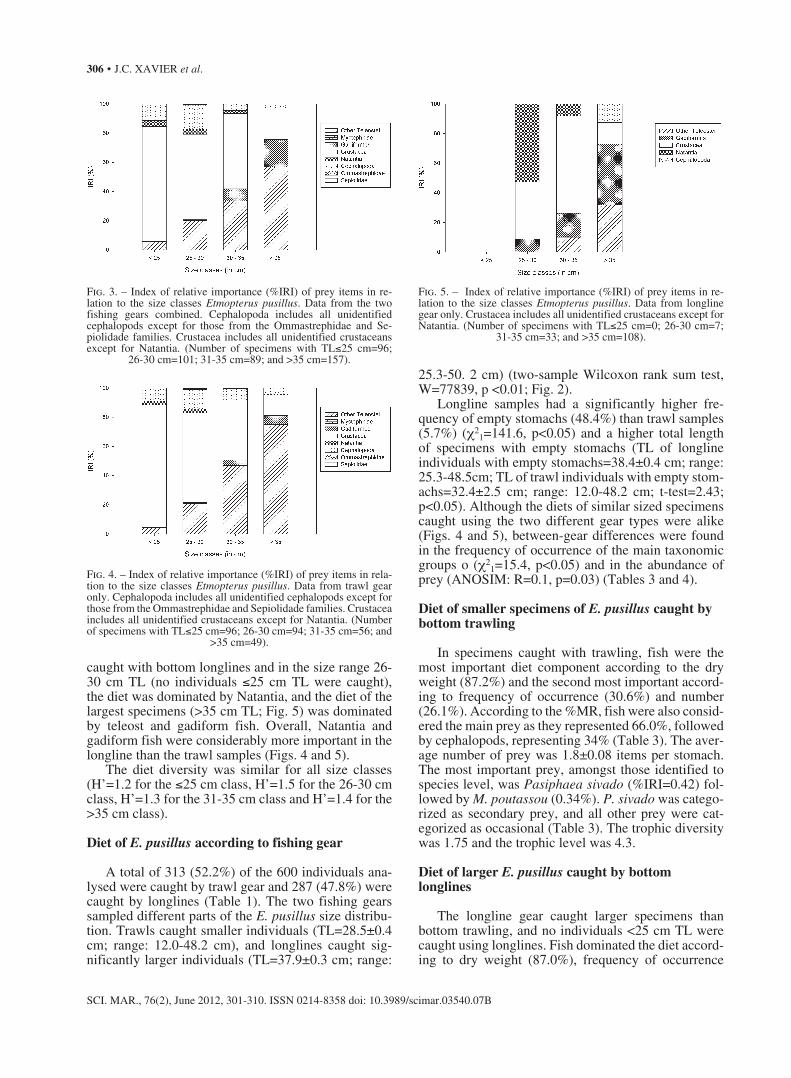
Four different size groups (TL) with distinct diets were identified: ≤25 cm; 26-30 cm; 31-35 cm; and >35 cm. There were significant differences in the diet com-position between the length classes (ANOSIM statistic, R=0.075, p<0.01). The diet of the smallest individuals (≤25 cm) was almost exclusively based on crustaceans (%IRI=78.8%), cephalopods had an %IRI of 11.2% and fish an %IRI of 5.5% (Fig. 3). As E. pusillus in-creased in size, crustaceans gradually lost importance, while fish showed the opposite trend. Cephalopods were relatively unimportant in the diet of these sharks throughout their ontogenic development (Fig. 3). The same pattern was apparent for each gear type, although there were some differences. The diet of E. pusillus caught with bottom trawling was dominated by crus-taceans in smaller individuals (≤25 cm TL) and teleost fish in larger ones (>35 cm TL; Fig. 4). In E. pusillus
Table 2. – List of identified prey categories in the diet of Etmopterus pusillus (number of individuals with food in their stomachs=443) combining data from both trawl and longline gears. GE: ecological group (D: demersal, M: mesopelagic, P: pelagic, B: benthic, Na: not attributable); n: number of prey; %FO: frequency of occurrence; %N: percentage in number; %MR: percentage by reconstructed mass %W: percentage by dry weight (estimated mass within each component is in parentheses); %IRI: index of relative importance; Q: food coefficient;
and prey classification.
Prey Items GE n %FO %N %MR %W %IRI Q Classification
CEPHALOPODA 11.3 11.1 24.5 4.7 10.34 Enoploteuthidae D 3 0.7 0.7 – (11.0) 0.14 7.2 OccasionalHistioteuthis corona M 1 0.2 0.2 3.3 (6.5) 0.03 1.4 OccasionalIllex coindetii M 1 0.2 0.2 8.1 (5.0) 0.02 1.1 OccasionalOnychoteuthis banksii M 1 0.2 0.2 0.1 (0.5) <0.01 0.1 OccasionalSepietta oweniana D 1 0.2 0.2 0.4 (10.2) 0.04 2.2 OccasionalSepiolidae M/D 2 0.5 0.4 – (0.4) 0.01 0.2 OccasionalTodarodes sagittatus M 3 0.7 0.7 12.0 (2.1) 0.03 1.4 OccasionalTodaropsis eblanae D 2 0.5 0.4 0.8 (0.3) 0.01 0.1 OccasionalCephalopods (unidentified) Na 37 8.1 8.1 – (63.9) 10.07 515.4 Occasional OccasionalCRUSTACEA 36.7 53.4 – 7.7 51.95 OccasionalDecapoda (unidentified) Na 2 0.5 0.4 – (5.8) 0.05 2.6 OccasionalIsopoda Na 1 0.2 0.2 – (<0.1) <0.01 <0.1 OccasionalNatantia Na 13 1.6 2.8 – (2.8) 0.15 7.9 OccasionalPasiphaea sp. P 3 0.5 0.7 – (2.9) 0.03 1.9 OccasionalPasiphaea sivado P 7 1.6 1.5 – (33.5) 0.95 51.0 OccasionalPlesionika sp. B 1 0.2 0.2 – (1.1) 0.01 0.3 OccasionalPolybius henslowi M 2 0.5 0.4 – (8.4) 0.07 3.7 OccasionalCrustaceans (unidentified) Na 216 31.8 47.1 – (45.5) 50.70 2139.0 Occasional OccasionalFISH 28.6 30.3 76.0 87.1 27.89 OccasionalBenthodesmus elongatus 1 0.2 0.2 15.4 (2.7) 0.01 0.6 OccasionalCeratoscopelus sp. M 1 0.2 0.2 – (<0.1) <0.01 <0.1 OccasionalGadiculus argenteus D 6 1.4 1.3 1.1 (8.1) 0.22 10.5 OccasionalGonostoma sp. M/D 1 0.2 0.2 – (8.6) 0.03 1.9 OccasionalMicromesistius poutassou M 23 4.7 5.0 40.5 (21.2) 2.14 106.4 SecondaryMyctophidae P 6 1.4 1.3 – (2.7) 0.09 3.6 OccasionalMyctophum punctatum M 5 1.1 1.1 19.1 (1.9) 0.06 2.0 OccasionalTeleostei (unidentified) Na 96 19.4 20.9 – (54.9) 25.33 1147.8 NOT IDENTIFIED Na 24 5.41 5.2 – 0.5 9.82 522.9
306 • J.C. XAVIER et al.
SCI. MAR., 76(2), June 2012, 301-310. ISSN 0214-8358 doi: 10.3989/scimar.03540.07B
caught with bottom longlines and in the size range 26-30 cm TL (no individuals ≤25 cm TL were caught), the diet was dominated by Natantia, and the diet of the largest specimens (>35 cm TL; Fig. 5) was dominated by teleost and gadiform fish. Overall, Natantia and gadiform fish were considerably more important in the longline than the trawl samples (Figs. 4 and 5).
The diet diversity was similar for all size classes (H’=1.2 for the ≤25 cm class, H’=1.5 for the 26-30 cm class, H’=1.3 for the 31-35 cm class and H’=1.4 for the >35 cm class).
Diet of E. pusillus according to fishing gear
A total of 313 (52.2%) of the 600 individuals ana-lysed were caught by trawl gear and 287 (47.8%) were caught by longlines (Table 1). The two fishing gears sampled different parts of the E. pusillus size distribu-tion. Trawls caught smaller individuals (TL=28.5±0.4 cm; range: 12.0-48.2 cm), and longlines caught sig-nificantly larger individuals (TL=37.9±0.3 cm; range:
25.3-50. 2 cm) (two-sample Wilcoxon rank sum test, W=77839, p <0.01; Fig. 2).
Longline samples had a significantly higher fre-quency of empty stomachs (48.4%) than trawl samples (5.7%) (χ2
1=141.6, p<0.05) and a higher total length of specimens with empty stomachs (TL of longline individuals with empty stomachs=38.4±0.4 cm; range: 25.3-48.5cm; TL of trawl individuals with empty stom-achs=32.4±2.5 cm; range: 12.0-48.2 cm; t-test=2.43; p<0.05). Although the diets of similar sized specimens caught using the two different gear types were alike (Figs. 4 and 5), between-gear differences were found in the frequency of occurrence of the main taxonomic groups o (χ2
1=15.4, p<0.05) and in the abundance of prey (ANOSIM: R=0.1, p=0.03) (Tables 3 and 4).
Diet of smaller specimens of E. pusillus caught by bottom trawling
In specimens caught with trawling, fish were the most important diet component according to the dry weight (87.2%) and the second most important accord-ing to frequency of occurrence (30.6%) and number (26.1%). According to the %MR, fish were also consid-ered the main prey as they represented 66.0%, followed by cephalopods, representing 34% (Table 3). The aver-age number of prey was 1.8±0.08 items per stomach. The most important prey, amongst those identified to species level, was Pasiphaea sivado (%IRI=0.42) fol-lowed by M. poutassou (0.34%). P. sivado was catego-rized as secondary prey, and all other prey were cat-egorized as occasional (Table 3). The trophic diversity was 1.75 and the trophic level was 4.3.
Diet of larger E. pusillus caught by bottom longlines
The longline gear caught larger specimens than bottom trawling, and no individuals <25 cm TL were caught using longlines. Fish dominated the diet accord-ing to dry weight (87.0%), frequency of occurrence
Fig. 3. – Index of relative importance (%IRI) of prey items in re-lation to the size classes Etmopterus pusillus. Data from the two fishing gears combined. Cephalopoda includes all unidentified cephalopods except for those from the Ommastrephidae and Se-piolidade families. Crustacea includes all unidentified crustaceans except for Natantia. (Number of specimens with TL≤25 cm=96;
26-30 cm=101; 31-35 cm=89; and >35 cm=157).
Fig. 4. – Index of relative importance (%IRI) of prey items in rela-tion to the size classes Etmopterus pusillus. Data from trawl gear only. Cephalopoda includes all unidentified cephalopods except for those from the Ommastrephidae and Sepiolidade families. Crustacea includes all unidentified crustaceans except for Natantia. (Number of specimens with TL≤25 cm=96; 26-30 cm=94; 31-35 cm=56; and
>35 cm=49).
Fig. 5. – Index of relative importance (%IRI) of prey items in re-lation to the size classes Etmopterus pusillus. Data from longline gear only. Crustacea includes all unidentified crustaceans except for Natantia. (Number of specimens with TL≤25 cm=0; 26-30 cm=7;
31-35 cm=33; and >35 cm=108).

FEEDING ECOLOGY OF THE SMOOTH LANTERNSHARK • 307
SCI. MAR., 76(2), June 2012, 301-310. ISSN 0214-8358 doi: 10.3989/scimar.03540.07B
(23.7%) and number (50.0%). Crustaceans were the second most important group according to dry weight (12.5%), frequency of occurrence (17.6%) and number (39.2%) (Table 4). Fish were also considered the main prey according to %MR (Table 4). The mean number of prey was 1.3±0.09 items per stomach. The most impor-tant prey identified to species level was M. poutassou (%IRI=29.66; categorized as preferential prey), while P. sivado was the second most important (%IRI=4.21; categorized as secondary prey) (Table 4). The trophic diversity was 1.84, and the trophic level was 4.3.
DISCUSSION
The diet of E. pusillus in the northeast Atlantic
To our knowledge, this is the first study focusing in detail on the diet of E. pusillus from anywhere in the world. Despite the high level of unidentified fish and crustaceans that formed the bulk of the diet, our study
was able to make a valuable contribution to the knowl-edge on the feeding ecology of this poorly known shark. In the northeast Atlantic, particularly along the Algarve coast, the diet of this shark is based primarily on mesope-lagic and demersal crustaceans, fish and cephalopods, including vertically migrating species (e.g. Pasiphaea spp.), species with a mesopelagic distribution (e.g. Mi-cromesistius poutassou) and exclusively benthic species (Plesionika sp.). This latter species, the only benthic spe-cies identified in the diet of E. pusillus, was unimportant in the diet of the laternshark; however, it is consumed by a large number of sympatric species in the study re-gion, including the sharks Etmopterus spinax and Galeus melastomus (Saldanha et al. 1995, Santos and Borges 2001, Cabral and Murta 2002, Pais 2002), which shows that a wide range of sharks can also exploit benthic prey.
Pelagic organisms represent an important food source for many demersal communities (Blaber and Bulman 1987, Mauchline and Gordon 1991, Yama-mura and Inada 2001). In our study, E. pusillus fed on
Table 3. – List of identified prey categories in the diet of Etmopterus pusillus caught by trawling (number of individuals with food in their stomachs=295). GE: ecological group (D: demersal, M: mesopelagic, P: pelagic, B: benthic, Na: not attributable); n: number of prey; %FO: frequency of occurrence; %N: percentage in number; %MR: percentage by reconstructed mass %W: percentage by dry weight (estimated
mass within each component is in parentheses); %IRI: index of relative importance; Q: food coefficient; and prey classification.
Prey Items n %FO %N¯ %MR %W %IRI Q Classification
CEPHALOPODA 16.3 12.8 34.0 6.2 10,66 Enoploteuthidae 3 1.0 0.8 – (11.5) 0.15 8.7 OccasionalHistioteuthis corona 1 0.3 0.3 4.5 (6.8) 0.03 1.7 OccasionalIllex coindetii 1 0.3 0.3 11.2 (5.2) 0.02 1.3 OccasionalSepietta oweniana 1 0.3 0.3 0.5 (10.7) 0.04 2.7 OccasionalCephalopods(unidentified) 35 11.6 9.1 – (65.8) 10.41 580.8 CRUSTACEA 46.6 56.4 – 6.2 59.36 Pasiphaea sivado 4 1.4 1.0 – (27.5) 0.42 25.2 SecondaryCrustaceans (unidentified) 195 41.5 50.9 – (72.5) 58.94 3246.5 FISH 30.6 26.1 66.0 87.2 22.04 Gadiculus argenteus 4 1.4 1.0 1.1 (11.4) 0.19 10.8 Occasional Gonostoma sp. 1 0.3 0.3 – (12.6) 0.05 3.0 OccasionalMicromesistius poutassou 7 2.4 1.8 18.0 (11.0) 0.34 18.0 OccasionalTeleostei (unidentified) 75 22.1 19.6 – (65.0) 21.46 1150.9 NOT IDENTIFIED 18 6.1 4.7 – 0.4 7.94 470.0
Table 4. – List of identified prey categories in the diet of Etmopterus pusillus caught by longlines (number of individuals with food in their stomachs=148). GE: ecological group (D: demersal, M: mesopelagic, P: pelagic, B: benthic, Na: not attributable); n: number of prey; %FO: frequency of occurrence; %N: percentage in number; %MR: percentage by reconstructed mass %W: percentage by dry weight (estimated
mass within each component is in parentheses); %IRI: index of relative importance; Q: food coefficient; and prey classification.
Prey Items n %FO %N %MR %W %IRI Q Classification
CEPHALOPODA 1.4 2.7 – 0.2 4.75 Cephalopods (unidentified) 2 1.4 2.7 – (100.0) 4.75 270.3 CRUSTACEA 17.6 39.2 – 12.5 24.90 Decapoda (unidentified) 1 0.7 1.4 – (11.9) 0.30 15.5 OccasionalPasiphaea sivado 3 2.0 4.1 – (49.1) 3.57 192.4 SecondaryPolibius henslowi 1 0.7 1.4 – (20.5) 0.49 26.8 OccasionalCrustacean (unidentified) 21 12.8 28.4 – (18.6) 20.54 511.3 FISH 23.7 50.0 – 87.0 55.36 Micromesistius poutassou 16 9.5 21.6 100.0 (56.7) 25.11 1210.4 PreferentialTeleostei (unidentified) 19 12.8 25.7 – (43.3) 30.07 1099.0 NOT IDENTIFIED 6 4.1 8.1 – 0.3 14.99 810.8

308 • J.C. XAVIER et al.
SCI. MAR., 76(2), June 2012, 301-310. ISSN 0214-8358 doi: 10.3989/scimar.03540.07B
pelagic prey such as Pasiphaea sivado, which is very common to 300 m depth in the pelagic zone although its distribution extends from 10 m to 600 m (Alvarez 1968). It is also possible that E. pusillus performs verti-cal feeding migrations, which is a common behaviour in sharks (Sims et al. 2006). Neiva et al. (2006) sug-gested that E. spinax makes vertical feeding migra-tions, but further evidence is required to definitively confirm the behaviour pattern in this genus.
Our study showed that E. pusillus feeds on locally abundant resources off the Algarve coast. Pasiphaea sivado, Micromesistius poutassou and myctophids are key taxa in the regional marine food web (Santos and Borges 2001). The low trophic diversity of E. pusillus suggests that it is a selective predator. E. spinax and E. pusillus have a similar diet in Algarve waters. Fish also dominated the diet of E. spinax (with M. poutassou as the most important species) but cephalopods also played an important role (32.2% by W), particularly the octopod Eledone sp. (22.6% by W) (Neiva et al. 2006). Neither of these sharks fed on amphipods, salps or scavenged prey, suggesting a very selective diet, which contrasts with other shark species, such as Squa-lus acanthias (Hanchet 1991).
From the prey identified to species level only M. poutassou seems to play an important role in the diet of E. pusillus. From the highly digested items, the ce-phalopod items were small flesh pieces (although some identifiable beaks were present), the fish were mostly represented by eroded fish otoliths (seemingly from M. poutassou but they were too eroded to make a defi-nite identification) and the crustacean items were too broken. Although the identified items allowed the diet of E. pusillus to be interpreted correctly, more feeding studies are needed, for example, using other methods such as fatty acid or DNA analyses to identify the highly digested fish and crustaceans that formed the bulk of the diet recovered from E. pusillus.
E. pusillus has a similar trophic level (4.3) to other deep water Squaliformes sharks, including the genera Somniosus (S. microcephalus, S. pacificus, S. rostra-tus) and Squalus (S. cubensis, S. megalops), as well as species in the Etmopterus genus, such as E. baxteri and E. compagnoi (Cortés 1999).
The frequent observation of a few limited food items in stomachs, with many prey in advanced stages of digestion and a relatively high number of empty stomachs (particularly in specimens collected with longlines) suggests that E. pusillus feeds intermittently, as shown for many other sharks in previous studies (Wetherbee and Cortés 2004, Braccini et al. 2005). However, more studies on the feeding duration, total digestion time and gastric evacuation rates of E. pusil-lus are needed to address this issue.
Diet of E. pusillus according to sex
Sharks could be an appropriate model for testing theories about the mechanisms underlying sexual
segregation (Sims 2005, Springer 1967). There are frequently size differences between mature males and females of the same shark species (Sims 2005). The fact that most species of sharks have larger females than males suggests that different energy requirements are a key cause of sexual segregation (Sims 2005). E. pusillus matures relatively late in its life cycle and is sexually dimorphic. Females are larger at first maturity and reach greater lengths than males (Coelho and Er-zini 2007). Although E. pusillus may aggregate by size and sex (Coelho and Erzini 2008b), our study found no differences between the diets of males and females. Neiva et al. (2006) also reported a similar absence of sexual differences in the diets of E. spinax from the same area. Braccini et al. (2005) reported that Squalus megalops in southern Australia showed differences in diets only between large females and smaller males (which attain lower maximum sizes than females).
Diet of E. pusillus according to ontogenic development
E. pusillus showed ontogenic changes in dietary composition, with crustaceans decreasing in impor-tance and fish progressively increasing in importance with the size of the sharks (Fig. 3). These diet tran-sitions are most likely related to the natural increase in predatory capacity as the shark increases in size. Larger specimens have larger mouths and stomachs with greater storage capacity (Karpouzi and Stergiou 2003). An increase in size also implies an increase in swimming capacity and ability (Wetherbee and Cortés 2004), allowing the sharks to capture larger prey.
In addition to ontogenic changes in the diet of E. pusillus, there were also differences related to the sampling gear. For example, in smaller E. pusillus, Crustacea was quite important in specimens caught by bottom trawling whereas Natantia was the most impor-tant in specimens caught with bottom longlines. These differences can be attributed, despite the overlap, to the spatial distribution of the sampling according to the fishing gear (see Fig. 1) and to the characteristics of the sampling areas, since bottom trawling was performed on sandy bottoms whereas longlines were set in rocky areas. As it was not possible to identify the bulk of the items because they had been heavily digested, more studies are needed to assess this issue.
Bottom trawling and bottom longlines as methods for sampling deep-sea sharks
The trawl and longline have considerably different selectivity (Borges et al. 2001). By combining the data from the two types of fishing gears, we were able to test for size-related changes in the diet of E. pusillus. However, due to our limited dataset, we were unable to evaluate interactions between sampling year and the fishing gear used, or to assess the environmental fac-tors affecting the shark distribution.

FEEDING ECOLOGY OF THE SMOOTH LANTERNSHARK • 309
SCI. MAR., 76(2), June 2012, 301-310. ISSN 0214-8358 doi: 10.3989/scimar.03540.07B
Longlines select for individuals in search of food (Hayward et al. 1989), whose stomachs are likely to be empty (Simpfendorfer 1998). This might be the cause of some of the statistical differences that we found between the gear types. However, longlines caught larger specimens than bottom trawling, and therefore the study was able to illustrate a clear change in the diet of the sharks as they grow (i.e. Crustacea in the diet of smaller E. pusillus and fish in the diet of larger E. pusillus). The main sources of bias in trawl-caught specimens are the lower selectivity of the gear (i.e. the gear catches a wide size range of organisms) and the possibility of sharks feeding inside the net. However, this gear type is less likely to select hungry specimens than longlines. Our study shows that trawling caught a wide range of sizes of E. pusillus, with less empty stomachs (5.7%), in comparison with longlines (nar-rower range of sizes of E. pusillus and 48.4% of indi-viduals with empty stomachs), which suggests that the E. pusillus caught by trawling included specimens that were hungry. As the prey found inside the stomachs of E. pusillus were at different stages of digestion (not necessarily fresh), it is likely that this shark does not feed substantially inside the net. We concluded that the two fishing gears used in this study are important for properly assessing the diet of deep-sea sharks because they allow sampling across the size distribution, which is necessary for comprehensively assessing the feeding ecology of any species. However, further research is needed in order to critically evaluate the diet of sharks according to sex and maturity condition at different spatial and temporal scales (Braccini et al. 2005), as the number of specimens analysed was not representative.
Implications of this study for the conservation of E. pusillus
E. pusillus can be caught easily, either by passive gears (such as longlines) or by active gears (such as trawling), and therefore conservation issues must be assessed. Since individuals of this species are never landed and are not listed in the fisheries statistics, it is extremely difficult to evaluate population changes and trends over time (Coelho and Erzini 2005, Coe-lho and Erzini 2007) and consequently to implement an effective conservation and management regime in the future (Coelho and Erzini 2007, Heithaus et al. 2008). Studies like the present one are vital in order to gather the baseline information necessary for the con-servation of these poorly understood sharks. We have shown that, even though E. pusillus is a mesopelagic/demersal predator, it uses various parts of the water column and is therefore not exclusively dependent on benthic resources. Moreover, it is advantageous that the main prey of E. pusillus have a low commercial value because the sharks do not actively compete with commercial fisheries for food resources. However, the versatile feeding habits of this species make it vulner-able to many gear types, and therefore it may need
more conservation efforts than species less likely to be caught as by-catch.
ACKNOWLEDGEMENTS
The authors would like to thank to Dr Margarida Cristo for her valuable help in identifying crustaceans. Dr José Xavier and Dr Rui Coelho were supported by the “FCT - Fundação para a Ciência e Tecnologia”, co-funded by “POCI-2010 - Programa Operacional Ciência e Inovação 2010” and “FSE - Fundo Social Europeu”.
REFERENCES
Alvarez R.Z. 1968. Crustáceos Decápodos Ibéricos. Consejo Supe-rior de Investigaciones Cient�ficas, Barcelona, 510 pp.
Assis C.A. 2000. Estudo Morfológico dos Otólitos Sagitta, Asteris-cus e Lapillus de Teleósteos (Actinopterygii, Teleostei) de Por-tugal Continental – Sua Aplicação em Estudos de Filogenia, Sistemática e Ecologia. Ph.D. thesis, Univ. Lisboa, 991 pp
Blaber S.J.M., Bulman C.M. 1987. Diets of fishes of the upper con-tinental slope of eastern Tasmânia: content, calorific values, di-etary overlap and trophic relationships. Mar. Biol. 95: 345-356.
Borges T.C., Erzini K., Bentes L., Costa M.E., Gonçalves J.M.S., Lino P.G., Pais C., Ribeiro J. 2001. By-catch and discarding practices in five Algarve (southern Portugal) métiers. J. Appl. Ichthyol. 17: 101-114.
Braccini J.M., Gillanders B.M., Walker T.I. 2005. Sources of varia-tion in the feeding ecology of the piked spurdog (Squalus mega-lops): implications for inferring predator-prey interactions from overall dietary composition. ICES J. Mar. Sci. 62: 1076-1094.
Cabral H.N., Murta A.G. 2002. The diet of blue whiting, hake, horse mackerel and mackerel off Portugal. J. Appl. Ichthyol. 18: 14-23.
Clarke M.R. 1986. A handbook for the identification of cephalopod beaks. Clarendon Press, Oxford, 273 pp.
Clarke K.R., Warwick R.M. 2001. Change in Marine Communities: An Approach to Statistical Analysis and Interpretation, 2nd Edi-tion. Natural Environment Research Council, Plymouth, 160 pp.
Coelho R., Erzini K. 2005. Length at first maturity of two species of lantern sharks (Etmopterus spinax and Etmopterus pusillus) of southern Portugal. J. Mar. Biol. Ass. U.K. 85: 1163-1165.
Coelho R., Erzini K. 2007. Population parameters of the smooth lantern shark, Etmopterus pusillus, in Southern Portugal (NE Atlantic). Fish. Res. 86: 42-57.
Coelho R., Erzini K. 2008a. Identification of deep water lantern sharks (Chondrichthyes: Etmopteridae) using morphometric data and multivariate analysis. J. Mar. Biol. Ass. U.K. 88: 199-204.
Coelho R., Erzini K. 2008b. Effects of fishing methods on deep water shark species caught as by-catch off southern Portugal. Hydrobiologia 606: 187-193.
Coelho R., Bentes L., Gonçalves J.M.S., Lino P.G., Ribeiro J., Erzini K. 2003. Reduction of elasmobranch by-catch in the hake semi-pelagic near bottom longline fishery in the Algarve (Southern Portugal). Fish. Sci. 69: 293-299.
Coelho R., Erzini K., Bentes L., Correia C., Lino P.G., Monteiro P., Ribeiro J., Gonçalves J.M.S. 2005. Semipelagic longline and trammel net elasmobranch catches in southern Portugal: catch composition, catch rates and discards. J. Northwest. Atl. Fish. Sci. 35: 531-537.
Cortés E., Gruber S.H. 1990. Diet, feeding habits and estimates of daily ration of young lemon sharks (Negaprion brevirostris). Copeia 1990: 204-218.
Cortés E. 1997. A critical review of methods of studying fish feed-ing based on analysis of stomach contents: application to elas-mobranch fishes. Can. J. Fish. Aquat. Sci. 54: 726-738.
Cortés E. 1999. Standardized diet compositions and trophic levels of sharks. ICES J. Mar. Sci. 56: 707-717.
Cotton C., Dyb D.E., Fossen I. 2005. Bottom-living top predators of the deep Atlantic: the sharks, skates, rays. World Wide Web

310 • J.C. XAVIER et al.
SCI. MAR., 76(2), June 2012, 301-310. ISSN 0214-8358 doi: 10.3989/scimar.03540.07B
Electronic publication. www.mar-eco.no.FAO. 2006. Universal software for fishery statistical time series.
Catches and landings 2006. FAO Fisheries Department, Fish-ery Information, Data and Statistics Unit, Rome.
Gibson C., Valenti S., Fordham S., Fowler S.L. 2008. The Con-servation of Northeast Atlantic Chondrichthyans: Report of the IUCN Shark Specialist Group Northeast Atlantic Red List Workshop. IUCN Species Survival Commission, Shark Special-ist Group, Newbury, 76 pp.
Hanchet, S. 1991. Diet of spiny dogfish, Squalus acanthias Lin-naeus, on the east coast, South Island, New Zealand. J. Fish Biol. 39: 313-323
Hantz M. 2003. Sharks - Rulers Of The Deep. Science Screen Re-port, Vol. 33: 1-2.
Hayward R.S., Margraf F.J., Knigth C.T., Glomski D.J. 1989. Gear bias in field estimation of the amount of food consumed by fish. Can. J. Fish. Aquat. Sci. 46: 874-876.
Heithaus M.R., Frid A., Wirsing A.J., Worm B. 2008. Predict-ing ecological consequences of marine top predator declines. Trends Ecol. Evol. 23: 202-210.
Hureau J.C. 1970. Biologie comparée de quelques poissons antarc-tiques. Bull. Inst. Oceanogr. Monaco 68: 1-244.
Karpouzi V.S., Stergiou K.I. 2003. The relationships between mouth size and shape and body length for 18 species of marine fishes and their trophic implications. J. Fish. Biol. 62: 1353-1365.
Lehodey P., Maury O. 2003. Global Ocean Ecosystem Dynamics: a core project of the International Geosphere-biosphere Pro-gramme. France.
Mauchline J., Gordon J.D.M. 1991. Oceanic pelagic prey of benthopelagic fish in the benthic boundary layer of a marginal oceanic region. Mar. Ecol. Prog. Ser. 74: 109-115.
Monteiro P., Araujo A., Erzini K., Castro M. 2001. Discards of the Algarve (southern Portugal) crustacean trawl fishery. Hydro-biologia 449: 267-277.
Moore J.A., Mace P.M. 1999. Challenges and prospects for deep-sea finfish fisheries. Fisheries 24: 22-23.
Myrberg A.A., Gruber S.H. 1974. The Behavior of the bonnethead shark, Sphyrna tiburo. Copeia 1974: 358-374.
Neiva J., Coelho R., Erzini K. 2006. Feeding habits of velvet belly lanternshark Etmopterus spinax (Chondrichthyes: Etmopteri-dae) off Algarve, southern Portugal. J. Mar. Biol. Ass. U.K. 86: 835-841.
Pais C. 2002. Diet of a deep-sea fish, Hoplostethus mediterraneus, from the south coast of Portugal. J. Mar. Biol. Ass. U.K. 82: 351-352.
Pauly D., Christensen V., Dalsgaard J., Froese R., Torres Jr. F. 1998. Fishing down marine food webs. Science 279: 860-863.
Sá R., Bexiga C., Veiga P., Vieira L., Erzini K. 2006. Feeding ecology and trophic relationships of fish species in the lower Guadiana River Estuary and Castro Marim e Vila Real de Santo
Ant�nio Salt Marsh. Est. Coast. Shelf Sci. 70: 19-26.Saldanha L. 1995. Fauna Submarina Atlântica. Publicações Europa
– América, Mem Martins, 364 pp.Santos J., Borges T.C. 2001. Trophic relationships in deep-water
fish communities off Algarve, Portugal. Fish. Res. 51: 337-341.Shannon C., Weaver W. 1949. The Mathematical Theory of Commu-
nication. Urbana: University of Illinois Press, CIDADE, 117 pp.Simpfendorfer C.A. 1998. Diet of the Australian sharpnose shark,
Rhizoprionodon taylori, from northern Queensland. Mar. Freshw. Res. 49: 757-761.
Sims D.W. 2005. Differences in habitat selection and reproduc-tive strategies of male and female sharks. In: Ruckstuhl K.E., Neuhaus P. (eds.), Sexual Segregation in Vertebrates - Ecology of the Two Sexes. Cambridge University Press, Cambridge, pp. 127-147.
Sims D.W., Quayle V.A. 1998. Selective foraging behavior of bask-ing sharks on zooplankton in a small-scale front. Nature 393: 460-464.
Sims D.W., Wearmouth V.J., Southall E.J., Hill J., Moore P., Rawl-inson K., Hutchinson N., Budd G.C., Righton D., Metcalfe J.D., Nash J.P., Morritt D. 2006. Hunt warm, rest cool: bioenergetic strategy underlying diel vertical migration of a benthic shark. J. Anim. Ecol. 75: 176-190.
Springer S. 1967. Social organization of shark population. In: Gil-bert P.W., Mathewson R.F., Rall D.P. (eds.), Sharks, Skates, and Rays. Johns Hopkins Press, Baltimore, pp. 149-174.
Stevens J.D., Bonfil R., Dulvy N.K., Walker P.A. 2000. The effects of fishing on sharks, rays, and chimaeras (chondrichthyans), and the implications for marine ecosystems. ICES J. Mar. Sci. 57: 476-494.
Wetherbee B.M., Cortés E. 2004. Food consumption and feeding habits. In: Carrier J.C., Musick J.A., Heithaus M.R. (eds.), Biol-ogy of Sharks and Their Relatives. CRC Press, New York, pp. 225-246.
Whitehead P.J., Bauchot M.L., Hureau J.C., Nielsen J., Tortonese E. 1986. Fishes of the North-Eastern Atlantic and the Mediter-ranean, Vols. I-III. UNESCO, Paris. 1473 pp.
Xavier J.C., Cherel Y., Assis C.A., Sendão J., Borges T.C. 2010. The feeding ecology of Conger eels (Conger conger) in the North-east Atlantic. J. Mar. Biol. Ass. U.K. 90: 493-501.
Xavier J. C., Croxall J. P., Cresswell K. A. 2005. Boluses: a simple, cost-effective diet method to assess the cephalopod prey of al-batrosses? Auk 122: 1182-1190
Yamamura O., Inada I. 2001. Importance of micronekton as food of demersal fish assemblages. Bull. Mar. Sci. 68: 13-25.
Scient. ed.: E. Massut�.Guest ed.: G. Morey.Received November 11, 2011. Accepted November 29, 2011.Published online May 7, 2012.