Failure factors of small software projects at a global outsourcing marketplace
13
The Journal of Systems and Software 92 (2014) 157–169 Contents lists available at ScienceDirect The Journal of Systems and Software j ourna l ho mepage: www.elsevier.com/locate/jss Failure factors of small software projects at a global outsourcing marketplace Magne Jørgensen ∗ Simula Research Laboratory and University of Oslo, P.O. Box 134, NO-1325 Lysaker, Norway a r t i c l e i n f o Article history: Received 2 July 2013 Received in revised form 22 January 2014 Accepted 23 January 2014 Available online 3 February 2014 Keywords: Outsourcing Project failures Risk management a b s t r a c t The presented study aims at a better understanding of when and why small-scale software projects at a global outsourcing marketplace fail. The analysis is based on a data set of 785,325 projects/tasks completed at vWorker.com. A binary logistic regression model relying solely on information known at the time of a project’s start-up correctly predicted 74% of the project failures and 67% of the non-failures. The model-predicted failure probability corresponded well with the actual frequencies of failures for most levels of failure risk. The model suggests that the factors connected to the strongest reduction in the risk of failure are related to previous collaboration between the client and the provider and a low failure rate of previous projects completed by the provider. We found the characteristics of the client to be almost as important as those of the provider in explaining project failures and that the risk of project failure increased with an increased client emphasis on low price and with an increased project size. The identified relationships seem to be reasonable stable across the studied project size categories. © 2014 Elsevier Inc. All rights reserved. 1. Introduction A great deal of resources are spent on software projects that fail to deliver useful functionality. For example, the proportion of started and then cancelled projects, sometimes termed “aborted” or “abandoned” projects, is reported to be 9% (Sauer et al., 2007), 11% (Tichy and Bascom, 2008), and 11.5% (El Emam and Koru, 2008). Several non-peer reviewed reports claim a much higher proportion of cancelled software projects, but may be less reliable or less rep- resentative of the population of software projects. The frequently cited Standish Group Chaos Report (1995), for example, claims that as many as 31% of all software projects get cancelled. The low reliability of that report is discussed in (Jørgensen and Moløkken- Østvold, 2006; Eveleens and Verhoef, 2010). While the cancellation rates described in the Standish Group Chaos Reports and similar non-peer reviewed surveys are likely to be exaggerated, there is no doubt that the proportion of cancelled projects is substantial. The definition of a failed project in software surveys typically includes both cancelled projects and projects completed with a very poor product or process quality. Consequently, the reported fail- ure rates appear higher than the corresponding cancellation rates. Exactly how much higher depends on the failure criteria used. For example, El Emam and Koru (2008) categorized a project as having failed if it received a score of “poor” or “fair” in four out of five of ∗ Tel.: +47 924 333 55. E-mail address: [email protected] the following performance criteria: user satisfaction, ability to meet budget targets, ability to meet schedule targets, product quality and staff productivity. This definition led to a failure rate of more than twice the cancellation rate for the same set of projects, i.e., a failure rate of 26% for the data set reporting a cancellation rate of 11.5%. Defining every project that does not deliver the specified product, is over budget, or is not on time as a failure, as is the case in several reports, typically amounts to 50–80% of all software projects being failures. For an overview of software failure surveys see (Hashmi and Stevrin, 2009). The challenge of defining project failures meaningfully is fur- ther illustrated in (Boehm, 2000), where Barry Boehm makes the reasonable claim that not all cancellations should be considered to be failures. There may, for example, be good reasons for cancelling a well-managed project if the project’s original assumptions of use- fulness are no longer valid. In that case, the failure would clearly be to continue a project that is no longer needed instead of cancelling it. A similar problem may occur when a project is interpreted as a failure because it delivers something other than what was origi- nally specified or expected. There are development processes, e.g., agile methods, in which requirements are meant to evolve as part of the learning process and, clearly, it would be meaningless to define the learning process leading to change in requirements as indicat- ing a failure. It may also be important to separate a project failure from a product failure, see for example (Baccarini, 1999). Finally, there may be differences in the failure perspectives of different project stakeholders, which also lead to different interpretations of whether a project has failed or not (Agarwal and Rathod, 2006). 0164-1212/$ – see front matter © 2014 Elsevier Inc. All rights reserved. http://dx.doi.org/10.1016/j.jss.2014.01.034
-
Upload
independent -
Category
Documents
-
view
5 -
download
0
Transcript of Failure factors of small software projects at a global outsourcing marketplace

Fm
MS
a
ARRAA
KOPR
1
fso1SorcarØrnd
ipuEef
0h
The Journal of Systems and Software 92 (2014) 157–169
Contents lists available at ScienceDirect
The Journal of Systems and Software
j ourna l ho mepage: www.elsev ier .com/ locate / j ss
ailure factors of small software projects at a global outsourcingarketplace
agne Jørgensen ∗
imula Research Laboratory and University of Oslo, P.O. Box 134, NO-1325 Lysaker, Norway
r t i c l e i n f o
rticle history:eceived 2 July 2013eceived in revised form 22 January 2014ccepted 23 January 2014vailable online 3 February 2014
a b s t r a c t
The presented study aims at a better understanding of when and why small-scale software projectsat a global outsourcing marketplace fail. The analysis is based on a data set of 785,325 projects/taskscompleted at vWorker.com. A binary logistic regression model relying solely on information known atthe time of a project’s start-up correctly predicted 74% of the project failures and 67% of the non-failures.The model-predicted failure probability corresponded well with the actual frequencies of failures for
eywords:utsourcingroject failuresisk management
most levels of failure risk. The model suggests that the factors connected to the strongest reduction inthe risk of failure are related to previous collaboration between the client and the provider and a lowfailure rate of previous projects completed by the provider. We found the characteristics of the client tobe almost as important as those of the provider in explaining project failures and that the risk of projectfailure increased with an increased client emphasis on low price and with an increased project size. Theidentified relationships seem to be reasonable stable across the studied project size categories.
. Introduction
A great deal of resources are spent on software projects thatail to deliver useful functionality. For example, the proportion oftarted and then cancelled projects, sometimes termed “aborted”r “abandoned” projects, is reported to be 9% (Sauer et al., 2007),1% (Tichy and Bascom, 2008), and 11.5% (El Emam and Koru, 2008).everal non-peer reviewed reports claim a much higher proportionf cancelled software projects, but may be less reliable or less rep-esentative of the population of software projects. The frequentlyited Standish Group Chaos Report (1995), for example, claims thats many as 31% of all software projects get cancelled. The loweliability of that report is discussed in (Jørgensen and Moløkken-stvold, 2006; Eveleens and Verhoef, 2010). While the cancellation
ates described in the Standish Group Chaos Reports and similaron-peer reviewed surveys are likely to be exaggerated, there is nooubt that the proportion of cancelled projects is substantial.
The definition of a failed project in software surveys typicallyncludes both cancelled projects and projects completed with a veryoor product or process quality. Consequently, the reported fail-re rates appear higher than the corresponding cancellation rates.
xactly how much higher depends on the failure criteria used. Forxample, El Emam and Koru (2008) categorized a project as havingailed if it received a score of “poor” or “fair” in four out of five of∗ Tel.: +47 924 333 55.E-mail address: [email protected]
164-1212/$ – see front matter © 2014 Elsevier Inc. All rights reserved.ttp://dx.doi.org/10.1016/j.jss.2014.01.034
© 2014 Elsevier Inc. All rights reserved.
the following performance criteria: user satisfaction, ability to meetbudget targets, ability to meet schedule targets, product quality andstaff productivity. This definition led to a failure rate of more thantwice the cancellation rate for the same set of projects, i.e., a failurerate of 26% for the data set reporting a cancellation rate of 11.5%.Defining every project that does not deliver the specified product,is over budget, or is not on time as a failure, as is the case in severalreports, typically amounts to 50–80% of all software projects beingfailures. For an overview of software failure surveys see (Hashmiand Stevrin, 2009).
The challenge of defining project failures meaningfully is fur-ther illustrated in (Boehm, 2000), where Barry Boehm makes thereasonable claim that not all cancellations should be considered tobe failures. There may, for example, be good reasons for cancellinga well-managed project if the project’s original assumptions of use-fulness are no longer valid. In that case, the failure would clearly beto continue a project that is no longer needed instead of cancellingit. A similar problem may occur when a project is interpreted asa failure because it delivers something other than what was origi-nally specified or expected. There are development processes, e.g.,agile methods, in which requirements are meant to evolve as part ofthe learning process and, clearly, it would be meaningless to definethe learning process leading to change in requirements as indicat-ing a failure. It may also be important to separate a project failure
from a product failure, see for example (Baccarini, 1999). Finally,there may be differences in the failure perspectives of differentproject stakeholders, which also lead to different interpretationsof whether a project has failed or not (Agarwal and Rathod, 2006).
1 tems a
dsoltto
fsitcFSe
ftkttidaepumtttmotsrstt
fthiha
tppdll
2
7tmpac
58 M. Jørgensen / The Journal of Sys
In spite of the problems with providing a commonly acceptedefinition of project failures, there is little doubt that there are manyituations where resources can be saved by reducing the numberf projects that do not deliver anything, deliver a product muchater than expected, or deliver a product that is not useful at all forhe client. Not only is the direct waste of project resources likelyo be substantial, but also the indirect waste such as lost businesspportunities.
The importance of reducing the waste of resources on projectailures motivates the high number of studies concerning the rea-ons for project failures, and methods to reduce failure rates. Thisncludes several studies surveying what the stakeholders, such ashe software developers, project managers, clients and users, per-eive are the main failure and success factors of software projects.or lists of such perceived factors see for example (Linberg, 1999;chmidt et al., 2001; Charette, 2005; Fabriek et al., 2008; Vernert al., 2008; Al-Ahmad et al., 2009).
The study presented in this paper differs, to our knowledge,rom previous studies on project failures on the following charac-eristics: (i) It focuses on the effects of the potential failure factorsnown at the time of the project start-up, (ii) It uses only observa-ional data and not perceived project failures, and (iii) It focuses onhe, typically very small, projects conducted at a global outsourc-ng marketplace. While there are other studies that use projectata to predict failures based on project characteristics (Wohlinnd Andrews, 2001; Mizuno et al., 2004; Cerpa et al., 2010; Egorovat al., 2010), these studies do not restrict the prediction of the risk ofroject failure to observable variables known at the project start-p. The use of the variables known at start-up makes the modelore useful for practical settings. By the time it is possible to know
hat the project plan is poor or the problem complexity is higherhan expected, it may already be too late to take the proper actiono avoid project problems and reduce the risk of failure. Prediction
odels using variables known at the project start-up may, amongstthers, allow a client to get input related to an expected increase inhe failure risk when emphasizing a lower price rather than higherkills when selecting a provider for the project. On the other hand,estricting a prediction model to variables observed at the projecttart-up means that the model will not be as accurate as modelshat include project failure variables known at much later stages inhe development process.
The goal of our study is not only to predict the risk of projectailure, in the context of a global outsourcing marketplace, at theime of project start-up, but also to better understand when weave a context that is more likely to result in project failure. This
mproved understanding may be used to avoid situations with aigh risk of failure, or if that is not possible, to give risk reducingctions a high priority in high-risk situations.
The remaining part of this paper is organized as follows: Sec-ion 2 describes the project database we used to build the model ofroject failure. Section 3 defines the model variables, describes therocess of building the model, evaluates the accuracy of the pre-iction model and discusses the factors connected with higher or
ower risks of project failure. Section 4 contains a discussion of theimitations of the analyses. Section 5 concludes.
. The project database
The dataset we used to develop the prediction model consists of85,325 small-scale software projects. The clients and providers ofhese projects have been using the services of vWorker.com (now
erged with freelancer.com), which is a web-based global market-lace that connects software clients and providers. The providersre typically single software developers or smaller outsourcingompanies located in low-cost countries, but include developers
nd Software 92 (2014) 157–169
and companies from high-cost countries as well. There are also afew larger companies that use this marketplace, in addition to otherchannels, to find work for their employees. The services offered bythe vWorker.com marketplace include:
• The means for clients to search for and invite project bids fromproviders with appropriate skills, e.g., Java, php, and SQL.
• Support for providers to place bids on a project.• Arrangements that ensure that the provider is paid when the
work is completed, and that the client does not have to pay ifthe work is of too low quality.
• Processes for managing disagreements/negotiations between theclients and the providers regarding payments or quality of work(arbitration processes).
• Skill tests of the providers.• Evaluations of provider performances from previous projects
through the presentation of aggregated and project specific infor-mation about client satisfaction and project cancellations.
• Evaluations of client performances from previous projectsthrough the presentation of aggregated and project specific infor-mation about providers’ satisfaction and project cancellations.
Typically, the providers and the clients never physically meetand conduct all of their communication through the functionalityprovided by vWorker.com, or other internet-based communica-tion.
The characteristics of the data set of the vWorker.com projectsthat we used in this study include:
• Project data registered between May 2001 and October 2012.• Number of projects: 785,325.• Number of bids placed: 4,791,067.• Mean number of bids per project: 6.1.• Proportion of cancelled projects: 11.1%.• Proportion of projects that were either cancelled or the provider
received a client satisfaction rating of “poor” or worse: 14.0%(these are the projects we categorized as failed, see Section 3).Notice that a cancelled project either had no satisfaction score ora satisfaction score of “poor” or worse.
• Average provider pass rate on skill tests: 64%.• Number of different provider nationalities: 187.• The ten largest provider countries (sorted by decreasing number
of projects): India, US, Romania, Pakistan, UK, Russia, Ukraine,Canada, Bangladesh, and the Philippines. Some of the providerslocated in high-cost countries seemed to use developers fromlow-cost countries, i.e., the provider country is not always as itseems from the vWorker.com presentation of a country.
• Number of different client nationalities: 177.• The ten largest client countries (sorted by decreasing number of
projects): US (with more than 50% of the projects), UK, Australia,Canada, India, Germany, the Netherlands, Israel, Sweden, andFrance.
• Proportion of projects where the client and provider are locatedin different countries: 90%.
• Proportion of projects where the client and provider have collab-orated previously using vWorker.com: 43%.
• Price range of projects: 1–30,000 USD, with a mean of 146 USD,i.e., most projects are very small. Nearly all projects are based ona fixed-price contract between the client and the provider.
As can be seen from the above information, this data set includesa high number of projects, but the projects are, on average, very
small. Based on personal experience with several of the companieson vWorker.com, we experience that a typical rate per work-houris 10–20 USD, which means that the average project or task effort islikely to be only about 10 work-hours. Where there is, we believe,
tems a
vaatfittaoo
3
tfipptdtbedrtesimoOs
tol(wmo
3
dsursttttTv
•
M. Jørgensen / The Journal of Sys
alue in understanding failure factors in smaller software projectsnd tasks, the small size of the projects clearly affects the gener-lizability of the results, e.g., to other outsourcing context. Whilehere is evidence providing some support of a generalization of thendings from our data set to larger projects, especially the findinghat the failure factors of the smallest projects did not differ fromhose of projects larger than 1000 USD (see Section 4), such gener-lizations will rest on assumptions hard to fully validate as part ofur study. In short, our data do mainly generalize to similar globalutsourcing marketplaces with small-scale projects.
. Modelling project failure
We use project data from 2001 to 2008 to build a binary logis-ic regression model (Wonnacott and Wonnacott, 1990) of projectailure, and refer to this data set as the learning data set. The learn-ng data set includes 437,278 projects, which is 56% of the totalroject data. The data from 2009 to 2012, which included 348,047rojects, is termed the evaluation data set, and is used to assesshe prediction accuracy of the regression model. The evaluationata set is also used to assess the robustness of the model, i.e.,o see how the odds ratios of the models change from a modelased on the learning data set (2001–2008) to one based on thevaluation data set (2009–2012). This chronological splitting of theata to build and evaluate the model reflects the fact that it is onlyealistic to use projects completed before the ones to be predictedo build a prediction model. There are several options for mod-lling the relationship between project characteristics and failure,ee for example the use of Bayesian models and genetic algorithmsn (Reyes et al., 2011). We chose to use a binary logistic regression
odel due to the, relatively speaking, simpler interpretation of thedds ratios compared to the model parameters of the alternatives.ur approach is similar to that used in (Takagi et al., 2005) to predict
oftware project failure.The remaining part of this section describes the variables used in
he model (Section 3.1), the binary logistic regression model devel-ped and its fit to the learning data set (Section 3.2), the analysiseading to the chosen cut-off point for predicting project failuresSection 3.3), the evaluation of the prediction accuracy of the modelhen applied to the evaluation data set (Section 3.4), the use of theodel to explain project failure (Section 3.5), and a comparison of
ur results to the results of related studies (Section 3.6).
.1. The variables of the model
We emphasized the inclusion of variables expected to have airect or indirect causal connection to project failure. The empha-is on causally connected variables is motivated by our wish tose the model not only to predict, but also to understand essentialelationships in software outsourcing. In addition, a model empha-izing causally relevant variables may be more robust with respecto over-fitting to the learning data set. The variable we try to predicthrough our model, i.e., the dependent variable, is the outcome ofhe project in terms of whether or not the project failed to deliverhe expected functionality. This variable is defined in Section 3.1.1.he variables used to predict project failure, i.e., the independentariables, are related to the following four aspects of the projects:
The skill of the provider, as indicated by the mean client sat-isfaction score from previously started projects, failure rate of
previously started projects, and pass rate on skill tests at the timeof the current project’s start-up (for definitions of the providerskill variables see Section 3.1.2). We hypothesize that increasedprovider skill reduces the likelihood of project failure.nd Software 92 (2014) 157–169 159
• The skill of the client, as indicated by provider satisfaction scoresfrom previously started projects and failure rate of previouslystarted projects (for definitions of the client skill variables seeSection 3.1.3). We hypothesize that increased client skill reducesthe likelihood of project failure. Including the skill variables ofboth the provider and client, we hoped, would enable us to com-pare the relative importance of the provider and client skills inpredicting and explaining project failure.
• Collaboration aspects, as indicated by previous collaborationsbetween the client and the provider, geographical distancebetween the client and the provider, and the client’s focus on lowprice when selecting between providers for the current project(for the definitions of the collaboration characteristic variablessee Section 3.1.4). We hypothesize that previous collaborations, ageographical closeness between the client and provider regions,and less focus on low price during the selection of a providerdecreases the likelihood of project failure. In addition, we hypoth-esize that there are geographical regions of providers and clientswith an increased likelihood of project failure.
• Project size, as indicated by the bid price of the selected providerfor the current project (for a definition of the project size variablesee Section 3.1.5). We hypothesize that the failure rate increaseswith the increased size of a project.
For most of the variables, we transfer a ratio or ordinal scalemeasurement into a nominal scale (category-based) variable. Wedo this to ease the analyses, to ease the interpretation of the oddsratios and to enable the inclusion of the category value “no value.”The inclusion of the value “no value” is essential for several of thevariables, e.g., to separate those clients and providers with no pre-vious project experience (and consequently no failure rate) fromthose with high or low failure rates on previous projects. Noticethat these categories are not categories of missing or unknown val-ues, but rather the introduction of dummy variables telling whethera client or provider have received satisfaction scores or not, startedany project or not, or completed skill tests or not.
A nominal scaled variable with broad categories may also be use-ful in a situation where smaller changes in the variable values donot necessarily reflect changes in the underlying phenomenon wewant to model. This may be the case for several of the included vari-ables, such as those related to the satisfaction levels of the providersand clients. We typically use the median value of a ratio or ordi-nal scale variable as the threshold value for the separation into a“low” or “high” category value due to skewed distributions and thegoal to include an equal number of observations in each category.The threshold value for determining the “low” and “high” cate-gories is based on the learning sample projects only, to preservethe chronologic separation of the learning and evaluation data set.
Our selection of variables is limited to those provided by thevWorker.com database. There are many other variables potentiallyconnected to project failure, such as the choice of developmentmethod, the complexity of the software to be developed and thetime pressure. The coefficient of the regression models may beaffected by the omission of these variables. While this may not bea problem for the prediction model, the explanatory model shouldfor this reason be interpreted with care.
3.1.1. Project failureWe categorized a project as failed when it was started, but not
completed (a cancelled project), or had a client satisfaction score of3 (“poor”) or lower (more on this score in Section 3.1.2). Otherwise aproject was categorized as not failed (Table 1). The threshold client
satisfaction score of 3 was selected because the marketplace itself(vWorker.com) instructs the clients to use this value to indicatea project failure. The majority of the projects (about 80%) that arecategorized as failed are cancelled projects. Most cancelled projects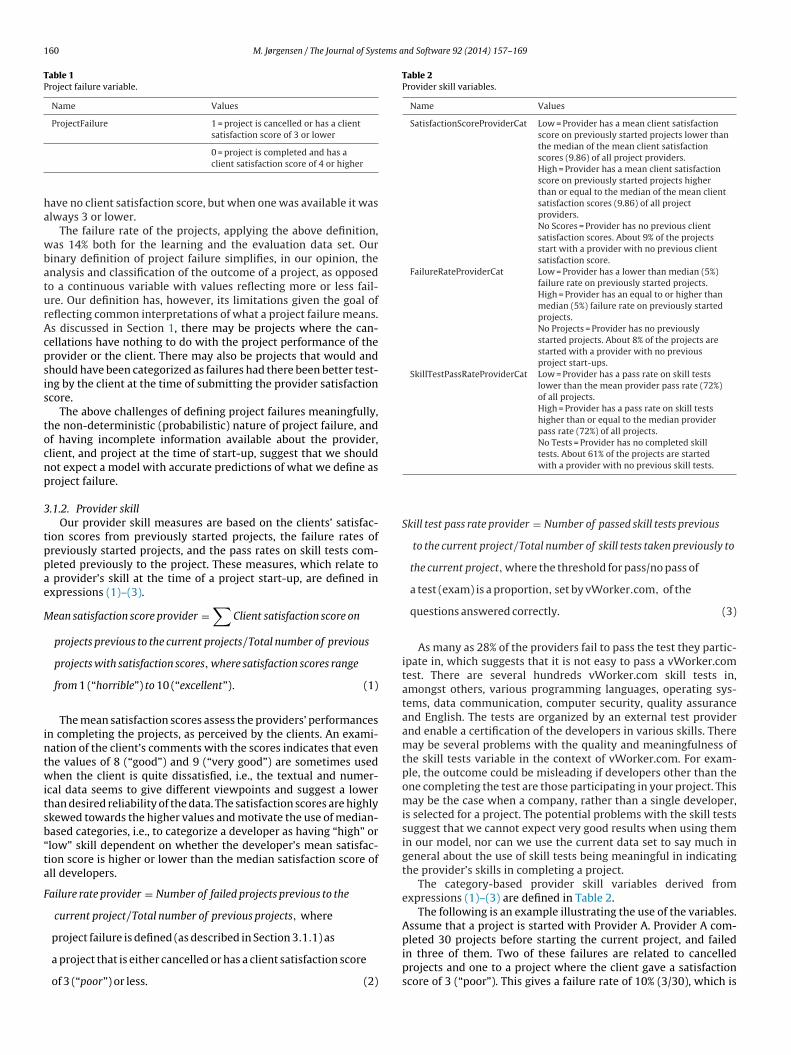
160 M. Jørgensen / The Journal of Systems and Software 92 (2014) 157–169
Table 1Project failure variable.
Name Values
ProjectFailure 1 = project is cancelled or has a clientsatisfaction score of 3 or lower
ha
wbaturAcpsis
tocnp
3
tppae
M
intwitsb“ta
F
Table 2Provider skill variables.
Name Values
SatisfactionScoreProviderCat Low = Provider has a mean client satisfactionscore on previously started projects lower thanthe median of the mean client satisfactionscores (9.86) of all project providers.High = Provider has a mean client satisfactionscore on previously started projects higherthan or equal to the median of the mean clientsatisfaction scores (9.86) of all projectproviders.No Scores = Provider has no previous clientsatisfaction scores. About 9% of the projectsstart with a provider with no previous clientsatisfaction score.
FailureRateProviderCat Low = Provider has a lower than median (5%)failure rate on previously started projects.High = Provider has an equal to or higher thanmedian (5%) failure rate on previously startedprojects.No Projects = Provider has no previouslystarted projects. About 8% of the projects arestarted with a provider with no previousproject start-ups.
SkillTestPassRateProviderCat Low = Provider has a pass rate on skill testslower than the mean provider pass rate (72%)of all projects.High = Provider has a pass rate on skill testshigher than or equal to the median providerpass rate (72%) of all projects.No Tests = Provider has no completed skill
0 = project is completed and has aclient satisfaction score of 4 or higher
ave no client satisfaction score, but when one was available it waslways 3 or lower.
The failure rate of the projects, applying the above definition,as 14% both for the learning and the evaluation data set. Our
inary definition of project failure simplifies, in our opinion, thenalysis and classification of the outcome of a project, as opposedo a continuous variable with values reflecting more or less fail-re. Our definition has, however, its limitations given the goal ofeflecting common interpretations of what a project failure means.s discussed in Section 1, there may be projects where the can-ellations have nothing to do with the project performance of therovider or the client. There may also be projects that would andhould have been categorized as failures had there been better test-ng by the client at the time of submitting the provider satisfactioncore.
The above challenges of defining project failures meaningfully,he non-deterministic (probabilistic) nature of project failure, andf having incomplete information available about the provider,lient, and project at the time of start-up, suggest that we shouldot expect a model with accurate predictions of what we define asroject failure.
.1.2. Provider skillOur provider skill measures are based on the clients’ satisfac-
ion scores from previously started projects, the failure rates ofreviously started projects, and the pass rates on skill tests com-leted previously to the project. These measures, which relate to
provider’s skill at the time of a project start-up, are defined inxpressions (1)–(3).
ean satisfaction score provider =∑
Client satisfaction score on
projects previous to the current projects/Total number of previous
projects with satisfaction scores, where satisfaction scores range
from 1 (“horrible”) to 10 (“excellent”). (1)
The mean satisfaction scores assess the providers’ performancesn completing the projects, as perceived by the clients. An exami-ation of the client’s comments with the scores indicates that evenhe values of 8 (“good”) and 9 (“very good”) are sometimes usedhen the client is quite dissatisfied, i.e., the textual and numer-
cal data seems to give different viewpoints and suggest a lowerhan desired reliability of the data. The satisfaction scores are highlykewed towards the higher values and motivate the use of median-ased categories, i.e., to categorize a developer as having “high” orlow” skill dependent on whether the developer’s mean satisfac-ion score is higher or lower than the median satisfaction score ofll developers.
ailure rate provider = Number of failed projects previous to the
current project/Total number of previous projects, where
project failure is defined (as described in Section 3.1.1) as
a project that is either cancelled or has a client satisfaction score
of 3 (“poor”) or less. (2)
tests. About 61% of the projects are startedwith a provider with no previous skill tests.
Skill test pass rate provider = Number of passed skill tests previous
to the current project/Total number of skill tests taken previously to
the current project, where the threshold for pass/no pass of
a test (exam) is a proportion, set by vWorker.com, of the
questions answered correctly. (3)
As many as 28% of the providers fail to pass the test they partic-ipate in, which suggests that it is not easy to pass a vWorker.comtest. There are several hundreds vWorker.com skill tests in,amongst others, various programming languages, operating sys-tems, data communication, computer security, quality assuranceand English. The tests are organized by an external test providerand enable a certification of the developers in various skills. Theremay be several problems with the quality and meaningfulness ofthe skill tests variable in the context of vWorker.com. For exam-ple, the outcome could be misleading if developers other than theone completing the test are those participating in your project. Thismay be the case when a company, rather than a single developer,is selected for a project. The potential problems with the skill testssuggest that we cannot expect very good results when using themin our model, nor can we use the current data set to say much ingeneral about the use of skill tests being meaningful in indicatingthe provider’s skills in completing a project.
The category-based provider skill variables derived fromexpressions (1)–(3) are defined in Table 2.
The following is an example illustrating the use of the variables.Assume that a project is started with Provider A. Provider A com-
pleted 30 projects before starting the current project, and failedin three of them. Two of these failures are related to cancelledprojects and one to a project where the client gave a satisfactionscore of 3 (“poor”). This gives a failure rate of 10% (3/30), which is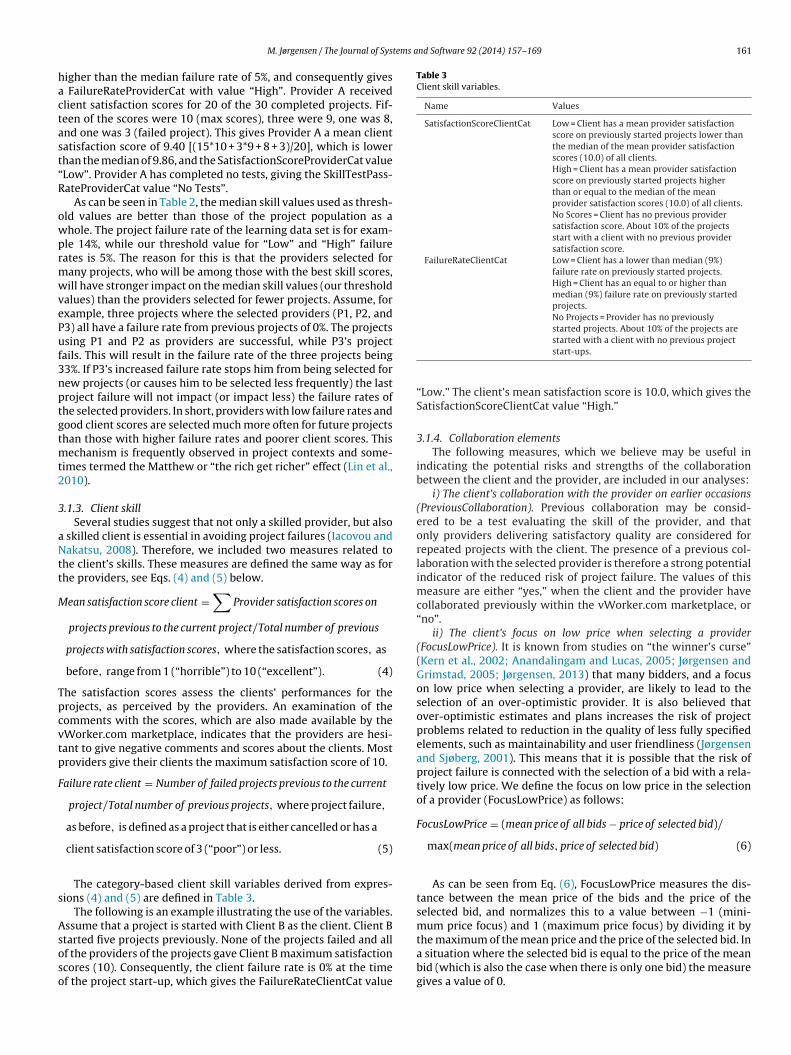
tems and Software 92 (2014) 157–169 161
hactast“R
owprmwvePuf3nptgtmt2
3
aNtt
M
Tpcvtp
F
s
Asoso
Table 3Client skill variables.
Name Values
SatisfactionScoreClientCat Low = Client has a mean provider satisfactionscore on previously started projects lower thanthe median of the mean provider satisfactionscores (10.0) of all clients.High = Client has a mean provider satisfactionscore on previously started projects higherthan or equal to the median of the meanprovider satisfaction scores (10.0) of all clients.No Scores = Client has no previous providersatisfaction score. About 10% of the projectsstart with a client with no previous providersatisfaction score.
FailureRateClientCat Low = Client has a lower than median (9%)failure rate on previously started projects.High = Client has an equal to or higher thanmedian (9%) failure rate on previously startedprojects.No Projects = Provider has no previouslystarted projects. About 10% of the projects are
M. Jørgensen / The Journal of Sys
igher than the median failure rate of 5%, and consequently gives FailureRateProviderCat with value “High”. Provider A receivedlient satisfaction scores for 20 of the 30 completed projects. Fif-een of the scores were 10 (max scores), three were 9, one was 8,nd one was 3 (failed project). This gives Provider A a mean clientatisfaction score of 9.40 [(15*10 + 3*9 + 8 + 3)/20], which is lowerhan the median of 9.86, and the SatisfactionScoreProviderCat valueLow”. Provider A has completed no tests, giving the SkillTestPass-ateProviderCat value “No Tests”.
As can be seen in Table 2, the median skill values used as thresh-ld values are better than those of the project population as ahole. The project failure rate of the learning data set is for exam-le 14%, while our threshold value for “Low” and “High” failureates is 5%. The reason for this is that the providers selected forany projects, who will be among those with the best skill scores,ill have stronger impact on the median skill values (our threshold
alues) than the providers selected for fewer projects. Assume, forxample, three projects where the selected providers (P1, P2, and3) all have a failure rate from previous projects of 0%. The projectssing P1 and P2 as providers are successful, while P3’s projectails. This will result in the failure rate of the three projects being3%. If P3’s increased failure rate stops him from being selected forew projects (or causes him to be selected less frequently) the lastroject failure will not impact (or impact less) the failure rates ofhe selected providers. In short, providers with low failure rates andood client scores are selected much more often for future projectshan those with higher failure rates and poorer client scores. This
echanism is frequently observed in project contexts and some-imes termed the Matthew or “the rich get richer” effect (Lin et al.,010).
.1.3. Client skillSeveral studies suggest that not only a skilled provider, but also
skilled client is essential in avoiding project failures (Iacovou andakatsu, 2008). Therefore, we included two measures related to
he client’s skills. These measures are defined the same way as forhe providers, see Eqs. (4) and (5) below.
ean satisfaction score client =∑
Provider satisfaction scores on
projects previous to the current project/Total number of previous
projects with satisfaction scores, where the satisfaction scores, as
before, range from 1 (“horrible”) to 10 (“excellent”). (4)
he satisfaction scores assess the clients’ performances for therojects, as perceived by the providers. An examination of theomments with the scores, which are also made available by theWorker.com marketplace, indicates that the providers are hesi-ant to give negative comments and scores about the clients. Mostroviders give their clients the maximum satisfaction score of 10.
ailure rate client = Number of failed projects previous to the current
project/Total number of previous projects, where project failure,
as before, is defined as a project that is either cancelled or has a
client satisfaction score of 3 (“poor”) or less. (5)
The category-based client skill variables derived from expres-ions (4) and (5) are defined in Table 3.
The following is an example illustrating the use of the variables.ssume that a project is started with Client B as the client. Client B
tarted five projects previously. None of the projects failed and allf the providers of the projects gave Client B maximum satisfactioncores (10). Consequently, the client failure rate is 0% at the timef the project start-up, which gives the FailureRateClientCat valuestarted with a client with no previous projectstart-ups.
“Low.” The client’s mean satisfaction score is 10.0, which gives theSatisfactionScoreClientCat value “High.”
3.1.4. Collaboration elementsThe following measures, which we believe may be useful in
indicating the potential risks and strengths of the collaborationbetween the client and the provider, are included in our analyses:
i) The client’s collaboration with the provider on earlier occasions(PreviousCollaboration). Previous collaboration may be consid-ered to be a test evaluating the skill of the provider, and thatonly providers delivering satisfactory quality are considered forrepeated projects with the client. The presence of a previous col-laboration with the selected provider is therefore a strong potentialindicator of the reduced risk of project failure. The values of thismeasure are either “yes,” when the client and the provider havecollaborated previously within the vWorker.com marketplace, or“no”.
ii) The client’s focus on low price when selecting a provider(FocusLowPrice). It is known from studies on “the winner’s curse”(Kern et al., 2002; Anandalingam and Lucas, 2005; Jørgensen andGrimstad, 2005; Jørgensen, 2013) that many bidders, and a focuson low price when selecting a provider, are likely to lead to theselection of an over-optimistic provider. It is also believed thatover-optimistic estimates and plans increases the risk of projectproblems related to reduction in the quality of less fully specifiedelements, such as maintainability and user friendliness (Jørgensenand Sjøberg, 2001). This means that it is possible that the risk ofproject failure is connected with the selection of a bid with a rela-tively low price. We define the focus on low price in the selectionof a provider (FocusLowPrice) as follows:
FocusLowPrice = (mean price of all bids − price of selected bid)/
max(mean price of all bids, price of selected bid) (6)
As can be seen from Eq. (6), FocusLowPrice measures the dis-tance between the mean price of the bids and the price of theselected bid, and normalizes this to a value between −1 (mini-mum price focus) and 1 (maximum price focus) by dividing it by
the maximum of the mean price and the price of the selected bid. Ina situation where the selected bid is equal to the price of the meanbid (which is also the case when there is only one bid) the measuregives a value of 0.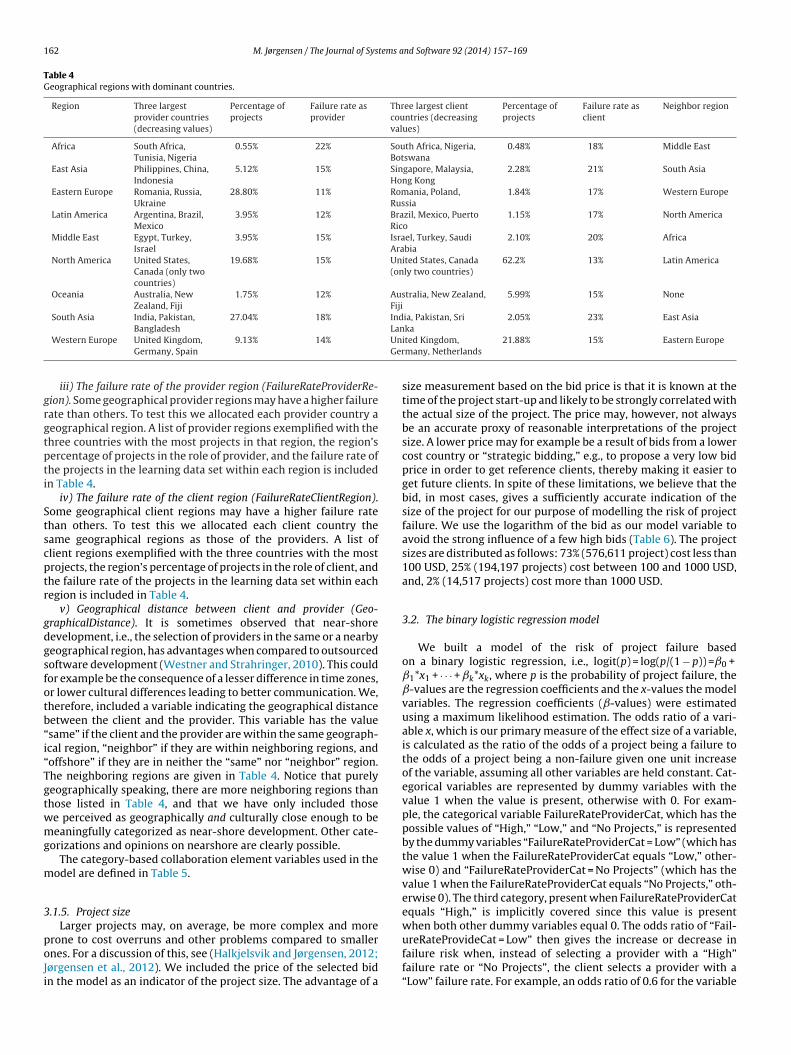
162 M. Jørgensen / The Journal of Systems and Software 92 (2014) 157–169
Table 4Geographical regions with dominant countries.
Region Three largestprovider countries(decreasing values)
Percentage ofprojects
Failure rate asprovider
Three largest clientcountries (decreasingvalues)
Percentage ofprojects
Failure rate asclient
Neighbor region
Africa South Africa,Tunisia, Nigeria
0.55% 22% South Africa, Nigeria,Botswana
0.48% 18% Middle East
East Asia Philippines, China,Indonesia
5.12% 15% Singapore, Malaysia,Hong Kong
2.28% 21% South Asia
Eastern Europe Romania, Russia,Ukraine
28.80% 11% Romania, Poland,Russia
1.84% 17% Western Europe
Latin America Argentina, Brazil,Mexico
3.95% 12% Brazil, Mexico, PuertoRico
1.15% 17% North America
Middle East Egypt, Turkey,Israel
3.95% 15% Israel, Turkey, SaudiArabia
2.10% 20% Africa
North America United States,Canada (only twocountries)
19.68% 15% United States, Canada(only two countries)
62.2% 13% Latin America
Oceania Australia, NewZealand, Fiji
1.75% 12% Australia, New Zealand,Fiji
5.99% 15% None
South Asia India, Pakistan, 27.04% 18% India, Pakistan, SriLan
2.05% 23% East Asia
UnGer
grgtpti
Stscptr
gdgsfotb“i“Tgtwmg
m
3
poJi
BangladeshWestern Europe United Kingdom,
Germany, Spain9.13% 14%
iii) The failure rate of the provider region (FailureRateProviderRe-ion). Some geographical provider regions may have a higher failureate than others. To test this we allocated each provider country aeographical region. A list of provider regions exemplified with thehree countries with the most projects in that region, the region’sercentage of projects in the role of provider, and the failure rate ofhe projects in the learning data set within each region is includedn Table 4.
iv) The failure rate of the client region (FailureRateClientRegion).ome geographical client regions may have a higher failure ratehan others. To test this we allocated each client country theame geographical regions as those of the providers. A list oflient regions exemplified with the three countries with the mostrojects, the region’s percentage of projects in the role of client, andhe failure rate of the projects in the learning data set within eachegion is included in Table 4.
v) Geographical distance between client and provider (Geo-raphicalDistance). It is sometimes observed that near-shoreevelopment, i.e., the selection of providers in the same or a nearbyeographical region, has advantages when compared to outsourcedoftware development (Westner and Strahringer, 2010). This couldor example be the consequence of a lesser difference in time zones,r lower cultural differences leading to better communication. We,herefore, included a variable indicating the geographical distanceetween the client and the provider. This variable has the valuesame” if the client and the provider are within the same geograph-cal region, “neighbor” if they are within neighboring regions, andoffshore” if they are in neither the “same” nor “neighbor” region.he neighboring regions are given in Table 4. Notice that purelyeographically speaking, there are more neighboring regions thanhose listed in Table 4, and that we have only included thosee perceived as geographically and culturally close enough to beeaningfully categorized as near-shore development. Other cate-
orizations and opinions on nearshore are clearly possible.The category-based collaboration element variables used in the
odel are defined in Table 5.
.1.5. Project sizeLarger projects may, on average, be more complex and more
rone to cost overruns and other problems compared to smallernes. For a discussion of this, see (Halkjelsvik and Jørgensen, 2012;ørgensen et al., 2012). We included the price of the selected bidn the model as an indicator of the project size. The advantage of a
kaited Kingdom,many, Netherlands
21.88% 15% Eastern Europe
size measurement based on the bid price is that it is known at thetime of the project start-up and likely to be strongly correlated withthe actual size of the project. The price may, however, not alwaysbe an accurate proxy of reasonable interpretations of the projectsize. A lower price may for example be a result of bids from a lowercost country or “strategic bidding,” e.g., to propose a very low bidprice in order to get reference clients, thereby making it easier toget future clients. In spite of these limitations, we believe that thebid, in most cases, gives a sufficiently accurate indication of thesize of the project for our purpose of modelling the risk of projectfailure. We use the logarithm of the bid as our model variable toavoid the strong influence of a few high bids (Table 6). The projectsizes are distributed as follows: 73% (576,611 project) cost less than100 USD, 25% (194,197 projects) cost between 100 and 1000 USD,and, 2% (14,517 projects) cost more than 1000 USD.
3.2. The binary logistic regression model
We built a model of the risk of project failure basedon a binary logistic regression, i.e., logit(p) = log(p/(1 − p)) =ˇ0 +ˇ1*x1 + · · · + ˇk*xk, where p is the probability of project failure, theˇ-values are the regression coefficients and the x-values the modelvariables. The regression coefficients (ˇ-values) were estimatedusing a maximum likelihood estimation. The odds ratio of a vari-able x, which is our primary measure of the effect size of a variable,is calculated as the ratio of the odds of a project being a failure tothe odds of a project being a non-failure given one unit increaseof the variable, assuming all other variables are held constant. Cat-egorical variables are represented by dummy variables with thevalue 1 when the value is present, otherwise with 0. For exam-ple, the categorical variable FailureRateProviderCat, which has thepossible values of “High,” “Low,” and “No Projects,” is representedby the dummy variables “FailureRateProviderCat = Low” (which hasthe value 1 when the FailureRateProviderCat equals “Low,” other-wise 0) and “FailureRateProviderCat = No Projects” (which has thevalue 1 when the FailureRateProviderCat equals “No Projects,” oth-erwise 0). The third category, present when FailureRateProviderCatequals “High,” is implicitly covered since this value is presentwhen both other dummy variables equal 0. The odds ratio of “Fail-
ureRateProvideCat = Low” then gives the increase or decrease infailure risk when, instead of selecting a provider with a “High”failure rate or “No Projects”, the client selects a provider with a“Low” failure rate. For example, an odds ratio of 0.6 for the variable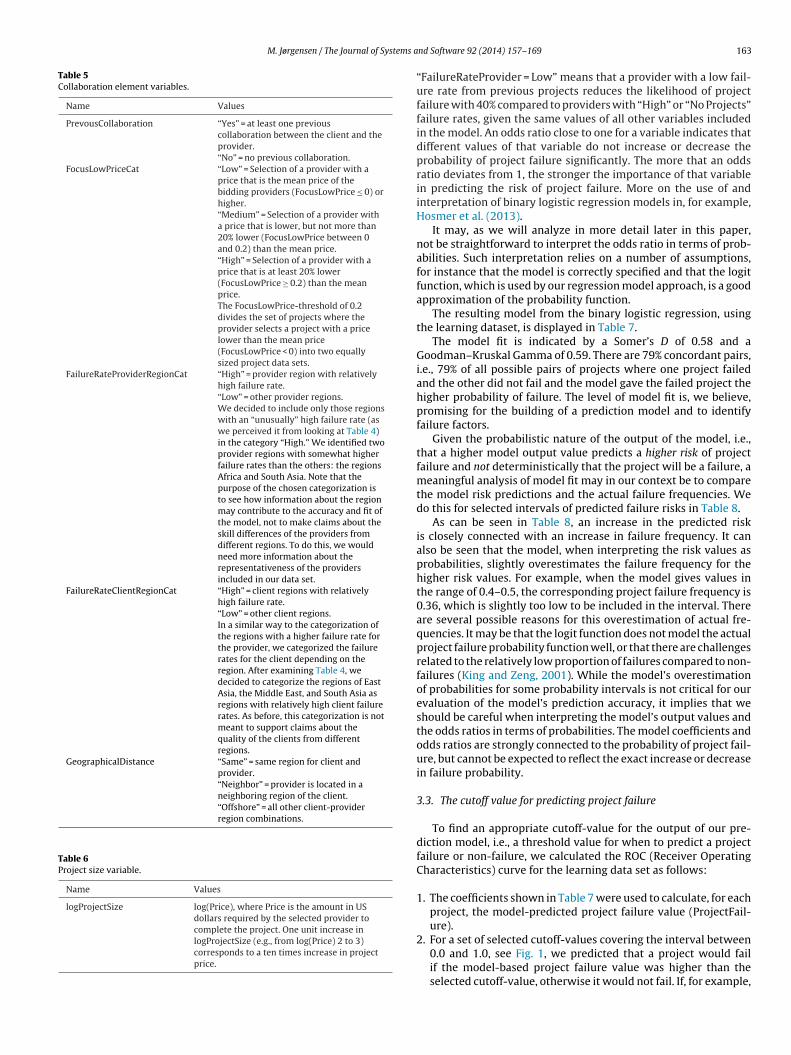
M. Jørgensen / The Journal of Systems a
Table 5Collaboration element variables.
Name Values
PrevousCollaboration “Yes” = at least one previouscollaboration between the client and theprovider.“No” = no previous collaboration.
FocusLowPriceCat “Low” = Selection of a provider with aprice that is the mean price of thebidding providers (FocusLowPrice ≤ 0) orhigher.“Medium” = Selection of a provider witha price that is lower, but not more than20% lower (FocusLowPrice between 0and 0.2) than the mean price.“High” = Selection of a provider with aprice that is at least 20% lower(FocusLowPrice ≥ 0.2) than the meanprice.The FocusLowPrice-threshold of 0.2divides the set of projects where theprovider selects a project with a pricelower than the mean price(FocusLowPrice < 0) into two equallysized project data sets.
FailureRateProviderRegionCat “High” = provider region with relativelyhigh failure rate.“Low” = other provider regions.We decided to include only those regionswith an “unusually” high failure rate (aswe perceived it from looking at Table 4)in the category “High.” We identified twoprovider regions with somewhat higherfailure rates than the others: the regionsAfrica and South Asia. Note that thepurpose of the chosen categorization isto see how information about the regionmay contribute to the accuracy and fit ofthe model, not to make claims about theskill differences of the providers fromdifferent regions. To do this, we wouldneed more information about therepresentativeness of the providersincluded in our data set.
FailureRateClientRegionCat “High” = client regions with relativelyhigh failure rate.“Low” = other client regions.In a similar way to the categorization ofthe regions with a higher failure rate forthe provider, we categorized the failurerates for the client depending on theregion. After examining Table 4, wedecided to categorize the regions of EastAsia, the Middle East, and South Asia asregions with relatively high client failurerates. As before, this categorization is notmeant to support claims about thequality of the clients from differentregions.
GeographicalDistance “Same” = same region for client andprovider.“Neighbor” = provider is located in aneighboring region of the client.“Offshore” = all other client-providerregion combinations.
Table 6Project size variable.
Name Values
logProjectSize log(Price), where Price is the amount in USdollars required by the selected provider tocomplete the project. One unit increase inlogProjectSize (e.g., from log(Price) 2 to 3)corresponds to a ten times increase in projectprice.
nd Software 92 (2014) 157–169 163
“FailureRateProvider = Low” means that a provider with a low fail-ure rate from previous projects reduces the likelihood of projectfailure with 40% compared to providers with “High” or “No Projects”failure rates, given the same values of all other variables includedin the model. An odds ratio close to one for a variable indicates thatdifferent values of that variable do not increase or decrease theprobability of project failure significantly. The more that an oddsratio deviates from 1, the stronger the importance of that variablein predicting the risk of project failure. More on the use of andinterpretation of binary logistic regression models in, for example,Hosmer et al. (2013).
It may, as we will analyze in more detail later in this paper,not be straightforward to interpret the odds ratio in terms of prob-abilities. Such interpretation relies on a number of assumptions,for instance that the model is correctly specified and that the logitfunction, which is used by our regression model approach, is a goodapproximation of the probability function.
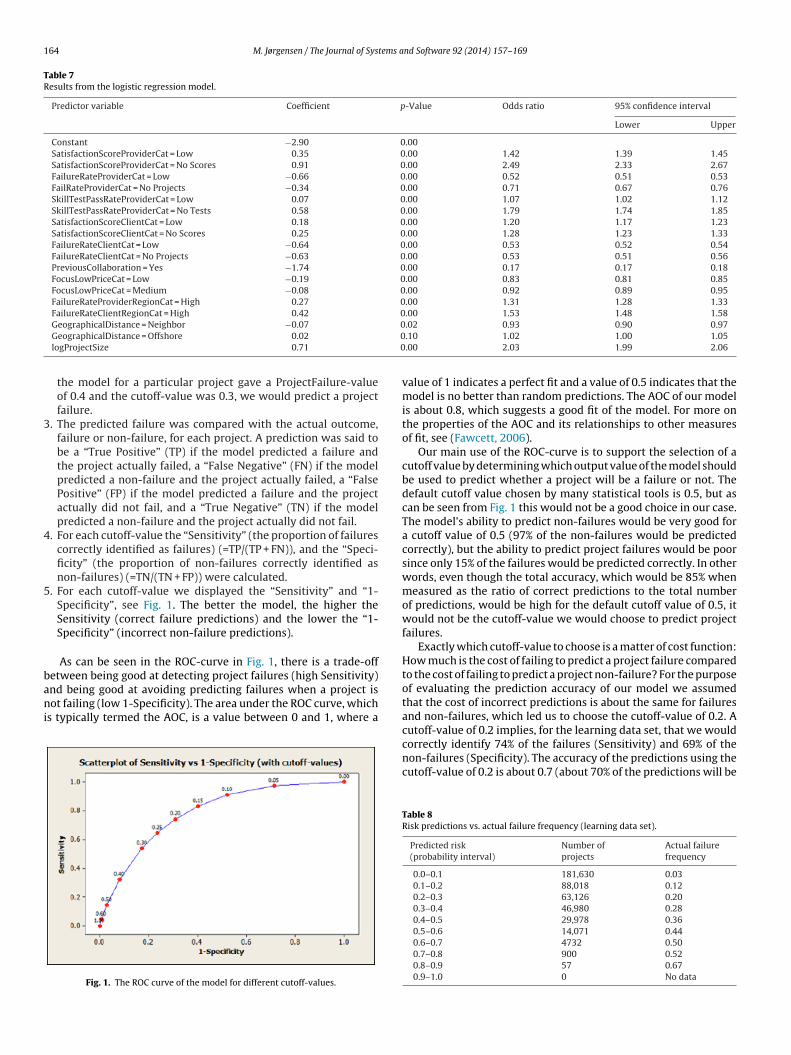
The resulting model from the binary logistic regression, usingthe learning dataset, is displayed in Table 7.
The model fit is indicated by a Somer’s D of 0.58 and aGoodman–Kruskal Gamma of 0.59. There are 79% concordant pairs,i.e., 79% of all possible pairs of projects where one project failedand the other did not fail and the model gave the failed project thehigher probability of failure. The level of model fit is, we believe,promising for the building of a prediction model and to identifyfailure factors.
Given the probabilistic nature of the output of the model, i.e.,that a higher model output value predicts a higher risk of projectfailure and not deterministically that the project will be a failure, ameaningful analysis of model fit may in our context be to comparethe model risk predictions and the actual failure frequencies. Wedo this for selected intervals of predicted failure risks in Table 8.
As can be seen in Table 8, an increase in the predicted riskis closely connected with an increase in failure frequency. It canalso be seen that the model, when interpreting the risk values asprobabilities, slightly overestimates the failure frequency for thehigher risk values. For example, when the model gives values inthe range of 0.4–0.5, the corresponding project failure frequency is0.36, which is slightly too low to be included in the interval. Thereare several possible reasons for this overestimation of actual fre-quencies. It may be that the logit function does not model the actualproject failure probability function well, or that there are challengesrelated to the relatively low proportion of failures compared to non-failures (King and Zeng, 2001). While the model’s overestimationof probabilities for some probability intervals is not critical for ourevaluation of the model’s prediction accuracy, it implies that weshould be careful when interpreting the model’s output values andthe odds ratios in terms of probabilities. The model coefficients andodds ratios are strongly connected to the probability of project fail-ure, but cannot be expected to reflect the exact increase or decreasein failure probability.
3.3. The cutoff value for predicting project failure
To find an appropriate cutoff-value for the output of our pre-diction model, i.e., a threshold value for when to predict a projectfailure or non-failure, we calculated the ROC (Receiver OperatingCharacteristics) curve for the learning data set as follows:
1. The coefficients shown in Table 7 were used to calculate, for eachproject, the model-predicted project failure value (ProjectFail-ure).
2. For a set of selected cutoff-values covering the interval between0.0 and 1.0, see Fig. 1, we predicted that a project would failif the model-based project failure value was higher than theselected cutoff-value, otherwise it would not fail. If, for example,
164 M. Jørgensen / The Journal of Systems and Software 92 (2014) 157–169
Table 7Results from the logistic regression model.
Predictor variable Coefficient p-Value Odds ratio 95% confidence interval
Lower Upper
Constant −2.90 0.00SatisfactionScoreProviderCat = Low 0.35 0.00 1.42 1.39 1.45SatisfactionScoreProviderCat = No Scores 0.91 0.00 2.49 2.33 2.67FailureRateProviderCat = Low −0.66 0.00 0.52 0.51 0.53FailRateProviderCat = No Projects −0.34 0.00 0.71 0.67 0.76SkillTestPassRateProviderCat = Low 0.07 0.00 1.07 1.02 1.12SkillTestPassRateProviderCat = No Tests 0.58 0.00 1.79 1.74 1.85SatisfactionScoreClientCat = Low 0.18 0.00 1.20 1.17 1.23SatisfactionScoreClientCat = No Scores 0.25 0.00 1.28 1.23 1.33FailureRateClientCat = Low −0.64 0.00 0.53 0.52 0.54FailureRateClientCat = No Projects −0.63 0.00 0.53 0.51 0.56PreviousCollaboration = Yes −1.74 0.00 0.17 0.17 0.18FocusLowPriceCat = Low −0.19 0.00 0.83 0.81 0.85FocusLowPriceCat = Medium −0.08 0.00 0.92 0.89 0.95FailureRateProviderRegionCat = High 0.27 0.00 1.31 1.28 1.33FailureRateClientRegionCat = High 0.42 0.00 1.53 1.48 1.58
000
3
4
5
bani
GeographicalDistance = Neighbor −0.07
GeographicalDistance = Offshore 0.02
logProjectSize 0.71
the model for a particular project gave a ProjectFailure-valueof 0.4 and the cutoff-value was 0.3, we would predict a projectfailure.
. The predicted failure was compared with the actual outcome,failure or non-failure, for each project. A prediction was said tobe a “True Positive” (TP) if the model predicted a failure andthe project actually failed, a “False Negative” (FN) if the modelpredicted a non-failure and the project actually failed, a “FalsePositive” (FP) if the model predicted a failure and the projectactually did not fail, and a “True Negative” (TN) if the modelpredicted a non-failure and the project actually did not fail.
. For each cutoff-value the “Sensitivity” (the proportion of failurescorrectly identified as failures) (=TP/(TP + FN)), and the “Speci-ficity” (the proportion of non-failures correctly identified asnon-failures) (=TN/(TN + FP)) were calculated.
. For each cutoff-value we displayed the “Sensitivity” and “1-Specificity”, see Fig. 1. The better the model, the higher theSensitivity (correct failure predictions) and the lower the “1-Specificity” (incorrect non-failure predictions).
As can be seen in the ROC-curve in Fig. 1, there is a trade-off
etween being good at detecting project failures (high Sensitivity)nd being good at avoiding predicting failures when a project isot failing (low 1-Specificity). The area under the ROC curve, whichs typically termed the AOC, is a value between 0 and 1, where a
Fig. 1. The ROC curve of the model for different cutoff-values.
.02 0.93 0.90 0.97
.10 1.02 1.00 1.05
.00 2.03 1.99 2.06
value of 1 indicates a perfect fit and a value of 0.5 indicates that themodel is no better than random predictions. The AOC of our modelis about 0.8, which suggests a good fit of the model. For more onthe properties of the AOC and its relationships to other measuresof fit, see (Fawcett, 2006).
Our main use of the ROC-curve is to support the selection of acutoff value by determining which output value of the model shouldbe used to predict whether a project will be a failure or not. Thedefault cutoff value chosen by many statistical tools is 0.5, but ascan be seen from Fig. 1 this would not be a good choice in our case.The model’s ability to predict non-failures would be very good fora cutoff value of 0.5 (97% of the non-failures would be predictedcorrectly), but the ability to predict project failures would be poorsince only 15% of the failures would be predicted correctly. In otherwords, even though the total accuracy, which would be 85% whenmeasured as the ratio of correct predictions to the total numberof predictions, would be high for the default cutoff value of 0.5, itwould not be the cutoff-value we would choose to predict projectfailures.
Exactly which cutoff-value to choose is a matter of cost function:How much is the cost of failing to predict a project failure comparedto the cost of failing to predict a project non-failure? For the purposeof evaluating the prediction accuracy of our model we assumedthat the cost of incorrect predictions is about the same for failuresand non-failures, which led us to choose the cutoff-value of 0.2. Acutoff-value of 0.2 implies, for the learning data set, that we would
correctly identify 74% of the failures (Sensitivity) and 69% of thenon-failures (Specificity). The accuracy of the predictions using thecutoff-value of 0.2 is about 0.7 (about 70% of the predictions will beTable 8Risk predictions vs. actual failure frequency (learning data set).
Predicted risk(probability interval)
Number ofprojects
Actual failurefrequency
0.0–0.1 181,630 0.030.1–0.2 88,018 0.120.2–0.3 63,126 0.200.3–0.4 46,980 0.280.4–0.5 29,978 0.360.5–0.6 14,071 0.440.6–0.7 4732 0.500.7–0.8 900 0.520.8–0.9 57 0.670.9–1.0 0 No data
M. Jørgensen / The Journal of Systems a
Table 9Risk prediction vs. actual failure frequency (evaluation data set).
Predicted risk(probability interval)
Number ofprojects
Actual failurefrequency
0–0.1 144,480 0.030.1–0.2 70,265 0.110.2–0.3 49,347 0.190.3–0.4 38,640 0.250.4–0.5 26,225 0.320.5–0.6 13,294 0.390.6–0.7 4481 0.46
c8o
3
t2Tca
•
•
•
•
•
•
•
tsvwT
buaf
cwttm
3
hoa
0.7–0.8 886 0.530.8–0.9 49 0.630.9–1.0 No data No data
orrect). Note that this is a substantially lower accuracy than the5% correct predictions for the default cutoff-value of 0.5, in spitef being a more meaningful prediction model.
.4. The prediction accuracy of the model
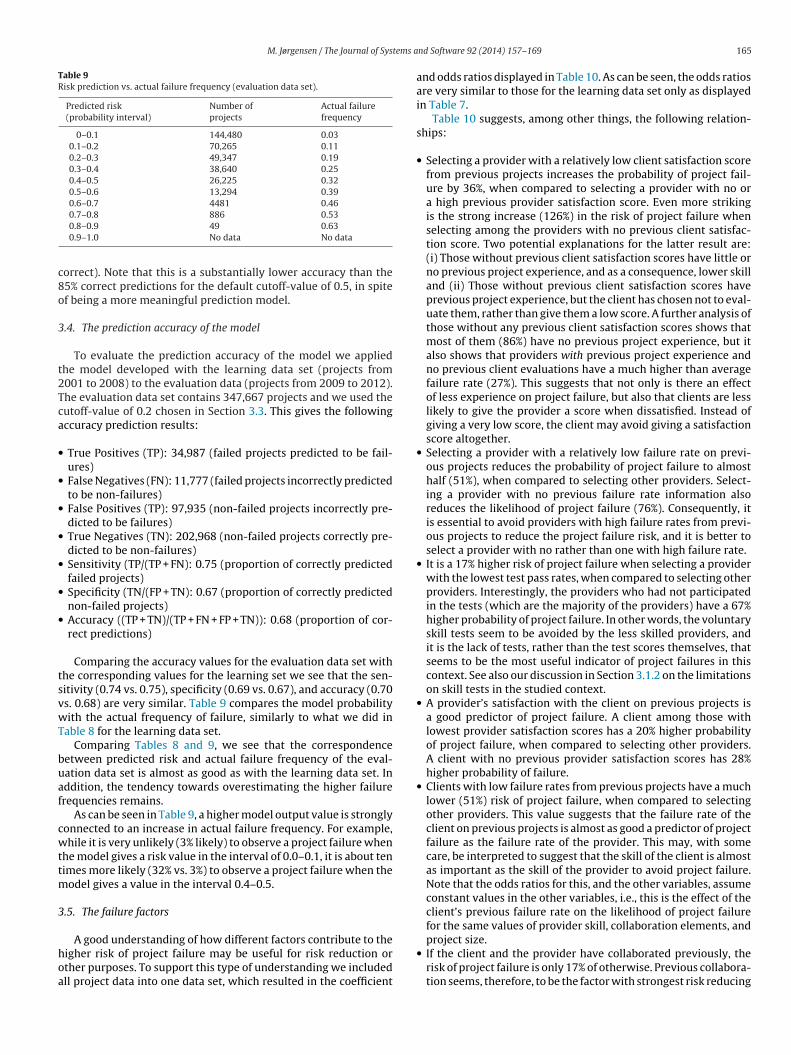
To evaluate the prediction accuracy of the model we appliedhe model developed with the learning data set (projects from001 to 2008) to the evaluation data (projects from 2009 to 2012).he evaluation data set contains 347,667 projects and we used theutoff-value of 0.2 chosen in Section 3.3. This gives the followingccuracy prediction results:
True Positives (TP): 34,987 (failed projects predicted to be fail-ures)False Negatives (FN): 11,777 (failed projects incorrectly predictedto be non-failures)False Positives (TP): 97,935 (non-failed projects incorrectly pre-dicted to be failures)True Negatives (TN): 202,968 (non-failed projects correctly pre-dicted to be non-failures)Sensitivity (TP/(TP + FN): 0.75 (proportion of correctly predictedfailed projects)Specificity (TN/(FP + TN): 0.67 (proportion of correctly predictednon-failed projects)Accuracy ((TP + TN)/(TP + FN + FP + TN)): 0.68 (proportion of cor-rect predictions)
Comparing the accuracy values for the evaluation data set withhe corresponding values for the learning set we see that the sen-itivity (0.74 vs. 0.75), specificity (0.69 vs. 0.67), and accuracy (0.70s. 0.68) are very similar. Table 9 compares the model probabilityith the actual frequency of failure, similarly to what we did in
able 8 for the learning data set.Comparing Tables 8 and 9, we see that the correspondence
etween predicted risk and actual failure frequency of the eval-ation data set is almost as good as with the learning data set. Inddition, the tendency towards overestimating the higher failurerequencies remains.
As can be seen in Table 9, a higher model output value is stronglyonnected to an increase in actual failure frequency. For example,hile it is very unlikely (3% likely) to observe a project failure when
he model gives a risk value in the interval of 0.0–0.1, it is about tenimes more likely (32% vs. 3%) to observe a project failure when the
odel gives a value in the interval 0.4–0.5.
.5. The failure factors
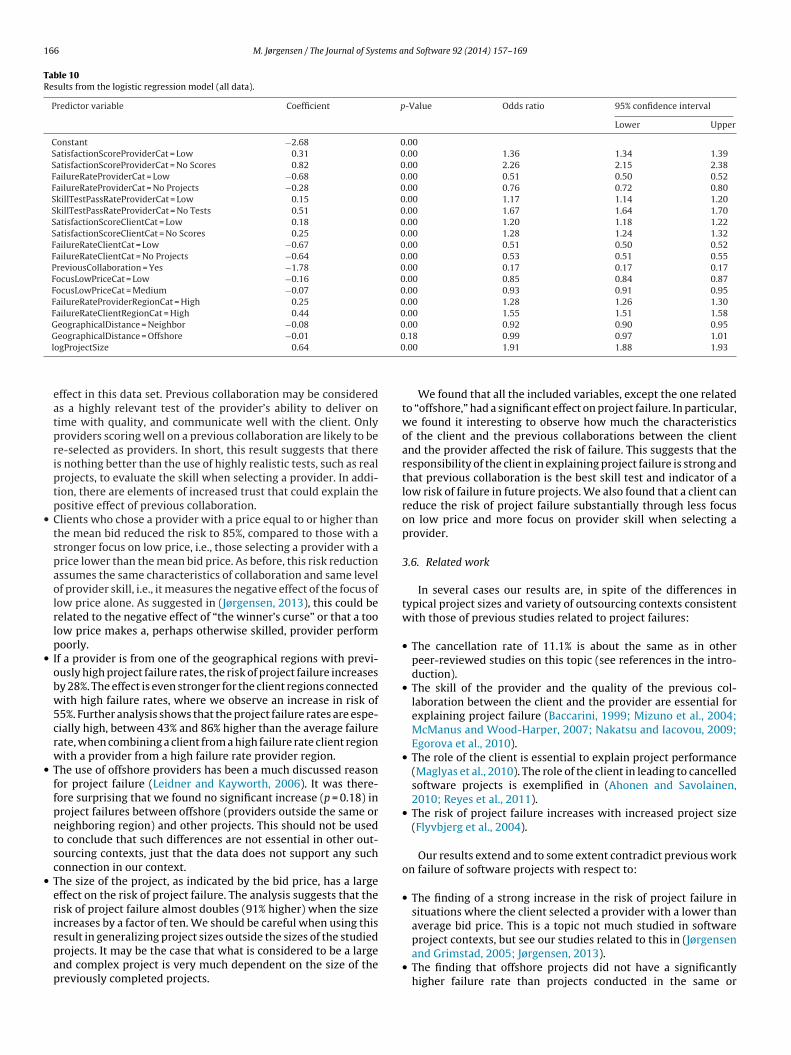
A good understanding of how different factors contribute to theigher risk of project failure may be useful for risk reduction orther purposes. To support this type of understanding we includedll project data into one data set, which resulted in the coefficient
nd Software 92 (2014) 157–169 165
and odds ratios displayed in Table 10. As can be seen, the odds ratiosare very similar to those for the learning data set only as displayedin Table 7.
Table 10 suggests, among other things, the following relation-ships:
• Selecting a provider with a relatively low client satisfaction scorefrom previous projects increases the probability of project fail-ure by 36%, when compared to selecting a provider with no ora high previous provider satisfaction score. Even more strikingis the strong increase (126%) in the risk of project failure whenselecting among the providers with no previous client satisfac-tion score. Two potential explanations for the latter result are:(i) Those without previous client satisfaction scores have little orno previous project experience, and as a consequence, lower skilland (ii) Those without previous client satisfaction scores haveprevious project experience, but the client has chosen not to eval-uate them, rather than give them a low score. A further analysis ofthose without any previous client satisfaction scores shows thatmost of them (86%) have no previous project experience, but italso shows that providers with previous project experience andno previous client evaluations have a much higher than averagefailure rate (27%). This suggests that not only is there an effectof less experience on project failure, but also that clients are lesslikely to give the provider a score when dissatisfied. Instead ofgiving a very low score, the client may avoid giving a satisfactionscore altogether.
• Selecting a provider with a relatively low failure rate on previ-ous projects reduces the probability of project failure to almosthalf (51%), when compared to selecting other providers. Select-ing a provider with no previous failure rate information alsoreduces the likelihood of project failure (76%). Consequently, itis essential to avoid providers with high failure rates from previ-ous projects to reduce the project failure risk, and it is better toselect a provider with no rather than one with high failure rate.
• It is a 17% higher risk of project failure when selecting a providerwith the lowest test pass rates, when compared to selecting otherproviders. Interestingly, the providers who had not participatedin the tests (which are the majority of the providers) have a 67%higher probability of project failure. In other words, the voluntaryskill tests seem to be avoided by the less skilled providers, andit is the lack of tests, rather than the test scores themselves, thatseems to be the most useful indicator of project failures in thiscontext. See also our discussion in Section 3.1.2 on the limitationson skill tests in the studied context.
• A provider’s satisfaction with the client on previous projects isa good predictor of project failure. A client among those withlowest provider satisfaction scores has a 20% higher probabilityof project failure, when compared to selecting other providers.A client with no previous provider satisfaction scores has 28%higher probability of failure.
• Clients with low failure rates from previous projects have a muchlower (51%) risk of project failure, when compared to selectingother providers. This value suggests that the failure rate of theclient on previous projects is almost as good a predictor of projectfailure as the failure rate of the provider. This may, with somecare, be interpreted to suggest that the skill of the client is almostas important as the skill of the provider to avoid project failure.Note that the odds ratios for this, and the other variables, assumeconstant values in the other variables, i.e., this is the effect of theclient’s previous failure rate on the likelihood of project failurefor the same values of provider skill, collaboration elements, and
project size.• If the client and the provider have collaborated previously, therisk of project failure is only 17% of otherwise. Previous collabora-tion seems, therefore, to be the factor with strongest risk reducing
166 M. Jørgensen / The Journal of Systems and Software 92 (2014) 157–169
Table 10Results from the logistic regression model (all data).
Predictor variable Coefficient p-Value Odds ratio 95% confidence interval
Lower Upper
Constant −2.68 0.00SatisfactionScoreProviderCat = Low 0.31 0.00 1.36 1.34 1.39SatisfactionScoreProviderCat = No Scores 0.82 0.00 2.26 2.15 2.38FailureRateProviderCat = Low −0.68 0.00 0.51 0.50 0.52FailureRateProviderCat = No Projects −0.28 0.00 0.76 0.72 0.80SkillTestPassRateProviderCat = Low 0.15 0.00 1.17 1.14 1.20SkillTestPassRateProviderCat = No Tests 0.51 0.00 1.67 1.64 1.70SatisfactionScoreClientCat = Low 0.18 0.00 1.20 1.18 1.22SatisfactionScoreClientCat = No Scores 0.25 0.00 1.28 1.24 1.32FailureRateClientCat = Low −0.67 0.00 0.51 0.50 0.52FailureRateClientCat = No Projects −0.64 0.00 0.53 0.51 0.55PreviousCollaboration = Yes −1.78 0.00 0.17 0.17 0.17FocusLowPriceCat = Low −0.16 0.00 0.85 0.84 0.87FocusLowPriceCat = Medium −0.07 0.00 0.93 0.91 0.95FailureRateProviderRegionCat = High 0.25 0.00 1.28 1.26 1.30FailureRateClientRegionCat = High 0.44 0.00 1.55 1.51 1.58GeographicalDistance = Neighbor −0.08 0.00 0.92 0.90 0.95
00
•
•
•
•
GeographicalDistance = Offshore −0.01
logProjectSize 0.64
effect in this data set. Previous collaboration may be consideredas a highly relevant test of the provider’s ability to deliver ontime with quality, and communicate well with the client. Onlyproviders scoring well on a previous collaboration are likely to bere-selected as providers. In short, this result suggests that thereis nothing better than the use of highly realistic tests, such as realprojects, to evaluate the skill when selecting a provider. In addi-tion, there are elements of increased trust that could explain thepositive effect of previous collaboration.Clients who chose a provider with a price equal to or higher thanthe mean bid reduced the risk to 85%, compared to those with astronger focus on low price, i.e., those selecting a provider with aprice lower than the mean bid price. As before, this risk reductionassumes the same characteristics of collaboration and same levelof provider skill, i.e., it measures the negative effect of the focus oflow price alone. As suggested in (Jørgensen, 2013), this could berelated to the negative effect of “the winner’s curse” or that a toolow price makes a, perhaps otherwise skilled, provider performpoorly.If a provider is from one of the geographical regions with previ-ously high project failure rates, the risk of project failure increasesby 28%. The effect is even stronger for the client regions connectedwith high failure rates, where we observe an increase in risk of55%. Further analysis shows that the project failure rates are espe-cially high, between 43% and 86% higher than the average failurerate, when combining a client from a high failure rate client regionwith a provider from a high failure rate provider region.The use of offshore providers has been a much discussed reasonfor project failure (Leidner and Kayworth, 2006). It was there-fore surprising that we found no significant increase (p = 0.18) inproject failures between offshore (providers outside the same orneighboring region) and other projects. This should not be usedto conclude that such differences are not essential in other out-sourcing contexts, just that the data does not support any suchconnection in our context.The size of the project, as indicated by the bid price, has a largeeffect on the risk of project failure. The analysis suggests that therisk of project failure almost doubles (91% higher) when the sizeincreases by a factor of ten. We should be careful when using this
result in generalizing project sizes outside the sizes of the studiedprojects. It may be the case that what is considered to be a largeand complex project is very much dependent on the size of thepreviously completed projects..18 0.99 0.97 1.01
.00 1.91 1.88 1.93
We found that all the included variables, except the one relatedto “offshore,” had a significant effect on project failure. In particular,we found it interesting to observe how much the characteristicsof the client and the previous collaborations between the clientand the provider affected the risk of failure. This suggests that theresponsibility of the client in explaining project failure is strong andthat previous collaboration is the best skill test and indicator of alow risk of failure in future projects. We also found that a client canreduce the risk of project failure substantially through less focuson low price and more focus on provider skill when selecting aprovider.
3.6. Related work
In several cases our results are, in spite of the differences intypical project sizes and variety of outsourcing contexts consistentwith those of previous studies related to project failures:
• The cancellation rate of 11.1% is about the same as in otherpeer-reviewed studies on this topic (see references in the intro-duction).
• The skill of the provider and the quality of the previous col-laboration between the client and the provider are essential forexplaining project failure (Baccarini, 1999; Mizuno et al., 2004;McManus and Wood-Harper, 2007; Nakatsu and Iacovou, 2009;Egorova et al., 2010).
• The role of the client is essential to explain project performance(Maglyas et al., 2010). The role of the client in leading to cancelledsoftware projects is exemplified in (Ahonen and Savolainen,2010; Reyes et al., 2011).
• The risk of project failure increases with increased project size(Flyvbjerg et al., 2004).
Our results extend and to some extent contradict previous workon failure of software projects with respect to:
• The finding of a strong increase in the risk of project failure insituations where the client selected a provider with a lower thanaverage bid price. This is a topic not much studied in software
project contexts, but see our studies related to this in (Jørgensenand Grimstad, 2005; Jørgensen, 2013).• The finding that offshore projects did not have a significantlyhigher failure rate than projects conducted in the same or

tems a
4
Twed“UotimewmrmamftioMpbpppootdgc
spraw
M. Jørgensen / The Journal of Sys
neighboring geographical region. This seems to be in oppositionto what is reported in (Westner and Strahringer, 2010) and theperception of many software managers (Nakatsu and Iacovou,2009). We do not currently know much about the reason forthis difference in findings. It is possible that the providers andclients involved in the studied type of outsourcing (those usingthe global outsourcing marketplace for small projects) are dif-ferent from the type of providers and clients included in otherstudies. We followed-up with analyses of whether there weresome client regions where offshore collaborations were espe-cially risky, i.e., whether our general analysis hid some interestingresults present on a more detailed level. The analyses gave thatthere may be regions where the failure rate increased when col-laborating offshore, but that clients in the largest client regions(North America, Western Europe, Oceania, and South Asia), hadon average no increased project risk in such cases. Interestingly,the highest failure rates were found when both the client and theprovider were from South Asia, mainly India, which suggests thatthe difference in culture may not be the main explanation for thehigher risk of project failure in that region. More studies may beneeded to get more robust and context dependent results on theeffect of offshore collaborations on project failure risk.
. Limitations and discussions
Most of the projects included in our analysis are very small.o analyze whether the failure factors for the smallest projectsere different from those, relatively speaking, larger projects, we
xamined the extent to which the odds ratios would change forifferent project size sub-sets, including “very small” (1–100 USD),small” (100–1000 USD), and “medium” (1000 and up to 30,000SD) sized projects. The median price of the projects in the categoryf medium sized projects is about 2000 USD. If the odds ratios werehe same for the larger as for the smaller projects, this would maket less likely that our results were influenced by a situation where
any of the very small projects at vWorker.com may be differ-nt from traditional software development work, e.g., include taskshere students request experts to solve their homework program-ing assignments. The same variables and the same binary logistic
egression were used for each of the sub-sets of project data. Theain finding from this analysis was that the model fit (Somer’s D)
nd the odds ratios for the different sub-sets of data were similar forost of the model variables, see Table 11. Interesting observations
rom this re-analysis include that performing poorly on the skillests (SkillTestPassRateProviderCat = Low) is a better predictor ofncreased risk of failure for the smallest projects and that less focusn low price when selecting a provider (FocusLowPriceCat = Low oredium) is a better predictor of decreased of failure for the larger
rojects. In general, however, that odds ratio give support to theelief that the importance of the included variables to explain risk ofroject failure is likely to remain reasonably stable with increasingroject size, at least in the context of the global outsourcing market-lace studied. In spite of this result, we can hardly use this analysisf project sub-sets to make strong claims about the failure factorsf large projects, especially outside an outsourcing context similaro the one that we have studied. The size-independence within ourata set may, nevertheless, suggest that several of the results mayeneralize to projects somewhat larger than those included in theurrent analysis.
Several of the smaller projects may not be similar to traditionaloftware project, but rather the development of simple scripts or
roviding technical support. The observation that the odds ratiosemain stable when excluding this suggests that the failure factorsre not very different in different types of projects, i.e., that weould not get different results when trying to separate the analysisnd Software 92 (2014) 157–169 167
into subgroups of projects. We conducted the regression analysison several other sub-groups of projects, e.g., based on type of skillneeded, but did not find much difference in odds ratios.
Our data set does not include information about the type ofdevelopment methods used by the software provider. Our ownexperience as client of several projects at vWorker.com suggeststhat this vary a lot. Some providers use agile and others more tra-ditional development method. Unfortunately, we were not able toanalyze how much the choice of development method contributedto the risk of project failure. Similarly, the data set did not enableus to analyze the influence from several other potentially impor-tant variables, e.g., the project complexity and use of developmentplatforms. The missing variables should be considered when inter-preting the results. It may, for example, be the case that a variableis not a causal factor, but instead a factor strongly correlated witha non-included factor causing increased risk of failure. This may inparticular be a threat for the somewhat surprising findings, e.g., thestrong effect on low client skill on risk of project failure. Low skillof client may, for example, be correlated with poor specificationsand poor project management, which are the more direct causes ofa project failure.
To test the robustness of the model to missing variables weexamined how the odds ratios changed when removing variables.If the odds ratios changed very much there could for example beproblems related to a high degree of multicollinearity. We found,however, that the odds ratios were quite stable to the removal ofvariables from the model. This increases our belief in the validityand robustness of the model.
We examined several of the requirement specifications ofvWorker.com and found many of them to be of low quality. Lowquality of the requirement specifications may be a problem inmany software contexts and frequently contribute to project fail-ure. The low quality of the typical requirement specification invWorker.com does, however, limit the generalization of our resultsmainly to contexts where many requirement specifications areincomplete and vague.
Several of the variables, e.g., the project failure variable, are noteasy to define in a manner that makes them objectively measurableand fully consistent with the variety of interpretations. The rela-tively good prediction accuracy and high robustness of our model,however, give some support in that the model variables approachthe phenomena we tried to understand.
We tried to emphasize variables causally related to the risk ofproject failure, but have only partly succeeded in doing so. Lowclient skill as indicated by project failure rate is, for example, hardlythe direct reason for the failure of a new project, but perhaps insteada characteristic that is correlated with the competence of the client,and that increases the likelihood of failure risk actions and non-actions by the client. Perhaps even more problematic is our useof the geographical region to explain project failure. Potentially,there are causal links between the software provider and clientcultures in a geographical region, and therefore the higher risk ofproject failure, but these links are most likely very complex, contextdependent, and currently not well understood. Further work shouldtry to better understand the underlying mechanisms of each of theidentified failure factors in order to get closer to the ideal of thecause-effect model.
The building of a sound binary logistic regression model is notunproblematic either. Proper interpretation of such models is basedon numerous assumptions that are hard to meet in the context ofsoftware development. We showed that we must be careful not tointerpret the outputs of the model as exact probabilities, but rather
as risk values strongly correlated with probabilities.We include several observations with the same client or thesame provider. This may violate the assumption of independenceamong the observations. To check whether this type of dependence
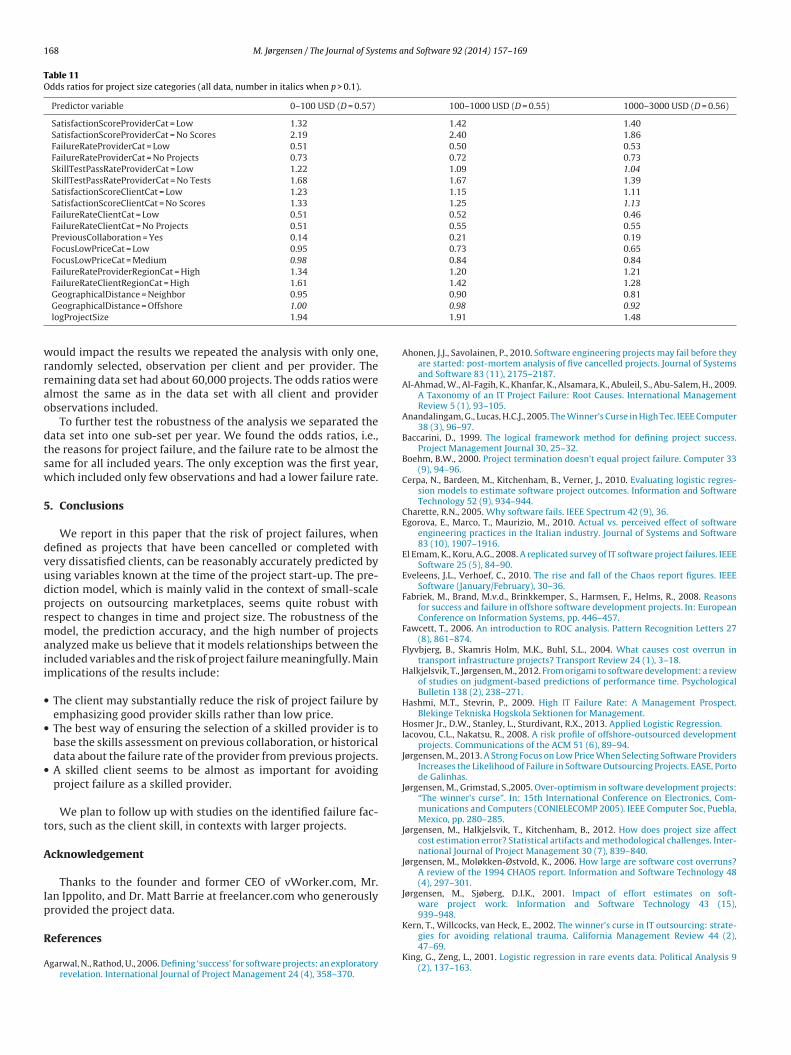
168 M. Jørgensen / The Journal of Systems and Software 92 (2014) 157–169
Table 11Odds ratios for project size categories (all data, number in italics when p > 0.1).
Predictor variable 0–100 USD (D = 0.57) 100–1000 USD (D = 0.55) 1000–3000 USD (D = 0.56)
SatisfactionScoreProviderCat = Low 1.32 1.42 1.40SatisfactionScoreProviderCat = No Scores 2.19 2.40 1.86FailureRateProviderCat = Low 0.51 0.50 0.53FailureRateProviderCat = No Projects 0.73 0.72 0.73SkillTestPassRateProviderCat = Low 1.22 1.09 1.04SkillTestPassRateProviderCat = No Tests 1.68 1.67 1.39SatisfactionScoreClientCat = Low 1.23 1.15 1.11SatisfactionScoreClientCat = No Scores 1.33 1.25 1.13FailureRateClientCat = Low 0.51 0.52 0.46FailureRateClientCat = No Projects 0.51 0.55 0.55PreviousCollaboration = Yes 0.14 0.21 0.19FocusLowPriceCat = Low 0.95 0.73 0.65FocusLowPriceCat = Medium 0.98 0.84 0.84FailureRateProviderRegionCat = High 1.34 1.20 1.21FailureRateClientRegionCat = High 1.61 1.42 1.28
wrrao
dtsw
5
dvudprmaii
•
•
•
t
A
Ip
R
A
GeographicalDistance = Neighbor 0.95
GeographicalDistance = Offshore 1.00
logProjectSize 1.94
ould impact the results we repeated the analysis with only one,andomly selected, observation per client and per provider. Theemaining data set had about 60,000 projects. The odds ratios werelmost the same as in the data set with all client and providerbservations included.
To further test the robustness of the analysis we separated theata set into one sub-set per year. We found the odds ratios, i.e.,he reasons for project failure, and the failure rate to be almost theame for all included years. The only exception was the first year,hich included only few observations and had a lower failure rate.
. Conclusions
We report in this paper that the risk of project failures, whenefined as projects that have been cancelled or completed withery dissatisfied clients, can be reasonably accurately predicted bysing variables known at the time of the project start-up. The pre-iction model, which is mainly valid in the context of small-scalerojects on outsourcing marketplaces, seems quite robust withespect to changes in time and project size. The robustness of theodel, the prediction accuracy, and the high number of projects
nalyzed make us believe that it models relationships between thencluded variables and the risk of project failure meaningfully. Mainmplications of the results include:
The client may substantially reduce the risk of project failure byemphasizing good provider skills rather than low price.The best way of ensuring the selection of a skilled provider is tobase the skills assessment on previous collaboration, or historicaldata about the failure rate of the provider from previous projects.A skilled client seems to be almost as important for avoidingproject failure as a skilled provider.
We plan to follow up with studies on the identified failure fac-ors, such as the client skill, in contexts with larger projects.
cknowledgement
Thanks to the founder and former CEO of vWorker.com, Mr.an Ippolito, and Dr. Matt Barrie at freelancer.com who generouslyrovided the project data.
eferences
garwal, N., Rathod, U., 2006. Defining ‘success’ for software projects: an exploratoryrevelation. International Journal of Project Management 24 (4), 358–370.
0.90 0.810.98 0.921.91 1.48
Ahonen, J.J., Savolainen, P., 2010. Software engineering projects may fail before theyare started: post-mortem analysis of five cancelled projects. Journal of Systemsand Software 83 (11), 2175–2187.
Al-Ahmad, W., Al-Fagih, K., Khanfar, K., Alsamara, K., Abuleil, S., Abu-Salem, H., 2009.A Taxonomy of an IT Project Failure: Root Causes. International ManagementReview 5 (1), 93–105.
Anandalingam, G., Lucas, H.C.J., 2005. The Winner’s Curse in High Tec. IEEE Computer38 (3), 96–97.
Baccarini, D., 1999. The logical framework method for defining project success.Project Management Journal 30, 25–32.
Boehm, B.W., 2000. Project termination doesn’t equal project failure. Computer 33(9), 94–96.
Cerpa, N., Bardeen, M., Kitchenham, B., Verner, J., 2010. Evaluating logistic regres-sion models to estimate software project outcomes. Information and SoftwareTechnology 52 (9), 934–944.
Charette, R.N., 2005. Why software fails. IEEE Spectrum 42 (9), 36.Egorova, E., Marco, T., Maurizio, M., 2010. Actual vs. perceived effect of software
engineering practices in the Italian industry. Journal of Systems and Software83 (10), 1907–1916.
El Emam, K., Koru, A.G., 2008. A replicated survey of IT software project failures. IEEESoftware 25 (5), 84–90.
Eveleens, J.L., Verhoef, C., 2010. The rise and fall of the Chaos report figures. IEEESoftware (January/February), 30–36.
Fabriek, M., Brand, M.v.d., Brinkkemper, S., Harmsen, F., Helms, R., 2008. Reasonsfor success and failure in offshore software development projects. In: EuropeanConference on Information Systems, pp. 446–457.
Fawcett, T., 2006. An introduction to ROC analysis. Pattern Recognition Letters 27(8), 861–874.
Flyvbjerg, B., Skamris Holm, M.K., Buhl, S.L., 2004. What causes cost overrun intransport infrastructure projects? Transport Review 24 (1), 3–18.
Halkjelsvik, T., Jørgensen, M., 2012. From origami to software development: a reviewof studies on judgment-based predictions of performance time. PsychologicalBulletin 138 (2), 238–271.
Hashmi, M.T., Stevrin, P., 2009. High IT Failure Rate: A Management Prospect.Blekinge Tekniska Hogskola Sektionen for Management.
Hosmer Jr., D.W., Stanley, L., Sturdivant, R.X., 2013. Applied Logistic Regression.Iacovou, C.L., Nakatsu, R., 2008. A risk profile of offshore-outsourced development
projects. Communications of the ACM 51 (6), 89–94.Jørgensen, M., 2013. A Strong Focus on Low Price When Selecting Software Providers
Increases the Likelihood of Failure in Software Outsourcing Projects. EASE, Portode Galinhas.
Jørgensen, M., Grimstad, S.,2005. Over-optimism in software development projects:“The winner’s curse”. In: 15th International Conference on Electronics, Com-munications and Computers (CONIELECOMP 2005). IEEE Computer Soc, Puebla,Mexico, pp. 280–285.
Jørgensen, M., Halkjelsvik, T., Kitchenham, B., 2012. How does project size affectcost estimation error? Statistical artifacts and methodological challenges. Inter-national Journal of Project Management 30 (7), 839–840.
Jørgensen, M., Moløkken-Østvold, K., 2006. How large are software cost overruns?A review of the 1994 CHAOS report. Information and Software Technology 48(4), 297–301.
Jørgensen, M., Sjøberg, D.I.K., 2001. Impact of effort estimates on soft-ware project work. Information and Software Technology 43 (15),939–948.
Kern, T., Willcocks, van Heck, E., 2002. The winner’s curse in IT outsourcing: strate-
gies for avoiding relational trauma. California Management Review 44 (2),47–69.King, G., Zeng, L., 2001. Logistic regression in rare events data. Political Analysis 9(2), 137–163.

tems a
L
L
L
M
M
M
N
R
S
S
Dybå, he founded and promoted evidence-based soft-ware engineering and teaches this to students and
M. Jørgensen / The Journal of Sys
eidner, D.E., Kayworth, T., 2006. A review of culture in information systemsresearch: toward a theory of information technology culture conflict. MIS Quar-terly 30 (2), 357–399.
in, M., Viswanathan, S., Agarwal, R., 2010. An Empirical Study of Online Soft-ware Outsourcing: Signals under Different Contract Regimes. Available at SSRN1694385.
inberg, K.R., 1999. Software developer perceptions about software project failure:a case study. Journal of Systems and Software 49 (2), 177–192.
aglyas, A., Nikula, U., Smolander, K.,2010. Comparison of two models of successprediction in software development projects. In: 6th Central and East-ern European Software Engineering Conference (CEE-SECR). IEEE Computers,pp. 43–49.
cManus, J., Wood-Harper, T., 2007. Understanding the sources of information sys-tems project failure. Management Services 51 (3), 38–43.
izuno, O., Hamasaki, T., Takagi, Y., Kikuno, T., 2004. An empirical evaluation ofpredicting runaway software projects using bayesian classification. In: ProductFocused Software Process Improvement. Springer, pp. 263–273.
akatsu, R.T., Iacovou, C.L., 2009. A comparative study of important risk fac-tors involved in offshore and domestic outsourcing of software developmentprojects: a two-panel Delphi study. Information & Management 46 (1),57–68.
eyes, F., Cerpa, N., Candia-Véjar, A., Bardeen, M., 2011. The optimization of successprobability for software projects using genetic algorithms. Journal of Systemsand Software 84 (5), 775–785.
auer, C., Gemino, A., Reich, B.H., 2007. The impact of size and volatility – on ITproject performance. Communications of the ACM 50 (11), 79–84.
chmidt, R., Lyytinen, K., Keil, M., Cule, P., 2001. Identifying software project risks:an international delphi study. Journal of Management Information Systems 17(4), 5–36.
nd Software 92 (2014) 157–169 169
Takagi, Y., Osamu, M., Tohru, K., 2005. An empirical approach to characterizingrisky software projects based on logistic regression analysis. Empirical SoftwareEngineering 10 (4), 495–515.
The Standish Group, 1995. The Standish Group: The Chaos Report. The StandishGroup, West Yarmouth, MA.
Tichy, L., Bascom, T., 2008. The business end of IT project failure. Mortage Banking68 (628), 28.
Verner, J., Sampson, J., Cerpa, N., 2008. What factors lead to software project failure?Research Challenges in Information Science, IEEE Computers, 71–80.
Westner, M.K., Strahringer, S., 2010. The current state of IS offshoring in Germany:project characteristics and success patterns. Journal of Information TechnologyManagement 21 (1), 49.
Wohlin, C., Andrews, A.A., 2001. Assessing project success using subjective evalua-tion factors. Software Quality Journal 9 (1), 43–70.
Wonnacott, T.H.W., Wonnacott, R.J., 1990. Introductory Statistics. John Wiley & Sons.
Magne Jørgensen works as a researcher at the SimulaResearch Laboratory and is a professor at the Universityof Oslo. Previously, he worked in software development,estimation and process improvement in the telecomand insurance industry. With Prof. Kitchenham and Dr.
software professionals. His current main research interestis judgment-based effort estimation and project manage-ment.