Memory bias for emotional facial expressions in major depression
Upload
khangminh22Category
view
0download
0
Citation: Alghamdi, T.; Alaghband,
G. Facial Expressions Based
Automatic Pain Assessment System.
Appl. Sci. 2022, 12, 6423. https://
doi.org/10.3390/app12136423
Academic Editors: Yang-Lang Chang,
Mohammad Alkhaleefah and
Tan-Hsu Tan
Received: 18 April 2022
Accepted: 21 June 2022
Published: 24 June 2022
Publisher’s Note: MDPI stays neutral
with regard to jurisdictional claims in
published maps and institutional affil-
iations.
Copyright: © 2022 by the authors.
Licensee MDPI, Basel, Switzerland.
This article is an open access article
distributed under the terms and
conditions of the Creative Commons
Attribution (CC BY) license (https://
creativecommons.org/licenses/by/
4.0/).
applied sciences
Article
Facial Expressions Based Automatic Pain Assessment SystemThoria Alghamdi 1,2,* and Gita Alaghband 1
1 Department of Computer Science and Engineering, College of Engineering, University of Colorado Denver,Denver, CO 80204, USA; [email protected]
2 Department of Information Systems, College of Computing and Information Technology,King Abdulaziz University, Jeddah 21589, Saudi Arabia
* Correspondence: [email protected]
Abstract: Pain assessment is used to improve patients’ treatment outcomes. Human observers may beinfluenced by personal factors, such as inexperience and medical organizations are facing a shortageof experts. In this study, we developed a facial expressions-based automatic pain assessment system(FEAPAS) to notify medical staff when a patient suffers pain by activating an alarm and recordingthe incident and pain level with the date and time. The model consists of two identical concurrentsubsystems, each of which takes one of the two inputs of the model, i.e., “full face” and “the upperhalf of the same face”. The subsystems extract the relevant input features via two pre-trainedconvolutional neural networks (CNNs), using either VGG16, InceptionV3, ResNet50, or ResNeXt50,while freezing all convolutional blocks and replacing the classifier layer with a shallow CNN. Theconcatenated outputs in this stage is then sent to the model’s classifier. This approach mimics thehuman observer method and gives more importance to the upper part of the face, which is similarto the Prkachin and Soloman pain intensity (PSPI). Additionally, we further optimized our modelsby applying four optimizers (SGD/ADAM/RMSprop/RAdam) to each model and testing themon the UNBC-McMaster shoulder pain expression archive dataset to find the optimal combination,InceptionV3-SGD. The optimal model showed an accuracy of 99.10% on 10-fold cross-validation, thusoutperforming the state-of-the-art model on the UNBC-McMaster database. It also scored 90.56%on unseen subject data. To speed up the system response time and reduce unnecessary alarmsassociated with temporary facial expressions, a select but effective subset of frames was inspectedand classified. Two frame-selection criteria were reported. Classifying only two frames at the middleof 30-frame sequence was optimal, with an average reaction time of at most 6.49 s and the ability toavoid unnecessary alarms.
Keywords: computer vision; deep learning; inceptionv3; pain assessment; ResNet-50; ResNeXt50;transfer learning; VGG16
1. Introduction
Effective management of pain, including assessment and tracking overtime, is neces-sary to study the effectiveness of different treatments [1,2] and to avoid reaching chronicpain syndromes [2]. Pain can be assessed either by patients’ self-reporting or by medicalmember observations [1,3]. The self-report method on a verbal or visual scale is the goldstandard of pain assessment [1,4], but this method can be inaccurate and challenging inpeople with severely impaired communication ability (e.g., people with later stage demen-tia [5], burn-injured adults [1], neonates [6], intensive care patients [7], etc.). There aretwo common methods for pain assessment based on the observation principle: the CriticalCare Pain Observation Tool (CPOT) and the Pain Assessment in Advanced DementiaScale (PAINAD) [1]. The CPOT and PAINAD tools are designed for patients unable toself-report [1]. The CPOT assesses facial expressions, body movements, ventilator com-pliance, and muscle tension/rigidity, while the PAINAD assesses breathing, vocalization,facial expressions, body language, and consolability [1]. Facial expressions form the basic
Appl. Sci. 2022, 12, 6423. https://doi.org/10.3390/app12136423 https://www.mdpi.com/journal/applsci
Appl. Sci. 2022, 12, 6423 2 of 16
components of pain assessment in both the CPOT and PAINAD tools. Studies have shownthat periodically monitoring patient pain level in intensive care units in hospitals improvedpatient outcomes [8]. However, the medical member observations methods are highlysubjective; human observers may be influenced by personal factors [6] and observers needto have the required experience [9]. Further, contentious pain assessment monitoring mayfail and not be sustained when there is a shortage of medical experts [9]. These causes showthe need for an automatic system to monitor a patient’s pain level [6,8,9], which can alsobe used at home for elderly people [9]. A previous study that compared the performanceof a human observer’s pain assessment with that of an automated pain assessment fromfacial expressions concluded that the latter outperforms the former and is more reliable [6].However, the tasks of pain detection and assessment from the images is challenging dueto the diversity in head poses and environments, such as the illumination conditions andintensive occlusion [8,9]. Furthermore, patients tend to show a high variance in theirreactions and facial expressions to the same level of pain [8].
The actions that form the facial expression of feelings, such as lowering the eyebrowsor squinting, are called action units (AU) and each is assigned a unique code (e.g., AU6is lifting the cheeks). Regarding pain expression, six AU’s (AU4, 6, 7, 9, 10, and 43) havebeen found to be the most representative [10]. By assigning numerical values to those sixAUs, pain can be calculated via the Prkachin and Soloman pain intensity (PSPI) equation,as shown below:
PSPI pain = AU4 + max(AU6, AU7) + max(AU9, AU10) + AU43 (1)
This PSPI score determines pain intensity on a scale of 0 (no pain) to 16 (maximum pain).Below is a detailed explanation of the valuation of the six AUs used in PSPI:
• AU4 is the intensity of lowering the eyebrows on a scale from 0 to 5 (0 = not lowered,5 = maximally lowered).
• AU6 is the intensity of raising the cheeks on a scale from 0 to 5 (0 = not raised,5 = maximally raised).
• AU7 is the intensity of tightening the eyelid on a scale from 0 to 5 (0 = not tight,5 = very tight).
• AU9 is the intensity of wrinkling the nose on a scale from 0 to 5 (0 = not wrinkled,5 = very wrinkled).
• AU10 is the intensity of rising the upper lip on a scale from 0 to 5 (0 = not raised,5 = very raised).
• AU43 is whether the eyes are closed; represented as a binary value (0 = opened,1 = closed)
In this paper, we developed a new facial-expression-based automatic pain assessmentsystem (FEAPAS). The model uses a dual convolutional neural network classifier to detectpain from facial expressions. The dual model better imitates the human brain’s visualperception [11]. In this new model, we used the upper partition of detected faces, namelythe eyes/brow area, and the full face as input images for our dual classifier. Becauseour goal was to produce an online model with a fast response time to generate alerts ina timely manner, we avoided an extensive computation time typically needed for deeplearning system by using the optimal one of four pretrained networks (VGG16, InceptionV3,ResNet50, ResNeXt50) after freezing all the convolutional blocks and using the resultingweight in our shallow dual CNN classifier (e.g., transfer learning).
Using a camera, the proposed FEAPAS monitors a patient in bed; the backend codereads the video frame by frame and sends each frame to the classifier after detecting thepatient’s face and extracting the upper face area. An alarm is activated if the classifieroutputs a positive pain score. The specific frame is stored with the associated pain level,date, and time to include in the report for the medical team.
To achieve a fast and robust FEAPAS, the following two challenges must be overcome.First, the system’s performance heavily depends on the classifier’s performance; a classifier
Appl. Sci. 2022, 12, 6423 3 of 16
with high accuracy and a fast prediction process increases the system’s reliability. To obtainan efficient classifier and overcome the limited face shapes in the system training dataset,transfer-learning is used on four CNN models (VGG16, InceptionV3, ResNet50, ResNeXt50)via freezing convolutional layers and replacing the prediction layer with a shallow CNN.This is then tested with four different optimizers (SGD, ADAM, RMSprop, and RAdam).The following two critical measurements were considered when developing the optimalconcurrent shallow CNN with VGG16/InceptionV3/ResNnet50/ResNeXt50 with frozenlayers, i.e., the accuracy of 10-fold cross-validation and the accuracy of test data for anunseen subject. The resulting shallow model was embedded in our FEAPAS to generatetimely and accurate alerts.
The second challenge is to speed up the system’s response time. To do so, we selectivelysampled the frames being tested. Instead of testing every single frame in the input sequence,we tested two frame-selection approaches. The first approach tests two segments from eachend of a video sequence (boundary test), while the second tests one segment in the middleof the video sequence frames (middle test).
The rest of the paper is organized as follows: Section 2 reviews transfer learningmodels and optimizers; Section 3 includes previous research on automatic pain assessmentin chronological order; Section 4 describes the dataset and the proposed models; Section 5presents the experimental results; and Section 6 offers concluding remarks.
2. Background
The transfer learning method is used to speed up training process and improve theperformance of new untrained models by using the weights of an existing model [12].The concept of transfer learning is modeled after human intelligence by using the currentknowledge to solve new problems faster or better [13]. In transfer learning, the top layersof a pretrained model are frozen and specific layers above it are added to create a newmodel [12]. However, the benefit of transfer learning is affected by the data and task of thenew model [13]. We chose to test the four VGG16, InceptionV3,RestNet50, and ResNeXt50as possible platforms for classifier for FEAPAS because they have been widely successful inimage classification.
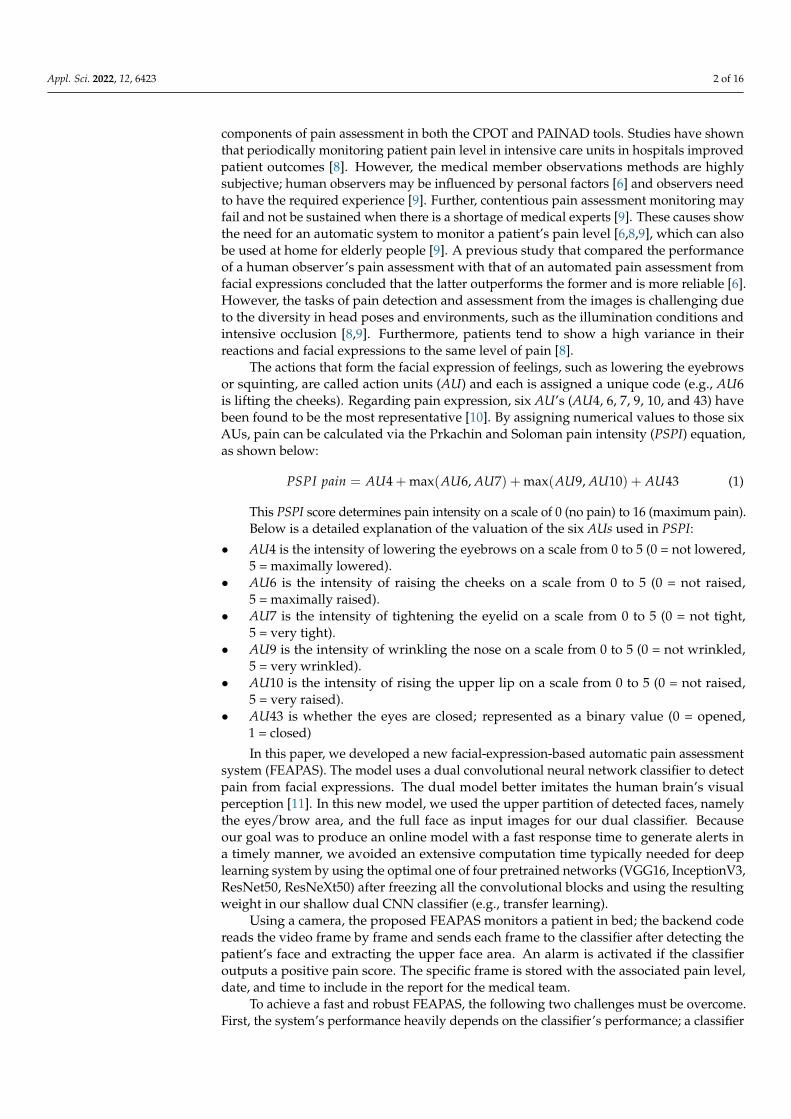
In the ILSVRC 2014 competition, Visual Geometry Group VGG16 was ranked the bestmethod in localization and second best in classification [12]. VGG16 addressed the depthof CNN architecture by adding more layers with small filters (3 × 3). VGG16 was trainedon ImageNet with 1000 classes. The structure of VGG16 is shown in Figure 1 [14].
Appl. Sci. 2022, 12, x FOR PEER REVIEW 3 of 16
To achieve a fast and robust FEAPAS, the following two challenges must be over-come. First, the system’s performance heavily depends on the classifier’s performance; a classifier with high accuracy and a fast prediction process increases the system’s reliabil-ity. To obtain an efficient classifier and overcome the limited face shapes in the system training dataset, transfer-learning is used on four CNN models (VGG16, InceptionV3, Res-Net50, ResNeXt50) via freezing convolutional layers and replacing the prediction layer with a shallow CNN. This is then tested with four different optimizers (SGD, ADAM, RMSprop, and RAdam). The following two critical measurements were considered when developing the optimal concurrent shallow CNN with VGG16/InceptionV3/Res-Nnet50/ResNeXt50 with frozen layers, i.e., the accuracy of 10-fold cross-validation and the accuracy of test data for an unseen subject. The resulting shallow model was embedded in our FEAPAS to generate timely and accurate alerts.
The second challenge is to speed up the system’s response time. To do so, we selec-tively sampled the frames being tested. Instead of testing every single frame in the input sequence, we tested two frame-selection approaches. The first approach tests two seg-ments from each end of a video sequence (boundary test), while the second tests one seg-ment in the middle of the video sequence frames (middle test).
The rest of the paper is organized as follows: Section 2 reviews transfer learning mod-els and optimizers; Section 3 includes previous research on automatic pain assessment in chronological order; Section 4 describes the dataset and the proposed models; Section 5 presents the experimental results; and Section 6 offers concluding remarks.
2. Background The transfer learning method is used to speed up training process and improve the
performance of new untrained models by using the weights of an existing model [12]. The concept of transfer learning is modeled after human intelligence by using the current knowledge to solve new problems faster or better [13]. In transfer learning, the top layers of a pretrained model are frozen and specific layers above it are added to create a new model [12]. However, the benefit of transfer learning is affected by the data and task of the new model [13]. We chose to test the four VGG16, InceptionV3,RestNet50, and Res-NeXt50 as possible platforms for classifier for FEAPAS because they have been widely successful in image classification.
In the ILSVRC 2014 competition, Visual Geometry Group VGG16 was ranked the best method in localization and second best in classification [12]. VGG16 addressed the depth of CNN architecture by adding more layers with small filters (3 × 3). VGG16 was trained on ImageNet with 1000 classes. The structure of VGG16 is shown in Figure 1 [14].
Figure 1. VGG16 architecture where each color represents a block of layers with the same kernel size.
InceptionV1 won the ILSVRC 2014 classification. It was proposed to overcome the overfitting of the data in the deep convolutional neural networks by using multiple filters
Figure 1. VGG16 architecture where each color represents a block of layers with the same kernel size.
InceptionV1 won the ILSVRC 2014 classification. It was proposed to overcome theoverfitting of the data in the deep convolutional neural networks by using multiple filters ofdifferent sizes on the same level [15]. InceptionV3 is designed to optimize the performance
Appl. Sci. 2022, 12, 6423 4 of 16
of the previous versions of inception which suffer from high computations by applyingfactorized convolutions and aggressive regularization [16].
The residual neural network (ResNet) won ILSVRC 2015 in image classification, de-tection, and localization. Moreover, it won MS COCO 2015 detection and segmentation.ResNet was inspired by VGG even though it is deeper and less complex [17].
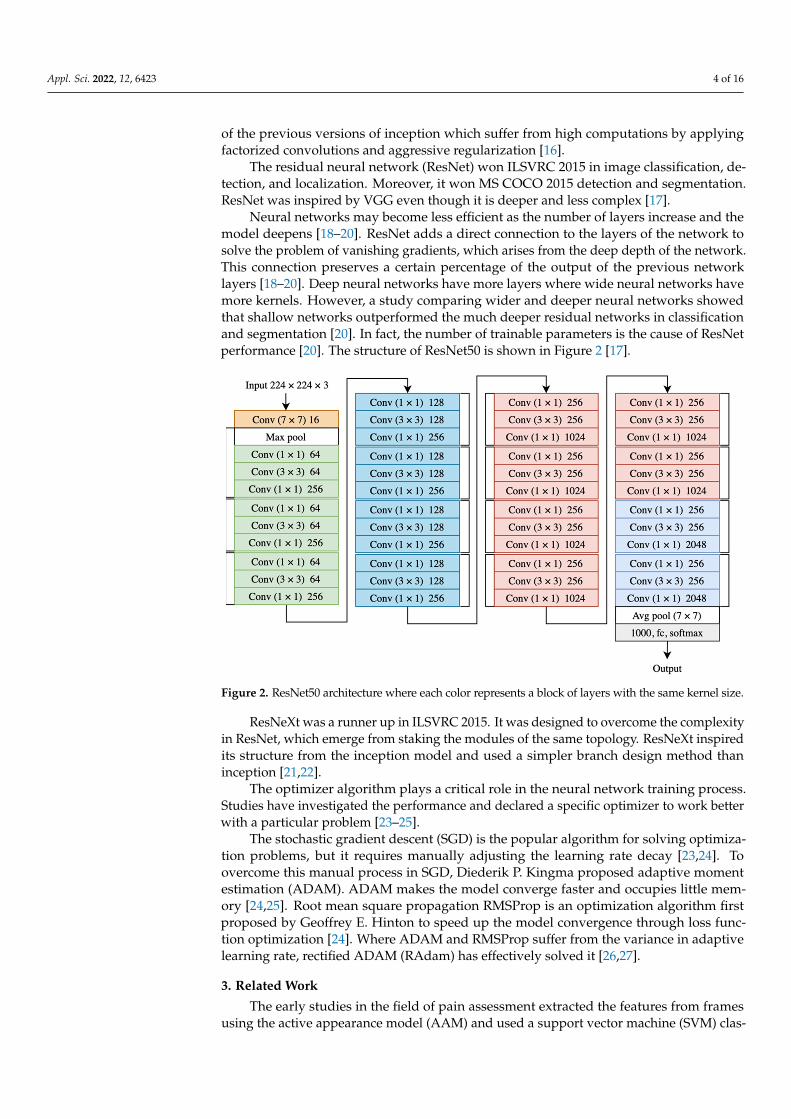
Neural networks may become less efficient as the number of layers increase and themodel deepens [18–20]. ResNet adds a direct connection to the layers of the network tosolve the problem of vanishing gradients, which arises from the deep depth of the network.This connection preserves a certain percentage of the output of the previous networklayers [18–20]. Deep neural networks have more layers where wide neural networks havemore kernels. However, a study comparing wider and deeper neural networks showedthat shallow networks outperformed the much deeper residual networks in classificationand segmentation [20]. In fact, the number of trainable parameters is the cause of ResNetperformance [20]. The structure of ResNet50 is shown in Figure 2 [17].
Appl. Sci. 2022, 12, x FOR PEER REVIEW 4 of 16
of different sizes on the same level [15]. InceptionV3 is designed to optimize the perfor-mance of the previous versions of inception which suffer from high computations by ap-plying factorized convolutions and aggressive regularization [16].
The residual neural network (ResNet) won ILSVRC 2015 in image classification, de-tection, and localization. Moreover, it won MS COCO 2015 detection and segmentation. ResNet was inspired by VGG even though it is deeper and less complex [17].
Neural networks may become less efficient as the number of layers increase and the model deepens [18–20]. ResNet adds a direct connection to the layers of the network to solve the problem of vanishing gradients, which arises from the deep depth of the net-work. This connection preserves a certain percentage of the output of the previous net-work layers [18–20]. Deep neural networks have more layers where wide neural networks have more kernels. However, a study comparing wider and deeper neural networks showed that shallow networks outperformed the much deeper residual networks in clas-sification and segmentation [20]. In fact, the number of trainable parameters is the cause of ResNet performance [20]. The structure of ResNet50 is shown in Figure 2 [17].
Figure 2. ResNet50 architecture where each color represents a block of layers with the same kernel size.
ResNeXt was a runner up in ILSVRC 2015. It was designed to overcome the complex-ity in ResNet, which emerge from staking the modules of the same topology. ResNeXt inspired its structure from the inception model and used a simpler branch design method than inception [21,22].
The optimizer algorithm plays a critical role in the neural network training process. Studies have investigated the performance and declared a specific optimizer to work bet-ter with a particular problem [23–25].
The stochastic gradient descent (SGD) is the popular algorithm for solving optimiza-tion problems, but it requires manually adjusting the learning rate decay [23,24]. To over-come this manual process in SGD, Diederik P. Kingma proposed adaptive moment esti-mation (ADAM). ADAM makes the model converge faster and occupies little memory [24,25]. Root mean square propagation RMSProp is an optimization algorithm first pro-posed by Geoffrey E. Hinton to speed up the model convergence through loss function optimization [24]. Where ADAM and RMSProp suffer from the variance in adaptive learn-ing rate, rectified ADAM (RAdam) has effectively solved it [26,27].
Figure 2. ResNet50 architecture where each color represents a block of layers with the same kernel size.
ResNeXt was a runner up in ILSVRC 2015. It was designed to overcome the complexityin ResNet, which emerge from staking the modules of the same topology. ResNeXt inspiredits structure from the inception model and used a simpler branch design method thaninception [21,22].
The optimizer algorithm plays a critical role in the neural network training process.Studies have investigated the performance and declared a specific optimizer to work betterwith a particular problem [23–25].
The stochastic gradient descent (SGD) is the popular algorithm for solving optimiza-tion problems, but it requires manually adjusting the learning rate decay [23,24]. Toovercome this manual process in SGD, Diederik P. Kingma proposed adaptive momentestimation (ADAM). ADAM makes the model converge faster and occupies little mem-ory [24,25]. Root mean square propagation RMSProp is an optimization algorithm firstproposed by Geoffrey E. Hinton to speed up the model convergence through loss func-tion optimization [24]. Where ADAM and RMSProp suffer from the variance in adaptivelearning rate, rectified ADAM (RAdam) has effectively solved it [26,27].
3. Related Work
The early studies in the field of pain assessment extracted the features from framesusing the active appearance model (AAM) and used a support vector machine (SVM) clas-

Appl. Sci. 2022, 12, 6423 5 of 16
sifier [28,29] to create automated pain assessment systems. Khan et al. [30] later comparedSVM in their proposed framework for pain along with three other classifiers (decision tree(DT), random forest (RF), and 2 nearest neighbors (2NN) based on Euclidean distance).Their framework detects the face from a frame, horizontally halves the detected face, anduses the halves as the two inputs of the model; it employs the shape information using apyramid histogram of oriented gradients (PHOG) and the appearance information using apyramid local binary pattern (PLBP) to obtain a unique representation of the face. However,more recent pain assessments utilize neural networks. Zhou et al. [31] utilized the recurrentconvolutional neural network (RCNN) to introduce a real-time regression framework forautomatic pain intensity estimation, while Rodriguez et al. [32] employed the advantage ofcombining CNNs with long short-term memory (LSTM) in their model. Some researcherseven used dual models that consisted of a fusion structure of CNNs, such as Semwal andLondhe, who used two shallow neural networks—spatial appearance network (SANET)and shape descriptor network (SDNET)—in one model [9], and multiple neural networksin another [33].
Inspired by Khan et al. [30], our proposed model used two inputs based on thedetected face parts to mimic the PSPI code; however, instead of using both halves of theface we used the full face as one input and the upper face for the other input. We employedneural networks for automatic feature extraction from frames, just as [31] and [32] did.However, instead of RCNN or a combination of CNNs and LSTM, we employed theVGG16, InceptionV3, ResNet50, and ResNeXt50 each with a shallow CNN replacing theclassifier layer.
The higher accuracy obtained by [9] and [33] encouraged us to adopt a fusion structureof CNNs.
We compared our model’s performance to the aforementioned models [9,30,32,33]that used the same dataset (UNBC-McMaster shoulder pain expression archive), as well asthe measurement strategy (the k-fold cross validation accuracy), as ours. Vaish and Sagar’sstate-of-the-art model [34], which employed Kaze algorithm to extract features from thedetected face, obtains a fisher vector and sends it to an SVM classifier. It also uses the sametesting dataset and metric measurements. Therefore, we compared our results against it.The resulting optimal model is then embedded in our FEAPAS system.
4. Methodology4.1. Dataset
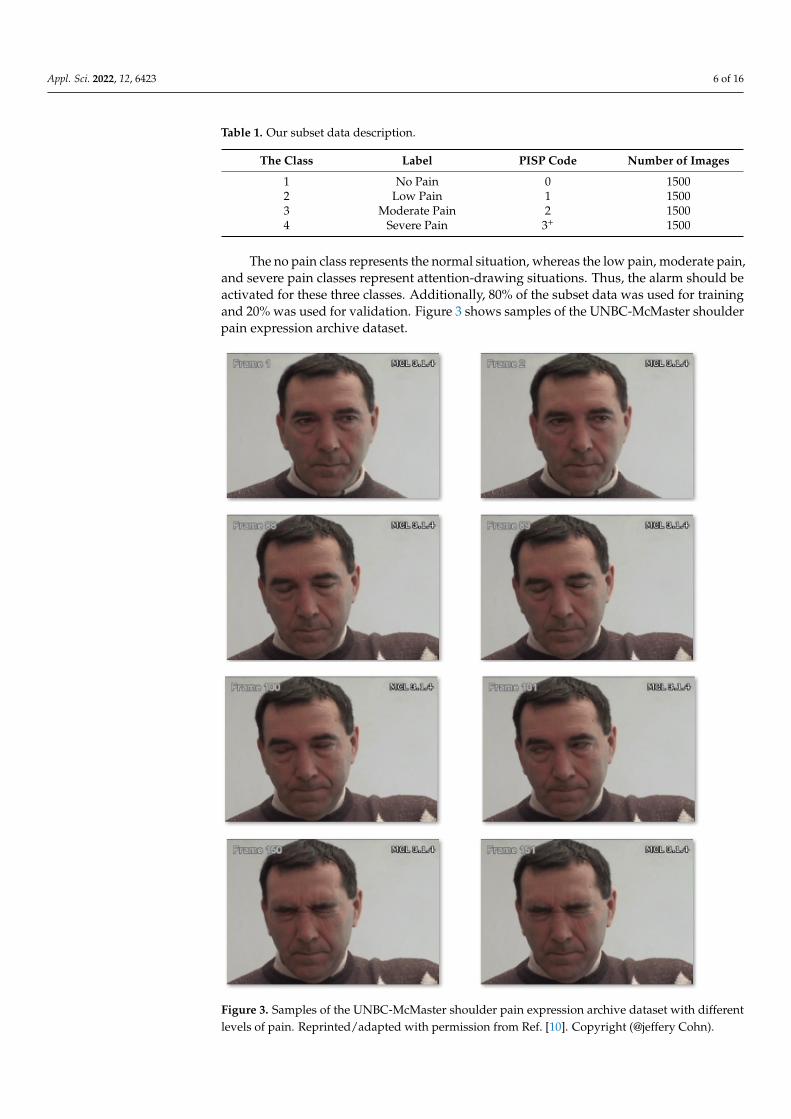
In this study, we used a subset of the UNBC-McMaster shoulder pain expressionarchive dataset [10]. To develop an automatic pain assessment system based on facialexpressions, researchers at McMaster University and the University of Northern BritishColumbia recorded 200 sequences for 25 adult participants (12 males and 13 females) suf-fering from shoulder pain. The recording sessions were conducted while the participantswere performing a series of active and passive physical tests on their affected and unaf-fected limbs. The UNBC-McMaster shoulder pain expression archive dataset consists of200 sequences with a total of 48,398 colored frames of 320 × 240 pixels.
The UNBC-McMaster shoulder pain expression archive dataset is highly imbalanced;82.71% represents the “no pain” class with 40,029 images and only 17.29% represents thedifferent levels of pain with 8369 images. Thus, using the full dataset may result in abiased classification, as shown in [9,33]. To avoid such potential bias, we used a subset with6000 randomly selected frames of 24 participants. We classified the subset dataset into fourclasses: no pain, low pain, moderate pain, and severe pain. Each had 1500 frames. The nopain class included images with PSPI equals zero. The low pain class included images withPSPI equals 1. The moderate pain class included images with a PSPI equal to 2. The severepain class included images with a PSPI equal to or greater than 3. Table 1 shows details ofour subset data.
Appl. Sci. 2022, 12, 6423 6 of 16
Table 1. Our subset data description.
The Class Label PISP Code Number of Images
1 No Pain 0 15002 Low Pain 1 15003 Moderate Pain 2 15004 Severe Pain 3+ 1500
The no pain class represents the normal situation, whereas the low pain, moderate pain,and severe pain classes represent attention-drawing situations. Thus, the alarm should beactivated for these three classes. Additionally, 80% of the subset data was used for trainingand 20% was used for validation. Figure 3 shows samples of the UNBC-McMaster shoulderpain expression archive dataset.
Appl. Sci. 2022, 12, x FOR PEER REVIEW 6 of 16
2. The severe pain class included images with a PSPI equal to or greater than 3. Table 1 shows details of our subset data.
Table 1. Our subset data description.
The Class Label PISP Code Number of Images 1 No Pain 0 1500 2 Low Pain 1 1500 3 Moderate Pain 2 1500 4 Severe Pain 3+ 1500
The no pain class represents the normal situation, whereas the low pain, moderate pain, and severe pain classes represent attention-drawing situations. Thus, the alarm should be activated for these three classes. Additionally, 80% of the subset data was used for training and 20% was used for validation. Figure 3 shows samples of the UNBC-McMaster shoulder pain expression archive dataset.
Figure 3. Samples of the UNBC-McMaster shoulder pain expression archive dataset with different levels of pain. Reprinted/adapted with permission from Ref. [10]. Copyright (@jeffery Cohn). Figure 3. Samples of the UNBC-McMaster shoulder pain expression archive dataset with differentlevels of pain. Reprinted/adapted with permission from Ref. [10]. Copyright (@jeffery Cohn).

Appl. Sci. 2022, 12, 6423 7 of 16
To test the data, we used all frames that belonged to the unseen participant. They werecoded as “064-ak064” and totaled 1611 frames.
To validate the FEAPAS, the consecutive frames in the unseen testing sequences weremerged using OpenCV library to create 6 test videos (one for each sequence) with 4 framesper second each. Table 2 shows details of each video.
Table 2. Testing videos description.
The Video Label Number of Merged Frames Duration in Second
Video 1 Sever pain 397 99Video 2 Sever pain 308 77Video 3 Sever pain 337 84Video 4 No pain 142 35Video 5 Sever pain 263 65Video 6 No pain 165 41
4.2. Data Preprocessing
Face detection is a critical process in pain assessment models. In [30,34], researchersused the Viola Jones object detection algorithm [35] to detect the face before feeding thedata to the model. In [3,33], researchers used the multi-task cascades neural network(MTCNN) [36] for face localization purposes as a milestone step in preparing the data.Due to good results of MTCNN in detecting faces, especially when compared against HaarCascades, we used MTCNN for face detection and removed unnecessary information ineach image. The next step was to divide the detected face into two parts: an upper part,which contained the eyes and eyebrows, and a lower part, which contained the nose, mouth,and chin [30]. We used OpenCV for this task. Unlike in a previous study [30], where theupper and lower parts of the detected face were used as inputs to the model, we used theupper face and the full face as inputs to simulate the PSPI code as a way to focus more onthe eyes and brows than the lower face.
To measure the impact of illumination and head rotation in our model performance,we used the OpenCV library to vary the brightness and rotation of the testing data ofunseen subject.
4.3. The Model
This study was conducted in two phases. First, we developed a robust classifier todetect when a person was in pain. Second, we developed an efficient system capable ofdetecting when a person was in pain, generating an alarm while minimizing false alarms.
4.3.1. Classifier
The UNBC-McMaster shoulder pain expression archive dataset, which we used totrain our system, resulted from experiments conducted on 25 participants, providing littleface-shape variation. To overcome the limitations of face shape variety and to combatoverfitting due to data scarcity, we used ImageNet weights to initialize our models beforefine-tuning our custom dataset. This approach yielded better results than training eachmodel from scratch on the domain dataset. Our model extracted features from the detectedface and the upper part of the detected face of our subset dataset using VGG16 in the firstexperiment, InceptionV3 in the second experiment, ResNet50 in the third experiment, andResNeXt50 in the fourth experiment after freezing the convolutional blocks and droppingthe final prediction layers. Transfer learning processes in VGG16 and ResNet50 wereconducted by extracting the feature vectors and freezing all convolutional blocks, as wellas feeding the output to our new classifier (Figure 4).

Appl. Sci. 2022, 12, 6423 8 of 16
Appl. Sci. 2022, 12, x FOR PEER REVIEW 8 of 16
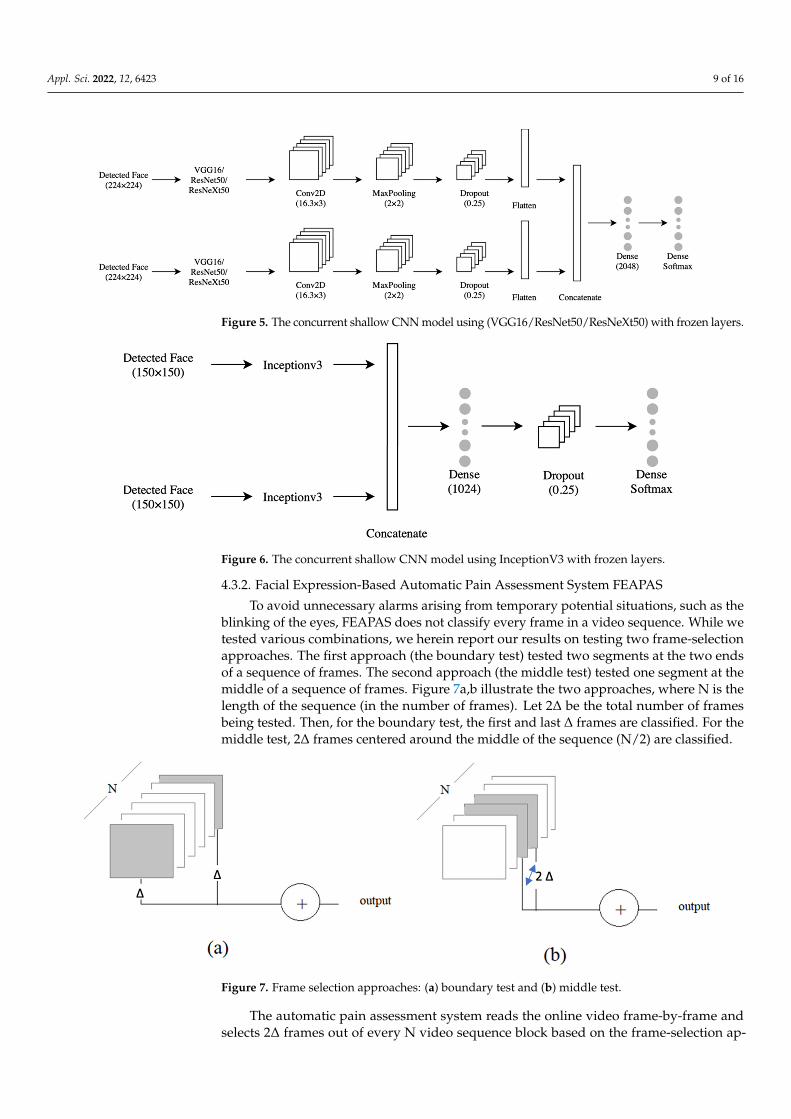
layer concurrent shallow CNN to increase the model accuracy. The features were ex-tracted from two inputs: the lower face and the upper face. They were sent to two identical shallow CNNs, each consisting of four layers (Figure 5). The first layer was convolution (Conv2D), which contained 16 neurons, a (3 × 3) filter, and Relu activation function. The second layer was the max-pooling layer, which had a (2 × 2) filter. The third layer was the dropout with a probability of 0.25. The fourth layer was a flattened layer. The output of each branch of CNN was concatenated and sent to a dense layer with 2048 neurons, then to a fully connected layer to classify the data. The shallow CNNs parameters above were chosen after extensive experiments with different values. The InceptionV3 model is shown in Figure 6. The models were trained with four optimizers (i.e., SGD-ADAM-RSM-prop-RAdam). The differentiation between these 16 models was based on the higher ac-curacy of 10-fold cross-validation and testing data of the unseen subject. The best model was subjected to a few more tests to measure its performance under different brightness and rotations. These brightness/rotations tests were conducted on the modified testing data, as described in Section 4.2.
Figure 4. The transfer learning using (a) VGG16 and (b)ResNet50. Figure 4. The transfer learning using (a) VGG16 and (b)ResNet50.
Using VGG16, ResNet50, or ResNeXt50 alone did not meet the desired accuracy. Weused them to extract the relevant features and replaced their prediction layers with a 4-layerconcurrent shallow CNN to increase the model accuracy. The features were extracted fromtwo inputs: the lower face and the upper face. They were sent to two identical shallowCNNs, each consisting of four layers (Figure 5). The first layer was convolution (Conv2D),which contained 16 neurons, a (3 × 3) filter, and Relu activation function. The second layerwas the max-pooling layer, which had a (2 × 2) filter. The third layer was the dropout witha probability of 0.25. The fourth layer was a flattened layer. The output of each branchof CNN was concatenated and sent to a dense layer with 2048 neurons, then to a fullyconnected layer to classify the data. The shallow CNNs parameters above were chosen afterextensive experiments with different values. The InceptionV3 model is shown in Figure 6.The models were trained with four optimizers (i.e., SGD-ADAM-RSMprop-RAdam). Thedifferentiation between these 16 models was based on the higher accuracy of 10-fold cross-validation and testing data of the unseen subject. The best model was subjected to a fewmore tests to measure its performance under different brightness and rotations. Thesebrightness/rotations tests were conducted on the modified testing data, as described inSection 4.2.
Appl. Sci. 2022, 12, 6423 9 of 16Appl. Sci. 2022, 12, x FOR PEER REVIEW 9 of 16
Figure 5. The concurrent shallow CNN model using (VGG16/ResNet50/ResNeXt50) with frozen lay-ers.
Figure 6. The concurrent shallow CNN model using InceptionV3 with frozen layers.
4.3.2. Facial Expression-Based Automatic Pain Assessment System FEAPAS To avoid unnecessary alarms arising from temporary potential situations, such as the
blinking of the eyes, FEAPAS does not classify every frame in a video sequence. While we tested various combinations, we herein report our results on testing two frame-selection approaches. The first approach (the boundary test) tested two segments at the two ends of a sequence of frames. The second approach (the middle test) tested one segment at the middle of a sequence of frames. Figure 7a,b illustrate the two approaches, where N is the length of the sequence (in the number of frames). Let 2Δ be the total number of frames being tested. Then, for the boundary test, the first and last Δ frames are classified. For the middle test, 2Δ frames centered around the middle of the sequence (N/2) are classified.
Figure 7. Frame selection approaches: (a) boundary test and (b) middle test.
Figure 5. The concurrent shallow CNN model using (VGG16/ResNet50/ResNeXt50) with frozen layers.
Appl. Sci. 2022, 12, x FOR PEER REVIEW 9 of 16
Figure 5. The concurrent shallow CNN model using (VGG16/ResNet50/ResNeXt50) with frozen lay-ers.
Figure 6. The concurrent shallow CNN model using InceptionV3 with frozen layers.
4.3.2. Facial Expression-Based Automatic Pain Assessment System FEAPAS To avoid unnecessary alarms arising from temporary potential situations, such as the
blinking of the eyes, FEAPAS does not classify every frame in a video sequence. While we tested various combinations, we herein report our results on testing two frame-selection approaches. The first approach (the boundary test) tested two segments at the two ends of a sequence of frames. The second approach (the middle test) tested one segment at the middle of a sequence of frames. Figure 7a,b illustrate the two approaches, where N is the length of the sequence (in the number of frames). Let 2Δ be the total number of frames being tested. Then, for the boundary test, the first and last Δ frames are classified. For the middle test, 2Δ frames centered around the middle of the sequence (N/2) are classified.
Figure 7. Frame selection approaches: (a) boundary test and (b) middle test.
Figure 6. The concurrent shallow CNN model using InceptionV3 with frozen layers.
4.3.2. Facial Expression-Based Automatic Pain Assessment System FEAPAS
To avoid unnecessary alarms arising from temporary potential situations, such as theblinking of the eyes, FEAPAS does not classify every frame in a video sequence. While wetested various combinations, we herein report our results on testing two frame-selectionapproaches. The first approach (the boundary test) tested two segments at the two endsof a sequence of frames. The second approach (the middle test) tested one segment at themiddle of a sequence of frames. Figure 7a,b illustrate the two approaches, where N is thelength of the sequence (in the number of frames). Let 2∆ be the total number of framesbeing tested. Then, for the boundary test, the first and last ∆ frames are classified. For themiddle test, 2∆ frames centered around the middle of the sequence (N/2) are classified.
Appl. Sci. 2022, 12, x FOR PEER REVIEW 9 of 16
Figure 5. The concurrent shallow CNN model using (VGG16/ResNet50/ResNeXt50) with frozen lay-ers.
Figure 6. The concurrent shallow CNN model using InceptionV3 with frozen layers.
4.3.2. Facial Expression-Based Automatic Pain Assessment System FEAPAS To avoid unnecessary alarms arising from temporary potential situations, such as the
blinking of the eyes, FEAPAS does not classify every frame in a video sequence. While we tested various combinations, we herein report our results on testing two frame-selection approaches. The first approach (the boundary test) tested two segments at the two ends of a sequence of frames. The second approach (the middle test) tested one segment at the middle of a sequence of frames. Figure 7a,b illustrate the two approaches, where N is the length of the sequence (in the number of frames). Let 2Δ be the total number of frames being tested. Then, for the boundary test, the first and last Δ frames are classified. For the middle test, 2Δ frames centered around the middle of the sequence (N/2) are classified.
Figure 7. Frame selection approaches: (a) boundary test and (b) middle test.
Figure 7. Frame selection approaches: (a) boundary test and (b) middle test.
The automatic pain assessment system reads the online video frame-by-frame andselects 2∆ frames out of every N video sequence block based on the frame-selection ap-

Appl. Sci. 2022, 12, 6423 10 of 16
proach. The selected frames are then processed to obtain the inputs of the InceptionV3-SGDclassifier, which is the upper- and full-face partitions. If the classifier’s output is not set tono pain for all tested frames in the N-frame sequence, then the alarm is activated. Figure 8shows a high-level flow chart of the automatic pain assessment system, FEAPAS. In theboundary testing frame-selection method, the final decision is taken after classifying thelast frame in the sequence, but, in the middle testing approach, the decision is immediatelyreleased after reading half the number of frames in the sequence, which speeds up theresponse time.
Appl. Sci. 2022, 12, x FOR PEER REVIEW 10 of 16
The automatic pain assessment system reads the online video frame-by-frame and selects 2Δ frames out of every N video sequence block based on the frame-selection ap-proach. The selected frames are then processed to obtain the inputs of the InceptionV3-SGD classifier, which is the upper- and full-face partitions. If the classifier’s output is not set to no pain for all tested frames in the N-frame sequence, then the alarm is activated. Figure 8 shows a high-level flow chart of the automatic pain assessment system, FEAPAS. In the boundary testing frame-selection method, the final decision is taken after classify-ing the last frame in the sequence, but, in the middle testing approach, the decision is immediately released after reading half the number of frames in the sequence, which speeds up the response time.
Figure 8. FEAPAS flow chart.
We used Anaconda on a GPU Tesla P100-SXM2 [37] to build and train the models. To test the selection frame approaches on FEAPAS, we used a CPU Intel Core i7-8750 (2.20GHz and 8 GB RAM), with a Windows 10 64-bit operating system (Anaconda 5.3.1.) [38]; Library Keras 2.2.4. [39]; Library OpenCV 4.4.0. [40]; and programming language Python 3.7.3.
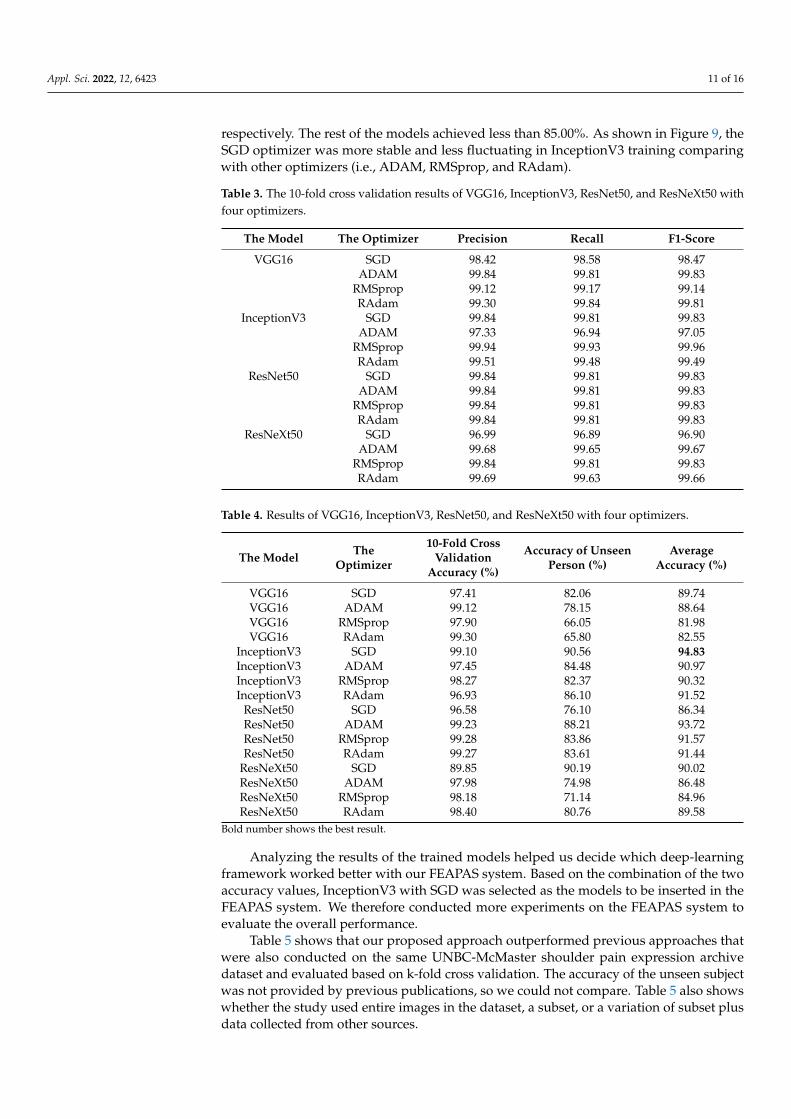
5. Results Table 3 shows the 10-fold cross validation results of the 16 models (precision, recall,
and F1-score). Table 4 shows the results of the phase that tested the two classifier plat-forms in terms of the 10-fold cross validation accuracy and data of unseen subject for 16 assortments made up of four models and four optimizers trained on the UNBC-McMaster shoulder pain expression archive dataset. All 16 models showed high accuracy and achieved more than 96.00% for 10-fold cross validation, except for ResNeXt50 with SGD. For an unseen subject, InceptionV3 with SGD and ResNeXt50 with SGD achieved 90.56%
Figure 8. FEAPAS flow chart.
We used Anaconda on a GPU Tesla P100-SXM2 [37] to build and train the models. Totest the selection frame approaches on FEAPAS, we used a CPU Intel Core i7-8750 (2.20GHzand 8 GB RAM), with a Windows 10 64-bit operating system (Anaconda 5.3.1.) [38]; LibraryKeras 2.2.4. [39]; Library OpenCV 4.4.0. [40]; and programming language Python 3.7.3.
5. Results
Table 3 shows the 10-fold cross validation results of the 16 models (precision, recall, andF1-score). Table 4 shows the results of the phase that tested the two classifier platforms interms of the 10-fold cross validation accuracy and data of unseen subject for 16 assortmentsmade up of four models and four optimizers trained on the UNBC-McMaster shoulder painexpression archive dataset. All 16 models showed high accuracy and achieved more than96.00% for 10-fold cross validation, except for ResNeXt50 with SGD. For an unseen subject,InceptionV3 with SGD and ResNeXt50 with SGD achieved 90.56% and 90.19, respectively,whereas ResNet50 with ADAM and InceptionV3 with RAdam achieved 88.21% and 86.10%,
Appl. Sci. 2022, 12, 6423 11 of 16
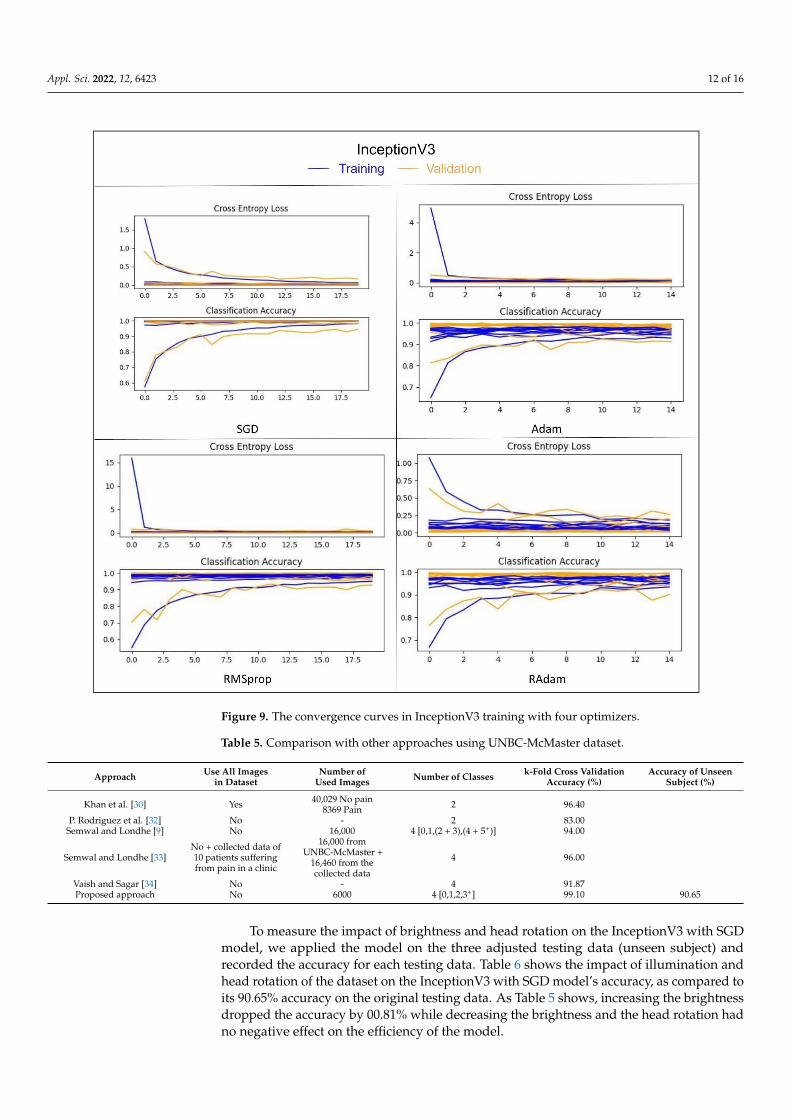
respectively. The rest of the models achieved less than 85.00%. As shown in Figure 9, theSGD optimizer was more stable and less fluctuating in InceptionV3 training comparingwith other optimizers (i.e., ADAM, RMSprop, and RAdam).
Table 3. The 10-fold cross validation results of VGG16, InceptionV3, ResNet50, and ResNeXt50 withfour optimizers.
The Model The Optimizer Precision Recall F1-Score
VGG16 SGD 98.42 98.58 98.47ADAM 99.84 99.81 99.83
RMSprop 99.12 99.17 99.14RAdam 99.30 99.84 99.81
InceptionV3 SGD 99.84 99.81 99.83ADAM 97.33 96.94 97.05
RMSprop 99.94 99.93 99.96RAdam 99.51 99.48 99.49
ResNet50 SGD 99.84 99.81 99.83ADAM 99.84 99.81 99.83
RMSprop 99.84 99.81 99.83RAdam 99.84 99.81 99.83
ResNeXt50 SGD 96.99 96.89 96.90ADAM 99.68 99.65 99.67
RMSprop 99.84 99.81 99.83RAdam 99.69 99.63 99.66
Table 4. Results of VGG16, InceptionV3, ResNet50, and ResNeXt50 with four optimizers.
The Model TheOptimizer
10-Fold CrossValidation
Accuracy (%)
Accuracy of UnseenPerson (%)
AverageAccuracy (%)
VGG16 SGD 97.41 82.06 89.74VGG16 ADAM 99.12 78.15 88.64VGG16 RMSprop 97.90 66.05 81.98VGG16 RAdam 99.30 65.80 82.55
InceptionV3 SGD 99.10 90.56 94.83InceptionV3 ADAM 97.45 84.48 90.97InceptionV3 RMSprop 98.27 82.37 90.32InceptionV3 RAdam 96.93 86.10 91.52
ResNet50 SGD 96.58 76.10 86.34ResNet50 ADAM 99.23 88.21 93.72ResNet50 RMSprop 99.28 83.86 91.57ResNet50 RAdam 99.27 83.61 91.44
ResNeXt50 SGD 89.85 90.19 90.02ResNeXt50 ADAM 97.98 74.98 86.48ResNeXt50 RMSprop 98.18 71.14 84.96ResNeXt50 RAdam 98.40 80.76 89.58
Bold number shows the best result.
Analyzing the results of the trained models helped us decide which deep-learningframework worked better with our FEAPAS system. Based on the combination of the twoaccuracy values, InceptionV3 with SGD was selected as the models to be inserted in theFEAPAS system. We therefore conducted more experiments on the FEAPAS system toevaluate the overall performance.
Table 5 shows that our proposed approach outperformed previous approaches thatwere also conducted on the same UNBC-McMaster shoulder pain expression archivedataset and evaluated based on k-fold cross validation. The accuracy of the unseen subjectwas not provided by previous publications, so we could not compare. Table 5 also showswhether the study used entire images in the dataset, a subset, or a variation of subset plusdata collected from other sources.
Appl. Sci. 2022, 12, 6423 12 of 16Appl. Sci. 2022, 12, x FOR PEER REVIEW 12 of 16
Figure 9. The convergence curves in InceptionV3 training with four optimizers.
Table 5 shows that our proposed approach outperformed previous approaches that were also conducted on the same UNBC-McMaster shoulder pain expression archive da-taset and evaluated based on k-fold cross validation. The accuracy of the unseen subject was not provided by previous publications, so we could not compare. Table 5 also shows whether the study used entire images in the dataset, a subset, or a variation of subset plus data collected from other sources.
Table 5. Comparison with other approaches using UNBC-McMaster dataset.
Approach Use All Images in
Dataset Number of Used Im-
ages Number of Classes k-Fold Cross Validation
Accuracy (%) Accuracy of Unseen
Subject (%)
Khan et al. [30] Yes 40,029 No pain
8369 Pain 2 96.40
P. Rodriguez et al. [32] No - 2 83.00 Semwal and Londhe [9] No 16,000 4 [0,1,(2 + 3),(4 + 5+)] 94.00
Semwal and Londhe [33] No + collected data of 10 patients suffering from pain in a clinic
16,000 from UNBC-McMaster + 16,460
from the collected data 4 96.00
Vaish and Sagar [34] No - 4 91.87 Proposed approach No 6000 4 [0,1,2,3+] 99.10 90.65
Figure 9. The convergence curves in InceptionV3 training with four optimizers.
Table 5. Comparison with other approaches using UNBC-McMaster dataset.
Approach Use All Imagesin Dataset
Number ofUsed Images Number of Classes k-Fold Cross Validation
Accuracy (%)Accuracy of Unseen
Subject (%)
Khan et al. [30] Yes 40,029 No pain8369 Pain 2 96.40
P. Rodriguez et al. [32] No - 2 83.00Semwal and Londhe [9] No 16,000 4 [0,1,(2 + 3),(4 + 5+)] 94.00
Semwal and Londhe [33]No + collected data of10 patients sufferingfrom pain in a clinic
16,000 fromUNBC-McMaster +
16,460 from thecollected data
4 96.00
Vaish and Sagar [34] No - 4 91.87Proposed approach No 6000 4 [0,1,2,3+] 99.10 90.65
To measure the impact of brightness and head rotation on the InceptionV3 with SGDmodel, we applied the model on the three adjusted testing data (unseen subject) andrecorded the accuracy for each testing data. Table 6 shows the impact of illumination andhead rotation of the dataset on the InceptionV3 with SGD model’s accuracy, as compared toits 90.65% accuracy on the original testing data. As Table 5 shows, increasing the brightnessdropped the accuracy by 00.81% while decreasing the brightness and the head rotation hadno negative effect on the efficiency of the model.

Appl. Sci. 2022, 12, 6423 13 of 16
Table 6. The impact of brightness and head rotation on the InceptionV3_SGD model.
Dataset Accuracy (%) Performance (%)
The brightened images 89.75 −00.81The dimmed images 91.56 +00.91
The images with a slight rotation. 91.17 +00.52
To test the response time of our system, we ran FEAPAS four times, i.e., twice for eachframe selection approach using sequence length values (N = 30).
The experiment was conducted by playing the test videos on a screen and directingthe laptop’s webcam to the screen to mimic a real live feed. A stopwatch was used to recordthe time, at which point the alarm was activated.
We tested the following four scenarios with a sequence length of N = 30. The middleand boundary frame selection strategies with a segment length of 2∆ are as follows:
• One frame at each end of the sequence: two-boundary test frames: 2-B, ∆ = 1• Two frames at the middle of the sequence: two-middle test frames: 2-M, ∆ = 1• Two frames at each end of the sequence: four-boundary test frames: 4-B, ∆ = 2• Four frames at the middle of the sequence: four-middle test frames: 4-M, ∆ = 2
Table 7 shows the impact of frame selection approach in response time. The largersegment length required more frames to be classified, which thus led to longer responsetime. Finishing classification at the middle or at the end of the sequence was an importantfactor and should be considered in future studies. Moreover, 2-M-30 showed the lowestaverage response time of 6.49 s, and 4-B-30 showed the highest average response time of29.86 s.
Table 7. The response time in seconds for four running, where B denotes boundary testing andM denotes middle testing. Further, [2–4] is the number of testing frames and [30] is the length ofsequence. For example, 4-B-30 indicated that the FEAPAS tested four frames on the boundary of thesequence with 30 frames for each decision. If all four frames are classified as pain, then FEAPASactivates the alarm and stores the tested frames/images with date, time, and pain level.
2-B-30 2-M-30 4-B-30 4-M-30
Video 1 32.97 12.34 40.38 15.93Video 2 03.33 02.95 06.70 12.45Video 3 07.05 06.09 07.76 06.11Video 4 No alarm No alarm No alarm No alarmVideo 5 48.31 06.89 51.96 07.11Video 6 No alarm No alarm No alarm No alarm
The average 27.68 6.49 29.86 6.61
Figure 10 shows the output of FEAPAS on video 1 by using the 2-B-30 selected framestrategy. The FEAPAS stored the captured frames and classified them as pain before savingthe date and time with the pain level.
Appl. Sci. 2022, 12, x FOR PEER REVIEW 14 of 16
Figure 10. The output of FEAPAS on video 1 using the 2-B-30 strategy. Reprinted/adapted with permission from Ref. [10]. Copyright (@jeffery Cohn).
6. Conclusions We developed a new facial expression-based automatic pain assessment system to
monitor patients and assist in the pain evaluation process. The FEAPAS was designed to recognize four classes: no pain, low pain, moderate pain, and severe pain. When a patient is detected to be in pain, FEAPAS activates an alarm to allow the medical team to take steps. While developing FEAPAS, we focused on two main criteria: (1) the system should be precise enough to not miss any true alarm and (2) fast enough to catch the pain situa-tions and activate the alarm. Our proposed FEAPAS consisted of two subsystems each using a modified pretrained CNN. The modification included freezing the convolutional block and replacing the prediction layer with a shallow CNN. Each subsystem takes one of the two systems’ inputs (i.e., the full face and the upper face). Among the 16 tested model combinations (four pretrained CNN options, VGG16, InceptionV3, ResNet50, and ResNeXt50, and four possible optimizers, SGD, ADAM, RMSprop, and RAdam), the model with a InceptionV3 and the SGD optimizer excelled with an accuracy of 99.10% on 10-fold cross-validation, and a 90.56% score on the unseen subject data. (Future work should explore other optimizers to further improve system performance.) To speed up the response time in FEAPAS and avoid unnecessary alarms caused by momentary facial ex-pressions, we classified few selected frames instead of classifying every single frame. Fur-ther, we tested, two frame selection approaches (i.e., at the two ends of the sequence and in the middle of the sequence) using sequence lengths of 30 frames with segment-lengths of two and four frames, respectively. FEAPAS correctly classified six online videos with 1611 frames (four videos recorded the severe pain situation and two other videos recorded the no pain situation) with an average response time of less than 30 s.
Author Contributions: T.A. conducted this research under supervision of her PhD advisor, G.A. The authors contributed toward the new methodologies, design, implementation, and analysis of FEAPAS application. All authors have read and agreed to the published version of the manuscript.
Funding: This research received no external funding.
Institutional Review Board Statement: Not applicable.
Informed Consent Statement: Permission to use the UNBC-McMaster shoulder pain expression dataset to develop an automatic pain assessment system based on facial expressions was received from the McMaster University and the University of Northern British Columbia. Permission is granted to use a specific set of images (TV095, JL047, IB109, DM039, AK064) for electronic media and include notice of copyright (@jeffery Cohn).
Data Availability Statement: Data was obtained from [10], and accessed on 9 November 2021, and are available [at http://www.pitt.edu/~emotion/um-spread.htm] with the permission of [10].
Conflicts of Interest: The authors declare no conflict of interest.
Figure 10. The output of FEAPAS on video 1 using the 2-B-30 strategy. Reprinted/adapted withpermission from Ref. [10]. Copyright (@jeffery Cohn).
Appl. Sci. 2022, 12, 6423 14 of 16
6. Conclusions
We developed a new facial expression-based automatic pain assessment system tomonitor patients and assist in the pain evaluation process. The FEAPAS was designedto recognize four classes: no pain, low pain, moderate pain, and severe pain. When apatient is detected to be in pain, FEAPAS activates an alarm to allow the medical team totake steps. While developing FEAPAS, we focused on two main criteria: (1) the systemshould be precise enough to not miss any true alarm and (2) fast enough to catch the painsituations and activate the alarm. Our proposed FEAPAS consisted of two subsystems eachusing a modified pretrained CNN. The modification included freezing the convolutionalblock and replacing the prediction layer with a shallow CNN. Each subsystem takes oneof the two systems’ inputs (i.e., the full face and the upper face). Among the 16 testedmodel combinations (four pretrained CNN options, VGG16, InceptionV3, ResNet50, andResNeXt50, and four possible optimizers, SGD, ADAM, RMSprop, and RAdam), themodel with a InceptionV3 and the SGD optimizer excelled with an accuracy of 99.10%on 10-fold cross-validation, and a 90.56% score on the unseen subject data. (Future workshould explore other optimizers to further improve system performance.) To speed upthe response time in FEAPAS and avoid unnecessary alarms caused by momentary facialexpressions, we classified few selected frames instead of classifying every single frame.Further, we tested, two frame selection approaches (i.e., at the two ends of the sequence andin the middle of the sequence) using sequence lengths of 30 frames with segment-lengthsof two and four frames, respectively. FEAPAS correctly classified six online videos with1611 frames (four videos recorded the severe pain situation and two other videos recordedthe no pain situation) with an average response time of less than 30 s.
Author Contributions: T.A. conducted this research under supervision of her PhD advisor, G.A.The authors contributed toward the new methodologies, design, implementation, and analysis ofFEAPAS application. All authors have read and agreed to the published version of the manuscript.
Funding: This research received no external funding.
Institutional Review Board Statement: Not applicable.
Informed Consent Statement: Permission to use the UNBC-McMaster shoulder pain expressiondataset to develop an automatic pain assessment system based on facial expressions was receivedfrom the McMaster University and the University of Northern British Columbia. Permission isgranted to use a specific set of images (TV095, JL047, IB109, DM039, AK064) for electronic media andinclude notice of copyright (@jeffery Cohn).
Data Availability Statement: Data was obtained from [10], and accessed on 9 November 2021, andare available [at http://www.pitt.edu/~emotion/um-spread.htm] with the permission of [10].
Conflicts of Interest: The authors declare no conflict of interest.
References1. Taggart, S.; Skylas, K.; Brannelly, A.; Fairbrother, G.; Knapp, M.; Gullick, J. Using a Clinical Judgement Model to Understand the
Impact of Validated Pain Assessment Tools for Burn Clinicians and Adult Patients in the ICU: A Multi-Methods Study. Burns2021, 47, 110–126. [CrossRef]
2. Lalloo, C.; Kumbhare, D.; Stinson, J.N.; Henry, J.L. Pain-QuILT: Clinical Feasibility of a Web-Based Visual Pain Assessment Tool inAdults with Chronic Pain. J. Med. Internet Res. 2014, 16, e3292. [CrossRef]
3. Semwal, A.; Londhe, N.D. ECCNet: An Ensemble of Compact Convolution Neural Network for Pain Severity Assessmentfrom Face Images. In Proceedings of the 2021 11th International Conference on Cloud Computing, Data Science & Engineering(Confluence), Noida, India, 28–29 January 2021. [CrossRef]
4. Lints-Martindale, A.; Hadjistavropoulos, T.; Lix, L.M.; Thorpe, L. A Comparative Investigation of Observational Pain AssessmentTools for Older Adults with Dementia. Clin. J. Pain 2012, 28, 226–237. [CrossRef]
5. Natavio, T.; McQuillen, E.; Dietrich, M.S.; Wells, N.; Rhoten, B.A.; Vallerand, A.H.; Monroe, T.B. A Comparison of the PainAssessment Checklist for Seniors with Limited Ability to Communicate (PACSLAC) and Pain Assessment in Advanced DementiaScale (PAINAD). Pain Manag. Nurs. 2020, 21, 502–509. [CrossRef]
6. Salekin, S.; Zamzmi, G.; Goldgof, D.; Kasturi, R.; Ho, T.; Sun, Y. Multimodal Spatio-Temporal Deep Learning Approach forNeonatal Postoperative Pain Assessment. Comput. Biol. Med. 2021, 129, 104150. [CrossRef]

Appl. Sci. 2022, 12, 6423 15 of 16
7. Othman, E.; Werner, P.; Saxen, F.; Al-Hamadi, A.; Gruss, S.; Walter, S. Automatic Vs. Human Recognition of Pain Intensity fromFacial Expression on the X-ITE Pain Database. Sensors 2021, 21, 3273. [CrossRef]
8. Rudovic, O.; Pavlovic, V.; Pantic, M. Automatic Pain Intensity Estimation with Heteroscedastic Conditional Ordinal RandomFields. In Advances in Visual Computing; Springer: Berlin/Heidelberg, Germany, 2013.
9. Semwal, A.; Londhe, N.D. Computer aided pain detection and intensity estimation using compact CNN based fusion network.Appl. Soft Comput. 2021, 112, 107780. [CrossRef]
10. Lucey, P.; Cohn, J.F.; Prkachin, K.M.; Solomon, P.E.; Matthews, I. Painful data: The UNBC-McMaster shoulder pain expressionarchive database. In Proceedings of the 2011 IEEE International Conference on Automatic Face & Gesture Recognition (FG), SantaBarbara, CA, USA, 21–25 March 2011; pp. 57–64.
11. Yu, Y.; Hao, K.; Ding, Y. A New Image Classification Model Based on Brain Parallel Interaction Mechanism. Neurocomputing 2018,315, 190–197. [CrossRef]
12. Dubey, A.K.; Jain, V. Automatic facial recognition using VGG16 based transfer learning model. J. Inf. Optim. Sci. 2020, 41,1589–1596. [CrossRef]
13. Yang, Q. An introduction to transfer learning. In Advanced Data Mining and Applications; Tang, C., Ling, C.X., Zhou, X.,Cercone, N.J., Li, X., Eds.; Lecture Notes in Computer Science; Springer: Berlin/Heidelberg, Germany, 2008; Volume 5139, p. 1.
14. Simonyan, K.; Zisserman, A. Very Deep Convolutional Networks for Large-Scale Image Recognition. arXiv 2014, arXiv:1409.1556.15. Szegedy, C.; Liu, W.; Jia, Y.; Sermanet, P.; Reed, S.; Anguelov, D.; Erhan, D.; Vanhoucke, V.; Rabinovich, A. Going Deeper with
Convolutions. In Proceedings of the IEEE Conference on Computer Vision and Pattern Recognition (CVPR), Boston, MA, USA,7–12 June 2014; pp. 1–9.
16. Szegedy, C.; Vanhoucke, V.; Ioffe, S.; Shlens, J.; Wojna, Z. Rethinking the Inception Architecture for Computer Vision. InProceedings of the IEEE Conference on Computer Vision and Pattern Recognition (CVPR), Las Vegas, NV, USA, 27–30 June 2016;pp. 2818–2826. [CrossRef]
17. He, K.; Zhang, X.; Ren, S.; Sun, J. Deep Residual Learning for Image Recognition. In Proceedings of the 2016 IEEE Conference onComputer Vision and Pattern Recognition (CVPR), Las Vegas, NV, USA, 27–30 June 2016; pp. 770–778. [CrossRef]
18. Veit, A.; Wilber, M.J.; Belongie, S. Residual Networks Behave Like Ensembles of Relatively Shallow Networks. arXiv 2016,arXiv:1605.06431v2.
19. Zagoruyko, S.; Komodakis, N. Wide Residual Networks. arXiv 2016, arXiv:1605.07146.20. Wu, Z.; Shen, C.; Van Den Hengel, A. Wider or Deeper: Revisiting the ResNet Model for Visual Recognition. Pattern Recognit.
2019, 90, 119–133. [CrossRef]21. Xie, S.; Girshick, R.; Dollár, P.; Tu, Z.; He, K. Aggregated Residual Transformations for Deep Neural Networks. In Proceedings of
the IEEE Conference on Computer Vision and Pattern Recognition (CVPR), Honolulu, HI, USA, 21–26 July 2016; pp. 5987–5995.22. Li, L.; Ma, H. RDCTrans U-Net: A Hybrid Variable Architecture for Liver CT Image Segmentation. Sensors 2022, 22, 2452.
[CrossRef] [PubMed]23. Landro, N.; Gallo, I.; La Grassa, R. Mixing ADAM and SGD: A Combined Optimization Method. arXiv 2020, arXiv:2011.08042.24. Jiang, X.; Hu, B.; Satapathy, S.C.; Wang, S.-H.; Zhang, Y.-D. Fingerspelling Identification for Chinese Sign Language via AlexNet-
Based Transfer Learning and Adam Optimizer. Sci. Program. 2020, 2020, 3291426. [CrossRef]25. Jiang, S.; Chen, Y. Hand Gesture Recognition by Using 3DCNN and LSTM with Adam Optimizer. In Advances in Multimedia
Information Processing—PCM 2017; Zeng, B., Huang, Q., El Saddik, A., Li, H., Jiang, S., Fan, X., Eds.; PCM 2017. Lecture Notes inComputer Science; Springer: Cham, Switzerland, 2018; Volume 10735. [CrossRef]
26. Liu, L.; Jiang, H.; He, P.; Chen, W.; Liu, X.; Gao, J.; Han, J. On the Variance of the Adaptive Learning Rate and Beyond. arXiv 2019,arXiv:1908.03265.
27. Cui, K.; Zhan, Z.; Pan, C. Applying Radam Method to Improve Treatment of Convolutional Neural Network on BanknoteIdentification. In Proceedings of the 2020 International Conference on Computer Engineering and Application (ICCEA),Guangzhou, China, 18–20 March 2020. [CrossRef]
28. Ashraf, A.B.; Lucey, S.; Cohn, J.F.; Chen, T.; Ambadar, Z.; Prkachin, K.; Solomon, P.; Theobald, B.J. The Painful Face: PainExpression Recognition using Active Appearance Models. In Proceedings of the 9th International Conference on MultimodalInterfaces, ACM, Nagoya, Aichi, Japan, 12–15 November 2007; pp. 9–14. [CrossRef]
29. Lucey, P.; Cohn, J.F.; Prkachin, K.M.; Solomon, P.E.; Chew, S.; Matthews, I. Painful Monitoring: Automatic Pain Monitoring usingthe UNBC-McMaster Shoulder Pain Expression Archive Database. Image Vis. Comput. 2012, 30, 197–205. [CrossRef]
30. Khan, R.A.; Meyer, A.; Konik, H.; Bouakaz, S. Pain Detection through Shape and Appearance Features. In Proceedings of the 2013IEEE International Conference on Multimedia and Expo (ICME), San Jose, CA, USA, 15–19 July 2013. [CrossRef]
31. Zhou, J.; Hong, X.; Su, F.; Zhao, G. Recurrent Convolutional Neural Network Regression for Continuous Pain Intensity Estimationin Video. In Proceedings of the IEEE Conference on Computer Vision and Pattern Recognition (CVPR) Workshops, Las Vegas,NV, USA, 27–30 June 2016; pp. 84–92.
32. Rodriguez, P.; Cucurull, G.; Gonzalez, J.; Gonfaus, J.M.; Nasrollahi, K.; Moeslund, T.B.; Roca, F.X. Deep Pain: Exploiting LongShort-Term Memory Networks for Facial Expression Classification. IEEE Trans. Cybern. 2017, 52, 3314–3324. [CrossRef]
33. Semwal, A.; Londhe, N.D. MVFNet: A multi-view fusion network for pain intensity assessment in unconstrained environment.Biomed. Signal Processing Control. 2021, 67, 102537. Available online: https://www.sciencedirect.com/science/article/pii/S1746809421001348 (accessed on 10 March 2022). [CrossRef]

Appl. Sci. 2022, 12, 6423 16 of 16
34. Vaish, A.; Gupta, S. A Novel Approach for Pain Intensity Detection by KAZE Features. In Proceedings of the Third InternationalConference on Microelectronics, Computing and Communication Systems; Springer: Singapore, 2019.
35. Viola, P.; Jones, M. Rapid Object Detection using a Boosted Cascade of Simple Features. In Proceedings of the 2001 IEEE ComputerSociety Conference on Computer Vision and Pattern Recognition. CVPR 2001, Kauai, HI, USA, 8–14 December 2001; Volume 1.[CrossRef]
36. Zhang, K.; Zhang, Z.; Li, Z.; Qiao, Y. Joint Face Detection and Alignment using Multitask Cascaded Convolutional Networks.IEEE Signal Processing Lett. 2016, 23, 1499–1503. [CrossRef]
37. Parallel Distributed Systems Lab—PDS Lab. Available online: http://pds.ucdenver.edu/ (accessed on 8 April 2022).38. Anaconda|The World’s Most Popular Data Science Platform. Available online: https://www.anaconda.com (accessed on
8 April 2022).39. Keras. The Python Deep Learning API. Available online: https://keras.io/ (accessed on 8 April 2022).40. OpenCV 4.4.0—OpenCV. Available online: https://opencv.org/opencv-4-4-0/ (accessed on 8 April 2022).
Copyright © 2022 FDOKUMEN