Exploring the utility of the Simple View of Reading in Irish children attending schools in areas...
17
Journal of Education and Training Studies Vol. 1, No. 1; April 2013 ISSN 2324-805X E-ISSN 2324-8068 Published by Redfame Publishing 204 Exploring the Utility of the Simple View of Reading in Irish Children Attending Schools in Areas Designated as Socially Disadvantaged Rena Lyons 1 , Allyn Fives 2 , Noreen Kearns 2 , John Canavan 2 , Carmel Devaney 2 & Pat Eaton 3 1 Discipline of Speech and Language Therapy, School of Health Sciences, NUI Galway, Ireland 2 Child and Family Research Centre, NUI Galway, Ireland 3 School of Education, NUI Galway, Ireland Correspondence: Rena Lyons, Discipline of Speech and Language Therapy, School of Health Sciences, NUI Galway, Ireland. Tel: 353-91-492-918. E-mail: [email protected] Received: January 9, 2013 Accepted: March 11, 2013 Available online: March 21, 2013 doi:10.11114/jets.v1i1.107 URL: http://dx.doi.org/10.11114/jets.v1i1.107 Abstract Evidence suggests that children living in areas designated as socially disadvantaged may be at risk for literacy difficulties. The Simple View of Reading (Gough & Tunmer, 1986; Hoover &Gough, 1986) is a theoretical model that sets out to describe the processes that children need to develop to become proficient readers, that is word recognition or decoding processes and language comprehension processes. The overall aim of this study was to investigate the utility of the Simple View of Reading in a cohort of Irish children attending schools designated as socially disadvantaged. The objectives were twofold. The first objective was to investigate predictors of reading accuracy, spelling and reading comprehension skills in this sample. The second objective was to investigate whether or not these predictors varied with age. The sample comprised fifty-nine children attending two schools. Inclusion criteria were: children between the ages of 5-8 years; a sample of children within three ranges of reading abilities as rated by their teachers (teachers were asked to rate the children‟s reading ability as above average, average or below average); and a minimum score of 80 on the British Picture Vocabulary Scales (BPVS) (Dunn et al., 1997) to be included. Reading accuracy (single word reading and passage reading), reading comprehension, and spelling were measured using three standardised tests i.e., Weschler Individual Attainment Test 11 UK , Teachers Version (WIAT, 11 UK -T) (Weschler, 2006), the York Assessment of Reading for Comprehension (YARC) (Snowling et al., 2009), and the Single Word Spelling Test (SWST), (Sacre & Masterson, 2000). Potential predictors of literacy skills, such as phonemic awareness and phonic knowledge skills, were measured using criterion-referenced tests. Vocabulary was also a potential predictor and was measured using the BPVS. There was mixed evidence for the Simple View of Reading. While phonic knowledge, phonemic knowledge and non-word reading were predictors of reading, other factors such as vocabulary were also predictors. Although vocabulary was a predictor of reading comprehension for the total sample, the picture was less clear when the effect of age was explored. To conclude, there was mixed evidence to support the Simple View of Reading. Nonetheless, the findings were encouraging in that children were acquiring literacy skills. Key words: simple view of reading, literacy, social disadvantage 1. Introduction 1.1 Literacy and Social Disadvantage The Irish Education Act (1998) defines educational disadvantage as the obstacles that arise from social or economic disadvantage that prevent students from benefitting from education in schools. Evidence for the under-achievement in reading of children in Irish schools designated as disadvantaged has been highlighted in research studies over the past decade. A number of Irish studies have shown that pupils attending primary schools designated as disadvantaged, or where there are high proportions of disadvantaged children, have significantly lower scores for reading achievement than pupils in non-designated schools (Cosgrove, Kellaghan, Forde & Morgan, 2000; Hayes & Kernan, 2001; Weir, Milis & Ryan, 2002). Weir (2001) found this difference to be between a half and one standard deviation below national mean scores. More recently, Eivers, Shiel and Shortt (2005) carried out a study of reading standards in Irish disadvantaged primary schools. Reading was
Transcript of Exploring the utility of the Simple View of Reading in Irish children attending schools in areas...
Journal of Education and Training Studies
Vol. 1, No. 1; April 2013
ISSN 2324-805X E-ISSN 2324-8068
Published by Redfame Publishing
204
Exploring the Utility of the Simple View of Reading in Irish Children
Attending Schools in Areas Designated as Socially Disadvantaged
Rena Lyons1, Allyn Fives2, Noreen Kearns2, John Canavan2, Carmel Devaney2 & Pat Eaton3
1Discipline of Speech and Language Therapy, School of Health Sciences, NUI Galway, Ireland
2Child and Family Research Centre, NUI Galway, Ireland
3 School of Education, NUI Galway, Ireland
Correspondence: Rena Lyons, Discipline of Speech and Language Therapy, School of Health Sciences, NUI
Galway, Ireland. Tel: 353-91-492-918. E-mail: [email protected]
Received: January 9, 2013 Accepted: March 11, 2013 Available online: March 21, 2013
doi:10.11114/jets.v1i1.107 URL: http://dx.doi.org/10.11114/jets.v1i1.107
Abstract
Evidence suggests that children living in areas designated as socially disadvantaged may be at risk for literacy
difficulties. The Simple View of Reading (Gough & Tunmer, 1986; Hoover &Gough, 1986) is a theoretical
model that sets out to describe the processes that children need to develop to become proficient readers, that is
word recognition or decoding processes and language comprehension processes. The overall aim of this study
was to investigate the utility of the Simple View of Reading in a cohort of Irish children attending schools
designated as socially disadvantaged. The objectives were twofold. The first objective was to investigate
predictors of reading accuracy, spelling and reading comprehension skills in this sample. The second objective
was to investigate whether or not these predictors varied with age. The sample comprised fifty-nine children
attending two schools. Inclusion criteria were: children between the ages of 5-8 years; a sample of children
within three ranges of reading abilities as rated by their teachers (teachers were asked to rate the children‟s
reading ability as above average, average or below average); and a minimum score of 80 on the British Picture
Vocabulary Scales (BPVS) (Dunn et al., 1997) to be included. Reading accuracy (single word reading and
passage reading), reading comprehension, and spelling were measured using three standardised tests i.e.,
Weschler Individual Attainment Test 11UK, Teachers Version (WIAT, 11UK-T) (Weschler, 2006), the York
Assessment of Reading for Comprehension (YARC) (Snowling et al., 2009), and the Single Word Spelling Test
(SWST), (Sacre & Masterson, 2000). Potential predictors of literacy skills, such as phonemic awareness and
phonic knowledge skills, were measured using criterion-referenced tests. Vocabulary was also a potential
predictor and was measured using the BPVS. There was mixed evidence for the Simple View of Reading. While
phonic knowledge, phonemic knowledge and non-word reading were predictors of reading, other factors such as
vocabulary were also predictors. Although vocabulary was a predictor of reading comprehension for the total
sample, the picture was less clear when the effect of age was explored. To conclude, there was mixed evidence to
support the Simple View of Reading. Nonetheless, the findings were encouraging in that children were
acquiring literacy skills.
Key words: simple view of reading, literacy, social disadvantage
1. Introduction
1.1 Literacy and Social Disadvantage
The Irish Education Act (1998) defines educational disadvantage as the obstacles that arise from social or
economic disadvantage that prevent students from benefitting from education in schools. Evidence for the
under-achievement in reading of children in Irish schools designated as disadvantaged has been highlighted in
research studies over the past decade. A number of Irish studies have shown that pupils attending primary
schools designated as disadvantaged, or where there are high proportions of disadvantaged children, have
significantly lower scores for reading achievement than pupils in non-designated schools (Cosgrove, Kellaghan,
Forde & Morgan, 2000; Hayes & Kernan, 2001; Weir, Milis & Ryan, 2002). Weir (2001) found this difference to
be between a half and one standard deviation below national mean scores. More recently, Eivers, Shiel and
Shortt (2005) carried out a study of reading standards in Irish disadvantaged primary schools. Reading was
www.redfame.com/jets Journal of Education and Training Studies Vol. 1, No. 1; 2013
205
assessed using the Drumcondra Sentence Reading Test (2002), a sentence reading test that has been standardised
on an Irish sample of children. The aim of the study was to obtain baseline data on the reading achievement of
pupils in first, third and sixth classes (ages 6/7, 8/9 and 11/12 years respectively) in a representative national
sample of schools designated as disadvantaged. Schools are so designated according to various specific
indicators of disadvantage including the number of families in local authority housing, in receipt of
unemployment benefit or social welfare assistance schemes. Scores of the pupils in the reading survey were
compared with those of pupils in the standardisation sample. Twenty-seven percent of first and sixth class pupils
and 30% of those in third class achieved scores at or below the 10th percentile. In Ireland the 10th percentile is
used as the marker for identifying children with serious literacy difficulties, that is those entitled to additional
support. In addition, McDonald (1998) found a difference of almost half of a standard deviation in the mean
reading achievement of 1st class pupils in Irish disadvantaged and non-disadvantaged schools. The Department
of Education and Science Inspectorate (2005) carried out a study of 12 disadvantaged primary schools (n=1477
pupils) and found 43% of the pupils across all the schools (1st to 6th class) had scores at or below the 20th
percentile on standardised reading tests. In two of the schools approximately 60% scored at this level. In 2005,
the Department of Education and Science published an action plan called Delivering Equality of Opportunity in
Schools (DEIS). This action plan focuses on addressing the educational needs of children and young people from
disadvantaged communities, given the evidence for their under-achievement in the education system. One
element of the plan is to target additional resources and supports to schools serving disadvantaged communities,
supporting other efforts at national level to bring about greater social cohesion and economic progress. Schools
in disadvantaged areas have been designated as DEIS schools, and additional supports have been allocated to
these schools to support the development of literacy e.g. increased teacher allocation, access to additional
supports e.g. Home-School-Community Liaison Officers, library resources, ICT etc.
The evidence from Irish studies suggests that children living in disadvantaged areas are at risk for literacy
difficulties. However, the tests used in these studies have primarily been measures of reading accuracy in
relatively large samples. Moreover, there has been little research on potential predictors of reading accuracy,
such as phonic knowledge, phonemic awareness and vocabulary. In addition, there has been little research on
reading comprehension and spelling abilities. Given that there is evidence that children in low-income families
show delayed development in early phonological/phonemic awareness as compared to children from middle- to
high-income families (Lonigan, Burgess, Anthony, & Barker, 1998), as well as delayed reading skills (Duncan &
Seymour, 2000), there is need to pay attention to this group who are at risk of literacy difficulties.
1.2 Learning to Read: The ‘Simple View of Reading’ Theory
The Simple View of Reading (Hoover & Gough, 1990) is a theoretical framework that attempts to describe the
processes that children need to develop to become proficient readers. According to the Simple View of Reading,
there are two processes that are important in reading. The first process relates to recognition of words. In order to
recognise or decode words, children use a combination of sight word recognition and/or phonically-based
decoding processes to decode printed words. In order to comprehend words, children need to be able to decode
words and activate word meanings in the language system (Stuart, Stainthorp, & Snowling, 2008). Reading
comprehension is viewed as a product of listening comprehension and decoding (Kirby &Savage, 2008). Stuart
et al. (2008) argue that different factors underlie performance in these two areas.
“Phonological processing best predicts word recognition, whereas language comprehension processes are
underpinned by lexical knowledge (vocabulary), semantic and syntactic processes…both word recognition and
language comprehension are essential at all levels of reading skill, but they are not [their emphasis] one and the
same” (Stuart et al., 2008:62)
1.2.1 Word Recognition Processes
When learning to read words, children need to use a decoding strategy that is based on the relationships between
graphemes (letters) and phonemes (sounds) (Stuart et al., 2008). Research in early literacy instruction has raised
phonemic awareness and phonics to the top of the literacy agenda (Wilson & Colmar, 2008; Wagner, Torgesen &
Rashotte, 1994). There is broad acknowledgement that phonemic awareness skills are important in the
development of word recognition in young children even after factoring out variability due to IQ, vocabulary,
memory and social class (Anthony, Lonigan, Driscoll, Phillips & Burgess, 2003). In particular, there is evidence
that phonemic awareness (i.e., the ability to discriminate and manipulate individual speech sounds or phonemes
in words) and phonic knowledge are strong predictors of word recognition (Hatcher & Hulme, 1999; Hoien,
Lundberg, Stanovich & Bjaalid, 1995; Hulme, Hatcher, Nation, Brown, Adams & Stuart, 2002; Muter, Hulme,
Snowling & Taylor, 1998; Nation & Hulme, 1997). There is some evidence that children progress from
www.redfame.com/jets Journal of Education and Training Studies Vol. 1, No. 1; 2013
206
awareness of large units (e.g., syllables and rhymes) to awareness of smaller units or phonemes (Carroll,
Snowling, Hulme & Stevenson, 2003). Children also learn correspondences between the sounds (phonemes) and
letters (graphemes) and how to blend these phonemes to decode words (sound blending). The importance of
phonic knowledge (or sound-letter correspondence) in learning to read is acknowledged by many researchers
(Stackhouse, 2006; Hogan, Catts, & Little, 2005; Nag, 2007). Hatcher, Hulme and Ellis (1994) found that
interventions for reading need to include teaching of phonemic awareness and phonic knowledge skills if they
are to be maximally effective. A meta-analysis of fifty two intervention studies by Ehri, Nunes, Willows,
Schuster, Yaghoub-Zadeh, and Shanahan (2001) found that interventions that included phonemic skills training
with phonics teaching and consistently targeted reading-related operations (such as phoneme segmenting and
blending) were characteristics of the most effective interventions for reading and spelling. Castles and Coltheart
(2004) suggest that measures of phonic knowledge might be as strong a predictor of subsequent literacy
development as phoneme awareness. Therefore phonic knowledge has been identified as an essential component
of early reading success, preferably taught in conjunction with phonemic awareness.
There is some evidence to suggest that children acquire phonemic awareness in overlapping rather than temporally
discrete stages and that these skills emerge along a continuum of difficulty (Anthony et al.., 2003; Pufpaff, 2009).
Anthony et al. (2003) argue that development of these skills is linked with linguistic complexity (whereby children
attend to increasingly smaller phonological units); and cognitive operations (whereby children perform
increasingly complex operations and an increasing number of operations on phonological information). The
complexity of the task demands may affect children‟s ability to demonstrate mastery in these skills e.g., demands
of the tasks on working memory. Pufpaff (2009) argues that there are a number of factors that influence the
development of phonological/phonemic awareness skills: the type and number of cognitive processes required to
complete tasks (e.g., demands on short-term memory); speech perception versus speech production (tasks that
focus on perception of sounds are easier than tasks that require production); the “completeness dimension” in
relation to blending and segmentation (i.e., tasks that require partial blending (e.g., /b/ /at/) or partial segmenting
(e.g., bat /b/ /at/) are easier than those that require complete blending or segmentation of all component phonemes);
and finally the position of the target phoneme within a word (i.e., initial phonemes are easier to identify and
manipulate than final phonemes).
Some argue that reading non-words or pseudowords test the child‟s ability to use of phonic knowledge (Kirby &
Savage, 2008). Non-words are novel items that the child has not seen before and they are not stored in the
lexicon. Therefore when reading non-words children must use phonic analysis skills, or bottom-up processing, to
work out the connection between letters and sounds so that a word can be pronounced. Some argue that this is a
skill that children require for reading new or unfamiliar words (Valdervelden & Siegel, 1995). It can provide
useful information on how children are using orthographic knowledge and phonemic awareness skills to read
new words (Hogan, Catts, & Little, 2005; Valdervelden & Siegel, 1995). The ability to tackle unfamiliar words
is the distinguishing feature of children whose word recognition processes have developed into a self-sustaining
system (Share, 1995) and there is some evidence that poor readers have difficulty reading non-words (Snowling
& Hulme, 1994; Snowling, 1995). Hogan et al. (2005) found that measures of non-word reading accounted for
more variance in word reading than phonological awareness in older children.
1.2.2 Language Comprehension Processes
The second dimension in the Simple View of Reading is language comprehension. The end goal of reading is
comprehension, which is dependent on word recognition and language comprehension processes such as
vocabulary, syntactic and semantic abilities (Ouellette, 2006; Stuart et al., 2008). Vocabulary knowledge
(knowledge of the meanings of spoken words) is a major contributor to children‟s reading comprehension, and
becomes more important as children become more fluent and skilled readers. “Vocabulary storage involves
lexical representations of stored phonology or sound patterns of words, along with semantic representations of
word meaning” (Ouellette, 2006:554). For example, Snow (2002) showed that the correlations between oral
vocabulary measured in kindergarten and children‟s later reading comprehension increased through the grades,
with a correlation of .45 in 1st grade, .62 in 4th grade, and .69 in 7th grade. Torgesen, Wagner, Rashotte, Burgess
and Hecht (1997) also showed that as children progress through school, vocabulary accounts for increasing
amounts of the variation in reading comprehension. In their longitudinal study, 2nd grade vocabulary explained
11% of variance in 4th grade reading comprehension; 3rd grade vocabulary explained 43% of variance in 5th
grade reading comprehension. Ouellette (2006) also found that receptive vocabulary breadth alone predicted
decoding performance. Ouellette and Beers (2010) also found that vocabulary was a more powerful predictor of
comprehension in older children (Grade 6) than younger children (Grade 1). In addition, there is some evidence
that teaching of vocabulary may lead to significant improvement in reading comprehension (Beck & McKeown,
www.redfame.com/jets Journal of Education and Training Studies Vol. 1, No. 1; 2013
207
1991; Beck, Perfetti & McKeown, 1982; Durso & Coggins, 1991).
There seems to be evidence for a reciprocal relationship between vocabulary knowledge and reading. Good
readers have better knowledge of word meanings, in terms of both breadth (the number of different words whose
meanings they know) and depth (the sophistication of their knowledge of the nuances of a word‟s meaning).
However, as the vocabulary used in written texts includes many words, which seldom appear in spoken discourse,
children have to learn most new word meanings through reading, because they may not ever hear them spoken.
That is, once children can read, reading becomes the major source of vocabulary growth. Anderson, Wilson and
Fielding (1988) showed, from a diary study, that children who read more have an advantage in vocabulary
development. The children whose diaries revealed them to be avid readers (those at the 98th percentile for time
spent reading out of school) were exposed on average to four and a half million words, compared with about a
quarter of a million words for those at the 50th percentile, and a few hundred words for those at the 25th
percentile. Stanovich (1993) showed that reading develops vocabulary to the extent that it can compensate for
lower cognitive ability: children with low nonverbal ability but high exposure to print had better vocabulary than
high nonverbal ability but low exposure to print. Children who don‟t understand the meanings of words in the
text are going to find it much harder to work out what is happening and why. Some studies (e.g. Robbins & Ehri,
1994; McKeown, 1985) suggest children with pre-existing better vocabularies acquire new meanings more easily,
whilst others (e.g. Nagy, Anderson & Herman, 1987; Cunningham & Stanovich, 1997) have found that children
of all ages and ability levels are able to learn new word meanings through reading. There is also some evidence
that there is a correlation between vocabulary and phonological awareness skills. Carroll, Snowling, Hulme and
Stevenson (2003) found a high correlation between receptive lexical knowledge (vocabulary) and large-segment
awareness which supports the theory that early global sound sensitivity may be related to the growth of
vocabulary knowledge. Muter et al. (2004), in their longitudinal study of early reading development, found that
for reading comprehension, higher language skills such as vocabulary and grammatical development are
important predictors, whereas phonological skills appear relatively unimportant predictors of reading
comprehension.
1.3 Learning to Spell
While much has been written about the development of reading skills, the development of spelling has received
less attention. According to Goulandris (2006) reading and spelling develop at different rates, with each skill
contributing to the development of the other. Learning to spell also requires phonemic awareness and phonic
knowledge skills, such as ability to segment words into smaller elements (segmentation ability) and the ability to
represent these smaller elements via grapheme-phoneme correspondences (phonic knowledge) (Stackhouse,
2006). According to Frith (1985) there are three stages in learning to spell i.e., logographic, alphabetic and
orthographic. In the initial logographic phase, children rely mainly on visual skills and their spelling in general
does not show phoneme-grapheme correspondence (Stackhouse, 2006). In the alphabetic stage children apply
phoneme-grapheme rules to decode new words and spelling becomes more logical. In the final orthographic
stage of learning to spell, the child learns to recognise larger chunks of words such as prefixes and suffixes.
Others have challenged this stage theory of literacy development arguing that learning whole word spellings,
sound-letter rules and spelling patterns happen concurrently and influence each other and that children use a
range of strategies and knowledge to represent spoken words with letters (Goulandris, 2006; Jamieson &
Simpson, 2006). There is debate about the causal relationship between phonemic awareness and spelling ability
(Pufpaff, 2009). The direction of the relationship may be influenced by the types of phonemic awareness tasks
measured and/or the age of the participants, suggesting that the causal relationship may change at different stages
e.g., some later developing phonemic awareness skills may develop as a result of learning to read and spell
(Pufpaff, 2009). For example, Vandervelden and Siegel (1995) suggest that the process of using systematic
relationships between letters and phonemes in spelling may facilitate the development of segmentation skills.
There is evidence to suggest that children living in disadvantaged areas in Ireland may be at risk for literacy
difficulties. However, there has been little research on the processes involved in learning to read in these children.
The Simple View of Reading provides a balanced conceptual model of reading in that it encompasses the
processes involved in learning to read. The aim of this study was to explore the utility of this model in a cohort
of children attending schools which were designated as socially disadvantaged. The research questions in this
study were:
1. What are the contributions of phonemic awareness, phonic knowledge, non-word reading, and
vocabulary to reading and spelling skills?
2. What are the contributions of phonemic awareness, phonic knowledge, non-word reading, and
vocabulary to reading comprehension?
www.redfame.com/jets Journal of Education and Training Studies Vol. 1, No. 1; 2013
208
3. Do predictors of reading accuracy and reading comprehension vary with age?
2. Methodology
2.1 Participants
Purposeful sampling was used to recruit the participants in this study. The inclusion criteria for the study were:
1. Children aged between 5 and 8 years attending schools designated as socially disadvantaged. The
schools were designated as DEIS banded schools as they met the criteria for the Delivering Equality of
Opportunities in Schools initiative of the Department of Education and Science i.e., they were in areas
where there were high concentrations of pupils from disadvantaged backgrounds.
2. An equal distribution of boys and girls;
3. A mix of reading ability levels (children were rated as below average, average and above average
in reading by their class teacher);
4. A sample (10%) of children whose first language was not English;
5. Children who attain a minimum standard score of 80 on the British Picture Vocabulary Scales
(BPVS) (Dunn, Dunn, Whetton, & Burley, 1997).
The research team was granted ethical approval by a university ethics committee. The team contacted the
Principals of two schools designated by the Department of Education and Science as socially disadvantaged to
invite them to take part in the study. Both schools were located in urban areas. When the schools agreed to
participate, the teachers were requested to distribute information sheets and consent forms to the parents of
children who met the inclusion criteria. The children were also given an opportunity to provide assent to
participate and child-friendly information sheets and assent forms were provided. When the consent forms were
returned, the team requested that the teacher rate the children in terms of their general reading ability i.e. average,
below average or above average. The research team then selected 15 children in each age group who met the
inclusion criteria for the study. The team also ensured that there was a range of children meeting the criteria in
each age group: an equal sample of boys and girls, five children in each ability level and 10% of children whose
first language was not English. In total, 60 children were recruited into the study, with 59 participating (one
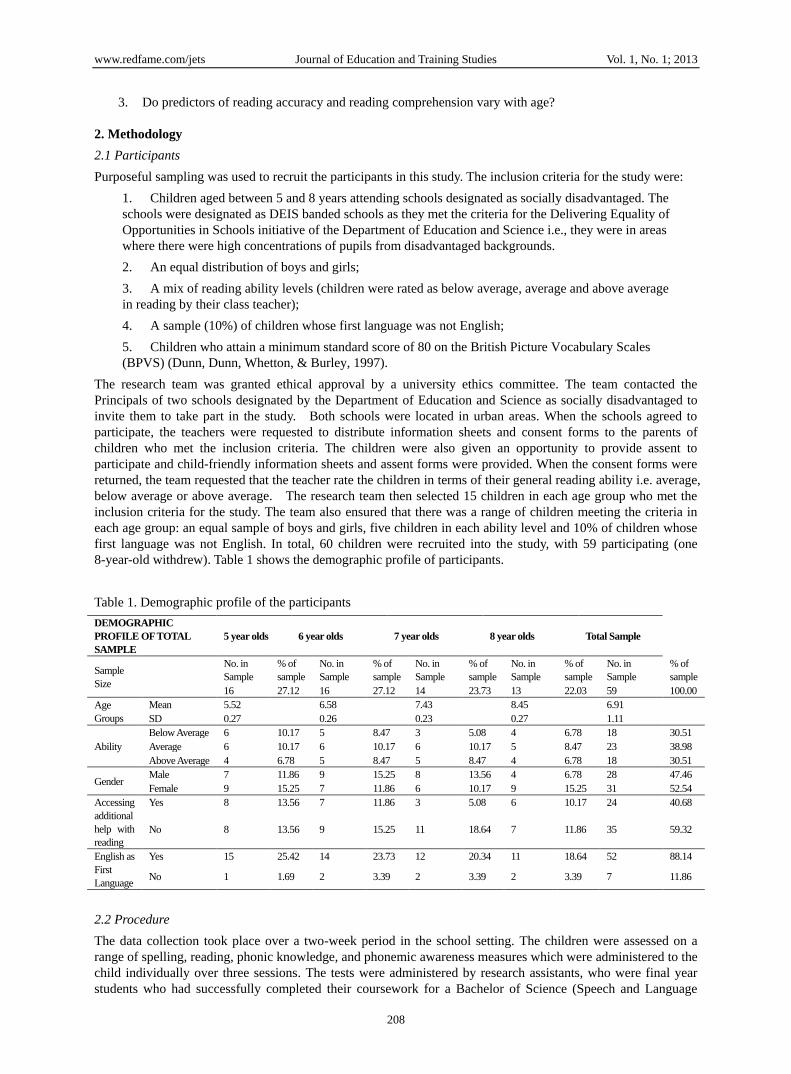
8-year-old withdrew). Table 1 shows the demographic profile of participants.
Table 1. Demographic profile of the participants
DEMOGRAPHIC
PROFILE OF TOTAL
SAMPLE
5 year olds 6 year olds 7 year olds 8 year olds Total Sample
Sample
Size
No. in
Sample
% of
sample
No. in
Sample
% of
sample
No. in
Sample
% of
sample
No. in
Sample
% of
sample
No. in
Sample
% of
sample
16 27.12 16 27.12 14 23.73 13 22.03 59 100.00
Age
Groups
Mean 5.52 6.58 7.43 8.45 6.91
SD 0.27 0.26 0.23 0.27 1.11
Ability
Below Average 6 10.17 5 8.47 3 5.08 4 6.78 18 30.51
Average 6 10.17 6 10.17 6 10.17 5 8.47 23 38.98
Above Average 4 6.78 5 8.47 5 8.47 4 6.78 18 30.51
Gender Male 7 11.86 9 15.25 8 13.56 4 6.78 28 47.46
Female 9 15.25 7 11.86 6 10.17 9 15.25 31 52.54
Accessing
additional
help with
reading
Yes 8 13.56 7 11.86 3 5.08 6 10.17 24 40.68
No 8 13.56 9 15.25 11 18.64 7 11.86 35 59.32
English as
First
Language
Yes 15 25.42 14 23.73 12 20.34 11 18.64 52 88.14
No 1 1.69 2 3.39 2 3.39 2 3.39 7 11.86
2.2 Procedure
The data collection took place over a two-week period in the school setting. The children were assessed on a
range of spelling, reading, phonic knowledge, and phonemic awareness measures which were administered to the
child individually over three sessions. The tests were administered by research assistants, who were final year
students who had successfully completed their coursework for a Bachelor of Science (Speech and Language
www.redfame.com/jets Journal of Education and Training Studies Vol. 1, No. 1; 2013
209
Therapy). The research assistants received training from the research team on the administration and scoring of
the tests, the sequence of administration of the tests, and the procedures for recording the data. The research team
planned detailed timetables and schedules for the assessments to minimise disruption for the class teacher. All
data was inputted to an excel spreadsheets and a random sample of the data (20%) was double-entered and
selected to check the accuracy of scoring and data and there was a <1% error rate entry to the database.
2.3 Materials
2.3.1 Reading Measures
Two measures of reading were included, that is single word reading and passage reading. The Single Word
Reading (SWR) subtest of the Wechsler Individual Attainment Test IIUK Teacher‟s Version (WIAT IIUK-T)
(Wechsler, 2006), was used to assess accuracy of single word reading. The WIAT-IIUK-T (2006) was recently
standardised on a UK population of 4-16 year olds. The York Assessment of Reading for Comprehension (YARC)
(Snowling et al., 2009) was used to assess reading accuracy (passage reading) and comprehension.
2.3.2 Spelling Measure
The Single Word Spelling Test (SWST), (Sacre & Masterson, 2000) was used to assess spelling.
2.3.3 Vocabulary Measure
The British Picture Vocabulary Scale (BPVS II, Dunn et al., 1997) was used to measure receptive vocabulary.
2.3.4 Phonemic Awareness Measures
A set of seven phonemic awareness tasks was developed, based on a pre-school assessment battery (Stuart,
unpublished) and on the Comprehensive Test of Phonological Processing (CTOPP) (Wagner, Torgesen and
Rashotte, 1999). The seven tasks were given in the following order to all participants: initial phoneme
matching, final phoneme matching, initial phoneme identification, final phoneme identification, phoneme
blending (words), phoneme segmentation, and phoneme blending (non-words).
2.3.4 Non-word Reading Measure
A measure of non-word reading (Stuart, unpublished) consisting of 30 non-words was used to assess children‟s
ability to use phonological recoding processes to read unfamiliar items. The first 10 items consist of non-words
with one or two syllables, illustrated by drawings of friendly monsters. In the remaining 20 items, there are
words of increasing complexity i.e. blends and multisyllabic words.
2.3.6 Phonic Knowledge Measure
The phonic knowledge measure assessed pupils‟ knowledge of grapheme-phoneme correspondences. There were
25 single letter graphemes (all single letters of the alphabet except q), 14 digraphs (four consonant, ten vowel)
and one trigraph (igh). The graphemes selected were among those whose grapheme-phoneme correspondence are
taught first in many structured phonic schemes.
2.4 Test Administration
For the standardised tests (WIAT IIUK-T, YARC, SWST, BPVS II), the administration procedures and
instructions given in the respective test manuals were followed. Procedures and instructions given for the
phonemic awareness, non-word reading and phonic knowledge measures were as follows:
Task 1 Initial phoneme matching
A target word was spoken and the pupil was required to indicate, from a set of three pictures, the item whose
name began with the same phoneme as the target word. The following instructions were given: “We‟re going to
play some games with words. I‟ll show you pictures to help you remember them. Look at this first picture. This
is a hat. Now look at these three pictures. This is a cup, and this is a house and this is a ball. Which of these
pictures starts with the /h/ sound like hat: cup, house or ball?” Corrective feedback was given on two practice
items, followed by four test items with no further feedback.
Task 2 Final phoneme matching
A target word was spoken and the pupil was required to indicate, from a set of three pictures, the item whose
name ended with the same phoneme as last phoneme of (the target word. The following instructions were given:
“Now we‟re going to change our word game, and think of the last sound in each word. Look at this first picture.
This is a leaf. Now look at these three pictures. This is a duck, knife and moon. The word leaf ends with the /f/
sound. Which of these words ends with the /f/ sound like leaf? duck, knife or moon?” Corrective feedback was
given on two practice items, followed by four test items with no further feedback.
www.redfame.com/jets Journal of Education and Training Studies Vol. 1, No. 1; 2013
210
Task 3 Initial phoneme identification
Pupils were shown pictures which were named for them, They were then asked to give the first sound of the
name. The following instructions were given: “Now we‟re going to change our word game again. See this
picture? It‟s a tiger. Say tiger. What sound is at the beginning of tiger?” Corrective feedback was given on two
practice items, followed by eight test items with no further feedback. The task was discontinued after five
consecutive failures. Only pupils who attempted all items continued on to the final phoneme identification and
the phoneme segmentation tasks.
Task 4 Final phoneme identification
Pupils were again shown pictures which were named for them. They were then asked to give the last sound of
the name. The following instructions were given: “Now we‟re going to change the game again. Look at this
picture. It‟s a vase. What sound can you hear at the end of vase?” Corrective feedback was given on two practice
items, followed by six test items with no further feedback. The task was discontinued after three consecutive
failures.
Task 5 Phoneme blending real words
Pupils were required to blend syllables or phonemes into a word. Practice with corrective feedback was given
first on two syllable blending items (e.g. mon-day), followed by two onset-rime blending items (e.g. m-ake),
followed by two phoneme blending items (e.g. b-e-d). The following instructions were given: “This is a
different word game. I‟m going to talk like a robot and I want you to tell me the word the robot is trying to say.
Are you ready? Listen: Mon-day. What word is the robot trying to say?” There were 12 test items, three testing
syllable blending, and nine testing phoneme blending. The phoneme blending test items varied in number of
phonemes: there were three 2-phoneme items, two 3-phoneme items, two 4-phoneme items, and one 6-phoneme
and one 7 phoneme item. The task was discontinued after three consecutive failures. Only pupils who
attempted all items continued on to the phoneme blending – non-words task.
Task 6 Phoneme segmentation
Pupils were required to segment monosyllabic words consisting of from two to five phonemes into their
constituent phonemes. The following instructions were given: “Now you are going to be a robot. I‟m going to
say the word and you will say it back to me one sound at a time like the robot did. If I say she, then you would
say sh-e. You try it. Say she. Now say she one sound at a time”. Corrective feedback was given on five practice
items, followed by 12 test items with no further feedback.
Task 7 Phoneme blending non-words
Pupils were required to blend phonemes into a non-word pronunciation. The following instructions were given:
“This is the last game. I‟m going to talk like a robot again and I want you to tell me what word the robot is trying
to say. This time the words will be made up words, you won‟t have heard them before. Let‟s try one. Listen:
gam-bo. What made up word is the robot trying to say? gam-bo” After one further syllable blending practice
item, four phoneme blending practice items were given with corrective feedback, followed by ten test items from
two to five phonemes in length, with no further feedback.
Task 8 Non-word reading
For the first ten items, pupils were shown each drawing of a monster in turn, and given the following instructions:
“Look at this little monster. He‟s a special sort of monster. Can you read this (point to non-word „ud‟) and tell me
what sort of a monster he is?” Corrective feedback was given on the first two practice items: “That‟s not quite
right. He‟s an u – d (point to each letter as you give its sound) monster, u –d, ud. He‟s an ud monster, isn‟t he,
and we worked that out from the letters. Let‟s try the next one”. Once the illustrated items had been successfully
completed, the pupil was asked to read the remaining 20 non-illustrated items. When the child failed five
consecutive items, the test was discontinued.
Phonic knowledge
Pupils were shown a card, with 40 graphemes, in total and they were shown one line at time with five graphemes.
The tester pointed to each grapheme in turn and asked the pupil to give the sound of that grapheme. The
instructions were as follows: “There are lots of letters on this card and I want you to tell me what sound each
letter or group of letters makes” The tester points to the first letter. “Here‟s the letter S (ESS). Can you tell me
the sound of letter S? And this one?” The tester points to the second letter. If the child named the letter, the tester
said “Yes that‟s the letter, what is its sound?” After five consecutive failures, the tester says to the child: “They‟re
getting a bit hard now aren‟t they? Have a look at the rest of the letters and tell me if you know any of their
www.redfame.com/jets Journal of Education and Training Studies Vol. 1, No. 1; 2013
211
sounds”. One point was given when the children provided the correct sound for each letter and stopped testing
when the child was clear that they don‟t know any more.
2.5 Analysis Plan
Descriptive statistics are provided to illustrate the children‟s performance on the range of skills tested. In order to
answer the first research question (that is exploring the contributions of phonemic awareness, phonic knowledge,
non-word reading, and vocabulary to reading and spelling skills) simple multiple regression was used with three
separate analyses to assess the ability of phonemic awareness, phonic knowledge, non-word reading, and
vocabulary to predict scores on three different dependent variables, that is single word reading (as measured on the
WIAT SWR, passage reading (as measured on the YARC) and spelling (as measured on the SWST). In order to
answer the second research question (that is an investigation into the contributions of phonemic awareness, phonic
knowledge, non-word reading, and vocabulary to reading comprehension) a simple multiple regression was used
to assess the ability of phonemic awareness, phonic knowledge, non-word reading, and vocabulary to predict
scores on reading comprehension (as measured by the YARC). In order to address the third research question (that
is whether predictors of reading accuracy and reading comprehension vary with age), in the first instance a simple
multiple regression was used to assess the ability of phonemic awareness and phonic knowledge to predict scores
on word reading (as measured by the WIAT SWR) and non-word reading. Separate analyses were conducted for
children aged 5-6 years and children aged 7-8 years. In addition, simple multiple regression was used to assess the
ability of vocabulary scores (as measured by the BPVS), word reading (as measured by the WIAT SWR) and
non-word reading to predict reading comprehension scores (as measured on the YARC). Separate analyses were
conducted for children aged 5-6 and children aged 7-8. Preliminary analyses were conducted in all regression
analyses to ensure no violation of the assumptions of normality, linearity, multicollinearity, and homoscedasticity.
3. Results
Given that the initial and final phoneme matching tasks (Tasks 1 and 2) each had only four items, the participants
needed to score 3/4 on each task to be significantly above chance. Therefore, these tasks were excluded from
further analyses. The results of all other measures are shown in Table 2.
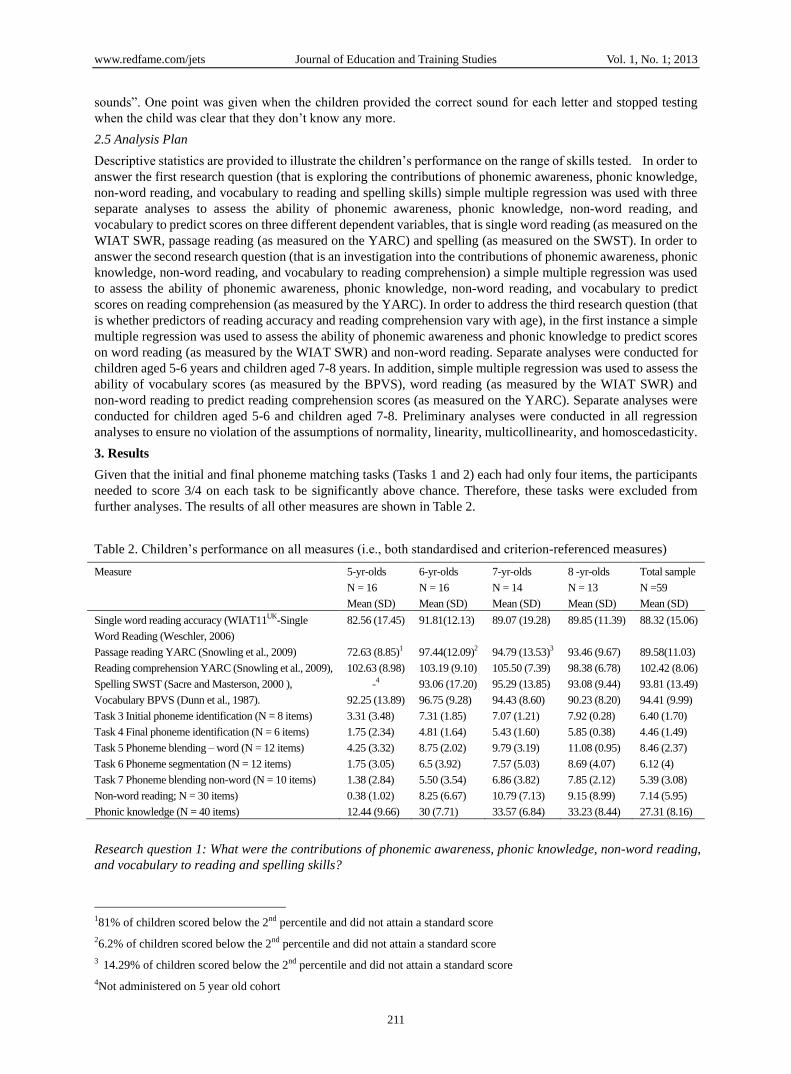
Table 2. Children‟s performance on all measures (i.e., both standardised and criterion-referenced measures)
Measure 5-yr-olds
N = 16
Mean (SD)
6-yr-olds
N = 16
Mean (SD)
7-yr-olds
N = 14
Mean (SD)
8 -yr-olds
N = 13
Mean (SD)
Total sample
N =59
Mean (SD)
Single word reading accuracy (WIAT11UK
-Single
Word Reading (Weschler, 2006)
82.56 (17.45) 91.81(12.13) 89.07 (19.28) 89.85 (11.39) 88.32 (15.06)
Passage reading YARC (Snowling et al., 2009) 72.63 (8.85)1 97.44(12.09)
2 94.79 (13.53)
3 93.46 (9.67) 89.58(11.03)
Reading comprehension YARC (Snowling et al., 2009), 102.63 (8.98) 103.19 (9.10) 105.50 (7.39) 98.38 (6.78) 102.42 (8.06)
Spelling SWST (Sacre and Masterson, 2000 ), -4 93.06 (17.20) 95.29 (13.85) 93.08 (9.44) 93.81 (13.49)
Vocabulary BPVS (Dunn et al., 1987). 92.25 (13.89) 96.75 (9.28) 94.43 (8.60) 90.23 (8.20) 94.41 (9.99)
Task 3 Initial phoneme identification (N = 8 items) 3.31 (3.48) 7.31 (1.85) 7.07 (1.21) 7.92 (0.28) 6.40 (1.70)
Task 4 Final phoneme identification (N = 6 items) 1.75 (2.34) 4.81 (1.64) 5.43 (1.60) 5.85 (0.38) 4.46 (1.49)
Task 5 Phoneme blending – word (N = 12 items) 4.25 (3.32) 8.75 (2.02) 9.79 (3.19) 11.08 (0.95) 8.46 (2.37)
Task 6 Phoneme segmentation (N = 12 items) 1.75 (3.05) 6.5 (3.92) 7.57 (5.03) 8.69 (4.07) 6.12 (4)
Task 7 Phoneme blending non-word (N = 10 items) 1.38 (2.84) 5.50 (3.54) 6.86 (3.82) 7.85 (2.12) 5.39 (3.08)
Non-word reading; N = 30 items) 0.38 (1.02) 8.25 (6.67) 10.79 (7.13) 9.15 (8.99) 7.14 (5.95)
Phonic knowledge (N = 40 items) 12.44 (9.66) 30 (7.71) 33.57 (6.84) 33.23 (8.44) 27.31 (8.16)
Research question 1: What were the contributions of phonemic awareness, phonic knowledge, non-word reading,
and vocabulary to reading and spelling skills?
181% of children scored below the 2nd percentile and did not attain a standard score
26.2% of children scored below the 2nd percentile and did not attain a standard score
3 14.29% of children scored below the 2nd percentile and did not attain a standard score
4Not administered on 5 year old cohort
www.redfame.com/jets Journal of Education and Training Studies Vol. 1, No. 1; 2013
212
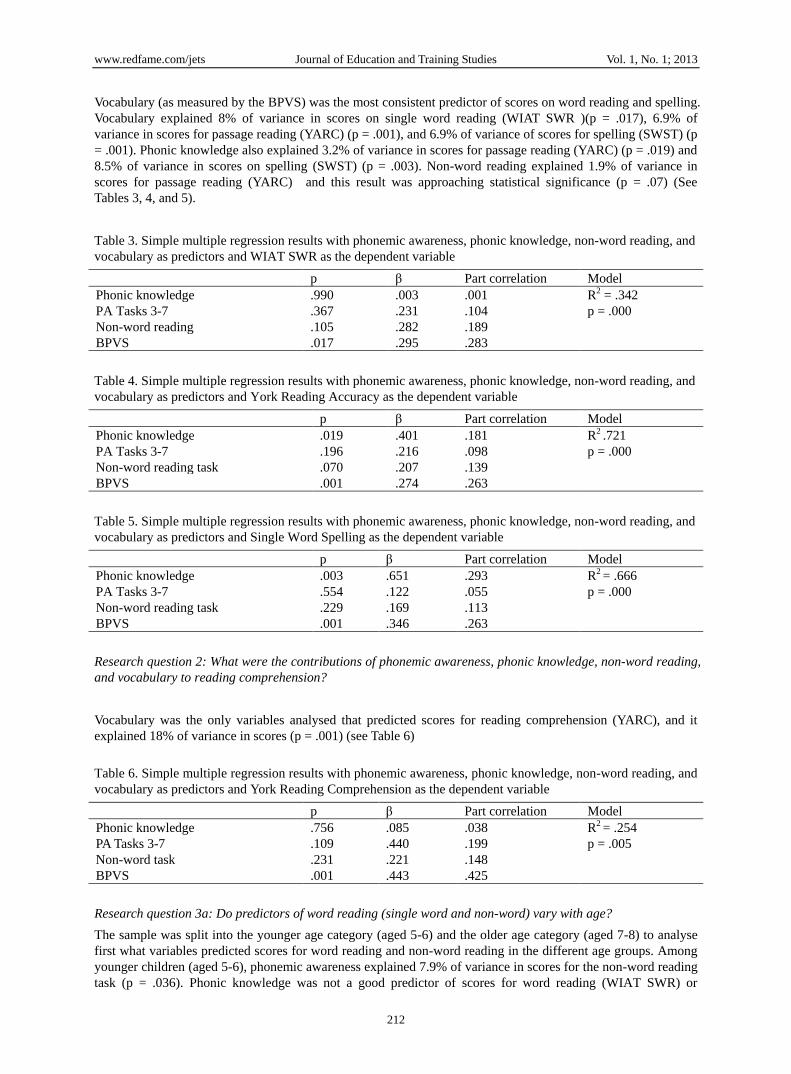
Vocabulary (as measured by the BPVS) was the most consistent predictor of scores on word reading and spelling.
Vocabulary explained 8% of variance in scores on single word reading (WIAT SWR )(p = .017), 6.9% of
variance in scores for passage reading (YARC) (p = .001), and 6.9% of variance of scores for spelling (SWST) (p
= .001). Phonic knowledge also explained 3.2% of variance in scores for passage reading (YARC) (p = .019) and
8.5% of variance in scores on spelling (SWST) (p = .003). Non-word reading explained 1.9% of variance in
scores for passage reading (YARC) and this result was approaching statistical significance (p = .07) (See
Tables 3, 4, and 5).
Table 3. Simple multiple regression results with phonemic awareness, phonic knowledge, non-word reading, and
vocabulary as predictors and WIAT SWR as the dependent variable
p β Part correlation Model
Phonic knowledge .990 .003 .001 R2 = .342
p = .000 PA Tasks 3-7 .367 .231 .104
Non-word reading .105 .282 .189
BPVS .017 .295 .283
Table 4. Simple multiple regression results with phonemic awareness, phonic knowledge, non-word reading, and
vocabulary as predictors and York Reading Accuracy as the dependent variable
p β Part correlation Model
Phonic knowledge .019 .401 .181 R2 .721
p = .000 PA Tasks 3-7 .196 .216 .098
Non-word reading task .070 .207 .139
BPVS .001 .274 .263
Table 5. Simple multiple regression results with phonemic awareness, phonic knowledge, non-word reading, and
vocabulary as predictors and Single Word Spelling as the dependent variable
p β Part correlation Model
Phonic knowledge .003 .651 .293 R2 = .666
p = .000 PA Tasks 3-7 .554 .122 .055
Non-word reading task .229 .169 .113
BPVS .001 .346 .263
Research question 2: What were the contributions of phonemic awareness, phonic knowledge, non-word reading,
and vocabulary to reading comprehension?
Vocabulary was the only variables analysed that predicted scores for reading comprehension (YARC), and it
explained 18% of variance in scores (p = .001) (see Table 6)
Table 6. Simple multiple regression results with phonemic awareness, phonic knowledge, non-word reading, and
vocabulary as predictors and York Reading Comprehension as the dependent variable
p β Part correlation Model
Phonic knowledge .756 .085 .038 R2 = .254
p = .005 PA Tasks 3-7 .109 .440 .199
Non-word task .231 .221 .148
BPVS .001 .443 .425
Research question 3a: Do predictors of word reading (single word and non-word) vary with age?
The sample was split into the younger age category (aged 5-6) and the older age category (aged 7-8) to analyse
first what variables predicted scores for word reading and non-word reading in the different age groups. Among
younger children (aged 5-6), phonemic awareness explained 7.9% of variance in scores for the non-word reading
task (p = .036). Phonic knowledge was not a good predictor of scores for word reading (WIAT SWR) or
www.redfame.com/jets Journal of Education and Training Studies Vol. 1, No. 1; 2013
213
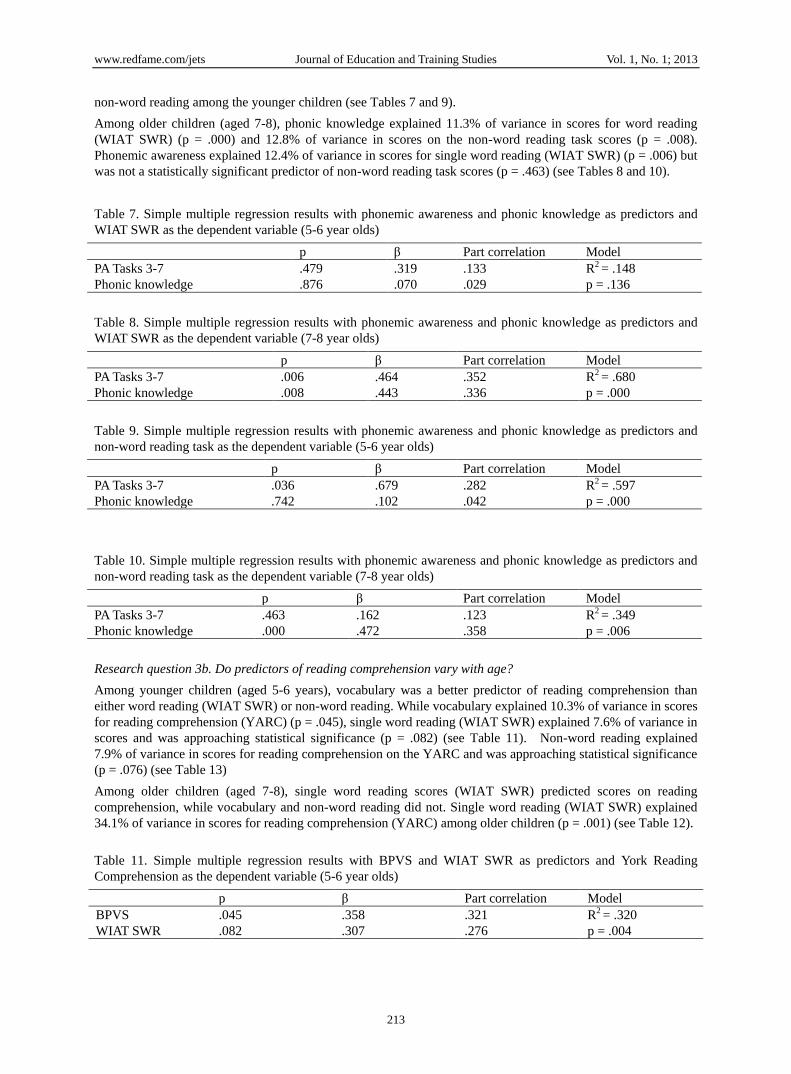
non-word reading among the younger children (see Tables 7 and 9).
Among older children (aged 7-8), phonic knowledge explained 11.3% of variance in scores for word reading
(WIAT SWR) (p = .000) and 12.8% of variance in scores on the non-word reading task scores (p = .008).
Phonemic awareness explained 12.4% of variance in scores for single word reading (WIAT SWR) (p = .006) but
was not a statistically significant predictor of non-word reading task scores (p = .463) (see Tables 8 and 10).
Table 7. Simple multiple regression results with phonemic awareness and phonic knowledge as predictors and
WIAT SWR as the dependent variable (5-6 year olds)
p β Part correlation Model
PA Tasks 3-7 .479 .319 .133 R2 = .148
p = .136 Phonic knowledge .876 .070 .029
Table 8. Simple multiple regression results with phonemic awareness and phonic knowledge as predictors and
WIAT SWR as the dependent variable (7-8 year olds)
p β Part correlation Model
PA Tasks 3-7 .006 .464 .352 R2 = .680
p = .000 Phonic knowledge .008 .443 .336
Table 9. Simple multiple regression results with phonemic awareness and phonic knowledge as predictors and
non-word reading task as the dependent variable (5-6 year olds)
p β Part correlation Model
PA Tasks 3-7 .036 .679 .282 R2 = .597
p = .000 Phonic knowledge .742 .102 .042
Table 10. Simple multiple regression results with phonemic awareness and phonic knowledge as predictors and
non-word reading task as the dependent variable (7-8 year olds)
p β Part correlation Model
PA Tasks 3-7 .463 .162 .123 R2 = .349
p = .006 Phonic knowledge .000 .472 .358
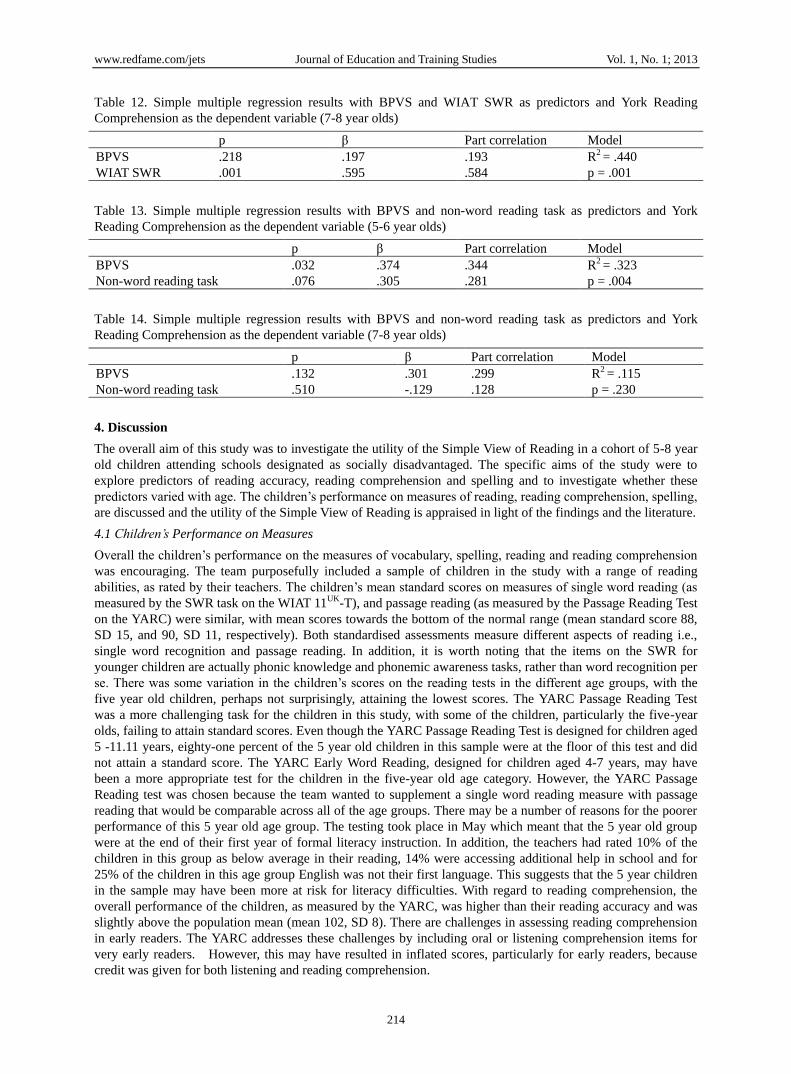
Research question 3b. Do predictors of reading comprehension vary with age?
Among younger children (aged 5-6 years), vocabulary was a better predictor of reading comprehension than
either word reading (WIAT SWR) or non-word reading. While vocabulary explained 10.3% of variance in scores
for reading comprehension (YARC) (p = .045), single word reading (WIAT SWR) explained 7.6% of variance in
scores and was approaching statistical significance (p = .082) (see Table 11). Non-word reading explained
7.9% of variance in scores for reading comprehension on the YARC and was approaching statistical significance
(p = .076) (see Table 13)
Among older children (aged 7-8), single word reading scores (WIAT SWR) predicted scores on reading
comprehension, while vocabulary and non-word reading did not. Single word reading (WIAT SWR) explained
34.1% of variance in scores for reading comprehension (YARC) among older children (p = .001) (see Table 12).
Table 11. Simple multiple regression results with BPVS and WIAT SWR as predictors and York Reading
Comprehension as the dependent variable (5-6 year olds)
p β Part correlation Model
BPVS .045 .358 .321 R2 = .320
p = .004 WIAT SWR .082 .307 .276
www.redfame.com/jets Journal of Education and Training Studies Vol. 1, No. 1; 2013
214
Table 12. Simple multiple regression results with BPVS and WIAT SWR as predictors and York Reading
Comprehension as the dependent variable (7-8 year olds)
p β Part correlation Model
BPVS .218 .197 .193 R2 = .440
p = .001 WIAT SWR .001 .595 .584
Table 13. Simple multiple regression results with BPVS and non-word reading task as predictors and York
Reading Comprehension as the dependent variable (5-6 year olds)
p β Part correlation Model
BPVS .032 .374 .344 R2 = .323
p = .004 Non-word reading task .076 .305 .281
Table 14. Simple multiple regression results with BPVS and non-word reading task as predictors and York
Reading Comprehension as the dependent variable (7-8 year olds)
p β Part correlation Model
BPVS .132 .301 .299 R2 = .115
p = .230 Non-word reading task .510 -.129 .128
4. Discussion
The overall aim of this study was to investigate the utility of the Simple View of Reading in a cohort of 5-8 year
old children attending schools designated as socially disadvantaged. The specific aims of the study were to
explore predictors of reading accuracy, reading comprehension and spelling and to investigate whether these
predictors varied with age. The children‟s performance on measures of reading, reading comprehension, spelling,
are discussed and the utility of the Simple View of Reading is appraised in light of the findings and the literature.
4.1 Children’s Performance on Measures
Overall the children‟s performance on the measures of vocabulary, spelling, reading and reading comprehension
was encouraging. The team purposefully included a sample of children in the study with a range of reading
abilities, as rated by their teachers. The children‟s mean standard scores on measures of single word reading (as
measured by the SWR task on the WIAT 11UK-T), and passage reading (as measured by the Passage Reading Test
on the YARC) were similar, with mean scores towards the bottom of the normal range (mean standard score 88,
SD 15, and 90, SD 11, respectively). Both standardised assessments measure different aspects of reading i.e.,
single word recognition and passage reading. In addition, it is worth noting that the items on the SWR for
younger children are actually phonic knowledge and phonemic awareness tasks, rather than word recognition per
se. There was some variation in the children‟s scores on the reading tests in the different age groups, with the
five year old children, perhaps not surprisingly, attaining the lowest scores. The YARC Passage Reading Test
was a more challenging task for the children in this study, with some of the children, particularly the five-year
olds, failing to attain standard scores. Even though the YARC Passage Reading Test is designed for children aged
5 -11.11 years, eighty-one percent of the 5 year old children in this sample were at the floor of this test and did
not attain a standard score. The YARC Early Word Reading, designed for children aged 4-7 years, may have
been a more appropriate test for the children in the five-year old age category. However, the YARC Passage
Reading test was chosen because the team wanted to supplement a single word reading measure with passage
reading that would be comparable across all of the age groups. There may be a number of reasons for the poorer
performance of this 5 year old age group. The testing took place in May which meant that the 5 year old group
were at the end of their first year of formal literacy instruction. In addition, the teachers had rated 10% of the
children in this group as below average in their reading, 14% were accessing additional help in school and for
25% of the children in this age group English was not their first language. This suggests that the 5 year children
in the sample may have been more at risk for literacy difficulties. With regard to reading comprehension, the
overall performance of the children, as measured by the YARC, was higher than their reading accuracy and was
slightly above the population mean (mean 102, SD 8). There are challenges in assessing reading comprehension
in early readers. The YARC addresses these challenges by including oral or listening comprehension items for
very early readers. However, this may have resulted in inflated scores, particularly for early readers, because
credit was given for both listening and reading comprehension.
www.redfame.com/jets Journal of Education and Training Studies Vol. 1, No. 1; 2013
215
In addition, the overall mean standard scores for vocabulary and spelling were also in the average range. There is
an emphasis on oral language development in Irish classrooms, particularly in disadvantaged schools, with the
assumption that these skills will in turn contribute the development of literacy (Kennedy, 2012). In a recent study,
Law, McBean and Rush (2011) also found that vocabulary scores in a sample of preschool children living in
areas that were socially disadvantaged were in the average range. Although the children‟s scores in the current
study were in the average range, their scores were more in the lower end of this range and on the boundary of
delay. These results must be interpreted within the context of the sample in this study. Although all were
attending schools designated as disadvantaged, the sample included children with a range of reading abilities, as
rated by their teachers. In addition, definitions of what constitutes „disadvantaged‟ can be challenging and the
sample may not have been as „disadvantaged‟ as samples in other studies.
While these findings need to be interpreted with caution, they provide tentative evidence that the Department of
Education and Science initiatives to support the development of literacy in schools designated as disadvantaged,
may be enhancing the children‟s literacy. One possible interpretation for their relatively good performance may
be that this sample were not as disadvantaged as those in other studies, given that disadvantage is difficult to
measure. Nonetheless, many barriers to literacy development have been identified in this group of children
including: environmental factors such as low parental literacy levels (Eivers et al., 2004), less exposure to book
reading, text, and teaching about sounds and words (Kennedy et al., 2012); factors related to teaching such as
lack of differentiation in teaching to address specific and individual learning needs; and other factors such as
large class sizes, poor access to psychoeducational assessments, lack of suitable resources for assessing and
teaching literacy skills, and lack of cohesion between classroom and support programmes (Eivers et al., 2004;
Department of Education and Science, 2011). Given these factors and other evidence that children who are
disadvantaged may be at increased risk for literacy difficulties, the Department of Education and Science have
provided additional supports for children attending schools, designated as socially disadvantaged. The findings
of this study provide very tentative evidence that these initiatives may be making a difference. There have been
few published studies on the effectiveness of these initiatives. Kennedy (2008) found evidence for the
effectiveness of an intervention literacy programme for children in disadvantaged schools over a two-year period.
Kennedy (2008) identified some key factors that contributed to the effectiveness of these programmes, including
professional development support for teachers when implementing new teaching methodologies and the use of
cognitively challenging activities to stimulate children‟s creativity and agency. Further rigorous longitudinal
studies are required to explore the effectiveness of initiatives being implemented in disadvantaged schools.
4.2 The Utility of the Simple View of Reading
While there is evidence to support the Simple View of Reading (Muter et al., 2004, Catts et al., 2006), others
argue that it may not be so simple. On the basis of the Simple View of Reading, we had two hypotheses. Our
first hypothesis was that phonic knowledge, phonemic awareness and non-word reading would be better
predictors of word recognition and spelling than vocabulary. Our second hypothesis was that vocabulary would
be a predictor of reading comprehension. The evidence for the first hypothesis was mixed. Phonic knowledge
predicted passage reading and spelling, and non-word reading predicting passage reading. Some argue that
phonic knowledge skills play an important role in learning to read and spell (Muter et al., 2004; Ehri et al., 2001).
Non-word reading was also an important predictor of reading. Children need to draw on and use phonic
knowledge and phonemic awareness skills when reading non-words, given that unfamiliar or new words
resemble non-words. Indeed, Ouellette and Beers (2010) argue that if we adopt the Simple View of Reading,
non-word reading tasks should be included in the assessment protocol because they truly test sound letter
associations. Therefore, the findings that phonic knowledge and non-word reading were predictors of word
recognition support the Simple View of Reading. These findings are also consistent with other research (Ehri et
al. 2001; Castles & Coltheart 2004; Hogan et al., 2005; Nag 2007). Nonetheless, a somewhat surprising finding
was that vocabulary was also a predictor of reading. This contrasts with the findings of Muter et al. (2004) who
found that word recognition skills were consistently predicted by measures of phonic knowledge and phonemic
knowledge but not by vocabulary knowledge, rhyme skills, or grammatical skills.
When we examined whether these predictors changed with age, perhaps not surprisingly phonic knowledge and
phonemic awareness were stronger predictors of reading in the older children (7-8 years). Phonic knowledge was
a stronger predictor of reading and non-word reading in the 7-8 year old sample, whereas it was not a predictor
in the younger sample. The younger children may not yet have learned the letter-sound associations and were
more likely to rely on their phoneme awareness skills when reading. As already discussed in the literature, there
is some evidence that children progress from awareness of large units (e.g., syllables and rhymes) to awareness
of smaller units or phonemes (Carroll et al., 2003). It is also worth noting that the simple multiple regression
www.redfame.com/jets Journal of Education and Training Studies Vol. 1, No. 1; 2013
216
analysis was based on four predictors of reading i.e., phonic knowledge, phonemic awareness, non-word reading
and vocabulary. The interaction between these factors is not clear.
The evidence for the second hypothesis was also mixed. For the total sample, as expected vocabulary was the
strongest predictor of reading comprehension. The finding that vocabulary was a predictor of reading
comprehension is also consistent with the literature (Snow, 2002; Torgesen et al., 1997; Muter et al., 2004). For
example, Muter et al. (2004), in their longitudinal study of early reading development, found that for reading
comprehension, higher language skills such as vocabulary and grammatical development are important
predictors, whereas phonological skills were relatively unimportant predictors. However, when we examined
whether the factors varied with age, it emerged that vocabulary was a stronger predictor of reading
comprehension, along with single word reading and non-word reading, in the younger children, whereas single
word reading was the strongest predictor of reading comprehension in the older sample. Vocabulary, while still a
predictor of reading comprehension in the older children, was a less powerful predictor. This contrasted with the
findings in other studies (Muter et al., 2004: Ouellette & Beers, 2011). In the Simple View of Reading, it is
construct of listening comprehension that is considered important in reading comprehension. What is perhaps
less clear is what aspects of listening comprehension are important for reading comprehension, and more
specifically what aspects of vocabulary may be important predictors such as breadth or depth of vocabulary
(Ouellette & Beers, 2010). In addition, researchers need to consider how constructs are measured. For example,
breadth rather than depth of vocabulary was measured using the BPVS. Reading comprehension was measured
in this study by asking children to answer questions based on a text that they had read. For the younger children
there were also listening comprehension tasks. Kirby and Savage (2008) argue that researchers need to cognisant
of the demands of reading comprehension tasks, as some tasks of comprehension may place additional demands
on decoding skills. They advocate use of a range of measures of reading comprehension in research studies. The
findings of this study also need to be considered in light of the small sample size, in particular when the group
was divided in younger (n=32) and older groups (n=27). Nonetheless, the evidence from this study supports the
Simple View of Reading in that vocabulary was a predictor of reading comprehension, albeit a stronger predictor
in younger rather than older children.
While this study provides mixed evidence for the Simple View of Reading, some argue that the Simple View of
Reading may not be so simple (Kirby & Savage, 2008; Ouellette & Beers, 2010; Joshi & Aaron, 2000; Tilstra et
al., 2009, McMaster, Van den Broek, Kendeou, & Rapp (2009). Some have identified gaps in the model such as
the role of fluency in reading and reading comprehension, ways in which children use cognitive strategies in
reading comprehension tasks, and the different aspects of vocabulary that may be important predictors of reading
and reading comprehension (Kirby & Savage, 2008; Ouellette & Beers, 2010).
4.3 Limitations
The results of this study provide a snapshot of the performance of a cohort of different children in four different
age groups at a particular point in time. Further longitudinal studies are required that examine the development
of these skills within the same cohort of children over time. The findings of this study must be interpreted within
the context of the limitations of the study. The data collected in the sample were subjected to a range of statistical
analyses and the results must be interpreted with caution given the small sample size. In addition, as already
stated, the study included children with a range of reading abilities, as rated by their teachers. It is difficult to be
specific about how „disadvantaged‟ the sample was. The research team used attendance at a DEIS school as a
measure of disadvantage but other measures may provide a more explicit definition of disadvantage e.g., parental
income. With regard to the measures, although a number of phonemic awareness tasks were administered, these
represented only a sample of phonemic awareness skills. While the tasks took account of linguistic and cognitive
demands, they were not specifically designed to measure dimensions such as partial/complete
blending/segmenting, effect of syllable structure, and increasing cognitive loading. In addition, it is worth noting
that all of the standardised tests used in the study were standardised on UK populations. In addition, we need to
be mindful of the validity of the tests and look carefully at what they tested. The early tasks on the WIATUK-T
measure phonic knowledge and phonemic awareness rather than reading per se. The BPVS tests vocabulary
breadth rather than depth. The reading comprehension tasks in the YARC included listening comprehension
items for the early readers and answering questions based on a passage for the older readers. Reading
comprehension requires decoding and holding information in working memory so that it can be processed
(Kirby&Savage, 2008). If decoding is effortful, the child may have less cognitive resources available for
comprehension. In addition, other variables, such as fluency, that have been linked with literacy development
were not investigated.
www.redfame.com/jets Journal of Education and Training Studies Vol. 1, No. 1; 2013
217
5. Conclusions and Recommendations
The results of this study are encouraging in that the children in this study, who are attending schools designated
as socially disadvantaged, are acquiring literacy skills. The Simple View of Reading provides a useful
conceptual and balanced model because it promotes a broad agenda for teaching literacy skills as it focuses
attention on both word reading skills and comprehension abilities, and the underlying skills necessary to develop
these abilities (Kirby & Savage, 2008; Stuart et al., 2008; Brooks, Torgerson, & Hall, 2008). However, research
is required to further develop our understanding of the complex inter-related processes involved in the „not so
simple‟ task of learning to read. These findings also highlight the importance of considering the age of children
in studies, given that different skills may be important at different stages of development (Ouellette & Beers,
2010). Further longitudinal studies, such as that of Muter et al. (2004), are required that include multiple
measures to explore the role of specific predictors at different stages of development.
Acknowledgments
This project was part of a bigger project that was funded by Barnardos. Thank you to everyone who helped with
the project including Marie Galvin, and the research assistants who collected the data. Thank you to Aoife
O‟Brien who helped with inputting the data. Thank you to the schools, parents and children who gave up their
time to participate in the study. Thank you to Prof. Morag Stuart for her feedback on earlier drafts.
References
Anderson, R. C., Wilson, P. T., & Fielding, L. G. (1988). Growth in reading and how children spend their time
outside of school. Reading Research Quarterly, 23, 285-303. http://dx.doi.org/10.1598/RRQ.23.3.2
Anthony, J. L., Lonigan, C., Driscoll, K., Phillips, B., & Burgess, S. (2003). Phonological sensitivity: a
quasi-parallel progression of word structure units and cognitive operations. Reading Research Quarterly,
38(4), 470-487. http://dx.doi.org/10.1598/RRQ.38.4.3
Beck, I., & McKeown, M. (1991). Conditions of vocabulary acquisition. In R. Barr, M. Kamil, P. Mosenthal, and
P. D. Pearson (Eds.), Handbook of reading research, (Vol. 2, pp. 789-814). New York, NY: Longman.
Beck, I. L., Perfetti, C. A., & McKeown, M. G. (1982). Effects of long-term vocabulary instruction on lexical
access and reading comprehension. Journal of Educational Psychology, 7, 506–21.
http://dx.doi.org/10.1037/0022-0663.74.4.506
Brooks, G., Torgerson, C., & Hall, J. (2008). The use of phonics in the teaching of reading and spelling. EBP
Briefs, 3(2), June.
Carroll, M., Snowling, M., Hulme, C., & Stevenson, J. (2003). The development of phonological awareness in
preschool children. Developmental Psychology, 39(5), 913–923.
http://dx.doi.org/10.1037/0012-1649.39.5.913
Catts, H., Adlof, S., & Weismer, S. (2006). Language deficits in poor comprehenders: a case for the Simple View
of Reading. Journal of Speech, Language, and Hearing Research, 49, 278-293.
http://dx.doi.org/10.1044/1092-4388(2006/023)
Cosgrove, J., Kellaghan, T., Forde, P., & Morgan, M. (2000). The 1998 National Assessment of English Reading.
Dublin, Ireland: Educational Research Centre.
Cunningham, A. E., & Stanovich, K. E. (1997). Early reading acquisition and its relation to reading experience
and ability ten years later. Developmental Psychology, 33, 934-945.
Department of Education and Science (DES). (2005). DEIS Delivering Equality of Opportunity in Schools – An
Action Plan for Educational Inclusion. Dublin, Ireland: Stationery Office.
Department of Education and Science Inspectorate. (2005). Literacy and Numeracy in Disadvantaged Schools:
Challenges for Teachers and Learners Dublin, Ireland: Stationery Office.
Department of Education and Skills. (2011). Literacy and numeracy for learning and life: The national strategy
to improve literacy and numeracy among children and young people 2011-2020. Dublin, Ireland:
Department of Education and Skills.
Duncan, L. G., & Seymour, P. H. K. (2000). Socio-economic differences in foundation-level literacy. British
Journal of Psychology, 91, 145–166. http://dx.doi.org/10.1348/000712600161736
Dunn, L., Dunn, L. Whetton, C., & Burley, J. (1997). The British Picture Vocabulary Scale, 2nd edition, GL
Assessment Limited.
www.redfame.com/jets Journal of Education and Training Studies Vol. 1, No. 1; 2013
218
Durso, F. T., & Coggins, K. A. (1991). Organized instruction for the improvement of word knowledge skills.
Journal of Educational Psychology, 3, 108-112. http://dx.doi.org/10.1037//0022-0663.83.1.108
Ehri, L., Nunes, S., Willows, D., Schuster, B., Yaghoub-Zadeh, Z., & Shanahan, T. (2001). Phonemic awareness
instruction helps children learn to read: evidence from the National Reading Panel's meta-analysis. Reading
Research Quarterly, 36(3), 250-287. http://dx.doi.org/10.1598/RRQ.36.3.2
Eivers, R, Shiel, G., & Shortt, F. (2005). Literacy in disadvantaged primary schools- problems and solutions.
Dublin: Educational Research Centre. PLEASE DELETE
Eivers, E., Shiel, G., & Shortt, S. (2004). Reading literacy in disadvantaged primary schools. Dublin, Ireland:
Educational Research Centre.
Eivers, E., Shiel, G., Perkins, R., & Cosgrove, J. (2005). The 2004 national assessment of English reading.
Dublin: Educational Research Centre. Retrieved from http://www.erc.ie/documents/naer04_report_full.pdf
Frith, U. (1985). Beneath the surface of developmental dyslexia. In Patterson, K.E., Marshall, J.C., Coltheart, M.
(Eds). Surface Dyslexia (pp 301-330). London, England: Routledge and Kegan Paul.
Gough P., & Tunmer, W. (1986). Decoding, reading and reading disability. Remedial and Special Education,
7(1), 6-10. http://dx.doi.org/10.1177/074193258600700104
Goulandris, N. (2006). Assessing reading and spelling skills. In M. Snowling and J. Stackhouse (Eds.), Dyslexia,
Speech and Language – a Practitioner’s Handbook (pp. 98-127). London, England: Whurr Publishers.
Hatcher, P. J., & Hulme, C. (1999). Phonemes, rhymes and intelligence as predictors of children‟s responsiveness
to remedial reading instruction: Evidence from a longitudinal study. Journal of Experimental Child
Psychology, 72, 130-153. http://dx.doi.org/10.1006/jecp.1998.2480
Hayes, N., & Kernan, M. (2001). Seven years old: School experience in Ireland. National report of the IEA
preprimary project. Dublin, Ireland: Centre for Social and Educational Research, Dublin Institute of
Technology.
Hogan, T., Catts, H., & Little, T. (2005). The relationship between phonological awareness and reading:
Implications for the assessment of phonological awareness. Language, Speech, and Hearing Services in
Schools, 36, 285-293. http://dx.doi.org/10.1044/0161-1461(2005/029)
Hoien, T., Lundberg, I., Stanovich, K., & Bjaalid, I.K. (1995). Components of phonological awareness. Reading
and Writing, 7, 171-188. http://dx.doi.org/10.1007/BF01027184
Hoover, W. A., & Gough, P. B. (1990). The simple view of reading. Reading and Writing, 2, 127-160.
http://dx.doi.org/10.1007/BF00401799
Hulme, C., Hatcher, P. E., Nation, K., Brown, A., Adams, J., & Stuart, G. (2002). Phoneme awareness is a better
predictor of early reading skills than onset-rime awareness. Journal of Experimental Child Psychology, 82,
2-28. http://dx.doi.org/10.1006/jecp.2002.2670
Jamieson, C., & Simpson, S. (2006). Spelling: challenges and strategies for the dyslexic learner and the teacher.
In M. Snowling and J. Stackhouse (Eds.), Dyslexia, Speech and Language: A Practitioner's Guide (pp.
198-228). London, England: Whurr Publishers.
Joshi, R., & Aaron, P. (2000). The component model of reading: simple view of reading made a little more
complex, Reading Psychology, 21, 85–97.
Kennedy, E. (2008). Improving literacy achievement in a disadvantaged primary school: Empowering classroom
teachers through professional development (Unpublished doctoral dissertation). Dublin, Ireland: St.
Patrick‟s College.
Kennedy, E., Dunphy, E., Dwyer, B., Hayes, G. McPhillips, T., Marsh, J., O‟Connor, M., & Shiel, G. (2012).
Literacy in Early Childhood and Primary Education (3-8 years). National Council for Curriculum and
Assessment. Dublin, Ireland. .
Kirby, J., & Savage, R. (2008). Can the simple view deal with the complexities of reading?, Literacy, 42(2),
75-82. http://dx.doi.org/10.1111/j.1741-4369.2008.00487.x
Law, J., McBean, K., & Rush, R. (2011). Communication skills in a population of primary school-aged children
raised in an area of pronounced social disadvantage. International Journal of Language and
Communication Disorders, 46(6), 657-664. http://dx.doi.org/10.1111/j.1460-6984.2011.00036.x
www.redfame.com/jets Journal of Education and Training Studies Vol. 1, No. 1; 2013
219
Lonigan, C., Burgess, S., Anthony, J. L., & Barker, T. A. (1998). Development of phonological sensitivity in 2-
to 5-year-old children. Journal of Educational Psychology, 90(2), 294–311.
http://dx.doi.org/10.1037/0022-0663.90.2.294
McDonald, E. (1998). Reading Achievement and Educational Disadvantage, Irish Educational Studies, 17 (1),
208-221. http://dx.doi.org/10.1080/0332331980170119
Muter, V., Hulme, C., Snowling, M., & Taylor, S. (1998). Segmentation, not rhyming, predicts early progress in
learning to read. Journal of Experimental Child Psychology, 71, 3-27.
http://dx.doi.org/10.1006/jecp.1998.2453
Muter, V., Hulme, C., Snowling, M., & Stevenson, J. (2004). Phonemes, rimes, vocabulary, and grammatical
skills as foundations of early reading development: evidence from a longitudinal study. Developmental
Psychology, 40(5), 665-681. http://dx.doi.org/10.1037/0012-1649.40.5.665
Nag, S. (2007). Early reading in Kannada: the pace of acquisition of orthographic knowledge and phonemic
awareness. Journal of Research in Reading, 30(1), 7-22.
http://dx.doi.org/10.1111/j.1467-9817.2006.00329.x
Nagy, W. E., Anderson, R. C., & Herman, P. A. (1987). Learning word meanings from context during normal
reading. American Educational Research Journal, 24, 237-270. http://dx.doi.org/10.2307/1162893
Nation, K., & Hulme, C. (1997). Phonemic segmentation, not onset-rime segmentation, predicts early reading
and spelling skills. Reading Research Quarterly, 32, 154-167. http://dx.doi.org/10.1598/RRQ.32.2.2
Ouellette, G. (2006). What‟s meaning got to do with it; the role of vocabulary in word reading and reading
comprehension, Journal of Educational Psychology, 98(3), 554-566.
http://dx.doi.org/10.1037/0022-0663.98.3.554
Ouellette, G., & Beers, A. (2010). A not so simple view of reading: how oral vocabulary and visual-word
recognition complicate the story, Reading and Writing, 23, 189-208.
http://dx.doi.org/10.1007/s11145-008-9159-1
Pufpaff, L. (2008). A developmental continuum of phonological sensitivity skills. Psychology in the School,
46(7), 679-691. http://dx.doi.org/10.1002/pits.20407
Robbins, C., & Ehri, L. C. (1994). Listening to stories helps kindergartners learn new vocabulary words. Journal
of Educational Psychology, 86, 54-64.
Sacre, L., & Masterson, J. (2000). Single Word Spelling Test. GL Assessment
Share, D. L. (1995). Phonological recoding and self-teaching: Sine qua non of reading acquisition. Cognition, 5,
151-218. http://dx.doi.org/10.1016/0010-0277(94)00645-2
Snow, C. (2002). Reading for Understanding: Toward a Rand Program in Reading Comprehension.RAND
Corporation.
Snowling, M., & Hulme, C. (1994). The development of phonological Skills. Philosophical Transactions:
Biological Science, 346(1315), 21-27. http://dx.doi.org/10.1098/rstb.1994.0124
Snowling, M., Stothard, S., Clarke, P., Bowyer-Crane, C., Harrington, A., Truelove, E., & Hulme, C. (2009).
York Assessment of Reading for Comprehension. University of York, Centre for Reading and Language,
England.
Snowling, M. J. (1995). Phonological processing and developmental dyslexia. Journal of Research in Reading,
18, 132-138. http://dx.doi.org/10.1111/j.1467-9817.1995.tb00079.x
Stackhouse, J. (2006). Speech and spelling difficulties: what to look for. In M. Snowling and J. Stackhouse
(Eds.), Dyslexia, Speech and Language: A Practitioner's Guide (pp. 15-35). London, England: Whurr
Publishers Publishers.
Stanovich, K. E. (1993). Does reading make you smarter? Literacy and the development of verbal intelligence.
Advances in Child Development and Behaviour, 24, 133-180.
Stuart, M., Stainthorp, R., & Snowling, M. (2008). Literacy as a complex activity: deconstructing the simple
view of reading. Literacy, 42(2), 59-66. http://dx.doi.org/10.1111/j.1741-4369.2008.00490.x
Tilstra, J., McMaster, K., Van den Broek, P., Kendeou, P., & Rapp, D. (2009). Simple but complex: components
of the simple view of reading across grade levels. Journal of Research in Reading, 32(4), 383–401.
http://dx.doi.org/ 10.1111/j.1467-9817.2009.01401.x
www.redfame.com/jets Journal of Education and Training Studies Vol. 1, No. 1; 2013
220
Torgesen, J. K., Wagner, R. K., Rashotte, C. A., Burgess, S., & Hecht, S. (1997). Contributions of phonological
awareness and rapid automatic naming ability to the growth of word-reading skills in second- to fifth-grade
children. Scientific Studies of Reading, 1, 161-185. http://dx.doi.org/10.1207/s1532799xssr0102_4
Vance, M., & Mitchell, J. (2006). Short-term memory: assessment and intervention. In M. Snowling and J.
Stackhouse (Eds.), Dyslexia, Speech and Language: A Practitioner's Guide (pp. 143-166). London,
England: Whurr Publishers.
Vandervelden, M., & Siegel, L. (1995). Phonological recoding and phoneme awareness in early literacy.
Reading Research Quarterly, 30(4), 854-875. http://dx.doi.org/10.2307/748201
Wagner, R. K., Torgesen, J. K., & Rashotte, C. A. (1994). Development of reading-related phonological
processing abilities: New evidence of bidirectional causality from a latent variable longitudinal study.
Developmental Psychology, 30, 73-87. http://dx.doi.org/10.1037//0012-1649.30.1.73
Wagner, R. K., Torgesen, J. K., & Rashotte, C. A. (1999). The Comprehensive Test of Phonological Processing.
Austin, TX: Pro-Ed.
Wechsler, D. (2006). Wechsler Individual Attainment Test II UK for Teachers (WIAT–II UK-T). London,
England: Pearson Publishers.
Weir, S., Milis, L., & Ryan, C. (2002). The Breaking the Cycle scheme in urban schools: Final evaluation report.
Report to the Department of Education and Science. Dublin, Ireland: Education Research Centre
Wilson, J., & Colmar, S. (2008). Re-evaluating the significance of phoneme awareness and phonics in literacy
teaching: the shared role of school counsellors and teachers. Australian Journal of Guidance and
Counselling, 18(2), 89-105. http://dx.doi.org/10.1375/ajgc.18.2.89
This work is licensed under a Creative Commons Attribution 3.0 License.