Exploring the effects of manufacturers' influence strategies and control on category performance in...
24
Full Terms & Conditions of access and use can be found at http://www.tandfonline.com/action/journalInformation?journalCode=rirr20 Download by: [Turku University] Date: 16 November 2015, At: 22:05 The International Review of Retail, Distribution and Consumer Research ISSN: 0959-3969 (Print) 1466-4402 (Online) Journal homepage: http://www.tandfonline.com/loi/rirr20 Exploring the effects of manufacturers' influence strategies and control on category performance in the grocery goods sector Saara Hyvönen , Arto Lindblom , Rami Olkkonen & Petri Ollila To cite this article: Saara Hyvönen , Arto Lindblom , Rami Olkkonen & Petri Ollila (2010) Exploring the effects of manufacturers' influence strategies and control on category performance in the grocery goods sector, The International Review of Retail, Distribution and Consumer Research, 20:3, 311-333 To link to this article: http://dx.doi.org/10.1080/09593969.2010.491209 Published online: 23 Jun 2010. Submit your article to this journal Article views: 117 View related articles Citing articles: 2 View citing articles
Transcript of Exploring the effects of manufacturers' influence strategies and control on category performance in...

Full Terms & Conditions of access and use can be found athttp://www.tandfonline.com/action/journalInformation?journalCode=rirr20
Download by: [Turku University] Date: 16 November 2015, At: 22:05
The International Review of Retail, Distribution andConsumer Research
ISSN: 0959-3969 (Print) 1466-4402 (Online) Journal homepage: http://www.tandfonline.com/loi/rirr20
Exploring the effects of manufacturers' influencestrategies and control on category performance inthe grocery goods sector
Saara Hyvönen , Arto Lindblom , Rami Olkkonen & Petri Ollila
To cite this article: Saara Hyvönen , Arto Lindblom , Rami Olkkonen & Petri Ollila (2010)Exploring the effects of manufacturers' influence strategies and control on categoryperformance in the grocery goods sector, The International Review of Retail, Distribution andConsumer Research, 20:3, 311-333
To link to this article: http://dx.doi.org/10.1080/09593969.2010.491209
Published online: 23 Jun 2010.
Submit your article to this journal
Article views: 117
View related articles
Citing articles: 2 View citing articles

Exploring the effects of manufacturers’ influence strategies and control
on category performance in the grocery goods sector
Saara Hyvonena*, Arto Lindblomb, Rami Olkkonenc and Petri Ollilaa
aDepartment of Economics and Management, University of Helsinki, Helsinki, Finland;bHelsinki School of Economics (HSE), Helsinki, Finland; cTurku School of Economics,
Rehtorinpellonkatu, Turku
(Received May 2009; final version received April 2010)
Category management (CM) has been promoted as a joint business processbetween manufacturers and retailers to produce enhanced business results byfocusing on delivering better value to end consumers. But do the business partnersinvolved in CM really recognize which particular CM arrangements generatethese results, what possibilities do they have to influence CM collaboration, anddoes CM most benefit the more powerful channel members? To address theseissues, our aim is to explore the effects of manufacturers’ influence strategies(consumer-oriented activities, information exchange supporting category planimplementation, and incentives) and control over CM on category performance.The data consist of 206 responses to a survey of food manufacturers in Finlandand Sweden. Our findings indicate that plan implementation and control enhancemost manufacturers’ category performance, and that control is contingent on amanufacturer’s category position. Category leaders, and to a smaller extent,category supporters tend to have most influence in CM collaboration. Finnishand Swedish manufacturers also had significant differences in their influencestrategy–category performance profiles.
Keywords: category management; manufacturers’ influence and control; categoryperformance; grocery goods
Introduction
In recent years, category management (CM) has become an importantcollaborative and consumer-oriented business practice and enjoys rapidly growingacceptance and implementation among retailers and manufacturers, especially inthe grocery goods sector in Western economies. CM is defined as the supplier–retailer process of managing product categories as strategic business units andcustomizing them on a store-by-store basis to produce enhanced business results byfocusing on delivering better consumer value (AC Nielsen 2006; Dupre andGruen 2004). With its strong consumer focus, CM represents a demand sidemanagement strategy, the most important and sophisticated element of EfficientConsumer Response (ECR). CM forms a platform for channel partners to jointlydevelop marketing strategies and tactics so as to provide mutual benefits and
*Corresponding author. Email: [email protected]
The International Review of Retail, Distribution and Consumer Research
Vol. 20, No. 3, July 2010, 311–333
ISSN 0959-3969 print/ISSN 1466-4402 online
� 2010 Taylor & Francis
DOI: 10.1080/09593969.2010.491209
http://www.informaworld.com
Dow
nloa
ded
by [
Tur
ku U
nive
rsity
] at
22:
05 1
6 N
ovem
ber
2015

strengthen the competitive advantages of individual firms (Aastrup et al. 2008;Dapiran and Hogarth-Scott 2003; Holweg, Schnedlitz, and Teller 2009). The mostimportant marketing activities to achieve these goals, proposed in the previous CMliterature, are the development of assortments based on consumer needs andpreferences, optimization of promotions, and introduction of new products(Basuroy, Murali, and Walters 2001; Dewsnap and Hart 2004; Hogarth-Scottand Dapiran 1997). A product category is a distinct, manageable group ofproducts that consumers perceive to be interrelated and/or substitutable in meetingtheir needs (AC Nielsen 2006). Examples would be dairy goods, prepared foods,and pet foods. Retailers attempt to offer a balance among variety (number ofcategories), depth (number of stock-keeping-units SKUs within a category), andservice level (the number of individual items of a particular SKU). Categories aremanaged as small strategic business units within the retail store and differentiatedaccording to the characteristics of local or regional markets to increase customerloyalty (Desrochers and Nelson 2006; Dupre and Gruen 2004).
CM recognizes the interrelatedness of products in the category and focuses onimproving the performance of whole categories rather than of individual brands(Basuroy, Murali, and Walters 2001). Under CM, traditional brand-oriented retailbuyers are replaced with category managers who are responsible for integrating thepurchase and merchandising of all brands within a category where the variety, depth,and service level should be balanced. Also for manufacturers, CM implies acategory-based approach to their traditional, brand-oriented marketing activities.The key managerial challenge for retailers and manufacturers alike is to findsolutions as to what kind of brands to include in each category to increase endconsumers’ satisfaction and loyalty, instead of simply how to move the brandsefficiently from manufacturers to retailers (Gruen and Shah 2000). Hence, CM canbe characterized as a form of relational exchange where retailers and manufacturersshould replace their traditional organizational structures with relational governancestructures (Aastrup et al. 2008; Dyer and Singh 1998; Morgan and Hunt 1999).Effective governance influences the willingness of channel partners to engage invalue-creation initiatives in joint CM projects (Corsten and Kumar 2005), whichare executed according to the standardized, eight-step category plan (for detailedinformation on CM business plans, see AC Nielsen, 2006). Yet, there is nouniform practice of CM; rather, each retailer together with its suppliers developsits own unique approach, where the form of collaboration may vary from strongto weak (Dapiran and Hogarth-Scott 2003; Desrochers, Grundlach, and Foer2003).
Despite the growing interest in CM in the academic literature (for a review ofrecent studies, see Aastrup, Grant, and Bjerre 2007; Holweg, Schnedlitz, and Teller2009) and its rapid adoption in the grocery goods sector (AC Nielsen, 2006), there isstill much uncertainty about its consequences for retailers, manufacturers, andconsumers (Basuroy, Murali, and Walters 2001; Dussart 1998; Kurnia and Johnston2003). Possibly one of the most ambiguous aspects of managing CM is the role anduse of power. Channel power and its sources, influence strategies, and control havedrawn considerable attention within marketing channel research (e.g. El-Ansary andStern 1972; Frazier 1983; Gaski 1986; Gaski and Nevin 1985; Scheer and Stern1992), but a review of literature indicates surprisingly few empirical investigations onpower and its sources in the CM context (Dapiran and Hogarth-Scott 2003; Linblomand Olkkonen 2006).
312 S. Hyvonen et al.
Dow
nloa
ded
by [
Tur
ku U
nive
rsity
] at
22:
05 1
6 N
ovem
ber
2015

The performance outcomes of CM collaboration have also received scantattention in academic literature so far. Corsten and Kumar (2005) analyzed theimpact of ECR adoption and its antecedents (relationship-specific investments,cross-functional teams, and incentive systems) on suppliers’ economic performance.Gruen and Shah (2000) examined the effects of category plan implementation onretailers’ category performance and conceptualized plan implementation as retailerconfidence, supplier’ capabilities/delivered information, and plan objectivity.Researchers generally tend to agree that the balance of power in supplier–retailerrelationships has shifted over recent decades, as integrated retail chains now occupya dominant position in the European grocery goods sector. The main factors for thepower advantage of retailers are the concentration of retail structures, ownershipand control of information, and introduction of own brands (Aastrup, Grant, andBjerre 2007; Burt and Sparks 2003; Clarke et al. 2002). Besides the resultant pricepressure from large retailers, suppliers may find it increasingly difficult to affect CMdecisions and the division of benefits between partners.
To gain additional insights into the research gaps mentioned above, the presentstudy aims to increase our understanding of the role and use of power and itsconsequences in the CM context. The primary objective of the study is to explore theeffects of influence strategies and control over CM on category performance, and therole of control as a potential moderator of the influence strategy–categoryperformance relationships. We propose a conceptual classification which identifiesthe dimensions of influence strategies, and develop a preliminary scale to measurethese dimensions. Our secondary objective is to explore whether the manufacturers’profiles regarding their influence strategies, control, and category performance differbetween firms across their category positions and across the two countries in whichthey operate. The data for the present study were collected from food manufacturersoperating in Finland and Sweden. In both countries the grocery goods retailing ishighly concentrated: in Finland, two retail chains (SOK-Group and Kesko-Group)and in Sweden, three retail chains (Ahold-ICA, Coop Norden, and Axel Johansson)hold market shares of about 77% and 70%, respectively (Planet Retail Databank,2009). The remainder of the paper is organized as follows. Next the key conceptsincluded in the conceptual framework are described. The subsequent sections depictthe methodology, empirical results, conclusions and implications, and finally somedirections for further research.
Conceptual framework and hypotheses
The conceptual framework of the study shows the expected relationships between theconcepts (Figure 1). We propose the following main effects: category performance isaffected by influence strategies and control over CM. We also assume a moderatingeffect: the relationship between influence strategies and category performance isaffected by the level of control. Category position and country of operation are twocontingency variables that are assumed to differentiate the firms’ profiles with respectto their influence on CM and consequent category performance. In developing theframework, we selected constructs that were relevant in the context of the CMcollaboration and also of theoretical interest in marketing channel literature. Webegin by specifying category performance in more depth, and thereafter influencestrategies and control over CM are conceptually discussed as antecedents of categoryperformance.
The International Review of Retail, Distribution and Consumer Research 313
Dow
nloa
ded
by [
Tur
ku U
nive
rsity
] at
22:
05 1
6 N
ovem
ber
2015

Category performance
Category performance is of great interest to all channel partners in that it representsthe return on their investment in CM. As Gruen and Shah (2000) point out,manufacturers do not do CM for goodwill reasons, but because they expect it toincrease consumer loyalty and business results. Hence, performance outcome isprobably the determining factor in the manufacturer’s decisions as to what amountof relationship-specific resources to invest in CM collaboration, as well as in aretailer’s decisions on what brands to carry in a category. Retailers generallyconsider category performance from one of three perspectives: based on the retailer’scategory (growth, profitability, share relative to other stores’ category shares), fromthe consumer’s perspective (loyalty, satisfaction), or from the cost perspective(inventory, handling, turns). The underlying assumption is that effective CM willenhance category performance on one or more of these measures (Gruen and Shah2000). Corsten and Kumar (2005) assessed the economic performance of suppliers asan outcome of ECR adoption on three indicators: category growth, profits, andsales. Reports on CM successes found in trade journals also tend to focus oncategory sales growth, category gross profits, and customer satisfaction (Lassar,1998). In the present study, category performance is defined as the overall salesvolume and growth that a manufacturer perceives to generate in the category with itsretailers, and conceptualized as a two-dimensional construct comprising (1)consumer loyalty and consumer satisfaction, and (2) category share and sales.These measures reflect external effectiveness or market performance at the categorylevel, as perceived by the manufacturers.
Origins of power and influence in marketing channels
Before introducing and specifying the influence strategies used in this study, wedescribe the two major approaches of power in marketing channel literature. Powerrefers to one channel member’s ability to influence decision variables in themarketing strategy of another firm at a different level in a given channel (Coughlanet al. 2001; El-Ansary and Stern 1972; Gaski 1986). Power can be exercised invarious ways, as suggested by those who operationalize power usage as a powersource, based on French and Raven’s original typology from 1959 (El-Ansary andStern 1972; Etgar 1976; Gaski 1986; Gaski and Nevin 1985), as well as by those who
Figure 1. Conceptual framework.
314 S. Hyvonen et al.
Dow
nloa
ded
by [
Tur
ku U
nive
rsity
] at
22:
05 1
6 N
ovem
ber
2015

operationalize it as an influence strategy (Frazier 1983; Frazier and Rody 1991;Frazier and Summers 1984).
The first group of researchers classified the exercise of power into five powersources which have stood the test over time: reward, coercive, legitimate, referent,and expert power. Raven and Kruglanski (1970) added information power as a sixthsource of power to this typology. Consequently, the origins of power exercise can beviewed as one channel member’s possession of resources that are ‘stronger’ in somedecision areas compared with another channel member’s resources (extent anddomain of power), and/or or more valuable vis-a-vis another channel member’sresources that can be used to activate influence attempts. The second group ofresearchers, in turn, categorized influence strategies into information exchanges,recommendations, requests, threats, promises, and legal pleas. In contrast to powerstemming from the possession of valuable resources, influence strategies can beregarded as the means or methods of communication to catalyze power-inducedinteraction between channel members.
Nonetheless, both of the above groups of researchers agreed on a fundamentaldichotomy: the exercise of coercive and noncoercive power. Coercive power isassociated with a channel partner’s direct pressure and sanctions for noncomplianceto encourage specific behaviors, while noncoercive power refers to a channelpartner’s granting of beneficial assistance to another partner, such as referent,expertise, and information power. Noncoercive power may enhance the willingnessof a channel partner to comply with influence attempts by indirect means. It shouldbe noted that interfirm cooperation was of little value or relevance in these earlystudies, meaning that the costs of using a coercive influence approach wereinsignificant. In addition, the influence strategy and power source approachescontain overlapping dimensions and appear somewhat simplistic (Frazier and Rody1991; Mayo, Richardson, and Simpson 1998; Payan and Nevin 2006). Theclassification of promises as coercive influence is perhaps the most controversialissue (Boyle et al. 1992). The divergence of concepts and schema used across powerstudies further increases the difficulty to compare their results. Moreover, previousstudies have explored the effects of all five sources of power or influence strategiessimultaneously, whereas there are no studies focusing either on one or a few of powerbases and their effects on economic performance.
Given that power is a context-specific phenomenon, it may be based on thedifferent means of influence at the category level than at the level of overall interfirmrelationships. The latter has been the analysis level in most previous studies on powersources or influence strategies, using mainly single-item measures. While theseconcepts and their operational measures are not directly applicable to analyzecategory-level collaboration, the present study aims to identify a preliminaryclassification of alternative influence strategies adapted to the context of CMcollaboration. Earlier CM studies indicate that manufacturers and retailers tend torely on persuasive and other indirect means of influence – noncoercive power –rather than on coercion in guiding and administering joint activities and processes(Aastrup, Grant, and Bjerre 2007; Hogarth-Scott and Dapiran 1997). For example,expert or information power can be used as a substitute of coercive power incooperative relationships (Dapiran and Hogarth-Scott 2003). Thus, influencestrategies are assumed to be related to expert power, information power, referentpower, recommendations, and promises, which serve exclusively as higher-ordertheoretical concepts in this study.
The International Review of Retail, Distribution and Consumer Research 315
Dow
nloa
ded
by [
Tur
ku U
nive
rsity
] at
22:
05 1
6 N
ovem
ber
2015
Influence strategies in category management collaboration
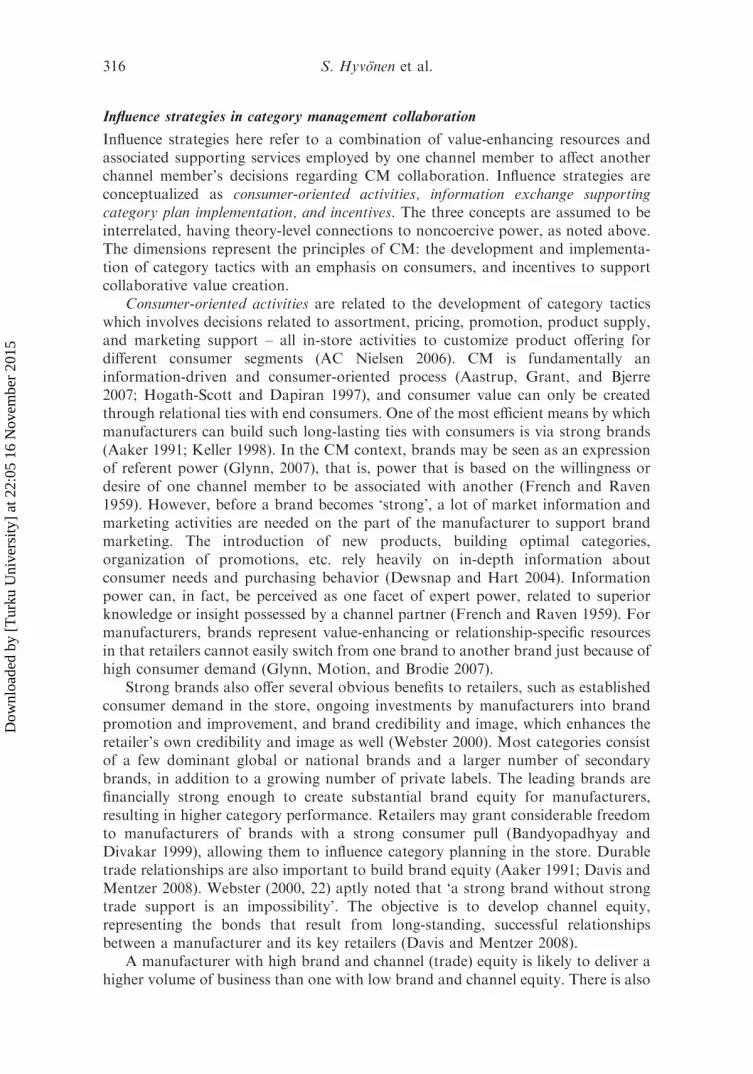
Influence strategies here refer to a combination of value-enhancing resources andassociated supporting services employed by one channel member to affect anotherchannel member’s decisions regarding CM collaboration. Influence strategies areconceptualized as consumer-oriented activities, information exchange supportingcategory plan implementation, and incentives. The three concepts are assumed to beinterrelated, having theory-level connections to noncoercive power, as noted above.The dimensions represent the principles of CM: the development and implementa-tion of category tactics with an emphasis on consumers, and incentives to supportcollaborative value creation.
Consumer-oriented activities are related to the development of category tacticswhich involves decisions related to assortment, pricing, promotion, product supply,and marketing support – all in-store activities to customize product offering fordifferent consumer segments (AC Nielsen 2006). CM is fundamentally aninformation-driven and consumer-oriented process (Aastrup, Grant, and Bjerre2007; Hogath-Scott and Dapiran 1997), and consumer value can only be createdthrough relational ties with end consumers. One of the most efficient means by whichmanufacturers can build such long-lasting ties with consumers is via strong brands(Aaker 1991; Keller 1998). In the CM context, brands may be seen as an expressionof referent power (Glynn, 2007), that is, power that is based on the willingness ordesire of one channel member to be associated with another (French and Raven1959). However, before a brand becomes ‘strong’, a lot of market information andmarketing activities are needed on the part of the manufacturer to support brandmarketing. The introduction of new products, building optimal categories,organization of promotions, etc. rely heavily on in-depth information aboutconsumer needs and purchasing behavior (Dewsnap and Hart 2004). Informationpower can, in fact, be perceived as one facet of expert power, related to superiorknowledge or insight possessed by a channel partner (French and Raven 1959). Formanufacturers, brands represent value-enhancing or relationship-specific resourcesin that retailers cannot easily switch from one brand to another brand just because ofhigh consumer demand (Glynn, Motion, and Brodie 2007).
Strong brands also offer several obvious benefits to retailers, such as establishedconsumer demand in the store, ongoing investments by manufacturers into brandpromotion and improvement, and brand credibility and image, which enhances theretailer’s own credibility and image as well (Webster 2000). Most categories consistof a few dominant global or national brands and a larger number of secondarybrands, in addition to a growing number of private labels. The leading brands arefinancially strong enough to create substantial brand equity for manufacturers,resulting in higher category performance. Retailers may grant considerable freedomto manufacturers of brands with a strong consumer pull (Bandyopadhyay andDivakar 1999), allowing them to influence category planning in the store. Durabletrade relationships are also important to build brand equity (Aaker 1991; Davis andMentzer 2008). Webster (2000, 22) aptly noted that ‘a strong brand without strongtrade support is an impossibility’. The objective is to develop channel equity,representing the bonds that result from long-standing, successful relationshipsbetween a manufacturer and its key retailers (Davis and Mentzer 2008).
A manufacturer with high brand and channel (trade) equity is likely to deliver ahigher volume of business than one with low brand and channel equity. There is also
316 S. Hyvonen et al.
Dow
nloa
ded
by [
Tur
ku U
nive
rsity
] at
22:
05 1
6 N
ovem
ber
2015

some evidence that, for a multi-brand manufacturer, CM of the entire product linemay turn in higher profits than brand management (Zenor 1994). The challenge formanufacturers, thus, is to maintain trade equity. Retail assortments requireimprovements that rely on suppliers’ activities regarding product development,promotion and (re-)positioning of their brands, and in-store services for thecategory. They can also influence customer/brand loyalty through efficient productreplenishments to avoid out-of-stocks (AC Nielsen 2006; Glynn, Motion, and Brodie2007). If a manufacturer has succeeded in developing marketing tactics thatstrengthen its brand equity and channel equity, it is justifiable to expect thatconsumer-oriented activities will have a positive effect on performance outcomes.
Information exchange supporting category plan implementation is perhaps one ofthe most important elements in CM collaboration. An unimplemented plan will notdeliver any benefits for business partners, regardless where the problem lies along thecategory planning process. Developing category plans that are purely implementedcauses relationship costs for channel partners (Dupre and Gruen 2004). Planimplementation includes defining specific tasks to be done, and those responsible foraccomplishing each task; it generally involves at least rearranging, adding, anddelisting of brands and SKUs (AC Nielsen 2006; Gruen and Shah 2000). In the caseof integrated retail chains, a category plan usually covers hundreds of stores, and sothe stakes in CM are high. Gruen and Shah (2000) found that the degree of planimplementation was strongly correlated with the level of preplanning agreement.Manufacturers and retailers should therefore make a preplanning agreementspecifying their common CM goals, category definitions and category roles, datato be utilized, measurement criteria, and the roles and responsibilities of the channelpartners in carrying out these tasks (AC Nielsen 2006). One key outcome of thispreplanning agreement is the category scorecard, which shows the performancemetrics for evaluating the success of joint programs. The scorecard helps channelpartners to ‘get and stay on the same page’ (Gruen and Shah 2000, 493).
Retailers who lack experience in CM, or do not have the performance metrics toevaluate the value/performance-enhancing effects of CM, may rely on manufac-turers’ expertise and recommendations to gain and utilize information about markettrends and future consumer needs in different segments. Expertise is related toformal or specialized knowledge about particular CM issues, while recommenda-tions, as complementary means of influence, rely on one channel member’spredictions that another channel member will be more profitable if it follows thosesuggestions about some specific action or set of actions (Frazier and Summers 1986,French and Raven 1959; Payan and Nevin 2006). On the other hand, retailers canmake use of electronic point-of-sales data (EPOS), which provide detailed and real-time information about end consumers’ daily purchases and the development ofmanufacturers’ product shares, thus counterbalancing suppliers’ expertise. In thisrespect, EPOS data show the ‘what’ of category, while manufacturers are able tosupply information on the ‘why’ – for example, consumers’ buying motives, values,and preferences – and utilize the data to project future category development(Desrochers, Grundlach, and Foer 2003). Proper CM implementation depends on anunderstanding of both the why and the how of consumer behavior.
Previous theoretical and empirical studies imply that as the amount and qualityof information exchange increases, it would support the implementation of categoryplan (Gruen and Shah 2000). The thrust of CM is that closer interaction betweenretailers and manufacturers strengthens their commitment to implement the plan.
The International Review of Retail, Distribution and Consumer Research 317
Dow
nloa
ded
by [
Tur
ku U
nive
rsity
] at
22:
05 1
6 N
ovem
ber
2015

Gruen and Shah’s (2000) study on retailers showed that plan implementation waspositively related to performance outcomes. Additional findings imply that CMyielded higher prices and profitability for retailers than brand management(Basuroy, Murali, and Walters 2001), and that suppliers perceived the properimplementation of category plans to have a favorable effect on category performance(Dhar, Hoch, and Kumar 2001). In the light of this empirical evidence, although veryscarce, we propose that manufacturers are able to influence on the level planimplementation by developing information systems and measurement tools tosupport joint CM arrangements. Successful plan implementation requires that theresponsibilities and working roles between the partners are clearly defined.
Finally, incentives in this study refer to the functional support that amanufacturer makes available for retailers to motivate them to assist its brandmarketing tactics at the store level. As an influence strategy, these incentives mayinclude ‘positive sanctions’ in terms of promises. A manufacturer may, for example,promise that its support would result in relative benefits for the retailer in the form oflower prices and discounts, various types of promotional allowances, marketingsupport, or other tailored reward systems (cf. Frazier and Rody 1991). Previousresearch demonstrates that retailers can indeed be motivated by a manufacturer’swillingness and ability to provide marketing support for them (Corsten and Kumar2005; Gaski and Nevin 1985; Lassar 1998). A strong assistance program promotedby a manufacturer is likely to reduce retailers’ problems in carrying and selling themanufacturer’s brands, thereby increasing the retailer’s willingness to develop theCM business process and allow the manufacturer to influence it through this kind ofsupport. Parallel with some earlier findings concerning the performance outcomes ofthe above influence strategies, we hypothesize that:
H1: Customer-oriented activities (H1a), information exchange supportingcategory plan implementation (H1b), and incentives (H1c) are positivelyrelated to manufacturer category performance.
Control over category management
Control is defined here as the extent of a manufacturer’s influence over retailers’ in-store activities with regard to CM arrangements. We settle on this narrow,operational-level definition because in-store activities are the final point throughwhich channel members can influence the end consumer’s perceived value of a retailoffering. In earlier studies, channel control has usually been viewed as an outcome ofpower sources or influence strategies (Etgar 1976; Frazier and Summers 1986; Gaskiand Nevin 1985; Hunt and Nevin 1974). In this study, however, channel control isanalyzed as a moderator in influence strategy–category performance relationships,including its direct impact on category performance.
Traditionally, interdependent channel members have been assumed to guardtheir independence (e.g., Anand and Stern 1985; Etgar 1976; Gaski and Nevin 1985),and similar observations can be found in the literature on CM. Dupre and Gruen(2004) found that there was a gap between the CM capabilities of suppliers andretailers, noting that many retailers were not open to CM. Corsten and Kumar(2005) provided evidence that retailers’ trust in their suppliers’ capabilities tended toincrease ECR adoption, which benefited manufacturers but led to greater feelings ofinequity in the relationship on the part of suppliers. Suppliers that had made
318 S. Hyvonen et al.
Dow
nloa
ded
by [
Tur
ku U
nive
rsity
] at
22:
05 1
6 N
ovem
ber
2015
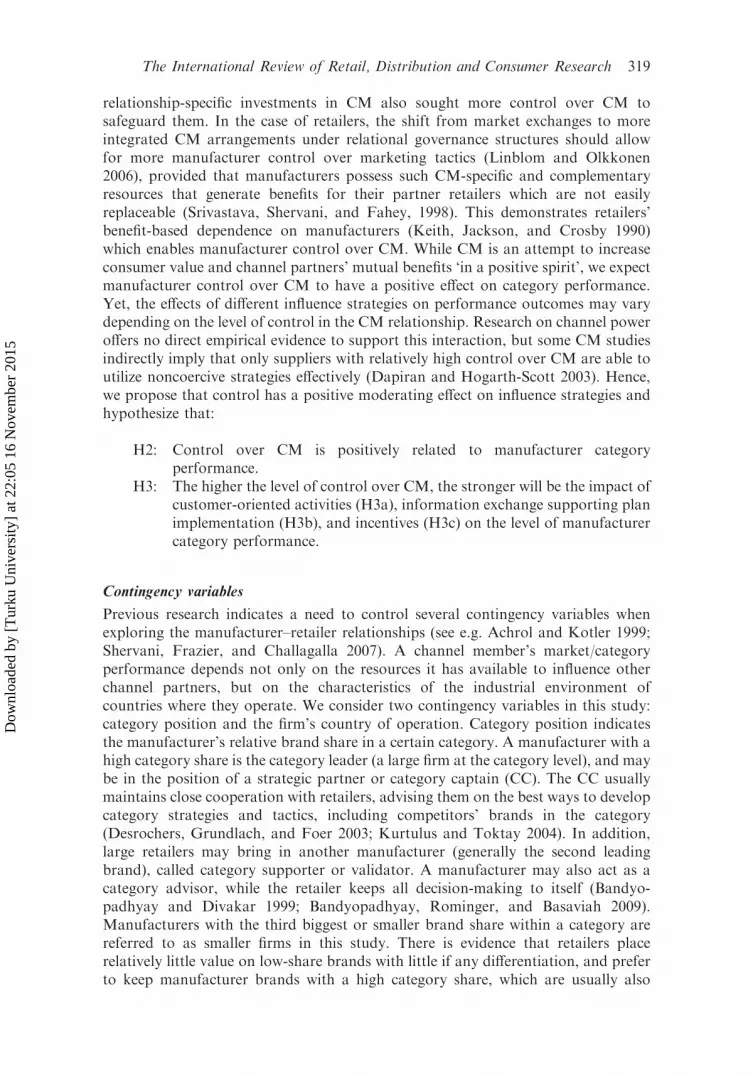
relationship-specific investments in CM also sought more control over CM tosafeguard them. In the case of retailers, the shift from market exchanges to moreintegrated CM arrangements under relational governance structures should allowfor more manufacturer control over marketing tactics (Linblom and Olkkonen2006), provided that manufacturers possess such CM-specific and complementaryresources that generate benefits for their partner retailers which are not easilyreplaceable (Srivastava, Shervani, and Fahey, 1998). This demonstrates retailers’benefit-based dependence on manufacturers (Keith, Jackson, and Crosby 1990)which enables manufacturer control over CM. While CM is an attempt to increaseconsumer value and channel partners’ mutual benefits ‘in a positive spirit’, we expectmanufacturer control over CM to have a positive effect on category performance.Yet, the effects of different influence strategies on performance outcomes may varydepending on the level of control in the CM relationship. Research on channel poweroffers no direct empirical evidence to support this interaction, but some CM studiesindirectly imply that only suppliers with relatively high control over CM are able toutilize noncoercive strategies effectively (Dapiran and Hogarth-Scott 2003). Hence,we propose that control has a positive moderating effect on influence strategies andhypothesize that:
H2: Control over CM is positively related to manufacturer categoryperformance.
H3: The higher the level of control over CM, the stronger will be the impact ofcustomer-oriented activities (H3a), information exchange supporting planimplementation (H3b), and incentives (H3c) on the level of manufacturercategory performance.
Contingency variables
Previous research indicates a need to control several contingency variables whenexploring the manufacturer–retailer relationships (see e.g. Achrol and Kotler 1999;Shervani, Frazier, and Challagalla 2007). A channel member’s market/categoryperformance depends not only on the resources it has available to influence otherchannel partners, but on the characteristics of the industrial environment ofcountries where they operate. We consider two contingency variables in this study:category position and the firm’s country of operation. Category position indicatesthe manufacturer’s relative brand share in a certain category. A manufacturer with ahigh category share is the category leader (a large firm at the category level), and maybe in the position of a strategic partner or category captain (CC). The CC usuallymaintains close cooperation with retailers, advising them on the best ways to developcategory strategies and tactics, including competitors’ brands in the category(Desrochers, Grundlach, and Foer 2003; Kurtulus and Toktay 2004). In addition,large retailers may bring in another manufacturer (generally the second leadingbrand), called category supporter or validator. A manufacturer may also act as acategory advisor, while the retailer keeps all decision-making to itself (Bandyo-padhyay and Divakar 1999; Bandyopadhyay, Rominger, and Basaviah 2009).Manufacturers with the third biggest or smaller brand share within a category arereferred to as smaller firms in this study. There is evidence that retailers placerelatively little value on low-share brands with little if any differentiation, and preferto keep manufacturer brands with a high category share, which are usually also
The International Review of Retail, Distribution and Consumer Research 319
Dow
nloa
ded
by [
Tur
ku U
nive
rsity
] at
22:
05 1
6 N
ovem
ber
2015

profitable (Desrochers, Grundlach, and Foer 2003: Shervani, Frazier, andChallagalla 2007). Leading brands are easier for retailers to market and sell becauseof established consumer demand, as noted earlier. Accordingly, we expectmanufacturers’ category positions to depend on their category shares, and theirinfluence strategies and control to differ across their category positions.
CM collaboration may have a context-specific profile, which is shaped by thecharacteristics of the industrial (micro/macro) environment, including, for example,regulatory, economic, competitive, societal, and cultural factors. The industrialenvironment in Finland and Sweden is relatively similar with regard to regulatory,societal (e.g., socio-demographic factors), economic, and competitive conditions.The competitive environment in the grocery goods sector is a case in point: the retailstructure in both countries is highly concentrated, and retailer operations areintegrated under centrally coordinated units. In Finland only two and in Swedenthree retail chains control approximately 77% and 70% of the grocery goodsmarket, respectively. Because it was not possible to analyze environmental factorswithin the limits of the present study, we use the country of operation as a proxy forchannel environment, indicating primarily norms or codes of conduct that are deeplyrooted in the national business cultures, which may vary widely across countries(Song et al. 2005). Norms have been proved to be important elements that guidechannel members’ behavior (Heide and John 1992). Possible differences in thecontrol and influence patterns across different countries of operation may give someviews on the codes of conduct (norms) characterizing the invisible rules of ‘thebusiness game’ in the grocery goods sector.
Methodology
To test the hypotheses of this study, we conducted a survey among foodmanufacturers in Finland and Sweden. Both samples covered small, medium-sized,and large firms. The sampling frame was supplied by ECR Finland and theAssociation of Grocery Manufacturers of Sweden, as almost all of foodmanufacturers are members of these organizations. After a careful inspection ofthe company characteristics and the number of product lines, using the internet as amajor source, we selected a total of 231 companies for the study. Given the nature ofCM – the management of product categories as distinct business units – it wasappropriate to analyze the supplier–retailer relationship at the category level ratherthan at the level of overall interfirm relationships. Consequently, one manager wasidentified, by internet or by phone, as responsible for each product category in agiven firm, and the number respondents per firm was determined by the number ofcategories they represented. Thus, a large manufacturer (in terms of sales turnover)could be a market leader or second largest in some categories and simultaneouslysmall in others. Similarly, a smaller firm (in terms of sales turnover) could be amarket leader in one category. In the case of large and medium-sized companies, thequestionnaire was sent to several product/marketing managers, in smaller companiesto marketing managers. The questionnaire was first developed in Finnish, and theitem pools were pre-tested among six board members of ECR Finland. The finalquestionnaire was then translated into Swedish. A personalized instruction letterwith return envelope was sent along with the final questionnaire.
The Finnish sample comprised 470 managers in 90 food manufacturing firms. Atotal of 90 usable responses were received, the response rate being 19%. The Swedish
320 S. Hyvonen et al.
Dow
nloa
ded
by [
Tur
ku U
nive
rsity
] at
22:
05 1
6 N
ovem
ber
2015

sample consisted of 705 managers in 141 food manufacturing firms; 116 usablequestionnaires were returned, corresponding to a response rate of 16%. Thus, thefinal data comprise 206 responses. Given the respondents’ expertise and their statusas key informants with regard to product categories (Phillips 1981), the response ratewas deemed satisfactory for our exploratory study. Finally, there were nostatistically significant differences in means (t-tests at the. 05 level) between earlyand late respondents on the scales studied (on non-response bias, see Armstrong andOverton 1977; Hudson et al. 2004). Of the Finnish respondents, 52% representedcategory leaders, 24% second largest companies, and 24% third largest or smallerfirms in terms of category share. Among the Swedish respondents, 54% werecategory leaders, 26% second largest, and 20% third largest or smaller with regardto their category share.
Most of the measurement scales were developed specifically for this study.Following Churchill’s (1979) approach, the multi-item scales were developed basedon a thorough review of the previous literature on channel relationships. We alsoused trade journals and interviews with managers in defining the CM domain. Toour knowledge, there are no previous measures of influence strategies and controldesigned for the CM context. The final scale comprises 15 influence strategy items,measured on a five-point agreement-disagreement scale (1 ¼ strongly disagree,5 ¼ strongly agree) and hypothesized as three separate factors. The influencestrategy items used in this study are outlined in Table 1. Control over CM wasoperationalized as the extent to which a manufacturer could influence the retailers’decisions concerning in-store activities in its category. Control was measured on afive-point Likert-type scale ranging from 1 ¼ extremely weak to 5 ¼ extremelystrong, and consisting of four variables: (1) the retailer’s decisions on categorymanagement in the store; (2) category roles; (3) in-store category tactics, that is,assortment, pricing, allocation of shelf space, and campaigns; and (4) overall depthof category, that is, number of SKUs in the category. The questionnaire includedfour category performance items adopted from previous CM studies (Corsten andKumar 2005; Gruen and Shah 2000): (1) customer loyalty; (2) customer satisfaction;(3) sales volume; and (4) the category share of the brand/product, on a scale from1 ¼ decreases significantly to 5 ¼ increases significantly. Category position con-sisted of three-point measure: category leader, second largest, and third largest orsmaller firm in the category.
Results
Before submitting the data for the main analyses, we conducted basic psychometrictests to provide evidence of the internal validity and reliability of the multi-itemscales. Our purpose here was to develop and refine the scales for influence strategies,control over CM, and manufacturer category performance. We developed thesescales following the paradigm endorsed by Churchill (1979). Exploratory factoranalysis (EFA) was used as an initial item-purification procedure to ensure theinternal consistency of the scales. The EFA for influence strategies, using the Kaisercriterion for factor extraction and Varimax rotation for factor interpretation,resulted in three distinct factors as expected, accounting for 61.4% of the variance inthe original items (Table 1). The factors were labeled: consumer-oriented activities,information exchange supporting category plan implementation, and incentives.Cronbach’s alphas computed for each scale were .81, .87, and .81, respectively. The
The International Review of Retail, Distribution and Consumer Research 321
Dow
nloa
ded
by [
Tur
ku U
nive
rsity
] at
22:
05 1
6 N
ovem
ber
2015

alpha coefficients for influence strategies were high, exceeding the conventional levelrecommended by several scholars (e.g. Churchill 1979; Hair et al. 1995). Similarly,we deployed reliability analyses for control over CM and category performance.Cronbach’s alphas for the scales were .82 and .79, respectively. Table 2 gives asummary of the correlations, descriptive statistics, and reliability of the five scalesdeployed in this study.
Table 1. Exploratory factor analysis (EFA): influence strategy items.
‘Our company can influence retailers’category management decisionsthrough:’
Rotated factor loadings
Factor 1Consumer-orientedactivities
Factor 2Informationexchangesupportingcategoryplan
implementationFactor 3Incentives
Providing strong and differentiatedbrands
.763
Developing innovative products .756Active use of advertising directedtoward consumers (pull strategy)
.718
Providing wide assortment to retailers .669Arranging product replenishmentsefficiently
.604
Adjusting the production capacityflexibly to consumer demand toavoid out-of-stocks
.596
Working closely with retailers todevelop and implement the categorymanagement process
.859
Developing measurement tools forassessment of category managementsuccess
.844
Developing information systems andsoftware that support category planimplementation
.835
Defining clear working roles andresponsibilities with retailers topromote category planimplementation
.715
Providing superior discounts to ourretailers
.843
Providing tailored rewarding andincentive systems to our retailers
.712
Providing marketing support to ourretailers
.759
Offering retailers lower prices than ourcompetitors
.747
Allowing flexible terms of payment toour retailers
.736
Percentage of variance extracted 32.2 19.3 9.9V.A.F for by three-factorsolution ¼ 61.4%
322 S. Hyvonen et al.
Dow
nloa
ded
by [
Tur
ku U
nive
rsity
] at
22:
05 1
6 N
ovem
ber
2015

Tests of hypotheses
We used hierarchical moderated regression analysis (HMRA) to analyze the effects ofinfluence strategies and control over CM on category performance. HMRA isdesigned to investigate main and moderator effects separately (Cohen and Cohen1983). As interaction terms are not included in the main effect equation, nomulticollinearity is introduced (assuming that the general rules for assessingmulticollinearity among independent variables are followed), and so the main effectsof the predictors and potential moderators can thus be determined (for an in-depthdiscussion see, for example, Sharma, Duran, and Gur-Arie 1981). The moderatoreffects are then assessed in the moderated regression equation by inspecting theunstandardized regression coefficients, t-statistics, and changes in the coefficient ofdetermination (R2), while the main effects are not investigated. Therefore, ahierarchical approach should be taken when investigating moderator effects with orwithout variable transformation (Baron and Kenny 1986; Cohen and Cohen 1983).Table 3 shows the main effects (ME) as well as the moderating effects (MOE) of thepredictors and moderators on the criterion variable of category performance.
The main effects regression analysis (ME) indicated that information exchangesupporting plan implementation (b2¼ 0.31; p 5 .001) and manufacturer controlover CM (b4¼ 0.31; p 5 .001) are highly significant predictors of manufacturercategory performance. Both had a direct positive effect on category performance,thus providing support for Hypotheses H1b and H2. Neither consumer-orientedinfluence strategies nor incentives had a direct significant effect on manufacturercategory performance, but both signs were positive, as predicted. Thus, HypothesesH1a and H1c were not supported. In the light of our findings, it seems that planimplementation and manufacturer control over in-store category activities are themost important means by which manufacturers can influence retailer CM decisions.Hence, working closely with retailers, developing performance metrics for the brandsin the category, and agreeing on the responsibilities of the CM partners enablesmanufacturers to widen their scope of influence in in-store activities. Manufacturersmay possess the kind of expertise and knowledge of markets and competitors thatmakes it possible for them to ‘sell’ the category plan to retailers. Furthermore, thosemanufacturers who perceived themselves to have higher levels of control over in-store CM activities, had also higher category performance. Such in-store CM
Table 2. Intercorrelations and descriptives of measures.
Scale (1) (2) (3) (4) (5)
1. Consumer-oriented CM activities 1.002. Information exchange supporting
category plan implementation0.53* 1.00
3. Incentives 70.10 70.23* 1.004. Control over CM 0.37* 0.41* 70.10 1.005. Category performance 0.37* 0.44* 70.05 0.44* 1.00
Scale mean 3.69 3.51 2.54 2.98 3.75Standard deviation .68 .91 .83 .87 .70No. of items 6 4 5 4 4
Cronbach’s alpha 0.81 0.87 0.81 .82 .79
Notes: *p 5 .01.
The International Review of Retail, Distribution and Consumer Research 323
Dow
nloa
ded
by [
Tur
ku U
nive
rsity
] at
22:
05 1
6 N
ovem
ber
2015

Table
3.
Regressionmodels:main
effects
(ME)andmoderatedeff
ects
(MOE).
Predictors
Criterion:manufacturercategory
perform
ance
Model
1(M
E)
unstandardized
bcoeffi
cient
t–value
Model
2(M
OE)
unstandardized
bcoeffi
cient
t-value
Consumer-orientedactivities(X1)
0.13
1.82(*)
0.16**
2.24**
Inform
ationexchangesupporting
category
planim
plementation(X2)
0.31***
4.72***
0.04
0.42
Incentives
(X3)
0.04
0.83
0.05
0.86
Manufacturercontrolover
CM
(X4)
0.31***
4.74***
0.07
0.55
Interactionterm
(X1X4)
70.06
70.36
Interactionterm
(X2X4)
0.43***
6.12***
Interactionterm
(X3X4)
0.05
0.79
Model
fit
Adjusted
R2¼
27.6%
F¼
38.11***
Adjusted
R2¼
27.0%
F¼
38.32***
Multiple
R¼
52.5%
Multiple
R¼
52.6%
Notes:***p5
.001,**p5
.01,*p5
.10.
324 S. Hyvonen et al.
Dow
nloa
ded
by [
Tur
ku U
nive
rsity
] at
22:
05 1
6 N
ovem
ber
2015
activities cover category roles, overall depth of assortment, allocation of shelf space,pricing, and campaigns. However, as a manufacturers’ influence strategy, consumer-oriented activities only had a marginal direct impact on category performance, beingsignificant at p 5 .10 but not at the p 5 .05 criterion we applied.
The results of the moderated multiple regression analysis (MOE) show asignificant interaction between control over CM (X4) and information exchangesupporting category plan implementation (w2) for manufacturer category perfor-mance (b ¼ 0.43; p 5 .001). Hypothesis H3b is thus supported. The positiveinteraction coefficient indicates that, as control over CM increases, the effect of planimplementation on category performance also increases. A significant multiplicativeinteraction coefficient indicates the presence of a moderator effect, and a significantinteraction term identifies either a quasi or a pure moderator effect. This means thata pure moderator is neither related to the criterion nor predictor variables, butinteracts with the predictor variable modifying the form of the relationship. A quasimoderator not only interacts with the predictor variable, but is also a predictor initself (Sharma, Duran, and Gur-Arie 1981). More precisely, manufacturer controlacts as a quasi moderator in this respect because it also has a significant direct effecton category performance. The results show that control did not moderate the effectsof consumer-oriented activities and incentives on category performance; hence,Hypotheses H3a and H3c were not supported. Instead, when MOE were analyzedsimultaneously with direct effects, consumer-oriented activities had a positive effecton manufacturer category performance (b ¼ 0.16; p 5 .01).
Multicollinearity may cause problems when both the individual and theinteraction terms are included in a regression equation (Hair et al., 1995). Thus,the variation inflation factor (VIF) was calculated for each of the predictors and themoderator variable in the equation. The VIF of all the predictors (4.4 or lower) wasbelow the threshold of 10 (Hair et al., 1995), indicating that multicollinearity was nota problem. Moreover, as unstandardized coefficients were used to investigate themoderator effects, any multicollinearity introduced by the interaction terms was notproblematic (Sharma, Duran, and Gur-Arie 1981). Since multicollinearity reducesthe likelihood of obtaining significant interaction terms, the analyses producedconservative tests. In order to test the stability of the results, we randomly split thesample and performed same analyses on each half. The results showed that the samemoderator effect was upheld (H3b: b ¼ 0.46; p 5 .001).
Profiles of influence patterns
To gain further insight into possible differences in CM arrangements, we conducteda K-Means cluster analysis to assess the different influence patterns and theirperformance outcomes. The firms were classified into clusters based on consumer-oriented activities, information exchange supporting category plan implementation,incentives, control over CM, and manufacturer category performance. While there isno optimal procedure for determining the appropriate number of clusters (Everitt1980; Punj and Stewart 1983), one criterion for defining it in survey-based data couldbe between n/30 and n/50 (n is the number of observations)(e.g., Ketchen andShook 1996; Lassar 1998). This heuristic indicates a viable solution of four to sixclusters for our sample. We chose the four-cluster solution because it provided thebest trade-off between parsimony and detail. The four clusters were then cross-tabulated by category position and country of origin. Table 4 shows the number of
The International Review of Retail, Distribution and Consumer Research 325
Dow
nloa
ded
by [
Tur
ku U
nive
rsity
] at
22:
05 1
6 N
ovem
ber
2015

Table
4.
Manufacturers’influence
profilesforfour-cluster
solutionbycategory
positionandcountryofoperation.
Cluster
1Category
leaders
withCM
controland
perform
ance
advantages
Cluster
2Category
supporters
withem
phasis
onincentives
Cluster
3Reactors
with
limited
CM
control
Cluster
4Focuseddefenders
withperform
ance
advantages
Consumer-orientedCM
activities
4.08(high)
3.56(low)
2.88(low)
3.77(high)
Inform
ationexchangesupporting
category
planim
plementation
4.17(high)
2.80(low)
2.49(low)
3.80(high)
Incentives
2.26(low)
3.05(high)
2.39(low)
3.87(high)
Manufacturercontrolover
CM
3.47(high)
3.10(high)
1.72(low)
2.37(low)
Category
perform
ance
4.08(high)
3.62(low)
2.89(low)
3.88(high)
Finland(N¼
90)
60.0%
13.3%
15.6%
11.1%
Sweden
(N¼
113)
38.9%
37.2%
14.2%
9.7%
Category
leader
(N¼
111)
61.1%
24.1%
7.4%
7.4%
Category
supporter,thesecond
largestin
thecategory
(N¼
51)
46.0%
34.0%
10.0%
10.0%
Smaller
firm
s,thethirdlargestin
thecategory
(N¼
45)
20.5%
25.0%
38.6%
15.9%
N¼
98
48.3%
N¼
54
26.6%
N¼
30
14.8%
N¼
21
10.3%
326 S. Hyvonen et al.
Dow
nloa
ded
by [
Tur
ku U
nive
rsity
] at
22:
05 1
6 N
ovem
ber
2015

firms in each cluster, and the cluster means of the variables compared with thesample means (high vs. low).
Cluster 1 (48.3% of the sample) consists of manufacturers who emphasizedcustomer orientation based on factors like strong brands, consumer-directedadvertising, and innovative products. These firms provided information andexpertise to retail partners concerning plan implementation, and had the highestlevels of control over CM and category performance as compared to the othergroups. Cross-tabulations by category position showed that over half of categoryleaders belonged to this group, of which about 60% operated in Finland and almost40% in Sweden. We labeled the cluster ‘category leaders with CM control andperformance advantages’. Cluster 2 (26.6% of the sample) consists of manufacturerswith medium levels of control over CM. They mainly used incentives to influenceCM, but their category performance was lower vis-a-vis sample mean. One third ofcategory supporters and 25% of smaller firms belonged to this group. The influence-control profile is more typical of Swedish firms than of Finnish firms. We labeled thecluster ‘category supporters with emphasis on incentives’.
Cluster 3 (14.8% of the sample) comprised firms without any significant influenceon CM collaboration as compared to the other groups. Almost 40% of these firmswere smaller manufacturers who could be characterized as ‘low-performing reactorswith limited CM control’. This group resembles the reactor firms in Miles’ andSnow’s (1978) strategy typology, denoting firms with a relatively risky position intheir markets. Finally, cluster 4 is the smallest group, consisting of 10.3% of thefirms in the sample. Their influence strategies were based on a combination ofconsumer-oriented activities, commitment to category plan implementation, andincentives. These firms were high-performers but had relatively low control over CM.Most of them were smaller firms (third largest or smaller in the category), withcategory supporters as the next largest group. We named this cluster ‘focuseddefenders with performance advantages’. Defenders are firms that attempt tomaintain a narrow market segment by providing superior/differentiated products (cf.Miles and Snow 1978).
As expected, there were significant differences in all the criteria among the fourclusters (p 5 .001). Although this post hoc analysis suffers from typical limitationsof cluster analysis (for limitations of cluster analysis in marketing research, see Punjand Stewart, 1983), it nevertheless provides valuable insights into the differences ininfluence strategy–category performance profiles across the two contingencyvariables.
Conclusions and implications
Although practitioners in trade press emphasize the potential significance of CM as adriver of consumer value to increase business performance based on win–winpartnerships, academic empirical research on its consequences for suppliers andretailers is still scarce (Corsten and Kumar 2005; Dupre and Gruen 2004; Gruen andShah 2000; Hogarth-Scott and Dapiran 1997). Thus, the overall aim of this studywas to explore the interplay between influence strategies, control over CM, andcategory performance, based on survey data collected from food manufacturers inFinland and in Sweden. Our study complements previous literature on interfirmpower and influence by conceptualizing the dimensions of influence strategies in theCM context (e.g. Frazier and Rody 1991; Gaski 1986; Hogarth-Scott and Dapiran
The International Review of Retail, Distribution and Consumer Research 327
Dow
nloa
ded
by [
Tur
ku U
nive
rsity
] at
22:
05 1
6 N
ovem
ber
2015

1997; Payan and Nevin 2006), and testing their hypothesized effects on manufacturercategory performance.
We found that manufacturers’ information which supports category planimplementation as an influence strategy, and their control over in-store activitieshad the strongest direct impact on category performance. Manufacturers are able towiden their array of influence in CM collaboration by providing expertise andrecommendations based on detailed information, for example, about market trendsand consumer segments, and developing performance metrics for categories toenhance the business performance of partner firms. Proper plan development andimplementation decreases stocks-outs, which are known to decrease end consumers’loyalty both to the brand and the store. Our findings are consistent with Gruen’s andShah’s (2000) study of retailers, where plan implementation was positively related tocategory performance. In our study, the effect of plan implementation on categoryperformance was even stronger at higher levels of control; the moderated effect ofcontrol on plan implementation–category performance relationship was substantial(0.43) compared with its direct effect (0.31). Parallel findings on the role of powerhave been reported in qualitative CM studies (Hogarth-Scott and Dapiran 1997).Our results reveal that manufacturers who are category leaders would have the bestpossibilities to influence plan implementation (cf. Desrochers, Grundlach, and Foer2003; Shervani, Frazier, and Challagalla 2007).
Consumer-oriented activities as a manufacturer’s influence strategy only had amarginal direct impact on category performance. In contrast, the analysis of MOEshowed that consumer-oriented activities (without the interactive effect) had apositive effect on category performance. The moderated impact was stronger (0.16)than its direct effect (0.13) in the main effect (ME) model. One explanation might bethat control is primarily associated with plan implementation, the cornerstone inCM, and partly depends on a manufacturer’s category position, as noted above.Hence, while plan implementation seems to be the top concern for those in theposition of category leaders, consumer-orientated activities may be more efficientinfluence strategies for category supporters and smaller manufacturers who havedeveloped differentiated brands for specific consumer segments; strong brandsdemonstrate referent power. We must leave the ultimate resolution to furtherresearch.
Furthermore, incentives as a manufacturer’s influence strategy had neither adirect nor a moderated effect from control over CM on category performance. Acomplementary analysis of influence profiles revealed that category supporters andsmaller manufacturers placed significantly more emphasis on incentives as aninfluence strategy than did category leaders. One reason might be that, in closercollaboration between category leaders and retailers, incentives are in-built elements;the benefits and costs may have been specified in advance in their preplanningagreement. Future studies might explore the domain and role of incentives morethoroughly in the CM context.
It should be noted that our study was designed to focus only on the ‘positive’ sideof power and influence. The choice was based on earlier studies on power in CM,which show that, in information-rich CM collaboration, noncoercive power – forexample, referent, expert, or information power, promises, and recommendations –can be used effectively as a substitute for coercive power. The following quotation inDapiran and Hogarth-Scott’s (2003) qualitative study is illustrative of this (p. 264): ‘Idon’t know whether I’d really call it power as much as working together (Australian
328 S. Hyvonen et al.
Dow
nloa
ded
by [
Tur
ku U
nive
rsity
] at
22:
05 1
6 N
ovem
ber
2015

supplier)’. Yet, additional empirical research is needed on the types, use, and levels ofpower/control in CM relationships.
A manufacturer’s category position seems to be one of the most importantdeterminants of influence, control, and category performance in current CMarrangements. About 60% of manufacturers with the highest levels of control overCM and highest performance advantages in this study were leaders in theircategories (category captains). On the other hand, almost half of category supporters(second largest in the category) had similar influence and performance profiles. Thesmallest, although interesting, group of firms consisted of ‘focused defenders withperformance advantages’ (cf. Miles and Snow, 1978), who were able to influenceretailers’ decisions by relying on a whole array of influence strategies, but who stillseemed to have little control over CM. These were primarily smaller firms andcategory supporters. In general, about 40% of small companies (third largest orsmaller in the categories) were poor-performing and had very little to say in CM,resembling Miles and Snow’s (1978) reactors. It appears that Finnish retailers tend tobuild their CM activities on category captain-driven arrangements, wherebycategory leaders are likely to take significant responsibility for formal CMdecision-making (Desrochers, Grundlach, and Foer, 2003). Swedish retailers, incontrast, are more likely to conduct CM cooperatively with several manufacturers.While the general industrial environment, including retail concentration, is verysimilar in both countries, the differences may be explained by differences in thenorms or codes of conduct that govern business relationships in Finland and Sweden(cf. Heide and John 1992). The role of norms merits further attention in forthcomingstudies on ECR/CM relationship.
Relationships between powerful retailers and powerful – albeit less powerful –manufacturers, are generally long term (Kumar, 2005). Hence, most manufacturersmust continue to do business with the retailers if there are only a few alternativemarketing channels available to them, as when the retailing structure is highlyconcentrated (Shervani, Frazier, and Challagalla, 2007). The inherent benefits andcosts of CM for manufacturers depend on the extent to which it is adopted and theway it is implemented at the retail level. CM can, for example, decrease competition,and in the extreme case, category captains can control outcomes in particularcategories, get preferential treatment, and exclude competitors from having anyinput. They may also try to reduce the number of suppliers/brands by blockingaccess to shelves (Desrochers, Grundlach, and Foer 2003). Thus, arrangements withlimited CC power are assumed to offer optimal CM in terms of higher levels ofinterbrand competition (Bandyopadhyay, Rominger, and Basaviah 2009), whichwould benefit all parties – manufacturers, retailers, and consumers (Desrochers,Grundlach, and Foer 2003; Kurtulus and Toktay 2004).
Due to limited shelf space, retailers usually give the best shelf positions to leadingbrands and to secondary brands and/or private labels. In the long term, it can berisky for retailers to be dependent on only a few key suppliers. This may decreaseinterbrand competition, and retailers/retail chains tend to imitate each other on bothstrategic and operational issues, even though strategies that are easily copied canrarely achieve sustainable competitive advantage (e.g. Miles and Snow 1978;Porter 1985). Satisfying only average-consumer needs leads to price competition – ashort-run strategy – which leaves little room for assortment renewal anddifferentiation between competing retail chains. In the long term, it is importantfor retailers to combine the expertise of several manufacturers in order to satisfy
The International Review of Retail, Distribution and Consumer Research 329
Dow
nloa
ded
by [
Tur
ku U
nive
rsity
] at
22:
05 1
6 N
ovem
ber
2015

differing consumer needs and preferences (Bandyopadhyay, Rominger, andBasaviah 2009; Desrochers, Grundlach, and Foer 2003). For example, local foodsourcing, which has risen in prominence over the last decade at the consumer andpolicy levels, may create opportunities for grocery retailers to use smallermanufacturers in a proactive manner to increase differentiation. Notwithstandingthe promoted CM approach, there is some cynicism among manufacturers aboutdeeper relationships with large and powerful retailers. This has led some observers tonote that, in practice, ‘the days of power play between manufacturers and retailersare far from over’ (Corsten and Kumar 2005, 91).
Limitations and directions for future research
This inquiry must, of course, be considered within its limitations, which point out theway toward potentially fruitful avenues for further research. First, our exploratorystudy approached power and influence in CM collaboration from the perspective ofmanufacturers in two Nordic countries, which raises the question of generalizabilitywith respect to retailers and other countries. A logical extension of this study wouldbe to test the framework from the retailer perspective or in manufacturer–retailerdyads, and in other national environments. Second, we took utmost care to definethe perceptual concepts used in this study and to propose scales to measure them inthe CM context. Nonetheless, these scales require subsequent replication andrefinement. A third limitation is the study’s cross-sectional snapshot of the CMrelationship at one point of time. The causal ordering of relationships betweenconcepts cannot effectively be confirmed through a research design that relies onassociation. This calls for a longitudinal examination of CM relationships over time,in conjunction with confirmatory techniques and structural equations models tovalidate the results.
The findings of this study provide a basis for further explorations to strengthenCM. A deeper understanding of the contingent effects of category position on powerin CM, for instance, is critical. Our sense and the implications of our results indicatethat category leaders can gain substantially more benefits from CM than smallermanufacturers. The established infrastructures of category leaders and their builtrelationships with large retailers leave little room for smaller firms. Retailers’ localsourcing from smaller manufacturers would be one interesting research area: howdoes local sourcing fit in with the competitive strategies of large retailers/retail chainsthat have developed sophisticated purchasing systems and performance metrics tocontrol the sales and profitability of individual brands based on real-time EPOSdata? Although supply chain efficiencies enhance business performance once theyhave been made, they should be complemented with demand chain managementactivities such as bringing improvements in product categories and introducing newproducts. Local sourcing would be an option for retailers to develop differentiatedstrategies to increase consumer value in specific segments, provided that consumerorientation becomes a real option in CM. This is an area of study suited toqualitative research.
Additionally, the share of private labels has grown very rapidly both in Swedenand especially in Finland; in some EU-countries their shares have long been greater.Thus, it would be fruitful to investigate whether there are differences in suppliers’category performance between private labels and manufacturers’ brands. Finally,category roles (i.e., destination, seasonal/occasional, and convenience) would be
330 S. Hyvonen et al.
Dow
nloa
ded
by [
Tur
ku U
nive
rsity
] at
22:
05 1
6 N
ovem
ber
2015

worthy of close examination as important moderators in CM. Category roles guideretailers’ category strategies and tactics, and may have considerable effects onmanufacturers’ possibilities for influence and control in CM collaboration.
References
Aaker, D.A. 1991. Managing brand equity. New York: The Free Press.Aastrup, J., D.B. Grant, and M. Bjerre. 2007. Value creation and category management
through retailer-supplier relationships. International Review of Retail, Distribution andConsumer Research 17, no. 5: 523–41.
Aastrup, J., H. Kotzab, D. Grant, C. Teller, and M. Bjerre. 2008. A model for structuringefficient consumer response measures. International Journal of Retail & DistributionManagement 36, no. 8: 590–606.
Achrol, R.S., and P. Kotler. 1999. Marketing in the network economy. Journal of Marketing63, no. 4. Special Issue, 146–63.
AC Nielsen. 2006. Consumer-centric category management: Positioning your organization towin. Hoboken, NJ: John Wiley.
Anand, P., and L.W. Stern. 1985. A sociopsychological explanation for why marketingchannel members relinquish control. Journal of Marketing Research XXII(November),365–76.
Armstrong, J.S., and T.S. Overton. 1977. Estimating non-response bias in mail surveys.Journal of Marketing Research 14, no. 3: 396–402.
Bandyopadhyay, S., and S. Divakar. 1999. Incorporating balance of power in channel decisionstructure: Theory and empirical application. Journal of Retailing and Consumer Services 6:79–89.
Bandyopadhyay, S., A. Rominger, and S. Basaviah. 2009. Developing a framework toimprove retail category management through category captain arrangements. Journal ofRetailing and Consumer Services 16, no. 4: 315–19.
Baron, R.M., and D.A. Kenny. 1986. The moderator-mediator variable distinction in socialpsychological research: Conceptual, strategic, and statistical considerations. Journal ofPersonality and Social Psychology 51, no. 6: 1173–82.
Basuroy, S., M.K. Murali, and R.G. Walters. 2001. The impact of category management onretailer prices and performance: Theory and evidence. Journal of Marketing 55(October):16–32.
Boyle, B., F.R. Dwyer, R.A. Robicheaux, and J.T. Simpson. 1992. Influence strategies inmarketing channels: Measures and use in different relationship structures. Journal ofMarketing Research XXIX(November): 462–73.
Burt, S., and L. Sparks. 2003. Power and competition in the UK retail grocery market. BritishJournal of Management 14, no. 3: 237–54.
Churchill, G.A. Jr. 1979. A paradigm for developing better measures of marketing constructs.Journal of Marketing Research 16, no. 1: 64–73.
Clarke, R., S. Davies, P. Dobson, and M. Waterson. 2002. Buyer power and competition inEuropean food retailing. Cheltenham, UK: Edward Elgar.
Cohen, J., and P. Cohen. 1983. Applied multiple regression/correlation analysis for thebehavioral sciences. Hillsdale, NJ: Erlbaum.
Corsten, D., and N. Kumar. 2005. Do suppliers benefit from collaborative relationships withlarge retailers? an empirical investigation of efficient consumer response adoption. Journalof Marketing 69, no. 3: 80–94.
Coughlan, A., E. Anderson, L. Stern, and A. El-Ansary. 2001. Marketing channels. 6th ed.New York: Prentice-Hall.
Dapiran, G.P., and S. Hogarth-Scott. 2003. Are co-operation and trust being confused withpower? An analysis of food retailing in Australia and the UK. International Journal ofRetail & Distribution Management 31, no. 5: 256–67.
Davis, D.F., and J.T. Mentzer. 2008. Relational resources in interorganizational exchange:The effects of trade equity and brand equity. Journal of Retailing 84, no. 4: 435–48.
Desrochers, D.M., G.T. Grundlach, and A.A. Foer. 2003. Analysis of antitrust challenges tocategory captain arrangements. Journal of Public Policy & Marketing 22, no. 2: 201–15.
The International Review of Retail, Distribution and Consumer Research 331
Dow
nloa
ded
by [
Tur
ku U
nive
rsity
] at
22:
05 1
6 N
ovem
ber
2015

Desrochers, D.M., and P. Nelson. 2006. Adding consumer behavior insights to categorymanagement: Improving item placement decisions. Journal of Retailing 82, no. 4: 357–65.
Dewsnap, B., and C. Hart. 2004. Category management: A new approach for fashionmarketing? European Journal of Marketing 38, no. 7: 809–34.
Dhar, S.K., S.J. Hoch, and N. Kumar. 2001. Effective category management depends on therole of the category. Journal of Retailing 77, no. 2: 165–84.
Dupre, K., and T.W. Gruen. 2004. The use of category management practices to obtain asustainable competitive advantage in the fast-moving-consumer-goods industry. Journal ofBusiness and Industrial Marketing 19, no. 7: 444–59.
Dussart, C. 1998. Category management: Strengths, limits and developments. EuropeanManagement Journal 16, no. 1: 444–59.
Dyer, J.H., and H. Singh. 1998. The relational view: Cooperative strategy and sources ofinterorganizational competitive advantage. The Academy of Management Review 23, no. 4:660–79.
El-Ansary, A., and L. Stern. 1972. Power measurement in the distribution channels. Journal ofMarketing Research 9(Summer): 59–74.
Etgar, M. 1976. Channel domination and countervailing power in distributive channels.Journal of Marketing Research 13, no. 3: 254–62.
Everitt, B.S. 1980. Cluster analysis. London: Heinemann Educational Books.Frazier, G.L. 1983. Interorganizational exchange behavior in marketing channels: A
broadened perspective. Journal of Marketing 47(Fall): 68–78.Frazier, G.L., and R.C. Rody. 1991. The use of influence strategies in interfirm relationships in
industrial product channels. Journal of Marketing 55(January): 52–9.Frazier, G.L., and J. Summers. 1984. Interfirm influence strategies and their application within
distribution channels. Journal of Marketing 48(Summer): 43–55.French, J.R.P., and B.H. Raven. 1959. The bases of social power. In Studies in social power,
ed. D. Cartwright, 150–67. Ann Arbor, MI: Institute for Social Research, The Universityof Michigan.
Gaski, J. 1986. Interrelations among a channel entity’s power sources: Impact of the exerciseof reward and coercion on expert, referent, and legitimate power sources. Journal ofMarketing Research 23, no. 1: 62–78.
Gaski, J., and J. Nevin. 1985. The differential effects of exercised and unexercised powersources in a marketing channel. Journal of Marketing Research 22(May): 130–42.
Glynn, M.S. 2007. How retail category differences moderate retailer perceptions ofmanufacturer brands. Australian Journal of Marketing 15, no. 2: 55–67.
Glynn, M.S., J. Motion, and R.J. Brodie. 2007. Sources of brand benefits in manufacturer-reseller B2B relationships. Journal of Business & Industrial Marketing 22, no. 6: 400–9.
Gruen, T.W., and R.H. Shah. 2000. Determinants and outcomes of plan objectivity andimplementations in category management relationships. Journal of Retailing 76, no. 4:483–510.
Hair, J.F., R.E. Anderson, R.L. Tatham, and W.C. Black. 1995. Multivariate data analysis.New York: MacMillan.
Heide, J.B., and G. John. 1992. Do norms matter in marketing relationships? Journal ofMarketing 56, no. 2: 32–44.
Hogarth-Scott, S., and G.P. Dapiran. 1997. Shifting category management relationships in thefood distribution channels in the UK and Australia.Management Decision 35, no. 4: 310–8.
Holweg, C., P. Schnedlitz, and C. Teller. 2009. The drivers of consumer value in the ECRCategory Management model. The International Review of Retail, Distribution andConsumer Research 19, no. 3: 199–218.
Hudson, D., L.-H. Seah, D. Hite, and T. Haab. 2004. Telephone presurveys, self-selection,and non-response bias to mail and internet surveys in economic research. AppliedEconomics Letters 11: 237–40.
Hunt, M., and J. Nevin. 1974. Power in a channel of distribution: Sources and consequences.Journal of Marketing Research 11(May): 186–93.
Keith, J., D.W. Jackson, Jr., and L.A. Crosby. 1990. Effects of alternative influence strategiesunder different channel dependence structures. Journal of Marketing 54(July): 30–41.
Keller, K.L. 1998. Strategic brand management: Building, measuring and managing brandequity. Upper Saddle River, NJ: Prentice Hall.
332 S. Hyvonen et al.
Dow
nloa
ded
by [
Tur
ku U
nive
rsity
] at
22:
05 1
6 N
ovem
ber
2015

Ketchen, D.J., and C.L. Shook. 1996. The application of cluster analysis in strategicmanagement research: An analysis and critique. Strategic Management Journal 17, no. 2:441–58.
Kumar, N. 2005. The power of power in supplier-retailer relationships. Industrial MarketingManagement 34: 863–6.
Kurnia, S., and R.B. Johnston. 2003. Adoption of efficient consumer response: Key issues andchallenges in Australia. Supply Chain Management: An International Journal 8, no. 3: 251–62.
Kurtulus, M., and B.L. Toktay. 2004. Category captainship: Who wins, who loses? ECRJournal: International Commerce Review 4, no. 2: 27–33.
Lassar, W.M. 1998. Control systems in supplier-retailer relationships and their impact onbrand performance. Journal of Retailing and Consumer Services 5, no. 2: 65–75.
Linblom, A., and R. Olkkonen. 2006. Category management tactics: An analysis ofmanufacturers’ control. International Journal of Retail & Distribution Management 34,no. 6: 482–496.
Mayo, D.T., L.D. Richardson, and J.T. Simpson. 1998. The differential effects of the uses ofpower sources and influence strategies on channel satisfaction. Journal of MarketingTheory and Practice 6, no. 2: 16–25.
Miles, R.E., and C.C. Snow. 1978. Organizational strategy. Structure and process. New York:McGraw-Hill.
Morgan, R.M., and S. Hunt. 1999. Relationship-based competitive strategy. The role ofrelationship marketing in marketing strategy. Journal of Business Research 46, no. 3: 281–90.
Payan, J.M., and J.R. Nevin. 2006. Influence strategy efficacy in supplier-distributorrelationships. Journal of Business Research 59: 457–65.
Phillips, L. 1981. Assessing measurement error in key informant reports: A methodologicalnote on organizational analysis in marketing. Journal of Marketing Research 18, no. 3:395–415.
Planet Retail Databank. 2009. http://www.planetretail.net/ (accessed January 14, 2009).Porter, M.E. 1985. Competitive advantage. Creating and sustaining superior performance. New
York: Free Press.Punj, G., and D. Stewart. 1983. Cluster analysis in marketing research: Review and
suggestions for application. Journal of Marketing Research 29: 134–48.Raven, B.H., and A.W. Kruglanski. 1970. Conflict and power. In The structure of conflict, ed.
P. Swangle, 69–109. New York: Academic Press.Scheer, L.K., and L.W. Stern. 1992. The effect of influence type and performance outcomes
on attitudes toward the influencer. Journal of Marketing Research XXIX(February):128–142.
Sharma, S.F., R.M. Duran, and O. Gur-Arie. 1981. Identification and analysis of moderatorvariables. Journal of Marketing Research 18, no. 3: 291–300.
Shervani, T.A., G. Frazier, and S. Challagalla. 2007. The moderating influence of firm marketpower on transaction cost economics model: An empirical test in a forward channelintegration context. Strategic Management Journal 28, no. 5: 635–52.
Song, M., C. Droge, S. Hanvanich, and R. Calantone. 2005. Marketing and technologyresource complementary: An analysis of their interaction effect in two environmentalconditions. Strategic Management Journal 26, no. 3: 259–76.
Srivastava, R.K., T.A. Shervani, and L. Fahey. 1998. Market-based assets and shareholdervalue: A framework for analysis. Journal of Marketing 62(January): 2–18.
Webster, F.E. Jr. 2000. Understanding interrelationships among brands, consumers, andresellers. Journal of the Academy of Marketing Science 28, no. 1: 17–23.
Zenor, M.J. 1994. The profit benefits of category management. Journal of Marketing Research31(May): 202–13.
The International Review of Retail, Distribution and Consumer Research 333
Dow
nloa
ded
by [
Tur
ku U
nive
rsity
] at
22:
05 1
6 N
ovem
ber
2015