Evidence for differential alternative splicing in blood of young boys with autism spectrum disorders
16
RESEARCH Open Access Evidence for differential alternative splicing in blood of young boys with autism spectrum disorders Boryana S Stamova 1,2,5* , Yingfang Tian 1,2,4 , Christine W Nordahl 1,3 , Mark D Shen 1,3 , Sally Rogers 1,3 , David G Amaral 1,3 and Frank R Sharp 1,2 Abstract Background: Since RNA expression differences have been reported in autism spectrum disorder (ASD) for blood and brain, and differential alternative splicing (DAS) has been reported in ASD brains, we determined if there was DAS in blood mRNA of ASD subjects compared to typically developing (TD) controls, as well as in ASD subgroups related to cerebral volume. Methods: RNA from blood was processed on whole genome exon arrays for 2-4–year-old ASD and TD boys. An ANCOVA with age and batch as covariates was used to predict DAS for ALL ASD (n=30), ASD with normal total cerebral volumes (NTCV), and ASD with large total cerebral volumes (LTCV) compared to TD controls (n=20). Results: A total of 53 genes were predicted to have DAS for ALL ASD versus TD, 169 genes for ASD_NTCV versus TD, 1 gene for ASD_LTCV versus TD, and 27 genes for ASD_LTCV versus ASD_NTCV. These differences were significant at P <0.05 after false discovery rate corrections for multiple comparisons (FDR <5% false positives). A number of the genes predicted to have DAS in ASD are known to regulate DAS (SFPQ, SRPK1, SRSF11, SRSF2IP, FUS, LSM14A). In addition, a number of genes with predicted DAS are involved in pathways implicated in previous ASD studies, such as ROS monocyte/macrophage, Natural Killer Cell, mTOR, and NGF signaling. The only pathways significant after multiple comparison corrections (FDR <0.05) were the Nrf2-mediated reactive oxygen species (ROS) oxidative response (superoxide dismutase 2, catalase, peroxiredoxin 1, PIK3C3, DNAJC17, microsomal glutathione S-transferase 3) and superoxide radical degradation (SOD2, CAT). Conclusions: These data support differences in alternative splicing of mRNA in blood of ASD subjects compared to TD controls that differ related to head size. The findings are preliminary, need to be replicated in independent cohorts, and predicted alternative splicing differences need to be confirmed using direct analytical methods. Keywords: Autism, ASD, RNA, Splicing, Head size, Gene expression Background Autism spectrum disorder (ASD) is a spectrum of neurodevelopmental disorders that are clinically defined by communication and social impairments combined with stereotypic and repetitive behaviors [1]. Though over 20% of those diagnosed with ASD have a number of identifiable genetic causes [2], the genetic bases for the remaining cases remain unclear. It is not known how many other genetic causes of ASD may be identi- fied, or if there is a group of susceptibility genes that interact with environmental factors (for example, toxins, infection, immune) and cause the majority of cases of ASD [2-4]. A role for both genetics and environment in ASD has come from many studies, including a recent study of ASD brain. Regional patterns of gene expression that distinguish frontal and temporal cortex were attenuated in ASD brain compared to controls [5]. Moreover, there were two modules of co-expressed genes associated with * Correspondence: [email protected] 1 MIND Institute, University of California at Davis, Sacramento, CA 95817, USA 2 Department of Neurology, University of California at Davis, Sacramento, CA 95817, USA Full list of author information is available at the end of the article © 2013 Stamova et al.; licensee BioMed Central Ltd. This is an Open Access article distributed under the terms of the Creative Commons Attribution License (http://creativecommons.org/licenses/by/2.0), which permits unrestricted use, distribution, and reproduction in any medium, provided the original work is properly cited. Stamova et al. Molecular Autism 2013, 4:30 http://www.molecularautism.com/content/4/1/30
Transcript of Evidence for differential alternative splicing in blood of young boys with autism spectrum disorders
Stamova et al. Molecular Autism 2013, 4:30http://www.molecularautism.com/content/4/1/30
RESEARCH Open Access
Evidence for differential alternative splicing inblood of young boys with autism spectrumdisordersBoryana S Stamova1,2,5*, Yingfang Tian1,2,4, Christine W Nordahl1,3, Mark D Shen1,3, Sally Rogers1,3,David G Amaral1,3 and Frank R Sharp1,2
Abstract
Background: Since RNA expression differences have been reported in autism spectrum disorder (ASD) for bloodand brain, and differential alternative splicing (DAS) has been reported in ASD brains, we determined if there wasDAS in blood mRNA of ASD subjects compared to typically developing (TD) controls, as well as in ASD subgroupsrelated to cerebral volume.
Methods: RNA from blood was processed on whole genome exon arrays for 2-4–year-old ASD and TD boys. AnANCOVA with age and batch as covariates was used to predict DAS for ALL ASD (n=30), ASD with normal totalcerebral volumes (NTCV), and ASD with large total cerebral volumes (LTCV) compared to TD controls (n=20).
Results: A total of 53 genes were predicted to have DAS for ALL ASD versus TD, 169 genes for ASD_NTCV versusTD, 1 gene for ASD_LTCV versus TD, and 27 genes for ASD_LTCV versus ASD_NTCV. These differences weresignificant at P <0.05 after false discovery rate corrections for multiple comparisons (FDR <5% false positives). Anumber of the genes predicted to have DAS in ASD are known to regulate DAS (SFPQ, SRPK1, SRSF11, SRSF2IP, FUS,LSM14A). In addition, a number of genes with predicted DAS are involved in pathways implicated in previous ASDstudies, such as ROS monocyte/macrophage, Natural Killer Cell, mTOR, and NGF signaling. The only pathwayssignificant after multiple comparison corrections (FDR <0.05) were the Nrf2-mediated reactive oxygen species (ROS)oxidative response (superoxide dismutase 2, catalase, peroxiredoxin 1, PIK3C3, DNAJC17, microsomal glutathioneS-transferase 3) and superoxide radical degradation (SOD2, CAT).
Conclusions: These data support differences in alternative splicing of mRNA in blood of ASD subjects compared toTD controls that differ related to head size. The findings are preliminary, need to be replicated in independentcohorts, and predicted alternative splicing differences need to be confirmed using direct analytical methods.
Keywords: Autism, ASD, RNA, Splicing, Head size, Gene expression
BackgroundAutism spectrum disorder (ASD) is a spectrum ofneurodevelopmental disorders that are clinically definedby communication and social impairments combinedwith stereotypic and repetitive behaviors [1]. Thoughover 20% of those diagnosed with ASD have a numberof identifiable genetic causes [2], the genetic bases for
* Correspondence: [email protected] Institute, University of California at Davis, Sacramento, CA 95817, USA2Department of Neurology, University of California at Davis, Sacramento, CA95817, USAFull list of author information is available at the end of the article
© 2013 Stamova et al.; licensee BioMed CentrCommons Attribution License (http://creativecreproduction in any medium, provided the or
the remaining cases remain unclear. It is not knownhow many other genetic causes of ASD may be identi-fied, or if there is a group of susceptibility genes thatinteract with environmental factors (for example, toxins,infection, immune) and cause the majority of cases ofASD [2-4].A role for both genetics and environment in ASD has
come from many studies, including a recent study ofASD brain. Regional patterns of gene expression thatdistinguish frontal and temporal cortex were attenuatedin ASD brain compared to controls [5]. Moreover, therewere two modules of co-expressed genes associated with
al Ltd. This is an Open Access article distributed under the terms of the Creativeommons.org/licenses/by/2.0), which permits unrestricted use, distribution, andiginal work is properly cited.
Stamova et al. Molecular Autism 2013, 4:30 Page 2 of 16http://www.molecularautism.com/content/4/1/30
autism including a neuronal module enriched for knownautism susceptibility genes (genetic module); and amodule enriched for immune and glial genes that werenot enriched for autism GWAS-associated genes (envir-onmental immune module) [5]. Significantly for thepresent study, some genes showed evidence of altereddifferential alternative splicing (DAS) of specific FOX1regulated mRNAs [5].These data led us to consider in this study whether
there might be altered DAS of mRNA in ASD blood.Blood is useful to study in ASD for several reasons: (1)various factors - including genetics, toxicants, infections,immune and autoimmune factors implicated in ASD[6-11] - affect alternative splicing in leukocytes in blood[12-19]; (2) the monocyte transcriptome in blood is verysimilar to the microglia (brain macrophage) transcrip-tome [20,21], and microglia are activated in ASD brain[22]; (3) immune and autoimmune dysfunction thatwould be associated with alterations of gene expressionand alternative splicing in blood has been reported insubgroups of ASD individuals [23-26]; (4) there is cross-talk between the immune system and the CNS [27,28];(5) studies of blood allow us to investigate subjects at anearly age when ASD becomes clinically evident.In recruiting subjects for this study, we included ASD
boys that were ultimately found to have altered trajector-ies of brain development. Abnormal brain enlargementhas been consistently observed in MRI studies ofpreschool-aged ASD children compared to age-matchedcontrols [29-31]. This is one of the most consistent find-ings in the neuropathology of a subset of ASD in boys,however there is considerable variability in total cerebralvolume (TCV) phenotypes. Macrocephaly has beenreported in 15% to 20% of young children with ASD[29,31-34] , though there is an ongoing debate for itsrelevance in ASD [35,36]. In the larger population ofchildren recruited for this study, approximately 15% hadabnormally enlarged TCV [30]. In addition, PTEN(phosphatase and tensin homolog deleted on chromo-some 10) mutations are found in a subset of ASD chil-dren with macrocephaly [37-39]. It has been suggestedthat PTEN may regulate cell size through effects on pro-tein translation, particularly interesting in the view of itsconnection to PI3K/AKT/mTOR signaling pathways im-plicated in single gene causes of ASD [40]. Finally, differ-ences of differential alternative splicing have beenassociated with abnormal brain volumes in various ani-mal models and in humans [41-44].We therefore postulated that specific differences in al-
ternative splicing/exon usage in immune blood cells maybe present in ASD boys, and this might differ in ASDboys with large total cerebral volumes (ASD_LTCV)versus ASD boys with normal total cerebral volumes(ASD_NTCV). Thus, we compared ASD and ASD
subgroups related to total cerebral volume to typicallydeveloping (TD) controls. Our findings demonstrateDAS in ASD versus TD boys, and that there are differ-ences of DAS in ASD boys with large brains comparedto those with normal total cerebral volumes. Finally,there are some genes that demonstrate DAS in blood inthis study that have previously been reported to haveDAS in brain [5]. However, most of the DAS bloodgenes are different from DAS brain genes which wouldbe consistent with differential alternative splicing gener-ally being tissue specific [45-48].
MethodsSubjectsThis study was approved by the University of Californiaat Davis Institutional Review Board (IRB). Written in-formed consent was obtained from the parent or guard-ian of each participant and data were analyzed withoutpersonal information identifiers.Fifty boys (n=20 TD and n=30 ASD), aged 2-4 years,
participated in this study. Participants were enrolled inthe UC Davis MIND Institute’s Autism Phenome Project(APP) (http://www.ucdmc.ucdavis.edu/mindinstitute/re-search/app/). The diagnostic criteria for ASD and TDand inclusion and exclusion criteria were previously de-scribed [30]. Briefly, subjects were recruited through theMIND Institute at the University of California, Davis.ASD diagnosis was determined based on administrationof the Autism Diagnostic Observation Schedule-Generic(ADOS-G) [49], and the Autism Diagnostic Interview-Revised (ADI-R) [50] by appropriately trained membersof the research team and clinical consensus of two inde-pendent psychologists. Autism severity was determinedby using the ADOS severity score, based on the algo-rithm scores on the various modules [51]. Developmen-tal abilities of cases and controls were determined usingthe Mullen Scales of Early Development [52]. Inaddition, several inclusion and exclusion criteria wereused for the TD group. TD inclusion was based on hav-ing Standard Score of 70-130 on the Learning Compos-ite of the Mullens Scale of Early Learning, and a score<11 on the Social Communication Questionnaire usedto screen for autism traits [53]. Exclusion criteria for theTD group included a diagnosis of intellectual disability,pervasive developmental disorder, specific language im-pairment, or any known developmental, neurological, orbehavioral problems [30].In addition, if the ASD or TD children had a fever or
had been ill within the 2 weeks before the blood draw,blood draws were rescheduled for a later time. Thismethod was used to exclude children with acute infec-tions in a previous CHARGE study [54]. Clinical infor-mation collected for the kids from this study showed sixwere on different prescription and non-prescription

Stamova et al. Molecular Autism 2013, 4:30 Page 3 of 16http://www.molecularautism.com/content/4/1/30
medications (6 ASD/0 TD), and 25 (17 ASD/8 TD) wereon supplements (mostly vitamins). Since no two ASD orTD individuals were on the same medication or supple-ment, and times varied since the last doses, these werenot included as covariates in the analyses and there weretoo few medication- and supplement-free subjects toanalyze separately.
MRI of brainBecause total cerebral volume (TCV) is extremely vari-able in ASD [30], ASD participants were selected to havea range of TCV. As part of the APP, all participantsunderwent MRI scanning at the UC Davis Imaging Re-search Center, as previously described [30]. In short, allscans were acquired during natural, nocturnal sleep.Total cerebral volume (TCV) data were measured froma three-dimensional T1-weighted MPRAGE scan (TR,2,170 ms; TE, 4.86 ms; matrix, 256 × 256; slices acquiredin sagittal direction, 192; isotropic voxels, 1 mm). Distor-tion correction using a calibration phantom was carriedout and images were corrected for field in homogeneity.TCV was measured using a template-based automatedmethod, and excluded brainstem and cerebellum [30].ASD subjects were divided into two subgroups based onMRI measures of TCV, with the ones with NTCV (n=20ASD subjects) having TCV within 1.5 standard deviationsof the TD centroid [30], while the ones with LTCV (n=10)had TCV >1.5 standard deviations of the TD controls.
RNA and array processingWhole venous blood was collected into PAXgene tubes(PreAnalytiX, Germany), which immediately lyse all cellsin whole blood and stabilize the RNA without measurabledegradation or ex vivo transcriptional changes. RNA wasisolated and processed as previously described [55] usingthe WT-Ovation™ Pico RNA Amplification System(NuGEN, San Carlos, CA, USA) with the Exon Moduleand fragmented and labeled using the FL Ovation™ cDNABiotin Module V2 (NuGEN, San Carlos, CA, USA). Ex-pression was measured by hybridization on AffymetrixHuman Exon 1.0 ST microarrays according to protocol(Affymetrix, Santa Clara, CA, USA).Probe summarization and probe set normalization were
performed using robust multi-chip average (RMA) inPartek Genomics Suite 6.5 software (Partek Inc., St. Louis,MO, USA). RMA includes background correction, Quan-tile Normalization, log2-transformation, and Median Pol-ish probe set summarization. Only the core meta-probesets (about 228,000 probe sets) were analyzed since theseare the best annotated. Exons with low signal in all sam-ples (maximum signal across all samples of the log2-transformed probe set value <3), were considered notexpressed and were excluded from further analysis.
Analysis of predicted DASSince the exon array used does not contain probe setscovering exon-exon junctions, deducing DAS is indirectgiven that the unit measured is exon expression whichprovides a measure of exon usage. Thus we will oftenuse the term predicted ‘differential alternative splicing/differential exon usage (DAS/DEU)’ to emphasize thefact that differential exon expression is used to predictDAS in these studies.An alternative splicing ANCOVA was performed on the
probe sets passing the filtering criteria using Partek soft-ware. The Splicing ANCOVA Model [56,57] used was:
Yijklm ¼ μþ Groupi þ Ageþ Batchj þMarkerIDk
þ SampleID Group � Batchð Þijlþ Group �MarkerIDik þ Age �MarkerIDk
þ Batch �MarkerIDjk þ εijklm
Where:
� Yijklm represents the mth observation on the ith
Group, jth Batch, kth MarkerID, lth SampleID.� μ is the common effect for the whole experiment.� εijklm represents the random error present in the mth
observation on the ith Group, jth Batch, kth
MarkerID, lth SampleID. The errors εijklm areassumed to be normally and independentlydistributed with mean 0 and standard deviationδ for all measurements.
SampleID(Group * Batch)ijl is a sample-to-sample ef-fect. SampleID is a random effect. Batch is a randomeffect.MarkerIDk is exon-to-exon effect (alt-splicing inde-
pendent to Group). This term also accounts for the factthat not all exons of a gene hybridize to the correspond-ing probe sets (MarkerID) with the same efficiency.Group * MarkerIDik, Age * MarkerIDk, Batch *
MarkerIDjk represent whether an exon expresses differ-ently in different level of the specified alternative splicefactor(s). The term Group * MarkerIDik was used toidentify group-specific DAS.Thus, an alternative splicing ANCOVA was performed
on the 17,100 genes passing the filtering criteria (max-imum signal across all samples of the log2-transformedprobe set value <3, as described in the above section). Thesplicing ANCOVA model included covariates for bothtechnical (batch, random effect) and biological (age, con-tinuous variable) variation to account for their effect onDAS/DEU. In addition, since not all exons in a geneexpress/hybridize to the probe sets at the same level,MarkerID was added to the model to account for exon-to-exon differences. MarkerID is an exon-to-exon effect (alt-

Stamova et al. Molecular Autism 2013, 4:30 Page 4 of 16http://www.molecularautism.com/content/4/1/30
splicing independent of Group). SampleID was added tothe model, which accounted for the sample-to-sampleeffect. An interaction term of MarkerID with Group(ASD, TD) to detect alternative splicing was used to esti-mate an exon has a different expression in different levelsof the factor (ASD, TD), which was used to identify geneswith predicted DAS/DEU in the different groups. Thesplicing prediction algorithm within Partek softwarewas used.Separate differential alternative splicing ANCOVAs
were performed for the following comparisons: All ASDversus TD; ASD_LTCV versus TD; ASD_NTCV versusTD; and ASD_NTCV versus ASD_ LTCV. To correct forthe multiple comparisons being performed, a Benjamini-Hochberg false discovery rate of 5% was adopted, mean-ing that the P values were adjusted so that no more than5% of the reported genes would be expected to be falsepositives [58].
Hierarchical clustering and principal component analysesHierarchical clustering using Euclidean distance andaverage linkage, and the principal components analysis(PCA) were performed in Partek Genomics Suite. Foreach analysis, the exon-level expression data correctedfor age and batch were used. Genome-wide PCA usingall probe sets on the array and all samples wasperformed to examine array quality and visualize vari-ability at the whole-genome level (Additional file 1:Figure S1).
Functional pathways associated with DAS in ASDIngenuity pathway analysis (IPA) was used to identifythe pathways from the IPA library of canonical pathwaysthat were most significant to each dataset. The signifi-cance of the association between the dataset with pre-dicted DAS/DEU and canonical pathways was assessedby calculating the ratio of the number of genes from thedataset that map to the pathway divided by the totalnumber of molecules that exist in the canonical path-way. A Fisher’s exact test was then used to calculate aP value determining the probability that each biologicalfunction and/or pathway assigned to that dataset is dueto chance alone. A FDR (5% false positives) correctedP <0.05 was considered to be statistically significant forover-representation of the molecules in a given pathway.Thus, over-represented canonical pathways are thosewith more molecules than expected by chance.The above analyses used standard criteria for identify-
ing ASD pathways associated with DAS/DEU. However,as outlined in the results below, only two pathways wereidentified using the DAS/DEU genes that passed FDRcorrection. We therefore performed a sub-analysis inorder to obtain a broader picture of possible regulatedpathways. Thus, a splicing ANCOVA was performed for
All ASD versus TD, except that all genes showing aP <0.05 for DAS were identified. An exon-level expres-sion ANCOVA was then performed on these genes forALL ASD versus TD, including age and batch as covari-ates. Exons with expression significantly different be-tween All ASD and TD with P <0.005 and |Fold-Change| >1.2 were considered significant in this analysis.This approach would help correct for multiple compari-sons and should identify the most reliable DAS genesbecause they were predicted to be differentially alterna-tively spliced, and to have significant differences ofexon-level expression for All ASD versus TD (overlapP <0.0002). An Ingenuity pathway analysis was thenperformed on this list of genes for ALL ASD versus TDwith P <0.05 considered significant.
ResultsParticipants’ characteristicsDemographic and clinical characteristics of the subjectsare presented in Table 1. There were 20 ASD_NTCVsubjects (3.0 ± 0.5 years), 10 ASD_LTCV subjects (3.1 ±0.2 years), and 20 TD subjects (3.0 ± 0.3 years). Sevenout of the 10 ASD_LTCV subjects were classified asmegalencephalic, defined as having TCV >2 standard de-viations above the TD mean. There were no significantgroup differences in age or race. As expected, develop-mental quotient (DQ), verbal quotient (VQ), and non-verbal quotient (NVQ) were significantly lower in theASD than the TD groups (P <1E-09). Total cerebral vol-ume (TCV) was not significantly different between theASD_NTCV and TD groups (P=0.87). TCV was signifi-cantly enlarged in the ASD_LTCV compared toASD_NTCV (P=2.42E-10) and TD (P=1.42E-09), whichwas the result of our pre-selection. There were no sig-nificant differences in the ADOS severity scores betweenthe ASD_NTCV and ASD_LTCV groups (P=0.17).
DAS/DEU in ASD groups compared to TDThere were 53 genes with predicted DAS/DEU for thecomparisons of ALL ASD versus TD (Table 2, Additionalfile 2: Table S1) (FDR corrected P <0.05). The clusteranalysis (Figure 1A) and Principal Components Analysis(Figure 1B) using these genes demonstrated good separ-ation of the subjects in each group with a few exceptions(Figure 1).There were 169 genes with predicted DAS/DEU for the
comparisons of ASD_NTCV versus TD (FDR correctedP <0.05) (Additional file 2: Table S2). The cluster analysis(Figure 2A) and principal components analysis (Figure 2B)using these genes demonstrated excellent separation ofthe subjects in each group with no exceptions (Figure 2).There was only one gene with predicted DAS/DEU for
the comparison of ASD_LTCV versus TD (FDR corrected
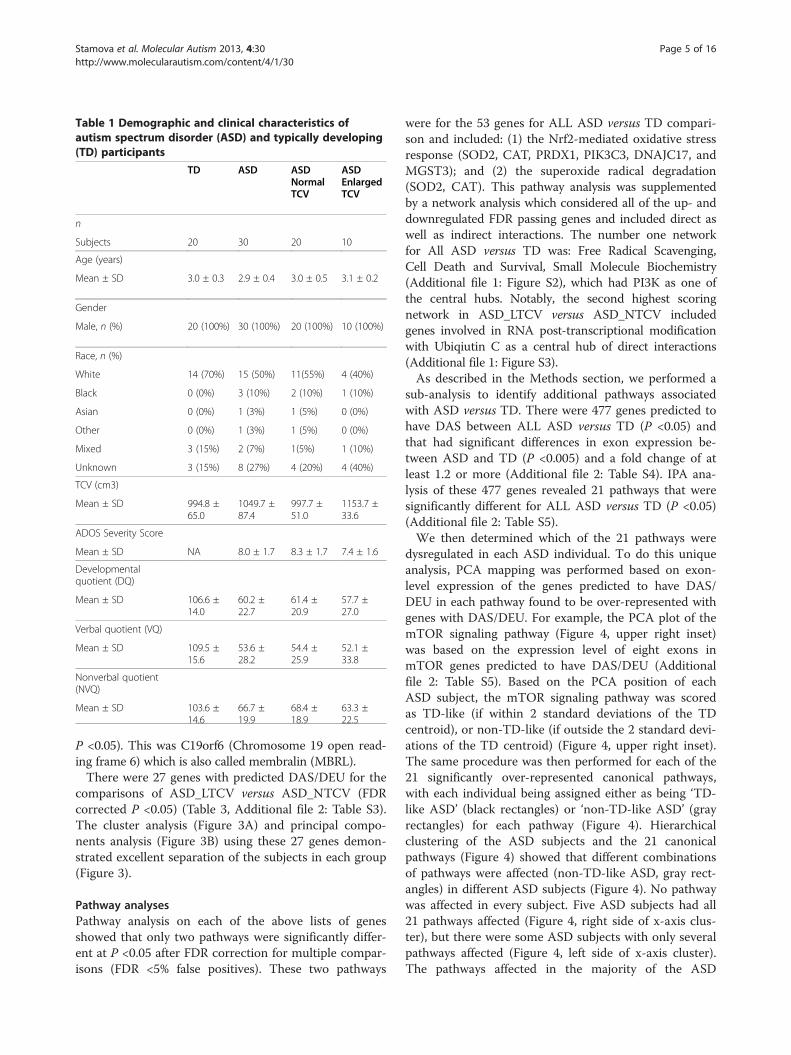
Table 1 Demographic and clinical characteristics ofautism spectrum disorder (ASD) and typically developing(TD) participants
TD ASD ASDNormalTCV
ASDEnlargedTCV
n
Subjects 20 30 20 10
Age (years)
Mean ± SD 3.0 ± 0.3 2.9 ± 0.4 3.0 ± 0.5 3.1 ± 0.2
Gender
Male, n (%) 20 (100%) 30 (100%) 20 (100%) 10 (100%)
Race, n (%)
White 14 (70%) 15 (50%) 11(55%) 4 (40%)
Black 0 (0%) 3 (10%) 2 (10%) 1 (10%)
Asian 0 (0%) 1 (3%) 1 (5%) 0 (0%)
Other 0 (0%) 1 (3%) 1 (5%) 0 (0%)
Mixed 3 (15%) 2 (7%) 1(5%) 1 (10%)
Unknown 3 (15%) 8 (27%) 4 (20%) 4 (40%)
TCV (cm3)
Mean ± SD 994.8 ±65.0
1049.7 ±87.4
997.7 ±51.0
1153.7 ±33.6
ADOS Severity Score
Mean ± SD NA 8.0 ± 1.7 8.3 ± 1.7 7.4 ± 1.6
Developmentalquotient (DQ)
Mean ± SD 106.6 ±14.0
60.2 ±22.7
61.4 ±20.9
57.7 ±27.0
Verbal quotient (VQ)
Mean ± SD 109.5 ±15.6
53.6 ±28.2
54.4 ±25.9
52.1 ±33.8
Nonverbal quotient(NVQ)
Mean ± SD 103.6 ±14.6
66.7 ±19.9
68.4 ±18.9
63.3 ±22.5
Stamova et al. Molecular Autism 2013, 4:30 Page 5 of 16http://www.molecularautism.com/content/4/1/30
P <0.05). This was C19orf6 (Chromosome 19 open read-ing frame 6) which is also called membralin (MBRL).There were 27 genes with predicted DAS/DEU for the
comparisons of ASD_LTCV versus ASD_NTCV (FDRcorrected P <0.05) (Table 3, Additional file 2: Table S3).The cluster analysis (Figure 3A) and principal compo-nents analysis (Figure 3B) using these 27 genes demon-strated excellent separation of the subjects in each group(Figure 3).
Pathway analysesPathway analysis on each of the above lists of genesshowed that only two pathways were significantly differ-ent at P <0.05 after FDR correction for multiple compar-isons (FDR <5% false positives). These two pathways
were for the 53 genes for ALL ASD versus TD compari-son and included: (1) the Nrf2-mediated oxidative stressresponse (SOD2, CAT, PRDX1, PIK3C3, DNAJC17, andMGST3); and (2) the superoxide radical degradation(SOD2, CAT). This pathway analysis was supplementedby a network analysis which considered all of the up- anddownregulated FDR passing genes and included direct aswell as indirect interactions. The number one networkfor All ASD versus TD was: Free Radical Scavenging,Cell Death and Survival, Small Molecule Biochemistry(Additional file 1: Figure S2), which had PI3K as one ofthe central hubs. Notably, the second highest scoringnetwork in ASD_LTCV versus ASD_NTCV includedgenes involved in RNA post-transcriptional modificationwith Ubiqiutin C as a central hub of direct interactions(Additional file 1: Figure S3).As described in the Methods section, we performed a
sub-analysis to identify additional pathways associatedwith ASD versus TD. There were 477 genes predicted tohave DAS between ALL ASD versus TD (P <0.05) andthat had significant differences in exon expression be-tween ASD and TD (P <0.005) and a fold change of atleast 1.2 or more (Additional file 2: Table S4). IPA ana-lysis of these 477 genes revealed 21 pathways that weresignificantly different for ALL ASD versus TD (P <0.05)(Additional file 2: Table S5).We then determined which of the 21 pathways were
dysregulated in each ASD individual. To do this uniqueanalysis, PCA mapping was performed based on exon-level expression of the genes predicted to have DAS/DEU in each pathway found to be over-represented withgenes with DAS/DEU. For example, the PCA plot of themTOR signaling pathway (Figure 4, upper right inset)was based on the expression level of eight exons inmTOR genes predicted to have DAS/DEU (Additionalfile 2: Table S5). Based on the PCA position of eachASD subject, the mTOR signaling pathway was scoredas TD-like (if within 2 standard deviations of the TDcentroid), or non-TD-like (if outside the 2 standard devi-ations of the TD centroid) (Figure 4, upper right inset).The same procedure was then performed for each of the21 significantly over-represented canonical pathways,with each individual being assigned either as being ‘TD-like ASD’ (black rectangles) or ‘non-TD-like ASD’ (grayrectangles) for each pathway (Figure 4). Hierarchicalclustering of the ASD subjects and the 21 canonicalpathways (Figure 4) showed that different combinationsof pathways were affected (non-TD-like ASD, gray rect-angles) in different ASD subjects (Figure 4). No pathwaywas affected in every subject. Five ASD subjects had all21 pathways affected (Figure 4, right side of x-axis clus-ter), but there were some ASD subjects with only severalpathways affected (Figure 4, left side of x-axis cluster).The pathways affected in the majority of the ASD
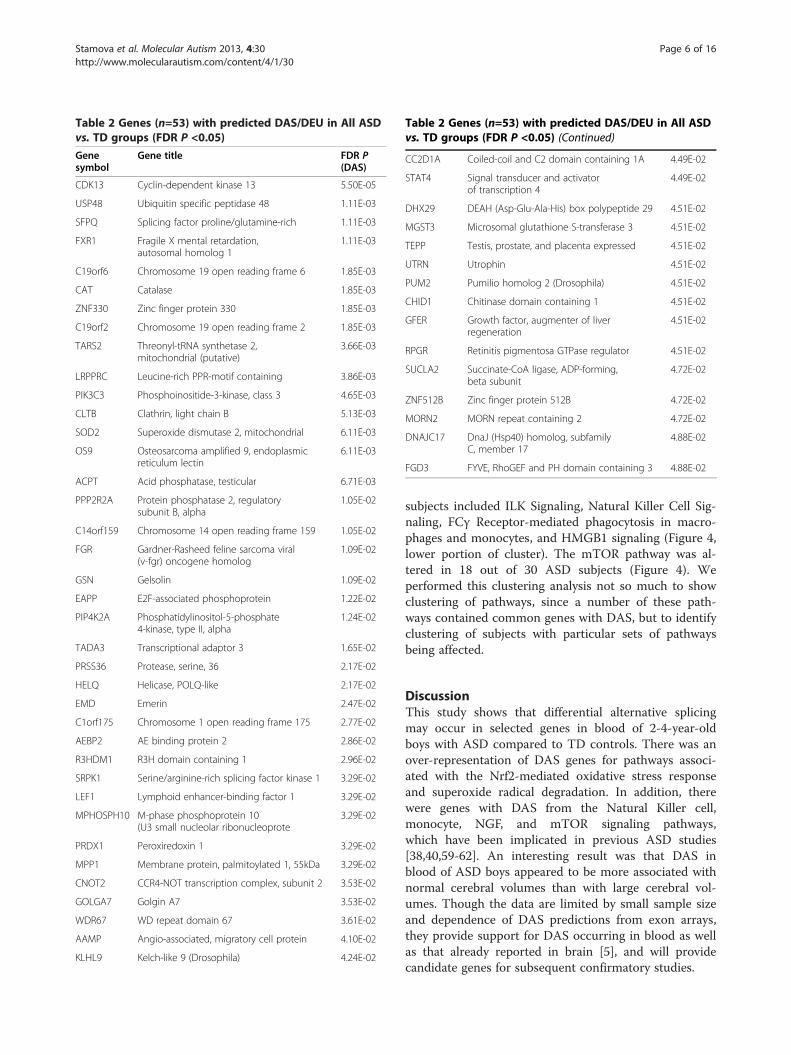
Table 2 Genes (n=53) with predicted DAS/DEU in All ASDvs. TD groups (FDR P <0.05)
Genesymbol
Gene title FDR P(DAS)
CDK13 Cyclin-dependent kinase 13 5.50E-05
USP48 Ubiquitin specific peptidase 48 1.11E-03
SFPQ Splicing factor proline/glutamine-rich 1.11E-03
FXR1 Fragile X mental retardation,autosomal homolog 1
1.11E-03
C19orf6 Chromosome 19 open reading frame 6 1.85E-03
CAT Catalase 1.85E-03
ZNF330 Zinc finger protein 330 1.85E-03
C19orf2 Chromosome 19 open reading frame 2 1.85E-03
TARS2 Threonyl-tRNA synthetase 2,mitochondrial (putative)
3.66E-03
LRPPRC Leucine-rich PPR-motif containing 3.86E-03
PIK3C3 Phosphoinositide-3-kinase, class 3 4.65E-03
CLTB Clathrin, light chain B 5.13E-03
SOD2 Superoxide dismutase 2, mitochondrial 6.11E-03
OS9 Osteosarcoma amplified 9, endoplasmicreticulum lectin
6.11E-03
ACPT Acid phosphatase, testicular 6.71E-03
PPP2R2A Protein phosphatase 2, regulatorysubunit B, alpha
1.05E-02
C14orf159 Chromosome 14 open reading frame 159 1.05E-02
FGR Gardner-Rasheed feline sarcoma viral(v-fgr) oncogene homolog
1.09E-02
GSN Gelsolin 1.09E-02
EAPP E2F-associated phosphoprotein 1.22E-02
PIP4K2A Phosphatidylinositol-5-phosphate4-kinase, type II, alpha
1.24E-02
TADA3 Transcriptional adaptor 3 1.65E-02
PRSS36 Protease, serine, 36 2.17E-02
HELQ Helicase, POLQ-like 2.17E-02
EMD Emerin 2.47E-02
C1orf175 Chromosome 1 open reading frame 175 2.77E-02
AEBP2 AE binding protein 2 2.86E-02
R3HDM1 R3H domain containing 1 2.96E-02
SRPK1 Serine/arginine-rich splicing factor kinase 1 3.29E-02
LEF1 Lymphoid enhancer-binding factor 1 3.29E-02
MPHOSPH10 M-phase phosphoprotein 10(U3 small nucleolar ribonucleoprote
3.29E-02
PRDX1 Peroxiredoxin 1 3.29E-02
MPP1 Membrane protein, palmitoylated 1, 55kDa 3.29E-02
CNOT2 CCR4-NOT transcription complex, subunit 2 3.53E-02
GOLGA7 Golgin A7 3.53E-02
WDR67 WD repeat domain 67 3.61E-02
AAMP Angio-associated, migratory cell protein 4.10E-02
KLHL9 Kelch-like 9 (Drosophila) 4.24E-02
Table 2 Genes (n=53) with predicted DAS/DEU in All ASDvs. TD groups (FDR P <0.05) (Continued)
CC2D1A Coiled-coil and C2 domain containing 1A 4.49E-02
STAT4 Signal transducer and activatorof transcription 4
4.49E-02
DHX29 DEAH (Asp-Glu-Ala-His) box polypeptide 29 4.51E-02
MGST3 Microsomal glutathione S-transferase 3 4.51E-02
TEPP Testis, prostate, and placenta expressed 4.51E-02
UTRN Utrophin 4.51E-02
PUM2 Pumilio homolog 2 (Drosophila) 4.51E-02
CHID1 Chitinase domain containing 1 4.51E-02
GFER Growth factor, augmenter of liverregeneration
4.51E-02
RPGR Retinitis pigmentosa GTPase regulator 4.51E-02
SUCLA2 Succinate-CoA ligase, ADP-forming,beta subunit
4.72E-02
ZNF512B Zinc finger protein 512B 4.72E-02
MORN2 MORN repeat containing 2 4.72E-02
DNAJC17 DnaJ (Hsp40) homolog, subfamilyC, member 17
4.88E-02
FGD3 FYVE, RhoGEF and PH domain containing 3 4.88E-02
Stamova et al. Molecular Autism 2013, 4:30 Page 6 of 16http://www.molecularautism.com/content/4/1/30
subjects included ILK Signaling, Natural Killer Cell Sig-naling, FCγ Receptor-mediated phagocytosis in macro-phages and monocytes, and HMGB1 signaling (Figure 4,lower portion of cluster). The mTOR pathway was al-tered in 18 out of 30 ASD subjects (Figure 4). Weperformed this clustering analysis not so much to showclustering of pathways, since a number of these path-ways contained common genes with DAS, but to identifyclustering of subjects with particular sets of pathwaysbeing affected.
DiscussionThis study shows that differential alternative splicingmay occur in selected genes in blood of 2-4-year-oldboys with ASD compared to TD controls. There was anover-representation of DAS genes for pathways associ-ated with the Nrf2-mediated oxidative stress responseand superoxide radical degradation. In addition, therewere genes with DAS from the Natural Killer cell,monocyte, NGF, and mTOR signaling pathways,which have been implicated in previous ASD studies[38,40,59-62]. An interesting result was that DAS inblood of ASD boys appeared to be more associated withnormal cerebral volumes than with large cerebral vol-umes. Though the data are limited by small sample sizeand dependence of DAS predictions from exon arrays,they provide support for DAS occurring in blood as wellas that already reported in brain [5], and will providecandidate genes for subsequent confirmatory studies.

Figure 1 All ASD vs. TD. Unsupervised hierarchical clustering (A) and PCA (B) of the 53 exons predicted to display DAS/DEU with FDR P <0.05in All ASD vs. TD analysis. The heatmap in 1A represents adjusted exon expression level (high=red, low=green) of the exons predicted to haveDAS/DEU. TD subjects denoted in blue; ASD subjects - in black. The PCA plot in 1B shows separation of the ASD (red spheres) from the TD(blue spheres) subjects. The ellipsoids are drawn at 2 standard deviations around the group centroids.
Stamova et al. Molecular Autism 2013, 4:30 Page 7 of 16http://www.molecularautism.com/content/4/1/30
Oxidative stress responsesDAS was predicted for specific genes in the superoxide rad-ical degradation and Nrf-2 mediated oxidative stress path-ways which were significant for the ALL ASD versus TDcomparison. SOD2 is a mitochondrial matrix protein thattransforms toxic superoxide, a by-product of the mitochon-drial electron transport chain, into hydrogen peroxide anddiatomic oxygen. Mice without SOD2 die shortly after birth[63]. Catalase decomposes toxic hydrogen peroxide producedby SOD to water and oxygen. Peroxiredoxin 1 (PRDX1) cata-lyzes peroxide reduction of hydrogen peroxide, organic hy-droperoxides, and peroxynitrite, and thus decreases oxidativestress in cells. The MGST3 gene encodes the enzymeMicrosomal glutathione S-transferase 3 which demonstratesglutathione-dependent peroxidase activity towards lipid hy-droperoxides. All of these genes are induced by reactive oxy-gen species (ROS). ROS cause the transcription factor Nrf2to translocate from cytoplasm to the nucleus where Nrf2binds anti-oxidant response elements (ARE) in promoters ofNrf2 target anti-oxidant genes including SOD2, CAT,PRDX1, and MGST3 to increase RNA expression [64].There is some evidence of oxidative stress [65-68] and ab-
normal levels of superoxide and catalase in blood of ASDchildren [69-71]. There is also increased oxidative stress in
ASD brain and specific abnormalities related to glutathioneand superoxide [67,72]. Moreover, mitochondrial abnormal-ities have been identified in blood of ASD subjects [9] thatcould contribute to ROS production and alterations of Nrf2and SOD2 pathways identified here. Mitochondrial abnor-malities are also found in brain [73]. Though oxidative stressmay not be causal, the results of the current study supportthe possibility of DAS in specific oxidative stress genes inperipheral blood cells is associated with ASD. This associ-ation probably is not specific since evidence of oxidativestress is seen in other neurodevelopmental disorders andalso occurs during normal function of the immune system.
Regulators of alternative splicingA number of the genes predicted to have DAS inASD either regulate splicing and/or are transcriptionalregulators. Some of these genes included: SFPQ (splicingfactor proline/glutamine rich), SRPK1 (serine/arginine-rich splicing factor kinase 1), SRSF11 (serine/arginine-rich splicing factor 11), SRSF2IP (splicing factor, argin-ine/serine-rich 2-interacting protein), FUS (fused insarcoma), and LSM14A (SCD6 homolog A-yeast).SFPQ , a DNA and RNA binding protein, is an essential
pre-mRNA splicing factor required early in spliceosome

A B
Exo
ns
TD
Exo
ns
TD ASD_NTCV
0-2 2
ASD-NTCV
Figure 2 ASD_NTCV vs. TD. Unsupervised hierarchical clustering (A) and PCA (B) of the 169 exons predicted to display DAS/DEU with FDRP <0.05 in ASD_NTCV vs. TD analysis. The heatmap in 1A represents adjusted exon expression level (high=red, low=green) of the exons predictedto have DAS/DEU. TD subjects denoted in blue; ASD_NTCV subjects - in orange. The PCA plot in 1B shows separation of the ASD_NTCV (orangespheres) from the TD (blue spheres) subjects. The ellipsoids are drawn at 2 standard deviations around the group centroids.
Stamova et al. Molecular Autism 2013, 4:30 Page 8 of 16http://www.molecularautism.com/content/4/1/30
formation and for splicing catalytic step II. It binds to pre-mRNA in the spliceosome C complex and regulates bothalternative splicing and transcription. SFPQ has beenassociated with Alzheimer’s disease [74] and plays arole in neuronal survival and differentiation duringdevelopment [75].SRPK1 regulates splicing, controlling the intranuclear
distribution of splicing factors in interphase cells, andregulates splice site selection. Alternative splicing of thisgene results in multiple transcript variants. In brain,SRPK1 is expressed in cortical and hippocampal pyramidalneurons, cortical and cerebellar granule cells, and Purkinjecell neurons, and regulates alternative splicing of glutam-ate receptor subunit 2 (GluR2) and tau protein [76].The SRSF11 gene encodes a nuclear protein that con-
tains an arginine/serine-rich region similar to segmentsfound in other pre-mRNA splicing factors and also playsa role in pre-mRNA processing and splicing includingthe human telomerase protein [77]. The related SRSF2IP(SCAF11) is another pre-mRNA splicing factor showingdifferential alternative splicing in ASD in this study.The Fus gene encodes a protein component of the het-
erogeneous nuclear ribonucleoprotein (hnRNP) complexwhich regulates pre-mRNA splicing and export of fullyprocessed mRNA to cytoplasm. This protein belongs tothe FET family of RNA-binding proteins which regulategene expression and process mRNA/microRNA. Fus
proteins are found in brain cytoplasmic inclusions of pa-tients with fronto-temporal dementia, affect tau splicing,and Fus mutations have been associated with familialamyotrophic lateral sclerosis [78]. Fus protein decreasesin cortex during development [79].LSM14A is homologous to Sm-like (LSm) proteins
which are members of the tri-snRNP (small nuclear ri-bonucleoprotein) particles that regulate pre-mRNA spli-cing. Mutations in snRNP proteins have been associatedwith neurodevelopmental disorders with ASD features,including Prader-Willi and Angelman Syndrome [80,81].Though most of the above genes have not been directly
implicated in ASD, they could affect differential alternativesplicing of ASD susceptibility genes [82]. Moreover, alterna-tive splicing appears to play a role in some known geneticcauses of ASD. There is aberrant alternative splicing insingle gene mutations associated with ASD (CADPS2,NLGN3, NLGN4X, NRXN1, and SHANK3). There isdysregulated splicing in some single gene disorders respon-sible for some forms of syndromic autism (tuberous scler-osis and neurofibromatosis); and still other genes associatedwith syndromic autisms encode proteins that can modulatealternative splicing (FMR1, MECP2, and SNRPN-Fragile Xand Retts Syndrome) [82]. In addition, a recent study dem-onstrated differential expression of mRNA in brain betweenASD and controls, which revealed enrichment of mRNAsinvolved in the process of alternative splicing [35].

Table 3 Genes (n=27) with predicted DAS/DEU inASD_LTCV vs. ASD_NTCV groups (FDR P <0.05)
Genesymbol
Gene title FDR P(DAS)
TMEM204 Transmembrane protein 204 2.26E-05
SRSF2IP Splicing factor, arginine/serine-rich 2-interacting protein
7.17E-05
PPP1R10 Protein phosphatase 1, regulatory(inhibitor) subunit 10
4.19E-04
ATXN7L3B Ataxin 7-like 3B 1.52E-03
HPS1 Hermansky-Pudlak syndrome 1 1.90E-03
ANKRD44 Ankyrin repeat domain 44 4.46E-03
EXOG Endo/exonuclease (5'-3'),endonuclease G-like
5.11E-03
ZNF493 Zinc finger protein 493 1.51E-02
DHX29 DEAH (Asp-Glu-Ala-His) box polypeptide 29 1.57E-02
HOOK2 Hook homolog 2 (Drosophila) 2.02E-02
IL12RB2 Interleukin 12 receptor, beta 2 2.14E-02
BAT3 HLA-B associated transcript 3 2.53E-02
DVL3 Dishevelled, dsh homolog 3 (Drosophila) 2.53E-02
RAB7A RAB7A, member RAS oncogene family 2.53E-02
TNFRSF14 Tumor necrosis factor receptorsuperfamily, member 14
2.53E-02
PPIP5K2 Diphosphoinositol pentakisphosphatekinase 2
2.67E-02
NDST1 N-deacetylase/N-sulfotransferase(heparan glucosaminyl) 1
3.26E-02
DPH2 DPH2 homolog (S. cerevisiae) 3.71E-02
PDP1 Pyruvate dehyrogenase phosphatasecatalytic subunit 1
3.71E-02
TGFB1I1 Transforming growth factor beta1 induced transcript 1
4.14E-02
UBA6 Ubiquitin-like modifier activating enzyme 6 4.41E-02
SLC38A5 Solute carrier family 38, member 5 4.42E-02
PLCD3 Phospholipase C, delta 3 4.45E-02
COL15A1 Collagen, type XV, alpha 1 4.47E-02
KDELR3 KDEL (Lys-Asp-Glu-Leu) endoplasmicreticulum protein
4.47E-02
BIRC3 Baculoviral IAP repeat-containing 3 4.47E-02
ALOX15 Arachidonate 15-lipoxygenase 4.47E-02
Stamova et al. Molecular Autism 2013, 4:30 Page 9 of 16http://www.molecularautism.com/content/4/1/30
Regulation of transcription, protein synthesis, and proteindegradationThe number two network for ASD_NTCV versus TDwas Cellular Assembly, Function and Organizationand RNA Post-Transcriptional Modification which hadUbiquitin C at its hub (Additional file 1: Figure S2).There were a number differentially alternatively splicedgenes in our ASD analyses that functioned in regulatingtranscription, translation, and protein degradation atvarious levels.
TranscriptionThere were many genes with predicted DAS in ASD ver-sus TD that regulated transcription including POLR2B(polymerase (RNA) II (DNA directed) polypeptide B,140kDa). POLR2B encodes the second largest subunit ofRNA polymerase II, the polymerase responsible for syn-thesizing messenger RNA in eukaryotes. This subunit, incombination with at least two other polymerase sub-units, forms a structure within the polymerase thatmaintains contact in the active site of the enzyme be-tween the DNA template and the newly synthesizedRNA, playing a key role in transcription as well as alter-native splicing. Though not implicated in ASD, inAlzheimer brain the hyperphosphorylation of RNA poly-merase II and decreases of RNA levels precede neurofib-rillary tangle formation [83].MED12 (mediator complex subunit 12) is a compo-
nent of the Mediator complex, a co-activator involved inthe regulated transcription of nearly all RNA polymeraseII-dependent genes. This subunit may regulate transcrip-tion of targets of the Wnt signaling pathway and SHHsignaling pathway relevant for neurodevelopment andintellectual disability syndromes [84-86].Another DAS gene was TADA3 (Transcriptional
Adaptor 3) which enhances the initiation rate of RNApolymerase II-mediated gene transcription by interactingfunctionally with the general transcription machinerybound at the basal promoter (see below). Related genesincluded MLL3, a histone methyl transferease, which is aco-activator complex of nuclear receptors, involved intranscriptional co-activation. The gene is essential fornormal embryogenesis and cell cycle progression [87].Another related DAS gene is ASH2L (ash2 (absent,small, or homeotic)-like (Drosophila) is part of theMLL1/MLL2 histone methyltransferase (HMT) complex.It is involved in methylation/ demethylation and func-tions as a transcriptional activator and may play a role inchromosome demarcation [88].There were also several transcription factors predicted to
have DAS in ASD including STAT4, CNOT2, and NPAS2and TCF1 (Transcription Factor 19). NPAS2, a member ofthe basic helix-loop-helix (bHLH)-PAS family of transcrip-tion factors, regulates transcription of proteins involved inspecific types of memory, several proteins (PER1) that arepart of the molecular clock in the mammalian forebrain,and has been implicated in ASD [89]. STAT4 (signal trans-ducer and activator of transcription 4) is essential for medi-ating responses to IL12 in lymphocytes, and regulating thedifferentiation of T helper cells. STAT4 regulates perforinexpression in cytotoxic T cells and Natural Killer cells [90],the latter cells having been shown to have altered cyto-toxic/perforin functions in ASD [59].There is evidence for coupling of transcription and spli-
cing, with faster rates of transcription being associated

A
Exo
nsE
xons
ASD_LTCV ASD_NTCV
0-2 2
ASD_NTCV
B
ASD_LTCV
Figure 3 ASD_LTCV vs. ASD_NTCV. Unsupervised hierarchical clustering (A) and PCA (B) of the 27 exons predicted to display DAS/DEU withFDR P <0.05 in ASD_LTCV vs. ASD_NTCV analysis. The heatmap in 1A represents adjusted exon expression level (high=red, low=green) of theexons predicted to have DAS/DEU. ASD_LTCV subjects denoted in grey; ASD_NTCV subjects - in orange. The PCA plot in 1B shows separation ofthe ASD_NTCV (orange spheres) from the TD (grey spheres) subjects. The ellipsoids are drawn at 2 standard deviations around thegroup centroids.
Stamova et al. Molecular Autism 2013, 4:30 Page 10 of 16http://www.molecularautism.com/content/4/1/30
with exon skipping [91,92]. Thus DAS in genes affectingtranscription could result in alterations of DAS in a num-ber of targets.
TranslationThere were also many DAS genes involved in regulatingtranslation including: PIK3C3 (in mTOR pathway);PPP1R9B ( protein phosphatase 1, regulatory (inhibitor)subunit 9B); FXR1 (fragile X mental retardation, autosomalhomolog 1); PPP2R2A (protein phosphatase 2, regulatorysubunit B, alpha-mTOR); ELP2 (elongation protein 2homolog-yeast); EIF2AK1 (eurkaryotic translation initi-ation factor 2-alpha kinase 1); MRPL40 (mitochondrialribosomal protein L 40); TARS2 (threonyl-tRNA synthe-tase 2, mitochondrial); YARS (tyrosyl -tRNA synthetase);and EIF2C3 (eukaryotic translation initiation factor 2C, 3).These many genes involved in translation relate directlyand indirectly to PI3K/AKT/mTOR pathways, a resultwhich was also supported by our sub-analysis on the path-ways affected in each ASD subject discussed below (seesection on Pathways previously implicated in ASD).
Ubiquitination and protein degradationSeveral genes with predicted DAS in ASD were relatedto ubiquitin pathways, and ubiquitin was a hub in sev-eral regulated networks (Additional file 1: Figure S2).
These genes included USP48 (ubiquitin specific peptid-ase 48), UBA6 (ubiquitin-like modifier activating enzyme6), BIRC3 (baculoviral IAP repeat-containing 3), andDnaJC17 (DNAJ (Hsp40) homolog, subfamily C, mem-ber 17). BIRC3 Acts as an E3 ubiquitin-protein ligaseregulating NF-kappa-B signaling and regulates both ca-nonical and non-canonical NF-kappa-B signaling. Thetarget proteins for its E3 ubiquitin-protein ligase activityinclude: RIPK1, RIPK2, RIPK3, RIPK4, CASP3, CASP7,CASP8, TRAF1, and BCL10. Ubiqutin pathways havebeen implicated in autism for some time and arespecifically linked to autism associated with 15q11-q13chromosome deletions [93,94].
Genes implicated in previous autism studies - GWAS andRNA expression in brainOf the genes predicted to be alternatively spliced in ASDversus TD boys in this study, some have been implicatedin previous genetic studies of ASD including Gelsolin(GSN), LRPPRC (leucine-rich PPR-motif containing),BIN1 (bridging integrator 1), MED12 (mediator complexsubunit 12), NPAS2 (neuronal PAS domain protein 2),SYNE1 (spectrin repeat containing, nuclear envelope 1),and TBL1XR1 (transducin (beta)-like X-linked receptor 1)[73,89,95-97]. Thus, there is overlap of genes implicated in

Figure 4 Individual-subject level analysis. Hierarchical clustering of ASD subjects and significant pathways (P <0.05). Each ASD subject in eachof the significant pathways was scored as either TD-like, if its PCA position on the PCA plot for the genes with DAS/DEU in the particular pathwaywas within 2 SD of the TD centroid (within the TD ellipsoid); or as non-TD-like, if its PCA position on the first three PCA components space wasoutside 2 SD of the TD centroid (outside of the TD ellipsoid). An example of the scoring scheme - in the upper right-hand corner - is presentedfor the mTOR signaling pathway.
Stamova et al. Molecular Autism 2013, 4:30 Page 11 of 16http://www.molecularautism.com/content/4/1/30
previous genetic ASD studies and the findings in thisstudy of DAS in ASD.Gelsolin has been implicated in previous genetic studies
of ASD [95], has been reported to be differentially splicedin ASD compared to TD brain [5], and is predicted to bealternatively spliced in the ALL ASD versus TD analysisand the ASD_NTCV versus TD analysis in this study.Gelsolin protein binds the ‘plus’ ends of actin monomersand filaments to prevent monomer exchange, and modu-lates assembly and disassembly of actin filaments. Muta-tions of this gene cause familial amyloidosis Finnish type(FAF) [98]. Multiple transcript variants encoding severaldifferent isoforms have been found. Gelsolin levels in-crease in brain during development, and are higher inchildren with Down’s syndrome [99]. In brain gelsolin hasmany roles including modulating NMDA receptors, alter-ing dendritic spines, being highly expressed by oligoden-drocytes, and modulating amyloidosis [100-102].The LPPRC gene has also been implicated in previous
ASD genetic studies [73,95]. In the nucleus it bindsHNRPA1-associated poly(A) mRNAs and is part ofnmRNP complexes at late stages of mRNA maturationwhich are associated with nuclear mRNA export. Inmitochondria the protein binds to poly(A) mRNA andstabilizes mitochondrially encoded cytochrome c oxidase
(COX) subunits. It cooperates with PPARGC1A toregulate certain mitochondrially encoded genes andgluconeogenic genes and may regulate docking ofPPARGC1A to transcription factors and regulates tran-scription of the multidrug-related genes MDR1 andMVP. The LPPRC proteinis reduced over two-fold inASD compared to control brain [73]. The LPPRC pro-tein directly binds Neurofibromin 1, mutations of whichcan be associated with ASD [103].MED12 (see above) has also been implicated as a
genetic susceptibility ASD gene [95]. A novel X-linkeddisorder with developmental delay and autistic featureswith duplication of Xq12-q13.3 involves the MED12gene [104]. MED12 is linked to the sonic hedgehogpathway and mutations in the gene are associated withmental retardation and autism like features [86]. Med12-dependent recruitment of the Mediator complex withSox10 promotes terminal differentiation of myelinatingglia [105]. MED12 plays a key role in forming the hind-brain during development [84].TBL1XR1 (transducin (beta)-like 1X-linked receptor 1 -
trascription regulator, beta-catenin binding) has alsobeen implicated in ASD. It localizes to the histonedeacetylase complex and interacts with HDAC3 andRNA polymerase II, playing a key role in regulating
Stamova et al. Molecular Autism 2013, 4:30 Page 12 of 16http://www.molecularautism.com/content/4/1/30
transcription. This gene is one of six newly identifiedgenes that have recurrent mutations that are associatedwith ASD [106]. This gene also regulates the beta cateninWnt signaling pathway which has also been implicated inASD [97,107].Of the ASD genes found to demonstrate DAS in blood
in this study, several of these have been reported to alsobe differentially alternatively spliced in ASD brain. Theseinclude: GSN; CLTB (clathrin, light chain); OS9 (osteo-sarcoma amplified 9, endoplasmic reticulum lectin);BIN1; CHPT1 (choline phosphotransferase 1); LSM14A(SCD6 homolog A); MINK1 (misshapen-like kinase 1);and SYNE1 [5]. Though the function of these genes maybe different in blood and brain [108], and even thoughthe exons involved are different as expected since alter-native splicing is highly tissue-specific, DAS of the samegenes in blood and brain represents an independent lineof evidence for these genes being affected by DAS/DEUin different cohorts and tissues in ASD.
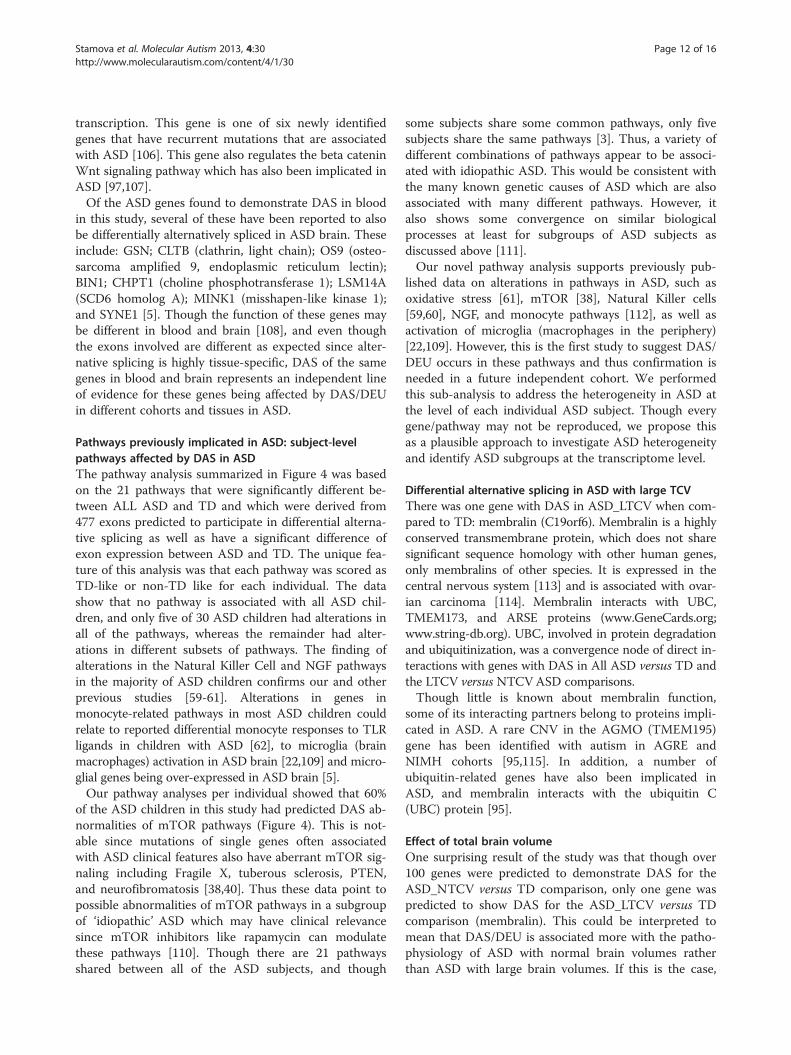
Pathways previously implicated in ASD: subject-levelpathways affected by DAS in ASDThe pathway analysis summarized in Figure 4 was basedon the 21 pathways that were significantly different be-tween ALL ASD and TD and which were derived from477 exons predicted to participate in differential alterna-tive splicing as well as have a significant difference ofexon expression between ASD and TD. The unique fea-ture of this analysis was that each pathway was scored asTD-like or non-TD like for each individual. The datashow that no pathway is associated with all ASD chil-dren, and only five of 30 ASD children had alterations inall of the pathways, whereas the remainder had alter-ations in different subsets of pathways. The finding ofalterations in the Natural Killer Cell and NGF pathwaysin the majority of ASD children confirms our and otherprevious studies [59-61]. Alterations in genes inmonocyte-related pathways in most ASD children couldrelate to reported differential monocyte responses to TLRligands in children with ASD [62], to microglia (brainmacrophages) activation in ASD brain [22,109] and micro-glial genes being over-expressed in ASD brain [5].Our pathway analyses per individual showed that 60%
of the ASD children in this study had predicted DAS ab-normalities of mTOR pathways (Figure 4). This is not-able since mutations of single genes often associatedwith ASD clinical features also have aberrant mTOR sig-naling including Fragile X, tuberous sclerosis, PTEN,and neurofibromatosis [38,40]. Thus these data point topossible abnormalities of mTOR pathways in a subgroupof ‘idiopathic’ ASD which may have clinical relevancesince mTOR inhibitors like rapamycin can modulatethese pathways [110]. Though there are 21 pathwaysshared between all of the ASD subjects, and though
some subjects share some common pathways, only fivesubjects share the same pathways [3]. Thus, a variety ofdifferent combinations of pathways appear to be associ-ated with idiopathic ASD. This would be consistent withthe many known genetic causes of ASD which are alsoassociated with many different pathways. However, italso shows some convergence on similar biologicalprocesses at least for subgroups of ASD subjects asdiscussed above [111].Our novel pathway analysis supports previously pub-
lished data on alterations in pathways in ASD, such asoxidative stress [61], mTOR [38], Natural Killer cells[59,60], NGF, and monocyte pathways [112], as well asactivation of microglia (macrophages in the periphery)[22,109]. However, this is the first study to suggest DAS/DEU occurs in these pathways and thus confirmation isneeded in a future independent cohort. We performedthis sub-analysis to address the heterogeneity in ASD atthe level of each individual ASD subject. Though everygene/pathway may not be reproduced, we propose thisas a plausible approach to investigate ASD heterogeneityand identify ASD subgroups at the transcriptome level.
Differential alternative splicing in ASD with large TCVThere was one gene with DAS in ASD_LTCV when com-pared to TD: membralin (C19orf6). Membralin is a highlyconserved transmembrane protein, which does not sharesignificant sequence homology with other human genes,only membralins of other species. It is expressed in thecentral nervous system [113] and is associated with ovar-ian carcinoma [114]. Membralin interacts with UBC,TMEM173, and ARSE proteins (www.GeneCards.org;www.string-db.org). UBC, involved in protein degradationand ubiquitinization, was a convergence node of direct in-teractions with genes with DAS in All ASD versus TD andthe LTCV versus NTCVASD comparisons.Though little is known about membralin function,
some of its interacting partners belong to proteins impli-cated in ASD. A rare CNV in the AGMO (TMEM195)gene has been identified with autism in AGRE andNIMH cohorts [95,115]. In addition, a number ofubiquitin-related genes have also been implicated inASD, and membralin interacts with the ubiquitin C(UBC) protein [95].
Effect of total brain volumeOne surprising result of the study was that though over100 genes were predicted to demonstrate DAS for theASD_NTCV versus TD comparison, only one gene waspredicted to show DAS for the ASD_LTCV versus TDcomparison (membralin). This could be interpreted tomean that DAS/DEU is associated more with the patho-physiology of ASD with normal brain volumes ratherthan ASD with large brain volumes. If this is the case,

Stamova et al. Molecular Autism 2013, 4:30 Page 13 of 16http://www.molecularautism.com/content/4/1/30
there is no ready explanation for this finding though itis consistent with a different pathophysiology of theASD_LTCV and ASD_NTCV subgroups. There were 27genes that demonstrated DAS in the ASD_NTCV versusASD_LTCV comparison, which associated with manypathways including IL12 signaling in macrophages, In-ositol Pyrophosphates Biosynthesis, synaptic long-termpotentiation, PKA signaling, Dopamine-DARPP32 Feed-back in cAMP Signaling, and others. Given that onlyone gene differed in the ASD_LTCV to TD comparison,these differences are likely driven by the ASD_NTCVgroup. The data would suggest that future genetic, im-aging, biomarker, and behavioral studies should considerhead size for defining clinical ASD subgroups.
LimitationsCause and effect cannot be determined from this study.Since blood samples were used, it is not known to whatextent the observed changes reflect changes in the brain.It is likely that many of these changes reflect differencesin the peripheral immune system of ASD and are associ-ated with the immune and autoimmune dysregulationobserved in some ASD subjects [112].The sample size is small and though multiple compari-
son adjustments were made, the problem of false posi-tives can only be addressed by replication in futurestudies. CNVs, SNPs, and other processes could affectthe exon usage measured in this study which would notrepresent differences of alternative splicing. Therefore,alternative splicing predicted using exon arrays in thisstudy will require confirmation using other approachesthat directly measure expression of alternatively splicedvariants of single genes. The current study provides onesource for determining which genes might be evaluatedin future studies.
ConclusionsThe data in this study suggests that DAS occurs in bloodof 2-4-year-old boys with ASD compared to TD con-trols. Different ASD subgroups based on TCV exhibitedspecific DAS. These findings are preliminary and needto be replicated in independent cohorts.
Additional files
Additional file 1: Figure S1. Principle components analysis (PCA) on awhole-genome level of all samples included in our analyses. Color-codingbased on Group: TD - blue, ASD_NTCV - orange, ASD_LTCV - gray.Figure S2. IPA top-scoring networks of the 53 genes with DAS/DEU(ALL ASD vs. TD): Free Radical Scavenging , Cell Death and Survival, SmallMolecule Biochemistry. Red - predicted exon with DAS/DEU is moreoften retained in ASD than in TD; green - predicted exon with DAS/DEUis more often excluded in ASD than in TD. Solid lines represent directinteractions. Dashed lines - indirect interactions. Note: PI3K node, whichdisplays DAS. Colors represent genes predicted to display DAS/DEUbetween ALL ASD and TD. Figure S3. IPA second top-scoring networks
of the 27 genes with DAS/DEU in ASD_LTCV vs. ASD_NTCV: CellularAssembly and Organization, Cellular Function and Maintenance, RNAPost-Transcriptional Modification. Note: UBC convergence hub of directinteractions. Colors represent genes predicted to display DAS/DEUbetween ASD_LTCV and ASD_NTCV and TD. Red - predicted exon withDAS/DEU is more often retained in ASD_LTCV than in ASD_NTCV; green -predicted exon with DAS/DEU is more often excluded in ASD_LTCV thanin ASD_NTCV. Solid lines represent direct interactions. Dashed lines -indirect interactions.
Additional file 2: Table S1. Genes (n=53) with predicted DAS/DEU inALL ASD vs. TD groups (FDR P <0.05). Table S2. Genes (n=169) withpredicted DAS/DEU in ASD_NTCV vs. TD groups (FDR P <0.05). Table S3.Genes (n=27) with predicted DAS/DEU in ASD_LTCV vs. ASD_NTCVgroups (FDR P <0.05). Table S4. Genes (n=477) with predicted DAS/DEUin sub-analysis of ALL ASD vs. TD Groups for individual subject-levelpathway analysis. Table S5. Functional analysis using IPA of the 477 DASgenes in the sub-analysis of ALL ASD compared to TD (see Table S4)revealed that 21 canonical pathways were over-represented (P <0.05).These 21 pathways and the genes with DAS in each pathway are listedbelow. These 21 pathways were used for the analysis shown in Figure 4.
AbbreviationsASD: Autism spectrum disorders; DAS: Differential alternative splicing;DEU: Differential exon usage; LTCV: Large total cerebral volume;NTCV: Normal total cerebral volume; TD: Typically developing.
Competing interestsThe authors declare that they have no competing interests.
Authors’ contributionsBS and FRS devised the study. CWN, MDS, SR, and DGA selected participants,oversaw diagnostic evaluations, and directed MRI studies and analyses. BSand YT performed the statistical analyses. BS and FRS wrote the manuscriptand all authors participated in reviewing and editing the manuscript.
AcknowledgementsThe study was supported by the MIND Institute (FRS), the UC DavisChildren’s Miracle Network (FRS and BS), and by ARRA funding1R01MH089626 to DGA. Dr. Yingfang Tian was supported by ScienceTechnology Foundation of Shaanxi Province, PR China (2012K16-03-05).
Author details1MIND Institute, University of California at Davis, Sacramento, CA 95817, USA.2Department of Neurology, University of California at Davis, Sacramento, CA95817, USA. 3Department of Psychiatry and Behavioral Sciences, University ofCalifornia at Davis, Sacramento, CA 95817, USA. 4College of Life Sciences,Shaanxi Normal University, Xi’an 710062, China. 5MIND Institute Research WetLabs, University of California at Davis, Room 2417, 2805 50th Street,Sacramento, CA 95817, USA.
Received: 4 June 2013 Accepted: 6 August 2013Published: 4 September 2013
References1. American Psychiatric Association: Diagnostic and Statistical Manual of Mental
Disorders, Fourth Edition, Text Revision (DSM-IV-TR). Arlington, VA: AmericanPsychiatric Association; 2000.
2. Geschwind DH: Genetics of autism spectrum disorders. Trends Cogn Sci2011, 15:409–416.
3. Bill BR, Geschwind DH: Genetic advances in autism: heterogeneity andconvergence on shared pathways. Curr Opin Genet Dev 2009, 19:271–278.
4. Carter M, Scherer S: Autism spectrum disorder in the genetics clinic: areview. Clin Genet 2013, 83:399–407.
5. Voineagu I, Wang X, Johnston P, Lowe JK, Tian Y, Horvath S, Mill J, CantorRM, Blencowe BJ, Geschwind DH: Transcriptomic analysis of autistic brainreveals convergent molecular pathology. Nature 2011, 474:380–384.
6. Napolioni V, Persico AM, Porcelli V, Palmieri L: The mitochondrialaspartate/glutamate carrier AGC1 and calcium homeostasis:physiological links and abnormalities in autism. Mol Neurobiol 2011,44:83–92.
Stamova et al. Molecular Autism 2013, 4:30 Page 14 of 16http://www.molecularautism.com/content/4/1/30
7. Palmieri L, Persico AM: Mitochondrial dysfunction in autismspectrum disorders: cause or effect? Biochim Biophys Acta 2010,1797:1130–1137.
8. Palmieri L, Papaleo V, Porcelli V, Scarcia P, Gaita L, Sacco R, Hager J,Rousseau F, Curatolo P, Manzi B, Militerni R, Bravaccio C, Trillo S, SchneiderC, Melmed R, Elia M, Lenti C, Saccani M, Pascucci T, Puglisi-Allegra S,Reichelt KL, Persico AM: Altered calcium homeostasis in autism-spectrumdisorders: evidence from biochemical and genetic studies of themitochondrial aspartate/glutamate carrier AGC1. Mol Psychiatry 2010,15:38–52.
9. Giulivi C, Zhang YF, Omanska-Klusek A, Ross-Inta C, Wong S, Hertz-PicciottoI, Tassone F, Pessah IN: Mitochondrial dysfunction in autism. JAMA 2010,304:2389–2396.
10. Rossignol DA, Frye RE: Mitochondrial dysfunction in autism spectrumdisorders: a systematic review and meta-analysis. Mol Psychiatry 2012,17:290–314.
11. Frye RE, Rossignol DA: Mitochondrial dysfunction can connect the diversemedical symptoms associated with autism spectrum disorders.Pediatr Res 2011, 69:41R–47R.
12. Jaresova I, Rozkova D, Spisek R, Janda A, Brazova J, Sediva A: Kinetics ofToll-like receptor-4 splice variants expression in lipopolysaccharide-stimulated antigen presenting cells of healthy donors and patients withcystic fibrosis. Microbes Infect 2007, 9:1359–1367.
13. Li R, Rosendahl A, Brodin G, Cheng AM, Ahgren A, Sundquist C, Kulkarni S,Pawson T, Heldin CH, Heuchel RL: Deletion of exon I of SMAD7 inmice results in altered B cell responses. J Immunol 2006,176:6777–6784.
14. Chisa JL, Burke DT: Mammalian mRNA splice-isoform selection is tightlycontrolled. Genetics 2007, 175:1079–1087.
15. Simarro M, Mauger D, Rhee K, Pujana MA, Kedersha NL, Yamasaki S, CusickME, Vidal M, Garcia-Blanco MA, Anderson P: Fas-activated serine/threoninephosphoprotein (FAST) is a regulator of alternative splicing. Proc NatlAcad Sci U S A 2007, 104:11370–11375.
16. Pleiss JA, Whitworth GB, Bergkessel M, Guthrie C: Rapid, transcript-specificchanges in splicing in response to environmental stress. Mol Cell 2007,27:928–937.
17. Takai K, Sakamoto S, Sakai T, Yasunaga J, Komatsu K, Matsuoka M: Apotential link between alternative splicing of the NBS1 gene and DNAdamage/environmental stress. Radiat Res 2008, 170:33–40.
18. Munoz MJ, Perez Santangelo MS, Paronetto MP, de la Mata M, Pelisch F,Boireau S, Glover-Cutter K, Ben-Dov C, Blaustein M, Lozano JJ, Bird G,Bentley D, Bertrand E, Kornblihtt AR: DNA damage regulates alternativesplicing through inhibition of RNA polymerase II elongation. Cell 2009,137:708–720.
19. Kurokawa K, Kuwano Y, Tominaga K, Kawai T, Katsuura S, Yamagishi N,Satake Y, Kajita K, Tanahashi T, Rokutan K: Brief naturalistic stress inducesan alternative splice variant of SMG-1 lacking exon 63 in peripheralleukocytes. Neurosci Lett 2010, 484:128–132.
20. Priller J, Flugel A, Wehner T, Boentert M, Haas CA, Prinz M, Fernandez-KlettF, Prass K, Bechmann I, de Boer BA, Frotscher M, Kreutzberg GW, PersonsDA, Dirnagl U: Targeting gene-modified hematopoietic cells to thecentral nervous system: use of green fluorescent protein uncoversmicroglial engraftment. Nat Med 2001, 7:1356–1361.
21. Simard AR, Rivest S: Bone marrow stem cells have the ability to populatethe entire central nervous system into fully differentiated parenchymalmicroglia. FASEB J 2004, 18:998–1000.
22. Morgan JT, Chana G, Pardo CA, Achim C, Semendeferi K, Buckwalter J,Courchesne E, Everall IP: Microglial activation and increased microglialdensity observed in the dorsolateral prefrontal cortex in autism.Biol Psychiatry 2010, 68:368–376.
23. Careaga M, Van de Water J, Ashwood P: Immune dysfunction in autism: apathway to treatment. Neurotherapeutics 2010, 7:283–292.
24. Wills S, Cabanlit M, Bennett J, Ashwood P, Amaral D, Van de Water J:Autoantibodies in autism spectrum disorders (ASD). Ann NY Acad Sci2007, 1107:79–91.
25. Fatemi SH, Earle J, Kanodia R, Kist D, Emamian ES, Patterson PH, Shi L,Sidwell R: Prenatal viral infection leads to pyramidal cell atrophy andmacrocephaly in adulthood: implications for genesis of autism andschizophrenia. Cell Mol Neurobiol 2002, 22:25–33.
26. Ashwood P, Wills S, Van de Water J: The immune response in autism: anew frontier for autism research. J Leukoc Biol 2006, 80:1–15.
27. Molina-Holgado E, Molina-Holgado F: Mending the broken brain:neuroimmune interactions in neurogenesis. J Neurochem 2010,114:1277–1290.
28. Ziemssen T, Kern S: Psychoneuroimmunology–cross-talk between theimmune and nervous systems. J Neurol 2007, Suppl 2:II/8–II/11.
29. Courchesne E, Karns CM, Davis HR, Ziccardi R, Carper RA, Tigue ZD, ChisumHJ, Moses P, Pierce K, Lord C, Lincoln AJ, Pizzo S, Schreibman L, Haas RH,Akshoomoff NA, Courchesne RY: Unusual brain growth patterns in earlylife in patients with autistic disorder: an MRI study. Neurology 2001,57:245–254.
30. Nordahl CW, Lange N, Li DD, Barnett LA, Lee A, Buonocore MH, Simon TJ,Rogers S, Ozonoff S, Amaral DG: Brain enlargement is associated withregression in preschool-age boys with autism spectrum disorders.Proc Natl Acad Sci U S A 2011, 108:20195–20200.
31. Hazlett HC, Poe M, Gerig G, Smith RG, Provenzale J, Ross A, Gilmore J, PivenJ: Magnetic resonance imaging and head circumference study of brainsize in autism: birth through age 2 years. Arch Gen Psychiatry 2005,62:1366–1376.
32. Schumann CM, Bloss CS, Barnes CC, Wideman GM, Carper RA, AkshoomoffN, Pierce K, Hagler D, Schork N, Lord C, Courchesne E: Longitudinalmagnetic resonance imaging study of cortical development throughearly childhood in autism. J Neurosci 2010, 30:4419–4427.
33. Fombonne E, Roge B, Claverie J, Courty S, Fremolle J: Microcephaly andmacrocephaly in autism. J Autism Dev Disord 1999, 29:113–119.
34. Lainhart JE, Bigler ED, Bocian M, Coon H, Dinh E, Dawson G, Deutsch CK,Dunn M, Estes A, Tager-Flusberg H, Folstein S, Hepburn S, Hyman S,McMahon W, Minshew N, Munson J, Osann K, Ozonoff S, Rodier P, Rogers S,Sigman M, Spence MA, Stodgell CJ, Volkmar F: Head circumference andheight in autism: a study by the Collaborative Program of Excellence inAutism. Am J Med Genet A 2006, 140:2257–2274.
35. Raznahan A, Wallace GL, Antezana L, Greenstein D, Lenroot R, Thurm A,Gozzi M, Spence S, Martin A, Swedo SE, Giedd JN: Compared to what?Early brain overgrowth in autism and the perils of population norms.Biol Psychiatry 2013. doi:10.1016/j.biopsych.2013.03.022.
36. Chaste P, Klei L, Sanders SJ, Murtha MT, Hus V, Lowe JK, Willsey AJ, Moreno-De-Luca D, Yu TW, Fombonne E, Geschwind D, Grice DE, Ledbetter DH,Lord C, Mane SM, Lese Martin C, Martin DM, Morrow EM, Walsh CA, SutcliffeJS, State MW, Devlin B, Cook EH Jr, Kim SJ: Adjusting Head Circumferencefor Covariates in Autism: Clinical Correlates of a Highly HeritableContinuous Trait. Biol Psychiatry 2013. doi:10.1016/j.biopsych.2013.04.018.
37. Zhou J, Parada LF: PTEN signaling in autism spectrum disorders. Curr OpinNeurobiol 2012, 22:873–879.
38. Kelleher RJ, Bear MF: The autistic neuron: troubled translation? Cell 2008,135:401–406.
39. Butler MG, Dasouki MJ, Zhou XP, Talebizadeh Z, Brown M, Takahashi TN,Miles JH, Wang CH, Stratton R, Pilarski R, Eng C: Subset of individuals withautism spectrum disorders and extreme macrocephaly associated withgermline PTEN tumour suppressor gene mutations. J Med Genet 2005,42:318–321.
40. Gipson TT, Johnston MV: Plasticity and mTOR: towards restoration ofimpaired synaptic plasticity in mTOR-related neurogenetic disorders.Neural Plast 2012, 2012:486402.
41. Romaniello R, Tonelli A, Arrigoni F, Baschirotto C, Triulzi F, Bresolin N, BassiMT, Borgatti R: A novel mutation in the beta-tubulin gene TUBB2Bassociated with complex malformation of cortical development anddeficits in axonal guidance. Dev Med Child Neurol 2012, 54:765–769.
42. Edery P, Alix E, Clerget-Darpoux F, Leutenegger AL: [Extreme microcephalyand growth retardation caused by mutations in a non-coding RNAcomponent of the minor spliceosome]. Med Sci (Paris) 2012, 28:130–133.
43. Brunk K, Vernay B, Griffith E, Reynolds NL, Strutt D, Ingham PW, Jackson AP:Microcephalin coordinates mitosis in the syncytial Drosophila embryo.J Cell Sci 2007, 120:3578–3588.
44. Varon R, Dutrannoy V, Weikert G, Tanzarella C, Antoccia A, Stockl L, SpadoniE, Kruger LA, di Masi A, Sperling K, Digweed M, Maraschio P: Mild Nijmegenbreakage syndrome phenotype due to alternative splicing. Hum MolGenet 2006, 15:679–689.
45. Anthony K, Gallo JM: Aberrant RNA processing events in neurologicaldisorders. Brain Res 2010, 1338:67–77.
46. Caceres JF, Kornblihtt AR: Alternative splicing: multiple controlmechanisms and involvement in human disease. Trends Genet 2002,18:186–193.

Stamova et al. Molecular Autism 2013, 4:30 Page 15 of 16http://www.molecularautism.com/content/4/1/30
47. Clark TA, Schweitzer AC, Chen TX, Staples MK, Lu G, Wang H, Williams A,Blume JE: Discovery of tissue-specific exons using comprehensive humanexon microarrays. Genome Biol 2007, 8:R64.
48. Glatt SJ, Cohen OS, Faraone SV, Tsuang MT: Dysfunctional gene splicing asa potential contributor to neuropsychiatric disorders. Am J Med Genet BNeuropsychiatr Genet 2011, 156B:382–392.
49. Lord C, Risi S, Lambrecht L, Cook E, Leventhal B, DiLavore P, Pickles A, RutterM: The autism diagnostic observation schedule-generic: a standardmeasure of social and communication deficits associated with thespectrum of autism. J Autism Dev Disord 2000, 30:205–223.
50. Lord C, Rutter M, Le Couteur A: Autism Diagnostic Interview-Revised: arevised version of a diagnostic interview for caregivers of individualswith possible pervasive developmental disorders. J Autism Dev Disord1994, 24:659–685.
51. Gotham K, Pickles A, Lord C: Standardizing ADOS scores for a measure ofseverity in autism spectrum disorders. J Autism Dev Disord 2009, 39:693–705.
52. Mullen EM: Mullen Scales of Early Learning. Pines, MN: American GuidanceService; 1995.
53. Rutter M, Bailey A, Lord C (Eds): The Social Communication Questionnaire.Los Angeles, CA: Western Psychological Services; 2003.
54. Ashwood P, Krakowiak P, Hertz-Picciotto I, Hansen R, Pessah IN, Van deWater J: Associations of impaired behaviors with elevated plasmachemokines in autism spectrum disorders. J Neuroimmunol 2011,232:196–199.
55. Tian Y, Liao IH, Gunther JR, Liu D, Ander BP, Stamova BS, Lit L, Jickling GC,Xu H, Zhan X, Sharp FR: GABA- and acetylcholine-related geneexpression in blood correlate with tic severity and microarray evidencefor alternative splicing in Tourette syndrome: a pilot study. Brain Res2011, 14:14.
56. Tamhane A, Dunlop D: Statistics and Data Analysis: From Elementary toIntermediate. Upper Saddle River, NJ: Prentice Hall; 2000.
57. Eisenhart C: The assumptions underlying the analysis of variance.Biometrics 1947, 3:20.
58. Reiner A, Yekutieli D, Benjamini Y: Identifying differentially expressedgenes using false discovery rate controlling procedures. Bioinformatics2003, 19:368–375.
59. Enstrom AM, Lit L, Onore CE, Gregg JP, Hansen RL, Pessah IN,Hertz-Picciotto I, Van de Water JA, Sharp FR, Ashwood P: Altered geneexpression and function of peripheral blood natural killer cells inchildren with autism. Brain Behav Immun 2009, 23:124–133.
60. Gregg JP, Lit L, Baron CA, Hertz-Picciotto I, Walker W, Davis RA, Croen LA,Ozonoff S, Hansen R, Pessah IN, Sharp FR: Gene expression changes inchildren with autism. Genomics 2008, 91:22–29.
61. Lu AT, Yoon J, Geschwind DH, Cantor RM: QTL replication and targetedassociation highlight the nerve growth factor gene for nonverbalcommunication deficits in autism spectrum disorders. Mol Psychiatry2013, 18:226–235.
62. Enstrom AM, Onore CE, Van de Water JA, Ashwood P: Differentialmonocyte responses to TLR ligands in children with autism spectrumdisorders. Brain Behav Immun 2010, 24:64–71.
63. Li Y, Huang TT, Carlson EJ, Melov S, Ursell PC, Olson JL, Noble LJ, YoshimuraMP, Berger C, Chan PH, Wallace DC, Epstein CJ: Dilated cardiomyopathyand neonatal lethality in mutant mice lacking manganese superoxidedismutase. Nat Genet 1995, 11:376–381.
64. Zhang M, An C, Gao Y, Leak RK, Chen J, Zhang F: Emerging roles of Nrf2and phase II antioxidant enzymes in neuroprotection. Prog Neurobiol2013, 100:30–47.
65. Melnyk S, Fuchs GJ, Schulz E, Lopez M, Kahler SG, Fussell JJ, Bellando J,Pavliv O, Rose S, Seidel L, Gaylor DW, James SJ: Metabolic imbalanceassociated with methylation dysregulation and oxidative damage inchildren with autism. J Autism Dev Disord 2012, 42:367–377.
66. Rose S, Melnyk S, Trusty TA, Pavliv O, Seidel L, Li J, Nick T, James SJ:Intracellular and extracellular redox status and free radical generation inprimary immune cells from children with autism. Autism Res Treatment2012, 2012:986519.
67. Rose S, Melnyk S, Pavliv O, Bai S, Nick TG, Frye RE, James SJ: Evidence ofoxidative damage and inflammation associated with low glutathioneredox status in the autism brain. Transl Psychiatry 2012, 2:e134.
68. Pecorelli A, Leoncini S, De Felice C, Signorini C, Cerrone C, Valacchi G,Ciccoli L, Hayek J: Non-protein-bound iron and 4-hydroxynonenal proteinadducts in classic autism. Brain Dev 2013, 35:146–154.
69. Laszlo A, Novak Z, Szollosi-Varga I, du Hai Q, Vetro A, Kovacs A: Blood lipidperoxidation, antioxidant enzyme activities and hemorheologicalchanges in autistic children. Ideggyogy Sz 2013, 66:23–28.
70. Meguid NA, Dardir AA, Abdel-Raouf ER, Hashish A: Evaluation of oxidativestress in autism: defective antioxidant enzymes and increased lipidperoxidation. Biol Trace Elem Res 2011, 143:58–65.
71. Frustaci A, Neri M, Cesario A, Adams JB, Domenici E, Dalla Bernardina B,Bonassi S: Oxidative stress-related biomarkers in autism: Systematicreview and meta-analyses. Free Radic Biol Med 2012, 52:2128–2141.
72. Chauhan A, Audhya T, Chauhan V: Brain region-specific glutathione redoximbalance in autism. Neurochem Res 2012, 37:1681–1689.
73. Anitha A, Nakamura K, Thanseem I, Yamada K, Iwayama Y, Toyota T,Matsuzaki H, Miyachi T, Yamada S, Tsujii M, Tsuchiya KJ, Matsumoto K, IwataY, Suzuki K, Ichikawa H, Sugiyama T, Yoshikawa T, Mori N: Brain region-specific altered expression and association of mitochondria-relatedgenes in autism. Mol Autism 2012, 3:12.
74. Guttula SV, Allam A, Gumpeny RS: Analyzing microarray data ofAlzheimer’s using cluster analysis to identify the biomarker genes.Int J Alzheimers Dis 2012, 2012:649456.
75. Lowery LA, Rubin J, Sive H:Whitesnake/sfpq is required for cell survival andneuronal development in the zebrafish. Dev Dyn 2007, 236:1347–1357.
76. Mytilinaios DG, Tsamis KI, Nikolakaki E, Giannakouros T: Distribution ofSRPK1 in human brain. J Chem Neuroanat 2012, 43:20–27.
77. Listerman I, Sun J, Gazzaniga FS, Lukas JL, Blackburn EH: The major reversetranscriptase-incompetent splice variant of the human telomeraseprotein inhibits telomerase activity but protects from apoptosis.Cancer Res 2013, 73:2817–2828.
78. Dormann D, Haass C: Fused in sarcoma (FUS): an oncogene goes awry inneurodegeneration. Mol Cell Neurosci 2013. doi:10.1016/j.mcn.2013.03.006.
79. Blechingberg J, Holm IE, Nielsen AL: Characterization and expressionanalysis in the developing embryonic brain of the porcine FET family:FUS, EWS, and TAF15. Gene 2012, 493:27–35.
80. Workman E, Kolb SJ, Battle DJ: Spliceosomal small nuclearribonucleoprotein biogenesis defects and motor neuron selectivity inspinal muscular atrophy. Brain Res 2012, 1462:93–99.
81. Douglas AG, Wood MJ: RNA splicing: disease and therapy. Brief FunctGenomics 2011, 10:151–164.
82. Smith RM, Sadee W: Synaptic signaling and aberrant RNA splicing inautism spectrum disorders. Front Synaptic Neurosci 2011, 3:1.
83. Husseman JW, Hallows JL, Bregman DB, Leverenz JB, Nochlin D, Jin LW,Vincent I: Hyperphosphorylation of RNA polymerase II and reducedneuronal RNA levels precede neurofibrillary tangles in Alzheimerdisease. J Neuropathol Exp Neurol 2001, 60:1219–1232.
84. Hong SK, Dawid IB: The transcriptional mediator component Med12 isrequired for hindbrain boundary formation. PLoS One 2011, 6:e19076.
85. Wang X, Yang N, Uno E, Roeder RG, Guo S: A subunit of the mediatorcomplex regulates vertebrate neuronal development. Proc Natl Acad SciUSA 2006, 103:17284–17289.
86. Zhou H, Spaeth JM, Kim NH, Xu X, Friez MJ, Schwartz CE, Boyer TG: MED12mutations link intellectual disability syndromes with dysregulatedGLI3-dependent Sonic Hedgehog signaling. Proc Natl Acad Sci USA 2012,109:19763–19768.
87. Mohibi S, Gurumurthy CB, Nag A, Wang J, Mirza S, Mian Y, Quinn M,Katafiasz B, Eudy J, Pandey S, Guda C, Naramura M, Band H, Band V:Mammalian alteration/deficiency in activation 3 (Ada3) is essential forembryonic development and cell cycle progression. J Biol Chem 2012,287:29442–29456.
88. Chen Y, Wan B, Wang KC, Cao F, Yang Y, Protacio A, Dou Y, Chang HY,Lei M: Crystal structure of the N-terminal region of human Ash2Lshows a winged-helix motif involved in DNA binding. EMBO Rep 2011,12:797–803.
89. Nicholas B, Rudrasingham V, Nash S, Kirov G, Owen MJ, Wimpory DC:Association of Per1 and Npas2 with autistic disorder: support for theclock genes/social timing hypothesis. Mol Psychiatry 2007, 12:581–592.
90. Yamamoto K, Shibata F, Miyasaka N, Miura O: The human perforin gene isa direct target of STAT4 activated by IL-12 in NK cells. Biochem BiophysRes Commun 2002, 297:1245–1252.
91. Shukla S, Oberdoerffer S: Co-transcriptional regulation of alternativepre-mRNA splicing. Biochim Biophys Acta 1819, 2012:673–683.
92. Kornblihtt AR: Coupling transcription and alternative splicing. Adv ExpMed Biol 2007, 623:175–189.

Stamova et al. Molecular Autism 2013, 4:30 Page 16 of 16http://www.molecularautism.com/content/4/1/30
93. Guffanti G, Strik Lievers L, Bonati MT, Marchi M, Geronazzo L, Nardocci N,Estienne M, Larizza L, Macciardi F, Russo S: Role of UBE3A and ATP10Agenes in autism susceptibility region 15q11-q13 in an Italian population:a positive replication for UBE3A. Psychiatry Res 2011, 185:33–38.
94. Baron CA, Tepper CG, Liu SY, Davis RR, Wang NJ, Schanen NC, Gregg JP:Genomic and functional profiling of duplicated chromosome 15 celllines reveal regulatory alterations in UBE3A-associated ubiquitin-proteasome pathway processes. Hum Mol Genet 2006, 15:853–869.
95. Basu SN, Kollu R, Banerjee-Basu S: AutDB: a gene reference resource forautism research. Nucleic Acids Res 2009, 37:832–836.
96. O'Roak BJ, Deriziotis P, Lee C, Vives L, Schwartz JJ, Girirajan S, Karakoc E,Mackenzie AP, Ng SB, Baker C, Rieder MJ, Nickerson DA, Bernier R, Fisher SE,Shendure J, Eichler EE: Exome sequencing in sporadic autism spectrumdisorders identifies severe de novo mutations. Nat Genet 2011, 43:585–589.
97. O’Roak BJ, Vives L, Girirajan S, Karakoc E, Krumm N, Coe BP, Levy R, Ko A,Lee C, Smith JD, Turner EH, Stanaway IB, Vernot B, Malig M, Baker C, Reilly B,Akey JM, Borenstein E, Rieder MJ, Nickerson DA, Bernier R, Shendure J,Eichler EE: Sporadic autism exomes reveal a highly interconnectedprotein network of de novo mutations. Nature 2012, 485:246–250.
98. Yamada M, Naiki H: Cerebral amyloid angiopathy. Prog Mol Biol Transl Sci2012, 107:41–78.
99. Ji L, Chauhan A, Muthaiyah B, Wegiel J, Chauhan V: Gelsolin levels areincreased in the brain as a function of age during normal developmentin children that are further increased in Down syndrome. Alzheimer DisAssoc Disord 2009, 23:319–322.
100. Furukawa K, Fu W, Li Y, Witke W, Kwiatkowski DJ, Mattson MP: The actin-severing protein gelsolin modulates calcium channel and NMDAreceptor activities and vulnerability to excitotoxicity in hippocampalneurons. J Neurosci 1997, 17:8178–8186.
101. Paunio T, Kangas H, Heinonen O, Buc-Caron MH, Robert JJ, Kaasinen S,Julkunen I, Mallet J, Peltonen L: Cells of the neuronal lineage play a majorrole in the generation of amyloid precursor fragments in gelsolin-relatedamyloidosis. J Biol Chem 1998, 273:16319–16324.
102. Vouyiouklis DA, Brophy PJ: A novel gelsolin isoform expressed byoligodendrocytes in the central nervous system. J Neurochem 1997, 69:995–1005.
103. Arun V, Wiley JC, Kaur H, Kaplan DR, Guha A: A novel neurofibromin (NF1)interaction with the leucine-rich pentatricopeptide repeat motif-containing protein links neurofibromatosis type 1 and the FrenchCanadian variant of Leigh’s syndrome in a common molecular complex.J Neurosci Res 2013, 91:494–505.
104. Kaya N, Colak D, Albakheet A, Al-Owain M, Abu-Dheim N, Al-Younes B,Al-Zahrani J, Mukaddes NM, Dervent A, Al-Dosari N, Al-Odaib A, Kayaalp IV,Al-Sayed M, Al-Hassnan Z, Nester MJ, Al-Dosari M, Al-Dhalaan H, ChedrawiA, Gunoz H, Karakas B, Sakati N, Alkuraya FS, Gascon GG, Ozand PT: A novelX-linked disorder with developmental delay and autistic features.Ann Neurol 2012, 71:498–508.
105. Vogl MR, Reiprich S, Kuspert M, Kosian T, Schrewe H, Nave KA, Wegner M:Sox10 cooperates with the mediator subunit 12 during terminaldifferentiation of myelinating glia. J Neurosci 2013, 33:6679–6690.
106. O'Roak BJ, Vives L, Fu W, Egertson JD, Stanaway IB, Phelps IG, Carvill G,Kumar A, Lee C, Ankenman K, Munson J, Hiatt JB, Turner EH, Levy R, O’DayDR, Krumm N, Coe BP, Martin BK, Borenstein E, Nickerson DA, Mefford HC,Doherty D, Akey JM, Bernier R, Eichler EE, Shendure J: Multiplex targetedsequencing identifies recurrently mutated genes in autism spectrumdisorders. Science 2012, 338:1619–1622.
107. Choi HK, Choi KC, Yoo JY, Song M, Ko SJ, Kim CH, Ahn JH, Chun KH, Yook JI,Yoon HG: Reversible SUMOylation of TBL1-TBLR1 regulates beta-catenin-mediated Wnt signaling. Mol Cell 2011, 43:203–216.
108. Rebenko-Moll NM, Liu L, Cardona A, Ransohoff RM: Chemokines,mononuclear cells and the nervous system: heaven (or hell) is in thedetails. Curr Opin Immunol 2006, 18:683–689.
109. Vargas DL, Nascimbene C, Krishnan C, Zimmerman AW, Pardo CA:Neuroglial activation and neuroinflammation in the brain of patientswith autism. Ann Neurol 2005, 57:67–81.
110. Sahin M: Targeted treatment trials for tuberous sclerosis and autism: nolonger a dream. Curr Opin Neurobiol 2012, 22:895–901.
111. Geschwind DH: Autism: many genes, common pathways? Cell 2008,135:391–395.
112. Onore C, Careaga M, Ashwood P: The role of immune dysfunction in thepathophysiology of autism. Brain Behav Immun 2012, 26:383–392.
113. Andersson O, von Euler G: Characterization and expression of the geneencoding membralin, an evolutionary conserved protein expressed inthe central nervous system. Brain Res Gene Expr Patterns 2002, 1:205–212.
114. Chen YC, Davidson B, Cheng CC, Maitra A, Giuntoli RL 2nd, Hruban RH,Wang TL, Shih IM: Identification and characterization of membralin, anovel tumor-associated gene, in ovarian carcinoma. Biochim Biophys Acta2005, 1730:96–102.
115. Sebat J, Lakshmi B, Malhotra D, Troge J, Lese-Martin C, Walsh T, Yamrom B,Yoon S, Krasnitz A, Kendall J, Leotta A, Pai D, Zhang R, Lee YH, Hicks J,Spence SJ, Lee AT, Puura K, Lehtimaki T, Ledbetter D, Gregersen PK,Bregman J, Sutcliffe JS, Jobanputra V, Chung W, Warburton D, King MC,Skuse D, Geschwind DH, Gilliam TC, et al: Strong association of de novocopy number mutations with autism. Science 2007, 316:445–449.
doi:10.1186/2040-2392-4-30Cite this article as: Stamova et al.: Evidence for differential alternativesplicing in blood of young boys with autism spectrum disorders.Molecular Autism 2013 4:30.
Submit your next manuscript to BioMed Centraland take full advantage of:
• Convenient online submission
• Thorough peer review
• No space constraints or color figure charges
• Immediate publication on acceptance
• Inclusion in PubMed, CAS, Scopus and Google Scholar
• Research which is freely available for redistribution
Submit your manuscript at www.biomedcentral.com/submit