Predicting outcomes for linguistically specific sentence treatment protocols

Seton Hall UniversityeRepository @ Seton HallSeton Hall University Dissertations and Theses(ETDs) Seton Hall University Dissertations and Theses
2011
Evaluating the Influence of Response toIntervention (Levels 2-3) with Racially, Culturally,Ethnically, Linguistically Diverse (RCELD)StudentsReina MartinezSeton Hall University
Follow this and additional works at: http://scholarship.shu.edu/dissertations
Part of the Bilingual, Multilingual, and Multicultural Education Commons, and the EducationalAdministration and Supervision Commons
Recommended CitationMartinez, Reina, "Evaluating the Influence of Response to Intervention (Levels 2-3) with Racially, Culturally, Ethnically, LinguisticallyDiverse (RCELD) Students" (2011). Seton Hall University Dissertations and Theses (ETDs). Paper 28.

Evaluating the Influence of Response to Intervention (Levels 2-3) with RACIALLY,
CULTURALLY, ETHNICALLY, LINGUISTICALLY DIVERSE (RCELD) Students
A dissertation submitted
Reina Martinez
Seton Hall University
in partial fulfillment of the requirement for the
degree of
DOCTOR OF EDUCATION in
EDUCATIONAL ADMINISTRATION
This dissertation has been accepted by the faculty of
Seton Hall University
Barbara Strobert, Ed.D, Mentor Charles M. Achilles, Ed.D
Debra Thomas, Ph.D Milagros Torres, Ph.D

SETON HALL UNIVERSITY COLLEGE OF EDUCATION AND HUMAN SERVICES
OFFICE OF GRADUATE STUDIES
APPROVAL FOR SUCCESSFUL DEFENSE
Doctoral Candidate, Reina Martinez, has successfully defended and made the required
modifications to the text of the doctoral dissertation for the Ed.D. during this Spring
Semester 2011.
DISSERTATION COMMITTEE (please sign and date beside your name)
Mentor: Dr. Barbara Strobert
Committee Member: Msgr. Dr. Charles Achilles &)
1
Committee Member: Dr. Debra Thomas -i-
Committee Member: Dr. Milagors Torres
1 Y /
External Reader: l
The mentor and any other committee members who wish to review revisions will sign and date this document only when revisions have been completed. Please return this form to the Office of Graduate Studies, where it will be placed in the candidate's file and submit a copy with your final dissertation to be bound as page number two.

MARCH, 20 1 1
Copyright 0 REINA MARTINEZ, 20 1 1

ABSTRACT
The purpose for this study was to determine the influence on achievement and
classification rate into special education of racially, culturally, ethnically, linguistically
diverse students following the use of a district-designed response to intervention (RtI)
structure by examining local processes that may contribute to student achievement and
classification rate into special education settings. Response to intervention (RtI) is a
structure created as a function of academic intervention to address students who are
experiencing academic or behavioral difficulties.
Achievement was measured by the scores attained by the students in grades 5-9
referred to IST on the New York State English Language Arts and New York State Math
Assessments and the rate of classification into special education.
This study was designed as a cross-sectional, descriptive, non-experimental
design (Type 2, Table 3) (Johnson, 2001). To explore the null hypothesis, separate
Repeated Measures of Analysis of Covariance (ANCOVA) were performed for the NYS
ELA and NYS Math Assessments, examining two points in time, the 2008-2009 and
2009-2010 school years. Quantitative data were collected from the district data
repository system and the New York State District Report Card Website.
The qualitative data were collected from voluntary district personnel through
open-ended interviews. The interviewees' responses were recorded and transcribed, then
analyzed using the Analysis of Competing Hypothesis (ACH) software. Results
indicated that referral to an Instructional Support Team (IST) did not have influence on
the achievement of the students referred. Regarding the classification rate of students
iii

into special education, results indicated that although the number of students classified
into special education has been declining in the district, the number of minority students
classified during the 2009-201 0 school years was disproportionate when compared to the
number of non-minority students referred to the committee on special education (CSE).
The results of the qualitative data indicated that the teachers interviewed were not
familiar with the RtI process and the administrators were not using the RtI process
consistently to address student academic andlor behavioral difficulties.
The influence of RtI was not significant. This can be attributed to the limitation of
four schools in one district, the diversity of the students, and the inconsistency in
implementation of procedures and processes of RtI.

ACKNOWLEDGMENTS
I am deeply grateful and appreciative to the following people and thank them
sincerely for all they have done.
Thank you to my advisor and mentor, Dr. Barbara Strobert, for your
unconditional support and encouragement and relentless determination to see me through
this process, and to Dr. Achilles, for your love of research, your advocacy for those who
are disenfranchised and marginalized in our schools, your commitment to me and
encouraging me to complete my study. I am grateful to Mrs. L. Weinbrook for all of her
help and support.
Thank you with my most heartfelt gratitude, Dr. Debra Thomas, for encouraging
me to begin this process and for being there for me with support and encouragement
every step of the way.
Thank you, Dr. Milagros Torres. Your encouragement and continuous support
have given me the inner strength to work on a day-to-day basis, and thank you, Dr.
Bernadette Casey. You have inspired, supported, and given of yourself at all times to
help me in every way.
Thank you to my Superintendent(s) for consenting to and trusting me to conduct
this study, and to the following:
District administrators and colleagues who provided me with the resources
needed to conduct my study.

My district friends, colleagues. and Seton Hall Cohort members, whose words
of support and encouragement instilled in me even more determination to
continue and see that the final product was complete.
All the participants who agreed to help me by volunteering their time to help me
conduct this study.

DEDICATION
To my husband, Harry, who encouraged me and had the faith in me to embark on
this journey. I thank him from the bottom of my heart. The personal and financial
sacrifices that we have endured have been many. Your support and continuous
demonstration of love and patience are a measure of true devotion.
To my three boys, Alberto, John, and Robert, remember you need to fly higher
than your mother. You have all been a source of inspiration, and I have tried to be a
role model to all of you. I am very lucky to have three wonderful, caring, and loving
boys. Siara, my hopes for you are for you to grow into a young lady who understands
the importance of gaining knowledge and serving others.
To my brother and sisters, especially, Julie, my nephew, Kevin, and the rest of my
family thank you for all your help, support, and unconditional love, and to my very
close friends who have supported and encouraged me and have cheered me through
the finish line.
vii

TABLE OF CONTENTS
... ......................................................................... ........................ Abstract .. ...ill
....................................................................................................... Acknowledgements v
........................................................................................ Chapter 1 Introduction 1
.............................................................................. Background for the study 1
.............................................................................. Statement of the Problem 1
................................................................................... Purpose for the Study 8
..................................................................................... Research Questions 9
................................................................................. Conceptual Framework 9
.................................................................................... Design of the Study 12
.............................................................................................. Procedures 13
............................................................................. Significance of the Study 14
........................................................ Limitations and Delimitations of the Study 15
...................................... Summary of Chapter One and Organization of the Study -17
................................................. CHAPTER 2 Relevant Research, Theory and Practice 20
................................................................................. Socio-cultural issues -21
............................ The Achievement Gap and RCELD students in Special Education 23
........................................................... RCELD Students and Special Education 25
............................................................................. Minority Student Identity 29
.......................................................................... Minority Disproportionality 33
Behavioral Issues and RCELD students ............................................................ 34
Language Diversity .................................................................................. ..37
.......................................................................................... Generation 1.5 37
viii

Parental Factors ........................................................................................ 38
................................................................. Response to Intervention Definition 39
....................................................................... Background and History of RtI 40
............................................................... IQ-Achievement Discrepancy Model 41
........................ A Tiered Pyramid: Theoretical Framework: Response to Intervention 42
Tier 1 or First Level ............................................................................. 44
Tier 2 or Level 2 ................................................................................. 45
..................................................................... Intervention Support Team 46
Tier 3 or Level 3 ................................................................................ -46
School Personnel and Implementation of the Pyramid as Response to Intervention ......... 46
.............................................................................................. Legislation 48
Summary of Literature, Theory and Practice ...................................................... 51
................................................................. CHAPTER 3 Design and Methodology -53
Research Design ...................................................................................... -54
.................................................................................................. Setting -58
Population, Sampling and Instrumentation ......................................................... 59
Methods ................................................................................................. 62
Research Questions ............. ... .............................................................. ...63
Question Numbers 1 and 2 ........................................................................... 63
Question Numbers 3 and 4 ........................................................................... 65
Research Procedures .................................................................................. 66
Validity and Reliability ............................................................................... 68
Summary of Chapter 3 ................................................................................. 68
CHAPTER 4 Analysis of Results ......................................................................... 70
Setting for the Study ................................................................................... 71

Data Analysis and Results .......................................................................... -78
.................................................................. Research question number 1 -81
Summary of Analysis for Question 1 ........................................................ 121
.................................................................. Research question number 2 123
.............................................................................. Questions 3 and 4 124
Research question number 3 .................................................................. 125
Research question number 4 .................................................................. 130
Summary of Chapter Four .................................................................... 140
CHAPTER 5 FINDINGS, CONCLUSIONS AND RECOMMENDATIONS .................... 142
Discussion of the Findings .......................................................................... 142
Findings ................................................................................................ 145
Influencing Factors ................................................................................. -150
Comparison to Previous Research ................................................................. 151
Conclusions ........................................................................................... 152
Recommendations .................................................................................... 155
For Policy .......................................................................................... -155
For Practice ......................................................................................... 156
For Future Research ............................................................................... 158
Summary ............................................................................................... 158
REFERENCES ............................................................................................. 160

APPENDICES
Appendix A Glossary of Terms .......................................................................... 168
Appendix B Teacher Interview Protocol ................................................................................ 174
Appendix C Administrator Interview Protocol ................... .. ....... ... ..................................... 176
Appendix D Seton Hall Institutional Board Review Approval ................................................ 178
Appendix E Solicitation Notice, Solicitation Letter and Volunteer Consent Form ................... 181
Appendix F District Approval to Conduct Study ........................................................................ 186
................ . Appendix G Permission Request and Letter Granting Permission From J Mahabir 188
Appendix H Cover Letter to Panel of Expert & Interview Protocol Assessment Form ............ 190
Appendix I Letter Requesting Permission and Granting Permission from Dr . Sugai Dr . Sugai's Pyramid of Intervention .......................................................... 191
Appendix J Teacher Interview Summary of Questions & Responses Table and Interview . . Transcriptions ............................................................................................ 194
Appendix K Administrator Interview Summary of Questions & Responses Table and Interview . . Transcriptions.. ................................................... ; ....................................... 214

LIST OF TABLES
................... Table 1 Descriptive student data enrolled in public schools in the United States 3
..... Table 2 Types of Research Obtained by Crossing Research Objective and Time Dimension 54
............................................... Table 3 District building breakdown and grades served 58
.......................................................... Tab1 e 4 Total District Enrollment by Ethnicity 59
................................................................... Table 5 School Personnel Participants 60
................................................................. Table 6 District Enrollment by Ethnicity 72
................................................................. Table 7 Profile of the Schools in District 72
............................................... Table 8 Academic Achievement Variables Descriptive -74
.............................................................. Table 9 Frequency SES group membership 74
...................................................... Table 10 Frequency Ethniciiy Group Membership 75
........................................................................ Table 1 1 Frequency Student Grade 75
...................................................................... Table 12 Gender Group Membership 75
......................................................................... Table 13 LEP Group Membership 76
................................. Table 14 Time Dimensions. Data Collection, Design, Data Analysis 77
............................................................. Table 1 5 ELA Scores Compared by Gender. 80
............................................. Table 16 Within-Subject Efects of' Change in ELA Scores 81
................................................. Table 17 Tests oj'Bet~.teen-Sttbjects of Gender on ELA 83
.......................................... Table 18 Descriptive. for Math Scores Compared by Gender 84
..................................................... Table 19 Within-Subject Effects of Change in Math 85
................................ Table 20 Tests of Between-Subject Effects of Change in Math Scores 88
............................................. Table 2 1 Descriptive For ELA Scores Compared by LEP 89
................................................ Table 22 Within-Subject Effects of Change in ELA LEP 90
.................................... Table 23 Tests oj'Behveen-Subject Effects of LEP on ELA Scores 93
............................................. Table 24 Descriptive For Math Scores Compared by LEP 94
Table 25 Within-Subject Effects of Change in Math Scores and LEP ................................. 95
Table 26 Tests of Between-Subject Eflects ofLEP on Math Scores ................................... 97
..................................................... Table 27 Descriptive for ELA Compared by Grade 97
Table 28 Within-Subject Ef icts of Change in ELA Scores and Grade ............................... 98
xii

....................................... Table 29 Tests of Between-Subject Effects of ELA and Grade 100
........................................... Table 30 Descriptive for Math Scores compared by Grade 101
.............................. Table 3 1 Within-Subject Efects of Change in Math Scores by Grade 101
Table 32 Tests of Between-Subject Effects of Grade on Math Scores ............................... 104
Table 33 Descriptive for ELA Scores Con~pured by SES .............................................. 105
Table 34 Within-Subject Efects of Change in ELA Scores by SES Interaction .................... 106
Table 35 Tests of Between-Subject Ej'ects of SES on ELA Scores ................................... 108
Table 36 Descriptive for Math Scores Compared by SES ............................................. 109
Table 37 Within-Subject Eflects of Change in Math Scores by SES interaction .................. -110
Table 38 Tests of Between-Subjects Ejfects of SES on Muth Scores by SES ........................ 113
Table 39 Descriptive.for ELA Scores Compared by Ethnicity ....................................... 114
Table 40 Within-Subject Eflects of Change in ELA Scores by Ethnicity ............................ 115
Table 41 Tests of Between-Subject Effects of Ethnicity on ELA Scores ............................. 117
Table 42 Parameter Estimates of Univui-iate Effects by Ethnicity ................................... 118
Table 43 Descriptive for Math Scores Compared by Ethnicity ....................................... 118
Table 44 Tests of Within-Subject Ejfects of Ethnicity on Math Score ............................... 119
Table 45 Tests of Between-Subject Effects of Ethnicity on Math Scores ............................ 121
Table 46 Special Education Enrollment for Grcrdes 5- 9. for 08-09-1 0 School Years ............. 123
xiii

LIST OF FIGURES Figure 1 Conceptual.frumework ........................................................................... 11
Figure 2 Topics explored in the Review of Literature ................................................... 50
Figure 3 Estimated Marginal Means of ELA comparing student gender ............................ 82
Figure 4 Estimated Marginal Means of Math comparing student gender ........................... 86
Figure 5 Estimated Marginal means of ELA comparing student LEP status (LEP to students
not considered LEP) .............................................................................. 91
Figure 6 Estimated iMclrginal Means of'Math comparing scores of student LEP status ........... 96
Figure 7 Estimated Marginal Means of ELA comparing scores by grade level ELA ............... 99
Figure 8 Estimated Marginal Means of Math comparing scores by grade level .................. 103
Figure 9 Estimated lMarginal Means of ELA comparing scores by SES ............................ 107
Figure 10 Estimated Marginal Means ofMath comparing scores by SES ......................... 112
Figure 1 1 Estimated Marginal Means of ELA comparing scores by ethnicity ..................... 116
.................... Figure 12 Estimated Marginal Means of Math comparing scores by ethnicity 120
Figure 13 Administrator Inconsistency Graph ......................................................... 127
Figure 14 Teacher Inconsistency Graph ...................... ; ......................................... 132
Figure 15 Pyramid used in one school in the district .................................................. 136
Figure 16 Pyramid used in one school in the district .................................................. 137
Figure 17 Pyramid used in one school in the district ................................................. 13 8
Figure 18 Pyramid of Interventions used in one school. for ELLS .................................. 139
xiv
CHAPTER I
INTRODUCTION
Background for the study
The minority population of the United States continues to rise, with its largest
minority group consisting of Hispanics (Campbell, 2009). In 2008, Hispanics comprised
15.1% of the United States population. A U.S. Census report released in the summer of
2008 indicated that by the year 2042, Hispanics will be the majority of the population of
the United States, The challenges associated with this increase in population are numerous.
'The challenges schools face to educate our racially, culturally, ethnically,
linguisticalIy, diverse (RCELD) students are many. They include unconscious race bias,
teachers lacking the skills to teach culturally and linguistically diverse students, resource
inequalities and power relationships between school authorities and minority parents
(Fiedler, Chiang, Van Haren, Jorgensen et al., 2008). The documentation of RCELD
students' academic achievement shows a significant gap on standardized test scores
beween minority and majority students, along with a high rate of suspension and dropout
rates among minority students, especially males (Artiles, Arzubiaga, King, & Harris-Murri,
2008).
Statement of the Problem
In 1984 a study conducted by Achilles, Faires, Campbell, Martin & Jackson found that
in the United States, there were students for whom the school system was not providing an
adequate program or environment. In their study Achilles et al. (1 984) affirmed that education
is society's institution, the school is its organization, and the school personnel (teachers and
administrators) are the individuals charged with the task of educating all. They further go on to

say that the ideal educational system should provide maximal opportunities for each
individual. Inadequate educational programs persist today and students who are racially,
culturaIly, ethnically and linguistically diverse are underachieving and are marginalized in our
schools. The actuaI situation is that our system has not attained the ideal for all individuals and .
struggles to find ways to make it an ideal system for all.
Changes in the American perception of who gets educated and how they get educated
are determined by socio-economic, social mobility, racial composition, and policy decisions
factors. Consequently, policy makers, educators, enhanced accountability mandated at the
national and state level, public awareness of how schools should be reformed, adequate student
assessment, the conditions of poverty and the widening of the achievement gap between
RCELD (racially, culturally, ethnically, linguistically diverse) students and their White
counterparts are all implications affecting education and must be considered as the minority
population in this country increases. The majority of RCELD students continue to be
marginalized and disenfranchised in our schools. When compared to White students, they are
underachieving, and often they are placed in separate settings and in many cases mislabeled
when they show difficulty mastering the information and skills schools value. Thus, it is
crucial that educators understand that when students experience academic challenges and/or
behavior problems, it does not mean they should be labeled as having a learning disability
(Harry & Klingner, 2007).
RCELD students, specifically males, earn lower grades, are represented in special education
programs, receive disciplinary referrals, and have higher high school dropout rates than their White
counterparts. The documentation of minority males' academic achievement shows a significant gap
on standardized test scores between minority and majority students, along with the continued high

rate of suspensions and dropouts among minority males (Artiles, Arzubiaga, King, & Harris-Murri,
2008). High schooI drop out rates in turn have been linked to incarceration rates.
The underachievement and the representation in education of RCELD students are among
the most important and enduring problems in the field of education. In an article titled "Turnaround
or Full Speed Ahead?'(201 O), House Committee members raised concerns regarding the number of
schools that are underperforming. In his opening statement, Chairman George Miller addressed the
dropout crisis and schools that have failed to turn around. "Turning around our schools is critical
for our economy, our communities, and our students" (Alliance for Excellent Education, 201 0).
Table 1
Descriptive Student Enrollment Data in Public Schools in the United States
Alliance for Education, 2010
Ethnic Group 1998 2008 White 62% 55% African - American 17% 16% Hispanic 15% 22% Other 5% 7%
Indicator 4: Condition of Education, 2010 (U.S. Department of Education, 2010)
Table 1 presents the growth of our minority population in schools throughout the United
States. The growth of RCELD students in our schools has implications for the future of this
country
A social or economic crisis of a large magnitude in this country may ensue when
a significant number of our minority students are underachieving in school, The social
and economic repercussions could be devastating for the future of the United States and
its standing in the global economy.

The Commission on Excellence in Special Education was created by President
Bush (2004) to ensure that every child is learning regardless of race, family background,
or disability status. No Child Left Behind (NCLB) and Individuals for disability
education act (IDEA) legislation have been enacted in response to concerns about the
increase in the number of students identified with a specific learning disability (SLD) and
the perceived limitations of the discrepancy model.
Congress defined SLD as a disorder in one or more or the basic psychological processes involved in understanding or in using language, spoken or written, which may manifest itself in an imperfect ability to listen, think, speak, read, write, spell, or to do mathematical calculations. The term includes such conditions as perceptual handicaps, brain injury, minimal brain dysfunction, dyslexia, and developmental aphasia. The term does not include children who have learning problems which are primarily the result of visual, hearing or motor handicaps, of mental retardation, or emotional disturbance, or of environmental, cultural, or economic disadvantage (U.S. Office of Education, 1977,65083).
As specified in the federal guidelines that accompany the federal law, state and local educational agencies have the responsibility of operationalizing these guidelines (2007, 13). There are three general criteria used by most states for identification of individuals with learning disabilities.
1. A significant discrepancy between intellectual ability and academic performance in at least one area of academic functioning listed in the definition.
2. Documented needs for services based on achievement below what would be expected for the child's age, grade level, or both.
3. Evidence that the learning disability (LD) is not primarily the result of visual, hearing or motor handicaps; mental retardation; emotional disturbance; or environmental, cultural, or economic disadvantage (U.S. Office of Education, 1977).
The discrepancy model, also referred to as the "wait-to-fail model" (Harry,
Klingner & Cramer, 2007), since it is often not until the child is about nine years old
when a reading delay will be sufficiently behind the chronological age expectation to
qualify him or her for the required discrepancy, resulting in delayed implementation of

appropriate educational interventions for the child (2007, 13). The discrepancy model
uses norm - referenced assessments to evaluate students' labeling of SLD or placement
into a special education program. These tests have been found to be culturally biased
(PCESE, 2002, Fuchs & Fuchs, 2005, Vaughn & Fuchs, 2003).
Additionally, federal legislation that holds educators accountable for the
performance of all students has been continually reformed. As a result, educators are
expected to report results for specific subgroups, such as RCELD and special education
students. The provision of special education services under U.S. law-the Education for
All Handicapped Children Act, 1975, and the IDEA, 2004-ensured that schools no longer
marginalize students on the basis of perceived developmental, sensory, physical, or
cognitive limitations.
Harry and Klingner (2006) posited that this law focused on the disability existing
within a child and therefore the main criterion for eligibility for special education
services has been proof of intrinsic deficit. The law's provision of disability categories
for students who have learning and behavioral difficulties has become a way for schools
to turn away from their responsibility to provide high quality education. Harry and
Klingner (2006) quoted Reid and Valle (2004), "Why can't students' difficulties and
challenges be seen as human variation rather than pathology?" (2006, 5).
The recommendations and policy changes enacted by the Federal Government
and the U.S. Department of Education of Special Education Programs, include the
following: a) a focus on results, not just process; (b) embrace a model of prevention, not a
model of failure; and (c) consider children with disabilities as general education students

(Martinez, 2006). These three points supported a response to intervention (RtI)
framework for the labeling and misplacing students into special education settings.
The reauthorization of IDEA (2004) allows for a change in the discrepancy model
by recommending tiered interventions by which schools can identify students when they
begin to show signs of difficulty and provide intensive and individualized instruction
without mislabeling them. IDEA articulated that in determining special education labeling
and placement for students, states, not local educational agencies (LEAS), must mandate
the use of a severe discrepancy between intellectual ability and achievement criterion
(Martinez et al., 2006,3). Under these regulations states must allow a process based on a
child's response to scientific, research-based intervention, a tiered approach known as
Response to Intervention (RtI) (Spiegel, 2009).
Response to intervention is a structure created as a function of academic
intervention to address students who are experiencing academic andlor behavioral
chaIlenges. RtI is a problem-solving structure used in schools, a term created by Frank
Greshman (2003).
Wright (2007) asserted that educators must rise in support of the large number of
academically marginal and disenfranchised students in their classrooms. He further stated
that intervention resources must be implemented, but often they are limited and that when
assistance is provided, it is poor and too late to benefit the student. Intervention resources,
such as individualized instruction that might be effective if given at the point when
struggling learners begin to fall behind, are often compartmentalized, not systematic, and
kept off-limits to those students until they experience profound and chronic failure.
Schools need a model for providing early intervention that delivers efficient and effective

assistance to at-risk learners to close the gap of skills or performance with peers (Wright,
2007).
To improve education outcomes for RCELD students, personnel in the district
used in this study have been working closely with the Technical Assistance Center at
New York University (TAC) in implementing an RtI structure to address issues involving
students in its schooIs. The RtI model emphasizes intervention and prevention when
students begin to show signs of academic and social/behavioral failures or are not
learning at the same rate as their peers. The central issue of the aforementioned RtI
structure is the determination of "adequate" or "inadequate" response to intervention. A
number of experts (Denton, Vaughn, & Fletcher, 2003; Vaughn and Fuchs, 2003) posited
that struggling learners must receive highly effective, proven instructional practice, and
their progress must be monitored frequently.
The RtI-TAC (Response to Intervention-Technical Assistance Center) is part of
the New York State Education Department personnel's strategy to promote and build
school district capacity to implement a systematic, response to intervention process that
begins with appropriate core instruction, early screening, and identification of students
who are struggling in academic and/or behavioral areas, Continuous monitoring of
progress and how well these students respond to changes in targeted instruction to
address their learning needs is also an essential component of the RtI structure. To
ensure that underachievement in a student suspected of having a learning disability is not
due to lack of appropriate instruction in reading, effective July 1,201 2, school districts in
New York State must have an RtI process in place as part of their process to determine if
a student in grades K-4 is a student with a learning disability in the area of reading.

Supporters of RtI espouse the belief that the structure has the potential to reverse the
trends of concern present in the data on special education referrals and determination of
eligibility (Spiegel, 2009).
The Response to Intervention structure initiated in the district under study needs
to be examined to determine whether or not those with the task of its execution are doing
whatever it takes to ensure that RCELD students are not neglected.
Purpose of the Study
The purpose in conducting this study was to examine the influence of a school-
designed RtI structure on the achievement of and classification rate of RCELD students
into special education by exploring a local school district's processes that influence
student achievement. Achievement was measured by the raw scores attained by the
students referred to the instructional support team (IST) on the New York State (NYS)
English Language Arts (ELA) and NYS Math standardized assessments. In doing this
analysis, this researcher's objectives were to describe a phenomenon and document the
characteristics of the phenomenon by conducting a non-experimental research study
(Johnson, 200 1).
In quoting Richards et al., (2007), Spiegel, (2009) cited that research on RtI has
been conducted mostly at the elementary level and has focused on reading intervention.
Klinger and Edwards (2006) stipulated that the interventions used within the RtI structure
have not been validated with RCELD populations and further added that RtI alone is not
sufficient in determining the presence of a learning disability. This research addresses the
middle and secondary grades, and it focuses on the achievement of students referred to
the RtI (Levels 2-3) and the involvement of school personnel in the RtI process. The task

of implementation and the level of involvement in sustaining an RtI initiative are focal to
the work of the instructional leader (the building principal), and the classroom teachers.
Research Questions
The research questions that guided this study were:
The Null Hypothesis No states that RtI had no influence on the achievement of
RCELD students in grades 5-9.
1. How has achievement of RCELD students been influenced following the use
of a district-designed pyramid of intervention, as defined by scores attained on the
NYS English Language Arts (ELA) and NYS Math assessments in grades 5-9
1
during the 2009-20 10 school year?
2. How has the classification rate of RCELD students into special education
been influenced following the use of the implementation of a district-designed
intervention model in grades 5-9 during the 2009-201 0 school year?
3. How has the building administrator been involved in the implementation of
the district-designed intervention (RtI) model?
4. How have the teachers in their respective buildings used the district-designed
intervention (RtI) model?
Conceptual Framework
One study in particular conducted by Joseph Mahabir (2009) was to investigate,
analyze, and examine the process by which students were referred for special education
by teachers and to determine if the processes employed by the district were aligned and in
compliance with state and federal mandated procedures, Mahabir's study (2009) in

conjunction with George Sugai's (2007) research, an RtI pyramid presented for the
National Summit on Shared Implementation of IDEA, were used as the groundwork for
this study. The classroom interventions used by teachers before the referral process were
also examined. Mahabir's study expounded on the federal concerns over the educational
ability of culturally and linguistically diverse students with disabilities to obtain a high
quality education. RCELD students have been disproportionately represented in special
education programs such as self contained classes. Mahabir described three theories that
provided an understanding of how overrepresentation of RCELD students occurs (2009,
Functional theorists espouse the belief that deviation from the norm in regular education is regarded as a reflection of deficits or pathologies inherent in the student. When students fail in the regular education environment they are perceived as having deficits and therefore special education placement is seen as the answer for their academic or behavioral challenges. The critical theorists support the premise that education is designed to serve the needs of the dominant social, economic and political classes and special education is designed to place minority students in a system of education that is compartmentalized and devalued. Critical theorists maintain the belief of a separate "special" educational system as being unjust to minority students and the regular education system as catering to the needs of the dominant social, economic and political classes of society. The widespread use of achievement testing continues to expand the development of a body of educational theorists who subscribe to the deficit model. Education has been subjugated by the question of how to deal with students who fail in the regular education setting with rigor and respect. Two different responses have been manifested; one has been to focus on the student and his family to identify cognitive, social, emotional or linguistic deficits and the second has been to focus on the outside environment in which the student survives to determine a cause for his failure. In addition, Mahabir (2009) quotes the work of Heller, Holtzman, and Mesnick who stated that disproportionality becomes a problem, when students are exposed to the likelihood of special education placement by virtue of receiving poor-quality regular instruction, and when the quality and academic relevance of the special education instruction block their educational progress, including decreasing the likelihood of their return to the regular classroom (Mahabir, 2009, 13-16).

I Problem Solving Conceptual Framework I ~ d l c l e s Research based
Edutatan
representation Into
speclal educmlon prosrams - settlryls, dlsclpllnary referrals
Resp0~e to Inte I PyramldStructure
Components
Genersl Ed leafher lnltlates LSTreferral pro-
Inwokedad cornmltted to all areas of students' acadernlc success
Led by best rcresrch on student learnlng and bulldng temchar efflcery
Artlcubte m v l s l o ~ s t m ~ mrnmunlcatlon
Make declslons based on data
Know who tho student population !s and
understends dlversa nee& - .-
Student be&tnlng to f show di(n.9 o t
acadenk~hav lora l dlfflcully I,=> !
General classroom
i teacher assesses problem, lmplmenta stretegles and rnonltors studenrs pragre~s
How Is student
progresalng?
I Haw 1s student 1ST Proces begins!
progressing? I Oubmrnes Ibr Improvement are set
Ivategles, research based
programs recommsnded
Progress Monltorln@- a tlmellne to meetcutcomes lo
-
L-,
Uadfledar found lnellglble for Speclal E d Serwlces/placement
clawcam pmct lw and contlnue to rnonltor progress
--- I Were the ecdemlc or I
dlfflculty problems Contlnw Interwntlm
addressed by the IST?
Recornmendntlan to CSE --evaluetlons performed - psychologfcal, soclobglcal, soclsl history, educatlanal (knowledge mcqulnd and owned overs perlad cf t h e
Figure 1
A Problem-Solving Conceptual Framework Used in Constructing the Basis for This Study

Figure 1 presents a problem-solving conceptual framework of the policies; people
who influence and make decisions about education opportunities for students. The figure
also shows the trajectory of RtI when a student begins to show academic difficulty or
behavioral difficuIty that may lead to referral to IST and eventual classification.
Design of the Study
The researcher used a cross-sectional descriptive non-experimental research
design (Johnson, 2001) that employed mixed (quantitativelqualitative) approaches that
drew from conversations with school personnel involved in the general and special
education process and the examination and presentation of district data collected on
students who were referred to the Instructional Support Team (IST), Level 2 of the RtI
pyramid during the 2009-2010 school year.
The researcher studied several areas: the number of RCELD students in grades
5-9 referred to IST, their demographic data, and socio-economic status (SES). The study
also gathered data on the number of students who were referred to the Committee on
Special Education (CSE) for classification during the 2009-2010 school year. This
process involved gleaning whether there was a particular pattern by race, culture,
ethnicity, or language diversity that may indicate an area of the referral process that
needed further exploration.
District and state data were collected on students to determine what, if any,
influence on achievement, as measured by the scores attained on the NYS ELA and Math
assessments, pre and post interventions had on the outcomes for students referred to IST.

Data were also collected on students who were referred to the Committee on Special
Education (CSE) and what the outcomes or eventual placement for students referred to
this level were. Level 3 of the RtI pyramid of intervention is where CSE conducts its
reviews of students referred. Data gathered through open-ended questions from district
personnel interviewed were analyzed to determine the level of involvement of the
processes followed in the schools to implement RtI structure through the lens of a single
district in the Hudson Valley, New York State.
Procedures
To answer the research questions, a cross-sectional, descriptive, non-
experimental, research design that used mixed methods involving the concurrent
collection of qualitativelquantitative data was employed. This design incorporated the
collection and analyses of qualitativelquantitative data to answer the research questions.
The quantitative portion of the study consisted of the collection and analysis of
district data to present a picture of the achievement, as measured by the NYS ELA and
Math standardized assessments, of students referred to the instructional support team
(IST) and the number of students who went to the committee on special education
(CSE). The quantitative portion of this study included district data collected from 2008-
2009 and 2009-2010 school years from students in grades 5-9 who were referred to IST
to determine what, if any, influence IST had on the achievement of students referred.
The other portion of the data included the number of students referred to the CSE and
what their eventual outcomes were.
The use of qualitative and quantitative methods provided a holistic portrayal of
the impact of the district implemented RtI structure. The qualitative portion of this study

included structured interviews with open-ended questions and probes, which according to
Patton (20021, produced in-depth responses about the teachers' and administrators'
perceptions, opinions, and knowledge about the district-designed RtI model (Wright,
2007). Qualitative methods are often used to tell a program's story.
To recruit participants for the open-ended interviews, the researcher contacted the
building administrators to request permission to conduct the study and each administrator
contacted the teacher participants. District data from numerous sources were collected:
the District Data Repository, New York State Education Department website, and Basic
Educational Data Systems (BEDS). Permission was requested from and granted by from
the Superintendent of Schools to conduct this study and collect district data.
Significance of the Study
In this study, the researcher considered New York State mandates under federal
legislation such as the No Child Left Behind Act (NCLB) and IDEA that have identified
a number of districts with high numbers of RCELD students labeled or placed in
alternative settings. Under these mandates school districts are required by the state to
implement systematic plans and interventions to address issues of representation in
special education settings and representation in disciplinary referrals and students
referred for disciplinary actions.
The findings from this study should bring attention to an issue of educational
importance: the underachievement and overrepresentation in special education,
alternative settings, discipline referrals, and classification rate of students referred to
special education in the district. School personnel are pivotal in educating these
students.

As Artiles et al., (2008) presented, in the past educators have placed blame on
RCELD students when they underachieved or failed to progress by placing them in
alternative settings or retaining the students in grade. Educators have often thought that
RCELD students need more time to catch-up, need a separate location and a special
education teacher to provide them with the support that the general education teachers
feel they cannot provide. According to Artiles et al. (2008), these responses have
exacerbated the problem and have not ameliorated this conundrum for RCELD students.
These practices have continued to perpetuate the marginalization and disenfranchisement
of students, not to mention the financial burden imposed on school districts.
In addition, study results may indicate how well practitioners, school
administrators, and policy-makers provide feedback on whether or not an intervention
model is working to help address the numbers of minorities who are underachieving in
schools. The issue of marginalization and disenfranchisement of RCELD learners is
important, and there is a scarcity of research information on how RtI influences academic
outcomes, specifically during middle school and beyond. This study can be a valuable
addition to the research literature. Much of the work that has been done on RtI has
focused on the needs of students at the elementary level, leaving a gap in the literature for
educators who work with students at the middle and secondary levels (Spiegel, 2009).
Limitations and Delimitations of the Study
A delimitation of this study was that it was conducted in one district in New York
State, and the findings may not be representative of all districts.
The researcher used information from three middle schools (grades 5-7) and the '
secondary school (grades 8-9). The schools in the district designed their own RtI

structure, also referred to as a pyramid of interventions framework. The pyramids'
interventions may differ from school to school. The choice to conduct the study in all
middle schools and the secondary school in one district was due in part to the differences
in RtI frameworks in each of the schools. The involvement of the building administrator
and other school personnel is important to the influence of this framework on student
achievement. Data were collected from all four schools, and the findings may not be
representative of other schools and school districts. The interviews conducted and the
responses represent the views of the group participating in this study; therefore, their
responses should not be considered as representative of the views of all general
classroom teachers or an adequate representation of all general and special education
programs in the district or other districts.
The researcher delimited the study to the population of students who were
referred to IST during the 2009-2010 school year. The data used to measure achievement
were the raw scores of the NYS English Language Arts (ELA) and Math assessments
attained by the students referred to IST. The researcher also delimited the population to
the building administrators in the four schools and teachers to a random sample of regular
and special education classroom teachers of grades 5-9. Finally, the researcher delimited
the analysis to the quantitative data obtained from the district for the school years 2008-
2009 and 2009-2010 to present a picture of the achievement and representation of
RCELD students referred to CSE and the outcomes of their referrals.
The demographics of the population of the district under study was a limitation of
this research. The RCELD learners in grades 5-9 was the major group studied. Other
participants included a random sample of classroom teachers who teach grades 5-9 and

one building administrator from each building. The data collected from the district and
New York State Education Department included the total population enrolled in special
education in one district and included a breakdown of demographics and enrollment of
students in special education by disabilities. Other data collected included information
specific to students who had any type of intervention.
In addition, the interviews conducted and the subsequent responses represented
the views of the teachers and administrators participating in this study. Thus, the findings
may not be representative of how the classroom teachers in the other buildings in the
district are using the designed intervention structures. The pyramids were based on the
RtI model and then modified by the personnel of each school. Subsequently, there is
variation in interventions and strategies used at each tier (Figures 15, 16, 17 and 18).
Summary of Chapter One and Organization of the Study
The first chapter presented a growing phenomenon; the underachievement of
RCELD students and the proportion of RCELD students underachieving and being
placed in special education settings. This chapter included the purpose of the study, the
background of the study, the significance of the study, the research questions,
delimitations and limitations of the study, and the significance of the study as related to
policy makers and educators in this country. The glossary of terms can be found in
Appendix A. Since the issue of education outcomes of RCELD students is important and
there is a scarcity of research information on the topic of RtI and its influence in
educational outcomes for these students, this study can be a valuable addition to the
literature.

Chapter 2 presents a review of research of literature, theory, and practice
pertaining to the proportion of RCELD students placed in special education, referred for
disciplinary actions and placed in alternative settings. In the literature review the writer
discusses the factors that influence the reform efforts introduced by the passage of Iaws to
address the issue of disproportionality as it relates to the educational achievement of
RCELD students in special education, referred for academic and behavioral issues. This
section also presents a historical description of the Response to Intervention structure and
an analysis of practices implemented by the Federal government to rectify and address
this phenomenon. A theoretical framework for the study is derived from material
presented in Chapter 1 and Chapter 2.
In Chapter 3, the researcher explains the design of the study in conjunction with
the methods and procedures through which the data were collected and analyzed.
In Chapter 4, the researcher provides the data used and the analyses employed.
The responses to the interview questions were transcribed and analyzed for patterns and
themes from answers provided in the interviews to ascertain how the classroom teachers
were using a district designed intervention structure and how effective the pyramid of
intervention has been in addressing the representation of RCELD students in special
education. District data were obtained through the district's data repository, the NYSED
department website's report card and Basic Educational Data System. These data were
collected for any student who had IST intervention to determine if there were any
changes in achievement or classification status. District data were analyzed to establish
whether or not RtI has had any influence on the achievement and rate of classification of
RCELD students and their education outcomes.

In Chapter 5, the researcher provides a summary of the findings presented in
Chapter 4, conclusions and discussions relating the results of this study to the literature
review and previous research findings. Recommendations for practice, policy and M e r
research are included in Chapter 5.

CHAPTER 2
RELEVANT RESEARCH, THEORY AND PRACTICE
An effort was made to gather information from scholarly journals and dissertations to get
an understanding of the topic and the information available. Computer data bases were searched
on the Seton Hall University Library Website. The data bases accessed included ERIC and
ProQuest. In addition, articles from the Teachers College Record, Review of Educational
Research, Exceptional Children, Journal of Special Education, Childhood Education, National
Association of Secondary School Principals, Learning Disabilities Research and Practice,
Journal of StaffDevelopment, Teaching Exceptional Children and dissertations and dissertation
abstracts. U.S. Department of Education websites were also perused for information on the topic
of minorities, education, minorities in education, and the state of education in the United States
for minority students. Furthermore, the NYS TAC-RTI and the NYSED data bases and websites
were also researched. The terms used in the search for sources included the following: special
education, minority students, Hispanic males, African-American students, males in special
education, education achievement of minority students, response to intervention, education and
poverty, literacy and minority students, school leadership, culture and education outcomes,
strategies for minority students, parent involvement and student success, the achievement gap,
disproportionality, overrepresentation and minority students, and language diversity. These
searches produced a myriad of material that provided the researcher with a strong research-based
foundation to write the relevant review research and practice.
In this chapter, the researcher reviewed research, theory, and literature as they relate to
the achievement and representation of RCELD students in education. Stokes (1997) stipulated
that educational research in the United States fits with ccPasteur's Quadrant," defined as

educational research aimed to build fhdarnental theory while addressing practical problems of
the world. Educational research has had a history of impacting the quality of learning
opportunities for youth, particularly those who have had to face persistent intergenerational
challenges due to race, ethnicity, poverty, gender, and disability. The challenges faced by
RCELD students are; institutional and structural, rather than systemic, and cannot be attributed
to a single cause (Lee, 2008,798). Lee also posited that education research in the United States
has been limited by two factors; the first one has been a history of deficit assumptions rooted in
conceptions about race, and the second factor has been an education apartheid in which academic
disciplines and conceptual traditions are not synchronized with one another (Lee, in press).
Minority students are often disproportionately represented in school settings and
programs that may deny them the opportunity to advance into a more rigorous curriculum that
would pIace them on track to a college education. Disproportionality is the inappropriate over-
representation and over-identification of ethnic minority children in special education. RCELD
students are also overrepresented in discipline and suspensions, alternative academic placements,
and high school dropout rates. In addition, they are underrepresented in honors, gifted and
talented, advanced placement courses, and higher education enrollment. There is a discussion of
disproportionality as a growing phenomenon and how it is a systemic issue in our schools. U.S.
public schools continue to grapple with conceptions of equality. Minority students and White
students have continued to receive unequal educational experiences.
Socio-cultural issues
An article by Janzen (2008) titled "Socio-Cultural Issues and English Language
Learners" presented several key findings. In a five-year study examining the efficacy of
different types of programs offered to ELL'S Thomas and Collier (2001) examined over

2 10,000 students across the country and found that most types of programs failed to bring
students to average levels of achievement on standardized reading tests. They also stated
that failure or stress were clearly multi-dimensional, ranging fiom institutional practices
such as academic tracking (Janzen, 2008; Callahan, 2005; Sharley & Layser, 2000) to
students' level of first language literacy to issues of poverty. One critical issue is that
teachers are not prepared to work with non-native English speakers. A national survey
determined that 41 percent of teachers have ELL'S in their classes, but only 12 percent of
those teachers had had eight hours or more of training on how to assist these students.
Another study, in which 200 teacher participants in several states were canvassed,
reached a similar conclusion that the majority of these teachers taught ELL students but
had not received the proper training to help them (Janzen, 2008).
Contemporary education reforms espouse inclusive education as a basic premise; schools
are about belonging, nurturing and educating all children and youth, regardless of differences in
culture, gender, language, ability, class, and ethnicity. Inclusive education transforms education
systems by offering alternatives to placement in general education classrooms (Artiles &
Kozleski, 2007; Artiles et al., in press). We should seek opportunities to strengthen and improve
access, opportunity and quality in our schools by targeting issues related to education equity.
Legislation and reform efforts have been enacted on a national level mandating state education
departments and local districts to implement practices to address issues of disproportionality.
Hilliard (1 998) stated that assessment practices in general fail to account for the
functioning of systems of oppression.

Forty years after Brown, Hilliard stated:
When children do not learn, systems are deficient. The race of the child does not tell us anything about the child's mental capacity to succeed in schooI. Socio-economic status is not a barrier to learning, if the student is exposed to good teaching. Racism and bigotry are negative factors in teaching and learning. Our children are not succeeding mainly because the masses of them have been abandoned. The courts can mandate physical desegregation, but not an educational environment that is high quality and nurturing. (Lee, p. 8 10)
Culturally responsive schooling has been a substantial and growing body of
research and discourse focused on cultural differences and on improving the academic
achievement of youth who are not part of the dominant group in the United States.
"Students of color and students from low socio-economic backgrounds consistently and
persistently perform lower than their peers according to measures of school achievement
because their home culture is at odds with culture and expectations of schools"
(Castagno, McKinley Jones Brayboy, 2008).
The Achievement Gap and RCELD students in Special Education
The problem addressed in this study is the underachievement and representation of
RCELD students in special education. The achievement gap, as defined by Anderson, Medrich
and Fowler (2007), referred to the differences in scores on state and national achievement tests
between various demographic groups. The achievement gap is of concern between RCELD
students and their White counterparts. Gardner (2007) offered possible causes of the
achievement gap between subgroups and the dominant White student population. These include
low socio-economic status, school funding, the belief that minority students are less intelligent
and less capable, unvalued cultures, parents' negative school experiences, racism, minorities'
external locus of control, and student identity.

The representation of ethnic and language minority students in self-contained special
education classrooms has raised civil rights and education concerns. Despite the legislation
action of Brown vs. Board of Education to provide equal access to education, institutional
structures, such as ability grouping and separate special education institutional
structures, continue to keep minority students segregated from their White peers (Skiba et al.,
2008). Schools in the United States have large populations of students who struggle to achieve
and require some degree of individualized assistance. According to the U.S. Department of
Education (USDOE), about 5% of students in grades 9-12 drop out of school and approximately
10% of the students in this country receive special education services. About half of the special
education population nationally is identified as learning disabled (LD). This number has doubled
since 1980 (Wright, 2007).
In a briefing to members of the U.S. Commission on Civil Rights, expert panelists
discussed the nature, extent, and possible causes of misplacement of minorities, specifically
Blacks, Hispanics, Native Americans and Limited English Proficient (LEP), in special education
programs at a higher proportion than the general education student population (US Commission
on Civil Rights, 2007). English Language Learners (ELLs) currently represent at least1 0 percent
of all students nationwide, and their numbers are likely to increase because of the projected
growth of the Hispanic population (Campbell, 2009). According to U.S. Census figures, 11
million elementary and secondary students of immigrant families were enrolled in public schools
in October 2005, representing 20% of all students (Gandara & Rumberger, 2009). Most of these
students enter school as English Language Learners (ELLs), and most ELLs initially have
exceptionally low performance on measures of academic achievement and attainment.

RCELD Students and Special Education
The high classification numbers of individuals with learning disabilities has received
attention from the USDOE. In its twenty-second annual report to Congress, it drew attention to
the increased identification of students with learning disabilities. Information on race and
ethnicity of students with disabilities were included in this report (Mahabir, 2009).
The issue of representation of minority students in special education has been well
documented in the research and was officially acknowledged thirty-eight years ago. Minority
males drop out of school more frequently, face higher rates of unemployment, and are
incarcerated at disproportionate rates compared with their White counterparts. In addition,
students from low socio-economic status backgrounds were three times more likely to drop out
of school. Jordan and Anil(2009) hypothesized that the odds of a student referral for
disciplinary action increases in the middle grades if the child is male, a minority, in special
education, or is poor.
In a review of the book Why Are So Many Minoritv Students Failing in Special
Education?, Trainor (2008) extracted the results fkom Klinger's ethnographic study on
disproportionality. The results provided evidence for two principal arguments: (a) identification
of disability is biased and flawed and (b) the use of disability labels does little to help educators
provide effective instruction for children. Special education does not address cultural differences
(Trainor, 2008).
Carlysle (2007) underscored the phenomenon of over-representation of minority students
in special education and their placement into special education programs without accurate
evaluation. According to Carlysle (2007), representation of minority students had been
increasing and was the result of a series of social processes that had resulted in inevitable

outcomes of real conditions, such as finance and education policies, racial, ethnic and language
diversity and lack on the part of educators to understand and teach students who are different
from the majority students. The author interpreted the special education problem by focusing on
the individuals who had been part of the student's life: administrators, teachers, and parents and
their political-personal agendas.
Artiles, Klingner and Tate (2006) inferred that disproportionate placement of minority
students is attributed to presenting conventional visions of human development in which culture,
ideology, history, and power play influential roles. Blanchett (2006) documented that structural
systems of disadvantage mediate the special education placement of minority students. The
focus of the National Center for Culturally Responsive Educational Systems (NCCREST) was to
affirm the significance of disproportionate representation, which has become a national problem
affecting our minority students. What studies have failed to show is "the how and why" of over-
representation, to pinpoint the reasons why minority students have been underachieving and have
been over-represented in special education. Minority students are also overrepresented in the
application of discipline referrals, school suspensions, and alternative placements.
The court cases, Milliken vs. Bradley (1 994) and Milliken vs. Bradley I1 (1997) shaped
the creation of new discourses by conceptualizing and transcending oversimplifications in the
explanations of disproportionate representation. These cases address the theoretical poverty of
the scholarship traditionally used to examine complex notions such as culture and its role in
human development. Furthermore, educators should engage in interdisciplinary discourses to
understand and address this problem. Until the present (2010), efforts have been limited in
addressing the real conditions that affect the achievement gap of RCELD students. Educators
must extend these discourses to address larger systemic issues.

Special education placement is the route that many teachers take when students are not
performing in their classes. Special education is regarded as a "fix it all" solution by many
educators for students whose needs exceed the skills or time constraints of the regular classroom
teacher. They say that placement in special education will help the student get what he needs to
succeed. The process of decision making in special education is biased because of the
subjectivity inherent in the process. The presence of bias is defined when capricious referral
practices are used or reluctance to refer has been demonstrated. The referral process is a major
factor contributing to the disproportionate placement of culturally diverselminority students in
special education classes when educators perceive that language and culture are deficiencies
rather than differences. The tendency is to blame the student for lack of success rather than to
question the efficiency of the instruction provided (Reilly, 1991), commonly known as the
"blame the victim" syndrome (Achilles, 20 10).
Traditional explanations of why RCELD students are underachieving and why there is an
achievement gap between this group and their White counterparts have been complicated by the
notions that there has been a problem in theorizing disproportionate representation. Scholars and
policy makers have contributed to a child-deficit approach. The role of biological and social
influences in child development that prepare children in a different manner has been
acknowledged by the National Research Council (NRC). In a 2002 report, members of the NRC
stated that school factors also influence the problem of overrepresentation. A limited view of
culture and its role in special education represents a missed opportunity to shed light on enduring
issues related to minority underachievement and disproportionate representation, such as racism,
structural discrimination, and alternative understandings of disability and human development
(Artiles, et al., 2006).

In the United States, inclusive education is about access to general education programs.
Ethnicity, race, culture, poverty and language diversity all complicate the underachievement and
special education picture. Data obtained from the NRC (2002) suggest that Hispanic and African
American students are more than three times as'likely to be placed in more restrictive
environments than their White counterparts. Equity dilemmas arise as educators grapple with
issues such as the complexities of geography, cultural historical practices, and interpretations of
policy that reflect local customs and practices. These constructs affect special education
inclusion narratives and have enculturated generations of educators (Artiles & Kozleski, 2007).
Although a sizeable amount of scholarship has been produced on inclusive education, it has ignored the fact that poor ethnic and linguistic minority students are overrepresented in special education . . .This is not an accidental omission, since most of the research in this field and other field is "colorblind" . . . The latest NRC (2002) report acknowledged that the impact of special education interventions on minority students cannot be discerned because studies did not provide information about the ethnic or socioeconomic backgrounds of students. Categorical cultural markers (e.g. ethnicity, social class) and cultural practices or processes tend to be neglected in inclusion work (Artiles et al., 2007, p. 3).
A disproportionate number of students with disabilities are poor and are members of a
minority group. Future inclusive education work should focus on participation and outcomes for
students who have been marginalized due to ethnic identity and ability level in educational
systems. These entities are laden with inequitable structural and social conditions and are
lacking in an understanding of the students served by the schools. Transformative, inclusive
schools invest in systemic, sustained programmatic attention to professional learning, the use of
data driven decision making, and school capacity development (Artiles & Kozleski, 2007).
The National Board for Professional Teaching Standards is considered to reflect effective
teaching. These standards were created in 1987 after the release of A Nation Prepared: Teaching
for the 21" Century by the Carnegie Forum on Education and the Economy's Task Force on

Teaching as a Profession. The standards highlighted a vision for accomplished teaching
(Lemons-Smith, 2008).
Minority Student Identity
Educational research on the role of culture and its role in learning for African-
American students by Hilliard and others, translated ancient Kemetic texts and examined
their contemporary relevance, in particular for the African-American community, while
other groups of scholars engaged in empirical studies rooted in culturally coherent
identity orientation among African and African-descent populations. These empirical
studies were very much aligned with regard to historical, linguistic and philosophical
investigations. There was a paradigm shift to reexamine the focus on measures of
personality and identity from purely individual internal attributes to individual attributes
that are situational or relational. Researchers looked at ethnic identity instead of
individual identity. They also examined a nexus of constructs that are fhctionally
related to identity, including self-esteem, self-efficacy, motivation, and relationships
between these identity constructs and contextual issues. Graham and Hudley, 2005 (Lee,
2008) identified racial or ethnic identity as a person's sense of belonging to his or her
group, and the meaning attached to that group membership, including "self-labeling"
(2008, p. 81 1). Education was viewed as a tool for African American self reliance rooted
in conceptualizing Pan-African identity as a tool for community empowerment (2008,
p. 804). Thus the goals of education were viewed as more than the accumulation of
knowledge for workforce participation, but also the development of comniunal identity
and a valuing of the development of knowledge and character in tandem (2008, p. 804,
King, 1994).

Academic achievement has been a topic of interest for years and a major focus has
centered on the gap that exists between racial minorities and their White counterparts.
Underachievement can have negative consequences. Dilorenzo (2009) examined the role of
related-racial socialization (RS) and racial identity (RI) in the academic achievement of college
students who were African American and Latino in a study that included a sample of 294
participants. The participants were comprised of 207 Latinos, 87 African Americans; 221
females and 72 males. Of the Latinos, 58.5% were second generation and 81.6% spoke Spanish
as a second language and attended a racially diverse university. Racial-Socialization was
assessed using the Racial Bias Preparation Scale and Racial Socialization Scale. Racial identity
was assessed with the Multi-group Ethnic Identity Measure and Multidimensional Inventory of
Black Identity. Achievement was assessed using GPA and SAT scores. This study employed
hierarchical linear regression analyses. Gender, along with generational status and language, was
used for Latino participants. With regard to African Americans, the study found that promotion
of racial mistrust, cultural socialization, and assimilation were related to lower achievement for
males, but higher for females. With regard to Latinos, proactive socialization was related to
lower achievement for males and higher achievement for females. In addition, promotion of
racial mistrust and public regard were related to higher achievement for second generation
students, but lower achievement for first generation students. The findings showed how complex
racial socialization and racial identity and the relationships between these constructs and
achievement vary based on the racial group being measured as well as other differences; i.e.,
language and gender (Spiegel, 2009).
It is important to examine Hispanic students' identity, their experiences in school and
how they view schooling experiences as well as their career expectations and aspirations. It is

essential that students form a connection between their identity, schooling and future plans.
Quiroz (1997) andyzed 47 Mexican and Puerto Rican student autobiographies which were
written at the end of the students' eighth grade year and 27 written by the same cohort during
their junior year of high school. This study aimed to learn whether or not there was any change
in how the participants viewed their schooling experiences, career expectations and aspirations
between eighth grade and the junior year in high school and what the differences and similarities
were between the two groups. The autobiographies of these students offered a look at what
makes up Latino students' own life constructs. According to Quiroz (1997), the "student self"
that emerged from the autobiographies of both the Mexican and Puerto Rican autobiographies
suggested that schooling was largely a confusing and/or punishing experience for Latino
students. The students identified several aspects of self identity unrewarding (Quiroz, 1997).
In general, the autobiographies signaled specific categories of difficulty from which the students derived negative evaluation of schooling: language problems, student mobility (movement from one country, city, neighborhood, house, or school), the inherent difficulties of school work, teacher mobility (frequent changes in teachers), discipline situations that included corporal punishment, and embarrassment resulting from interactions with teachers. In reviewing their elementary school years, students typically evaluated a given year in terms of the teacher along with the positive or negative events that transpired during that year (P. 7).
In comparing the Latino students' autobiographies, Quiroz identified and described
several shifts: As students progressed through the educational process they continued to blame themselves for their poor educational experiences. As they matured, they also began to find fault with the educational institution. Eighth grade evaluations of teacher "meanness" evolved into junior's evaluations of teachers as "boring and apathetic." The confusion of elementary school often evolved into resentment and sometimes hostility toward the schooling process and its agents. Those students who retained their aspirations were better able to integrate the "critical" selves, in spite of, rather than because of assistance from staff. Although fa-mily

self was salient for the Mexican students, it did not appear to provide the type of school capital that facilitated an educational identity for those Latino students. An analysis of the autobiographies illustrated that the connection between education and future career was not well developed for Latino students.
The educational experiences of so many Latino students (failing tests, being placed in low ability tracks, experiencing discipline and or criticism by staff, socially distant or indifferent teachers and counselors) were generally so negative that it was difficult if not impossible for these students to tolerate the punishing aspects of schooling . . . Even the juniors who continued to express hope remained on a slow track, apparently, to nowhere. Only the most resilient students would survive the process and graduate (Quiroz, 1997, pp. 14-1 5).
Educational researchers have become increasingly interested in what has been
referred to as the "school to work" transition. The aforementioned study underscored that
it is important to make the assumption that linking future career aspirations and
establishing educational pathways for attaining these goals begins at a much earlier stage
of a youngster's life (1 997).
Social scientists who study identity have advocated that one's identity consists of the
presentation of several different selves. Incorporating different selves happens during
adolescence. According to Farrell(1994), successful students exhibit six selves: the family, the
career, the sexual, the peer, the student, and the affiliating. Farrell proposed that the integration
of three selves is necessary for student success in school: the family, the student, and the career
selves. Quiroz (1997) inferred that the presentation of the various selves in response to others is
a crucial activity in the educational pursuits of students. The results of this analysis prompted
two questions; how aware are RCELD children of their opportunities for social mobility? Does
this awareness affect motivation? Education ought to be linked to the prospect of a career
(Quiroz, 1997). Research conducted by the National Center for Educational Statistics (2007)
suggested that foreign-born children and children of foreign-born parents tend to be of lower

socio-economic status (SES) than their U.S. born peers and may not perform as well as their US.
born peers on measures of academic achievement.
The possible-selves theory (Clark, Lee, Goodman & Yacco, 2008) supported the notion
of how individuals envision themselves in the future. This self theory offers educators a way to
better understand the motivations and achievement of secondary students. Possible selves can
propose a positive influence by contributing to qualities and lifestyles that individuals strive to
attain. Alternatively, the construct can be negative, with characteristics that individuals want to
avoid in the future (Clark, et al., 2008). Many times RCELD students are considered at risk, are
under challenged academically, are disproportionately represented in special education and
remedial classes, and do not have the best teachers (Nelson & Eckstein, 2008).
Yowell 2002 emphasized that studies of academic achievement have consistently shown
that children's hopes or aspirations for future success are among the strongest predictors of
school achievement. In this study, the researcher examined ninth grade Latino students' possible
selves, by exploring three domains: the possible selves, the ideological content of specific selves,
and the associatioiw between those possible selves and risk for school dropout. "According to
possible selves theory, the lack of balance between detailed and personalized expected and
feared selves may compromise the school engagement and outcomes of Latino youth (2002).
Minority Disproportionality
Disproportionality is the inappropriate over-representation andlor over-identification of
ethnic minority children in special education. Minority children are also over-represented in
discipline issues and suspensions, alternative academic placements, and high school drop-out
rates. In addition, they are under-represented in honors, gifted and talented, and advanced
placement courses and higher education enrollment. There is a discussion of disproportionality

as a growing phenomenon and how it is a systemic issue in our schools. Legislation and reform
efforts implemented on national, state, and local levels have required educators to implement
practices to address the issues of disproportionality. The full complexity of existing RCELD
student dispr~portionalit~ has not yet been fully understood since there are so many factors that
can contribute to representation when RCELD exists.
Behavioral Issues and RCELD students
There is extensive literature in the area of school discipline and the existence of racial,
gender, and socio-economic (SES) factors that affect school discipline referrals. The literature
consistently supports that minorities are disproportionately represented in the administration of
school discipline. Additionally, there is a wide range of literature on the connection between the
race of teachers and student performance. Non-cognitive factors, for example, discipline can
affect school and labor market outcomes, human capital development and the economic well
being of communities. These factors can result in negative consequences for the United States'
standing as a competitive nation. Minority males drop out of school more frequently, face higher
degrees of unemployment, and are incarcerated at a higher rate when compared with their White
counterparts. Students from low socio-economic backgrounds (SES) were three times more
likely to drop out of school than higher (SES) students. Jordan and Anil(2009) hypothesized
that the odds of a student referral for disciplinary action increases in the middle grades if the
child is male, a minority, in special education, or is poor. A study by Byrd, Weitzman &
Anginer (1 997) concluded that grade retention of adolescents is associated with increased rates
of behavior problems.
Does student discipline contribute to placement into special education? Teacher
perceptions, according to Upreti (2009), drive the decisions to refer students for disciplinary

consequences, eligibility for special education, and even suspension or expulsion. A number of
factors may contribute to the formation of teacher perceptions. These may include teacher
intrinsic factors, such as gender, teaching experience, teacher efficacy, teacher self-efficacy and
teacher burnout (Upreti, 2009). It is clear that teachers' perceptions of student behavior affect
students in a myriad of important ways. Among the educators working with our nation's youth,
student behavior and discipline are often open to subjective interpretation. Teacher perceptions
of student behavior appear to influence a wide range of school-related issues. Research fiom a
study of school safety in 2009 has linked teacher perceptions of student behavior with
excessively punitive discipline practices. Studies conducted on school climate have also found a
strong relationship between teacher perceptions and student emotional outcomes (Upreti, 2009).
Certain behaviors that might be considered normal in a minority subculture may be
viewed as aberrant by the White middle class (Reilly, 1991). Teachers' perceptions of ideal
student behavior have been shown to be differently applied across minority and Caucasian
populations. Reilly stated that some teachers base their judgment of student competence on race,
sex, socio-economic status, and linguistic and cultural differences (1 991). Reilly (1991) also
stated that behavior disorders may be generically defined as behavior that violates cultural norms
regarding what is appropriate and acceptable and includes behavior that deviates significantly
fiom that appropriate to one's age. These behaviors may range from withdrawal to aggression.
Specific characteristics include disrupting classroom procedures, stealing, defying authority,
refisal to follow directions, insubordinate behavior, tantrums, and acts of destruction.
Other areas where minority students may be over-represented are in school suspensions
and alternative placements. Out-of-school suspensions are a common form of discipline used to
respond to misbehavior in an attempt to maintain a positive climate in school. School suspension

is viewed by administrators as a consequence of outcomes and perceived by students and parents
as punishment. However, suspension rarely has a logical, functional, or instructive connection to
the offense or infraction. Negative outcomes such as academic failure, negative school attitudes,
grade-retention and school dropout have been connected to suspension without interventions that
focus on reinforcing or teaching pro-social or appropriate responses to difficult situations.
No Child Left Behind (NCLB, 2001) is being considered for revision and reauthorization
by the administration of President Obama. Traditionally, attention to this act has focused on
academic performance and accountability. According to Gastic (201 O), the Unsafe School
Choice Option (USCO), section 9532 under NCLB, states that students who attend "persistently
unsafe and dangerous" schools or who themselves have been victims of violent crime at school
are eligible to transfer to another public school (Gastic, 2010, U.S. Department of Education,
2004). USCO is the first legislation specifically addressing school safety concerns as grounds
for school choice and its provision has been vetted. The shortcomings of the individual transfer
option have gone relatively unexamined according to Gastic (2010).
In an article that appeared in the Educational Researcher in 2010, Gastic's purpose was to
fill the gap and investigate how the individual transfer option would fail to adequately protect the
students who are at greatest risk of being hurt at school. The individual transfer option fails to
extend school choice to students in proportion to their risk of harm at school . Thus, it is
indifferent to the disproportionate risk to which some student populations are subjected when it
comes to other forms of serious school violence. For example, there are significant differences
by sex and race/ethnicity in the degree to which students encounter weapons -related violence at
school. In 2007, 10% of male students in grades 9-12 reported being threatened or injured with a
weapon at school, as compared with 5% of female students. Latino and African American

students were aIso more likely than White students to have this experience, 9% for Latino and
10% for African American vs. 7% for White students (Gastic, 20 10).
Language Diversity
According to the law, a student's inability to speak and understand the English language
should not exclude him or her from effective participation in an education program offered in a
school district. District personnel must take steps to ensure that the student receives appropriate
language interventions to rectify the deficiency (NCES, 2007). Students who speak a language
other than English at hame and speak English with difficulty in school may be in need of special
services (NCES, 2007). Seventy percent of Hispanic elementary and secondary students spoke a
language other than English at home compared to students fiom other raciallethnic groups.
Nineteen percent of Hispanics in the United States had the highest percentage of students who
spoke English with difficulty (NCES, 2007). Among Hispanic students in kindergarten to 41h
grade, 69% were the most likely to speak a language other than English at home and 20% of
students in K-4 spoke English with difficulty (2007).
Generation 1
Generation 1.5 students are generally defined as English language learners who have
been partially educated in the United States. However, Roberge, (2002) described these
students using three different labels:
1. First generation, adult immigrants, foreign-born, foreign-educated,
first language (L 1) dominant.
2. Childhood immigrants, foreign-born, partially foreign educated and
partially US. educated, can be L1 or English dominant.

3. Children of immigrants, U.S. born, U.S. educated, English dominant.
Groups similar to Generation 1.5 are also known as "In-migrants." These may be
people from Puerto Rico or other U S , territories; "parachute kids," who come to the
United States alone to live with extended family members and attend K-12 schools;
native-born, non-native speakers who are U.S. born students raised in linguistics enclave
communities; "transitional," those who have experienced complex patterns of back and
forth immigration; and speakers of other Englishes (immigrant students from English
schools abroad).
Despite the use of group identification, this group of students is remarkably
diverse. Their language and education histories may share little in common, and their
education and socialization in the United States will likely differ from one another. The
individual stories of these students are critical to understanding their education needs and
challenges. Researchers and educators need to gain knowledge and a full picture of this
group of students because they are a fast-growing percentage of the U.S. student
population. A study conducted by Lee Zwald (2009) on Generation 1.5 students and their
academic writing process consisted of participants enrolled in the first year of college.
The findings suggested that individual characteristics and differences and factors such as
age of arrival, language history, and educational experiences both before and after their
arrival in the United States must be considered.
Parental Factors
National Center for Education Statistics (NCES, 2007) research has shown a link
between levels of parental education and child outcomes such as education experiences and
academic achievement, Differences in parental educational attainment levels persist across

raciallethnic groups. Statistics from 2005 showed that only 10% of Hispanic children between
the ages of 6 and 18 have mothers who possessed a bachelor's degree (NCES, 2007). In relation
to the father's educational attainment. a different pattern existed. Eleven percent of Hispanic
children had fathers with a bachelor's degree. In the lower levels of parental educational
attainment, 41% of Hispanic children had the highest percentage of mothers and fathers who did
not complete high school. Data from NCES (2007) included all dropouts regardless of when
they last attended high school, as well as individuals who have never attended school in the
United States, such as immigrants who did not attain a high school diploma in their home
country (2007). These data excluded military personnel and those who are incarcerated.
Response to Intervention Definition
RtI refers to an integrated, school-wide framework of service delivery in general and
special education that promotes successful school outcomes for all students. RtI is a structure
involving high quality instruction and frequent student monitoring through formative assessment
of progress. Thus, RtI involves systematic evaluation between academic and behavioral
intervention and a student's response to the intervention (Martinez, 2006, p. 1). According to
Graner, Faggella-Luby, & Fritschmann, 2005 in Martinez, 2006), RtI is rooted in well-
documented special-education practices and early reading intervention (2006).
According to Samson (2009), RtI provides answers to many of the most pressing
questions facing school educators. It provides a systematic framework of interventions to
identify students who may be at risk. RtI can provide feedback to educators as to whether the
model is effective in reducing the number of students placed in special education. The literature
suggests that RtI is taking center stage as a possible solution to the many problems that have

been exposed in public schools throughout the country. However, it has not been scientifically
validated as an effective framework (Samson, 2009).
Background and History of RtI
IDEA (2004) did not specifically cite the RtI structure. The federal regulations allowed
for changes in Specific Learning Disability (SLD) identification that employ RtI methods. The
federal legislation requires educators to adopt criteria for determining the presence andlor
identification of a student with an SLD. IDEA (2004) stipulates that there must be a process
based on the student's response to specific, research-based interventions as a part of the
evaluation procedures (IDEA, 300.307 (a)(2)). The language used in this legislation has
attracted significant attention as a means of fulfilling the call for scientific, research-based
intervention, especially within the field of education.
The push behind the surge of current RtI initiatives stems from needed improvement in
the traditional general and special education systems and the widespread accessibility of best
research-proven methods (Martinez, 2006). During the 1990s researchers began to study the
problems present in general and special education systems. They included the sharp contrast of
service delivery between special and general education settings, the lack of emphasis on
prevention and early intervention, (wait- to-fail model), and the limited weight given to the
importance of research-based instruction and intervention.
The identification and eligibility and the types of interventions given to students in
special education have caused intense debate about the effectiveness of the primary method used
to identify students with an SLD; the IQ-achievement discrepancy model. This situation has
prompted researchers and educators to develop alternative methods. To understand the

momentum that RtI has attained, educators must understand the limitations of the IQ-
achievement discrepancy model (2006).
A statutory definition of SLD first appeared in the federal Education for all Handicapped
Children Act of 1975 (PL 94-1 42).
This law required that as part of the identification procedures a student exhibit
". . . a severe discrepancy between achievement and intellectual ability" in one or
more of seven achievement areas (e.g. reading comprehension and mathematics
calculation) (Martinez, 2006, p. 2).
As a result, there have been significant inconsistencies in the process and instruments
used and the magnitude for determining the presence of SLD. A severe discrepancy resulted
across and within states. These inconsistencies and flaws inherent in the model have made it an
unreliable source for the determination of the presence of SLD. Martinez (2006) quoted Reschly
(2003) who noted that the reliance on the use of the discrepancy model for identification of the
presence of SLD is "unreliable and unstable, invalid, and as a way to undermine best practices
harmful" (p. 2).
IQ-Achievement Discrepancy Model
This model has been described as lacking reliability and stability because it involves
gathering assessment data from one point in time. Achievement scores change over time and
different assessment instruments may yield different scores in the same area. The extent of
variations across and within state lines may identi@ a child with a learning disability. However,
the same child may no longer be eligible for special education services in another state or
district.

In addition, the IQ achievement discrepancy model was founded under the assumption
that a student's IQ score can assess achievement. In spite of this, researchers have questioned
the degree to which IQ predicts achievement (Martinez, 2006). IQ results do not measure
reading, spelling, phonological processing, or other language memory tasks.
In general, minimal group differences exist between students with commensurate IQ
achievement scores and discrepant IQ achievement scores (2006, p. 3).
Finally, the IQ achievement model may undermine best practice because traditional
standardized testing procedures are not related to any aspect of the design, implementation or
evaluation of classroom instruction. Greshman (2002) is quoted by Martinez (2006): "There is
simply not a direct link between traditional assessment procedures and the resulting interventions
that are given to students in special education."
The IQ achievement discrepancy model has also been known as the "wait-to-fail model."
Students must be at least nine years old or far enough along in the elementary years to
demonstrate a severe discrepancy between ability and achievement. Hence, according to the
discrepancy model, students must demonstrate and experience significant and persistent failure
across the elementary years before they are identified as having an SLD. This model is harmful
for students because'waiting to serve children until later in the elementary years, according to
Greshman, VanderHeyden & Witt (2005), increases their odds of being identified as having a
learning disability by 450%.
A Tiered Pyramid: Theoretical Framework: Response to Intervention
In this study, the researcher considered New York State Mandates under federal
legislation such as the No Child Left Behind Act and Individuals with Disabilities Act that have
identified a number of districts with high numbers of RCELD students labeled or placed in

alternative settings. Under these mandates educators are required by state personnel to
implement systematic plans and interventions to address issues of representation in special
education settings and in disciplinary referrals. The population used in this study resides in the
Lower Hudson Valley, New York. The district has 11 schools serving about 8000 students in
grades K- 12.
In April 2000, district administrators were part of the educators in 364 districts in New
York State who were notified of possible issues pertaining to rates of representation of minority
students in special education and referred for disciplinary referrals. The New York State
Education Department (NYSED) provided support to educators in districts that had been cited
for over-identification and representation of RCELD students. The educators in the district, as
part of NCLB and IDEA (2004) legislation, implemented a Response to Intervention (RtI)
framework.
Educators who adopt intervention resources in an efficient manner are afforded an
opportunity to provide more intensive, individualized support as students display increased
learning difficulties. RtI is also a diagnostic model which provides evidence that students with
significant learning delays may have a learning disability if they fail to catch up with peers
despite well-implemented interventions (Wright, 2007, p. 3). RtI has been hailed as a viable
framework for improvement of the overall education system and as an alternative to traditional
identification of the presence of an SLD.
The RtI pyramid is a framework that espouses requiring educators to monitor student
progress through the administration of formative assessments, data collection, and analysis.
Students who do not demonstrate Adequate Yearly Progress (AYP) are identified early and

provided with access to interventions. By using the RtI pyramid structure, students are served in
a multi-tiered education service-delivery system (Samson, 2009).
The main features of RtI are the focus and emphasis on prevention. This model has its
roots in public health and disease control and occurs at three levels: primary, secondary and
tertiary (Sugai, 2007). Each level has prescriptive instructions for educators to follow in the
general education setting. This framework includes several tenets: providing a swift
instructional response to the needs of struggling students, providing supplemental and
differentiated instruction based on results of formative assessments, monitoring student progress
with increased frequency as students receive more specialized instruction, and using research-
based but not yet proven effective practices in the classroom (Bryant and Barrera, 2009).
Tier 1 or Level 1
The primary level, or Tier one, is also known as primary prevention. At this level
services are in place for all students. The first tier is also considered to be the universal tier. Rtl
Tier 1 or Level 1 involves a high quality school and classroom environment, scientifically sound
core curriculum and instruction, and intentional instructional practices. In this tier, school
personnel must objectively and systematically evaluate curriculum materials for quality that are
backed by research. Administrators must also evaluate a teacher's instructional strategies to
ensure delivery of the curriculum or intervention program (Martinez, 2006). Assessments and
data gathering of results are used to monitor whether or not students are making adequate
progress.
With regard to discipline, the classroom teacher must implement structures and
expectations for all students by implementing the core social curriculum to prevent the

development of behavioral problems. At this level the teacher can identify students whose
behaviors are not responsive to that core or level.
Tier 2 or Level 2
The secondary tier includes targeted, supplemental instruction and behavioral standards
for students who are considered "at risk" and for whom universal instruction was not sufficient.
These students may be flagged as "at risk." Services at Tier 2 (Level 2) are more intense and are
focused on specific needs of a student or group of students. Interventions at Tier 2 may consist of
delivering reading interventions of a specific amount of time during the school day or week.
According to Fuchs, Moch, Morgan & Young (2003), Tier 2 interventions can be applied
through one of two methods, standard protocol/researcher approach or problem solving/school
practitioner approach. Barnett, Daly, Jones and Lentz, (2004) espoused a combination of these
two approaches and problem-solving methods. In standard protocol approaches, all children
whose scores or data indicated difficulty in a certain academic area (e.g., reading fluency) are
given the same intervention that has been empirically validated to promote progress in that
academic area. At Tier 2, disciplinary issues are dealt with by specialized support staff in the
school to reduce the current frequency and extent of problem behavior.
The second approach to the selection and delivery of appropriate Tier 2 interventions
involves the problem-solving model. This model involves building or grade level problem-
solving teams or instructional support teams (IST) who systematicalIy review student data and
make decisions as to which interventions are best for the child depending on the difficulty the
student is experiencing. The rationale for these intervention teams is that a group of
professionals using multiple criteria would make sounder decisions than an individual acting
alone.

Intervention Support Team
The intervention support team concept is known by many names: IST, (Instructional
Support Team), SST (Student Study Team), MDT (Multi-Disciplinary Team), CST (Child Study
Team), TAT (Teacher Assistance Team), and PIT (Pre-referral Intervention Team) (Mahabir,
2009). The term used to identify this team is not important; what is important is that the
intervention team is a problem-solving and decision-making process that involves a coordinated
approach fiom several stakeholders-families, teachers, counselors, administrators-to help
students maximize their potential (2009). Whatever label is used to identify any of these groups
or "intervention teams," they are created to serve the same purpose.
Tier 3 or Level 3
Despite the efforts made on the strategies and assessments used at Tiers 1 and 2, some
students may continue to struggle; more intensive services may be warranted. The interventions
at Tier 3 are more intense and individualized than in Tier 2, and progress is monitored more
frequentIy. Fuchs & Fuchs (2005) suggested that current best practices in the field indicate that
students who do not make adequate progress in Tiers 2 or 3 be further evaluated to rule out
conditions such as mental retardation or emotional disability. Additionally, Fuchs, et al, (2003)
substantiated that students who fail to make academic gains at Tiers 2 and 3 may have a learning
disability.
At the tertiary tier, teachers focus on individualized and intensive behavior support to
reduce complications, intensity and/or severity of existing problem behavior (Sugai, 2007).
School Personnel and Implementation of the Pyramid as Response to Intervention
The pyramid of intervention logic has direct influence on both academic and behavioral
supports. The principal's role is important in the endeavor to implement RtI structures such as

the three-tiered or three-level pyramid. The successful implementation of the RtI structure is
contingent on the principal to view himself or herself as a participant in all aspects of
implementation, monitoring, and sustaining the process. He or she has to be a manager and a
Leader by working collaboratively with the teachers, promoting the initiative, providing resources
and enabling teacher capacity building. In a study conducted to identify and examine the
leadership characteristics of secondary-level principals who successfully implemented RtI,
Spiegel(2009) found that there were six principal leadership characteristics. The study included
12 study participants, 3 high school principals, and 9 certified professional staff. Using two
established theoretical models, Fullan's Framework for Leadership and the Interstate School
Leaders Licensure Consortium (ISLLC) Standards, interviews were constructed and conducted
with the 12 participants. Six leadership characteristics emerged: (1) principals as participants,
(2) strong communication skills, (3) support of staff, (4) allocation of resources, (5) identification
and use of expertise, and (6) data proficiency. When comparing the observed leadership
characteristics and the leadership roles as self-reported by the practitioners in the
implementation, such as RtI, four important roles were suggested: principal as participant,
principal as data manager, principal as recruiter and principal as resource provider (Spiegel,
2009).
A study conducted at an Indiana secondary school of students with emotional disabilities
whose purpose was to examine the perceptions of Indiana's special and general education
administrators and teachers regarding service delivery, instructional models, and transitional
outcomes for this population of students, found that administrators and teachers, regardless of
specialty area, perceived that their students with emotional disability (ED) were educated in a
general education setting

Legislation
The NCLB act emphasizes that all students will learn and will continue to make
substantial improvements, placing tremendous accountability on educators. IDEA (2004) also
requires accountability and interventions. The focus of IDEA is to increase general education
options for students with disabilities and to reduce the over-identification of minority students
placed in special-education. These Federal laws require educators to create plans that will
reduce the number of minority students over-identified in special education settings and in
discipline referrals. Part of the plans that states are adapting include a Response to Intervention
(Rtl) model, an intervention linked by the IDEA to reduce special education eligibility
determination (Hardcastle and Justice, 2006). It is the responsibility of educators to produce
quality teaching and improved student outcomes (2006).
The report, A New Era: Revitalizing Special Education for Children and Their Families,
underscored that young people with disabilities drop out of high school at twice the rate of their
peers. The Commission on Excellence in Special Education was created by President Bush in
2004 to ensure that every child learns, regardless of race, family background, or disability status.
This Commission recommended reforms to improve America's special education system and
ensure that it be a culture of accountability and results. To address the issue of the over-
representation of minority students in special education, IDEA (1 997) and its reauthorization,
IDEIA (2004), recommended that all educators use and implement procedures to ensure that all
instruments used to determine eligibility for special education are non-discriminatory. Public
Law 108-446 IDEA, (1997) & IDEIA, (2004) require that SED personnel develop and submit a
six year State Performance Plan (SPP) to the Office of Special Education Programs (OSEP) at
USDOE. The State Performance Plans are created to monitor and assess the states' efforts to

implement the requirements and purposes of IDEA and IDEIA. OSEP requires that plans in their
states address three areas of priority which include 20 indicators used to meet these areas. State
leaders must establish how educators will accomplish its measurable and rigorous targets with
activities that will improve the outlined areas.
New York State Education Department, Chapter 405, sets parameters for what needs to
be reported, data to be collected and submitted, and deadlines for reporting. State Performance
Plans have been designed to evaluate the States' efforts to implement the requirements, purposes,
and implementation of such plans under the IDEA act.

Figure 2 Topics explored in the Review of literature

Summary of Literature, Theory and Practice
The United States is a diverse nation, and it is experiencing demographic metamorphic
shifts. These demographic shifts are changing the fabric, color and cultures of its people. Our
nation's schools are experiencing this dynamic and are currently being challenged to become
more knowkdgeable about the assumptions, attributes, and norms of a range of cultures. Many
educators have failed to take cross-cultural communication issues into account, which can
contribute to the problems that many students are facing in schools. The neglect of cross-cultural
communication and cultural responsive instruction is evident and is shown by the
disproportionality of RCELD students underachieving and placed in special education.
This phenomenon, known as disproportionality, has been well documented for over thirty
years. Skiba, et al. (2008)) define disproportionality as the representation of a group in a
category that exceeds our expectations for that group, or differs substantially from the
representation of others in that category.
"Although concerns have historically tended to focus on issues of overrepresentation in special
education or specific disability categories, groups may also be underrepresented in a category or
setting" (Fiedler, et al., 2008). A complex interplay of economic and demographic variables
including poverty, culture, geography and language are factors which contribute to
disproportionality (2008).
The literature reminds us that Latin American and Caribbean peoples are the Iargest
group of immigrants replacing Europeans in the United States. The Census Bureau predicts that
Hispanics, the largest minority group, will be about 20% of the national population by the year
2042 (Campbell, 2009). These demographic changes may also influence the achievement gap.

The dropout rate for Hispanics has become the highest among all groups in the United States.
Hispanics are disproportionately placed in special education. They are also overrepresented in
discipline and suspensions and alternative academic placements and underrepresented in honor
courses, gifted and talented programs, advanced placement courses, and higher education
enrollment.
Special education has been regarded as a solution for students whose needs exceed the
skills or time constraints of the regular classroom teacher. Classroom teachers believe that the
placement into special education will help the student get what he or she needs in order to
succeed. The NCLB and IDEA laws require accountability and interventions that mandate
district personnel to gather and report data and to set plans to reduce the numbers of students
overrepresented in special education settings.
Response to Intervention is one plan to change behaviors as a function of intervention.
The goal is to produce a discrepancy between the baseline and post-intervention levels of
performance. Within a problem-solving framework a problem is defined as a discrepancy of
what is current and the desired levels of performance, Data collection and analysis are essential
components of the RtI Model. Data drive the decision making to modify or change the nature of
interventions. Gresham, VanderHayden & Witt (2005) have stated that the central issue in using
an RtI model is the determination of "adequate" or "inadequate" response to intervention. The
decision must be made at local and individual levels by an assessment team and will vary from
school to school. RtI has shown promise at the elementary level. The literature is still lacking on
the influence of RtI on older RCELD students' achievement, placement into special settings, and
high school graduation rates.

CHAPTER 3
DESIGN AND METHODOLOGY
The researcher's purpose for conducting this study was to examine the influence
of a district-designed RtI structure on the achievement and classification rate into special
education of RCELD students in special education by exploring a local school district's
processes that may contribute to student achievement and special education placement.
This chapter describes the researcher's design and methods used in conducting this study
that included mixed methods, both quantitative and qualitative data collection. One New
York State district's three middle schools, which house grades 5-7, and the secondary
school which houses grades 8-9 were used in the study.
The structure of the research design and the rationale for using this particular
design, the selection of participants, instrumentation, methods of data collection and
analysis, and the reliability and validity of the research conducted are also presented. The
involvement of school personnel in the implementation of the RtI structure adopted by
school district personnel was examined. Holding the student as the central focus and
collecting and using data gathered to direct and inform the most appropriate interventions
were tenets used to examine the influence of the RtI structure. Additionally, the use of
the best research practices available to provide the student with a comprehensive
systematic approach to improve academic outcomes through the implementation of the
district-designed RtI structure were also analyzed.
Johnson (2001) stipulated that the study's primary objective as well as when data
were collected and the time dimension of the study are essential in determining the design
of a study.

Table 2 Types of Research Obtained by Crossing Research Objective and Time Dimension (Johnson, 2001, p. 10)
Research objective Retrospective Cross-sectional Longitudinal
Descriptive Retrospective, descriptive study (Type 1)
Predictive Retrospective, predictive study (Type 4)
Explanatory Retrospective, explanatory study (Type 7)
Cross-sectional, descriptive study (Type 2) Cross-sectional, 'predictive study (Type 5)
Cross-sectional, expIanatory study (Type 8)
Longitudinal, descriptive study (-be 3) Longitudinal, Predictive study (Type 6) Longitudinal, explanatory study (Type 9)
Research Design
The single typology shown in Table 2 is the result of the systematic cross
classification of two meaningful dimensions, research purpose and time dimension
(Johnson, 200 1).
The problem and purpose direct the design of the study and the methods are
dictated by the design. A cross-sectional, descriptive non-experimental design (Type 2,
Johnson, 2001) was appropriate for this study because most education research problems
do not lend themselves to experimentation, although many education phenomena lend
themselves to controlled inquiry of the non-experimental kind (Johnson, 2001). The
research design shouId achieve the most valid and reliable results possible.
The cross-sectional descriptive (Type 2) and non-experimental design of this
study (Johnson, 2001) is appropriate given the boundaries and limitations of the current
research. This design provided the structure needed to present the results, along with

their interpretation, in a clear and meaningful way that would contribute and perhaps add
to the current knowledge in the field. Under normative conditions, schools are places that
serve everyone and therefore must ensure equal academic success, treatment, and
outcomes for a11 who attend. Descriptive non-experimental research design of this type is
important.
As stated by Kerlinger (1 986) non-experimental research is an important design
employed by many researchers. Researchers use a classification system of non-
experimental methods that is highly descriptive of what educators do and also allows
them to communicate effectively in an interdisciplinary research environment (Kerlinger,
1986).
Kerlinger (1 986) defined non-experimental research as "a systematic empirical
inquiry in which the scientist does not have direct control of independent variables
because their manifestations have already occurred or because they are inherently not
manipulable" (p. 9). In examining the processes of representation of RCELD students,
researchers must review factors that might be responsible for student placement.
Inferences among variables are made without direct intervention, from concomitant
variation of independent and dependent variables (Johnson, 2001). The significance of the
variation of these variables and the differences between them were tested using descriptive
statistics. Repeated Measures of Analysis of Covariance (ANCOVA) were performed by
examining two points in time 2008-2009 and 2009-2010.
Johnson noted that non-experimental research could also enhance experimental
designs by providing corroboration and increased evidence of the external validity of
previously established experimental findings.

This researcher used mixed methods which incorporated qualitative and
quantitative data collected fiom the district under study to present a picture of the
representation of minority students in special education programs in the district. The
popularity of these approaches has increased because research continues to evolve and the
use of mixed methods is another step forward, using the strengths of qualitative and
quantitative research (Creswell, 2009). The combination of both qualitative and
quantitative approaches provides more insight than either method alone. Although there is
some debate among quantitative and qualitative methods purists about the use of mixed
methods, many authors have stated that the benefits of each method can improve the
quality of a study, particularly if used for complementary purposes within a single study
(Clark, Lee, Goodman & Yacco, 2008).
"Mixed-methods research is an approach to inquiry that combines or associates both qualitative and quantitative methods. It involves philosophical assumptions, the use of qualitative and quantitative approaches, and the mixing of both procedures in a study. It is more than simply collecting both kinds of data; mixed methods combines the use of both approaches in tandem so that the overall strength of the study is greater than either qualitative or quantitative research" (Creswell, 2009, p. 4).
AIthough philosophical ideas remain largely hidden in research, they still
influence the practice of researchers and need to be identified. Creswell recommended
that individuals preparing a research proposal make explicit the larger philosophical ideas
they espouse. This information will help the researcher decide specifically why the
methods for his or her research were chosen (2009).
Worldview is a term used by Creswell to identify a basic set of beliefs that guide
action. He describes worldviews as a general orientation about the world and the nature

of research that a researcher holds. These worldviews are shaped by the discipline area
of the researcher, the beliefs of the advisers and faculty in a researcher's area of interest
and past research experience.
Creswell(2009) identified four worldviews: post-positivism, constructivism,
advocacy/participatory, and pragmatism. In providing a rationale for using a specific
method based on one's philosophical view of the world, this researcher holds
assumptions of social constructivist and advocacy/participatory philosophical
worldviews. Social constructivists seek to understand the world in which they live.
One goal of the researcher was to rely as much as possible on the participants'
views of the situation being studied (Creswell, 2009). Another assumption held by this
researcher was that of the advocacy/participatory worldview which holds that research
inquiry contains an agenda for action to change the lives of the participants, the
institutions in which they work or live, and the researcher's life. Moreover, specific
issues that need to be addressed may speak to important social issues, such as
inequality, empowerment, oppression, domination, suppression and alienation. This
philosophical worldview focuses on the needs of groups and individuals in our society
who may be marginalized or disenfranchised (Creswell, 2009).

Setting
This study was conducted in a suburban district in the Hudson Valley in New York.
Four schools of the district were used in the study. The district consists of 1 1 schools,
one high school, grades 10- 12, one secondary school comprised ~f grades 8 and 9, three
middle schools made up of grades 5-7, four K-4 elementary schools, one K-2 elementary
school, and one alternative high school, grades 9- 12. The School District data were
gathered from the district data repository and the NYS Report Card.
Table 3 Dish.ict Building Breakdown and Grades Served
Building Number Grades Served High School 1 10 - 12 Secondary School 1 8 - 9 Middle Schools 3 5 - 6 Elementary Schools 4 K - 4 Elementary School 1 K - 2 Alternative High School 1 9 - 12
Table 3 presents the district's building information and grades served in each one.
The racial or ethnic origin breakdown of the number of students who are
American Indian or Alaska Native is 36 or > 1 %, Black or African American is 994 or
12%, Hispanic or Latino 2,979 or 37%, Asian or Native Hawaiian or other Pacific
Islander is 252 or 3%, Caucasian is 3,727 or 47%. The number of students who are
multiracial is 4, which was less than 1% of the total sample. The enrollment of students
with limited English proficiency is 847 or 1 1 %. This information is presented in Table 4.

Table 4
Total District Enrollment by Ethnicity
Ethnicity Total District Student Enrollment 7,988
American Indian or 3 6 .45% American Native
African-American or Black
Hispanic or Latino 2,979 37%
Asian, Hawaiian, Pacific Islander
Caucasian 3,727 46.55%
Population, Sampling, and Instrumentation
Quantitative data collected included the following demographic data: ethnicity,
LEP, SES, grade level of students referred to IST (n = 66), and students referred to CSE
(n = 55) during the 2009-201 0 school year. In addition, NYS ELA and Math assessment
scores for IST students were collected. The quantitative data collected was analyzed
using descriptive statistics.
Qualitative data were gathered from responses of structured interviews consisting
of open-ended questions conducted with personnel. The participants in this study were a
building administrator from each of the buildings used in the study (n=4) and regular and
special education teachers (n=8) of grades 5-9. The researcher planned to have wide
representation of the participants, grade level, and courses taught selected from each of
the buildings used in the study. The participating administrators of all four schools were
currently employed as full-time administrators in their respective buildings. Classroom

teacher participants were currently employed as full-time middle school and secondary
school teachers.
Table 5 School Personnel Participants and the Schools Used in the Qtditative Portion of the St@:
Administrator Teachers Grade Subject n=4 n=8 5 - 9 Taught Ethnicity Gender
1 Caucasian Male
Math Language Arts
Caucasian Male
Math Caucasian Language Arts
Male
African- American
Female
Female Language Caucasian Arts Science
Language Caucasian Arts Math
Female
Hispanic
Caucasian
Male
Male Science
Math Hispanic Male
Male
Female
Caucasian
Language Caucasian Arts Science
G 7 Science Caucasian Female
Table 5 shows the participants' buildings used in the study.

For identification purposes numbers were assigned to the schools and
administrators and letters were assigned to teacher participants. These codes are known
only to the researcher.
The table above presents information on the district personnel in the buildings
used in the study for the qualitative portion of the study. The eight teacher participants
were general and special education teachers. These volunteer participants were selected
due to their willingness to participate in the study. Interviews were conducted by the
researcher in a private location at a time, date, and location agreed to by the participants
and the researcher. Interviews were between 20 and 25 minutes in length and were
recorded but the transcriptions of the responses do not identify the participant in any way.
The researcher used a coding system for participant identification, such as
Participant A, B, C, etc. This coding was known only to the researcher in order to
maintain the confidentiality and anonymity of each participant. Each session was listed
by a number with no identifiable connection to the participant. The researcher
transcribed all of the digital recordings.
A teacher interview schedule of questions created by Mahabir (2009) and
modified was used. This researcher requested and was granted permission from Mahabir
(Appendix H) to use and modify the interview questions for teachers and administrators.
Structured open-ended interviews were used to gather information from the classroom
teachers and building administrators. These responses provided information on classroom
and school processes that have been implemented as part of the RtI model to assist
struggling learners and examine other factors that might contribute to the referral process.

They also provided the researcher with an understanding of respondents' level of
involvement and the implementation of the district-designed intervention pyramid.
Methods
A mixed-method approach, using both qualitative and quantitative data, was used
to answer the research questions in reference to the achievement and rate of classification
into special education of RCELD students referred. The use of this method showed what
influence, if any, the implementation of the RtI structure had on the achievement of
students referred to IST and CSE and what the final outcomes were for students referred
to CSE (Level 3) of the RtI structure. The analysis and results of the data described what .
influence, if any, RtI had on the students referred for the 2009-20 10 school year.
Quantitative data were collected from the district's data repository, the New York
State Education Department Website and BEDS. These data provided an overview of the
total number of students who went to CSE using categories of race/ethnicity, LEP, SES,
and grade. Data were also obtained on who recommended the student to CSE and what
the final outcome was for each student, classification and placement or ineligibility to
receive services. Permission was requested from and granted by the Superintendent of
Schools to conduct the study in the selected district.
The qualitative data showed to what level the district personnel, teachers, and
administrators were involved in the implementation of the district-designed RTI model.
Qualitative methods were employed to collect information from school personnel
regarding the processes used and the involvement in the RtI process. Interviews that
included open-ended questions were conducted with classroom teachers and building
administrators to gather a wide range of data to answer the guiding questions.

Research Questions
The research questions that guided this study were:
The null hypothesis - H, states that RtI had no influence on the achievement of RCELD
students in grades 5-9.
1. How has achievement, as defined by scores attained by students referred to IST
on the NYS English Language Arts (ELA) and NYS Math assessments of
RCELD students, been influenced following the use of the im&xnentation of a
district - designed intervention model in grades 5-9 during the school year 2009
2. How has the classification rate of RCELD students been influenced following the
use of the implementation of a district-designed intervention model in grades 5-9
during the school year 2009-20 1 O?
3. How has the building administrator been involved in the implementation of the
district-designed intervention model?
4. How have the teachers in the respective buildings used the district-designed
intervention (RtI) model?
Questions Number f & 2
1. How has achievement as defined by scores attained by students
referred to IST on the NYS English Language Arts (ELA) and
NYS Math assessments of RCELD students been
influenced following the use of the implementation of a district-designed
intervention model in grades 5-9 during the school year 2009-2010?

2. How has the classification rate of RCELD students been
influenced following the use of the implementation of a district-designed
intervention model in grades 5-9 during the school year 2009-2010?
The purpose of the first research question was to examine what, if any, influence
the RtI structure had on the achievement as measured by the scores attained on the NYS
ELA and Math assessments on the students who were referred to IST (Level 2) of the RtI
pyramid.
To answer the first research question, a quantitative method was employed. Data
were also gathered from the New York State Basic Educational Data Survey (NY BEDS),
the NYS Department of Education's School Report Card, and the District's data
repository.
The introduction of this plan contains descriptive tables of data collected from the
District and the NYS Report Card used in the study. The data include information on
students referred to IST (Level 2) of RtI, ethnicity, grade, gender, student language
diversity, poverty level, and NYS ELA and Math assessments to measure achievement
for the students referred to IST in grades 5-9. Repeated Measures (ANCOVAs) were
used to determine if achievement, as measured by a change in the raw scores attained on
the NYS assessments, differed significantly for the students referred to IST from one year
to the next. The interaction between covariates, gender, ethnicity, grade, LEP and SES,
and the Independent variables were also tested for any significance.
The purpose for the study was to evaluate what, if any, influence IST had on the
classification rate of RCELD students. Data were also collected on the number of
students referred to the next level of the RtI pyramid, students who went from Level 2 to

Level 3, the Committee on Special Education (CSE), and what the final outcomes were
for these students.
Other information collected were data of students who were referred to CSE
during the 2009-2010 school year in addition to demographic data and information on the
disability determination made by the CSE (classified as learning disabled, mentally
retarded, speech and language impaired, and emotionally disturbed).
Information and data were gathered fiom personnel in the three middle schools
(grades 5-7) and the secondary school (grades 8-9), since all students fiom the middle
schools go to the secondary school.
Questions Number 3 and 4
3. How has the building administrator been involved in the implementation of the
district-designed intervention model?
4. How have the teachers in the respective building used the district-designed
intervention model?
The researcher's purpose for these questions was to gain information on the
processes currently being used in the schools to monitor student's academic progress and
the processes followed to place students into special education. School personnel who
were interviewed volunteered to participate in the study; a building administrator and two
teachers were interviewed from each building to provide the researcher with insight as to
how involved the administrators and the teachers were regarding the implementation of
the RtI structure and the processes followed to provide intervention for students who
were showing signs of academic or behavioral difficulty.

Qualitative methods were used to answer research questions three and four. The
data to answer these questions were drawn fiom the interview instruments for
administrators (Appendix C) and teachers (Appendix B). The interview instrument used
to interview the administrators and the teachers were adapted from Mahabir's (2009)
protocol. Permission (Appendix G) was requested and granted by this researcher to use
the interview scheduIe.
The adaptations made to the interview schedule created by Mahabir were tested
for validity and reliability by a panel of experts who were asked to review the questions
to be used in the interviews and complete an interview-schedule assessment form
(Appendix I) in which they provided information regarding the wording of the questions,
whether or not the question should be rejected or accepted and which research question
the particular question addressed.
Research Procedures
Approval by the Institutional Review Board (IRB) of Seton Hall University was
given to conduct the research study (Appendix D). The approval by IRB testified that the
researcher followed established procedures to ensure protection and maintain anonymity
of participants. Permission was requested from and granted (Appendix F) by the
Superintendent of Schools to conduct the study in the district. Data used in the study
were gathered fkom the New York State Education Department website, BEDS (Basic
Educational Data Systems). The researcher contacted each of the building principals and
requested to speak with the staff at a faculty meeting to present faculty with the study to
be conducted and its purpose. The staff was also informed of the need for participants to
participate in structured open-ended interviews for the qualitative portion of the study.

The staff was assured that protection and anonymity of participants would be
maintained, After the researcher visited each building to present the study to the staff, a
flyer was sent to all staff members of each building describing the study, its significance
and outlining the questions to be answered through the research and requesting their
willingness to participate in the study (Appendix E). This mailing included an informed
consent form (Appendix E) which described the purpose and methodology of the study,
guaranteed anonymity, maintained participant protection, explained the right for a
participant to withdraw from the interview at any time during the study, and offered a
report of the results of the study upon individual request. Those who consented to
participate in the study were required to sign and return necessary documentation. A
self-addressed, stamped envelope was also included in the mailing.
After the signed consent was received, the researcher provided each participant
(administrator or teacher) with a form on which to schedule an appropriate time for the
interview. The interview locations and times were decided by each participant within
their respective buildings. Interview length, confidentiality, participant anonymity, and
environment were factors deeply considered by the researcher. Each interview was
conducted using a digital recorder to capture the responses, thoughts, and expressed
beliefs of the participants regarding the implementation of the school-designed
intervention pyramid. The interviews consisted of open-ended questions to provide
information to enhance the results of the study. Teacher and administrator interview
transcriptions are included in Appendices J and K, respectively.

VaIidity and Reliability
The quantitative portion of the study consisted of collecting district data from
the NYSED, BEDS 2008-2009 and 2009-2010. New York State requires all districts to
submit data and create and submit plans according to mandates outlined in IDEA (2004)
and the OSE (Office of Special Education).
The interview instrument questions were tested for content validity. Permission
was requested to use the interviews for participants (teachers and administrators) created
by Joseph 0. Mahabir (2009) (Appendix G). Modifications were made by the researcher
to buiId around the pyramid of interventions. The content validity of an instrument is
determined by the extent to which the instrument is a representative sample of the content
area being measured (Leedy & Ormond, 2005).
Reliability of the interview instrument is the extent to which it yields consistent
results when the characteristic being assessed has not changed (2005). Inter-rater
agreement was used to test the reliability of the interview questions, using three raters to
evaluate the instruments and provided the same judgments about the open-ended
questions to be used in the interview for the qualitative portion of this study. The
purpose of piloting the interview instrument was to ensure that the interview participants
understood the wording of the questions and that the questions were effectively designed
to gather the information presented by the research questions and the theoretical
framework guiding this study.
Summary of Chapter 3
In Chapter 3 the researcher detailed the design, methods, and procedures in the
data analysis plan, described how the data were gathered, compiled and analyzed in the

current research. Chapter 3 also provided a description of the research, objective, and
time dimension in which data were collected to answer the questions that guided this
research.
Chapter 4 presents the data and data analyses. For the qualitative portion of the
study, responses to the interview questions were transcribed and analyzed by the
researcher searching for patterns and themes from the responses of the participants to the
guiding questions established, The responses were analyzed using the ACH method.
This method requires that the evidence or participants' responses are entered into a
matrix and a hypothesis that is aligned is created. Quantitative district data on the
demographics of students referred to IST, the attained NYS ELA and Math assessment
scores (2008-2009 and 2009-2010) and data on students referred to CSE were collected
during 2009-20 10 for school year. These data were analyzed to determine what, if any,
influence the RtI intervention (IST) had on student achievement and on the classification
rate during 2009-2010.

CHAPTER 4
A.NALYSIS OF RESULTS
This chapter presents the data and statistical analyses of data collected to examine
the influence of a school-designed Response to Intervention structure on the achievement
and classification rate of Racially, Culturally, EthnicaIly, Linguistically, Diverse
(RCELD) students in special education by exploring a local scl~ool district's processes
that may have contributed to student achievement and/or classification.
The quantitative portion of the study included demographic data from all four
schools used in the study 2009-20 10 school year. Test data were collected for the
surveyed students for the 2008-2009 and 2009-20 10 school years. Using qualitative data,
the researcher enriched the study analysis with administrator and teacher interviews.
RtI is a problem-solving process implemented to provide students with interventions as
soon as they begin to experience academic or behavioral difficulty. Theoretically, if
these difficulties are caught early and specific interventions and monitoring take place,
then there is no need for the student to be placed in a separate setting or program. This
structure allows school personnel to provide and monitor interventions before
recommending a student for special education. The structures used by the personnel in
the schools used in this study are in the shape of a pyramid with three or four levels or
tiers depending on the school. At the first tier, 80% of the students are assessed and
monitored by their teachers in their general education classroom setting. Teachers at the
first tier provide instruction to meet the needs of all students in their classes. In Tier 2,
about 15% of students who have shown academic or behavioral difficulties are referred to

the building's instructional support team (IST) through a process detailed by the building
personnel. In Tier 3 there are more intense interventions, such as recommendation for
students to go to CSE for testing and possible placement in a separate setting.
In the first section of this chapter the researcher describes the setting for the study.
In the second section a table provides a visual representation of the questions that guided
this study along with the data collected and the analyses used. The third section includes
a computer analysis of the semi-structured interviews conducted. The teacher and
administrator protocol are presented in Appendixes J and K.
Setting for the study
This study was conducted in a suburban school district that served approximately 7,988
students in the Hudson Valley of New York. The district was comprised of 46.55% White, 37.65%
Hispanic, 12.25 % Black, and 3.1% other. The district is considered to be both ethnically and
economically diverse. The racial or ethnic origin breakdown of the students who are American
Indian or Alaska Native is 36 or >I%, Black or African American is 994 or 12%, Hispanic or
Latino is 2,979 or 37.65%, Asian or Native Hawaiian or other Pacific Islander is 252 or 3%, and
Caucasian is 3,727 or 47%. The number of students who are multiracial is 4, which was less than
1% of the total sample. The enrollment of students with limited English proficiency is 847 or 1 1%.

Table 6
District Enrollment in 2009 by Ethnicity/Race -
Ethnicity Total District Student Enrollment 7,988
American Indian or American 3 6 -45% Native
African American or Black 994 12:25% .
Hispanic or Latino 2,979 37.65%
Asian, Hawaiian, Pacific Islander
Caucasian 3,727 46.55%
Table 6 shows the racial/ethnic breakdown of the students in the district (2010).
Descriptive information is presented in Table 7 for each of the schools used in the study,
Table 7
Projle of the District Schools Used in the Study
Variable School 1 School 2 School 3 School 4
Grade Configuration 5- 7 5 -7 8- 9 5 -7 Student Enrollment N=545 N=563 N=1,200 N=703 Student Socio-Economic N=172 N=240 N=343 N=173 Status Percent of SES 3 1% 43% .49% 6% Limited English N=43 N=77 N- 107 N=44 Proficient
Table 7 represents a profile of the schools used in the study, including grade
configuration, student enrollment, socio-economic status, SES enrollment, and Limited
English Proficient students. This data was obtained from the 2010 NYS Report Card.

Following are descriptive and frequency tables that explain the variables used to
test the null hypothesis. The following tables represent information that wouId clarify
what data were collected before they were analyzed. Table 8 presents the statistics of the
academic achievement variables, NYS ELA and NYS Math Assessments from two
different years 2008-2009 and 2009 -201 0. The assessment scores for the population
used in this study are represented in Table 8. It is important to note that there were no
scores for ninth grade students, as they do not take either assessment in the ninth grade.
The tables that follow describe variables used in the study for their influence on
achievement. Socio-economic status membership was determined by students who
receive "free or reduced lunch" and students who do not receive "free or reduced lunch"
(Table 9), students considered SES, n = 44 and students not considered SES, n = 22.
Racially, culturally, and linguistically diverse students were the focus of this study.
Table 10 represents the membership of RCE students. They are represented as
minority (RCE) or non-minority, n = 56 (includes Hispanic and African American
students combined). Grade was another variable used because of the configuration used
in the schools under study. The middle schools are comprised of grades 5-7, and the
secondary school is made up of grades 8 and 9; grade 5, n = 2 1, grade 6, n = 9, grade 7, n
= 12, grade 8, n= 20 and grade 9, n = 4 (Table 11).
Table 12 is a frequency table representing gender membership; male, n=34 and
female, n = 32. The next table used is a frequency table that presents the LEP group
membership, represented by no, n = 56 (not considered LEP status) and yes, n = 10
(considered LEP status), Table 13.

Table 8
Descriptive Statistics ofAcademic Achievement Variables
N Min. Max M SD
ELA Raw Score 2008 - 2009 61 558 696 648.25 23.375 ELA Raw Score 2009 20 10 59 564 686 650.00 20.927 MATH Raw Score 2008 2009 62 455 704 647.03 38.340 MATH Raw Score 2009 - 201 0 59 480 719 649.03 31.148 Table 8 represents scores of assessments used to measure achievement
Table 9
Frequency Table of SES Group Membership.
Frequency Percent Valid Percent Cumulative Percent
Valid Not Low SES 22 33.3 33.3 33,3 Low SES 44 66.7 66.7 100.0 Total 66 100.0 100.0
SES status of students referred to IST represented in Table 9

Table 10
Frequency Table of Ethnicity Group Membership Valid Cumulative
Percent Valid Non-minority 10 15.2 15.2 15.2
Student Minority 5 6 84.8 84.8 100.0 Student Total 66 100.0 100.0
The ethnicity membership of students referred to IST is represented in table 10.
Table 11 Frequency table of student grade.
Frequency Percent Valid Percent Cumulative
Valid 5 2 1 31.8 31.8 31.8 6 9 13.6 13.6 45.5 7 12 18.2 18.2 63.6 8 20 30.3 30.3 93.9 9 4 6.1 6.1 100.0
Total 66 100.0 100.0
Frequency table of gender group membership.
Frequency Percent Valid Percent Cumulative Percent
Valid Male 34 51.5 51.5 51.5 Female 32 48.5 48.5 100.0 Total 66 100.0 100.0
Gender group membership of students referred to IST is represented in Table 12

Table 13 Frequency table of LEP group membership
Frequency Percent Valid Percent Cumulative Percent
Valid No 56 84,8 84.8 84.8 Yes 10 15.2 15.2 100.0 Total 66 100.0 100.0
Table 13 shows the number of LEP and non-LEP student status
The mixed method was employed in collecting quantitative and qualitative data.
Johnson's (200 1 ) table of types of research obtained by crossing research objective and
time dimensions, used in this study, is presented in Table 14.

Table 14
Time Dimension, Design, Data Collection and Data Analysis of the Research Questions Guiding This Study
- Time Data Data
Research Question Dimension Design Collecfion Anaiysis
1. How has the achievement Cross-sectional of RCELD students been Panel Studies influenced following the use of a district-designed pyramid of intervention, as defined by scores attained on the NYS ELA and NYS Math students b Assessments in grades 5-9 during the 2009-20 10 School year?
2. How has the Classification Cross-Sectional rate of RCELD Students into spec Panel Studies education been influenced following the use of the implementation of a district-designed intervention model in grades 5-9 during the 2009-20 10 school year?
3. How has the building administrator been involved in the implementation of the district-designed intervention (RtI) model?
4. How have the teachers in their respective buildings used the district-designed intervention (RtI) model?
Cross-Sectional
Cross-Sectional
Descriptive Non-experimental TY pe 2 (Johnson, 2001)
Descriptive Non-experimental Type 2 (Johnson, 200 1 )
Descriptive Non-experimental
Descriptive Non-experimental
District data BEDS NYSED VADIR 2009-20 10
District data BEDS NYSED VADIR 2009-20 10
Structured Interviews
Open ended interviews Instructional Support Team
Structured Interviews
Open ended interviews Instructional Support Team
Descriptive analysis Inferential Statistics Repeated Measures; ANCOVA
Descriptive analysis Inferential Statistics Repeated
Measures; ANCOVA
Descriptive analyses, Interviews
Transcriptions ACH Analysis of Competing Hypotheses (Heuer, 1976)
Descriptive analyses, Interviews Transcriptions Using ACH Analysis of Competing Hypotheses
-- (Heurer, 1976)

Table 14 provides the reader with a visual representation of how the questions
that guided this study were answered: time dimension employed, the design and data
collection methods, statistical analysis, and the methodology employed to analyze the
information to answer all questions that guided the study.
Data Analysis and Results
Research Question Number 1 How has achievement as defined by scores attained by students referred to IST on
the NYS English Language Arts (ELA) and NYS Math assessments of RCELD
students been influenced following the use of the implementation of a district-
designed intervention model in grades 5-9 during the school year 2009-2010?
The researcher collected data from the district's data repository system and data
that have already been reported to the NYS Education Department. A null hypothesis
was developed.
The null hypotheses NO states: IST intervention had no influence on the
achievement of RCELD male students as measured by the scores on the NYS ELA and
Math exams for the 2008-2009 and 2009-2010 school years.
To answer question number one, the null hypothesis, separate Repeated Measures
Analysis of Covariance (ANCOVA) were performed for the NYS ELA and NYS Math
Assessments, examining two points in time 2008-2009 and 2009-2010. The ANCOVA
analyses were used to determine if achievement, as measured by a change in the raw

scores attained on the NYS assessments, differed significantIy for the students who were
referred to IST from one year to the next.
In the proposed analysis, the dependent variables were achievement scores, while
the independent variable was IST participation (represented by time; i.e., pre- and post-
IST), and several covariates were tested for their influence on academic achievement.
Additionally, demographics were also tested for interaction effects, to determine if the
impact that the IST had varied by these demographics. Covariates that were examined
included etknicity, gender, grade, LEP, and SES. Since the sample size of the current
analysis was somewhat modest (n = 66), covariates were tested separately in analysis, as
a model that included dl covariates would lack statistical power to detect significance.
The mean scores for ELA, compared by gender (maIes to females), are presented
in Table 15. Results of Repeated Measures (ANCOVA) are reported for both within-
subjects effects (2008-2009 vs. 2008-2009) and between-subjects effects (male/female).

Table 15 Descriptive Statistics for ELA scores for 2008-2009 and 2009-2010, compared by gender
Student N Mean Std. SexIGender Deviation
ELA Raw Score Male 28 29.948 28 Female Total 55 23,737 55
ELA Raw Score Male 28 14.212 28 Female 27 2 1,808 27 Total 55 18.189 55
Within-subjects results indicated that ELA scores did not change significantly
from the 2008 - 2009 to the 2008 - 2009 school year (Pillai's Trace=.020, F[lJ=1.071,
p.05; Table 16), holding gender constant. Additionally, results also indicated that the
change in ELA scores over time did not significantly vary by gender, as the interaction
term of "The*Genderw was not significant (Pillai's Trace=.022, F[1]=1.206, p.05;
Table 16).

Table 16
Testing of Within-Subjects Efects of Change in ELA Scores over Time and of the Time-by-Gender Interaction
Hypothesis Error Effect Value F d f d f Sig. Time Pillai's Trace .020 1.071 1.000 53.000 .305
Wilks' Lambda .980 1.071 1.000 53.000 ,305 Hotel ling's Trace .020 1.071 1.000 53.000 ,305 Roy's Largest Root ,020 1.071 1 .OOO 53.000 305
Time * Gender Pillai's Trace ,022 1.206 1 .OOO 53.000 .277 Wilks' Lambda ,978 1.206 1.000 53.000 ,277 Hotelling's Trace ,023 1.206 1.000 53.000 ,277 Roy's Largest Root .023 1.206 1.000 53.000 ,277
Changes in ELA scores over time, compared by male and female, were plotted in
a line graph (Figure 3) and support these conclusions, showing that the growth trajectory
of ELA scores was approximately equivalent between males and females. Figure 3 also
demonstrated that neither males nor females experienced substantial change in score
between years.

Estimated Marginal Means of ELA Student
SexlGende - rvtals - - - Felmle
1- I 1 2
Time
Figure 3 Estimated marginal means of ELA, comparing student gender
This figure shows the estimated marginal means of ELA by comparing male and
female scores over two points in time: 2008-2009 (Time 1) and 2009-2010 (Time 2).

Between-subjects effects determine whether the mean ELA scores were
significantly different between gender groups (male vs. female, Table 17). Between-
subjects effects are first tested for overall effects (omnibus effects), and then tested
separately at each year if the omnibus effects are found to be significant. If omnibus
differences are not found to be significant, individual comparisons by year were not
considered valid and were not examined. Results indicated that there were no significant
omnibus effects by gender (F[1] =.203, p>.05; Table 17); indicating that males and
females did not significantly differ in their ELA scores. These findings supported lack of
apparent differences in group mean scores at either time point in Figure 3.
Table 17
Tests of Between-Subjects Effects of Gender on ELA Scores
Measure: ELA Transformed Variable: Average
Source Type TI1 Sum d f Mean Square F Sig. of Squares
Intercept 2323 1 14 1 $37 1 2323 1 141 337 82762.222 .OOO ~ e n d e i 57.037 1 57.037 .203 ,654 Error 14876.963 5 3 280.697

Next, differences between males and females were further examined, comparing
changes in math scores from 2008-2009 to 2008-2009. Descriptive statistics are presented
in Table 18. Results of Repeated Measures (ANCOVA) with within-subjects effects for
math scores (2008- 2009 vs. 2000-2010) and between-subjects effects of gender
(male/female) are presented in Table 19.
Table 18
Descriptive Sdatistics for Math scores for 2008 - 2009 and 2009 - 2010, compared by gender
Student SedGender Mean Std. Deviation N
Math Raw Score Male 653.52 26.345 29 2008 2009 Female 642.64 42.168 28
Total 648.18 35.134 57 Math Raw Score Male 657.97 20.566 29 2009 - 201 0 Female 645.14 2 1.739 28
Total 65 1.67 21.935 5 7
Within-subjects results indicated that math scores did not significantly change
fiom the 2008-2009 to the 2009-2010 school year (Pillai's Trace = 009, F[l] = 0.497,
p>.05; Table 19), holding gender constant. Additionally, results also indicated that the
change in Math scores over time did not significantly vary by gender, as the interaction
term of "Time*GenderW was not significant (Pillai's Trace =.001, F[l] = 0.039, p>.05;
Table 19).

Table 19
Testing of Within-Subjects Effects of Change in Math Scores over Time and of the Time- by-Gender Interaction.
Multivariate ~ e s t s ~ - - -- -- -
Error Effect Value F Hypothesis df df Sig. Time Pillai's Trace ,009 .497" 1.000 55.000 ,484
WiIks' Lambda .99I ,497a 1.000 55.000 ,484 Hotelling's Trace .009 .497a 1.000 55.000 .484 Roy's Largest .009 ,039" 1,000 55.000 .484 Root
Time * Gender Pillai's Trace ,001 ,039" 1.000 55.000 .844 Wilks' Lambda ,999 ,039" 1,000 55.000 344 HoteIling's Trace .001 .03ga 1.000 55.000 .844 Roy's Largest .OO 1 1.000 55.000 ,844 Root
a. Exact statistic b. Design: Intercept + Gender; Within Subjects Design: Time
Changes in math scores over time, compared by male and female, were plotted in
a line graph (Figure 4) and support these conclusions, showing that the growth trajectory
of math scores was approximately equivalent between males and females. Figure 4 also
demonstrated that neither males nor females experienced substantial change in score
between years.

Figure 4 Estimated marginal means of math, comparing student gender
This figure shows the estimated marginal means of Math by comparing male and
female scores over two points in time: 2008-2009 (Time 1) 2009-201 0 (Time 2).

Between-subjects effects determine whether the mean math scores were
significantly different between gender groups (male vs. female, Table 20). Between-
subjects effects are first tested for overall effects (omnibus effects), and then tested
separately at each year if the omnibus effects are found to be significant. If omnibus
differences are not found to be significant, individual comparisons by year were not
considered valid and were not examined. Results indicated that there were significant
omnibus effects by gender (Fill =.4.077, p<.05; Table 20), indicating that males and
females significantly differed in their math scores. .These findings are M e r supported
by the differences between group mean scores at both time points, which are evident in
Figure 4. Specifically, during the 2008-2009 school year male students (M = 653.52,
SD=26,345) demonstrated higher math raw test scores than did female students (M =
642.64, SD=42.168). A similar trend was observed during the 2008-2009 school year, as
male students (M=657.97, SD=20.566) earned higher math scores than did female
students (M=645.14, SD=21.739).

Tests of Between-Subjects Eflects of Gender on Math Score
Type 111 Sum of Source Squares d f Mean Square F Sig. Intercept 2.406E7 1 2.406E7 49048.789 .OOO Gender 1999.906 1 1999.906 4,077 .048 Error 26980.989 55 490.563
The ELA and math scores were also examined, respectively, for their change over
time, relative to the student's Limited English Proficiency (LEP) status. Mean scores for
ELA, compared by LEP status (LEP to non-LEP), are presented in Table 2 1. Results of
Repeated Measures (ANCOVA) are reported for both within-subjects effects (2008-2009
vs. 2009-201 0) and between-subjects effects (LEP vs. non-LEP).

Table 2 1
Descriptive Statistics for ELA Scores for 2008-2009 and 2009-2010, compared by LEP status
Limited English Proficient (LEP) Mean Std. Deviation N
ELA Raw Score No 652.79 19.557 47 2008-2009 Yes 620.88 28.955 8
Total 648.15 23.737 55 ELA Raw Score No 653.57 18.387 47 2009-201 0 Yes 641.75 13.926 8
Total 651.85 18.189 55
Within-subjects results indicated that ELA scores changed significantly from the
2008-2009 to the 2009-201 0 school year (Pillai's Trace=.086, F[1]=4.988, p<.05; Table
22), holding LEP status constant. Additionally, results also indicated that the change in
ELA scores over time significantly varied by LEP group, as the interaction term of
"Time*LEPW was significant (Pillai's Trace=.075, F[1]=4.289, pC.05; Table 22).
Changes in ELA scores over time, compared by LEP and non-LEP, were plotted in a line
graph (Figure 5) and support these concIusions, showing that the growth trajectory of
ELA scores differed between LEP and non-LEP. Specifically, Figure 5 shows that the
gap in ELA scores between students LEP status (M= 620.88, SD=28.955) and students
considered non- LEP (W652.79, SW19.557) was widest during the 2008-2009 school
year, while the gap diminished during the 2009-201 0 school year. Non-LEP students
experienced little or no change in their math scores for the 2008-2009 school year
(M=653.57, SD=18.387), while LEP students saw an increase in scores over time
(M=641.75, SD=13.926; Table 22; Figure 5).

Table 22.
Testing of Within-Subjects Efects of Change in ELA Scores over Time and of the Time- by-LEP Status Interaction Multivariate ~ e s t s ~ Effect Hypothesis Error
VaIue F d f df Sig. Time Pillai's Trace .086 4.988" 1.000 53.000 .030
Wilks' Lambda .914 4.988" 1.000 53.000 .030 Hotelling's Tr'ace .094 4.988" 1.000 53.000 ,030 Roy's Largest Root .094 4.988" 1.000 53.000 .030
Time * LEP PilIai's Trace ,075 4.289a 1.000 53.000 ,043 Wilks' Lambda ,925 4.28ga 1.000 53.000 .043 Hotelling's Trace .081 4.289' 1.000 53.000 .043 Roy's Largest Root .081 4.289a 1.000 ' 53.000 .043
a. Exact statistic b. Design: Intercept + LEP; Within Subjects Design:

Estimated Marginal Means of ELA
C I 1 1 2
Time
Figure 5 ~stirnated marginal means of ELA, comparing student LEP status (LEP to shdents not considered LEP)
This figure shows the estimated marginal means of EI,A by comparing scores of
students' LEP status over two points in time: 2008-2009 (Time 1) 2009-201 0 (Time 2).

Between-subjects effects determine whether the mean ELA scores were
significantly different between LEP groups (LEP and non-LEP, Table 23). Between-
subjects effects are first tested for overall effects (omnibus effects), and then tested
separately each year if the omnibus effects are found to be significant. If omnibus
differences are not found to be significant, individual comparisons by year were not
considered valid and were not examined. Results indicated that there were no significant
omnibus effects by LEP (F[1]=14.855, p<.05), indicating that males and females did not
significantly differ in their ELA scores. These findings are further supported by the lack
of apparent differences in group mean scores at either time point in Figure 5.

Table 23
Tests of Between-Subjects Eflects of LEP on ELA Score
Dependent Parameter 95% C.I. Variable Lower Upper
B S.E. t Sig. Bound Bound ELA Raw Score Intercep 620.875 7.439 83.464 .000 605.955 635.795 2008 - 2009 t
[LEP=O] 31.912 8.047 3.966 .000 15.772 48.053 [LEP= I] Oa
ELA Raw Score Intercept 641.750 6.3 15 101 -623 .000 629.084 654.416 2009 2010 bEP=O] 11.824 6.831 1.731 .089 -1.878 25.526
[LEP= I] Oa This parameter is set to zero because it is redundant.
Mean scores for math, compared by LEP status (LEP to non-LEP), are presented
in Table 24. Results of Repeated Measures (ANCOVA) are reported for both within-
subjects effects (2008-2009 vs. 2009-2010) and between-subjects effects (LEP vs. non-
LEP).

Table 24
Descri,ptive Statisticsfor Math scores.fir 2008-2009 aid 2009-201 0, comp&ed by LEP status
Limited English Std. Proficient (LEP) Mean Deviation N
Math Raw Score No 649.98 36.740 48 2008 - 2009 Yes
Total 648.1 8 35.134 57 Math Raw Score , No 653.98 20.793 48 2009 - 2010 Yes 639.33 24.995 9
Total 65 1.67 21.935 57
Within-subjects results indicated that math scores did not change significantly
fiom the 2008-2009 to the 2009-20 10 school year (Pillai's Trace=.002, F[l]=O. 125,
p>.05; Table 25, holding LEP status constant. Additionally, results also indicated that the
change in math scores over time did not vary significantly by LEP status, as the
interaction term of "Time*LEP" was not significant (PiIlai's Trace=.00 1, F[1]=0.057,
p.05; Table 25).
Changes in math scores over time, compared by LEP to non-LEP students, were
plotted in a line graph (Figure 6) and support these conclusions, showing that the growth
trajectory of math scores was approximately equivalent between LEP and non-LEP
students. Figure 6 also demonstrated that neither LEP nor non-LEP students experienced
substantial change in score between years.

Table 25
Testing of Within-Subject Eflects of Change in Math Scores over Time and of the Tirne- by-LEP Status Interaction
Effect Hypothesis Error Value F d f d f Sig.
Time Pillai's Trace .002 .125a 1.000 55.000 .725 Wilks' Lambda .998 ,125a 1.000 55.000 .725 Hotelling's Trace . ,002 .125a 1.000 55.000 ,725 Roy's Largest Root .002 . .125" 1.000 55.000 .725
Time * LEP Pillai's Trace .001 ,057" 1,000 55.000 ,812 Wilks' Lambda ,999 .057" 1.000 55.000 ,812 Hotelling's Trace ,001 ,057a 1.000 5.5.000 ,812 Roy's Largest Root .001 .057" 1.000 55.000 ,812
Levene's Test of Equality of Error Variancesa
Between-subjects effects determine whether the mean math scores were not
significantly different between LEP status groups (LEP to non-LEP, Table 26). Between-
subjects effects are first tested for overall effects (omnibus effects) and then tested
separately each year if the omnibus effects are found to be significant. If omnibus
differences are not found to be significant, individual comparisons by year were not
considered valid and were not examined. Results indicated that there were no significant
omnibus effects by LEP status (F[1]=2.557, p>.05; Table 26), indicating that LEP and
non-LEP students did not significantly differ in their math scores. These f ndings are
further supported by the lack of apparent differences between group mean scores at either
time point in Figure 6.

Estimated Maralnal Means of Math Limited
Pro ~cient (LE P) - No
Yes
Time
Figure 6 Estimated marginal means of math, comparing scores of student LEP status
This figure shows the estimated marginal means of math by comparing scores of
students considering their LEP status over two points in time: 2008-2009 (Time 1) 2009-
20 10 (Time 2); yes, considered LEP; no, considered non-LEP.

Table 26
Tests of Between-Subjects Effects of LEP Status on Math Scores
Source Type I11 Sum of Squares d f Mean Square F Sig.
Intercept 12630192.781 1 12630192.781 25084.157 ,000 LEP 1287.693 1 1287.693 2.557 ,116 Error 27693.20 1 5 5 503.513
The ELA and math scores were also examined, respectively, for their change over
time, relative to the student's grade in school (grades 5-8). Mean scores for ELA,
compared by grade, are presented in Table 27. Results of Repeated Measures
(ANCOVA) are reported for both within-subjects effects (2008-2009 vs. 2009-2010) and
between-subjects effects (grade).
Table 27
Descriptive Statisticsfor ELA Scores for 2008-2009 and 2009-201 0, compared by Grade Student Grade Mean Std. Deviation N
ELA Raw Score 5 646.70 36.222 20 2008-2009 6 652.14 1 1.097 7
7 642,3 6 9.636 11 8 65 1.94 13.836 17 Total 648.15 23.737 5 5
ELA Raw Score 2009-201 0
5 656.25 12.238 20 6 635.43 32.928 7 7 650.82 8.852 11 8 654.12 18.296 17 Total 651.85 18.189 55
Within-subjects results indicated that ELA scores did not significantly change
from the 2008-2009 to the 2009-2010 school year (Pillai's Trace=.001, F[1]=0.054,
p>.05; Table 28). Additionally, results also indicated that the change in ELA scores over

time did not significantly vary by grade, as the interaction term of "Time*GradeW was not
significant (Pillai's Trace=. 106, F[1]=2.007, p>.05; Table 28).
Table 28
Testing of Within-Subject Efects of Change in ELA Scores over Time and of the Tirne- by-Grade Interaction
Effect Hypothesis Error Value F d f d f Sig, .,
Time Pillaifs Trace .001 ,054a 1.000 51.000 .817 Wilksf Lambda ,999 .054a 1.000 51.000 .817 Hotelling's Trace .001 .054a 1.000 51.000 ,817 Roy's Largest Root .OO 1 .054a 1.000 51.000 317
Time * grade Pillai's Trace ,106 2.007a 3.000 51.000 .I25 Wilks' Lambda 394 2.007a 3.000 51.000 .I25 Hotelling's Trace .I18 2.007a 3.000 51.000 .I25 Roy's Largest Root .I1 8 2.007a 3.000 51.000 .I25
a. Exact statistic b. Design: Intercept + grade; Within Subjects Design: Time
Changes in ELA scores over time, compared by grade, were plotted in a line
graph (Figure 7) and support these conclusions, showing that the growth trajectory of
ELA scores was approximately equivalent between students of different grade levels.
Although some modest differences in trajectory are evident in Figure 7 between students
of different grade levels, the differences were not statistically significant. It should be
noted that the sample size of the current analysis was not large and failure to find
significance, in some instances, may be related to a lack of power.

Estimated Marginal Means of ELA
I 2
Time
Figure 7 Estimated marginal means of ELA, comparing scores by grade level
This figure shows the estimated marginal means of ELA by comparing scores by
students' grade level over two points in time: 2008-2009 (Time 1) 2009-2010 (Time 2).

Between-subjects effects determine whether the mean ELA scores were
significantly different between students of different grade levels. Between-subjects
effects are first tested for overall effects (omnibus effects) and then tested separately each
year if the omnibus effects are found to be significant. If omnibus differences are not
found to be significant, individual comparisons by year were not considered valid and
were not examined. Results indicated that there were no significant omnibus effects by
grade (F[1]=.709, p>.05; Table 29), indicating that students of different grades did not
differ significantly in their ELA scores. These findings are further supported by the lack
of substantial differences between group mean scores for students from different grades
at either time point in Figure 7.
Table 29
Tests of ~e?weei+~ubjecrs Effects of Grade on ELA Scores
Source Type I11 Mean Sum of Squares d f Square F Sig.
Intercept 19654433.1 16 1 19654433.1 16 6991 8.693 .OOO grade 597.690 3 199.230 .709 3 1 Error 14336.3 10 5 1 281.104
The mean scores for math, compared by grade, are presented in Table 30. Results
of Repeated Measures (ANCOVA) are reported for both within-subjects effects (2008-
2009 vs. 2009-20 10) and between-subjects effects (grade).
Within-subjects results indicated that math scores did not significantly change
fiom the 2008-2009 to the 2009-2010 school year (Pillai's Trace=.046, F[1]=2.577,
p>.05; Table 3 1). Additionally, results also indicated that the change in math scores over

time varied significantly by grade, as the interaction term of ."Time* Grade" was
significant (Pillai's Trace=. 137, F[1]=2.803, pc.05; Table 3 1).
Table 30
Descriptive Statistics for Math Scores for 2008-2009 and 2009-2010, compared by grade
Student Grade M SD N
Math Raw Score 5 2008-2009 6
7 8 Total
Math Raw Score 5 2009-20 10 6
7 8 Total
Table 3 1
Testing of Within Subject Effects of Change in Math Scores over Time and of the Time- by-Grnde Interaction
Hypothesis Error Effect Value F d f d f Sig. Time Pillai's Trace 046 2.577a 1.000 53.000 ,114
Wilks' Lambda 954 2.577a 1.000 53.000 ,114 Hotelling's Trace 049 2.577a 1.000 53.000 .I14 Roy's Largest 049 2.803a 1.000 53.000 .I14 Root
Time * grade PiIlai's Trace 137 2.803' 3.000 53.000 .049 Wilks' Lambda 863 2.803a 3.000 53.000 .049 Hotelling's Trace 159 2.803a 3.000 53.000 ,049 Roy's Largest 159 3.000 53.000 .049 Root
a. Exact statistic b. Design: Intercept + grade; Within Subjects Design: Time

Changes in math scores over time,'compared by grade, were plotted in a line
graph (Figure 8) and support these conclusions, showing that the growth trajectory of
math scores was somewhat different between students of different grade levels (Figure
8). The figure demonstrates that the greatest gains in math scores were experienced by 61h
graders, while modest gains were also seen in 7'" graders (Figure 8) and 5th and
graders experienced a slight decline or no change, respectively (Figure 8).

Estimated MargInaI Mcaiis of Math
Figure 8 Estimated marginal means of math, comparing scores by grade level
This figure shows the estimated marginal means of math by comparing scores by
students' grade level over two points in time: 2008-2009 (Time 1 ) 2009-201 0 (Time 2).

Between-subjects effects determine whether the mean math scores were
significantiy different between students of different grade levels. Between-subjects
effects are first tested for overall effects (omnibus effects), and then tested separately
each year if the omnibus effects are found to be significant. If omnibus differences are
not found to be significant, individual comparisons by year were not considered valid and
were not examined. Results indicated that there were no significant omnibus effects by
grade (F[l)=.819, p>.05; Table 32), indicating that students of different grades did not
significantly differ in their math scores, even though they did differ at the rate at which
their math scores changed over time (within-subjects effects).
Table 32
Tests of Between-Subjects Eflects of Grade on Math Scores Measure: Math Transformed Variable: Average
Type 111 Sum of Source Squares df Mean Square F Sig. -- - - - - - - -
Intercept 2094961 7.975 T 20949617.975 40088.604 .OOO grade Error
Socio-economic status (SES) was also examined as a covariate of the change of
ELA and Math scores over time, with students dichotomized into "FreeIReduced"
(received free or reduced lunch) and "Not FreeReduced." The mean scores for ELA,
compared by SES (received free or reduced lunch) are presented in Table 33.

Table 33
Descriptive Statistics for ELA Scores for 2008-2009 and 2009-201 0, Ccompared by SES
SES M SD N
ELA Raw Score Not 659.94 18.257 17 2008 - 2009 FreeReduced
FreeJReduced 642.87 24.200 38 Total 648.15 23.737 5 5
ELA Raw Score Not 657.00 15.383 17 2009 20 10 FreeReduced
FreeReduced 649.55 19.050 38 Total 65 1.85 18.189 55
Within-subjects results indicated that ELA scores did not significantly change
from the 2008-2009 to the 2009-2010 school year (Pillai's Trace=.005, F[1]=0.244,
p>.05; Table 34). Additionally, results also indicated that the change in ELA scores over
time did not significantly vary by SES group, as the interaction term of "Time*SES" was
not significant (Pillai's Trace=.030, F[1]=1.6 13, p>.05; Table 34).

Table 34
Testing of Within-Subject Efects of Change in ELA Scores over Time and of the Time- by-SES Interaction
Hypothesis Error Effect Value F d f Df Sig. Time Pillai's Trace 005 ,244a 1.000 53.000 .623
Wilks' Lambda 995 .244a 1.000 53.000 ,623 Hotelling's Trace 005 .244a 1.000 53.000 ,623 Roy's Largest 1.613a 1.000 53.000 .623 Root 005
Time*SES Pillai's Trace .030 I.613a 1.000 53.000 ,210 Wilks' Lambda .970 1.613a 1.000 53.000 .210 Hotelling's Trace ,030 1.61 3* 1.000 53.000 .210 Roy's Largest .030 1 .OOO 53.000 .210
a. Exact statistic b. Design: Intercept + SES; Within Subjects Design: Time
Between-subjects effects determine whether the mean ELA scores were
significantly different between SES groups (FredReduced vs. Not FreelReduced).
Between-subjects effects are first tested for overall effects (omnibus effects), and then
tested separately each year if the omnibus effects are found to be significant. If omnibus
differences are not found to be significant, individual comparisons by year were not
considered valid and were not examined. Resuits indicated that there were significant
omnibus effects by SES group (F[1]=7.105, pC.05; Table 3 9 , indicating that students in
the "Free/Reduced" group significantiy differed in their ELA scores, when compared to
students from the "Not FreeIReduced" group. These findings are further supported by the
moderate differences in group mean scores at either time point in Figure 9.

Estimated Marginal Means of ELA I
Student Social Eco~ian i ic Inclicator
-Not Considered SES .--- Free Lunch - Reduced Priced Lunch
Time
Figure 9 Estimated marginal means of ELA comparing scores by SES
This figure shows the estimated marginal means of ELA by comparing scores by
students' grade level over two points in time: 2008-2009 (Time 1) 2009-2010 (Time 2).

Table 35
Tests of Between-Subjects Eflects of SES on ELA Scores
Type I11 Sum of Source Squares . d f Mean Square F Sig. Intercept 1.999E7 1 1.999E7 80466.749 .OOO SES 1765.449 1 1765.449 7,105 ,010 Error 13168.551 5 3 248.463 .
Since significant omnibus between-subjects effects were found (Table 35), each
year was analyzed individually to determine the nature of the overall differences between
SES groups (Table 35). Results of this univariate analysis indicated that students of
differing SES status only differed from one another during the 2008-2009 school year
(B=17.073, SE=6.586, p<.05), as students from the "not freelreduced" group
demonstrated significantly higher ELA scores. However, analysis of the 2009-2010
school year indicated that these differences were diminished over time and were no
longer detectable as statistically significant.
Changes in ELA scores over time, compared by SES group, were plotted in a line
graph (Figure 9) and supported the conclusions that the change in ELA scores did not
vary by SES group, showing that the growth trajectory of ELA scores was approximately
equivalent between the "free/reduced" group and the "not free/reducedW group
(Figure 9).
The mean scores for math, compared by SES, are presented in Table 36. Results
of Repeated Measures (ANCOVA) are reported for both within-subjects effects (2008-
2009 vs. 2009-2010) and between-subjects effects (freelreduced vs. not freelreduced).

Table 36
Descriptive Statistics for Math Scores for 2008-2009 and 2009-2010, Compared by SES
SES ' M SD N MATH Raw Score Not Low SES 662.1 1 23.992 18 2008 - 2009 Low SES 64 1 -74 37.778 39
Total 648.18 35.134 57 MATH Raw Score Not Low SES 657.67 16.691 18 2009 - 201 0 Low SES 648.90 23.654 3 9
Total 65 1.67 2 1.935 57
Within-subjects results indicated that ELA scores did not significantly change
from the 2008-2009 to the 2009-2010 school year (Pillai's Trace=.001, F[1]=0.067,
pj.05; Table 37). Additionally, results also indicated that the change in math scores over
time did not significantly vary by SES, as the interaction term of "Time*SESW was not
significant (Pillai's Trace=.022, F[1]=1.222, p>.05; Table 37).

Table 37
Testing of Within-Subject Effects of Change in Math Scores over Time and of the Time- by-SES ln teraction
Hypothesis Error Effect Value F d f d f Sig. Time Pillai's Trace .OO 1 .067a 1.000 55.000 ,797
Wilks' Lambda .999 .067a 1.000 55.000 .797 Hotelling's Trace .OO 1 .067a 1.000 55.000 .797 Roy's Largest .001 1.222a 1.000 55.000 ,797 Root
Time * SES Pillai's Trace .022 1.222a 1.000 55.000 .274 Wilks' Lambda .978 1.222a 1.000 55.000 .274 Hotelling's Trace .022 1 .222a 1.000 55.000 ,274 Roy's Largest .022 1 .OOO 55.000 .274 Root
a. Exact statistic b. Design: Intercept + SES; Within Subjects Design: Time
Between-subjects effects determine whether the mean math scores were
significantly different between SES groups (freelreduced vs. not freeheduced). Between-
subjects effects are first tested for overall effects (omnibus effects), and then tested
separately each year if the omnibus effects are found to be significant. If omnibus
differences are not found to be significant, individual comparisons by year were not
considered valid and were not examined. Results indicated that there were significant
omnibus effects by SES group (F[l]=5.452, pC.05; Table 38), indicating that students in
the "free/reduced" group significantly differed in their math scores, when compared to
students from the "not" freelreduced" group. These findings are fhrther supported by the
moderate differences between group mean scores at either time point in Figure 10.

Changes in math scores over time, compared by SES group, were plotted in a line
graph Figure 10) and supported the conclusions that the change in math scores did not
vary by SES group, showing that the growth trajectory of math scores was approximately
equivalent between the "fiee/reduced" group and the "not freeheduced"
group (Figure 10).

Rccodsd SES (1wo ICVC~S) - No1 Low SLiS - -. - LO\\. SliS
Figure 10 Estimated marginal means of math, comparing scores by SES
This figure shows the estimated marginal means of math by comparing scores by
students' grade level over two points in time: 2008-2009 (Time 1) 2009-2010 (Time 2).

Since significant omnibus between-subjects effects were found (Table 38), the
math score from each year was analyzed individuaIly to determine the nature of the
overall differences between SES groups (Table 38). Results of this univariate analysis
were similar to that of ELA, as students of differing SES status only differed from one
another during the 2008-2009 school year (B=20.368, SE=9.722, p<.05) and students
from the "Not FreeReduced group demonstrated significantly higher math scores.
However, analysis of the 2009-2010 school year indicated that these differences were
diminished over time and were no longer statistically significant during the second year
of the study.
Table 3 8
Tests of Between-Subjects Eflects of SES on Math Scores
95% Confidence Interval
Dependent Std. Lower Upper Variable Parameter B Error t Sig;. Bound Bound Math Raw Intercept 641.744 5.463 1 17.468 .000 630.795 652.692 Score 2008 [SES=.OO] 20.368 9.722 2.095 .041 .885 39.850 2009 [SES= 1-00] Math Raw Intercept 648.897 3.481 186.390 .000 641.921 655.874 Score 2009 - [SES=.OO] 8.769 6.195 1.415 .I63 -3.646 21.185 2010 [SES=1.00] This parameter is set to zero because it is redundant.

The mean scores for ELA, compared by ethnicity (minority vs. non-minority) are
presented in Table 39. The ethnicity variable was re-coded from Caucasian, African
American and Hispanic to two variables, minority and non-minority. Results of Repeated
Measures (ANCOVA) are reported for both within-subjects effects (2008-2009 and 2009-
2010) school years and between-subjects effects (minority to non-minority).
Table 39
Descriptive Statistics Recoded Ethnicity Minority (1) Non- Minority(0) Std.
Mean Deviation N ELA Raw Score .OO 662.75 22.613 8 2008 - 2009 1 .OO 645.66 23.242 4 7
Total 648.15 23.737 5 5 ELA Raw Score .OO 661.38 16.509 8 2009 2010 1 .OO 650.23 18.123 4 7
Total 65 1.85 18.189 55
Within subjects results indicated that ELA scores did not differ significantly fiom
the 2008-2009 and 2009-20 10 school years (Pillai's Trace = .002,F[l]=. 10 1, p>.05; Table
40), holding ethnicity constant. Additionally, results also indicated the change in ELA
scores over time did not vary significantly by ethnicity, as the interaction term of "Time-
Ethnicity R" was not significant (Pillai's Trace = .007,F[I]=.350 p >.05.

Table 40
Testing of Within Subject Effects of Change in ELA Scores over Time and of the Time-by Ethnicity R Interaction ~ultivar%e ~ e s t s ~
Hypothesis Error Effect Value F d f df Sig. Time Pillai's Trace .002 .lOla 1.000 53.000 .751
Wilks' Lambda ,998 .1Ola 1.000 53.000 ,751 Hotelling's Trace .002 ,10 1 a 1,000 53.000 .751 Roy's Largest .002 .350a 1.000 53.000 .751 Root
Time * PiIlai's Trace ,007 ,350a 1.000 53.000 ,556 E thn ic i t~ r Wilks' Lambda .993 ,350a 1.000 53.000 .556
HotelIing's Trace ,007 .350a 1.000 53.000 .556 Roy's Largest ,007 1.000 53.000 .556
a. Exact statistic b. Design: Intercept + Ethnicity-r Within Subjects Design: Time
Between-subjects effects determine whether the mean ELA scores were
significantly different between ethnicity groups (minority vs. non-minority). Between-
subjects effects are first tested for overall effects (omnibus effects), and then tested
separately each year if the omnibus effects are found to be significant. If omnibus
differences are not found to be significant, individual comparisons by year were not
considered valid and were not examined. Results indicated that there were significant
omnibus effects by ethnicity group (F[1]=5.3 19, p<.05; Table 41), indicating that
students in the minority group significantly differed in their ELA scores, when compared
to students from the non-minority group. These findings are further supported by the
moderate differences between group mean scores at either point in Figure 1 1.

Recotled Ethniqity Ivlinonty vs Non Minority
Time
Figure 11 Estimated marginal means of ELA, comparing scores by ethnicity (minority status)
This figure shows the estimated marginal means of ELA, comparing scores by
students' ethnicity over two points in time: 2008-2009 (Time 1) 2009-2010 (Time 2).

Table 41
5 Type 111 Sum of
Source Squares F Sig. Intercept 1 1732050.364 1 11 732050.364 45815.369 ,000 Ethnicity-r 1362.164 1 1362.164 5,319 ,025 Error 13571.836 5 3 256.072
Since significant omnibus between-subjects effects were found (Table 41), each
year was analyzed individually to determine the nature of the overall differences between
ethnicity groups (Table 41). Results of this univariate analysis indicated that students of
differing ethnicity status only differed from one another during the 2008-2009 school
year (Table 42; B=17.090, SE=8.858, p=0.059), and that difference only approached
significance in 2008-2009 (Table 42). In that year, non-minority students scored higher
than minority students on ELA (Table 42). The non-significant difference found in the
2009- 2010 school year (Table 42) between ethnicity groups indicates that those
differences were ameliorated over time.

Table 42
Parameter Estimates of Univariate Effects of Ethnicity, Separately by School Year.
-
95% Confidence Interval
Dependent Std. Lower Upper Variable Parameter B Error t Sie. Bound Bound ELA Raw Intercept 6 4 5 . 6 6 0 3.378 191.125 ,000 638.884 652.435 Score 2008 - [Ethnicity r= 01 17.090 8.858 1.929 ,059 -.676 34.857 2009 [ ~ t h n i c i G r = 11 ELA Raw Intercept 650.234 2.614 248.785 .OOO 644.992 655.476 Score 2009 [Ethnicity - r=.O] 11.141 6.853 1.626 ,110 -2.604 24.886 2010 [Ethnicity-r= 1 ] This parameter is set to zero because it is redundant.
Table 43
Descriptive Statistics
Std. Recoded Ethnicity M Deviation N
Math Raw Score 2008 Non-minority Student 664.25 16.705 8 2009 Minority Student 645.55 36.734 49
Total 648.1 8 35.134 57 Math Raw Score 2009 Non-minority Student 657.50 8.264 8 2010 Minority Student 650.71 23.341 49
Total 65 1.67 21.935 57
Within-subjects resuIts indicated that math scores did not differ significantly from
the 2008-2009 and 2009-2010 school years (Pillai's Trace = .000,F[1]=.013, p>.05; Table
43), holding ethnicity constant. Additionally, results also indicated the change in Math
scores over time did not vary significantly by ethnicity, as the interaction term of
"Time*Ethnicity - r" was not significant (Pillai's Trace = .013,F[1]=.713 p >.05). These
results indicate that the change in math scores (or lack thereof) over time did not vary by
ethnic group (Table 43).

Testing of Within-Subject Effects of Change in Math Scores over Time and of the Time- by-Ethnicity Interaction
Effect Value F Hvuothesis df Error df Sig. Time Pillai's Trace .000 .013a 1.000 55.000 ,911
Wilks' Lambda 1.000 ,013a 1.000 55.000 -91 1 Hotelling's Trace .000 .013a 1.000 55.000 ,911 Roy's Largest .000 .713a 1.000 55.000 .911 Root
- - - - - - - - - - - -
Time * Pillai's Trace .013 .713a 1.000 55.000 ,402 Ethnicity-R Wilks' Lambda .987 .713a 1.000 55.000 .402
Hotelling's Trace .0 13 .7 1 3a 1.000 55.000 .402 Roy's Largest ,013 1.000 55.000 ,402 Root
a. Exact statistic b. Design: Intercept + Ethnicity-R Within Subjects Design: Time
Between-subjects effects determine whether the mean math scores were
significantly different between ethnicity groups (minority vs. non-minority). Between-
subjects effects are first tested for overall effects (omnibus effects), and then tested
separately each year if the omnibus effects are found to be significant. If omnibus
differences are not found to be significant, individual comparisons by year were not
considered valid and were not examined. Results indicated that there were not significant
omnibus effects by ethnicity group (F[1]=2.204, p>.05; Table 44), indicating that
students in the minority group did not significantly differ in their math scores, when
compared to students from the non-minority group. These findings are fiuther supported
by the lack of substantial differences between group mean scores at either time point in
Figure 12.

Recoclecl Etlmicity (two levels) - Hon-~~inolity Shdent
---- Mumity Sh~dent
T h e
Figure 12 Estimated marginal means of math, comparing scores by ethnicity (minority status)
This figure shows the estimated marginal means of math by comparing scores by
students' ethnicity over two points in time: 2008-2009 (Time 1) 2009-2010 (Time 2).

Table 45
Tests of Between-Subjects Effects of Ethnicity on Math Scores.
Source Type I11 Sum Mean of Squares d f Square F Sig.
Intercept 1.178E7 1 1.178E7 23260.054 .OOO Ethnicity-r 1 1 16.632 1 1 1 16.632 2.204 .I43 Error 27864.263 55 506.623
Summary of Analysis for Question 1
First, it is important to note that in reviewing Frequency Table 9 the number of
students considered SES status referred to IST was n = 44 or 66.7%, while students not
considered SES was n = 22 or 33.3% . SES has been linked to poor achievement in
school. Regarding the number of students referred to IST considered non-minority was n
= 10 or 15.2% and minority was n = 56 or 56 % (Table 10) of the population of students
referred to IST. In addition, in looking at Table 1 1, grade was another focal detail was
that grade 5 and grade 8 students were n = 2 1 or 3 1.8% and n = 20 or 30.3% respectively,
making these two grades of the four grades studied the highest number of students
referred to IST
Results from the Repeated Measures of Covariance (ANCOVA) did not provide
evidence to reject the null hypothesis that there were no significant differences in student
achievement as measured by the NYS English Language Arts and Math assessments
scores found in students who were referred to IST. The results of a series of variables
tested to explore whether or not IST referral had any influence on achievement showed
that there were no significant changes in assessments scores.

For the limited English proficient status covariant, results showed that English
Language Arts scores changed significantly from 2008-2009 to 2009-201 0. Additionally,
results also indicated that the change in ELA scores over time varied significantly by LEP
group. These findings suggest that LEP students who were referred to IST demonstrated
achievement in ELA (Pillai's Trace=.086, F[1]=4.988, pc.05; Table 16), holding LEP
status constant. However, it is important to note that the percentage of LEP students was
15.2% compared to 84.8% non LEP status students. Students considered LEP showed
improvement, while RCELD students did not show any significant difference in scores in
either ELA or Math.
Between-subjects effects determine, whether the mean math scores were
significantly different between gender groups (male vs. female, Table 20). Between-
subjects effects are first tested for overall effects (omnibus effects), and then tested
separately each year if the omnibus effects are found to be significant. If omnibus
differences are not found to be significant, individual comparisons by year were not
considered vaIid and were not examined. Results indicated that there were significant
omnibus effects by gender (F[1]=.4.077, p<.05; Table 20)' indicating that males and
females significantly differed in their math scores. These findings are fixther supported
by the differences between group mean scores at both time points, which are evident in
Figure 4. Specifically, during the 2008-2009 school year male students (M=653.52,
SD=26.345) demonstrated higher math raw test scores than did female students
(M=642.64, SD=42.168). A similar trend was observed during the 2008-2009 school

year, as male students (M=657.97, SD=20.566) earned higher math scores than did
female students (M=645.14, SD=21.739).
Research Question Number 2
How has the classification rate of RCELD students been influenced following the use of
the implementation of a district-designed intervention model in grades 5-9 during the
school year 2009-20 1 O?
To answer this question the researcher obtained quantitative data from the
District's Data Repository; these data were reported to NYS as part of the district profile
for accountability purposes. Statistical analyses were not used due to the modest sample
size of students in grades 5-9 referred to CSE during the 2009-2010 school year.
Table 46 Special Education Enrollment for Grades 5-9, 2007-2008,2008-2009 and 2009-2010 School Years
- Special Education
Population 2007-2008 2008-2009 2009-201 0
Grades: PK- 1 2 N = 1,463 1,372 1,315
Grades: 5-9 474 433 399
% of 5-9 Students Enrolled 32.39% 3 1.56% 30.34%
The district special education enrollment and the enrollment for grades 5-9 were
displayed in Table 40, showing a time duration of three years.
For PK-12 the total special education enrollment during the 2007-2008 and 2008-2009
school years decreased by n = 9 1 students, for 2008-2009 and 2009-20 10, the total special

education enrollment decreased by n = 57. Between the years 2007-2008 and 2008-2009
there was a decrease of .83% in the number of students in grades 5-9 enrolled in special
education. Between 2008-2009 and 2009-2010 there was a decrease of 2.05%.
For the year 2009-2010, n = 45 students in grades 5-9 were referred to CSE. Of
the 45 students referred to CSE, 25 were building-initiated and 20 were parent-initiated.
The CSE found 10 students ineligible for special education services and 3 8 were found
eligible. A breakdown of students classified by disability is as follows: Emotionally
Disturbed, n = 5, Learning Disabled, n = 23, Other Health Impaired, n = 5, Speech and
Language impaired, n = 3, Autism, n = 1 and one student was designated as 504.
In summary, it is important to note that there was a decrease in enrollment in
special education from the previous year. The number of African American students
referred to the CSE was n=5, (female, n=l and males, n=4), Caucasian, n=19; females, n =
7 and males, n=12; Hispanic, n=23; females, n= 6 and males, n= 17.
Research Questions 3 and 4
Questions 3 and 4 were analyzed using qualitative data. In conducting interviews
with building personnel, the researcher wanted to explore the level of involvement of the
building personnel in the implementation of the district-designed pyramid of intervention.
The researcher wanted to examine the processes and procedures implemented that might
have contributed to the achievement and classification rates of RCELD students into
special education. The interview protocols used were adapted from Mahabir (2009). Inter-
rater agreement was used to test the reliability of the interview questions, using three
raters to evaluate the instruments who provided the same judgments about the open-ended

questions to be used in the interviews for the qualitative portion of this study. The
purpose of piloting the interview instrument was to ensure that the interview participants
understood the wording of the questions, and that the questions were effectively designed
to gather the information presented by the research questions and the theoretical
framework guiding this study.
The Analysis of Competing Hypothesis (ACH) software program was used to
analyze the responses provided during interviews conducted with building volunteer
participants. The interviewees' answers were recorded and then transcribed. To maintain
confidentiality and anonymity, each participant was given a letter or number identification
in order to code their responses. This coding system was known only to the researcher.
These transcriptions were used as the "evidence" in the ACH software. The responses of
all participants were entered into a matrix using the ACH software. The matrix was
created using the participants' responses along with hypotheses that aligned with the
questions used in the interviews.
Research Question Number 3
How has the building administrator been involved in the implementation of the
district - designed intervention model?
The Analysis of Competing Hypothesis (ACH) software program was used to
analyze the responses provided during interviews conducted with building administrators
(n = 4). The matrix was created using the participants' responses along with eight
hypotheses developed. The hypotheses developed were written fiom the questions used

during the open-ended structured principal interviews (Appendix C), The administrator
matrix used to analyze the responses of the interviews consisted of n= 32 pieces of
evidence (respondents' answers) and cight hypotheses.
The evidence (n = 32) was assessed against the following hypotheses:
Student achievement did not determine the implementation of the district-designed
intervention.
The components of the Rtl structure used in your building were not determined by
building personnel,
There is no systematic process for when a student first shows signs of academic
difficulty.
Specific data are not collected often on all students.
Data collected are not analyzed to make decisions about student performance.
There is no consistency among the schools in the district as to what programs
(interventions) to include in the respective building RtI pyramid.
The building's RtI structure does not show a clear process (trajectory) to monitor
students' academic and behavioral progress.
Building leader is not directly involved in monitoring the Rtl process.

Inconsistencies per Hypothesis
Student achievement did not determine the implementation of the district-designed intervention.
The components of the RtI structure used in your building were not determined by building personnel.
There is no systematic process for when a student first shows signs of academic difficulty.
Specific data are not collected often on all students. Data collected are not analyzed to make decisions about student performance.
There is no consistency among the schools in the district as to what programs (interventions) to include in the respective building Rtl pyramid.
The building's RtI structure does not show a clear process (trajectory) to monitor students' academic and behavioraI progress.
Building leader is not directly involved in monitoring the RtI
Figure 13 Administrator Inconsistency Graph
Figure 13 shows the inconsistencies with the hypotheses stated relating to the
administrator interview questions.

To analyze the responses of the interviewed administrators against each
hypothesis, the researcher determined to divide the ratings into two groups: ratings of
inconsistencies that had ratings between 0-1 6.0 and those that had ratings greater than
16.5. Responses from the participants were used to reject or validate the hypotheses.
Hypothesis Number 1-Student achievement did not determine the implementation
of the district-designed intervention-had an inconsistency rating of 26.0, highlighting
that the statements made by the administrators interviewed were inconsistent with the
hypothesis. The following responses made by the interviewees are not consistent with
the stated hypothesis.
"Basically, initially, the determination was made based on, initially, some of the programs that we have in the three schools that the group felt were programs that were working, and the group felt were working and where they fit into the pyramid, but as time has moved on we have tried to evolve our pyramid to be more student specific."
"We needed a systematic way to address students that were not working irp to the ability of the curriculum and that were not having success in the classroom, and using the RtI structure, we were able to systematically look at ways to address students' weaknesses."
Hypothesis Number 8-Building leader is not directly involved in monitoring
the RtI process-received a rating of 26.0, highlighting that this hypothesis is
inconsistent with statements made by the administrators. Following are two intewiewees'
responses regarding the determination of programs or what components to implement
into the Rt1 structure.
"...at the building level, as we got a little more detail and building specific, it was myself as well as the School Improvement Team (SIPT), as well as input from the assistant principal."

". ..administrators, special education teachers, regular education teachers, and guidance counselors were involved; we had a number of teachers both from speciaI education teachers, who have been involved in success academies and programs like that."
Hypothesis Number 7-The building's RtI structure does not show a clear
process (trajectory) to monitor students' academic and behavioral progress-
received an inconsistency rating of 2 1.5. The following statements were examples made
by several interviewees:
"Well, initially we will look at information that we've compiled on the student, based on their previous years' academic year, school grades, scores on standardized assessments."
"The teachers are involved by providing interventions at the Tier 1 level basically for everyone in the classroom and by differentiating their instruction for students.. .also involved in providing other intervention programs such as the Read 180 and the Academic Intervention Services (AIS)."
"We looked at need, we looked at resources. We looked at availability in terms of what the district was supporting. So we have to use all those structures to try to figure out what we can use. For example, one of the reading interventions is also a multi-sensory reading intervention and is district-wide so we have to use what is provided to us."
Hypothesis Number 3-There is no systematic process for when a student first
shows signs of academic difficulty-received a rating of 20.0. The next few statements
were provided by several participants.
"...we put a manual that we created and we use in the building.. .We have conversations with the child, the parent, the team, the larger team in RtI team in the process. Then we look to go to the actual IST team to actually be inserted in that process. Then we move to the Tier 1, Tier 2, and Tier 3 interventions."
"We needed a systematic way to address students that were not working up to the ability of the curriculum and that were not having success in the classroom, and using the RtI system we were able to systematically look at ways to address some of the students' weaknesses."

"...we identify students whether it is to the IST process, where teachers will identifl students to their IST team ... where we discuss students who we have academic or behavioral concerns for and how we can meet the needs of those students through proper placement ."
Hypothesis Number 2-The components of the RtI structure ueed in your
building were not determined by building personnel-received a rating of 17.0.
Three hypotheses--Specific data are not collected often on all students (Hypothesis
Number 4), Data collected are not analyzed to make decisions about student
performance (Hypothesis Number S), and There is no consistency among the achools
in the district as to what programs (interventions) to include in the respective
building RtI pyramid (Hypothesis Number 6)-received a score of 16.0 or less (Figure
13) and their inconsistencies were not found to be significant.
To summarize Question Number 3 in all of the buildings studied, interviewees
discussed the importance of data collection on the placement and provision of
interventions for all students. The administrators stated that some of the data used were
state assessment scores from previous years, final averages, scores on formative
assessments, and surnmative scores. This information was significant for proper student
academic placement.
Research Question Number 4
How have the teachers in the respective buildings used the district-designed
intervention (RtI) model?
The participants in these interviews were teachers n= 8; there were two teachers
from each of the buildings under study. Responses from the teachers' interviews were

entered into a matrix consisting of six hypotheses relating to the questions used in the
interview protocol for teachers (Appendix B) and the responses were entered into the
teacher matrix (Appendix L ) to analyze the responses given by the teachers against the
stated hypotheses.
The totaI number of responses (n = 72) were assessed against the following
hypotheses:
1. Teachers use the RtI pyramid in their classes to monitor student progress.
2. Teachers have a process to recommend a student for special education.
3. Teachers use student information to make decisions as to what interventions to
recommend for students showing academic and/or behavioral difficulty.
4. There is a systematic process to recommend students through the RtI structure.
5. Teachers coilect data on students to impact instructional and disciplinary practices.
6. Special education services result in beneficial outcomes for students.

Inconsistencies per Hypothesis
HYPOTHESES Special education services result in beneficial outcomes for students. Teachers have a process to recommend a student for special education. There is a systematic process to recommend students through the Rtl structure. Teachers use the RtI pyramid in their classes to monitor student progress. Teachers use student information to make decisions as to what interventions to recommend for students showing academic and behavioral difficulty. Teachers collect data on students to impact instructional and disciplinary practices.
Figure 14 Teacher Inconsistency Graph
Figure 14 shows the inconsistencies with the hypotheses stated relating to the
teacher interview questions.
There were 72 statements from the teacher interviews that were transcribed and
entered as evidence into the ACH software to create the teacher matrix that analyzed
whether or not the respondents' answers were consistent or inconsistent with the stated
hypotheses.
In rating the responses of participants, Hypothesis Number 4-Teachers use the
RtI pyramid in their classes to monitor student progress-had an inconsistency rating
of 27.5, highlighting that most of the teachers' responses were not consistent with this
statement.
When asked, "How familiar are you with the district-designed pyramid of
intervention?" and "What do you know about the RtI structure used in your building?"
teachers did not recognize the RtI structure as evidenced by their responses:
"I really.. .I'm not too familiar with the RtI model besides the information that you sent me."
"I know some of the interventions that are used at different levels of the pyramid, the interventions they are used in, but I do not know what interventions are included at each level."
"I am familiar with it. I don't claim to know it very well.. .and conversations that we have had about it . . .there are three tiers and I am not sure, a little fuzzy about how the tiers melt each into the next one.. ."
"To be honest, not very familiar.. .the reason probably being that I'm pretty much "old school." And, what I've been doing over the years has worked, and I've been very successful in my results with the kids, and I don't think that I would change much."

Hypotheses 2 , 3 and 6, respectively-Teachers have a process to recommend a
student for special education, There is a systematic process to recommend students
through the RtI process, and Teachers use student information to make decisions as
to what interventions to recommend for students showing academic and or
behavioral difficulty-had the same inconsistency score of 5.0.
Two hypotheses, Numbers 1 and 5, respectively, had the same inconsistency score
of 2.5. Teachers collect data on students to impact instructional and disciplinary
practices, and Special education services result in beneficial outcomes for students.
Teachers' responses were consistent with regard to the use of data to make instructional
decisions about teaching and learning strategies to use for students. They monitor their
students' progress. The following is a statement made by one of the interviewees.
"The first thing we do is discuss it (student performance and behavior) amongst our team because in middle school we have teams and we decide what the needs are for the student. On our team level, we institute some of the interventions such as double checking for homework and making sure the parent is informed on the issues the student is having. If the interventions that we do on a team level don't work, then we will go to the IST. Most of the time the ISTs are used rarely now, I am seeing, because it has been taken care of prior to meeting seventh grade."
In summary, many of the responses provided by teacher interviews showed that
the teachers don't know or understand the RtI structure used in their respective buildings.
Mmy of the teachers interviewed were not familiar with what RtI is and do not know the
RtI pyramid, even though they are following steps to monitor students' academic and
behavioral difficulties. They are not aware that all the steps they take are actually part of
the RtI. Middle school teachers were more familiar about using a process to monitor
student progress. There is a team- teaching approach at each of the middle schools, and
the team meets often to discuss student progress. Many of the teachers interviewed

believe that special education settings benefit student outcomes. They also believe that
the placement of students into special education is a decision that must be made after
certain steps have been taken by the general education teacher. This is not the case at the
secondary level; in grades 8 and beyond, teachers' responses indicated that they work
alone to do what they feel needs to be done to monitor student progress. At the
secondary level it is crucial for all teachers to be aware of the RtI pyramid and to
understand how it works and why it is important.

R ~ w e 7: Rrrpaow to WmwaUh m u a d h oprr ofthe schools:
Figure 15 Pyramid structure used in one school

Figure 16 Pyramid Structure

Figure 17 Pyramid Structure
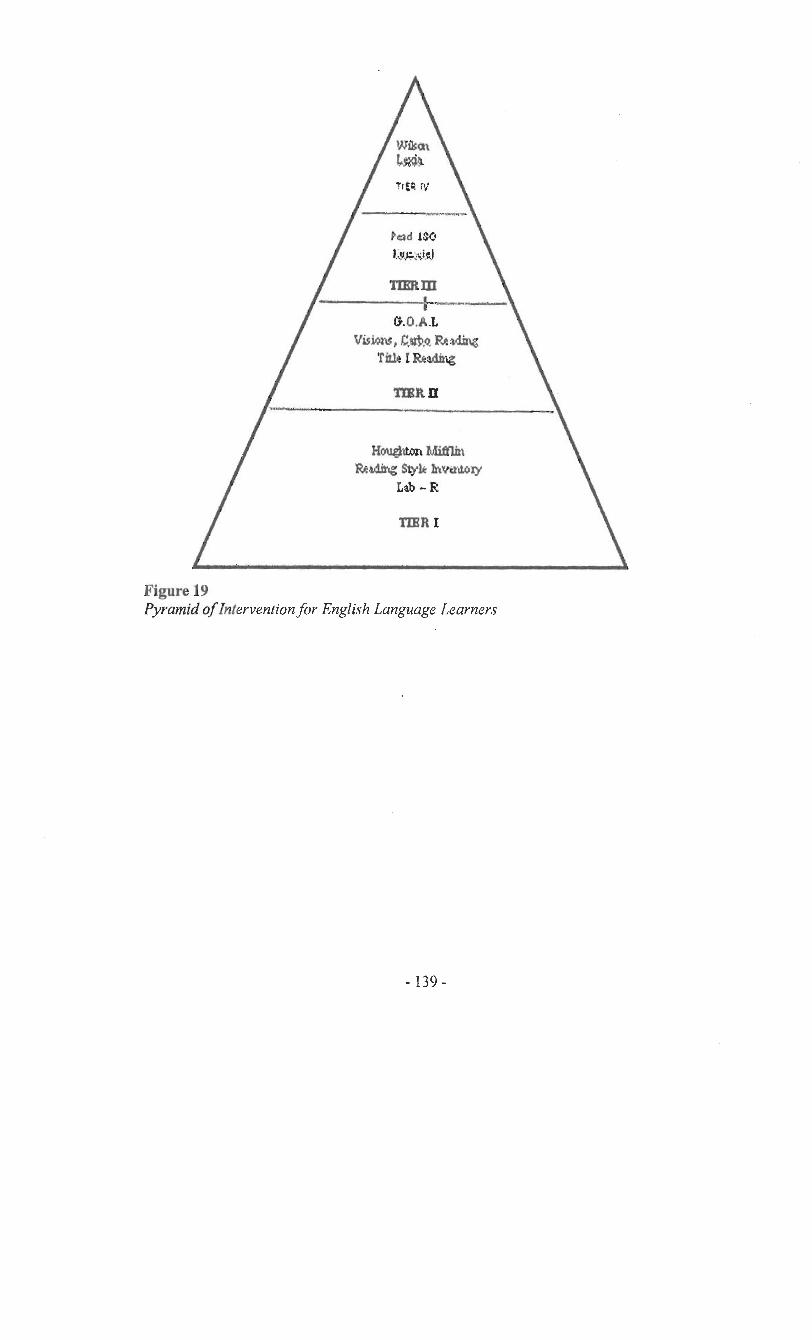
Figure 19 Pyramid of Intervention for English Language Learners

Summary of Chapter Four
Chapter 4 presented a description of the participants, data, and analyses conducted
to answer the questions that guided this study. There were demographic data collected as
well as other data gathered and analyzed to determine whether or not the referral to the
Instructional Support Team had any influence on these demographics. Covariates that
were examined included; ethnicity, gender, grade, LEP, and SES. Since the sample size
of the current analysis was somewhat modest (n=66), covariates were tested separately in
analysis, as a model that included all covariates would lack statistical power to detect
significance. Overall, the quantitative data analyzed using Repeated Measures Analysis
of Covariance did not show that there were any significant changes in achievement of
RCELD students referred to IST. The covariate with the most significant change was
LEP students and their ELA scores. "Within-subjects results indicated that ELA scores
changed significantly from the 2008-2009 and 2009- 2010 school years (Pillai's Trace =
.086, F[1]=4.988, p<.05;Table 22), holding LEP constant. In addition, results also
indicated that the change in ELA scores over time varied significantly by LEP status, as
the interaction term of *Time*LEP* was significant (Pillai's Trace=.075, F[1]=4.289,
pC.05; Table 22)." With regard to the referral of RCELD students referred to CSE, the
population sample was small to detect any statistical power. A table containing the
number of students who went to CSE through a building referral was created to show
what the CSE determinations for these students were.
Finally, the qualitative data, open-ended interviews conducted with volunteer
building administrators and teachers participants (n = 12), analyzed with Analysis of

Competing Software (ACS), highlighted that administrators are very engaged in
monitoring student progress and achievement, but were not very involved with
overseeing the RtI process. The teacher participant responses highlighted that they are
not very familiar with the RtI process used in their building.

CHAPTER 5
FINDINGS, CONCLUSIONS AND RECOMMENDATIONS
Discussion of the Findings
This study examined the influence of a district-designed Response to Intervention
structure on the achievement and rate of classification of racially, culturally, ethnically and
linguistically diverse students into special education by exploring a local school district's
processes that may contribute to student achievement and rate of classification. In doing this
analysis, this researcher's objectives were to describe a phenomenon and document the
characteristics of the phenomenon by conducting non-experimental research (Johnson, 2001).
The study was conducted in one suburban school district in the Hudson Valley in New York.
From the search of the literature on RCELD students and their educational outcomes, several
consistent finding were noted: the underachievement of these students, the achievement gap between
RCELD students and their White counterparts and the classification rate of RCELD students into special
education. The United States is a diverse nation and it is experiencing demographic metamorphic shifts.
These demographic shifts are changing the fabric, color, and cultures of its people. Our nation's schools
are experiencing this dynamic and are currently being challenged to become more knowledgeable about
the assumptions, attributes, and norms of a range of cultures. Failing to take cross-cultural
communication issues into account can contribute to the problems that many students are facing in
schools. The neglect of cross-cultural communication and cultural responsive instruction is evident and
is shown by the disproportionality of RCELD students underachieving and placed in special education.
Artiles, et al. (2008) stipulated that the academic achievement of minority
students shows a significant gap on standardized test scores between majority and

minority students, coupled with high incidence of suspensions and dropout rates. Gardner
(2007) offered several possible causes for the achievement gap between RCELD student
sub-groups and the dominant white student population, including low SES, school
funding, the belief that minority students are less intelligent and less capable, unvalued
cultures, parents' negative school experiences, racism, minorities' external locus of
control, and student identity.
This study used a comparative, descriptive, non-experimental design in which
quantitative and qualitative data were collected. The quantitative portion of the study
consisted of collecting data on students who were referred to Instsuctional Support Team
(Level 2) of the district-designed pyramid fiom the four schools used in the study.
The qualitative portion of the study consisted of 12 interviews of administrators
and teachers who worked in the schools under study. These interviewees were volunteers
who participated in the study. The interview instruments used for the qualitative portion
of the study were developed to determine the level of involvement of building personnel
in the implementation of the RtI process in their respective buildings. The interview
instruments were designed to extract information fiom the interviewees on the following:
type and amount of data collected on students, how the data were collected and used, and
whether student information had assisted building personnel in making decisions about
student program and placement.
Quantitative data were used to explore the null hypothesis for which separate
Repeated Measures Analysis of Covariance (ANCOVAs) were performed for the New
York State English Language Arts and New York State Math Assessments, examining
two points in time 2008-2009 and 2009-201 0. The ANCOVAs were used to determine if

achievement, as measured by a change in the raw scores attained on the NYS
assessments, differed significantly for the students who were referred to IST fiom one
year to the next. In the analyses performed, the dependent variables were achievement
scores, while the independent variable was IST participation (represented by time; ix. ,
pre- and post-IST); several covariates were tested for their influence on academic
achievement. Additionally, demographics were also tested for interaction effects, to
determine if the impact that the IST had varied by these demographics. Covariates that
were examined included: ethnicity, gender, grade, limited English proficiency, and socio-
economic status. Since the sample size of the current analysis was somewhat modest
(n=66), covariates were tested separately in analysis, as a model that included all
covariates would lack statistical power to detect significance.
The choice to conduct this research project was due in part to the philosophical
values espoused by the researcher. Although philosophical ideas remain largely hidden
in research, they still influence the practice of researchers and need to be identified.
Creswell(2009) recommended that individuals preparing a research proposal make
explicit the larger philosophical ideas they espouse. This information will help the
researcher decide specifically why the methods for his or her research were chosen
(2009). Worldview is a term used by Creswell to identify a basic set of beliefs that guide
action. He described worldviews as a general orientation about the world and the nature
of research that a researcher holds. These worldviews are shaped by the discipline area
of the researcher, the beliefs of the advisers and faculty in a researcher's area of interest
and past research experience.

Creswell(2009) identified four worldviews: post-positivism, constructivism,
advocacy/participatory, and pragmatism. In providing a rationale for using a specific
method based on one's philosophical view of the world, this researcher holds assumptions
of social constructivist and advocacy/participatory philosophical worldviews. Social
constructivists seek to understand the world in which they live.
One assumption held by this researcher was that of the advocacy/participatory
worldview which holds that research inquiry contains an agenda for action to change the
lives of the participants, the institutions in which they work or live, and the researcher's
life. Moreover, specific issues that need to be addressed may speak to important social
issues, such as inequality, empowerment, oppression, domination, suppression and
alienation. This philosophical worldview focuses on the needs of groups and individuals
in our society who may be marginalized or disenfranchised (Creswell, 2009).
Findings
The answers to the questions that guided this study used a cross sectional,
descriptive, non-experimental design involving a mixed method that included both
quantitative and qualitative data collection.
Question Number 1 : How has IST referral influenced the achievement of RCELD
students, as defined by scores attained on the NYS English Language Arts (ELA) and
NYS Math assessments, following the use of the implementation of a district-designed
intervention model in grades 5-9 during the school year 2009-2010?
First, it is important to note that in reviewing Frequency Table 9, the number of
students considered SES status referred to IST was n = 44 or 66.7% while students not
considered SES was n = 22 or 33.3% . SES has been linked to poor achievement in

school. The number of minority students referred to IST considered non-minority was n
= 10 or 15.2%, and minority was n = 56 or 56 % (Table 10) of the population of students
referred to IST. These two points highlight Lee's (2008) comments that educational
research has had a history of impacting the quality of opportunities to learn for youth,
particularly those who have and continue to face persistent intergenerational challenges
due to race, ethnicity, poverty, gender and disability (2008). In addition, in looking at
Table 11, grade was another focal detail. Grade 5 and grade 8 students were n = 2 1 or
3 1.8% and n = 20 or 30.3%, respectively, In these two grades of the four grades studied,
the highest number of students were referred to IST.
Results fiom the Repeated Measures of Covariance (ANCOVAs) did not provide
evidence to reject the null hypothesis that there were no significant differences in student
achievement as measured by the NYS ELA and Math assessments scores found in
students who were referred to IST. The results of a series of variables tested whether or
not IST referral had any influence on achievement, showed that there were no significant
changes in assessments scores. These results could point to the possibility that language
diversity, such as students' proficiencies in their first and second language, as well as
students' life experiences and the context in which they are taught (Esparza and Brown,
2008) might have contributed to the lack of improvement on standardized assessments
and need to be considered by educators. Students who speak a language other than
English at home and speak English with difficulty in school may be in need of specific
language interventions in the general education setting, Tier 1 (Level 1) or Tier 2 (Level
2) of the pyramid. In addition, ethnic background, cultural background, and SES status
for these students might not have been considered with regard to what interventions were

implemented. Teaching strategies and the absence of culturally responsive teaching and
schooling might not have been modified for RCELD students.
For the limited English proficient status covariant, results showed that English
Language Arts scores changed significantly from 2008-2009 to 2009-201 0. Additionally,
results also indicated that the change in ELA scores over time significantly varied by LEP
group. These findings suggest that LEP students who were referred to IST demonstrated
achievement in ELA (Pillai's Trace=.086, FEIl4.988, p<.05; Table 16)' holding LEP
status constant. However, it is important to note that the percentage of LEP students was
15.2% compared to 84.8% non LEP status students. Students considered LEP showed
improvement, while RCELD students did not show any significant difference in scores in
either ELA or Math. An explanation to this significance could be that LEP students are
going to show improvement regardless by nature of their increased exposure to the
English language. However, the study did not look at factors such as how long these
students have been learning English or how long they have been in this country. The
failure to find significance with regard to students referred to IST and the improvement of
scores on the ELA and the Math assessments could be attributed to the procedures
followed in the referral process to refer students to the IST and how they were monitored.
What academic difficulties were these students having and how were they addressed?
Since results of the analyses showed no significant changes in students' scores, exploring
other possible interventions tailored to the student population would be a way to address
the achievement level of the RCELD students.

Between-subjects effects determine whether the mean Math scores were
significantly different between gender groups (male vs. female, Table 20). Between-
subjects effects are first tested for overall effects (omnibus effects), and then tested
separately each year if the omnibus effects are found to be significant. If omnibus
differences are not found to be significant, individual comparisons by year were not
considered valid and were not examined. Results indicated that there were significant
omnibus effects by gender (F[1]=.4.077, p<.05; Table 20), indicating that males and
females differed significantly in their Math scores. These findings are further supported
by the differences between group mean scores at both time points, which are evident in
Figure 4. Specifically, during the 2008-2009 school year male students (M=653.52,
SD=26.345) demonstrated higher Math raw test scores than did female students
(M=642.64, SD=42.168). A similar trend was observed during the 2009-201 0 school
year, as male students (M457.97, SD=20.566) earned higher Math scores than did
female students (M=645.14, SD=21.739).
Question Number 2: How has the classification rate of RCELD students been influenced
following the use of the implementation of a district-designed intervention model in grades 5-9
during the school year 2009-2010? In the buildings used in the study, there were 25 building
initiated student referrals to the Committee on Special Education. There was a decrease in
enrollment in special education from the previous year. The number of African American
students referred to the CSE was n=5, (females n=l and males n=4); Caucasian was n=19,
females n= 7 and males n=12; and Hispanic was n=23; females n= 6 and males n= 17.
Concerning the classification rate of RCELD students in grades 5-9 used in the study, there were
two findings; the first is that of the students referred to CSE, Hispanic males (n=12) were

classified as Learning Disabled, highlighting that Hispanic males tend to be labeled as LD more
often than other labels. The other finding is that of the Hispanic students who were referred to
CSE, n=23, n=12 were identified as dual language speakers. All students referred to CSE were
identified as Hispanics fitting into any of the labels of generation 1.5. RCELD students'
overrepresentation in special education settings; the numbers still tell us that disproportionality
andlor the inappropriate overrepresentation and/or over-identification of ethnic minority children
in special education is still a concern. There is a discussion of disproportionality as a growing
phenomenon and how it is a systemic issue in our schools. Legislation and reform efforts
implemented on national, state, and local levels have required educators to implement practices
to address the issues of disproportionality. The fill complexity of existing RCELD student
disproportionality has not yet been h l ly understood, since there are so many factors that can
contribute to representation when RCELD exists.
Question Number 3: How has the building administrator been involved in the
implementation of the district-designed intervention model? This was answered using
open-ended interviews with volunteer building administrators. The interviews were
conducted to enrich the research and probe how involved the administrators were in the
implementation and monitoring of the RtI process. While the responses from the
interviews conducted with building administrators showed that they were all very
involved in student achievement, their focus was increasing the number of students
making adequate yearly progress (AYP) on state assessments. Their responses also
indicated that data collected on students included previous years' assessment scores, final
averages for past grades, classroom and formative assessment scores, and teacher

recommendations. These data were used to inform the administrator as to program
placement for students.
Question Number 4: How have the teachers in their respective buildings been involved
in the implementation of the district-designed intervention (Rti) model? Teacher
responses presented the RtI model as district-structure, not aprocess in which they
needed to be involved. However, the teachers' responses did highlight their concerns for
their students and students on their teams. They discussed how they collect data and how
the information gathered helped them make decisions as to which pedagogical strategies
would best help students in their classes. The middle school teachers had structured time
to meet with team members to discuss students who were experiencing academic or
behavioral difficulty. The meetings at this level were informa1 and no documentation
was kept. They also discussed that the type of data they collected were student grades,
which included homework and test grades. Systematic data collection on students was
not consistent within or among the middle schools. A review of the RtI pyramids used in
each building showed that there are inconsistencies among the buildings with regard to
the interventions included at each level. Inconsistencies also existed in the collection and
dissemination of data, as well as the process used to recommend students to IST.
Influencing Factors
The examination of the influence of the district-designed pyramid on the
achievement of and rate of classification of RCELD students suggests RCELD students
continue to be marginalized and disenfranchised in our schools. In comparing minority
students to their White counterparts, populations of RCELD students continue to lag
behind, are underachieving, and often are placed in separate settings and programs that

provide inferior educational opportunities for them. Our minority populations earn lower
grades in school and often are represented in separate and unequal educational tracks.
Carlysle (2007) posited that the representation of minority students had been increasing
and that it is the result of a series of social processes that have resulted in inevitable
outcomes of real conditions. Finance and education policies, racial, ethnic, and language
diversity, and lack of understanding on the part of educators to teach students who are
different from majority students influence student achievement. Artiles, et al. (2006)
inferred that conventional visions of human development in which culture, ideology,
history, and power play are attributes that play a significant role in the underachievement,
the achievement gap between RCELD students and their White counterparts and the
classification into special education of our minority student population. Special
education has been regarded as a "fix it all" solution by many educators for students
whose needs exceed the skills or time constraints of the regular classroom teacher.
Comparison to Previous Research
The issue of marginalization and disenfranchisement of RCELD learners is
important and there is a scarcity of research information on how RtI influences academic
outcomes, specifically during middle school and beyond. Much of the work done on RtI
has focused on the needs of students at the elementary level, leaving a gap in the
literature for educators who work with students at the middle and secondary levels
(Spiegel, 2009). A study conducted by Kucera (2008) indicated that the early
intervention strategy (RtI) did not impact third-grade reading achievement or the
proportion of students referred to special education. The findings in Kucera's research
are consistent with the findings of this study that the RtI process did not improve the

academic achievement andlor reduce the number of classified RCELD students into
special education (2008).
Conclusions
The RtI structure was introduced to mitigate the problems associated with the "wait-to-
fail" discrepancy model (IDEA, 2004). The RtI process requires documentation that students
have been unable to respond to appropriate interventions based on educationally and
scientifically proven principles that are provided and monitored over a period of time in the
mainstream classroom (USDOE, 2006). With its focus and emphasis on prevention, this model
has its roots in public health and disease control and occurs at three levels: primary, secondary
and tertiary (Sugai, 2007). Each level has prescriptive instructions for educators to follow in the
general education setting. This framework includes several tenets: providing a swift
instructional response to the needs of struggling students, providing supplemental and
differentiated instruction based on results of formative assessments, monitoring student progress
with increased frequency as students receive more specialized instruction, and using research-
based, but not yet proven, effective practices in the classroom (Bryant and Barrera, 2009),
Despite the claims that RtI will reduce the classification rate of RCELD students by
providing students who may need "more time to catch up" with more direct, intense, research
based instruction, its influence on achievement was not supported in this study. Based on the
quantitative analyses performed in this study, the findings indicated that referral to Instructional
Support Team had no influence on the achievement of RCELD students on the New York State
English Language Arts or Math scores or classification of these students into special education.
It is important to note that the district used in this study had been cited by the
New York State Education Department as a district identifying students in

disproportionate numbers to special education settings. Since then, the district has been
strongly committed to ensuring that systems are in place to provide interventions for all
students before they are referred. The district has been working closely with NYU and
Chapter 405 to address the problem of disproportionality of labeling and placement into
special education programs of minority students. A word of caution concerning biases
present in our schools; the referral process is a major factor contributing to the
disproportionate placement of culturally diverse minority students in special education
settings when educators perceive that language and culture are deficiencies rather than
differences (Reilly, 1991). To continue.serving the student population in this district, it is
essential that all work that is done concerning the student population is inclusive of all
district personnel, specifically classroom teachers and building principals with regard to
teacher knowledge building about and development in addressing these issues.
The successful educational outcomes of our minority student population are
contingent upon the people who are a part of their lives, directly or indirectly; i.e., policy-
makers, parents, teachers and administrators. Factors such as student educational
experiences and district policies enacted that take into account their racial, ethnic,
cultural, socio-economic and linguistic diversity can shape schools into transformative
institutions that tailor interventions and programs to the population being served.
The primary objective of this study was to examine the influence of a school-
designed RtI structure on the achievement of and classification rate of RCELD students
into special education by exploring a local school district's processes that may contribute
to student achievement.

Much of the debate surrounding RCELD students' underachievement and their
overrepresentation into special education has included mandates at the federal and state
level; laws such as IDEA and NCLB and their reauthorizations by the federal government
have been passed to ensure equity and equality in education for all. These laws have
prompted our educators to act to ensure that all public school students in America receive
a quality and equitable education.
First, the NCLB act emphasizes that all students will learn, that no child will be left
behind and will continue to make substantial improvements, placing tremendous accountability
on educators (IDEA, 2004). This law also requires that educators be held accountable to ensure
that there are processes in place, such as RtI, before recommending students for special
education.
The Commission on Excellence in Special Education was created by President Bush
(2004) to ensure that every child is learning regardless of race, family background, and disability
status. This Commission recommended reforms to improve America's special-education system
and move it to be a culture of accountability and results. IDEA (1997) and its reauthorization
(IDEIA, 2004) recommended that all educators use and implement procedures to ensure that all
instruments used to determine eligibility for special education are non-discriminatory, These
laws are mandating states and local school agencies to implement models such as RtI and
programs such as academic intervention services, Inclusive education transforms education
systems by offering alternatives to placement in general education classrooms (Artiles &
Kozleski, 2007; Artiles, et al., in press). We should seek opportunities to strengthen and
improve access, opportunity, and quality in our schools by targeting issues related to education
equity. Legislation and reform efforts have been enacted on a national level mandating state

education departments and local districts to implement practices to address issues of
disproportionality.
In the district studied, one of the observations made fiom this research is the
number of RCELD students who were referred to IST and the number of students who
were referred to CSE for testing and placement. Although the number of students
classified for special education has been decreasing over the last three years, the number
of minority students referred to the Committee on Special Education and classified,
continues to be disproportionate when compared to the number of students referred in
grades 5-9 in the 2009-2010 school year. Another observation concerned the
achievement of RCELD students. In using the NYS ELA and Math assessments scores
attained by the students who were referred to IST, there were no significant changes in
scores from one year to the next. A third observation made was that building
administrators were committed to student achievement and in raising standardized
assessment scores, but the commitment to the RtI process was not noted. The fourth
observation was that while the teachers were involved in their students' academic
development and knew what to do for them when they showed signs of academic or
behavioral difficulties, the teachers were not familiar with the entire picture of RtI, its
components, or the processes that should be followed.
Recommendations
For Policy
If equity issues are to truly be addressed, policy makers need to consider the funding of
their mandates. In an article titled, "Turn Around or Full Speed Ahead" (201 O), House

Committee members raised concerns regarding the number of schools with students that are
underperforming and dropping out of school. The students in our schools must be provided with
an education and issues that are impeding them from attaining success must be addressed, The
United States' economy and its standing and competence in the global economy, o w security,
and the quality of life in our communities are at stake.
For Practice
The district under study has a growing minority population, specifically Hispanic, and the
implications of this growth are many for all stakeholders involved in students' education. The
recommendations provided are mainly for the RCELD population enrolled in this district.
District personnel must commit to creating an RtI structure that takes into account the
demographics, specifically ethnicity and language diversity of the student population of the
district. First, the district must ensure that every level of the RtI process is clearly articulated to
all district personnel and that the process at all levels is prescriptive. The pyramid of
intervention logic has direct influence on both academic and behavior supports (Sugai, 2007)
(Appendix M).
In order for RtI to truly function as a probIem-solving model, a deep commitment from
all involved in its implementation and monitoring is required. It is essential for a11 stakeholders
to be trained to follow specific protocols regarding the implementation of intervention strategies
and the monitoring of progress. "The what and the how" specific to the populations targeted
must be included in the protocols.
The successful implementation of the RtI structure is incumbent on the principal to view
himself or herself as a participant in all aspects of implementation, monitoring, and sustaining

the process. He or she has to be a manager and a leader by working collaboratively with the
teachers, promoting the initiative, providing resources and enabling teacher capacity-building.
Spiegel observed that practitioners successful in the implementation of a structure such as RtI
displayed four important roles: principal as participant, principal as data manager, principal as
recruiter, and principal as resource provider (Spiegel, 2009).
Student academic success is usually measured by standardized tests scores. In an effort
to meet mandated accountability reforms regarding student achievement, the focus is on the
scores and ensuring that students make adequate yearly progress. Many times this method of
placing students into academic intervention classes does not address other needs that may not be
transparent with regard to the student's academic difficulties. Knowing more about the student
population in a building than just scores attained on assessments is necessary to provide the child
with what he needs in order to be successful.
In establishing culturally responsive schooling for the minority population, it is important
for administrators, teachers, and other school personnel to examine students' identity, their
experiences in school, and how they view schooling experiences as well as their career
expectations and aspirations. It is essential that students form a connection between their
identity, schooling, and future plans (Quiroz, 1997). Reilly (1991) stated that some teachers base
their judgment of student competence on race, sex, socio-economic status, and linguistic and
cultural differences.
The components and strategies included at all levels of the RtI structure must be clearly
defined and research based. For example, at Tier 1, or the universal level, the delivery of the
curriculum must be monitored and measured using proven research-based practices. An
essential component at this level is the administration of frequent formative assessments to

measure and monitor the delivery of the curriculum. Data derived from assessment scores must
be considered to inform decisions about whether or not a student is progressing.
Transformative, inclusive schools invest in systemic, sustained programmatic attention
to professional learning and the use of data driven decision making and school capacity
development (Artiles & Kozleski, 2007). As part of the district professional development
program, all professional staff should receive training on culturally responsive teaching.
For Future Research
In conducting this study there were two confounding observations that would benefit
from further research; the highest number of students referred to IST were srn grade (n=2 1) and
8th grade (n=20). In the district under study, 5' grade is the first year of middle school and gth
grade is the first of two years at the secondary school (8-9 Center). A possibility for future
research would be to focus on the transition of students, specificaIly RCELD students, from
elementary school to middle school and from middle school to secondary school.
Another recornmendation for future study would be a longitudinal study on the language
achievement of students who are considered generation 1.5 language learners. The setting of the
study would be in one building, not four. The focus would be on identifying the generation 1 .5
learners and their achievement trajectory over a period of time, what Johnson (2001) refers to as
a "longitudinal descriptive study," or Type 3 (Table 1).
Summary
The education system in the lJnited States has failed to educate all public school
students equally. America is a nation of diversity, a nation built on a foundation of
differences. However, factors such as poverty, race, ethnicity, culture, language, and

diversity have contributed to the marginalization and disenfranchisement of a group of
students in our schools.

References
ACH (2009). Analysis of Competing Hypotheses software, Palo Alto Corporation, CA.
ACH. User manual: From the open source analysis of competing hypothesis pro-ject.
http://competin~hy~otheses.o1'g/c1ocs/~Jser manual.
Achilles, C. F. (1 984). A study of isssues related to discipline, grouping and tracking, and special
education in an urban desegregation area. Americcrn Association ofschool Administrutors
(AASA) (pp. i-99). Las Vegas, Nevada: American Association of School Administrators.
Adams. G. R., & Schvaneveldt, J. D. (1 991). Understcrn~iing Reseurch iblethods (2nd ed.). White Plains,
NY: Longman Publishing Group. (Original work published 1991).
Alford, B., & Nino, M. C. (2009). Remember 0za ih'ission: i k k i n g education and schools betterfor
rt~rdents (2009 Yearbook, ed.) (C. M. Achilles, B. J. Irby, B. Alford, & G. Perrault, eds.). Lancaster,
PA: Destech Publications, Inc.
Alliance for Excellent Education. (20 10, June 1). Turn around or full speed?: House committee raises
concerns with school turnaround models included in Obama administration's ESEA blueprint.
Straight A's: Pliblic Educution Policy and Progress, 10(1 1).
Anyaso, M. H. (2006). Culture and academic performance: Diverse issues in higher education. Proqzrcst
Educcrtion Datuhuse. 23( 16), 4.
Arias, B. (2003). The impact of Brown on Latinos: A study of transformation of policy intentions.
Teachers College Record 107(9). 1974- 1998.
Artiles, A. J. (2008). The next generation of disproportionality research: Toward a conlparative model in
the study of equity in ability differences. Proyziest Edzication Jozirnal Database, 42(1), 4- 14.

Artiles, A. J., & Kozleski, E. B. (2007). Beyond convictions: interrogating culture, history, and power in
inclusive education. Language Arts, 84(4), 357-364.
Artiles, A. J., Klingner, J. K., & Tate, W. F. (2006). Theme issue: Representation of minority students in
special education: Complicating traditional explanations:. Educutional Researcher, 35(6), 3-5.
Arzubiaga, A. E., Artiles, A. J., King, K. A., & Harris-Murri, N. (2008). Beyond research on cultural
minorities: Challenges and implications of research as situated cultural practice. Exceptional
Children, 71(3), 309-327.
Barclay, K. (2007). Research in reading. Illinois Reading cormcil Jozrrnal, 35, 67-69.
Bernhard J.K., Cummings., J., Campoy., F.I., Ada., A. F., Winder., A., & Bleiker, C. (2006). Identity texts
literacy development among pre-school English language learners: Enhancing learning
opportunities for children at risk for learning disabilities. Teachers College Record I08(1 I), 2380-
2405.
Bollmer, J., Bethel, J., Garrison-Mogren, R., & Brauen, M. (2007). Using the risk ratio to assess racial1
ethnic disproportionality in special education at the school-district level. Journal of Special
Edzrcution, 41, 186 - 198.
Briefing. (December, 2007). Minorities in special education. U.S. Commission on Civil Rights,
Washington, DC.
Bryant, D. & Barrera, M. (2009). Changing roles for educators within the framework of response-to
intervention. Intervention in School and Clinic 45: 72-79.
Byrd, R., Weitzman, M., & Aninger, P. (1997). Increased behavior problems associated with delayed
school entry and delayed school progress. Pedatrics, 1 OO(4).

Callahan, C. (2005). Identifying gifted students from underrepresented populations.
Theory into practice, 44(2), 98- 104.
Campbell, N. M. (2009). ikrketing to the U.S. Hispanic consumer: Apparelpreferences und strategies.
Unpublished master's thesis, North Carolina State University, Raleigh, NC.
Carlysle, J. (2007). Why are so many minority students in special education? Childhood Education, 83(4),
246.
Castagno, A.E., McKinley, B., & Brayboy. (2008). Culturally responsive schooling of Indigenous youth: A
review of the literature. Review of Educational Research. 78(4). 94 1-993.
Center for Evaluation & Education Policy. (2006). Closing the achievement gap series: Part 11. Response to
intervention (RTI). Basic elements, practical applications, and policy recommendations (Part I1
Volume 4, Number 8). Bloomington, IN.
Christle. C., Nelson, M., & Jolivette, K. (2004). Characteristics related to the use of suspension. Treatment
of Children, 2 7.
Clark, M. A., Lee, S. M., Goodman, W., & Yacco, S. (2008). Examining underachievement in public
education: Action research at a district level. lVationcd Association of Secondary School Principuls,
Y2(2), 1 1 1 - 132.
Cresswell, J. (2009). Qualitative inquiry and research design. Thousand Oaks, CA. Sage.
Cresswell, J. (2003). Research Design. Thousand Oaks, CA. Sage.
Esparza-Brown, J., & Doolittle, J. (2008). A cultural, linguistic, and ecological framework for response to
intervention with English language learners. Teaching Exceptionul Children, 40(5), 66-72.
Fiedler, C. R., Chiang, B., VanHaren, B., Jorgensen, J., Halberg, S., & Boreson, L. (2008). Culturally
responsive practices in schools: A checklist to address disproportionality in special education.
Teaching Exceptional Children, 40(5), 52-59.
- 162 -

Fuchs, D., & Fuchs, L. (May, 2005). Operationalizing response-to-intervention (RTI) as a method of LD
identification. Journal oj'Special Education.
l~ttp://www.tenncssee.~ov/edi~catiodspe~ed/d~~~/~efi~operti~dq.pc~f
Fuchs, D., Mock, D., & Young, C. L. (2003). Responsiveness-to-intervention: Definitions, evidence, and
implications for the learning disabilities construct. Learning Disabilities Research and Practice, 18,
157-171.
Gardner, D. (2007). Confronting the achievement gap. Phi Deltci Kappan. 88,542-546.
Gandara, P., & Rumberger, R. (2009). Immigration, language and education: How does language structure
opportunity? Teachers College Record, 11 1 (3), 750-783.
Gresham, F. M., Vanderheyden, A., & Witt, J. C. (2005). Response to intervention in the identification qj'
learning disubilities: Empirical support undjuture challenges. Manuscript submitted for
publication.
Guerra, P. L., & Nelson, S. W. (2007). Assessment is the first step to creating a school that educates
every body . Journal qf Staff Development, 28, 59-60.
Guiberson, M. (2009). Hispanic representation in special education: Patterns and implications: Preventing
school failure. Helderj'P~rblications, 53(3).
Hardcastle, B., & Justice, K. (2006). RTI and the classroom teacher: A guide to fostering tecicher buy-in
and supporting the intervention process. Hossham, PA: LRP Publication
Harry, B. Klingner, J., & Cramer, E., with Sturges. (2007). Case Studies oj'iMinority Student Plcicernent in
Speci~d Education. New York: Teachers College Press. (Original work published 2007).
Indiana University. (2009). The context ofnzinority ciisproportionaliry.. Pr~ictitioner perspectives on special
edzication referral (Grant No. 14201-077-DY07). Bloomington, IA: Indiana Department of
Education, Division of Exceptional Learners.
- 163 -

Janzen, J. (2008). Teaching English language learners in the content areas. Review ofEducationa1
Research. 78(4) p. 10 10.
Johnson, B. (March, 2001). Toward a new classification of non-experimental quantitative research.
Educational Researcher, Vol. 30 (2) p. 3- 13.
Jordan, J. L., & Anil, B. (August, 2009). Race, gender, school, discipline, and human capital. Jourwul of
Agriczrlturul and Applied Economics, 4 1 (2), 4 19-429.
Keegan Emon, M., & Altshuler, S. J. (2004). Can we predict disruptive school behavior? Children &
Schools, 26(1), 23.
Kerlingner, F. N. (1 986). Fozrndations of Behaviorul Reseurch. Holt, Reinhart and Winston. Fort Worth,
TX. xviii-667.
Krezmian, M. P., Leone, P. E., & Achilles, C. M. (2006). Suspension, race, and disability: an analysis of
statewide practices and reporting. Journal of Emotional and Behavioral Disorclers, 14(4), 2 17-226.
Kucera, A. J. (2008). The eirect of implen~entution ofa response to intervention nzodel on stzrdent
achievement, speciul educution rejkrrals, and special education eligibility. Dissertation.
Stephenville, TX.
Lemmons-Smith, S. (2008). Dr. Asa Hilliard: Trumpeter for the academic and cuItural exceIIence of
African-American children. Review qf Educutionul Research. 78(4), 908.
Mahabir, J. 0. (2009). An emminution of r@rrul and eventuul placement ofstudents in speciul education
settings in a mid-sized urban school district in southern Californiu (Doctoral dissertation,
Claremont Graduate University, 2009). Dissertution Abstructs.
Martinez, R.S., Nellis, L.M., & Prendergast, K.A. (2006). Closing the achievement gap series: Part II.
Response to intervention (RTI)-Basic elements, pructicaf nppiications, undpolicy

recommendations (Edzrcution Policy Brie$ Vol.4, Number 8.) Bloomington, IN: Center for
Evtrlucrtion und Education Policy, Indiana University.
National Center for Educational Statistics. (2007). Stutus und trends in the education of ruciul and ethnic
minorities (http:Nnces.ed.gov/pubs2007/minoritytrends/Ind~7~26.asp#s). United States: National
Center for Educational Statistics.
NCES (20 10-28). The condition of education 201 0: Indicator 4: Rucial/e thnic enrollment in public
schools. I.E.S. National Center for Education Statistics.
Nelson, S. CV., & Guerra, P. L. (2008). Four-stage process changes individuals and entire schools. Journul
of Stujf Developnzent, 29(2), 55-56.
Osnald, D.. Coutinho, M., Best. A. & Singh, N. ( 1990). Etlinic representation i11 special Education: The
influence of school-rclatcd cconvmic and delnographic variables. Ute .Jo~rrncrl of L7pecid Etlucation,
32, 194-206
Patton, M. Q. (2002). Qualitutive Resetrrch & Evulztcrtion Methods 3. Thousand Oaks: Sage Publications.
Quiroz, P. A. (1 997). Silencing oj7the lurnbs: How Latit20 students lose their voice in school. Manuscript
submitted for publication, Michigan State University, MI.
Raffaele, L. M., & Knoff, H. M. (2003). Who gets suspended from school and why: A demographic
analysis of schools and disciplinary infractions in a large school district. Ed~tcution und Treutment
oJ'Children, 26( l), 30-5 1.
Reid, D. K., & Knight, M. G. (2006). Disability justifies exclusion of minority students: A critical history
grounded in disability studies. Educution~d Researcher, 35(18), 18-23.
Reilly, Thomas, F. (1991). Cultural bias: The albatross of assessing behavior disordered children.
Preventing School Failure, 36(1), 50-53,

Roberge, M.M. (2002). California's Generation 1.5 immigrants: What experiences, characteristics, and
needs do they bring to our English classes? CATESOL ,Jonr.nal, 14(1), 107-1 29.
Samson, J.S. (2009). Evidenced-based reading practices for response to interventiodresponse to
intervention: A practical guide for every teacher. Hcirvwd Educutioncrl Review. 79(1), 148.
Salend, S. J. (2002). A comprehensive approach to identifying and addressing issues of disproportionate
representation. Remedial and Special Education, 23(5), 289.
Skiba, R.J.,Simmons, A.B., Ritter, S., Gibb, A., Rausch, K. M., Cuadrado, J., & Choong-Geun, C. (2008).
Achieving Equity in special education: History, status, and current challenges. Journal of
Exceptional Children. 74 (3), 264.
Sodak, L. C., & Podell, D. M. (1993). Teacher efficacy and student problem as factors in special education
referral, The ,Jotrrnal qf'Speciul Ednccrtion, 2 7( 1 ), 66-8 1 .
Spiegel, A. E. (2009). Principal leadership characteristics that influence successful implementation of
response to intervention (Doctoral dissertation, Edgewood College, 2009). Dissertntion Abstracts.
Sugai, G. (2007, August 1). School-wide positive behcrvior suppor.t and I-esponsiveness to intervention
[Keynote Presentation to and paper for the Southern Maryland PBIS Summer Regional
Conference]. Waldorf, MD, September 1, 2009, Maryland rtinetwork.org.
Trainor, A. (2008). Why are so many minorities in special education? Remedial Special Edi~cation, 29(1),
58-59.
Upreti, G. (2009). The impact o f dutcr sharing on the uccltrucy qfstufjperceplions in schools implementing
,school-wide positive hehcrvior support (Department of Special Education and Psychology). Tempe.
Tucson, AZ: University of Arizona.
Wright, J. (2007). RTI too! kit: A prcrcticul grridejbr schools. Dude Publishing. Portchester, NY (233).

Yowell, C. M. (2002). Dreams of the future: The pursuit of education and career possible selves among
ninth grade Latino youth. Applied Developmental Science, 6(2), 62-72.
Zwald, R. L (2009). Everything in the middle: A case study of a Generation 1.5 student's academic writing
process. (Doctoral Dissertation, Indiana University). Disser-tation Abstracts.
http://www.vesid.nysed.~ov/specialed/spp/p1a11/suspension. htm,
http://www.vesih. n~sed.nov/s~ecialed/c haptes4051 Elementary and Middle School Assistance Center, 2009.

Appendix A Glossary of Terms

Glossary of Terms
The following are terms and acronyms used throughout the study. These are definitions
of the terms as they ,apply in the study.
AIS - Academic Intervention Services
Alternative placement - Placement of a student in another environment from school
necessary to ensure a more appropriate environment for the student, as well as to ensure
the safety of all students.
Classification Rate - Number of students with disabilities (SWD) in a racial/ethnic
group divided by the total number of students in the same racial ethnic group multiplied
by one hundred.
CSE - Committee on Special Education - a committee of professionals in a school
district (district level) who make decisions regarding the classification or determination
of whether a child shouId be classified or not after reviewing assessment scores and
building level recommendations.
CST - Child Study Team - a team of professionals who function in a school building
comprised of special education teachers, school psychologist, school counselor, regular
education teacher, and special area teacher who make recommendations after data has
been collected to move a student to the district committee on Special Education.
Disproportionality - The over or underrepresentation of a particular group of students at
a rate different from that found in the general popuIation. Disproportionate numbers refer
to either a significantly larger or smaller percentage of students from a specific minority
background placed in special education than the percentage of that minority in general
education.

Education for All Handicapped Children Act - Public Law 94 142. Federal legislation
passed in 1975 that makes available a free and appropriate public education (FAPE) for
all handicapped children in the United States. This piece of legislation was the forerunner
to IDEA.
Education Records - Records directly related to a student and maintained by an
educational agency or institution or by a party acting for the agency or institution. The
definition of "education records" has legal significance in terms of the privacy of student
records; see FERPA for a definition, as well as your state's regulations or statutes on this.
FAPE - Free and Public Education In monitoring Free Appropriate Public Education
(FAPE) in the Least Restrictive Environment (LRE) according to this law, there are 20
indicators used by the State of New York to determine whether or not a district is
complying with federal and state mandates regarding the rates of suspensions and
expulsions and disproportionality (Indicator 4 and Indicators 9- 10, SPP 2005-20 10).
Hispanic - A person of Cuban, Dominican, Puerto Rican, Mexican, South or Central
American origin or any other Spanish culture regardless of race
Human Capital - Defines education as a highly profitable investment. It focuses on the
individual's earning potential and affirms that a society can foster growth and
development by fostering the skill levels of its citizens.
IDEA - Individuals with Disabilities Education Act - PL 101 - 476. This legislation was
formerly known as the Education for All Handicapped Children Act). IDEA was
amended in 1997 as Public Law 105-17 and is usually just referred to as "IDEA" or
"IDEA '97." This piece of federal legislation is the heart of entitlements to special

education. IDEA also empowers parents as partners in their special needs child's
educational planning.
IDEIA - (IDEIA, 2004) - Individuals with Disabilities Education Improvement Act is
the landmark legislation, originally c ~ ~ r c t e d in 1975 as the Education for All Handicapped
Children Act. This legislation guides how states and school districts must educate
children with disabilities (Wyatt-Ross, 2007).
Inclusion - In special education, the term means to provide services to the student in the
regular classroom (instead of pulling the students out of class for services or segregating
them in special classes). In different areas, the term "inclusion" may take on additional
meanings such as modifying the curriculum that may not be rigorous or challenging so
that a student who would not be able to keep up with the school work of a "regular" class
can be educated in the regular classroom.
IST - Instructional Support Team - a group of stakeholders in a school charged with
making decisions regarding setting goals, program decisions, and monitoring for a
student who has been referred to the team due to academic and/or behavioral issues.
LRF, - Least Restrictive Environment - The usual or most typical environment possible
for instruction, treatment, andlor living. When applied to education, the least restrictive
environment is the regular (mainstream) classroom, for that is the least restrictive
environment that will enable the student to function and benefit from their educational
program. One of the considerations in determining LRE is that the proposed setting or
placement provides the student contact with children without disabilities "to the
maximum extent appropriate" (while meeting all of the child's learning needs and

physical requirements). Consideration and requirement of LRE is an important
component under IDEA. Pathological impairment - Having limited strength, vitality, or alertness due to chronic
or acute health problems such as a heart condition, rheumatic fever, asthma, hemophilia,
and leukemia, which adversely affect educational performance. Relating to or caused by
disease. Of, relating to, or manifesting behavior that is habitual, maladaptive, and
compulsive:
Odds ratios - The odds ratio is a way of comparing whether the probability of a certain
event is the same for two groups. (http://www.childrensmercy.org/stats/defi nitions/or.htm
Overrepresentation -Numbers that are disproportionately high in the representation of
students in specific disability-related categories that are above state and national
averages.
Overidentification - The overrepresentation of students in special education
programs/services that is above state and national averages; identification of more
students for services through special education than the proportion of that population in
the general population.
SpEd, SPED - Special education
Special Education - Instruction specifically designed to meet the unique needs of a
student with a disability, including classroom instruction, instruction in physical
education, home instruction, and instruction in hospitals and institutions.
Specific Learning Disability - A classification under IDEA: (1) General: a disorder in
one or more of the basic psychological processes involved in understanding or in using
language, spoken or written, that may manifest itself in an imperfect ability to listen,

think, speak, read, write, spell, or to do mathematical calculations, including conditions
such as perceptual disabilities, brain injury, minimal brain dysfunction, dyslexia, and
developmental aphasia. (2) Disorders not included: learning problems that are primarily
the result of visual, hearing, or motor disabilities, of mental retardation, of emotional
disturbance, or of environmental, cultural, or economic disadvantage.
SPP - State Performance Plan
Suspension - A disciplinary action that requires the student to be excluded from the
school building for a specified period of time School (Clristle, Nelson & Jolivette, 2004).
SWPBS - School-wide positive behavior support and responsiveness-to-intervention
(Sugai, 2007).
Chapter 405 - Chapter 405 (1 999) is part of the New York State Chapter Bill enacted by
the State legislature to address the major issues the Board of Regents had identified as
critical to improving special education services in New York State. Chapter 405 includes
provisions for addressing and improving results in problem areas (i.e., high rates of
identification of students as students with disabilities, low rates of declassification of
students with disabilities, high rates of placement of students with disabilities in separate
sites, and/or significant disproportion based on race and ethnicity in identification and
placement in particular settings of students with disabilities). These provisions include
technical assistance by the New York State Department of Education and, if appropriate,
the development of corrective action plans by districts
(http://www.vesid.nvsed.gov/specialed/chapter405).
VESID - Vocation and Education for Students with Disabilities

Appendix B
Teacher Interview Protocol

Teacher Interview Protocol I . How does the placement of students into special education result in
beneficial outcomes for those students? 2. What process do you follow to recommend a student for placement into
special education? 3. Do you believe there is a difference between the curriculum for students
placed in special education and the curriculum for students in general education?
4. What type of data have you collected on your students? 5. How has the information you have on your students impacted your
instructional practices? 6. How familiar are you with the District designed pyramid of intervention? 7. What do you know about the pyramid used in your building? 8. How is the model being implemented in your classes? 9. What impact do you believe has the implementation of the pyramid model
for intervention had on your instructional and behavioral management practices?

Appendix C
Administrator Interview Protocol

Administrator Interview Protocol
1. What determined the implementation of the RtI pyramid used in your building? 2. How was the determination made? 3. Who participated in the design of the pyramid for your building? 4. What is the process outlined for a student needing intervention? 5. How are the teachers involved with and involved in the RtI process? 6. Describe the process used in your building to recommend interventions for your
students. 7. Describe the process used in your building to recommend interventions for your
students. 8. What type of data do you collect on your students? 9. How are the data analyzed?
10. How are students monitored in your building?

Appendix D Seton Hall Internal Review Board Approval

OFF~CC C)F INSTITUTIONAT. .- - .. REVIEW BOARD
- - . -
SETON HALL UNIVERSITY
licina M a r t i n u 17 l'ict-ce Llri ve Ston! Point. XI ' I0980

REQUEST FOR APPROVAL OF RESEARCH, DEMONSTRATION OR RELATED ACTIVITIES INVOLVING HUMAN SUBJECTS
All material must be tvped.
PROJECT Tr'rLE: An Evaluation of the Influence of a District - 1)esigned RLI (Response to Intervention) Pyramid on the Rate of Classification and Achicvcrnent of RCE1.D (Racially, Culturnlly, Etboically and Unguisticelly) Divcrsc Students in Gradcs 5 -9: A Snapshot of u 1)istrict
CERTiNCA TION STA TEMENF
In makmy this application, I(we) certify lhat I(we) have read and understand the University's policies and procedures governing research, development, and related activities involving human subjects I (we) shall comply with Ihe letter and sp~rit of those policies. I(vre) further acknowledge my(our) obligation to (1) obtain written approval of significant deviations from the origtnally-approved protocol BEFORE making those deviations, and (2) report immedialely all adverse effecls of the study on the subjects to the Director of the Instilutional Revievr Board. Selon Hall University, Soy14 Orange. NJ 07079.
"Please print or type out names of all researchers below signali~re. Use separate sheel of paper, if necessary."
My s~gnatljre indicates that I have reviewed the attached maler~als and consider them to meet IRG standards.
SUPERVISOR ATE
p"w"rcOe znT .'Please print or type out name below signalure"
The request for approval submlled by the above researcher@) was considered by the IRB for Research Involuing Human Subjects Research at the= .LC ,: rc. L? c t 3 1 f.' rneehng
The application was approved .-not approved by the Commitlee. Special conditions were - were not set by Ihe IRB. (Any special conditions are described on the reverse side.)
.",
DATE-
REVIEW BOARD FOR HUMAN SUBJECl'S RESEARCH
Setorr Hall University 312005

Appendix E Solicitation Notice, Solicitation Letter and Volunteer Consent Form

Seton HaH University Institutional Review Board
&+ u*, /;&. SETON HALL i;l:l~:-~.:?, ; ,, ; ; -.7,: .'., :! i lCT 2 '7 21310 f . ,
j .; ! :-.;,;-:-: j , - , - I--.-* L . : . , . . . . . . . -..,-, .<.. >- .: .>,.-. UNIVERSITY -.-.-. . ."*.. - .>-. ,-..- 2*-*2-.->-w
1 8 5 6 Approval Dare
Consent Form for Classroom Teachers and Building Administrator to participate in the Research study:
An Evaluation of the Influence of a District - Designed RtI (Response to Intervention) 3 dz Pyramid on the rate of classification and achievement of RCELD (Racially, Culturally, a Ethnically, Linguistically) students in Grades 5 -9: A Snapshot of a District 5 P
,-> 4 0 2 E @--
'5 ,@; You are being asked to participate in a research study. Before you volunteer to participate, it is -. ---* <
important that you read the following information and ask any questions you may have regarding this investigation of a district - designed Response to Intervention (RtI) structure.
Researcher's
The researcher, Reina Martinez, is conducting research into the influence of a district - designed pyramid of intervention (RtI) structure on diverse students in grades 5 - 9. The researcher is currently an educator in the North Rockland Central School District and is conducting this work as part of her doctoral work at Seton Hall University. The researcher works in the high school of the district being studied, therefore, there is no daily contact with the participants of this study.
Purpose of the Study
The purpose for this research is to examine the influence of a school designed RtI sbacture on the rate of representation of diverse male students placed in special education, specifically in grades 5 - 9, by exploring local school dynamics and processes that may contribute to inappropriate classroom settings. The RtI structure was implemented several years ago in the district to ensure that students receive appropriate interventions as soon as they begin to show signs of failure. Since this process involves gleaning whether there is a particular pattern by RCELD (race, culture, ethnicity, language diversity) that may indicate an area of the referral process that needs further exploration.
The purpose is to analyze the influence of the RtI structure and how this model influenced the achievement and eventual outcomes for diverse students during the 2009 - 2010 school year in grades 5 - 9.
The purpose of this study is to evaluate the influence of the RtI structure on the achievement and or classification rate of diverse students into special education settings in 4 schools in the district by collecting district data fiom the NYSED, BEDS (Basic Educational Data Systems), VADIR and VESID. Student information gathered will be confidential and coded using student identification numbers. This coding will ensure anonymity. The data will be provided by a district Information Specialist. The study will also involve administrator and teacher interview information to analyze the involvement of the personnel in thk RtI process. The information gathered from this interview will add a qualitative component to the data analysis. Confidentiality and anonymity will be maintained using a coding system.
College of Education and Human Services Executive EdD. Program
Tel. 973.275.2728 400 South Orange Avenue South Orange, New lersey 07079-2685

Coltsent Agreement:
The signatui e below indicates that the individual has read the information in this document and has had the opportunity to ask questions about the study. This signature also indicates agreement to participate in the study.
The signature also confirms knowledge that the interview will be audio-taped and that withdrawal of consent may be exercised at any time.
Name of Participant
Signature of Participant Date
Signature of Researches Date
Pleasc complete and return this consent from within one week in the self-addressed, stamped envciopr. which is included for your convenience. Again, your participation and timely resporise :~rc gr-csattv :tppteciated.
A signed copv of this consent will be given to vou for your records.
L' Seton Hall University hstitufionai Review Board

Study of the Influence of Implementation of Response to Intervention (Rtl) Structure in Grades 5 -9
Volunteers are needed to participate in a study designed to evaluate the influence of the Rtt pyramid of intervention on the achievement and classification rate into special education of diverse students in Grades 5 - 9.
Please accept this invitation to Teachers of Grades 5 - 9 to attend an information session concerning the study being conducted
All of the information will be confidential and coded to protect all volunteers and students.
- - I he researcher, Reha Martinez is conducting this research to fulfill the requirement for the
Ed.D. in Educational Leadership from Seton Hall University and has received approval to conduct t'nis study in the district.
The purpose of this research will be to examine how the implementation of the pyramid and its components have influenced the achievement and or classification rate of male students placed in special education specifically in grades 5 - 9.
The meeting will be held in - a: -- school at --
Thank you for your time and consideration to this request.

Seton Hall tlniuersiv Institutional Review Board
P-
Description of the Study Q Response to intervention is a structure created as a function o f academic intervention to
address students who are experiencing acatlemic and or behavioral challenges. Response to S * *- %
Intervention (RrI), a term first coined by Frank Greshman (2003) is a problem solving structure .g used in schools to provide intervention to students who begin to show academic failure. (=z,
!.9 The methods of data collection to be w e d in this study will consist o f data on students in
gfidzs 5 -- 9 who had any form of RtI. The data collected will be used to analyze whether or not the interverltions implemented had any influence on the achievement and or classification rate of dlverst: s t~~dents; placed into special education.
Quantitative data will be gathered from the New York State Basic Educaticnal Data Survey (NY H E M ) , the N Y S E 9 Sch~o: Repcrt Card al-lct the L?is:~lci data bank for the 2003 - 2010 schuoi year. The qualitative data wili consist of interviews conducted and recorded with classroom teachers and building administrators to determine their involvement in the implementation of the district - designed pyramid. In addition, it will provide other information on the classification rate of RCELD into special education settings.
Benefits of the Study
Thc benetit of' participating in this sriirly is ro provide teachers and administrators information gathered :cgartiing the intluz~~c~: ol'!he R t i structure on the classification rate of RCELD students. This study sl~ould also bring attention to an issue of edi~cational importance; the underachievement, representation in special education, aiit.rna:ive settings and discipline referrals of RCELU students. Schooling and school perbonwi are pivotal in educating these students.
VoIuntnry Participation
Participation in this study is voluntary. The decision whether to participate or not, will have no effect on cmploynient within the school distr~ct. Individuals are free to withdraw thew consent and discontinue palwlpauon at any time. Participants have the right to refuse to answer any question posed for any reason.
Anonymity
'The school district will not be advised as to the identity of participants. The individuai interviews will be coded and the identity of the participants will be known only to the researcher. Information given to the district will be in aggregate form.
Audio-Recording
Information provided by the volunteers will be audio recorded and transcribed by the researcher. If an individual is uncomfortable with that format then participation should not be considered. The instrument to be used to record interviews was an Olympus Voice Recorder 7600PC.
Cori tidentiality
Interviews will be conducted by the researcher in a private location agreed upon by participant and interviewer. The interviews will be recorded but will be coded to maintain the confidentiality of the participant. Each session will be listed by a number with no identifiable

connection to the participant. The researcher will transcribe all of the digital recordings. Records will be kept on a USB memory device key in a locked file in the researcher's residence and will only be used by the researcher. Privacy will be maintained in any presentations resulting from this study. Reports will be written in such a way that individual differences will not be individually identifiable.
Contact Int'ormation
If there are any questions concerning the research or the design please contact:
Researcher: Reina Martinez North Rockland High School 1 06 Hanmond Rd Thiells, NY 10984 Office phone: 845-942-3337 Cell number: 845-222- 8395 Home number: 845-429-6504
Researcher's faculty advisor and contact iuformat~on Dr. Barbara Strobert Seton Hall University 1l)cpal.t~ucnt of Edi~cation, Leadership, Managenlent and Policy Office phone: 973-275-2324 Email: Strobe~tB~~!siiu.edu
I t ' thcri. are any qireslions ccnce~ning research subject's rights, the IKB contact may be reached at: IRE3 Contact: Dr Maly F. Ruzicka Oftice of the IRB I~residents Hall Seton Hall University Suutll Orange, WJ 07079 Office phone: 973-3 1 3-63 14

Appendix F
District Approval to Conduct Study

NORTH ROCKLAND CENTRAL SCHOOL Administrative Offtce Building
65 CHAPEL STREET, GARNERWLLE, NEW YORK 10923 (845)942-3002
Ileana Eckert Stcperin~cndent ojSchools
November 3,2009
Ms. Reina Martinez 17 Pierce Drive Stony Point, NY 10980
Dear Ms. Martinez:
Your request to access Haverstraw-Stony Point Central School District data pursuant to your doctoral dissertation is hereby approved.
Best wishes for a successful project. 1 look forward to reading your finished product.
Sincerely,
Ilcana Eckert Superintendent of Schools

Appendix G
Letter Requesting & Granting Permission to use ~Mahabir' Study

Reina Martinez 17 Pierce Drive Stony Point, NY 10980 E-mail: rnmarti59(~aol.com 845-429-6504 (H) 845-942-3337
Dr. Joseph Mahabir 679 1 San Diego Drive Buena Park, CA 9062 josephO 1 150 1 r'$yahoo.com Telephone Number: 3 10 769 6797 June 30,20 10 Dear Dr. Mahabir,
I am a doctoral candidate at Seton Hall University working on the dissertation portion of my degree program. The topic of my study is the representation of RCELD students in Special Education. This study involves an analysis and examination of how teachers and administrators are using the district-designed intervention pyramid model, what the influence of the intervention pyramid model has been on the rate of classification on the representation of RCELD students into special education placement and to what extent do discipline referrals influence placement of these students into special education placement. I respectfully request your written permission to use your teacher interview schedule with some modifications.
The representation of Hispanic Males in Special Education is an area in which I am personally and professionally interested in due to my ethnic background and as an educator in the North Rockland Central School district for the past 22 years. I would like to use your teacher and administrator interview schedules for my research which consists of a cross-sectional, descriptive, non-experimental design that would employ both qualitative and quantitative data.
If there is additional information you request regarding this matter, please do not hesitate to contact me or my advisor, Dr.Barbara Strobert at the Department of Education at Seton Hall University. Her telephone number is 973-275-2324. I have enclosed a self-addressed, stamped envelope for your convenience in mailing me approval to use your interview schedules.
Again, thank you for your help in granting me permission to use the interviews schedules in my research.
Sincerely,
Reina Martinez

Dr. Joseph Mahabir 6791 San Diego Drive Buena Park, CA 90620
Email: josephO11501~vahoo.com Home Phone: (7 14) 761 -2897
To: Ms. Reina Martinez Cc: Dr. Barbara Strobert From: Dr. Joseph Mahabir Re: Permission Date: September 7,20 1 0
Dear Ms. Martinez, As per our conversation 1 am granting you permission to use any part of my dissertation that may be of interest to you. Best of luck in the pursuit of your doctoral degree.
Sincerely, 4

Appendix H
Cover Letter to Panel of Experts and Interview Protocol Assessment Form

Cover Letter to Panel of Experts
September, 20 10
Dear -. .. p3
I am a doctoral candidate at Seton Hall University working on the dissertation portion of my degree program. The topic of my study is the representation of RCELD (racial, cultural, ethnic, linguistically, diverse) students in Special Education, I am conducting a study involving an analysis of how teachers are using the district designed intervention pyramid model in a school district in the Hudson Valley in New York.
The nature of this portion of my study will consist of both quantitative and qualitative research. The methods of data collection will include individual open - ended interviews with staff members (classroom teachers and building administrators). The information gathered from interviews will be recorded and transcribed. All interviews will be conducted in English.
I am asking for your participation in the assessment of the content of the interview questions for teachers prior to my use of these instruments. The interview schedule is designed to answer the following questions.
1. How has achievement of RCELD students been influenced following the use of a district-designed pyramid of intervention, as defined by scores attained on the NYS English Language Arts (ELA) and NYS Math assessments in grades 5 - 9 during the 2009 - 20 10 school year?
2. How has the classification rate of RCELD students into special education been influenced following the use of the implementation of a district - designed intervention model in grades 5 - 9 during the 2009 - 201 0 school year?
3. How has the building administrator been involved in the implementation of the district - designed intervention (RtI) model?
4. How have the teachers in their respective buildings used the district - designed intervention (RtI) model?
In reviewing the instrument, I am asking that you consider the following: 1. Are the questions on the instrument relevant to the questions guiding this
study? 2. Are terms and questions easy to understand? 3. Are directions clear? 4. Is the instrument culturally sensitive? 5. Please provide suggestions you may have regarding the order, the content, the
wording of the instrument (interview questions)?
Attached is an assessment form which can be used to indicate whether or not you accept or reject any item outlined on the interview schedule. Also, on the spaces

provided, include any changes you would like made to any of the items on the instrument. Please complete the Assessment Form and return it in the pre-addressed, stamped envelope enclosed for your convenience. Your participation, input and timely response are sincerely appreciated. If you have any questions or concerns, or if there is additional information you request regarding this matter, please contact me at 845-429- 6504 (H), 845-222-8395 (C) or 845 942-3337 (W) or my advisor, Dr. Barbara Strobert at the Department of Education, Leadership, Management and Policy at Seton Hall University. Her telephone number is 973-275-2324.
Again, thank you for your support and cooperation in granting me the opportunity to conduct this research in our district.
Sincerely,
Reina Martinez 17 Pierce Drive Stony Point, NY 10980

Question # 1 Cornmcnt/Suggcstions:
Question # 2
Question # 3 Commen t/Suggestions: .-
Interview Schedule Assessment Form (This is the form sent to the panel of experts to determine the validity and reliability of the instrument, the interview schedule to be used with the classroom teachers and administrators).Directions: Please indicate: (1) whether or not you accept or reject the item, (2) indicate what research question the item refers or applies to and (3) include any comments or suggestions you may have regarding the structure, wording or changes that would improve the question.
Question # 5
Ql~estion # 6 Comment/Suggestions:
Question # 7 63.6ent/Suggestions:
Question # 8 Commen t/Suggestions:
Qrrestion # 9 Commenl/Suggestions:
Name:
Signature: Date:

Appendix I
Permission From G. Sugai to Use Pyramid of Intervention

Appendix I
Permission From G . Sugai to Use Pyramid of Intervention

SETON HALL UNIVERSITY. Reina Martinez 17 Pierce Drive Stony Point, NY 10980 E-mail: [email protected] 845-429-6504 (H) 845-942-3337
Dr. George Sugai Educational Psychology Department Neag School of Education 249 Glenbrook Road, Unit 2064 Stom, CT 06269-2064
September, 2009
Dear Dr.Sugai,
I am a doctoral candidate at Seton Hall University working on the dissertation portion of my degree program. The topic of my study is the representation of Hispanic males in Special Education. This study involves an analysis and examination of how teachers and administrators are using the district designed intervention pyramid model, what the influence of the intervention pyramid model has been on the representation of Hispanic Males into special education placement and to what extent do discipline referrals iniluence placement of these students int special education. I rwpectruily request your permission to use two figures which were designed by yon, the Integration of Academic and Social Behavior Three Tiered Continuum Behavior Support and the Comparison of RTI in Literacy andSocial Behavior.
The nature of my study will consist of a cross-sectional, descriptive, non-experimental design employing mixed methods; quantitative and qualitative. Both qualitative and quantitative methods will be used to answer the m h questions in reference to RCELD student representation in special education. disciplinary referrals. the influence the district designed intervention model has had on the representation of these students in special education placement, and the level of involvement by the building administrators and classroom teachers in the implementation of the district-designed pyramid. Qualitative data collection will include individual open - ended interviews with staff members (teachers 'and administrators) and the quanritative method will include information gathered h m examining district data. The following questions are guiding this study:
College of Pducaclon and H~mm Mccl exnartk FAD. hDgml
TeL 973375.2721 4 0 6 Sauch Orange Amue South Orange, New l auy 07079-2685

1. How has the classification rate of RCELD students been influenced following the use
of the implementation of a district designed intervention model?
2. How has the building administrator been involved in the implementation of the
district designed intervention model?
3. How have the teachers in their respective buildings, used the district designed
intervention modei'?
Your permission to use these figures would enhance my dissertation to illustrate and compare your figures with the ones currently used in our district. I have enclosed a self-addressed, stamped envelope for your convenience in mailing me approval to use your figures.
If there is additional information you request regarding this matter, please do not hesitate to contact me or my advisor, Dr.8arbara Strobert at the Department of Education at Seton Hall University. Her telephone nurnbcr is 973-275-2324.
Again, thank you for your support and cooperation in granting me permission to use the figures in my research.
cc: Dr. Barbara Strobert, Advisor - Seton Hall University


Appendix J Teacher Interview Transcriptions

Teacher Interv~ew Summary
program outcomes
Process recommend
Difference curriculum
Collect type
Information instruction
District intervention
Building RtI
Model classes
Impact Behavior
Collaborate struggling
Process plan
Assessments strategies
Literature circles One on one
reading
Monitor progress
Strategies
Lndividuals review
Progress meet
Changing Methods
Intervention Benefit
Discuss Follow
Classroom same
State assessments
Adjust Flexible
Requirements
IST Identified
Adjust differentiate
Close monitoring
Needs met
We Direct way
Interest Learning styles
Goals instruction
Conversations f ~ z y
Different levels
Support ESL/
Spec.ED
Attention special
Class size handle
No understanding
Lost
Deliver at a different pace
changing
Academic social
Access Compare
Old school Good results
Unfamiliar behavior
Degree discipline
Adjustments Curriculum
Process COIlSent
Multi-faceted process
Goal declassified
Samples patterns
Diversify curriculum
Co-teachers Well-versed
Changing diversifjmg
Optimal performance
Academic Appropriate placement
Follow Protocol
Adapted ability level
Visual auhtory
Different Extra help
Covered Staff meetings
Process evaluation
Team interventions
Working with teachers and
Mainstream ed
different
First step noticing
Modificatio ns
differentiatio n
Variety Formal informal
Invaluable Formative assessment
Involved process
Academic help
Different Needs
awareness
Educational needs
Team intervention
Modifications extra time
Standardized test scores
Adjust understand
Classroom recommendation
Ability process
Where they are adjust
Accept needs - -
feedback

Interview With Teacher "A"
Ms. Reina Martinez: Again, thank you for your participation in the interview. Again, for the purpose of the transcriptions you are going to be "Teacher A". Okay, the first
question is,
1. How does the pIacement of a student into a special education program result in beneficial outcomes for those students?
Yes, completely. I think the placement of students into special education benefits the student because, I think, we do a good . . . we really look into it deeply to see if this student can benefit from the procedures that we put in place to help him. And if he gets into special education he has some modifications that can help him learn better. I think it helps. I think by me informally diagnosing the certain student that we're talking about helps with the referral and helps determine if the student should be in special education, if he's eligible for the help that we're hoping to get him or her.
2. What process do you follow to recommend a student into special education?
Usually, some of the students stand out from the other kids, just by an overview of what's going on in the classroom. They might not be prepared for, maybe, some homework, they don't have a pencil, or they're just shuffling around . . . not that they just don't have a pencil . . . they don't, a h . . . it's a tough question . . . how do we refer them? Usually within one or two weeks of school they consistently come in with zeros or they're stuck on things, they come up and said they don't understand certain things, and then we would also pull the student aside and do some kind of intervention, as far as to see what Ievel they are in math, you know, basic operations. I teach a fifth grade, so our first unit is big numbers, I would give them some questions as far as can they read certain numbers, what place value is the number in, what's the value of the number, and that usually helps out with math, as far as that they might need some services. As far as ELA, we do a pre-assessment in reading, and then we kind of determine what grade level they are on, and that's a good start, if you know they're two grade levels below. If they're one grade level below, it's a little easier to get them into . . . you know, just to catch up. We do the . . . there is an IST team that we put some paperwork through to, and then we fiIl out some of the questions that they ask as far as "what modifications have we been doing?" or, "How can you rate his behavior, his academics?' and then we put the paperwork through and an administrator, is the chairperson of the team and then we will have, ure will set up a meeting and we'll think of what type of help we could give the student and then we'll work that through. We'll implement that stuff and then what we will do is we will meet again at a later time and then there's more paperwork to fill out as far as the IST team goes.

3. Do you believe that there is a difference between the curriculum for students placed in special education and the curriculum for students that are in general ed.?
No, there isn't, however I think special education settings provide students with a smaller group in which to work. Special Education teachers use strategies that are specific to the needs of the students in their classes. They set up plans for the students and they monitor them more frequently because they have smaller groups and they are expected to.
4. What type of data do you collect on your students?
My grade, basically, is based on homework, class work, tests, projects and quizzes. So, I don't think that we should just have tests . . . actually, it's a fumy story . . . my daughter has just tests, she's in a private, parochial school, kind of, that's like, it seems like a11 she has is tests, and I think that there should be some alternative assessment. I wasn't a good "test taker" myself, so I don't think we should rely on tests, I think there's different ways to do it. We implement rubrics in our classroom. As far as projects also, and participation helps, as far as how well they do their homework, I do, in math, I do grade just about all the homework assignments. But, there are also other ways, as far as in class projects that they do have the assistance of teachers that are in the building or in the classroom that can help them. So, that's as far as how I assess my students.
5. How does the information you collect inform your instructional practices?
Well, every two weeks the students go home with assigned folder work with everything that I've graded over the two week span. So, 1 do have that data on each of the students. Also, we do, in reading, we do some . . . a little bit of ''running records" in the middle schools, as far as how well they are reading. Also, we jot down notes, and you know, as far as a behavior book that has like a log of phone numbers for my students, so I jot down different things, as far as how well they are doing in class work, participation, also behavior goes in there too . . . as far as how well they are fitting into the classroom. I think it has impacted it greatly, because this year I have a very talkative group and I had to adjust, as far as even how I teach, because they're not one to just sit as a whole class, where I could just speak as I usually do in math class. So, I have even more of the groups that I have, that I usually . . . I usually do group work, but, I even have to do more group work to break the kids up into smaller groups. So, you know, understanding how my students learn best is how, you know, will impact my practices, as far as how I will instruct the class.
6. How familiar are you with the district design pyramid model for intervention?

I really . . . I'm not too familiar with the RtI model besides the information that you sent or you gave me.
7. What do you know about know about the pyramid used in your building?
Not a lot. I've been involved in meetings and I've filled out forms, so I've been involved somewhat.
8. How is the model being implemented in your classes?
I don't, I mean, is the RtI model . . . is that . . . Response to Intervention . . . OK, OK, I think, is it being modeled in the class . . . I guess it is then. If I have it right, then, I mean, I'm passing the information along the IST team, OK, alright, sorry about that. So, it is being used, as a matter of fact we're going through it with one of the students right now. We just actually, it worked out in, hopefully, in the favor of the student, that he's being placed where he needs to be placed. So, through the IST team the teacher is given information to the IST team, the IST team doing their job, I think the student is now placed in the appropriate learning environment.
9. What impact do you believe has the implementation of the pyramid model for intervention had on your instructional and behavior management practices?
I'm very comfortable with it. I think it's really beneficial for the kids and as a, you know, as a teacher . . . that's what we're here for, just to make sure that all the kids are placed in the right environment, as far as learning, and what's best for them.
Ms. Reina Martinez: Thank you so much

Interview with Teacher "B"
Ms. Reina Martinez: Again, thank you for your participation in the interview. Again, for the purpose of the transcriptions you are going to be "Teacher B". Okay, the first question is,
1. How does the placement of a student into a special education program result in beneficial outcomes for those students?
Yes I do, small environment, I even think for all students smaller groups the better of they are this way they can get more one on one actually for they have an aide in the classroom so I definitely, believe it helps them, in a regular classroom they get lost switching of classrooms what teachers, special ed is much more organized class of six or eight.
2. What process do you follow to recommend a student into special education?
UsuaIIy meet with guidance, special education teachers, the principal we usually first try to come up with some sort of plan to see if they can make it in the regular classroom and if that does not work we look at past records and we take it from there. Usually, it's a long process.
3. Do you believe that there is a difference between the curriculum for students placed in special education and the curriculum for students that are in general ed.?
No, I don't. Students are still required to pass state assessments as required by the state. But, as I said before, I even think that in smaller groups students can get more one on one actually. So, I definitely, believe it helps to be placed in special education instead of a regular education classroom. Special Education teachers are trained to have many different abilities and yet cover the material that needs to be covered with all students.
4. What type of data do you collect on your students?
Assessments, classwork, homework, tests and quizzes. I always do smaIl groups, I always work with small groups, literature circles one on one whole class all of the above.
5. How does the information you collect inform your instructional practices?
I keep a folder for each of the students and I also have packets for each of the students for each unit so at the end of the unit I collect all the packets which includes all of the notes, class-work, homework assignments and type of writing

assignments and at the end of each unit I not only have a packet, but rather a folder with all their work.
6. How familiar are you with the district design pyramid model for intervention?
Not that familiar. Oh
7. What do you know about know about the pyramid used in your building?
We always meet on individuals. We, again like I said, we collect data on the students and we all meet together. We review everything to see where they should be placed.
8. How is the model being implemented in your classes?
I monitor students' work and assessments, when I see that someone is not progressing, I contact other teachers on the team and we have a meeting on that child. If necessary, we will also gather information from the special teachers.
9. What impact do you believe has the implementation of the pyramid model for intervention had on your instructional and behavioral management practices?
Every year I get a little more comfortable with it so does my team usually every couple of weeks we review it and review where students need to be and we take it from there.
Ms. Reina Martinez: Thank you so much

Interview With Teacher "C"
Ms. Reina Martinez: Again, thank you for your participation in the interview. Again, for the purpose of the transcriptions you are going to be "Teacher C". Okay, the first question is, 1. How does the placement of a student into a special education program result in
beneficial outcomes for those students?
My experience has been those students are monitored more closely by the special education teachers and by the regular education teachers we meet together and meet regularly to see that their needs are being met.
2. What process do you follow to recommend a student into special education? Well, we have IST committee, the meetings and IST process we go through that and I would say usually through the steps of the IST process would be the most direct way
3. Do you believe that there is a difference between the curriculum for students placed in special education and the curriculum for students that are in general ed.? No, I don't think so. I don't think that it is.
4. What type of data do you collect on your students? Well in the beginning of the year we do collect information about the students' interests, how they perceive themselves and it's usually the first week of school their interests what type of learners they feel they are and and I keep a little file of that and then I also ask them what they see as their goals and how they see themselves as being and just as the year goes on through conversations I get to know on I get to know them better not that I keep a log or anything, and then of course through testing and the lab and all that type of stuff,
5. How does the information you collect inform your instructional practices? Well that students have strengths in certain areas that they see themselves as having those strengths and I know that If I can implement that somehow I will ask for assistance from that student, let's say a student has artistic strength and likes to draw and I need someone to draw something, I will ask that student for assistance.
6. How familiar are you with the district design pyramid model for intervention? I am familiar with it. I don't claim to know it very well and conversations that we have had about it and that there are three tiers and I am not sure a little fuzzy about how the tiers melt into the next one, but I am familiar with it.
7. What do you know about know about the pyramid used in your building? I know that some of the interventions that are used at different levels of the pyramid the interventions that are used in but I do know what interventions.
8. Haw is the model being implemented in your classes? In my classes, I have ifmy understanding is correct I have some support, some special education, ESL teacher support for those long term L's and we have meetings with those teachers as to how better meet the students' needs.

9. What impact do you believe has the implementation of the pyramid model for intervention had on your instructional and behavioral management practices? I guess it has just made me more aware of the students who might need special attention, and things I know that there are more things available I know that there are teachers and I can go to those teachers. Ms. Reina Martinez: Thank you so much.

Ms. Reina Martinez Interview With Teacher "D"
Ms. Reina Martinez: Again, thank you for your participation in the interview. Again, for the purpose of the transcriptions you are going to be "Teacher D". Okay, the first question is, Teacher D
1. How does the placement of a student into a special education program result in beneficial outcomes for those students? Well, in my experience, not that I teach special ed., but I think it's beneficial, obviously. The main reason, I think, is because of class size. At least with a smaller class size they'll have more contact with the teacher. I remember years ago, the maximum class size was 12, now it's increased to 18, and, which I think it hinders the kids now. Of course, now, with them being put into inclusion classes, some kids can handle it, not all. But putting them into special ed classes, it's, it's better for them.
2. What process do you follow to recommend a student into special education? Basically, obviously, to see how they're doing in class. If I see that they're completely lost, meaning that they have no understanding what-so-ever, if their grades are lacking in respect to the rest of the class. You know, if the rest of the class or most of the class is getting 6OYs, whatever, or 70's, 80's and this kid's like in the 30's or 40's, there's something wrong. I think it's more that, obviously, more of a special needs then that it is, I think, that they just don't understand. And then I would probably, in the process, I would then, you know, take a look at their past scores, reading scores, elementary scores, middle school scores and then speak to their guidance counselor. And, then from there, obviously, the recommendation, I guess, for the CSE or CST.
3. Do you believe that there is a difference between the curriculum for students placed in special education and the curriculum for students that are in general ed.? You know what, that's . . . because I teach a Regents class, you can't really change the curriculum, because, in the end, obviously, all these kids will be taking the Regents Exam. In a non-Regents class, I can see changing, you know, altering or modifying the curriculum. More so, in that, maybe, to deliver at a slower pace, probably not include more, like for instance, with me with the regular class, sometimes, not that I go off on a tangent, but I may bring in other information that the kids might not, necessarily, need for the Regents Exam, but just for general knowledge. Whereas, maybe, with a special ed class, you really can't do that, because you have to adhere, especially with a Regents, as I said, you really have to adhere to the curriculum. You really can't diverge that far off, because, obviously, the kid is going to suffer for that.
4. What type of data do you collect on your students?
Within that class, I don't know, if you're talking about determining grades, or whatever, obviously, their homework, their class assignments, the assessments, quizzes and tests. Also, not too much that it's like a social grade, but to see how they react, not only with me, but with their peers, and not so much the behavioral issue, but as if, you know, if they're understanding what's going on, if they feel like they're

completely lost or not. Also, I like to compare how they're doing in my class to other classes as well. I, we, have access to look at their report cards and I will, if a kid is doing poorly in my class. I want to see if it's just my class, or is it across the board. And, more often than not, I would say that if they are doing poorly in my class, they're probably, they are doing poorly, interesting enough, in math as well. And, so I like to compare and see what they rc doing and if it's really, the grade is really bad, I like to take a look at their 8th grade scores, the assessment and compare it to what they do in my class presently. 5 How does the information you collect on your students inform your
instructional practices?
I, we, have access to look at their report cards and I will, if a kid is doing poorly in my class, I want to see if it's just my class, or is it across the board. And, more often than not, I would say that if they are doing poorly in my class, they're probably, they are doing poorly, interesting enough, in math as well. And, so I like to compare and see what they're doing and if it's really, the grade is really bad, I like to take a look at their sth grade scores, the assessment and compare it to what they do in my class presently.
How famiIiar are with the district-designed pyramid model for intervention? To be honest, not overly familiar. I would, probably, the reason probably being is that I'm pretty much "Old School". And, what I've been doing over the years has worked and I've been pretty successfid in my results with the kids and, I don't think, I don't think that I would change much. What do you know about the pyramid used in your building? Again, not familiar what-so-ever. Again, not familiar what-so-ever How is the model being implemented in your classes? And, again, because I'm unfamiliar with the entire method, I believe, in a classroom, it could be any classroom, I think behavior is the main, the main issue, discipline. What impact do you believe has the implementation of the pyramid model for intervention had on your instructional and behavioral management practices? Obviously, with the special ed kids, again, it depends upon the degree, that they are so called, "special ed". Because, I believe that all kids know the difference between right and wrong. Because, otherwise, then, they don't belong here. If that comes to the point where they just don't understand that. So, I'm, I'm a firm believer in discipline first and then academia would follow. So, you know, the management issue that I have in class is pretty much null and void, in that I don't have a problem. That, but, I think, that is very important.

Interview With Teacher "E"
Ms. Reina Martinez: Again, thank you for your participation in the interview. Again, for the purpose of the transcriptions you are going to be "Teacher E?'. Okay, the first question is, Teacher E.
How does the placement of a student into a special education program result in beneficial outcomes for those students? That's a very good question. After several different assessments, adjustment in the curriculum, delivery? Curriculum, different interventions in regards to how we reach the children, diversifying curriculum. Then we look at if these processes have failed, and now we need to see if there is a gap, or a missing piece from achievement and ability.
What process do you follow to recommend a student into special education?
The speciaI education process is usually by consent of the psychologist and the school councilor. That is how it initially starts. When the parent gives consent, then we can proceed forward to testing. But we try to do things prior to that obviously.
Do you believe that there is a difference between the curriculum far students placed in special education and the curriculum for students that are in general ed.? Can you describe the process you follow to recommend a student to Special Education?
Yes, there is an outlined process. It is multi-faceted. The first thing we have to do is refer a student to RTI. That committee goes over with a specific teacher what things have been put in place for a student to achieve greater success in the classroom without having to go up for special education. At that meeting there is a pool of teachers, with a pool of ideas, with a pool of solutions that have worked for other students in the past, and you pull from there. From that point, you implement from those things, and if you see the response is moving forward, then we wouldn't go forward with classification. We would see that these interventions have worked. In the event those interventions have failed through time, then we know there is probably some type of gap and we need testing to be done.
What Qpe of data do you collect on your students?
Yes, if properly done. The goal for special education is not to stay classified; the goal is to become unclassified down the road. The true goal is to learn how to achieve and become successful with the disabilities you have. You make those accommodations and modifications in your learning, but at the time, it's hard to compensate. Anyone that has a disability would still want to be successfbl, so what you do to compensate for that disability and the goals for special education develop strategies for students with disabilities to eventually be successful down the road.

5. How does the information you collect inform your instructional practices?
In response to intervention, for that- tests, quizzes, work samples, homework samples, writing samples. All of those things are cumulative, and if there is a pattern, we can see where the student is able to do homework- lets say- and they still do poor on tests, is it a study issue? Is it something where they need to develop skills in transferring what is being taught into independent practice and retention? Or we look at the test scores. Are the tests too large? Are we not testing what is being taught? All those things go into place, so when we look at the information with a committee of people versus the one teacher maybe stuck in that one format you try to develop a different strategy and see where you can optimize the student's potential.
6. How familiar are you with the district design pyramid model for intervention?
When a student goes up for RTI it impacts it greatly, it's a lot more work for the teacher individually because now you're looking at trying to diversify the curriculum a d the information differently so that another student in the class can adapt and learn it, as well. But does it work? 1 believe, yes, if it's done appropriately then the outcome is beneficial. If the student is involved ??? that feedback- is this better than what we have done in the past- and the student says yes, then that's what you should go with. Because the idea is just to get the student in the easiest, most conducive way possible that doesn't deter them of discourage them.
7. What do you know about know about the pyramid used in your building?
I am not as familiar as I should be, but from having people that I know personally and coworkers work on the committees itself, and my co-teacher helped develop the program, I'm pretty well versed I believe.
I know that there are different components to the pyramid of intervention. The first is the gathering of information- the process where all the teachers meet and put a student up, and then you come back after a certain amount of time to see if the interventions you have chosen as a committee work. And then you go from there. If they do work- do you implement it, if not- what do we re-do and where do we go from there. There is a process that builds up to student performance.
8. How is the model being implemented in your classes?
By changing the curriculum, by changing the assessment forms, looking at different modalities of teaching in general, diversifying the information, giving student different and multiple opportunities to come up with the same solutions- but maybe present it differently. So that their method of presentation for assessment will be more

conducive to ensure they have learned something. The different ways you assess, the different ways you teach, how you diversify and differentiate, and instruction- is what allows students to show their individual performance.
9. What impact do you believe has the implementation of the pyramid model for intervention had on your instructional and behavioral management practices?
As a special education teacher, I think the model is good- and it has the right idea. I think that the model is appropriate. They are looking at helping students perform optimally without having to go to classification, which is a stigma in the past- if a student is not achieving- then lets classify them. So we want to remove that, because we don't want to misplace students, or classify them unnecessarily. But in the same breath, I would hate to see it turn into something that prevented classification because of a "numbers thing" in our society where- "are we being judged at how many classified children we have," so we prolong classification because we are using these things to stop that. I think there needs to be a more definitive line of: when do we classify? And when do we not? So- with that being said, that's generally how I feel about it.
Thank you.

Interview With Teacher "F"
Again, thank you for your participation in the interview. Again, for the purpose of the transcriptions you are going to be "Tezcher F". Okay, the first question is,
How does the placement of a student into a special education program result in beneficial outcomes for those students?
I think based on that there are test scores and academic scores we look at the overall student and try to place them appropriately based on this year math and ELA language arts skills.
What process do you follow to recommend a student into special education?
We start out by going out through the IST process so we fill out the paper work for that we meet with the guidance counselors and the principal and we follow the protocol from there.
Do you believe that there is a difference between the curriculum for students placed in special education and the curriculum for students that are in general ed.?
I teach general ed., I don't teach special ed.,, but from my understanding from what I know the curricuIum is the same. It is just adapted to their ability level.
What type of data do you collect on your students? I do visual, auditory and just transcriptions of observations that I make. We have quizzes, tests in the classroom that I make.
How does the information you collect inform your instructional practices?
Based on all the different methods, I can pin point who needs extra help see who needs extra help, we offer extra help before school, lunch time and in small groups during class. I think again, we look at all of the data that we collected and try to target those students and try to group them together and provide any special
How familiar are you with the district design pyramid model for intervention?
We have covered it several times during faculty meetings and staff development days I think most of us are at the IST levels I don't think that any of us are at the higher levels I think most of us are involved at the IST levels not the higher levels.
What do you know about know about the pyramid used in your building?

Again, we start with the IST process from there they are evaluated for any special programs.
How is the model being implemented in your classes?
I think as a team we meet together, we discuss students who need special interventions and we go forward on the IST process.
What impact do you believe has the implementation of the pyramid model for intervention had on your instructional and behavioral management practices?
A lot of it is working with the intervention teachers, getting feedback from them on whether the interventions are working and on how we can work together to make our students successful.
Ms. Reina Martinez: Thank you so much.

Ms. Reina Martinez Interview With Teacher "G"
Ms. Reina Martinez: Again, thank you for your participation in the interview. Again, for the purpose of the transcriptions you are going to be "Teacher G . Okay, the first question is,
1. How does the placement of a student into a special education program result in beneficial outcomes for those students?
I'm sorry could you repeat that question one more time?
Okay, I don't have much contact with special education students, and I'm not sure what programs they're involved in, so I'm not sure if you want to pick someone else to interview. No? Okay. Because I don't actually have anyone mainstreamed into my classes this year. Before, we had different students come in for subject areas, but for special ed., they're in different classes this year. So it may be different for the specials, because then they do go to special classes, like the encore or Specials. But in terms of ELA and for Social Studies this year I don't really see any of that. So I could really answer that question.
2. What process do you foHow to recommend a student into special education? Okay, we usually have a team meeting; we also have an IST Team here, in which the first step is to refer a student. Then we meet as a building level so we usually have teachers, principals, assistant principals, and guidance councilors, anyone we can get them involved. We usually meet and come up with ways that we can help this student and things that we are noticing. Then the next step would be to contact parents, and do a diagnostic test, and take it further.
3. Do you believe that there is a difference between the curriculum for students placed in special education and the curriculum for students that are in general ed.?
No I don't think so, I think it should be the same, I think it's the way it's gone over and taught. I think in terms of modifications and differentiations that must be made in order to meet their needs.
4. What type of data do you collect on your students? A variety of different data, Whether its formal assessments, informal assessments, conferences, a variety of different data.
5. How does the information you collect inform your instructional practices?
Actually, it's invaluable, I think in terms of collecting the data, because it tells you the strengths and weaknesses of a student. This year we are having monthly assessments for ELA and for Math in the district. I find that what they're giving us is not enough. Especially for ELA, it's a short reading passage and four questions. Which I find, four questions is not enough. I don't need a three hour exam or assessment, but I would like something with a little more meat, to get

some more information because that really helps you in terms of your teaching. Also working in small groups, and working one on one with a student. Another example, in terms of writing, we are working on descriptive writing pieces right now, so as I conference with the students and I actually sit with them and see what they are working on, I can see that some of them need to work on their beginnings, or some in terms of grammar, so we can do small focus and mini lessons on different areas that they need to improve upon.
6. How familiar are you with the district design pyramid model for intervention?
Not that familiar. But to be honest, this is my fourth year after a three year child care leave, so in terms of special education I feel like I had more of a background at West Haverstraw because they had a blended class, so I sort of feel a little bit out of the loop.
7. What do you know about know about the pyramid used in your building?
When you refer to the pyramid- pyramid is the.. .?
Ms. Reina Martinez: . . . response to intervention.
I have been involved in meetings, I have been asked to fill out data collection sheets on students. So I have been involved in that process, and seen students who have actually gone through that and get the help that they need.
8. How is the model being implemented in your classes?
In our classes right now we have students who are receiving academic help in terms of aflerschool programs. In terms of referrals right now we don't really have much on my team this year, but if the need was there I would know how to get the process started.
9. What impact do you believe has the implementation of tbe pyramid model for intervention had on your instructional and behavioral management practices?
1 think after working with a variety of students it changes from year to year. I also think that working with special education teachers- there are a couple here that have pushed in- it opens your view and makes you more aware of the different learning styles, and to be more in-tune to the different needs of the students. And not just teach to the middle but you have to teach to the whole group. Whether it's re-teaching in a different way, or using such technologies as the smart board, and going to the computer lab and things like that. I use many different tools to teach.
Ms. Reina Martinez: Thank you so much.

Ms. Reina Martinez Interview With Teacher " H
Ms. k i n a Martinez: Again, thank you for your participation in the interview. Again, for the purpose of the transcriptions you are going to be "Teacher H". Okay, the first question is,
1. How does the placement of a student into a special education program result in beneficial outcomes for those students?
Certain students really do benefit from it because they get more one on one help, and they get more interventions with an extra teacher in the classroom. They also will get special settings for their educational needs and they tend to do better because they do have the background and they have that extra support system and that's what they need. Most of the kids that are in special education classes need the extra support, whether its for organization, whether its for reading, whether its checking for understanding- having the extra support in the classroom benefits them and brings their achievement levels up.
2. What process do you follow to recommend a student into special education?
The first thing we do is discuss it amongst our team because in middle school we have team and we decide what the needs are for the student. On our team level we institute some of the interventions such as double checking for homework and making sure the parents is informed on the issues that the student is having. If the student is not doing homework for some reason, for an intervention we might take their agenda and make sure they are putting their homework in their agendas everyday and having their parents sign it to see that they do have homework. If the interventions that we do on a team level don't work then we will go to the IST. Most of the time the IST's are used rarely now I'm seeing because its been taken care of prior to meeting seventh grade.
3. Do you believe that there is a difference between the curriculum for students placed in special education and the curriculum for students that are in general ed.?
In my classroom there is no difference; and as far as I know there is no difference in the classes on my team. The children are treated the same, except they get their interventions- if they need extra time they get their extra time, if they need their directions read they get their directions read- but they are not treated different as far as the curriculum goes at all.
4. What type of data do you collect on your students?
Of course we have all of the data on the state assessments that we look at as a team. Working as team in middle school is just great because we can meet the needs of all the students. We look at the data from the state assessments, and in my classroom I look at quiz grades, I do an item analysis on my quizzes and test so I know where my students

stand. I go by the IEPs, 1 look at the levels of the tests that they had when they were placed into a special education program. Any data I can get my hands on, I take a look at it.
5. How does the information you collect inform your instructional practices?
I have been noticing that there are some students in the general education population that there are some students having trouble with reading and comprehension, and if I look at the ELA results I can see where they are falling in certain categories and I can adjust my teaching and my assignments according to that. I try to do more reading in my classroom and I try to institute more lessons that have comprehension problems and inferences, because kids are having a hard time with inferencing. I try to institute that more than I used to. I try to adjust as I go, and I try to be very flexible with what I do. One year I may not have to do something like that, but next year I might. The data helps me understand where my kids are at and what I really need to concentrate on.
6. How familiar are you with the district design pyramid model for intervention?
I'm not very familiar with it. I know what my requirements are and what I need to do starting with my classroom and my team, and going to the IST and after that. ISTs- I don't know if they are reaIIy doing the job they are supposed to be doing, because many times you recommend a child for an IST and you come up with strategies, but the strategies are already things we decided to do on our team level. After that, I really don't know that much about the response to intervention part, I don't know where that comes in, and I don't know if it's meeting the needs of all the students in the district.
7. What do you know about know about the pyramid used in your building?
In my building I don't think it's really being used to its greatest ability. I think people are disgusted, or dis-enlightened by the IST process. I don't think it's being used as much as it used to be. I don't know whether it's because the students are being identified before they reach a certain level, or if they are using more of the ELA and Math Assessments to look at the kids and see where they are at. I don't know where things are happening at because we haven't done an IST. We did one last year, and prior to that for a couple of years we were doing two, three, or four, and sometimes more on students. Now we are also getting information as to what students have already been through the IST process and where they are at. That hdps also because we are not duplicating work. I don't know if it's redly being used to its greatest ability.
8. How is the model being implemented in your classes?
PersonalIy, I take a look at the students and I see where they are at, and see what I need to do to adjust my curriculum and my classroom. I try to institute more differentiation, but that's probably about it, I also have the content support teacher in my classroom (inclusion), so she sees more of the interventions and is in charge of more of the interventions than I would.

9. What impact do you believe has the implementation of the pyramid model for intervention had on your instructional and behavioral management practices?
I think I look at the students differently than I used to. I try to find out more about where they were last year, what their issues were last year. Then I try to adjust for their needs. As I said, the students are changing on an annual basis and I can't do the same old thing anymore, I need to make adjustments. That's really where it came in, was my adjustments to my curriculum and my method of teaching. I think that is where most of it has occurred with myself personally, and not so much with the students, with how I'm doing it now and what I'm accepting from them, and what their needs are.
Ms. Reina Martinez: Thank you so much.

Appendix K
Administrator Interview Transcriptions

Administrator Interview Summary
Questions Administrator Interview Summary Administrative Unique Framework interventions needs influence Influence systematic
Implementation Pyramid
Determination Made
Participated Design
Student interventions
Teachers Process
Building Interventions
Data Collect
Analyzed Used
Specific Structure
Monitored
Variable Performance determinants
Recommendations Committees modifications morphed
Performance Streamline behavior
Identify Identie
Support referral Files Challenges
groups success Synthesized Recommendations working
modifications plan
Pre-assessment Evaluate improvement knowledge
Organic Direct process Principle
Concrete Student characteristics characteristics district
Approach deficiencies Core team Core team
Performance deficiencies literacy Manual
Process Common Common
solutions conversations
Heart enhance enhance Case by case
Performance decisions Academic
decisions behavioral
Knowledge ability Trends ability monitoring
Academic Expertise ~ e s o w c e s
needs resources needs
Support enhanced Scripted Scripted process Refine
Building process process

Administrator Interview Transcriptions Administrator 1
I would like to thank you for volunteering for this interview about the RTI pyramid used in your building. For the purposes of transcription, you will be Principal
Number 1
What determined the implementation of the RtI pyramid used in your building?
Well, it was initially started the year before I got here with the principal prior to myself and we continued to work MY FIRST YEAR with the other middle school principals and our boss, who was the assistant superintendent for curriculum and instruction who was K-7, and we worked from that point to develop our pyramid.
How was the determination made?
The determination was made based on initially some of the programs that we have in the three schools that uh the group felt were programs that were working, and the group felt were working and where they fit into the pyramid but as time has moved on we have tried to evolve our pyramid to be more student specific to have the programs created or put in place to be more student specific rather than the other way around.
Who participated in the design of the pyramid for your building?
Well, district wide as I said, it was the three middle schools principals, and the assistant superintendent, building level as we got a little bit more detail and building specific, it was myself and as well as the SIPT team, as well as input from the assistant principal.
What is the process for a student needing intervention?
Well, Initially we will look at information that we've compiled on the student based on their previous year's the previous year on their academic year; school grades, teacher recommendations, test score data and any other formal assessments we have given throughout the year. We take a look at that and identify students in need for placement purposes we put them into the appropriate intervention that we may have it is also something that we look at throughout the year, as we find our students come into our school or student with deficiencies up here we then adjust their placement into the appropriate program throughout the year.

5. How are your teachers involved with the RtI process?
The teachers are involved by providing interventions at the Tier 1 level basically for everyone in their classroom and by differentiating their instruction for all students also involved in providing any other intervention programs such as the Read 180 and the AIS programs that we offer and also involved in the process of identifying students through classroom assessments and formative assessments they give in their classroom assessments and formative assessments and when they notice deficiencies and recommendations that they provide to us.
6. Describe the process used in your building to recommend interventions for your students.
Well again, we talked about initially, before the year starts there are things we look at but as the year goes on we identify students whether it is to the IST process where teachers will identifj students to their IST team or pre-IST team we also have team meetings where we discuss students who have academic or behavioral concerns for and how we can meet the needs of those students through proper placement or program.
7. What type of data do you collect on your students?
We do we create data base, for all of our students that includes test score data, intervention programs that they are in formative assessment data as well we also take a look at academic performance, teacher recommendation data as well as for our program we do progress monitoring in our Read 180 we do and SEU test beginning middle and end of the program pre and post more informal observations for our test after school and AIS programs before d we take a look at academic performance both pre and post.
8. How are the data analyzed?
We take a look at the data to make a determination of whether or not there in an appropriate intervention for this student they are progressing or are they not should we continue with this intervention or do they need a different intervention or have they tested out and have they caught up to grade level and its time to move on out a specific intervention.
9. How did you decide on what interventions to include in your building's structure?
Well initially, you know it was based on what we had in place, we have evolved, we have taken a look at the data to look at the data to determine what programs seem to work for our students and which ones don't. and the ones

that do work we continue to work with or grow or try to improve and the ones that don't we look to replace or get rid of.
10. How are students monitored in your building?
Again, we progress monitor those students throughout the various programs during the year, pre and post to determine if they are properly placed.

Interview Survey for Administrators Administrator 2
I would like to thank you for volunteering for this interview about the RTI pyramid used in your building. For the purposes of transcription, you will be Principal
Number 2.
What determined the implementation of the RtI pyramid used in your building?
We needed a systematic way to address students that were not working up to the ability of the cumculum and that were not having success in the classroom and using the RTI system we were able to systematically look at ways to, ah, address some of the students' weaknesses.
How was the determination made?
District-wide, there was a decision that we needed to have a system for Response to Intervention in each of the buildings.
Who participated in the design of the pyramid for your building?
The district central office, the principals in the district, in general, but for Haverstraw Middle School, it was the administration and also we had a core team of people, which included psychologists, guidance counselors, regular ed teachers, special ed teachers and an administrator that received the RtI training and put together the RtI Pyramid. And it's the RtI team that continues to this day and we just finished our official RtI manual last week.
What is the process for a student needing intervention?
We, again, put together a manual of that process so that it is something common for us in the building and I will be happy to give you a copy of that. It's very involved, but, basically, the very, very, very limited answer is that we have conversations with the child, the parent, the team, the larger team in the process. Then we look to go to the actual IST team to actually be inserted in that process. Then we move to the Tier 1, Tier 2 and Tier 3 interventions.
How are your teachers involved with the RtI process?
They have gone through training to be members of the RtI or IST team that actually looks at the case by case situation as brought forth. They've been trained to be members and have also been trained to deliver some of those interventions. The interventions are delivered by faculty members in the building, so they were trained on "both sides of the table," so to speak.

6. Describe the process used in your building to recommend interventions for your students.
Again, we have a whole manual. We looked at two types of interventions. We looked at academic and we looked at behavioral interventions. And, we have specific pathways that the staff follows for both of those instances. And, I'll be happy again to share the manual with you, it's quite involved and it's canstantly, constantly monitored and documented.
7. What type of data do you collect on your students?
Prior to intervention we have a universal reading screening for the academic portion of Rtl. Then, after we look at that screening . . . then we place them, I mean "we", the teams, the teachers, look at where they go in terms of the Tiers. We look at State assessments, we look at DRA 2's or standardized tests, we also look at writing folders from the elementary schools that are brought to us. We look at formal assessment data, parent information. We look at RSI's, which is Reading Style Inventory. We look at their classical files, which basically has a list of students' . . . their aspirations, their learning styles, or things that they feel they're good at, so it's kind of a student inventory that they take and we take all that information and bring it all to the table in terms of where to place students. Also, for the SPI's, with some interventions that they've taken in their . . . before they've come to us, or while they're here, SRI's or some of the interventions . . . lexi, lexia, lexiles that we use . . . so we look at all that. We look at multiple measures to try to see where to place the student. I'm sure that I'm leaving some out too.
8. How is the data analyzed?
Every month we have a, we give a formative assessment. We meet as a grade level stnd then the grade teachers in the team meet with me and we go over that data. We look for trends and then the classroom teachers and monitors act on those trends. We look at all those measures that I previously mentioned. We come together as a group in the spring and start looking at data to start placing for the next year. So, we look at all the monitoring that happened during the year and then . . . we call it the War Room, we've got special ed teachers there, we have reading specialists, we have speech, we have ESL, we have classroom teachers, administrators . . . so we kind of go through each kid and look at that information, That helps us with staffing, etc. for what we need for next school year.
9. How did you decide on what interventions to include in your building's structure?
We looked at need, we looked at resources, we looked at availability in terms of what the District was supporting. So we have to use all of those structures to try to figure out what we can use. For example, one of the reading interventions is also a

multi-sensory reading intervention and is District-wide so we have to use what is provided to us.
10. How are students monitored in your building?
We have follow-up meetings. If a student is brought to an IST and those could be from, depending on what the research says, they could be four weeks, it could be six weeks, but it's typically it's six weeks that we monitor. We bring back data, the team evaluates it, then we can choose to . . . or the data will dictate whether or not we need to continue the intervention or if we need to try another Tier or another strategy. Also, it's being monitored regularly by the classroom teacher cause then that has to be brought back to the team. And the teams are made up of virtually every staff person. We're looking to maybe refine that to a core team, but we do have people from different grade levels, if your issue is an ESL issue maybe, we will have an ESL person there. If it's a behavior issue, we wiIl have a psychologist or a social worker there. So, depending on what the situation is, those are the people that will be sitting around, the core group, of IST members. And there's always an administrator at every IST meeting.

Interview with Principal Number 3 Administrator 3
Thank yon again far your participation in thb interview. For the purposes of this transcription, you are going to be Principal 3.
1 What determined the implementation of the RTI Pyramid used in your building?
We work within the framework of special education services that are provided in the district that have an influence on what any particular school does in a school building. Schoal buildings, principals, and teams of people in school don't work in isolation. So that is one aspect you take into consideration. A second aspect would be the research and the knowledge about that interventions and what would be appropriate interventions. The initial ???? use of "student distress." Thirdly I will say what we have found that we could offer and could work in our building. What works within our school, what has the research said about RTI, and what is the district doing in terms of special education services.
2. How is the determination made?
It's made on the needs of the students, and what is right at the age group and educational development that we work with, It's not the same to work with fourth graders as it is to work with eighth and ninth graders. When we begin to discuss implementation of an RTI Model and the evolution of the next steps for a specific students or groups of students we have to take into consideration who we work with, which is eighth and ninth graders. That age group is comprised of students with very specific and very concrete characteristics that have to deal with early adolescence, with the development of those students, and with the intellectual and emotional makeup of those kids. I would say that another aspect that we took into consideration is who we are, what we know how to do. You might want to do X, Y, and Z in your school building, but if you don't have the resources to do X, Y, and Z, you may have to do P and Q.
3. Who participated in the design of the pyramid for your building?
The compilation of the pyramid itself became an administrative task. The designs of the different interventions are of different levels of approach to students deficiencies. I would say that was the process that evolved over the course of time. It was not something that we came up with in one semester. Things that were already in place slowly became part of the pyramid of interventions and perhaps another couple of things. When I came the train was already in motion, so I kind of jumped on a train that was already moving- so to speak. I could not talk to you about the pre and the post.

4. What is the process for a student needing intervention?
It depends if we are talking about literacy interventions; for example, the process will be assessing what is happening with the student in terms of performance, ask for report cards, progress reports, teacher evaluations of aspects of a student's performance, not necessarily numerical aspects. I would say that the process can be driven by a teacher; it can be driven by a counselor. What we really like is when teachers drive the process. We feel that it is much closer to the trenches when a teacher takes ownership of that process it is more valuable. It is not an imposition on the teacher, teachers don't like to receive impositions, and that has to be taken into consideration. Therefore, we actually recommend that teachers are the ones who propose students to an IST process. ???? the IST, interventions can be put in place for a child. It can also be with regards to literacy issues, and reading and writing issues, it could be a request for an evaluation in terms of READ 180. The English teacher could be the one making contact. All of these conversations have dynamic. They are not in lock???. They are dynamic. The teacher expresses concerns, talks to counselor, talks to assistant principal, talks to other colleagues, speaks to a reading teacher, ??I????? Who may agree to do a read 180 evaluation or even the possibility of the child needing lower level of services in terms of reading ability than READ 180. Perhaps Systems 44 which we are beginning to implement in the building. So the process at this point is driven by teachers are the ones who know how the students are doing, and are the ones who bring the students forward to ISTs, to discussion with a counselor, and assistant principal, and from there sometimes after an IST, after interventions have been in place for a number of months, and perhaps more severe decisions may be taken and it may be determined in requests for evaluations. However, those are later stages. We have nothing in the days when the immediate response was 'let's evaluate the child to special education. '
5. I know part of this you have already said, but I have to ask you again, "How are your teachers involved in the RTI process?"
We want them to be involved in proportion to students for discussion, and in being part of the solution, because some of the recommendations have been in the classroom. Naturally so- that is where the railroad meets the road. That's where instruction takes place. So we promote and encourage them to be dynamic in terms of the conversations they have with the other staff members and being part of the decision making process to provide for higher level of layers and services for a child. Whether it is in the form of in class school 'modifications.' Or perhaps a child that was not identified in the past for a 504 maybe in the process of a student study- IST- perhaps a 504 can be put in pIace if deemed necessary. It often that case that when students begin to face higher levels of academic demands with their entry into eighth and ninth grade they may experience stressors and distress that they were not experiencing in the past.

6. Describe the process used in your building to recommend interventions for your students.
The IST process is at the heart of it. Without doing ISTs, counselors, assistant principals for guidance, they dynamically discuss cases with teachers in order to discuss potential interventions. I would say there is not one venue of adding additional interventions or non-special education services for students. With regards to more specific details about that part of the process I would recommend that you speak to administrator Y, and you ask her perhaps one or two of those questions. You don't necessarily have to do the whole interview, but I recommend you asking her some of the questions to support or enhance the content of this interview.
7. What types of data do you coIlect on your students?
We constantly look at data. Prior to, during, and after what exactly, what are you referring to?
We use everything that we can put our hands on. From student files, with all of the numerical points regarding? IST? performance in the previous grades, current years performance, teacher reports, data collections forms that request teachers to provide information on the perfonnance of the child. We try and make decisions based on data if we can. However, I feel the more we work with data, the more you have to take into consideration that not everything is about data. Data works very well when you are looking at groups of students because you couldn't evaluate a class of 600 kids based on what you think of them. When you are evaluating the performance of one particular child, there are many different aspects that have to do with what happens between that child and the academic content, between that child and the text, between that child and their peers in their classroom, and between that child and their teachers- with how the child interacts with the outside world. All of those dynamics between the child and everything else is part of the discussion. It's not just data. Those would be considered data- only its self data.
8 .How are your data analyzed and used?
Well, I am going to be honest with you, and it's something that I should do, and see through one or two cases every year. I have not sat through an IST process from beginning to end. I do know what they set out to accomplish, but I think it will help me if I actually walk through the process. So how do they analyze the data? I know that when they meet they discuss every aspect of the child- From the numerical performance to the more self aspects of it. I don't exactly know how to answer 'how.' They collect as much data as they can and they to the best of their skills, knowledge, and ability they evaluate everything.

9. How did you decide on what specific interventions to include in your building structure?
Age group, academic needs of the students, expertise within the teaching body, prior successes of those interventions in other places, and prior experiences with those interventions by ourselves, our own experiences that we have heard or leaned through our prior interventions. I would say that those are some things that come to mind right away.
10. How are the students monitored in your building?
Once a student becomes part of an IST process, the student becomes part of a case study, and we do have a scripted IST process that is determined within the guidance office. Students progress from the referral point to similar meeting points during the school year, all through the end of the school year. Those students who are part of an IST process are monitored carefully, but all other students are monitored carefully, as well. Counselors and I have access to relatively clean tools that allow them to look at all of their students in their caseload which has the elements that will be very heIpfwl in allowing them to follow up on our students. We take into consideration behavioral data points, suspensions, time outs, detentions, attendance, of course grades, and number of classes failed. We use that very basic data to monitor our students and try not to loose anybody through the cracks. We try to do it religiously every quarter. We make an emphasis on the monitoring of the review of our students, and at the interim points counselors are expected to monitor those kids who at one point were determined to be relatively at risk. That could be not necessarily kids who have failed classes, but those other that have passed everything and could either way. That could happen to a child that has passed all classes, but their GPA is not very high.
Thank you.

Interview Suwey for Administrators Administrator 4
I would like to thank you for vohnteeriag for this interview about the RTI pyramid used in your building. For the purposes of transcription, you will be Principal
Number 4.
What determined the implementation of the RtI pyramid used in your building? There were several determinations we first looked at our students to see what their needs were which are unique to each building depending on where they come from. There's a lot of variables there, so that was our primary determinant . . . Was the population we were serving. We also looked at the capacity in our building, what our teachers, related staff and support staff knew about, were conversant in, in terms of interventions, and where also, we needed to provide some training so that we could provide interventions that we didn't have at the onset outside the pyramids application of the Building.
How was the determination made? It was a committee decision mostly of the administrators but also a group of teachers that has morphed through several committees we are now calling this committee the E Team here in the building. But, originally it was some special ed teachers, some regular ed teachers, the administration of the building and that actually predated my being stationed here as the principal, but that was what was ongoing when I came.
Who participated in the design of the pyramid for your building? Well, as I mentioned, it was administrators, special ed teachers, regular ed teachers, guidance counselors were involve, we had a number of teachers both from special Ed and regular Ed that had been involve in success academies and programs like that. That were in use for students and all those people were involved in one level or other.
What is the process for a student needing intervention? Pretty simple. Actually, we try and streamline this. If a student is having problems in class whether it is academic or behavioral they are sent to an IST team, that team reviews what is going on and provides some possible interventions right there back to the team of teachers. Since we are a middle school we are team based, so those interventions go back to the team. We set a timeline as those goals are smart based, so we have a timeline to see whether they are going to be effective. Then there is an automatic review of those IST interventions at a pre-determined amount of time and that varies depending on the interventions we're using and it depends on the individual student. And then from there we start working up the pyramid after that second meeting if things aren't improving, for whatever reason, again whether it is academic or behavioral. Then we start moving up the pyramid looking at interventions that go either beyond the classroom or at least beyond the general ed application of classroom interventions. How are the teachers involved with the RtI process? Well, every teacher, of course, is involved in IST, depending on students that they send to that, also going the

other way, administration. We identify students based on state assessments that may need interventions and we go to the teams, so every teacher is involved at that level. We would call that Tier 1, obviously. Students who are referred to IST are those teams of teachers and independent teachers are part of that committee, as well as, again, special ed., guidance counselor, in some cases psychologists, etc. So, there's a number of people that are involved at different levels.
6. Describe the process used in your building to recommend interventionsyou're your students. Well, as I said before, it either comes from the team of teachers or it may come from a review of academic success or challenge by administration or guidance counselor, that can happen too, so we try and make it a two way street, try and make it both ways, because we are really focused on the success of each individual student. We have gotten to the point where the staff is pretty facile with that process
What type of data do you collect on your students? Prior, during and after? Well, let me take the most severe or most intense interventions, if you will, we always do, with any intervention that takes a student beyond the regular classroom: we're always going to do a pre-assessment, of some kind if it's academic. We'll always do a post, if they matriculate out of that particular intervention if we feel they're ready. Obviously, we're not going to take them out till we have some kind of data that says the student has made improvements and can either move back to the general large group setting or not. If we're collecting data that's more in the behavioral mode, there's a multitude of ways that we get that behavioral data, anywhere from anecdotal information from monitors and teaching assistants, if they happen to be in the room, to the nurse, potentially, or school psychologist, all stakeholders have some element of reporting to do whenever a kid is touched by them, their role in the building. So, we take that anecdotal data. Also, in the classroom, teachers are asked to provide, in the IST model that T mentioned before, they're asked to provide us a whole wealth of data. And, of course, from our end, administrative end, we look at the data that comes, again, from state assessments, or local formative assessments, that we do building wide and district wide. So, there's a lot of information comes to piay on one student.
8. How are the data analyzed? Basically, in some cases, the IST team that the student has been sent through; obviously the IST has all that data at their disposal and they try to synthesize that into a working plan or a review of that working plan. In some cases that information is reviewed by building administration, myself, my assistant principal. In some cases that information is also synthesized through our guidance and counseling center and people like the school psychologist and the nurse, perhaps, depending on the issue.
9. How did you decide on what interventions to include in your building's structure? Well, I would say, first of all, that that is a very organic process. It changes every year, sometimes during the year, what we include in that pyramid

changes. What we try to do is look at, again, our students that we were serving . . . what the overall needs were, what the most intensive needs were for Tier 3, and if they fell into a group, which they sort of did. You know you're looking at literacy and nurneracy, at least at some level and then in Tier 2, the same thing. But then their behavioral issues create a real fluid response to intervention, I think, which is good, because not every kid is the same. So, what we bring to the table may be different, and the pyramid could be very broad or it could be very narrow, depending on the student.
10. How are students monitored in your building? Through the IST process, through the teachers that may be providing a direct service, intervention is a small group setting or a one to one setting, in some cases. They are certainly reviewed by building administration on a regular basis. Anyone who has reached Tier 3, I'm looking at personally, very closely on a regular basis. My A/P or assistant principal, the same thing. So, again, depending on the intervention, who is looking after that, that will give them point. It may be a teacher in the intervention, or it may be a report out of that intervention to building administration or to a counselor, or to, andlor to, someone like a school psychologist. We all, here in this building, we are really standing on the principle that we want the best eyes on each kid, so thase best eyes may not be mine, they may be someone else in the building, and I rely on their expertise. Highly reliable organizations rely on expertise, and we try to do that here.

Copyright © 2022 FDOKUMEN