European Journal of Scientific Research (ISSN: 1450-216X) Vol. 9, No ...
76
© European Journal of Scientific Research, Vol 9, No 2, 2005 European Journal of Scientific Research (ISSN: 1450-216X) Vol. 9, No: 2 August, 2005
-
Upload
khangminh22 -
Category
Documents
-
view
0 -
download
0
Transcript of European Journal of Scientific Research (ISSN: 1450-216X) Vol. 9, No ...

© European Journal of Scientific Research, Vol 9, No 2, 2005
European Journal of Scientific Research
(ISSN: 1450-216X)
Vol. 9, No: 2 August, 2005

© European Journal of Scientific Research, Vol 9, No 2, 2005
© AMS Publishing, Inc. 2005 Editor-In-Chief & Managing Editor: Adrian Marcus Steinberg, PhD Publisher: Lulu Press, Inc. Morrisville, USA

© European Journal of Scientific Research, Vol 9, No 2, 2005
European Journal of Scientific Research
European Journal of Scientific Research is an international official journal of the AMS Publishing, Inc. (Austria) publishing high quality research papers, reviews, and short communications in the fields of biology, chemistry, physics, environmental sciences, business and economics, finance, mathematics and statistics, geology, engineering, computer science, social sciences, natural and technological sciences, linguistics, medicine, architecture, industrial, and all other applied and theoretical sciences. The journal welcomes submission of articles through [email protected].
Editorial Board
Prof. Adrian M. Steinberg Wissenschaftlicher Forscher, Austria
Dr. Parag Garhyan Auburn University, USA
Prof. Morteza Shahbazi Edinburgh University, UK
Prof. Raj Rajagopalan National University of Singapore
Prof. Sang-Eon Park Inha University, Korea
Dr. Said Elnashaie Auburn University, USA
Dr. Subrata Chowdhury University of Rhode Island, USA
Dr. Raj Rajagopalan National University of Singapore, Singapore
Prof. Ghasem-Ali Omrani Tehran University of Medical Sciences, Iran
Prof Ajay K. Ray National University of Singapore, Singapore
Dr. Mutwakil Nafi China University of Geosciences, China
Prof. Abdel Rahman Al Tawaha McGill University, Canada
Mr. Mete Feridun Cyprus International University, Cyprus
Prof. Bansi Sawhney University of Baltimore, USA

© European Journal of Scientific Research, Vol 9, No 2, 2005
EUROPEAN JOURNALS INC.® realizes the meaning of fast publication to researchers, particularly to
those working in competitive & dynamic fields. Hence, we offer an exceptionally fast publication
schedule including prompt peer-review by the experts in the field and immediate publication upon
acceptance. EUROPEAN JOURNALS INC.® pledges to review the submitted articles within three
days of receipt and promptly include them in the forthcoming issue should they pass the evaluation
process. Further information is available at: www.EuroJournals.com.

© European Journal of Scientific Research, Vol 9, No 2, 2005
European Journal of Scientific Research Vol. 9, No: 2
CONTENTS
NECK CIRCUMFERENCE IN IDENTIFYING OVERWEIGHT NIGERIANS;
EVALUATING AND VALIDATING A SIMPLE TOOL SANUSI RA, OSIGBESAN OT, YUSUF OB, OGINNI AB
COMPLEX NETWORK TOPOLOGY LEARNING USING ANN
A REINFORCEMENT LEARNING APPROACH SADIA RASHEED, SHIREEN TAHIRA, TAUSEEF-UR-REHMAN, SIKANDAR HAYAT KHIYAL
GROWTH PERFORMANCE AND NUTRIENT UTILIZATION OF AFRICAN CATFISH
(CLARIAS GARIEPINUS) FINGERLINGS FED DIETS WITH GRADED INCLUSION LEVELS OF DUCKWEED (LEMNA SP)
OLUKUNLE OYIN AND AGBOOLA, G.O.
RURAL WATER MARKETS IN PAKISTAN: PREVALENCE, PROBLEMS AND PROSPECTS
ZAKIR HUSSAIN, HAMMAD BADAR, MOHAMMAD FARHAN.B HUSSAIN
CLUSTERING USING A MODIFIED KRUSKAL ALGORITHM ISSAM A.R. MOGHRABI
© European Journal of Scientific Research, Vol 9, No 2, 2005
NECK CIRCUMFERENCE IN IDENTIFYING OVERWEIGHT NIGERIANS; EVALUATING AND VALIDATING A SIMPLE TOOL
*SANUSI RA, *OSIGBESAN OT, **YUSUF OB, *OGINNI AB
*Department of Human Nutrition, **Epidemiology, Medical Statistics Environmental Health, College of Medicine, University of Ibadan, Ibadan,
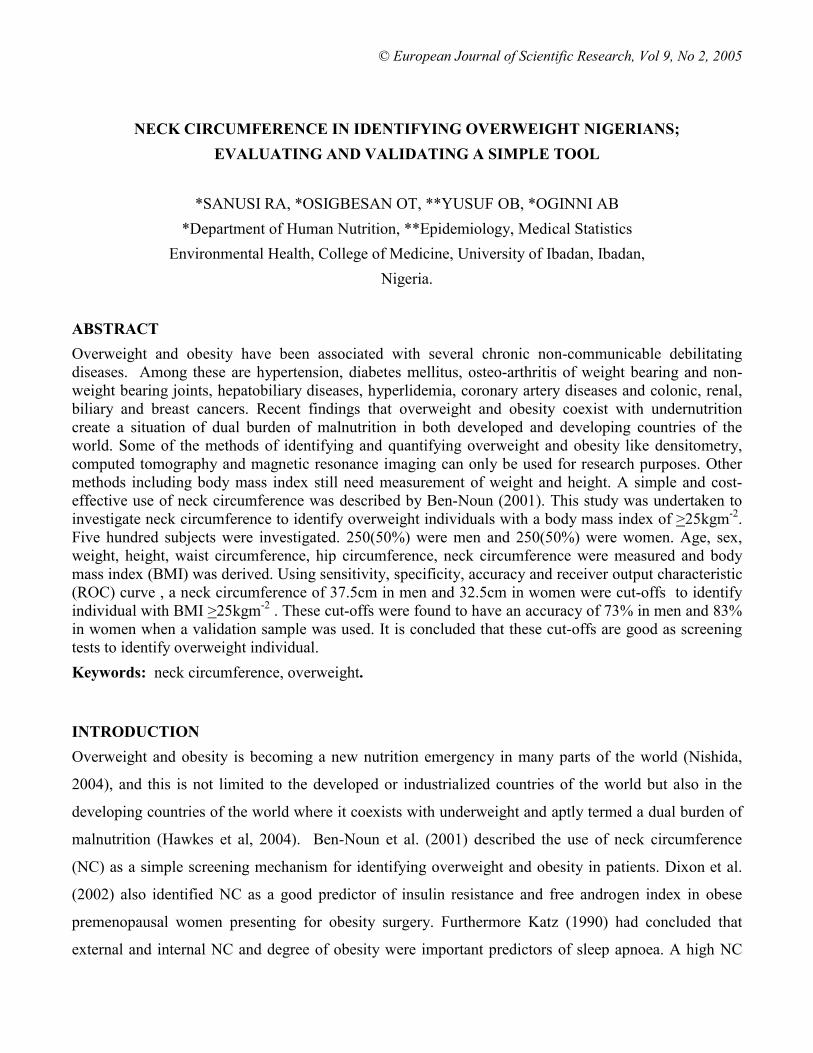
Nigeria. ABSTRACT Overweight and obesity have been associated with several chronic non-communicable debilitating diseases. Among these are hypertension, diabetes mellitus, osteo-arthritis of weight bearing and non-weight bearing joints, hepatobiliary diseases, hyperlidemia, coronary artery diseases and colonic, renal, biliary and breast cancers. Recent findings that overweight and obesity coexist with undernutrition create a situation of dual burden of malnutrition in both developed and developing countries of the world. Some of the methods of identifying and quantifying overweight and obesity like densitometry, computed tomography and magnetic resonance imaging can only be used for research purposes. Other methods including body mass index still need measurement of weight and height. A simple and cost-effective use of neck circumference was described by Ben-Noun (2001). This study was undertaken to investigate neck circumference to identify overweight individuals with a body mass index of >25kgm-2. Five hundred subjects were investigated. 250(50%) were men and 250(50%) were women. Age, sex, weight, height, waist circumference, hip circumference, neck circumference were measured and body mass index (BMI) was derived. Using sensitivity, specificity, accuracy and receiver output characteristic (ROC) curve , a neck circumference of 37.5cm in men and 32.5cm in women were cut-offs to identify individual with BMI >25kgm-2 . These cut-offs were found to have an accuracy of 73% in men and 83% in women when a validation sample was used. It is concluded that these cut-offs are good as screening tests to identify overweight individual. Keywords: neck circumference, overweight.
INTRODUCTION Overweight and obesity is becoming a new nutrition emergency in many parts of the world (Nishida,
2004), and this is not limited to the developed or industrialized countries of the world but also in the
developing countries of the world where it coexists with underweight and aptly termed a dual burden of
malnutrition (Hawkes et al, 2004). Ben-Noun et al. (2001) described the use of neck circumference
(NC) as a simple screening mechanism for identifying overweight and obesity in patients. Dixon et al.
(2002) also identified NC as a good predictor of insulin resistance and free androgen index in obese
premenopausal women presenting for obesity surgery. Furthermore Katz (1990) had concluded that
external and internal NC and degree of obesity were important predictors of sleep apnoea. A high NC

© European Journal of Scientific Research, Vol 9, No 2, 2005
was also recognized as positively correlated to factors of metabolic syndrome and risk of cardio-vascular
disease (Ben-Noun, 2003). More overweight than underweight exist among adults in Latin America,
North Africa, Middle East and South East Asia (UN SCN, 2002). It has been adequately demonstrated
that morbidity and mortality increase with increasing Body Mass Index (BMI) and degree of obesity
(Adams-Campbell et al. 1990, Sjostrom et al. 1993, Ho et al. 2001, Bray 2004, Zhu et al. 2004). This
study was undertaken to evaluate the use of NC to identify overweight in Nigeria since currently there is
no national prevalence figure of overweight and obesity in Nigeria. Although Mabadeje (2002) had
reported a prevalence of 4.2% obesity in his in his study, Owa and Adejuyigbe (1997), Ansa et al.
(2001), Adeyemo et al. (2003), had investigated body mass index (BMI), obesity in children,
adolescents and Nigerian families. The objective of this study was to measure the weight, height,
waist/abdominal circumference, hip circumference and neck circumference of Nigerians and determine
the neck circumference, that is equivalent to a BMI of >25 and determine NC cut-off level, for
overweight.
METHODOLOGY This study was cross-sectional and descriptive. It was conducted in the city of Ibadan, Nigeria, between
March and October 2004. The sampling technique was purposive. Participants are Nigerians aged
between 20 and 70years recruited through informal interview from the university community, from
secondary schools, also artisans, traders and civil servants. Data collected included age, sex, occupation,
tribe, residential area, and weight, height, neck, waist and hip circumferences.
These measurements were of participants who were voluntary participants, who gave informed consents.
The measurements were done using standard techniques. A minimum sample size of 73 was derived
using statistical equation.
Minimum sample size (n) = (z/d)2 p.q
p = prevalence of overweight ( an assumption of 5% was made).
q = (1 – p) proportion without obesity or overweight (taken as 95%).
z = a constant (taken as 1.96).
d = degree of error that is tolerated (taken as 5%).

© European Journal of Scientific Research, Vol 9, No 2, 2005
However, 250 males and 250 females were selected for this study. Another 108 participants were
recruited from the same locality to validate the results obtained.
Anthropometric measurements.
Weight was measured with minimum dressing, using a bathroom scale (Hansen model 89, Ireland),
measuring from 0-120kg, at 1kg interval..
Height was measured with participant standing erect, barefoot on a vertical stadiometer constructed for
this purpose.
Waist and hip and neck circumferences were measured using a non-stretch steel tapes “GRIPP”, ISO
9001, ISO 14001 EEC. The waist was measured at the level of the umbilicus, the hip was measured over
the greater trochanters across the buttocks, and the neck was measured midway in the neck. From these
measurements body mass index (weight/height2) (BMI) was derived. A BMI of >25 or >30 was taken as
overweight and obese respectively.
Validation
A fresh data of weight, height, age, and neck circumference were collected from a separate 108 subjects
to serve for validation of the test sample data. These included 77females and 41 males.
Statistical Data Analysis.
Data were analyzed using the Statistical Package for the Social Sciences (SPSS) Version 12.
Descriptives, correlations, sensitivity and specificity, accuracy of scale were also generated. The ROC
analysis was used.
RESULTS In the test sample and sex combined, the mean age was 39.16(+11) years, mean weight 77.7 (+13.5) kg,
mean length 1.66 (0.08) m, mean BMI was 28.4 (+5.5) kg/m2. The mean neck circumference was 36.5
(+3.3) cm, abdominal circumference 92.8 (+12.9) cm and hip circumference was 104.4(+11.7) cm.
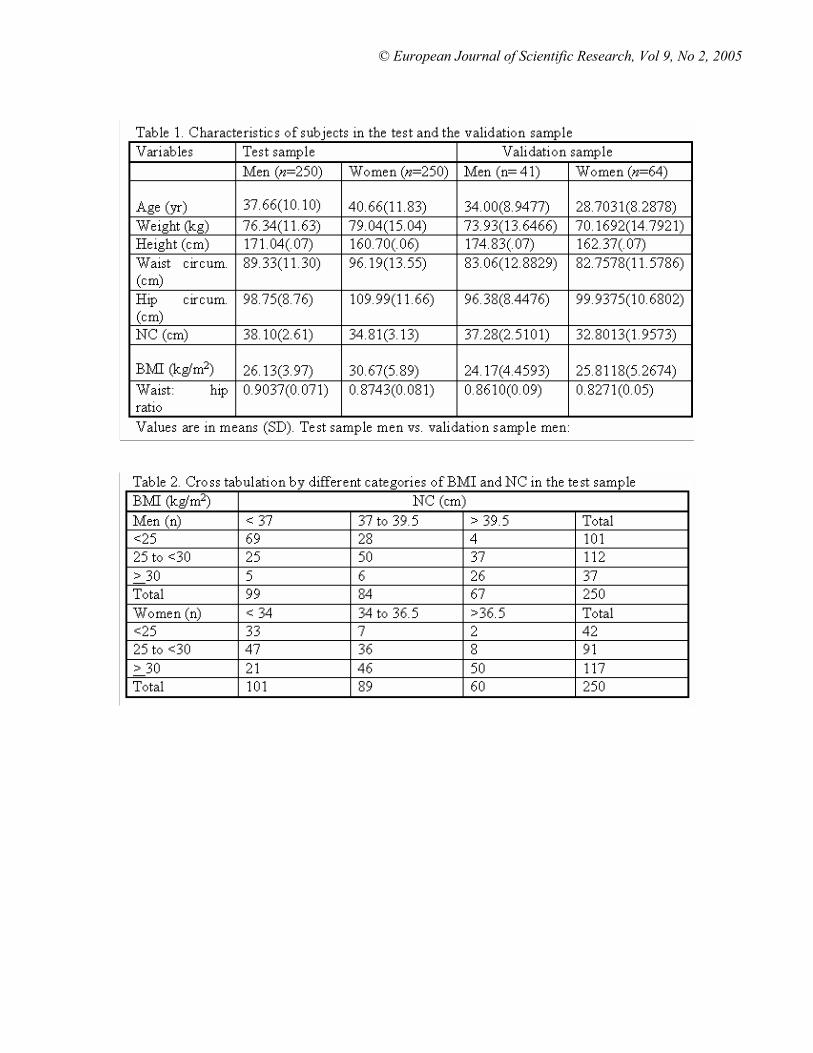
Table 1 shows the characteristics of the men and women in the test and validation samples. The
differences between the test and validation samples and the men and women are significant at p∠0.05.

© European Journal of Scientific Research, Vol 9, No 2, 2005
Table 2, shows the cross-tabulation between the neck circumferences and the body mass index
categories among the men and women in the test sample.
The relationship between neck circumference and other variables as measured by Pearson’s correlation
coefficient showed NC to be positively correlated with the exception of age in women in the test sample
and age in men in the validation (Table 3). This relationship in the validation sample is shown in Table
4. In both test and validation samples the relationship between NC and weight, waist circumference, hip
circumference, body mass index and waist hip ratio were positive and statistically significant.
The NC cut-off for determining subjects with BMI ≥25 in both men and women in the test sample is
shown in Table 5 while similar information among the validation group is shown in Table 6. The
smallest cut-off is the minimum observed test value minus1 while the largest cut-off is the maximum
observed test value plus1. The cut off points for identifying overweight in this test sample for men was
between 33.75cm and 36.75cm and for women, between 31.75cm and 37.75cm. A categorical value of
37.5cm for men and 32.5cm for women is chosen. With this value the sensitivity of the scale in men is
84.62%, and 85.0% in women. The specificity in men is 67.86% and 81.08% in women. The accuracy in
men is 73.17% and 83.12% in women.
DISCUSSION The association between NC, age, weight, waist and hip circumferences, waist hip ratio (WHR) is
demonstrated confirming the relationship of neck circumference with other measurements of obesity.
The simplicity of measuring NC is in itself a hallmark of an excellent instrument. Added value is the
safety and being inexpensive. Although the most popular measurement of obesity and overweight is the
BMI, as pointed out by Ben-Noun et al, it may not be practical in all situations. Previous classification
using BMI had described a BMI of 25 to 29.9 as obesity grade 1 or overweight, indeed it is the first step
in the wrong direction as regards obesity. And since the documented prevalence of obesity is still about
4.6% in Nigeria (Mabadeje 2002), the study was limited to identifying overweight. While BMI is itself a
measure of obesity, it does not measure distribution of fat, which is better identified with WHR. Truncal
or intra-abdominal obesity is associated with higher risk of cardiovascular disease. The WHR in this
study sample showed 105 (42%) of men with a whr of 0.9 to 1.0 while 78(31.6%) of women are in this
category. One hundred and twenty-seven men (51%) and 159 women (64.4%) had a whr of less than
0.9. About 7% of men and 4% of women had a whr greater than 1.0.

© European Journal of Scientific Research, Vol 9, No 2, 2005
A neck circumference of >37.5cm in men and >32.5 identified participants whose BMI >25kgm-2
amongst the external validation sample with a sensitivity of 85% for men and 85% for women. The
specificity at these NC was about 68% for men and 81% for women. The specificity of 96% was
recorded for a NC of 39cm for men, and a specificity of 97% for a NC of 35cm for women. The highest
accuracy for this scale is 37.5cm in men and 32.5cm in women.
The differences in the results of Ben-Noun et al.(2001) and this study cannot be explained solely on the
subjects of the study being different, perhaps some subtle differences in methodology and instruments.
Notwithstanding, the NC of <37.5cm in men and <32.5 cm in women can be considered to be consistent
with normal weight (p<0.05), while those higher should be evaluated with instrument more specific to
quantify overweight and obesity. The lack of information on the national prevalence of overweight and
obesity is a gap in our knowledge, which is necessary not only for policy but for planning intervention
strategies. Hitherto because Nigeria is still food insecure we have the believe that overweight and
obesity are no problems here, this might be mistaken in view of the demonstrated coexistence of both
underweight and overweight/obesity in the same community or even households (Hawkes et al 2004). A
need to undertake a national survey for underweight, overweight and obesity, using body mass index
among the adult population in Nigeria is hereby established. The principal application of this is then the
size of men’s shirt being collar size; so it might be a ready indicator for overweight. Similarly in recent
time, a piece of decorative item in women is a neck-band called “Choker” which fits snugly in the neck
of women. The length of this, can in view of the findings here, be used as an indicator of presence or
absence of overweight or obesity. This becomes a self-diagnostic tool, or do it yourself method against
an emerging epidemic of overweight and obesity.
© European Journal of Scientific Research, Vol 9, No 2, 2005

© European Journal of Scientific Research, Vol 9, No 2, 2005

© European Journal of Scientific Research, Vol 9, No 2, 2005

© European Journal of Scientific Research, Vol 9, No 2, 2005

© European Journal of Scientific Research, Vol 9, No 2, 2005

© European Journal of Scientific Research, Vol 9, No 2, 2005
REFERENCES Adams-Campbell L.L., Nwankwo M, Ukoli F, Omene J, Haile G.T., Kuller L.H. (1990). Body fat
distribution patterns and blood pressure in black and white women. Journal of Medical Association. 82(2):573-6.
Adeyemo Adebowale, Amy Luke, Richard Cooper, Xiaodong Wu, Bamidele Tayo, Xiaofeng Zhu, Charles Rotimi, Nourdine Bouzekri and Ryk Ward (2003). A Genome-Wide Scan for Body Mass Index among Nigerian families. Obesity Research 11:266-273.
Ansa V.O., Odigwe C.O., Anah M.U. (2001). Profile of body mass index and obesity in Nigerian children and adolescents. Nigerian Journal of Medicine 10(2):78-80.Apr-June.
Ben-Noun L and Laor A. (2003). Relationship of neck circumference to cardiovascular risk factors. Obes. Res.11 (2):226-231.
Ben-Noun L, Solar E and Laor A. (2001). Neck circumference as a simple screening measure for identifying overweight and obese patients. Obesity Research 9:470-477.
Bray G.A. (2004). Medical consequences of obesity. J. Clin. Endocrinol. Metab. Jun. 89(6):2583-2589. Dixon J.B., O’Brien P.E. (2002). Neck circumference: a good predictor of raised insulin and free
androgen index in obese premenopausal women; changes with weight loss. Clin. Endocrinol. (Oxf.) 57(6):769-78.
Hawskes C, Eckhardt C, Ruel M, Minot N. (2004). Diet quality, Poverty and Food Policy: a new research agenda for obesity prevention in developing countries. SCN. News, UNSYSTEM/SCN No. 29, Late 2004-Early 2005. Pp20-22.
Ho S.C., Chen Y.M., Woo J.L., Leung S.S., Lam T.H., Janus E.D.(2001). Association between simple anthropometric indices and cardiovascular risk factors. Int J. Obes. Relat. Metab. Disord. 25(11):1689-1697.
Katz I, Stradling J, Slutsky A.S., Zamel N, Hofftein V.(1990). Do patients with obstructive sleep apnoea have thick necks? Am. Rev. Respir. Dis. 141(5Pt 1):122831.
Mababeje A.F. (2002). Summary Report. World Hypertension League/National Heart, Lung and Blood Institute. Hypertension/Obesity Project symposium.
Nishida C.(2004). Overweight and Obesity; a new nutrition emergency? SCN News. UNS/SCN No. 29, Late2004 - Early2005. Pp3-4.
Owa J.A., Adejuigbe O. (1997). Fat mass percentage, Body mass index and Mid-upper arm circumference in a healthy population of Nigerian children. Journal of Tropical Paediatrics 43(1):13-19.
Sjostrom C.D., Hakangard A.C., Lissner L., Sjostrom L.(1993). Snoring and Sleep apnoea in men: association with central obesity and hypertension. Int. J. Obes. Relat. Metab. Disord. 1993 Sep. 17(9):533-540.
World Health Organization (1997). Obesity Epidemic puts millions at risk from related diseases. Press Release WHO/46.
Zhu Shankuan, Stanley Heshka, Zimian Wang, Wei Shen, David B. Allison, Robert Ross and Steven B. Heymsfield (2004). Combination of BMI and Waist circumference for identifying cardiovascular risk factor in Whites. Obesity Research 12:633-645.

© European Journal of Scientific Research, Vol 9, No 2, 2005
COMPLEX NETWORK TOPOLOGY LEARNING USING ANN A REINFORCEMENT LEARNING APPROACH
1Sadia Rasheed*, 1Shireen Tahira, 2Tauseef-Ur-Rehman
and 1M. Sikandar Hayat Khiyal 1Department of Computer Science, Faculty of Applied Sciences
International Islamic University, Islamabad Pakistan. 2Department of Telecom Engineering, Faculty of Applied Sciences
International Islamic University, Islamabad Pakistan ABSTRACT Efficient routing of packets in computer networks is a prerequisite for wide deployment of network-enabled devices, especially mobile and distributed computing. Current approaches to this problem have been partially successful. Boyan and Littman presented the Q-routing algorithm, a network routing algorithm based on Q-learning, a method from the emerging field of reinforcement learning. Q-routing learns to route packets in an adaptive manner. Neural networks have been used with some success to perform Q-learning, and would seem to be a possible method to allow Q-routing to scale well beyond its initial table-based implementation. This paper uses Q-routing algorithm. In this framework, the routing information at individual nodes is maintained as Q value estimates of how long it will take to send a packet to any particular destination via each of the node's neighbors. These Q values are updated through exploration as the packets are transmitted. This paper attempts to apply a neural network as a function approximator in an online reinforcement learning task, a field where neural networks have been used with varying degrees of success in the past. A discussion of the factors involved in neural network function approximation in reinforcement learning is provided. The main contribution of this work is the faster adaptation and improved quality of routing policies. The results achieved are satisfactory, some insight is gained into the difficulties of using neural networks as a function approximator in reinforcement learning tasks. Key Words: Reinforcement Learning, Q-Routing, Artificial Neural Network (ANN), Function Approximation, Adhoc Networks, MANET. 1. INTRODUCTION In a communication network information is transferred from one node to another as data packets. The
process of sending a packet from its source node ‘s’ to its destination node ‘d’ is referred to as packet
routing. Normally it takes multiple “hops” to transfer a packet from its source to destination node. On its
way, the packet spends some time waiting in the queues of intermediate nodes while they are busy
processing the packets that came earlier. Thus the delivery time of the packet, defined as the time it
takes for the packet to reach its destination, depends mainly on the total time it has to spend in the
queues of the intermediate nodes.

© European Journal of Scientific Research, Vol 9, No 2, 2005
Normally, there are multiple routes that a packet could take, which means that the choice of the route is
crucial to the delivery time of the packet for any (s,d) pair. If there was a global observer with current
information about the queues of all nodes in the network, it would be possible to make optimal routing
decisions: always send the packet through the route that has the shortest delivery time at the moment. In
the real world, such complete, global information is not available, and the performance of the global
observer is an upper bound on actual performance. Instead, the task of making routing decisions is
shared by all the nodes, each using only local information. Thus, a routing policy is a collection of local
decisions at the individual nodes. When a node ‘x’ receives a packet P(d) destined for node ‘d’, it has to
choose one of its neighboring nodes y such that the packet reaches its destination as quickly as possible.
The simplest such policy is the shortest-path algorithm, which always routes packets through the path
with the minimum number of hops. This policy is not always good because some intermediate nodes,
falling in a popular route, might have large queues. In such cases it would be better to send the packet
through another route that may be longer in terms of hops but results in shorter delivery time. Hence as
the traffic builds up at some popular routes, alternative routes must be chosen to keep the average packet
delivery time low. This is the key motivation of this paper that it learns alternate routes through
exploration as the current routing policy begins to lead to degraded performance.
Learning effective routing policies is a challenging task. In this paper, network makes routing decisions
using Q-routing in which Kohonen’s neural network is used as function approximator. This paper
presents improvements in reinforcement learning. The algorithm presented here, aims to be stable as
possible as under high loads while performing in less extreme situations.
2. BACKGROUND Reinforcement learning Reinforcement learning method is a method where supervised learning cannot easily be used because
there are no sufficient data or external knowledge that can be applied, a reward signal. Maximizing this
reward signal is the goal of reinforcement learning. Reinforcement learning algorithms develop a policy,
usually defined as a mapping of states and subsequent actions to expected reward.
Temporal difference learning is a major part of reinforcement learning theory, and covers a number of
methods such as TD(0), Q-learning and Sarsa.

© European Journal of Scientific Research, Vol 9, No 2, 2005
Q(st,at)←Q(st,at)+α[rt+1+γQ(st+1,at+1)-Q(st,at)] (1)
The equation (1), referred to as the “Q-function” for quite obvious reasons, is the policy update rule used
in Q-learning. The update rule states how the value of the Q-function is updated for each state st, and for
every action at that can be taken from that state. rt+1 is the immediate reward from this action, and
γQ(st+1,at+1) is the discounted future reward from this state. The value γ is the discounting rate.
Q-Routing In Q-routing, the routing decision maker at each node x makes use of a table of values Qx(y; d), where
each value is an estimate, for a neighbor y and destination d, of how long it takes for a packet to be
delivered to node d, if sent via neighbor y, excluding time spent in node x’s queue. When the node has
to make a routing decision it simply chooses the neighbor y for which Qx(y; d) is minimum. Learning
takes place by updating the Q values.
On sending P(d) to y, x immediately gets back y’s estimate for the time remaining in the trip, namely
Qy(z^, d) = min Qy(z, d) (2)
zєN(y)
where N(y) denotes the set of neighbors of node y. if the packet spent qx units of time in x’s queue, then
x can revise its estimate based on this feedback:
∆Qx(y, d)=η(Qy(zˆ, d)+ qx + δ- Qx(y, d)) (3)
Where η is the “learning rate” constant for all Q-values updates and δ is a transmission delay over the
link between nodes x and y (assumed same for all links).
Neural Networks (Kohonen’s Networks) The objective of a Kohonen’s network is to map input vectors (patterns) of arbitrary dimension N onto a
discrete map with 1 or 2 dimensions. Patterns close to one another in the input space should be close to
one another in the map: they should be topologically ordered. A Kohonen’s network is composed of a
grid of output units and N input units. The input pattern is fed to each output unit. The input lines to
each output unit are weighted. These weights are initialized to small random numbers.
The learning process is as roughly as follows:

© European Journal of Scientific Research, Vol 9, No 2, 2005
• initialize the weights for each output unit
• loop until weight changes are negligible
o for each input pattern
present the input pattern
find the winning output unit
find all units in the neighborhood of the winner
update the weight vectors for all those units
o Reduce the size of neighborhoods if required.
The winning output unit is simply the unit with the weight vector that has the smallest Euclidean
distance to the input pattern. The neighborhood of a unit is defined as all units within some distance of
that unit on the map (not in weight space). The weights of every unit in the neighborhood of the winning
unit (including the winning unit itself) are updated using:
wni= wni + phi * rij * (Nn - wni ) (4)
where rij = e (-dist (i, j) 2 ) / (2*theta)
phi = Learning rate parameter
theta = Learning Factor
dist(i, j) = Guassian density function.
This will move each unit in the neighborhood closer to the input pattern. As time progresses the learning rate and the neighborhood size are reduced.
3. RELATED WORK Reinforcement learning is a relatively new and emerging area of machine learning theory. Very limited
work has done in this area of field. Richard S. Sutton and Andrew G. Barto [1] presented the basic
intuitive sense of what reinforcement learning is and how it differs and relates to other fields, e.g.
supervised learning and neural network, genetic algorithms and artificial life, control theory.

© European Journal of Scientific Research, Vol 9, No 2, 2005
The field is still quite young, and there are problems that are still being researched which are proving
difficult to solve. However, the reinforcement learning approach is very promising even in these early
stages, and seems a good fit for the network routing problem as Boyan and Littman [2] showed. This
paper describes the Q-Routing algorithm for packet routing in which a reinforcement learning module is
embedded into each node of switching network.
Neural networks are a technique for pattern recognition and function approximation based originally on
ideas from biology and the study of neurons [3], although the theory behind neural networks is based on
statistical foundations [4]. Neural networks seek to mimic the apparently simple, but extremely
effective, structure of the human brain.
Neural network has been used to some success to perform Q-learning. There has been notable success
with this method using Q-learning and a neural network which approximate the value function. Will
Newton was the one who presented the idea of using Neural Network as function approximator in online
reinforcement learning task [5]. The results achieved were disappointing, but some insight is gained into
the difficulties of using neural networks as a function approximator in reinforcement learning tasks.
Ritesh Gandhi [6] used Kohonen’s Neural Network to solve Traveling salesman problem (TSP).
4. METHODOLOGY
SSQ-Routing Algorithm Q-routing and Kohonen’s network are combined in this algorithm. Kohonen’s network is used as
function approximator. Q-value table is updated using Kohonen’s network updating rule as in equation
(2).
Main steps of the algorithm are:
1. Initial Q-values can be calculated as
rij = e (-dist (i, j) 2 ) / (2*theta)
where
dist(i,j)= exp(-d2/phi) / sqrt(2)
2. Take source node as ‘starting node’.
3. Find the next neighboring node having minimum Q-value.

© European Journal of Scientific Research, Vol 9, No 2, 2005
4. Update the Q-value for that selected node by using the equation derived from equation- (4) as
∆Qx(y, d)= Qx(y, d) + phi * rij * ( Qy(zˆ, d) - Qx(y, d) )
Where
Qy(z^, d) = min Qy(z, d)
zєN(y)
5. Decrease ‘theta’,’ phi’ and recalculate ‘r’ value for the selected node only.
6. Compare selected node with ‘ending node’, if not equal then, go to step 3 else exit.
5. IMPLEMENTATION
Simulation Environment
The simulation environment was built on NS-2, a discrete event simulator targeted at networking
research. NS-2 provides substantial support for simulation of TCP, routing, and multicast protocols over
wired and wireless (local and satellite) networks.
Network Topology used
The network topology used for simulation is 6Χ6 irregular grid shown in figure-1 due to Boyan and
Littman (1994). In this network, there are two possible ways of routing packets between the left cluster
(nodes 1 through 18) and the right cluster (nodes 19 through 36): the route including nodes 12 and 25
(R1) and the route including nodes 18 and 19 (R2). For every pair of source and destination nodes in
different clusters, either of the two routes, R1 or R2 can be chosen. Convergence to effective routing
policies, starting from either random or shortest path policies.

© European Journal of Scientific Research, Vol 9, No 2, 2005
Parameters
The Q tables were initialized with small random Q values, except for the base cases. Learning rate for
forward exploration ηf , value for ‘theta’, and ‘phi’ are summarized in table 1. Performance of the
algorithms was found to be the best with these parameters.
In Table 1 Parameters for the Algorithms are shown. In Q-Routing and SSQ-routing where the learning
rates vale for ‘theta’ and ‘Phi’ are constant.
© European Journal of Scientific Research, Vol 9, No 2, 2005
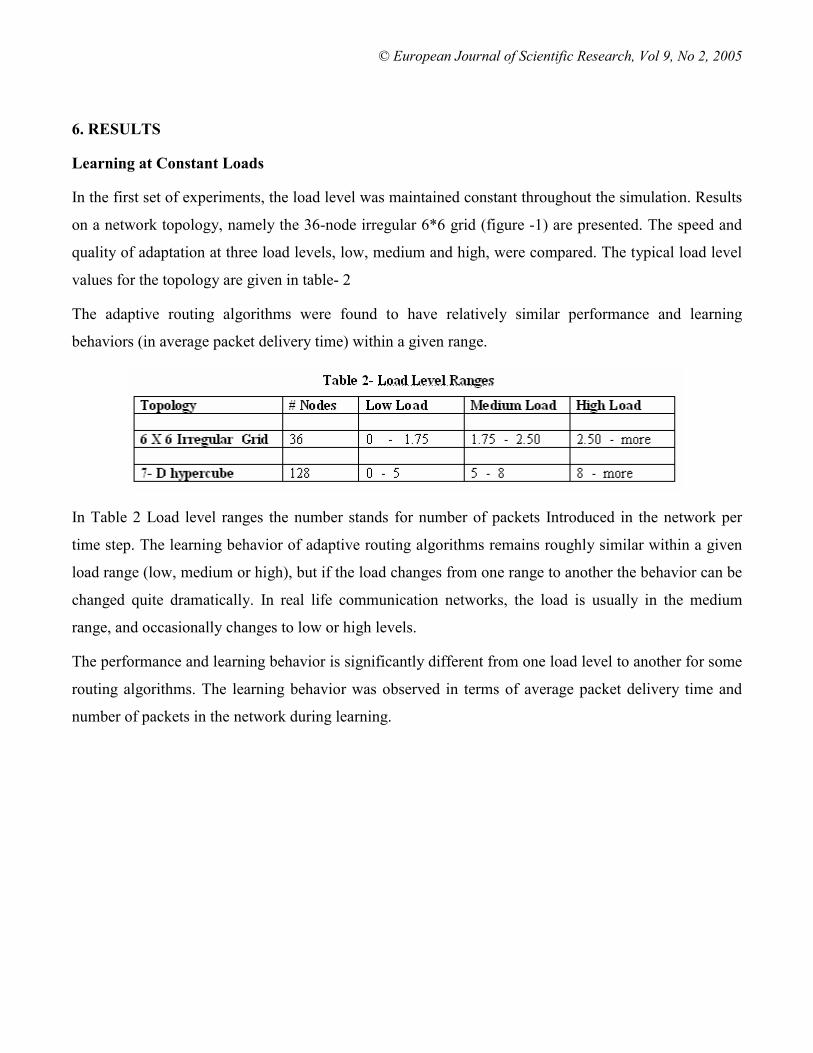
6. RESULTS
Learning at Constant Loads
In the first set of experiments, the load level was maintained constant throughout the simulation. Results
on a network topology, namely the 36-node irregular 6*6 grid (figure -1) are presented. The speed and
quality of adaptation at three load levels, low, medium and high, were compared. The typical load level
values for the topology are given in table- 2
The adaptive routing algorithms were found to have relatively similar performance and learning
behaviors (in average packet delivery time) within a given range.
In Table 2 Load level ranges the number stands for number of packets Introduced in the network per
time step. The learning behavior of adaptive routing algorithms remains roughly similar within a given
load range (low, medium or high), but if the load changes from one range to another the behavior can be
changed quite dramatically. In real life communication networks, the load is usually in the medium
range, and occasionally changes to low or high levels.
The performance and learning behavior is significantly different from one load level to another for some
routing algorithms. The learning behavior was observed in terms of average packet delivery time and
number of packets in the network during learning.

© European Journal of Scientific Research, Vol 9, No 2, 2005
0
5
10
15
20
25
30
35
40
45
50
010
020
040
060
080
010
0012
0014
0016
0018
0020
00
Q-routing
SSQ-Routing
Figure 2: Average packet delivery time at a low load level for the grid topology: Difference between Q-
Routing and SSQ-Routing is statistically significant between 300 to 800 time steps.
0
100
200
300
400
500
600
700
800
0 200 400 600 800 1000 1200 1400 1600 1800 2000
Q-routing
SSQ-Routing
Simulation time step
Aver
age
pack
et d
eliv
ery
time
Simulation time step
Num
ber o
f pac
kets
in n
etw
ork

© European Journal of Scientific Research, Vol 9, No 2, 2005
Figure 3: Number of packets for 7-D hypercube at low load: Difference between SSQ-Routing and Q-
Routing is significant after 150 time step.
At low load the average packet delivery time for both the grid (figure 2) and the hypercube (figure 3)
shows that there is not much gain in the speed of learning from Q-Routing to SSQ-Routing. Reason for
this trend is that at low loads, what matters the most is the amount of exploration and the algorithm that
allows more exploration per packet hop will learn faster. SSQ-Routing learns more than 3 times as fast
as Q-Routing for both topologies.
0
50
100
150
200
250
300
0 500 1000 1500 2000 2500 3000 3500 4000 4500 5000
Q-routing
SSQ-Routing
Figure 4: Average packet delivery time for the grid topology at a medium load level: Difference
between SSQ-Routing and Q-Routing is significant between 300 to 1900 time steps.
At medium load levels, the average packet delivery times (figure 4 for the grid and 5 for the hypercube)
shows that both SSQ-Routing performs better than Q-Routing. This result is significant because it
highlights the contribution of both the quality and quantity of exploration in learning. They contribute in
two different ways to increase the performance of SSQ-Routing.
Simulation time step
Num
ber o
f pac
kets
in n
etw
ork

© European Journal of Scientific Research, Vol 9, No 2, 2005
0
100
200
300
400
500
600
700
800
900
0 500 1000 1500 2000 2500 3000 3500 4000 4500 5000
Q-routing
SSQ-Routing
Figure 5: Average packet delivery time for 7-D hypercube at medium load: Difference between SSQ-
Routing and Q-Routing is significant between 200 to 2750 time steps.
0
50
100
150
200
250
300
0 500 1000 1500 2000 2500 3000 3500 4000 4500 5000
Q-routing
SSQ-Routing
Simulation time step
Num
ber o
f pac
kets
in n
etw
ork
Simulation time step
Num
ber o
f pac
kets
in n
etw
ork

© European Journal of Scientific Research, Vol 9, No 2, 2005
Figure 6: Average packet delivery time for grid topology at high load: Difference between SSQ-
Routing and Q-Routing is significant between after 1000 time steps.
At high load levels the average packet delivery time (figure 6) for the grid topology show that while Q-
Routing converges to a qualitatively poor routing policy, and SSQ-Routing converge to qualitatively
similar policies.
0
200
400
600
800
1000
1200
1400
0 1000 2000 3000 4000 5000 6000 7000 8000
Q-routingSSQ-Routing
Figure 7: Average packet delivery time for 7-D hypercube at high load: All differences are significant
between 2400 to 300 time steps. Q-Routing is significantly different from SSQ-Routing
Adaptation to Changing Network Topology The third set of experiments compared the routing algorithms' ability to adapt to the changes in network
topology. A link was added between nodes 3 and 34 in the 6*6 grid topology (figure-1) for these
experiments. The routing algorithms were first allowed to learn an effective routing policy for the new
network at a load level of 2.0 pkts/step until they converged (in 2000 time steps). At time step 2000, the
link between node 12 and 25 was removed (figure 6). That is, the Q tables of node 12 and 25 were
Aver
age
pack
et d
eliv
ery
time
Simulation time step

© European Journal of Scientific Research, Vol 9, No 2, 2005
updated such that Q12(25,*) and Q25(12,*) were all set to Infinite Cost and the corresponding routing
tables were also updated accordingly. The C values were not changed. Only single run is shown in
figure-7 to depict the variations in adaptation process. However, statistical significance is computed over
50 runs and is given below.
0
20
40
60
80
100
120
0 1 1800 2000 2200 2400 2600 2800 3000
Q-routingSSQ-Routing
Aver
age
pack
et d
eliv
ery
time
(afte
r con
verg
ence
)
Simulation time step
© European Journal of Scientific Research, Vol 9, No 2, 2005
Figure 10: Adaptation to change a in the network topology. Q-Routing does not converge to an
effective policy while SSQ-Routing converges to an effective policy very fast.
7. CONCLUSIONS AND FUTURE WORK
SSQ-Routing with higher quantity of exploration and better quality of exploration than
Q-Routing was developed in this work. It was evaluated and compared to Q-Routing.
The ability to learn an effective routing policy starting from a random policy, the ability to adapt to
changes in traffic patterns, and the ability to adapt to changes in network topology. SSQ-Routing is an
improvement over the conventional adaptive routing algorithms such as BF in a number of ways. SSQ-
Routing strikes a balance between the amounts of overhead incurred and speed of adaptation whether it
is from random policy at fixed loads or to change in traffic pattern or change in network topology.
Reinforcement learning and neuro-dynamic programming are both relatively new fields in computer
science. The techniques involved still have some rough edges and are not always fully understood, this
is particularly the case with the application of function approximation to reinforcement learning. But the
results shown above are very satisfactory yet.
A different function approximator may have shown more success. A radial basis function and tile
coding, such as proposed by Sutton and Barto [7] could be a good approach to try, as Residual
algorithms were considered as a solution but would require the Q-routing algorithm to be re-phrased as
an episodic learning task, which may not be feasible. A more thorough and time consuming analysis of
the methods proposed in this project could lead to a more successful application of neural network
function approximation to the Q-routing problem.

© European Journal of Scientific Research, Vol 9, No 2, 2005
REFERENCES
[1]. Robert Crites and Andrew Barto; Improving Elevator Performance Using Reinforcement Learning; Advances in Neural Information Processing Systems, 1996. [2]. Justin Boyan and Michael Littman; Packet Routing in Dynamically Changing Networks: A Reinforcement Learning Approach; Technical report, School of Computer Science, Carnegie Mellon University, 1993. [3]. Kevin Gurney; An Introduction to Neural Networks; UCL Press Limited, 1997.
[4]. Chris M. Bishop; Neural Networks for Pattern Recognition; Oxford University Press, 1995.
[5]. Will Newton, A neural Network algorithm for internetwork routing; MS thesis; 2002.
[6]. Ritesh Gandhi.Synoptic Study of Kohonen’s Approach for the approximate solution of TSP; [7]. Richard S. Sutton and Andrew G. Barto; Reinforcement Learning: An introduction; MIT Press, 1998.

© European Journal of Scientific Research, Vol 9, No 2, 2005
GROWTH PERFORMANCE AND NUTRIENT UTILIZATION OF AFRICAN CATFISH (Clarias gariepinus) FINGERLINGS FED DIETS WITH GRADED INCLUSION LEVELS OF
DUCKWEED (Lemna sp)
OLUKUNLE OYIN and AGBOOLA, G.O. DEPARTMENT OF WILDLIFE AND FISHERIES MANAGEMENT,
UNIVERSITY OF IBADAN
ABSTRACT A twelve-week nutritional study was carried out to investigate the growth performance and nutrient utilization of African catfish (Clarias gariepinus) fingerlings fed diets with fish graded levels of duckweed (Lemna sp.) meal inclusion. The diets I – V contained 0%, 25%, 50%, 75% and 100% respectively of duckweed. The experiment was carried out in circular plastic tanks of 28 litres volume under normal room condition. Each treatment contained 10 fingerlings of 3.84 + 0.13a average weight in three replicates. Feeding was done at 5% body weight per day and weight changes of fish were recorded every two weeks. Weight of feed were adjusted accordingly. Growth parameters such as weight gain, specific growth rate and nutrient utilization parameters such as Food Conversion Ratio (FCR), Protein Efficiency Ratio (PER), Gross Conversion of Food Efficiency (GCFC) were monitored. Mean weight gain of (1.58g), survival rate (90%) and SGR 2.40% were highest in fish fed diet I with 0% duckweed inclusion while lowest mean weight gain, survival rate, and SGR (0.00%) were recorded in fish fed diet V (100% duckweed inclusion). The lowest mean weight gain and survival rate were recorded in fish fed diet V (100% duckweed inclusion). There was no significant deviation from the mean between the SGR of fish fed diets II, III and IV (P > 0.05). The Food Conversion Ratio (FCR) was lowest in fish fed diet 1 (2.91) and highest in fish fed diet III (5.51); no gain in weight was observed in treatment 5 hence no FCR was recorded in treatment V. Gross Conversion of Food Efficiency (GCFE) was highest in treatment 1 (34.45), closely followed by treatment IV (21.45) and the lowest in treatment III (18.15); no GCFE was recorded in treatment V. Protein Efficiency Ratio (PER) was highest in treatment I (0.38) and non existing in treatment V. The water quality parameters monitored during the period of the experiment (temperature, dissolved oxygen and pH) fell within the optimum range for growth and survival of C. gariepinus. The comparison of the proximate carcass composition of experimental fish before and after experiment showed an increase in crude protein level from the initial 59.87% to the highest recorded in fish fed diet IV (66.30%). In all the parameters measured (mean weight gain, specific growth rate, fish fed diet 1. %DWM showed the best growth performance followed by fish fed diets II IV and III in that order. It is striken that there is no significant difference in the MWG and SGR of Diets II, III and IV containing DWM. Fish fed diet V (100% duckweed inclusion) however recorded the poorest performance. Therefore, it can be inferred that for optimum growth performance and optimum catfish protein content 75% level of duckweed meal in the diet of C.gariepinus can be tolerated. The catfish fingerlings were able to digest up to 75% inclusion level of DWM with much gain in carcass protein; improved FCR, GCFE and PER. KEYWORDS: Growth performance, Nutrient utilization, Duckweed meal, medium

© European Journal of Scientific Research, Vol 9, No 2, 2005
PROBLEM DESCRIPTION
Population explosion coupled with the ever-increasing demand for dietary animal protein in
Nigeria, has consequently increased the demand for fish (9). Fish in the wild have thus been
indiscriminately exploited leaving the government with the option of fish importation to feed her ever
growing population.
In order to ensure steady and continuous supply of fish to the Nigerian populace and avoid
unfavourably balance of payment due to heavy importation, there is the need to intensify aquaculture so
as to boost local production of fish and gradually phase out importation of fish. Yet, there are several
factors militating against the efforts made to develop fish farming in order to increase fish supply. The
factors being identified include lack of modern fishing imputs, loss of products owing to improper
handling, processing, transportation and marketing equipment. Others include uncontrolled aquatic
weeds in culture medium, poor finance and little incentive from government, as well as the scarcity and
high cost of conventional feedstuffs e.g. fishmeal, which make it difficult to match production with
demand (2).
Of all the factors highlighted, feeding plays the most vital role as the farmer must supply his fish
with rations, which must contain good quality dietary protein. However these ingredients are expensive
and their supply unsteady. This lack of nutritionally adequate cost effective diets is a major constraint to
aquaculture (6). Therefore in order to reduce reliance upon conventional meals, which are expensive,
alternatives and ideally less expensive sources of good quality protein must be researched.
Exploitation of aquatic flora as source of edible protein has received little attention in Nigeria
despite being in abundance and constituting a menace to the beneficial used of water sources. Many
aquatic weeds have been used in the diet of herbivorous fishes, Agbede and Falaye (1996)2, fed Azolla
filliculoides (water fern), Elodea Sp and Pistia straitiotes (water lettuce) to Juvenile Nile tilapia

© European Journal of Scientific Research, Vol 9, No 2, 2005
(Oreochromis niloticus). The experiment showed that there was no significant difference in the protein
content of the fish fed control diet and those fed on aquatic weeds after the experiment.
The use of aquatic weeds e.g. duckweed in the diet of fish therefore would no doubt reduce the
cost of input while serving as a way of making the most discarded, the most useful”. This study is
therefore designed to investigate the nutritional potential of varying levels of duckweed meal (DWM)
inclusion on the growth of African cat fish fingerlings.
MATERIALS AND METHODS
Fresh duckweeds were harvested on the abandoned production ponds at the Department of
Wildlife and Fisheries Management fish farm, University of Ibadan, Nigeria, sun dried for 3 days
(5hours maximum/day) under intense sunlight until they become fluffy and blended into fine powder.
The other feedstuffs were obtained from a livestock feed mill in Ibadan, Nigeria. Five diets – I, II, III, IV
and V were formulated with varying proportions –O%, 25%, 50%, 75% and 100% respectively of sun
dried duckweed meal (DWM) included into the basal diets to replace soyabean meal (SBM) protein
(44% CP). The difference in crude protein content of SBM and duckweed (36.7% CP) was balanced by
multiplying the inclusion level of DWM in the diets by a factor of 1.24, Altschul (1958).
The control diet had O% DWM inclusion. The crude protein level of the diets was 40%. The
experimental diets were weighed, thoroughly mixed, moisture pelletted, dried for 5hours and stored at -
18oC in polythene bags until used. Ten fingerlings of Clarias gariepinus, mean weight 3.84 + 0.13g
were allotted per tank with three replicates per treatment. Each tank contained 28L volume of fresh
water changed 100% every other day. Water temperature, dissolved oxygen and pH levels were
monitored weekly.

© European Journal of Scientific Research, Vol 9, No 2, 2005
The fingerlings were fed 5% of their total body weight twice daily and weighing was done
fortnightly. The quantity of feed fed to the fish was adjusted relative to the weight gained.
The proximate analysis of the diets and carcasses were done using standard analytical methods
(1). The data obtained were analysed using the one way analysis of variance and comparison of means.
RESULTS AND DISCUSSION
The water quality parameters for all the experimental tanks were within acceptable ranges as
recommended for fish culture by Body (1982).
PROXIMATE ANALYSES OF THE DIETS.
The proximate composition of sun dried DWM is crude protein 36.7%, Ash 14.03%, Crude fibre
4.23%, Moisture 12.84%, Fat 8.27%, NFE 23.93%. The results of the proximate analysis of the sun
dried DWM, the gross and proximate analysis of experimental diets are recorded in table 1.0 (a) and (b).
The proximate analysis showed that the experimental diets contained an average of 42.93% crude
protein and they were all accepted by the test fish.

© European Journal of Scientific Research, Vol 9, No 2, 2005
Proximate composition of experimental fish
The proximate composition of the experimental fish before and after feeding trials is presented in
table 2.0. All the fish fed the experimental diets appreciated in weight at the end of the experiment.
Fish fed diet IV with 75% DWM has the highest body protein (66.3%).
The carcass of fish fed diet II (65.95%CP), diet III (64.9%CP) and diet V (65.78%CP), are not
significantly different form one another (P > 0.05) but they are significantly different at P < 0.05 from
diet 1 (64.22%).

© European Journal of Scientific Research, Vol 9, No 2, 2005
The crude protein in the initial fish was 59.07%. There was a significant improvement in the
crude protein stored in the flesh of all the fish fed the experimental diets when compared with the crude
protein content of the initial fish However, fish fed diet I had the lowest crude protein contents
(64.22%).
There was no significant difference in the carcass fibre composition of all the fish fed the
experimental diets; but fish fed diets II, III, IV and V differ significantly in carcass ash, moisture and
lipid composition from the control (treatment I) at P > 0.05.
The best growth performance was achieved in fish fed diet I containing 0% DWM while fish fed
diet V containing the highest inclusion (100%) of DWM recorded the poorest performance in terms of
growth, food conversion ratio and protein efficiency ratio.
Growth Performance and Nutrient Utilization.
Table 3.0 shows the growth performance and nutrient utilization of African cat fish fed the test
diets for 84days. Fish placed on the control diet (1) had the best SGR (2.46). FCR 2.91 and PER (0.38)

© European Journal of Scientific Research, Vol 9, No 2, 2005
while fish fed diet 5 had the lowest SGR and PER that were undetectable. Treatments 2, 4, 3 had
significantly (P < 0.05) different MWG from the control however, Diets 3 and 4 were not significantly
different from each other The Protein Efficiency Ratio (PER) of the control diet (0.38) was the highest
followed by treatment IV (0.33). the PER of treatment II and III do not show any significant difference
from each other (P > 0.05).
DISCUSSION AND RECOMMENDATION
The study revealed that the best growth performance similar to the control was the 25% DWM
while the poorest growth performance was recorded with diet containing 100% DWM. It can therefore
be inferred that catfish cannot be fattened on a 100%CP DWM diet at best the fish were sustained on a
maintenance level hence the no growth performance in Diet V. However, treatment 4 with higher
inclusion (75%) of DWM encouraged good food conversion (3.58) and efficiency (0.33) but lower
protein intake (2.64). It can be inferred that the higher fiber content in Diet III (5.38% CF) encouraged

© European Journal of Scientific Research, Vol 9, No 2, 2005
faster evacuation of faecal material but lower protein assimilation 64.90% CP in carcass. Mbagwu and
Adeniji (1988) carried out series of preliminary experiments to determine the extent to which duckweed
and its components are digested and assimilated by tilapia. They concluded that tilapia was able to
digest duckweed efficiently because of the possession of sharp pharyngeal teeth and the long coiled
intestine which are absent in catfishes. The lower FCR (3.58), higher GCFE (31.45) and PER (0.33) of
Diet (IV) suggest that catfish fingerling is able to digest a high (75%) inclusion levels of duckweed in its
diet. This could have been influenced by the high CP content of this DWM gotten from ponds heavily
fertilized with organic manure and supplemented feeds.
This view is supported by Mbagwu and Adeniji (1988), Stambelie et al. (1994) and later by
Fasakin (1999) that the leaf protein concentrate of duckweed though of high quality, has its protein
content dependent on source. In addition, Mbagwu and Adeniji (1988) and Rusoff et al., (1980) further
reported DWM’s great potential as an inexpensive effective and culturable source of protein supplement
because it contains higher concentration of amino acids than most plant proteins. This research supports
Skillicorn’s et al. (1993) suggestion of 25% replacement level of DWM in fish diet to supporting good
growth with the SGR, FCR and PER as good as the fish fed soyabean meal based diet containing an
average of 42.93% CP/100% CP of the diet. However, this work differs from Skillicorn et al., (1993) in
that DWM when cultured in a nutritional rich medium can be included in fish diet to as high as 75%
inclusion level without much significant difference (P < 0.05) in MWG and SGR. In fact a much
improved FCR of the diet can be obtained than in the 25% DWM inclusion from a DWM raised in a
poor nutrient medium. A diet with 75% inclusion level of DWM gave a significantly higher carcass
protein than Diets I (control) and II 25% DWM. A multiple protein source diet gives a better carcass
protein and it is to be recommended in catfish diets, Altschul (1958) and Olukunle (1996).

© European Journal of Scientific Research, Vol 9, No 2, 2005
However, efforts must be made to reduce level of anti-nutritional factor (Calcium oxalate) in
duckweed to the barest minimum or completely removed for better performance through improvement
of the culture medium Francis et al. (2001).
© European Journal of Scientific Research, Vol 9, No 2, 2005
REFERENCES Altschul, M.A. (1958). Processed plant protein foodstuff. Academic Press Inc. Publishers, New York. A.O.A.C (1991). Official methods of Analysis of the Association of Analytical Chemists Washinton
D.C Pp. 109. Agbede S.A and Falaye A.E (1997). Nutritive value of three aquatic weeds as diets for Nile Tilapia
(oreochromis niloticus). J. Trop. For Resources Vol. 14.1 Pp. 19-23. Fasakin, E.A (1999). “ Nutrient quality of leaf protein concentrates produce from water per (Azolda
Africana Desv.) and duckweed (Sprodela polyorhiza L. Schleiden). Bioresource technology 69 (2): 185-187).
Francis G., Makaar H.P.S and Becker K. (2001). Anti nutritional factors present in plant derived alternate fish feed ingredients and their effects in fish. Aquaculture 199:197-227.
Mbagwu I.G and Adeniji H.A (1988). The nutritional content of duckweed Lemna Paucicostata Hengen ex Engelin ) in the Kanji Lake area. Aquatic Botany 29.
New, M.B (1991). Where will fish be in year 2000? Fish farmer Int. files May/June Pp 38 - 41. Olukunle, O.A. (1996). The Nutritional Potentials of Processed sesame indicum in the diets of Clarias
gariepinus Burchell, 1822). A Ph.D thesis in the Department of Wildlife and Fisheries Management, University of Ibadan, Ibadan.
Rusoff, L.L., Blakeney, B.W., Jr Culley, D.D. (1980). Duckweeds (Lemnaceae family) a potential source of protein and amino-acids.
Skillicon P., William, S., and Journey W. (1993). Duckweed Aquaculture: a new aquatic farming system for developing countries”. The world Lance 76 Pp, Washington D.C
Stambelie J.H and Leng R.A (1994). Unpublished observations UNE, primidale NSW. Australia. Tabor, Z.G (1992). The fishing industry in Nigeria status and potentials for self-sufficiently in fish
production. NIOMR technical paper No 54. Van Dyke J.M. and Sutton D.L. (1979). Digestion of duckweed (Lemna s.p.) by the grass carp
(Ctenopharyngolon endella) Journal of fish Biological. 11:273-278.
© European Journal of Scientific Research, Vol 9, No 2, 2005
RURAL WATER MARKETS IN PAKISTAN: PREVALENCE, PROBLEMS AND PROSPECTS
Dr. Zakir Hussain and Hammad Badar, Mohammad Farhan.B Hussain1
ABSTRACT
Water markets have been in operation in many countries including Pakistan. Although informal water markets have been in operation since decades, they are gradually developed in Pakistan over the past two decades. The formal markets having well defined, private and transferable water rights are relatively of recent origin. The recent evidence in Pakistan shows that informal markets are developing over time and canal water is freely traded, often sold and bought. The survey results revealed that 6-7 percent of the sampled farmers buy and sell water at head and 20 percent sell water at the tail end of the distributaries. However, over 80 percent of head and middle farms trade water. The canal water rate varies from $ 2-$ 3 per hour mostly to neighboring farmers. The sale of ground water is quite common and due to short supplies of surface water; conjunctive use of water is increasing. Almost all tube well owners at and head middle reaches sell water, where as over 50 percent tail enders sell water. The tube wells water rate varies from $ 1.00 per hour to $ 3.00 per hour. The distance over which water can be transported provides a limitation to water market sales, but lined watercourses increase the distance over which tube well water can be sold. Unreliability of access to purchased tube well water is another problem for water buyers. Purchasers are more likely to have unreliable access to groundwater if they buy water from small-capacity, electric-powered tube wells, if they are young and own little or no land. Policy measures to improve access and reliability of groundwater through water markets include increasing the density of tube wells, especially by assisting small farmers to purchase tube wells; lining water delivery channels; and providing more reliable electrical power supply to rural areas. Furthermore, the replication of Participatory Irrigation Management will improve reliability of irrigation water and canal supplies will be increased.
I) INTRODUCTION
Throughout the world the growing demand for potable water, irrigated agriculture, and environmental services is putting increasing pressure on finite supplies of freshwater resources. New methodologies and new systems for more efficient and equitable distribution of water between competing users are needed to meet this challenge. Traditionally, most countries have relied on centralised, state managed, command and control systems to ensure equitable distribution of water and provide subsidised water delivery services to farms and cities. But poor state management, increasing fiscal pressures on central governments, increasing concern about the environmental effects of large catchment and irrigation systems, and the continual growth of urban populations have led to a new paradigm characterised by decentralised management, user control of water delivery services, transferable water-use rights, and
1 The authors respectively are: Professor, Department of Economics University of Sargodha, Lecturer, Department of Agribusiness and Marketing, University of Agriculture, Faisalabad and graduate student, Department of Agricultural Economics, Texas A&M, University, USA

© European Journal of Scientific Research, Vol 9, No 2, 2005
water markets (Easter and Hearne 1995; Rosegrant and Gazmuri 1994, Rosegrant and Binswanger 1994).
Water markets, in which farmers buy and sell irrigation water, provide one of the most promising institutional mechanism for increasing access to irrigation with private groundwater market, for providing vertical drainage, and for increasing the efficiency of water use in irrigation systems (Shah 1993; Moench 1994; Rosegrant and Binswanger 1994; Rosegrant and Gazmuri 1994; Kahnert and Levine 1993).
Irrigation plays a key role in Pakistan's strategy for increasing agricultural productivity. Surface irrigation has allowed the extension of cultivation into areas and seasons that lack sufficient rainfall for agriculture. However, the public and irrigation systems do not provide farmers with adequate water or enough control over irrigation deliveries to meet the demands of the more intensive agriculture that came in the wake of the “Green Revolution” and increasing population pressure in Pakistan. Moreover, allowances are not made for water losses in the channels. Problems with operation and maintenance of the canal systems mean that tail-end distributaries and watercourses do not receive enough canal water for the current cropping intensity, and delivery schedules are unreliable in many areas.
Of the total surface irrigation water, 110 MAF is diverted to canals, 70 percent of the water is withdrawn in Kharif season and 30 percent in the Rabi season. The canal withdrawals have been quite erratic in the past decade depending upon the snowmelt and rainfall during the monsoon. The provincial share in the Kharif withdrawals is 49 percent, 47 percent; and 4 percent and Rabi withdrawals is 54 percent, 43 percent and 3 percent in Punjab, Sindh, Balochistan and NWFP respectively in the year 1998-99 ( A Year Book of Agricultural Statistics, Government of Pakistan 2000). The availability of water as per canal withdrawals is 1.5 acre feet, 5 acre feet, 1.5 acre feet and, one acre feet per cropped acre in Punjab, Sindh, Balochistan, and NWFP respectively. This shows that surface water is not enough to cater the consumptive needs of crops.
All this has led to many turning to groundwater from private tube wells as a sole or supplement source of irrigation. However, tube well ownership is limited to a relatively small proportion of farmers, who tend to be the larger and more affluent landowners. Sale and purchase of groundwater through informal water market offers other farmers the opportunity to use ground water. Ground water is mined through public and private tube wells (493,000; Government of Pakistan 2002). The private farmers install most of the tube wells in sweet water zone. Public tube wells were installed in the Salinity Control and Reclamation Program (SCARP) areas to pump out effluent discharge from waterlogged areas. These tube wells were of bigger capacity installed near canals to pump out ground water in these canals to lower water table. The size of the tube wells was large, thus farmers were unable to purchase. Private tube wells owners are over drafting the aquifer due to which water table is going down.

© European Journal of Scientific Research, Vol 9, No 2, 2005
Owing to the importance of groundwater in the irrigation based agricultural economy of Pakistan, paper attempts to explore the concept of groundwater markets, their prevalence, and structure and problems their development in Pakistan. The paper has been divided into various sections. Section II presents the concepts of groundwater markets, their rationale, potential benefits and costs associated with these; Sections III and IV describes the prevalence, structure and features of ground water markets in Pakistan; Section V and VI comprised discussion on recent experience of water markets in Pakistan and linkage of water markets with other factor markets; Section VII and VIII presents scope of water markets in Pakistan and implications for agricultural production and Section 1X and X concludes the paper with problems in the groundwater market development and some policy recommendations. The following section II elaborates on the concept of water markets and their rationale.
II) WATER MARKETS: RATIONALE, BENEFITS AND COSTS
There are several non-market mechanisms for allocating water in most countries. Whereas private sector hierarchies are subject to market tests of profitability in order to survive and prosper, and to government regulation of market failures, government hierarchies are faced with different goals and performance requirements.
Costly inefficiencies in the supply and use of water support a shift from government provision to a market–based approach that is more effective and less wasteful. Markets can allow rapid changes in allocation in response to changing demands for water and can stimulate investment and employment as investors are assured of access to secure supplies of water. Because of water's unique characteristics, such markets do not work everywhere; nor do they resolve all water–related issues. Yet these same characteristics also make government publicly administered allocation of water difficult. Markets are preferable when water is scarce and when the infrastructure to affect transfers exists or can be cheaply developed. By designing appropriate water laws and regulations and by strengthening private and public institutions to administer them, formal water markets can effectively address rising demands for groundwater and for water found in rivers, lakes, and canals (Thobani, M. 1997). For water markets to work, property rights to water must be private, exclusive and transferable (Bauer 1997). The role of the state should be minimal in this setting and should be restricted to protecting property rights, enforcing contracts, and reducing transaction costs and barriers to exchange.

© European Journal of Scientific Research, Vol 9, No 2, 2005
Private Tube wells improve production by increasing farmer’s control over the amount and timing of irrigation. This increases yields and allows farmers to switch to higher-value crops. By making water available to those who cannot install their own wells, groundwater markets improve the equity of access to this vital resource. But the benefits of groundwater are not equal for water buyers and tubewell owners. Purchasing groundwater from other farmers gives farmers more control over their irrigation than relying on public canal irrigation systems alone, but less control over how much water to apply and when than if they owned a tubewell.
However, water-market transfers are often constrained by the cost of constructing, operating, and modifying the infrastructure needed to redirect water flows; the cost of gaining legal and bureaucratic approval for transactions of water use rights from one user to another; the cost of finding willing buyers and sellers and negotiating a transaction; and the cost of registering and enforcing the transactions. These transactions costs are generally considered to be the major constraint to active water markets (Hearne and Easter 1995).
In sum, water markets have at least two clear advantages compared to administered efficiency pricing. First, information and transaction costs are reduced since buyers and sellers of water generate the necessary information on the value of marginal product and opportunity costs of water. As is the case with all markets, different values are measured and compared by prices, and the way price signals coordinate, dispersed information and preferences is one of the great advantages of water markets (over alternative systems of water allocation). Second, the initiation of transferable water rights would legalize the current situation, rather than being viewed as a usurpation of these rights. Thus, their implementation should be more palatable politically and doable as compared to administered water pricing regimes.
III) PREVALENCE OF GROUNDWATER MARKETS IN PAKISTAN
In Pakistan, groundwater markets are reported to operate in all provinces, but are most active in Punjab, where the greatest groundwater development has taken place. By 1975, more than 30 percent of tubewell owners in Pakistan reported selling water, but the fraction of water sold was very small (World Bank 1984). A study by Pakistan’s Water and Power Development Authority (WAPDA) in canal command areas of Punjab and Sindh and NWFP found water sales in 43 of 100 water courses (WAPDA 1990: see also Bajwa and Ahmed 1991). Based on data from a survey of well owners through out Pakistan, National Engineering Services-Pakistan (NESPAK), a Parastatals engineering consulting firm, reported that 21 percent of well owners sold water (NESPAK 1991).
Water markets that exist in Pakistan are informal and are generally limited to localized water trading between adjacent farmers, and the practice is quite common especially for groundwater. Although found in many parts of Pakistan, the occurrence of groundwater markets is not uniform and these are most common in central Punjab where groundwater is sweet. The extent of area irrigated through water markets, which is often considered to be a surrogate for the magnitude of water trading, varies across regions as well as over time depending on a number of factors such as rainfall, groundwater supply, cropping patterns, and the cost and availability of electricity. In water scarce pockets of Punjab substantial area is irrigated through groundwater markets. There is no systematic estimate at the national level of the magnitude of water trading.
© European Journal of Scientific Research, Vol 9, No 2, 2005
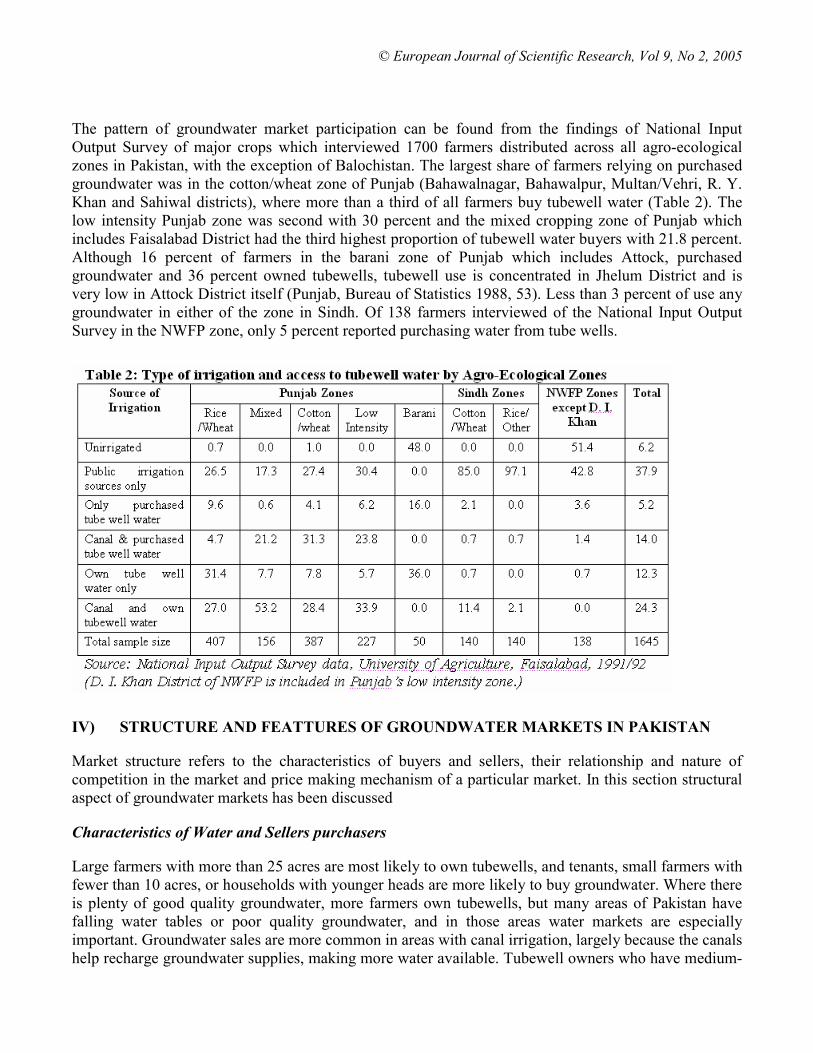
The pattern of groundwater market participation can be found from the findings of National Input Output Survey of major crops which interviewed 1700 farmers distributed across all agro-ecological zones in Pakistan, with the exception of Balochistan. The largest share of farmers relying on purchased groundwater was in the cotton/wheat zone of Punjab (Bahawalnagar, Bahawalpur, Multan/Vehri, R. Y. Khan and Sahiwal districts), where more than a third of all farmers buy tubewell water (Table 2). The low intensity Punjab zone was second with 30 percent and the mixed cropping zone of Punjab which includes Faisalabad District had the third highest proportion of tubewell water buyers with 21.8 percent. Although 16 percent of farmers in the barani zone of Punjab which includes Attock, purchased groundwater and 36 percent owned tubewells, tubewell use is concentrated in Jhelum District and is very low in Attock District itself (Punjab, Bureau of Statistics 1988, 53). Less than 3 percent of use any groundwater in either of the zone in Sindh. Of 138 farmers interviewed of the National Input Output Survey in the NWFP zone, only 5 percent reported purchasing water from tube wells.
IV) STRUCTURE AND FEATTURES OF GROUNDWATER MARKETS IN PAKISTAN
Market structure refers to the characteristics of buyers and sellers, their relationship and nature of competition in the market and price making mechanism of a particular market. In this section structural aspect of groundwater markets has been discussed
Characteristics of Water and Sellers purchasers
Large farmers with more than 25 acres are most likely to own tubewells, and tenants, small farmers with fewer than 10 acres, or households with younger heads are more likely to buy groundwater. Where there is plenty of good quality groundwater, more farmers own tubewells, but many areas of Pakistan have falling water tables or poor quality groundwater, and in those areas water markets are especially important. Groundwater sales are more common in areas with canal irrigation, largely because the canals help recharge groundwater supplies, making more water available. Tubewell owners who have medium-

© European Journal of Scientific Research, Vol 9, No 2, 2005
sized landholdings (10 to 25 acres) are more likely to sell water than those with large landholdings, who can use more of the water for their own land.
The pattern of tubewell owners, having larger landholdings found in much of Pakistan is similar to that of the rest of South Asia. In Table 3, which presents average landholding size and other characteristics of tubewell owners, water purchasers, and nonusers of groundwater, farmers who own tubewells also own significantly more land than either groundwater purchasers or nonusers of groundwater, though their operational holding sizes are not significantly larger than water buyers. A comparable pattern in which larger landowners own wells and smaller landowners purchase tubewell water, based on the National Input Output Survey data from the Punjab mixed cropping zone, is shown in Table 4. Much of the difference in holding sizes in made up by water buyers tenting in land. Nearly one-third of water buyers and nonusers of groundwater are landless tenants, whereas all tubewell owners own at least some land. The proportion of landowners who rented in additional land ranged from 13 to 16 percent among all categories of farmers, Water buyers are from significantly younger households than those of tubewell owners, indicating that they may not be as well established. This may arise because, when land is divided among sons, the eldest may keep the tubewell and other purchase from him or other nearby farmers.

© European Journal of Scientific Research, Vol 9, No 2, 2005
Landownership and age are indicators of overall status among farm households. Farmer's don't invest in tubewells for prestige, but higher stakes can enable them to mobilize the resources needed for tubewell investment, including financial resources and government assistance (such as electricity connections). Therefore, higher status households are more likely to own wells and lower status households are more likely to rely on tubewell water purchases. But it is not only low-status household who purchases water. Water purchases may provide a backup when farmer's own well is not functioning, or purchases may be used to irrigate land that cannot be served by a farmer's well. In several cases, farmers preferred buying water to operating their own wells because purchasing water from electric powered wells was cheaper than using their own PTO tube wells.
Nature of Competition and Relationship between Buyer and Seller
Groundwater markets are not perfectly competitive markets in which buyer are free to choose among a number of sellers rather generally monopoly power is exercised in these markets. These markets are abysmally small and fractured and are typically characterized by a monopolistic behaviour of the seller and weak bargaining position of buyers. Buyers often have limited choice due to low density of their tube wells, coupled with uneven topography and potential for seepage losses, which enable sellers to exercise a degree of monopoly power. Further, there is evidence of buyers being tied down to sellers from contiguous plots, as sellers can and do refuse conveyance of water through their plots to other possible suppliers (Janakarajan 1993, 1994). Monopoly power not only encourages sellers raising water prices but also compromising on the quality of service they offer.
The physical proximity is not only the relationship that influences the development of competitive groundwater markets. Social and agrarian relationship between buyer (share cropper or other wise) and seller also restrict the sale and purchase of groundwater if tube well owners are only willing to sell to close relatives or those with whom they have other ties. A major reason for sale among kin is that relatives often have the closest landholdings due to inheritance patterns.
Nature of Groundwater market contracts
The terms of water payment vary widely and differ by crop, by season and by location. The payments can be made through cash or non-cash mode. Cash payments are made on the basis of time, volume or area irrigated. Non-cash contracts, which typically take the form of sharecropping (i.e., seller collects a water rent in the form of a share of the buyer's output), are quite common. They have been found to be incentive compatible (Aggarwal 1999). These contracts work as `double-sided' incentive, providing the

© European Journal of Scientific Research, Vol 9, No 2, 2005
seller an incentive to ensure that water supply is timely and reliable, and the buyer an incentive not to shirk in the application of labor. At times the groundwater market shows a liege character
A flat charge per hour of pumping is the most common form of groundwater market contracts in most of the groundwater market areas. This type of arrangements occurs under all types of tube wells. Water from diesel pump sets is commonly sold under an arrangement whereby the buyer supplies the diesel and motor oil for the pump and pays an additional fee per hour to the well owner to cover the wear and tear on the engines. Share cropping contracts for water are used under both diesel and electric tube wells.
Fragmented and Localized markets
Water trading in Pakistan is spatial, fragmented and often occurs over short distances and periods. Unlike developed nations like Chile, Western USA and Australia, the institutions, legislation, rules and regulations do not exist in Pakistan for more formal transactions.
Supply Driven
The occurrence of informal groundwater markets generally depends on surface water supplies rainfall, groundwater supply, availability and cost of energy, cropping pattern etc. Most water sales do not involve any reduction in irrigation by sellers (Saleth 1999). Majority of the sellers are large farmers owning deep wells and large capacity pump sets and the buyers are usually small farmers without wells or pump sets, though there are some farmers who rely on groundwater markets due to farm fragmentation or shortage of water in own tube wells. The provision and access to use of groundwater and irrigation assets to resource-poor farmers, groundwater markets have generated employment and promoted equity.
Social and Tenurial Status
The social milieu and agrarian structure often determines the emergence of groundwater markets. In the context of agrarian relation in Punjab it has been found that it is the water buyers' position in the social network, particularly their ethnicity and relations to sellers rather than their ability to pay that determines their access to water because conveyance of tube well water though public water courses is prohibited. Moreover, there were several cases of price discrimination with prices being lowered for favored clients especially shared croppers.
V) RECENT EVIDENCE OF WATER MARKETS IN PAKISTAN
There is no comprehensive study on water markets except a study done by Meinzen R. Dick (1996). In order to reveal the extent of water markets in Pakistan, a snap shot survey of seven distributaries in Faisalabad and Jhang Districts was conducted in April and May 2003. In all 55 randomly selected respondents were interviewed through a structured questionnaire. The respondents were also segregated according to their positions (head (16), middle (24) and tail (15) on the respective distributaries. The source of water supply was mainly canal and private tube wells, 96 percent of the farmers depend on conjunctive use of water while 4 percent use only tube well water. Nearly 60 percent tube wells are operated through diesel engine, 31 percent are run on electricity and the rest are tractor drawn. The number of tube wells varies from one to three depending the extent water use and sale. Most of tube wells (75 percent) are installed at owners farms, 21 percent were installed at leased farms and the rest
© European Journal of Scientific Research, Vol 9, No 2, 2005
were sunk at the head of the outlet. The experience of the respondents in farming varies from 30 to 40 years. The average area owned is 8 acres. The most dominant crop is wheat in winter season; sugarcane and cotton are summer cash crops. The cultivable waste area is more on tail-end farms because of the scarcity of water. Following is a brief discussion of the practical implications of water trading, looking at evidence of both formal and informal water markets in Pakistan
Characteristics of the Participants
According to the results, the small farmers (below 4ha) and the large farmers (above 12 ha) were less involved in water transactions as compared to medium farmers (from 4 to 12 ha). The reason of the majority of the medium sized farmers involved in the water markets is that their farms are larger than 10 acres (4.05 ha); however above a certain farm size, most of the water pumped is allocated primarily to their own fields reducing the quantity of water available for sale. The small sized farmers participate significantly more than large farmers in water purchasing.
Prices of water vary from one trading activity to another being low for electric tube wells as compared to diesel and canal water. Canal water prices are much higher than those being charged by the Punjab Irrigation Department. Water market transactions are more in the areas where the farmers are “Locals” which are less cooperative as compared to the settler farmers generally perceived as cooperative.
The strategy of the tube well owners is that they usually do not discriminate among their potential buyers but they prefer to sell their neighbors and the surrounding members in their family. They think first they are farmers and then water sellers. In the water shortage periods, first they fulfill their crop water requirements and then they sell water. Mostly they sell water to their neigh borers and relatives and then to others. Electric tube wells are operated more due to less operation and maintenance cost incurred while PTO and diesel tube wells are less operated. The strategy of the buyers is that they prefer to purchase tube well water form their nearest and electric tube well because it costs less to them.
All the water sales and purchases in the sample area take place in cash and the price of tube well water per hour does not change with the scarcity of the water rather changes with the change in energy prices. Most of the time the price paid is same for all the buyers and in some cases of land-lord tenant relationship is superimposed on the seller and buyer relationship in which the tenant will pay a share of the total operational hours but some times for lower price than others.
Tube well water prices are affected by some factors including investment costs, operation and maintenance costs, tube well discharge, tube well groundwater quality, competition with other sources of water, demand etc. Some times the buyer uses his own tractor and does not pay any compensation to the tube well owner and some time the tractor is provided by the tube well owner and the buyer provides diesel or pay the fuel cost to the tube well owner and does not pay any compensation to him. Only a few tube well owners were found to include the O&M cost in fixed cost of water per hour. The cost of tube well water varies depending on the source of power being highest for PTO, then for diesel and the lowest for electric tube wells. The opposite is the case with the average number of hours sold by electric, diesel and PTO tube wells.
Generally speaking, tube well markets improve the reliability of the irrigation water supply and the farmers try to improve the reliability and flexibility of their irrigation water supply.
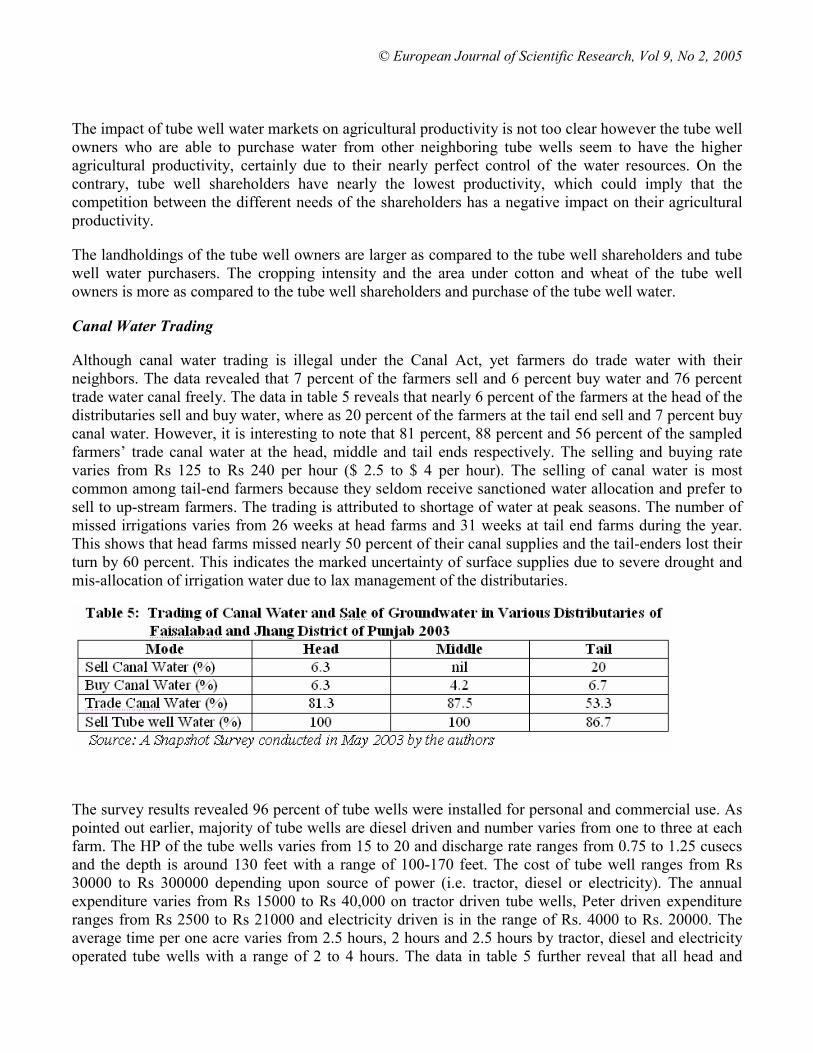
© European Journal of Scientific Research, Vol 9, No 2, 2005
The impact of tube well water markets on agricultural productivity is not too clear however the tube well owners who are able to purchase water from other neighboring tube wells seem to have the higher agricultural productivity, certainly due to their nearly perfect control of the water resources. On the contrary, tube well shareholders have nearly the lowest productivity, which could imply that the competition between the different needs of the shareholders has a negative impact on their agricultural productivity.
The landholdings of the tube well owners are larger as compared to the tube well shareholders and tube well water purchasers. The cropping intensity and the area under cotton and wheat of the tube well owners is more as compared to the tube well shareholders and purchase of the tube well water.
Canal Water Trading
Although canal water trading is illegal under the Canal Act, yet farmers do trade water with their neighbors. The data revealed that 7 percent of the farmers sell and 6 percent buy water and 76 percent trade water canal freely. The data in table 5 reveals that nearly 6 percent of the farmers at the head of the distributaries sell and buy water, where as 20 percent of the farmers at the tail end sell and 7 percent buy canal water. However, it is interesting to note that 81 percent, 88 percent and 56 percent of the sampled farmers’ trade canal water at the head, middle and tail ends respectively. The selling and buying rate varies from Rs 125 to Rs 240 per hour ($ 2.5 to $ 4 per hour). The selling of canal water is most common among tail-end farmers because they seldom receive sanctioned water allocation and prefer to sell to up-stream farmers. The trading is attributed to shortage of water at peak seasons. The number of missed irrigations varies from 26 weeks at head farms and 31 weeks at tail end farms during the year. This shows that head farms missed nearly 50 percent of their canal supplies and the tail-enders lost their turn by 60 percent. This indicates the marked uncertainty of surface supplies due to severe drought and mis-allocation of irrigation water due to lax management of the distributaries.
The survey results revealed 96 percent of tube wells were installed for personal and commercial use. As pointed out earlier, majority of tube wells are diesel driven and number varies from one to three at each farm. The HP of the tube wells varies from 15 to 20 and discharge rate ranges from 0.75 to 1.25 cusecs and the depth is around 130 feet with a range of 100-170 feet. The cost of tube well ranges from Rs 30000 to Rs 300000 depending upon source of power (i.e. tractor, diesel or electricity). The annual expenditure varies from Rs 15000 to Rs 40,000 on tractor driven tube wells, Peter driven expenditure ranges from Rs 2500 to Rs 21000 and electricity driven is in the range of Rs. 4000 to Rs. 20000. The average time per one acre varies from 2.5 hours, 2 hours and 2.5 hours by tractor, diesel and electricity operated tube wells with a range of 2 to 4 hours. The data in table 5 further reveal that all head and
© European Journal of Scientific Research, Vol 9, No 2, 2005
middle farmers sell water where as 87 percent of tail Enders sell ground water through tube wells. Thus groundwater markets are coming up in the central Punjab where sub-soil water is sweet.
The average sale of water ranges from 1-18 hours per day with mean rate of about 5 hours. The winter season (Rabi) water sale is 20 hours and summer season (Kharif) sale is 30 hours. The tube well operating hours averaged to 7 hours daily; in Rabi season sale is 4 hours and in Kharif season water sale is 8 hours. The water rate varies from Rs 60 ($1.00) per hour to Rs. 180 ($3.00) per hours.
Forms of Water Transactions
In the command areas of the five sampled watercourses, most of the water transactions relate to the sale and purchase of the tube water while in the canal water most of the cases relate to the exchange (partial or full exchange) of the turns. On the sale and purchase of the canal water supplies, only one person reported the sale as against the 12 farmers reporting about the purchase of the canal water. The difference may be due to the fear of the law that inhibits the sale and purchase of the canal water supplies.
Exchange of partial canal turn is a more common practice in the Fordwah watercourse than in the Azim and Fateh watercourses. Tail watercourses (Fordwah 130-R and Azim 111-L) manifest a higher activity than the head watercourses, essentially due to a high level of tube well water sales.
One of the main finding of the study is that at tail reaches where the canal water supplies are very poor and farmers believe that they would not be able to receive their due share of canal water, they sell the canal water to the head reach farmers and prefer to use tube well water conditional upon the good underground water quality (Azim 111-L), Otherwise the case is opposite where the groundwater quality is poor leading towards the salinization. In this case the small quantities of the canal water supplies are important for them to leach down the salts accumulated in the field by poor quality groundwater application.
The authors have discussed the factors affecting the groundwater markets. Among those location of farm at watercourse (higher involvement in tail as compared to head reach), season (water markets being more active during the Kharif season as compared to Rabi) are more important. Where there are relatively good canal water supplies (in terms of quantity and reliability) and poor groundwater quality, the intensity of water markets is less.
VI) LINKAGE OF WATER MARKETS WITH OTHER FACTOR MARKETS
Pakistan is endowed with rich land, water and mineral resources but unfortunately resource use efficiency is low especially of land and water. The yield and productivity of crops per unit of land and water is low due to irrational use and mismanagement of these two vital resources. The soils are being deteriorated by twin menace of water logging and salinity. The soils are poor in organic matter and are continuously being depleted for want of balanced use of fertilizer. Soils are further deteriorated by the wind and water erosions. The conveyance efficiency of water is 45 percent only. The inequity and in-efficacy at the farm level is yet an-other issue. The total surface water availability is over 130 million acres feet (MAF) but consumptive use varies from 30-46 MAF (estimated) and the rest is lost to the system or escaped to the sea. The fertilizer off-take is only 2.5 million nutrient tons against the
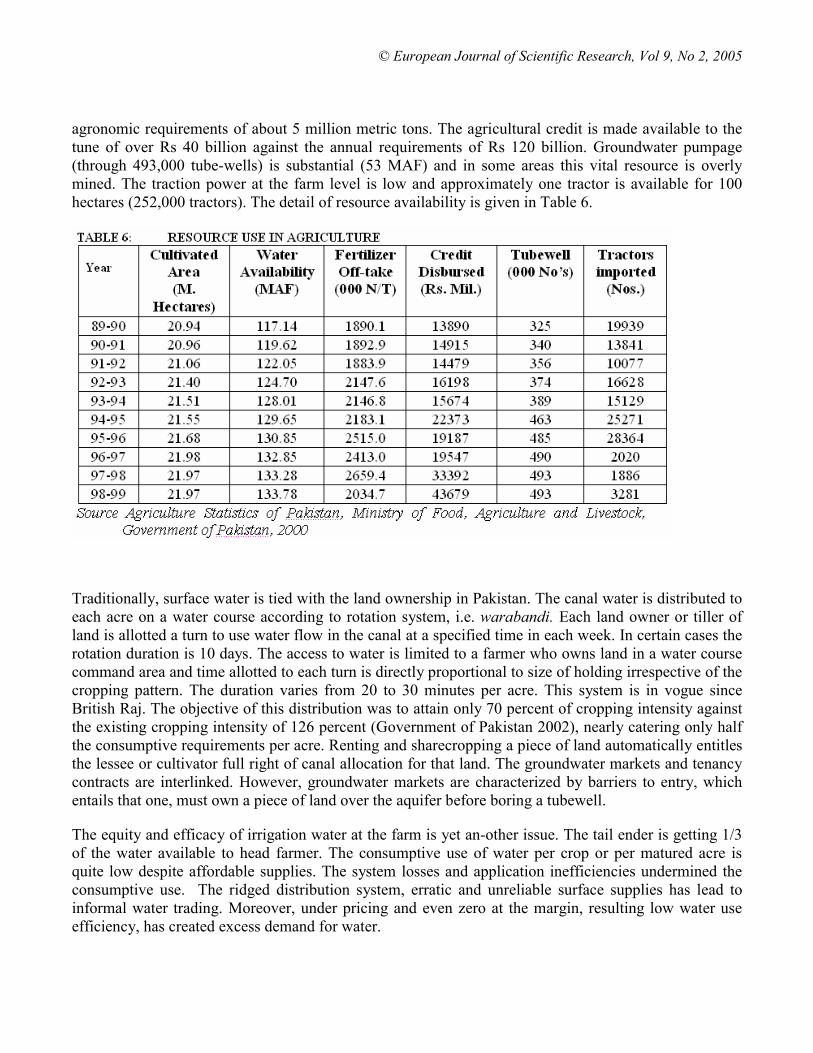
© European Journal of Scientific Research, Vol 9, No 2, 2005
agronomic requirements of about 5 million metric tons. The agricultural credit is made available to the tune of over Rs 40 billion against the annual requirements of Rs 120 billion. Groundwater pumpage (through 493,000 tube-wells) is substantial (53 MAF) and in some areas this vital resource is overly mined. The traction power at the farm level is low and approximately one tractor is available for 100 hectares (252,000 tractors). The detail of resource availability is given in Table 6.
Traditionally, surface water is tied with the land ownership in Pakistan. The canal water is distributed to each acre on a water course according to rotation system, i.e. warabandi. Each land owner or tiller of land is allotted a turn to use water flow in the canal at a specified time in each week. In certain cases the rotation duration is 10 days. The access to water is limited to a farmer who owns land in a water course command area and time allotted to each turn is directly proportional to size of holding irrespective of the cropping pattern. The duration varies from 20 to 30 minutes per acre. This system is in vogue since British Raj. The objective of this distribution was to attain only 70 percent of cropping intensity against the existing cropping intensity of 126 percent (Government of Pakistan 2002), nearly catering only half the consumptive requirements per acre. Renting and sharecropping a piece of land automatically entitles the lessee or cultivator full right of canal allocation for that land. The groundwater markets and tenancy contracts are interlinked. However, groundwater markets are characterized by barriers to entry, which entails that one, must own a piece of land over the aquifer before boring a tubewell.
The equity and efficacy of irrigation water at the farm is yet an-other issue. The tail ender is getting 1/3 of the water available to head farmer. The consumptive use of water per crop or per matured acre is quite low despite affordable supplies. The system losses and application inefficiencies undermined the consumptive use. The ridged distribution system, erratic and unreliable surface supplies has lead to informal water trading. Moreover, under pricing and even zero at the margin, resulting low water use efficiency, has created excess demand for water.

© European Journal of Scientific Research, Vol 9, No 2, 2005
This has an important bearing on other factor markets, particularly land, become more valuable, and the administratively-created shortage creates an economic rent for the big landlords. As the market fails to match supply and demand in the absence of prices, the existing supply has to be rationed usually by Irrigation Authorities (rent seekers) at political will.
Thus trading water rights is particularly beneficial for small farmers, who happened to be majority (93 percent; Government of Pakistan, 2002) in Pakistan. They are often left out from the political equation and have therefore, been most vulnerable to reductions in their water allocation over time, and have few other sources of collateral. Poor farmers can be assured of sufficient water by their tradable rights, which also help to reduce the abuses of administrative allocation. Since the water rights are divisible, farmers can use some part of their water rights for small loans as collateral, rather than their entire farm holdings. Although the experience in some countries is that small farmers are often bought out completely when they trade, the more efficient ones that remain are able to expand by purchasing water use rights.
Public financial institutions (Agricultural Development Bank of Pakistan) which distribute farm credit, especially for tube wells and irrigation schemes, often bestow access to liege rather than small farmers, thus become instruments of political power in the country. Since farmers are the main users of canal water, they oppose raising water prices because it increases their variable costs.
Finally, when comparing the transactions costs of water markets with alternative allocation mechanisms, the `hidden' transactions costs of the latter must also be taken into account. There are very high costs due to private rent-seeking by the managers of publicly administered irrigation systems.
Pakistan has excess supply of labor and unemployment rate (7.8 percent) is increasing and poverty (32 percent) especially rural poverty is on the rise (Government of Pakistan, Economic Survey, and June 2003). The emergence of ground market is healthy omen to arrest unemployment and alleviate rural poverty. The country is endowed with ground water resources. The ground water is pumped through half a million tube wells. The availability such a huge ground water resource (53 million MAF) can provide additional employment to teaming millions through installation of tube wells. However, tube well installation cost is prohibitive, causing a barrier to entry in the groundwater market. In addition, colossal seepages losses though conveyance in the unlined watercourses (that too public owned) further restricts the competition in ground water marketing.
Private tube wells are a big source to augment surface supplies and consumptive use of water. These tube wells are energized through electricity and diesel. Until recently, the electric tube wells have been running on flat rate basis, which has caused over-exhaustion of the aquifer. This calls for a preventive regulation in order to preserve and manage ground water efficiently. Majority (nearly 85 percent) of tube wells are owned by the big landlords. The small farmers and land less poor can be provided incentive to install tube wells and sell water for additional income, These tube wells should be allowed to install at the head of the distributaries or at the head of the water course so that tube well owner find wide niche markets down stream. This has been successfully practiced in Bangladesh under the auspices of “Grameen Bank”. However it seems imperative to invoke rural regulation for ground water development and its proper management to avoid over drafting the aquifer.

© European Journal of Scientific Research, Vol 9, No 2, 2005
VII) SCOPE OF FORMAL WATER MARKETS IN PAKISTAN
In Pakistan, there has been no clear policy statement in favor of groundwater markets. At the same time, though there is no legal basis for informal markets to exist and function, the government has followed a benign policy of non-interference vis-à-vis such markets. In such a policy and regulatory framework, informal markets are emerging and serving a useful purpose water allocation in scarce situation. Why there is a need formal market? Some of the major benefits that a formal market is expected to yield are:
• Many regions of the world are switching to water markets as best alternative to allocate water among the competing sectors. When the irrigators can buy and sell water at will, they have to choose to use allocated water supply more carefully. For instance, if farmers use water more efficiently, they can increase their incomes by trading the water they save. The formal market would enable water transfers to take place among farmers on a greater scale and also between competing sectors, thus allowing a reallocation of water to higher productive use Farmers can choose to grow less thirsty crops; they are at liberty to sell the water they no longer require. The inter-Sectoral transfer would enable the nation to defer lumpy investment on costly dams and reservoirs or any other huge hydraulic structure.
• Secondly, given the fragmented structure of the informal markets; water trading cannot be regulated. Therefore, in formal water market having well defined property rights, trading can easily be regulated. The regulated water markets can lead to mitigate the spill over effects of trading such as aquifer over draft or monopolistic situation and or equity and efficacy issues, more effectively.
• Thirdly, formal markets, having explicit water right system, can encourage potential investors and water users in gaining ensured long-term access to water This is one of the important pre-conditions to fetch private investment or direct foreign investment into the resource starved water sector of the country.
• Fourthly, formal water markets and exclusive property rights minimize transaction costs involved in water trading. These costs include monitoring and implementation costs, conveyance costs, design costs and rent seeking. The small transaction costs would provide cost advantage to water trade and thereby expanding the scope of the water market.
• Finally, formal water market will empower small and poor farmers who will gain water rights, which can serve as additional collateral for getting agricultural credit.
VIII) IMPLICATIONS FOR AGRICULTURAL PRODUCTIVITY
Data on water use and crop incomes suggest that large gains in average water productivity may be possible through shifts in cropping patterns induced by increasing the opportunity cost of water to farmers. The average net income of water for IRRI rice in Punjab is only Rs.47/acre-inch of water compared to Rs.215 for cotton. The corresponding figures for Sindh are Rs.66 for IRRI rice and Rs.361 for cotton. Increases in the opportunity cost of water for IRRI rice farmers through the opportunity to sell water rights could promote more efficient use of water in IRRI rice cultivation, as well as increase

© European Journal of Scientific Research, Vol 9, No 2, 2005
incentives and water availability for cultivation of less water-intensive crops. Similarly, better allocation of water could even bring about an increase in area cultivated in some regions. For example, because of uncontrolled direct outlets in the Nara Canal in Sindh, the command area has increased by 30 percent, leaving large areas in the tail portion of the canal without sufficient water. Increasing water availability to tail-end farmers could also have large effects on productivity. Crop yields o f rice and wheat are 1.3 to 1.5 times higher at the tail of canals than at the head; sugar cane yields are 1.9 times higher at the tail than at the head.
Increased availability of groundwater could have even greater effects. Meinzen-Dick (1996) showed that groundwater has a higher impact on wheat yields than canal water, and that water markets that increased groundwater available to farmers who do not own tube wells clearly increased the level of agricultural productivity. Water from own wells was even more productive, most likely because of the less regular availability of purchased water.
Analysis of PRHS 2002-03 data on groundwater use per acre at the plot level suggests that markets for tube well water markets do not function efficiently. Controlling for tube well availability, plots cultivated by tube well-owning households have a 15 to 17 percent higher utilization rate than do households without tube wells. If tube well markets functioned efficiently, water sales would result in a smaller difference in water use between owners of tube wells and buyers o f tube well water. The estimated impact on productivity is very large and highly significant in the rabi season: ownership of a tube well, controlling for access of a plot to a tube well (whether owned or not) raises wheat yields by 30 percent and rabi season net revenues by 83 percent.
© European Journal of Scientific Research, Vol 9, No 2, 2005
IX) PROBLEMS LIMITING GROUNDWATER MARKET DEVELOPMENT
Water markets are largely autonomous, indigenous institutions that are likely to continue functioning with out a great deal of official intervention. These clearly play an important role in expanding access to critical groundwater resources in Pakistan. Because access to such groundwater is not tied to rigid warabandi schedules and the unreliability of canal irrigation supplies, water markets also increases farmers’ control over irrigation. Despite the advantage of water markets, there are some problems which are encountered with the development of groundwater markets which are as under.
1. The main constraint for groundwater market development is the renewable groundwater supplies that place limits on the number of tube wells that can be installed and operated in a sustainable manner. A growing number of areas are already experiencing net groundwater withdrawals and falling water tables. In Punjab as a whole, pumpage exceeds recharge by more than 25 percent (NESPAK, 1991). This means that providing a tube well for every farm is not a viable solution in the long run.
2. There is ample evidence of decline in groundwater table caused by competitive water withdrawal due to intense water marketing activities and mushroom growth of private tube well which has increased 5 times since the 1970 in Pakistan. Under the current legal system, there is `open access' to groundwater and the access to groundwater is governed by de facto water rights system. As long as this is the case, overexploitation of groundwater cannot be avoided, since water price tends to reflect pumping costs and other related factors, and does not fully capture the scarcity value of groundwater. The problem is compounded by electricity subsidy especially in Balochistan province. In Balochistan, until recently the electricity is charged on a flat rate basis; which encourages over-pumping and fugitive use of groundwater. In addition to reducing ecological sustainability, one important side effect of this phenomenon is that poor farmers who do not have the resources to deepen their wells; are driven out of farming
3. The degree of water control afforded to groundwater purchases is not as great as that of tube well owners. Tube well owners treat water sales as a residual category to be met after serving the needs of their own fields. Groundwater sale are generally not a commercial enterprise in which sellers have an interest in meeting the needs of their clientele. As a result water purchasers can not rely on getting as much water as they need and when they need it. Purchased tube well water is therefore, not as productive as water from own tube wells.
4. Lined watercourses and pipes ensure that water purchasers receive more of the water they pay for from the tube well and permit sales to a wider potential number of fields from each tube well. Lined conveyance structure thus goes hand in hand with the development of more competitive groundwater markets. Despite these advantages for groundwater markets, there has been little private investment in lining or pipes in Pakistan. In most cases, the field channels are only lined for the first 20 meters from the tube well, which is done primarily to absorb the energy of the tube well water being pumped into the channel.
5. Farmer’s use watercourses for tube well water despite the Canal and Drainage Act provision that all who do so are assessed the water rate for canal irrigation use. A NESPAK (1991) study suggests that this law restricts the sale of tube well water. The Canal and Drainage Act further restricts transporting tube well water by prohibiting farmers from carrying water across public watercourses.

© European Journal of Scientific Research, Vol 9, No 2, 2005
X) CONCLUSION AND RECOMMENDATIONS
The water market transactions have been taking place in many countries including Pakistan. The informal water markets have been in place since decades, formal markets with well defined, private and transferable water rights in the developed countries are of relatively recent phenomena. These well developed water markets in Chile, Western USA and Australia have provided significant gains from water trading, particularly from trades between agricultural and urban users when water gets reallocated to more productive uses. In many cases, water trading and marketing has helped to overcome water shortages. The formal and well developed water markets have provided incentives for the conservation and more efficient use of irrigation water. The, farmers have switched to water-saving technologies (drip and sprinkle irrigation) and high-value, less water consumptive crops.
The recent evidence shows that informal markets are developing over time and canal water is freely traded, often sold and bought. The survey results reveal that 6-7 percent of the sampled farmers buy and sell water at head and 20 percent sell water at the tail end of the distributaries. However, over 80 percent of head and middle farms trade water. The canal water rate varies from $ 2-$ 3 per hour mostly to neighboring farmers. The sale of ground water is quite common and due to short supplies of surface water; conjunctive use of water is increasing. Almost all tube well owners at and head middle reaches sell water, where as over 50 percent tail enders sell water. The tube wells water rate varies from $ 1.00 per hour to $ 3.00 per hour The distance over which water can be transported provides a limitation to water market sales, but lined watercourses increase the distance over which tube well water can be sold.
The Pakistani experience with informal water markets has been encouraging, although there have been only limited gains as markets have remained informal, localized and fragmented. The informal markets are at their infancy. The existing water distribution through warabandi coupled with tandem water and land rights, have restricted the development of these markets. The current irrigation law prohibits water trading of surface supplies and creates barrier to entry in the market. In spite of mushroom growth of tubewells, ground water markets are characterized as fragmented and spatial in nature. The current land and water laws also serve as barrier to entry in ground water market which arise from the fact that farmer must own a piece of land above an aquifer before sinking a well or tube well.
Pakistan is soon becoming a water poor country; therefore, country should alternate option for water use. The development and encouragement water market is one plausible option. The earlier studies and recent evidence provide credence to the argument that informal markets are growing in Pakistan. The informal markets are quite common, water sale and buying is taking place among fellow farmers. The trading of canal water is also on the rise at the head and the middle reaches and sale of canal water is noticed at the tale ends. The groundwater marketing is also creating water table draw down. Water trading and formal market can generate additional gains through better water use. Therefore it is high time that policy makers move and encourage formal water marketing mechanism both at the surface and ground water level.
A growing number of areas are already experiencing falling water tables. In Punjab as a whole, 25 percent more groundwater is being pumped out of the ground than is being recharged. A tubewell for every farm is clearly not a viable option. Consequently, policies must be adapted to local conditions. Where good quality groundwater supplies are abundant, policies to make tubewell ownership possible for more owners should be promoted, but where tubewells are limited, policies to encourage water markets should take priority.
© European Journal of Scientific Research, Vol 9, No 2, 2005
1. Policies should be targeted to medium-sized farms because these farmers are more likely to be able to buy a tubewell than farmers with small holdings, and they are more interested in selling water than large farmers, who are likely to use all of the water from a tubewell for their own land.
2. Before water markets are established for reallocation, there must first be clear property rights to water separate from land ownership, and those rights must be tradable.
3. Policies should include credit access to help less affluent farmers finance wells and pump sets. Credit for tubewell purchase is already available for small and medium-sized farms in Pakistan; however the access to credit is skewed to wards large farmers. The farmers being uneducated farmers often do not take advantage of institutional credit with lower interest rates. Furthermore small farmer’s size of holding does not meet the collateral requirements of tubewells, hence assigning of property right of water seems imperative for mortgage purposes. Procedures and application forms should be simplified, and barriers to small farmers receiving credit should be removed.
4. Policies that encourage farmers to acquire private tubewells must be approached with caution, however. The number of tubewells that can be operated sustainably in a given area is limited by the available recharge for groundwater resources. In areas experiencing problems with water quality or quantity, tubewell density must be limited to avoid environmental degradation.
5. Farmers should be encouraged to join together to purchase, install, and operate tubewells as shared enterprises. Joint ownership enables small farmers to acquire rights to water and increases the chance of tapping into good quality water. Group wells are also more efficient economically. Shared ownership is likely to become more important for equitable allocation as supplies become scarcer. In addition to policies to provide credit and technical assistance to groups, information on arrangements for sharing water and expenses and for conflict management should be provided.
6. Existing regulations should be modified to permit farmers to convey groundwater through watercourses used for surface irrigation, as long as they do not interfere with canal deliveries or cause deterioration of the infrastructure.
7. Technical assistance programs for farmers who wish to invest in a tubewell are valuable in helping farmers to locate pockets of fresh water, avoiding saline areas. Information on water tables and sustainable withdrawals should be made available at the local level, to assist farmers and government officials in making appropriate decisions on resource use.
8. There is an-other option of trading water through a Water Bank. An irrigator (or a water user) “deposits” water in the bank with the hope that another user will rent that water at a price that yields a profit for the depositor. The “bank” is run by a Provincial Irrigation and Drainage Authorities (PIDA’s), a state agency or some other entity that can effectively manage the process, including setting the rental terms and conditions.
9. Although purchased water makes a significant contribution to agricultural productivity, there is still a decided productivity gap between farmers who purchase groundwater and those who own their own wells. To improve the reliability of groundwater markets, more research is needed to identify incentives for sellers and factors that promote more equitable sharing of groundwater resources.
10. The is a need to review and update the 121-years Canal and Drainage Act, to integrate features of the current conjunctive use environment with existing canal water transactions.

© European Journal of Scientific Research, Vol 9, No 2, 2005
11. There is also need for the careful assessment of the equity dimension related to the process and the possible involvement of effective farmer’s organizations into this process.
12. An efficient management of the groundwater extraction process is needed taking into account water transactions because groundwater sources are being depleted with the passage of time.

© European Journal of Scientific Research, Vol 9, No 2, 2005
REFERENCES Aggarwal, Rimjhim M. 1999. "Risk Sharing and Transaction Costs in Groundwater Contracts: Evidence
from Rural India", Mimeo, University of Maryland, College Park, Maryland.
Agricultural Prices Commission 2003, Cost of Production series data for various crops, Ministry of Food, Agriculture and Livestock, Government of Pakistan, Islamabad
Ahmad, B, et al 1991-92 National Input Output Survey Data, Department of Farm Management, University of Agriculture, Faisalabad
Bajwa, A. R., and C. B. Ahmed. 1991. Trading of Canal and Tube well Water for Irrigation purposes. Lahore, Pakistan: Water and Power Development Authority, Lahore
Bauer Carl J. 1997. “ Bring Water Markets Down to Earth; The Political Economy of Water Rights in Chile 1976-95, World Development, 25(5): 639-656 Agriculture Statistics of Pakistan
Brajer, V., A. Church, R. Cummings, and P. Farah. 1989. “The Strengths and Weaknesses of Water Markets.” The Natural Resources Journal. 29. 489-509.
Colby Saliba, B. and D. Bush. 1987. Water Markets in Theory and Practice. West View, Boulder, Co.
Dinar, A. and J. Letey. 1991. “Agricultural Water Marketing, Allocative Efficiency, and Drainage Reduction.” Journal of Environmental Economics and Management. 20:210-223.
Easter, K. W. and R. Hearne. 1995. “Water Markets and Decentralized Water Resources Management: International Problems and Opportunities.” Water Resources Bulletin. 31:9-20.
Easter, K. William, Ariel Dinar and Mark W. Rosegrant. 1998. "Water Markets: Transaction Costs and Institutional Options," in K.W. Easter et al. (eds.), Markets for Water: Potential and Performance.
Government of West Pakistan, 1970. Report of the Water Allocation and Rates committee (Main Report, Provincial Irrigation Department, Lahore
Government Pakistan, 2003 Economic Survey of Pakistan, Ministry of Finance and Economic Affairs Govt. of Pakistan, Islamabad
Government Pakistan, Agriculture Statistics of Pakistan, Ministry of Food, Agriculture and Livestock. Various Issues. (1999, 2000, 2001 and 2002), Islamabad. Govt. of Pakistan
Hearne, R. and K.W. Easter. 1995. Water Allocation and Water Markets: An Analysis of Gains-From-Trade in Chile. World Bank Technical Paper Number 315. The World Bank.
Hearne, R. and K.W. Easter. 1997. “The Economic and Financial Gains from Water Markets in Chile.” Agricultural Economics. Forthcoming.
Janakarajan, S. 1993. "Triadic Exchange Relations: An Illustration from South India", Institute of Development Studies24 (3):75-82.
Janakarajan, S. 1994. "Trading in Groundwater: A Source of Power and Accumulation", in M. Moench (ed), Selling Water: Conceptual and Policy Debate Over Groundwater in India, VIKSAT/ Pacific Institute/ Natural Heritage Institute, Ahmedabad.
Kahnet, F., and G. Levine, eds. 1993. Groundwater Irrigation and the Rural Poor: Options for Development in the Gangetic Basin. Washington, D.C.: World Bank.

© European Journal of Scientific Research, Vol 9, No 2, 2005
Meinzen-Dick, R and M Sullins. 1994. “Water Markets in Pakistan: Participation and Productivity.” EPTD Discussion Paper No. 4. IFPRI. Washington, D.C.
Meinzen-Dick, R. 1996. "Groundwater markets in Pakistan: participation and productivity." IFPRI Research Report No. 106, Washington DC.
Meinzen-Dick, Ruth (1996) Public, Private, and Shared Water: Groundwater Markets and Groundwater Access in Pakistan: Presented at a conference” Voices from the Commons," the Sixth Annual Conference of the International Association for the Study of Common Property, Berkeley, CA, June 5-8, 1996
Moench, M., ed. 1994. Selling water: Conceptual and Policy Debates Over Groundwater Markets in India. Gujarat, India: VIKSAT, Pacific Institute, National Heritage Institute.
Moench, Marcus H (1992) 'Chasing the Water table: Equity and Sustainability in Groundwater Management', Economic and Political Weekly, December 19-26
NESPAK (National Engineering Services, Pakistan). 1991. Contribution of Private Tube wells in the Development of Water Potential. Final Report. Lahore, Pakistan: Ministry of Planning and Development.
Rosegrant, M. and H. Binswanger. 1994. “Markets in Tradable Water Rights: Potential for Efficiency Gains in Developing Country Water Resource Allocation.” World Development. 22(11):1613-1625.
Rosegrant, M. and R. Gazmuri. 1994. Reforming Water Allocation Policy through Markets in Tradable Water Rights: Lessons from Chile, Mexico, and California. EPTD Discussion Paper No. 6. International Food Policy Research Institute.
Saleth, Maria R (1993) Efficacy of Power Tariff as an Instrument of Groundwater Management: Implications for Sustainability, Efficiency and Equity, presented at the Workshop on Co-management of Power and Groundwater: Issues in Sustainability and Equity" at Tata Energy Research Institute Delhi, 12-13 February.
Saleth, R. Maria. 1999. "Water Markets in India: Economic and Institutional Aspects," in K.W. Easter et al. (eds.), Markets for Water: Potential and Performance
Shah Tushaar and Intizar Hussain 2002, Groundwater Markets in South Asia: An Overview of Policy Issues and Options, paper in draft): International Water Management Institute Sri Lanka, Colombo
Shah, T. 1993. Groundwater Markets and Irrigation Development: Political Economy and Practical Policy. Oxford University Press. Oxford.
Thobani, M. 1997. Formal Water Markets: Why, When and How to Introduce Tradable Water Rights in Developing Countries. The World Bank Research Observer. Volume 12, Number 2.
WAPDA (Water and Power Development Authority). 1990. Trading of Canal and Tube well Water for Irrigation Purposes, Lahore, Pakistan: WAPDA.
World Bank. 1984. Public and Private Tube well Performance: Emerging Issues and Options. Pakistan Sub-sector Report. Washington, D.C.: World Bank.
World Bank. 2004. Pakistan Rural Factor Markets: Policy Reforms for Growth and Equity. Rural Development Unit, South Asia Region, Report. Washington, D.C: World Bank.

© European Journal of Scientific Research, Vol 9, No 2, 2005
CLUSTERING USING A MODIFIED KRUSKAL ALGORITHM
ISSAM A.R. MOGHRABI [email protected]
Faculty of Science, Beirut Arab University, Beirut, Lebanon


© European Journal of Scientific Research, Vol 9, No 2, 2005
65
ABSTRACT In this paper, we present a new technique for clustering documents in a Bibliographic Information Retrieval environment (BIR) through solving a combinatorial optimization problem, the Traveling Salesman Problem (TSP) more efficiently than some of the well-known leading techniques in this area, the Guided Local Search technique (GLS). Our technique uses a tailored Minimum Spanning Tree (TMST) technique and constructs the shortest path one segment at a time. The time complexity for the GLS is of O (e * s), where e is the number of edges connecting the nodes and s is the number of iterations while our algorithm is O (e * log2e). Experiments are conducted using both techniques and the corresponding results reported. Keywords: GLS, TSP, MST 1. INTRODUCTION It has been shown that the problem of clustering documents in the vector space may be formulated as a TSP (see []) and hence algorithms used to solve such an NP-hard problem may be employed. The simplest approach to solve a NP-hard optimization problem is to list all the feasible solutions, evaluate their corresponding objective function values and choose the best. This approach of complete enumeration, although widely applicable, is not practical because of the vast number of possible solutions to any problem of reasonable size. Many constrained optimization problems are solved using complete methods such as the branch and bound [1][2][3]. But due to their combinatorial explosion nature, completeness is sacrificed by using different methods such as Hill Climbing. However, Hill Climbing may settle in local optima. Many methods have been proposed to overcome this problem such as Simulated Annealing [4][5] [6], Tabu [7][8][9] and Guided Local Search (GLS) [10]. GLS has demonstrated practical superiority over other methods used to solve the problem of the TSP. The algorithm is a generalization of the GENET computation models [11][12][13]. However, in our work we demonstrate how more efficient algorithms could be devised by adjusting some of the Minimum Spanning Tree algorithms, such as Kruskal’s. This paper presents a new technique for solving TSP and compares its results to a principal technique in this area, the GLS. 2. GUIDED LOCAL SEARCH GLS (See [10] for a more detailed description) is a meta-heuristic based on Local Search. Local search is the basis of many heuristic methods for combinatorial optimization problems. When the given Local Search algorithm settles in local optimum, GLS changes the objective

© European Journal of Scientific Research, Vol 9, No 2, 2005
66
function in order to bring the algorithm out of local optimum neighborhood. The key is in the way the objective function is modified. GLS employs solution features to distinguish between solutions with different characteristics, so that bad characteristics can be penalized, and hopefully avoided by the local search algorithm. The choice of solution features depends on the type of the problem, and als=o, to a certain extent, on the local search algorithm. A feature fi is represented by an indicator function in the following way:
Associated with a feature is a cost function c(s), which gives the cost of having the feature present in a solution and a penalty pi, initially set to zero, used to penalize occurrences of the feature, in local minima. When the Local Search algorithm returns a local minimum, �, which is not a legal solution, GLS increments the penalty of all the features present in that solution which have maximum utility, util(�,fi), as defined by util(�,fi) = [Ii(�) . ci(�)]/ (1+pi) . The idea is to penalize features, which have high costs, although the usefulness of doing so decreases as the feature is penalized more and more. Local Search is guided out of the local minimum by using an augmented cost function. The idea is to make the local minimum more costly than the neighboring search space, where these features are not present. The augmented cost function is defined as follows: h(�) = g(�) + �� pi . Ii(�), for i = 1 to n. The strengthening of the search for solutions is controlled by the parameter �. A low value will result in a more concentrated search for the solution, where the basins and plateaus in the search landscape are searched with more care. A higher value for � will result in a more diverse search, where plateau and basins in the search are searched less carefully. 2.2 CLUSTERING USING GLS Let G = <N, e> be a connected graph where N is the set of nodes (documents) and e is the set of edges. An edge represents the distance (similarity, or otherwise) between two documents. The lengths of the edges are represented in a symmetric distance matrix D = [distance(i,j)] which gives the distance between any two nodes i and j. It is essential here to determine the features of the problem that GLS will use to determine its next move. The goal of GLS, in this paper, is to find a tour which visits each document exactly once and is of minimum length. This tour includes

© European Journal of Scientific Research, Vol 9, No 2, 2005
67
a number of edges and the solution cost (tour length) is given by the sum of the lengths of the edges in the tour. Therefore, edges are ideal features for our problem. Local search starts from an arbitrary solution to find a local minimum. The basic GLS algorithm is outlined in figure 1. GLS increments the penalty of all the features present in a local minimum solution which have maximum utility, util(�,fi). Therefore, each edge eij connecting documents i and j is assigned a penalty (i,j), initially set to 0, and GLS will penalize the edges that appear in the local minimum, using the utility function. The edge penalties can be arranged in a symmetric penalty matrix P=[penalty(i,j)]. Due to symmetry, only n (n – 1) / 2 components need be shown. Penalties have to be combined with the problem’s cost function to form the augmented cost function which is minimized by local search. This can be done by considering the auxiliary distance matrix: D� = D + ��P = [distance(i,j) + ��penalty(i,j)] . Local search must use D� instead of D in move assessments. GLS modifies P and (through that) D whenever local search reaches a local minimum.

© European Journal of Scientific Research, Vol 9, No 2, 2005
68
After the penalties have been increased, local search is restarted from the last local minimum to search for a new local minimum. This is repeated until a termination criterion is satisfied. In the general case, the criterion is either a maximum number of iterations or a time budget [14]. 3. THE MODIFIED KRUSKAL ALGORITHM Problems of minimum spanning trees are covered in details in [15]. The first algorithm discussed is due to Boruvak [16]. The Prim algorithm was introduced by Jarnik [17] and was rediscovered by Prim and Dijkstra [18] [19]. Other sophisticated algorithms include Kruskal’s [20] and the one given by Yao, Cheriton and Tarjan [21] [22] [23]
Kruskal’s algorithm seems to be the most suitable to our purposes here. It works in two phases. First, the edges of the graph are sorted. Second, the edges are added one by one to a partial graph until a minimum spanning tree is formed [24]. We consider the documents to be clustered as the nodes in the graph. The edge between the nodes represents the Hamming Distance between some two documents. The Hamming Distance between two documents di and dj and is given by HD(di,dj) = Σk f(aik, ajk),
© European Journal of Scientific Research, Vol 9, No 2, 2005
69
where f(aik, ajk)=1 if aik = ajk and 0 otherwise.
Kruskal's algorithm is implemented using disjoint set structures [24]. In a disjoint data structure, the edges are numbered from 1 to n – 1, where n is the number of documents. The edges are to be grouped into disjoint sets, so that at any given time each edge is in exactly one set. In each set we choose one member to serve as a label for the set. For instance, if we decide to use the first edge as the label, then we can refer to the set {edge2, edge 5, edge 7, edge 10} simply as “set edge 2”. Initially the n – 1 edges are in n – 1 different sets, each containing exactly one edge. Two operations have to be carried out: find(x), where given some node, it finds which set it is contained in, and returns the label of that set, and merge(A, B), where given two different labels, it merges the contents of the two corresponding sets, and chooses a label for the combined set. Some modifications will be applied to the Kruskal algorithm in order to limit the number of edges for each node to a maximum of two in order to obtain a single path that minimally traverses all the documents rather than a minimum spanning tree. The modified algorithm is outlined in Figure 2. We have added to the algorithm an array block where each element in the array represents the number of edges connected to a node. To preserve the shortest path property, where each node is connected to maximum two edges, the values in the array should not exceed two. The array is first initialized to zero. As the algorithm progresses, edges, with two nodes u and v connected to the edge, are added to a partial graph as long as: 1- The maximum number of edges connected to each of the two nodes u and v is less than 2 (see line 13 in figure 2). 2- The nodes u and v are in different sets.

© European Journal of Scientific Research, Vol 9, No 2, 2005
70
At the conclusion of the algorithm, only one connected component remains, which is a single path that traverses all the documents.
4. AN EXAMPLE The following example illustrates how the shortest path is constructed. Consider the symmetric distance matrix in Figure 3. The first step in the algorithm is to sort the edges in an ascending order (Figure 4).

© European Journal of Scientific Research, Vol 9, No 2, 2005
71
The new version of Kruskal’s algorithm traverses all edges in order to construct the shortest path. Figure 5 shows the edges retrieved and the connectivity for each one.
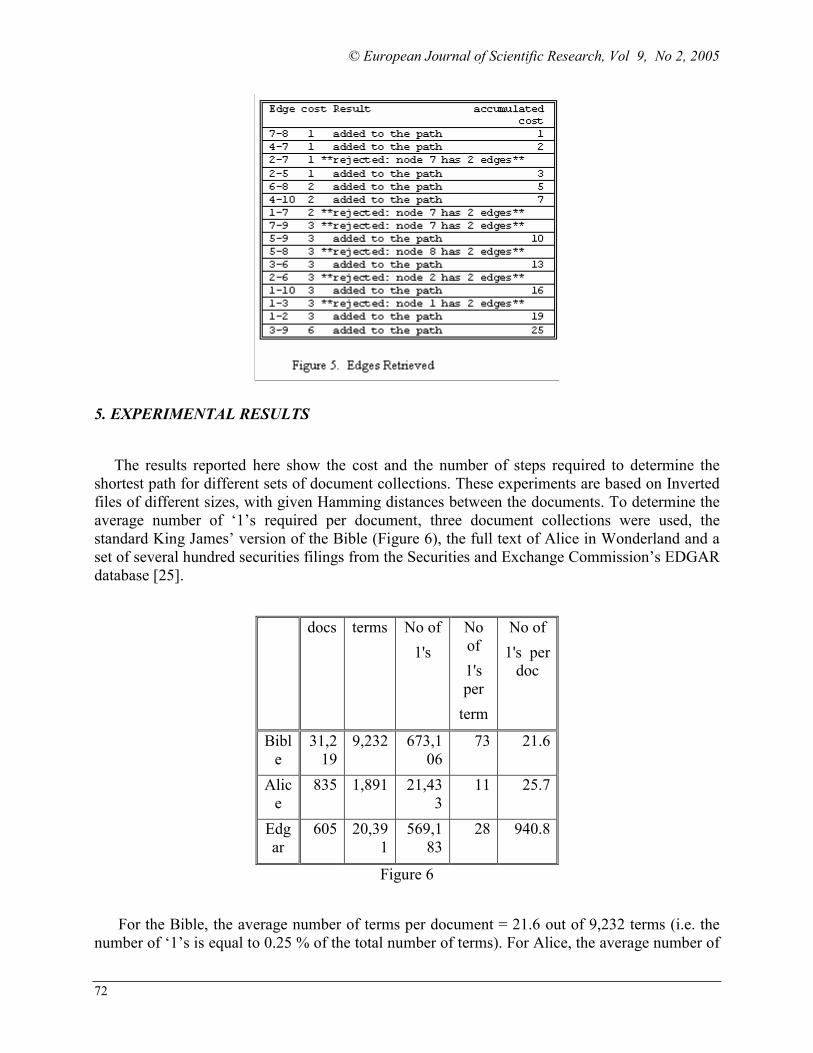
© European Journal of Scientific Research, Vol 9, No 2, 2005
72
5. EXPERIMENTAL RESULTS
The results reported here show the cost and the number of steps required to determine the shortest path for different sets of document collections. These experiments are based on Inverted files of different sizes, with given Hamming distances between the documents. To determine the average number of ‘1’s required per document, three document collections were used, the standard King James’ version of the Bible (Figure 6), the full text of Alice in Wonderland and a set of several hundred securities filings from the Securities and Exchange Commission’s EDGAR database [25].
docs terms No of 1's
No of 1's per
term
No of 1's per
doc
Bible
31,219
9,232 673,106
73 21.6
Alice
835 1,891 21,433
11 25.7
Edgar
605 20,391
569,183
28 940.8
Figure 6
For the Bible, the average number of terms per document = 21.6 out of 9,232 terms (i.e. the number of ‘1’s is equal to 0.25 % of the total number of terms). For Alice, the average number of
© European Journal of Scientific Research, Vol 9, No 2, 2005
73
terms per document = 25.7 out of 1,891 terms (i.e. the number of ‘1’s is equal to 1.40 % of the total number of terms). For EDGAR, the average number of terms per document = 940.8 out of 20,391 terms (i.e. the number of ‘1’s is equal to 5.00 % of the total number of terms). The average number of terms is = 2.5 % (average of 0.25%, 1.40% and 5.00%) of the total number of terms. Therefore, 2.5% of the terms were assigned randomly to each document. GLS and Kruskal algorithms run in O (e * s) and O (e * log2e), respectively, where e is the
number of edges connecting the nodes and s is the number of steps required by the GLS to find
the near-optimal solution. A new parameter S that represents the s value in the GLS algorithm
and log2e in the TMST technique has been introduced to compare the speed of both algorithms.
The results are reported in Tables 1, where, for each inverted file (I.F.), the cost returned by the
GLS and the TMST are shown with the corresponding S factor. The TMST technique
outperforms the GLS in most of the cases, especially when the number of nodes increases (figure
7). However, the number of steps required by GLS to determine the best solution is very large in
most of the cases tested.
6. CONCLUSIONS We have presented in this paper a new technique to solve a combinatorial clustering problem, the TSP, by adjusting the Kruskal’s Minimum Spanning Tree algorithm and compared its results to a well-known method that has been used to solve the same problem, namely the GLS. The new technique outperforms the GLS in most of the cases in terms of effectiveness and execution time as our experimental results reveal.

© European Journal of Scientific Research, Vol 9, No 2, 2005
74
© European Journal of Scientific Research, Vol 9, No 2, 2005
75
REFERENCES
[1] E.W. Lawler and D.E. Wood, ``Branch-and-bound methods: a survey'', Operations Research 14,
699-719 (1966) [2] P.A.V. Hall, ``Branch and bound and beyond'', Proc. International Joint Conference on AI,
641-650 (1971) [3] E. M. Reingold, J. Nievergelt, and N. Deo, Combinatorial algorithms: theory and practice,
Englewood Cliffs, N.J., Prentice hall, (1977) [4] E. Aarts and J. Korst, Simulated Annealing and Boltzmann Machines, John Wiley & Sons, 1989 [5] L. Davis (ed.), Genetic algorithms and simulated annealing, Research notes in AI,
Pitman/Morgan Kaufmann, 1987 [6] R.H.J.M. Otten and L.P.P.P. van Ginneken, The annealing algorithm, Kluwer Academic
Publishers (1989) [7] F. Glover, “Tabu search Part I“, ORSA Journal on Computing 1, 109-206 (1989) [8] F. Glover, “Tabu search Part II“, ORSA Journal on Computing 2, 4-32 (1990) [9] F. Glover, E. Taillard, and D. de Werra, ”A user's guide to tabu search”, Annals of Operations
Research, Vol.41, 1993, 3-28 (1993). [10] C. Voudouris. Guided Local Search for Combinatorial Optimisation Problems. PhD thesis,
Department of Computer Science, Univerisy of Essex, Colchester, UK, 1997 [11] C.J. Wang and E.P.K. Tsang, “Solving constraint satisfaction problems using neural-networks”,
Proceedings of IEE Second International Conference on Artificial Neural Networks, 295-299 (1991)
[12] A. Davenport, E.P.K. Tsang, C.J. Wang and K. Zhu, “GENET: a connectionist architecture for solving constraint satisfaction problems by iterative improvement”, Proc., 12th National Conference for Artificial Intelligence (AAAI), 325-330 (1994)
[13] C. Voudouris and E.P.K. Tsang, ”Guided Local Search”, Technical Report CSM-247, Department of Computer Science, University of Essex (1995) [14] C. Voudouris and E. Tsang. Tunneling Algorithm for Partial CSPs and Combinatorial
Optimization Problems. Technical Report CSM-213, Department of Computer Science, University of Essex, Colchester, UK, 1994.
[15] Graham, Ronald L. and Pavol Hell (1985), “On the history of the minimum spanning tree problem”, Annals of the History of Computing, vol. 7, no. 1, pp. 43-57
[16] Boruvka, Otokar (1926), “Ojistem problemu minimalnim”, Parce Moravske Prirodoved Spoleknosti, vol. 3, pp. 37-58
[17] Jarnik, V. (1930), “Ojistem problemu minimalnim”, Prace Moravske Prirodoved Spolecnosti, vol. 6, pp. 57-63
[18] Prim, Robert C. (1957) “Shortest Connection Networks and some generalizations”, Bell System Technical Journal, vol. 36, pp. 1389-1401

© European Journal of Scientific Research, Vol 9, No 2, 2005
76
[19] Dijkstra, Edgsger W. (1959) “A note on two problems in connection with graphs”, Numerische Mathematik, vol. 1, pp. 269-271 [20] Kruskal, Joseph B., Jr. (1956), “On the shortest spanning subtree of a graph and the traveling
salesman problem”, Proceedings of the American Mathematical Society, vol. 7, no. 1, pp. 48-50
[21] Yao, Andrew C.-C. (1975), “An O(|E|loglog|V|) algorithm for finding minimum spanning trees”, Information Processing letters, vol. 4, no. 2, pp. 21-23
[22] Cheriton, David and Robert E. Tarjan (1976), “Finding Minimum Spanning Trees”, SIAM Journal on Computing, vol. 5, no. 4, pp. 724-742
[23] Tarjan, Rpbert E (1983) Data structures and Network Algorithms SIAM [24] Cormen, T.H., & Leiserson C.E., (2nd edition.). (2001). Introduction to Algorithms. MIT
press and McGraw-Hill [25] Fray R. (1996). Global Methods for Inverted File Compression, University of Colorado at
Denver Larson, R.R,