Food safety regulation in Bangladesh, chemical hazard and ...
Upload
khangminh22Category
view
0download
0
Molecular Spectroscopy Compendium
ENSURE FOOD QUALITY, PRODUCTION, AND SAFETY

The table of contents below has been linked to the individual sections in this compendium. Click on the text to jump to a specific section. Identify targets and unknowns in food matrices ...................................................3Get precise, accurate answers with Agilent Molecular Spectroscopy Instruments ........................................................4Agilent FTIR Instruments .............................................................................................5Agilent FTIR Application Notes ..................................................................................8
Fast, Effective Evaluation of Edible Bird Nests UsingThe Handheld Agilent 4100 ExoScan FTIR (5990-9789EN) ..................................................9In Situ Screening of Quality Traits in Tomato Cultivars Using the Handheld 4200 FlexScan FTIR Spectrometer (5991-0003EN)...........15QA/QC of Dairy Powders Using the Agilent Cary 630 ATR-FTIR Analyzer (5991-0784EN) ..................................................................21QA/QC of Flours Using the Agilent Cary 630 ATR-FTIR Analyzer (5991-0785EN) ..................................................................25QA/QC of Sugars Using the Agilent Cary 630 ATR-FTIR Analyzer (5991-0786EN) ..................................................................29QA/QC of Tea Using the Agilent Cary 630 ATR-FTIR Analyzer (5991-0787EN) ..................................................................35At-Site Screening and Measurement of Adulterant Levels in Bovine Milk by Mid FTIR Spectroscopy (5991-1953EN)............................41Pesticide Authentication by Portable FTIR Spectroscopy (5991-2531EN).......................................................................................................45Measurement of Acrylamide in Potato Chips by Portable FTIR Analyzers (5991-2532EN) ........................................................51Determination of Phosphorus Concentration in Hydroponics Solution (SI-A-1121) ....................................................................57Validation of a Leaf Reflectance and Transmittance Model for Three Agricultural Crop Species (SI-A-1194) ............................63
Agilent UV-Vis/Fluorescence Instruments ..............................................................69 Agilent UV-Vis/Fluorescence Application Notes ...................................................71
Determination of Phosphorus Concentration in Hydroponics Solution (SI-A-1121) ....................................................................72Validation of a Leaf Reflectance and Transmittance Model for Three Agricultural Crop Species (SI-A-1194) ............................78
In this compendium, you’ll find current and emerging applications that will help you identify both target and non-target molecules by applying the very latest techniques for spectral data gathering.
TABLE OF CONTENTS
To search for words or phrases used in any of the enclosed
Application Notes, click on the Search button below to open
Acrobat’s Search window.
SEARCH
To learn more about Agilent food safety technologies and applications, visit
agilent.com/chem/food2
FTIR, UV-Vis, and fluorescence spectrometers deliver sensitive, productive analyses from farm to fork Short analysis times, limited sample preparation, and the ability to determine molecular structure make molecular spectroscopy ideal for many food analysis tasks:
Authenticating ingredients• Verify identity by searching spectral databases• Measure authenticity and alcohol content in spirits, liquors, and wine• Confirm quality and authenticity of edible oils, syrups, and dairy products
Ensuring product quality• Make sure food coloration is within specification • Perform critical measurements, such as:
◦ Antioxidant and vitamin levels ◦ Levels of trans fats and free fatty acids ◦ Quality traits in vegetables and fruits ◦ Oxidation and its relationship to rancidity ◦ Levels of acrylamide, and other unwanted by-products of food processing
• Research and control the quality of packaging materials• Identify extraneous micro-contaminants and particles
3
IDENTIFY TARGETS AND UNKNOWNS IN FOOD MATRICES
Widespread globalization has increased the pressure to meet stringent standards for quality, safety, and cost effectiveness throughout the food production chain – including incoming inspection, new product development, and packaging.
(Continued)

New research, production, and quality-control applications for FTIR, UV-Vis, and fluorescence spectrometers are appearing every day. Agilent spectrometers have the power and versatility to handle the most challenging applications in the lab, on the farm, or at collection, shipping, and receiving sites.
Superior quantitative and qualitative data with excellent low-level sensitivity Leading-edge Agilent molecular spectrometers enable researchers, suppliers, and producers to:
• Rapidly identify, verify, and authenticate food ingredients• Quickly screen a representative number of incoming ingredients using portable FTIR
systems – and make accept-or-reject decisions on the spot• Ensure that incorrectly labeled, substandard, or unacceptable ingredients never enter the
manufacturing chain• Detect, identify, and measure contaminants in food and food ingredients• Ensure the quality and performance of packaging materials• Determine crop health and produce quality
In addition, Agilent Molecular Spectroscopy solutions are well matched to the food industry’s need for speed, simplicity, and reliable answers.
• Ultra compact systems preserve valuable bench space, while making portable and mobile operation a reality
• Mid-infrared FTIR spectrometers provide more specific details about food sample composition, as compared to near-infrared (NIR) spectroscopy
• Handheld and portable systems let you bring your analyzer to your samples – in field, farm, collection, shipping, receiving, or processing locations
• Benchtop and mobile FTIR systems use the same optomechanical and electronic components – as well as the same sampling technology – simplifying method transfer from lab to field
• Intuitive software automates on-board methods, and enables any user to achieve reliable results
• Exclusive FTIR sampling technology, such as DialPath transmission interface, makes analyzing foods faster, more reliable, and easier than ever
4
Enhancing crop production• Measure fruit ripeness to confirm that prices are based on quality• Analyze soils and soil composition• Identify pesticides in containers before distribution and application
As the food industry’s premier measurement company, Agilent is uniquely positioned to help you protect lives and livelihoods. Our chromatography and mass spectroscopy systems are used in thousands of food analysis laboratories worldwide. We also support your food testing efforts with an extensive support network, plus a wide array of columns and supplies.
Get precise, accurate answers with Agilent Molecular Spectroscopy instruments
To learn more about Agilent food safety technologies and applications, visit
agilent.com/chem/food
AGILENT FTIR INSTRUMENTS
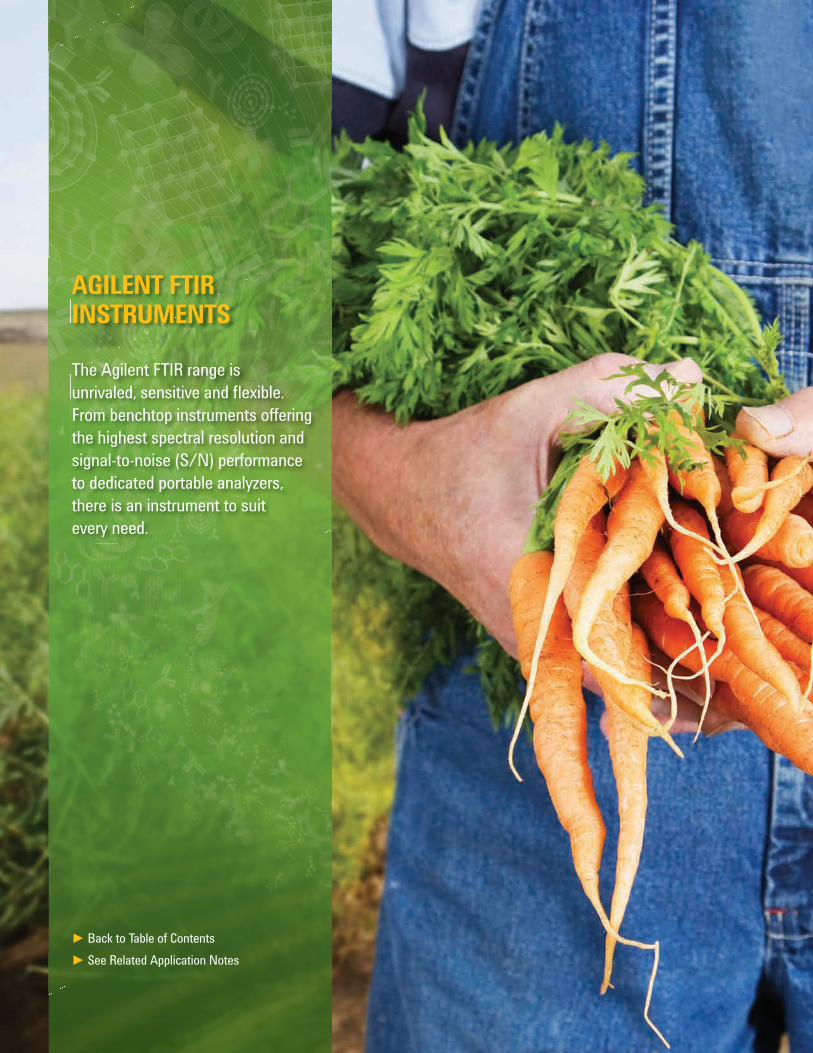
The Agilent FTIR range is unrivaled, sensitive and flexible. From benchtop instruments offering the highest spectral resolution and signal-to-noise (S/N) performance to dedicated portable analyzers, there is an instrument to suit every need.
► Back to Table of Contents► See Related Application Notes

Reliable, rugged, and easy to use 4500 Series Portable FTIRAgilent 4500 Series FTIR spectrometers are fully portable, battery-powered analyzers suitable for testing foods and food ingredients in demanding environments – such as agricultural fields, produce collection sites, and raw ingredient shipping/receiving sites. The 4500 series FTIR is also well-suited for rapidly verifying identity and quality.
Reliable, rugged, and easy to use 4500 Series Portable FTIRAgilent 4500 Series FTIR spectrometers are fully portable, battery-powered analyzers suitable for testing foods and food ingredients in demanding environments – such as agricultural fields, produce collection sites, and raw ingredient shipping/receiving sites. The 4500 series FTIR is also well-suited for rapidly verifying identity and quality.
In the lab or in the field 4100 ExoScan Series FTIR (handheld)Our rugged, versatile 4100 ExoScan FTIR lets you screen for key analytes virtually anywhere, or bring samples back to the lab for more in-depth analysis. You can also choose from several sample interfaces that can be changed in seconds with no realignment. The system is ideal for measuring a wide range of foods, food ingredients, and agriculture-related substances – such as soils, fertilizers, herbicides, and pesticides – often with no sample preparation required.
The 4100 ExoScan, 4500, 5500, and Cary 630 FTIR are all built on the same compact, robust technology and utilize the same software design. This ensures you can take quality measurements wherever you need them – simply choose the model that best suits your application.
LEARN MORE DOWNLOAD BROCHURE
LEARN MORE DOWNLOAD DATA SHEET
(Continued)
► Back to Table of Contents► See Related Application Notes
To learn more about Agilent food safety technologies and applications, visit
agilent.com/chem/food
6
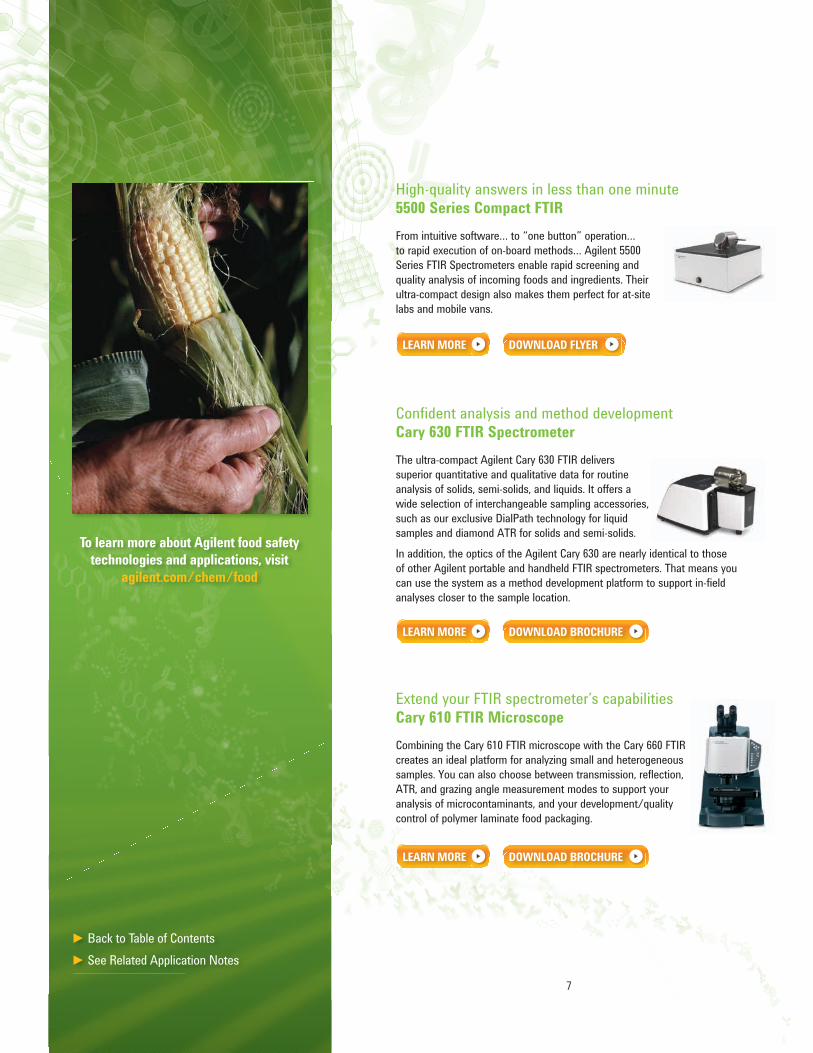
Confident analysis and method development Cary 630 FTIR Spectrometer The ultra-compact Agilent Cary 630 FTIR delivers superior quantitative and qualitative data for routine analysis of solids, semi-solids, and liquids. It offers a wide selection of interchangeable sampling accessories, such as our exclusive DialPath technology for liquid samples and diamond ATR for solids and semi-solids.In addition, the optics of the Agilent Cary 630 are nearly identical to those of other Agilent portable and handheld FTIR spectrometers. That means you can use the system as a method development platform to support in-field analyses closer to the sample location.
Extend your FTIR spectrometer’s capabilities Cary 610 FTIR Microscope Combining the Cary 610 FTIR microscope with the Cary 660 FTIR creates an ideal platform for analyzing small and heterogeneous samples. You can also choose between transmission, reflection, ATR, and grazing angle measurement modes to support your analysis of microcontaminants, and your development/quality control of polymer laminate food packaging.
LEARN MORE DOWNLOAD BROCHURE
LEARN MORE DOWNLOAD BROCHURE
► Back to Table of Contents► See Related Application Notes
To learn more about Agilent food safety technologies and applications, visit
agilent.com/chem/food
7
High-quality answers in less than one minute 5500 Series Compact FTIRFrom intuitive software… to “one button” operation… to rapid execution of on-board methods… Agilent 5500 Series FTIR Spectrometers enable rapid screening and quality analysis of incoming foods and ingredients. Their ultra-compact design also makes them perfect for at-site labs and mobile vans.
LEARN MORE DOWNLOAD FLYER

FTIR Application Notes Fast, Effective Evaluation of Edible Bird Nests Using The Handheld Agilent 4100 ExoScan FTIR (5990-9789EN) ................................9In Situ Screening of Quality Traits in Tomato Cultivars Using the Handheld 4200 FlexScan FTIR Spectrometer (5991-0003EN) .....................15QA/QC of Dairy Powders Using the Agilent Cary 630 ATR-FTIR Analyzer (5991-0784EN) ............................................................................21QA/QC of Flours Using the Agilent Cary 630 ATR-FTIR Analyzer (5991-0785EN) ............................................................................25QA/QC of Sugars Using the Agilent Cary 630 ATR-FTIR Analyzer (5991-0786EN) ............................................................................29QA/QC of Tea Using the Agilent Cary 630 ATR-FTIR Analyzer (5991-0787EN) ............................................................................35At-Site Screening and Measurement of Adulterant Levels in Bovine Milk by Mid FTIR Spectroscopy (5991-1953EN) ......................................41Pesticide Authentication by Portable FTIR Spectroscopy (5991-2531EN) .................................................................................................................45Measurement of Acrylamide in Potato Chips by Portable FTIR Analyzers (5991-2532EN) ..................................................................51Determination of Phosphorus Concentration in Hydroponics Solution (SI-A-1121) ..............................................................................57Validation of a Leaf Reflectance and Transmittance Model for Three Agricultural Crop Species (SI-A-1194) ......................................63
► Back to Table of Contents
To learn more about Agilent food safety technologies and applications, visit
agilent.com/chem/food
8
Introduction
The popularity of birds nest soup in Chinese cuisine stretches back over 1000 years. The literal translation of the Chinese name for the dish, yàn wō (燕窝), is “swallow’s nest”. In fact, edible bird nests are produced by swiftlets (Collocalia fuciphaga), which belong to the same family as the common swallow, but which are smaller in size. Although there are 90 varieties of Southeast Asian swiftlet, the nests of only four types of bird, namely cave swifts, are deemed worthy of human consumption. During the breeding season, the male birds regurgitate a sticky salivary secretion to form the nest. As a rich source of amino acids, carbohydrates and mineral salts, bird nests have also been used for hundreds of years as an important health supplement in Traditional Chinese Medicines (TCM). Examples of its use include as a treatment for malnutrition, a boost to the immune system, and to enhance the body’s metabolism. More recently bird nests have also been used in cosmetic products.
Fast, effective evaluation of edible bird nests using the handheld Agilent 4100 ExoScan FTIRApplication note
Author
Joe Set
Agilent TechnologiesPetaling Jaya, Malaysia
Food testing
The high demand for edible bird nests, especially from China, Hong Kong and Taiwan, and limited supply has led to a lucrative market building up around the product. This in turn has led to the upsurge of fake and adulterated edible bird nest products. Unethical suppliers blend the original bird nest with additives in order to boost its weight and market value. Common substances used to imitate bird nests include edible plants, fi sh skin, mushroom or algae [1]. The more expensive ‘Red Blood’ bird nest can be adulterated from the less expensive white nest by adding a natural colorant such as karayagum, red seaweed or tremella fungus or by exposing it to sodium nitrate.
The method that is required to identify genuine, unadulterated bird nests also needs to be applied to the food safety arising from the production and preparation of nests for consumption. Edible bird nests undergo treatment with hydrogen peroxide to ‘whiten’ the nests. Many processes involve the addition of preservatives such as boric acid, potassium sulfi te or sulfur dioxide (according to country regulations). Sugar, salt, and monosodium glutamate (MSG) are added to improve the taste. Gluten, white fungus, jelly, animal skin or synthetic rubber is often used to improve the shape and appearance of the nests.
2
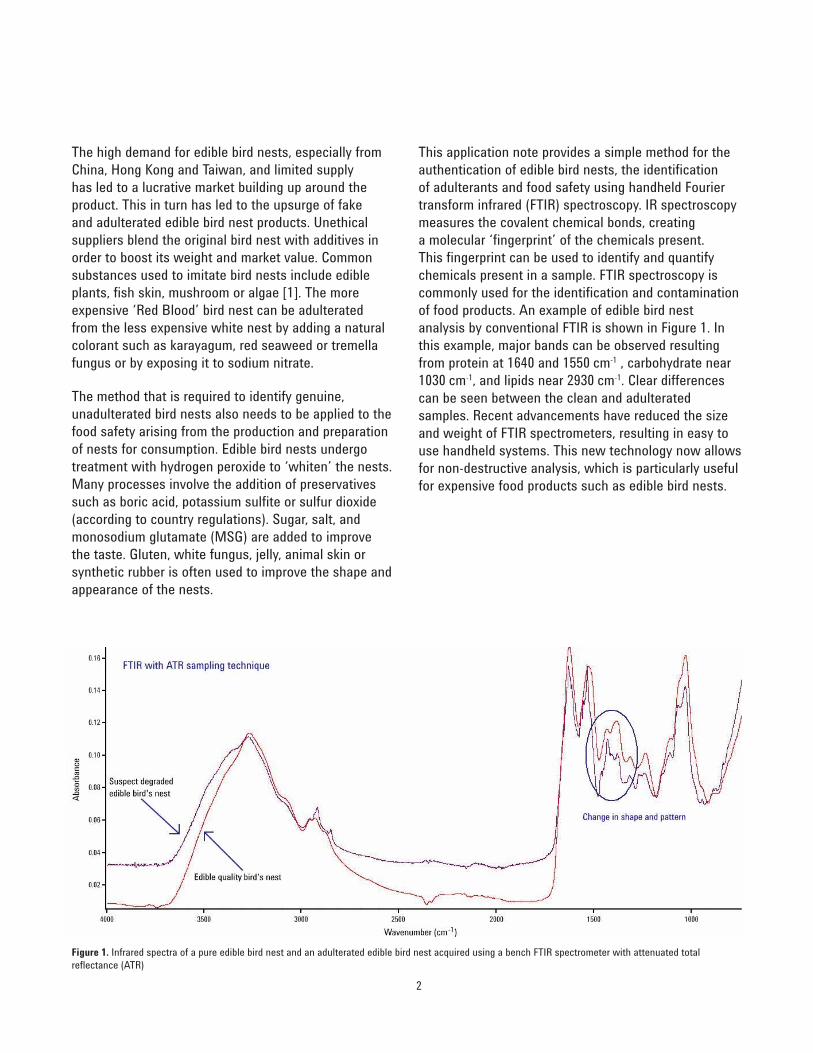
This application note provides a simple method for the authentication of edible bird nests, the identifi cation of adulterants and food safety using handheld Fourier transform infrared (FTIR) spectroscopy. IR spectroscopy measures the covalent chemical bonds, creating a molecular ‘fi ngerprint’ of the chemicals present. This fi ngerprint can be used to identify and quantify chemicals present in a sample. FTIR spectroscopy is commonly used for the identifi cation and contamination of food products. An example of edible bird nest analysis by conventional FTIR is shown in Figure 1. In this example, major bands can be observed resulting from protein at 1640 and 1550 cm-1 , carbohydrate near 1030 cm-1, and lipids near 2930 cm-1. Clear differences can be seen between the clean and adulterated samples. Recent advancements have reduced the size and weight of FTIR spectrometers, resulting in easy to use handheld systems. This new technology now allows for non-destructive analysis, which is particularly useful for expensive food products such as edible bird nests.
Figure 1. Infrared spectra of a pure edible bird nest and an adulterated edible bird nest acquired using a bench FTIR spectrometer with attenuated total refl ectance (ATR)

Instrumentation
An Agilent 4100 ExoScan FTIR (Figure 2) was used for this study. It is a versatile, robust handheld mid-IR system that can be equipped with a wide range of interchangeable sampling interfaces. In this study, the diffuse refl ectance interface was used. The 4100 ExoScan FTIR is powered by rechargeable and interchangeable lithium ion batteries that can be operated continuously for 4 hours. It can also be docked in the lab and operated like a benchtop FTIR, with performance equal to conventional laboratory FTIR spectrometers.
Used with the diffuse refl ectance sample interface, the 4100 ExoScan FTIR provides non-destructive testing. This is in contrast to the a more conventional lab benchtop FTIR using an attenuated total refl ectance (ATR) sampling method that would destroy the physical structure of a bird nest. Additionally, the diffuse refl ectance sample interface measures a greater sample volume, yielding a more sensitive measurement than ATR. In addition to providing non-destructive testing, the compact design of the 4100 ExoScan means that sample analysis can take place where it is most convenient, whether in a lab, mobile facility or in the fi eld.
3
Diffuse re� ectance midIR spectroscopy of edible bird nests
Diffuse refl ectance IR spectra of neat samples have a different band shape compared to classical absorbance spectra as shown in Figure 3. Highly absorbing samples produce negative bands when plotted on an absorbance scale. These negative bands are due to changes in the refractive index of the material coincident with the absorbance band. The bands are, however, at the same frequency as positive absorbance bands measured with ATR and can be used to identify and quantify materials in a similar manner. Although the band shape is different, the information content is the same between measurements made with diffuse refl ectance and ATR sample interfaces.
As was stated above, edible bird nests can be contaminated or adulterated with a number of common additives including carbonates, sugars, salt, MSG and feathers. Examples of adulterated bird nests were measured with the 4100 ExoScan FTIR. Spectra obtained from these adulterated samples are shown in Figures 4 to 7, demonstrating the ease of detection. Furthermore, a method was created to give a pass/fail answer, and identify the adulterant as detailed in the following section.
Figure 2. The Agilent 4100 ExoScan FTIR (left) and in use (right), testing an edible bird nest

4
Figure 4. Identifi cation of calcium carbonate contamination of a bird’s nest measured with the Agilent 4100 ExoScan FTIR in diffuse sampling mode
Figure 5. Identifi cation of salt present in bird’s nest measured with the Agilent 4100 ExoScan FTIR in diffuse sampling mode
Figure 4 shows a comparison of a spectrum obtained from a pure edible bird nest sample, and one that has been contaminated with calcium carbonate, most likely arising from the nest’s original location on limestone rocks or cave. The pure nest is characterized by spectral bands due to the protein (amide I, II and III) as well as bands due to cellulose. In addition to those bands, the nest contaminated with calcium carbonate contains two additional bands at 1410 cm-1 and 873 cm-1 due to the carbonate functional group. As can be seen from the spectra in Figure 4, the 4100 ExoScan FTIR can easily distinguish a pure edible bird nest sample from one that has been contaminated with calcium carbonate.
Salt (sodium chloride) is often added to an edible bird nest to enhance its fl avor and to increase its weight and value. Sodium chloride is an inorganic compound; therefore, it is not visible by IR. However, adulteration of edible bird nests by salt is still detectable with the 4100 ExoScan FTIR. Salt effectively ‘dilutes’ the sample, causing the spectrum to exhibit positive bands where a spectrum of pure bird nest has negative bands. This can be seen in Figure 5.
Figure 3. Lab bench FTIR with ATR sampling compared to 4100 ExoScan with diffuse sampling. The identical sample has been measured by both sampling techniques.
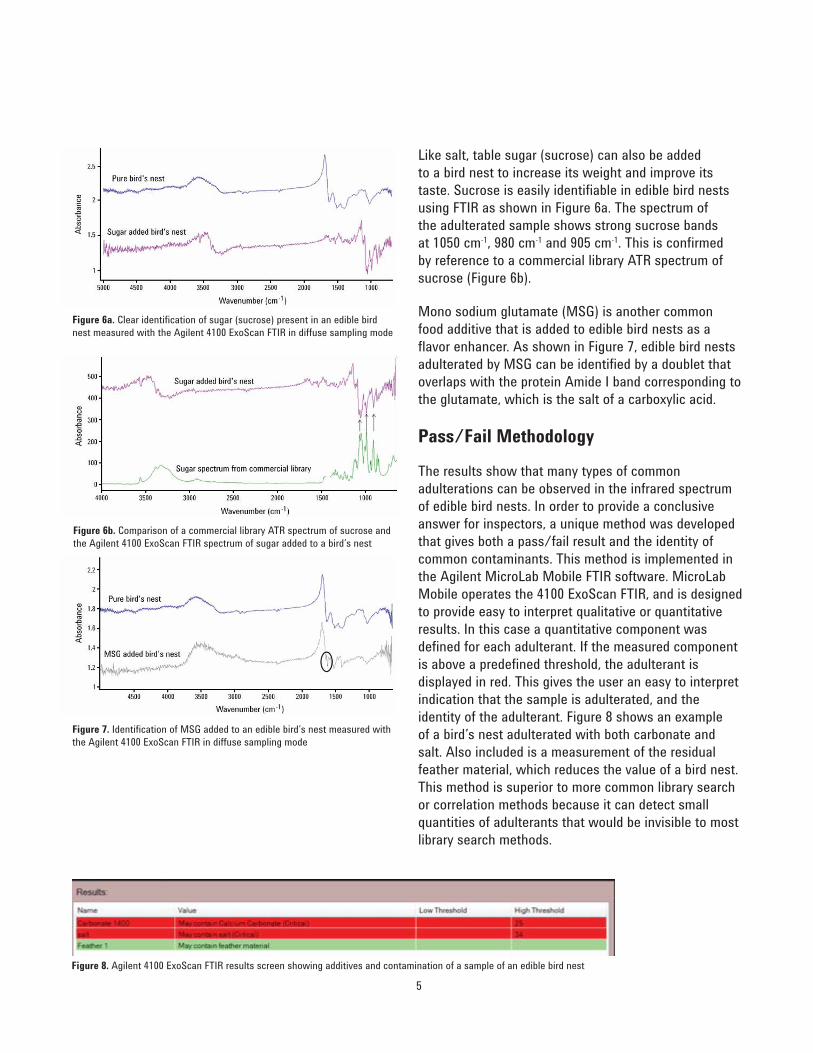
Like salt, table sugar (sucrose) can also be added to a bird nest to increase its weight and improve its taste. Sucrose is easily identifi able in edible bird nests using FTIR as shown in Figure 6a. The spectrum of the adulterated sample shows strong sucrose bands at 1050 cm-1, 980 cm-1 and 905 cm-1. This is confi rmed by reference to a commercial library ATR spectrum of sucrose (Figure 6b).
Mono sodium glutamate (MSG) is another common food additive that is added to edible bird nests as a fl avor enhancer. As shown in Figure 7, edible bird nests adulterated by MSG can be identifi ed by a doublet that overlaps with the protein Amide I band corresponding to the glutamate, which is the salt of a carboxylic acid.
Pass/Fail Methodology
The results show that many types of common adulterations can be observed in the infrared spectrum of edible bird nests. In order to provide a conclusive answer for inspectors, a unique method was developed that gives both a pass/fail result and the identity of common contaminants. This method is implemented in the Agilent MicroLab Mobile FTIR software. MicroLab Mobile operates the 4100 ExoScan FTIR, and is designed to provide easy to interpret qualitative or quantitative results. In this case a quantitative component was defi ned for each adulterant. If the measured component is above a predefi ned threshold, the adulterant is displayed in red. This gives the user an easy to interpret indication that the sample is adulterated, and the identity of the adulterant. Figure 8 shows an example of a bird’s nest adulterated with both carbonate and salt. Also included is a measurement of the residual feather material, which reduces the value of a bird nest. This method is superior to more common library search or correlation methods because it can detect small quantities of adulterants that would be invisible to most library search methods.
5
Figure 6a. Clear identifi cation of sugar (sucrose) present in an edible bird nest measured with the Agilent 4100 ExoScan FTIR in diffuse sampling mode
Figure 6b. Comparison of a commercial library ATR spectrum of sucrose and the Agilent 4100 ExoScan FTIR spectrum of sugar added to a bird’s nest
Figure 7. Identifi cation of MSG added to an edible bird’s nest measured with the Agilent 4100 ExoScan FTIR in diffuse sampling mode
Figure 8. Agilent 4100 ExoScan FTIR results screen showing additives and contamination of a sample of an edible bird nest

www.agilent.com/chemAgilent shall not be liable for errors contained herein or for incidental or consequential damages in connection with the furnishing, performance or use of this material.
Information, descriptions, and specifi cations in this publication are subject to change without notice.
© Agilent Technologies, Inc. 2012Published January 19, 2012Publication number: 5990-9789EN
References
1. Li, X., Xi, X. & Che, W. (2003) Analysis and assessment of quality in import-export bird nest. Guangzhou Food Science and Technology. 19:72 & 89.
Conclusions
FTIR spectroscopy is a valuable technique for the identifi cation, quality assurance and authentication of edible bird nests as it is non-destructive, fast and direct, requiring no sample preparation, with good sensitivity and specifi city. These attributes are important to help prevent the fraudulent trade of counterfeit or adulterated bird nests and also to assure food safety and health standards. The industry surrounding the supply, processing and selling of swiftlet nests is expanding rapidly due to a growing affl uence in China, the largest market for edible bird nests, and publicity surrounding the health and well-being benefi ts of consuming bird nests.
The Agilent 4100 ExoScan FTIR analyzer fi tted with an integrated diffuse refl ectance sampling interface provides an ideal analytical capability for the application:
• It is easy to operate using a Select-Point-Press mode, making it ideal for unskilled operators.
• Samples can be analyzed in the fi eld using the light and portable analyzer ensuring quick results and fast sample turnaround, allowing adulterated samples to be rejected at source.
• A number of areas on the sample can be analyzed in a non-destructive manner allowing each nest to be tested.
• The results are easy to interpret using the unique quantitative method available with the MicroLab Mobile software.
• The results generated are reliable, as illustrated by comparison with data acquired using conventional technology.

Abstract
Chemometrics was employed to develop models that utilize infrared spectral measurements to estimate the concentrations of key analytes in tomatoes that determine quality. Models constructed using the handheld Agilent 4200 FlexScan FTIR spectrometer gave results comparable to those obtained using a benchtop spectrometer. The 4200 FlexScan spectrometer thus provides the ability to accurately assess the quality of tomatoes in the field in order to assure the quality of the end food product.
In situ screening of quality traits in tomato cultivars using the handheld 4200 FlexScan FTIR spectrometerApplication note
Authors
Glynda Fe G. Sayajon*, Sarah Herringshaw*, Alejandra M. Santos*, Luis E. Rodriguez-Saona* and David M. Francis†
The Ohio State University * Columbus, † Wooster, OH, USA
Food testing

Introduction
Monitoring the quality of tomatoes (Lycopersicon esculentum) is important at all levels in the food industry. While appearance, texture and flavor are the important quality attributes of fresh-market tomatoes, the major quality components of processing tomatoes are soluble solids, pH, titratable acidity, viscosity and color.1 Sugars and organic acids, responsible for the sweetness and tartness, are the major factors affecting consumer acceptability2 and the sugar-acid ratio is vital to flavor acceptability.3 In the tomato industry, soluble solids dictate the factory yield: the higher the soluble solids, the lesser the quantity of tomato that is required to produce processed tomato products such as pulp, paste and concentrate4. Similarly, pH plays a vital part in microbiological safety and food spoilage. Generally, the pH of tomatoes has been reported to range from 3.9 to 4.9, or in standard cultivars, 4.0 to 4.75.
The development of tomato varieties with altered nutritional profiles requires efficient selection and scientific competence to measure metabolite contents in thousands of samples6. Field-based devices can streamline quality assurance and Fourier-transform infrared (FTIR) techniques combined with chemometrics offer tomato processors and breeders powerful tools for the rapid assessment of tomato quality attributes. Portable IR units enable the food manufacturer to quickly assess the quality of the product, allowing for timely correction measures during manufacture. Portable systems are simple to use and require minimal or no sample preparation. They reduce assay time and help to streamline the analytical procedure so that it is more applicable to higher sample throughput and automation, providing in-situ assessment of the sample’s composition.
This application note evaluates the performance of the novel Agilent 4200 FlexScan portable infrared units against a benchtop IR spectrometer for the determination of tomato quality parameters (Brix, pH, titratable acidity, glucose, fructose and citric acid). Models were constructed on both spectrometers using partial least squares regression (PLSR) to predict these quality parameters, using reference data collected by traditional refractometer and chromatography
2
methods. The 4200 FlexScan demonstrated comparable performance to the benchtop spectrometer for the measurement of these key quality parameters, with the added advantage of delivering that information to food scientists in the field, providing increased efficiency and efficacy in assuring the quality of the end food product.
Experimental
SamplesA total of 80 tomato varieties (genotypes) was grown in Fremont, Ohio at the Ohio Agricultural Research and Development Center (OARDC), North Central Agricultural Experimental Station in 2009. The varieties represent landrace varieties from Central and South America, and vintage varieties from North America and Europe.
At least 12 representative fruit from each variety were cut into quarters and a quarter from each fruit was pooled and blended into juice.
Reference measurementsSoluble solid content was measured using an Abbe refractometer. The overall pH of diluted samples of puree were measured and the samples were titrated to pH 8.2 using 0.1N NaOH to determine titratable acidity. This was reported as % citric acid using the conversion factor of 0.064 Equivalent wt. (mg/mEq).
Sugar and acid contents were analyzed using high performance liquid chromatography. For extraction of sugars, tomato juice aliquots (~2 mL) were passed through a mixed-mode C18 and strong cation exchange SPE column to remove interfering acidic components from the solution. For extraction of acids, aliquots of tomato juice (2 mL) were mixed with 2% metaphosphoric acid and centrifuged.
Infrared measurementsSpectral data from all tomato juice samples were collected in parallel using (1) a dry air purged benchtop Excalibur Series 3100 Fourier-Transform infrared spectrometer (Varian, now Agilent Technologies, Santa Clara, CA) incorporating a KBr beamsplitter, DTGS detector, and three reflection ZnSe ATR accessory; (2) a handheld 4200 FlexScan FTIR spectrometer
(Agilent Technologies Inc., Danbury, CT), with a ZnSe beamsplitter, DTGS detector and single-reflection diamond ATR sampling interface. Both spectrometers were operated at 4 cm-1 spectral resolution.
Aliquots (0.5 mL) from thawed tomato juice samples were centrifuged at 12,000 rpm for 5 minutes at 25 °C, and two drops were applied to the surface of the ATR crystal for spectral data collection. The absorbance spectra of the room temperature samples consist of 64 co-added interferograms at 4 cm-1 resolution measured in the 4000 to 600 cm-1 mid-IR wavelength range. The spectrum of each individual sample, which took less than 2 minutes to acquire, was corrected against a background spectrum of air. Duplicate independent measurements were taken on each sample and background spectra were collected after every sample to account for environmental variations. Between measurements, the ATR surface was cleaned with a 70% ethanol solution.
Statistical analysisPartial least squares regression (PLSR) analysis was used to correlate the infrared spectral results with those of the referee analysis methods. PLSR is a bilinear regression analysis method that decreases a huge number of variables into latent factors that are linear combinations of the spectral frequencies (X) used to ascertain the analyte’s concentration (Y)7. This technique has the potential to estimate the component concentration, as well as the chemical properties of the spectra.8 This analytical approach offers a more information-rich data set of reduced dimensionality and eliminates data noise, resulting in more accurate and reproducible calibration models9.
Spectral data were exported from the spectrometers as .spc files and imported into a multivariate statistical program for partial least squares regression analysis in order to generate the calibration models. The calibration models correlated the spectra against the concentration of each tomato analyte (Brix, pH, titratable acids, glucose, fructose, and citric acid), which had been measured by the referee analysis method. Performance of these models was evaluated in terms of outlier diagnostics, standard error of cross-validation (SECV), and correlation coefficient (R). Distribution of
3
residuals and leverage were used for the evaluation of outliers. Any observation with atypical and large residual or leverage was re-analyzed and eliminated if it was considered a substantial outlier, and thereafter the model was recalculated. The calibration model that generated the best combination of minimum SECV, higher R and optimized numbers of latent factors was selected for each tomato analyte.
Results and discussion
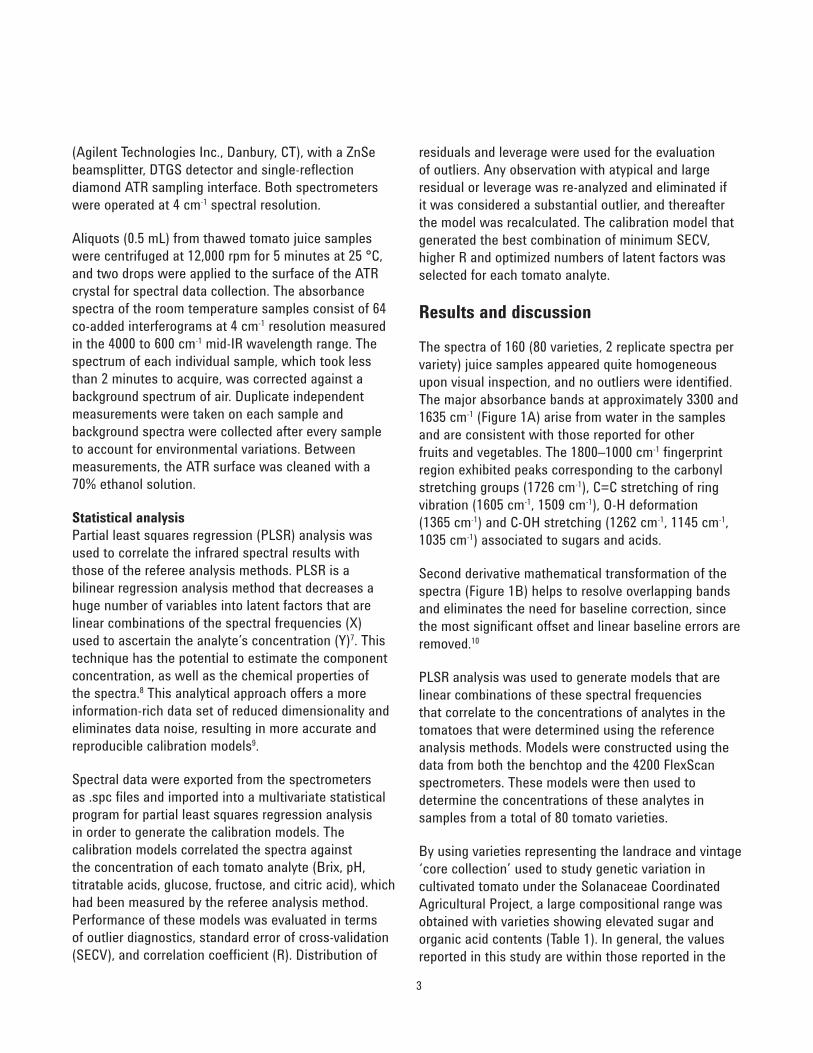
The spectra of 160 (80 varieties, 2 replicate spectra per variety) juice samples appeared quite homogeneous upon visual inspection, and no outliers were identified. The major absorbance bands at approximately 3300 and 1635 cm-1 (Figure 1A) arise from water in the samples and are consistent with those reported for other fruits and vegetables. The 1800–1000 cm-1 fingerprint region exhibited peaks corresponding to the carbonyl stretching groups (1726 cm-1), C=C stretching of ring vibration (1605 cm-1, 1509 cm-1), O-H deformation (1365 cm-1) and C-OH stretching (1262 cm-1, 1145 cm-1, 1035 cm-1) associated to sugars and acids.
Second derivative mathematical transformation of the spectra (Figure 1B) helps to resolve overlapping bands and eliminates the need for baseline correction, since the most significant offset and linear baseline errors are removed.10
PLSR analysis was used to generate models that are linear combinations of these spectral frequencies that correlate to the concentrations of analytes in the tomatoes that were determined using the reference analysis methods. Models were constructed using the data from both the benchtop and the 4200 FlexScan spectrometers. These models were then used to determine the concentrations of these analytes in samples from a total of 80 tomato varieties.
By using varieties representing the landrace and vintage ‘core collection’ used to study genetic variation in cultivated tomato under the Solanaceae Coordinated Agricultural Project, a large compositional range was obtained with varieties showing elevated sugar and organic acid contents (Table 1). In general, the values reported in this study are within those reported in the

in the field. This information enables optimization of the quality of the end food product, since it can be obtained before harvest and processing.
The estimated analyte contents measured by the ATR-IR spectroscopy showed some data scattering along the regression line (Figure 2), when compared to those determined by the reference methods (refractometer, pH meter, or HPLC), as the R value ranged from 0.75–0.92 (Table 1). However, the Brix measurements had a ±0.1° accuracy, which were further complicated by rounding errors, and coefficients of variability (%CV) for HPLC analysis were ~20%, which could limit the precision of the PLSR prediction.
Figure 1. Attenuated total reflectance (ATR) infrared absorption spectrum of tomato sample (A) and its second derivative transformation (B) as shown on the benchtop Excalibur 3100 FTIR and portable Agilent 4200 FlexScan spectrometers
Table 1. Predictive models for determining tomato qualities by FTIR using a benchtop and the Agilent 4200 FlexScan spectrometers
Tomato analyte
Spectrometer Concentration/ pH range
SECV R
Brix Benchtop 4.40–7.50 0.36 0.79
FlexScan 0.39 0.75
Fructose Benchtop 1.37–5.70 g/100 g 0.32 0.87
FlexScan 0.43 0.79
Glucose Benchtop 1.03–5.75 g/100 g 0.43 0.89
FlexScan 0.49 0.86
pH Benchtop 3.90–4.76 0.06 0.92
FlexScan 0.06 0.91
Titratable acids
Benchtop 0.27–0.88 0.05 0.91
FlexScan 0.05 0.87
Citric acid
Benchtop 256.37–2015.93 mg/100 g
136.50 0.90
FlexScan 123.40 0.92
literature, taking into account that nutrient levels may be affected by variety, maturity, temperature and soil nutrients among others11.
Since the benchtop spectrometer used a three-reflection ATR, it would follow that it would have higher sensitivity than the 4200 FlexScan handheld instrument equipped with a single reflection ATR. In spite of that and although the benchtop instrument provided the best quality parameter predictive models in general, the handheld 4200 FlexScan system generated very comparable correlation values (R) and SECVs (Table 1). The 4200 FlexScan handheld spectrometer can therefore provide reliable estimations of Brix, glucose, fructose, pH, titratable acids and citric acids in tomato samples
4

Conclusions
Screening of quality parameters in tomatoes has been accomplished through the use of the handheld Agilent 4200 FlexScan FTIR spectrometer in the mid-infrared spectral region. A simple, quick and reliable technique was developed for the determination of key analytes and the results were comparable to those obtained with a benchtop unit. The ease of use, convenience and ruggedness offered by the handheld infrared spectrometer make it an ideal tool for food scientists and technicians to obtain vital information in the field. This tool can play a vital role in crop and process improvement studies, thus improving the quality assurance of the end food product.
References
1. Moraru, C., Logendra, L., Lee, T. C. & Janes, H. (2004). Characteristics of 10 processing tomato cultivars grown hydroponically for the NASA Advanced Life Support (ALS) Program. J. Food Compos. Anal. 17, 141–154.
2. Baldwin, E. A., Goodner, K. & Plotto, A. (2008). Interaction of volatiles, sugars, and acids on perception of tomato aroma and flavor descriptors. Journal of Food Science, 73, S294–S307.
3. Petroturza M. & Telekyvamossy, G. (1989). 3. Sensory evaluations. Study on Taste Substances of Tomato. Nahrung, 33, 387–394.
4. Gould, W. A. (1992). Tomato juice manufacture. Tomato Production, Processing & Technology. Gould W., ed., Baltimore, CTI Publications.
Figure 2. PLS regression plots of glucose (A and B) and citric acid (C and D) on the benchtop Excalibur 3100 FTIR (A and C) and 4200 FlexScan (B and D) spectrometers. The regression plots showed a good correlation per analyte across spectrometers.
5

5. Sapers, G. M., Phillips, J. G. & Stoner, A. K. (1977). Tomato acidity and safety of home canned tomatoes. Hortscience, 12, 204–208.
6. De Nardo, T., Shiroma-Kian, C., Halim, Y., Francis, D. & Rodriguez-Saona, L. E. (2009). Rapid and simultaneous determination of lycopene and beta-carotene contents in tomato juice by infrared spectroscopy. J. Agric. Food Chem. 57, 1105–1112.
7. Martens, H. & Naes, T. (1989). Models for calibration. Chapter 3 in Multivariate Calibration. H. Martens & T. Naes, ed. John Wiley & Sons Ltd., London, UK.
8. Haaland, D. & Thomas, E. V. (1988). Partial least-squares methods for spectral analyses. 1. Relation to other quantitative calibration methods and the extraction of qualitative information. Anal. Chem., 60, (11), 1193–1202.
9. Wold, S. (1999). Multivariate calibration — Direct and indirect regression methodology — Discussion and comments. Scand. J. Stat. 26, 204–205.
10. Kohler, A., Bertrand, D., Martens, H., Hannesson, K., Kirschner, C. & Ofstad, R. (2007). Multivariate image analysis of a set of FTIR microspectroscopy images of aged bovine muscle tissue combining image and design information. Anal. Bioanal. Chem. 389, 1143–1153.
11. Jones, R. A. & Scott, S. J. (1983). Improvement of tomato flavor by genetically increasing sugar and acid contents. Euphytica. 32, 845–855.
www.agilent.com/chemAgilent shall not be liable for errors contained herein or for incidental or consequential damages in connection with the furnishing, performance or use of this material.
Information, descriptions, and specifications in this publication are subject to change without notice.
© Agilent Technologies, Inc. 2012Published February 27, 2012 Publication number: 5991-0003EN

Introduction
Dairy powders are used extensively as functional ingredients in a myriad of food products. The composition of dairy powders can be highly variable in terms of proteins, carbohydrate (normally lactose), fat and moisture content. The characterization of dairy ingredients is traditionally carried out by solvent extraction of the fat, followed by chromatographic separation of the proteins and lactose. While these methods are highly accurate, they are time-consuming, tedious and costly. In recent years vibrational spectroscopy has been proven to be an ideal way to analyze powders, giving results within minutes of sample acquisition without prior sample preparation. Among the various vibrational techniques available: Fourier transform infrared (FTIR), near infrared (NIR), and Raman spectroscopy, mid-FTIR spectroscopy appears to be the most useful.
QA/QC of dairy powders using the Agilent Cary 630 ATR-FTIR analyzer
Application note
Zubair Farooq and Ashraf A. Ismail
McGill UniversityMcGill IR GroupDepartment of Food Science and Agricultural Chemistry Montreal, QuebecCanada
Food testing and agriculture

This is because mid-FTIR spectroscopy can provide a great deal of structural information from spectra characterized by very sharp spectral bands that can be assigned to specifi c functional groups, thereby making mid-FTIR spectroscopy a highly valuable technique for the identifi cation of complex dairy ingredients. Furthermore, using an attenuated total refl ectance (ATR) sampling accessory in combination with an FTIR spectrometer, as in the case of the Cary 630 ATR-FTIR analyzer, provides the best means for routine authentication of dairy powders and quality assurance/quality control (QA/QC) applications aimed at assessing the batch-to-batch variability of powder ingredients.
Objective
Government regulatory agencies and consumer groups are increasingly demanding that the food industry authenticate all raw materials going into their products. To address such a challenge in a timely and cost-effective manner, product manufacturers usually require an advance sample of food ingredients be shipped to them for testing prior to accepting a large quantity of the commodity. However, once the shipment arrives there is still the question of whether the advance samples were indeed representative of the bulk shipment and there is also a need to confi rm that the bulk shipments are uniform in composition. For example, since most dairy powders to the naked eye appear white, with a soft grainy texture and a virtually identical structural consistency (Figure 1), it is necessary to utilize analytical methods to characterize their composition.
Figure 1. Various milk protein powders
Ideally, this analysis should be completed in less than 30 seconds, require little or no sample preparation
2
and should be carried out at the receiving dock prior to placing the dairy powder ingredients into storage or integrating them directly into the production line.
In this application note, α-lactalbumin, an expensive whey protein, must be uniquely differentiated from other dairy ingredients such as β-lactoglobulin, whey protein isolate (WPI), whey protein concentrates (WPC) or even other types of dairy proteins such as caseins or caseinates.
Experimental
Materials and instrumentation• Various milk protein powders obtained from
different suppliers including α-lactalbumin, β-lactoglobulin, glycomacropeptide, milk protein concentrate, WPI, WPC, caseins and caseinates.
• A robust and light-weight Agilent Cary 630 ATR-FTIR analyzer (Figure 2).
Figure 2. Agilent Cary 630 ATR-FTIR analyzer
MethodSpectral acquisition was carried out by:
1. Placing a small amount of protein powder on the diamond ATR surface.
2. Pressing the samples against the diamond crystal using the attached pressure clamp. A slip clutch on the clamp prevents overtightening.
3. Collecting 64 co-added spectra (~30 seconds acquisition time at 4 cm-1 resolution) between 4000 and 650 cm-1.
Data processingA database of spectra of representative dairy powders was constructed using the Agilent MicroLab FTIR software spectral library builder. Subsequently, additional spectra of different lots of dairy powders were recorded and treated as ‘unknowns’. For example, the ATR-FTIR spectrum of α-lactalbumin was acquired and treated as an ‘unknown’ and was identifi ed correctly as α-lactalbumin through the automated spectral matching feature of the MicroLab FTIR software (Figure 3).
Figure 3. Correct identifi cation of an unknown dairy powder as α-lactalbumin by the Agilent MicroLab FTIR software by direct comparison to a spectral library of dairy powders
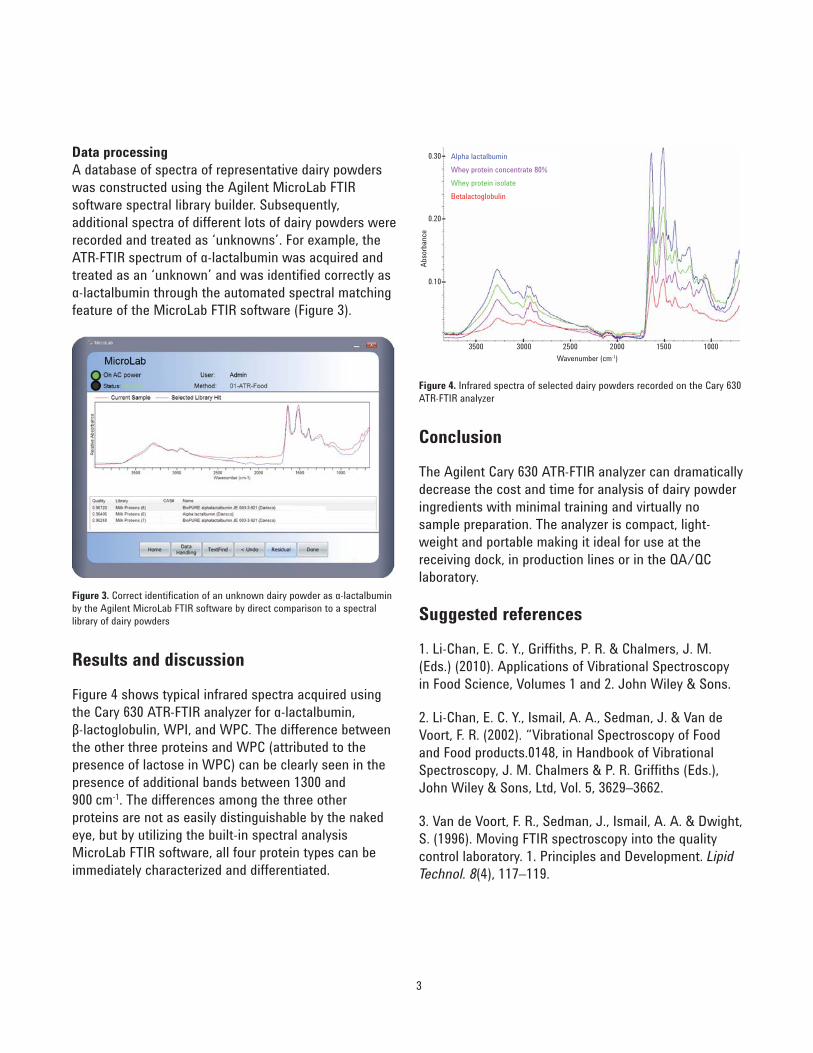
Results and discussion
Figure 4 shows typical infrared spectra acquired using the Cary 630 ATR-FTIR analyzer for α-lactalbumin, β-lactoglobulin, WPI, and WPC. The difference between the other three proteins and WPC (attributed to the presence of lactose in WPC) can be clearly seen in the presence of additional bands between 1300 and 900 cm-1. The differences among the three other proteins are not as easily distinguishable by the naked eye, but by utilizing the built-in spectral analysis MicroLab FTIR software, all four protein types can be immediately characterized and differentiated.
3
Figure 4. Infrared spectra of selected dairy powders recorded on the Cary 630 ATR-FTIR analyzer
Conclusion
The Agilent Cary 630 ATR-FTIR analyzer can dramatically decrease the cost and time for analysis of dairy powder ingredients with minimal training and virtually no sample preparation. The analyzer is compact, light-weight and portable making it ideal for use at the receiving dock, in production lines or in the QA/QC laboratory.
Suggested references
1. Li-Chan, E. C. Y., Griffi ths, P. R. & Chalmers, J. M. (Eds.) (2010). Applications of Vibrational Spectroscopy in Food Science, Volumes 1 and 2. John Wiley & Sons.
2. Li-Chan, E. C. Y., Ismail, A. A., Sedman, J. & Van de Voort, F. R. (2002). “Vibrational Spectroscopy of Food and Food products.0148, in Handbook of Vibrational Spectroscopy, J. M. Chalmers & P. R. Griffi ths (Eds.), John Wiley & Sons, Ltd, Vol. 5, 3629–3662.
3. Van de Voort, F. R., Sedman, J., Ismail, A. A. & Dwight, S. (1996). Moving FTIR spectroscopy into the quality control laboratory. 1. Principles and Development. Lipid Technol. 8(4), 117–119.
Wavenumber (cm-1)
Abso
rban
ce
3500 1500200025003000 1000
0.10
0.20
0.30 Alpha lactalbuminWhey protein concentrate 80%Whey protein isolateBetalactoglobulin

www.agilent.com/chemAgilent shall not be liable for errors contained herein or for incidental or consequential damages in connection with the furnishing, performance or use of this material.
Information, descriptions, and specifi cations in this publication are subject to change without notice.
© Agilent Technologies, Inc. 2012Published November 28, 2012Publication number: 5991-0784EN

Introduction
Food grains (cereals, legumes and oilseeds) are milled to get fl ours, which can be employed in the manufacture of an enormous variety of products such as pasta and bakery products. All the raw ingredients in a food product should ideally be authenticated in order to ensure consistent quality standards and to comply with regulatory labeling requirements. Flours are generally received as powders that need to be tested to ensure: fi rstly that the contents of the containers correspond with the label and shipping ledger; and secondly, that the product received meets the requirements of the formulator as to uniformity and purity (in terms of composition). Typically an advance sample is made available before bulk shipment and, in this case, it is incumbent upon the formulator to verify that the advance sample is indistinguishable in composition from that of the bulk shipment.
QA/QC of fl ours using the Agilent Cary 630 ATR-FTIR analyzer
Application note
Zubair Farooq and Ashraf A. Ismail
McGill UniversityMcGill IR GroupDepartment of Food Science and Agricultural Chemistry Montreal, QuebecCanada
Food testing and agriculture
Flours and fl our products are usually composed of carbohydrates, proteins, lipids, moisture and other minor constituents. Flour is typically mixed with water to form dough, which is then used in the production of bread and other baked goods. Differentiation among the various fl our types (for example, gluten-free fl our) can ensure quality and address mandatory labeling requirements.
Experimental
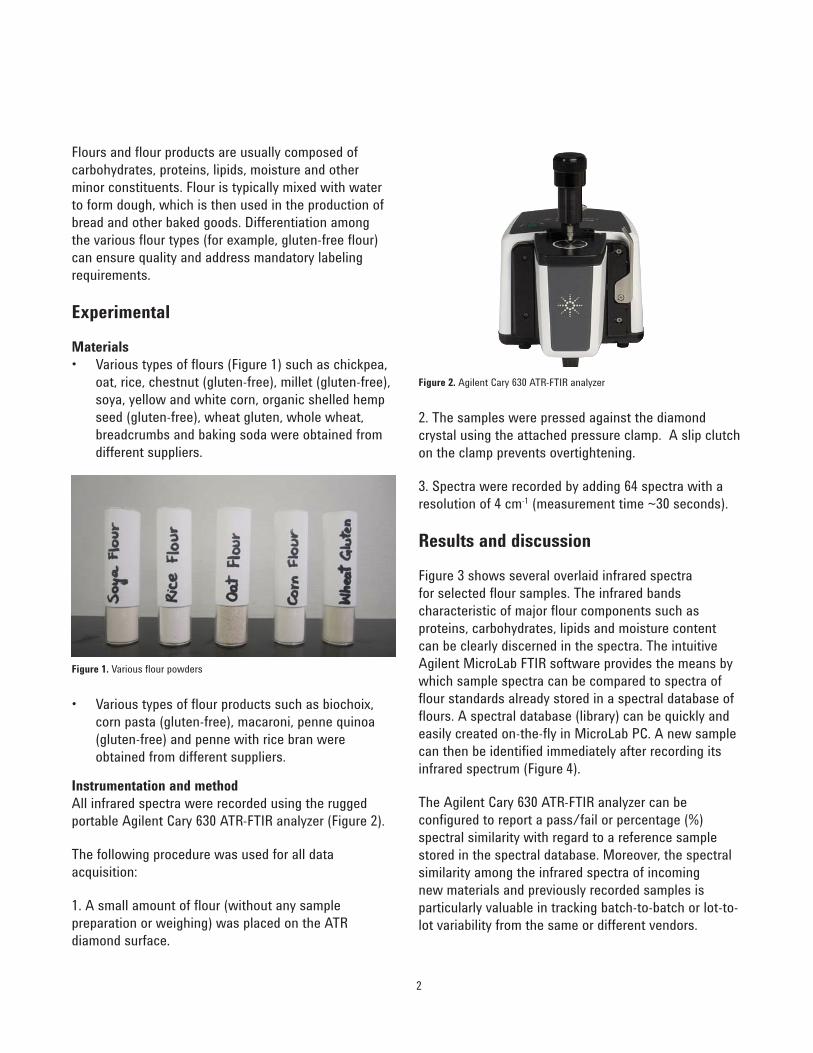
Materials • Various types of fl ours (Figure 1) such as chickpea,
oat, rice, chestnut (gluten-free), millet (gluten-free), soya, yellow and white corn, organic shelled hemp seed (gluten-free), wheat gluten, whole wheat, breadcrumbs and baking soda were obtained from different suppliers.
Figure 1. Various fl our powders
• Various types of fl our products such as biochoix, corn pasta (gluten-free), macaroni, penne quinoa (gluten-free) and penne with rice bran were obtained from different suppliers.
Instrumentation and methodAll infrared spectra were recorded using the rugged portable Agilent Cary 630 ATR-FTIR analyzer (Figure 2).
The following procedure was used for all data acquisition:
1. A small amount of fl our (without any sample preparation or weighing) was placed on the ATR diamond surface.
2
Figure 2. Agilent Cary 630 ATR-FTIR analyzer
2. The samples were pressed against the diamond crystal using the attached pressure clamp. A slip clutch on the clamp prevents overtightening.
3. Spectra were recorded by adding 64 spectra with a resolution of 4 cm-1 (measurement time ~30 seconds).
Results and discussion
Figure 3 shows several overlaid infrared spectra for selected fl our samples. The infrared bands characteristic of major fl our components such as proteins, carbohydrates, lipids and moisture content can be clearly discerned in the spectra. The intuitive Agilent MicroLab FTIR software provides the means by which sample spectra can be compared to spectra of fl our standards already stored in a spectral database of fl ours. A spectral database (library) can be quickly and easily created on-the-fl y in MicroLab PC. A new sample can then be identifi ed immediately after recording its infrared spectrum (Figure 4).
The Agilent Cary 630 ATR-FTIR analyzer can be confi gured to report a pass/fail or percentage (%) spectral similarity with regard to a reference sample stored in the spectral database. Moreover, the spectral similarity among the infrared spectra of incoming new materials and previously recorded samples is particularly valuable in tracking batch-to-batch or lot-to-lot variability from the same or different vendors.

3
Figure 3. Overlapped infrared spectra of selected fl our powders recorded on the Cary 630 ATR-FTIR analyzer
Figure 4. Agilent MicroLab FTIR software correct identifi cation of an unknown fl our sample
Protein and moisture
CarbohydrateProtein
Fat
Fat
Moisture
Chick pea fl ourWhite corn fl ourSoya fl ourRice fl ourRice and chestnut fl ourOat fl ourMillet fl our - gluten freeChick pea fl ourWheat gluten

Conclusion
The Agilent Cary 630 ATR-FTIR analyzer is an FTIR spectrometer with a built-in rugged diamond surface. It rapidly produces high quality spectra and it provides a rapid and robust method to differentiate between different fl ours. Moreover, the Cary 630 ATR-FTIR is quite portable and can be equally employed at the receiving dock, in the storage facility or in the process line to ensure the highest possible product consistency.
Suggested references
1. Karoui, R., Downey, G. & Blecker, C. (2010). Mid-infrared spectroscopy coupled with chemometrics: a tool for the analysis of intact food systems and the exploration of their molecular structure-quality relationships — a review. Chem. Rev., 110, 6144–6168.
www.agilent.com/chemAgilent shall not be liable for errors contained herein or for incidental or consequential damages in connection with the furnishing, performance or use of this material.
Information, descriptions, and specifi cations in this publication are subject to change without notice.
© Agilent Technologies, Inc. 2012Published November 28, 2012Publication number: 5991-0785EN

Introduction
Various manufacturers especially in the chemical, pharmaceutical and food industries employ sugars in their products. Sugars can be extracted from plant or microbial sources or they can be chemically synthesized. The majority of sugars are purchased as crystalline white powders and the most common examples are glucose, sucrose, lactose, fructose, maltose and xylitol. Protein-based sweeteners such as thaumatin, curculin and monellin are also used. Substituting artifi cial sweeteners such as aspartame, saccharin and sucralose can signifi cantly reduce or virtually eliminate the calories associated with sugar content in food and beverages.
Due to the similarity in their color, odor, texture and general appearance (Figure 1) it is very diffi cult for processors to authenticate the sugar identity prior to its addition to a formulation.
QA/QC of sugars using the Agilent Cary 630 ATR-FTIR analyzer
Application note
Zubair Farooq and Ashraf A. Ismail
McGill UniversityMcGill IR GroupDepartment of Food Science and Agricultural Chemistry Montreal, QuebecCanada
Food testing and agriculture

Currently, most pharmaceutical and food manufacturers rely on chromatographic techniques, which are tedious, time-consuming and require the use of solvents, to distinguish between the sugars. Occasionally, for quality assurance/quality control (QA/QC) purposes it is necessary to use internal or external chemical laboratory support for testing. As in all food commodity or food-grade pharmaceutical excipients, the manufacturer usually requires an advance sample from the supplier to verify that it meets their requirements. The sample is analyzed to compare it with other lots previously received. Then, when the bulk shipment arrives it must be tested to ensure that it has the same chemical and crystalline composition as the advance sample and that it is homogenous in composition. This can be accomplished by acquiring multiple samples from different containers. Sometimes, material from the regular supplier is not available and a new vendor must be found and the new sugar chemical composition must be compared to that supplied by the previous vendor.
Figure 1. Various sugars
Manufacturers who use sugars in their products need a ready-to-deliver, robust technology, free from system calibrations, that can test and accept or reject the sugar powder on the spot, ideally immediately on receiving the sample.
Experimental
Small amounts of sugar samples were placed without weighing onto the sampling surface of the Agilent Cary 630 ATR-FTIR analyzer (Figure 2). The samples were pressed against the diamond crystal using the attached pressure clamp. A slip clutch on the clamp prevents overtightening.
2
Spectra were acquired in about 30 seconds by co-adding 64 spectra with a resolution of 4 cm-1. Each resulting spectrum was displayed on the computer screen along with its closest spectral analogue chosen from a spectral library database of sugar standards acquired using the Cary 630 ATR-FTIR analyzer and its MicroLab FTIR software.
Figure 2. Agilent Cary 630 ATR-FTIR analyzer
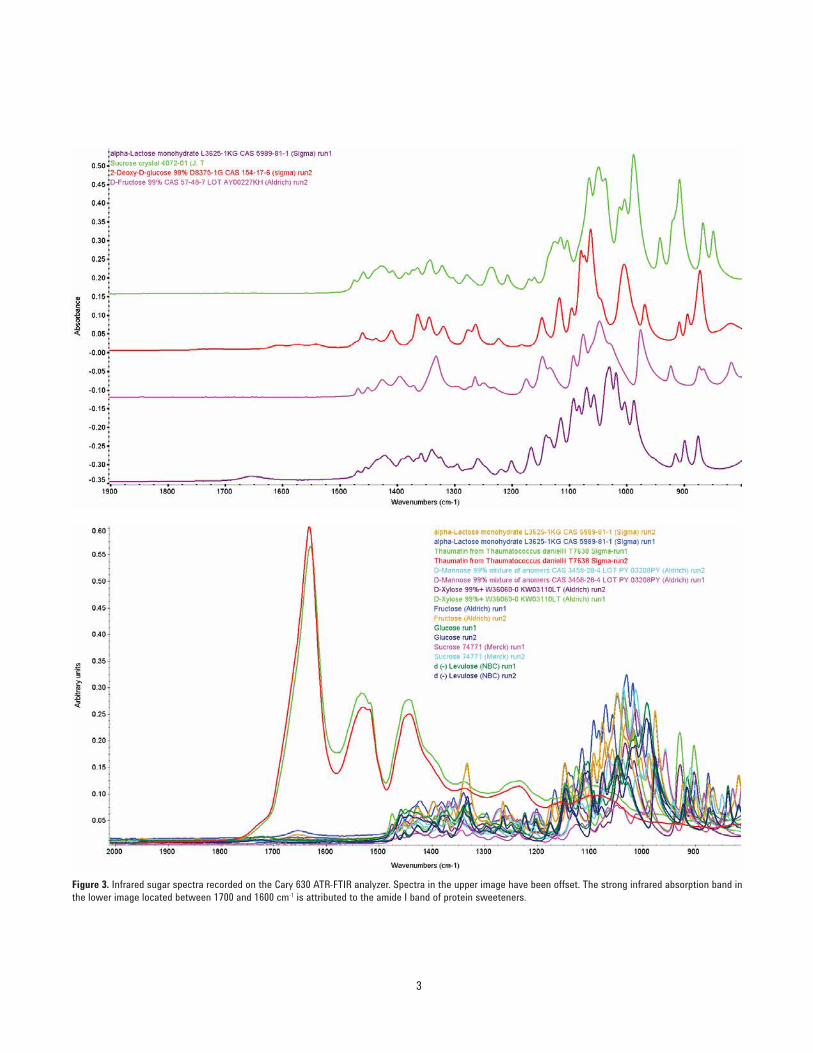
Results and discussion
All carbohydrate-based sugars possess strong and characteristic infrared absorptions between 1200 and 600 cm-1 attributed to C-O-H and C-O-C bonds (Figure 3, top). Protein-based sweeteners like thaumatin show unique absorption bands between 1700 and 1500 cm-1 (Figure 3, bottom), which can be attributed to the amide I and amide II absorption bands belonging to the proteins. Artifi cial sweeteners also possess unique absorptions depending on their chemical structure. Accordingly, the spectrum of a sugar can be easily assigned to a particular sugar class (carbohydrate, protein-based or artifi cial sweetener) and in most cases assigned with a high degree of accuracy to a specifi c sugar. Hence, when a new or unknown sweetener is received, its spectrum can be compared to those stored in the database of previously recorded sweeteners, and its identity can be correctly established by the MicroLab FTIR software (Figure 4).
3
Figure 3. Infrared sugar spectra recorded on the Cary 630 ATR-FTIR analyzer. Spectra in the upper image have been offset. The strong infrared absorption band in the lower image located between 1700 and 1600 cm-1 is attributed to the amide I band of protein sweeteners.

Conclusion
The Agilent Cary 630 ATR-FTIR is a robust, light-weight and compact (12 in long, 6 in wide, 9 in high and ~7 lb) analyzer that rapidly provides high quality spectra. It comes with very intuitive MicroLab FTIR analysis software for authenticating sugar samples by comparison to known spectra of reference standards. This makes the Cary 630 ATR-FTIR analyzer ideal for use at the receiving dock, on the production fl oor or it can be taken to the ingredient supplier depot for on-site verifi cation.
Figure 4. Correct identifi cation of an unknown sugar sample by the MicroLab FTIR software
4

5

www.agilent.com/chemAgilent shall not be liable for errors contained herein or for incidental or consequential damages in connection with the furnishing, performance or use of this material.
Information, descriptions, and specifi cations in this publication are subject to change without notice.
© Agilent Technologies, Inc. 2012Published November 28, 2012Publication number: 5991-0786EN

Introduction
Tea is the most widely consumed beverage after water. Teas are generally divided into categories based on processing techniques. The most commonly applied processes are oxidation and fermentation. There are many different tea varieties (Figure 1) including white, yellow, green, oolong, black and post-fermented. Some teas can be modifi ed further by the addition of additives or by blending different varieties to improve taste. Almost all teas sold in bags and other types of teas (leaves) in the world are blends.
Tea leaves contain more than 700 compounds including, fl avanoids, amino acids, vitamins (C, E and K), caffeine, polysaccharides, fl avanols, tannin, polyphenols and catechins. Catechins can make up to 30% of the dry weight of teas and their concentration is greatest in white and green teas, while black teas contain substantially fewer catechins.
QA/QC of tea using the Agilent Cary 630 ATR-FTIR analyzer
Application note
Zubair Farooq and Ashraf A. Ismail
McGill UniversityMcGill IR GroupDepartment of Food Science and Agricultural Chemistry Montreal, QuebecCanada
Food testing and agriculture
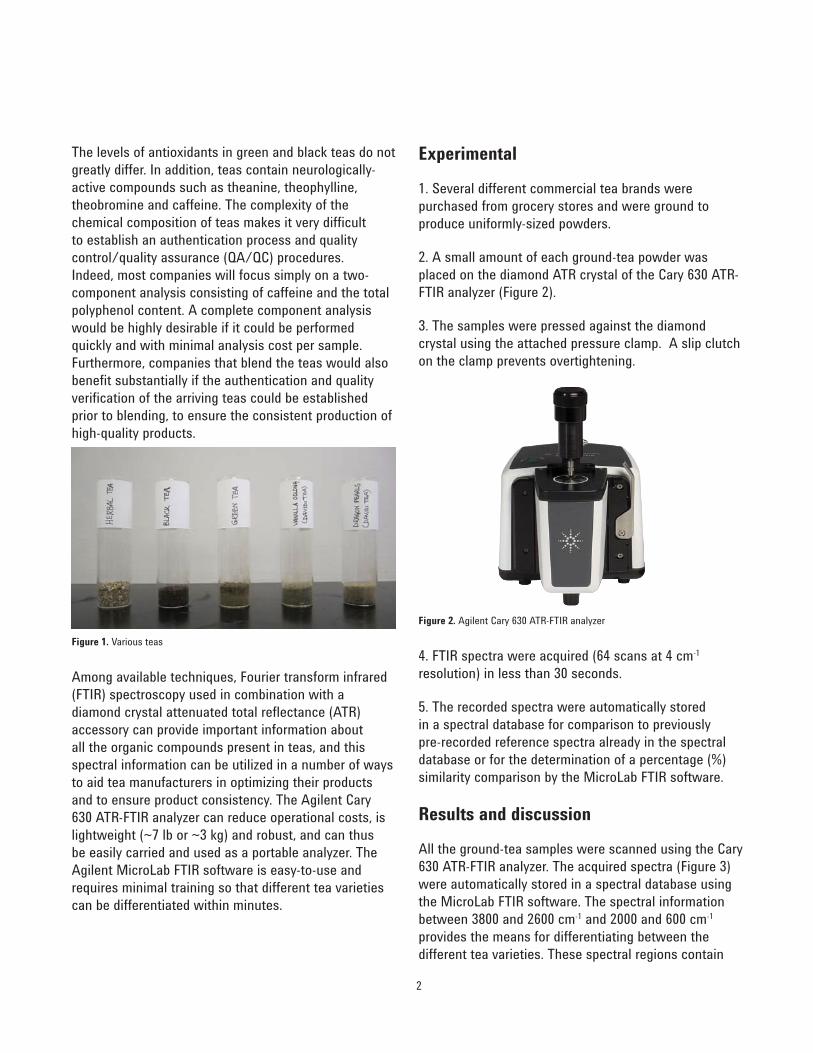
The levels of antioxidants in green and black teas do not greatly differ. In addition, teas contain neurologically-active compounds such as theanine, theophylline, theobromine and caffeine. The complexity of the chemical composition of teas makes it very diffi cult to establish an authentication process and quality control/quality assurance (QA/QC) procedures. Indeed, most companies will focus simply on a two-component analysis consisting of caffeine and the total polyphenol content. A complete component analysis would be highly desirable if it could be performed quickly and with minimal analysis cost per sample. Furthermore, companies that blend the teas would also benefi t substantially if the authentication and quality verifi cation of the arriving teas could be established prior to blending, to ensure the consistent production of high-quality products.
Figure 1. Various teas
Among available techniques, Fourier transform infrared (FTIR) spectroscopy used in combination with a diamond crystal attenuated total refl ectance (ATR) accessory can provide important information about all the organic compounds present in teas, and this spectral information can be utilized in a number of ways to aid tea manufacturers in optimizing their products and to ensure product consistency. The Agilent Cary 630 ATR-FTIR analyzer can reduce operational costs, is lightweight (~7 lb or ~3 kg) and robust, and can thus be easily carried and used as a portable analyzer. The Agilent MicroLab FTIR software is easy-to-use and requires minimal training so that different tea varieties can be differentiated within minutes.
2
Experimental
1. Several different commercial tea brands were purchased from grocery stores and were ground to produce uniformly-sized powders.
2. A small amount of each ground-tea powder was placed on the diamond ATR crystal of the Cary 630 ATR-FTIR analyzer (Figure 2).
3. The samples were pressed against the diamond crystal using the attached pressure clamp. A slip clutch on the clamp prevents overtightening.
Figure 2. Agilent Cary 630 ATR-FTIR analyzer
4. FTIR spectra were acquired (64 scans at 4 cm-1 resolution) in less than 30 seconds.
5. The recorded spectra were automatically stored in a spectral database for comparison to previously pre-recorded reference spectra already in the spectral database or for the determination of a percentage (%) similarity comparison by the MicroLab FTIR software.
Results and discussion
All the ground-tea samples were scanned using the Cary 630 ATR-FTIR analyzer. The acquired spectra (Figure 3) were automatically stored in a spectral database using the MicroLab FTIR software. The spectral information between 3800 and 2600 cm-1 and 2000 and 600 cm-1 provides the means for differentiating between the different tea varieties. These spectral regions contain
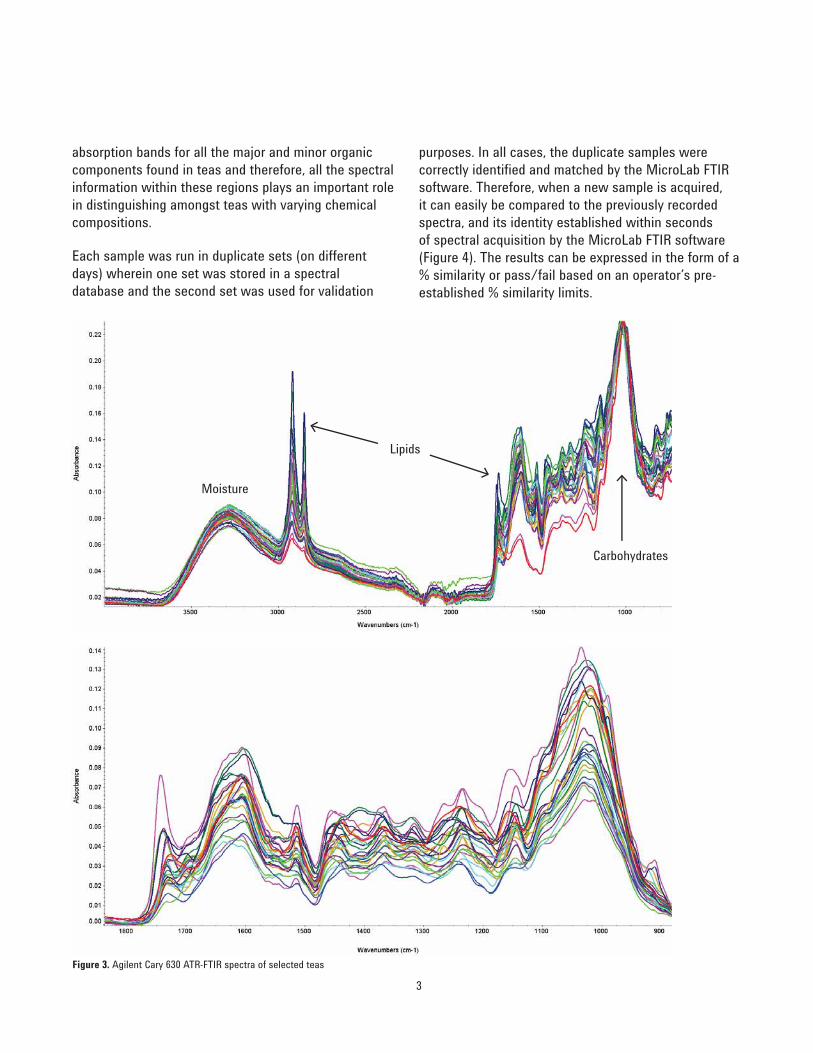
absorption bands for all the major and minor organic components found in teas and therefore, all the spectral information within these regions plays an important role in distinguishing amongst teas with varying chemical compositions.
Each sample was run in duplicate sets (on different days) wherein one set was stored in a spectral database and the second set was used for validation
3
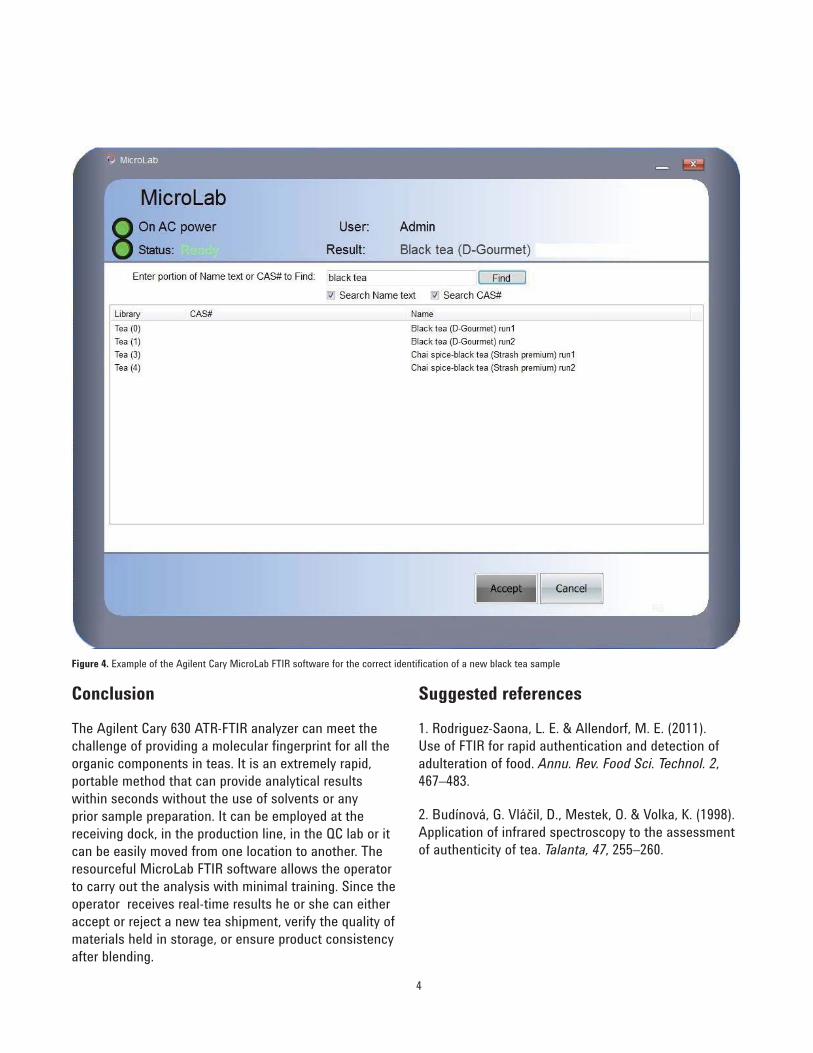
purposes. In all cases, the duplicate samples were correctly identifi ed and matched by the MicroLab FTIR software. Therefore, when a new sample is acquired, it can easily be compared to the previously recorded spectra, and its identity established within seconds of spectral acquisition by the MicroLab FTIR software (Figure 4). The results can be expressed in the form of a % similarity or pass/fail based on an operator’s pre-established % similarity limits.
Figure 3. Agilent Cary 630 ATR-FTIR spectra of selected teas
Moisture
Lipids
Carbohydrates
Conclusion
The Agilent Cary 630 ATR-FTIR analyzer can meet the challenge of providing a molecular fi ngerprint for all the organic components in teas. It is an extremely rapid, portable method that can provide analytical results within seconds without the use of solvents or any prior sample preparation. It can be employed at the receiving dock, in the production line, in the QC lab or it can be easily moved from one location to another. The resourceful MicroLab FTIR software allows the operator to carry out the analysis with minimal training. Since the operator receives real-time results he or she can either accept or reject a new tea shipment, verify the quality of materials held in storage, or ensure product consistency after blending.
Suggested references
1. Rodriguez-Saona, L. E. & Allendorf, M. E. (2011). Use of FTIR for rapid authentication and detection of adulteration of food. Annu. Rev. Food Sci. Technol. 2, 467–483.
2. Budίnová, G. Vláčil, D., Mestek, O. & Volka, K. (1998). Application of infrared spectroscopy to the assessment of authenticity of tea. Talanta, 47, 255–260.
4
Figure 4. Example of the Agilent Cary MicroLab FTIR software for the correct identifi cation of a new black tea sample

5

www.agilent.com/chemAgilent shall not be liable for errors contained herein or for incidental or consequential damages in connection with the furnishing, performance or use of this material.
Information, descriptions, and specifi cations in this publication are subject to change without notice.
© Agilent Technologies, Inc. 2012Published November 28, 2012Publication number: 5991-0787EN

Introduction
Milk is a common target for adulteration, which is of signifi cant concern to both producers and consumers. Some common milk adulterants include water, whey, sodium hydroxide, urea, melamine and other potentially harmful substances. The purpose of adulterating milk is to artifi cially increase the volume and/or mask inferior quality product for economic gain.
For this reason, there is signifi cant interest in rapid, easy to use analytical methods that can detect if milk is adulterated and then measure the levels of the adulterants in milk. In a recent publication [1], researchers measured adulterants in milk in the laboratory using the Agilent Cary 630 FTIR spectrometer and showed that the mid FTIR system is superior to NIR spectroscopy for these determinations.
With the recent availability of easy-to-use, dedicated FTIR analyzers, screening milk for adulteration and then measuring the specifi c contaminant levels is easier and faster than with traditional analytical methods. These FTIR analyzers are designed for use in at-site production locations by less experienced personnel and thus offer the dairy industry a means to improve productivity.
At-Site Screening and Measurement of Adulterant Levels in Bovine Milk by Mid FTIR Spectroscopy
Application note
Authors
Alan Rein, Ph.D.Agilent Technologies, Inc.
Professor Luis Rodriguez-Saona Food Science and Technology Department of Ohio State University
Food, QA/QC

Compact, at-site FTIR systems for methods development and methods deployment in the dairy industryAgilent now offers a family of ultra-compact FTIR spectrometers and analyzers (Figure 1), which all utilize the same optics, software and sampling technology [2]. If multi-purpose methods development and QA/QC is of primary interest, the Cary 630 FTIR spectrometer is ideal. For deployment of specifi c FTIR based solutions, the Agilent 5500 FTIR analyzer is an excellent platform for routine at-site analysis. Both of these systems use diamond ATR sampling technology for the analysis of solids and fi lms; Agilent’s exclusive DialPath transmission sampling technology is used for the analysis of liquid milk samples.
2
This application note will describe two distinct methods for measuring adulteration in milk:
• A screening method to detect that an adulteration has taken place, using an Agilent FTIR analyzer equipped with DialPath sampling technology
• Identifi cation and measurement of specifi c adulterants, using an Agilent FTIR analyzer equipped with diamond ATR sampling technology
In the screening method, the milk is measured directly with no sample preparation, leading to an extremely fast analysis. Using this technique on the dedicated Agilent 5500 or 4500 FTIR spectrometer allows for effi cient screening at the point of delivery.
To get accurate identifi cation and measurement of the adulterant, a second method is employed that uses simple sample preparation steps. This latter technique provides a fast alternative to classical analytical methods of determining milk contamination levels.
Experimental
InstrumentationTable 1. Spectrometer parameters used for both screening and specifi c identifi cation methods
Parameter SettingsScreening DialPath technology 30 micron
pathlengthMeasurement ATR technology single refl ection
diamond ATRFTIR spectra 64 co-added interferograms
Resolution 4 cm-1
Measurement time per sample Approx. 30 seconds
Materials and reagentsPreparation of milk standards for analysisCommercial bovine milk samples were mixed with varying amounts of tap water, whey, synthetic milk, synthetic urine, urea and hydrogen peroxide. These materials were chosen because they are reported as common adulterants in certain countries for either increasing volume, adding nitrogen (to provide better results from Kjeldahl protein assays) or to sanitize the milk (hydrogen peroxide).
The overall dilution of the milk by adulterants was from 3 to 50% v/v. The concentrations of specifi c adulterants spiked into milk samples was: 1.87 – 30 g/L for whey; 0.78 – 12.5 g/L of urea and synthetic urine; 0.05 – 0.8 g/L of urea for synthetic milk and 0.009 – 0.15 g/L for hydrogen peroxide. Six lots of milk were adulterated with fi ve levels of contaminants resulting in 30 adulterated samples per lot.
For adulerant screening, two drops each of the spiked liquid samples were measured with the DialPath sampling technology (Table 1).
For measuring each adulterant individually, the spiked samples were mixed in equal volumes with chloroform to extract the fat matrix interference. The water soluble supernatant was then applied to the diamond ATR sensor and vacuum dried to form a fi lm (Table 1).
Figure 1. Agilent Cary 630 FTIR spectrometer for routine QA/QC and methods development and the Agilent 5500 FTIR analyzer for deployment of methods in at-site production labs.
Results and discussion
Screening
3
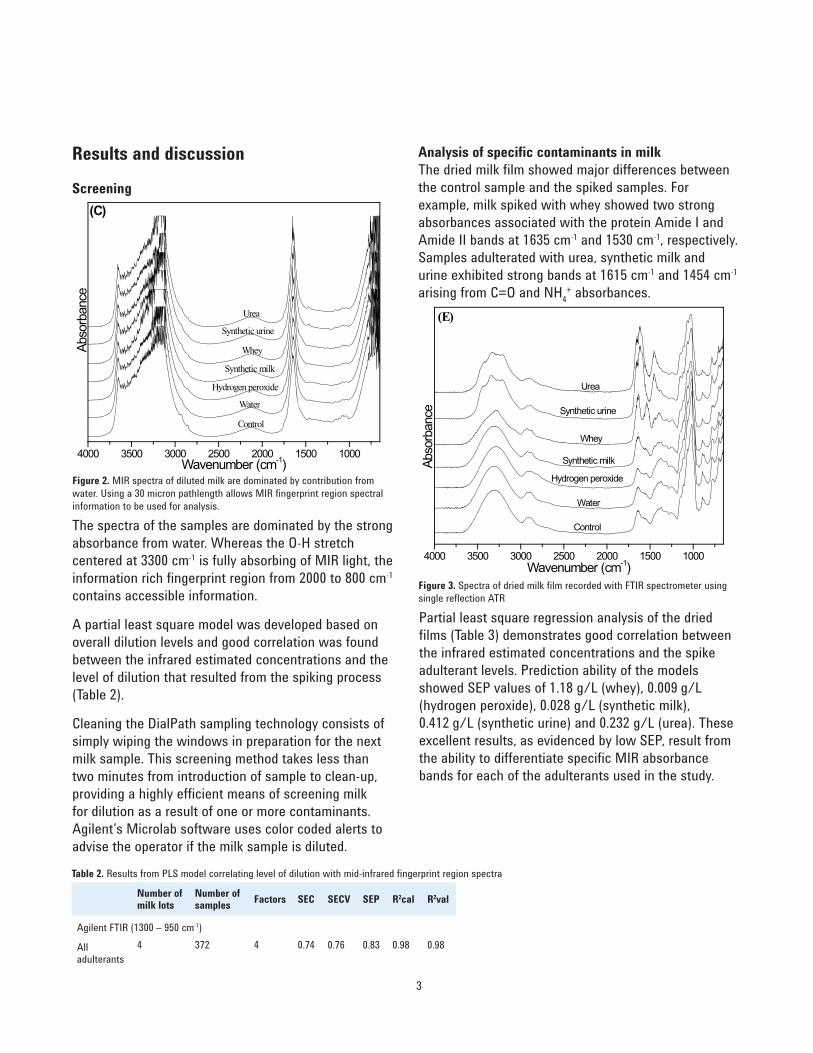
Figure 2. MIR spectra of diluted milk are dominated by contribution from water. Using a 30 micron pathlength allows MIR fi ngerprint region spectral information to be used for analysis.
The spectra of the samples are dominated by the strong absorbance from water. Whereas the O-H stretch centered at 3300 cm-1 is fully absorbing of MIR light, the information rich fi ngerprint region from 2000 to 800 cm-1 contains accessible information.
A partial least square model was developed based on overall dilution levels and good correlation was found between the infrared estimated concentrations and the level of dilution that resulted from the spiking process (Table 2).
Cleaning the DialPath sampling technology consists of simply wiping the windows in preparation for the next milk sample. This screening method takes less than two minutes from introduction of sample to clean-up, providing a highly effi cient means of screening milk for dilution as a result of one or more contaminants. Agilent’s Microlab software uses color coded alerts to advise the operator if the milk sample is diluted.
Analysis of specifi c contaminants in milkThe dried milk fi lm showed major differences between the control sample and the spiked samples. For example, milk spiked with whey showed two strong absorbances associated with the protein Amide I and Amide II bands at 1635 cm-1 and 1530 cm-1, respectively. Samples adulterated with urea, synthetic milk and urine exhibited strong bands at 1615 cm-1 and 1454 cm-1 arising from C=O and NH4
+ absorbances.
4000 3500 3000 2500 2000 1500 1000
Urea
Synthetic urine
Whey
Synthetic milk
Hydrogen peroxide
Water
Abs
orba
nce
Wavenumber (cm-1)
Control
(C)
Figure 3. Spectra of dried milk fi lm recorded with FTIR spectrometer using single refl ection ATR
4000 3500 3000 2500 2000 1500 1000
(E)
Urea
Whey
Synthetic urine
Synthetic milk
Hydrogen peroxide
Water
Control
Abs
orba
nce
Wavenumber (cm-1)
Partial least square regression analysis of the dried fi lms (Table 3) demonstrates good correlation between the infrared estimated concentrations and the spike adulterant levels. Prediction ability of the models showed SEP values of 1.18 g/L (whey), 0.009 g/L (hydrogen peroxide), 0.028 g/L (synthetic milk), 0.412 g/L (synthetic urine) and 0.232 g/L (urea). These excellent results, as evidenced by low SEP, result from the ability to differentiate specifi c MIR absorbance bands for each of the adulterants used in the study.
Table 2. Results from PLS model correlating level of dilution with mid-infrared fi ngerprint region spectra
Number of milk lots
Number of samples Factors SEC SECV SEP R2cal R2val
Agilent FTIR (1300 – 950 cm-1)
All adulterants
4 372 4 0.74 0.76 0.83 0.98 0.98
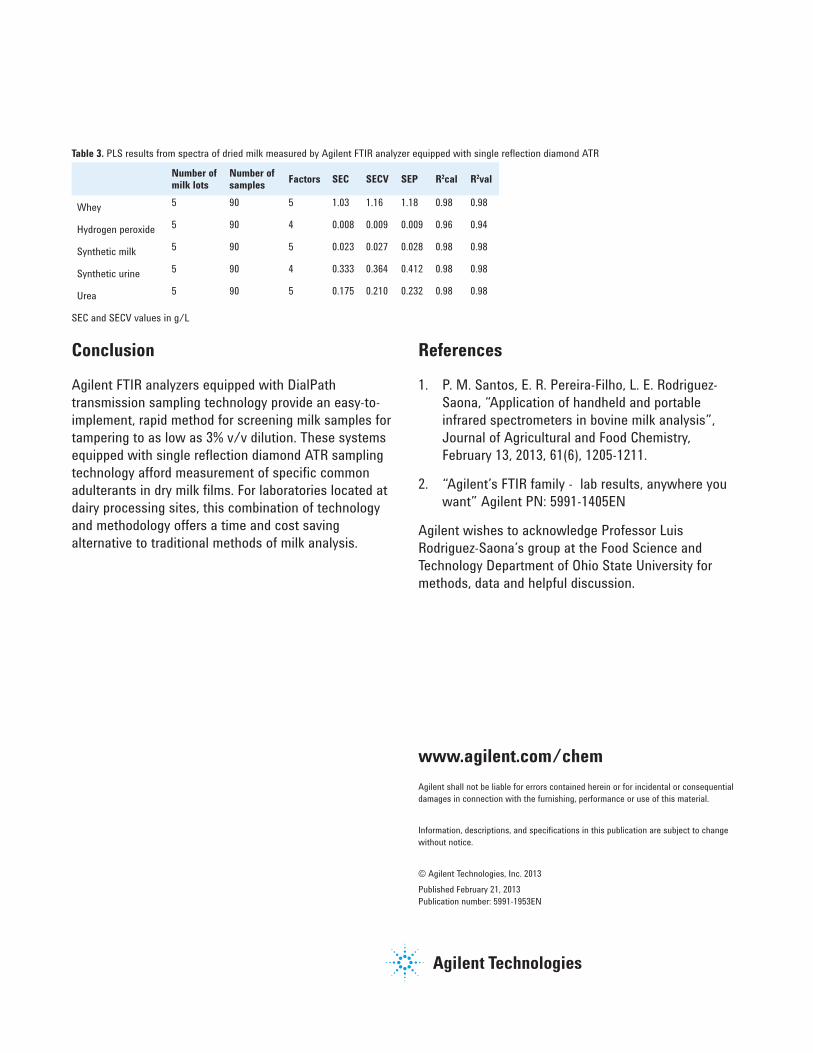
Table 3. PLS results from spectra of dried milk measured by Agilent FTIR analyzer equipped with single refl ection diamond ATR
Number of milk lots
Number of samples Factors SEC SECV SEP R2cal R2val
Whey 5 90 5 1.03 1.16 1.18 0.98 0.98
Hydrogen peroxide 5 90 4 0.008 0.009 0.009 0.96 0.94
Synthetic milk 5 90 5 0.023 0.027 0.028 0.98 0.98
Synthetic urine 5 90 4 0.333 0.364 0.412 0.98 0.98
Urea 5 90 5 0.175 0.210 0.232 0.98 0.98
SEC and SECV values in g/L
www.agilent.com/chemAgilent shall not be liable for errors contained herein or for incidental or consequential damages in connection with the furnishing, performance or use of this material.
Information, descriptions, and specifi cations in this publication are subject to change without notice.
© Agilent Technologies, Inc. 2013Published February 21, 2013Publication number: 5991-1953EN
Conclusion
Agilent FTIR analyzers equipped with DialPath transmission sampling technology provide an easy-to-implement, rapid method for screening milk samples for tampering to as low as 3% v/v dilution. These systems equipped with single refl ection diamond ATR sampling technology afford measurement of specifi c common adulterants in dry milk fi lms. For laboratories located at dairy processing sites, this combination of technology and methodology offers a time and cost saving alternative to traditional methods of milk analysis.
References
1. P. M. Santos, E. R. Pereira-Filho, L. E. Rodriguez-Saona, “Application of handheld and portable infrared spectrometers in bovine milk analysis”, Journal of Agricultural and Food Chemistry, February 13, 2013, 61(6), 1205-1211.
2. “Agilent’s FTIR family - lab results, anywhere you want” Agilent PN: 5991-1405EN
Agilent wishes to acknowledge Professor Luis Rodriguez-Saona’s group at the Food Science and Technology Department of Ohio State University for methods, data and helpful discussion.

Introduction
Counterfeit and illegally sold pesticides are a rapidly growing global problem, which affects food production, the health of farmers and consumers, and the overall environment including benefi cial insects and animals. In Europe and the U.S, it is estimated that over a billion dollars in illegal pesticides are sold yearly. In some areas of the world, more than 25% of pesticides are counterfeit.
Counterfeit pesticides are generally classifi ed1 as: fakes, which contain no biologically active ingredients or are highly diluted or banned pesticides; counterfeits, which have packaging that is authentic in appearance but contain impure or incorrect chemicals or illegal imports, which are generic copies of legitimate products.
There is compelling need to eliminate the trade in illegal pesticides and there are ample rules and regulations, but not enough enforcement. With the increasing availability of mobile and portable analytical instrumentation, those agencies and personnel responsible for ensuring pesticide safety and usage have powerful new tools to address the problem.
Pesticide Authentication by Portable FTIR Spectroscopy
Authors
Shannon RichardAlan Rein
Agilent Technologies,Danbury CT, USA
Application noteFood

In this application note, we demonstrate how a portable FTIR spectrometer can be used to rapidly analyze pesticides before distribution, before mixing, and/or before application to crops.
Advantages of Portable FTIR Analyzers for the Analysis of Pesticides
Mobile FTIR offers a number of advantages for personnel involved in ensuring the authenticity of pesticides:
• Mid infrared spectroscopy provides a detailed fi ngerprint of the chemical structure of the suspect pesticide.
◦ Verifi es identity of pesticides and identifi es diluted, inert, banned or improperly identifi ed agents.
◦ Differentiates closely related pesticides based on spectral fi ngerprint.
• Analysis requires no sample preparation. Results on suspect samples are obtained in less than one minute using the on-board library of pesticides.
◦ Large numbers of containers can be rapidly assessed in distribution, warehouse or other locations.
• At site analysis enables personnel to make real-time actionable decisions.
◦ Off specifi cation pesticides can be stopped before they are shipped or applied to a fi eld.
2
The Agilent 4500 FTIR and 5500 FTIR systems (Figures 1a and1b) are well suited to the analysis of pesticides:
• The 4500 FTIR system is fully portable and battery powered. This enables true at-site measurements of pesticides regardless of location.
• The 5500 FTIR system is a bench top system well suited to fi xed, at-site labs or in mobile van based labs.
• Both systems utilize an ATR element as the sampling sensor; the diamond sensor is immune to chemical attack by corrosive substances. One drop of pesticide is required for analysis.
• The MicroLab software is intuitive and highly visual. Colored alerts alert the user to the presence of off-specifi cation pesticide.
• The MicroLab software compares the spectrum of the suspect pesticide to spectra contained in an on-board library to instantly verify or disprove identity.
Material and Methods
A series of pesticides were analyzed using the Agilent 4500a portable FTIR system outfi tted with single refl ection diamond ATR sensor. The pesticides that were analyzed included cis-chlordane, trans-chlordane, aldrin, lindane and campheclor. Approximately 0.5 µL of each pesticide was placed on the diamond ATR sensor. The recorded spectra consisted of 64 co-added interferograms measured at 4 cm-1 resolution. Spectra were searched against the a commercially available pesticides library from ST Japan, and the identity of the sample pesticide was determined in less than one minute
Figure 1a. The Agilent 5500 FTIR analyzer equipped with diamond ATR sampling technology for use in at-site labs.
Figure 1b. The Agilent 4500 battery powered FTIR analyzer for similar measurements in out-of-lab applications.
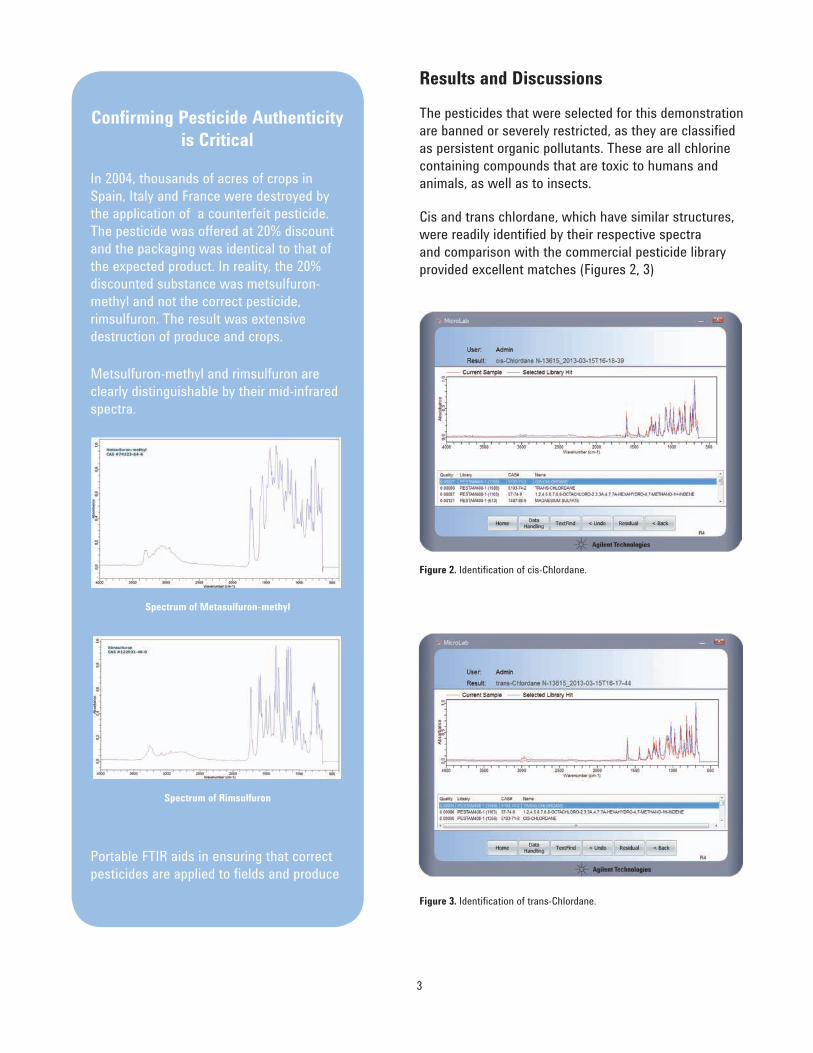
3
Figure 2. Identifi cation of cis-Chlordane.
Figure 3. Identifi cation of trans-Chlordane.
Results and Discussions
The pesticides that were selected for this demonstration are banned or severely restricted, as they are classifi ed as persistent organic pollutants. These are all chlorine containing compounds that are toxic to humans and animals, as well as to insects.
Cis and trans chlordane, which have similar structures, were readily identifi ed by their respective spectra and comparison with the commercial pesticide library provided excellent matches (Figures 2, 3)
Confi rming Pesticide Authenticity is Critical
In 2004, thousands of acres of crops in Spain, Italy and France were destroyed by the application of a counterfeit pesticide. The pesticide was offered at 20% discount and the packaging was identical to that of the expected product. In reality, the 20% discounted substance was metsulfuron-methyl and not the correct pesticide, rimsulfuron. The result was extensive destruction of produce and crops.
Metsulfuron-methyl and rimsulfuron are clearly distinguishable by their mid-infrared spectra.
Portable FTIR aids in ensuring that correct pesticides are applied to fi elds and produce
Spectrum of Metasulfuron-methyl
Spectrum of Rimsulfuron
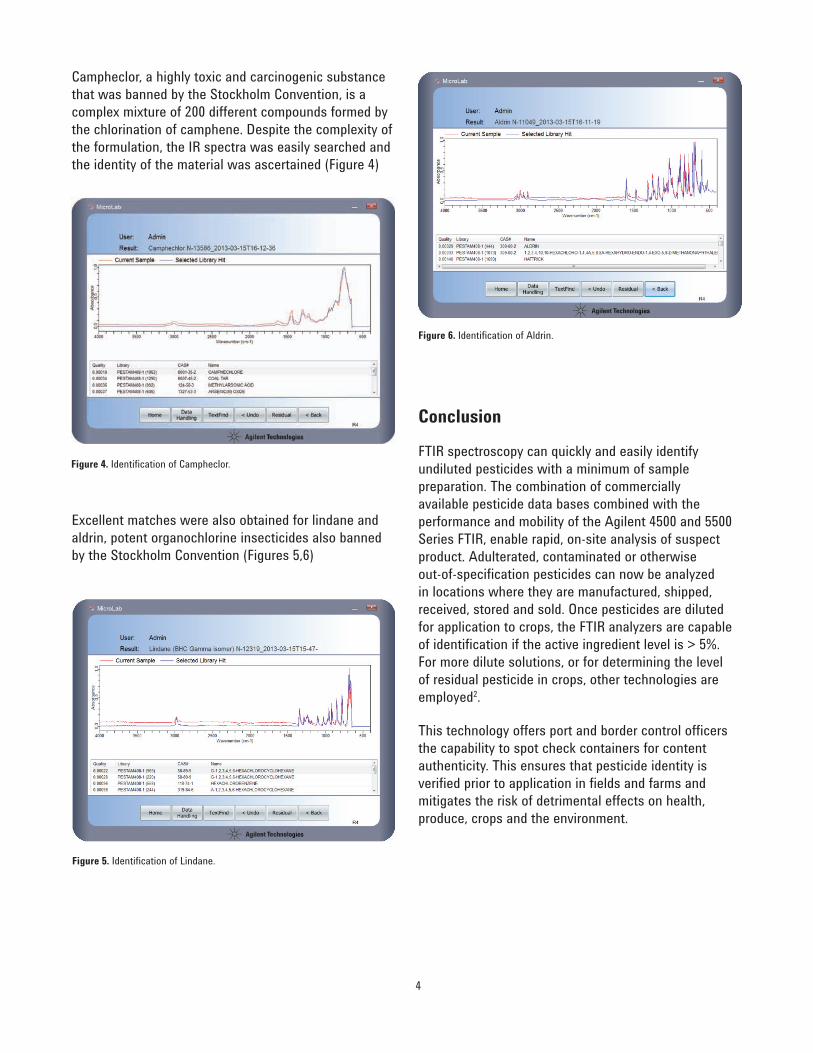
Campheclor, a highly toxic and carcinogenic substance that was banned by the Stockholm Convention, is a complex mixture of 200 different compounds formed by the chlorination of camphene. Despite the complexity of the formulation, the IR spectra was easily searched and the identity of the material was ascertained (Figure 4)
Excellent matches were also obtained for lindane and aldrin, potent organochlorine insecticides also banned by the Stockholm Convention (Figures 5,6)
Conclusion
FTIR spectroscopy can quickly and easily identify undiluted pesticides with a minimum of sample preparation. The combination of commercially available pesticide data bases combined with the performance and mobility of the Agilent 4500 and 5500 Series FTIR, enable rapid, on-site analysis of suspect product. Adulterated, contaminated or otherwise out-of-specifi cation pesticides can now be analyzed in locations where they are manufactured, shipped, received, stored and sold. Once pesticides are diluted for application to crops, the FTIR analyzers are capable of identifi cation if the active ingredient level is > 5%. For more dilute solutions, or for determining the level of residual pesticide in crops, other technologies are employed2.
This technology offers port and border control offi cers the capability to spot check containers for content authenticity. This ensures that pesticide identity is verifi ed prior to application in fi elds and farms and mitigates the risk of detrimental effects on health, produce, crops and the environment.
Figure 4. Identifi cation of Campheclor.
Figure 5. Identifi cation of Lindane.
Figure 6. Identifi cation of Aldrin.
4

Suggested Confi guration
0021-010 4500a FTIR Single Refl ection ATR
G8046AA#117 ATR Pesticides Library from ST Japan
References1 Frederick Fishel, The Global Increase in Counterfeit Pesticides, Institute of Food and Agricultural Sciences, University of Florida (2009).
2 Agilent Publication, Accelerated Analysis of On-Site Pesticide Detection in Vegetables by Agilent 5975T LTM GC/MSD and TSP, 5990-8067EN, June 8, 2011.
5

www.agilent.comAgilent shall not be liable for errors contained herein or for incidental or consequential damages in connection with the furnishing, performance or use of this material.
Information, descriptions, and specifi cations in this publication are subject to change without notice.© Agilent Technologies, Inc. 2013Published June 11, 2013Publication number: 5991-2531EN
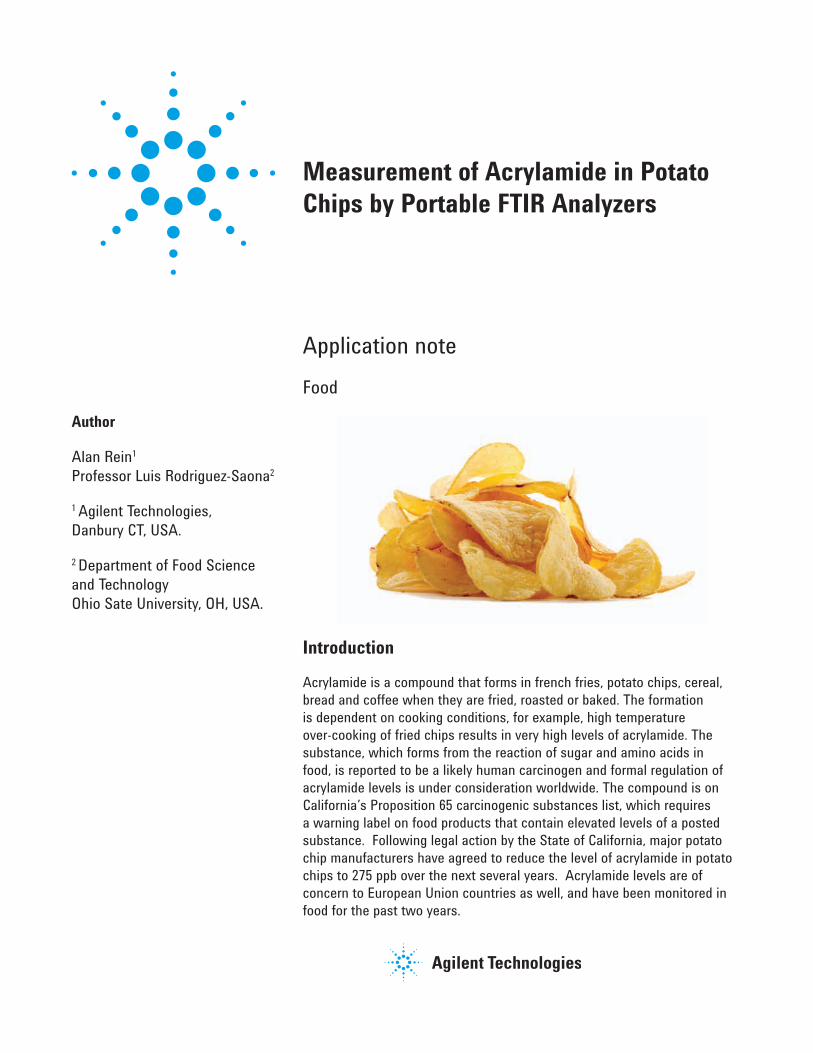
Introduction
Acrylamide is a compound that forms in french fries, potato chips, cereal, bread and coffee when they are fried, roasted or baked. The formation is dependent on cooking conditions, for example, high temperature over-cooking of fried chips results in very high levels of acrylamide. The substance, which forms from the reaction of sugar and amino acids in food, is reported to be a likely human carcinogen and formal regulation of acrylamide levels is under consideration worldwide. The compound is on California’s Proposition 65 carcinogenic substances list, which requires a warning label on food products that contain elevated levels of a posted substance. Following legal action by the State of California, major potato chip manufacturers have agreed to reduce the level of acrylamide in potato chips to 275 ppb over the next several years. Acrylamide levels are of concern to European Union countries as well, and have been monitored in food for the past two years.
Measurement of Acrylamide in Potato Chips by Portable FTIR Analyzers
Author
Alan Rein1
Professor Luis Rodriguez-Saona2
1 Agilent Technologies,Danbury CT, USA.
2 Department of Food Science and TechnologyOhio Sate University, OH, USA.
Application noteFood

The current methods for determining the level of acrylamide in foods use GC-MS and LC-MS/MS, which require signifi cant sample preparation, specialized instrumentation and knowledgeable operators. Food producers often turn to third party laboratories for the measurement of acrylamide. Thus, there is a need for rapid, accurate and real-time measurement of acrylamide to allow monitoring and controlling of acrylamide formation during food processing.
In a recent article [1], it was shown that a portable FTIR gave equivalent and in some cases better measurement of acrylamide when compared to a traditional lab FTIR and NIR spectrometers. This result was accomplished using a method that requires far less sample preparation than the LC-MS/MS method. In this application note, we summarize the fi ndings of that work and demonstrate that FTIR spectroscopy employing compact, easy to-use FTIR analyzers provides acrylamide level measurements that are equivalent to the referenced mass spectroscopy method with less sample preparation.
2
This combination of technology and methodology provides more rapid, at-site acrylamide measurements and provides information to help control the cooking process conditions. The FTIR procedure also provides an easier and faster quality control method for measuring acrylamide levels in fi nished foodstuffs.
Compact at-site FTIR systems to develop and deploy methods for detecting acrylamide
Portable FTIR analyzers have signifi cant value to the food industry. With increasing globalization of food sources, quality and safety is of paramount importance to consumers, regulatory agencies and the companies involved in growing and processing food and food ingredients. The value of portable FTIR analyzers arises from the ability to:
• Identify and verify food ingredients when and where needed.
• Eliminate adulterated, counterfeit or out-of-spec ingredients.
• Detect, identify and measure contaminants in food and food ingredients.
• Get answers at collection, receiving and processing sites, as well as at farms or fi elds.
• Aid in keeping harmful or out-of-spec ingredients and foods “at the factory gate”.
• Allow actionable, on the spot decisions to proactively improve quality, safety and production effi ciency.
Agilent offers a family of highly compact FTIR spectrometers and analyzers (Figure 1a and 1b), which all utilize the same optics, software and sampling technology [2]. If multi-purpose methods development and QA/QC is of primary interest, the Cary 630 FTIR spectrometer (not shown) is most suitable. For deployment of the FTIR based acrylamide method, the Agilent 5500 FTIR analyzer is recommended for at-site lab analysis. For analyses of acrylamide in non-lab environments, the Agilent 4500 battery powered FTIR analyzer is ideal. For the acrylamide FTIR method, these systems all employ diamond ATR sampling technology.
Figure 1a. The Agilent 5500 FTIR analyzer equipped with diamond ATR sampling technology for use in at-site labs measuring acrylamide.
Figure 1b. The Agilent 4500 battery powered FTIR analyzer for similar measurements in out-of-lab applications.
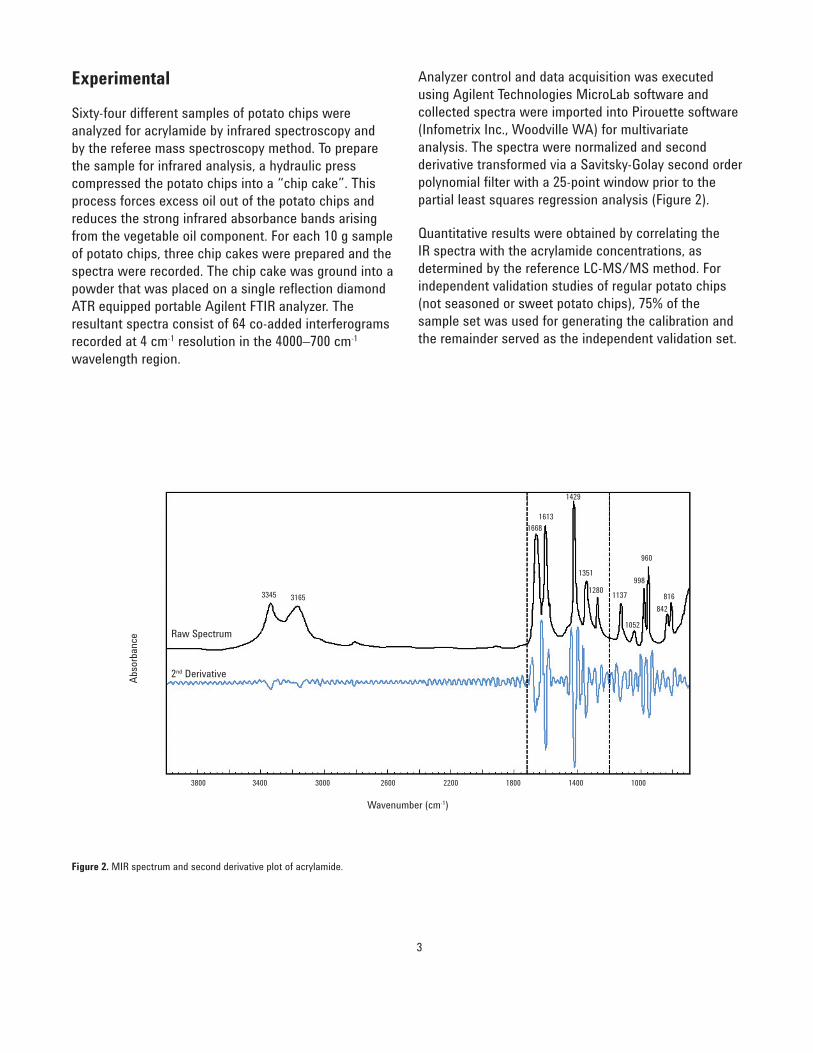
3
Figure 2. MIR spectrum and second derivative plot of acrylamide.
Experimental
Sixty-four different samples of potato chips were analyzed for acrylamide by infrared spectroscopy and by the referee mass spectroscopy method. To prepare the sample for infrared analysis, a hydraulic press compressed the potato chips into a “chip cake”. This process forces excess oil out of the potato chips and reduces the strong infrared absorbance bands arising from the vegetable oil component. For each 10 g sample of potato chips, three chip cakes were prepared and the spectra were recorded. The chip cake was ground into a powder that was placed on a single refl ection diamond ATR equipped portable Agilent FTIR analyzer. The resultant spectra consist of 64 co-added interferograms recorded at 4 cm-1 resolution in the 4000–700 cm-1 wavelength region.
Analyzer control and data acquisition was executed using Agilent Technologies MicroLab software and collected spectra were imported into Pirouette software (Infometrix Inc., Woodville WA) for multivariate analysis. The spectra were normalized and second derivative transformed via a Savitsky-Golay second order polynomial fi lter with a 25-point window prior to the partial least squares regression analysis (Figure 2).
Quantitative results were obtained by correlating the IR spectra with the acrylamide concentrations, as determined by the reference LC-MS/MS method. For independent validation studies of regular potato chips (not seasoned or sweet potato chips), 75% of the sample set was used for generating the calibration and the remainder served as the independent validation set.
Wavenumber (cm-1)
Abso
rban
ce Raw Spectrum
2nd Derivative
3800 3400 3000 2600 2200 1800
842816
960
998
1052
11371280
1351
1429
16131668
31653345
1400 1000

4
Wavenumber (cm-1)
Abso
rban
ce
Acrylamide concentration measured by LC-MS/MS (µg/kg)
Pred
icted
acr
ylam
ide co
ncen
tratio
n (µ
g/kg
)
3800 3400 3000 2600 2200 1800 1400 1000
00
200
200
400
400
600
600
800
800
1000
1000
1200
1200
Results and Discussion
The acrylamide levels in potato chips, as determined by the reference LC-MS/MS method varied from 169 to 2453 µg/kg (169 to 2453 ppb). LOD and LOQ concentrations for the mass spec method were calculated to be 18 and 55 micrograms/liter.
Loading plots of the fi rst two factors in the PLS correlation showed that the highest relevant variation in the calibration set for acrylamide content was in the range of 1201–1699 cm-1.
The strong 1730 cm-1 absorbance band in the spectrum of potato chip cake (Figure 3) arises from fat, and is excluded in the PLSR model.
Figure 3. Spectrum of regular potato chip cake as measured by portable FTIR analyzer equipped with single refl ection diamond ATR sample technology.
.
Figure 4. Correlation between infrared estimated levels and reference acrylamide values. The white squares represent samples in calibration groups; black squares represent samples used in validation groups.
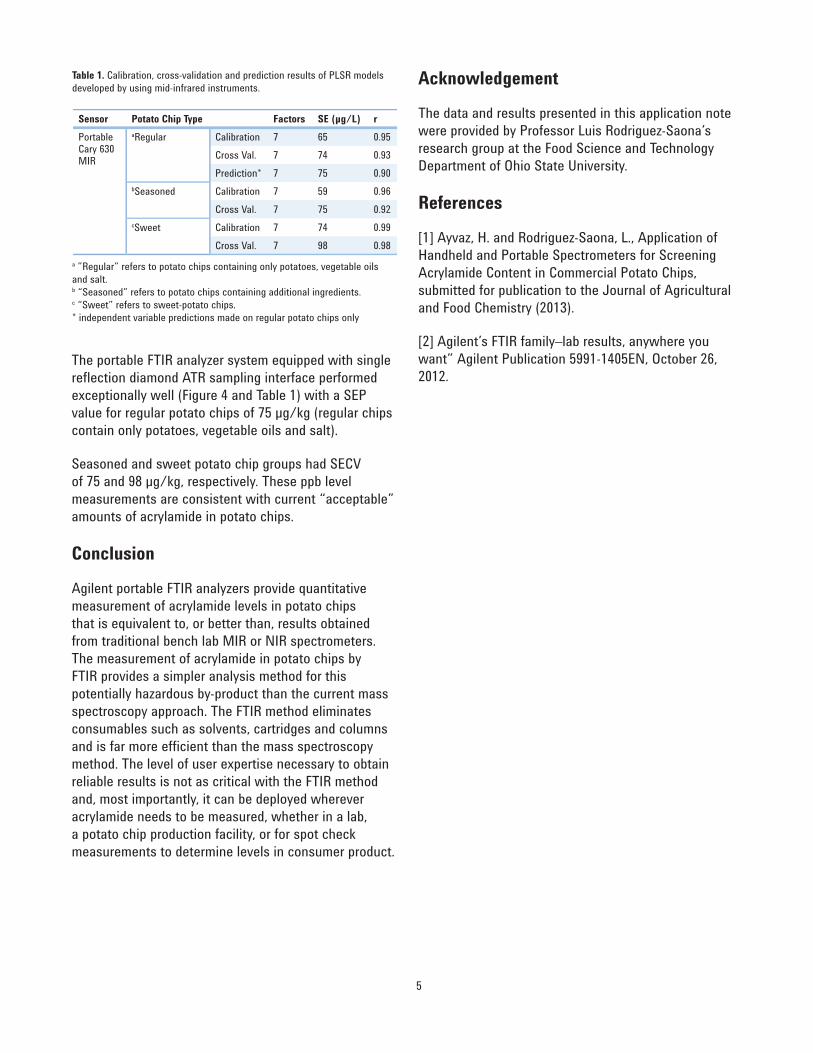
5
Sensor Potato Chip Type Factors SE (µg/L) rPortable Cary 630 MIR
aRegular Calibration 7 65 0.95Cross Val. 7 74 0.93Prediction* 7 75 0.90
bSeasoned Calibration 7 59 0.96Cross Val. 7 75 0.92
cSweet Calibration 7 74 0.99Cross Val. 7 98 0.98
The portable FTIR analyzer system equipped with single refl ection diamond ATR sampling interface performed exceptionally well (Figure 4 and Table 1) with a SEP value for regular potato chips of 75 µg/kg (regular chips contain only potatoes, vegetable oils and salt).
Seasoned and sweet potato chip groups had SECV of 75 and 98 µg/kg, respectively. These ppb level measurements are consistent with current “acceptable” amounts of acrylamide in potato chips.
Conclusion
Agilent portable FTIR analyzers provide quantitative measurement of acrylamide levels in potato chips that is equivalent to, or better than, results obtained from traditional bench lab MIR or NIR spectrometers. The measurement of acrylamide in potato chips by FTIR provides a simpler analysis method for this potentially hazardous by-product than the current mass spectroscopy approach. The FTIR method eliminates consumables such as solvents, cartridges and columns and is far more effi cient than the mass spectroscopy method. The level of user expertise necessary to obtain reliable results is not as critical with the FTIR method and, most importantly, it can be deployed wherever acrylamide needs to be measured, whether in a lab, a potato chip production facility, or for spot check measurements to determine levels in consumer product.
Table 1. Calibration, cross-validation and prediction results of PLSR models developed by using mid-infrared instruments. Acknowledgement
The data and results presented in this application note were provided by Professor Luis Rodriguez-Saona’s research group at the Food Science and Technology Department of Ohio State University.
References
[1] Ayvaz, H. and Rodriguez-Saona, L., Application of Handheld and Portable Spectrometers for Screening Acrylamide Content in Commercial Potato Chips, submitted for publication to the Journal of Agricultural and Food Chemistry (2013).
[2] Agilent’s FTIR family–lab results, anywhere you want” Agilent Publication 5991-1405EN, October 26, 2012.
a ”Regular” refers to potato chips containing only potatoes, vegetable oils and salt.b “Seasoned” refers to potato chips containing additional ingredients.c “Sweet” refers to sweet-potato chips.* independent variable predictions made on regular potato chips only

www.agilent.comAgilent shall not be liable for errors contained herein or for incidental or consequential damages in connection with the furnishing, performance or use of this material.
Information, descriptions, and specifi cations in this publication are subject to change without notice.© Agilent Technologies, Inc. 2013Published June 21, 2013Publication number: 5991-2532EN
Determination of phosphorus
concentration in hydroponics solution
Application Note
Author
Sharon Lim
Agilent Technologies, Inc.
Mulgrave, Victoria 3170,
Australia
Introduction
Phosphates exist in many forms in water. They can occur as
orthophosphates, condensed phosphates such as pyro, meta and
polyphosphates or as organically bound phosphates.1 The major pollution
sources of phosphates in natural waters are detergents used in industry and
fertilizers from agricultural farming.
The use of fertilizers is increasing. Phosphates in fertilizer and farm runoffs
have to be monitored in order to prevent the possibility of polluting the
surrounding environment. The excessive enrichment of natural waters with
plant nutrients, known as eutrophication, can result in overabundant growth
of undesirable algae and aquatic plants, affecting water quality.2,3
Solution spectrophotometry still remains an essential and reliable analytical
method for routine water analysis, particularly for the determination of
nutrient elements such as nitrogen and phosphorus.
Spectrophotometric methods often require the initial conversion of
phosphates to soluble orthophosphates which can then be determined
colorimetrically. Orthophosphates can be analyzed quantitatively by three
methods:
1. Vanadomolybdophosphoric acid method
2. Stannous chloride method
3. Ascorbic acid method

2
Methods 1 and 2 were used in this study to quantitate
and confirm an unknown phosphorus concentration in a
hydroponics solution. These methods are suitable for
determining the level of phosphates such as KH2PO4
and NH4H2PO4 added into fertilizers and hydroponics as
sources of phosphorus. It is also important that the
phosphate level conforms to plant requirements. If
excess phosphates are used, this could lead to the
death of plants as well as excess phosphate in runoffs.
Equipment
Instrument: Cary 1
Concentration Application software
Methodology
Digestion
Pretreatment of the hydroponics sample
The hydroponics sample was digested first, using the
potassium persulfate method as described in
reference 1. Acid digestion is necessary if total
phosphorus is to be determined as phosphorus may be
present in combination with organic matter.
Apparatus
1. Hot plate
2. Weighing boats
Reagents
1. Phenolpthalein indicator aqueous solution
2. Sulfuric acid solution (300 mL conc H2SO4 in
1 L H2O)
3. Potassium persulfate K2S2O8
4. Sodium hydroxide NaOH, 1 N
Procedure
1. One drop (0.05 mL) phenolpthalein was added to 50
mL of sample. If red color developed H2SO4 was
added to discharge the color.
2. One mL H2SO4 and 0.5 g solid K2S2O8 were then
added.
3. The solution was boiled gently on a preheated hot
plate for 30 to 40 mins or until 10 mL remained.
4. It was then cooled and diluted to 30 mL with
distilled H2O.
5. One drop (0.05 mL) phenolpthalein was added,
followed by NaOH until the solution was faintly
pink.
6. The solution was then made up to 100 mL with
distilled water.
Phosphate analysis
The phosphorus in the sample solution was then
determined by Methods 1 and 2.
Separate calibration graphs were constructed using
phosphate standards that were also pretreated with
persulfate.
Method 1:
Vanadomolybdophosphoric acid method
A wavelength of 470 nm was used. The yellow color
was due to the molybdophosphoric acid in the presence
of vanadium. The intensity of the yellow color from this
complex formation was proportional to the phosphate
concentration. Glassware was acid washed before use.
The procedure is as described in reference 1.
Reagents
1. Phenolpthalein indicator solution
2. HCL solution (0.5 N)
3. Activated carbon
4. Vanadate-molybdate reagent
Solution A: 2.5 g of ammonium molybdate
(NH4)6Mo7024.4H2O was dissolved in 30.0 mL of distilled
water.
Solution B: 0.125 g of ammonium metavanadate was
dissolved by heating to boiling point in 30 mL of
distilled water. It was cooled and 33 mL concentrated
HCL was added.

3
Solution C: After cooling to room temperature,
Solution A was mixed with Solution B, and diluted to
100 mL.
5. Standard phosphate solutions:
22.068 mg of anhydrous KH2PO4 was dissolved in
distilled water and diluted to 100 mL. Thus, 1mL =
50.3µg PO43--P.
A series of standards were made: for example, 0.5 mL
of stock was put into a 50 mL flask for standard 1, and
5 mLs of Solution C added. Distilled water was used to
fill to the 50 mL mark. A calibration graph at 470 nm
was obtained on the Cary 1 spectrophotometer using
the Concentration Application. A 1 second signal
averaging time (SAT) was used throughout.
Sample preparation
Procedures
1. If the digested sample pH was >10, 0.05 mL
(1 drop) of phenopthalein was added to
50 mL sample. The pH was lowered with
0.5 N HCl before it was diluted to 100 mL.
2. 200 mg of activated carbon was then added to
50 mL of the sample. It was then shaken for
5 minutes in a flask then filtered to remove the
carbon.
3. 35 mL of sample was placed into a 50 mL
volumetric flask to which 10 mL of Solution C was
added and diluted to the mark with distilled water.
4. The blank was 35 mL distilled water treated as in
number 3, in another 50 mL volumetric flask.
5. After 10 minutes, the sample absorbance at 470 nm
was measured and compared with that of the
blank. Each of the calibration standards was read
after a 10 minute delay.
AOAC has described Fe2+ and NO3- as interferents. The
sample was spiked with ferric nitrate to show the
effects of an interferent (Figure 1). The concentration of
ferric nitrate added was 27.83 mg/L.
The scan was compared with the unspiked sample
scan. The absorbance readings at 470 nm were not
affected by this interferent, as the ferrous and nitrate
ion concentrations were still <100 and 1000 mg/L
respectively, in the spiked sample.1
Figure 1. An example of an interferent Fe(NO3)2 spiking of hydroponics
sample
A series of standards was made for calibration at
470 nm. The calibration graph obtained from this
method is shown in Figure 2 below:
Figure 2. The calibration graph for method 1
The values obtained from the linear calibration graph
were then corrected as in reference 1 for dilution
factors.
The phosphorus concentration from the Absorbance at
470 nm of 0.08401 Abs was calculated as follows:
(4.745 µg/mL x (50 mL/35 mL))
= 6.78 mg/L

4
Method 2:
Stannous chloride method
Molybdophosphoric acid reduction by stannous chloride
to molybdenum results in the development of a blue
color. The procedure used was as described in
reference 1. A wavelength of 690 nm was used.
Reagents
1. Phenolpthalein indicator solution
2. Strong acid solution: 300 mL conc H2SO4 was added
slowly to 600 mL distilled water, cooled, then 4.0
mL conc HNO3 was added before dilution to 1 L.
Procedure
1. Ammonium molybdate reagent 1: 2.5 g
(NH4)6Mo7O24.4H2O was dissolved in 17.5 mL
distilled water. 28 mL of conc H2SO4 was added to
40 mL distilled water. The molybdate was then
added and diluted to 100 mL.
2. Stannous chloride reagent 1: 2.5 g of SnCl2.2H2O
was dissolved in 100 mL glycerol. Heat if necessary
to aid dissolution.
3. Standard phosphate solutions (as in Method 1).
The samples, standards, and reagents were kept within
2 °C of one another and in the temperature range
between 20 to 30 °C. Color measurements were taken
11 minutes after the reagents were added. The color
was measured at 690 nm using distilled water as the
blank. The light path used was 1 cm. No extraction1
was required as the amount of phosphorus present in
the solution was estimated from the results obtained in
Method 1. Increased sensitivity is required only if the
concentration is below 100 µg P/L.
The calibration graph for Method 2 is as shown in
Figure 3.
Figure 3. The calibration graph for method 2
Sample: Dilution factors
Forty milliliters of the sample was taken and diluted to
100 mL with distilled water after discharging the pink
color with acid. Then 50 mL of this solution was taken
and diluted to 100 mL with distilled water.
The calculations include the following dilution factors:
As in reference 1:
µg P/mL = value from line of best fit x 100/40 x 100/50
Thus, the phosphorus concentration measured from
Method 2 (which gave an absorbance value of
1.2295 Abs at 690 nm) was calculated as follows:
1.4409 µg/mL x 2.5 x 2
= 7.2 µg/mL
or 7.2 mg/L
Discussion
The concentration of phosphorus in the hydroponics
sample was found to be:
Method 1 Method 2
6.8 mg/L 7.2 mg/L
These results give an average of 7 mg/L of phosphorus
in the hydroponics sample, and also correspond to the
expected value for hydroponics sample. (See Appendix.)
The minimum detectable limit of phosphates using
vanadomolybdophosphoric acid method is 200 µg P/L
with a 1 cm pathlength cell, while the minimum
detection limit using the stannous chloride is lower,
about 3 µg P/L.1 Thus, Method 2 is more sensitive than
Method 1.

5
However, the color generated in Method 1 is stable and
its intensity is unaffected by room temperature
variations. In Method 2, the time taken to read both
standards and samples was critical for the accuracy of
the concentration readings.
The temperature of the reactions in Method 2 also
affects the phosphate results. However, the choice of
methods used to analyze phosphate quantitatively
would depend on the interferents present and the
detection limits required. The interferents and their
levels affecting phosphate analyses are different for
Methods 1 and 2.1
Increased sensitivity can be achieved in Method 2 by an
extraction of molybdophosphoric acid into an organic
solvent such as benzene-isobutanol. This additional
procedure can improve the detection limit of this
method to 3 µg P/L if required.
The concentration levels of various interferents are
discussed elsewhere.1 Clean acid washed glassware is
also required for these analyses to prevent phosphate
contamination.
Other reducing agents besides stannous chloride can
be used to form the blue molybdenum compound.
These include ascorbic acid, 1-amino-2-napthol-4
sulfuric acid, hydrazine sulfate and p-methylamino-
phenol sulfate. However, stannous chloride (Method 1)
and ascorbic acid (Method 3) are the most commonly
used reducing agents.
In this hydroponics sample, both results are close,
suggesting that both methods are suitable. The results
also show that despite the presence of many ions in
the sample, these ions have not affected the
determination of phosphate. (See Appendix for the
composition of the sample.)
These methods can be automated if required for greater
sample throughput. Automation is possible when using
the Cary 1/3. Automation can increase reliability as
well as reproducibility by reducing operator errors that
can become significant if too many samples are to be
analyzed manually.
Conclusion
The phosphorus content in the hydroponics solution
can be accurately measured using the Cary 1 and the
Concentration Application software. No interference
effects were observed using this methodology.
References
1. “Standard Methods for the Examination of Water
and Wastewater”, APHA, AWWA, WPCF; USA;
1985, 16th Ed.
2. Editors: S.O.Ryding and W.Rast. “The control of
eutrophication of lakes and reservoirs.” The
Parthenon Pubs Group: London; 1989.
3. E.H. Nicoll. “Small water pollution control works
design and practice”. Ellis Horwood Ltd: England;
1988.
Appendix
Table 1. Composition of hydroponics sample
Salts present in solution
KH2PO4
Ca(NO3)2.H2O
MgSO4.7H2O
KNO3
K2SO4
FeSO4.7H20
MnSO4.4H2O
ZnSO4.7H20
CuSO4.5H20
NH4H2PO4
Theoretical P content of sample
P in KH2PO4 = 5.7 mg/L
P in NH4H2PO 4 = 1.1 mg/L
Therefore:
P content in sample = 6.8 mg/L

www.agilent.com/chem
© Agilent Technologies, Inc., 1991, 2011
Published March, 2011
Publication Number SI-A-1121
Validation of a leaf reflectance and
transmittance model for three
agricultural crop species
Application Note
Author
G. J. Newnham* and T. Burt**
*Remote Sensing and Satellite
Research Group, Curtin
University of Technology,
Perth, Western Australia
** Agilent Technologies, Inc.,
679 Springvale Road,
Mulgrave, Victoria 3170,
Australia
Abstract
Reflectance and transmittance have been measured for a selection of leaves
from three cereal crop species using a laboratory based Cary 500
spectrophotometer. Spectral measurements, along with ancillary data
describing chlorophyll, water and dry matter content per unit leaf area, have
been used to assess the accuracy of the Prospect model [1] for estimating
leaf reflectance and transmittance. An inversion technique has also been
applied to the model to derive leaf pigment and leaf water content. This has
produced acceptable estimates of the true variation in these parameters.
This result indicates that the Prospect model, in conjunction with a suitable
method to account for canopy architecture and soil reflectance, has
potential to contribute to the generation of crop status information products
based on hyperspectral data.
Introduction
Increasingly, surface reflectance estimates derived from hyperspectral data
are used to assess spatial variance in crop condition and biomass over large
agricultural fields. The distribution and optical properties of individual plant
leaves are the primary factors contributing to the reflectance of a mature
crop canopy. Consequently, to develop valuable information products from
these data sources, an understanding of the reflectance and transmittance
of individual plant leaves is essential.
The Prospect leaf reflectance and transmittance model [1] has been
developed using contemporary theories of radiative transfer within leaf
material. However, the inherent variability in biochemical constituents and
leaf structure among plant species requires that accurate laboratory
validation of the model be undertaken before it can be used reliably for
agricultural crop condition assessment.
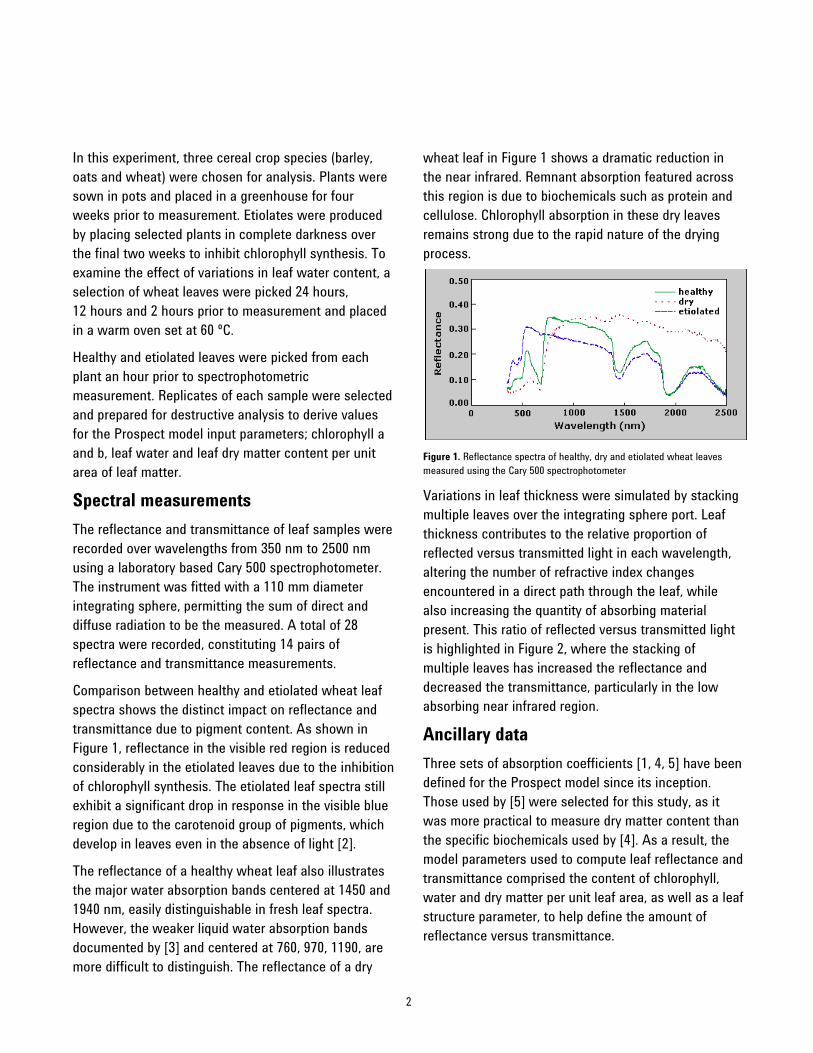
2
In this experiment, three cereal crop species (barley,
oats and wheat) were chosen for analysis. Plants were
sown in pots and placed in a greenhouse for four
weeks prior to measurement. Etiolates were produced
by placing selected plants in complete darkness over
the final two weeks to inhibit chlorophyll synthesis. To
examine the effect of variations in leaf water content, a
selection of wheat leaves were picked 24 hours,
12 hours and 2 hours prior to measurement and placed
in a warm oven set at 60 ºC.
Healthy and etiolated leaves were picked from each
plant an hour prior to spectrophotometric
measurement. Replicates of each sample were selected
and prepared for destructive analysis to derive values
for the Prospect model input parameters; chlorophyll a
and b, leaf water and leaf dry matter content per unit
area of leaf matter.
Spectral measurements
The reflectance and transmittance of leaf samples were
recorded over wavelengths from 350 nm to 2500 nm
using a laboratory based Cary 500 spectrophotometer.
The instrument was fitted with a 110 mm diameter
integrating sphere, permitting the sum of direct and
diffuse radiation to be the measured. A total of 28
spectra were recorded, constituting 14 pairs of
reflectance and transmittance measurements.
Comparison between healthy and etiolated wheat leaf
spectra shows the distinct impact on reflectance and
transmittance due to pigment content. As shown in
Figure 1, reflectance in the visible red region is reduced
considerably in the etiolated leaves due to the inhibition
of chlorophyll synthesis. The etiolated leaf spectra still
exhibit a significant drop in response in the visible blue
region due to the carotenoid group of pigments, which
develop in leaves even in the absence of light [2].
The reflectance of a healthy wheat leaf also illustrates
the major water absorption bands centered at 1450 and
1940 nm, easily distinguishable in fresh leaf spectra.
However, the weaker liquid water absorption bands
documented by [3] and centered at 760, 970, 1190, are
more difficult to distinguish. The reflectance of a dry
wheat leaf in Figure 1 shows a dramatic reduction in
the near infrared. Remnant absorption featured across
this region is due to biochemicals such as protein and
cellulose. Chlorophyll absorption in these dry leaves
remains strong due to the rapid nature of the drying
process.
Figure 1. Reflectance spectra of healthy, dry and etiolated wheat leaves
measured using the Cary 500 spectrophotometer
Variations in leaf thickness were simulated by stacking
multiple leaves over the integrating sphere port. Leaf
thickness contributes to the relative proportion of
reflected versus transmitted light in each wavelength,
altering the number of refractive index changes
encountered in a direct path through the leaf, while
also increasing the quantity of absorbing material
present. This ratio of reflected versus transmitted light
is highlighted in Figure 2, where the stacking of
multiple leaves has increased the reflectance and
decreased the transmittance, particularly in the low
absorbing near infrared region.
Ancillary data
Three sets of absorption coefficients [1, 4, 5] have been
defined for the Prospect model since its inception.
Those used by [5] were selected for this study, as it
was more practical to measure dry matter content than
the specific biochemicals used by [4]. As a result, the
model parameters used to compute leaf reflectance and
transmittance comprised the content of chlorophyll,
water and dry matter per unit leaf area, as well as a leaf
structure parameter, to help define the amount of
reflectance versus transmittance.

3
In order to determine chlorophyll content per unit leaf
area, images of each leaf were recorded using a flat bed
scanner and leaf area computed using digital image
analysis. Each leaf was then ground in acetone to
extract the leaf pigments and the solution filtered to
remove undissolved leaf matter. Absorption of the
dissolved pigment solution was measured using a
spectrophotometer and normalized for solvent volume
and leaf area. The content of chlorophyll a + b in the
leaves was computed according to the method of [6]
and recorded in units of µg/cm2 of leaf area.
To derive leaf water and dry matter content, leaf area
was again determined using digital image analysis. The
fresh leaves were weighed and then placed in a warm
oven set at 60 °C, for three days. When removed, a dry
weight was recorded and this considered the true
weight of dry matter in the fresh leaf. The difference
between fresh and dry weights was assumed to
account for the weight of water in the fresh leaf. Each
weight was normalized for the respective leaf area and
recorded in units of g/cm2.
Figure 2. Reflectance (lower curves) and 1-transmittance (upper curves)
measured for a single barley leaf layer (solid lines) and for a stack of four
barley leaves (dotted lines)
Figure 3. Graphical presentation of measured reflectance and 1-
transmittance spectra (solid lines) and those produced using the Prospect
model (dashed lines)
Model validation
Figure 3 shows a strong relationship between
measured cereal crop leaf reflectance and
transmittance spectra to those computed using the
Prospect model. Correlation in the visible red
chlorophyll absorbing region and the two major water
absorption bands in the near infrared are particularly
promising for inversion of the model.
Within the theoretical framework of the Prospect
model, the leaf is considered to be a series of flat
homogeneous plates. The relative proportion of light
reflected and transmitted is accounted for by the
structure parameter indicating the number of plates in
the leaf structure, and the refractive index of these
plates. The lowest value accepted by the model for this
structure parameter is one. This was the value used for
the computation of all spectra, except where multiple
leaves were stacked over the integrating sphere port.
One apparent inconsistency between measured and
modelled spectra is the general overestimation of
reflectance and underestimation of transmittance. This
is obvious in Figure 4, which shows the average
modelling error for all measured and modelled spectra.
This overestimation would be best addressed by
reviewing the refractive index used for model
calculations. It is assumed that lower refractive index
values would allow a more meaningful structure
parameter to be set and produce more accurate
spectra.
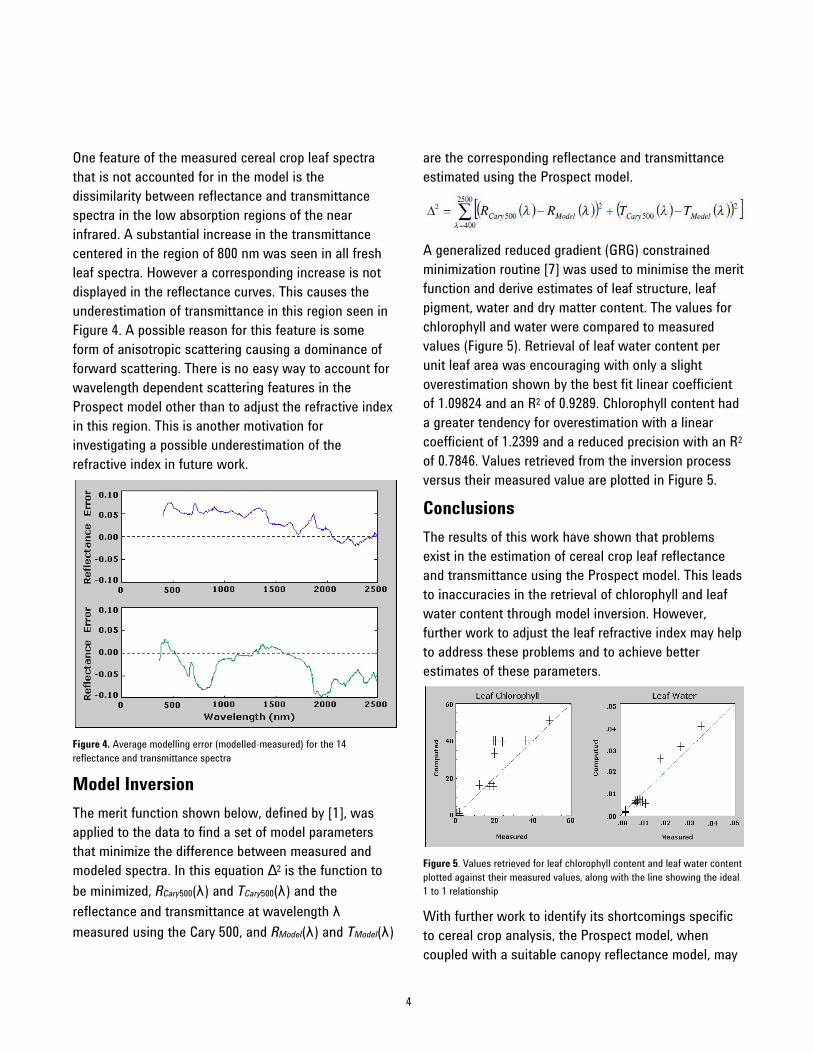
4
One feature of the measured cereal crop leaf spectra
that is not accounted for in the model is the
dissimilarity between reflectance and transmittance
spectra in the low absorption regions of the near
infrared. A substantial increase in the transmittance
centered in the region of 800 nm was seen in all fresh
leaf spectra. However a corresponding increase is not
displayed in the reflectance curves. This causes the
underestimation of transmittance in this region seen in
Figure 4. A possible reason for this feature is some
form of anisotropic scattering causing a dominance of
forward scattering. There is no easy way to account for
wavelength dependent scattering features in the
Prospect model other than to adjust the refractive index
in this region. This is another motivation for
investigating a possible underestimation of the
refractive index in future work.
Figure 4. Average modelling error (modelled-measured) for the 14
reflectance and transmittance spectra
Model Inversion
The merit function shown below, defined by [1], was
applied to the data to find a set of model parameters
that minimize the difference between measured and
modeled spectra. In this equation Δ2 is the function to
be minimized, RCary500(λ) and TCary500(λ) and the
reflectance and transmittance at wavelength λ
measured using the Cary 500, and RModel(λ) and TModel(λ)
are the corresponding reflectance and transmittance
estimated using the Prospect model.
A generalized reduced gradient (GRG) constrained
minimization routine [7] was used to minimise the merit
function and derive estimates of leaf structure, leaf
pigment, water and dry matter content. The values for
chlorophyll and water were compared to measured
values (Figure 5). Retrieval of leaf water content per
unit leaf area was encouraging with only a slight
overestimation shown by the best fit linear coefficient
of 1.09824 and an R2 of 0.9289. Chlorophyll content had
a greater tendency for overestimation with a linear
coefficient of 1.2399 and a reduced precision with an R2
of 0.7846. Values retrieved from the inversion process
versus their measured value are plotted in Figure 5.
Conclusions
The results of this work have shown that problems
exist in the estimation of cereal crop leaf reflectance
and transmittance using the Prospect model. This leads
to inaccuracies in the retrieval of chlorophyll and leaf
water content through model inversion. However,
further work to adjust the leaf refractive index may help
to address these problems and to achieve better
estimates of these parameters.
Figure 5. Values retrieved for leaf chlorophyll content and leaf water content
plotted against their measured values, along with the line showing the ideal
1 to 1 relationship
With further work to identify its shortcomings specific
to cereal crop analysis, the Prospect model, when
coupled with a suitable canopy reflectance model, may

5
prove a valuable tool in the monitoring and
management of agricultural crops using hyperspectral
data.
Acknowledgments
The authors wish to thank Agilent Technologies
Australia (M) Pty Ltd for the use of the Cary 500
spectrophotometer. We would also like to thank the
Department of Environmental Biology at Curtin
University of Technology for assistance in measuring
ancillary data and Associate Professor Mervyn Lynch
from the Department of Applied Physics for his
technical assistance.
References
1. S. Jacquemoud and F. Baret, "PROSPECT: A model
of leaf optical properties spectra," Remote Sensing
of Environment, vol. 44, pp. 281-292, 1990.
2. S. J. Maas and J. R. Dunlap, "Reflectance,
transmittance and absorptance of light by normal,
etiolated and albino corn leaves," Agronomy
Journal, vol. 81, pp. 105-110, 1989.
3. A. C. Curcio and C. C. Petty, "The near infrared
absorption spectrum of liquid water," Journal of the
Optical Society of America, vol. 41, pp. 302-304,
1951.
4. S. Jacquemoud, S. L. Ustin, J. Verdebout, G.
Schmuck, G. Andreoli, and B. Hosgood, "Estimating
leaf biochemistry using the PROSPECT leaf optical
properties model," Remote Sensing of Environment,
vol. 56, pp. 194-202, 1996.
5. F. Baret and T. Fourty, "Estimation of leaf water
content and specific leaf weight from reflectance
and transmittance measurements," Agronomie, vol.
17, pp. 455-464, 1997.
6. H. K. Lichtenthaler, "Chlorophylls and carotenoids:
pigments of photosynthetic membranes," Methods
in Enzymology, vol. 148, pp. 350-382, 1987.
7. J. Abadie and J. Carpentier, "Generalization of the
Wolfe reduced gradient method to the case of
nonlinear constraints," in Optimization, R. Fletcher,
Ed. London: Academic Press, 1969, pp. 37-47.

www.agilent.com/chem
© Agilent Technologies, Inc., 2001, 2011
Published March, 2011
Publication Number SI-A-1194

► Back to Table of Contents► See Related Application Notes
AGILENT UV-VIS/ FLUORESCENCE INSTRUMENTS
Agilent’s proven record of optical design excellence and innovation in UV-Vis & UV-Vis-NIR systems ensures you get the right answer every time.
Agilent fluorescence spectrometers are sensitive, accurate and flexible, and are designed to meet current and future application requirements.
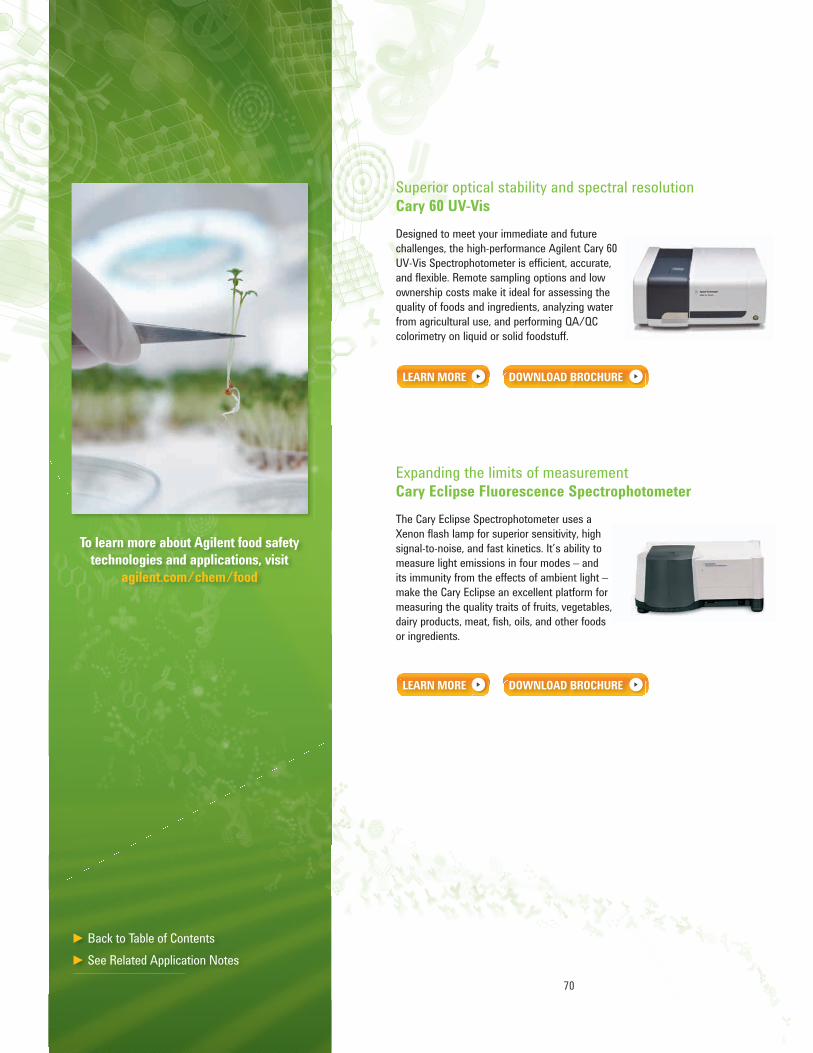
Superior optical stability and spectral resolution Cary 60 UV-Vis Designed to meet your immediate and future challenges, the high-performance Agilent Cary 60 UV-Vis Spectrophotometer is efficient, accurate, and flexible. Remote sampling options and low ownership costs make it ideal for assessing the quality of foods and ingredients, analyzing water from agricultural use, and performing QA/QC colorimetry on liquid or solid foodstuff.
Expanding the limits of measurement Cary Eclipse Fluorescence SpectrophotometerThe Cary Eclipse Spectrophotometer uses a Xenon flash lamp for superior sensitivity, high signal-to-noise, and fast kinetics. It’s ability to measure light emissions in four modes – and its immunity from the effects of ambient light – make the Cary Eclipse an excellent platform for measuring the quality traits of fruits, vegetables, dairy products, meat, fish, oils, and other foods or ingredients.
LEARN MORE DOWNLOAD BROCHURE
LEARN MORE DOWNLOAD BROCHURE
► Back to Table of Contents► See Related Application Notes
To learn more about Agilent food safety technologies and applications, visit
agilent.com/chem/food
70
UV-Vis/Fluorescence Instruments Application Notes Determination of Phosphorus Concentration in Hydroponics Solution (SI-A-1121) ........................................................................ 72
Validation of a Leaf Reflectance and Transmittance Model for Three Agricultural Crop Species (SI-A-1194) ................................ 78
► Back to Table of Contents
To learn more about Agilent food safety technologies and applications, visit
agilent.com/chem/food
71

Determination of phosphorus
concentration in hydroponics solution
Application Note
Author
Sharon Lim
Agilent Technologies, Inc.
Mulgrave, Victoria 3170,
Australia
Introduction
Phosphates exist in many forms in water. They can occur as
orthophosphates, condensed phosphates such as pyro, meta and
polyphosphates or as organically bound phosphates.1 The major pollution
sources of phosphates in natural waters are detergents used in industry and
fertilizers from agricultural farming.
The use of fertilizers is increasing. Phosphates in fertilizer and farm runoffs
have to be monitored in order to prevent the possibility of polluting the
surrounding environment. The excessive enrichment of natural waters with
plant nutrients, known as eutrophication, can result in overabundant growth
of undesirable algae and aquatic plants, affecting water quality.2,3
Solution spectrophotometry still remains an essential and reliable analytical
method for routine water analysis, particularly for the determination of
nutrient elements such as nitrogen and phosphorus.
Spectrophotometric methods often require the initial conversion of
phosphates to soluble orthophosphates which can then be determined
colorimetrically. Orthophosphates can be analyzed quantitatively by three
methods:
1. Vanadomolybdophosphoric acid method
2. Stannous chloride method
3. Ascorbic acid method

2
Methods 1 and 2 were used in this study to quantitate
and confirm an unknown phosphorus concentration in a
hydroponics solution. These methods are suitable for
determining the level of phosphates such as KH2PO4
and NH4H2PO4 added into fertilizers and hydroponics as
sources of phosphorus. It is also important that the
phosphate level conforms to plant requirements. If
excess phosphates are used, this could lead to the
death of plants as well as excess phosphate in runoffs.
Equipment
Instrument: Cary 1
Concentration Application software
Methodology
Digestion
Pretreatment of the hydroponics sample
The hydroponics sample was digested first, using the
potassium persulfate method as described in
reference 1. Acid digestion is necessary if total
phosphorus is to be determined as phosphorus may be
present in combination with organic matter.
Apparatus
1. Hot plate
2. Weighing boats
Reagents
1. Phenolpthalein indicator aqueous solution
2. Sulfuric acid solution (300 mL conc H2SO4 in
1 L H2O)
3. Potassium persulfate K2S2O8
4. Sodium hydroxide NaOH, 1 N
Procedure
1. One drop (0.05 mL) phenolpthalein was added to 50
mL of sample. If red color developed H2SO4 was
added to discharge the color.
2. One mL H2SO4 and 0.5 g solid K2S2O8 were then
added.
3. The solution was boiled gently on a preheated hot
plate for 30 to 40 mins or until 10 mL remained.
4. It was then cooled and diluted to 30 mL with
distilled H2O.
5. One drop (0.05 mL) phenolpthalein was added,
followed by NaOH until the solution was faintly
pink.
6. The solution was then made up to 100 mL with
distilled water.
Phosphate analysis
The phosphorus in the sample solution was then
determined by Methods 1 and 2.
Separate calibration graphs were constructed using
phosphate standards that were also pretreated with
persulfate.
Method 1:
Vanadomolybdophosphoric acid method
A wavelength of 470 nm was used. The yellow color
was due to the molybdophosphoric acid in the presence
of vanadium. The intensity of the yellow color from this
complex formation was proportional to the phosphate
concentration. Glassware was acid washed before use.
The procedure is as described in reference 1.
Reagents
1. Phenolpthalein indicator solution
2. HCL solution (0.5 N)
3. Activated carbon
4. Vanadate-molybdate reagent
Solution A: 2.5 g of ammonium molybdate
(NH4)6Mo7024.4H2O was dissolved in 30.0 mL of distilled
water.
Solution B: 0.125 g of ammonium metavanadate was
dissolved by heating to boiling point in 30 mL of
distilled water. It was cooled and 33 mL concentrated
HCL was added.

3
Solution C: After cooling to room temperature,
Solution A was mixed with Solution B, and diluted to
100 mL.
5. Standard phosphate solutions:
22.068 mg of anhydrous KH2PO4 was dissolved in
distilled water and diluted to 100 mL. Thus, 1mL =
50.3µg PO43--P.
A series of standards were made: for example, 0.5 mL
of stock was put into a 50 mL flask for standard 1, and
5 mLs of Solution C added. Distilled water was used to
fill to the 50 mL mark. A calibration graph at 470 nm
was obtained on the Cary 1 spectrophotometer using
the Concentration Application. A 1 second signal
averaging time (SAT) was used throughout.
Sample preparation
Procedures
1. If the digested sample pH was >10, 0.05 mL
(1 drop) of phenopthalein was added to
50 mL sample. The pH was lowered with
0.5 N HCl before it was diluted to 100 mL.
2. 200 mg of activated carbon was then added to
50 mL of the sample. It was then shaken for
5 minutes in a flask then filtered to remove the
carbon.
3. 35 mL of sample was placed into a 50 mL
volumetric flask to which 10 mL of Solution C was
added and diluted to the mark with distilled water.
4. The blank was 35 mL distilled water treated as in
number 3, in another 50 mL volumetric flask.
5. After 10 minutes, the sample absorbance at 470 nm
was measured and compared with that of the
blank. Each of the calibration standards was read
after a 10 minute delay.
AOAC has described Fe2+ and NO3- as interferents. The
sample was spiked with ferric nitrate to show the
effects of an interferent (Figure 1). The concentration of
ferric nitrate added was 27.83 mg/L.
The scan was compared with the unspiked sample
scan. The absorbance readings at 470 nm were not
affected by this interferent, as the ferrous and nitrate
ion concentrations were still <100 and 1000 mg/L
respectively, in the spiked sample.1
Figure 1. An example of an interferent Fe(NO3)2 spiking of hydroponics
sample
A series of standards was made for calibration at
470 nm. The calibration graph obtained from this
method is shown in Figure 2 below:
Figure 2. The calibration graph for method 1
The values obtained from the linear calibration graph
were then corrected as in reference 1 for dilution
factors.
The phosphorus concentration from the Absorbance at
470 nm of 0.08401 Abs was calculated as follows:
(4.745 µg/mL x (50 mL/35 mL))
= 6.78 mg/L
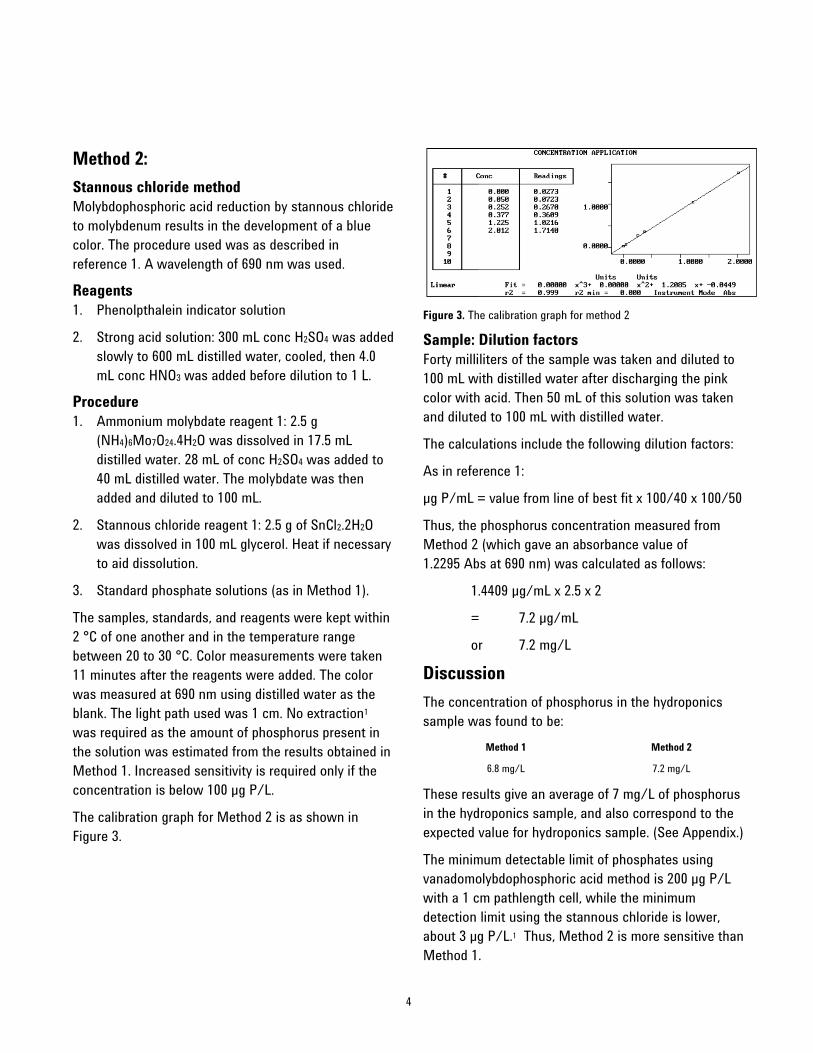
4
Method 2:
Stannous chloride method
Molybdophosphoric acid reduction by stannous chloride
to molybdenum results in the development of a blue
color. The procedure used was as described in
reference 1. A wavelength of 690 nm was used.
Reagents
1. Phenolpthalein indicator solution
2. Strong acid solution: 300 mL conc H2SO4 was added
slowly to 600 mL distilled water, cooled, then 4.0
mL conc HNO3 was added before dilution to 1 L.
Procedure
1. Ammonium molybdate reagent 1: 2.5 g
(NH4)6Mo7O24.4H2O was dissolved in 17.5 mL
distilled water. 28 mL of conc H2SO4 was added to
40 mL distilled water. The molybdate was then
added and diluted to 100 mL.
2. Stannous chloride reagent 1: 2.5 g of SnCl2.2H2O
was dissolved in 100 mL glycerol. Heat if necessary
to aid dissolution.
3. Standard phosphate solutions (as in Method 1).
The samples, standards, and reagents were kept within
2 °C of one another and in the temperature range
between 20 to 30 °C. Color measurements were taken
11 minutes after the reagents were added. The color
was measured at 690 nm using distilled water as the
blank. The light path used was 1 cm. No extraction1
was required as the amount of phosphorus present in
the solution was estimated from the results obtained in
Method 1. Increased sensitivity is required only if the
concentration is below 100 µg P/L.
The calibration graph for Method 2 is as shown in
Figure 3.
Figure 3. The calibration graph for method 2
Sample: Dilution factors
Forty milliliters of the sample was taken and diluted to
100 mL with distilled water after discharging the pink
color with acid. Then 50 mL of this solution was taken
and diluted to 100 mL with distilled water.
The calculations include the following dilution factors:
As in reference 1:
µg P/mL = value from line of best fit x 100/40 x 100/50
Thus, the phosphorus concentration measured from
Method 2 (which gave an absorbance value of
1.2295 Abs at 690 nm) was calculated as follows:
1.4409 µg/mL x 2.5 x 2
= 7.2 µg/mL
or 7.2 mg/L
Discussion
The concentration of phosphorus in the hydroponics
sample was found to be:
Method 1 Method 2
6.8 mg/L 7.2 mg/L
These results give an average of 7 mg/L of phosphorus
in the hydroponics sample, and also correspond to the
expected value for hydroponics sample. (See Appendix.)
The minimum detectable limit of phosphates using
vanadomolybdophosphoric acid method is 200 µg P/L
with a 1 cm pathlength cell, while the minimum
detection limit using the stannous chloride is lower,
about 3 µg P/L.1 Thus, Method 2 is more sensitive than
Method 1.
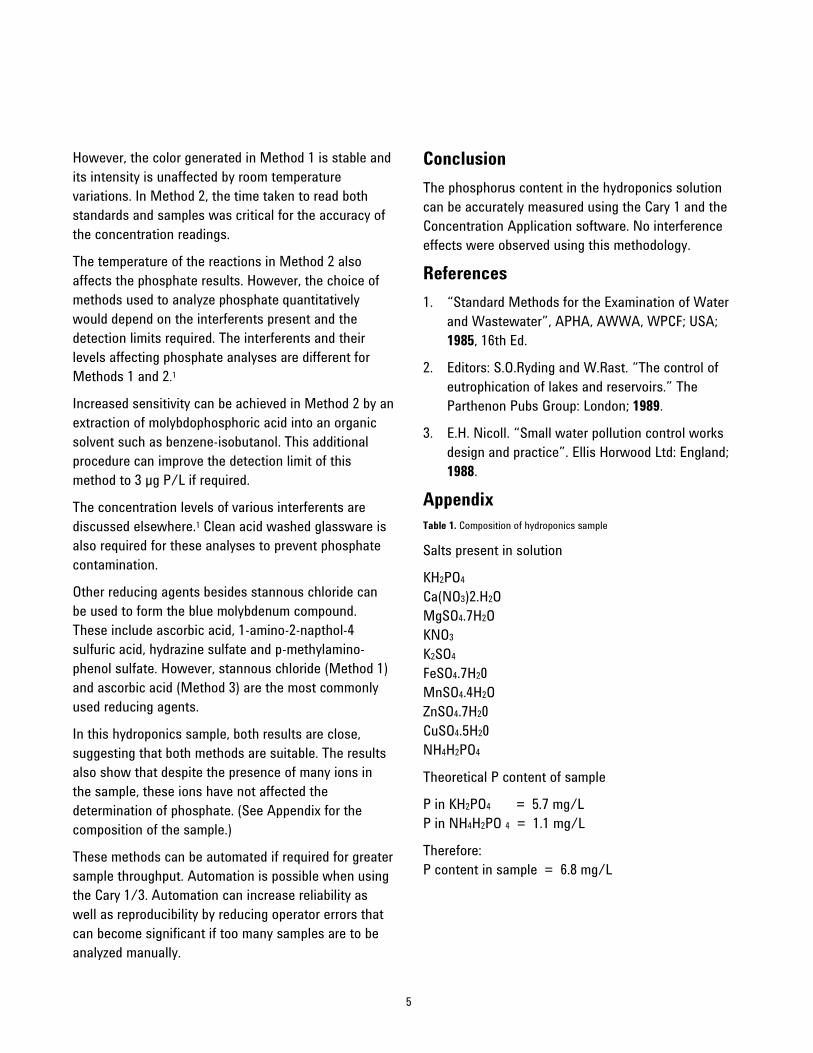
5
However, the color generated in Method 1 is stable and
its intensity is unaffected by room temperature
variations. In Method 2, the time taken to read both
standards and samples was critical for the accuracy of
the concentration readings.
The temperature of the reactions in Method 2 also
affects the phosphate results. However, the choice of
methods used to analyze phosphate quantitatively
would depend on the interferents present and the
detection limits required. The interferents and their
levels affecting phosphate analyses are different for
Methods 1 and 2.1
Increased sensitivity can be achieved in Method 2 by an
extraction of molybdophosphoric acid into an organic
solvent such as benzene-isobutanol. This additional
procedure can improve the detection limit of this
method to 3 µg P/L if required.
The concentration levels of various interferents are
discussed elsewhere.1 Clean acid washed glassware is
also required for these analyses to prevent phosphate
contamination.
Other reducing agents besides stannous chloride can
be used to form the blue molybdenum compound.
These include ascorbic acid, 1-amino-2-napthol-4
sulfuric acid, hydrazine sulfate and p-methylamino-
phenol sulfate. However, stannous chloride (Method 1)
and ascorbic acid (Method 3) are the most commonly
used reducing agents.
In this hydroponics sample, both results are close,
suggesting that both methods are suitable. The results
also show that despite the presence of many ions in
the sample, these ions have not affected the
determination of phosphate. (See Appendix for the
composition of the sample.)
These methods can be automated if required for greater
sample throughput. Automation is possible when using
the Cary 1/3. Automation can increase reliability as
well as reproducibility by reducing operator errors that
can become significant if too many samples are to be
analyzed manually.
Conclusion
The phosphorus content in the hydroponics solution
can be accurately measured using the Cary 1 and the
Concentration Application software. No interference
effects were observed using this methodology.
References
1. “Standard Methods for the Examination of Water
and Wastewater”, APHA, AWWA, WPCF; USA;
1985, 16th Ed.
2. Editors: S.O.Ryding and W.Rast. “The control of
eutrophication of lakes and reservoirs.” The
Parthenon Pubs Group: London; 1989.
3. E.H. Nicoll. “Small water pollution control works
design and practice”. Ellis Horwood Ltd: England;
1988.
Appendix
Table 1. Composition of hydroponics sample
Salts present in solution
KH2PO4
Ca(NO3)2.H2O
MgSO4.7H2O
KNO3
K2SO4
FeSO4.7H20
MnSO4.4H2O
ZnSO4.7H20
CuSO4.5H20
NH4H2PO4
Theoretical P content of sample
P in KH2PO4 = 5.7 mg/L
P in NH4H2PO 4 = 1.1 mg/L
Therefore:
P content in sample = 6.8 mg/L

www.agilent.com/chem
© Agilent Technologies, Inc., 1991, 2011
Published March, 2011
Publication Number SI-A-1121

Validation of a leaf reflectance and
transmittance model for three
agricultural crop species
Application Note
Author
G. J. Newnham* and T. Burt**
*Remote Sensing and Satellite
Research Group, Curtin
University of Technology,
Perth, Western Australia
** Agilent Technologies, Inc.,
679 Springvale Road,
Mulgrave, Victoria 3170,
Australia
Abstract
Reflectance and transmittance have been measured for a selection of leaves
from three cereal crop species using a laboratory based Cary 500
spectrophotometer. Spectral measurements, along with ancillary data
describing chlorophyll, water and dry matter content per unit leaf area, have
been used to assess the accuracy of the Prospect model [1] for estimating
leaf reflectance and transmittance. An inversion technique has also been
applied to the model to derive leaf pigment and leaf water content. This has
produced acceptable estimates of the true variation in these parameters.
This result indicates that the Prospect model, in conjunction with a suitable
method to account for canopy architecture and soil reflectance, has
potential to contribute to the generation of crop status information products
based on hyperspectral data.
Introduction
Increasingly, surface reflectance estimates derived from hyperspectral data
are used to assess spatial variance in crop condition and biomass over large
agricultural fields. The distribution and optical properties of individual plant
leaves are the primary factors contributing to the reflectance of a mature
crop canopy. Consequently, to develop valuable information products from
these data sources, an understanding of the reflectance and transmittance
of individual plant leaves is essential.
The Prospect leaf reflectance and transmittance model [1] has been
developed using contemporary theories of radiative transfer within leaf
material. However, the inherent variability in biochemical constituents and
leaf structure among plant species requires that accurate laboratory
validation of the model be undertaken before it can be used reliably for
agricultural crop condition assessment.

2
In this experiment, three cereal crop species (barley,
oats and wheat) were chosen for analysis. Plants were
sown in pots and placed in a greenhouse for four
weeks prior to measurement. Etiolates were produced
by placing selected plants in complete darkness over
the final two weeks to inhibit chlorophyll synthesis. To
examine the effect of variations in leaf water content, a
selection of wheat leaves were picked 24 hours,
12 hours and 2 hours prior to measurement and placed
in a warm oven set at 60 ºC.
Healthy and etiolated leaves were picked from each
plant an hour prior to spectrophotometric
measurement. Replicates of each sample were selected
and prepared for destructive analysis to derive values
for the Prospect model input parameters; chlorophyll a
and b, leaf water and leaf dry matter content per unit
area of leaf matter.
Spectral measurements
The reflectance and transmittance of leaf samples were
recorded over wavelengths from 350 nm to 2500 nm
using a laboratory based Cary 500 spectrophotometer.
The instrument was fitted with a 110 mm diameter
integrating sphere, permitting the sum of direct and
diffuse radiation to be the measured. A total of 28
spectra were recorded, constituting 14 pairs of
reflectance and transmittance measurements.
Comparison between healthy and etiolated wheat leaf
spectra shows the distinct impact on reflectance and
transmittance due to pigment content. As shown in
Figure 1, reflectance in the visible red region is reduced
considerably in the etiolated leaves due to the inhibition
of chlorophyll synthesis. The etiolated leaf spectra still
exhibit a significant drop in response in the visible blue
region due to the carotenoid group of pigments, which
develop in leaves even in the absence of light [2].
The reflectance of a healthy wheat leaf also illustrates
the major water absorption bands centered at 1450 and
1940 nm, easily distinguishable in fresh leaf spectra.
However, the weaker liquid water absorption bands
documented by [3] and centered at 760, 970, 1190, are
more difficult to distinguish. The reflectance of a dry
wheat leaf in Figure 1 shows a dramatic reduction in
the near infrared. Remnant absorption featured across
this region is due to biochemicals such as protein and
cellulose. Chlorophyll absorption in these dry leaves
remains strong due to the rapid nature of the drying
process.
Figure 1. Reflectance spectra of healthy, dry and etiolated wheat leaves
measured using the Cary 500 spectrophotometer
Variations in leaf thickness were simulated by stacking
multiple leaves over the integrating sphere port. Leaf
thickness contributes to the relative proportion of
reflected versus transmitted light in each wavelength,
altering the number of refractive index changes
encountered in a direct path through the leaf, while
also increasing the quantity of absorbing material
present. This ratio of reflected versus transmitted light
is highlighted in Figure 2, where the stacking of
multiple leaves has increased the reflectance and
decreased the transmittance, particularly in the low
absorbing near infrared region.
Ancillary data
Three sets of absorption coefficients [1, 4, 5] have been
defined for the Prospect model since its inception.
Those used by [5] were selected for this study, as it
was more practical to measure dry matter content than
the specific biochemicals used by [4]. As a result, the
model parameters used to compute leaf reflectance and
transmittance comprised the content of chlorophyll,
water and dry matter per unit leaf area, as well as a leaf
structure parameter, to help define the amount of
reflectance versus transmittance.
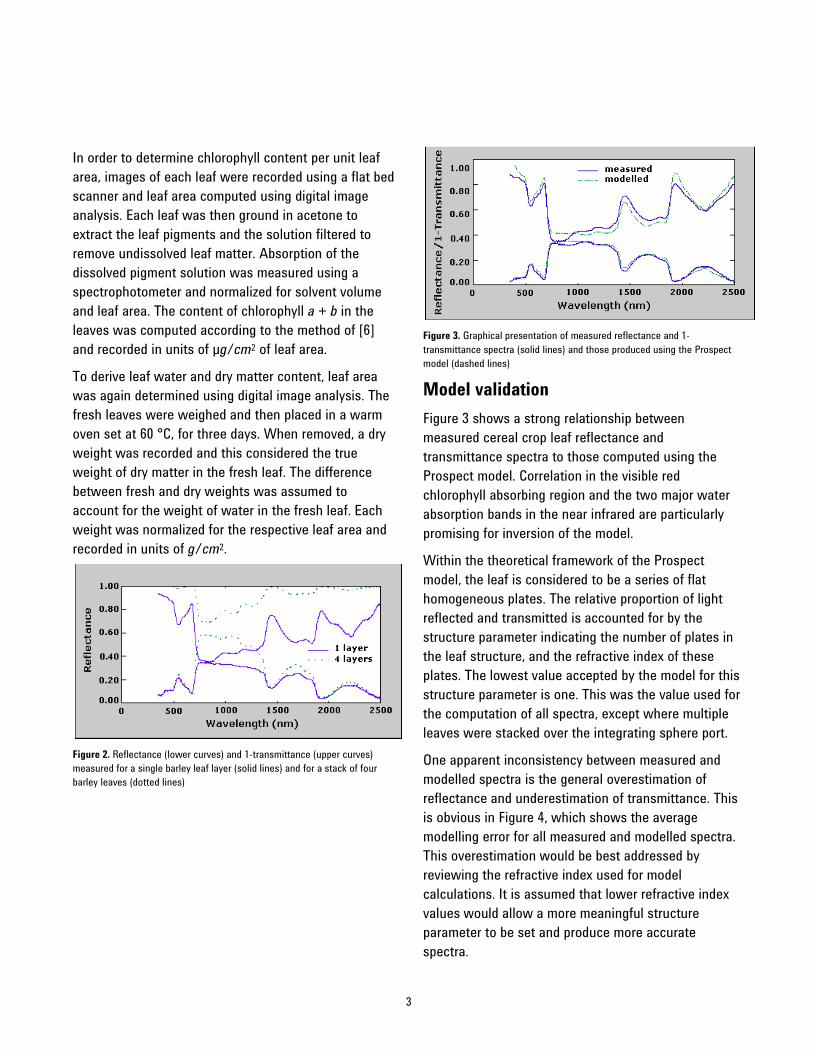
3
In order to determine chlorophyll content per unit leaf
area, images of each leaf were recorded using a flat bed
scanner and leaf area computed using digital image
analysis. Each leaf was then ground in acetone to
extract the leaf pigments and the solution filtered to
remove undissolved leaf matter. Absorption of the
dissolved pigment solution was measured using a
spectrophotometer and normalized for solvent volume
and leaf area. The content of chlorophyll a + b in the
leaves was computed according to the method of [6]
and recorded in units of µg/cm2 of leaf area.
To derive leaf water and dry matter content, leaf area
was again determined using digital image analysis. The
fresh leaves were weighed and then placed in a warm
oven set at 60 °C, for three days. When removed, a dry
weight was recorded and this considered the true
weight of dry matter in the fresh leaf. The difference
between fresh and dry weights was assumed to
account for the weight of water in the fresh leaf. Each
weight was normalized for the respective leaf area and
recorded in units of g/cm2.
Figure 2. Reflectance (lower curves) and 1-transmittance (upper curves)
measured for a single barley leaf layer (solid lines) and for a stack of four
barley leaves (dotted lines)
Figure 3. Graphical presentation of measured reflectance and 1-
transmittance spectra (solid lines) and those produced using the Prospect
model (dashed lines)
Model validation
Figure 3 shows a strong relationship between
measured cereal crop leaf reflectance and
transmittance spectra to those computed using the
Prospect model. Correlation in the visible red
chlorophyll absorbing region and the two major water
absorption bands in the near infrared are particularly
promising for inversion of the model.
Within the theoretical framework of the Prospect
model, the leaf is considered to be a series of flat
homogeneous plates. The relative proportion of light
reflected and transmitted is accounted for by the
structure parameter indicating the number of plates in
the leaf structure, and the refractive index of these
plates. The lowest value accepted by the model for this
structure parameter is one. This was the value used for
the computation of all spectra, except where multiple
leaves were stacked over the integrating sphere port.
One apparent inconsistency between measured and
modelled spectra is the general overestimation of
reflectance and underestimation of transmittance. This
is obvious in Figure 4, which shows the average
modelling error for all measured and modelled spectra.
This overestimation would be best addressed by
reviewing the refractive index used for model
calculations. It is assumed that lower refractive index
values would allow a more meaningful structure
parameter to be set and produce more accurate
spectra.

4
One feature of the measured cereal crop leaf spectra
that is not accounted for in the model is the
dissimilarity between reflectance and transmittance
spectra in the low absorption regions of the near
infrared. A substantial increase in the transmittance
centered in the region of 800 nm was seen in all fresh
leaf spectra. However a corresponding increase is not
displayed in the reflectance curves. This causes the
underestimation of transmittance in this region seen in
Figure 4. A possible reason for this feature is some
form of anisotropic scattering causing a dominance of
forward scattering. There is no easy way to account for
wavelength dependent scattering features in the
Prospect model other than to adjust the refractive index
in this region. This is another motivation for
investigating a possible underestimation of the
refractive index in future work.
Figure 4. Average modelling error (modelled-measured) for the 14
reflectance and transmittance spectra
Model Inversion
The merit function shown below, defined by [1], was
applied to the data to find a set of model parameters
that minimize the difference between measured and
modeled spectra. In this equation Δ2 is the function to
be minimized, RCary500(λ) and TCary500(λ) and the
reflectance and transmittance at wavelength λ
measured using the Cary 500, and RModel(λ) and TModel(λ)
are the corresponding reflectance and transmittance
estimated using the Prospect model.
A generalized reduced gradient (GRG) constrained
minimization routine [7] was used to minimise the merit
function and derive estimates of leaf structure, leaf
pigment, water and dry matter content. The values for
chlorophyll and water were compared to measured
values (Figure 5). Retrieval of leaf water content per
unit leaf area was encouraging with only a slight
overestimation shown by the best fit linear coefficient
of 1.09824 and an R2 of 0.9289. Chlorophyll content had
a greater tendency for overestimation with a linear
coefficient of 1.2399 and a reduced precision with an R2
of 0.7846. Values retrieved from the inversion process
versus their measured value are plotted in Figure 5.
Conclusions
The results of this work have shown that problems
exist in the estimation of cereal crop leaf reflectance
and transmittance using the Prospect model. This leads
to inaccuracies in the retrieval of chlorophyll and leaf
water content through model inversion. However,
further work to adjust the leaf refractive index may help
to address these problems and to achieve better
estimates of these parameters.
Figure 5. Values retrieved for leaf chlorophyll content and leaf water content
plotted against their measured values, along with the line showing the ideal
1 to 1 relationship
With further work to identify its shortcomings specific
to cereal crop analysis, the Prospect model, when
coupled with a suitable canopy reflectance model, may

5
prove a valuable tool in the monitoring and
management of agricultural crops using hyperspectral
data.
Acknowledgments
The authors wish to thank Agilent Technologies
Australia (M) Pty Ltd for the use of the Cary 500
spectrophotometer. We would also like to thank the
Department of Environmental Biology at Curtin
University of Technology for assistance in measuring
ancillary data and Associate Professor Mervyn Lynch
from the Department of Applied Physics for his
technical assistance.
References
1. S. Jacquemoud and F. Baret, "PROSPECT: A model
of leaf optical properties spectra," Remote Sensing
of Environment, vol. 44, pp. 281-292, 1990.
2. S. J. Maas and J. R. Dunlap, "Reflectance,
transmittance and absorptance of light by normal,
etiolated and albino corn leaves," Agronomy
Journal, vol. 81, pp. 105-110, 1989.
3. A. C. Curcio and C. C. Petty, "The near infrared
absorption spectrum of liquid water," Journal of the
Optical Society of America, vol. 41, pp. 302-304,
1951.
4. S. Jacquemoud, S. L. Ustin, J. Verdebout, G.
Schmuck, G. Andreoli, and B. Hosgood, "Estimating
leaf biochemistry using the PROSPECT leaf optical
properties model," Remote Sensing of Environment,
vol. 56, pp. 194-202, 1996.
5. F. Baret and T. Fourty, "Estimation of leaf water
content and specific leaf weight from reflectance
and transmittance measurements," Agronomie, vol.
17, pp. 455-464, 1997.
6. H. K. Lichtenthaler, "Chlorophylls and carotenoids:
pigments of photosynthetic membranes," Methods
in Enzymology, vol. 148, pp. 350-382, 1987.
7. J. Abadie and J. Carpentier, "Generalization of the
Wolfe reduced gradient method to the case of
nonlinear constraints," in Optimization, R. Fletcher,
Ed. London: Academic Press, 1969, pp. 37-47.

www.agilent.com/chem
© Agilent Technologies, Inc., 2001, 2011
Published March, 2011
Publication Number SI-A-1194

For more information
Learn more: agilent.com/chem/food
Buy online: agilent.com/chem/store
Find an Agilent customer center in your country: agilent.com/chem/contactus
U.S. and Canada 1-800-227-9770 option 3, then option 3 again [email protected]
In other countries, please call your local Agilent Representative or Agilent Authorized Distributor – visit agilent.com/chem/contactus
This information is subject to change without notice.
© Agilent Technologies, Inc. 2013 Printed in the USA December 31, 2013 5991-3818EN
Copyright © 2022 FDOKUMEN