Enriching Unstructured Media Content About Events to Enable ...
Upload
khangminh22Category
view
5download
0
ENRICHING LIVES. INSPIRING CHANGE.
HEMAS HOLDINGS PLC ANNUAL REPORT 2011/12

CONTENTSFinancial Highlights 2
Chairman’s Report 4
CEO’s Review 6
Financial Review 10
Sector Reviews
FMCG 14
Healthcare 16
Leisure 18
Transportation 20
Power 22
Sustainability Report 24
Corporate Governance 38
Risk Management 48
Report of the Remuneration Committee 51
Audit Committee Report 52
Nominations Committee Report 53
Directors’ Interest in Contracts with the Company 54
Board Profiles 56
Board of Management 58
Group Operating Committee 59
Annual Report of the Directors 60
Financial Statements 67
Statement of Directors’ Responsibilities 68
Independent Auditors’ Report 69
Balance Sheet 70
Income Statement 71
Statement of Changes in Equity 72
Cash Flow Statement 74
Notes to the Financial Statements 75
Share Information 120
Five Year Summary 123
Glossary 124
Notice of Meeting 125
Form of Proxy 127

THE HEMAS GROUP IS ONE OF SRI LANKA’S MOST-LOVED
COMPANIES, HOLDING DEEP AND LONG-STANDING
RELATIONSHIPS WITH THOUSANDS OF LOYAL CUSTOMERS
ACROSS THE ISLAND.
OVER THE YEARS, WE’VE BEEN INVESTING FOR GROWTH
IN OUR PORTFOLIO ACROSS ALL OUR SECTORS, ADDING
VALUE, GROWING IN STRENGTH, ENRICHING LIVES.
ENRICHING LIVES. INSPIRING CHANGE.

2 The Hemas Group. Enriching Lives
FINANCIAL HIGHLIGHTS
Change
Year Ended 31 March 2012 2011 % 2010
Operating Results
Group Revenue Rs ‘000s 21,409,596 18,067,489 18.5 14,997,405
Operating Profit Rs ‘000s 1,958,205 1,817,642 7.7 1,498,046
Profit Before Taxation Rs ‘000s 1,574,913 1,569,345 0.4 1,094,719
Profit After Taxation Rs ‘000s 1,314,606 1,355,191 (3.0) 934,644
Profit Attributable to the Group Rs ‘000s 1,209,058 1,210,159 (0.1) 901,730
Gross Dividend Paid Rs ‘000s 285,370 382,390 (25.4) 183,525
Cash from Operations Rs ‘000s 948,833 1,994,663 (52.4) 1,407,985
Balance Sheet Highlights
Total Assets Rs ‘000s 22,808,972 19,215,874 18.7 16,066,931
Total Shareholders’ Funds Rs ‘000s 10,791,559 8,874,006 21.6 7,692,116
No. of Shares ‘000s 515,291 512,041 0.6 101,958
Gearing % 24.5 27.8 (11.9) 25.8
Shareholder Information
Return on Equity % 12.3 14.6 (15.8) 12.3
Earnings per Share* Rs. 2.33 2.36 (1.4) 1.76
Dividend per Share* Rs. 0.50 0.70 (28.5) 0.36
Dividend Payout % 21.4 29.6 (27.8) 20.4
Net Assets per Share* Rs. 20.94 17.33 20.8 15.09
Market Capitalisation Rs ‘000s 13,552,143 23,553,869 (42.5) 12,234,975
Price Earnings Ratio Times 11.3 19.5 (42.0) 13.6
Market Price as at 31st March* Rs. 26.30 46.00 (42.8) 24.00
* Comparative figures adjusted for sub division of ordinary shares in the proportion of 5:1
0
5,000
10,000
15,000
20,000
25,000
GROUP REVENUERs. Mn
07/08 08/09 09/10 10/11 11/12
0
300
600
900
1,200
1,500
PROFIT ATTRIBUTABLE TO THE GROUPRs. Mn
07/08 08/09 09/10 10/11 11/12
0
500
1,000
1,500
2,000
2,500
CASH FROM OPERATIONSRs. Mn
07/08 08/09 09/10 10/11 11/12
0
3,000
6,000
9,000
12,000
15,000
0
5
10
15
20
25
SHAREHOLDERS' FUNDS & ROERs. Mn %
07/08Shareholders’ Funds ROE
08/09 09/10 10/11 11/12

Annual Report 2011/12 3
Personal Care
Home Care
Food
Paper Products
FMCG
HEALTHCARE
LEISURE
TRANSPORTATION
POWER
Pharmaceuticals
Diagnostics & Surgical
Hospitals
Aviation
Maritime
Freight & Logistics
Courier Services
Hotels
Destination Management
Thermal
Mini Hydro
COMPANY INFORMATION MANAGEMENT REPORTS SECTOR REVIEW GOVERNANCE SUSTAINABILITY FINANCIAL REPORTS
PROFIT AFTER TAX Rs. Mn
08/09 09/10 10/11 11/12
534636
519575
TURNOVER
31%
PROFIT AFTER TAX Rs. Mn
08/09 09/10 10/11 11/12
15 69
232
356
PROFIT AFTER TAX Rs. Mn
08/09 09/10 10/11 11/12
133
122
94
PROFIT AFTER TAX Rs. Mn
08/09 09/10 10/11 11/12
163181
224242
PROFIT AFTER TAX Rs. Mn
08/09 09/10 10/11 11/12
245 244
426
271
TURNOVER
35%
TURNOVER
6%
TURNOVER
3%
TURNOVER
21%

4 The Hemas Group. Enriching Lives
CHAIRMAN’S REPORT
“...in addition to optimising revenue and
profit growth from current activities we
have been and we are continuing to invest
in incremental activities that will give us
new slabs of revenue in the future. We
believe this will help us to create greater
shareholder value in the future...”
PROFIT AFTER TAX - Rs. Mn
1,315CASH FROM OPERATIONS - Rs. Mn
949

Annual Report 2011/12 5
The expected peace dividend that would create massive inflows of
investment has not materialised. On reflection this should not be
perceived as a negative. There are a large number of countries that
have peace. With peace we have joined the club of peaceful countries.
We are on a level playing field with the rest. The only surprise is that
we ever expected a peace dividend!!
Investment funds will flow to where there is a competitive advantage
which gives the investor the potential to get good returns. Tourism
is a classic example. We have a competitive advantage and we are
therefore seeing interest and inflows of funds.
Modern business leaders place importance on the impact on the
environment, human rights and governance as these are areas of
concern to their shareholders. Countries that do not score well
on these three dimensions will suffer the consequences and will
find that this will diminish inflows of funds. We must hope that the
Government will deal vigorously with the problems of abductions,
violence and corruption as they will be the log across the river that
will reduce the inflow of investments.
When planning for the future it is necessary to take a view of the
future and to develop strategies in that context.
I think the macro economic fundamentals are quite sound and
this gives us confidence about the future. Inflation is single digit,
unemployment figures are coming down and compared to most
parts of the world our unemployment numbers are impressive even
though they to some extent have been helped by those moving out
as migrant workers. Reserves are adequate, government debt as a
percentage of GDP is declining. The only blip that will not go away
easily is the deficit in the balance of trade, but as long as other inflows
bridge the gap it does not really spoil an otherwise good report card.
Overall with modest assumptions of investment inflows GDP growth
is expected to be around 7 to 8%.
Your Board has viewed the future through these very lightly rose
tinted glasses. Therefore we are continuing our commitment to
growth in the future. This means that in addition to optimising
revenue and profit growth from current activities we have been and
we are continuing to invest in incremental activities that will give
us new slabs of revenue in the future. We believe this will help us to
create greater shareholder value in the future. The flip side to this is
that in the short term the interest costs of the investments in new
activities will depress earnings. Whilst we will be mindful of sustaining
earnings growth we will not let this stifle investment for the future
which we believe is the best route to build shareholder value.
We are continuing to pursue our three prongs of investment activities
that will create long term value, namely Hospitals, Power and Hotels.
The CEO in his report will comment in detail on our performance
during the year. So rather than repeating all of this I will confine my
comments saying that our sales increased by 18.5%, EBITDA by 5.8%.
However profit before tax and earnings remained flat due to the
reasons I have commented upon earlier and a bit of bad luck with
one of our new initiatives, the mini hydro plants where the power
generated was low due to the drought. Increases in working capital
during the year had a negative effect on the Group’s operating cash
flow reducing it by 52%.
We continue our successful, journey from family firm to a well
structured public company. Family members are moving away from
their executive roles. We have a very good governance structure .
The three committees namely Audit, Remuneration and Nomination
have worked well during the year. There are separate reports on
these activities in this report. I think we have very good professional
management teams across our businesses and we give a lot of
attention to developing our people skills.
We welcome to the Board Mr. R Gopalakrishnan .He has immense
corporate experience and we are delighted and fortunate that he
has joined our Board. I must congratulate the CEO Mr. Husein Esufally
on another excellent performance. I must thank the members of the
Board for their help and support. What we achieve is entirely due to
our staff and to all of them I say a big Thank You.
Lalith De Mel
Chairman
May 25, 2012
“I THINK THE MACRO ECONOMIC
FUNDAMENTALS ARE QUITE SOUND AND
THIS GIVES US CONFIDENCE ABOUT THE
FUTURE...”
MANAGEMENT REPORTS SUSTAINABILITY GOVERNANCE FINANCIAL REPORTS
6 The Hemas Group. Enriching Lives
CHIEF EXECUTIVE OFFICER’S REVIEW
GROUP REVENUE - Rs. Mn
21,410EARNINGS - Rs. Mn
1,209
“Whilst we anticipate that there will be short
term challenges to the economy, we remain
optimistic about Sri Lanka’s long term growth
and many of our investment strategies are
predicated on that.“

Annual Report 2011/12 7
Dear Shareholder,
As an eventful year comes to an end and paves the way for
another, it is indeed my pleasure to report to you on the Company’s
performance for the year ended March 31, 2012. It was encouraging
to see the Company close the year with positive momentum, after
experiencing a challenging first half.
Revenues showed a robust growth of 18.5% to record Rs. 21.4Bn for
the year under review, key contributors to revenue growth being
Power (32.7%), Healthcare (14.8%) and FMCG (13.7%) sectors. The
steady growth of our Hospital volumes together with the healthy
performance of our pharmaceutical business contributed towards the
continuous topline growth of the healthcare sector. The growth seen
by the Power sector is attributable to the hike in furnace oil prices, a
pass through cost of our thermal power operation. Our FMCG sector
faced a challenging environment during the first half of the year, but
was successful in ending the year on a positive note with a strong
momentum in sales growth. Despite the closure of Hotel Serendib,
which was subsequently rebranded as Avani Bentota, the Leisure
sector posted a topline growth of 14.3%. A shrinking cargo market
contributed to the drop in revenue of 1.7% of the Transportation
sector, which was somewhat mitigated by the impressive growth
witnessed in passenger sales.
Whilst Earnings for the first half were down by 17.2%, performance
bounced back strongly during the third and fourth quarters with
Earnings up by 12.6% and 19.6% respectively, enabling the Company
to close out the year with Earnings of Rs.1,209Mn, a marginal decline
from the previous year’s Rs. 1,210Mn. Earnings were driven by
the strong performances of Pharmaceuticals, Aviation and FMCG
businesses, which grew by 35.1%, 28.8% and 10.7% respectively, whilst
results were dampened by the poor rainfall in the catchment areas
of our hydro plants, the closure for refurbishment of Hotel Serendib
(which reopened as Avani Resort, Bentota) and startup losses and
development expenses of our new Hospital projects. In addition, the
steep decline in the Sri Lankan Rupee during the latter part of the
year, caused unexpected exchange losses that impacted reported
earnings.
For the Sri Lankan economy, 2011 was a mixed year, during which an
impressive GDP growth of 8.3% coincided with increasing pressure
on prices, currency and interest rates. The impact of these pressures
was increasingly evident during the latter part of 2011 with the
inevitable repercussions spilling over into 2012 with even greater
impact. Whilst the depreciating rupee, increasing costs of borrowing
and heightening inflationary pressures have all impacted our Group’s
performance in general, certain industry-specific challenges such
as high commodity prices, Euro zone crisis and the year-round
drought have stunted growth in some of our businesses. In a business
environment which was increasingly uncertain, it was a challenging
task to deliver results without losing focus on our long-term
investment plan. For the year under review the Group has generated
Operating Profits of Rs. 1.96Bn, a growth of 7.7%, whilst investing
Rs. 1.5Bn in projects that we believe will hold the Company in good
stead in years to come.
At the current market price of Rs. 22.00 (25/05/12), your stock is
trading at a price-earnings multiple of 9.4 on 2011/12 earnings. This
reflects an earnings yield of 10.6% implying good underlying value for
the stock, given the long-term growth potential of our underlying and
new businesses.
UNDERLYING BUSINESSES: THE CORE THAT DRIVES
THE GROUP
While our underlying businesses, namely FMCG, Pharmaceuticals,
Hotels, Aviation and Power, experienced mixed fortunes during the
year under review, many of them closed the year on a high note.
The FMCG business sustained a difficult first half with its revenues
growing at a moderate pace of 8.5% in a highly competitive market
environment. Gross margins were also under immense pressure due
to high raw material prices, as a result of which sector profits declined
12.7% during the first half. The second half of the year saw a spirited
comeback by the business, with revenues growing by 19% and profits
soaring by 41.3%. Whilst Baby Cheramy and Clogard remains the
main flagship brands of our business, growth over the year was led
by Kumarika, Velvet and Fems brands, which saw significant growth
in market share and revenues in their respective categories. Our
new offering for the year included Kumarika Face Wash, marking its
entry into the growing market of skin cleansing, along with useful
extensions to its existing shampoo and hair oil propositions, all of
“WHILST EARNINGS FOR THE FIRST HALF
WERE DOWN BY 17.2%, PERFORMANCE
BOUNCED BACK STRONGLY DURING THE
THIRD AND FOURTH QUARTERS WITH
EARNINGS UP BY 12.6% AND 19.6%
RESPECTIVELY...”
MANAGEMENT REPORTS SUSTAINABILITY GOVERNANCE FINANCIAL REPORTS

8 The Hemas Group. Enriching Lives
which were inspired around a ‘naturals’ platform. In addition, Clogard
extended its presence in the oral care category with its Multi-Vitamin
variant whilst Diva Detergent Powder was extended to the whitener
category with Diva White Power. During the year, our sanitary napkins
brand Fems underwent a facelift and was re-launched with a new
look and feel. As we anticipate a more dynamic and competitive
marketplace going forward, we continuously look to align our product
portfolio with the evolving consumer.
Pharmaceutical distribution has been a steadily growing business
over the past few years, and for the year under review the business
recorded a revenue growth of 13.4% and an impressive profit growth
of 35.1%. The business was significantly impacted by the rapid
decline in the Rupee during the latter part of the year, stunting its
growth which otherwise would have been even better. Hemas has
been the long-standing market leader in pharmaceutical distribution
and we have further strengthened our leadership position by
extending our market share to 17% (source: IMS). During the year the
business acquired a new agency Panacea Biotec which specializes
in Nephrology. In this business, our long-term strategy is to most
effectively serve the Sri Lankan market by attracting and retaining
Principals that manufacture pharmaceuticals which address our
market needs effectively in terms of quality, efficacy and affordability.
According to the Health Ministry, the new Drug Policy will be
presented to the Parliament soon and currently it is with the legal
draftsman. Even with the proposed changes in the Drug policy,
the Company is well placed to continue its service to Sri Lankan
patients through the mix of MNC’s and Branded Generic Companies
that it represents. The Company welcomes a policy to streamline
the Pharmaceutical industry in Sri Lanka, and plays an active role
at the Pharmaceutical Chamber (SLCPI) which has made several
recommendations to improve the effectiveness of the proposed
reforms.
The key highlight of our Hotels Sector, which comprises the Serendib
Group of Hotels, was the repositioning and rebranding of Hotel
Serendib as Avani Resorts, Bentota. The total cost of refurbishment
was Rs. 650Mn, and the hotel is now positioned to target an up
market clientele. The closure of the hotel resulted in a decline in
profits, understating the real performance of the Sector, which in fact
enjoyed a tremendous year. Club Hotel Dolphin and Hotel Sigiriya
grew its earnings by 340% and 213% respectively to close the year at
Rs. 91Mn and Rs. 47Mn respectively. Given the improved outlook of
tourism to Sri Lanka, the sector has revived its plans to develop its 43
acre property in Tangalle.
Growth and profitability of our Aviation business suffered during
the first nine months of the year due to the industry-wide decline in
cargo volumes, overshadowing the growth in the passenger sales
market. During the first nine months, profits declined by 8% but
due to the steady growth in our passenger sales coupled with a late
recovery in the cargo market, the business was able to close the year
successfully, posting a 28.8% growth in profits. Going forward, the
sector is evaluating several investment opportunities in the Maritime
& Logistics space where it sees significant potential.
Power Sector profits were depressed throughout the year due to
extremely low rainfall in the catchment areas of our hydro power
plants. Revenues were up 32.7% as a result of higher furnace oil prices
being passed through to thermal power revenues. However this has
no positive effect on profitability and the poor performance of our
hydro plants determined the overall profitability of the sector, which
delivered Earnings of Rs. 203Mn, a decline of 36.3% over last year.
Our third mini hydro power plant, which is located in Upper Magal
Ganga, commenced operations in September 2011. With this 2.4MW
plant, our total renewable energy capacity is now 7.0MW, which is in
addition to Heladhanavi, the 100MW thermal plant at Puttalam.
Our strategy remains to grow our portfolio of renewable energy
projects and to this end, we have already embarked on a Rs. 750Mn
project for a 3MW biomass power plant. Furthermore, the Sector is
currently carrying out the groundwork for an offshore opportunity in
East Africa for a 10MW mini hydro plant.
NEW INVESTMENTS: DRIVING AN AMBITIOUS GROWTH PLAN
In the past few years, the Group has been actively investing in
Hospitals, Hotels and Power, with a long-term focus. Over the past 5
years, Group investments have exceeded Rs. 5Bn.
From a business portfolio perspective, the most noteworthy
investment in the recent past has been our entry into Hospitals
space, where we invested over Rs. 2Bn from 2007 to 2009. Our
hospital model is built around the idea of making quality healthcare
easily accessible to the target market. As we continuously focus on
perfecting our operating model, we continue to experience a growing
patronage at our multi-specialty facilities in Wattala and Galle. For the
year under review, total revenues from Wattala and Galle hospitals
have grown by 23.8% which led to an EBITDA growth of 25.3%. With
the ACHSI (Australian Council on Healthcare Standards International)
certification in 2011, Hemas Hospitals became the first and only
hospital in Sri Lanka to obtain an international accreditation. Moreover
Hemas Hospitals is the first hospital to receive the OHSAS 18001
CHIEF EXECUTIVE OFFICER’S REVIEW

Annual Report 2011/12 9
(Occupational Health & Safety Advisory Services) certification, which
is the international standard for health and safety of patients and staff.
With the learning experiences from our first two hospitals coupled
with our long-term positive outlook on the industry, we embarked
upon our third project at Thalawathugoda in early 2012. With this
project our total investment into the Hospital sector will exceed
Rs. 3Bn and we look forward to expanding our model into more
suburban towns and key cities outside Colombo over the longer term.
PEOPLE AND GOVERNANCE: KEY TO SUSTAINABLE GROWTH
As a public listed company, maintaining high standards of governance
is important to us, and we strive to ensure that governance facilitates
sustainable performance and growth rather than constrain it. Each of
our key businesses is governed by an active board which provides a
strategic oversight and ensure business risks are managed well.
The involvement of independent directors who can add value
at business level is important to ensure that performance and
conformance go hand in hand. Focusing on people development is a
natural outcome of governance as it is a key aspect of the continuity
of the organization. Leadership development in particular has been
a key area of focus at Hemas during the past year and there is no
doubt that this will be a key priority going forward. In our Group, each
of our leaders has an individualized development plan focusing on
leadership training, executive coaching and special assignments. From
time to time we transfer our leadership resources across businesses
and across functions as an effective tool of leveraging our top talent
to address key priorities of the Group.
Over the year under review, the company launched its Sustainability
initiative with the advice from a leading consultancy firm. Having
completed a successful pilot project in our Pharmaceuticals business,
the company hopes to roll this out across all Group businesses over
the coming years. Under this project, Group Sustainability guidelines
have been introduced to ensure that sustainability in the context
of Hemas is understood and adopted by all employees to ensure
that it becomes a way of life at Hemas. It is intended that this would
bring significant long term benefits through better stakeholder
engagement and reduction of our environmental footprint.
Our flagship Corporate Social Responsibility project ‘Piyawara’ in
collaboration with the Children’s Secretariat of Ministry of Child
Development & Women’s Affairs celebrated 10 years of partnership
with the government. The year under review saw a new concept
named ‘Piyawara’ Community Preschools’ being introduced to
assist the marginalized communities in rural Sri Lanka. The first ever
‘Piyawara’ community preschool is being constructed in Ambalnagar
which is a newly resettled village in the district of Kilinochchi.
Whilst we anticipate that there will be short term challenges to the
economy, we remain optimistic about Sri Lanka’s long term growth
and many of our investment strategies are predicated on that.
Our priority as always remains to deliver shareholder value through
earnings growth, and we will strive to do this by improving the
performance of our core businesses, whilst constantly looking for
acquisition opportunities that have a strategic fit with our portfolio
In conclusion, I wish to thank my Chairman and the Board of Directors
for their active participation and guidance to steer the Group forward.
My special thanks to Mr. Debu Bhatnagar who retired from the Board
having completed 3 years as a Non-Executive Director, following
his previous association with us as Head of the FMCG business. I am
indeed happy to welcome Mr. R Gopalakrishnan who joins us as an
Independent Director to fill the vacancy. My sincere thanks as always
to the entire Hemas team who have always given off their best to
support the company in its endeavors.
Our Customers remain at the core of our business, and I thank them
for their patronage and support, along with our Business partners
who have placed their confidence by partnering with Hemas. Finally,
my sincere thanks go out to all our shareholders for the faith you
have placed in the company, and we assure you of our best efforts in
delivering superior performance in the coming year and beyond.
Husein Esufally
Cheif Executive Officer
May 25, 2012
MANAGEMENT REPORTS SUSTAINABILITY GOVERNANCE FINANCIAL REPORTS

10 The Hemas Group. Enriching Lives
FINANCIAL REVIEW GROUP REVENUE
Consolidated revenue for the year was Rs. 21.4Bn, an 18.5% growth over the previous year. In terms of
revenue contribution, our two largest sectors are Healthcare and FMCG, which account for 34.9% and
30.8% respectively, of consolidated revenue, followed by the Power sector which accounts for 20.9%.
Healthcare sector grew by 14.8% during the year, supported by the steady buildup of volumes at our
Hospitals and the strong performance by our Pharmaceuticals business which continued to strengthen
its market leadership position, taking its market share to 17% (IMS). FMCG revenue growth which was
slowing down during the first half, picked up during the second half on the back of stronger consumer
demand to deliver a growth of 13.7% for the year. Power sector grew its top line by 32.7% mainly due to
the pass-through effect of higher furnace oil prices, which is the key input to our thermal power operation.
Our Leisure sector, which contributes 5.5% of Group revenues, grew its top line at a pace of 14.3% despite
the half-year closure of Hotel Serendib, which was refurbished and relaunched as Avani Resort, Bentota
in December. Our Transportation sector which makes up 3.4% of Group revenues, suffered a 1.7% decline
in revenues due to a shrinking cargo market, despite its impressive performance with regard to the
passenger business. Other revenues, which have grown by 55.8% was largely due to the encouraging
performance by our Systems Integration business which experienced its most successful year since
inception in 2008. In terms of impact on revenue growth, FMCG, Healthcare and Power sectors were
instrumental in delivering 15.9% out of the 18.5% overall revenue growth.
OPERATING PROFIT
Operating Profit (before interest cost and exchange losses due to foreign currency borrowings) of the
Group for the year ended 31 March 2012 was Rs. 1.96Bn, a 7.7% increase from the previous year. However
operating margins declined from 10.1% to 9.1% over the year, largely due to the declined profitability of
the Power sector, where operating margins dropped from 15.5% to 9.5%. The steep drop in Power sector
operating margins is attributable to the lower profitability of our mini hydro segment on the back of poor
rainfall and the pass-through effect of higher input costs of the thermal power segment. Operating Profits
of FMCG have grown by 8.6% with an operating margin of 9.1% compared to previous year’s 9.5%. FMCG
margins were dampened last year due to higher raw material prices vis-a-vis the previous year. Profitability
of the Personal Wash category in particular took a beating with the significant increase in distilled fatty
acid prices. Operating Profits of the Healthcare sector grew at a healthy pace of 24.1% largely driven
by the revenue growth of both Hospitals and Pharmaceuticals as well as continuous improvement in
0
5,000
10,000
15,000
20,000
25,000
(5)
0
5
10
15
20
25
Group Revenue Break -upRs. Mn %
07/0806/07 08/09 09/10 10/11 11/12
FMCG
Group RevenueHealthCare
Power
LeisureOthers
Transportation
Table 1: Revenue Analysis
Revenue Mix
10/11
Growth
11/12
Contribution to Growth Revenue Mix
11/12Absolute
11/1211/12
FMCG 32.1% 13.7% 4.4% 23.8% 30.8%
Healthcare 36.1% 14.8% 5.3% 28.9% 34.9%
Leisure 5.7% 14.3% 0.8% 4.4% 5.5%
Transportation 4.1% (1.7%) (0.1%) (0.4%) 3.4%
Power 18.7% 32.7% 6.1% 32.9% 20.9%
Other 3.4% 55.8% 1.9% 10.3% 4.5%
Group 100.0% 18.5% 18.5% 100.0% 100.0%
0
400
800
1,200
1,600
2,000
(15)
(10)
(5)
0
5
10
15
20
25
30
Operating Profit
Rs. Mn %
07/0806/07 08/09 09/10 10/11 11/12
Operating Profit Operating Margin
Operating Profit Growth

Annual Report 2011/12 11
operational efficiencies of the Pharmaceuticals business. Operating margin of the sector has increased to
7.9% during the year under review from 7.3% in the previous year. Leisure sector saw its operating profits
increase by 59.9%, due to the strong performances at Club Hotel Dolphin and Hotel Sigiriya, despite the
closure of Hotel Serendib. Leisure sector operating margins were impressive at 19.4% compared to 13.9%
the previous year. In the Transportation sector, operating margins improved from 35.8% to 38.2%, but the
decline in revenue restricted the growth in Operating Profits to 4.9%.
COST OF BORROWING
During the year under review, cost of borrowing was impacted due to the rapid depreciation of the rupee
resulting in Rs. 165Mn of exchange losses on foreign currency borrowings as well as interest expenses
of Rs. 250Mn. The total cost of borrowing of Rs. 415Mn is a 33.4% increase on the Rs. 311Mn recorded in
the previous year. The majority of the local currency borrowings are applied into our Hospital business.
Foreign currency borrowings are concentrated on the Leisure sector and Power sector. Whilst Heladhanavi
has USD 18Mn outstanding borrowings to fund its thermal power operations, Serendib Hotels Group
has outstanding borrowings of EUR 2Mn and GBP 2Mn which financed the refurbishment of Club Hotel
Dolphin in 2010 and the repositioning of Hotel Serendib last year. Whilst long-term borrowings have
declined from Rs. 1.70Bn to Rs. 1.39Bn, a drop of 18.5%, mainly due to capital repayments and recognition
of current component of borrowings, short-term borrowings have increased by 18.6%, from Rs. 2.38Bn to
Rs. 2.82Bn, where the majority is used in Heladhanavi operations. As a result, the total debt in the Group
has increased 3.1%, from Rs. 4.08Bn to Rs. 4.21Bn.
As the growth in total debt is lower than the accumulation of retained earnings of the Group, total gearing
has decreased from 27.8% to 24.5% over the year.
TAXATION
Taxation for the year under review has increased by 21.6%, from Rs. 214Mn to Rs. 260Mn. The effective tax
rate for the year was 16.5% as against 13.6% in the previous year. The key reasons for the increased effective
tax rate is that the highest pre-tax profits were generated by the highest tax paying businesses in the
Group and the relatively large unrealized exchange losses, which do not result in tax deductions despite
the reduction in pre-tax profits.
0
100
200
300
400
500
20
25
30
35
40
Cost of Borrowing
Rs. Mn %
07/0806/07 08/09 09/10 10/11 11/12
Finance Cost Gearing
Table 2: Operating Margin Analysis
Revenue Mix Operating Margins Margin Impact
10/11 11/12 10/11 11/12 Mix Profitability Total
FMCG 32.1% 30.8% 9.5% 9.1% 0.0% (0.1%) (0.1%)
Healthcare 36.1% 34.9% 7.3% 7.9% 0.0% 0.2% 0.2%
Leisure 5.7% 5.5% 13.9% 19.4% 0.0% 0.3% 0.3%
Transportation 4.1% 3.4% 35.8% 38.2% (0.2%) 0.1% (0.1%)
Power 18.7% 20.9% 15.5% 9.5% 0.0% (1.1%) (1.1%)
Other 3.4% 4.5% (23.2%) (17.0%) (0.3%) 0.2% (0.1%)
Group 100.0% 100.0% 10.1% 9.1% (0.5%) (0.4%) (0.9%)
0
90
180
270
360
450
0
5
10
15
20
25
30
Taxation
Rs. Mn %
07/0806/07 08/09 09/10 10/11 11/12
Taxation Effective Tax Rate
MANAGEMENT REPORTS SUSTAINABILITY GOVERNANCE FINANCIAL REPORTS

12 The Hemas Group. Enriching Lives
PROFIT AFTER TAX
Profit after Tax of the Group for the year under review was Rs. 1,315Mn, a 3% decline compared to previous
year’s Rs. 1,355Mn. The 7.7% growth in Operating Profits has been translated into a 3% decline in Profits
after Tax as a result of the 33.4% increase in the cost of borrowing and the 21.6% increase in taxation.
Profit after Tax has been mainly driven by the Healthcare sector which saw an impressive growth of 53.3%
on the back of a strong performance by our Pharmaceuticals business and the steady buildup of business
volumes at our Hospitals. On the other hand Leisure and Power sectors have dragged profit growth due to
the large exchange losses suffered on the foreign currency borrowings. In addition, the poor rainfall across
the catchment areas of our mini hydro plants further deteriorated Group profits.
Net margin of the Group declined from 7.5% to 6.1% during the year under review. This decline is largely
attributable to the significant drop in Power sector margins, from 12.6% to 6.1%.
CASH FLOW
Net Cash from Operating Activities declined 52.4% from Rs. 1,995Mn to Rs. 949Mn. A net outflow of
Rs. 922Mn into working capital has dragged cash flow generation, with the Power sector causing the
largest impact due to delayed payments by the CEB.
Net Cash used in Investing Activities has been Rs. 1.44Bn, 15.9% higher than the previous year. The bulk of
this amount was invested in the refurbishment of Hotel Serendib and the Magal Ganga Mini Hydro Project.
Net Cash Used in Financing Activities for the year was Rs. 457Mn, which is a 234.7% swing compared to the
Rs. 339Mn of Net Cash generated from Financing Activities in the previous year.
0
300
600
900
1,200
1,500
(60)
(45)
(30)
(15)
0
15
30
45
60
Profit After Tax
Rs. Mn %
07/0806/07 08/09 09/10 10/11 11/12
Profit After Tax Profit Growth
Net Margin
Table 3: Net Margin Analysis
Revenue Mix PAT Margins Margin
10/11 11/12 10/11 11/12 Mix Profitability Total
FMCG 32.1% 30.8% 9.0% 8.7% 0.0% (0.1%) (0.1%)
Healthcare 36.1% 34.9% 3.6% 4.8% 0.0% 0.4% 0.5%
Leisure 5.7% 5.5% 11.8% 8.0% 0.0% (0.2%) (0.2%)
Transportation 4.1% 3.4% 30.5% 33.5% (0.2%) 0.1% (0.1%)
Power 18.7% 20.9% 12.6% 6.1% 0.0% (1.2%) (1.3%)
Other 3.4% 4.5% (27.3%) (23.4%) (0.3%) 0.1% (0.2%)
Group 100.0% 100.0% 7.5% 6.1% (0.5%) (0.8%) (1.4%)
0
500
1,000
1,500
2,000
2,500
(200)
0
200
400
600
Cash Flow
Rs. Mn %
07/0806/07 08/09 09/10 10/11 11/12
Operating Cash Flow Profit After Tax
Operating Cash Flow Growth
FINANCIAL REVIEW

Annual Report 2011/12 13
RETURN ON INVESTMENT
Return on Capital Employed (ROCE) has declined from 13.5% to 12.3% due to the drop in operating margin
from 10.1% to 9.1% while asset utilization rate has remained stable. The increase in effective tax rate from
13.6% to 16.5%, coupled with lower gearing has caused the Return on Equity (ROE) to decline to 12.3%
from 14.6% in the previous year.
Table 4: Return on Investment
07/08 08/09 09/10 10/11 11/12
Operating Margin 10.5% 8.8% 10.0% 10.1% 9.1%
Asset Turnover 1.15 1.08 0.97 1.02 1.02
Asset/Capital Employed 1.29 1.27 1.29 1.31 1.32
ROCE 15.7% 12.1% 12.5% 13.5% 12.3%
Interest Cover 4.2 2.8 3.3 6.2 7.3
Effective Tax Rate 8.6% 16.1% 14.6% 13.6% 16.5%
Gearing 31.4% 32.9% 25.8% 27.8% 24.5%
ROE 19.4% 11.5% 12.3% 14.6% 12.3%
MANAGEMENT REPORTS SUSTAINABILITY GOVERNANCE FINANCIAL REPORTS

14 The Hemas Group. Enriching Lives
The Fast Moving Consumer Goods (FMCG) sector
of Hemas which closed the year with a turnover
of Rs 6.6Bn encompasses the key product
categories of personal care, personal wash, and
home care.
The industry is an extremely dynamic one with growth driven by
higher disposable income, new channels and an ever increasing
choice of new products for consumers to choose from. Whilst this
has contributed to high growth rates in the last few years (especially
in rural demand), there is evidence that the prevailing economic
climate and increase in cost of living have dampened growth. For the
year under review, the industry saw double digit growth, driven by
categories like skin care, hair care and feminine hygiene, whilst growth
in traditional categories remained in single digits. A key concern
for local manufacturers is the availability of spurious products that
are not registered under the Cosmetics, Devices & Drugs Authority
(CDDA), but, are freely available in cosmetic stores. This impacts our
fragrance business in particular, and we hope that authorities will
act on representations made to them to assure consumers of quality
products, and protect the interests of local manufacturers.
FMCG
After a challenging first half, where revenue growth was slowing
and margins were dipping, the Sector did well to recover and drive
momentum with increased brand building activities, which resulted
in a year on year revenue growth of 13.7%. Sector profitability was
significantly impacted due to the higher prices of imported raw
material, in particular distilled fatty acids, the key ingredient in the
manufacture of soap, which accounts for a significant portion of
FMCG revenues. The impact was partially reversed towards the end
of the year with world commodity prices coming off their peak levels.
However, this was negated by the unexpected and rapid depreciation
of the Sri Lankan rupee which declined by 13% over the two months
ending 31st March 2012. Despite this, the sector closed the year with
a profit of Rs. 575Mn, a year on year growth of 10.7%.
Baby Cheramy, our flagship brand continues to lead the market in
the baby care space. During the year the brand increased penetration
through a strong advertising and promotions campaign, enabling
the growth momentum to continue from the previous year. Whilst
the brand did well to increase share in certain segments (especially
soap), it has more to do in evolving segments, like Diapers, which are
dominated by imported offerings.

Annual Report 2011/12 15
Kumarika hair oil was the key driver of revenue growth for the FMCG
division during the year with the launch of two new variants. The
brand also re-launched its shampoo, offering consumers a unique
product on a ‘naturals’ platform in distinctive modern packaging.
These initiatives significantly contributed to revenue growth, with the
brand growing twice as fast as the category.
The brand has also achieved a measure of success in the Bangladesh
market since its launch in 2007. Encouraged by the positive response
we commenced manufacturing the product locally in Bangladesh to
further enhance competitiveness.
Clogard our oral care brand consists of toothpaste, toothbrushes and
mouthwash. Clogard launched a new multi vitamin variant during the
year. Clogard is in continuous partnership with the Sri Lanka Dental
Association, the Peradeniya Dental Faculty and other universities,
supporting them and involving itself in research and development
into dental hygiene.
Diva washing powder sales increased significantly over the year with
the introduction of ‘Diva Whitening Powder’. The success of brand
building and product improvement efforts were evident with the
brand crossing the Rs 1Bn sales mark. Diva was recognised at the SLIM
(Sri Lanka Institute of Marketing) Brand Excellence Awards 2011, with
the Bronze award for “Best New Entrant of the Year”.
Fems sanitary napkins was re-launched last year with enhanced
quality and product features, which has led to significant gains in
market share during the year. Growth in this category remains robust
and the company is in the process of developing a long term plan to
increase its presence in this market
Velvet toilet soap continued to gain popularity strengthening
its position in the adult toilet soap category. The brand has seen
continual growth since the re-launch of the product last year and
“AFTER A CHALLENGING FIRST HALF, WHERE REVENUE
GROWTH WAS SLOWING AND MARGINS WERE DIPPING,
THE SECTOR WAS ABLE TO RECOVER AND DRIVE
MOMENTUM WITH INCREASED BRAND BUILDING
ACTIVITIES, WHICH RESULTED IN A YEAR ON YEAR REVENUE
GROWTH OF 13.7%...”
closed the year with its sights set on becoming the second largest
brand of adult toilet soap. The brand also extended its footprint,
launching a liquid hand wash which was well received, especially in
modern trade.
Channel focus being a key priority for successful execution, we have
begun featuring more of our products in cosmetics outlets and
beauty salons as well as strengthening our presence in the modern
trade.
Our FMCG sector was awarded in 2011, the Gold award in the
manufacturing medium scale segment for excellence in quality at the
Sri Lanka National Quality Awards Ceremony, the Quest for Excellence
award at the Global Performance Excellence Awards organized by the
Asia Pacific Quality Organization and four awards at the SLIM - NASCO
(National Sales Congress) Awards.
Evolving consumer needs coupled with the rapid growth of the
modern trade present both opportunities and challenges to
business growth. We continue to work diligently towards
strengthening our existing product portfolio and identifying new
opportunities to expand our product offerings. We aim to implement
a realignment of the product/brand portfolio within the business
whilst relentlessly challenging ourselves to improve product quality in
line with consumer expectations. This is expected to result in a suite
of brands and products more aligned to the evolving consumer in
prospering, post-war Sri Lanka.
0
1,000
2,000
3,000
4,000
5,000
6,000
7,000
0
100
200
300
400
500
600
700
REVENUE AND PROFIT AFTER TAXRs. Mn
07/08 08/09 09/10 10/11 11/12Revenue Profit After Tax
Rs. Mn
Sector - 44% Group - 56%
SECTOR VS GROUP PROFIT
44%
Sector - 31% Group - 69%
SECTOR VS GROUP REVENUE
31%
MANAGEMENT REPORTS SUSTAINABILITY GOVERNANCE FINANCIAL REPORTS

16 The Hemas Group. Enriching Lives
HEALTHCARE
Hemas Healthcare Sector, which comprises
hospitals and pharmaceuticals distribution,
reported an outstanding financial performance
in 2011. For the year under review, the sector
posted revenues and profits of Rs. 7.5Bn and Rs.
356Mn respectively. Compared to the previous year, sector revenue
and profits have grown by 14.8% and 53.3% respectively.
Hemas Pharmaceuticals contributed 85.6% to the healthcare sector
revenue, reflecting a growth of 13% over the previous year. The
division posted Rs. 6.4Bn revenue during the period to cap what
has been an exceptional year marked by expansion of our product
portfolio and consolidation of market leadership status. The enhanced
profitability can be attributed to the strategic measures undertaken
by the company to sustain its leadership position. Our market share
increased to 17% during the year as per IMS, despite the industry
registering single digit growth during the same period.
Our sales and distribution systems were strengthened through the
year backed by an efficient supply chain system. We undertook a
strategic rebranding exercise to transform and position the company
as a fully-fledged pharmaceuticals, surgical and diagnostics company.
This rebranding of our consolidated business will enable enhanced
customer centricity. Customer relationship management training was
imparted to all our employees to empower them to peg our service
at a much higher level than prevailing industry standards. Launched
three years ago, the Over the Counter (OTC) segment reflects a
healthy growth rate with value additions in the form of new products
and aggressive sales and marketing efforts. We anticipate a wide
scope to grow this segment and will be aiming to strengthen our
presence in the OTC segment.
The company fortified its product portfolio by launching Mankind
products in Sri Lanka. One of the fastest growing pharmaceutical
companies in India, Mankind manufactures pharmaceuticals for acute
and chronic conditions, and will prove to be a vital addition to the
range of essential drugs in the market. Adding further value, we have
recently secured the distributorship for Panacea Biotech products in
Sri Lanka. Over the years, we have striven to offer the widest and most
relevant choice of drugs in the local context.
Inspired by our group philosophy of functioning in an ethical manner
and ensuring sustainability of all stakeholders, Hemas Pharmaceuticals
released its first-ever GRI-based Sustainability Report in 2011. This
is a pioneering achievement by any pharmaceuticals company in
the country. Our sustainability goals form an integral part of our

Annual Report 2011/12 17
company’s overall objectives, and sustainability is inbuilt in our
business model. Our vision to be a role model in healthcare in
Sri Lanka drives us to establish centres of excellence in every aspect
of our operations. As a pharmaceuticals supplier, we will continue to
look for ways through which we can make a direct connection with
our end users so that we can understand and cater to their needs in a
more focused manner.
Hemas Hospitals reached the Rs. 1Bn milestone, marking a 23.8%
increase in revenue over the previous year. This growth has been
strategically driven through focused investments, superior quality
certifications and world-class health care products and services.
Hemas Hospitals is comprised of two family-oriented private hospitals
located in Wattala and Galle and a laboratory and diagnostic services
network. Hemas Hospitals is the first and only health care facility
in Sri Lanka to receive international accreditation. This globally
acclaimed recognition from the Australian Council on Healthcare
Standard International (ACHSI) reflects the superior systems and
processes in place at Hemas Hospitals. The laboratories received the
ISO 9001:2008 & ISO 15189 certifications and the stringent OHSAS
18001 certification, which places the health and safety of patients and
employees at the forefront.
Wattala and Galle hospitals together generated an EBITDA growth
of 25.3% to post a figure of Rs. 167Mn. Whilst our flagship hospital in
Wattala continued to enjoy growing patronage, the Galle hospital
enhanced its offering with the introduction of laparoscopy surgery,
making it the first hospital in the south to offer this facility. Hemas
Hospitals is increasingly becoming a preferred centre for deliveries
and the ‘Maathru’ package for mother and baby care is one of our best
performing products.
As part of our initiative to strengthen the skills of our workforce, our
key managers were sent to reputable hospitals and business schools
in Singapore, Philippines and India to familiarize themselves with new
systems and processes that can be suitably adapted to local needs.
Our commitment to training staff was demonstrated by the 27,641
hours of training offered.
The satellite laboratory network set up at strategic locations around
the country experienced a 35% increase in revenue during the year
under review. We expanded our chain in 2011 by adding two more
laboratories in Gampaha and Chilaw. We will continue to strengthen
the network through expansion and value addition.
We have commenced the construction of our third hospital in
Thalawathugoda which is expected to be operational by March 2013.
The new Rs. 1.2Bn hospital is to be built on a one acre site close to the
Thalawathugoda junction. The 50 bed hospital is expected to have
a wide range of specialties. Going forward, Hemas hopes to expand
the chain of hospitals while improving service levels at the current
hospitals. While our core business of pharmaceutical distribution
continues to grow, the sector hopes to grow its presence in the
hospital segment.
“...AN EXCEPTIONAL YEAR MARKED BY EXPANSION OF OUR
PRODUCT PORTFOLIO AND CONSOLIDATION OF MARKET
LEADERSHIP STATUS...”
Sector - 27% Group - 73%
SECTOR VS GROUP PROFIT
27%
Sector - 35% Group - 65%
SECTOR VS GROUP REVENUE
35%
0
1,000
2,000
3,000
4,000
5,000
6,000
7,000
8,000
REVENUE AND PROFIT AFTER TAXRs. Mn
07/08 08/09 09/10 10/11 11/12Revenue Profit After Tax
0
100
200
300
400
500
600
Rs. Mn
MANAGEMENT REPORTS SUSTAINABILITY GOVERNANCE FINANCIAL REPORTS

18 The Hemas Group. Enriching Lives
LEISURE
The Hemas Leisure Sector comprises of the
Serendib Group of Hotels and Diethelm Travels,
a key inbound tour operator in Sri Lanka. Overall
a favourable year for the tourism industry,
2011/12 witnessed a 34% increase in tourist
arrivals to Sri Lanka, thereby driving high levels of occupancy at all our
properties. As a result, our leisure businesses generated revenues of
Rs. 1183Mn, a marked increase of 14.3% over the previous year.
The Hotels arm manages the four hotel properties of Avani Bentota
Resort & Spa (formerly Hotel Serendib), Hotel Sigiriya, Club Hotel
Dolphin and Avani Kalutara Resort & Spa. The Serendib Group
achieved a record turnover of 1 billion rupees during the financial
year. Achievement of this exceptional performance was supported
through our partnership with one of the largest hospitality and leisure
companies in the Asia Pacific Region - Minor International of Thailand.
Minor International’s selection of the Serendib Group as the global
launch pad for the Avani brand reflects their confidence in the group
and in the potential of the county’s tourism prospects. Avani Bentota
Resort and Spa, formerly known as Hotel Serendib, was refurbished at
a cost of approximately Rs. 650 Mn and converted into a luxury hotel.
Despite the complete refurbishment, Avani Bentota retains its original
Geoffrey Bawa signature touch.
The Sector recorded an average occupancy of 80% for the properties
mentioned above whilst posting an impressive growth of 29% in
average room rates for the year under review. The Serendib Group
has maintained high levels of occupancy due to strong relationships
with our tour operators overseas who perceive us as a reliable partner
that consistently delivers a high level of service to their customers.
As testimony to this claim, Club Hotel Dolphin won the ITS Red Star
award for the third consecutive year. The property was also awarded
the prestigious Holiday Check award based on guest reviews, making
it only one of 99 hotels in the world and the first in Sri Lanka to win
this accolade.
As a group, we are proactively developing new markets and attracting
guests from India, China, East Europe and the Middle East to mitigate
the impact of the economic downturn in the European Union (EU),
one of our key source markets. In anticipation of continued growth
in the tourism industry, we continue to engage in training and
development of our hotel staff, refurbishments of properties and the
pursuit of service excellence.
Diethelm Travels, one of the leading inbound tour operators in the
country, was able to build on the previous year’s positive performance
by ending this year with a revenue growth of 20% over last year. It was

Annual Report 2011/12 19
MANAGEMENT REPORTS SUSTAINABILITY GOVERNANCE FINANCIAL REPORTS
“MINOR INTERNATIONAL’S SELECTION OF THE SERENDIB
GROUP AS THE GLOBAL LAUNCH PAD FOR THE AVANI
BRAND REFLECTS THEIR CONFIDENCE IN THE GROUP
AND IN THE POTENTIAL OF THE COUNTY’S TOURISM
PROSPECTS....”
pleasing to note that tourist numbers from the EU and the Middle
East grew apace. The latter is fast emerging as an important tourist
generating market and demonstrates a keen interest in Sri Lanka’s
tourism product.
Lower occupancies at city hotels during the summer months had
an unfavourable impact on our travel counter business located at
Colombo’s five-star hotels. Fortunately, the onset of the 2011/12
winter season witnessed a complete turnaround in fortunes for this
segment of our business. The healthy inflow of inbound tourists
recorded from EU and other markets during the latter part of the year
impacted favourably on revenue earnings from our inbound
travel arm.
Diethelm Travels won key EU accounts for Sri Lanka and the Maldives,
largely attributable to an aggressive sales push. Encouraged by the
positive trend in the global tourism industry, we launched an office in
Maldives during the 2011/2012 financial year.
We remain optimistic about the growth prospects of the Sector as
the demand for the Sri Lankan tourism product continues to grow.
As such, we aim to expand our portfolio of signature owned and
managed properties in key tourist destinations around the Island,
under the Avani brand. The Sector aims to enhance the Group’s leisure
footprint whilst delivering great experiences and exceptional service
to our guests over the coming years.
Sector - 7% Group - 93%
SECTOR VS GROUP PROFIT
7%
Sector - 6% Group - 94%
SECTOR VS GROUP REVENUE
6%
0
200
400
600
800
1,000
1,200
1,400
0
20
40
60
80
100
120
140
REVENUE AND PROFIT AFTER TAXRs. Mn
07/08 08/09 09/10 10/11 11/12Revenue Profit After Tax
Rs. Mn

20 The Hemas Group. Enriching Lives
Comprising aviation, maritime and logistics, the
transportation sector contributed 18% to our
overall group profitability during the year under
review. Profit after tax grew by 8% over last year
to Rs. 242.2Mn, despite turnover slipping 2 %
to Rs. 721.9Mn, Sri Lanka’s transportation industry grew at a lower
7.2% in 2011, compared to 16.8% recorded a year earlier, according
to the Central Bank of Sri Lanka. The government has continued to
invest millions of rupees to develop seaports, airports, roads and rail
networks, creating multiple opportunities for the industry as a whole.
Sri Lanka’s aviation market continued its double digit growth last
year. The main Bandaranaike International Airport handled 6.1 million
passengers in 2011, which was a 17% growth over 2010, according to
the Central Bank figures.
Hemas’ aviation business benefited from a growth in air traffic. Overall
passenger sales grew in both the GSA (Genaral Sales Agent) and
outbound travel retail businesses. Despite the challenging global
market, our GSAs retained their market share as we maintained
our service quality levels to clients. Emirates Airlines and Malaysian
TRANSPORTATION
Airlines, continued to dominate our GSA business. During the year,
Emirates Airlines opened a deluxe passenger lounge at the airport,
reinforcing the Dubai-based carrier’s commitment to grow their
business in Sri Lanka. Malaysia Airlines has also shown keenness to
develop the business in Colombo.
Hemas Travel continued to expand its business, specialising in
corporate and leisure travel. In partnership with the UK’s Hogg
Robinson Group, the unit handled a large number of groups and a
number of corporate accounts. On the global arena, cargo volumes
were hit in 2011, following the Eurozone debt crisis and slower
economic recovery in the USA. Air cargo market growth slowed down
to a single-digit as exporters were hit by lower volumes and higher
freight rates.
The maritime segment was affected by a sharp decline in freight rates
across the world due to recessionary conditions and excess supply.
Container handling at the Port of Colombo reduced by 3% during the
financial year of 2011, where transhipment volumes also declined by
1%. (Source: SLPA)

Annual Report 2011/12 21
MANAGEMENT REPORTS SUSTAINABILITY GOVERNANCE FINANCIAL REPORTS
Far Shipping Lanka, our feeder vessel agency, saw a fall in
transhipment volumes during the financial year. However, our future
prospects remain strong, as the government remains committed
to expand capacity at the Colombo Port and to develop Galle,
Hambantota and Trincomalee Ports. These plans will position Sri Lanka
as a multi-port regional hub.
In the Logistics segment, our joint venture companies, Hellman
Worldwide Logistics and Skynet expanded their revenue bases and
recorded bottom-line growth in line with our expectations. Hellmann
continues to secure key clientele, while Skynet established itself
amongst the top ten players in the Sri Lankan courier market.
Looking ahead, the sector has established plans to strengthen its
presence in the logistics and maritime sectors in the economy in
keeping with the national policy of creating logistics and maritime
hubs. We are confident that we will be able to cater to future growth
opportunities that will arise both in the country and the region.
“DESPITE THE CHALLENGING GLOBAL MARKET, OUR GSAs
RETAINED THEIR MARKET SHARE AS WE MAINTAINED OUR
SERVICE QUALITY LEVELS TO CLIENTS...”
0
100
200
300
400
500
600
700
800
0
50
100
150
200
250
300
REVENUE AND PROFIT AFTER TAXRs. Mn Rs. Mn
07/08 08/09 09/10 10/11 11/12Revenue Profit After Tax
Sector - 18% Group - 82%
SECTOR VS GROUP PROFIT
18%
Sector - 3% Group -97%
SECTOR VS GROUP REVENUE
3%
22 The Hemas Group. Enriching Lives
POWER
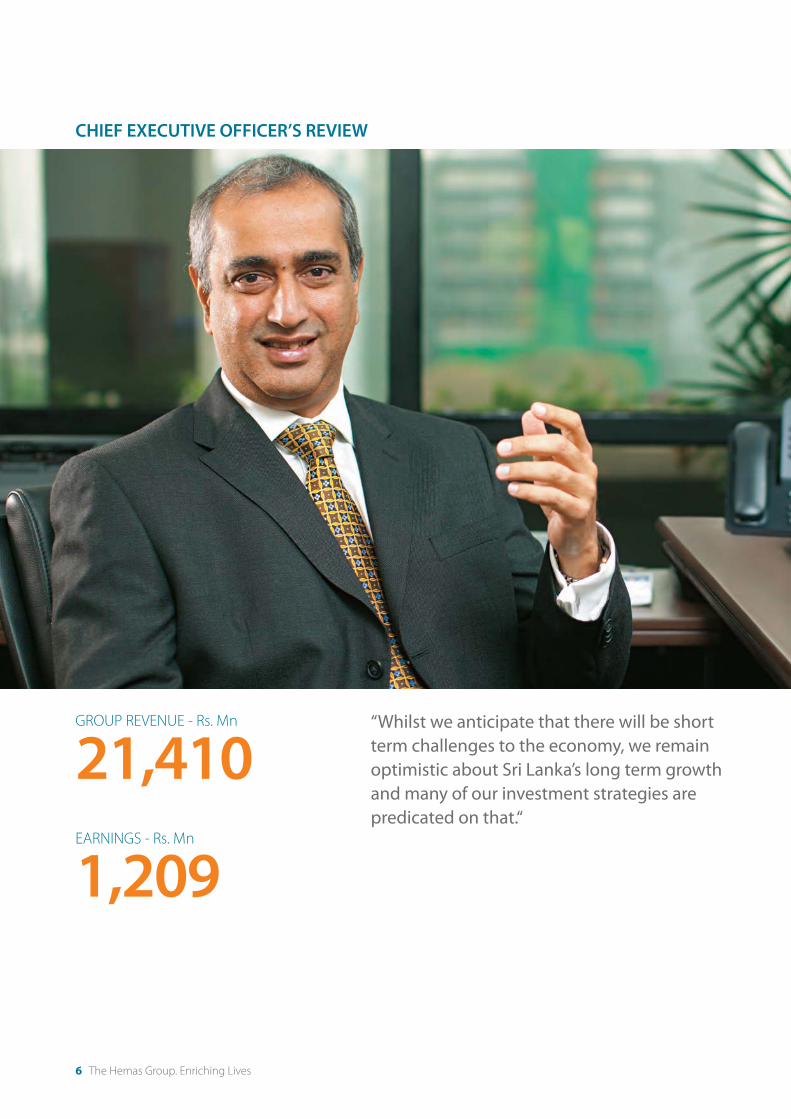
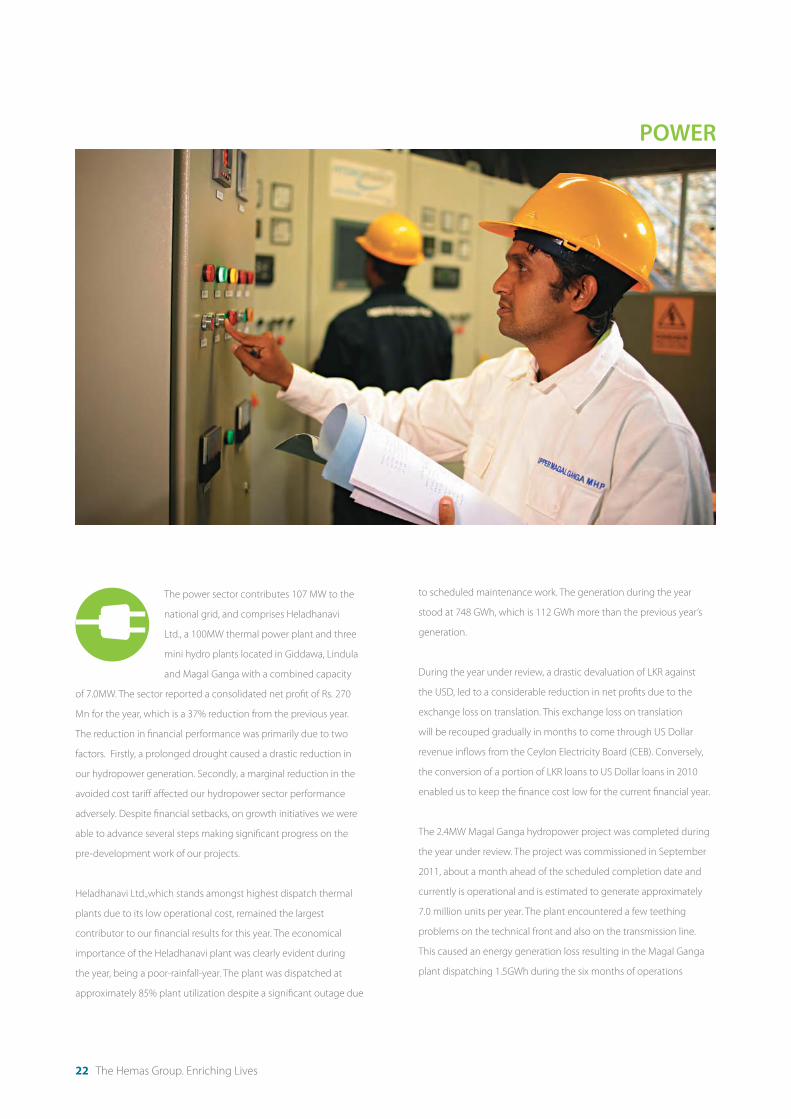
The power sector contributes 107 MW to the
national grid, and comprises Heladhanavi
Ltd., a 100MW thermal power plant and three
mini hydro plants located in Giddawa, Lindula
and Magal Ganga with a combined capacity
of 7.0MW. The sector reported a consolidated net profit of Rs. 270
Mn for the year, which is a 37% reduction from the previous year.
The reduction in financial performance was primarily due to two
factors. Firstly, a prolonged drought caused a drastic reduction in
our hydropower generation. Secondly, a marginal reduction in the
avoided cost tariff affected our hydropower sector performance
adversely. Despite financial setbacks, on growth initiatives we were
able to advance several steps making significant progress on the
pre-development work of our projects.
Heladhanavi Ltd.,which stands amongst highest dispatch thermal
plants due to its low operational cost, remained the largest
contributor to our financial results for this year. The economical
importance of the Heladhanavi plant was clearly evident during
the year, being a poor-rainfall-year. The plant was dispatched at
approximately 85% plant utilization despite a significant outage due
to scheduled maintenance work. The generation during the year
stood at 748 GWh, which is 112 GWh more than the previous year’s
generation.
During the year under review, a drastic devaluation of LKR against
the USD, led to a considerable reduction in net profits due to the
exchange loss on translation. This exchange loss on translation
will be recouped gradually in months to come through US Dollar
revenue inflows from the Ceylon Electricity Board (CEB). Conversely,
the conversion of a portion of LKR loans to US Dollar loans in 2010
enabled us to keep the finance cost low for the current financial year.
The 2.4MW Magal Ganga hydropower project was completed during
the year under review. The project was commissioned in September
2011, about a month ahead of the scheduled completion date and
currently is operational and is estimated to generate approximately
7.0 million units per year. The plant encountered a few teething
problems on the technical front and also on the transmission line.
This caused an energy generation loss resulting in the Magal Ganga
plant dispatching 1.5GWh during the six months of operations

Annual Report 2011/12 23
compared to the expected 3.5GWH. Both the technical and
transmission-line related issues are now largely resolved.
Due to low rainfall, the hydro power segment’s contribution to the
sector’s revenue was lower than expected. The 2.0MW Giddawa Power
Plant operated at 35% plant-utilization-level for the year compared to
the 40% expected level and the AgraOya Power Plant operated at 27%
plant-utilization-level compared to the 33% expected level.
The operational performances of both Giddawa and AgraOya were
further impacted by the 7% decrease in tariff over the last year’s tariff.
The combined effect of low generation and tariff reduction reduced
the net profit of Giddawa by 55% in comparison to its last year’s profit,
whereas AgraOya profits were down 59% over that of the
previous year.
In the coming year, we will commence development of our first
biomass power project with a capacity of 3MWs in the southern part
of the country. All the approvals required for this project, its designs,
technical specifications and the financing arrangements have been
finalized. Taking stock of the country’s available opportunities, we find
it is most opportune to align our growth strategy on the renewable
energy side. We have earmarked several hydropower sites in the
country with development potential. We are currently exploring
opportunities in East Africa for hydropower development in addition
to expanding capacity in Sri Lanka.
Looking ahead, we foresee a surge in demand for power generation
fuelled by greater economic activity. According to the CEB, total
“THE 2.4MW MAGAL GANGA HYDROPOWER PROJECT
WAS COMPLETED DURING THE YEAR UNDER REVIEW.
THE PROJECT WAS COMMISSIONED IN SEPTEMBER
2011, ABOUT A MONTH AHEAD OF THE SCHEDULED
COMPLETION DATE...”
0
1,000
2,000
3,000
4,000
5,000
6,000
0
50
100
150
200
250
300
350
400
450
REVENUE AND PROFIT AFTER TAXRs. Mn Rs. Mn
07/08 08/09 09/10 10/11 11/12Revenue Profit After Tax
Sector - 21% Group - 79%
SECTOR VS GROUP PROFIT
21%
Sector - 21% Group - 79%
SECTOR VS GROUP REVENUE
21%
MANAGEMENT REPORTS SUSTAINABILITY GOVERNANCE FINANCIAL REPORTS
primary energy demand is expected to increase to about15,000 kTOE
by the year 2020 at an average annual growth rate of about 3%. It is
crucial to generate power through renewable sources to meet this
surge in demand as renewable energy is clearly the sustainable long
term path for the sector. Conventional energy sources such as coal
reserves and fossil fuels continue to dwindle at a rapid pace leading
to higher costs for the use of these resources for power generation.
Additionally, the use of these resources contributes to pollution and
global warming. The Government has reinforced its commitment
to sustainable energy by continuing to support renewable power
projects. The previous National Energy Policy target to reach 10% of
the country’s energy generation through renewable energy sources
by 2015 has now been revised to achieve a target of 20% by 2020.
We are well placed to focus our efforts to be in line with the national
policy of developing the renewable energy industry of Sri Lanka.
We remain strongly committed to pursue opportunities to acquire or
develop viable hydropower projects while keeping a vigilant eye on
emerging opportunities in other renewable energy segments.

24 The Hemas Group. Enriching Lives
SUSTAINABILITY REPORT
“The Hemas Group has a well entrenched Sustainability Policy
based on the overall impact of the Organization’s operations
on the components of Sustainability: Environmental, Social
and Economic. We believe this approach creates long-term
shareholder value by embracing opportunities and managing
risks deriving from Economic, Environmental and Social
Developments...”

Annual Report 2011/12 25
Our dedication to all stakeholders of the community grows stronger
with every passing year. As a company that has woven ethical
operations and social responsibility into our DNA, we are totally
committed to serving our stakeholders by leveraging on innovative
sustainable strategies and delivering multiple benefits to the
community in a mutually fulfilling manner.
Apart from our initiatives to cascade profitability down into the
community in which we operate, we are also committed to our
people, who are the driving force behind the company. Our resources
reflect some of the most promising talent in the country and as a
group we go to great lengths to nourish, nurture and groom these
resources to become vital contributors to the progress of the country.
As inheritors of the planet and its natural resources each of us has
a responsibility to the environment and at Hemas Holdings we
have translated this collective responsibility to crystallize into some
dynamic initiatives that have a favourable impact on the environment,
thereby conserving our rich bio diversity and preserving the country’s
natural resources as healthy and vibrant for future generations.
Whilst structuring our sustainability commitment, Hemas Holdings
made a conscious decision that any social responsibility we embarked
on, would necessitate complete cooperation and involvement from
our staff rather than mere involvement as a donor. We are proud to
say that we have stayed true to this vow and, today, the company is
spearheading all its sustainable initiatives in active participation with
sustainable partners, such as the Government of Sri Lanka.
Our staff is entrenched in this social engagement philosophy and
proactively tracks avenues for further enrichment of sustainable
initiatives, becoming active participants in all our projects.
The Hemas Group has a well entrenched sustainability policy
based on the overall impact of the organization’s operations on the
components of sustainability: environmental, social and economic.
We believe this approach creates long-term shareholder value by
embracing opportunities and managing risks deriving from economic,
environmental and social developments, thereby ensuring long term
viability, profitability and integrity of the group. The defining elements
of our sustainability ensure commitment and accountability by
all staff.
“WE ARE PROUD OF THE FACT THAT HEMAS
PHARMACEUTICALS HAS RELEASED ITS FIRST
SUSTAINABILITY REPORT DEVELOPED AND BASED ON
THE GLOBAL REPORTING INITIATIVE (GRI) GUIDELINES FOR
SUSTAINABILITY REPORTING IN 2011. THE COMPANY HAS
ESTABLISHED A CONTINUOUS IMPROVEMENT PROCESS
IN ADOPTING THE GRI GUIDELINES AND INTENDS TO BE
IN FULL COMPLIANCE WITH THESE GUIDELINES IN THE
COMING YEARS...”
MANAGEMENT REPORTS SUSTAINABILITY GOVERNANCE FINANCIAL REPORTS

26 The Hemas Group. Enriching Lives
Guiding principles of the Hemas Group’s sustainability policy:
To comply with all applicable legislations, regulations and code of best practice.
To adhere to best corporate governance practices whilst being accountable and transparent to its stakeholders.
To identify the risks and opportunities faced by the group and provide mitigation where applicable.
To adhere to the core values of the group and conduct business in an ethical manner.
To integrate sustainability considerations in our daily business decisions.
To make clients and suppliers aware of the Group’s sustainable management practices.
To minimize the impact on sustainability by adhering to the individual guidelines introduced by the group sustainability
committee (environment, economic, human rights, work place and social).
To engage with stakeholders in an appropriate manner, in order to consider their opinion and suggestions for the benefit
of business operations and sustainability.
To continuously enhance quality of products, services and value to customers whilst ensuring profitability.
To provide employees a safe and healthy working environment.
To support and promote the protection of internationally proclaimed human rights.
To respect diversity within our employees (caste, creed, religion, disability, gender, age etc)
To be sensitive to the local communities within our business localities and whenever possible support local suppliers,
participate in community activities and provide employment.
To support the Group’s philanthropic arm ‘Hemas Outreach Foundation’ and be involved in projects and ensure employee
participation.
To respect and recognize the diverse cultural elements of a community. Incorporate and integrate them to the business
plan and strategy in order to ensure community’s sustainability.
To adhere to best environmental practices and incorporate them in business decisions, whilst committing ourselves to the
three R’s within the group (Reduce,Reuse,Recyle).
SUSTAINABILITY REPORT
We have taken a pledge to aspire to the highest standards of
corporate citizenship and our programmes through the period under
review, achieved significantly moving ahead in making a positive
impact on our sustainability pillars - Community, Human Resources
and Environment, which are inter-linked to ensure long term
viability for the enterprise and sustainability for the society and the
environment within which we operate.

Annual Report 2011/12 27
COMMUNITY
Our decade-long focus of Early Childhood Care and Development
(ECCD) is progressing rapidly, providing a sound foundation for
lifelong learning for future young generations. Hemas Holdings’
flagship Corporate Social Responsibility project in partnership with
the Children’s Secretariat of Ministry of Child Development & Women’s
Affairs - the ‘Piyawara’ programme - has gained further momentum
over this financial year. Launched in 2002, the group celebrates 10
years of partnership with the government on this initiative in the
year 2012.
The project essentially focuses on promoting Early Childhood Care
& Development (ECCD) through the establishment of child friendly
pre-schools across Sri Lanka. The Group’s CSR activities are carried out
by the Hemas Outreach Foundation which is managed by a board
of trustees. This is an approved charity by the Sri Lanka Government,
audited by Ernst and Young.
‘Piyawara’ Adds Further Value to Communities
Piyawara’ is an integrated educational programme making a valuable
contribution to the development of the state education system
through various strategies to benefit early childhood education in
the country. The programme goes beyond building bricks and mortar
to developing a holistic approach to pre-school education in Sri
Lanka. The key objective of Piyawara is to enhance and improve the
psychosocial and cognitive development of young children through
the addition of new pre-schools to the existing national network and
upgrading established pre-schools to reach minimum standards.
At present, we foster 34 pre-schools island-wide under the banner
‘Piyawara’, and approx 3,000 children are receiving their early learning
at these centres. These schools are located in diverse locations from
Jaffna to Hambantota.
Developed In partnership with the Ministry of Child Development and
Women’s Affairs, a host of activities are carried out in these schools
yearly - from teacher training to parental awareness programmes.
Apart from the activities in these preschools, further programmes are
delivered also at a national level through TV, Radio and district level
activities. Hemas has also partnered with Sri Lanka Police, to support
the national campaign against child abuse. Many programmes and
projects have been initiated to raise awareness on the issue. Piyawara
also aims to improve child protection legislations and provide
publicity for children’s issues.
In recognition of our contribution, the Ministry of Child Development
& Women’s Affairs appointed Hemas to the National Coordination
Committee on ECCD, the oversight body for the development and
implementation of the national policy on ECCD. In addition, the
ministry has also appointed Hemas to the provincial level committees
in the country, which reflects the deep commitment on our part,
which has been duly acknowledged by the state.
Exciting Developments in 2011/12
In the year 2011/12 the focus was on resettled areas of the northern
region of Sri Lanka. We commenced the year with the handing over of
the model pre-school in Jaffna, construction of which was undertaken
along with UNOPS at a total cost of Rs. 7,202,438/-. This project marks
the beginning of Piyawara’s entry into the hitherto inaccessible areas
of the north. We will be setting up many more such pre-schools in the
hitherto conflict effected districts as this project has brought hope to
the communities in the area.
During the period under review, we re-evaluated the needs of the
communities within which these pre-schools will be established.
There were some key factors that emerged. Firstly, it is very apparent
MANAGEMENT REPORTS SUSTAINABILITY GOVERNANCE FINANCIAL REPORTS

28 The Hemas Group. Enriching Lives
that years of backward social ideologies and prejudice have relegated
these communities to the brink of poverty, thereby having basic
sanitation, healthcare and educational facilities denied to the children.
The abject lack of basic services and infrastructure motivated us to
add value to the existing model pre-school through a new concept of
‘Piyawara Community Pre-schools’.
The Ambalnagar village was selected for this pilot project. Located
about 10 kms from Kilinochchi, Ambalnagar consists largely of
marginalized communities struggling to eke out their living in the
most rudimentary conditions, with a severe lack of basic necessities
such as sanitation and medical care and schooling. The community
residing here counts 300 children between the ages of 1- 4 and 186
above 4 years, all with little or no access to pre-school education
in their immediate vicinity. The community pre-schools will also be
used for multi purpose functions such as conducting maternal and
child clinics, whilst imparting vital early education to the children.
A prototype model with two class rooms have been designed for
community preschools by UNOPS.
In addition to the projects in the northern region the main focus
in 2011/12 was to conduct parental awareness programs in other
Piyawara schools on a large scale, covering all preschools in the
selected locations. However, the foundation had to cancel the annual
teacher training program scheduled for August 2011 in Jaffna due to
unavoidable circumstances.
We are proud to be sustaining these government partnerships
for a decade now and the Piyawara project has become a model
sustainability early education project in strengthening the gaps in
the government system and reducing the financial burden on the
state, whilst benefitting hundreds of children by giving them a sound
educational and emotional foundation for their future. Piyawara
also continued its teacher training programmes through 2011/12,
refreshing and upgrading skills of teachers to bring out the best in the
pre-schoolers. One of the goals of Piyawara is to empower community
led social development through island wide parental awareness
programmes.
Plans are ongoing to replicate the community pre school model in
Mullaitivu in the 2012/13 financial year. Our partnership with the
government has enabled us to leverage on the state network and
resources to achieve much wider coverage than we would have
on our own strength. The success of our flagship sustainability
programme can be directly attributed to the unstinted support of the
Chairman and Board of Directors down to the junior-most employee,
all of whom champion this project whole-heatedly. Our partners in
this project also need mention, namely, Rewe Touristik, a key business
partner of the Hemas Leisure Sector and Eli Lilly and Company a
partner of Hemas Healthcare sector.
We see exciting opportunities ahead for Piyawara in the upcoming
year and we will continue to explore beneficial linkages with the state
to analyze how we can add value to the lives of the communities we
touch with our project.
Related Piyawara Projects
Our focus on the Hambantota Special School which is managed by
the Southern Youth Development Foundation in partnership with
the Hambantota Municipal Council and Hemas Outreach Foundation
continues through the period under review. In 2011, Hemas provided
students of the school with essential nutrition in the form of free milk
SUSTAINABILITY REPORT
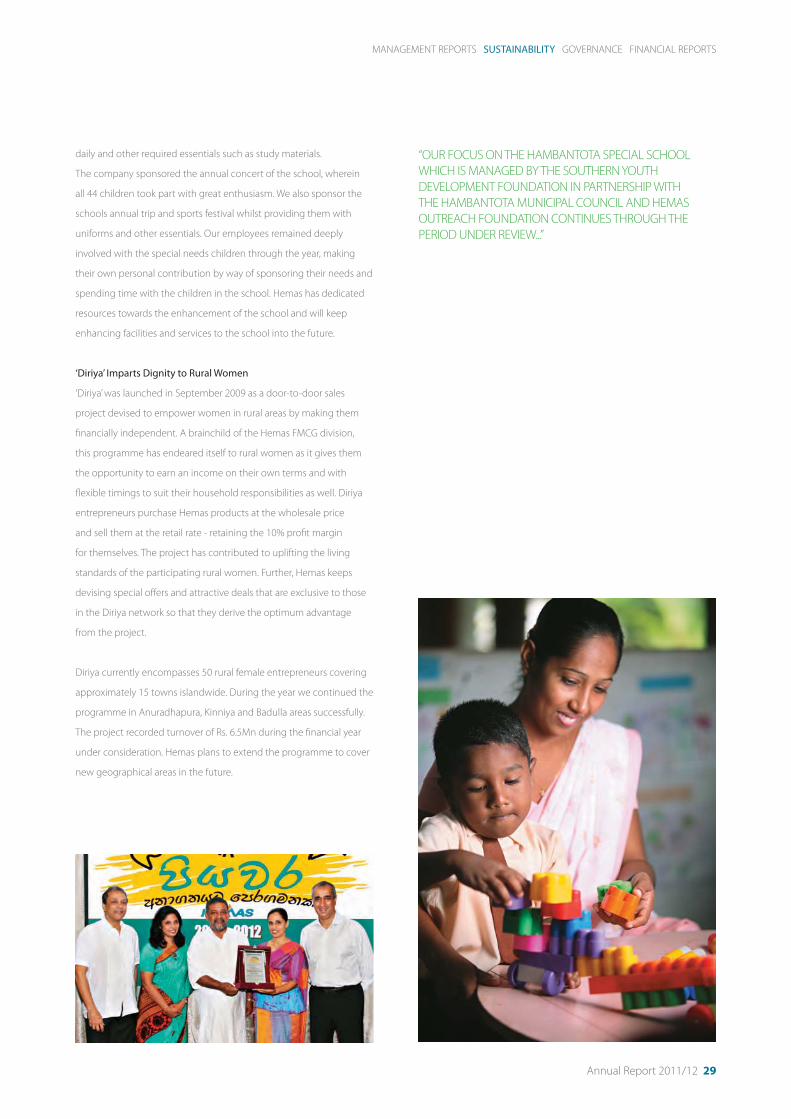
Annual Report 2011/12 29
daily and other required essentials such as study materials.
The company sponsored the annual concert of the school, wherein
all 44 children took part with great enthusiasm. We also sponsor the
schools annual trip and sports festival whilst providing them with
uniforms and other essentials. Our employees remained deeply
involved with the special needs children through the year, making
their own personal contribution by way of sponsoring their needs and
spending time with the children in the school. Hemas has dedicated
resources towards the enhancement of the school and will keep
enhancing facilities and services to the school into the future.
‘Diriya’ Imparts Dignity to Rural Women
‘Diriya’ was launched in September 2009 as a door-to-door sales
project devised to empower women in rural areas by making them
financially independent. A brainchild of the Hemas FMCG division,
this programme has endeared itself to rural women as it gives them
the opportunity to earn an income on their own terms and with
flexible timings to suit their household responsibilities as well. Diriya
entrepreneurs purchase Hemas products at the wholesale price
and sell them at the retail rate - retaining the 10% profit margin
for themselves. The project has contributed to uplifting the living
standards of the participating rural women. Further, Hemas keeps
devising special offers and attractive deals that are exclusive to those
in the Diriya network so that they derive the optimum advantage
from the project.
Diriya currently encompasses 50 rural female entrepreneurs covering
approximately 15 towns islandwide. During the year we continued the
programme in Anuradhapura, Kinniya and Badulla areas successfully.
The project recorded turnover of Rs. 6.5Mn during the financial year
under consideration. Hemas plans to extend the programme to cover
new geographical areas in the future.
“OUR FOCUS ON THE HAMBANTOTA SPECIAL SCHOOL
WHICH IS MANAGED BY THE SOUTHERN YOUTH
DEVELOPMENT FOUNDATION IN PARTNERSHIP WITH
THE HAMBANTOTA MUNICIPAL COUNCIL AND HEMAS
OUTREACH FOUNDATION CONTINUES THROUGH THE
PERIOD UNDER REVIEW...”
MANAGEMENT REPORTS SUSTAINABILITY GOVERNANCE FINANCIAL REPORTS

30 The Hemas Group. Enriching Lives
OUR PEOPLE
At Hemas, we invest in our employees to help them succeed and
develop the skills they need to perform to their highest potential. We
leverage best practices across the sectors enabling our employees
to develop their skills, explore new opportunities and empowering
them to be innovative. We have implemented frameworks to
effectively build leadership, track performance and cultivate growth.
We believe that the success of Hemas depends on the diverse
strengths and talents of our employees and we take care to foster a
culture of continual development with an unwavering commitment
to the engagement and fulfillment of our employees. Helping our
employees succeed and acquire the skills that enable growth in turn
will help sustain Hemas’ long-term growth.
Hemas Group
Our core belief is that talent and leadership development is a growth
driver. The Group is dedicated to identifying and developing its
leaders at each level. At the director level, we have implemented a
forum to discuss and review each director and map out their career
movements in the same business or in another business. A definitive
policy was developed and approved in order to lend legitimacy and
adherence to the process.
Over the past 1 ½ years the group’s senior management has been
undergoing executive coaching sessions to sharpen competencies
and make them better leaders. Our executive coaching partner is the
Global Consulting firm, Heidrick and Struggles. Hemas has invested
time and financial resources in this important development process as
we believe that coaching and mentoring plays a vital role in making
leaders more effective. Thus far, two batches have gone through
sessions and the third batch completes the sessions in May 2012.
We are committed to a robust and systematic approach to managerial
and executive development and succession planning. During the
year under review, 12 management trainees were recruited for
FMCG, Healthcare and Hospitals sectors. Hemas has established its
credentials as one of the most preferred employers in the country and
this was evident in the 2,000 applications we received on announcing
the vacancies. Our screening process was able to handpick the best
talent from among the applicants. One of the screening tools used
were assessment centers run by SHL certified assessors.
A diploma level course was conducted during the course of the year
for middle and junior level mangers to develop their managerial and
leadership skills. This year’s course had 12 participants and they will
follow the course for duration of 8 months.
Training is an integral component of our talent and performance
agendas and outbound training is one of the many diverse training
forums we utilize. The Directors Adventure 2011 was one such
training program which witnessed the coming together of the senior
management outside of the board room to great success.
The purpose of the adventure session was to develop bonding
through adventure learning at the Thulhiriya Training Center. An
SUSTAINABILITY REPORT
“OUR CORE BELIEF IS THAT TALENT AND LEADERSHIP
DEVELOPMENT IS A GROWTH DRIVER. THE GROUP IS
DEDICATED TO IDENTIFYING AND DEVELOPING ITS
LEADERS AT EACH LEVEL. AT THE DIRECTOR LEVEL, WE HAVE
IMPLEMENTED A FORUM TO DISCUSS AND REVIEW EACH
DIRECTOR AND MAP OUT THEIR CAREER MOVEMENTS IN
THE SAME BUSINESS OR IN ANOTHER BUSINESS...”
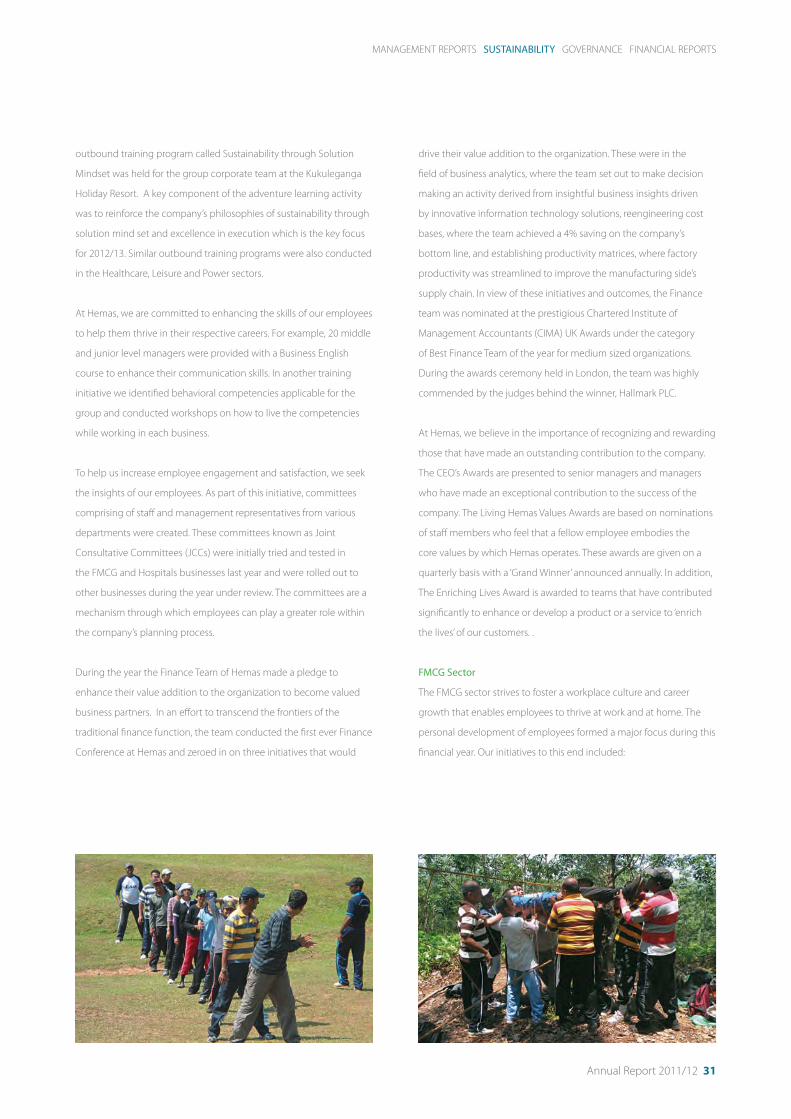
Annual Report 2011/12 31
outbound training program called Sustainability through Solution
Mindset was held for the group corporate team at the Kukuleganga
Holiday Resort. A key component of the adventure learning activity
was to reinforce the company’s philosophies of sustainability through
solution mind set and excellence in execution which is the key focus
for 2012/13. Similar outbound training programs were also conducted
in the Healthcare, Leisure and Power sectors.
At Hemas, we are committed to enhancing the skills of our employees
to help them thrive in their respective careers. For example, 20 middle
and junior level managers were provided with a Business English
course to enhance their communication skills. In another training
initiative we identified behavioral competencies applicable for the
group and conducted workshops on how to live the competencies
while working in each business.
To help us increase employee engagement and satisfaction, we seek
the insights of our employees. As part of this initiative, committees
comprising of staff and management representatives from various
departments were created. These committees known as Joint
Consultative Committees (JCCs) were initially tried and tested in
the FMCG and Hospitals businesses last year and were rolled out to
other businesses during the year under review. The committees are a
mechanism through which employees can play a greater role within
the company’s planning process.
During the year the Finance Team of Hemas made a pledge to
enhance their value addition to the organization to become valued
business partners. In an effort to transcend the frontiers of the
traditional finance function, the team conducted the first ever Finance
Conference at Hemas and zeroed in on three initiatives that would
drive their value addition to the organization. These were in the
field of business analytics, where the team set out to make decision
making an activity derived from insightful business insights driven
by innovative information technology solutions, reengineering cost
bases, where the team achieved a 4% saving on the company’s
bottom line, and establishing productivity matrices, where factory
productivity was streamlined to improve the manufacturing side’s
supply chain. In view of these initiatives and outcomes, the Finance
team was nominated at the prestigious Chartered Institute of
Management Accountants (CIMA) UK Awards under the category
of Best Finance Team of the year for medium sized organizations.
During the awards ceremony held in London, the team was highly
commended by the judges behind the winner, Hallmark PLC.
At Hemas, we believe in the importance of recognizing and rewarding
those that have made an outstanding contribution to the company.
The CEO’s Awards are presented to senior managers and managers
who have made an exceptional contribution to the success of the
company. The Living Hemas Values Awards are based on nominations
of staff members who feel that a fellow employee embodies the
core values by which Hemas operates. These awards are given on a
quarterly basis with a ‘Grand Winner’ announced annually. In addition,
The Enriching Lives Award is awarded to teams that have contributed
significantly to enhance or develop a product or a service to ‘enrich
the lives’ of our customers. .
FMCG Sector
The FMCG sector strives to foster a workplace culture and career
growth that enables employees to thrive at work and at home. The
personal development of employees formed a major focus during this
financial year. Our initiatives to this end included:
MANAGEMENT REPORTS SUSTAINABILITY GOVERNANCE FINANCIAL REPORTS

32 The Hemas Group. Enriching Lives
An awareness program on best health practices for our
Dankotuwa factory employees by personnel from Hemas
Hospital
A session on work-life balance conducted by trainer Prasanna
Jayathilake
A session on Employee Motivation & Changing Attitudes
conducted by Chandana Gunawardena
An awareness program on Violence Against Women& Child
Abuse
A comprehensive technical training for machine operators
conducted by Ceylon German Technical Institute.
To effectively prepare our managers and executives to lead in a
challenging macroeconomic environment and to develop employees
of all levels, the FMCG sector launched a series of training initiatives.
Hemas sponsored one of its senior leaders for an executive MBA
by the Indian School of Business. The program is targeted at busy
executives who normally cannot devote time for classroom training
of a lengthy duration. A brands competency development workshop
was carried by Kanter Retail, India, to develop brand mangers’
technical competencies on Customer Focused Marketing Strategies
and Integrated Marketing & Communications. Foreign training was
provided for the sales team on Strategic Procurement and Sourcing,
World Class Warehouse Operations and Planning, Manufacturing
Process Optimization and accounting & Finance for Non-Financial
Managers.
Healthcare Sector
At the heart of the Healthcare Sector are our people, who continue
to transform the sector through growth and innovation. The sector
continues to create a work environment in which employees know
that their skills, talents and interests can be developed to its full
potential.
Pharmaceuticals
The fifth batch of the Medical Delegates Professional Development
course concluded on March 2012. Since its inception, over 100
medical delegates have successfully completed this five month
course which covers Anatomy, Physiology, Pharmacology, Marketing
and Management. The course has received positive feedback from
principals and local agencies.
The division initiated two familiarization and educational tours for the
sales and operations employees. This opportunity helped them to
enhance their product knowledge thus increasing their performance
and productivity. In order to strengthen the team spirit and create a
motivational environment, the division participated in an outbound
training for management and sales staff. The annual Pharma Awards
event was held in July’11 to recognize staff who contributed to the
success of the company while exceeding the set targets.
Hospitals
At Hemas Hospitals we aim to design initiatives that enable our
employees to develop and sustain healthy behaviors to improve
their overall quality of life. In February 2012, counseling facilitates
were introduced for our hospital employees to assist employees with
challenges related to work and personal life. Hospital employees are
now able to consult Senior Medical Officer at the Suwatha Piyasa
Medical Services Unit. Medical treatments will be provided free of
charge if deemed necessary.
Hemas Hospitals partners with the Open University of Sri Lanka
and Aquinas University College to conduct the Student Nurse
Development Programme. The first batch of students has successfully
completed their academic and practical training. Due to the
SUSTAINABILITY REPORT

Annual Report 2011/12 33
expansion of Hemas Hospitals, a surge in the demand for quality
nursing staff is expected in the near future. In light of this, the Student
Nurse Development Program enrolled a new batch in March 2011.
A New Nursing Grading System designed by the Hospital Team
was approved by the Hospital Board for implementation effective
01st September 2011. This newly adopted grading system for
Nursing Professionals provides comprehensive guidelines for future
recruitment of nursing professionals into the Hemas Hospitals Chain.
It also creates a continuous competency based nursing education
platform, career progression pathways and rewarding nursing
professionals on merit.
The Director Medical Services, Hemas Hospitals, participated in the
ISQua 2011 Medical Conference in Hong Kong, China. Dr. Samanthi
De Silva, Head of Medical Services and Acting General Manager,
Hemas Hospital, Wattala, was honored as a speaker at the Hospital
Management Asia Conference-2010 held in Singapore. She is the
first Sri Lankan Medical Professional to be afforded an opportunity to
address this prestigious conference. Mr. Murtaza Esufally, Chairman,
Hemas Hospitals Chain, was honored as a guest speaker at the Private
Healthcare Investment World Asia Conference-2011 held in Singapore.
Leisure Sector
Going forward, our hotels sector expects to enter a new era in the
tourism industry with unbeaten service. Thus, it is of paramount
importance to develop the competencies of all employees in the
Leisure sector. We continue to invest in our associates to help them
develop their skills and to sustain Hemas’ superior service.
Serendib Group
We have partnered with Minor International in Thailand which is one
of the largest hospitality and leisure companies in the Asia Pacific
Region, to launch Avani, a new hotel brand. The induction process for
the Avani brand was carried out for all Avani Brand Hotels employees
and for a cross section of head office employees by our partner,
Minor Hotel Group. Service Excellence Training was conducted for
all employees of Avani Bentota by Mr. Dammika Kalapuge. Industry
specific and compulsory Health & Safety initiatives such as HACCP
& ISO 22000 Awareness Programmes, First Aid Skill Certifications
and Food Handler Medical Certification Initiatives were fulfilled at all
hotels.
Avani Bentota and Avani Kalutara conducted English & German
Language Training while Club Hotel Dolphin sought to upgrade the
language skills of employees. Moreover, an employee satisfaction
survey was carried out for Club Hotel Dolphin and the Head Office.
“HEMAS HOSPITALS PARTNERS WITH THE OPEN UNIVERSITY
OF SRI LANKA AND AQUINAS UNIVERSITY COLLEGE
TO CONDUCT THE STUDENT NURSE DEVELOPMENT
PROGRAMME. THE FIRST BATCH OF STUDENTS HAS
SUCCESSFULLY COMPLETED THEIR ACADEMIC AND
PRACTICAL TRAINING. DUE TO THE EXPANSION OF HEMAS
HOSPITALS, A SURGE IN THE DEMAND FOR QUALITY
NURSING STAFF IS EXPECTED...”
MANAGEMENT REPORTS SUSTAINABILITY GOVERNANCE FINANCIAL REPORTS

34 The Hemas Group. Enriching Lives
Diethelm Travels
As Sri Lanka tourism undergoes a revival, there is a greater need for
specialized skills in order for the group’s leisure business to position
itself on par with other regional destinations. Keeping this in mind, the
company sent key personnel for the MICE Professional Development
training programme organized by the Sri Lanka Convention Bureau,
together with the International Congress and Convention Association
(ICCA). At this programme, Hemas Leisure executives were exposed to
skills sets such as bidding for conferences, dealing with associations
and setting up green conferences.
Transportation Sector
The Transportation sector anticipates business growth as a result of
new opportunities due to increased global trade. Ensuring the success
of the sector depends on attracting and developing the best people
and empowering them to be innovative. The sector conducted a
trainee executive program during the year under review which saw
an unprecedented 2,000 applicants. The applicants were assessed
by written tests and interviews to identify the best candidates for
the program. Five applicants were selected for the intensive training
program. Once the training is completed, the five trainees will be
assigned to different companies in the sector ranging from airlines
representation, travel agency and shipping.
Foreign training programmes were conducted based on training
needs such as Strategic Procurement and Sourcing; World Class
Warehouse Operations and Planning; Manufacturing Process
Optimization and Accounting & Finance for Non-Financial Managers.
The result of these efforts is more engaged and productive employees
who can seize opportunities to grow the company.
The Director/GM of Hemas Air Services and Director/GM of Hemas
Travels attended a training programme on Leadership Skills for Top
Management at the Indian School of Business in Hyderabad, India.
This institute is one of the leading business schools in the region and
boasts an eminent faculty. The GM - Cargo for Hemas Air Services and
Senior Manager – Cargo Sales also attended a training programme,
Stepping into Leadership at the same institute in 2011.
Power Sector
Looking ahead at the industry prospects, we expect a renewed
demand for power and energy in the industrial and household
segments. In a growing industry, our goal is to conduct training for
employees from the front line to senior management, to ensure that
our employees have the knowledge and skills required to achieve
performance goals. During 2011/12, the sector organized outbound
training focused on team building, leadership, communication and
decision making. In addition, training was provided on adaptability
and quick reaction skills for employees in the power plants as this is an
integral skill for their job performance.
At Hemas, engaging employees and developing clear communication
lines between employees and management is of paramount
importance. Our resolve to continually seek the insights of our
employees led to the establishment of a Joint Consultative
Committee (JCC) within the sector to allow employees to express their
concerns and give them an opportunity to be part of the solution. The
committees also provide a forum for employees to express their ideas
and point out functions that can be further developed. The frequent
meetings between employees and management have resulted in
improved communication and increased productivity.
SUSTAINABILITY REPORT
“FOREIGN TRAINING PROGRAMMES WERE CONDUCTED
BASED ON TRAINING NEEDS SUCH AS STRATEGIC
PROCUREMENT AND SOURCING; WORLD CLASS
WAREHOUSE OPERATIONS AND PLANNING;
MANUFACTURING PROCESS OPTIMIZATION AND
ACCOUNTING & FINANCE FOR NON-FINANCIAL MANAGERS.
THE RESULT OF THESE EFFORTS IS MORE ENGAGED AND
PRODUCTIVE EMPLOYEES...”

Annual Report 2011/12 35
ENVIRONMENT
Hemas Holdings’ sustainability commitment encompasses our
responsibility to make environmentally friendly and ecologically
responsible decisions in our pursuit of creating shareholder wealth.
Our passion for preserving the environment is led by the Hemas
Green Pledge - ‘We take responsibility as individuals and collectively as
part of the Hemas Group to minimize harmful practices and embrace
emerging trends, that will help us leave a more gentle environmental
footprint.’
Our sustainability goals drive green practices within the company
- and the year under review was no exception towards achieving
those objectives. We were able to add further depth and breadth to
our conservation efforts and achieved significant gains in distilling
the pledge amongst employees, who are the key drivers of the green
philosophy.
We believe that appropriate environmentally friendly practices
can unleash strategic advantages to our businesses, helping us
remain competitive and relevant in a world battling with a host of
environmental hazards. During the year 2011/12, we continued with
some ongoing projects and embarked on some new initiatives. All our
activities are linked in some manner to our business, which imparts
an element of continuity and relevance for us as an organization
and for the sustainability of the initiatives. We constantly evaluate
our environmentally sustainable initiatives and the difference we are
making to the lives we touch.
Leisure Sector
Towards a Green Footprint
Hotel Sigiriya
Over the past few years, each of our hotels has embarked on initiatives
to help, conserve and enrich the environment. Hotel Sigiriya leads
the way in our group’s green initiatives due to its location in an area
that is rich in bio diversity. It was one of the first hotels in the country
to adopt a greening policy. Our legendary commitment to green
concepts has enabled us to strategically plan out, implement, collate
and document all the activities of our hotels in consultation with an
environmental expert. The company now has in place an overarching
set of conservation-based programmes, supported by regular audits
and backed by ongoing training programmes for the staff. In this
manner, we have ensured that a conservation and environmental
management culture has been integrated into our daily management.
The plethora of green initiatives undertaken by the hotel has received
global recognition at local and international forums. The hotel was
awarded the Green Apple Award for energy generation from organic
waste. We are committed to conserving energy and conserving
water; minimizing solid waste; managing greenhouse gas emissions,
air pollution and other chemical pollution; maximizing practices of
reducing, recycling and reusing; using environment-friendly materials,
planting indigenous flora in landscaping; and conserving biodiversity.
Moreover, the hotel remains proactive in maintaining the pristine
environment around the sacred Sigiriya Rock.
MANAGEMENT REPORTS SUSTAINABILITY GOVERNANCE FINANCIAL REPORTS

36 The Hemas Group. Enriching Lives
Club Hotel Dolphin
At Club Hotel Dolphin we are deeply involved with the local
community, working in partnership with the residents in the area to
deliver some essential services to improve their well-being. During
the last financial year, we undertook the task of renovating a local
community centre to benefit the children and youth of the area and
we sustained this involvement in the centre over 2011/12 as well.
Apart from the many activities which are being carried out at the
community centre, we have added on the facility of teaching
computer science to the children and youth of the area and engaged
a professional to coach the students. The hotel is also in the process
of donating land to the Pradeshiya Sabha to be used for the welfare of
the villagers. Club Hotel Dolphin frequently responds to requests for
donations to the village school and the district hospital.
Avani Bentota Resort & Spa and Avani Kalutara Resort
Sri Lanka is known to be a country with a rich spiritual legacy.
The Avani Bentota Resort & Spa and Avani Kalutara Resort have
been instrumental in maintaining places of worship in the vicinity
of their respective properties and in supporting the villagers to
pass on the legacy of their cultural and religious activities to the
next generation. The hotel staff participates in donations and
‘shramadana’ programmes together with the villagers and the entire
community comes together as one in this effort. Regular beach clean
up programmes remain an ongoing endeavour at the beachside
properties.
Avani Bentota Resort & Spa is also responsible for maintaining the
Bentota railway station for a period of three years commencing
August 2010. The station, which was in disrepair, was refurbished at a
cost of Rs.850,000/- in addition to continued monthly maintenance
charges of over Rs.10,000/-. The hotel also undertakes the annual
cleaning, painting and arranging of all wards in the Bentota
government hospital.
FMCG Sector
Harnessing Natural Resources
At the Dankotuwa Plant, our main manufacturing facility, we are
proactively focusing on ensuring that the environment in and around
the immediate surroundings is protected and retains its natural
beauty. Our investment of Rs.8 million to enhance the capacity of our
waste water treatment plants, allocated for production effluent and
human waste water, reflects our commitment to reusing resources
and eliminating wastage. This focused effort has enabled us to recycle
almost 100% of our waste water, an achievement far above stipulated
norms.
Once the waste water has been recycled, it is used for utilitarian
purposes, such as gardening. Furthermore, we recycle 80% of our
solid waste including polythene, paper, glass, plastics, oil and metal.
Our agreement with Geo Cycle (a subsidiary of Holcim Sri Lanka)
is indicative of our commitment to disposing of all solid waste in a
completely eco friendly manner. Our FMCG operation possesses its
own environmental management system and environmental policy
and functions in accordance. The company won the bronze award
for 2011 at the Geocycle awards ceremony. The award recognises the
facility’s long term commitment to the protection of the environment,
and the positive example it sets to those within the industry in which
it operates.
SUSTAINABILITY REPORT

Annual Report 2011/12 37
Power Sector
Protecting the Environment
The key environmental focus areas at the Heladhanavi power plant
are water conservation and the management of noise pollution. Rain
water harvesting pools have been set up across the premises and
these pools aid our water conservation effort. Water that contains
heavy oil components is treated prior to being released into the
environment, thus ensuring that the delicate eco system of the area is
completely unaffected.
The creation of the green belt in the 58 acre property helps to keep
noise levels to the permitted levels. The North-Western Province
Environmental Authority conducts a rigorous annual assessment of
noise pollution and we have been successful in obtaining the required
licensing in 2011/12 with ease for yet another year in succession.
As part of our commitment to sustainable development, we
have hired a dedicated environmental officer for the Sector. The
environmental officer acts as an independent party who ensures the
protection of the environment. The environmental officer has the
authority to even stop construction when deemed necessary
“The group is committed to developing renewable sources
of energy and its hydropower plants operate on the
philosophy of minimum impact to the environment and
are fully compliant with environmental regulations....“
MANAGEMENT REPORTS SUSTAINABILITY GOVERNANCE FINANCIAL REPORTS
The group is committed to developing renewable sources of
energy and its hydropower plants operate on the philosophy of
minimum impact to the environment and are fully compliant with
environmental regulations and standards stipulated by the Central
Environmental Authority. Apart from generating environmentally
friendly and renewable energy, the hydro power plants serve to
nurture and maintain the green environment within the plant
premises, thereby, contributing towards clean energy generation.
As one of the leading players in the private sector power industry,
we have vowed to deepen our commitment to augmenting and
expanding our best practices in the operation, making sure we lead
by example in terms of eco sensitive practices and outcomes. Our
endeavour in all our operations is to achieve a minimal environmental
footprint.

38 The Hemas Group. Enriching Lives
CORPORATE GOVERNANCEIn this report, we discuss, the work and operation of the Board and the
framework of governance it deploys to lead and control the business
and report on the Company’s performance.
COMPLIANCE WITH THE LISTING RULES
Our ordinary shares are listed on the Colombo Stock Exchange.
In accordance with the Listing Rules of the Colombo Stock Exchange
and the Securities and Exchange Commission of Sri Lanka, we confirm
that throughout the year ended 31 March 2012 and at the date of this
document, we were compliant with the provisions of and applied the
principles of Section 7.10 of the CSE’s listing rules.
The Institute of Chartered Accountants of Sri Lanka has issued the
new Sri Lanka Financial Reporting Standards applicable for financial
years beginning on or after 1st January 2012. We will report on it
for the first time in our 2012/13 financial year and intend to be in
compliance.
ROLE OF THE BOARD
ICASL CODE A.1.
Our core purpose is to ensure long term success of the Company and
long term returns to our shareholders. This requires us to determine
business strategy and our appetite for risk. We need to monitor
management’s performance in delivering against that strategy and
ensure that the risk management measures and internal controls
they put in place are appropriate and effective. We must ensure
that the funding and talent available to the business will support it
over the long term. Finally, we must remain aware of the Company’s
obligations to its shareholders and other stakeholders and respond to
their needs with transparent reporting and active engagement.
To help discharge these key responsibilities, the Board has defined
the business and governance issues which are reserved for its final
decision. These form the basis of its core agenda and are summarized
below:
Schedule of matters reserved for the Board
Business Strategy:-
Determining strategy and approval of plans and budgets.
Approval of major acquisitions and disposals.
Approval of investments.
Risk appetite, funding and liquidity:-
Determining the Company’s risk appetite.
Agreeing the Company’s capital structure, funding, borrowing
limits and liquidity.
Approval of Treasury policies including credit exposures and
interest rate, foreign currency translation and hedging.
Risk management and internal controls:-
Reviewing the effectiveness of the Company’s risk
management framework and internal controls and reporting
on that review to shareholders.
Financial reporting and dividends:-
Recommending and declaring dividends.
Approval of major accounting policies.
Approval of financial statements and results announcements.
Approval of all shareholder circulars and notices of meeting.
Appointments:-
Appointment of directors.
Appointment of auditors.
Appointment of Board Committees, their terms of reference
and membership.
Remuneration:-
Approval of the Company’s remuneration philosophy and the
principles of its remuneration policy.
Approval, on the recommendation of the Remuneration
Committee, of the Company’s total variable compensation
spend each year.
Approval of new share incentive plans prior to their submission
to shareholders for approval.
BOARD AGENDA LAST YEAR
The table below summarises the main business topics addressed
by the Board during the year in addition to their regular review of
business performance.
Summary of Board business -2011/12
Approval of Year end results
Review of 2011/12 year end results and reporting
Year end review of risk management and internal controls
Recommendation of final dividend
Approval of Annual Report contents
Approval of interim results, and interim dividend
Review of Business plans and Goals
Approval of 2012/13 Budget
Review on a regular basis the company’s performance vis a vis
the agreed plan and strategy.
Review the Human Resources plan and the remuneration
policy.

Annual Report 2011/12 39
Planning for 2012/13
Review of liquidity and capital position and executive
proposals for change
Performance of the Group and Strategic outlook for the next
five years.
KEY BOARD RELATIONSHIPS
ICASL CODE A.2
Of critical importance to the effective working of the Board, is the
relationship of the Chairman with the Chief Executive (CEO). While the
Chairman is responsible for leading and running the Board, the CEO
leads and runs the business. A summary of their clearly differentiated
but complementary roles is given below. The CEO keeps the chairman
closely informed on developments in the business, regularly discusses
with him the Board’s thinking and concerns and identifies issues for
further debate. Together they explore ways in which they can best
engage the Board on important issues and maximise non executive
contribution.
ROLE OF THE CHAIRMAN AND CEO
ICASL CODE A.3
In addition to his regular dialogue with the Chief Executive on
management’s interface with the Board, the chairman spends time
working on the Board’s forward agenda and on detailed preparation
for meetings in conjunction with the Company Secretary. His
aim is that Board meetings should allow full and free discussion,
unburdened by time constraint and over prescription, while still
delivering proper governance and the timely addressing of issues.
Both the Chairman and the CEO keep non-executive Board members
updated on all important and topical developments and give
them the opportunity to raise any issues of concern. Material and
information presented by management are designed to facilitate well
informed decision making. In chairing Board meetings, the Chairman
encourages expression of the broadest range of views, particularly
those which may challenge management. He seeks to foster open
and trusting relationships between executive and non-executive
Board members and is regularly rewarded with robust, incisive and
good humored debate.
Chairman
Leads the Board and sets its agenda including agreeing
strategy and determining risk appetite.
Ensures the regular flow of accurate and relevant management
information to enable the Board to make sound decisions and
monitor business performance.
Ensures, with the support of the Nomination Committee,
effective Board succession planning.
Fosters effective Board relationships, evaluation of Board
performance and follow up action.
Ensures effective communication with shareholders and that
the Board develops a clear understanding of their views.
Ensures the effective functioning of all Board Committees.
Chief Executive
Leads the Executive Committee in developing business
strategy for Board approval and in managing risk.
Runs the business, through the executive management, on a
day to day basis and reports to the Board on performance and
significant developments.
Builds and maintains an effective Executive Committee and
management team.
Communicates and instills throughout the business a shared
purpose, culture and set of values.
Maintains, in conjunction with the Chief Financial Officer
and Investor Relations team, an effective dialogue with
stakeholders and investors.
To help obtain a comprehensive view of Board activity and Board
members’ contribution, the Chairman attends Remuneration
Committee meetings and the Nomination Committee as their
chairman. In addition, he is in frequent touch with Board members
between formal meetings to keep them updated or seek their views
on particular issues. The chairman is always keen to preserve the
immediacy and informality of communication which he believes is
one of the great strengths of our Board.
MANAGEMENT REPORTS SUSTAINABILITY GOVERNANCE FINANCIAL REPORTS

40 The Hemas Group. Enriching Lives
BOARD STRUCTURE
ICASL CODE A.5
Hemas has a focused close knit Board comprised of an effective balance of executive and non executive directors. Board Committee memberships and
terms of appointment of each director as at 31st March 2012 are set out in the table below.
The Board
Lalith de Mel Husein Esufally Abbas Esufally Imtiaz Esufally Murtaza Esufally
Term of
Office
Mr. Lalith de Mel was
appointed to the Board
as an independent
director in April
2002. He was elected
Chairman in the year
2003 which Office he
holds to date. Each year,
his re appointment
to the Board is placed
before the shareholders
for approval.
Mr. Husein Esufally was
appointed to the Board
in October 1997. He
currently serves as the
Chief Executive Officer
of the Group.
Mr. Abbas Esufally was
appointed to the Board
in May 1991and served
as an executive director
until his retirement in
2007.
He now holds the
office of non executive
director/Advisor..
Mr. Imtiaz Esufally was
appointed to the Board
in May 1991.
He serves as an
executive director and
as Chairman of the
Transportation Sector of
the Group.
Mr. Murtaza Esufally was
appointed to the Board
in September 1998 and
is an executive director,
heading the Healthcare
sector of the group.
Committee
Membership
Mr. Lalith de Mel serves
as the Chairman of
the Remuneration
and Nominations
committees.
Mr. Husein Esufally
attends Audit
committee meetings
and meetings of
the Remuneration
and Nomination
Committees, as an
invitee.
None Mr. Imtiaz Esufally
attends meetings of the
Audit Committee by
invitation.
None.
Maithri Wickremesinghe Pradipta Mohapatra Divyaroop Bhatnagar Ramabadran Gopalakrishnan
Term of
Office
Mr. Maithri Wickremesinghe
was appointed to the Board
as an independent director
in 2003.
His current term in Office
expires in July 2012 .
Mr. Pradipta Mohapatra was
appointed to the Board in
July 2007 and serves as an
independent director.
His current term in Office
expires in June 2013.
Mr. Divyaroop Bhatnagar was
appointed to the Board in
August 2003 and served as
an executive director until
he stepped down from his
executive position in March
2008. Mr. Bhatnagar continued
to serve on the board as a non
executive director .His current
Term of Office expired on 31st
March 2012.
Mr. Ramabadran
Gopalkrishnan was
appointed to the Board as an
independent director on 1st
April 2012.
Committee
Membership
Mr. Wickremesinghe serves
as the Chairman of the Audit
Committee and member of
the Remuneration Committee.
Mr. Mohapatra is a member
of the Audit Committee and
Nomination Committee.
None None
CORPORATE GOVERNANCE
A brief resume of each of the above directors is given on page 56 of this report.

Annual Report 2011/12 41
FINANCIAL ACUMEN
ICSAL CODE A.4
Our Board benefits from a broad and rich base of non-executive
expertise. Together our non-executives bring to Hemas a powerful
mix of experience in Corporate Finance, Financial services, Legal and
Marketing. Some have worked at director level in large multinational
organizations whilst others have specialised experience and are
proven entrepreneurs. Each has the global perspective and outlook
required for the successful direction of Hemas’ business.
The executive directors, supported by senior management, are
responsible for the day to day operation and development of the
business.
CONTRIBUTION OF NON EXECUTIVES
Non-executive directors are appointed for an initial three year
term, subject to their retirement by rotation and reappointment by
shareholders at the Company’s AGM, after which a second term of
three years may be mutually agreed. Their annual time commitment
will vary according to their service on Board Committees and the
demands of the business. Each director confirms at the time of their
appointment that they have sufficient time to give to the role. The
non-executive directors make every effort to attend all scheduled and
short notice meetings, even if on occasion this requires them to join a
meeting by telephone or via Tele conference from a different
time zone.
The non-executive directors are appointed to bring an external and
independent view, both to support and when appropriate, challenge
their management colleagues.
Our non-executive directors closely monitor management
performance against the agreed strategy and direction and seek
remedial or alternative action where objectives are not being met.
Their independence from management also allows them to play a
critical part in key Board governance functions through their detailed
work on three Board Committees, the summary roles of which are
outlined below.
The Chairman of each Committee reports to the Board on matters
discussed at Committee meetings and highlights any significant
issues requiring Board attention. Reports from the Chairmen of the
Audit, Remuneration and Nomination Committees on the work of
those Committees during the year are given on pages 51, 52 and 53
respectively.
Full terms of reference of these Board Committees can be obtained
from the Secretaries on request.
AUDIT COMMITTEE
reviews the integrity of financial reporting to shareholders.
reviews the effectiveness of the Company’s risk management
framework and internal controls.
determines the scope of external audit and reviews its findings
and effectiveness.
reviews Internal Audit reports and monitors management’s
response to their recommendations.
recommends the appointment, reappointment and removal of
the external auditors.
Approves the remuneration and terms of appointment of the
external auditors.
REMUNERATION COMMITTEE
determines and agrees with the Board the principles of the
Company’s remuneration policy.
determines the total compensation for executive directors, the
CEO and executive committee members, within that policy.
recommends to the Board the quantum of the Company’s
annual variable compensation.
Sets vesting criteria for share incentive plans.
NOMINATION COMMITTEE
reviews the Board’s skill and experience base and proposes any
necessary changes.
directs the search and selection process for new appointments
and recommends preferred candidates to the Company and
subsidiary boards.
oversees senior management succession planning to ensure
continuity of executive resource at and just below Board.
OTHER COMMITTEES
The following committee forms part of the Corporate Governance
framework, but is not a formally appointed committee of the Board.
BOARD OF MANAGEMENT
The Executive Directors, together with the Group Business
Heads, meet each month as the Executive Committee under the
chairmanship of the Chief Executive Officer. The role of the Executive
MANAGEMENT REPORTS SUSTAINABILITY GOVERNANCE FINANCIAL REPORTS

42 The Hemas Group. Enriching Lives
Committee is to develop overall group strategy and annual business
plans, review business plans against budgets, design and review
policies and controls and provide a platform to the Chief Executive to
raise ideas and issues and obtain input.
Biographical details of the members of the Board of Management are
set out on page 58.
INDEPENDENCE
ICASL CODE A.5
One of the key qualities required of non-executives is that they
should have the independence of character and judgment which
enables them to challenge their executive colleagues constructively
and dispassionately and to carry our their broad governance role.
We recognise the importance of non-executives’ independence to
our shareholders and it is one of the issues we test in our annual
evaluation of directors’ effectiveness.
The independence of the directors was determined based on the
criteria as defined in the Listing Rules of the Colombo Stock Exchange.
Each of the following directors have submitted signed statements
declaring their independence:-
Mr. J C L De Mel *
Mr. M E Wickremesinghe *
Mr. P K Mohapatra
Mr. D Bhatnagar
*Notwithstanding the fact that both Messrs J.C.L. De Mel and
M E Wickremesinghe have served as directors for over 9 consecutive
years, the Board considers them independent, given their impartial
approach to the deliberations of the Board.
EXTERNAL INTERESTS
All directors have a duty to avoid situations which create or may
create a conflict with the interests of the Company. For this reason we
ask our non-executive directors to notify us of their external business
appointments and interests prior to joining the Company and to
keep us advised of any changes on a continuing basis. If a particular
directorship is identified as representing a potential conflict of interest,
the director in question will declare his interest and not participate in
any Board discussion relating to that company.
DIRECTORS’ INDEMNITY AND INSURANCE COVER
On their appointment, new directors are granted an indemnity by
the Company, to the extent permitted by law, in respect of any third
party liabilities which they may incur as a result of their service on the
Board. The Company arranges directors’ and officers’ liability insurance
to cover certain liabilities and defence costs which the Company
indemnity does not meet. Neither the indemnity nor the insurance
provides any protection in the event of a director being found to have
acted fraudulently or dishonestly in respect of the Company.
IMPROVING EFFECTIVENESS OF THE BOARD
ICASL CODE A.6
Continuing education and development
There is considerable emphasis on keeping the Board’s knowledge
of the business substantive and current. Of parallel importance is
the need for directors to keep up to date with relevant regulatory
developments, corporate governance trends and changes in investor
expectations, some of which impact in particular on the non-
executive role.
The Company Secretary researches and regularly circulates details
of external programs to facilitate this. In addition, all directors are
aware that they may, if they consider it necessary, seek independent
professional advice at the Company’s expense in relation to the
discharge of their role.
The Company convenes at least five Board meetings a year for
which detailed Agenda are prepared by the Company Secretary in
consultation with the chairman. Comprehensive discussion papers
on each of the topics for discussion are circulated to the members at
least seven working days prior to a meeting to enable the directors to
facilitate its effective conduct.
APPOINTMENTS TO THE BOARD
ICASL CODE A.7
A formal and transparent procedure exists for all appointments to
the Board. A Nominations Committee comprising two independent
directors and the CEO meet as required to review and make
recommendations to the Board on the suitability of the appointment
and re appointment of directors to the Company and its subsidiaries
and to regularly review the structure, size , composition and
competencies of the Board.
CORPORATE GOVERNANCE

Annual Report 2011/12 43
A statement by the Nominations Committee is given on page 53 of
this Report.
RETIREMENT AND RE ELECTION
ICASL CODE A.8
All directors’ appointments are subject to their retirement by rotation
at three year intervals and reappointment by shareholders at the
Company’s Annual General Meetings (AGMs). The Chairman retires
at each AGM in terms of Section 210 of the Act and is eligible for re
appointment in accordance with Section 211 of the Act.
BOARD EVALUATION
ICASL CODE A.9
Every year the Board conducts a review of its performance as a Board
and identifies issues on which it needs to work.
A performance evaluation of the Board was carried out last year at
which an assessment of the Board’s performance was made against
key drivers of effectiveness including strategy development, the
decision making process, Board-management relationships, board
processes and meetings and succession planning. Feedback was
also sought on the operation of the principal Board Committees and
on the contributions of individual directors. The review indicated
that overall the Board and its principal Committees were operating
effectively.
The relationship between the Chairman and CEO was considered to
be sound and it was felt that major issues were fully discussed before
decisions were made.
DISCLOSURE OF INFORMATION IN RELATION TO DIRECTORS
ICASL CODE A.10
The names of the Directors who served during the year and as at date
are disclosed in the Corporate Information page of this report.
Directors’ interest in contracts with the Company are set out on
page 54.
The table below provides a record of directors’ individual attendance
at Board and committee meetings, in person or by telephone.
DIRECTORS’ REMUNERATION
ICASL CODE B. 1,2 AND 3
The Remuneration Committee, comprising two independent
directors, within agreed terms of reference, makes recommendations
to the Board on the policy for remunerating executive directors, the
CEO and senior management. The Committee consults the CEO,
who participates in the deliberations, about its proposals relating to
the remuneration framework of other executive directors. They have
access to professional advise in discharging their responsibilities and
review data of comparable companies when positioning levels of
remuneration of executive directors and senior management.
The aggregate remuneration paid to the executive and non executive
directors for the year under review is disclosed on page 61 of this
Report.
Number of meetings attended
BoardAudit
Committee
Remuneration
Committee
Nominations
Committee
Mr. J C L De Mel 7/7 5/5 4/4
Mr. H E Esufally 7/7 7/7* 5/5 4/4
Mr. A N Esufally 7/7
Mr. I A H Esufally 7/7 7/7*
Mr. M E Wickremesinghe 7/7 7/7 5/5
Mr. M A H Esufally 6/7
Mr. P K Mohapatra 6/7 4/4
Mr. D Bhatnagar 7/7
Mr. R Gopalakrishnan (Appointed on 1st April 2012)
*By invitation
MANAGEMENT REPORTS SUSTAINABILITY GOVERNANCE FINANCIAL REPORTS

44 The Hemas Group. Enriching Lives
CONSTRUCTIVE USE OF THE AGM
ICASL CODE C.1
We are always pleased to hear the views of our stakeholders and to
answer their queries by telephone or in writing. We encourage them
to make maximum use of our website ([email protected]) to access
Company reports, notices of meetings and general shareholder and
dividend information.
Each AGM includes an open question period allowing shareholders
to ask about any areas of the Company’s performance as well as to
discuss the specific resolutions proposed at the meeting. All our
directors were available at the last AGM to answer questions and
many circulated and talked to shareholders informally after the
meeting. Voting on all the resolutions was by a show of hands and all
the resolutions were passed unanimously.
MAJOR TRANSACTIONS
ICASL CODE C.2
There were no major transactions carried out during the financial year
under review which materially altered the Company’s net asset base
or the consolidated group net asset base.
FINANCIAL REPORTING CONTROLS
ICASL CODE D.1
The financial reporting control system operating across the Group
requires certification of the key controls over the financial reporting
processes and certification of material income statement and balance
sheet accounts. The system focuses on the financial reporting process
over the most material financial statement line items and is designed
to maintain proper accounting records and provide assurance that
financial information used within the business and for publication is
reliable.
Compliance
The Board of Directors confirm that they have taken all reasonable
steps to ensure that the financial statements of the Company and
the Group have been prepared in a meaningful manner and are in
accordance with all applicable regulations.
The Directors’ Responsibility Statement is given on page 68 of this
Report.
GOVERNANCE OF RISK
ICASL CODE D.2
The Board is ultimately responsible for the framework of the Group’s
risk governance and risk management.
The Board is responsible for:
determining overall risk management strategy.
ensuring that risk is monitored and controlled effectively.
the Group’s systems of internal control.
GOVERNANCE FRAMEWORK
ICASL CODE D.3
The Audit Committee of the Board provides independent oversight
and challenge in relation to internal control and risk management
systems.
The Chief Executive has, through the authority given to him by the
Board, given delegated authority for the oversight of risk from within
the business to senior management from both line businesses and
risk control functions.
Senior management in the businesses are accountable for all risks
assumed in their areas of responsibility and for the execution of
appropriate risk management discipline within the framework of
policy and delegated authority set out by the Board. The principle of
individual accountability and responsibility for risk management is an
important feature of our corporate culture. Day to day independent
and objective assessment and monitoring of risk is provided by
various control functions at the Group level and in the business. These
control functions include Group Risk, Finance, Legal and Compliance,
Human Resources and Internal Audit. In addition, risk management
functions reside within each business unit, with formal reporting
lines and segregation of duties for the key risk, compliance, legal and
finance functions.
OPERATIONAL RISK AND INTERNAL CONTROLS
Operational risk arises from the potential for the Group to suffer losses
due to failures in processes or procedures in its business. Operational
risk is mitigated by the Group’s control environment. The directors and
senior managers of the Group are committed to maintaining high
standards of control and a risk aware culture to safeguard the Group’s
assets, reputation and franchise. The Group pays particular attention
to operational and reputational risks relating to product suitability,
sales practices at intermediaries and the accuracy of its valuation and
investor reporting processes.
CORPORATE GOVERNANCE

Annual Report 2011/12 45
Significant resources are devoted to protecting the resilience of the
Group’s information technology systems, including formal business
continuity plans and remote data back-up and disaster recovery
facilities for each of its key locations. Business continuity for its core
activities is regularly tested to maintain effectiveness. An insurance
program is tailored to its risk profile and designed to maximise
breadth of cover and certainty of response in respect of key third
party liabilities, loss of Group assets, business interruption, professional
indemnity, cash and goods in transit and people-related exposures.
The Company’s systems of internal control aim to safeguard assets,
maintain proper accounting records and provide assurance that the
financial information used in the business and published externally is
robust and reliable.
Review of controls and risk management systems
The Board receives reports from line management and Group Risk on
the risks to the achievement of the Group’s operational and financial
objectives, together with assurance that the level of risk sustained
is consistent with and being managed in accordance with its risk
appetite. This includes reports on the current and forward looking
assessments of capital and liquidity adequacy. The Audit Committee
receives reports from The Senior Manager, Risk and Control which
considers the effectiveness of risk controls through regular monitoring
of risk scenarios, key risk indicators and operational risk incident
reports. This is described in more detail in the Risk Management
section of the report on pages 48-50 and from the Chairman of
the Audit Committee. Objective assurance on the operation and
effectiveness of internal controls is provided by Internal Audit whose
audit program is targeted on the business areas and processes that
are most significant in terms of the Group’s risk profile and where
there are key controls on which the Group relies.
In addition to its ongoing monitoring of risk controls, the Board has
conducted a specific year end review of the effectiveness of the
Group’s system of internal control and risk management during the
year and for the period up to the date of this Annual Report. This
process, which was also reviewed by the Audit Committee, covered all
controls; operational, financial and compliance and risk management
systems. It included a review of all significant operational risk incidents
and internal audit findings raised during the year. Management does,
however, have an ongoing process for identifying, evaluating and
managing significant risks faced by the Group and continually takes
action to improve internal controls as a result of its own initiatives
and in response to reports from Internal Audit and other internal and
external reviews.
Trading in Company securities by Directors, Officers and Employees
The Colombo Stock Exchange has established guidelines, that restrict
dealings by directors and relevant employees in the Company’s
shares and in shares in other companies related to the Company’s
operations.
Based on the guidelines and on the basis of knowledge of
unpublished price-sensitive information, directors and relevant
employees are restricted from buying or selling shares during
identified periods. These periods include two (02) market days
following the announcement of quarterly and full year results and
following the announcement of a dividend or share issue.
CODE OF CONDUCT
ICASL CODE D.4
Through established practices and policies the Board supports the
need for directors and employees to observe the highest standards
of behaviour and business ethics. All directors, senior managers and
employees are expected to act with integrity, striving at all times to
enhance the reputation and performance of the Group. Appropriate
training programs on the Group’s internal policies including workplace
health and safety, environmental law compliance, trade practices
legislation and affirmative action programs support this process.
The Board recognises that managing “natural, human, social and other
forms of capital” may also assist in creating value for shareholders. To
this end the Board seeks, by the individual contributions of directors
and by encouraging activities of its executives, to uphold community
standards and to maintain good relations with community and
government organisations.
The Code of Conduct which draws together all of the Company’s
policies and codes was made more comprehensive during the year
and is available on the Company’s website www.hemas.com
All directors and members of the senior management affirm that they
have complied with the Code during the year under review.
MANAGEMENT REPORTS SUSTAINABILITY GOVERNANCE FINANCIAL REPORTS

46 The Hemas Group. Enriching Lives
STATEMENT OF COMPLIANCE WITH THE CODE OF BEST PRACTICE
ICASL CODE D.5
The Company has, throughout the year ended 31 March 2012, applied
the principles of and complied with the provisions of the Code of
Best Practice on Corporate Governance (2008) issued jointly by the
Institute of Chartered Accountants of Sri Lanka and the Securities and
Exchange Commission of Sri Lanka.
INSTITUTIONAL INVESTORS
ICASL CODE E.1
Hemas undertakes a series of meetings and events for institutional
investors and research analysts each year. The Board routinely receives,
as part of the Chief Financial Officer’s monthly performance review
report, updates on significant share movements, analysts’ consensus
forecasts, market sentiment and feedback from investor meetings.
The CEO and the Chief Financial Officer attend results presentations to
analysts and hear at first hand their perceptions and concerns about
the business.
THE FUTURE
The essence of good corporate governance is ensuring trustworthy
relations between the corporation and its stakeholders. Therefore,
good governance involves a lot more than compliance. Good
corporate governance is a culture and a climate of Consistency,
Responsibility, Accountability, Fairness, Transparency, and
Effectiveness that is deployed throughout the organization.
.
Your board will continue to provide effective oversight and strategic
guidance to the management, establishing a culture that sets the
right tone at the top, which is critical for establishing the ‘trust’ for the
corporation with all its stakeholders.
We look forward to welcoming shareholders to our AGM to be held
on 29th June 2012 and updating them on the progress and significant
changes to the business this year.
CORPORATE GOVERNANCE
CSE Rule No. Applicable Rule RequirementStatus of
compliance
Reference to Annual
Report
7.10.1 Non executive Directors(NEDs) Two or at least one third of the total number of
Directors should be NEDs.
√ Corporate
Governance Report
7.10.2 (a) Independent Directors Two or one third of NEDs (whichever is higher) should
be independent
√ Corporate
Governance Report
7.10.2 (b) Independent Directors Each Non-Executive Director should submit a
declaration of independence/ non-independence in
the prescribed format
√ Corporate
Governance Report
7.10.3 (a)
and (b)
Disclosure relating to
Directors
Names of Independent Directors should be disclosed
in the Annual Report
√ Corporate
Governance Report
- do - Disclosure relating to
Directors
The basis for determination of independence of NEDs,
if criteria for independence is not met.
√ Corporate
Governance Report
7.10.3 (c) Brief Resume of each
Director in the Annual
Report
A brief resume of each Director should be included in
the Annual Report, including his area of expertise
√ Annual Report of the
Directors
7.10.4 Criteria for defining
“independence”
Requirements for fulfilling criteria √ Corporate
Governance Report
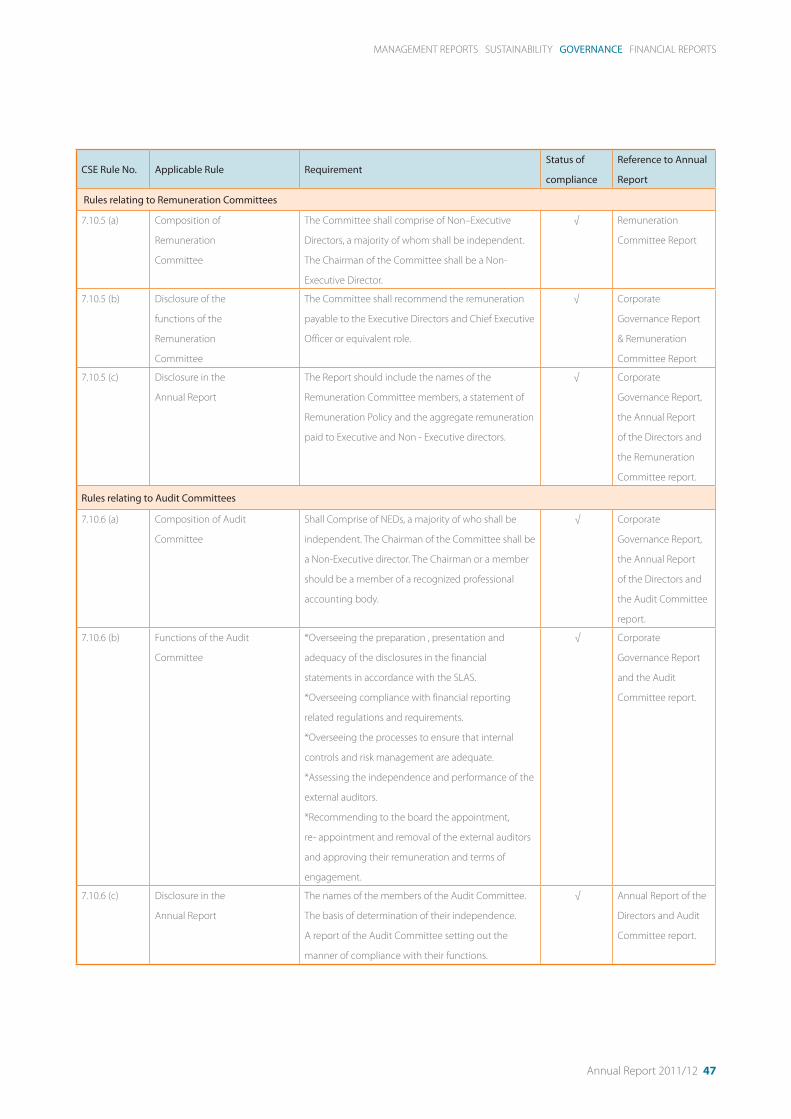
Annual Report 2011/12 47
CSE Rule No. Applicable Rule RequirementStatus of
compliance
Reference to Annual
Report
Rules relating to Remuneration Committees
7.10.5 (a) Composition of
Remuneration
Committee
The Committee shall comprise of Non–Executive
Directors, a majority of whom shall be independent.
The Chairman of the Committee shall be a Non-
Executive Director.
√ Remuneration
Committee Report
7.10.5 (b) Disclosure of the
functions of the
Remuneration
Committee
The Committee shall recommend the remuneration
payable to the Executive Directors and Chief Executive
Officer or equivalent role.
√ Corporate
Governance Report
& Remuneration
Committee Report
7.10.5 (c) Disclosure in the
Annual Report
The Report should include the names of the
Remuneration Committee members, a statement of
Remuneration Policy and the aggregate remuneration
paid to Executive and Non - Executive directors.
√ Corporate
Governance Report,
the Annual Report
of the Directors and
the Remuneration
Committee report.
Rules relating to Audit Committees
7.10.6 (a) Composition of Audit
Committee
Shall Comprise of NEDs, a majority of who shall be
independent. The Chairman of the Committee shall be
a Non-Executive director. The Chairman or a member
should be a member of a recognized professional
accounting body.
√ Corporate
Governance Report,
the Annual Report
of the Directors and
the Audit Committee
report.
7.10.6 (b) Functions of the Audit
Committee
*Overseeing the preparation , presentation and
adequacy of the disclosures in the financial
statements in accordance with the SLAS.
*Overseeing compliance with financial reporting
related regulations and requirements.
*Overseeing the processes to ensure that internal
controls and risk management are adequate.
*Assessing the independence and performance of the
external auditors.
*Recommending to the board the appointment,
re- appointment and removal of the external auditors
and approving their remuneration and terms of
engagement.
√ Corporate
Governance Report
and the Audit
Committee report.
7.10.6 (c) Disclosure in the
Annual Report
The names of the members of the Audit Committee.
The basis of determination of their independence.
A report of the Audit Committee setting out the
manner of compliance with their functions.
√ Annual Report of the
Directors and Audit
Committee report.
MANAGEMENT REPORTS SUSTAINABILITY GOVERNANCE FINANCIAL REPORTS

48 The Hemas Group. Enriching Lives
BOARD
Ris
k &
Co
ntr
ol D
ep
art
me
nt
Senior Management
Audit committee
Riskcommittee
Risk Champion
Head of the Dept.
Stakeholders
Stakeholders
Sta
keh
old
ers
Sta
keh
old
ers
RISK MANAGEMENTAs a successful diversified conglomerate, we believe that our dynamic
approach to risk management ensures that key risks are proactively
identified, assessed and appropriate risk responses are taken. Our
ongoing assessment process takes into account the likelihood of
an event, its potential impact on the business and the need for
mitigation controls.
Our system of risk management identifies and provides the response
to risks of group significance and business significance through
the establishment of standards and other controls. The risks are
categorized as: Strategic, Financial, Compliance and Operational.
We have adopted the ISO 31000 standard of risk management and
this framework has been established at both Group and SBU level
to enable scarce resources to the opportunities that are expected to
generate maximum return whilst minimizing the associated risk. It
elaborates on risk identification, risk assessment, risk response and risk
reporting methodologies.
RISK MANAGEMENT POLICY
Our policy for risk management is to proactively manage risk to
ensure continued growth of our business and to protect the value
created. Accordingly we;
Utilize an effective and integrated risk management system
while maintaining business flexibility.
Identify and assess material risks associated with our business
and monitor, manage and mitigate risks.
THE BOARD AND RISK MANAGEMENT
One of the tasks of the Hemas Holdings Board is to ensure that the
entity is functioning effectively and that the material risks to the
group are identified and understood, and that the systems of risk
management and internal control are in place to responsed to
those risks.
INTERNAL CONTROL, AUDIT AND RISK MANAGEMENT
The agenda for the audit committee contains standing items on
internal controls. These include the quarterly internal audit findings
report, an evaluation of internal controls, and an annual assessment of
Hemas’s enterprise level controls.
Group Risk Management Committee (GRMC) has been formed to
overlook the risk management process. The GRMC meets once every
quarter to review the company’s risk profile and to provide guidance
on required risk responses.
As part of Risk Management process, at the Group level, the Board
reviews on a continuous basis its strategies, processes, procedures
and guidelines to effectively identify, assess and respond to risks.
Further, at SBU level, the management of subsidiaries have developed
processess to identify, assess and respond to risks.
The group wide risk management programme is being facilitated
by Risk and Control division with the inputs from Business Strategy,
Corporate Finance, Group treasury and Group HR divisions.
Risk facilitation is exercised through risk workshops, risk reviews,
essential control checklists and risk reporting.

Annual Report 2011/12 49
KEY RISKS AND ACTION PLANS
The following framework depicts the specific and most relevant risks faced by the group and the management actions to respond to the risks. The risks
are not ranked, but are categorized and described.
MONITOR AND REVIEW
COMMUNICATION AND CONSULTATION
ESTABLISH THE
CONTEXT
Analyse business
environment
Set objectives
IDENTIFY THE RISKS
Deviation from
acheivement of
expected results
ANALYSE
THE RISKS
Analyse liklihood
and impact
EVALUATE
THE RISKS
Prioritize the
risks
TREAT
THE RISKS
Implement a
suitable risk
treatment plan
ISO 31000 RISK MANAGEMENT FRAMEWORK
Risk Risk exposure Mitigating actions
Market Risk Loss of market share or market leadership in relevant
segments due to intense competition from existing and
potential competitors, changes in customers attitudes and
adverse economic conditions.
Regular monitoring of key customers and consumer trends
Enhance productivity/efficiency to improve price
competitiveness
Continuous focus on innovation
Focus on new markets and growth prospects
Business Partner
Risk
Loss of principals/business partners due to global mergers
and acquisitions, intense competition, service level gaps.
Seek new market opportunities and develop new alliances
to minimize exposure to a single business partner.
Regular assessments of service levels in order to ensure
business partner expectations are met
Develop strategies to maximize value proposition of existing
business partners
Growth Risk Risk of core businesses of the portfolio being in the
maturity/declining phase.
Develop strategies to win the market share from
competitors through continuous innovation and value
enhancement.
Identify new business opportunities that leverage on core
competencies
Investment Risk Effect on future profitability of the Group by the degree of
realization of expected earnings on investments.
Information on returns from business activity is aggregated
each quarter to form an early risk warning system
Gaps in the business portfolio are identified and potential
new areas of business identified.
MANAGEMENT REPORTS SUSTAINABILITY GOVERNANCE FINANCIAL REPORTS

50 The Hemas Group. Enriching Lives
Risk Risk exposure Mitigating actions
Legal and
Regulatory Risk
Changes to regulations or new regulations imposed could
bring adverse effect on our businesses.
The centralized Legal division assists and advises the
companies across the Group on legal matters.
Periodic compliance reviews to ensure adherence to
regulatory and statutory requirements.
Participate in industry forums to lobby against regulations
that could have an adverse impact.
Operational Risk Internal process failures, fraud, breakdown of internal
controls, failure to comply with statutory requirements,
natural and man made disasters could result in potential
loss of earnings as well as reputation.
Maintain objectivity and independence of the internal audit
function.
Business Continuity Plans are in place to ensure the smooth
operation of the businesses even at a time of disaster.
Seek continuous improvement of processes through
process documentation, root cause analysis, vendor
performance evaluation, customer satisfaction
measurement etc.
Product Risk Possibility of products becoming irrelevant in the market Product innovation is given high priority.
Strategies are developed to get closer to customers and be
responsive to their needs.
Interest rate
and Foreign
Exchange Risk
Potential losses as a result of adverse movement of
interest and high volatility in foreign currency exchange
rates against the Sri Lankan Rupee.
Exchange rate movements are constantly monitored for
currencies in which the Group carries exposure, to ensure
timely actions to hedge.
Centralized treasury management
Managing interest rate risk and foreign exchange exposure
through appropriate financial risk management techniques.
Human Resource
Risk
Risk arising as a result of failure to attract, develop and
retain a skiled workforce
Build strong employer brand image and talent management
process to retain critical employees in the long term.
Develop career development programme, mentoring
programmes and performance based rewards programs.
Periodic salary surveys to ensure that remuneration is in line
with the market.
IT Risk Inaccuracy or delays in decision making due to inaccurate
or non availability of timely information from key
computer system since the Group depends mainly on IT
system for information purpose.
A centralized IT team is mobilized in the Group
A contingency plan is in place to mitigate the risk of IT
failures.
Comprehensive IT policy across the Group to ensure
adequate systems and controls are in place.
RISK MANAGEMENT

Annual Report 2011/12 51
REPORT OF THE REMUNERATION COMMITTEETHE ROLE
The role of the committee is to set the Company’s remuneration
policy. This policy must support the growth of the business and
facilitate the increase in shareholder value. In order to achieve this it
must ensure that the Company’s remuneration policies will attract,
motivate and retain the high quality staff required.
The Charter determines the terms of reference for the Remuneration
Committee. It includes the management of the Group’s Board and
Executive Remuneration Policy and setting the broad parameters of
remuneration for senior executives across the group.
The Remuneration Committee of the Board of Directors is responsible
for reviewing and recommending compensation arrangements
for the directors, the Chief Executive Officer and other key
management personnel. The Remuneration Committee assesses the
appropriateness of the nature and amount of emoluments of such
officers on a periodic basis by reference to relevant employment
market conditions with the overall objective of ensuring maximum
shareholder benefit from the retention of a high quality Board and
Management team.
Executives are given the opportunity to receive their base emolument
in the form of cash and non-cash benefits. It is intended that
the manner of payment chosen will be optimal for the recipient
without creating additional cost for the Group. The Remuneration
Committee obtains independent advice on remuneration strategy
and the appropriateness of remuneration packages given trends in
comparable companies.
The Committee will continue to consider the ability of the Group to
fund changes to remuneration packages in the short and longer term
when determining future executive compensation packages and to
align remuneration to performance.
REMUNERATION POLICY
The Remuneration Policy aims to ensure that:
Remuneration is aligned with and supports the Group’s
business strategies.
Rewards are competitive in motivating, attracting and retaining
executive talent to deliver continued and sustainable growth
in total shareholder returns.
Executives receive a level of reward that reflects the Group’s
performance and is also commensurate with the executive’s
performance, contribution and experience.
Remuneration levels are reviewed annually by the Remuneration
Committee through a process that considers individual, business unit
and overall performance of the Group and market practices.
In addition external consultants provide analysis and advice to ensure
key management personnel remuneration is competitive in the
market place.
All executive remuneration decisions are made at Board level, upon
recommendation by the Remuneration Committee.
NON-EXECUTIVE DIRECTORS’ REMUNERATION FRAMEWORK
Non-executive directors do not receive equity based compensation
or any performance based remuneration. Directors’ fees cover all
board activities including membership of board committees. In
considering the level of remuneration for non-executive directors, the
Remuneration Committee takes into account independently sourced
survey data and other information about the level of fees and benefits
being paid to non-executive directors by comparable companies and
endeavors to ensure having an excellent Board.
STOCK OPTIONS
The Company grants share options as a means of linking employee
rewards to creating shareholder value. In 2008, the shareholders
approved the granting of 3,000,000 shares as options. As a
consequence of a subdivision of shares carried out by the Company
in 2010, the number of ESOS shares available for allotment increased
to 15,000,000. The options granted have to be held for a minimum
period of 3 years. This links in to the objective of motivating and
retaining key staff. During the year under review, the 3rd and final
tranche of 3,250,000 shares were issued.
Stock Options granted by the Company over the years are given in
detail in the Annual Report of the Directors.
The Remuneration Committee determines the guidelines for the
issue of options and also the criteria for selecting the persons to
whom options will be granted. The Remuneration Committee, in
consultation with the CEO, formulates the recommendation to the
Board on the grant of options.
INDEPENDENCE OF THE REMUNERATION COMMITTEE
The Remuneration Committee comprises two independent directors,
namely:
Mr. J C L De Mel - Chairman
Mr. M E Wickremesinghe
The CEO is invited to participate at meetings of the Committee.
Lalith De Mel
Chairman
May 25, 2012
MANAGEMENT REPORTS SUSTAINABILITY GOVERNANCE FINANCIAL REPORTS

52 The Hemas Group. Enriching Lives
AUDIT COMMITTEE REPORTThe members of the Audit Committee of your Company are
appointed by the Board from amongst the independent non-
executive Directors and consists of Maithri Wickremesinghe, Chairman
and Pradipta Mohapatra, two directors who qualify as Independent
Non-Executive Directors under the standards prescribed by the
Colombo Stock Exchange.
The main role and responsibilities of the Audit Committee include;
(a) exercising oversight responsibilities relating to the quality and
integrity of the Company’s financial statements and financial
reporting process including the preparation, presentation
and adequacy of disclosures in the financial statements of
the Company in accordance with the Sri Lanka Accounting
Standards;
(b) exercising oversight responsibilities relating to the Company’s
compliance with financial reporting and information
requirements of the Companies Act No. 07 of 2007 and other
relevant financial reporting related regulations;
(c) exercising responsibilities over processes to ensure that
the Company’s internal controls and risk management are
adequate to meet the requirements of the Sri Lanka Auditing
Standards and compliance by the Company with legal and
statutory requirements;
(d) assessing the independence and performance of the
Company’s external auditors;
(e) making recommendations to the Board pertaining
to appointment, re-appointment and in appropriate
circumstances removal of the external auditors;
(f ) considering (if appropriate) the degree of any work undertaken
by the external auditor for the group other than the statutory
audit; and
(g) approving the remuneration and terms of engagement of the
external auditors.
The internal auditors report to the Audit Committee which meets with
the internal auditors both with and without the management present.
The Audit Committee met seven times during the financial
year ended 31st March 2012. The Audit Committee invited Mr.
Husein Esufally, the CEO, Mr. Imtiaz Esufally, Director, Mr. Malinga
Arsakularatne CFO and Mr. Prasenna Balachandran Head of Risk
Management to attend its meetings although it reserved the right to
request any of the individuals to withdraw. The Audit Committee inter
alia engaged in the following activities during the financial year under
review:-
Review of the un-audited quarterly financial statements and
discussion of these financial statements with management.
Review of the audited financial statements for the year and
discussion of those financial statements with the management
and external auditors.
Discussion with the Company’s external auditors the results
of the external auditors examinations and the judgment of
the external auditors concerning the quality as well as the
acceptability of the Company’s accounting principles.
Discussion of the management letter issued by the external
auditors and monitoring follow up action by the management.
Discussion with the external auditors of their independence
from the Company and the Company’s management including
a consideration of the compatibility of non-audit services
provided by the external auditors with their independence.
Review of the internal audit plan for the Company and unlisted
subsidiaries and monitoring the performance of the internal
auditors and their adherence to the internal audit plan.
Review of the internal audit reports and monitoring follow up
action by the management of the Company and its unlisted
subsidiaries.
Commissioning follow up reviews and reviewing the reports.
Introduced a Whistle Blowing Policy for the group.
The Committee reviewed the effectiveness of the external audit
and recommended to the Board the re-appointment of Messrs.
Ernst & Young Chartered Accountants as the external auditors of the
Company for the ensuing financial year, subject to the approval of the
shareholders at the Annual General Meeting.
Maithri Wickremesinghe
Chairman
Pradipta Mohapatra
Director
May 25, 2012

Annual Report 2011/12 53
NOMINATIONS COMMITTEE REPORTA Nominations Committee comprising, two independent directors
and the group CEO was established in June 2011. The Terms of
Reference of the Committee is as follows:-
Be responsible for identifying candidates to fill vacancies on
the board, as and when they arise and nominate them for
approval of the board.
Before making an appointment evaluate the balance of
skills, knowledge and experience on the board and on the
basis of this evaluation, prepare a description of the role and
capabilities required for the particular appointment.
Consider candidates for appointment from a wide range of
backgrounds.
Review regularly the structure, size and composition of the
board and make recommendations for any changes to the
board.
Ensure that on appointment to the board, Non Executive
Directors receive a formal letter of appointment setting out
what is expected of them including time commitment and
membership of board committees.
The Committee met formally on four occasions during the year to
consider and make recommendations on changes necessary to the
existing Board of Directors and the composition of the boards of the
subsidiaries.
Mr. Divyaroop Bhatnagar, whose term in Office expired on 31st
March 2012, resigned from the Board as from that date. Whilst
acknowledging the immense contribution made by Mr. Bhatnagar,
the Committee recommended the appointment of
Mr. R Gopalakrishnan, which recommendation was unanimously
accepted by the Board.
The Committee will continue to work closely with the Board in
performing their duties and responsibilities effectively.
COMMITTEE MEMBERS:
Mr. J C L De Mel - Chairman
Mr. P K Mohapatra
Mr. H E Esufally
Lalith De Mel
Chairman
May 25, 2012
MANAGEMENT REPORTS SUSTAINABILITY GOVERNANCE FINANCIAL REPORTS

54 The Hemas Group. Enriching Lives
DIRECTORS’ INTEREST IN CONTRACTS WITH THE COMPANYRelated Party disclosures as required by the Sri Lanka Accounting Standards No. 30 on Related Party Disclosures is detailed in Note 36 to the financial
statement. In addition, the Company carried out transactions in the ordinary course of business with entities where the Directors of the Company are
Directors of such entities.
Value Value
Company Directors Nature of 2012 2011
Transaction Rs.’000 Rs.’000
Hemas Manufacturing (Pvt) Ltd. Mr. H Esufally Dividend Income 165,600 43,374
Consultancy Fees 75,394 64,500
IT Charges 16,745 18,897
Corporate Services Income 1,965 -
Rental Income 794 -
Bank Guarantee Charges 54 437
Interest Expense (18,241) (9,874)
Hemas Pharmaceuticals (Pvt) Ltd. Mr. H Esufally Consultancy Fees 123,426 100,000
Mr. M Esufally IT Charges 28,261 26,889
Dividend Income 13,410 43,509
Interest Income 5,793 15,894
Rental Income 2,143 -
Corporate Services Income 350 -
Bank Guarantee Charges - 184
Interest Expense (1,115) -
Hemas Hospitals (Pvt) Ltd. Mr. M Esufally Interest Income 19,204 12,025
Mr. H Esufally IT Charges 4,086 4,074
Bank Guarantee Charges 1,020 1,028
Consultancy Fees 245 247
Corporate Services Income 96 -
Rental expenses (540) -
Hemas Southern Hospitals (Pvt) Ltd. Mr. M Esufally IT Charges 952 890
Bank Guarantee Charges 561 566
Rental Income - 227
Hemtours (Pvt) Ltd. Mr. H Esufally Interest Income 6,146 5,924
Mr. A Esufally Dividend Income - 6,750
Rental Expense (302) -
Diethem Travels Lanka (Pvt) Ltd. Mr. A Esufally IT Charges 4,166 2,830
Mr. H Esufally Consultancy Fees 245 247
Corporate Services Income 119 -
Interest Income 79 664
Transport and Accommodation Charges (2,062) (1,718)
Serendib Hotels PLC Deshamanya Lalith De Mel Interest Income 5,430 2,887
Mr. H Esufally Bank Guarantee Charges 1,985 -
Mr. A Esufally IT Charges - 17
Interest Expense (589) (60)
Serendib Leisure Management Ltd Mr. A Esufally IT Charges 633 -
Corporate Services Income 16 -
Forbes Air Services (Pvt) Ltd. Mr. H Esufally Consultancy Fees 63,960 53,300
Mr. A Esufally Dividend Income 3,902 8,640
Mr. I Esufally Rental Income 3,316 -
Mr. M Esufally Bank Guarantee Charges 765 -
IT Charges 675 281
Corporate Services Income 31 -
Interest Expense (14,640) (19,994)
Hemas Air Services (Pvt) Ltd. Mr. H Esufally Consultancy Fees 9,593 8,000
Mr. I Esufally IT Charges 1,602 1,585
Dividend Income 502 3,240
Corporate Services Income 16 -
Interest Expense (4,708) (4,393)
Hemas Travels (Pvt) Ltd. Mr. H Esufally IT Charges 3,647 3,244
Mr. I Esufally Dividend Income 1,648 4,230
Consultancy Fees 990 1,000
Corporate Services Income 71 -
Bank Guarantee Charges 36 -
Air Line Ticket Sales (7,648) (7,148)
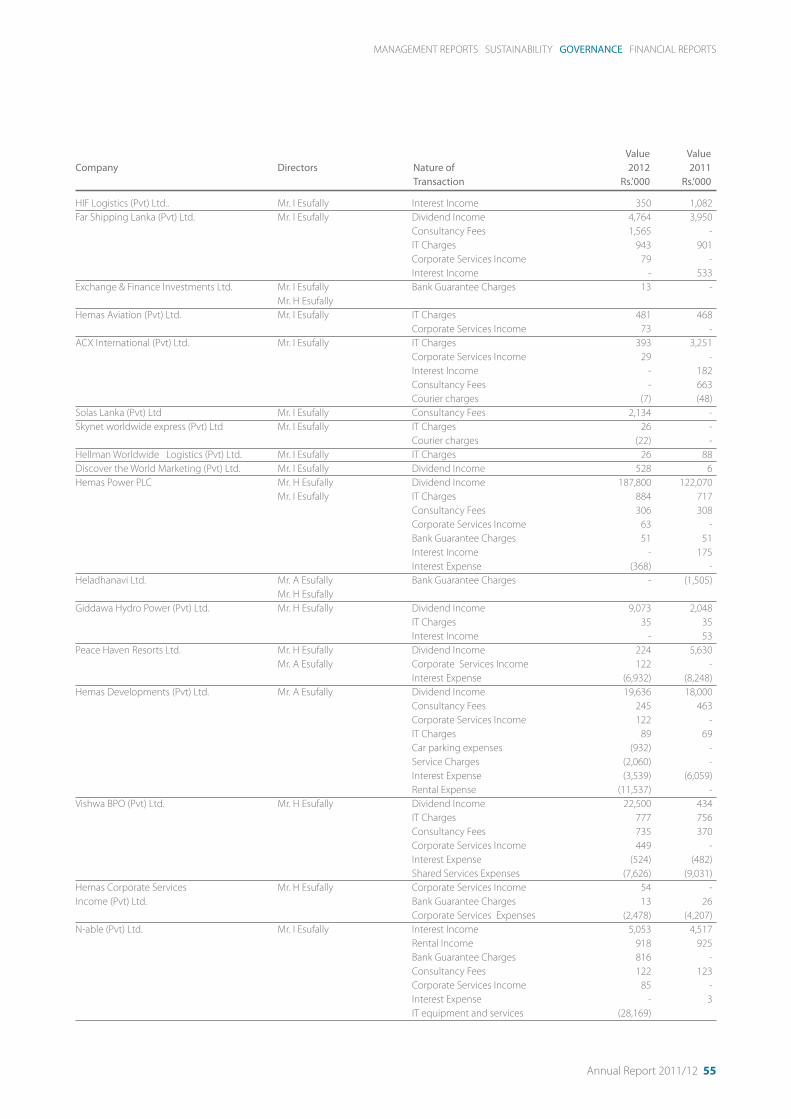
Annual Report 2011/12 55
Value Value
Company Directors Nature of 2012 2011
Transaction Rs.’000 Rs.’000
HIF Logistics (Pvt) Ltd.. Mr. I Esufally Interest Income 350 1,082
Far Shipping Lanka (Pvt) Ltd. Mr. I Esufally Dividend Income 4,764 3,950
Consultancy Fees 1,565 -
IT Charges 943 901
Corporate Services Income 79 -
Interest Income - 533
Exchange & Finance Investments Ltd. Mr. I Esufally Bank Guarantee Charges 13 -
Mr. H Esufally
Hemas Aviation (Pvt) Ltd. Mr. I Esufally IT Charges 481 468
Corporate Services Income 73 -
ACX International (Pvt) Ltd. Mr. I Esufally IT Charges 393 3,251
Corporate Services Income 29 -
Interest Income - 182
Consultancy Fees - 663
Courier charges (7) (48)
Solas Lanka (Pvt) Ltd Mr. I Esufally Consultancy Fees 2,134 -
Skynet worldwide express (Pvt) Ltd Mr. I Esufally IT Charges 26 -
Courier charges (22) -
Hellman Worldwide Logistics (Pvt) Ltd. Mr. I Esufally IT Charges 26 88
Discover the World Marketing (Pvt) Ltd. Mr. I Esufally Dividend Income 528 6
Hemas Power PLC Mr. H Esufally Dividend Income 187,800 122,070
Mr. I Esufally IT Charges 884 717
Consultancy Fees 306 308
Corporate Services Income 63 -
Bank Guarantee Charges 51 51
Interest Income - 175
Interest Expense (368) -
Heladhanavi Ltd. Mr. A Esufally Bank Guarantee Charges - (1,505)
Mr. H Esufally
Giddawa Hydro Power (Pvt) Ltd. Mr. H Esufally Dividend Income 9,073 2,048
IT Charges 35 35
Interest Income - 53
Peace Haven Resorts Ltd. Mr. H Esufally Dividend Income 224 5,630
Mr. A Esufally Corporate Services Income 122 -
Interest Expense (6,932) (8,248)
Hemas Developments (Pvt) Ltd. Mr. A Esufally Dividend Income 19,636 18,000
Consultancy Fees 245 463
Corporate Services Income 122 -
IT Charges 89 69
Car parking expenses (932) -
Service Charges (2,060) -
Interest Expense (3,539) (6,059)
Rental Expense (11,537) -
Vishwa BPO (Pvt) Ltd. Mr. H Esufally Dividend Income 22,500 434
IT Charges 777 756
Consultancy Fees 735 370
Corporate Services Income 449 -
Interest Expense (524) (482)
Shared Services Expenses (7,626) (9,031)
Hemas Corporate Services Mr. H Esufally Corporate Services Income 54 -
Income (Pvt) Ltd. Bank Guarantee Charges 13 26
Corporate Services Expenses (2,478) (4,207)
N-able (Pvt) Ltd. Mr. I Esufally Interest Income 5,053 4,517
Rental Income 918 925
Bank Guarantee Charges 816 -
Consultancy Fees 122 123
Corporate Services Income 85 -
Interest Expense - 3
IT equipment and services (28,169)
MANAGEMENT REPORTS SUSTAINABILITY GOVERNANCE FINANCIAL REPORTS

56 The Hemas Group. Enriching Lives
BOARD PROFILESDESHAMANYA J C L DE MEL
Non-executive Chairman
Deshamanya J C L De Mel has a Master of Arts Degree from
Cambridge University, UK. and the AMP Harvard Business School USA.
He counts over 40 years Board experience having served as a director
of several companies in Sri Lanka and abroad. He has served most of
his career at Reckitt Benckiser PLC. UK and was a main board director.
He was the Global Director -Pharmaceuticals when he retired. He has
served as the Chairman of the Board of Investment and the Chairman
of Sri Lanka Telecom Limited, and was a Senior Advisor, Ministry of
Finance. He holds directorships in Serendib Hotels PLC, a subsidiary of
Hemas and many other companies and is a Trustee of the Cambodia
Trust UK.
MR. H N ESUFALLY
Chief Executive Officer
Mr. Husein Esufally serves as the Chief Executive Officer of Hemas
Holdings PLC. He was appointed as the Chairman of Hemas Power
PLC in 2009 and stepped down from that Office in March 2012.
Mr. Esufally was appointed a member of the Board of Management of
the Postgraduate Institute of Management in March this year.
Mr. Esufally has over 28 years of management experience and holds a
BSc (Honours) Degree in Electronics from the University of Sussex, UK.
MR. A N ESUFALLY
Non-executive Director
Mr. Abbas Esufally is a Fellow of the Institute of Chartered Accountants
of England and Wales and the Institute of Chartered Accountants of
Sri Lanka and is an all Island Justice of Peace. He serves as Chairman
of Serendib Hotels PLC and Dolphin Hotels PLC. He has experience of
over 30 years in Sri Lanka and overseas and has been in the forefront
of the leisure industry in Sri Lanka. He is the Honorary Consul General
of Bhutan in Sri Lanka.
MR. I A H ESUFALLY
Executive Director
Mr. Imtiaz Esufally holds a Bachelor of Arts (Honours) degree in
Accounting and Economics from the University of Kent , UK. He has
over 25 years management experience and has been in the forefront
of the aviation industry. Mr. Esufally is Chairman of the Transportation
Sector and is on the board of Mercantile Shipping PLC. He was elected
as Chairman of Hemas Power PLC in April 2012.
MR. M E WICKREMESINGHE
Independent Director
Mr. Maithri Wickremesinghe is an Honours Graduate in Law of the
University of Colombo, an Attorney-at-Law of the Supreme Court
of Sri Lanka and a Fellow of the Chartered Institute of Management
Accountants of the United Kingdom. He is a practicing Attorney-at-
Law specializing in Commercial, Corporate & Banking Law.
He has previously lectured and examined at the Faculty of Law of
the University of Colombo, at the University of Moratuwa and at the
Kotalawela Defense Academy.
MR. M A H ESUFALLY
Executive Director
Mr. Murtaza Esufally holds a Bachelor of Law degree from the
University of Essex, UK. He is a Barrister-at-Law (Lincoln’s Inn) and
is an Attorney-at-Law of the Supreme Court of Sri Lanka. He has an
Executive MBA from the Melbourne Business School. He has over 17
years of Senior management experience. He is also the Chairman
of Hemas Hospitals (Pvt) Ltd and Hemas Pharmaceuticals (Pvt) Ltd,
subsidiaries of Hemas Holdings PLC.
MR. P K MOHAPATRA
Independent Director
Mr. Pradipta Mohapatra sits on the Board of 15 publicly quoted as
well as private companies in India, South Asia, USA and Europe.
He had a long career, working as a director on the main Board
of US $4 Billion RPG Enterprises in India, providing oversight to a
number of businesses. Pradipta has coached CEOs & CXOs level
executives in organisations such as Accenture, Deutsche Bank, HSBC,
Ericsson, Cummins, Levis Strauss, Raymond etc. He is a Graduate
in Chemical Engineering and Studied Management at the Harvard
Business School. He was also invited to be a fellow of the Chartered
Management Institute, UK.
Pradipta has been Chairman Confederation of Indian Industries,
Southern Region and President Madras Management Association.
He is co-founder and Chairman of Executive and Business Coaching
Foundation India Limited and Chennai Business School Limited.

Annual Report 2011/12 57
MR. R GOPALAKRISHNAN
Independent Director
Mr. Ramabadran Gopalakrishnan currently serves as Director, Tata Sons
Ltd. He is also the Chairman of four Tata companies; ie Tata Auto-
Component Systems Ltd., Rallis India Limited, Metahelix Life Sciences
Private Ltd, and Advinus Therapeutics Private Ltd.
He has worked for 44 years as a professional manager from 1967
onwards: 31 years in Hindustan Unilever and 13 years in TATA.
He serves as the Vice Chairman of Tata Chemicals, a director of Tata
Power and Tata Technologies and as an independent director on the
boards of the Indian subsidiaries of Akzo Nobel and Castrol India.
Mr. Gopalakrishnan studied physics at Calcutta University and
engineering at IIT Kharagpur before joining Hindustan Unilever as
a trainee. He has served Unilever as Chairman of Unilever Arabia, as
Managing Director of Brooke Bond Lipton India, and finally as Vice
Chairman of Hindustan Lever Limited.
He is a Past President of the All India Management Association.
MANAGEMENT REPORTS SUSTAINABILITY GOVERNANCE FINANCIAL REPORTS

58 The Hemas Group. Enriching Lives
BOARD OF MANAGEMENTThe role of the Board of Management is to develop overall group
strategy and annual business plans, review business plans against
budgets, design and review policies and controls, and provide a
platform to the chief executive to raise ideas and issues and obtain
input. The executive directors, together with the Group Business
heads, meet each month as the Executive Committee under the
chairmanship of the Chief Executive Officer.
The members of the Board of Management include:
MALINGA ARSAKULARATNE
Chief Financial Officer
Mr. Malinga Arsakularatne functions as the Chief Financial Officer
of Hemas Holdings PLC. He is also a member of the Board of
Management of Hemas Holdings PLC. He has been part of the Hemas
Group for the past 8 years and has over 8 years of experience in the
Fund Management Industry. Mr. Arsakularatne is a CFA Charterholder
and Fellow of the Chartered Institute of Management Accountants,
UK. He also holds an MSc in Investment Management from the Cass
Business School, UK, a BSc in Computer Science & Engineering from
the University of Moratuwa, Sri Lanka, and a Postgraduate Diploma in
Marketing from the Chartered Institute of Marketing (CIM), UK.
KISHAN NANAYAKKARA
Managing Director, Hemas Power PLC
Mr. Kishan Nanayakkara is the Managing Director of Hemas Power
PLC and has been holding this position since the inception of the
Company in 2003. He is also a member of the Board of Management
of Hemas Holdings PLC. Mr. Nanayakkara is a Fellow of the Chartered
Institute of Management Accountants, UK and an Associate of the
Institute of Chartered Accountants in England and Wales. He also
holds an MSc in Finance from the Birmingham Business School,
University of Birmingham, UK. He has held several senior management
positions and directorships in companies ranging from manufacturing
to financial services during a career spanning over 20 years.
Mr. Nanayakkara has served as an advisor to the National Council for
Economic Development and as a Consultant to the PERC in the past
and at present serves on the Board of the Sri Lanka Sustainable Energy
Authority.
SANJEEWA SAMARANAYAKE
Managing Director of Hemas Pharmaceuticals
Mr. Sanjeewa Samaranayake is the Managing Director of Hemas
Pharmaceuticals (Pvt) Ltd and Hemas Surgicals & Diagnostics (Pvt)
Ltd counts over 20 years of managerial experience holding senior
positions in manufacturing and trading companies in Sri Lanka.He has
a Bachelor of Commerce Degree from the University of Colombo and
is a Chartered Management Accountant with an MBA from the Post
Graduate Institute of Management, University of Sri Jayawardenapura.
He is also a Fellow of the Institute of Certified Management
Accountants of Sri Lanka. He joined Hemas Pharmaceuticals as
Director - Finance and Supply Chain in 2003 and was appointed as
Managing Director in 2007. He was awarded with the prestigious
“Platinum Honours Award” by the Postgraduate Institute of
Management Alumni at the inaugural event in 2010.
KASTURI WILSON
Managing Director of Transportation Sector
Ms. Kasturi Wilson is the Managing Director of the Groups’
Transportation sector and is a Fellow of the Chartered Institute of
Management Accountants, UK. She has a wide range of experience in
multiple industries and functions spanning from auditing, consulting,
logistics, leisure and travel. Ms. Wilson joined Hemas in 2002 as the
Finance Director of HemTours (Presently, Diethelm Travels) and in
2005 she was appointed the Head of Shared Services for the Group
and subsequently the Chief Process Officer of the Group in 2007. In
2011 Ms. Wilson took up the position of Managing Director of the
Transportation Sector.
D T R DE SILVA
Managing Director of Serendib Hotels PLC
Mr. Ranil De Silva was appointed as the Managing Director of Serendib
Hotels PLC in 2010. He is a Fellow of the Chartered Institute of
Management Accountants UK, Associate of the Institute of Chartered
Accountants of Sri Lanka and a Member of the Chartered Institute
of Marketing UK. He began his career at Ernst & Young and then
worked overseas with a Multi-National for 10 years. Mr. De Silva has
wide experience locally in the apparel industry and retailing prior to
assuming office as Group CEO of DCSL Group.

Annual Report 2011/12 59
The Group Operating Committee acts as a common platform for
senior management for sharing business information between
business and functional heads, updating members on group
performance, new initiatives, corrective actions and best practice
sharing across businesses, implementing decisions delegated by the
board, generating ideas and proposals to the Board and providing a
forum for learning.
The members of the Group Operating Committee include:
ROY JOSEPH
Finance Director of Hemas Consumer Brands
Mr. Roy Joseph is the Finance Director of Hemas Manufacturing (Pvt)
Ltd. and is an Associate of the Chartered Institute of Management
Accountants, UK, a Fellow of the Institute of Certified Management
Accountants of Sri Lanka and holds a Postgraduate Diploma in
Finance & Business Administration from the Institute of Chartered
Accountants. He counts over 20 years management experience
spanning the fields of Finance, IT, Supply Chain, Channels/Customer
Development and General Management. He has held key positions in
FMCG, Plantations, Construction and logistics companies.
HARITH PERERA
Managing Director of Diethelm Travels
Mr. Harith Perera is the Managing Director of Diethelm Travel
Sri Lanka (DTSL) and Diethelm Travel The Maldives (DTTM). He has
been with Hemas for the last 15 years. He joined Hemas FMCG
in 1996 and was involved in Sales and Brand Management until
2006. He joined Hemtours in 2006 and subsequently was part of
the team launching Diethelm Travel in Sri Lanka and Maldives. He
is an Executive Committee member of the Sri Lanka Association of
Inbound Tour Operators (SLAITO) and also the Vice President of the
PATA Sri Lankan chapter. He is a member of the Chartered Institute
of Marketing, UK and has a MBA from the University of Southern
Queensland, Australia.
INDRESH PUVIMANASINGHE FERNANDO
Finance Director of Serendib Hotels PLC
Ms. Indresh Puvimanasinghe Fernando is the Finance Director of
Serendib Hotels and is an accountant by profession. She joined
the transportation sector in 2006 and was promoted as Finance
Director of the sector before taking over her current assignment on
1st May 2011. A Fellow of the Chartered Institute of Management
Accountants, UK Ms. Puvimanasinghe Fernando counts 16 years’
experience in the management accounting profession in diverse
sectors such as financial services, travel, telecommunications and
outbound transportation. Having commenced her career as an
Accountant at Lanka Orix Factors (Pvt) Ltd in 1993, she went on to join
Aitken Spence in 1995 and served for five years in the Travel sector.
DIMUTH DE ALWIS
Group Human Resource Director
Mr. Dimuth De Alwis functions as the Group Human Resource
Director. He joined the Hemas FMCG sector in 1999 and was
subsequently promoted as the Head of Human Resources in 2006.
In 2008 he headed the Human Resources function of the Hospital
sector and was appointed as the Head of Group Human Resources
in 2010. Mr. De Alwis hold a Degree in Commerce and Management
(specialized in International Trade) from the University of
Sri Jayewardenepura and a National Diploma in Human Resources
Management from Institute of Personnel Management. He is also a
member of the Executive Committee of The Association of Human
Resources Professionals, Sri Lanka.
RIAD AMEEN
Legal Consultant
Mr. Riad Ameen functions as the Legal Consultant to Hemas Holdings
PLC. He holds a Bachelor’s Degree in Law (LLB) from the University
of London and a Master of Laws Degree (LLM) from the University of
Colombo. He is a Barrister of the Lincoln’s Inn, UK, and an Attorney-
at-Law. He has been associated with the Hemas Group for the past
6 years. Prior to that, Mr. Ameen was a state counsel in the Attorney
General’s Department for 7 years. Mr. Ameen has been an active civil
law practitioner for the past 14 years.
The Group Operating Committee also includes Husein Esufally,
Malinga Arsakularatne, Kishan Nanayakkara, Sanjeewa Samaranayake
and Kasturi Wilson.
MANAGEMENT REPORTS SUSTAINABILITY GOVERNANCE FINANCIAL REPORTS
GROUP OPERATING COMMITTEE

60 The Hemas Group. Enriching Lives
ANNUAL REPORT OF THE DIRECTORS Your Board of Directors takes pleasure in presenting the Ninth Annual
Report of the Board on the affairs of the Company and the Group
together with the Consolidated Financial Statements as at 31st
March 2012.
PRINCIPAL ACTIVITIES AND BUSINESS REVIEW
The principal activities of the Company, which are to invest in
and provide administrative services to the numerous companies
representing the Hemas Group, remain in place.
A detailed review of the Group’s activities and the development of its
business, together with an indication of likely future developments,
the main trends and factors likely to affect future performance and
a description of the principal risks and uncertainties it faces, are set
out on pages 14 to 50 which constitute the Sector reviews and Risk
Management review and form part of this Report. Information about
environmental matters, employees, social and community issues is
provided in the Company’s Sustainability Report available at 24 to 37.
SUBSIDIARIES AND JOINT VENTURES
Subsidiaries and Associates within the group are engaged in diverse
activities as described on page 119 of this Annual Report.
PROFIT AND APPROPRIATIONS
Details of the results and appropriations are given below:
DIVIDENDS
The Directors recommend that a final dividend of Rs. 128,822,655,
equivalent to Rs. 0.25 per ordinary share (2010/11 Rs. 128,010,155,
equivalent to Rs 0.25 per ordinary share) be paid on 10th July 2012
to those shareholders on the register of members at the close of
business on ex-dividend date. An interim dividend of
Rs. 128,822,655/-, equivalent to Rs. 0.25 per ordinary share was paid on
22nd November 2011, making a total for the year of Rs. 257,645,310
(2010/11 Rs. 255,457,810).
Prior to recommending the dividend and In accordance with Section
56(2) and (3) of the Companies’ Act No. 7 of 2007, the Board of
Directors signed a Certificate stating that, in their opinion, based
on available information, the Company will satisfy the solvency test
immediately after the distribution is made and have obtained a
certificate from the Auditors in terms of Section 57 of the Companies’
Act. Shareholder approval will be sought on the day of the AGM, to
declare and pay the dividend of Rs. 0.25 per share.
POST BALANCE SHEET EVENTS
No material events have taken place subsequent to the date of the
Balance Sheet which require an adjustment to or disclosure in the
Financial statements other than those described in note 33 to the
Accounts.
Group Company
2012 2011 2012 2011
Rs. ‘000 Rs. ‘000 Rs. ‘000 Rs. ‘000
Turnover 21,409,596 18,067,489 373,654 304,851
Profit and Appropriations
Profit earned before Interest and taxes 1,824,631 1,867,082 565,940 399,825
Interest paid (249,718) (297,737) (75,085) (52,136)
Profit before tax 1,574,913 1,569,345 490,855 347,689
Taxation (260,307) (214,154) (22,271) (9,369)
Profit after tax 1,314,606 1,355,191 468,584 338,320
Profit attributable to minority share holders (105,548) (145,032)
Profit attributable to parent 1,209,058 1,210,159 468,584 338,320
Other adjustments (116,643) (10,613) (629)
Amount available for appropriations 1,092,415 1,199,546 467,955 338,320
Appropriations
Final dividend -2010/2011 (128,010) (229,406) (128,010) (229,406)
Interim dividend -2011/2012 (128,823) (127,448) (128,823) (127,448)
Final Dividend recommended (128,823) (128,010) (128,823) (128,010)
Balance brought forward from previous years 6,359,604 5,516,911 4,077,851 4,096,385
Balance carried forward to next year 7,066,363 6,231,594 4,160,150 3,949,841

Annual Report 2011/12 61
SIGNIFICANT ACCOUNTING POLICIES
The accounting policies adopted are consistent with those applied
during the previous year.
A summary of the significant accounting policies adopted by the
Company and the Group are given in the Notes to the financial
statements on page 75.
In the process of applying accounting policies , the Company has
made assessments and assumptions apart from those involving
estimations, which have a significant effect on the amounts
recognized in the financial statements.
PROPERTY, PLANT AND EQUIPMENT
Total carrying amount of Property, Plant and Equipment of the Group as
at the date of the Balance sheet was Rs. 10,288,807 (2011 Rs. 7,457,601)
During the year under review, the Group acquired Property, Plant and
Equipment to the aggregate value of Rs. 1,580,502 (2011 Rs. 1,095,346)
INVESTMENT PROPERTIES
The fair value of investment property of the Company and the Group
as at the year end was Rs. 331,500 and Rs. 474,685 respectively. (2011
Rs. 309,965 and Rs. 1,309,965)
INVESTMENTS
Details of investments of the Company in its subsidiaries, joint
ventures and in equity securities are set out on pages 91 to 94 of this
Report.
RESERVES
Total Reserves of the Company and the Group as at the Balance Sheet
date amounted to Rs. 257,032 and Rs. 1,995,770 respectively. (2011
Rs. 257,032 and Rs. 1,045,976)
Movement in Reserves during the year is given in detail in the
“Statement of Changes in Equity” on pages 72 to 73.
DIRECTORS
Names and biographical details of the Directors who held Office at
the date of this report appear on pages 56 to 57.
APPOINTMENTS/RESIGNATIONS
Mr. R Gopalakrishnan was appointed to the directorate on 1st April
2012, to replace Mr. Divyaroop Bhatnagar, who resigned with effect
from 31st March 2012. An announcement in this regard was made to
the Colombo Stock Exchange in accordance with the requirements of
the Exchange and a press notice released to the public thereafter.
Rules about the appointment and replacement of directors are set
out in the Articles. Changes to the Articles must be approved by
shareholders by passing a special resolution.
RETIREMENT AND RE-ELECTION
In accordance with the 2008 Code of Best Practice, Messrs Imtiaz
Esufally and Pradipta Mohapatra, being the directors longest in
office will retire at the forthcoming Annual General Meeting of the
Company and offer themselves for re-election. A formal evaluation
process has been carried out during the course of the year in
respect of the directors offering themselves for re-election and
their performance continues to be effective and they continue to
demonstrate commitment to their roles.
As the Chairman is over 70 years of age, his reappointment is required
to be confirmed by the shareholders annually. A resolution seeking his
re appointment is set out in the ‘Notice of Meeting”.
Mr. R Gopalakrishnan who was appointed in April this year, will
retire in terms of Article 72 of the Articles of Association and seek re
election, with the unanimous support of the Board.
INDEMNITY
During the financial year ended 31st March 2012, the Company
provided indemnities to each of its Directors in accordance with the
provisions of the Company’s Articles of Association, providing for the
indemnification of Directors out of the assets of the Company to the
extent permitted by law. These indemnities constitute qualifying third-
party indemnities for the purposes of the Companies Act No. 7 of
2007 and remain in force at the date of approval of this Report.
REMUNERATION OF DIRECTORS
The Group’s remuneration framework is explained in detail in the
Remuneration Committee report appearing on page 51.
The total remuneration of the Directors during the year under
review amounted to Rs. 41,973,858 (2010/11 Rs. 36,474,240) Other
benefits received are indicated in detail in the notes to the Financial
Statements.
MANAGEMENT REPORTS SUSTAINABILITY GOVERNANCE FINANCIAL REPORTS

62 The Hemas Group. Enriching Lives
DIRECTORS’ INTERESTS AND THE INTEREST REGISTER
The relevant interest of each Director in the share capital of the
Company has been notified by the Directors to the Colombo Stock
Exchange in accordance with section 7.8 of the Listing Rules
and the relevant entries made in the Interest Register accordingly.
Directors’ share ownership details appear on page 122 under the
caption ”Share Information”.
BOARD COMMITTEES
The composition of Board and other Committees as at 31st March
2012, are given below:
Audit Committee
Mr. Maithri Wickremesinghe (Chairman)
Mr. Pradipta Mohapatra
Mr. Husein Esufally (by invitation)
Mr. Imtiaz Esufally (by invitation)
Mr. Malinga Arsakularatne (by invitation)
Remuneration Committee
Mr. Lalith De Mel (Chairman)
Mr. Maithri Wickremesinghe
Mr. Husein Esufally (by invitation)
Nominations Committee
Mr. Lalith De Mel (Chairman)
Mr. Pradipta Mohapatra
Mr. Husein Esufally
Other Committees
Board of Management
Mr. Husein Esufally (Chairman)
Mr. Murtaza Esufally
Mr. Imtiaz Esufally
Mr. Malinga Arsakularatne
Mr. Kishan Nanayakkara
Mr. Sanjeewa Samaranayake
Ms. Kasturi Chellaraja Wilson
Mr. Ranil De Silva
Group Operations Committee
Ms. Kasturi Chellaraja Wilson (Chair Person)
Mr. Husein Esufally
Mr. Malinga Arsakularatne
Mr. Kishan Nanayakkara
Mr. Sanjeewa Samaranayake
Mr. Ranil De Silva
Mr. Roy Joseph
Mr. Harith Perera
Ms. Indresh Fernando
Mr. Riad Ameen
Mr. Dimuth De Alwis
SHARE CAPITAL AND CONTROL
Details of the changes in the issued ordinary share capital of the
Company during the year are set out in note 15 to the Consolidated
Financial Statements. The Issued share capital as at 31st March
2012 was Rs. 1,600,602,534 divided into 515,290,620 shares. (2011
Rs.1,468,425,034/- divided into 512,040 620 shares )
The rights attached to the Company’s ordinary shares in addition to
those conferred on their holders by law, are set out in the Company’s
Articles of Association (the “Articles”), a copy of which can be obtained
on request from the Company Secretaries. The Articles contain certain
restrictions on the transfer of ordinary shares and on the exercise of
voting rights attached to them, including where the Company has
exercised its right to prohibit transfer following the omission of their
holder or any person interested in them to provide the Company with
information requested by it in accordance with the Companies Act
No. 7 of 2007.
SHARE INFORMATION
Information relating to the composition and distribution of
shareholders of the Company as at 31st March 2012 is given on pages
120 to 122 of this Report.
The percentage of shares held by the public was 28.51%
(2011 - 28.05%).
SUBSTANTIAL SHAREHOLDINGS
At 31st March 2012, the Company had been notified, pursuant to the
Disclosure and Transparency Rules of the Colombo Stock Exchange, of
the following significant voting rights in its ordinary share capital:
ANNUAL REPORT OF THE DIRECTORS

Annual Report 2011/12 63
Shareholder No of Shares
A Z Holdings (Pvt) Ltd 90,762,875
Saraz Investments (Pvt) Ltd 86,396,035
Blueberry Investments (Pvt) Ltd 85,781,250
Amagroup (Pvt) Ltd 85,780,665
Mr. I A H Esufally 6,132,500
Mr. H N Esufally 5,795,205
Mr. M A H Esufally 5,655,000
Mr. A N Esufally 1,992,085
RELATED PARTY TRANSACTIONS
Disclosures pertaining to related party transactions appear on page
116 whilst Directors’ interest in Contracts with the Company are
disclosed on pages 54 to 55.
No other transaction of significance had taken place that requires
disclosure in the report.
EMPLOYEE SHARE INCENTIVE SCHEMES
The Company’s employee share incentive schemes contain provisions
whereby, upon a change of control of the Company, outstanding
options and awards would vest and become exercisable either in part
or in full, at the discretion of the Grantee. Where shares are held in
trust, under a Trust Deed, the Trustees have the discretion to vote or
abstain from voting.
SHARE-BASED PLANS
The Remuneration Committee is responsible for reviewing
recommendations with respect to issues or grants under the
Company’s share-based plans. Directors approve issues or grants
under the plans only after being satisfied that this is in accordance
with the terms of shareholders’ approval.
EMPLOYEE SHARE PLAN
Details pertaining to the share options granted between the years
2003 and 2008, options exercised, shares cancelled and outstanding
as at the date of this report are tabulated below.
In the years 2003 and 2006, two employee share option schemes
were set up by the Company wherein 4,168,699 ordinary shares in the
Company were made available to the employees. However, in view
of the depressed stock market conditions, these schemes failed to
achieve the desired results.
A share ownership scheme was established by the Company in 2008,
with the intention that maintaining a proprietary interest and a long
term commitment amongst the senior directors and executives of the
Company and its subsidiaries on a continuing basis would facilitate
retention of key personnel and increase shareholder value.
During the year under review, a 3rd and final tranche of 3,250,000 in
the Employee Share Ownership scheme established in 2008 (Scheme
111) was issued to the Trustees, Messrs. Jacey Trust Services (Pvt) Ltd,
to be held in trust on behalf of the Grantees for a period of 3 years
from grant of options. The shares will be transferred to the eligible
employees at the end of the vesting period on 24th September 2014.
The vesting period pertaining to the 3,250,000 shares allocated under
the ESOS 2008 - Tranche 1, lapsed on 5th February 2012. The Grantees
Date of Grant Share
Options
granted
Share price Rs. Expiry date Shares
adjusted*
Shares
exercised
Shares lapsed Shares
outstanding
Scheme 1 Share Option Scheme 2003.
Tranche 1 01.04.04 1,558,850 50/- 31.03.06 68737 1,521,974 105,613
Tranche 2 01.07.04 732,500 31.03.07 126,175 831,175 27,500
Tranche 3 01.07.05 781,150 31.03.08 195,287 71050 905,387
Total 3,072,500 390,199 2,424,199 1.038,500
Scheme 11 Share Option Scheme-2006
Tranche 1 01.10.06 1,006,000 105/- 31.03.09 86,500 919,500
Scheme111 Share Ownership Scheme-2008
Tranche 1 06.02.09 650,000 62/- 05.08.12 2,600,000* - 3,250,000
Tranche11 27.12.10 2,250,000 44/09 26.06.13 2,250,000
Tranche 111 26.09.11 3,250,000 40/67 25.09.14 3,250,000
*Increase in shares consequent to a sub division.
MANAGEMENT REPORTS SUSTAINABILITY GOVERNANCE FINANCIAL REPORTS

64 The Hemas Group. Enriching Lives
have time until 5th August 2012 to deal with the shares allocated to
them in accordance with the Agreement signed with the Trustees.
FINANCIAL INSTRUMENTS
Information on the Group’s financial risk management objectives and
policies and on the exposure of the Group to relevant risks in respect
of financial instruments is set out under ‘Risk Management” on page
48 and in the notes to the Consolidated Financial Statements.
SUPPLIER PAYMENT POLICY
The Group’s operating companies are responsible for agreeing terms
and conditions under which business transactions with their suppliers
are conducted. Payments to suppliers are made in accordance with
those terms, provided that suppliers also comply with all relevant
terms and conditions. The Company is a holding company and does
not have any trade creditors.
CHARITABLE DONATIONS
During the year, the Group, through its subsidiaries, made charitable
donations in cash of Rs. 6,108,007 (2010/11 Rs. 9,665,268) Further
details of the Group’s charitable activities appear in the Sustainability
Report on pages 24 to 37.
COLLEAGUES
The Board seeks to instill high standards of customer care and service
in the Group and the commitment of every colleague to this business
requirement is considered to be critical. The Group has established
a framework of communication for colleagues concerning business
performance and Company benefits. Group-wide training reinforces
the Group’s commitment to colleague involvement and development.
The Group is committed to the principle of equal opportunity
in employment and to ensuring that no applicant or colleague
receives less favourable treatment on the grounds of gender, marital
status, race, ethnic origin, religion, disability, sexuality, age, or is
disadvantaged by conditions or requirements which cannot be
shown to be justified.
The Group applies employment policies which are fair and equitable
and which seek to promote entry into and progression within the
Group. Appointments are determined solely by application of job
criteria, personal ability and competency.
The Group gives full and fair consideration to applications for
employment made by disabled persons, having regard to their
particular aptitudes and abilities, wherever suitable opportunities exist
and training and career development support are provided, where
appropriate. Should a colleague become disabled when working
for the Group, efforts are made to continue their employment and
retraining is provided, if necessary.
A “whistle-blowing” policy and procedure is in place and has been
notified to all colleagues in the group. The policy enables them
to report any concerns on matters affecting the Group or their
employment, without fear of recrimination, and reduces the risk of
things going wrong or of malpractice taking place and remaining
unreported. In addition, the Group takes a zero-tolerance approach
to matters of discrimination, harassment and bullying in all aspects
of its business operations, whether they relate to sex, race, national
origin, disability, age, religion or sexual orientation and policies and
procedures are also in place for reporting and dealing with these
matters.
ENVIRONMENT
The Group recognises the importance of responsible environmental
management and its obligation to protect the environment. The
Group therefore gives high priority to all environmental matters.
Further information appears in the summary Sustainability Report
section of the Business Review. More detail is provided in the
Company’s Sustainability Report available on pages 24 to 37.
CORPORATE GOVERNANCE
The Company has complied with the Listing Rules of the Colombo
Stock Exchange and the Code of Best Practice on Corporate
Governance issued jointly by the Institute of Chartered Accountants
of Sri Lanka and the Securities and Exchange Commission of Sri Lanka.
The Company’ statement on Corporate Governance is included from
page 38 to 47 of this Report.
STATUTORY PAYMENTS
The Directors are satisfied that to the best of their knowledge and
belief, all dues to the Government and other Statutory Institutions
including employee related payments have been either paid or
adequately provided for in the financial statements.
ANNUAL REPORT OF THE DIRECTORS

Annual Report 2011/12 65
INDEPENDENT AUDITORS
Ernst & Young, External Auditors, have expressed their willingness
to continue in office in the ensuing year. A Resolution to re appoint
them and to authorise the Directors to determine their remuneration
will be proposed at the forthcoming Annual General Meeting of the
Company.
DISCLOSURE OF INFORMATION TO AUDITORS
Each of the Directors confirms that so far as he is aware, there is no
relevant audit information of which the Company’s auditors are
unaware and that he has taken all steps that he ought to have taken
as a Director in order to make himself aware of any relevant audit
information and to establish that the Company’s auditors are aware of
that information.
ANNUAL GENERAL MEETING
The Annual General Meeting of the Company for the financial year
ended 31st March 2012 will be held on Friday 29th June 2012 at the
Auditorium of the Chamber of Commerce, No 50 , Navam Mawatha,
Colombo 2 at 3.30 pm. The notice convening the Annual General
Meeting appears on page 125 of the Annual Report.
DECLARATION BY DIRECTORS
The Directors declare as follows:
That the Company has not engaged in any activity which
contravenes laws and regulations
That all material interests in contracts involving the Company
have been declared and they have refrained from voting on
matters in which they were materially interested
That the Company has made every endeavor to ensure the
equitable treatment of shareholders,
That they have conducted a review of the internal controls
covering financial, operational and compliance controls and
risk management and have obtained reasonable assurance of
their effectiveness and successful adherence therewith.
GOING CONCERN
After considering the financial position, operating conditions,
regulatory and other factors and such matters required to be
addressed in the Corporate Governance Code, the Directors have
a reasonable expectation that the Company possesses adequate
resources to continue in operation for the foreseeable future. For this
reason, they continue to adopt the Going Concern basis in preparing
the financial statements.
LIKELY DEVELOPMENTS
The Group’s objective during the next financial year will be to
maximise earnings and investment returns across all the business
units in its diversified portfolio.
Signed on behalf of the Board
Lalith de Mel Husein Esufally
Chairman CEO
Hemas Corporate Services (Pvt) Ltd
Secretaries
May 25, 2012
MANAGEMENT REPORTS SUSTAINABILITY GOVERNANCE FINANCIAL REPORTS

GROWING IN STRENGTH. ADDING VALUE.
FINANCIAL STATEMENTS
Statement of Directors’ Responsibilities 68
Auditors’ Report 69
Balance Sheet 70
Income Statement 71
Statement of Changes in Equity 72
Cash Flow Statement 74
Notes to the Financial Statements 75
Share Information 120
Five Year Summary 123
Glossary 124
Notice of Meeting 125
Form of Proxy 127

68 The Hemas Group. Enriching Lives
STATEMENT OF DIRECTORS’ RESPONSIBILITY FOR FINANCIAL REPORTING
In keeping with the provisions contained in the Companies’
Act No. 7 of 2007, the Directors of Hemas Holdings PLC
acknowledge their responsibility to prepare and present the
financial statements of both the Company and the Group.
The financial statements for the year ended 31st March 2012,
presented in this Report, have been prepared in compliance
with the requirements of the Sri Lanka Accounting Standards,
the Companies’ Act No. 7 of 2007 and the Listing Rules of
the Colombo Stock Exchange. The Directors consider that
appropriate Accounting Policies and Standards have been
applied and reasonable estimations made when preparing
the statements appearing on pages 75 to 119. A material
deviation, if any, from these Standards has been disclosed
where necessary.
The Directors confirm their responsibility for ensuring the
maintenance of proper books of account of the Company
and its subsidiaries which give a true and fair view of the state
of affairs of the Company and of the Group as at the balance
sheet date and that of the profit for the accounting period
ending on the balance sheet date. The financial reporting
structure is assessed at regular intervals by the Board and
through the Audit Committee. The views expressed by
the Audit Committee on the financial reporting system is
disclosed on page 52.
In conformity with the Companies’ Act No. 7 of 2007, the
Directors have caused a copy of the Annual Report to be sent
to every shareholder fifteen working days before the date
fixed for holding the Annual General Meeting. A copy of the
Financial Statements has also been delivered to the Registrar
General of Companies.
Adequate measures have been taken by the Board to
safeguard the assets of the Group. Internal checks, internal
audits and systems of internal control have been designed
and established to provide reasonable assurance that all
transactions are duly recorded so that misstatements, fraud
and other irregularities are either prevented or detected.
The External Auditors, Messrs Ernst & Young, were given every
opportunity to conduct evaluations and inspections of data
and financial records that were considered expedient for the
performance of their duties. Their opinion, appears on page 69
of this Report.
COMPLIANCE REPORT
The directors confirm that, to the best of their knowledge,
the financial statements prepared in accordance with the
applicable set of accounting standards, give a true and fair
view of the assets, liabilities, financial position and profit
of the Company and the Group taken as a whole and this
directors’ report contains a fair review of the development and
performance of the business and the position of the Company
and the Group taken as a whole, together with a description
of the principal risks and uncertainties that they face.
By Order of the Board
Hemas Corporate Services (Private) Limited
Secretaries
No. 75, Braybrooke Place,
Colombo 2.
May 25, 2012

Annual Report 2011/12 69
MANAGEMENT REPORTS SUSTAINABILITY GOVERNANCE FINANCIAL REPORTS
INDEPENDENT AUDITORS’ REPORT
TO THE SHAREHOLDERS OF HEMAS HOLDINGS PLC
Report on the Financial Statements
We have audited the accompanying financial statements of
Hemas Holdings PLC, the consolidated financial statements of
the Company and its subsidiaries which comprise the Balance
Sheets as at 31 March 2012, and the Income Statements,
Statements of Changes in Equity and Cash Flow Statements
for the year then ended, and a summary of significant
Accounting Policies and other explanatory notes.
Management’s Responsibility for the Financial Statements
Management is responsible for the preparation and fair
presentation of these financial statements in accordance with
Sri Lanka Accounting Standards. This responsibility includes
designing, implementing and maintaining internal control
relevant to the preparation and fair presentation of financial
statements that are free from material misstatements, whether
due to fraud or error, selecting and applying appropriate
Accounting Policies, and making accounting estimates that
are reasonable in the circumstances.
Scope of Audit and Basis of Opinion
Our responsibility is to express an opinion on these financial
statements based on our audit. We conducted our audit
in accordance with Sri Lanka Auditing Standards. Those
standards require that we plan and perform the audit to
obtain reasonable assurance whether the financial statements
are free from material misstatements.
An audit includes examining, on a test basis, evidence
supporting the amounts and disclosures in the financial
statements. An audit also includes assessing the accounting
policies used and significant estimates made by management,
as well as evaluating the overall financial statement
presentation.
We have obtained all the information and explanations which
to the best of our knowledge and belief were necessary for
the purposes of our audit. We therefore believe that our audit
provides a reasonable basis for our opinion.
Opinion
In our opinion, so far as appears from our examination, the
Company maintained proper accounting records for the year
ended 31 March 2012 and the financial statements give a true
and fair view of the Company’s state of affairs as at 31 March
2012 and its profit and cash flows for the year then ended in
accordance with Sri Lanka Accounting Standards.
In our opinion, the consolidated financial statements give a
true and fair view of the state of affairs as at 31 March 2012
and the profit and cash flows for the year then ended, in
accordance with Sri Lanka Accounting Standards, of the
Company and its subsidiaries dealt with thereby, so far as
concerns the shareholders of the Company.
Report on Other Legal and Regulatory Requirements
In our opinion, these financial statements also comply with
the requirements of Section 151(2) and Sections 153(2) to 153
(7) of the Companies Act No. 07 of 2007.
May 25, 2012
Colombo
INDEPENDENT AUDITORS’ REPORT

70 The Hemas Group. Enriching Lives
Group Company
As At 31 March Note 2012 2011 2012 2011 Rs. ‘000 Rs. ‘000 Rs. ‘000 Rs. ‘000
ASSETS Non-Current Assets Property, Plant and Equipment 3 10,288,807 7,457,601 106,461 105,305 Investment Properties 4 474,685 1,309,965 331,500 309,965 Leasehold Properties 5 55,713 58,779 - - Intangible Assets 6 300,409 323,895 - - Investment in Subsidiaries 7 - - 6,194,296 5,696,001 Investment in Joint Ventures 8 - - 38,519 38,519 Other Investments 9 384,148 433,676 114,008 114,008 Deferred Tax Assets 19 25,031 25,489 - - Loans Due from Related Parties 13 - - 15,000 15,000 Other Long Term Receivables 10 399,346 254,223 111,765 63,160 11,928,139 9,863,628 6,911,549 6,341,958
Current Assets Inventories 11 2,004,990 1,680,772 - - Trade and Other Receivables 12 6,038,471 4,365,024 295,246 113,028 Loans Due from Related Parties 13 - - 329,474 519,272 Other Investments 9 53 53 49 49 Tax Recoverable 134,306 148,020 585 - Amounts Due from Related Parties 14 - - 126,280 130,726 Short Term Cash Investments 23 1,614,034 2,025,097 8,800 210 Cash and Cash Equivalents 23 1,088,979 1,133,280 34,119 23,679 10,880,833 9,352,246 794,553 786,964 Total Assets 22,808,972 19,215,874 7,706,102 7,128,922 EQUITY AND LIABILITIES Equity Attributable to Equity Holders of the Parent Stated Capital 15 1,600,603 1,468,426 1,600,603 1,468,426 Reserves 16 1,995,771 1,045,976 257,032 257,032 Retained Earnings 7,195,185 6,359,604 4,288,973 4,077,851 Shareholders’ Funds 10,791,559 8,874,006 6,146,608 5,803,309 Minority Interests 2,145,976 1,701,635 - - Total Shareholders’ Funds and Minority Interests 12,937,535 10,575,641 6,146,608 5,803,309 Non-Current Liabilities Interest Bearing Loans and Borrowings 18 1,384,827 1,700,040 965,472 686,502 Deferred Tax Liabilities 19 161,309 123,609 40,056 42,022 Retirement Benefit Liability 20 248,342 230,298 30,551 18,676Other Non Current Liabilities 17 13,506 10,243 10,599 - 1,807,984 2,064,190 1,046,678 747,200
Current Liabilities Trade and Other Payables 21 5,171,603 4,093,092 82,241 40,139 Dividends Payable 6,071 12,798 2,553 1,932 Income Tax Liabilities 63,742 89,890 - 13,385 Amounts Due to Related Parties 22 - - 137,432 167,812 Interest Bearing Loans and Borrowings 18 936,458 991,266 290,590 321,640Bank Overdraft 23 1,885,579 1,388,997 - 33,505 8,063,453 6,576,043 512,816 578,413 Total Shareholders’ Funds, Minority Interests and Liabilities 22,808,972 19,215,874 7,706,102 7,128,922 These financial statements are in compliance with the requirements of the Companies Act No. 07 of 2007.
Malinga Arsakularatne Chief Financial Officer The Board of Directors is responsible for the preparation and presentation of these financial statements. Signed for and on behalf of the Board by,
Husein Esufally Lalith De Mel Chief Executive Officer Chairman The Accounting Policies and Notes on pages 75 through 119 form an integral part of these financial statements. Colombo May 25, 2012
BALANCE SHEET

Annual Report 2011/12 71
MANAGEMENT REPORTS SUSTAINABILITY GOVERNANCE FINANCIAL REPORTS
INCOME STATEMENT
Group Company
Year ended 31 March Note 2012 2011 2012 2011
Rs. ‘000 Rs. ‘000 Rs. ‘000 Rs. ‘000
Revenue 24 21,409,596 18,067,489 373,654 304,851
Cost of Sales (14,836,030) (12,228,702) - -
Gross Profit 6,573,566 5,838,787 373,654 304,851
Dividend Income 25 106 781 433,104 303,383
Change in Fair Value of Investment Properties 32,127 24,405 14,559 (20,445)
Other Income and Gains 26 144,358 108,830 7,923 5,575
Gain/ (Loss) on Disposal of Investments 27 (1,716) 3,317 (8,175) 234
Selling and Distribution Costs (1,793,789) (1,443,189) - -
Administrative Expenses (3,292,373) (2,792,086) (298,377) (241,136)
Finance Cost 28 (249,718) (297,737) (75,085) (52,136)
Finance Income 28 162,352 126,237 43,252 47,363
Profit Before Tax 29 1,574,913 1,569,345 490,855 347,689
Income Tax Expenses 30 (260,307) (214,154) (22,271) (9,369)
Profit for the Year 1,314,606 1,355,191 468,584 338,320
Attributable to:
Equity Holders of the Parent 1,209,058 1,210,159
Minority Interests 105,548 145,032
1,314,606 1,355,191
Rs. Rs.
Earnings Per Share 31 2.33 2.36
Dividends Per Share 32 0.50 0.70
The Accounting Policies and Notes on pages 75 through 119 form an integral part of these financial statements.

72 The Hemas Group. Enriching Lives
STATEMENT OF CHANGES IN EQUITY (GROUP)
A
ttri
bu
tab
le t
o E
qu
ity
Ho
lde
rs o
f th
e P
are
nt
R
ev
alu
ati
on
an
d O
the
r
Stat
ed
Ex
chan
ge
C
apit
al
Re
tain
ed
Min
ori
ty
Tota
l
Cap
ital
R
ese
rve
R
ese
rve
Ea
rnin
gs
Tota
l In
tere
sts
Equ
ity
R
s. ‘0
00
R
s. ‘0
00
R
s. ‘0
00
R
s. ‘0
00
R
s. ‘0
00
R
s. ‘0
00
R
s. ‘0
00
As
at
01
Ap
ril 2
01
0
1,3
69
,22
3
(2
9,9
71
) 8
35
,95
3
5,5
16
,91
1
7,6
92
,11
6
1,4
88
,10
4
9,1
80
,22
0
Pro
fit
for
the
Ye
ar
-
-
-
1,2
10
,15
9
1,2
10
,15
9
14
5,0
32
1
,35
5,1
91
Issu
e o
f o
rdin
ary
shar
es
un
de
r Em
plo
yee
Sh
are
Op
tio
ns
Sch
em
e
99
,20
3
-
-
-
99
,20
3
-
99
,20
3
Issu
e o
f P
refe
ren
ce s
har
es
-
-
10
1,2
50
-
1
01
,25
0
33
,75
0
13
5,0
00
Re
de
mp
tio
n o
f P
refe
ren
ce S
har
es
of
Join
t V
en
ture
Co
mp
any
-
-
-
(1
5,6
87
) (
15
,68
7)
-
(1
5,6
87
)
Div
ide
nd
s Pa
id -
Ord
inar
y Sh
are
s (2
01
0)
-
-
-
(3
56
,85
3)
(3
56
,85
3)
(4
4,3
22
) (
40
1,1
75
)
-
Pre
fere
nce
Sh
are
s o
f Jo
int
Ve
ntu
re C
om
pan
y -
-
-
(4
,18
3)
(4
,18
3)
(1
,39
4)
(5
,57
7)
Tran
sfe
r to
/fro
m d
uri
ng
th
e Y
ear
-
Ove
rhau
l, H
eat
Rat
e a
nd
Lu
be
Oil
Re
serv
es
-
-
42
,14
0
(4
2,1
40
) -
-
-
-
Re
valu
atio
n R
ese
rve
-
-
(
51
,39
7)
51
,39
7
-
-
-
Surp
lus
on
re
valu
atio
n
-
-
10
9,1
33
-
10
9,1
33
1
1,3
18
1
20
,45
1
Shar
es
Issu
ed
to
Min
ori
ty S
har
eh
old
ers
-
-
-
-
- 1
5,2
04
1
5,2
04
Ad
just
me
nt
in r
esp
ect
of
chan
ge
s in
Gro
up
Ho
ldin
g
-
-
-
-
-
53
,71
7
53
,71
7
Ne
t G
ain
/(Lo
ss)
Re
cog
nis
ed
Dir
ect
ly in
Eq
uit
y
-
De
ferr
ed
Inco
me
Tax
-
-
1
0,0
76
-
1
0,0
76
2
26
1
0,3
02
-
Exc
han
ge
Re
serv
e
-
2
8,7
92
-
-
2
8,7
92
-
28
,79
2
As
at
31
Ma
rch
20
11
1
,46
8,4
26
(
1,1
79
) 1
,04
7,1
55
6
,35
9,6
04
8
,87
4,0
06
1
,70
1,6
35
1
0,5
75
,64
1
Pro
fit
for
the
Ye
ar
-
-
-
1
,20
9,0
58
1
,20
9,0
58
1
05
,54
8
1,3
14
,60
6
Issu
e o
f o
rdin
ary
shar
es
un
de
r Em
plo
yee
Sh
are
Op
tio
ns
Sch
em
e
13
2,1
77
-
-
-
13
2,1
77
-
13
2,1
77
Re
de
mp
tio
n o
f P
refe
ren
ce S
har
es
of
Join
t V
en
ture
Co
mp
any
-
-
-
(
7,8
43
) (
7,8
43
) -
(7
,84
3)
Div
ide
nd
s Pa
id -
Ord
inar
y Sh
are
s
-
-
-
(
25
6,8
33
) (
25
6,8
33
) (
68
,31
3)
(
32
5,1
46
)
-
Pre
fere
nce
Sh
are
s o
f Jo
int
Ve
ntu
re C
om
pan
y -
-
-
(1
1,6
80
) (
11
,68
0)
(3
,77
7)
(1
5,4
57
)
Tran
sfe
r to
/fro
m d
uri
ng
th
e Y
ear
-
Ove
rhau
l Re
serv
e, H
eat
Rat
e a
nd
Lu
be
Oil
-
-
95
,39
6
(9
5,3
96
) -
-
-
-
Re
valu
atio
n R
ese
rve
-
-
(
80
5)
80
5
-
-
-
Surp
lus
on
re
valu
atio
n
-
-
95
5,1
01
-
9
55
,10
1
12
8,3
95
1,0
83
,49
6
Shar
es
Issu
ed
to
Min
ori
ty S
har
eh
old
ers
-
-
-
-
-
27
7,5
73
2
77
,57
3
Tran
sact
ion
co
st o
n Is
sue
of
shar
es
-
-
-
(
2,5
30
) (
2,5
30
) (
1,8
52
) (
4,3
82
)
Ad
just
me
nt
in r
esp
ect
of
chan
ge
s in
Gro
up
Ho
ldin
g
-
(
27
2)
-
-
(2
72
) 6
,76
7
6,4
95
Ne
t G
ain
/(Lo
ss)
Re
cog
nis
ed
Dir
ect
ly in
Eq
uit
y
-
De
ferr
ed
Inco
me
Tax
-
-
(
41
,41
4)
-
(
41
,41
4)
-
(
41
,41
4)
-
Exch
ang
e R
ese
rve
-
(5
8,2
11
) -
-
(
58
,21
1)
-
(
58
,21
1)
As
at
31
Ma
rch
20
12
1
,60
0,6
03
(
59
,66
2)
2,0
55
,43
3
7,1
95
,18
5
10
,79
1,5
59
2
,14
5,9
76
1
2,9
37
,53
5
The
Acc
ou
nti
ng
Po
licie
s an
d N
ote
s o
n p
age
s 7
5 t
hro
ug
h 1
19
form
an
inte
gra
l par
t o
f th
ese
fin
anci
al s
tate
me
nts
.

Annual Report 2011/12 73
MANAGEMENT REPORTS SUSTAINABILITY GOVERNANCE FINANCIAL REPORTS
Capital &
Stated Revenue Retained Total
Capital Reserve Earnings
Rs. ‘000 Rs. ‘000 Rs. ‘000 Rs. ‘000
As at 1 April 2010 1,369,223 257,032 4,096,385 5,722,640
Profit for the Year - - 338,320 338,320
Final Dividends Paid - 2009/2010 - - (229,406) (229,406)
Interim Dividends Paid - 2010/2011 - - (127,448) (127,448)
Issue of ordinary shares under Employee Share Options Scheme 99,203 - - 99,203
As at 31 March 2011 1,468,426 257,032 4,077,851 5,803,309
Profit for the Year - - 468,584 468,584
Final Dividends Paid - 2010/2011 - - (128,010) (128,010)
Interim Dividends Paid - 2011/2012 - - (128,823) (128,823)
Issue of ordinary shares under Employee Share Options Scheme 132,177 - - 132,177
Transaction cost of issue of shares - - (629) (629)
As at 31 March 2012 1,600,603 257,032 4,288,973 6,146,608
The Accounting Policies and Notes on pages 75 through 119 form an integral part of these financial statements.
STATEMENT OF CHANGES IN EQUITY (COMPANY)

74 The Hemas Group. Enriching Lives
CASH FLOW STATEMENT
Group Company
Year ended 31 March 2012 2011 2012 2011 Note Rs. ‘000 Rs. ‘000 Rs. ‘000 Rs. ‘000
Operating Activities Profit Before Taxation 1,574,913 1,569,345 490,855 347,689 Adjustments for Non Cash items Depreciation 3 635,469 619,976 24,638 17,460 Profit/(Loss) on Disposal of Property, Plant and Equipment (37,651) (30,651) 2,666 (3,560)Unrealised profits 7,427 - - -Change in Fair Value of Investment Properties 4 (32,127) (24,405) (14,559) 20,445 Amortisation/Impairment of Intangible assets 6 31,399 10,119 - - Amortisation of Leasehold Property 5 3,066 3,066 - - (Profit)/Loss on Sale of Non Current Investments 1,716 (3,495) 8,175 (234)Impairment of Non Current Investments - - 10,676 -Finance Cost 28 249,718 297,737 75,085 52,136 Investment Income 25 (106) (781) (433,104) (303,383)Retirement Benefit Plan 20 32,837 65,554 12,006 3,523 Exchange (Gain)/Loss on Foreign Currency Loans 90,649 18,656 - - Working Capital Adjustments (Increase)/Decrease in Trade and Other Receivables (1,678,951) (565,446) (182,218) (26,293)(Increase)/Decrease in Inventories (324,218) (136,212) - - (Increase)/Decrease in Amounts Due from Related Parties - - 4,446 83,365 (Increase)/ Decrease in Other Long Term Receivables (145,123) (77,158) (48,605) (33,068)Increase/(Decrease) in Amounts Due to Related Parties - - (30,380) 50,870 Increase/(Decrease) in Trade and Other Payables 1,080,696 805,027 53,322 (882)Finance Cost Paid 28 (249,718) (297,737) (75,085) (52,136)Income Tax Paid (276,877) (238,714) (38,208) (17,533)Gratuity Paid 20 (14,286) (20,219) (131) (1,873)Net Cash from/(Used in) Operating Activities 948,833 1,994,663 (140,421) 136,527 Investing Activities Purchase of Property, Plant and Equipment 3 (1,580,502) (1,095,346) (43,668) (71,468)Investment in Subsidiaries - - (520,083) (121,220)Investment in Intangible Assets 6 (1,146) (941) - - Other Investments (Net) 49,528 (369,403) - - Proceeds from Disposal of Property, Plant and Equipment 93,565 178,336 8,233 11,946 Proceeds from Disposal of Investments 3,174 57,452 2,937 474 Redemption of Preference Shares (7,843) (15,687) - - Investment Income Received 25 106 781 433,104 303,383 Net Cash from/(Used in) Investing Activities (1,443,118) (1,244,808) (119,477) 123,115 Financing Activities Interest Bearing Loans and Borrowings (Net) - Rupee Loan (963,870) 259,074 437,718 (88,189) - Foreign Currency Loans 449,060 228,837 - - Proceeds from Issue of Preference Shares - 135,000 - - Proceeds from Issue of Ordinary shares under ESOS 132,177 99,203 132,177 99,203 Transaction cost of Issue of ESOS shares (4,382) - (629) -Proceeds from Minority Shareholders 277,573 15,204 - - Dividends Paid - Ordinary Shares (335,649) (393,977) (256,833) (356,853) - Preference Shares of Joint Venture Company (11,680) (4,183) - - Net Cash from/(Used in) Financing Activities (456,771) 339,158 312,433 (345,839) Net Increase/(Decrease) in Cash and Cash Equivalents (951,056) 1,089,013 52,535 (86,198)Exchange Loss (890) (1,903) - - Cash and Cash Equivalents at the beginning of the Year 23 1,769,380 682,270 (9,616) 76,582 Cash and Cash Equivalents at the end of the Year 23 817,434 1,769,380 42,919 (9,616)
The Accounting Policies and Notes on pages 75 through 119 form an integral part of these financial statements.

Annual Report 2011/12 75
MANAGEMENT REPORTS SUSTAINABILITY GOVERNANCE FINANCIAL REPORTS
NOTES TO THE FINANCIAL STATEMENTS
1. CORPORATE INFORMATION
1.1 General
Hemas Holdings PLC is a public limited liability
company listed on Colombo Stock Exchange
incorporated and domiciled in Sri Lanka. The registered
office and the principal place of business is situated at
No. 75, Braybrooke Place, Colombo 02.
Hemas Holdings PLC does not have an identifiable
parent of its own.
1.2 Consolidated Financial Statements
The Consolidated financial statements of the Company
for the year ended 31 March 2012 comprise the Hemas
Holdings PLC (the ‘Company’) and all its Subsidiaries and
Joint Ventures whose accounts have been consolidated
therein (the ‘Group’).
1.3 Principal Activities and Nature of Operations
During the year, the principal activities of the Company
were carrying out investment activities, and providing
management and administration services to other
Companies in the group and the principal activities of
the Subsidiaries and Joint Ventures are disclosed in Note
38 to the financial statements.
1.4 Date of Authorisation for Issue
The Consolidated financial statements of Hemas
Holdings PLC for the year ended 31 March 2012 were
authorised for issue, in accordance with a resolution of
the Board of Directors on 25 May 2012.
2. GENERAL POLICIES
2.1 Basis of Preparation
The financial statements of the Group have been
prepared on an accrual basis and under the historical
cost convention basis unless stated otherwise. The
financial statements are presented in Sri Lankan Rupees,
which is the Group’s functional and presentation
currency and all values are rounded to the nearest
rupees thousand (Rs ‘000) except when otherwise
indicated.
2.1.1 Statement of Compliance
The financial statements of the Group have been
prepared in compliance with Sri Lanka Accounting
Standards (SLAS) issued by the Institute of Chartered
Accountants of Sri Lanka and the requirements of the
Companies Act No.7 of 2007.
2.1.2 Going Concern
The Directors have made an assessment of the
Company’s ability to continue as a going concern
and they do not intend either to liquidate or to cease
trading.
2.1.3 Basis of Consolidation
The financial statements of the Group represent the
consolidation of the financial statements of Hemas
Holdings PLC and all its subsidiaries and Joint ventures
as at 31 March 2012.
The financial statements of the subsidiaries are prepared
for the same reporting period as the parent company
and in compliance with the Group’s accounting policies
unless specifically stated.
All intra-group balances, income and expenses and
unrealised gains/losses resulting from intra-group
transactions, are eliminated in full.
(a) Subsidiaries
Subsidiaries are fully consolidated from the date
of acquisition or incorporation, being the date on
which the group obtains control and continue to be
consolidated until the date that such control ceases.
Subsidiaries are those enterprises controlled by the
parent. Control exists when the parent holds more than
50% at voting rights or otherwise has a controlling
interest.
Diethelm Travel The Maldives (Pvt) Ltd has been
consolidated as a subsidiary based on the power to
govern the financial and operating policies by the
parent.
The following subsidiaries have been incorporated
outside Sri Lanka.
Name/Country of incorporation Reporting
Currency
Hemas Consumer Brands (Pvt) Ltd
Bangladesh Taka (BDT)
Diethelm Travel The Maldives (Pvt) Ltd
Republic of Maldives US Dollar (USD)
Butama Hydro Electricity Company Limited
Republic of Uganda Uganda
Shilings

76 The Hemas Group. Enriching Lives
Minority Interests represent the portion of profit or
loss and net assets that is not held by the group and
are presented separately in the Consolidated Income
Statement and within equity in the consolidated
Balance Sheet, separately from parent shareholders’
equity.
(b) Joint Ventures
The Group has an interest in joint ventures which are
jointly controlled entities. A joint venture is a contractual
arrangement whereby two or more parties undertake
an economic activity that is subject to joint control,
and a jointly controlled entity is a joint venture that
involves the establishment of a separate entity in which
each venture has an interest. The Group recognises
its interest in the joint venture using proportionate
consolidation. The Group combines its share of each
of the assets, liabilities, income and expenses of the
joint venture with the similar items, line by line, in
its consolidated financial statements. The financial
statements of the joint ventures are prepared for the
same reporting year as the parent company except for
Hellman Worldwide Logistics (Private) Ltd where the
financial statements are prepared for 31 December
2011. All the material transactions are adjusted for the
3 months period ended 31 March 2012. Accounting
policies of the joint ventures are consistent with the
parent company.
The following Joint venture has been incorporated
outside Sri Lanka.
Country of incorporation Reporting Currency
HIF Logistics (Pvt) Ltd
Pakistan Pakistan Rupee (PKR)
(c) Business Combination and Goodwill
Business Combinations are accounted for using the
purchase method. This involves recognising identifiable
assets (including previously unrecognised intangible
assets) and liabilities (including contingent liabilities and
excluding future restructuring) of the acquired business
at fair value.
Goodwill acquired in a business combination represents
the excess of the cost of the business combination over
the Group’s interest in the net fair value of the acquirer’s
identifiable assets, liabilities and contingent liabilities.
Following initial recognition, goodwill is measured at
cost less any accumulated impairment losses.
2.1.4 Comparative Information
Previous year’s figures and phrases have been re-
arranged wherever necessary, to conform to the current
year’s presentation.
2.2 Changes In Accounting Policies
The Accounting Policies adopted are consistent with
those used in the previous year.
2.3 Significant Accounting Estimates and Assumptions
2.3.1 Judgments
In the process of applying the Group’s accounting
policies, management has made the following
judgments, apart from those involving estimations,
which has the most significant effect on the amounts
recognized in the financial statements.
Deferred Tax Assets
Deferred tax assets are recognised for all unused tax
losses to the extent that it is probable that taxable
profit will be available against which the losses can be
utilised. Significant management judgment is required
to determine the amount of deferred tax assets that can
be recognised, based upon the likely timing and level of
future taxable profits together with future tax planning
strategies.
Impairment of Goodwill
The Group determines whether goodwill is impaired
at least on an annual basis. This requires an estimation
of the “value in use” of the cash generating units to
which the goodwill is allocated. Estimating a value in
use amount requires management to make an estimate
of the expected future cash flows from the cash
generating unit and also to choose a suitable discount
rate in order to calculate present value of those cash
flows.
Fair Value of Unquoted Equity Investments
The unquoted equity instruments have been valued
based on the expected cash flows discounted at current
rates applicable for items with similar terms and risk
characteristics. This valuation requires the company
to make estimates about expected future cash flows
and discount rates, and hence they are subject to
uncertainty.
NOTES TO THE FINANCIAL STATEMENTS

Annual Report 2011/12 77
MANAGEMENT REPORTS SUSTAINABILITY GOVERNANCE FINANCIAL REPORTS
2.3.2 Estimates and Assumptions
The key assumptions concerning the future and other
key sources of estimation uncertainty at the Balance
Sheet date, that have a significant risk of causing a
material adjustments to the carrying amounts of
assets and liabilities within the next financial year are
discussed below. The respective carrying amounts of
assets and liabilities are given in related notes to the
financial statements.
Defined Benefit Plans
The cost of defined benefit plans-gratuity is determined
using actuarial valuations. The actuarial valuation
involves making assumptions about discount rates,
expected rates of returns on assets, futures salary
increases morality rates. Due to the long term nature
of these plans, such estimates are subject to significant
uncertainty. All assumptions are reviewed at each
reporting date.
2.4 Summary of Significant Accounting Policies
2.4.1 Foreign Currency Translation and Hedging
(a) Foreign currency transaction and balances.
All foreign exchange transactions are converted to
functional currency, at the rates of exchange prevailing
at the time the transactions are effected.
Monetary assets and liabilities denominated in
foreign currency are translated to functional currency
equivalents at the exchange rate prevailing at the
balance sheet date. Non-monetary assets and liabilities
are translated using exchange rates that existed when
the values were determined. The resulting gains and
losses are accounted for in the income statement.
(b) Foreign Operations
The Balance sheet and income statement of overseas
subsidiaries and joint ventures which are deemed to be
foreign operations are translated to Sri Lankan rupees at
the rate of exchange prevailing as at the balance sheet
date and at the average annual rate of exchange for the
period respectively.
The exchange differences arising on the translation are
taken directly to a separate component of equity. On
disposal of a foreign entity, the deferred cumulative
amount recognized in equity relating to that particular
foreign operation is recognized in the income
statement.
2.4.2 Taxation
a) Current Taxes
Current income tax assets and liabilities for the current
and prior periods are measured at the amount expected
to be recovered from or paid to the Commissioner
General of Inland Revenue. The tax rates and tax
laws used to compute the amount are those that are
enacted or substantively enacted by the Balance Sheet
date.
The provision for income tax is based on the elements
of income and expenditure as reported in the financial
statements and computed in accordance with the
provisions of the Inland Revenue Act.
b) Deferred Taxation
Deferred income tax is provided, using the liability
method, on all temporary differences at the Balance
Sheet date between the tax bases of assets and
liabilities and their carrying amounts for financial
reporting purposes.
Deferred income tax liabilities are recognised for all
taxable temporary differences except;
the initial recognition of an asset or liability in a
transaction that is not a business combination and,
at the time of the transaction, affects neither the
accounting profit nor taxable profit or loss; and
associated with investments in subsidiaries,
associates and interests in joint ventures, except
where the timing of the reversal of the temporary
differences can be controlled and it is probable that
the temporary differences will not reverse in the
foreseeable future.
Deferred income tax assets are recognised for all
deductible temporary differences, carry-forward
of unused tax credits and unused tax losses, to the
extent that it is probable that taxable profit will be
available against which the deductible temporary
differences, and the carry-forward of unused tax
credits and unused tax losses can be utilised except:
the deductible temporary difference arises from
the initial recognition of an asset or liability in a
transaction that is not a business combination and,

78 The Hemas Group. Enriching Lives
at the time of the transaction, affects neither the
accounting profit nor taxable profit or loss; and
associated with investments in subsidiaries,
associates and interests in joint ventures, deferred
tax assets are only recognised to the extent that it is
probable that the temporary differences will reverse
in the foreseeable future and taxable profit will be
available against which the temporary differences
can be utilised.
The carrying amount of deferred income tax assets is
reviewed at each Balance Sheet date and reduced to
the extent that it is no longer probable that sufficient
taxable profit will be available to allow all or part of the
deferred income tax asset to be utilised.
Deferred income tax assets and liabilities are measured
at the tax rates that are expected to apply to the year
when the asset is realised or the liability is settled, based
on tax rates (and tax laws) that have been enacted or
substantively enacted as at the Balance Sheet date.
Deferred income tax relating to items recognised
directly in equity is recognised in equity and not in the
Income Statement.
The movement in the deferred tax assets and liabilities
due to change in applicable rate have been charged to
the income statements in the current year.
Deferred tax assets and deferred tax liabilities are offset,
if a legally enforceable right exists to set off current
tax assets against current tax liabilities and when the
deferred taxes relate to the same taxable entity and the
same taxation authority.
c) Tax on dividend income
Tax on dividend income from subsidiaries is recognized
as an expense in the Consolidated Income Statement.
2.4.3 Borrowing Costs
Borrowing costs are recognised as an expense in the
period in which they are incurred, except to the extent
where borrowing costs that are directly attributable to
the acquisition, construction, or production of an asset
that takes a substantial period of time to get ready for
its intended use or sale, are capitalized as part of
that asset.
2.4.4 Intangible Assets (Other than Goodwill)
Intangible assets acquired separately are measured
on initial recognition at cost. The cost of intangible
assets acquired in a business combination is fair value
as at the date of acquisition. Following the initial
recognition of the intangible assets, the cost model
is applied requiring the assets to be carried at cost
less any accumulated amortisation and accumulated
impairment losses. Internally generated intangible
assets, excluding capitalised development costs are not
capitalised and expenditure is reflected in the Income
Statement in the year in which the expenditure is
incurred.
The useful lives of intangible assets are assessed to be
either finite or indefinite.
Intangible assets with finite lives are amortised over
the useful economic life and assessed for impairment
whenever there is an indication that the intangible
asset may be impaired. The amortisation period and the
amortisation method for an intangible asset with a finite
useful life is reviewed at least at each financial year end.
Changes in the expected useful life or the expected
pattern of consumption of future economic benefits
embodied in the asset is accounted for by changing
the amortisation period or method, as appropriate,
and treated as changes in accounting estimates. The
amortisation expense on intangible assets with finite
lives is recognised in the Income Statement in the
expense category consistent with the function/nature
of the intangible asset. Amortisation was commenced
when the assets were available for use.
Intangible assets with indefinite useful lives are tested
for impairment annually either individually or at the
cash generating unit level. Such intangibles are not
amortised. The useful life of an intangible asset with
an indefinite life is reviewed annually to determine
whether indefinite life assessment continues to be
supportable. If not, the change in the useful life
assessment from indefinite to finite is made on a
prospective basis.
Intangible assets that are not yet available for sale are
tested for impairments at each financial year end, even
if there is no indication that the asset is impaired.
Gains or losses arising from derecognition of an
intangible asset are measured as the difference
between the net disposal proceeds and the carrying
NOTES TO THE FINANCIAL STATEMENTS

Annual Report 2011/12 79
MANAGEMENT REPORTS SUSTAINABILITY GOVERNANCE FINANCIAL REPORTS
amount of the asset and are recognised in the Income
Statement when the asset is derecognized.
Research and Development Costs
Research costs are expensed as incurred. Intangible
assets arising from development expenditure on an
individual project is recognised only when the company
can demonstrate the technical feasibility of completing
the intangible assets so that it will be available for use
or sale, its intention to complete and its ability to use
or sell the assets, how the assets will generate future
economic benefits, the availability of resources to
complete the assets and the ability to measure reliably
the expenditure during the development.
During the period of development, the assets are
tested for impairment annually. Following the initial
recognition of the development expenditure, the
cost model is applied requiring the assets to be
carried at cost less any accumulated amortisation and
accumulated impairment losses. Amortisation of the
assets begins when development is completed and the
asset is available for use. It is amortised over the period
of expected future sales. During the period of which
the asset is not yet in use it is tested for impairment
annually.
2.4.5 Inventories
Inventories are valued at the lower of cost and net
realisable value, after making due allowances for
obsolete and slow moving items. Net realisable value
is the price at which inventories can be sold in the
ordinary course of business less the estimated cost of
completion and the estimated cost necessary to make
the sale.
The cost incurred in bringing inventories to its present
location and conditions are accounted using the
following cost formulae:-
Raw Materials - At actual cost on first-
in- first out/ weighted
average basis.
Foods and - At actual cost on
Beverages Stocks weighted average basis.
Finished Goods and - At cost of direct
Work-in Progress materials, direct labour
and an appropriate
proportion of fixed
production overheads
based on normal
operating capacity.
Consumables and Spares - At actual cost on first-in-
first out basis.
Goods-in-Transit and - At actual cost
Other Stocks
Medical Supplies - At actual cost on first-in-
first out basis.
2.4.6 Trade and Other Receivables
Trade receivables are stated at the amounts they are
estimated to realise net of allowances for bad and
doubtful receivables.
Other receivables and dues from Related Parties are
recognised at cost less allowance for bad and doubtful
receivables.
2.4.7 Cash and Cash Equivalents
Cash and cash equivalents are defined as cash in
hand, demand deposits and short term highly liquid
investments, readily convertible to known amounts
of cash and subject to insignificant risk of changes in
value.
For the purpose of cash flow statement, cash and cash
equivalents consist of cash in hand and deposits in
banks net of outstanding bank overdrafts. Investments
with short maturities i.e. three months or less from the
date of acquisition are also treated as cash equivalents.
2.4.8 Property, Plant and Equipment
a) Cost and Valuation
All items of Property, Plant and Equipment are initially
recorded at cost. Where items of Property, Plant and
Equipment are subsequently revalued, the entire
class of such assets is revalued. Revaluations are made
with sufficient regularity to ensure that their carrying
amounts do not differ materially from their fair values
at the Balance Sheet date. Subsequent to the initial
recognition as an asset at cost, revalued Property, Plant
and Equipment are carried at revalued amounts less any
subsequent depreciation thereon. All other Property,
Plant and Equipment are stated at historical cost less
accumulated depreciation and less accumulated
impairment in value.
When an asset is revalued, any increase in the carrying
amount is credited directly to a revaluation surplus
unless it reverses a previous revaluation decrease
relating to the same asset, which was previously
recognised as an expense. In these circumstances the
increase is recognised as income to the extent of the
previous write down. When an asset’s carrying amount

80 The Hemas Group. Enriching Lives
is decreased as a result of a revaluation, the decrease is
recognised as an expense unless it reverses a previous
increment relating to that asset, in which case it is
charged against any related revaluation surplus, to the
extent that the decrease does not exceed the amount
held in the revaluation surplus in respect of that same
asset. Any balance remaining in the revaluation surplus
in respect of an asset, is transferred directly to retained
earnings on retirement or disposal of the asset.
b) Restoration Costs
Expenditure incurred on repairs or maintenance of
Property, Plant and Equipment in order to restore
or maintain the future economic benefits expected
from originally assessed standard of performance, is
recognised as an expense when incurred.
c) Depreciation
Depreciation is calculated on a straight line method
over the useful life of all Property, Plant and Equipment
other than freehold land.
The principal annual rates used by the companies in the
Group are as follows:
Freehold Buildings 1.5% - 10%
Civil Construction at Plant -Thermal 10%
Civil Construction at Plant -Hydro 2%
Plant and Machinery 6% - 25%
Power Plant - Thermal 6.67%
Power Plant - Hydro 3%
Furniture and Fittings 7% - 25%
Office and Factory Equipments 10% - 33.33%
Computer Hardware and Software 25% - 33.33 %
Motor Vehicles 16.66% - 25%
Crockery and Cutlery 50% - 100%
Soil Erosion Prevention 5% - 10%
Buildings on Leasehold Land are depreciated over the
remaining lease period.
d) De-recognition
An item of Property, Plant and Equipment is
derecognised upon disposal or when no future
economic benefits are expected from its use or disposal.
Any gain or loss arising on derecognition of the asset
(calculated as the difference between the net disposal
proceeds and the carrying amount of the asset) is
included in the Income Statement in the year the asset
is derecognised.
2.4.9 Leased Property
Leasehold property comprising of land use rights
obtained on a long term basis, is stated at the recorded
carrying values as at the effective date of Sri Lanka
Accounting Standard 19 – Leases in line with Ruling
of the Urgent Issues Task Force of The Institute of
Chartered Accountants of Sri Lanka. Such carrying
amounts are amortized over the remaining lease term
or useful life of the leased property whichever is shorter.
2.4.10 Leases
(a) Finance Leases
Property, Plant and Equipment on finance leases, which
effectively transfer to the Group substantially all of the
risk and benefits incidental to ownership of the leased
item are capitalised at the inception of the lease at the
fair value of leased property or, if lower, at the present
value of minimum lease payments. Capitalized leased
assets are disclosed as Finance Leases under Property,
Plant and Equipment and depreciated over the period
the Group is expected to benefit from the use of the
leased assets.
The corresponding principal amount payable to
the lessor together with interest payable over the
period of lease is shown as a liability. Lease payments
are apportioned between the finance charges and
reduction of the lease liability so as to achieve a
constant rate of interest on the remaining balance
of the liability. The interest payable over the period
is transferred to an interest in suspense account. The
interest element of the rental obligations pertaining to
each financial year is charged to Income Statement over
the period of lease.
(b) Operating Leases
Leases where the lessor effectively retains substantially
all the risks and benefits of ownership over the leased
term, are classified as operating leases.
Lease rentals paid under operating leases are
recognised as an expense in the Income Statement on a
straight-line basis over the lease term.
2.4.11 Investments
Initial Recognition
Cost of investment includes purchase cost and
acquisition charges such as brokerages, fees, duties and
bank regulatory fees. The company distinguishes and
presents current and non current investment in the
Balance Sheet.
NOTES TO THE FINANCIAL STATEMENTS

Annual Report 2011/12 81
MANAGEMENT REPORTS SUSTAINABILITY GOVERNANCE FINANCIAL REPORTS
Measurement
a) Current Investments
Current investments are stated at lower of cost and
market value determined on an aggregate portfolio
basis. The cost of an investment is the cost of
acquisition inclusive of brokerage fees and stamp duty.
Unrealized gains and losses on current investments
carried at market value i.e. reduction to market value
and reversals of such reductions required to reflect
current investments at the lower of cost and market
value, are credited or charged to Income Statement.
b) Long Term Investments
Quoted and unquoted investments in shares held on a
long term basis are stated at cost.
The cost of the investment is the cost of acquisition
inclusive of brokerage fees, stamp duties and bank fees.
The carrying amount of long term investments is
reduced to recognise a decline other than temporary in
the value of investments, determined on an individual
investment basis.
In the Group’s financial statements, investments in
subsidiaries were accounted for in the equity method
until 31 March 2006. With effect from 1 April 2006 in
accordance with the revised SLAS 26 the investment
in Subsidiaries are accounted at the carrying value as
that date and any investment made after 1 April 2006
are carried at cost, net of any provision for other than
temporary diminution in value.
c) Other Investments
Treasury bills and other interest bearing securities held
for resale in the near future to benefit from short term
market movements are accounted for at cost plus
relevant proportion of the discounts or premiums.
d) Disposal of Investments
On disposal of an investment, the different between
net disposals and proceed and the carrying amount
is recognised as income or expense. Any revaluation
surplus related to disposed investments are transferred
to retained earnings.
2.4.12 Investment Property
Investment properties are measured initially at cost,
including transaction costs. The carrying amount
includes the cost of replacing part of an existing
investment property at the time that cost is incurred
if the recognition criteria are met; and excludes the
costs of day to day servicing of an investment property.
Subsequent to initial recognition, investment properties
are stated at fair value, which reflects market conditions
at the Balance Sheet date. Gains or losses arising from
changes in the fair values of investment properties are
included in the Income Statement in the year in which
they arise.
Investment properties are derecognised when either
they have been disposed off or when the investment
property is permanently withdrawn from use and no
future economic benefit is expected from its disposal.
Any gains or losses on the retirement or disposal of
an investment property are recognised in the Income
Statement in the year of retirement or disposal.
Transfers are made to investment property when,
and only when, there is a change in use, evidenced
by the end of owner occupation, commencement of
an operating lease to another party or completion of
construction or development. Transfers are made from
investment property when, and only when, there is a
change in use, evidenced by commencement of owner
occupation or commencement of development with a
view to sale.
The property occupied by the Group as an owner
occupied property becomes an investment property,
the group accounts for such property in accordance
with the policy stated under Property, Plant and
Equipment up to the date of change in use.
2.4.13 Impairment of Assets
The Group assesses at each reporting date whether
there is an indication that an asset may be impaired. If
any such indication exists, or when annual impairment
testing for an asset is required, the Group makes an
estimate of the asset’s recoverable amount. An asset’s
recoverable amount is the higher of an asset’s or
cash-generating unit’s fair value less costs to sell and
its value in use and is determined for an individual
asset or cash-generating unit, unless the asset or cash-
generating unit does not generate cash inflows that are
largely independent of those from other assets or cash-
generating units. Where the carrying amount of an asset
exceeds its recoverable amount, the asset is considered
impaired and is written down to its recoverable
amount. In assessing value in use, the estimated future
cash flows are discounted to their present value using
a pre-tax discount rate that reflects current market

82 The Hemas Group. Enriching Lives
assessments of the time value of money and the risks
specific to the asset. In determining fair value less costs
to sell, an appropriate valuation model is used. These
calculations are corroborated by valuation multiples,
quoted share prices for publicly traded subsidiaries or
other available fair value indicators.
Impairment losses of continuing operations are
recognised in the Income Statement in those expense
categories consistent with the function of the impaired
asset, except for property previously revalued where
the revaluation was taken to equity. In this case the
impairment is also recognised in equity up to the
amount of any previous revaluation.
For assets excluding goodwill, an assessment is made
at each reporting date as to whether there is any
indication that previously recognised impairment
losses may no longer exist or may have decreased. If
such indication exists, the Group makes an estimate
of recoverable amount. A previously recognised
impairment loss is reversed only if there has been a
change in the estimates used to determine the asset’s
recoverable amount since the last impairment loss
was recognised. If that is the case the carrying amount
of the asset is increased to its recoverable amount.
That increased amount cannot exceed the carrying
amount that would have been determined, net of
depreciation, had no impairment loss been recognised
for the asset in prior years. Such reversal is recognised
in the Income Statement unless the asset is carried at
revalued amount, in which case the reversal is treated as
a revaluation increase.
Goodwill is reviewed for impairment, annually or
more frequently if events or changes in circumstances
indicate that the carrying value may be impaired.
Impairment is determined for goodwill by assessing
the recoverable amount of the cash-generating unit (or
group of cash-generating units), to which the goodwill
relates. Where the recoverable amount of the cash-
generating unit (or group of cash-generating units) is
less than the carrying amount of the cash-generating
unit (group of cash-generating units) to which goodwill
has been allocated, an impairment loss is recognised.
Impairment losses relating to Goodwill cannot be
reversed in future periods.
2.4.14 Provisions
Provisions are recognized when the company has a
present obligation (legal or constructive) as a result
of a past event, where it is probable that an outflow
of resources embodying economic benefits will be
required to settle the obligation and a reliable estimate
can be made of the amount of the obligation. If the
effect of the time value of money is material, provisions
are determined by discounting the expected future
cash flows at a pre-tax rate that reflects current market
assessments of the time value of money and, where
appropriate, the risks specific to the liability.
2.4.15 Retirement Benefit Liability
a) Defined Benefit Plan - Gratuity
The Group measures the present value of the promised
retirement benefits of gratuity which is a defined
benefit plan with the advice of an actuary using the
projected benefit valuation method. Actuarial gains
and losses are recognised as income or expenses over
the expected average remaining working lives of the
participants of the plan.
However, as per the payment of Gratuity Act No. 12 of
1983 this liability only arises upon completion of 5 years
of continued service.
b) Defined Contribution Plans - Employees’ Provident Fund
and Employees’ Trust Fund
Employees are eligible for Employees’ Provident Fund
Contributions and Employees’ Trust Fund Contributions
in line with the respective statutes and regulations.
The Company contributes 12% and 3% of gross
emoluments of employees to Employees’ Provident
Fund and Employees’ Trust Fund respectively. Some
employees of the group are eligible for Mercantile
Services Provident Society fund, for which the group
contributes 12% of gross emoluments of employees.
2.4.16 Income Statement
Revenue Recognition
Revenue is recognised to the extent that it is probable
that the economic benefits will flow to the Company
and the revenue and associated costs incurred or
to be incurred can be reliably measured. Revenue is
measured at the fair value of the consideration received
or receivable net of trade discounts, value added taxes,
and other sales taxes and after eliminating intra-group
sales. The following specific criteria are used for the
purpose of recognition of revenue.
NOTES TO THE FINANCIAL STATEMENTS

Annual Report 2011/12 83
MANAGEMENT REPORTS SUSTAINABILITY GOVERNANCE FINANCIAL REPORTS
a) Sale of Goods
Revenue from sale of goods is recognised when the
significant risks and rewards of ownership of the goods
have passed to buyer; with the Group retaining neither
continuing managerial involvement to the degree
usually associated with ownership, nor effective control
over the goods sold.
b) Rendering of Services
Revenue from rendering of services is recognised in the
accounting period in which the services are rendered
or performed.
c) Energy Supplied
Revenue from energy supplied is recognised, upon
delivery of energy to Ceylon Electricity Board and
will be adjusted for capacity charge for Minimum
Guaranteed Energy Amount (MGEA) at the end of the
calendar year if there has been a curtailment. (Delivery
of electrical energy shall be completed when electrical
energy meets the specifications as set out in Power
Purchase Agreement (PPA) is received at the metering
point.)
d) Apartment and Food and Beverages Sales
Apartment revenue is recognised on the rooms
occupied on a daily basis, and food and beverages sales
are accounted for at the time of sales.
e) Interest
Interest Income is recognised on an accrual basis.
f ) Dividends
Dividend income is recognised on a cash basis (net of
dividend tax).
g) Rental Income
Rental income is recognised on an accrual basis. Rental
income arising on investment properties is accounted
for on a straight line basis over the lease terms.
h) Others
Other income is recognised on an accrual basis.
2.5 Business Segment Reporting
A business segment is a distinguishable component of
an enterprise that is engaged in providing an individual
product or service or a group of related products or
services that is subject to risk and returns that are
different from those of other business segments. The
accounting policies adopted for segment reporting are
the same accounting policies adopted for preparing
and presenting consolidated financial statements of the
Group. Inter segment transfers are based on fair market
prices.
2.6 Employees Share Option Plan (ESOP)/Share Option
Scheme (ESOS)
The Employee Share Option Plans (ESOP) were
approved by the shareholders of the Company in the
years 2003 and 2006, whereby the Company issued
a total of 4,468,699 Ordinary Shares to the senior
management and employees based on performance.
The options were required to be exercised between
the period 01 April 2004 and 31 March 2009. The two
schemes have however since lapsed.
In the year 2008, the Board recommended a further
3,000,000 shares by way of an Employee Share
Ownership Scheme (ESOS). The new scheme was
approved by the Members and came into effect on 9
December 2008.
The 1st tranche of 650,000 shares were issued to the
Trustees on 6 February 2009 at Rs. 62/- per share, on
behalf of the Senior Management. These shares will be
held in trust for the eligible employees unit such time as
the shares are transferred to them in terms of the ESOS
Trust – 2008.
The 2nd tranche of 2,250,000 shares were issued to the
trustees on 27 December 2010 at Rs.44.09 per share,
on behalf of the Senior Executives of the Group. These
shares will be held in trust for the eligible employees
until such time as the shares are transferred to them in
terms of the ESOS trust - 2008.
The 3rd tranche of 3,250,000 shares were issued to the
trustees on 26 September 2011 at 40.67 per share, on
behalf of the Senior Executives of the Group. These
shares will be held in trust for the eligible employees
until such time as the shares are transferred to them in
terms of the ESOS Trust -2008.
2.7 Sri Lanka Accounting Standards effective from 01
January 2012
The Group will be adopting the new Sri Lanka
Accounting Standards (new SLAS) comprising LKAS
and SLFRS applicable for financial periods commencing
from 01 January 2012 as issued by the Institute of
Chartered Accountants of Sri Lanka. The Group has
commenced reviewing its accounting policies and
financial reporting in readiness for the transition. As
the Group has a 31 March year end, priority has been

84 The Hemas Group. Enriching Lives
given to considering the preparation of an opening
balance sheet in accordance with the new SLASs as at
01 April 2011.This will form the basis of accounting for
the new SLASs in the future, and is required when the
Group prepares its first new SLAS compliant financial
statements for the year ending 31 March 2013. Set out
below are the key areas where accounting policies
will change and may have an impact on the financial
statements of the Group. The Group is in the process
of quantifying the impact on the financial statements
arising from such changes in accounting policies.
(a) SLFRS 1 – First Time Adoption of Sri Lanka Accounting
Standards requires the Group to prepare and present
opening new SLFRS financial statements at the date of
transition to new SLAS. The Group shall use the same
accounting policies in its opening new SLAS financial
statements and throughout all comparable periods
presented in its first new SLAS financial statements.
(b) LKAS 1 – Presentation of Financial Statements requires
an entity to present, in a statement of changes in
equity, all owner changes in equity. All non owner
changes in equity are required to be presented in
one statement of comprehensive income or in two
statements (a separate income statement and a
statement of comprehensive income). Components
of comprehensive income are not permitted to be
presented in the statement of changes in equity. This
standard also requires the Group to disclose information
that enables users of its financial statements to evaluate
the entity’s objectives, policies and processes for
managing capital.
(c) LKAS 16 – Property Plant and Equipment requires a
Group to initially measure an item of property plant
and equipment at cost, using the cash price equivalent
at the recognition date. If payment is deferred beyond
normal credit terms, the difference between the cash
price equivalent and the total payment is recognized as
interest over the period, unless such interest is capitalized
in accordance with LKAS 23 Borrowing Costs.
All site restoration costs including other environmental
restoration and similar costs must be estimated and
capitalised at initial recognition, in order that such costs
can be depreciated over the useful life of the asset.
This standard requires depreciation of assets over
their useful lives, where the residual value of assets
is deducted to arrive at the depreciable value. It also
requires that significant components of an asset be
evaluated separately for depreciation.
(d) LKAS 32 – Financial Instruments: Presentation, LKAS 39
– Financial Instruments: Recognition and Measurement
and SLFRS 7 – Disclosures will result in changes to the
current method of recognizing financial assets, financial
liabilities and equity instruments. These standards will
require measurement of financial assets and financial
liabilities at fair value at initial measurement. The
subsequent measurement of financial assets classified
as fair value through profit and loss and available for
sale will be at fair value, with the gains and losses routed
through the statements of comprehensive income and
other comprehensive income respectively.
Financial assets classified as held to maturity and loans
and receivables will be measured subsequently at
amortized cost. These assets will need to be assessed
for any objective evidence of impairment as a result
of one or more events that occurred after the initial
recognition of the asset (a ‘loss event’) coupled with a
reliable estimate of the loss event (or events) impact on
the estimated future cash flows of the financial asset or
group of financial assets . As such the current method
of assessing for impairment will have to be changed to
meet the requirements of these new standards.
Financial liabilities will be either classified as fair value
through profit or loss or at amortized cost. At present,
the company/group does not identify, categorise
and measure financial assets and liabilities as per
the requirements of the standard and also does not
recognise certain derivative instruments on the balance
sheet.
(e) SLFRS 2 – Share Based Payments, will require the Group
to reflect in its profit or loss and financial position the
effects of share based payment transactions, including
expenses associated with share options granted to
employees. An entity is required to recognize share
based payment transactions when goods are received
or services obtained based on the fair value of goods
or services or the fair value of equity instruments
granted. Hence the company will be required to
determine the fair value of options issued to employees
as remuneration and recognize an expense in the
statement of financial performance. This standard is not
limited to options and extends to all forms of equity
based remuneration and payments.
(f ) SLFRS 3 – Business combinations will require the Group
to apply this standard to transactions and other events
that meet the new definition of a business i.e. an
integrated set of assets(inputs) and activities( processes)
NOTES TO THE FINANCIAL STATEMENTS

Annual Report 2011/12 85
MANAGEMENT REPORTS SUSTAINABILITY GOVERNANCE FINANCIAL REPORTS
which are capable of being conducted and managed to
provide a return, as opposed to a mere asset acquisition.
Under the new acquisition method of accounting,
in addition to recognizing and measuring in its
financial statements the identifiable assets acquired
and liabilities assumed the standard also requires
recognition and measurement of any non-controlling
interest in the acquiree and re-measuring to fair value
any previously held interests which could have an
impact on the recognition of goodwill. Subsequent to
the acquisition of control any acquisitions or disposals
of non-controlling interest without loss of control will
be accounted for as equity transactions and cannot be
recognized as profit/loss on disposal of investments in
the statement of financial performance.
(g) LKAS 23 – Borrowing Cost, the Group must capitalize
borrowing costs in relation to a qualifying asset.
(h) LKAS 12 – Income Tax requires deferred tax to be
provided in respect of temporary differences which will
arise as a result of adjustments made to comply with
the new SLAS.
(i) LKAS 18 – Revenue requires the Group to measure
revenue at fair value of the consideration received
or receivable. It also specifies recognition criteria
for revenue, and the Group needs to apply such
recognition criteria to the separately identifiable
components of a single transaction in order to reflect
the substance of the transaction.
(j) IFRIC 4 – Determining whether an arrangement
contains a lease provides guidance for determining
whether such arrangements are, or contain, leases that
should be accounted for in accordance with LKAS 17
based on the assessment of whether fulfilment of the
arrangement is dependent on the use of a specific asset
or assets and the arrangement conveys a right to use
the asset, provided the fulfilment of the arrangement is
dependent on the use of a specific asset.
(k) IFRIC 12 – Service Concession Arrangements gives
guidance on the accounting by operators for public-
to-private service concession arrangements where
the grantor controls or regulates what services the
operator must provide with the infrastructure, to
whom it must provide them, and at what price and
the grantor controls -through ownership, beneficial
entitlement or otherwise-any significant residual
interest in the infrastructure at the end of the term of
the arrangement.
(l) LKAS 17- Leases applies to agreements that transfer
the right to use assets even though substantial services
by the lessor may be called for in connection with the
operation or maintenance of such assets. A finance
lease is a lease that transfers substantially all the risks
and rewards incidental to the ownership of an asset.
A lease is classified as an operating lease if it does not
transfer substantially all the risks and rewards incidental
to the ownership.
(m) IFRIC 15 Agreements for Construction of Real Estate -
This interpretation clarifies whether LKAS 18, ‘Revenue’
or LKAS 11 ‘Construction contracts’ should be applied
to particular transactions. It also explains the point at
which revenue and related expenses from a sale of
real estate unit should be recognized, if an agreement
between a developer and a buyer is reached before the
construction of the real estate unit is completed. The
company’s/ group’s current accounting policy for all
residential property sales is to recognize revenue on the
percentage completion of construction, which practice
is most likely to be changed by the application of IFRIC
15. As per this interpretation, contracts which do not
fall within the definition of construction contracts
in accordance with LKAS 11, can only be accounted
for under the percentage of completion method
if the company/group continuously transfer to the
buyer control and the significant risks and rewards of
ownership of the work in progress in its current state of
construction progresses.
(n) SIC 27 – Evaluating the substance of transactions
involving the legal form of a lease
The Institute of Chartered Accountants of Sri Lanka
has resolved an amendment to Sri Lanka Accounting
Standard 10, whereby the provision contained in
paragraphs 30 and 31 of SLAS 10 – Accounting Policies,
Changes in Accounting Estimates and Errors, would
not be applicable for financial statements prepared in
respect of financial periods commencing before
1 January 2012 and hence the impact of this transition
is not required to be disclosed in these financial
statements.

86 The Hemas Group. Enriching Lives
3 PROPERTY, PLANT AND EQUIPMENT
Balance Additions/ Balance As at Charge Revaluations Transfers Disposals As at 01.04.2011 31.03.2012 Rs.’000 Rs.’000 Rs.’000 Rs.’000 Rs.’000 Rs.’000
3.1 GroupGross Carrying AmountAt Cost/Cost incurred since last RevaluationFreehold Land 194,436 152,019 - (186,638) - 159,817Freehold Buildings 1,834,934 32,090 - (1,861,681) - 5,343Civil construction 336,062 199,890 - - - 535,952Buildings on Leasehold Land 104,570 426,301 - (529,419) (1,452) -Plant and Machinery 3,783,765 334,532 - - (24,819) 4,093,478Furniture and Fittings 504,514 267,701 - 2,083 (82,621) 691,677Office and Factory Equipment 795,845 110,255 - (292) (30,616) 875,192Computer Hardware and Software 405,531 58,350 - (1,497) (45,934) 416,450Motor Vehicles 475,003 99,455 - (6,600) (88,753) 479,105Revertment 19,109 3,096 - - - 22,205Capital Work-In-Progress 242,298 735,790 - (834,255) (3,903) 139,930 8,696,067 2,419,479 - (3,418,299) (278,098) 7,419,149
At ValuationFreehold Land 473,681 - 721,938 420,118 - 1,615,737Freehold Buildings 991,108 - 309,147 1,346,411 - 2,646,666Buildings on Leasehold Land 240,327 - 52,411 1,393,549 - 1,686,287Capital Work-In-Progress 36,112 - - (36,112) - - 1,741,228 - 1,083,496 3,123,966 - 5,948,690
Assets on Finance LeaseMotor Vehicles 14,060 3,500 - 6,600 (4,063) 20,097Total Gross Carrying Amount 10,451,355 2,422,979 1,083,496 (287,733) (282,161) 13,387,936
Accumulated Depreciation At Cost/Cost incurred since last Revaluation Freehold Buildings 147,464 54,950 - (199,774) - 2,640Civil construction 10,252 6,484 - - - 16,736Plant and Machinery 1,632,123 263,501 - - (19,592) 1,876,032Furniture and Fittings 247,306 66,769 - 2,115 (59,310) 256,880Office and Factory Equipment 259,337 97,011 - (338) (24,138) 331,872Computer Hardware and Software 346,308 40,205 - (1,483) (36,554) 348,476Motor Vehicles 254,085 55,397 - (2,017) (65,738) 241,727Revertment 12,177 851 - - - 13,028 2,909,052 585,168 - (201,497) (205,332) 3,087,391
At ValuationFreehold Buildings 18,433 34,707 - (53,140) - -Buildings on Leasehold Land 54,320 13,950 - (68,270) - - 72,753 48,657 - (121,410) - -
Assets on Finance Lease
Motor Vehicles 11,949 1,821 - 2,017 (4,049) 11,738Total Accumulated Depreciation 2,993,753 635,646 - (320,890) (209,381) 3,099,129
Net Carrying Amount At Cost 5,787,015 - - - - 4,331,758At Valuation 1,668,475 - - - - 5,948,690Assets on Finance Lease 2,111 - - - - 8,359 7,457,601 - - - - 10,288,807
NOTES TO THE FINANCIAL STATEMENTS
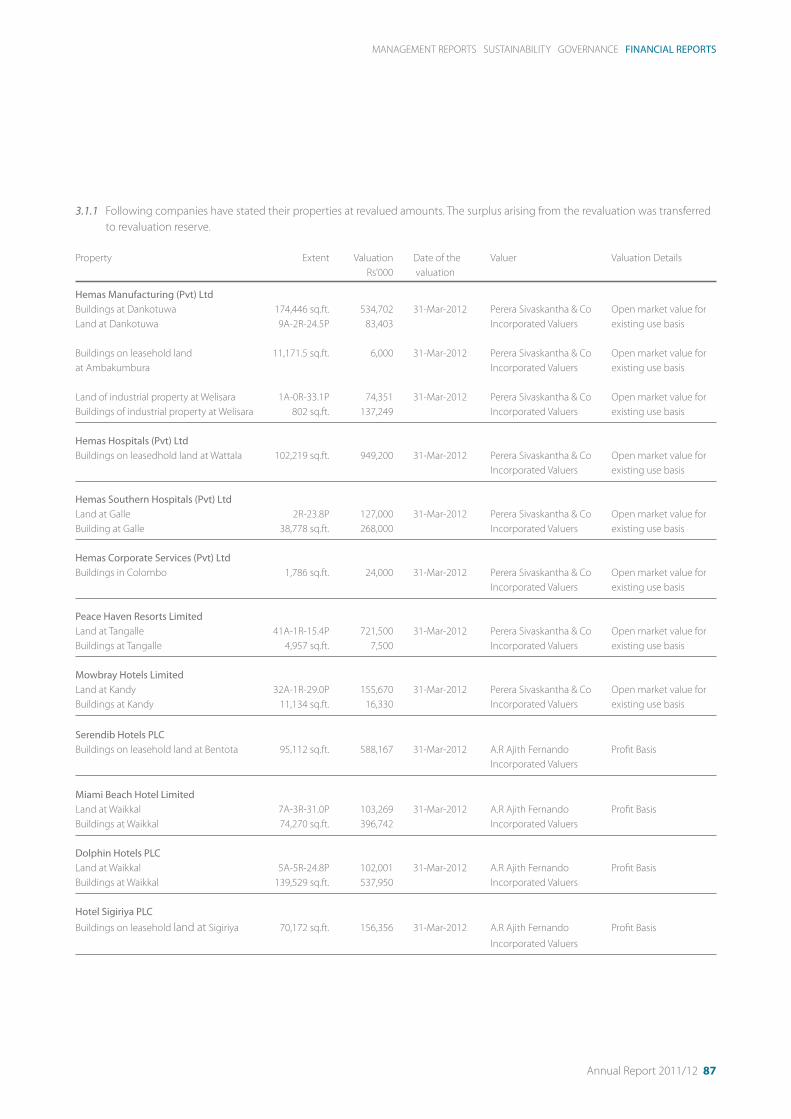
Annual Report 2011/12 87
MANAGEMENT REPORTS SUSTAINABILITY GOVERNANCE FINANCIAL REPORTS
3.1.1 Following companies have stated their properties at revalued amounts. The surplus arising from the revaluation was transferred
to revaluation reserve.
Property Extent Valuation Date of the Valuer Valuation Details
Rs’000 valuation
Hemas Manufacturing (Pvt) Ltd
Buildings at Dankotuwa 174,446 sq.ft. 534,702 31-Mar-2012 Perera Sivaskantha & Co Open market value for
Land at Dankotuwa 9A-2R-24.5P 83,403 Incorporated Valuers existing use basis
Buildings on leasehold land 11,171.5 sq.ft. 6,000 31-Mar-2012 Perera Sivaskantha & Co Open market value for
at Ambakumbura Incorporated Valuers existing use basis
Land of industrial property at Welisara 1A-0R-33.1P 74,351 31-Mar-2012 Perera Sivaskantha & Co Open market value for
Buildings of industrial property at Welisara 802 sq.ft. 137,249 Incorporated Valuers existing use basis
Hemas Hospitals (Pvt) Ltd
Buildings on leasedhold land at Wattala 102,219 sq.ft. 949,200 31-Mar-2012 Perera Sivaskantha & Co Open market value for
Incorporated Valuers existing use basis
Hemas Southern Hospitals (Pvt) Ltd
Land at Galle 2R-23.8P 127,000 31-Mar-2012 Perera Sivaskantha & Co Open market value for
Building at Galle 38,778 sq.ft. 268,000 Incorporated Valuers existing use basis
Hemas Corporate Services (Pvt) Ltd
Buildings in Colombo 1,786 sq.ft. 24,000 31-Mar-2012 Perera Sivaskantha & Co Open market value for
Incorporated Valuers existing use basis
Peace Haven Resorts Limited
Land at Tangalle 41A-1R-15.4P 721,500 31-Mar-2012 Perera Sivaskantha & Co Open market value for
Buildings at Tangalle 4,957 sq.ft. 7,500 Incorporated Valuers existing use basis
Mowbray Hotels Limited
Land at Kandy 32A-1R-29.0P 155,670 31-Mar-2012 Perera Sivaskantha & Co Open market value for
Buildings at Kandy 11,134 sq.ft. 16,330 Incorporated Valuers existing use basis
Serendib Hotels PLC
Buildings on leasehold land at Bentota 95,112 sq.ft. 588,167 31-Mar-2012 A.R Ajith Fernando Profit Basis
Incorporated Valuers
Miami Beach Hotel Limited
Land at Waikkal 7A-3R-31.0P 103,269 31-Mar-2012 A.R Ajith Fernando Profit Basis
Buildings at Waikkal 74,270 sq.ft. 396,742 Incorporated Valuers
Dolphin Hotels PLC
Land at Waikkal 5A-5R-24.8P 102,001 31-Mar-2012 A.R Ajith Fernando Profit Basis
Buildings at Waikkal 139,529 sq.ft. 537,950 Incorporated Valuers
Hotel Sigiriya PLC
Buildings on leasehold land at Sigiriya 70,172 sq.ft. 156,356 31-Mar-2012 A.R Ajith Fernando Profit Basis
Incorporated Valuers

88 The Hemas Group. Enriching Lives
3.1.2 Exchange gain
Additions/ Depreciation charge for the year to property, plant and equipment include exchange differences arising from the
translation of foreign currency balances to Sri Lankan rupees.
Additions Charge for
the year
Rs.’000 Rs.’000
Plant and machinery 17 4
Equipment, furniture and fittings 778 173
795 177
Balance Additions/ Transfers Disposal Balance
As At Charge As at
01.04.2011 31.03.2012
Rs.’000 Rs.’000 Rs.’000 Rs.’000 Rs.’000
3.2 Company
At Cost
Roadways 6,976 - (6,976) - -
Furniture and Fittings 17,193 16,233 - (10,038) 23,388
Office Equipment 11,050 5,692 - (4,132) 12,610
Computer Hardware and Software 84,214 6,502 - - 90,716
Motor Vehicles 91,772 15,241 - (6,290) 100,723
Total Value of Assets 211,205 43,668 (6,976) (20,460) 227,437
Depreciation
At Cost
Furniture and Fittings 7,397 2,588 - (3,575) 6,410
Office Equipment 8,050 789 - (2,604) 6,235
Computer Hardware and Software 74,766 7,114 - - 81,880
Motor Vehicles 15,687 14,147 - (3,383) 26,451
Total Depreciation 105,900 24,638 - (9,562) 120,976
01.04.2011 31.03.2012
Rs.’000 Rs.’000
Net Book Values
At Cost 105,305 106,461
4 INVESTMENT PROPERTIES
Group Company
2012 2011 2012 2011
Rs. ‘000 Rs. ‘000 Rs. ‘000 Rs. ‘000
Investment Properties at Fair Value at the
Beginning of the Year 1,309,965 1,261,410 309,965 330,410
Change in Fair Value of Investment
Properties during the Year 32,127 48,555 14,559 (20,445)
Transfers (867,407) - 6,976 -
Investment Properties at Fair Value at the End of the Year 474,685 1,309,965 331,500 309,965
NOTES TO THE FINANCIAL STATEMENTS

Annual Report 2011/12 89
MANAGEMENT REPORTS SUSTAINABILITY GOVERNANCE FINANCIAL REPORTS
4.1 Details of Investment Properties
Property Extent Valuation Date of the Valuer Valuation Details
Rs’000 valuation
Hemas Holdings PLC
Freehold property at Welisara 285,000 31-Mar-2012 Perera Sivaskantha & Co Open market value for
Land 1A-3R-8P Incorporated Valuers existing use basis
Building 66,340 sq.ft.
Freehold property at Handala 46,500 31-Mar-2012 Perera Sivaskantha & Co Open market value for
Land 2R-4.13P Incorporated Valuers existing use basis
Building 2,960 sq.ft.
Hemas Developments (Pvt) Ltd.
Freehold property at Baybrook Place 1,139,000 31-Mar-2012 Perera Sivaskantha & Co Income basis
Land 1R-10P Incorporated Valuers
Building 99,372 sq.ft.
The significant assumptions used by the valuer are as follows
Growth in future rentals 12%
Anticipated maintenance cost 55%
Discount rate 6%
4.2 Hemas Holdings PLC and Hemas Developments (Pvt) Ltd have stated their properties at fair value. The gain arising from the
fair valuation was recognised in the Consolidated Income Statement, except for 87% of the Investment Property of Hemas
Development (Pvt) Ltd which was reclassified to Property, Plant & Equipment in the Consolidated Balance Sheet following the
commencement of owner occupation by the group subsidiaries from 01 April 2011 which is the date of the change in use of the
property. Hence the respective gain was transfered to revaluation reserve.
5 LEASEHOLD PROPERTIES
Group
2012 2011
Rs. ‘000 Rs. ‘000
Cost/Valuation
Balance at the Beginning of the Year 76,838 76,838
Balance at the End of the Year 76,838 76,838
Amortisation
Balance at the beginning of the Year 18,059 14,993
Amortised during the Year 3,066 3,066
Balance at the end of the Year 21,125 18,059
Carrying Value at the End of the Year 55,713 58,779
5.1 Details of Investment Properties
Property Extent Lease period Value
Rs’000
Hemas Manufacturing (Pvt) Ltd
Land at Attmbakumbura 5A - 1R - 23.47P 21 Years 17,333
Serendib Hotels PLC
Land at Bentota 2A - 0R - 6P 50 Years 35,736
1A - 0R - 37P 30 Years
Hotel Sigiriya PLC
Land at Sigiriya 8A - 0R - 16P 30 Years 2,644

90 The Hemas Group. Enriching Lives
6 INTANGIBLE ASSETS
Group
2012 2011
Rs. ‘000 Rs. ‘000
6.1 Non Current
Goodwill 187,296 201,194
Brands 111,686 119,864
Development Expenses 1,427 2,837
300,409 323,895
6.1.1 Goodwill
Balance at the Beginning of the Year 201,194 201,194
Addition on changing in percentage holding 6,767 -
Impairment during the Year (20,665) -
Balance at the End of the Year 187,296 201,194
6.1.2 Brands
Balance at the Beginning of the Year 119,864 126,658
Impairment/Written Off during the Year (8,178) (6,794)
Balance at the End of the Year 111,686 119,864
6.1.3 Development Expenses
Balance at the Beginning of the Year 2,837 5,221
Acquired during the year 1,146 941
Amortiztion during the Year (2,556) (3,325)
Balance at the End of the Year 1,427 2,837
6.2 Hemas Group and its Subsidiaries annually carry out an impairment test on all its intangible assets. Impairment tests are carried
out as follows:
Goodwill - The business acquisition to which the goodwill is attributable is valued based on the earnings
growth method. Assumptions applied in such computations are reviewed each year.
Brands - Brands are valued based on the earnings growth method, and assumptions applied are
reviewed each year.
Development Expenses - These include all expenditure attributable to the intangible asset during its development
stage. The technical feasibility of completing the project/ product and the business case for
future economic benefits are reassessed each year.
6.3 Acquisition goodwill on ACX International (Pvt) Ltd was fully impaired taking into the Consideration the remaining recoverable
amount after the disposal of 51% group stake during year.
NOTES TO THE FINANCIAL STATEMENTS

Annual Report 2011/12 91
MANAGEMENT REPORTS SUSTAINABILITY GOVERNANCE FINANCIAL REPORTS
7 INVESTMENT IN SUBSIDIARIES
Company Holding Company
2012 2011 2012 2011
% % Rs. ‘000 Rs. ‘000
7.1 Non-Quoted Investments
ACX International (Pvt) Ltd. - 100% - 21,788
Butama Hydro Electricity Company Ltd. 1% - - -
Discover the World Marketing (Pvt) Ltd. 100% 100% 4,666 4,666
Exchange & Finance Investments (Pvt) Ltd. 100% 100% 9,412 9,412
Far Shipping Lanka (Pvt) Ltd. 100% 100% 3,000 3,000
Forbes Air Services (Pvt) Ltd. 100% 100% 62,452 62,452
Hemas Air Services (Pvt) Ltd. 100% 100% 64,687 64,688
Hemas Aviation (Pvt) Ltd. 100% 100% 1,910 1,910
Hemas Corporate Services (Pvt) Ltd. 100% 100% 39,891 39,891
Hemas Developments (Pvt) Ltd. 73% 73% 632,316 632,316
Hemas Foods (Pvt) Ltd. 100% 100% 24,845 24,846
Hemas Hospitals (Pvt) Ltd. 74% 74% 1,128,785 877,564
Hemas Manufacturing (Pvt) Ltd. 100% 100% 509,904 509,905
Hemas Marketing (Pvt) Ltd. 100% 100% 192,600 192,600
Hemas Pharmaceuticals (Pvt) Ltd. 100% 100% 213,331 213,331
Hemas Surgicals and Diagnostics (Pvt) Ltd. 100% 100% 23,956 23,957
Hemas Transportation (Pvt) Ltd. 100% 100% 300 300
Hemas Travels (Pvt) Ltd. 100% 100% 91,359 91,359
Hemtours (Pvt) Ltd. 100% 100% 209,912 209,912
Leisure Asia Investments Ltd. 100% 100% 398,795 257,559
Mowbray Hotels Ltd. 89% 89% 46,201 46,201
Peace Haven Resorts Ltd. 95% 95% 336,455 336,455
Vishwa BPO (Pvt) Ltd. 100% 100% 10,000 10,000
4,004,777 3,634,109
7.2 Quoted Investments
Hemas Power PLC 75% 75% 1,941,137 1,941,137
Serendib Hotels PLC 22.4% 22.4% 248,101 120,755
Dolphin Hotels PLC - - 281 -
Total 6,194,296 5,696,001
8 INVESTMENT IN JOINT VENTURES
Company Holding Company
2012 2011 2012 2011
% % Rs. ‘000 Rs. ‘000
Hellmann Worldwide Logistics (Pvt) Ltd. 49% 49% 8,475 8,475
HIF Logistics (Pvt) Ltd. 49% 49% 30,044 30,044
ACX International (Pvt) Ltd. 49% - 10,676 -
49,195 38,519
Less: Impairment of investments (10,676) -
38,519 38,519
The Company disposed 51% of shares in ACX International (Pvt) Ltd on 12 August 2011 and will be treated as a joint venture.
The Group divested its stake in Solas Lanka (Pvt) Ltd on 30 June 2011.

92 The Hemas Group. Enriching Lives
8.1 Proportionate Interest In Joint Ventures
Aggregate amounts of Group’s proportionate share of Heladhanavi Ltd (47%), HIF Logistics (Pvt) Ltd (49%) , Skynet Worldwide
Express (Private) Ltd. (49%) and Hellmann Worldwide Logistics (Pvt) Ltd, (49%), ACX International (Pvt) Ltd (49%) included in the
Group financial statements are as follows:
Group
2012 2011
Rs. ‘000 Rs. ‘000
Balance Sheet
a) Current Assets 2,096,507 1,247,403
b) Non Current Assets 1,399,577 1,578,192
c) Current Liabilities 2,142,078 1,325,816
d) Non Current Liabilities 179,778 360,759
Income Statement
e) Revenue 4,477,903 3,238,914
f ) Net Profit 185,610 244,925
9 OTHER INVESTMENTS
Group Company
2012 2011 2012 2011
Rs. ‘000 Rs. ‘000 Rs. ‘000 Rs. ‘000
Non-current
Investments in Equity Securities (Note: 9.1.1/9.2.1) 384,114 384,127 114,008 114,008
Investment In Treasury Bonds 34 49,549 - -
384,148 433,676 114,008 114,008
Current
Investment in Equity Securities (Note: 9.1.2/9.2.2) 53 53 49 49
Total Carrying Value of Other Investments 384,201 433,729 114,057 114,057
No. of Shares Carrying Value Market Value
2012 2011 2012 2011 2012 2011
Rs. ‘000 Rs. ‘000 Rs. ‘000 Rs. ‘000
9.1 Group
9.1.1 Investments in Equity Securities
Non-current
a) Quoted
Blue Diamond Jewellers PLC 1,300 1,300 4 4 8 2
Eden Hotels Lanka PLC 127 127 1 1 4 4
Galadari Hotels PLC 2,000 2,000 19 19 39 44
Kotmale Holdings PLC 40,000 40,000 400 400 1,580 990
Lankem Ceylon PLC 1,500 1,500 14 14 270 602
Mercantile Shipping PLC 424,323 424,323 53,603 53,603 72,559 48,797
Overseas Realty (Ceylon) PLC 1,000 1,000 10 10 13 16
Royal Palm Beach Hotels PLC 85 85 1 1 5 6
Total Investment in Quoted
Equity Securities 54,052 54,052 74,478 50,461
NOTES TO THE FINANCIAL STATEMENTS

Annual Report 2011/12 93
MANAGEMENT REPORTS SUSTAINABILITY GOVERNANCE FINANCIAL REPORTS
Carrying Value Directors’ Value
2012 2011 2012 2011
Rs. ‘000 Rs. ‘000 Rs. ‘000 Rs. ‘000
b) Non-quoted
Rainforest Ecology (Pvt) Ltd. 10,000 10,000 10,000 10,000
SLFFA Cargo Services Ltd. 188 201 188 201
Jada Resort & Spa (Pvt) Ltd 319,874 319,874 319,874 319,874
Total Investment in Non-Quoted Equity Securities 330,062 330,075 330,062 330,075
Total Equity Investments (Group - Non Current) 384,114 384,127 404,540 380,536
No. of Shares Carrying Value Market Value
2012 2011 2012 2011 2012 2011
Rs. ‘000 Rs. ‘000 Rs. ‘000 Rs. ‘000
9.1.2 Investments in Equity Securities - Current
a) Quoted
John Keells Holdings PLC 726 726 49 49 150 207
Total Investments in Quoted
Equity Securities 49 49 150 207
No. of Shares Carrying Value Directors’ Value
2012 2011 2012 2011 2012 2011
Rs. ‘000 Rs. ‘000 Rs. ‘000 Rs. ‘000
b) Non-quoted
Coca Cola Beverages Sri Lanka Ltd. 100 100 5 5 5 5
Glaxo Ceylon Ltd. 150 150 4 4 4 4
Carsons Marketing Ltd. 100 100 2 2 2 2
Millars Ltd 500 500 24 24 24 24
Less: Provision for fall in Value (31) (31) (31) (31)
Total Investments in Non-Quoted
Equity Securities 4 4 4 4
Total Equity Investments
(Group- Current) 53 53 154 211
No. of Shares Carrying Value Market Value
2012 2011 2012 2011 2012 2011
Rs. ‘000 Rs. ‘000 Rs. ‘000 Rs. ‘000
9.2 Company
9.2.1 Investment in Equity Securities - Non Current
a) Quoted
Overseas Realty (Ceylon) PLC 500 500 5 5 7 8
Kotmale Holdings PLC 40,000 40,000 400 400 1,580 2,140
Mercantile Shipping PLC 424,323 424,323 53,603 53,603 72,559 80,621
54,008 54,008 74,146 82,769
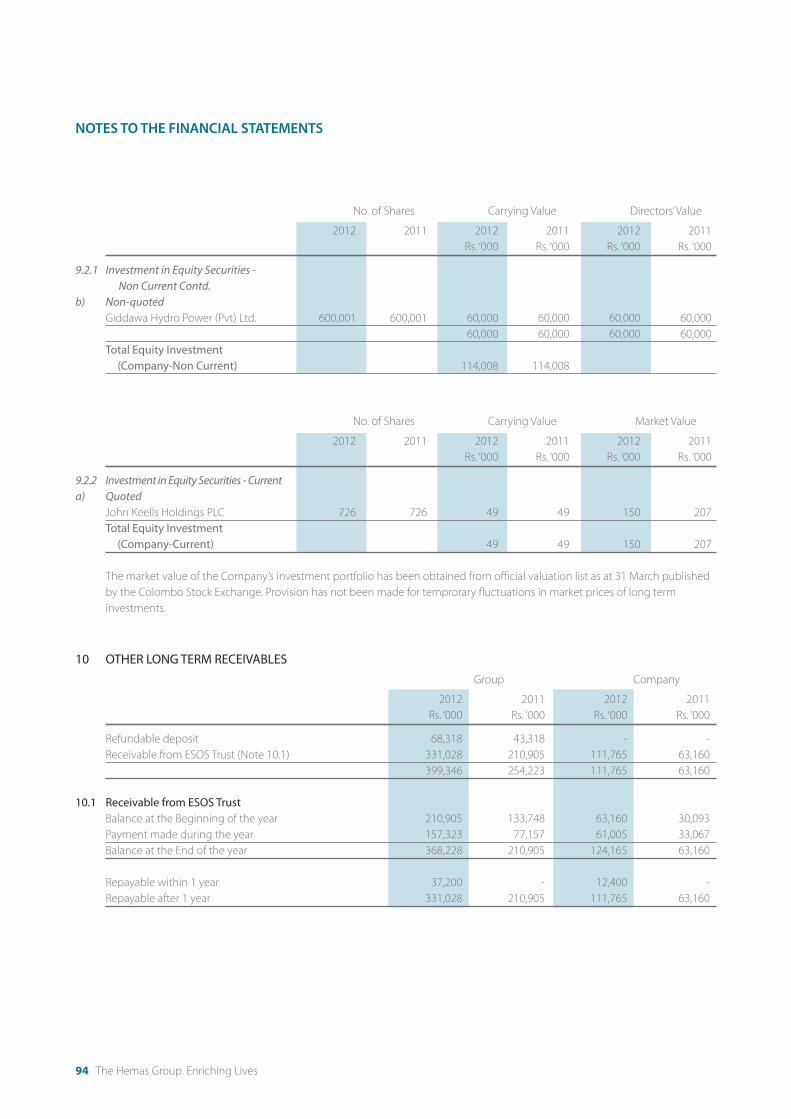
94 The Hemas Group. Enriching Lives
No. of Shares Carrying Value Directors’ Value
2012 2011 2012 2011 2012 2011
Rs. ‘000 Rs. ‘000 Rs. ‘000 Rs. ‘000
9.2.1 Investment in Equity Securities -
Non Current Contd.
b) Non-quoted
Giddawa Hydro Power (Pvt) Ltd. 600,001 600,001 60,000 60,000 60,000 60,000
60,000 60,000 60,000 60,000
Total Equity Investment
(Company-Non Current) 114,008 114,008
No. of Shares Carrying Value Market Value
2012 2011 2012 2011 2012 2011
Rs. ‘000 Rs. ‘000 Rs. ‘000 Rs. ‘000
9.2.2 Investment in Equity Securities - Current
a) Quoted
John Keells Holdings PLC 726 726 49 49 150 207
Total Equity Investment
(Company-Current) 49 49 150 207
The market value of the Company’s investment portfolio has been obtained from official valuation list as at 31 March published
by the Colombo Stock Exchange. Provision has not been made for temprorary fluctuations in market prices of long term
investments.
10 OTHER LONG TERM RECEIVABLES
Group Company
2012 2011 2012 2011
Rs. ‘000 Rs. ‘000 Rs. ‘000 Rs. ‘000
Refundable deposit 68,318 43,318 - -
Receivable from ESOS Trust (Note 10.1) 331,028 210,905 111,765 63,160
399,346 254,223 111,765 63,160
10.1 Receivable from ESOS Trust
Balance at the Beginning of the year 210,905 133,748 63,160 30,093
Payment made during the year 157,323 77,157 61,005 33,067
Balance at the End of the year 368,228 210,905 124,165 63,160
Repayable within 1 year 37,200 - 12,400 -
Repayable after 1 year 331,028 210,905 111,765 63,160
NOTES TO THE FINANCIAL STATEMENTS

Annual Report 2011/12 95
MANAGEMENT REPORTS SUSTAINABILITY GOVERNANCE FINANCIAL REPORTS
11 INVENTORIES
Group
2012 2011
Rs. ‘000 Rs. ‘000
Raw Materials 254,309 312,798
Work in Progress 40,170 37,801
Finished Goods and Other Stocks 1,701,876 1,406,401
Goods in Transit 65,590 -
2,061,945 1,757,000
Less: Provision for Obsolete Stocks (56,955) (76,228)
2,004,990 1,680,772
12 TRADE AND OTHER RECEIVABLES
Group Company
2012 2011 2012 2011
Rs. ‘000 Rs. ‘000 Rs. ‘000 Rs. ‘000
Trade Debtors
Related Parties (12.1) - - 117,456 81,786
Others 3,338,060 2,901,322 1,685 2,171
Ceylon Electricity Board 1,532,730 603,958 - -
Less: Provision for Doubtful Debts (103,227) (50,449) (500) (500)
4,767,563 3,454,831 118,641 83,457
Other Debtors
Related Parties (12.2) - - 60,025 8,152
Others 589,611 594,853 5,888 2,752
Receivable from ESOS Trust (Note 10.1) 37,200 - 12,400 -
Advances and Prepayments 585,970 299,869 89,726 11,476
Less: Provision for Doubtful Debts (4,986) (45,301) - -
5,975,358 4,304,252 286,680 105,837
Loans to Company Officers (12.3) 63,113 60,772 8,566 7,191
6,038,471 4,365,024 295,246 113,028

96 The Hemas Group. Enriching Lives
12.1 Trade Dues from Related Parties
Company
2012 2011
Relationship Rs. ‘000 Rs. ‘000
Hemas Pharmaceuticals (Pvt) Ltd. Subsidiary 23,040 19,567
Hemas Corporate Services (Pvt) Ltd. Subsidiary 469 466
Vishwa BPO (Pvt) Ltd. Subsidiary 34 -
Hemas Travels (Pvt) Ltd. Subsidiary 1,681 1,578
Hemas Power PLC Subsidiary 127 805
Hemas Air Services (Pvt) Ltd. Subsidiary 4,814 467
Hemas Aviation (Pvt) Ltd. Subsidiary 46 44
Exchange & Finance Investments (Pvt) Ltd. Subsidiary 6 -
Hemtours (Pvt) Ltd. Subsidiary 27 27
Hemas Southern Hospitals (Pvt) Ltd. Subsidiary 4,958 3,576
Hemas Hospitals (Pvt) Ltd. Subsidiary 1,893 4,191
Hemas Surgicals & Diagnostics (Pvt) Ltd Subsidiary 178 -
Hemas Manufacturing (Pvt) Ltd. Subsidiary 29,161 7,283
Forbes Air Services (Pvt) Ltd. Subsidiary 41,038 34,761
ACX International (Pvt) Ltd. Joint Venture 219 68
Hemas Developments (Pvt) Ltd. Subsidiary 43 90
Diethelm Travel Lanka (Pvt) Ltd. Subsidiary 458 386
Heladhanavi Ltd. Joint Venture 90 90
Giddawa Hydro Power (Pvt) Ltd. Subsidiary 3 3
Peace Haven Resorts (Pvt) Ltd. Subsidiary 11 -
Serendib Leisure Management (Pvt) Ltd. Subsidiary 821 3,718
Serendib Hotels PLC Subsidiary 2,223 88
Hellmann Worldwide Logistics (Pvt) Ltd. Joint Venture 114 114
Far Shipping Lanka (Pvt) Ltd. Subsidiary 763 878
N-able (Pvt) Ltd. Subsidiary 5,167 3,533
Sky Net Worldwide Express (Pvt) Ltd. Joint Venture 72 53
117,456 81,786
NOTES TO THE FINANCIAL STATEMENTS
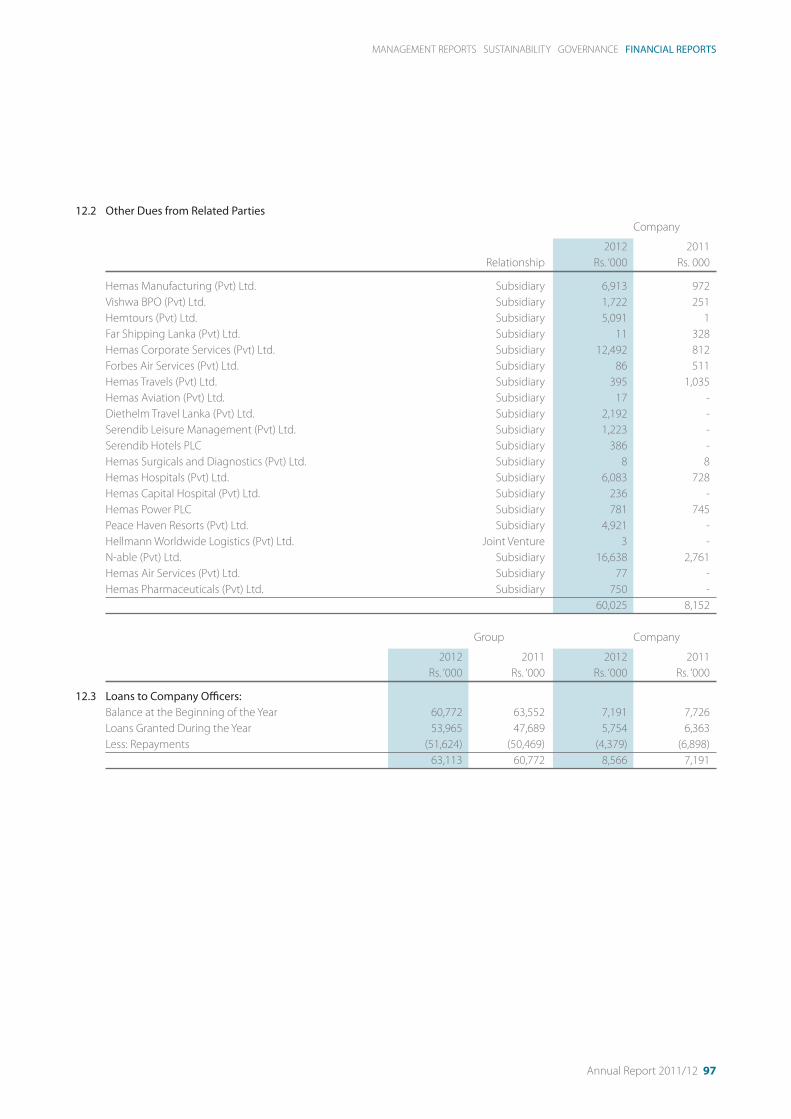
Annual Report 2011/12 97
MANAGEMENT REPORTS SUSTAINABILITY GOVERNANCE FINANCIAL REPORTS
12.2 Other Dues from Related Parties
Company
2012 2011
Relationship Rs. ‘000 Rs. 000
Hemas Manufacturing (Pvt) Ltd. Subsidiary 6,913 972
Vishwa BPO (Pvt) Ltd. Subsidiary 1,722 251
Hemtours (Pvt) Ltd. Subsidiary 5,091 1
Far Shipping Lanka (Pvt) Ltd. Subsidiary 11 328
Hemas Corporate Services (Pvt) Ltd. Subsidiary 12,492 812
Forbes Air Services (Pvt) Ltd. Subsidiary 86 511
Hemas Travels (Pvt) Ltd. Subsidiary 395 1,035
Hemas Aviation (Pvt) Ltd. Subsidiary 17 -
Diethelm Travel Lanka (Pvt) Ltd. Subsidiary 2,192 -
Serendib Leisure Management (Pvt) Ltd. Subsidiary 1,223 -
Serendib Hotels PLC Subsidiary 386 -
Hemas Surgicals and Diagnostics (Pvt) Ltd. Subsidiary 8 8
Hemas Hospitals (Pvt) Ltd. Subsidiary 6,083 728
Hemas Capital Hospital (Pvt) Ltd. Subsidiary 236 -
Hemas Power PLC Subsidiary 781 745
Peace Haven Resorts (Pvt) Ltd. Subsidiary 4,921 -
Hellmann Worldwide Logistics (Pvt) Ltd. Joint Venture 3 -
N-able (Pvt) Ltd. Subsidiary 16,638 2,761
Hemas Air Services (Pvt) Ltd. Subsidiary 77 -
Hemas Pharmaceuticals (Pvt) Ltd. Subsidiary 750 -
60,025 8,152
Group Company
2012 2011 2012 2011
Rs. ‘000 Rs. ‘000 Rs. ‘000 Rs. ‘000
12.3 Loans to Company Officers:
Balance at the Beginning of the Year 60,772 63,552 7,191 7,726
Loans Granted During the Year 53,965 47,689 5,754 6,363
Less: Repayments (51,624) (50,469) (4,379) (6,898)
63,113 60,772 8,566 7,191

98 The Hemas Group. Enriching Lives
13 LOANS DUE FROM RELATED PARTIES
Company
2012 2011
Relationship Rs. ‘000 Rs. ‘000
Non-Current
Hemas Corporate Services (Pvt) Ltd . Subsidiary 15,000 15,000
15,000 15,000
Current
Hemas Pharmaceuticals (Pvt) Ltd. Subsidiary 27,717 98,717
Hemas Corporate Services (Pvt) Ltd . Subsidiary 5,340 -
HIF Logistics (Pvt) Ltd. Joint Venture 123 6,000
Hemas Surgical and Diagnostics (Pvt) Ltd. Subsidiary - 1,000
Hemas Hospitals (Pvt) Ltd. Subsidiary 175,895 237,895
Diethelm Travels (Pvt) Ltd Subsidiary - 10,000
Hemtours (Pvt) Ltd. Subsidiary 65,000 65,000
N-able (Pvt) Ltd. Subsidiary 55,000 47,000
Serendib Hotels PLC Subsidiary 19 53,510
Leisure Asia Investments Ltd. Subsidiary 380 150
329,474 519,272
14 AMOUNTS DUE FROM RELATED PARTIES
Company
2012 2011
Relationship Rs. ‘000 Rs. ‘000
Hemtours (Pvt) Ltd. Subsidiary 11,903 16,852
Diethelm Travels (Pvt) Ltd Subsidiary - 74
HIF Logistics (Pvt) Ltd. Joint Venture - 40
Hemas Pharmaceuticals (Pvt) Ltd. Subsidiary 5,334 795
Hemas Surgicals & Diagnostics (Pvt) Ltd. Subsidiary - 20
Hemas Air Services (Pvt) Ltd. Subsidiary 12,539 12,539
Hemas Travels (Pvt) Ltd. Subsidiary 6,281 -
Forbes Air Services (Pvt) Ltd. Subsidiary 48,010 48,010
Hellmann Worldwide Logistics (Pvt) Ltd. Joint Venture - 3
Far Shipping Lanka (Pvt) Ltd. Subsidiary - 2,130
Hemas Clinical Research Services (Pvt) Ltd. Subsidiary 3,496 3,496
Hemas Hospitals (Pvt) Ltd. Subsidiary 37,642 42,532
N-able (Pvt) Ltd. Subsidiary - 3,356
Mowbray Hotels Ltd. Subsidiary 4,571 3,586
Serendib Hotels PLC Subsidiary - 789
Less: Provision for Doubtful Debts (3,496) (3,496)
126,280 130,726
NOTES TO THE FINANCIAL STATEMENTS

Annual Report 2011/12 99
MANAGEMENT REPORTS SUSTAINABILITY GOVERNANCE FINANCIAL REPORTS
15 STATED CAPITAL - GROUP/COMPANY
2012 2012 2011 2011
Number Rs. ‘000 Number Rs. ‘000
15.1 Fully Paid Ordinary Shares (15.1.1) 515,290,620 1,600,603 512,040,620 1,468,426
2012 2011
Number Rs. ‘000 Number Rs. ‘000
15.1.1 Fully Paid Ordinary Shares
Balance at the Beginning of the Year 512,040,620 1,468,426 101,958,124 1,369,223
Sub division of shares - - 407,832,496 -
Issue of shares under Employee Shares Ownership Plan 3,250,000 132,177 2,250,000 99,203
Balance at the End of the Year 515,290,620 1,600,603 512,040,620 1,468,426
The company exercised a sub division of ordinary shares in the proportion of 5:1 on 2nd July 2010.
15.2 Rights, Preferences and Restrictions of Classes of Capital
The holders of Ordinary Shares are entitled to receive dividends as declared from time to time and are entitled to one vote per
share at a meeting of the Company.
16 RESERVES
Group Company
2012 2011 2012 2011
Rs. ‘000 Rs. ‘000 Rs. ‘000 Rs. ‘000
(a) Revaluation and Other Capital Reserve
Balance at the Beginning of the Year 1,047,155 835,953 257,032 257,032
Preference share issue/Adjustment on Share Transfers - 101,250 - -
Transfer during the Year 95,395 (9,256) - -
Net Gain/(Loss) Recognised Directly in Equity 912,882 119,209 - -
Balance at the End of the Year 2,055,432 1,047,156 257,032 257,032
(b) Exchange Reserve
Balance at the Beginning of the Year (1,179) (29,971) - -
Transfer from/(to) Retained Earnings (58,483) 28,792 - -
Balance at the End of the Year (59,662) (1,179) - -
Total Reserves 1,995,771 1,045,977 257,032 257,032
17 OTHER NON CURRENT LIABILITIES
Group Company
2012 2011 2012 2011
Rs. ‘000 Rs. ‘000 Rs. ‘000 Rs. ‘000
Rent Deposits/Advanses 13,506 10,243 10,599 -
13,506 10,243 10,599 -

100 The Hemas Group. Enriching Lives
18 INTEREST BEARING LOANS AND BORROWINGS
2012 2012 2012 2011 2011 2011
Amount Amount Total Amount Amount Total
Repayable Repayable Repayable Repayable
Within 1 Year After 1 Year Within 1 Year After 1 Year
Rs. ‘000 Rs. ‘000 Rs. ‘000 Rs. ‘000 Rs. ‘000 Rs. ‘000
18.1 Group
Finance Leases 2,260 5,229 7,489 1,172 3,551 4,723
Bank Loans
- Rupee Loans (18.1.1) 702,702 461,171 1,163,873 790,085 1,344,494 2,134,579
- Foreign Currency Loans (18.1.2) 231,496 918,427 1,149,923 200,009 351,996 552,004
936,458 1,384,827 2,321,285 991,266 1,700,040 2,691,306
As at Loans As at
01.04.2011 Obtained Repayments 31.03.2012
Rs. ‘000 Rs. ‘000 Rs. ‘000 Rs. ‘000
18.1.1 Rupee Loans
Bank Loans 2,134,579 319,895 (1,290,601) 1,163,873
As at Loans Exchange As at
01.04.2011 Obtained Repayments Gain/(Loss) 31.03.2012
Rs. ‘000 Rs. ‘000 Rs. ‘000 Rs. ‘000 Rs. ‘000
18.1.2 Foriegn Currency Loans
HSBC - USD 277,240 - (114,052) 29,344 192,532
SCB - USD 274,765 - (91,485) 31,599 214,878
HNB - EURO - 155,860 - 18,954 174814
HNB - GBP - 146,712 - 20,911 167,623
Commercial Bank - EURO - 118,052 - 17,530 135,582
Commercial Bank - GBP - 233,972 - 30,522 264,494
552,004 654,596 (205,537) 148,859 1,149,923
Loan Facility Re-payment Term Intrest Rate
Heladhanavi Ltd.
HSBC - USD 6,400,000 36 Installments 1 Month LIBOR + 3% p.a.
SCB - USD 6,000,000 42 Installments 1 Month LIBOR + 3% p.a. reprice Quarterly
Serendib Hotels PLC
HNB - EURO 1,315,000 60 Installments 3 Month EURIBOR + 3.5% p.a.
HNB - GBP 615,000 60 Installments 3 Month LIBOR + 3.5% p.a.
Dolphin Hotels PLC
Commercial Bank - EURO 812,300 72 Installments 1 Month EURIBOR + 3.75% p.a.
Miami Beach Hotels Ltd.
Commercial Bank - GBP 1,323,000 72 Installments 3 Month LIBOR + 3.75% p.a.
NOTES TO THE FINANCIAL STATEMENTS

Annual Report 2011/12 101
MANAGEMENT REPORTS SUSTAINABILITY GOVERNANCE FINANCIAL REPORTS
2012 2012 2012 2011 2011 2011
Amount Amount Total Amount Amount Total
Repayable Repayable Repayable Repayable
Within 1 Year After 1 Year Within 1 Year After 1 Year
Rs. ‘000 Rs. ‘000 Rs. ‘000 Rs. ‘000 Rs. ‘000 Rs. ‘000
18.2 Company
Loans from Related Parties (18.2.1) 290,590 965,472 1,256,062 321,640 686,502 1,008,142
290,590 965,472 1,256,062 321,640 686,502 1,008,142
Loans Repayment/
As at Obtained Transfer As at
01.04.2011 During During 31.03.2012
the Year the year
Relationship Rs. ‘000 Rs. ‘000 Rs. ‘000 Rs. ‘000
18.2.1 Loans from Related Parties
Hemas Air Services (Pvt) Ltd. Subsidiary 77,169 - - 77,169
Hemas Developments (Pvt) Ltd. Subsidiary 132,168 21,400 (57,595) 95,973
Hemas Manufacturing (Pvt) Ltd. Subsidiary 145,274 1,096,253 (914,182) 327,345
Hemas Pharmaceuticals (Pvt) Ltd. Subsidiary - 150,000 - 150,000
Hemas Power PLC Subsidiary - 80,000 - 80,000
Peace Haven Resorts Ltd. Subsidiary 214,194 7,850 (24,756) 197,288
Vishwa BPO (Pvt) Ltd. Subsidiary 8,000 - - 8,000
Forbes Air Services (Pvt) Ltd. Subsidiary 300,717 135,000 (246,050) 189,667
Hemtours (Pvt) Ltd. Subsidiary 130,620 - - 130,620
1,008,142 1,490,503 (996,533) 1,256,062
Terms and Conditions
(1) Treasury Loans (Current)
Security - Unsecured
Repayment - Within 3 months
Interest - Based on market rates
(2) Other Loans (Non Current)
Security - Unsecured
Repayments - Grace Period of 4 Years (29/04/2008 - 30/04/2012) and thereafter repayable over 3 years
Interest - Grace Period of 4 Years (29/04/2008 - 30/04/2012) and thereafter interest chargeable based on Market Rates

102 The Hemas Group. Enriching Lives
19 DEFERRED INCOME TAX
Group Company
2012 2011 2012 2011
Rs. ‘000 Rs. ‘000 Rs. ‘000 Rs. ‘000
19.1 Deferred Tax Assets
Balance as at Beginning of the Year 25,489 22,805 - -
Income/(Expense) arising during the Year (458) 2,684 - -
Balance at the End of the Year 25,031 25,489 - -
19.2 Deferred Tax Liabilities
Balance as at Beginning of the Year 123,609 145,147 42,022 60,198
Provision/(Release) made during the Year
- Directly to Income Statement (3,382) (11,236) (1,966) (18,176)
- Directly to Equity 41,414 (10,302) - -
Disposed (332) - - -
Balance at the End of the Year 161,309 123,609 40,056 42,022
20 RETIREMENT BENEFIT LIABILITY
Group Company
2012 2011 2012 2011
Rs. ‘000 Rs. ‘000 Rs. ‘000 Rs. ‘000
Balance as at Beginning of the Year 230,298 184,963 18,676 17,026
Interest cost 22,922 18,684 1,867 1,873
Current service cost 31,603 31,210 1,983 1,586
Benefits paid (14,793) (20,219) (131) (1,873)
Transfer - - 6,281 -
Acturial (gain) or loss (21,688) 15,660 1,875 64
Balance as at the End of the Year 248,342 230,298 30,551 18,676
20.1 Messrs. K.A. Pandit Consultants and Actuaries, carried out an actuarial valuation of the defined benefit plan gratuity on
31/03/2012. Appropriate and compatible assumptions were used in determining the cost of retirement benefits. The principal
assumptions used are as follows:
2012 2011
Discount rate assumed (%) 11% 10%
Further salary increase (%) 9% 9%
Retirement age 55 Years 50 - 60 Years
21 TRADE AND OTHER PAYABLES
Group Company
2012 2011 2012 2011
Rs. ‘000 Rs. ‘000 Rs. ‘000 Rs. ‘000
Trade Payables
Related Parties - - - -
Others 3,656,741 2,815,496 - 585
Other Payables
Related Parties (21.1) - - 39,420 5,464
Others 434,270 558,596 19,638 10,507
Sundry Creditors including Accrued Expenses 1,080,592 719,000 23,183 23,583
5,171,603 4,093,092 82,241 40,139
NOTES TO THE FINANCIAL STATEMENTS

Annual Report 2011/12 103
MANAGEMENT REPORTS SUSTAINABILITY GOVERNANCE FINANCIAL REPORTS
Company
2012 2011
Relationship Rs. ‘000 Rs. ‘000
21.1 Non Trade Dues to Related Parties
Hemas Corporate Services (Pvt) Ltd. Subsidiary 1,415 458
Hemas Air Services (Pvt) Ltd. Subsidiary 861 -
Forbes Air Services (Pvt) Ltd. Subsidiary 1,458 70
Hemas Pharmaceuticals (Pvt) Ltd. Subsidiary 3,730 2,806
ACX International (Pvt) Ltd. Joint Venture 74 -
Hemas Manufacturing (Pvt) Ltd. Subsidiary 2,638 -
Hemtours (Pvt) Ltd. Subsidiary 72 104
Vishwa BPO (Pvt) Ltd. Subsidiary 3,213 45
Diethelm Travel Lanka (Pvt) Ltd. Subsidiary 509 167
Hemas Hospitals (Pvt) Ltd. Subsidiary 450 -
Hemas Developments (Pvt) Ltd. Subsidiary 12,789 -
Peace Haven Resorts (Pvt) Ltd. Subsidiary 509 -
N-able (Pvt) Ltd. Subsidiary 11,053 1,355
HIF Logistics (Pvt) Ltd. Joint Venture 11 39
Hemas Power PLC Subsidiary 170 -
Hemas Travels (Pvt) Ltd. Subsidiary 468 420
39,420 5,464
22 AMOUNTS DUE TO RELATED PARTIES
Company
2012 2011
Relationship Rs. ‘000 Rs. ‘000
Hemas Power PLC Subsidiary 9,602 9,602
Vishwa BPO (Pvt) Ltd. Subsidiary 14,680 14,680
Hemas Pharmaceuticals (Pvt) Ltd. Subsidiary - 25,111
Hemtours (Pvt) Ltd. Subsidiary 14,495 14,225
Hemas Aviation (Pvt) Ltd. Subsidiary 5,398 5,398
Exchange & Finance Investment (Pvt) Ltd. Subsidiary 3,752 3,752
Discover the World Marketing (Pvt) Ltd. Subsidiary 3,320 3,320
Hemas Air Services (Pvt) Ltd. Subsidiary 50,074 50,453
Hemas Travels (Pvt) Ltd. Subsidiary 7,840 7,840
Hemas Developments (Pvt) Ltd. Subsidiary 22,671 22,671
ACX International (Pvt) Ltd. Joint Venture - 5,160
Far Shipping Lanka (Pvt) Ltd Subsidiary 5,600 5,600
137,432 167,812

104 The Hemas Group. Enriching Lives
23 CASH AND CASH EQUIVALENTS IN CASH FLOW STATEMENT
Group Company
2012 2011 2012 2011
Rs. ‘000 Rs. ‘000 Rs. ‘000 Rs. ‘000
Components of Cash and Cash Equivalents
23.1 Favourable Cash and Cash Equivalent Balances
Cash & Bank Balances 1,088,979 1,133,280 34,119 23,679
Fixed Deposits, Treasury Bills and Repo Investments 1,614,034 2,025,097 8,800 210
23.2 Unfavourable Cash and Cash Equivalent Balances 2,703,013 3,158,377 42,919 23,889
Bank Overdraft (1,885,579) (1,388,997) - (33,505)
Total Cash and Cash Equivalents for the Purpose of
Cash Flow Statement 817,434 1,769,380 42,919 (9,616)
23.3 Disposal of subsidiaries
Cash consideration received on disposal of subsidiaries during the year were as follows,
100% of 51% of
Solas Lanka ACX
(Pvt) Ltd International
(Pvt) Ltd Total
Rs. ‘000 Rs. ‘000 Rs. ‘000
Property, Plant and Equipment - 2,008 2,008
Other investments - 13 13
Trade and Other Receivables 2,977 2,527 5,504
Interest Bearing Borrowings - 807 807
Retirement Benefit Liability 10 497 507
Deferred Tax Liabilities - 332 332
Trade and Other Payables 1,723 462 2,185
Income Tax Liabilities 235 (1,444) (1,209)
Total net assets 1,009 3,894 4,903 Profit/(Loss) on disposal of subsidiaries (759) (957) (1,716) 250 2,937 3,187
NOTES TO THE FINANCIAL STATEMENTS

Annual Report 2011/12 105
MANAGEMENT REPORTS SUSTAINABILITY GOVERNANCE FINANCIAL REPORTS
24 REVENUE
Group Company
2012 2011 2012 2011
Rs. ‘000 Rs. ‘000 Rs. ‘000 Rs. ‘000
Summary
Sale of Goods 12,999,829 11,444,147 - -
Rendering of Services 8,409,767 6,623,342 373,654 304,851
21,409,596 18,067,489 373,654 304,851
Segment information is given in Note 37 to these financial statements.
25 DIVIDEND INCOME
Group Company
2012 2011 2012 2011
Rs. ‘000 Rs. ‘000 Rs. ‘000 Rs. ‘000
Income from Investments
- Related Parties - - 433,098 303,297
- Others 106 781 6 86
106 781 433,104 303,383
26 OTHER INCOME AND GAINS
Group Company
2012 2011 2012 2011
Rs. ‘000 Rs. ‘000 Rs. ‘000 Rs. ‘000
Gain/(Loss) on Disposal of Property Plant & Equipment 30,224 30,651 (2,666) 3,560
Rental Income 1,686 9,369 6,430 1,390
Commission Income 12,950 9,307 - -
Exchange Gain 48,832 30,750 - -
Sundry Income 50,666 28,753 4,159 625
144,358 108,830 7,923 5,575
27 GAIN/(LOSS) ON DISPOSAL OF INVESTMENTS
Group Company
2012 2011 2012 2011
Rs. ‘000 Rs. ‘000 Rs. ‘000 Rs. ‘000
Profit/(Loss) on Disposal of Investment (1,716) 3,317 (8,175) 234
(1,716) 3,317 (8,175) 234

106 The Hemas Group. Enriching Lives
28 FINANCE COST AND INCOME
Group Company
2012 2011 2012 2011
Rs. ‘000 Rs. ‘000 Rs. ‘000 Rs. ‘000
28.1 Finance Cost
Interest Expense on Overdrafts 56,695 64,757 198 243
Interest Expense on Loans and Borrowings
- Rupee 164,335 219,093 74,887 51,893
- Foreign Currency 27,970 13,462 - -
Debenture Interest - 393 - -
Finance Charges on Lease Liabilities 718 32 - -
249,718 297,737 75,085 52,136
28.2 Finance Income
Interest Income
- Related Parties - - 42,055 43,937
- Others 162,352 126,237 1,197 3,426
162,352 126,237 43,252 47,363
29 PROFIT BEFORE TAX
Stated after Charging/(Crediting)
Group Company
2012 2011 2012 2011
Rs. ‘000 Rs. ‘000 Rs. ‘000 Rs. ‘000
Included in Cost of Sales
Depreciation 313,326 335,425 - -
Provision for Obsolete stocks (19,273) 31,125 - -
Included in Administrative Expenses
Employees Benefits including the following
Defined Benefit Plan Cost - Gratuity 32,837 65,554 5,725 3,523
Defined Contribution Plan Cost - MSPS/EPF/ETF 125,686 107,779 11,735 8,202
Depreciation 322,143 284,551 24,638 24,638
Exchange Loss 81,922 22,968 - -
Amortisation/ Impairment of Intangibles 31,399 10,119 - -
Profit/ (Loss) on Disposal of Property, Plant and Equipment (37,651) - 2,666 -
Auditors’ Fees and Expenses 8,024 7,760 1,076 980
Legal Fees 1,365 1,491 3 9
Donations 6,108 9,665 772 117
Bad Debts Written - off 19,063 322 - -
Provision for Doubtful Debts 12,463 33,789 - (1,646)
Included in Selling & Distribution Cost
Transport Cost 99,525 75,355 - -
Advertising Cost 413,637 299,967 - 144
NOTES TO THE FINANCIAL STATEMENTS

Annual Report 2011/12 107
MANAGEMENT REPORTS SUSTAINABILITY GOVERNANCE FINANCIAL REPORTS
30 INCOME TAX EXPENSE
Group Company
2012 2011 2012 2011
Rs. ‘000 Rs. ‘000 Rs. ‘000 Rs. ‘000
Current Income Tax
Current Tax Expense on Ordinary
Activities for the Year (30.1) 228,645 200,412 23,709 27,545
Under/(Over) Provision of Current
Taxes in respect of prior years 1,078 6,152 528 -
Tax on Dividends 33,508 21,510 - -
Deferred Tax Expense/(Income) arising due to
- Origination and Reversal of Timing Differences (2,924) (13,920) (1,966) (18,176)
260,307 214,154 22,271 9,369
30.1 Reconciliation between Income Tax Expenses and the Accounting Profit
Group Company
2012 2011 2012 2011
Rs. ‘000 Rs. ‘000 Rs. ‘000 Rs. ‘000
Accounting Profit Before Tax 1,574,913 1,569,345 490,855 347,689
Intra Group Adjustment/Share of Profits of Subsidiaries 664,836 910,604 - -
Income not subject to Income Tax (678,987) (943,206) (447,663) (283,172)
Excempt profit (470,750) (794,364) - -
Aggregate Disallowed Expenses 188,194 257,741 69,446 35,382
Aggregate Allowable Expenses (152,410) (251,783) (27,964) (17,942)
Aggregate disallowable income (60,166) 85,663 - -
Adjustment for tax losses (11,279) (5,290) - (4,652)
Taxable Profit 1,054,351 828,710 84,674 77,305
Income tax at 28% (2011 - 35%) 184,895 164,739 23,709 27,138
Income tax at 15% 599 26,381 - -
Income tax at 12% 20,653 - - -
Income tax at 10% 20,392 4,710 - -
Income Tax at other rates 2,106 1,721 - -
228,645 197,550 23,709 27,138
Social Responsibility levy - 2,862 - 407
Current Income Tax Expense 228,645 200,412 23,709 27,545

108 The Hemas Group. Enriching Lives
30.2 Applicable Tax Rates
As per the Inland Revenue Act No.10 of 2006 and amendments thereto, all group companies which are resident in Sri Lanka are
liable to Income Tax at 28% (2010/11- 35%) on taxable profit during the year 2011/2012 with the exception of the Companies
stated below.
Company Nature Exemption or
Concession
Period
Exemptions/Concessions Granted Under the Board of Investment Law
Hemas Developments (Pvt) Ltd Enjoys a concessionary tax rate 2% on
Revenue
15 years ending
2019/2020
Heladhanavi Limited Exempt from Income Tax Exempt 10 years ending
2014/2015
Okanda Power Grid (Pvt) Ltd Profit of the Company is exempt from income tax
for a period of 5 years, at 10% for next 2 years and
20% thereafter
Exempt 5 years from 1st
year of profit
or 2 years from
operations
Upper Agra Oya Hydro Power (Pvt) Ltd Profit of the Company is exempt from income tax
for a period of 5 years, at 10% for next 2 years and
20% thereafter
Exempt 5 years ending
2012/2013
Giddawa Hydro Power (Pvt) Ltd Profit of the Company is exempt from income tax
for a period of 5 years, at 10% for next 2 years and
20% thereafter
Exempt 5 years ending
2012/2013
Hemas Hospitals (Pvt) Ltd Profit of the Company is exempt from income tax
for a period of 5 years, at 10% for next 2 years and
20% thereafter
Exempt 5 years from 1st
year of profit
or 2 years from
operations
Hemas Southern Hospitals (Pvt) Ltd Profit of the Company is exempt from income tax
for a period of 5 years, at 10% for next 2 years and
20% thereafter
Exempt 5 years from 1st
year of profit
or 2 years from
operations
Vishwa BPO (Pvt) Ltd Exempt from income tax for a period of 3 years, at
10% for the next 2 years and 20% thereafter
10% Ending March
2012
Hemas Manufacturing (Pvt) Ltd For manufacturing and/or marketing of soap,
personal care items and other fast moving
consumer goods at its relocated factory in
Dankotuwa under “300 Enterprises Programme”,
Inland Revenue Act shall not apply for a period of
5 years. After the exemption, the profits are taxed
at 10% for a period of 2 years and 20% thereafter
Exempt 5 years ending
2012/2013
Exemptions/Concessions Granted Under the Inland Revenue Act No. 10 of 2006
Hemas Power PLC Classified as a venture capital Company and
enjoys a concessionary tax rate
12% open
N-able (Pvt) Ltd Exempt from income tax for a period of 3 years,
after the excemption at 5% for the first year, 10%
in the second year and 15% thereafter
Exempt 3 years ending
2012/2013
NOTES TO THE FINANCIAL STATEMENTS

Annual Report 2011/12 109
MANAGEMENT REPORTS SUSTAINABILITY GOVERNANCE FINANCIAL REPORTS
30.2 Applicable Tax Rates Contd.
Business income of Hotel Sigiriya PLC, Miami Beach Hotels Ltd, Serendib Leisure Management (Pvt) Ltd, Far Shipping Lanka (Pvt)
Ltd, Forbes Air Services (Pvt)Ltd, Hemas Air Services (Pvt) Ltd, Hemas Travels (Pvt) Ltd, Hemas Corporate Services (Pvt) Ltd, Hemas
Aviation (Pvt) Ltd, Exchange & Finance Investment (Pvt) Ltd, Discover the World Marketing (Pvt) Ltd, Hellman Worldwide Logistics
(Pvt) Ltd, Skynet Worldwide Express (Pvt) Ltd and Diethelm Travel Lanka (Pvt) Ltd is taxed at 10%.
Business income of Dolphin Hotels PLC and Serendib Hotels PLC Ltd is taxed at 12%. As per ‘’Business Profit Tax Act’’ in Maldives,
taxable profits of Diethelm Travel The Maldives (Pvt) Ltd is charged at 15%.
As per SRO No 172-Law/Income Tax/2009 dated 30 June 2009 Hemas Consumer Brands Private Ltd is entitled to pay tax at
reduce rate on income. As the Company incurred a loss during the year, minimum tax has been made as provisions for income
tax in line with the provisions of the ITO-1984.
31 EARNINGS PER SHARE
31.1 Basic Earnings Per Share is calculated by dividing the net profit for the year attributable to ordinary shareholders of the
Company by the weighted average number of ordinary shares outstanding during the year. The weighted average number of
ordinary shares outstanding during the year and the previous year are adjusted for events that have changed the number of
ordinary shares outstanding, without a corresponding change in the resources such as a bonus issue.
31.2 The following reflects the income and share data used in the Basic Earnings Per Share computation.
Group
2012 2011
Rs. 000 Rs. ‘000
Amount Used as the Numerator:
Profit for the Year 1,209,058 1,210,159
Less: Preference Dividends (11,680) (4,183)
Net Profit Attributable to Ordinary Shareholders for
Basic Earnings Per Share 1,197,378 1,205,976
In ‘000s 2012 2011
Number of Ordinary Shareholders Used as Denominator:
Number of shares at the beginning of the year 512,041 101,958
Sub division of shares - 407,832
512,041 509,790
Effect of Issue of shares under ESOS 1,625 563
Weighted Average number of Ordinary Shares in issue applicable to
Basic Earnings Per Share 513,666 510,353
31.3 There were no potentially dilutive Ordinary Shares outstanding at any time during the year.

110 The Hemas Group. Enriching Lives
32 DIVIDENDS PER SHARE
Company
2012 2011
Rs. 000 Rs. ‘000
32.1 Dividends Paid
Final out of 2010/2011 (2011-2009/2010) profits
Net Dividends paid to Ordinary shareholders 128,010 216,703
Withholding tax deducted at Source from Dividends out of Profits - 12,703
Gross Ordinary Dividend paid 128,010 229,406
Interim out of 2011/2012 profits
Net Dividends paid to Ordinary Shareholders 128,823 127,448
256,833 356,854
Withholding tax deducted at Source from Dividends out of Dividends received 28,537 25,536
Dividend paid to Ordinary Shareholders 285,370 382,390
32.2 Dividends Per Share
2012 2011
Rs. ‘000 Rs. ‘000
Final out of 2010/2011 profits 0.25 0.45
Interim out of 2011/2012 profits 0.25 0.25
32.3 The Final Dividends for 2010/11 has been paid on 11 July 2011 and Interim Dividends for 2011/12 has been paid on 22
November 2011.
33 EVENTS OCCURRING AFTER THE BALANCE SHEET DATE
The Board of Directors of the company has declared a final dividend of Rs. 0.25 per share for the financial year ended 31 March
2012 as required by section 56(2) of the Companies Act No. 07 of 2007, the Board of Directors has confirmed that the company
satisfies the solvency test in accordance with section 57 of the Companies Act No. 07 of 2007, and has obtained a certificate
from the Auditors, prior to declaring the final dividend which is to be paid on 10 July 2012.
In accordance with the Sri Lanka Accounting Standard 12 (Revised 2005) - Events after the Balance Sheet date, the final dividend
has not been recognised as a liability in the financial statements as at 31 March 2012.
34 COMMITMENTS & CONTINGENCIES
34.1 Capital Commitments
Group
2012 2011
Rs.’000 Rs.’000
Serendib Hotels PLC
Authorised by the Board, but not contracted for - 650,000
- 650,000
NOTES TO THE FINANCIAL STATEMENTS

Annual Report 2011/12 111
MANAGEMENT REPORTS SUSTAINABILITY GOVERNANCE FINANCIAL REPORTS
34.2 Contingencies
(a) Hemas Holdings PLC
The contingent liability as at 31 March 2012 on guarantees given by Hemas Holdings PLC, to banks on behalf of subsidiaries &
joint venture relating to facilities obtained, are as follows
2012 2011
Rs.’000 Rs.’000
Hemas Travels (Pvt) Ltd. - 22,000
Hemas Corporate Services (Pvt) Ltd. - 5,000
Hemas Southern Hospitals (Pvt) Ltd. 110,000 110,000
Exchange & Finance Investments (Pvt) Ltd. - 2,500
Hemas Manufacturing (Pvt) Ltd. - 85,000
Heladhanavi Ltd. 300,000 300,000
Hemas Power PLC 10,000 10,000
Forbes Air Services (Pvt) Ltd. 150,000 150,000
Hemas Hospitals (Pvt) Ltd. 200,000 200,000
Serendib Hotels PLC 628,504 200,000
N-able (Pvt) Ltd. 320,000 -
1,721,004 1,084,500
(b) Hemas Manufacturing (Pvt) Ltd.
A Civil Case has been filed against the Company by Colgate Palmolive Company, seeking a declaration that the Company’s
Registered Trade Mark No. 74941 is null and void and of no force of effect in law from the date of registration of the said mark.
Both parties have filed written submissions as per the Supreme Court rules and the Supreme Court Registry will notify the date
of hearing in due course.
(c) Hemas Marketing (Pvt) Ltd.
The Company has given a guarantee to Banks on behalf of Hemas Manufacturing (Pvt) Ltd amounting to Rs. 150,000,000/-
(d) Hemas Travels (Pvt) Ltd.
1. The Company has obtained guarantees from Standard Chartered Bank favouring BSP and non BSP Airlines amounting to
Rs.144,960,000/-
2. The Company has obtained guarantees from Standard Chartered Bank favouring DNATA Emirates groups headquarters
amounting to USD 10,000/-
3. The Company has obtained guarantees from Standard Chartered Bank favouring Royal Caribbean Cruises (Asia) PTE
amounting to USD 25,000/-
4. The Company has obtained guarantees from Standard Chartered Bank favouring Indian Railway Catering and Tourism
amounting to USD 10,000/-
5. The Company has obtained guarantees from Standard Chartered Bank favouring Desiya Online Travel Distribution
amounting to USD 10,000/-
6. The Company has obtained guarantees from Standard Chartered Bank favouring Ascot International Management
amounting to USD 5,000/-
7. The Company has obtained guarantees from Standard Chartered Bank favouring Saltours International amounting to
EUR 10,000/-
8. The Company has obtained guarantees from Standard Chartered Bank favouring M/S Gulliver’s Travels Associates amounting
to GBP 15,000/-

112 The Hemas Group. Enriching Lives
(e) Hemas Air Services (Pvt) Ltd.
1. The Company has obtained guarantees from Standard Chartered Bank favouring Malaysian Airlines for the purpose of GSA
agreement for cargo and Passenger amounting to USD 550,000 and USD 60,000 respectively.
2. The Company has obtained a guarantee from Standard Chartered Bank favouring Airport & Aviation Services (Sri Lanka) Ltd
amounting to Rs. 5,201,450/-
3. The Company has obtained guarantees from Standard Chartered Bank on behalf of Hemas Aviation (Pvt) Ltd favouring
Sri Lankan Airline Ltd, Drukair Corporation Ltd and Discover Momentum LLC, amounting to US$ 15,000, US$ 20,000 and
US$ 50,000 respectively.
(f ) Forbes Air Services (Pvt) Ltd.
1. The Company has obtained a guarantee from Standard Chartered Bank favouring Emirates - Dubai amounting to
Rs. 906,300,000/-.
2. The Company has obtained a guarantee from Standard Chartered Bank favouring Airport and Aviation Services (Sri Lanka)
Ltd amounting to Rs. 201,566/-
3. The Company has obtained a guarantee from Standard Chartered Bank favouring Director General of Civil Aviation
amounting to Rs. 24,024,000/-
(g) Discover the World Marketing (Pvt) Ltd.
The Company has given a guarantee amounting to USD 50,000 to its principal “Discover Momentum” in relation to the credit
facilities obtained by the principal.
34.3 Lease Commitments
(a) Hemas Hospitals (Pvt) Ltd.
Operating Lease Commitments - Company as Lessee
The Company has entered into an operating lease agreement to lease a land from Nihila Garments (Pvt) Ltd . This lease has a life
of 30 years with no renewal option included in .the contract. There are no restrictions placed upon the lessee by entering into
this lease.
Future minimum rentals payable under operating lease as at 31 March are as follows:
2012 2011
Rs. ‘000 Rs. ‘000
Within 01 Year 15,750 18,750
After 01 Year but not more than 05 Years 90,000 84,750
More than 05 Years 488,244 502,494
593,994 605,994
34.4 Commitments and Contingencies of the Jointly Controlled Entities
(a) Heladhanavi Ltd.
1. Operations and Maintenance Agreement with Lakdhanavi Ltd.
According to this agreement, the fixed fee payable after the final completion date is US$ 625,000 per annum paid in equal
monthly installments and Heladhanavi Ltd is liable to pay Lakdhanavi Ltd an additional sum of US $ 2,000,000 for each
remaining year of the term or pro rata for part of term upon the early termination of this agreement
2. Fuel Transport Agreement with LTL Projects (Pvt) Ltd.
Heladhanavi Ltd has entered into a contract during the period with LTL Projects (Pvt) Ltd, for the transportation of fuel.
According to the arrangement the company needs to pay a fixed charge of US$ 10,500 per month from the date of
commencement of power generation in the plant.
NOTES TO THE FINANCIAL STATEMENTS

Annual Report 2011/12 113
MANAGEMENT REPORTS SUSTAINABILITY GOVERNANCE FINANCIAL REPORTS
3. Fuel Supply Agreement with Ceylon Petroleum Corporation
If the company is unable to accept fuel under supply schedule (subject to change) and/or comply with its obligations under
this agreement and costs,expenses,damages & losses incurred as a direct and exclusive result of such failure or inability
should be paid by the company within 30 days. However, company’s liability under this agreement is limited to a maximum
of US$ 500,000 per annum.
According to the clause 3.5 (C) of fuel supply agreement, company has established two Letter of Credits in favour of Ceylon
Petroleum Corporation At Nations Develeopment Bank - to the value of Rs. 300Mn and at Sampath Bank- to the value of
Rs. 300Mn
4. Heladhanavi Limited (‘Heladhanavi’) is of the opinion, based on legal advice, that CEB has breached the PPA by; (a) failing to
pay a sum of Rs 57Mn on account of delayed interest income due to Heladhanavi; and (b) attempting to deduct dividend
tax of Rs 215Mn. Heladhanavi has commenced Arbitration proceedings with regard to the aforementioned disputes, and the
Board of Directors of Heladhanavi is confident that Heladhanavi would succeed in such Arbitration.
5 Power Purchase Agreement with Ceylon Electricity Board
If the company fails to supply Minimum Guaranteed Energy Amount (MGEA), which is 698,417,280 kwh per year, the
Company would be liable for liquidated damages.
Shortfall Amount of liquidated damages for each
kwh of shortfall
Exceeding 10% of MGEA up to 25% of MGEA 15% of capacity charges
Exceeding 25% of MGEA 25% of capacity charges
6 Eligibility to apply for a Generation Licence
As per the Sri Lanka Electricity Act No.20 of 2009, for a company to be eligible to obtain generation license for generation
capacity over and above 25MW, the company must be incorporated under the Companies Act No. 7 of 2007, in which the
government, a public corporation, a company in which the government holds more than fifty per centum of the shares or a
subsidiary of such a company, holds such number of shares as may be determined by the Secretary to the Treasury with the
concurrence of the Minister in charge of the subject of Finance.
However no such determination of shares was made by the Secretery to the Treasury at the point of application of the
generation license . It was revealed that the Government of Sri Lanka is in the process of amending the Electricity Act to
exempt the existing independent power procedures (including the Company) from this requirement. The Company is
currently supplying power to the Ceylon Electricity Board based on a generation license validly obtained on 26 September
2003.
A legal opinion was sought by the company in this regard which states that in the absence of the determination of the fixed
number shares by the secretary to the treasury as required under section 9 (1) (c) of the Sri Lanka Electricity Act No 20 of
2009, the company is entitled to apply for a generation license and hence will not be liable for any fines as the company does
not contravene the Act.
(b) Hellman Worldwide Logistics (Pvt) Ltd
The Company has obtained corporate guarantees from Hellmann Worldwide Logistics Ltd ( Hong Kong ) for Hong Kong
Dollars 1,500,000.

114 The Hemas Group. Enriching Lives
35
. A
SS
ET
S P
LED
GE
D
Th
e fo
llow
ing
ass
ets
hav
e b
ee
n p
led
ge
d a
s se
curi
ty fo
r lia
bili
tie
s as
at
the
Bal
ance
Sh
ee
t d
ate.
Nam
e o
f Th
e C
om
pan
y N
atu
re o
f A
sse
ts
Nat
ure
of
Liab
ility
C
arry
ing
Am
ou
nt
of
the
In
clu
de
d U
nd
er
A
sse
ts P
led
ge
d
2
01
2
20
11
R
s.’0
00
R
s.’0
00
He
mas
Man
ufa
ctu
rin
g
Inve
nto
rie
s an
d
Co
ncu
rre
nt
Mo
rtg
age
to
1
2,0
00
2
2,5
00
In
ven
tori
es
and
(P
vt)
Ltd
. Tr
ade
Re
ceiv
able
s th
e e
xte
nt
of
ban
k fa
cilit
y
Tr
ade
Re
ceiv
able
o
bta
ine
d f
rom
HN
B a
nd
HSB
C
La
nd
& B
uild
ing
of
Dan
kotu
wa
stat
e.
Pri
mar
y m
ort
gag
e fo
r th
e
- 7
88
,28
0
Pro
pe
rty,
Pla
nt
Ex
isti
ng
Mac
hin
ery
B
ank
loan
ob
tain
ed
fro
m N
DB
an
d E
qu
ipm
en
t
Pro
po
sed
Pla
nt
& M
ach
ine
ry,
Eq
uip
me
nt
and
Fu
rnit
ure
&
Fitt
ing
s o
f D
anko
tuw
a st
ate.
He
lad
han
avi L
td.
Imm
ova
ble
Ass
ets
U
S$ 4
,00
0,0
00
& U
S$ 1
2,6
00
,00
0
- 1
0,8
84
P
rop
ert
y, P
lan
t(T
he
Gro
up
has
its
(T
erm
Lo
an F
acili
ty)
and
Eq
uip
me
nt
pro
po
rtio
nat
e s
har
e
of
the
ass
ets
ple
dg
ed
)
Lan
d,B
uild
ing
, Pla
nt
and
Mac
hin
ery
U
S $
6,4
00
,00
0
2,9
49
,16
5
-
Pro
pe
rty
, Pla
nt
(Te
rm L
oan
wit
h H
SBC
)
and
Eq
uip
me
nt
and
Tr
ade
De
bto
rs
Lan
d,B
uild
ing
, Pla
nt
and
Mac
hin
ery
&
US
$ 1
1,6
00
,00
0
6,2
06
,13
5
-
Pro
pe
rty,
Pla
nt
Pro
pe
rty
, Pla
nt
Trad
e D
eb
tors
and
Eq
uip
me
nt
an
d E
qu
ipm
en
t
La
nd
,Bu
ildin
g, P
lan
t an
d M
ach
ine
ry
US
$ 6
,00
0,0
00
2
,94
9,1
65
-
P
rop
ert
y, P
lan
t
(T
erm
Lo
an w
ith S
tan
dar
d C
har
tere
d B
ank)
an
d E
qu
ipm
en
t
Sere
nd
ib H
ote
ls P
LC
Leas
eh
old
Lan
d
Pri
mar
y M
ort
gag
e
- 2
05
,51
3
Pro
pe
rty,
Pla
nt
an
d B
uild
ing
s u
p t
o t
he
val
ue
of
Rs.
48
Mn
.
an
d E
qu
ipm
en
t
to
Se
ylan
Ban
k P
LC
Seco
nd
ary
Mo
rtg
age
u
p t
o t
he
val
ue
of
Rs.
20
Mn
.
to
Se
ylan
Ban
k P
LC
Co
rpo
rate
Gu
aran
tee
fro
m H
em
as
Ho
ldin
gs
PLC
for
Rs.
20
0 M
n a
nd
In
de
mn
ity
of
the
Co
mp
any,
in f
avo
ur
of
Hat
ton
Nat
ion
al B
ank
PLC
NOTES TO THE FINANCIAL STATEMENTS

Annual Report 2011/12 115
MANAGEMENT REPORTS SUSTAINABILITY GOVERNANCE FINANCIAL REPORTS
35
. A
SS
ET
S P
LED
GE
D C
ON
TD
.
Nam
e o
f Th
e C
om
pan
y N
atu
re o
f A
sse
ts
Nat
ure
of
Liab
ility
C
arry
ing
Am
ou
nt
of
the
In
clu
de
d U
nd
er
A
sse
ts P
led
ge
d
2
01
2
20
11
R
s.’0
00
R
s.’0
00
Do
lph
in H
ote
ls P
LC
Fre
eh
old
Lan
d
Pri
mar
y M
ort
gag
e u
pto
th
e v
alu
e o
f 6
39
,95
1
56
5,1
25
P
rop
ert
y, P
lan
t
an
d B
uild
ing
s R
s. 1
26
.3 M
n t
o C
om
me
rcia
l Ban
k o
f
and
Eq
uip
me
nt
Ce
ylo
n P
LC o
f C
eyl
on
(EI
B L
oan
)
Pri
mar
y M
ort
gag
e u
pto
th
e v
alu
e o
f
Rs.
20
Mn
to
Co
mm
erc
ial B
ank
of
C
eyl
on
PLC
(Ove
rdra
ft f
acili
ty o
f R
s.2
0M
n)
Mia
mi B
eac
h H
ote
ls L
td
Fre
eh
old
Lan
d
Pri
mar
y M
ort
gag
e u
pto
th
e v
alu
e o
f 5
00
,01
1
46
4,7
75
P
rop
ert
y, P
lan
t
an
d B
uild
ing
s R
s. 2
34
.6 M
n t
o C
om
me
rcia
l Ban
k o
f
and
Eq
uip
me
nt
Ce
ylo
n P
LC (
EIB
Lo
an)
Pri
mar
y M
ort
gag
e u
pto
th
e v
alu
e o
f
Rs.
10
Mn
to
Co
mm
erc
ial
Ban
k o
f C
eyl
on
PLC
Co
rpo
rate
Gu
ran
tee
of
Do
lph
in
Ho
tels
PLC
for
Rs.
50
M
Ho
tel S
igir
iya
PLC
P
lan
t, M
ach
ine
ry a
nd
Eq
uip
me
nt
Pri
mar
y M
ort
gag
e u
p t
o t
he
val
ue
of
2
,69
1
2,9
25
P
rop
ert
y, P
lan
t
Rs.
1.7
5 M
n t
o C
om
me
rcia
l Ban
k o
f
and
Eq
uip
me
nt
Ce
ylo
n P
LC
Le
ase
ho
ld L
and
P
rim
ary
Mo
rtg
age
up
to t
he
val
ue
of
-
11
0,8
94
an
d B
uild
ing
s R
s.3
0 M
n t
o C
om
me
rcia
l Ban
k o
f
Ce
ylo
n P
LC
He
mas
Ho
spit
als
(Pvt
) Lt
d.
Leas
eh
old
rig
ht
to t
he
P
rim
ary
Mo
rtg
age
up
to
1
,36
4,2
69
1
,36
4,2
69
P
rop
ert
y, P
lan
t
Le
ase
ho
ld L
and
th
e v
alu
e o
f R
s 7
50
,00
0,0
00
to
an
d E
qu
ipm
en
t
DFC
C B
ank
He
mas
So
uth
ern
La
nd
an
d B
uild
ing
C
on
curr
ent m
ort
gag
e to
the
exte
nt o
f Ban
k 3
95
,00
0
35
3,2
00
P
rop
ert
y, P
lan
t
Ho
spit
als
(Pvt
) Lt
d.
fa
cilit
y o
bta
ine
d f
rom
Sam
pat
h B
ank
and
Eq
uip
me
nt

116 The Hemas Group. Enriching Lives
36. RELATED PARTY DISCLOSURES
Details of significant related party disclosures are as follows:
36.1 Transaction with related entities
Subsidiaries Others Total
2012 2011 2012 2011 2012 2011
Rs. ‘000 Rs. ‘000 Rs. ‘000 Rs. ‘000 Rs. ‘000 Rs. ‘000
Nature of Transaction
Consultancy Fees Receivable 280,862 229,222 - - 280,862 229,222
Bank Guarantee Fees Receivable 5,315 2,292 - (1,505) 5,315 786
IT Charges Receivable 64,395 64,904 26 88 64,421 64,992
Rent Receivable 7,171 1,152 - - 7,171 1,152
Loan Interest Income Receivable 42,055 42,854 - 1,082 42,055 43,937
Dividend Income 433,098 303,297 - - 433,098 303,297
Treasury Loans Granted (966,787) (605,154) - - (966,787) (605,154)
Loan Interest Expense Payable (50,674) (49,113) - - (50,674) (49,113)
Receipt of Services (34,834) (5,696) - - (34,834) (5,696)
Shared Service Fee Payable (7,626) (9,031) - - (7,626) (9,031)
Purchase of Air Tickets/ Foreign Currency (7,648) (7,711) - - (7,648) (7,711)
Treasury Loans Obtained 1,490,503 496,996 - - 1,490,503 496,996
Repayment of Loans (Net) 150,282 15,329 - - 150,282 15,329
Others 3,742 - - - 3,742 -
1,409,853 479,340 26 (335) 1,409,879 479,005
Off Balance Sheet items
Guarantees given by the Company to banks on behalf of related parties are disclosed in Note 34.2 to these financial statements.
Terms and Conditions:
- Sales and purchase of goods and/or services to related parties were made at on the basis of the price lists in force with
non related parties , but subject to approved discounts. Fees relating to rendering of services were made at agreed
prices. Settlement will take place in cash.
- Terms and Conditions on loans obtained from related parties are disclosed in Note 18.2.1 to these financial statements.
36.2 Transactions with Key Management Personnel
The key management personnel are the members of its Board of Directors of Hemas Holdings PLC and its Subsidiaries.
Group Company
2012 2011 2012 2011
Rs. ‘000 Rs. ‘000 Rs. ‘000 Rs. ‘000
a) Key Management Personnel Compensation
Short Term Benefits 142,349 144,243 41,974 36,474
b) Transactions, arrangements and agreements involving Key Management Personnel
No other significant transactions had taken place involving Key Management Personnel & their Close Family Members.
NOTES TO THE FINANCIAL STATEMENTS

Annual Report 2011/12 117
MANAGEMENT REPORTS SUSTAINABILITY GOVERNANCE FINANCIAL REPORTS
37
. S
EG
ME
NTA
L IN
FO
RM
AT
ION
Info
rmat
ion
bas
ed o
n th
e Pr
imar
y Se
gm
ents
(Bu
sin
ess
Seg
men
t)
For t
he
year
en
ded
31
Mar
ch
FMC
G
Hea
lthca
re
Leis
ure
Tr
ansp
ort
atio
n
Pow
er
Oth
ers
Gro
up
20
12
2011
20
12
2011
20
12
2011
20
12
2011
20
12
2011
20
12
2011
20
12
2011
R
s.’00
0 R
s.’00
0 R
s.’00
0 R
s.’00
0 R
s.’00
0 R
s.’00
0 R
s.’00
0 R
s.’00
0 R
s.’00
0 R
s.’00
0 R
s.’00
0 R
s.’00
0 R
s.’00
0 R
s.’00
0
Ass
ets
and
Lia
bili
ties
No
n C
urr
ent
Ass
ets
Pro
per
ty, P
lan
t an
d E
qu
ipm
ent
1,18
1,77
0 96
0,59
7 2,
092,
681
1,92
6,87
3 2,
503,
099
1,71
6,17
2 70
,836
43
,863
2,
546,
691
2,46
9,57
7 92
0,13
6 35
3,34
0 9,
315,
213
7,47
0,42
2
Inve
stm
ent P
rop
erty
-
- -
- -
- -
- -
- 1,
470,
500
1,30
9,96
5 1,
470,
500
1,30
9,96
5
Oth
er N
on
Cu
rren
t Ass
ets
632,
994
442,
238
1,46
1,89
7 58
3,31
4 49
5,90
5 62
8,83
8 86
,553
83
,702
1,
733,
831
1,33
1,66
1 6,
796,
850
6,30
3,06
5 11
,208
,030
9,
372,
818
Seg
men
tal N
on
Cu
rren
t Ass
ets
1,81
4,76
4 1,
402,
835
3,55
4,57
8 2,
510,
187
2,99
9,00
4 2,
345,
010
157,
389
127,
565
4,28
0,52
2 3,
801,
238
9,18
7,48
6 7,
966,
370
21,9
93,7
43
18,1
53,2
05
Def
erre
d T
ax A
sset
s
25
,031
25
,489
Elim
inat
ion
s/A
dju
stm
ents
(10
,090
,635
) (8
,315
,066
)
Tota
l No
n C
urr
ent
Ass
ets
11,9
28,1
39
9,86
3,62
8
Cu
rren
t A
sset
s
Seg
men
tal C
urr
ent A
sset
s 2,
596,
170
2,38
8,28
3 3,
132,
255
2,69
2,91
9 1,
154,
769
949,
795
2,11
2,44
5 1,
933,
063
2,72
5,09
7 2,
402,
865
1,43
7,68
7 1,
319,
597
13,1
58,4
23
11,6
86,5
22
Tax
Ref
un
ds
- -
- -
- -
- -
- -
- -
134,
306
148,
020
Elim
inat
ion
s/A
dju
stm
ents
-
- -
- -
- -
- -
- -
- (2
,411
,896
) (2
,482
,296
)
Tota
l Cu
rren
t A
sset
s
10
,880
,833
9,
352,
246
Tota
l Ass
ets
22,8
08,9
72
19,2
15,8
74
No
n C
urr
ent L
iab
iliti
es
Seg
men
tal N
on
Cu
rren
t Lia
bili
ties
58,8
21
199,
937
1,10
9,46
4 1,
210,
827
774,
951
501,
291
32,2
05
44,2
30
314,
380
489,
620
1,03
9,28
6 74
3,15
7 3,
329,
108
3,18
9,06
2
Def
erre
d T
ax L
iab
ility
16
1,30
9 12
3,60
9
Elim
inat
ion
s/A
dju
stm
ents
(1
,682
,432
) (1
,248
,481
)
Tota
l No
n C
urr
ent
Liab
iliti
es
1,80
7,98
4 2,
064,
190
Cu
rren
t Li
abili
ties
Seg
men
tal C
urr
ent L
iab
ilitie
s 1,
498,
446
1,32
2,36
5 2,
559,
918
2,18
3,42
2 1,
029,
196
1,15
2,05
1 1,
520,
606
1,42
6,49
2 2,
389,
587
1,74
7,00
2 90
2,93
0 90
8,02
3 9,
900,
683
8,73
9,35
5
Inco
me
Tax
Liab
ility
63
,742
89
,890
Elim
inat
ion
s/A
dju
stm
ents
(1
,900
,972
) (2
,253
,202
)
Tota
l Cu
rren
t Li
abili
ties
8,
063,
453
6,57
6,04
3
Tota
l Lia
bili
ties
9,
871,
437
8,64
0,23
3
Tota
l Seg
men
t Ass
ets
4,41
0,93
4 3,
791,
118
6,68
6,83
3 5,
203,
106
4,15
3,77
3 3,
294,
805
2,26
9,83
4 2,
060,
628
7,00
5,61
9 6,
204,
103
10,6
25,1
73
9,28
5,96
7 35
,152
,166
29
,839
,727
Tota
l Seg
men
t Lia
bili
ties
1,55
7,26
7 1,
522,
302
3,66
9,38
2 3,
394,
249
1,80
4,14
8 1,
653,
342
1,55
2,81
1 1,
470,
722
2,70
3,96
7 2,
236,
622
1,94
2,21
6 1,
651,
180
13,2
29,7
90
11,9
28,4
19
Oth
er S
egm
enta
l In
form
atio
n
Acq
uis
itio
n C
ost
of P
rop
erty
,
Pl
ant a
nd
Eq
uip
men
t 11
5,03
5 99
,711
27
3,66
2 76
,797
76
5,86
3 58
8,71
1 49
,075
8,
399
288,
689
242,
998
88,1
78
78,7
30
1,58
0,50
2 1,
095,
346
Dep
reci
atio
n o
f seg
men
tal a
sset
s 11
8,66
8 14
7,97
6 14
9,53
4 14
6,28
7 91
,572
78
,751
14
,297
13
,214
20
7,67
2 20
3,70
1 53
,726
30
,047
63
5,46
9 61
9,97
6
Oth
er N
on
Cas
h e
xpen
ses
- -
- -
- -
- -
- -
- -
Pro
visi
on
for R
etiri
ng
Gra
tuity
4,
776
16,9
81
12,5
42
20,4
40
4,20
3 10
,479
2,
980
8,67
2 84
2 1,
070
7,49
4 7,
912
32,8
37
65,5
54
Imp
airm
ent/
Am
ort
izat
ion
o
f In
tan
gib
les
8,17
8 6,
794
- -
2,55
6 3,
325
- -
- -
20,6
65
- 31
,399
10
,119

118 The Hemas Group. Enriching Lives
37
. S
EG
ME
NTA
L IN
FO
RM
AT
ION
CO
NT
D.
For t
he
year
en
ded
31
Mar
ch
FMC
G
Hea
lthca
re
Leis
ure
Tr
ansp
ort
atio
n
Pow
er
Oth
ers
Gro
up
20
12
2011
20
12
2011
20
12
2011
20
12
2011
20
12
2011
20
12
2011
20
12
2011
R
s.’00
0 R
s.’00
0 R
s.’00
0 R
s.’00
0 R
s.’00
0 R
s.’00
0 R
s.’00
0 R
s.’00
0 R
s.’00
0 R
s.’00
0 R
s.’00
0 R
s.’00
0 R
s.’00
0 R
s.’00
0
Rev
enu
e
Seg
men
tal R
even
ue
- Gro
ss
6,59
5,92
9 5,
799,
255
7,54
8,71
0 6,
572,
180
1,18
2,75
0 1,
035,
089
721,
987
734,
279
4,47
1,37
0 3,
370,
395
1,48
9,17
7 1,
081,
209
22,0
09,9
23
18,5
92,4
08
Intr
a Se
gm
enta
l Rev
enu
e -
- (6
8,31
7)
(56,
832)
-
- -
- -
- (4
0,08
4)
(43,
098)
(1
08,4
01)
(99,
929)
Seg
men
t Rev
enu
e 6,
595,
929
5,79
9,25
5 7,
480,
393
6,51
5,34
8 1,
182,
750
1,03
5,08
9 72
1,98
7 73
4,27
9 4,
471,
370
3,37
0,39
5 1,
449,
093
1,03
8,11
1 21
,901
,522
18
,492
,478
Inte
r Seg
men
tal r
even
ue
- -
- (1
,164
) -
- -
- -
- (4
91,9
26)
(423
,824
) (4
91,9
26)
(424
,989
)
Tota
l Rev
enu
e 6,
595,
929
5,79
9,25
5 7,
480,
393
6,51
4,18
4 1,
182,
750
1,03
5,08
9 72
1,98
7 73
4,27
9 4,
471,
370
3,37
0,39
5 95
7,16
7 61
4,28
7 21
,409
,596
18
,067
,489
Res
ult
s
Seg
men
tal R
esu
lts
550,
085
507,
705
585,
120
471,
625
143,
263
181,
107
250,
029
248,
520
268,
809
457,
192
(167
,154
) (1
49,7
09)
1,63
0,15
2 1,
716,
439
Fin
ance
Co
st
(2,7
12)
(33,
791)
(1
11,2
00)
(131
,231
) (4
8,88
6)
(35,
485)
(5
,595
) (1
1,44
9)
(52,
863)
(8
1,37
5)
(28,
462)
(4
,406
) (2
49,7
18)
(297
,737
)
Fin
ance
Inco
me
51,0
44
45,9
40
6,10
2 4,
824
17,6
30
1,34
8 25
,685
14
,401
57
,041
52
,340
4,
850
7,38
4 16
2,35
2 12
6,23
7
Ch
ang
e in
Fai
r Val
ue
of
In
vest
men
t Pro
per
ties
- -
- -
- -
- -
- -
32,1
27
24,4
05
32,1
27
24,4
05
Pro
fit/(
Loss
) bef
ore
Tax
59
8,41
7 51
9,85
4 48
0,02
2 34
5,21
8 11
2,00
7 14
6,97
0 27
0,11
9 25
1,47
2 27
2,98
7 42
8,15
7 (1
58,6
39)
(122
,326
) 1,
574,
913
1,56
9,34
5
Inco
me
Tax
(23,
735)
(6
60)
(123
,821
) (1
12,8
29)
(17,
824)
(2
5,35
0)
(27,
899)
(2
7,56
2)
(1,9
77)
(2,5
16)
(65,
051)
(4
5,23
7)
(260
,307
) (2
14,1
54)
Pro
fit/
(Lo
ss) f
or
the
Year
57
4,68
2 51
9,19
4 35
6,20
1 23
2,38
9 94
,183
12
1,62
0 24
2,22
0 22
3,91
0 27
1,01
0 42
5,64
1 (2
23,6
90)
(167
,563
) 1,
314,
606
1,35
5,19
1
Att
ribu
tab
le to
:
Equ
ity H
old
ers
of t
he
Pare
nt
574,
682
519,
194
375,
692
264,
874
36,8
46
50,5
78
242,
220
223,
910
203,
326
319,
300
(223
,708
) (1
67,6
97)
1,20
9,05
8 1,
210,
159
Min
orit
y In
tere
sts
- -
(19,
491)
(3
2,48
5)
57,3
37
71,0
42
- -
67,6
84
106,
341
18
134
105,
548
145,
032
57
4,68
2 51
9,19
4 35
6,20
1 23
2,38
9 94
,183
12
1,62
0 24
2,22
0 22
3,91
0 27
1,01
0 42
5,64
1 (2
23,7
90)
(167
,563
) 1,
314,
606
1,35
5,19
1
NOTES TO THE FINANCIAL STATEMENTS

Annual Report 2011/12 119
MANAGEMENT REPORTS SUSTAINABILITY GOVERNANCE FINANCIAL REPORTS
38 GROUP COMPANIES
Effective Holding Voting Power Principal Activities
31.03.2012 31.03.2011 31.03.2012 31.03.2011
FMCG
Hemas Manufacturing (Pvt) Ltd. 100% 100% 100% 100% Manufacture of FMCG Products
Hemas Marketing (Pvt) Ltd. 100% 100% 100% 100% Trading & Distribution of FMCG Products
Hemas Trading (Pvt) Ltd. 100% 100% 100% 100% Import and sale of Food Products
Hemas Consumer Brands (Pvt) Ltd. 100% 100% 100% 100% Trading of FMCG Products
HEALTHCARE
Hemas Pharmaceuticals (Pvt) Ltd. 100% 100% 100% 100% Distribution of Pharmaceutical Products
Hemas Surgical & Diagnostics (Pvt) Ltd. 100% 100% 100% 100% Distribution of Healthcare Products
Hemas Hospitals (Pvt) Ltd. 81% 81% 81% 81% Hospital Services
Hemas Southern Hospitals (Pvt) Ltd. 81% 81% 81% 81% Hospital Services
Hemas Capital Hospitals (Pvt) Ltd. 81% - 81% - Hospital Services
Hemas South Colombo Hospitals (Pvt) Ltd. 81% - 81% - Hospital Services
Hemas Clinical Research Services (Pvt) Ltd. 100% 100% 100% 100% Support Services of Clinical Trials
LEISURE
Leisure Asia Investments Ltd. 100% 100% 100% 100% Investment Holding Company
Serendib Hotels PLC 51% 51% 51% 51% Operating a Tourist Hotel and Investment
Holding Company
Hotel Sigiriya PLC 32% 32% 51% 51% Operating a Tourist Hotel
Dolphin Hotels PLC 39% 39% 51% 51% Operating a Tourist Hotel
Miami Beach Hotels Ltd 33% 33% 51% 51% Operating a Tourist Hotel
Serendib Leisure Management Ltd 51% 51% 51% 51% Hotel Management Services
Diethelm Travel Lanka (Pvt) Ltd. 80% 80% 80% 80% Destination Management Services
Diethelm Travel The Maldives (Pvt) Ltd. - - 66% 66% Destination Management Services
Hemtours (Pvt) Ltd. 100% 100% 100% 100% Destination Management Services
Conventions Asia (Pvt) Ltd. 100% 100% 100% 100% Event Management
Mowbray Hotels Ltd. 89% 89% 89% 89% Property
TRANSPORTATION
Forbes Air Services (Pvt) Ltd. 100% 100% 100% 100% GSA Emirates Airline
Hemas Air Services (Pvt) Ltd. 100% 100% 100% 100% GSA Malaysian Airline
Hemas Travels (Pvt) Ltd. 100% 100% 100% 100% Travel Agent
Hemas Aviation (Pvt) Ltd. 100% 100% 100% 100% Airline Presentation
Go Asia Air Lines (Pvt) Ltd. 100% 100% 100% 100% Airline Presentation
Exchange & Finance Investment (Pvt) Ltd. 100% 100% 100% 100% Airline Presentation
Discover the World Marketing (Pvt) Ltd 100% 100% 100% 100% Airline Presentation
Far Shipping Lanka (Pvt) Ltd. 100% 100% 100% 100% Shipping Agents
Hemas Transportation (Pvt) Ltd. 100% 100% 100% 100% Investment Holding Company
Solas Lanka (Pvt) Ltd. - 100% - 100% Shipping Agents
Hellman Worldwide Logistics (Pvt) Ltd* 49% 49% 49% 49% Freight Forwarders
HIF Logistics (Pvt) Ltd.* 49% 49% 49% 49% Freight Forwarders
Skynet Worldwide Express (Pvt) Ltd.* 49% 49% 49% 49% Courier Services
ACX International (Pvt) Ltd.* 49% 100% 49% 100% Courier Services
POWER
Hemas Power PLC. 75% 75% 75% 75% Venture Capital Company
Giddawa Hydro Power (Pvt) Ltd. 75% 75% 75% 75% Mini Hydro Power Plant
Okanda Power Grid (Pvt) Ltd. 75% 75% 75% 75% Mini Hydro Power Plant
Upper Agra Oya Hydro Power (Pvt) Ltd 75% 75% 75% 75% Mini Hydro Power Plant
Butama Hydro Electricity Company 75% - 75% - Mini Hydro Power Plant
Ella Dendro Electric (Pvt) Ltd 75% - 75% - Mini Hydro Power Plant
Heladhanavi Ltd.* 35% 35% 50% 50% Thermal Power Plant
OTHER
Hemas Corporate Services (Pvt) Ltd. 100% 100% 100% 100% Corporate Secretaries
Hemas Developments (Pvt) Ltd. 100% 100% 100% 100% Property Development
Peace Haven Resorts Ltd. 95% 95% 95% 95% Property
Vishwa BPO (Pvt) Ltd 100% 100% 100% 100% Financial & Accounting BPO
N-able (Pvt) Ltd. 100% 100% 100% 100% Enabling Information & Technology
Solutions
*Jointly Controlled Entities

120 The Hemas Group. Enriching Lives
SHARE INFORMATION
Shareholdings
RESIDENT NON-RESIDENT TOTAL
No.of
Shareholders
No.of
Shares
Percentage
(%)
No.of
Shareholders
No.of
Shares
Percentage
(%)
No.of
Shareholders
No.of
Shares
Percentage
(%)
1 to1,000 Shares 4,077 1,986,188 0.39 22 12,830 0.00 4,099 1,999,018 0.39
1,001 to 10,000 Shares 1,914 6,781,693 1.32 32 152,050 0.03 1,946 6,933,743 1.35
10,001 to 100,000 Shares 397 11,817,980 2.29 21 785,650 0.15 418 12,603,630 2.44
100,001 to 1000,000 Shares 70 20,778,850 4.03 14 4,953,100 0.96 84 25,731,950 4.99
Over 1,000,000 Shares 23 437,836,740 84.97 8 30,185,539 5.86 31 468,022,279 90.83
6,481 479,201,451 93.00 97 36,089,169 7.00 6,578 515,290,620 100.00
ANALYSIS OF SHAREHOLDERS ACCORDING TO THE NUMBER OF SHARES AS AT 31 MARCH 2012
No.of Shareholders No. of Shares
Catagories of Shareholders
Individual 6,209 50,952,630
Institutional 369 464,337,990
6,578 515,290,620
COMPUTATION OF PUBLIC SHAREHOLDING
As at 31 March 2012 2011
No of shares No of shares
Over 10% holding
Saraz Investments (Private) Limited 86,396,035 86,396,035
A Z Holdings (Private) Limited 90,762,875 90,762,875
Amagroup (Private) Limited 85,780,665 85,780,665
Blueberry Investments (Private) Limited 85,781,250 85,781,250
Directors’ shareholding
Mr. J C L De Mel 87,500 87,500
Mr. H N Esufally 5,795,205 5,795,205
Mr. A N Esufally 1,992,085 1,992,085
Mr. I A H Esufally 6,132,500 6,132,500
Mr. M E Wickremesinghe 11,250 11,250
Mr. M A H Esufally 5,655,000 5,655,000
Mr. P K Mohapatra - -
Mr. D Bhatnagar 150 150
368,394,515 368,394,515
Issued share capital 515,290,620 512,040,620
Less : directors’ shareholding and shareholders over 10% 368,394,515 368,394,515
Public holding 146,896,105 143,646,105
public holding as a % of issued share capital 28.51% 28.05%
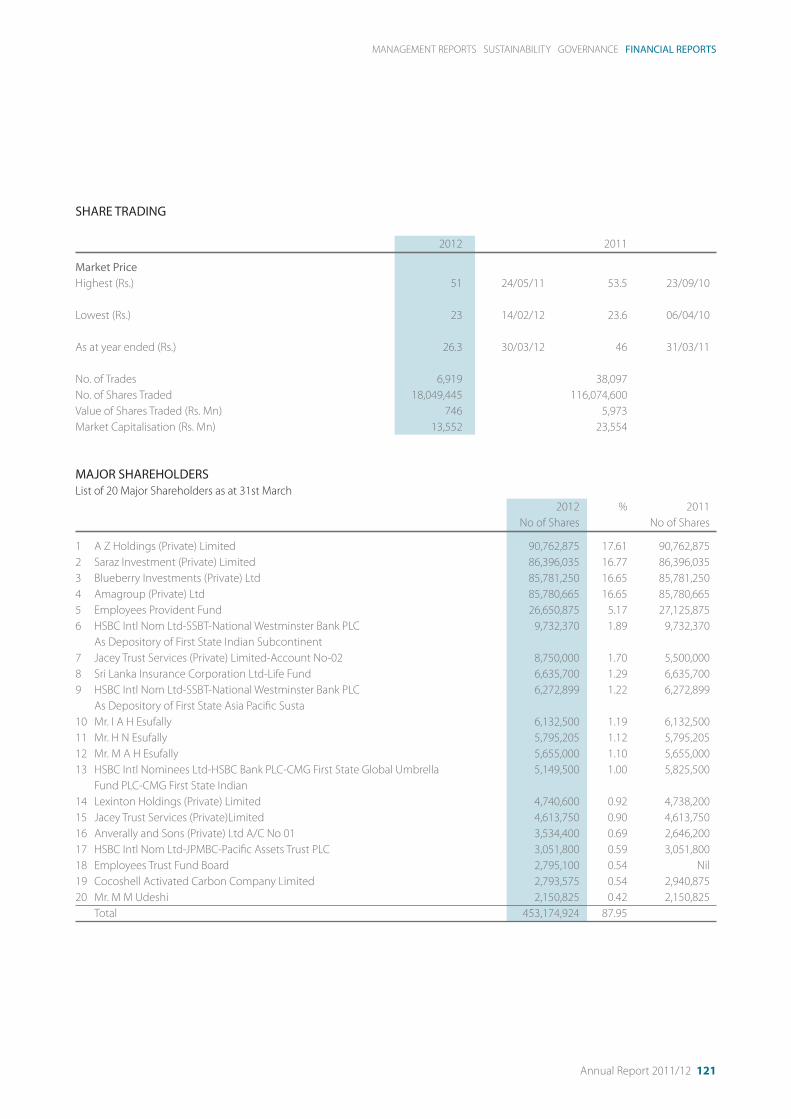
Annual Report 2011/12 121
MANAGEMENT REPORTS SUSTAINABILITY GOVERNANCE FINANCIAL REPORTS
SHARE TRADING
2012 2011
Market Price
Highest (Rs.) 51 24/05/11 53.5 23/09/10
Lowest (Rs.) 23 14/02/12 23.6 06/04/10
As at year ended (Rs.) 26.3 30/03/12 46 31/03/11
No. of Trades 6,919 38,097
No. of Shares Traded 18,049,445 116,074,600
Value of Shares Traded (Rs. Mn) 746 5,973
Market Capitalisation (Rs. Mn) 13,552 23,554
MAJOR SHAREHOLDERS
List of 20 Major Shareholders as at 31st March
2012 % 2011
No of Shares No of Shares
1 A Z Holdings (Private) Limited 90,762,875 17.61 90,762,875
2 Saraz Investment (Private) Limited 86,396,035 16.77 86,396,035
3 Blueberry Investments (Private) Ltd 85,781,250 16.65 85,781,250
4 Amagroup (Private) Ltd 85,780,665 16.65 85,780,665
5 Employees Provident Fund 26,650,875 5.17 27,125,875
6 HSBC Intl Nom Ltd-SSBT-National Westminster Bank PLC 9,732,370 1.89 9,732,370
As Depository of First State Indian Subcontinent
7 Jacey Trust Services (Private) Limited-Account No-02 8,750,000 1.70 5,500,000
8 Sri Lanka Insurance Corporation Ltd-Life Fund 6,635,700 1.29 6,635,700
9 HSBC Intl Nom Ltd-SSBT-National Westminster Bank PLC 6,272,899 1.22 6,272,899
As Depository of First State Asia Pacific Susta
10 Mr. I A H Esufally 6,132,500 1.19 6,132,500
11 Mr. H N Esufally 5,795,205 1.12 5,795,205
12 Mr. M A H Esufally 5,655,000 1.10 5,655,000
13 HSBC Intl Nominees Ltd-HSBC Bank PLC-CMG First State Global Umbrella 5,149,500 1.00 5,825,500
Fund PLC-CMG First State Indian
14 Lexinton Holdings (Private) Limited 4,740,600 0.92 4,738,200
15 Jacey Trust Services (Private)Limited 4,613,750 0.90 4,613,750
16 Anverally and Sons (Private) Ltd A/C No 01 3,534,400 0.69 2,646,200
17 HSBC Intl Nom Ltd-JPMBC-Pacific Assets Trust PLC 3,051,800 0.59 3,051,800
18 Employees Trust Fund Board 2,795,100 0.54 Nil
19 Cocoshell Activated Carbon Company Limited 2,793,575 0.54 2,940,875
20 Mr. M M Udeshi 2,150,825 0.42 2,150,825
Total 453,174,924 87.95

122 The Hemas Group. Enriching Lives
DIRECTORS’ SHAREHOLDING
31 March 2012 1 April 2011 31 March 2011
Mr. J C L De Mel 87,500 87,500 87,500
Mr. H N Esufally 5,795,205 5,795,205 5,795,205
Mr. A N Esufally 1,992,085 1,992,085 1,992,085
Mr. I A H Esufally 6,132,500 6,132,500 6,132,500
Mr. M E Wickremesinghe 11,250 11,250 11,250
Mr. M A H Esufally 5,655,000 5,655,000 5,655,000
Mr. P K Mohapatra - - -
Mr. D Bhatnagar 150 150 150
368,394,515 368,394,515 368,394,515
SHARE INFORMATION

Annual Report 2011/12 123
MANAGEMENT REPORTS SUSTAINABILITY GOVERNANCE FINANCIAL REPORTS
FIVE YEAR SUMMARY
Year Ended 31st March 2012 2011 2010 2009 2008
Rs.’000
Operating Results
Group Revenue 21,409,596 18,067,489 14,997,405 15,169,509 14,163,805
Profit Before Taxtaion 1,574,913 1,569,345 1,094,719 856,932 1,259,455
Taxation 260,307 214,154 160,075 137,854 108,625
Profit After Taxation 1,314,606 1,355,191 934,644 719,078 1,150,830
Profit Attributable to Hemas Group 1,209,058 1,210,159 901,730 775,128 1,135,419
Equity & Liabilities
Stated Capital and Preference Shares 1,600,603 1,468,426 1,369,223 1,369,223 1,329,013
Reserves 1,995,771 1,045,976 805,983 837,675 856,452
Retained Earnings 7,195,185 6,359,604 5,516,910 4,821,392 4,248,232
Minority Interest 2,145,976 1,701,635 1,488,104 837,062 604,967
Non-Current Liabilities 1,807,984 2,064,190 1,570,430 2,000,989 1,155,771
Current Liabilities 8,063,453 6,576,043 5,316,281 4,969,471 4,936,190
22,808,972 19,215,874 16,066,931 14,835,812 13,130,625
Assets
Property, Plant & Equipment 10,288,807 7,457,601 7,033,615 7,180,680 5,182,389
Investment Property 474,685 1,309,965 1,261,410 1,178,710 1,178,710
Leasehold Property 55,713 58,779 61,845 64,911 67,976
Intangible Assets 300,409 323,895 333,074 191,214 173,622
Investments (Associate & Others) 783,494 687,899 241,564 257,924 375,106
Deferred Tax Assets 25,031 25,489 22,805 21,832 18,482
Current Assets 10,880,833 9,352,246 7,112,618 5,940,541 6,134,340
22,808,972 19,215,874 16,066,931 14,835,812 13,130,625
Key Indicators
Earnings Per Share (Rs.)* 2.33 2.36 1.76 1.51 2.23
Dividends Per Share (Rs.)* 0.50 0.70 0.36 0.25 0.25
Dividend Cover (No. of Times) 4.7 3.4 4.9 6.0 8.9
Interest Cover (No. of Times) 7.3 6.2 3.3 2.8 4.2
Net Asset Per Share (Rs.)* 20.9 17.3 15.1 13.8 12.7
Cash from Operating Activities (Rs.’ 000) 948,833 1,994,663 1,407,985 1,458,434 929,277
Current Ratio (No. of Times) 1.3 1.4 1.3 1.2 1.2
Gearing (%) 24.5 27.8 25.8 32.9 31.4
ROE (%) 12.3 14.6 12.3 11.5 19.4
* Comparative figures adjusted for sub division of ordinary shares in the proportion of 5:1

124 The Hemas Group. Enriching Lives
CAPITAL EMPLOYED
Total shareholders’ funds plus debt and minority interest.
CAPITAL RESERVES
Reserves identified for specific purposes and considered not
available for distribution.
CURRENT RATIO
Current assets divided by current liabilities.
CONTINGENT LIABILITIES
Conditions or situations at the Balance Sheet date, the
financial effect of which are to be determined by future events
which may or may not occur.
DEBT
The sum of interest bearing long-term and short-term loans
and overdrafts.
DEFERRED INCOME TAX
The net tax effect on items which have been included in the
Income Statement, which would only qualify for inclusion on
a tax return at a future date.
DIVIDEND COVER
Net profit attributable to the ordinary shareholders divided
by the total dividend paid and proposed.
EARNINGS
Profit after tax less minority interest.
EARNINGS PER SHARE
Profit attributable to ordinary shareholders divided by the
weighted average number of ordinary shares in issue during
the year.
EBIT
Earnings before interest and tax.
EBITDA
Earnings before interest, tax, depreciation and amortisation.
EFFECTIVE RATE OF TAXATION
Income tax over profit before tax.
EQUITY
Total shareholders’ funds.
GEARING
Debt divided by the sum of equity, minority interest and debt.
INTEREST COVER
Earnings before interest and tax divided by the total finance
cost.
MARKET CAPITALISATION
The number of ordinary shares in issue multiplied by the
market price per share as at the reported date.
MINORITY INTEREST
Part of the net results of operations and of net assets of a
subsidiary attributable to interests which are not owned,
directly or indirectly, through Subsidiaries, by the Parent.
NET ASSETS PER SHARE
Shareholders funds divided by the number of ordinary shares
in issue as at the end of the year.
PRICE EARNINGS RATIO
Market price per share divided by the earnings per share.
RETURN ON EQUITY
Profit after tax, minority interest and extraordinary items
divided by average shareholders’ funds at the beginning and
end of the year.
REVENUE RESERVES
Reserves set aside for future distributions and Investments.
RETURN ON CAPITAL EMPLOYED
Operating profit divided by average capital employed.
SEGMENT
Constituent business units grouped in terms of similarity of
operations and strategy.
GLOSSARY

Annual Report 2011/12 125
NOTICE OF MEETINGNOTICE IS HEREBY GIVEN that the Ninth Annual General
Meeting of Hemas Holdings PLC will be held at the
Auditorium of the Ceylon Chamber of Commerce, No. 50,
Nawam Mawatha, Colombo 2 on Friday, the 29th day of June
2012 at 3.30 pm for the following purpose:-
AGENDA
1. To receive and consider the Statements of Accounts of
the Company and of the Group for the year ended 31st
March 2012 , together with the Reports of the Directors
and Auditors thereon.
2. To re-elect as Director, Mr. I A H Esufally retiring in
terms of Article 84 of the Articles of Association of the
Company.
3. To re-elect as Director, Mr. P K Mohapatra retiring in
terms of Article 84 of the Articles of Association of the
Company.
4. To re-elect as Director, Mr. R Gopalakrishnan retiring in
terms of Article 72 of the Articles of Association of the
Company.
5. To pass the ordinary resolution set out below to re-
appoint as director Mr. J C L De Mel who is over 70 years
of age and vacates office as a director of the Company
in terms of Section 210 (2) (a) of the Companies’
Act No. 7 of 2007;
“RESOLVED that Mr. J C L De Mel who has reached the
age of 75 years on 6th May 2012 be and is hereby re-
appointed a Director of the Company and it is hereby
declared as provided for in Section 211 (1) of the
Companies Act No. 7 of 2007 that the age limit of 70
years referred to in Section 210 of the said Companies’
Act shall not apply to Mr. J C L De Mel.”
6. To declare a final dividend of Rs. 0.25 per Ordinary share
as recommended by the Board.
7. To re- appoint Messrs. Ernst & Young, Chartered
Accountants as Auditors for the ensuing year
and to authorize the Directors to determine their
remuneration.
8. To authorize the Directors to determine and make
donations to Charity.
By Order of the Board of
HEMAS HOLDINGS PLC
Hemas Corporate Services (Private) Limited
Secretaries
8th June 2012
Note:
A member entitled to attend and vote is entitled to appoint a
Proxy to attend and vote in his/her place.
A Proxy need not be a Member of the Company.
A Form of Proxy accompanies this Notice.

126 The Hemas Group. Enriching Lives
NOTES

Annual Report 2011/12 127
FORM OF PROXYI/We ........................................................................................................................................................................................................................................................................................................
of ..............................................................................................................................................................................................................................................................................................................
being a Member/s of Hemas Holdings PLC do hereby appoint one of the following Directors of the Company,
Mr. Lalith De Mel or failing him
Mr. Husein Esufally or failing him
Mr. Abbas Esufally or failing him
Mr. Imtiaz Esufally or failing him
Mr. Murtaza Esufally or failing him
Mr. Maithri Wickremesinghe or failing him
Mr. Pradipta Mohapatra or failing him
Mr. Ramabadran Gopalakrishnan or failing him
Mr./Mrs. ...............................................................................................................................................................................................................................................................................................
of ............................................................................................................................................................................................................................................................................................................
as *my/our Proxy to *speak and /to vote for *me/us on *my/our behalf at the Ninth Annual General Meeting of Hemas Holdings PLC
to be held at 3.30 p.m. on Friday the 29th day of June 2012 at the Auditorium of the Ceylon Chamber of Commerce, No 50, Nawam
Mawatha, Colombo 2 and at any adjournment thereof.
For Against
1. To receive and consider the Statements of Accounts of the Company and of the Group
for the year ended 31.03.2012 together with the Reports of the Directors and Auditors
thereon.
2. To re-elect as Director, Mr. Imtiaz Esufally retiring by rotation in terms of the Articles of
Association of the Company.
3. To re-elect as Director, Mr. Pradipta Mohapatra retiring by rotation in terms of the Articles
of Association of the Company.
4. To re-elect as Director, Mr. Ramabadran Gopalakrishnan retiring by rotation in terms of
the Articles of Association of the Company.
5. To re-appoint Mr. J C L De Mel as a Director of the Company in terms of Section 211 (1) of
the Companies’ Act No.7 of 2007.
6. To declare a final dividend of Rs. 0.25 per share as recommended by the Board.
7. To re-appoint M/s Ernst & Young, Chartered Accountants, as auditors of the Company and
to authorize the directors to determine their remuneration.
8. To authorize the Directors to determine and make donations to Charity.
*The Proxy may vote as he/she thinks fit on any other resolution brought before this meeting
. .................................................................................................. Date:................................................................................
Signature/s
Note:
1. Please delete the inappropriate words.
2. Instructions as to completion are noted on the reverse hereof.

128 The Hemas Group. Enriching Lives
INSTRUCTIONS AS TO COMPLETION OF FORM OF PROXY
1. Kindly perfect the Form of Proxy after filling in legibly your
full name and address and by signing in the space provided.
Please fill in the date of signature.
2. A member entitled to attend and vote at the meeting is
entitled to appoint a proxy to attend and vote instead of
him/her.
3. In the case of Corporate Members, the Form of Proxy must
be completed under the Common Seal, which should be
affixed and attested in the manner prescribed by the Articles
of Association /Statutes.
4. If the Form of Proxy is signed by an Attorney, the relevant
Power of Attorney should also accompany the completed
Form of Proxy.
5. the completed Form of Proxy, addressed to the Secretaries
should be deposited at Hemas House, No. 75, Braybrooke
Place. Colombo 2 not less than Forty Eight (48) hours before
the time appointed for the Meeting.

CORPORATE INFORMATION
LEGAL FORM
Quoted Public Company with Limited
Liability listed on the Colombo Stock
Exchange on 15th October 2003
DATE OF INCORPORATION
10th December 1948
DATE OF RE-REGISTRATION
30th May 2007
NEW REGISTRATION NUMBER
P Q 6
ACCOUNTING YEAR END
31st March
REGISTERED OFFICE
Hemas House
No. 75, Braybrooke Place,
Colombo 2.
WEBSITE
www.hemas.com
AUDITORS
Ernst & Young
Chartered Accountants
No. 201, De Saram Place,
Colombo 10.
DIRECTORS
Lalith De Mel (Chairman)
Husein Esufally (CEO)
Abbas Esufally
Imtiaz Esufally
Murtaza Esufally
Maithri Wickremesinghe
Praditpa Mohapatra
Divyaroop Bhatnagar (Resigned 31.03.2012)
Ramabadran Gopalakrishnan (Appointed 01.04.2012)
SECRETARIES & REGISTRARS
Hemas Corporate Services (Pvt) Ltd
No. 75, Braybrooke Place,
Colombo 2.
Telephone: 4731731 (hunting)
Facsimile: 4731777
LAWYERS TO THE COMPANY
D.L.& F De Saram
No. 47, Alexandra Place,
Colombo 7.
BANKERS
Bank of Ceylon
Commercial Bank of Ceylon PLC
CITI Bank N.A
Deutsche Bank AG
DFCC Bank PLC
Hong Kong & Shanghai Banking Corp. Ltd
Hatton National Bank PLC
Nations Trust Bank PLC
National Development Bank PLC
Peoples Bank
Standard Chartered Bank
Sampath Bank PLC

HEMAS HOLDINGS PLC
Hemas House
75, Braybrooke Place,
Colombo 02,
Sri Lanka.
www.hemas.com
Designed and produced by emagewise
Copyright © 2022 FDOKUMEN