Enhanced speed advice for connected vehicles in the ...
14
ORIGINAL PAPER Open Access Enhanced speed advice for connected vehicles in the proximity of signalized intersections Evangelos Mintsis 1* , Eleni I. Vlahogianni 1 , Evangelos Mitsakis 2 and Seckin Ozkul 3 Abstract Technological advancements in the field of transportation are gradually enabling cooperative, connected and automated mobility (CCAM). The progress in information and communication technology (ICT) has provided mature solutions for infrastructure-to-vehicle (I2V) communication, which enables the deployment of Cooperative- ITS (C-ITS) services that can foster comfortable, safe, environmentally friendly, and more efficient traffic operations. This study focuses on the enhancement of speed advice comfort and safety in the proximity of signalized intersections, while ensuring energy and traffic efficiency. A detailed microscopic simulation model of an urban network in the city of Thessaloniki, Greece is used as test bed. The performance of dynamic eco-driving is evaluated for different penetration rates of the dynamic eco-driving technology and varying traffic conditions. The simulation analysis indicates that speed advice can be comfortable and safe without adversely impacting energy and traffic efficiency. However, efficient deployment of dynamic eco-driving depends on road design characteristics, activation distance of the service, traffic signal plans, and prevailing traffic conditions. Keywords: Dynamic eco-driving, Enhanced speed advice, Connected vehicle, Microscopic traffic simulation, Signalized intersection, Greenhouse gas emissions 1 Introduction C-ITS and Advanced Driver Assistance Systems (ADAS) can significantly enhance comfort, safety, traffic efficiency and energy savings via real-time information provision (tailored to the needs of individual vehicles), and coopera- tive driving [30]. Road safety impact assessment of the lat- ter systems has been conducted through real world experiments [26] and with the use of microscopic traffic simulation tools [31] that utilize surrogate measures of safety to indicate conflict risk for both uninterrupted and interrupted traffic flow [3, 9, 10, 12, 22]. C-ITS applications and ADAS that enable eco-driving and yield environmental benefits have also received significant attention from funding agencies, vehicle manufacturers, road authorities, technology providers, and the research community. Specifically, dynamic eco-driving in the proximity of signalized intersection uses real-time traffic and Signal Phase and Timing (SPaT) information to communicate robust and real-time speed and/or count- down advice to connected vehicles (CVs). Comprehensive reviews discussing different aspects of dynamic eco- driving in a connected (and automated) road environment can be found in [2, 13, 16, 29, 45, 47, 49]. Methodologically, the operation and performance of dynamic eco-driving was previously assessed through microscopic traffic simulation studies, driving simula- tors, controlled field experiments and real-world experi- ments [29]. © The Author(s). 2021 Open Access This article is licensed under a Creative Commons Attribution 4.0 International License, which permits use, sharing, adaptation, distribution and reproduction in any medium or format, as long as you give appropriate credit to the original author(s) and the source, provide a link to the Creative Commons licence, and indicate if changes were made. The images or other third party material in this article are included in the article's Creative Commons licence, unless indicated otherwise in a credit line to the material. If material is not included in the article's Creative Commons licence and your intended use is not permitted by statutory regulation or exceeds the permitted use, you will need to obtain permission directly from the copyright holder. To view a copy of this licence, visit http://creativecommons.org/licenses/by/4.0/. * Correspondence: [email protected] 1 Department of Transportation Planning and Engineering, School of Civil Engineering, National Technical University of Athens, 5 Iroon Polytechniou Str., Zografou Campus, 15773 Athens, Greece Full list of author information is available at the end of the article European Transport Research Review Mintsis et al. European Transport Research Review (2021) 13:2 https://doi.org/10.1186/s12544-020-00458-y
-
Upload
khangminh22 -
Category
Documents
-
view
3 -
download
0
Transcript of Enhanced speed advice for connected vehicles in the ...

ORIGINAL PAPER Open Access
Enhanced speed advice for connectedvehicles in the proximity of signalizedintersectionsEvangelos Mintsis1* , Eleni I. Vlahogianni1, Evangelos Mitsakis2 and Seckin Ozkul3
Abstract
Technological advancements in the field of transportation are gradually enabling cooperative, connected andautomated mobility (CCAM). The progress in information and communication technology (ICT) has providedmature solutions for infrastructure-to-vehicle (I2V) communication, which enables the deployment of Cooperative-ITS (C-ITS) services that can foster comfortable, safe, environmentally friendly, and more efficient traffic operations.This study focuses on the enhancement of speed advice comfort and safety in the proximity of signalizedintersections, while ensuring energy and traffic efficiency. A detailed microscopic simulation model of an urbannetwork in the city of Thessaloniki, Greece is used as test bed. The performance of dynamic eco-driving is evaluatedfor different penetration rates of the dynamic eco-driving technology and varying traffic conditions. The simulationanalysis indicates that speed advice can be comfortable and safe without adversely impacting energy and trafficefficiency. However, efficient deployment of dynamic eco-driving depends on road design characteristics, activationdistance of the service, traffic signal plans, and prevailing traffic conditions.
Keywords: Dynamic eco-driving, Enhanced speed advice, Connected vehicle, Microscopic traffic simulation,Signalized intersection, Greenhouse gas emissions
1 IntroductionC-ITS and Advanced Driver Assistance Systems (ADAS)can significantly enhance comfort, safety, traffic efficiencyand energy savings via real-time information provision(tailored to the needs of individual vehicles), and coopera-tive driving [30]. Road safety impact assessment of the lat-ter systems has been conducted through real worldexperiments [26] and with the use of microscopic trafficsimulation tools [31] that utilize surrogate measures ofsafety to indicate conflict risk for both uninterrupted andinterrupted traffic flow [3, 9, 10, 12, 22].C-ITS applications and ADAS that enable eco-driving
and yield environmental benefits have also receivedsignificant attention from funding agencies, vehicle
manufacturers, road authorities, technology providers, andthe research community. Specifically, dynamic eco-drivingin the proximity of signalized intersection uses real-timetraffic and Signal Phase and Timing (SPaT) information tocommunicate robust and real-time speed and/or count-down advice to connected vehicles (CVs). Comprehensivereviews discussing different aspects of dynamic eco-driving in a connected (and automated) road environmentcan be found in [2, 13, 16, 29, 45, 47, 49].Methodologically, the operation and performance of
dynamic eco-driving was previously assessed throughmicroscopic traffic simulation studies, driving simula-tors, controlled field experiments and real-world experi-ments [29].
© The Author(s). 2021 Open Access This article is licensed under a Creative Commons Attribution 4.0 International License,which permits use, sharing, adaptation, distribution and reproduction in any medium or format, as long as you giveappropriate credit to the original author(s) and the source, provide a link to the Creative Commons licence, and indicate ifchanges were made. The images or other third party material in this article are included in the article's Creative Commonslicence, unless indicated otherwise in a credit line to the material. If material is not included in the article's Creative Commonslicence and your intended use is not permitted by statutory regulation or exceeds the permitted use, you will need to obtainpermission directly from the copyright holder. To view a copy of this licence, visit http://creativecommons.org/licenses/by/4.0/.
* Correspondence: [email protected] of Transportation Planning and Engineering, School of CivilEngineering, National Technical University of Athens, 5 Iroon PolytechniouStr., Zografou Campus, 15773 Athens, GreeceFull list of author information is available at the end of the article
European TransportResearch Review
Mintsis et al. European Transport Research Review (2021) 13:2 https://doi.org/10.1186/s12544-020-00458-y

The operation of most dynamic eco-driving models re-lies on the assumption that traffic signals are pre-timed[5, 20, 27, 40, 41, 50, 55]. However, researchers devel-oped and simulated methodologies that facilitate theimplementation of dynamic eco-driving services for ac-tuated and adaptive traffic lights using empirical signaland loop detector data [6, 14, 25, 32, 44, 53]. Erdmannand Liang et al. [11, 23] proposed the combination ofadaptive signal control with Green-Light-Optimal-Speed-Advisory (GLOSA) to develop signal plans thatexploit vehicle state information.Efforts were also placed for the development of dy-
namic eco-driving models that can estimate energy andtraffic efficient speed advice for CV platoons in the prox-imity of signalized intersections [7, 43, 52, 54, 59].Recently, artificial intelligence has been also used for ap-plying dynamic eco-driving control in the proximity ofsignalized intersections [33, 58].The majority of proposed dynamic eco-driving models
that were evaluated with the use of microscopic trafficsimulation tools considered hypothetical networks withsimplified demand scenarios [5, 18, 27, 41, 42, 55, 56]. Afew studies focused on real-world isolated signalized in-tersections [21, 48], and others simulated either singlevehicle [15] or multi vehicle [4, 46, 51] scenarios alongactual urban arterial corridors (very limited informationis provided though regarding the calibration and valid-ation of the respective real-world simulation models).Moreover, deceleration strategies received greater inter-est, since they provide higher energy savings potential,while some researchers considered the recommendationof acceleration as safety critical [41]. Finally, focus hasbeen also placed in modelling and simulation of humanfactors related to dynamic eco-driving [24, 38, 40, 57].The literature review indicates that limited focus was
previously placed on the comfort and safety of dynamiceco-driving technologies [29]. Early evidence from fieldtesting of an eco-cruise control system in the vicinity oftraffic signalized intersections showed that manual speedadaptation based on countdown advice proved less com-fortable, but equally safe and desirable compared to au-tomated eco-cooperative adaptive cruise control (Eco-CACC) [39]. Thus, there is significant potential for en-hancing dynamic eco-driving performance via the intro-duction of novel features that improve comfort, useracceptance and safety.Undoubtedly, drivers/passengers would be more will-
ing to adopt dynamic eco-driving if it ensured comfort-able, safe and intuitive speed advice. According to theprofile of existing deceleration strategies, a CV initiallydecelerates and subsequently cruises at a steady-statespeed towards a signalized intersection until the signalstatus changes to green, when vehicle accelerates back toits desired speed beyond the signalized intersection. This
implies that existing dynamic eco-driving services in-struct CVs to cruise at significant steady speed while thevehicle approaches the signalized intersection and thesignal status remains red. In this case, many drivers/pas-sengers would feel uncomfortable driving/riding a ve-hicle that cruises in close vicinity to a signalizedintersection while the traffic light status is still red. Thatwould be especially true in the early stages of CVs mar-ket introduction when mixed traffic conditions are ex-pected to prevail on the streets and drivers/passengerswill be less familiar with CV technology.This study proposes and evaluates enhancements on
an existing dynamic eco-driving model (velocity plan-ning algorithm – VPA) that encompass the followingnovel features:
� provision of non-crawling speed advice, and� vehicle acceleration begins prior to CV arrival at
signalized intersection after deceleration strategy
The enhanced VPA is examined with the use of micro-scopic traffic simulation along an actual urban arterialcorridor that was thoroughly calibrated against real traf-fic conditions.
2 Enhanced speed adviceEnhanced dynamic eco-driving accounts for intuitivespeed advice that drivers/passengers can easily and con-veniently adapt to, and encompasses comfortable accel-erations/decelerations, acceptable cruising speeds, aswell as guidance that facilitates safe interactions withsurrounding road users and elements (e.g. traffic lights).As mentioned above, existing literature has overlookedspecific aspects of speed advice pertaining to comfortand safety which this study aims to address. To this end,we present in the following sections the reference model(VPA) previously developed by [55] and an enhancedVPA version proposed by this study that promotes speedadvice comfort and safety without adversely impactingenergy and traffic efficiency.
2.1 Velocity planning algorithm (VPA)Xia et al. [55] introduced VPA considering that energysavings can be realized when drivers exhibit the follow-ing behavior:
� maintain a steady-state speed near the speed limit,� keep a safe headway distance from the leading
vehicle, and� avoid idling, or idle the least possible time at the
traffic light if this is unavoidable.
Thus, an optimization problem was formulated thatminimized a vehicle’s tractive force and idling time while
Mintsis et al. European Transport Research Review (2021) 13:2 Page 2 of 14

accounting for ride comfort and the local speed limit(vlim). To avoid stopping at a traffic light, a vehicleshould arrive at the signalized intersection during agreen signal status. Based on the current signal status, agreen arrival interval can be estimated as:
tarrival ¼0; trg½ or t½ g ; tr1Þ; if signal status ¼ green
tg ; trÞ;�
if signal status ¼ red
�
ð1Þ
where tr is the time to the upcoming red phase, tg rep-resents the time to the next green phase, and tr1 is thetime to the second red phase. Thus, if the signal is green,a vehicle can either cruise at current speed or accelerateto a target speed to pass through the intersection duringthe first green window or decelerate and cross the inter-section during the second green window. If the signal isred (yellow time is considered to be red time), the ve-hicle can cruise at current speed or decelerate to a targetspeed to cross the intersection during the upcominggreen window.The possible values of tarrival can range between [tl, th],
where tl and th are low and high values according to Eq.1. Given the range [tl, th] and the vehicle’s distance tointersection dint, the possible target velocities varrival canbe expressed as the range [vl, vh], where vl is the max-imum between zero and vlo(vlo = dint/th) and vh is theminimum between vlim and vho(vho = dint/tl). Evidently,dint and signal timing information are key parametersfor the estimation of optimal speed trajectories.When varrival is estimated, the provision of speed ad-
vice to CV is determined according to its current speedvc. If vc lies within [vl, vh], then the vehicle can pass theintersection cruising at current speed. Alternatively, itcan accelerate or decelerate with respect to vh, which[55] have selected as the target velocity to achieve traveltime savings apart from environmental benefits. Theenergy-efficient speed profiles are estimated accordingto the following functions:
vopt ¼
vh − vd� cos μtð Þ; for 0≤ t <π2μ
vh − vd� μρ � cos t −π2μ
þ π2ρ
� �; for
π2μ
≤ t <π2ρ
þ π2μ
� �
vh þ vd� μρ forπ2ρ
þ π2μ
� �≤ t≤
dint
vh
8>>>>>><
>>>>>>:
ð2Þ
where vd is equal to vh − vc. Positive vd values generateacceleration profiles, and negative values generate decel-eration profiles. The only unknown parameters in Eq. 2are μ and ρ, which determine the acceleration/deceler-ation rate. The higher the value of μ, the higher the
acceleration/deceleration rate. The values of μ and ρ canbe computed by solving the following three constraints:
Z π2μ
0vh − vd� cos μtð Þð Þdt þ
Z π2ρþ π
2μ
π2μ
vh − vd� μρ � cosρ t −π2ρ
þ π2μ
� �� �dt
þ vh þ vd� μρ� �
� dint
vh−
π2ρ
−π2μ
� �¼ dint
jerkmax ¼ vd�μ�ρj j≤10 and amax≤2:5 m=s2
μ ¼ max μf g
8>>>>>>><
>>>>>>>:
ð3Þ
The first constraint in Eq. 3 is the distance constraint,which ensures vehicle’s arrival at the downstream signal-ized intersection in the shortest time. The second con-straint pertains to ride comfort. The third was set basedon the finding of [55], which suggests that minimizationof fuel consumption and emissions occurs for the largestpossible μ value (i.e. a vehicle accelerates sharply insteadof smoothly to vh). Moreover, it has to be noted thatVPA can be explicitly implemented at signalized inter-sections with fixed signal control plans, and it does notconsider queue dynamics at signalized intersections. Amore detailed description of VPA can be found in [55].
2.2 Enhanced velocity planning algorithm (EVPA)This study introduced enhancements to the control logicof the reference model (VPA) accounting for actual be-havioral traits of drivers. The enhanced velocity planningalgorithm (EVPA) increases the comfort and safety ofthe provided speed advice to facilitate acceptance of dy-namic eco-driving service from the driver’s/passenger’sside.The control logic of the reference model implies that
the minimum speed advice is an explicit function of thevehicle’s traveling state (approach speed and distance tothe signalized intersection) and the signal timing infor-mation of the signalized intersection. Thus, vl could ac-quire rather low values (e.g. 10 km/h), which impliesthat a vehicle might be advised to cruise towards a sig-nalized intersection at a crawling speed. However, inpractice, drivers would refrain from driving below aminimum speed threshold (anxiety reasons), irrespectiveof the provided speed advice. Thus, the authors proposethat varrival is not only bounded on the upper limit bythe speed limit, but also on the lower limit by a mini-mum acceptable speed value (vmin). Therefore, vl wouldbecome the maximum between vmin and vlo(vlo = dint/th).It is expected that this enhancement will increase the in-direct benefits of dynamic eco-driving, since legacy vehi-cles (LVs) will overtake CVs less frequently, thusinducing less turbulence to traffic. Additionally, previousresearch has shown that cruising at low speeds at theend of deceleration strategies might incur higher energy
Mintsis et al. European Transport Research Review (2021) 13:2 Page 3 of 14

consumption, even compared to a standstill strategy[41].
The second enhancement also pertains to decelerationstrategies. According to the control logic of existing dy-namic eco-driving models, a CV’s arrival at traffic lightsafter the implementation of a deceleration strategy isconcurrent with the onset of the green phase. However,many drivers/passengers would feel uncomfortable rid-ing a vehicle that cruises at high steady speed in closevicinity to a signalized intersection while the signal sta-tus is still red. Therefore, this study suggests that thelowest cruising speed vcr of the initially estimated decel-eration profile is used for the computation of the CV’spractical stopping distance, assuming it had compliedwith the initial deceleration strategy. In this case, the ve-hicle’s practical stopping distance dstop is given by thefollowing formula:
dstop ¼ v2cr
2gadg
� �� G
� � ð4Þ
where ad is the deceleration rate, g is the gravitationalconstant, and G is the roadway grade. Eq. 4 provides anestimate of typical braking distances and is more sim-plistic and usable than the theoretical stopping distanceone. Given the assumption that CVs fully stop and roadgrades are small, mass factor accounting for moments ofinertia during braking (which is considered for the esti-mation of theoretical stopping distance) can be ignoreddue to its small effects [28]. Moreover, we assume thatfriction is always guaranteed in our simulation experi-ments and anomalous situations such as sudden andstrong braking do not occur.
Subsequently, the practical stopping distance is sub-tracted from dint, and the result (d′ = dint − dstop) isreturned to the algorithm for the estimation of an en-hanced deceleration profile. According to this updateddeceleration profile, the vehicle decelerates to a lowercruising speed v
0cr compared to the initial one, but the
onset of the green phase occurs prior to the vehicle’s ar-rival at the signalized intersection. Moreover, sufficienttime and space remain available for the CV to stop incase of red light running from the opposite direction.Since the practical stopping distance is a function of thevehicle’s cruising speed, the EVPA is expected to per-form efficiently within a wide range of cruising speeds.The enhanced dynamic eco-driving service is expectedto be perceived as more intuitive, convenient and saferby drivers, who would thus increase their confidence re-garding the system’s operation and performance.
3 Simulation experiment3.1 Microscopic traffic simulation modelA detailed microscopic simulation model of an urban ar-terial corridor in the city of Thessaloniki, Greece, wasdeveloped with the use of the microscopic traffic simula-tion tool Aimsun. Its total length is 15 km (road grade isnearly zero across the full length of the corridor) and itencompasses 26 signalized intersections (17 equippedwith road-side units) which are controlled by pre-timedsignal control plans. The reference and the enhanced dy-namic eco-driving services were deployed on 23 signal-ized intersection approaches (IA) (highlighted in yellow)of the examined simulation network (Fig. 1). Side-streetparking and seven public transport lines (along withtheir corresponding time plans) that travesrse the centralbusiness district (CBD) of Thessaloniki were simulatedas well.A thorough macroscopic calibration process was con-
ducted to ensure the ability of the microscopic trafficsimulation model to replicate actual traffic operations(without dynamic eco-driving service) on the examinedroad network. Calibration parameters of Aimsun drivermodels (car-following, lane-changing, and gap-acceptance models) were adjusted for the reconciliationof field and simulated traffic counts. Field traffic datawere obtained from several traffic detectors that monitortraffic conditions in the CBD of Thessaloniki. The latterdata contain traffic volumes, average time mean speed,and travel time information for selected network routes.Field and simulated traffic counts were used for the
conduct of the appropriate statistical test (GEH) to verifythe validity of the simulation model [8]. The estimatedGEH values were lower than 5 for more than 85% of theselected detector stations (volume and speed counts).Moreover, GEH index was also lower than 5 when com-paring average travel time between field and simulationalong the urban arterial corridor shown in Fig. 1. Thus,the calibration procedure demonstrated that the simula-tion model can credibly replicate traffic operations per-taining to manual driving on the test network.However, we also deem that our simulation model re-
mains valid for different market penetration rates of dy-namic eco-driving technology, since we assumed thatCVs are manually driven beyond the service activationzone (cf. Section 3.2) and existing literature [2, 13, 16,29, 45, 47, 49] addressing the impacts of dynamic eco-driving on traffic operations does not indicate changesto route choice due to speed advice provision in theproximity of signalized intersections.
3.2 (E)VPA - Application Programming Interface (API)VPA and EVPA were simulated in Aimsun with the useof an Application Programming Interface (API) that wasdirectly interfaced with the core Aimsun models. The
Mintsis et al. European Transport Research Review (2021) 13:2 Page 4 of 14

API estimates a single energy optimal driving strategyfor every CV that enters the dynamic eco-driving serviceactivation zone. Then, the CV becomes “tracked” in thesimulation and strictly follows the provided speed advice(every simulation time step) until it crosses the signal-ized intersection. Thus, CVs fully comply with the esti-mated speed advice within the service activation zone.However, a CV can discard speed advice if it enters car-following state. An empirical formula was used to assessthe car-following state of CVs during the simulation[37]. The maximum car-following distance is given as:
xcf ¼ Tuk − 1 þ β ð6Þ
where T is a time constant, uk − 1 is the speed of thefollowing vehicle, and β is the average distance betweentwo vehicles in standstill. If a CV’s distance to the leaderbecomes shorter than xcf, then it becomes “untracked” inthe simulation and its motion is subsequently dictatedby the Aimsun driver models. In this case, an updatedspeed advice is not provided to the CV even though it isstill driving within the activation zone. The behavior ofCV beyond the activation zone is determined by Aimsundriver models that are parametrized to reflect manualdriving conditions.The length of the activation zone (per signalized IA) is
set equal to the total length of the corresponding signal-ized IA (road section between two consecutive intersec-tions). During the simulation of VPA, the estimatedspeed advice can range between 5 and 50 km/h. On theother hand, while EVPA is simulated the estimatedspeed advice can range between the minimum cruisingspeed after deceleration (20 km/h) and the speed limit
(50 km/h). Table 1 provides an elaborate list of the par-ameter values that affect the operation of the referenceand enhanced models in the simulation experiments.
3.3 Microscopic emission modelTo estimate carbon dioxide (CO2) emissions within thesimulation loop (second-by-second estimation, 1 Hz.),the Panis microscopic emission model calibrated withreal world emission data is used [36]. As this modelcombines multiple non-linear regression models to esti-mate emission functions per vehicle type and pollutant(with instantaneous speed and acceleration as explana-tory variables) it was considered relevant for the evalu-ation of the environmental impacts of dynamic eco-driving.The fleet composition with respect to engine type for
Greece was obtained from [1]. To this end, in our simu-lation experiments taxis, heavy duty vehicles (HDV), andbuses run on diesel engines. Passenger cars are dividedinto the following shares according to their fuel type:92% petrol, 5% diesel, and 2% LPG. The emission
Fig. 1 Test site in Thessaloniki, Greece (real world and simulation)
Table 1 Parameter values used in the simulation experiments
Variables Description Value(s)
vlim Speed limit (km/h) 50
μ Acceleration rate parameter (m/s ^ 2) 0.15
vmin Minimum cruising speed after deceleration (km/h) 20
g Gravitational constant (m/s ^ 2) 9.807
ad Normal deceleration rate (m/s ^ 2) 4.00
G Road grade (%) 0
T Time constant (sec) 1.02
β Average headway distance in standstill (meters) 3.5
Mintsis et al. European Transport Research Review (2021) 13:2 Page 5 of 14

constants used for the estimation of CO2 emissions percombination of vehicle and engine type are presented inTable 2.
3.4 Simulation scenariosThe performance of the reference (VPA) and the pro-posed (EVPA) speed advice algorithms was assessed fordifferent traffic demand levels and different penetrationrates of the dynamic eco-driving technology (Table 3).In total, 48 scenarios were simulated (38 with service onand 10 with service off). The calibration scenario corre-sponds to D100 traffic demand level (initial demand in-put to the microscopic simulation model). The effect ofthe penetration rate of the CV technology was testedboth for uncongested (D50) and congested (D100) trafficconditions. On the other hand, the performance of CVtechnology for a wide spectrum of traffic conditions(uncongested – near congested – congested/D10 –D100) was evaluated for three different penetration rates(low – moderate – high/P15 – P50 – P100). Speed ad-vice was explicitly provided to passenger cars and taxisamong the simulated vehicle types (passenger cars, taxis,trucks, and buses), since the reference model was expli-citly developed for light-duty vehicles.Aimsun is a stochastic microscopic traffic simulation
tool. Thus, multiple runs of each simulated scenariowere executed so that the obtained simulation outputscan be statistically significant. Initially, five runs of thecalibration scenario were executed (each correspondingto a different random seed) and statistics of the averagenetwork speed were collected. The required number ofruns is determined based on the standard deviation ofspeed for a specific significance level and the tolerableerror [35]. In this case, for 95% significance level and tol-erable error equal to 0.5 km/h, the required number ofruns was determined to be 10.
4 ResultsSimulation results were analyzed for the “do-nothing”(i.e. no dynamic eco-driving), VPA, and EVPA scenariosin three different aggregation levels:
� single vehicle performance (along different routes)� average section statistics (along different IAs)
� average network-wide statistics (whole simulatednetwork)
To facilitate the description of the results we use thecapital letters assigned to different traffic lights of thetest site (Fig. 1) to indicate road sections of interest inthe context of this analysis. Specifically, the notation{R→Q} connotes the road section between traffic lightsR and Q. The arrow symbol determines the direction oftraffic along the road section. In the cases of VPA andEVPA scenarios, it is also implied that dynamic eco-driving is deployed on the corresponding road section.The analysis of simulation results is presented in threededicated subsections (per aggregation level) below.
4.1 Single vehicle performanceThe analysis of single vehicle performance encompassesfour different types of plots: a) speed vs distance, b)speed vs time, c) cumulative CO2 emissions vs distance,and d) acceleration vs speed. These plots reveal the in-fluence of dynamic eco-driving on CV behavior and thecorresponding CV performance in terms of CO2 emis-sions. The CV performance displayed in Figs. 2 and 3pertains to traffic demand level D50, penetration rateP100 and two different routes of the test site.Figure 2 shows information about a single CV per-
formance along IA:{R→Q} (one-way multi-lane roadsegment). While the CV has to stop at the traffic light inthe “do-nothing” scenario, it can adopt a decelerationstrategy in the VPA and EVPA scenarios to avoid astandstill and generate lesser CO2 emissions. However, itcan be seen (in the focus area of the right top plot) thatthe EVPA algorithm allows the CV to cruise at a mar-ginally lower speed compared to the VPA one, and con-sequently begin acceleration approximately 10 mupstream of the traffic light (when the signal statuschanges to green).As explained in Section 3 of this study, the latter be-
havior can promote comfort, safety and user acceptanceof the system since the CV will not reach the traffic light(in red status) at cruising speed (enhanced speed advice);and increase intersection safety since there will be fur-ther available time for intersection clearance or CV tac-tical maneuvering in case of red light running from
Table 2 CO2 emission constants per combination of vehicle and engine type
Vehicle Type Engine Type E0 f1 f2 f3 f4 f5 f6
Car Petrol 0 0.553 0.161 −0.003 0.266 0.511 0.183
Car Diesel 0 0.324 0.086 0.005 −0.059 0.448 0.23
Car LPG 0 0.6 0.219 −0.008 0.357 0.514 0.17
Taxi Diesel 0 0.324 0.086 0.005 −0.059 0.448 0.23
HDV Diesel 0 1.52 1.88 −0.07 4.71 5.88 2.09
Bus Diesel 0 0.904 1.13 −0.043 2.81 3.45 1.22
Mintsis et al. European Transport Research Review (2021) 13:2 Page 6 of 14
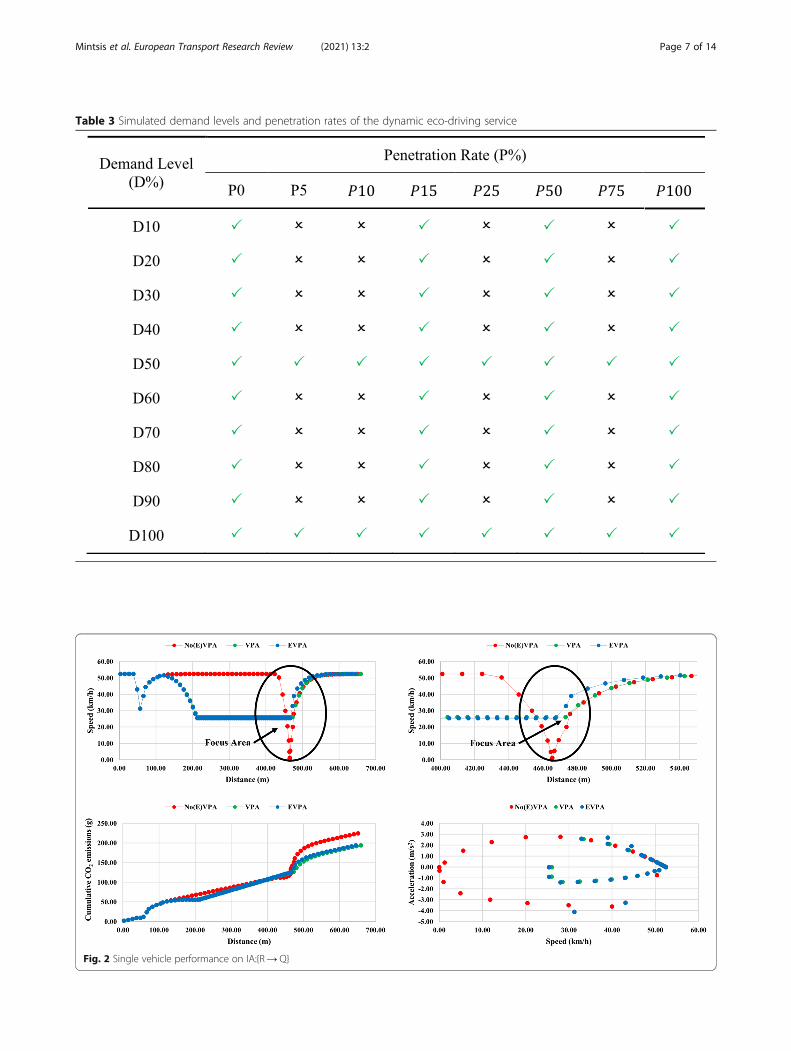
Table 3 Simulated demand levels and penetration rates of the dynamic eco-driving service
Fig. 2 Single vehicle performance on IA:{R→Q}
Mintsis et al. European Transport Research Review (2021) 13:2 Page 7 of 14

vehicles driving along other directions (possible scenarioin mixed traffic conditions). Interestingly, the EVPA de-celeration strategy does not adversely impact CO2 emis-sions savings. This is also justified by the sameacceleration/deceleration patterns between VPA andEVPA depicted in Fig. 2 (bottom right plot).The behavior of a single CV with (VPA and EVPA)
and without (“do-nothing”) dynamic eco-driving tech-nology is examined along the urban arterial corridor{O→A}. Every signalized intersection is equipped witha road-side unit (RSU) along the corridor (one-way four-lane urban arterial corridor with reserved bus lane onthe right-most lane and side-street parking on the left-most lane), thus enabling CVs to implement separate ac-celeration/deceleration strategies per IA.Figure 3 (top plots) indicates that VPA allows the CV
to successfully execute a deceleration strategy thrice,while EVPA only once given road characteristics, pre-vailing traffic conditions, and deployed traffic signalplan. However, the first two deceleration strategies sug-gested by VPA lead to rather low cruising speeds (< 20km/h) that can be non-acceptable by drivers or passen-gers in the case of fully autonomous vehicles. Moreover,they yield CO2 emissions savings that are not significantcompared to the “do-nothing” and EVPA scenarios whenthe same CV has to fully stop at the traffic light and ac-celerate back to desired speed from standstill.Nonetheless, a noteworthy observation is that dynamic
eco-driving alters the traffic patterns of CVs even inspace and time intervals that energy optimal driving
strategies are not applied or possible. Thisphenomenon can generate unfavorable conditions forthe CV due to surrounding traffic (queued vehiclesdisrupting the adoption of speed advice) or mistimedentrance at an intersection approach. Hence, the cu-mulative CO2 emissions of the CV (EVPA case) even-tually surpass those of the unequipped equivalent (leftbottom plot) along the examined path. Finally, resultsdemonstrate that the VPA produces milder acceler-ation/deceleration rates for the examined CV (rightbottom plot), and thus lesser cumulative CO2 emis-sions along its travelled path {O→A}.
4.2 Individual intersection approach statisticsA plethora of information is provided to scrutinize theperformance of dynamic eco-driving on two benchmarkIAs of the test site and compare the behavior of VPAand EVPA methods. The evaluation of the different algo-rithms is conducted in terms of CO2 emissions (gr/km),number of stops per vehicle, and mean travel time (sec-onds). The reported travel time and CO2 emissions re-sults also consider the road sections downstream of theexamined IAs where benefits from energy efficient decel-eration strategies can be realized. Moreover, a compre-hensive analysis of the provided speed advice ispresented per IA. Results are analyzed for traffic demandlevels D50 (uncongested conditions) and D100 (con-gested conditions), and penetration rates ranging be-tween P5 – P100.
Fig. 3 Single vehicle performance on urban arterial corridor {O→ A}
Mintsis et al. European Transport Research Review (2021) 13:2 Page 8 of 14

IA:{R→Q} was selected as benchmark in the contextof this study since it is isolated and vehicle arrival pat-terns are not influenced by implementation of dynamiceco-driving along upstream IAs. Moreover, it is a one-way four-lane road section spanning up to 360 m wherethere is available space for CVs to adopt dynamic eco-driving maneuvers. SPaT messages are received up to360 m upstream of signalized intersection Q by CVs,and 65.00 s of the signal cycle (72.22% of the cycle dur-ation) are allocated to the through movement (speed ad-vice is estimated specifically for this movement). Theminimum cruising speed is 20 km/h in the case ofEPVA, and 5 km/h in the case of VPA. An influencezone calibration parameter of 0.01 indicates that CVswill reach the traffic signal on red light status while driv-ing at cruising speed in the end of a deceleration strategy(VPA scenario). On the other hand, a 0.5 parametervalue (EVPA scenario) ensures that CVs’ accelerationwill commence prior to arrival on red signal status tothe intersection stop line.Despite increased demand in D100, traffic conditions
remain uncongested along IA:{R→Q} (Fig. 4). Mean
travel time (min/km) is slightly affected by dynamic eco-driving (bottom plots) and mostly for higher penetrationrates (> 75%). Both VPA and EVPA manage to signifi-cantly reduce idling (number of stops/veh) in mixed traf-fic, while stop events almost vanish in the case of fullyequipped fleet (middle plots). However, it can be noticedthat for low to intermediate penetration rates (P15 –P50) and highest demand level (D100) EVPA outper-forms VPA in terms of preventing CV stops at trafficlight Q. VPA advices lower cruising speeds in the con-text of deceleration strategies, and thus non-equippedvehicles (which represent the highest share in the fleetmix for low penetration rates of dynamic eco-drivingtechnology) tend to overpass CVs causing more stops attraffic lights compared to the EVPA scenario. Both algo-rithms generate CO2 emissions savings beyond mediumpenetration rate (P50) that are maximized for fullyequipped fleet (P100). Maximum CO2 emissions savingsrise approximately to 7.0% (top plots) and do not occurin the expense of significant travel time costs (bottomplots). Moreover, VPA and EVPA exhibit similar CO2
emissions savings potential in the case of IA:{R→Q}.
Fig. 4 Key Performance Indicators (KPIs) of dynamic eco-driving deployment on IA:{R→Q}
Mintsis et al. European Transport Research Review (2021) 13:2 Page 9 of 14

The reason IA:{N → M} is selected as benchmark andstudied explicitly is multifold. IA:{N → M} is part ofurban arterial corridor {O→A} where dynamic eco-driving is deployed on all signalized IAs (Fig. 1). It is oneof the few IAs on urban arterial corridor {O→A} thatspans 240 m long, thus providing enough space for CVsto execute dynamic eco-driving maneuvers. Additionally,it is fed with traffic by three different IAs (i.e. {O→N},{P→N}, and {R→N}) where dynamic eco-driving isalso applied. Hence, vehicle arrival patterns vary signifi-cantly on IA:{N → M} giving the opportunity to test dy-namic eco-driving for different CV approach speeds(also influenced upstream by dynamic eco-driving). Fur-thermore, 62.00 s of the signal cycle (68.89% of the cycleduration) are allocated to the through movement (speedadvice is estimated specifically for this movement).Consequently, there is adequate red duration to induceenergy efficient deceleration strategies. Algorithmic set-tings (VPA and EVPA) for IA:{N → M} are similar tothat of {R → Q}.Congested conditions prevail along IA:{N → M} for
the highest demand level (D100). Mean travel time in-creases four times compared to uncongested conditions(D50) for the “do-nothing” scenario (Fig. 5). The deploy-ment of dynamic eco-driving further disrupts traffic flowon IA:{N → M} for higher penetration rates. As ex-plained in Section 3 of this study, both VPA and EVPAdo not account for traffic light queues when estimatingacceleration/deceleration strategies. Therefore, CVs canreceive speed advice upon entrance to the intersectionapproach but eventually will need to abort it (due toreaching tail of queue), thus escalating travel time andCO2 emissions. Noticeably, EVPA outperforms VPA onthe basis of the examined KPIs (left plots – D100) forthe majority of the tested penetration rates (most signifi-cant difference for higher penetration rates). Due to thehigher minimum speed advice threshold in the case ofEVPA (i.e. 20 km/h), lesser speed advices are provided toequipped vehicles, hence reducing the intensity of dis-ruption to the traffic flow and CO2 emissions perform-ance incurred by dynamic eco-driving.On the other hand, traffic conditions are uncongested
along IA:{N → M} for the intermediate demand scenario(D50). Queued traffic almost diminishes at traffic lightM (Fig. 5 – middle right plot) for higher penetrationrates (> 75%). EVPA generates CO2 emissions savingsalong IA:{N → M}, which approximately rise to 13.0%and 8.5% reduction compared to the “do-nothing” andVPA scenarios respectively (Fig. 5 – top right plot). Not-ably, EVPA exhibits significantly improved performancecompared to VPA with respect to emissions reduction,although it adapts speed advice to improve comfort andsafety. Finally, it can be observed that for low to inter-mediate penetration rates vehicle stops increase with
deployment of VPA. This phenomenon occurs due tothe behavior of non-equipped vehicles as it was ex-plained in the aforementioned analysis of simulation re-sults for IA:{R→Q} as well.
4.3 Network-wide statisticsThe effects of dynamic eco-driving (VPA and EVPA) onnetwork performance are assessed in terms of: i) averagenetwork speed, b) CO2 emissions per kilometer driven(gr/km), and c) average stop time per kilometer driven(s/km). Network-wide statistics are reported for the fullspectrum of examined demand levels (D10 – D100) andtwo penetration rates (P50 and P100) to identify trigger-ing points for VPA and EVPA activation according tothe prevailing traffic conditions on the examined testsite.Figure 6 indicates that both VPA and EVPA can yield
CO2 emissions savings when average network speed isover 25 km/h (D10 – D80), but the latter savings are in-significant though. Moreover, network-wide savings di-minish as traffic demand shifts from light to moderate(D10 → D80). On the other hand, the tested algorithmsexhibit similar performance to the “do-nothing” case forheavy traffic conditions (congestion) when average stoptime increases significantly both for 50% and 100% pene-tration rates. As aforementioned, this is reasonable con-sidering that both algorithms are not designed toaccount for traffic light queues when estimating energyefficient speed advice. Moreover, it can be seen thatlower share of CVs in the fleet mix (P50) results inslightly lesser impacts of dynamic eco-driving on thenetwork scale compared to the case of fully equippedfleet (P100).VPA generates marginally higher CO2 emissions sav-
ings compared to EVPA in uncongested conditionswhen the whole test site is considered. However, thesesavings are realized in the expense of marginally in-creased travel times. Longer travel times are expected inthe VPA scenarios due to the minimum speed advicethreshold (i.e. 5 km/h). Lower CO2 emissions on the net-work level can be attributed to more energy efficientpatterns generated by VPA at areas of the networkwhere speed advice is not implemented successfully orat all as previously highlighted and explained in the ana-lysis of single vehicle performance. Finally, the lowerstop times observed for VPA can be also ascribed tocrawling speeds that can be advised by the latteralgorithm.
4.4 DiscussionSimulation results indicate that EVPA can exhibit similaror even better performance compared to VPA for spe-cific road characteristics, activation distances of dynamiceco-driving service, traffic conditions and traffic signal
Mintsis et al. European Transport Research Review (2021) 13:2 Page 10 of 14

plans, despite adapting speed advice to improve user ac-ceptance and intersection safety. It is also noteworthy,that improved EVPA performance occurs when VPA ad-vices deceleration strategies that encompass cruisingspeeds that undercut the minimum cruising speed afterdeceleration (vmin). For this reason EVPA and VPAperformance is similar along IA:{R→Q}, while EVPAsignificantly outperforms VPA in the case of IA:{N → M}. Moreover, the fact that EVPA suggests vehicleacceleration prior to CV arrival at the signalized inter-section after deceleration strategies does not weaken itsability to yield CO2 emissions savings.On the other hand, the analysis of single vehicle per-
formance and network-wide statistics revealed that VPAslightly outperforms EVPA in terms of environmentalbenefits on the network level. Nonetheless, this occurs atthe cost of marginally higher travel times. Both VPA andEVPA generate different traffic patterns on the examinedtest site even in areas where speed advice is not feasibledue to surrounding traffic or mistimed arrival at inter-section approach.
Moreover, both algorithms do not produce significantnetwork-wide emissions savings compared to the “do-nothing” scenario even for low to moderate traffic de-mand. As it can be seen in Fig. 1, traffic lights are closelyspaced beyond traffic light M along the urban arterialcorridor {O→A}, where the speed limit is 50 km/halong {O→A}. Thus, dynamic eco-driving benefits di-minish due to low approach speeds, confined speedrange and space for adapting to speed advice, and VPA/EVPA algorithmic logic that considers single signalizedintersections for estimating energy efficient driving strat-egies instead of multi-intersection corridors controlledby traffic lights. Previous research has also indicated thatinappropriate deployment of dynamic eco-driving couldeven generate environmental disbenefits due to unfavor-able factors [39, 40, 46, 55]. Hence, the deploymentscheme of dynamic eco-driving that encompasses roaddesign characteristics, activation distance of the service,traffic signal plans and traffic conditions significantlyaffect its energy efficiency and emissions savingspotential.
Fig. 5 KPIs of dynamic eco-driving deployment on IA:{N→M}
Mintsis et al. European Transport Research Review (2021) 13:2 Page 11 of 14

According to the latter information, it is important toidentify the deployment scheme that enables EVPA toperform efficiently (in terms of CO2 emissions reduc-tion) on the network scale. Thus, travel time, user ac-ceptance and safety benefits also provided by EVPA canbe realized.Additionally, we show that VPA and EVPA deteriorate
traffic conditions during congestion since they do notconsider traffic light queues for speed advice estimation.The corresponding simulation results pose irregular pat-terns with respect to speed advice efficiency and CO2
emissions. Notably, interactions between CVs and non-equipped vehicles become more complex especially inthe case of VPA when crawling speeds can be advised toCVs.Finally, it is of note that we assumed full diver compli-
ance to speed advice in the context of this simulationstudy. However, human factors can exert significant im-pacts on traffic flow performance [34] and intersectionsafety [17, 19]. Hence, we plan to address partial compli-ance to speed advice based on real-world data in future
research efforts and assess safety implications of humanfactors with respect to dynamic eco-driving with the useof rigorous mathematical methods such as the SurrogateSafety Assessment Model (SSAM).
5 ConclusionsCV applications have received significant attention fromthe research community in the past two decades. Severaldynamic eco-driving models were proposed for the esti-mation of energy efficient speed advice in the vicinity ofsignalized intersections. This study focused on the en-hancement of speed advice comfort and safety withoutnegatively affecting energy and traffic efficiency. Amicroscopic simulation analysis on an actual urban net-work is conducted to evaluate the performance of an en-hanced velocity planning algorithm (EVPA) for differentpenetration rates of dynamic eco-driving technology andtraffic demand levels.Simulation results indicated that EVPA can generate
CO2 emissions savings on the order of 13% along indi-vidual intersection approaches and 2.5% on a network
Fig. 6 Average network KPIs of dynamic eco-driving deployment on Thessaloniki’s test site
Mintsis et al. European Transport Research Review (2021) 13:2 Page 12 of 14

scale, without substantially escalating travel times. More-over, EVPA ensures increased speed advice comfort andsafety due to its inherent control logic. However, it wasalso identified that EVPA’s efficiency is dependent onroadway characteristics, activation distance of the ser-vice, traffic signal plans and traffic conditions. Thus, thedeployment scheme of dynamic eco-driving on urbannetworks plays a significant role in warranting environ-mental benefits and traffic efficiency.Additionally, it was proven that speed advice estima-
tion should consider signal plans from consecutive traf-fic lights on urban arterial corridors with closely spacedsignalized intersections to increase dynamic eco-drivingperformance. Finally, this study explicitly assumed con-nected vehicles that can precisely follow speed adviceusing automation functions. In future research, the au-thors plan to utilize actual speed advice data to modelthe influence of human factors in the adoption of speedadvice when CVs are manually driven and meticulouslyevaluate respective impacts on traffic safety and emis-sions savings.
AcknowledgementsNot applicable.
Authors’ contributionsThe author(s) read and approved the final manuscript.
FundingThis work was supported by the State Scholarships Foundation (IKY) underthe IKY/SIEMENS Research Projects for Excellence Programme [grant number1516] “Analysis and Upgrade of the Operations of Cooperative IntelligentTransportations Systems in Urban Networks”.
Availability of data and materialsThe datasets used and/or analysed during the current study are availablefrom the corresponding author on reasonable request.
Competing interestsThe authors declare that they have no competing interests.
Author details1Department of Transportation Planning and Engineering, School of CivilEngineering, National Technical University of Athens, 5 Iroon PolytechniouStr., Zografou Campus, 15773 Athens, Greece. 2Centre for Research andTechnology Hellas, Hellenic Institute of Transport, 6th km Charilaou-ThermiRd, 57001 Thermi, Greece. 3MUMA College of Business, University of SouthFlorida, 4202 E. Fowler Ave., BSN 3108, Tampa, FL 33620, USA.
Received: 3 March 2020 Accepted: 17 November 2020
References1. ACEA. (2017). Vehicles in use – Europe 2017. European Automobile
Manufacturers Association. https://www.acea.be/uploads/statistic_documents/ACEA_Report_Vehicles_in_use-Europe_2017.pdf
2. Alam, M. S., & McNabola, A. (2014). A critical review and assessment of eco-driving policy & technology: Benefits & limitations. Transport Policy, 35, 42–49. https://doi.org/10.1016/j.tranpol.2014.05.016.
3. Archer, J. (2005). Indicators for traffic safety assessment and prediction andtheir application in micro-simulation modelling: A study of urban andsuburban intersections. Doctoral Thesis, KTH.
4. Asadi, B., & Vahidi, A. (2011). Predictive cruise control: Utilizing upcomingtraffic signal information for improving fuel economy and reducing trip
time. IEEE Transactions on Control Systems Technology, 19(3), 707–714.https://doi.org/10.1109/TCST.2010.2047860.
5. Barth, M., Mandava, S., Boriboonsomsin, K., & Xia, H. (2011). Dynamic ECO-driving for arterial corridors. In In 2011 IEEE Forum on Integrated andSustainable Transportation Systems (FISTS), (pp. 182–188). https://doi.org/10.1109/FISTS.2011.5973594.
6. Bodenheimer, R., Brauer, A., Eckhoff, D., & German, R. (2014). EnablingGLOSA for adaptive traffic lights. In 2014 IEEE Vehicular NetworkingConference (VNC), (pp. 167–174). https://doi.org/10.1109/VNC.2014.7013336.
7. Chen, W., Liu, Y., Yang, X., Bai, Y., Gao, Y., & Li, P. (2015). Platoon-based speedcontrol algorithm for Ecodriving at signalized intersection. TransportationRes Rec, 2489(1), 29–38. https://doi.org/10.3141/2489-04.
8. Chu, L., Liu, H. X., Oh, J. S., & Recker, W. (2003). A calibration procedure formicroscopic traffic simulation. In Proceedings of the 2003 IEEE InternationalConference on Intelligent Transportation Systems (ITSC), (pp. 1574–1579).https://doi.org/10.1109/ITSC.2003.1252749.
9. Dalla Chiara, B., Deflorio, F. P., & Cuzzola, S. (2014). A proposal of risk indexesat signalised intersections for ADAS aimed to road safety. In Informatics inControl, Automation and Robotics, (pp. 265–278). Cham: Springer. https://doi.org/10.1007/978-3-319-03500-0_17.
10. Dalla Chiara, B., Deflorio, F., & Diwan, S. (2009). Assessing the effects of inter-vehicle communication systems on road safety. IET Intelligent TransportSystems, 3(2), 225–235. https://doi.org/10.1049/iet-its:20080059.
11. Erdmann, J. (2013). Combining adaptive junction control with simultaneousgreen-light-optimal-speed-advisory. In 2013 IEEE 5th International Symposiumon Wireless Vehicular Communications (WiVeC), (pp. 1–5). https://doi.org/10.1109/wivec.2013.6698230.
12. Gettman, D., & Pu, L. (2006). Theoretical validation of surrogate safetyassessment methodology for roundabouts and cross intersections. InProceedings of the 13th ITS World Congress.
13. Guanetti, J., Kim, Y., & Borrelli, F. (2018). Control of connected andautomated vehicles: State of the art and future challenges. Annual Reviewsin Control, 45, 18–40. https://doi.org/10.1016/j.arcontrol.2018.04.011.
14. Hao, P., Wu, G., Boriboonsomsin, K., & Barth, M. J. (2018). Eco-approach anddeparture (EAD) application for actuated signals in real-world traffic. IEEETransactions on Intelligent Transportation Systems, 20(1), 1–11. https://doi.org/10.1109/TITS.2018.2794509.
15. He, X., Liu, H. X., & Liu, X. (2015). Optimal vehicle speed trajectory on asignalized arterial with consideration of queue. Transportation Research PartC: Emerging Technologies, 61, 106–120. https://doi.org/10.1016/j.trc.2015.11.001.
16. Huang, Y., Ng, E. C. Y., Zhou, J. L., Surawski, N. C., Chan, E. F. C., & Hong, G.(2018). Eco-driving technology for sustainable road transport: A review.Renewable and Sustainable Energy Reviews, 93, 596–609. https://doi.org/10.1016/j.rser.2018.05.030.
17. Hurwitz, D. S. (2009). Application of driver behavior and comprehension todilemma zone definition and evaluation. Doctoral Thesis, University ofMassachusetts Amherst. https://doi.org/10.7275/bxwp-8c84.
18. Jiang, H., Hu, J., An, S., Wang, M., & Park, B. B. (2017). Eco approaching at anisolated signalized intersection under partially connected and automatedvehicles environment. Transportation Research Part C: Emerging Technologies,79, 290–307. https://doi.org/10.1016/j.trc.2017.04.001.
19. Johansson, G., & Rumar, K. (1971). Drivers’ brake reaction times. Humanfactors, 13(1), 23–27. https://doi.org/10.1177/2F001872087101300104.
20. Kamalanathsharma, R. K., & Rakha, H. A. (2016). Leveraging connectedvehicle technology and telematics to enhance vehicle fuel efficiency in thevicinity of signalized intersections. Journal of Intelligent TransportationSystems, 20(1), 33–44. https://doi.org/10.1080/15472450.2014.889916.
21. Kamalanathsharma, R. K., Rakha, H. A., & Yang, H. (2015). Networkwideimpacts of vehicle Ecospeed control in the vicinity of traffic signalizedintersections. Transportation Research Record: Journal of the TransportationResearch Board, 2503(1), 91–99. https://doi.org/10.3141/2503-10.
22. Kim, K. J., & Sul, J. (2009). Development of intersection traffic accident riskassessment model. In 4th IRTAD Conference.
23. Liang, X., Guler, S. I., & Gayah, V. V. (2019). Joint optimization of signalphasing and timing and vehicle speed guidance in a connected andautonomous vehicle environment. Transportation Research Record: Journal ofthe Transportation Research Board, 2673(4), 70–83. https://doi.org/10.1177/0361198119841285.
24. Liao, R., Chen, X., Yu, L., & Sun, X. (2018). Analysis of emission effects relatedto drivers’ compliance rates for cooperative vehicle-infrastructure system at
Mintsis et al. European Transport Research Review (2021) 13:2 Page 13 of 14

signalized intersections. International Journal of Environmental Research andPublic Health, 15(1), 122. https://doi.org/10.3390/ijerph15010122.
25. Mahler, G., & Vahidi, A. (2012). Reducing idling at red lights based onprobabilistic prediction of traffic signal timings. In 2012 American ControlConference (ACC), (pp. 6557–6562). https://doi.org/10.1109/ACC.2012.6314942.
26. Maile, M., & Delgrossi, L. (2009). Cooperative intersection collision avoidancesystem for violations (cicas-v) for prevention of violation-based intersectioncrashes. In Proceedings of International Technical Conference on the EnhancedSafety of Vehicles.
27. Mandava, S., Boriboonsomsin, K., & Barth, M. (2009). Arterial velocityplanning based on traffic signal information under light traffic conditions. In12th International IEEE Conference on Intelligent Transportation Systems (ITSC2009), (pp. 1–6). https://doi.org/10.1109/ITSC.2009.5309519.
28. Mannering, F., Kilareski, W., & Washburn, S. (2007). Principles of highwayengineering and traffic analysis. USA: Wiley.
29. Mintsis, E., Vlahogianni, E. I., & Mitsakis, E. (2020). Dynamic eco-driving nearsignalized intersections: Systematic review and future research directions.Journal of Transportation Engineering, Part A: Systems, 146(4). https://doi.org/10.1061/JTEPBS.0000318.
30. Monteil, J., Billot, R., & El Faouzi, N. E. (2011). Towards cooperative trafficmanagement: methodological issues and perspectives. In Proceedings ofAustralasian Transport Research Forum, (pp. 28–30).
31. Morsink, P. L., Wismans, L. J., & Dijkstra, A. (2008). Micro-simulation for roadsafety impact assessment of advanced driver assistance systems. In 7thEuropean Congress and Exhibition on Intelligent Transport Systems andServices.
32. Mousa, S. R., Ishak, S., Mousa, R. M., & Codjoe, J. (2019). Developing an eco-driving application for semi-actuated signalized intersections and modelingthe market penetration rates of eco-driving. Transportation Research Record:Journal of the Transportation Research Board, 2673(5), 466–477. https://doi.org/10.1177/0361198119839960.
33. Mousa, S. R., Mousa, R., & Ishak, S. (2018). A Deep-Reinforcement LearningAlgorithm for Eco-Driving Control at Signalized Intersections with PrioritizedExperience Replay, Target Network, and Double Learning. In TransportationResearch Board 97th Annual Meeting https://trid.trb.org/view/1497121.
34. Ni, D., Li, L., Wang, H., & Jia, C. (2017). Observations on the fundamentaldiagram and their interpretation from the human factors perspective.Transportmetrica B: transport dynamics, 5(2), 159–176. https://doi.org/10.1080/21680566.2016.1190673.
35. Ott, L., & Longnecker, M. (2004). A first course in statistical methods.Thomson-Brooks/Cole.
36. Panis, L. I., Broekx, S., & Liu, R. (2006). Modelling instantaneous trafficemission and the influence of traffic speed limits. Science of The TotalEnvironment, 371(1–3), 270–285. https://doi.org/10.1016/j.scitotenv.2006.08.017.
37. Pipes, L. A. (1953). An operational analysis of traffic dynamics. Journal ofApplied Physics, 24(3), 274–281. https://doi.org/10.1063/1.1721265.
38. Qi, X., Wang, P., Wu, G., Boriboonsomsin, K., & Barth, M. J. (2018). Connectedcooperative Ecodriving system considering human driver error. IEEETransactions on Intelligent Transportation Systems, 19(8), 2721–2733. https://doi.org/10.1109/TITS.2018.2845799.
39. Rakha, H. A., Chen, H., Almannaa, M., El-Shawarby, I., & Loulizi, A. (2016).Developing and field implementing an Ecocruise control system in the vicinityof traffic signalized intersections (no. NY17–02). TranLIVE. University of Idahohttps://rosap.ntl.bts.gov/view/dot/36797.
40. Rakha, H. A., Kamalanathsharma, R. K., & Ahn, K. (2012). AERIS: Eco-vehiclespeed control at signalized intersections using I2V communication (FHWA-JPO-12-063). Virginia Tech Transportation Institute http://ntl.bts.gov/lib/46000/46300/46329/FHWA-JPO-12-063_FINAL_PKG.pdf.
41. Raubitschek, C., Schutze, N., Kozlov, E., & Baker, B. (2011). Predictive drivingstrategies under urban conditions for reducing fuel consumption based onvehicle environment information. In 2011 IEEE Forum on Integrated andSustainable Transportation Systems (FISTS), (pp. 13–19). https://doi.org/10.1109/FISTS.2011.5973609.
42. Schuricht, P., Michler, O., & Bäker, B. (2011). Efficiency-increasing driverassistance at signalized intersections using predictive traffic state estimation.In 14th International IEEE Conference on Intelligent Transportation Systems(ITSC 2011), (pp. 347–352). https://doi.org/10.1109/ITSC.2011.6083111.
43. Stebbins, S., Hickman, M., Kim, J., & Vu, H. L. (2017). Characterising greenlight optimal speed advisory trajectories for platoon-based optimisation.
Transportation Research Part C: Emerging Technologies, 82, 43–62. https://doi.org/10.1016/j.trc.2017.06.014.
44. Sun, C., Guanetti, J., Borrelli, F., & Moura, S. (2018). Robust eco-driving controlof autonomous vehicles connected to traffic lights. ArXiv: 1802.05815[Math]. http://arxiv.org/abs/1802.05815
45. Taiebat, M., Brown, A. L., Safford, H. R., Qu, S., & Xu, M. (2018). A review onenergy, environmental, and sustainability implications of connected andautomated vehicles. Environmental Science & Technology, 52(20), 11449–11465. https://doi.org/10.1021/acs.est.8b00127.
46. Tielert, T., Killat, M., Hartenstein, H., Luz, R., Hausberger, S., & Benz, T. (2010).The impact of traffic-light-to-vehicle communication on fuel consumption andemissions. In 2010 Internet of Things (IOT), (pp. 1–8). https://doi.org/10.1109/IOT.2010.5678454.
47. Vahidi, A., & Sciarretta, A. (2018). Energy saving potentials of connected andautomated vehicles. Transportation Research Part C: Emerging Technologies,95, 822–843. https://doi.org/10.1016/j.trc.2018.09.001.
48. Vreeswijk, J. D., Mahmod, M. K. M., & van Arem, B. (2010). Energy efficienttraffic management and control – The eCoMove approach and expectedbenefits. In 13th International IEEE Conference on Intelligent TransportationSystems (ITSC 2010), (pp. 955–961). https://doi.org/10.1109/ITSC.2010.5625122.
49. Wadud, Z., MacKenzie, D., & Leiby, P. (2016). Help or hindrance? The travel,energy and carbon impacts of highly automated vehicles. TransportationResearch Part A: Policy and Practice, 86, 1–18. https://doi.org/10.1016/j.tra.2015.12.001.
50. Wan, N., Vahidi, A., & Luckow, A. (2016). Optimal speed advisory forconnected vehicles in arterial roads and the impact on mixed traffic.Transportation Research Part C: Emerging Technologies, 69, 548–563. https://doi.org/10.1016/j.trc.2016.01.011.
51. Wang, Z., Wu, G., & Barth, M. J. (2019). Cooperative eco-driving at signalizedintersections in a partially connected and automated vehicle environment.In IEEE Transactions on Intelligent Transportation Systems, (pp. 1–10). https://doi.org/10.1109/TITS.2019.2911607.
52. Wang, Z., Wu, G., Hao, P., & Barth, M. J. (2018). Cluster-wise cooperative eco-approach and departure application for connected and automated vehiclesalong signalized arterials. IEEE Transactions on Intelligent Vehicles, 3(4), 404–413. https://doi.org/10.1109/TIV.2018.2873912.
53. Weber, A., & Winckler, A. (2013). Exploratory advanced research project:Advanced traffic signal control. BMW Final Report. https://merritt.cdlib.org/d/ark:%2F13030%2Fm5s4865n/1/producer%2F884614370.pdf
54. Wu, X., Zhao, X., Xin, Q., Yang, Q., Yu, S., & Sun, K. (2019). Dynamiccooperative speed optimization at signalized arterials with various platoons.Transportation Research Record: Journal of the Transportation Research Board,2673(5), 528–537. https://doi.org/10.1177/0361198119839964.
55. Xia, H., Boriboonsomsin, K., & Barth, M. (2013). Dynamic eco-driving forsignalized arterial corridors and its indirect network-wide energy/emissionsbenefits. Journal of Intelligent Transportation Systems, 17(1), 31–41. https://doi.org/10.1080/15472450.2012.712494.
56. Xia, H., Wu, G., Boriboonsomsin, K., & Barth, M. (2013). Development andevaluation of an enhanced eco-approach traffic signal application forconnected vehicles. In 16th International IEEE Conference on IntelligentTransportation Systems (ITSC 2013), (pp. 296–301). https://doi.org/10.1109/ITSC.2013.6728248.
57. Xiang, X., Zhou, K., Zhang, W.-B., Qin, W., & Mao, Q. (2015). A closed-loopspeed advisory model with Driver’s behavior adaptability for eco-driving.IEEE Transactions on Intelligent Transportation Systems, 16(6), 3313–3324.https://doi.org/10.1109/TITS.2015.2443980.
58. Yang, Z., Zeng, H., Yu, Z., Wei, X., Liu, A., & Fan, X. (2019). Research on eco-driving strategy at intersection based on vehicle infrastructure cooperativesystem. Advances in Mechanical Engineering, 11(4). https://doi.org/10.1177/1687814019843368.
59. Zhou, F., Li, X., & Ma, J. (2017). Parsimonious shooting heuristic for trajectorydesign of connected automated traffic part I: Theoretical analysis withgeneralized time geography. Transportation Research Part B: Methodological,95, 394–420. https://doi.org/10.1016/j.trb.2016.05.007.
Publisher’s NoteSpringer Nature remains neutral with regard to jurisdictional claims inpublished maps and institutional affiliations.
Mintsis et al. European Transport Research Review (2021) 13:2 Page 14 of 14