
Energy systems transformation and the political economy of ...
289
Energy systems transformation and the political economy of climate change By Mark Huberty A dissertation submitted in partial satisfaction of the requirements for the degree of Doctor of Philosophy in Political Science in the Graduate Division of the University of California, Berkeley Committee in Charge: Professor John Zysman, Chair Professor Michael Hanemann Professor Paul Pierson Professor Alison Post Fall 2013
-
Upload
khangminh22 -
Category
Documents
-
view
0 -
download
0
Transcript of Energy systems transformation and the political economy of ...

Energy systems transformationand the
political economyof
climate change
By Mark Huberty
A dissertation submitted in partial satisfactionof the
requirements for the degree ofDoctor of Philosophy
inPolitical Science
in theGraduate Division
of theUniversity of California, Berkeley
Committee in Charge:Professor John Zysman, ChairProfessor Michael Hanemann
Professor Paul PiersonProfessor Alison Post
Fall 2013

c©2013 Mark Huberty
Abstract
Energy systems transformation and the political economy of climate change
by
Mark Huberty
Doctor of Philosophy, Political Science
Professor John Zysman, Chair
Climate change mitigation requires immediate and enduring cuts to greenhouse
gas emissions, achievable only through the transformation of today’s fossil fuel en-
ergy systems. Those systems today provide high-quality, inexpensive, and depend-
able energy to industrial societies. The low-emissions renewable energy systems that
would replace them are, as of 2013, still more expensive, more complex, and un-
proven.
This combination of factors makes the political economy of climate change mit-
igation immensely difficult. Achieving real emissions reduction will impose very
large material costs powerful interests, in pursuit of distant–if potentially massive–
environmental benefits. These conditions are not auspicious for adopting, much less
sustaining, effective climate policy.
Yet an increasingly large number of countries have taken explicit or implicit ac-
tion to reduce greenhouse gas emissions. These actions include emissions pricing
schemes, renewable energy research and development, energy efficiency mandates,
technological research and development, and a host of other policies. The list of states
pursuing such policy is as diverse as the policies themselves: the European Union,
South Korea, India, and even China have adopted some or all of the provisions out-
lined above.
This dissertation addresses how states have overcome the apparently sizable barri-
ers to climate change mitigation. It argues that successful states have made progress
1

by choosing policies that target environmental ends with economic gains. Those
gains comes through benefits derived from the transformation of national energy
systems–transformations that improve energy security, increase economic competi-
tiveness, improve technological leadership, or target other opportunities and chal-
lenges in the legacy energy infrastructure. By targeting such areas explicitly, these
policies create new constituents with a material stake in long-term policy stability.
Those constituents act as valuable political allies in the political fight over the scale
and distribution of costs for emissions reduction.
But while such policy strategies have proven successful to date, they do not resolve
the underlying problem of cost that has plagued climate change mitigation to date.
Massive emissions reduction still poses net economic costs, even if it yields huge pos-
itive environmental benefits. The benefits created by a low-emissions energy systems
transformation can offset those costs, and if targeted can create supportive economic
constituents. But the low-emissions energy systems of the future still do not, as of
this writing, offer any novel economic or technological improvements over the reli-
ably and ubiquitous energy we enjoy today. Hence these policies remain at risk of
disruption from outside forces. The recent policy stagnation in the United States and
Europe point to the risks posed by this inherent policy vulnerability.
2

For Emily
There at the beginning, the end, and forever
i

Acknowledgements
Preparing the work that follows depended on the generosity, wisdom, and support
of many people, in many places, over many years. John Zysman provided invalu-
able material, moral, and intellectual support starting from the first work we did on
climate change prior to the COP-15 climate talks. Nina Kelsey, who began that work
with us, was a superb colleague and intellectual foil for many of the ideas that even-
tually coalesced here. Through that early work, I had the chance to meet and work
with Katherine Richardson of Copenhagen University; Per Meilstrup and Erik Ras-
mussen at Mandag Morgen; and Gary Baldwin and Paul Wright at the Center for
Information Technology Research in the Interest of Society (CITRIS). Katherine, Per,
and Erik were generous hosts during my Fulbright residency in Denmark in 2011.
Gary and Paul provided support for the initial research that formed the foundation
of the dissertation. Per and Gary have since passed away, far too early. They are both
missed.
I was also lucky to have had a dissertation committee that embraced what was a
slightly odd take on a political science dissertation. Alison Post reliably asked more
pointed versions of the nagging questions I had about my own work; and provided a
sympathetic ear for bemoaning the disinterest that much of political science has in the
technical nuances of industrial infrastructure that so often shape policy in more ways
than we know. Paul Pierson embraced my interest in the practical details of politics.
Finally, Michael Hanemann noted in my prospectus defense that he wasn’t a politi-
cal scientist and so wasn’t quite sure how he should contribute; but then proceeded
to point out all sorts of parallels to my own argument that later came to enrich the
dissertation and my own thinking immensely. Moreover, everyone was immensely
helpful in my pursuit of academic job market, and even more supportive of my choice
to ultimately depart it.
ii
For 2010-2011, I was a Fulbright-Schuman fellow in the European Union. In Brus-
sels, Jean Pisani Ferry, Andre Sapir, and Georg Zachmann of Bruegel provided a con-
genial home, very strong coffee, and much intellectual stimulation. Vivian Haig, Jörn
Fleck, and the Transatlantic Policy Network were generous with their invitations and
champagne and remain good friends. In Copenhagen, Erik Rasmussen, Per Meil-
strup, and Solvej Christiansen of Mandag Morgen provided a brightly lit office and
much needed conversation in a dark Danish winter. The faculty of political science
at Copenhagen University also provided accommodation and friendship. In Berlin,
Georg Zachmann once again came through with company and conversation; would
that I could have made longer use of it. In each city, many politicians, business people,
activists, and bureaucrats made time to field my questions; most go unacknowledged
in the text, but their imprint is strong nonetheless.
Many others deserve additional thanks. The United States Environmental Protec-
tion Agency’s STAR fellowship provided the funds and freedom to travel, research,
and write without some of the encumbrances of academic life. The staff of the Berke-
ley Roundtable on the International Economy put up with my technical and adminis-
trative hassles. Professor Kevin Quinn of Berkeley Law provided useful feedback on
the more technical aspects of the later chapters. Hillary Sanders provided invaluable
research support as I was writing the leghist package that underpins chapter 5.
Finally, special thanks go to family and friends who had to endure the ups and
downs of a Ph.D. Sharing the doctoral slog with Abby Wood, Adrienne Hosek, Ben
Allen, Richard Ashcroft, and many other Berkeley grad students made everything
brighter. My parents were unfailingly supportive, even as they probably wondered
when I’d have a job again. And last, but not least my wife, by far the best thing to
come of my Ph.D. Words can’t really express my gratitude towards someone who
started the journey with me, who traveled tirelessly to meet me while on field work,
iii

who put up with the neurosis-inducing process that is academic hiring, and who
endured more conversations about renewable energy than she likely every expected.
Our future lies in the west.
iv

Contents
1 Introduction: Climate politics and energy systems
2 A low-carbon energy systems transformation: tasks, precedents, and com-
plications
3 The political economy of climate change reconsidered
4 Europe’s low-carbon systems transformation
5 Design or politics? Legislating the Third Climate and Energy Package
6 Economic actors and interests in European climate and energy policy
7 Conclusions: the limits to linkage
v
List of Figures
2.1 Global concentration and emissions of carbon dioxide. . . . . . . . . . . 14
2.2 Correlation of per-capita GDP with energy consumption and carbon
emissions. . . . . . . . . . . . . . . . . . . . . . . . . . . . . . . . . . . . 15
2.3 Intertemporal and geospatial variability in wind power production po-
tential, Denmark. . . . . . . . . . . . . . . . . . . . . . . . . . . . . . . . 31
3.1 The wealth-altruism model of climate action. . . . . . . . . . . . . . . . 51
4.1 EU-27 emissions trajectory, 1990-2009. . . . . . . . . . . . . . . . . . . . 88
4.2 Emissions and energy intensity in the EU-27 + Norway . . . . . . . . . 88
4.3 Emissions and energy intensity of economic activity in the EU across
enlargements. . . . . . . . . . . . . . . . . . . . . . . . . . . . . . . . . . 89
4.4 Import dependency by fuel for the EU-27 + Norway . . . . . . . . . . . 93
4.5 Net (total - verified emissions) permit allocation and emissions under
the EU ETS. . . . . . . . . . . . . . . . . . . . . . . . . . . . . . . . . . . . 109
4.6 Ratio of ETS permit allocation to verified emissions by year. . . . . . . 109
4.7 Revealed comparative advantage in wind turbine and solar photovoltaic
cell exports within Europe. Calculated from the 6-digit UN COM-
TRADE export data for the period 2000-2010. . . . . . . . . . . . . . . . 114
4.8 Clustering of EU 2020 RES-E targets . . . . . . . . . . . . . . . . . . . . 117
4.9 Net trade balance in wind turbines and solar cells, 1996-2009. . . . . . . 118
vi

4.10 Correlation of home-country green energy good exports with EU27
market growth for renewable energy. . . . . . . . . . . . . . . . . . . . . 118
4.11 Patterns of planned renewable energy adoption in the EU member states,
2010-2020. . . . . . . . . . . . . . . . . . . . . . . . . . . . . . . . . . . . 120
4.12 Timeline of EU Energy and Climate Policy . . . . . . . . . . . . . . . . . 133
5.1 Record of proposed and accepted amendments from the Commission
and Parliament during the legislative process for Emissions Trading
reforms in the Third Climate and Energy Package. Counts refer to bill
sections, nominally paragraphs, rather than complete amendments. Top-
ics derived from Latent Dirichlet Allocation as applied to the entire set
of potential and actual bill sections. . . . . . . . . . . . . . . . . . . . . . 147
5.2 Contributions to the 2008 Emissions Trading Scheme directive by leg-
islative actor. Contributions attributed to the “Final” outcome reflect
additions to the approved legislation not attributable to identified leg-
islative actors. These reflect in particular compromises undertaken at
the behest of the Council. Topics derived from Latent Dirichlet Alloca-
tion as applied to the entire set of potential and actual bill sections. See
figure 5.7 for a schematic explanation of how these data are generated. 148
5.3 Record of proposed and accepted amendments from the Commission
and Parliament during the legislative process for Internal Electricity
Market reforms in the Third Climate and Energy Package. Counts re-
fer to bill sections, nominally paragraphs, rather than complete amend-
ments. . . . . . . . . . . . . . . . . . . . . . . . . . . . . . . . . . . . . . . 154
vii
5.4 Contributions to the 2008 Internal Electricity Market Directive by leg-
islative actor. Contributions attributed to the “Final” outcome reflect
additions to the approved legislation not attributable to identified leg-
islative actors. These reflect in particular compromises undertaken at
the behest of the Council. See figure 5.7 for a schematic explanation of
how these data are generated. . . . . . . . . . . . . . . . . . . . . . . . . 155
5.5 Record of proposed and accepted amendments from the Commission
and Parliament during the legislative process for Renewable Energy
Mandate reforms in the Third Climate and Energy Package. Counts re-
fer to bill sections, nominally paragraphs, rather than complete amend-
ments. . . . . . . . . . . . . . . . . . . . . . . . . . . . . . . . . . . . . . . 171
5.6 Contributions to the 2008 Renewable Energy Directive by legislative
actor. Contributions attributed to the “Final” outcome reflect additions
to the approved legislation not attributable to identified legislative ac-
tors. These reflect in particular compromises undertaken at the behest
of the Council. See figure 5.7 for a schematic explanation of how these
data are generated. . . . . . . . . . . . . . . . . . . . . . . . . . . . . . . 172
5.7 Flow of data through the leghist modeling process. . . . . . . . . . . 173
6.1 Overview of the process of modeling respondent interests in consul-
tation processes. The Commission draws on a set of policy domains
to craft a policy strategy. Respondents voice interests in one or more
of those policy domains when writing their responses. Topic model-
ing can recover those policy domains, treated as a latent set of topics,
from the Commission document. Using that model, we can infer the
interests of each respondent from the language used in their responses. 187
viii

6.2 This figure illustrates policy domains in the 2006 European Energy
Strategy Green Paper. Each policy domain is showcased by the terms
identified by a topic model as most indicative of the domain itself. . . 191
6.3 Pairwise sectoral interest similarity for the 2006 Energy Strategy green
paper. Similarity is computed from the firm-level interests as expressed
in responses to public comment. Interests are defined as topics that
constitute greater than 5% of a respondent’s topic posterior topic mix-
ture. Pairwise respondent similarities are computed as the Jaccard in-
dex. Sector similarities are computed as the mean pairwise Jaccard in-
dex values for pairs of firms from different sectors. Cell shading indi-
cates sector-wise similarity. Cell statistics illustrate how novel over-
lap is, represented as the share of all comparisons with Benjamini-
Hochberg false discovery rates FDR of 0.1 or lower (Benjamini and
Hochberg, 1995). See section 6.7.3 for formal definitions . . . . . . . . . 192
6.4 Similarity of interests in the 2006 Energy Strategy green paper, as mea-
sured on the multidimensional simplex. The constitutes an alternative
measure of sectoral similarity, using the continuous simplex distance
as adopted by Grimmer (2010). . . . . . . . . . . . . . . . . . . . . . . . 193
6.5 This figure illustrates policy domains in the 2010 European Energy
Strategy White Paper. Each policy domain is showcased by the terms
identified by a topic model as most indicative of the domain itself. . . 195
ix
6.6 Pairwise sectoral interest similarity for the 2010 Energy Strategy white
paper. Similarity is computed from the firm-level interests as expressed
in responses to public comment. Interests are defined as topics that
constitute greater than 5% of a respondent’s topic posterior topic mix-
ture. Pairwise respondent similarities are computed as the Jaccard in-
dex. Sector similarities are computed as the mean the pairwise Jaccard
index values for pairs of firms from different sectors. Cell statistics
illustrate how novel overlap is, represented as the share of all com-
parisons with Benjamini-Hochberg false discovery rates (FDR) of 0.1
or lower (Benjamini and Hochberg, 1995). See section 6.7.3 for formal
definitions. . . . . . . . . . . . . . . . . . . . . . . . . . . . . . . . . . . . 197
6.7 Similarity of interests in the 2010 Energy Strategy white paper, as mea-
sured on the multidimensional simplex. The constitutes an alternative
measure of sectoral similarity, using the continuous simplex distance
as adopted by Grimmer (2010). . . . . . . . . . . . . . . . . . . . . . . . 198
6.8 This figure shows how stable interest group similarity is over time. It
correlates the similarity of expressed interests between sectors in 2006,
with those in 2010. It illustrates that sectors with significant overlap in
2006 remained largely unchanged in 2010. Sectors with lower levels of
overlap in 2006 had converged in their expressed interests by 2010. . . 200
6.9 Correlation between measures of overlap among sector-level interests.
This figure shows the correlation between two measures of sectoral in-
terests: the mean pairwise Jaccard similarity among firms between two
sectors; and the mean pairwise simplex distance between firms in two
sectors. The Spearman rank correlation measures -0.275 (p = 0.10) for
2006 and -0.320 (p = 0.00) for 2010. . . . . . . . . . . . . . . . . . . . . . 223
x
6.10 Distribution of respondent document lengths by comment period. . . 224
6.11 Correlation of topic distributions between complete responses and their
modal subsets. Modal subsets refer to the subset of sentences in a re-
sponse that contain modal words indicating future preferences. Each
point represents the proportion of a response from a single firm corre-
sponding to a single topic. . . . . . . . . . . . . . . . . . . . . . . . . . . 226
7.1 Economic growth in the European Union around the financial crisis.
All data show real GDP growth per annum. Source: Eurostat. . . . . . 238
xi

List of Tables
2.1 Global warming potentials (GWP) for different greenhouse gasses. . . 12
4.1 EU 2020 RES-E targets, as reported in Annex 1 of European Union (2009).119
4.2 Distributional and functional contributions of major instruments in the
EU policy suite. . . . . . . . . . . . . . . . . . . . . . . . . . . . . . . . . 132
5.1 Origin of content in 2008 Emissions Trading System Directive by leg-
islative actor. Shaded rows indicate policy domains where the Parlia-
ment accounted for the plurality of content in the final bill. . . . . . . . 149
5.2 Origin of content in 2008 Internal Market Directive by legislative actor.
Shaded rows indicate policy domains where the Parliament accounted
for the plurality of content in the final bill. . . . . . . . . . . . . . . . . . 156
5.3 Origin of content in 2008 Renewable Energy Directive by legislative
actor. Shaded rows indicate policy domains where the Parliament ac-
counted for the plurality of content in the final bill. . . . . . . . . . . . . 159
6.1 Breakdown of 2006 Energy Green Paper public comment respondents
by subsector. . . . . . . . . . . . . . . . . . . . . . . . . . . . . . . . . . . 183
6.2 Breakdown of 2010 Energy Strategy White Paper public comment re-
spondents by subsector. . . . . . . . . . . . . . . . . . . . . . . . . . . . 184
xii

1 Introduction: Climate politics and
energy systems
Addressing the threat of global climate change will require significant, long-term re-
ductions of greenhouse gas emissions by industrial economies. Those emissions re-
sult, primarily, from fossil fuel energy. Short of rapid progress on highly risky tech-
nologies like nuclear fusion or emissions sequestration, taking emissions out of the
energy supply will require the large-scale adoption of wind, solar, geothermal, and
biomass-based energy. While we can imagine how this shift to renewable energy
sources might occur, in many cases the technologies required are nonexistent or rel-
atively new, and experience in operating them limited. They are, as a rule, more
expensive than the fossil fuels they replace. Moreover, the industrial economies and
their citizens expect that the switch in energy sources will occur without disrupting
the economic and social activities that depend on reliable, ubiquitous, and relatively
cheap energy.
Hence climate change mitigation poses a political and economic problem of the
highest complexity. But while the motivation is new, the nature of the change itself
is not. Since the start of the industrial age, the world has seen a series of new energy
sources emerge to find their place in the global economy. Coal replaced wood starting
around 1600. Oil later supplanted coal, particularly for transportation, starting in
the latter half of the 19th century. Natural gas and nuclear energy became major1

contributors to global energy consumption in the 20th century. Among all of these,
however, electrification had perhaps the largest impact, not just on where energy
came from but also on its ubiquity, reliability, and portability.
Climate change policy shares a logic of systems transformation with each of these
earlier epochs. Prior changes in energy sources saw substantial reconfiguration of
energy production, distribution, and use. Those reconfigurations required not only
technological innovation and investment, but also a host of changes to how energy
markets were regulated, and the behavioral and social patterns of the society at large.
And, while each of these earlier transformations occurred in large part because of
the superiority of the new energy source, that superiority often proved insufficient
on to drive adoption on its own. The state–as regulator, financier, landowner, and
policeman–played important roles in each.
But climate change departs significantly from earlier energy systems transforma-
tions in two vitally important ways. First, the benefits offered by the new energy
source are, for the most part, distant and tangential to the economy. Avoiding the
worst ravages of climate change will require immediate action to avoid damages far
in the future. If successful, the benefits from climate change mitigation will arrive
mostly in the form of costs avoided, rather than improvements gained. And the ben-
eficiaries of action will be the children and grandchildren of those who must pay for
it. Thus the primary motivation for this transformation provides only weak incen-
tives for the actions required to initiate and sustain it.
Second, the new low-emissions energy sources offer few obvious advantages com-
pared with the fossil fuels they must displace. Indeed, climate change mitigation will
require significant investment to ensure that the natural variability of solar, wind,
tidal, and other sources of renewable power does not disrupt economies dependent
on reliable, constant supplies of power. And despite these potential–if entirely manageable–
2
shortcomings, renewable energy will, in the near term, cost more than fossil fuels.
These differences mean a transformation that, in human terms, stands in stark con-
trast to the experience of someone born in 1880, who grew up with gas light and coal
heat, but died in the age of electricity, television, and radio.
This dissertation considers the resulting political economy of a low-carbon energy
systems transformation. Chapter 2 introduces the problem of climate change and
demonstrates the necessity of significant changes to the energy system in order to
confront it. Like earlier transformations, decarbonization of the energy supply will re-
quire a series of parallel and complementary changes in how we produce, distribute,
and use energy. Technologically, that means a directed set of innovations and in-
vestments ultimately capable of providing the reliable, ubiquitous, and reasonably-
priced energy on which modern economies rely. Economically, that means a range
of changes to the markets that frame investments in energy infrastructure, markets
for energy supply and demand, and incentives for energy conservation. And socially,
it implies changes in the structural characteristics of social organization that dictate
much of how individual citizens and firms use energy in daily life.
Building on this foundation, 3 lays out a theory of the political economy of climate
change. The necessity of a low-carbon energy systems transformation poses signifi-
cant challenges to sustained climate policy. It has the potential to impose acute costs
on powerful and well-organized industrial and energy sector interests, and to gen-
erate acrimony among citizens resistant to higher energy prices. But, conceived as
emissions reduction alone, systems transformation offers few immediate or tangible
benefits to offset those costs. A low-carbon energy systems transformation also forces
the state to navigate the always-complex terrain of technological innovation. It must
influence the direction, pace and compatibility of technological development without
straying too far into the kind of top-down direction of technological change that has
3

failed so often in the past.
These challenges tempt us to favor the cheapest, most arms-length policy possible:
cheap, to minimize the pain; and arms-length, to minimize the state’s opportunity for
error. That logic underpins the conventional wisdom that an emissions price consti-
tutes the best policy approach to emissions reduction. States, so the argument goes,
must merely set a price on greenhouse gas emissions, and then step back to let the
market discover the most economically efficient path to emissions reduction.
But this logic is deeply flawed. Politically, carbon pricing imposes obvious and
immediate costs on powerful interests, while generating few politically viable means
of compensating losers. Advocates of emissions pricing argue that it must be “high,
ubiquitous, and reliable” to be effective (Nordhaus, 2010), but provide few means to
ensure that a high price doesn’t generate a political backlash that renders it unreli-
able or prone to rent-seeking by powerful interests. This is an increasingly familiar
critique, as in Victor (2011). But the problems go beyond these political concerns:
technologically, it’s unclear how pricing alone will deliver the parallel, complemen-
tary innovations and investments required to generate a viable low-emissions energy
system. This is especially true for the somewhat more price-insensitive energy trans-
mission and distribution markets, whose large, long-term investments mute the in-
centives of carbon pricing. Thus the dream of an arms-length approach wherein the
state sets an emissions price and the market does the rest will likely prove a chimera.
Chapter 3 introduces an alternative logic. I argue that viable climate policy will
emerge in situations where emissions reduction can be tied to progress on other pol-
icy domains that generate material near-term improvements. Those improvements
serve two purposes: first, they create beneficiaries that support policy continuity;
and second, they provide surpluses that can be diverted to compensate compensate
losers. The institutionalization of emissions policy that emerges from this pattern of
4

benefits and compensation will improve the effectiveness of climate policy itself, by
increasing the credibility that the policy regime will survive over the long term. But
the policies most likely to succeed at accomplishing this process will necessarily be
multifaceted, complementing emissions pricing with a range of policy instruments
that resemble more closely the traditional tools of industrial policy. Framing this
as a choice between an optimal first-best policy and some regrettable but necessary
second-best solution does not, I argue, enlighten. Rather, we must choose between
the second-best and nothing at all.
Can such a strategy succeed everywhere? Likely not. Consistent with the polit-
ical science literature on similar kinds of cross-cutting strategies–strategies broadly
termed “issue linkage”–the potential for this kind of policy bargain will vary widely.
In this case, I show that the structure of domestic energy systems will play a pow-
erful determining role in the opportunities available for effective issue linkage. As
networked technological systems, energy systems structure how the costs and ben-
efits of a limited set of climate-focused changes will cascade through the network
to affect firms and citizens throughout the economy. That structure depends on a
historically-contingent process of technological, regulatory, and infrastructure de-
velopment. Consequently, though the technologies underpinning electrification or
transport today vary little, the broader systems in which they exist vary tremendously
across countries. This suggest that domestic variation in energy systems frustrate at-
tempts to transfer policy models across national energy and political systems.
Chapters 4-5 turn to how the European Union has managed this politics of is-
sue linkage in crafting its comprehensive climate and energy policy regime. The
EU presents a particularly hard test of a theory of linkage-driven climate and en-
ergy policy. The EU would surely lead the list of polities we might expect to suc-
ceed at overcoming economic concerns to pursue environmental goals. As Vogel
5
(2012) has shown, the EU has adhered more strictly to a precautionary principle
when making policy for environmental and consumer protection. Furthermore, Eu-
rope is also presumed to have stronger, better-organized environmental actors. The
European Parliament, ineffectual in many ways, has historically been an effective ad-
vocate for environmental policy (Burns, 2005; Burns and Carter, 2010; Burns et al.,
2012). The stronger member states have either strong Green parties (Germany) or
environmentally-motivated parties (Scandinavia). And many European citizens are
thought to have “postmodern” preferences–willingly giving up marginal material
improvements for non-material social or environmental gains (Kitschelt, 1994).
Hence we might expect–and others have certainly argued–that climate policy would
be simply another instance of this precautionary bias. In that world, Europeans might
willingly accept the costs of emissions pricing as a precaution against the threat of
unchecked climate change.
Yet I argue that neither the design of Europe’s climate and energy policy suite, nor
the political history of that policy itself, conform to a view of politics dominated by
environmental interests and precautionary biases. Instead, even so environmentally-
conscious a polity as the EU still relies on economic and industrial benefits, rather
than environmental motivations, to stabilize support for climate change mitigation.
This is clear from the consistency between European policy strategy and European
economic interests, as shown in chapter 6. And it is doubly clear in the political
process by which that strategy was translated into policy. As chapter 5 shows, the
Parliament–Europe’s environmental advocate–has consistently failed to make policy
more environmentally aggressive, and less economically pliant. Instead, the Euro-
pean Commission has yoked industrial support for emissions reduction to progress
on more immediate and tangible goals in the energy sector. In doing so, the Commis-
sion has sought to reduce the vulnerability of climate policy to erosion by powerful
6

economic interests.
In doing so, the Commission has made choices contingent on the particular struc-
ture of the European energy system. But the principles that underpin the European
bargain–linkage between the long-term environmental goal and the material returns
to the tasks necessary to achieve that goal–appear to hold in other contexts as well.
As chapter 7 discusses, both relatively recent successes–like South Korea’s pursuit
of “green growth”–and persistent failures–like the American efforts to pass a cap-
and-trade program–illustrate the role played by the energy system in structuring the
possible outcomes of climate policy formation. The Koreans, by explicitly tying envi-
ronmental goals to industrial restructuring, gained the support of Korea’s politically
powerful industrial sector and succeeded despite the lack of support from environ-
mental interests. In contrast, the United States, with its well-funded and organized
environmental groups, has consistently been unable to make the connection between
environmental goals and industrial returns. As Skocpol (2013) has argued, American
environmental reformers remain mired in a mindset where public opinion on climate
change matters, and where managing the cost of emissions reduction–rather than
identifying its economic benefits–is the critical policy strategy. But whether these re-
formers can succeed if they merely switch to an industrial policy strategy is unclear.
In particular, the structure of the American energy system has far fewer opportuni-
ties for real material gains than its European or South Korean counterparts, restricting
the options for environmental policymakers even if they decide to explicitly pursue
linkage politics.
Stepping back from the climate issue, the dissertation makes a more general ar-
gument for treating climate change as a problem of comparative political economy,
rather than environmental politics. Though its motivations are environmental, cli-
mate change mitigation poses a fundamentally different set of problems, at a very
7

different scale, than almost any other environmental problem. Many environmental
problems merited solutions that modified social and economic behavior. Resolving
acid rain required power plant operators to switch fuel sources and clean their stack
effluent, but not stop using coal (Hanemann, 2009). Reducing groundwater pollu-
tion required factories to contain or purify their waste water, not end production
altogether.1 Only the most aggressive environmental organizations have taken the
position that true environmental protection requires humanity to simply stop doing
something.2
In contrast, climate change requires root-and-branch changes in how we produce,
distribute, and use energy. Barring either wholesale adoption of nuclear energy, or
successful carbon emissions sequestration, renewable energy is the only option for
permanent emissions reduction. That in turn implies, as we’ve said, a range of other
social, political, technical, and economic changes. Those changes will cut to the heart
of industrial economies, economic growth, employment, and development. It may
represent the most fundamental change in how we organize industrial societies since
the second industrial revolution. As such, the more focused perspective of environ-
mental politics–on interest group formation, local impacts, mass public opinion, and
scientific persuasion–will likely miss the forest for the trees. Instead, we need new ap-
proaches to studying interest group formation, legislative behavior, and the behavior
of economic actors at the scale of the energy system itself. Chapters 6 and 5 propose
new approaches for surveying both firm and legislator behavior that may make such
systems-level research tractable and scale-able.
1This statement might raise the objection that production did in fact stop: companies simply shutdown production and moved it to a new, unregulated locale. While true, that’s an economic conse-quence. There was no reason those factories couldn’t have kept producing. They simply chose notto.
2Note that this position is in the limit defensible. But it belies the fact that most major environmen-tal improvements over the last half-century have come through modifications of existing behaviorsthat were largely painless to end users.
8

2 A low-carbon energy systems
transformation: tasks, precedents,
and complications
2.1 Introduction
Climate policy is energy policy. Any serious attempt to avoid the consequences of
unchecked climate change will require significant absolute reductions in greenhouse
gas emissions over the course of the 21st century. Approximately 65% of those emis-
sions come from today’s fossil fuel-based energy systems, the largest contribution of
any single sector. Reducing those emissions implies substantial changes to the en-
ergy system to enable it to continue to provide abundant and reliable energy without
imposing large environmental costs.
This chapter argues that these changes constitute an energy systems transforma-
tion, understood as a set of parallel and complementary changes to energy produc-
tion, distribution, and use. Low-emissions energy sources have very different oper-
ating characteristics than the fossil fuels they replace. They are more variable, less
dense, and more geographically diffuse than fossil fuels. Accommodating these dif-
ferences in the character of energy production will require a set of corresponding
9

changes in energy distribution and use. In particular, the power grid will require sub-
stantial new capital investment to service distributed power generation and manage
intermittent power; and energy demand will shift from being an exogenous given,
over which operators have little control, to being another variable that can be man-
aged to ensure the stability of the energy system. These technical changes will require,
in turn, changes to markets for energy investment and sale.
This scale of change is consistent with earlier instances of energy systems transfor-
mation. Like Smil (2011a), I argue that the primary lesson to be drawn from these
earlier changes is the inherent slowness of change in large-scale networked systems.
But in comparison to earlier transformations, a low-carbon energy systems transfor-
mation offers more challenges and fewer tangible benefits. This lack of benefits com-
plicates the politics of designing and implementing policy to accomplish the technical
tasks required of a low-emissions energy systems transformation.
Hence climate policy formation must be understood as both a technical and politi-
cal task. The long duration, expense, and complexity of serious emissions reduction
will require implementing measures that build and sustain supportive political coali-
tions for the duration. As the following chapter argues, doing so will require policy
to generate real material benefits in the process of transformation. Such benefits will
help create acute support for specific policy regimes, which over time can build new
constituencies in favor of policy continuity. But the variegated nature of legacy en-
ergy systems and the economic actors that operate within them inform against any
expectation of universal policy solution. Instead, we should expect policies whose
idiosyncrasies are dictated by the structure of the legacy energy system, the material
opportunities and challenges it embodies, and the potential to address these issues
with instruments that serve longer-term climate goals.
10
2.2 The climate / energy nexus
Climate change refers to observed environmental changes resulting from increasing
average atmospheric temperatures. Average surface temperatures have increased by
approximately 0.74C over the course of the 20th century. On a geologic timescale,
the planet has seen such changes before. But the rate of change and the complex
vulnerabilities of human society now amplify the potential damages from unchecked
climate change. Furthermore, substantial evidence points to human activity as the
predominate cause of this increase, and greenhouse gasses as the primary instru-
ment.(Solomon et al., 2007)
Greenhouse gasses constitute a class of compounds that trap infra-red radiation re-
flected from the earth’s surface. Increased concentrations of greenhouse gasses in the
atmosphere change the equilibrium radiation flux, trapping heat energy in the earth’s
atmosphere. Carbon dioxide is perhaps the best-known greenhouse gas, but is also
the weakest. As table 2.1 shows, methane, sulfur hexaflouride, and other gasses have
much stronger greenhouse effects on a per-weight basis. But what carbon dioxide
lacks in power it makes up in volume and persistence. Present atmospheric concen-
trations of CO2 stand at approximately 390ppm, 3-6 orders of magnitude higher than
other greenhouse gasses. That CO2 will remain with us long after more potent gasses
like methane have decomposed.
The intensification of greenhouse gas emissions is inseparable from industrializa-
tion. Prior to industrialization, photosynthetic energy provided the vast majority
of available energy inputs for economic and social activity. Thermal energy came
largely from wood and crop residues. Mechanical power from draft animals required
food inputs that were either purpose-grown feed or pasture. The dependence on
photosynthesis kept society into a greenhouse gas equilibrium. Photosynthesis turns
water and carbon dioxide into carbohydrates and oxygen. Burning or metabolizing
11

Gas GWP Atmospheric half-life (years)CO2 1 100CH4 21 12N2O 310 114HFC-23 11,700 270HFC-32 650 4.9HFC-125 2,800 29HFC-134a 1,300 14HFC-143a 3,800 52HFC-152a 140 1.4HFC-227ea 2,900 34.2HFC-236fa 6,300 240HFC-4310mee 1,300 15.9CF4 6,500 50,000C2F6 9,200 10,000C4F10 7,000 2,600C6F14 7,400 3,200SF6 23,900 3200
Table 2.1: Global warming potentials (GWP) for different greenhouse gasses, relativeto CO2. 100-year time horizon. Source: GWP taken from (EPA, 2011, ES-3).Half-lives taken from (Solomon et al., 2007, table 2.14).
12
the carbon-based energy in plant matter consumes oxygen and carbohydrates, and
generates energy and CO2 as a byproduct. Once returned to the atmosphere, CO2
re-entered the photosynthetic cycle. The closed nature of this energy system, and the
limited energy potential of plant matter, meant that near-term over-consumption of
primary energy sources eventually ran into medium-term limits on the productivity
of forests, grassland, and farmland.
Industrialization marked a departure from this equilibrium. Capital-driven pro-
ductivity improvements depended on the availability of cheap, plentiful supplies
of energy.1 From the point of industrialization on, production required greater en-
ergy inputs than could be captured from self-renewing processes like photosynthe-
sis. Coal, and later oil and natural gas, provided an escape from these constraints via
what Sieferle (2001) called a “subterranean forest” of millions of years of accumulated
photosynthetic energy.
Harvesting and burning that subterranean forest meant a departure from green-
house gas equilibrium. As figure 2.1 shows, the atmospheric concentration of green-
house gasses began to increase at about the same point in industrial development at
which large-scale industrialization–and the co-commitant combustion of fossil fuels
for steam power and heating–began in Europe. In the late 20th and early 21st cen-
turies, the intensification of economic development, and hence energy consumption,
in countries like China and India has caused a further acceleration in both demand for
energy resources and flows of greenhouse gas emissions. As of 2007, China surpassed
the United States as the largest single greenhouse gas emitter, though its per-capita
emissions remained a fraction of that of the advanced industrial economies (Vidal
and Adam, 2007).
1Both Nef (1932) and Landes (2003) place great weight on coal energy in driving the industrialrevolution. Flinn (1984) and Clark and Jacks (2007) both dispute this argument, particularly in theEnglish case, suggesting that water power was more important to the primary productivity increasesin textiles. But this dispute does not affect the later importance of coal to the intensification of steelproduction or the second industrial revolution of the late 19th century.
13

1750 1800 1850 1900 1950 2000
250
300
350
400
Con
cent
ratio
n in
ppm
Mauna LoaSiple ice cores
(a) Atmospheric CO2 concentration since the18th century. Source: Data from 1750-1953come from the Siple ice core samples. Data af-ter 1958 come from the Mauna Loa observatorymonthy record.
1750 1800 1850 1900 1950 20000
2000
4000
6000
8000
MM
T c
arbo
n p
er a
nnum
(b) Global annual emissions of CO2. All datafrom Boden et al. (2009).
Figure 2.1: Global concentration and emissions of carbon dioxide.
Attempts to decouple industrial growth from energy demand have generated lim-
ited returns.2 Increasing energy efficiency and the greater weight of services have
caused emissions per unit GDP to fall across the developed economies. But with rare
exceptions–notably Denmark–the greenhouse gas emissions of the advanced indus-
trial economies have continued to increase. Moreover, falling emissions per unit GDP
in developed economies reflects, in most cases, the transition from a manufacturing-
led economy to a services-led economy. That transition has suppressed the growth
in emissions intensity of production, but has not displaced demand for emissions-
intensive goods. Moving emissions-intensive production like steel, cement, or heavy
manufacturing from one country to another only displaces the origin of emissions in
the accounting, not the importance of those emissions to the climate.3
2Raupach et al. (2007) note that there’s little evidence of any region actively decarbonizing theirenergy supply.
3In the G7, energy intensity per unit GDP declined 19.7% between 1991, the year after the Ky-oto Protocol’s 1990 baseline, and 2007. Despite this gain, energy use per capita grew 4% on average,
14

Per−capita GDP (2000 USD)
Car
bon
emis
sion
s (M
T p
er c
apita
)
10−2
10−1.5
10−1
10−0.5
100
100.5
101
102.5 103 103.5 104 104.5
year
1985
1990
1995
2000
2005
(a) Correlation of per-capita GDP with car-bon emissions. Emissions represented as met-ric tons of carbon per person. Period: 1960-2007. Carbon emissions taken from Bodenet al. (2009).
Per−capita GDP (2000 USD)
Ene
rgy
cons
umpt
ion
(kg
oil e
q. p
er c
apita
)102
102.5
103
103.5
104
102.5 103 103.5 104 104.5
year
1985
1990
1995
2000
2005
(b) Correlation of per-capita GDP with per-capita energy consumption in kilograms oilequivalent. Period: 1970-2007. Energy con-sumption taken from the World Bank WorldDevelopment Indicators database.
Figure 2.2: Correlation of per-capita GDP with energy consumption and carbon emis-sions. 107 countries represented. GDP represented in constant 2005 dol-lars per capita, calculated from nominal GDP deflated with the NIPAGDP deflator. Smoothed lines generated from loess regression. Individualpaths show country-specific timeseries within the data.
2.3 Energy options for climate change mitigation
Reducing greenhouse gas emissions therefore requires severing the link between eco-
nomic prosperity and growth, and emissions. Given that 60% of all emissions come
from fossil fuel-based energy, that will require a much lower emissions footprint for
energy consumption. In macroscopic terms, states have three levers with which to
and total energy consumption 14%. Total energy consumption declined only in Germany and theUnited Kingdom, 1% and 0.65%, respectively. But German success in particular came at a price: thedismantling of the East German industrial base after reunification, and the widespread East Germanunemployment that followed. The collapse of British manufacturing during and after the Thatcherperiod is well-documented. These are, obviously, not viable or reproducible strategies. Denmark hasbeen somewhat more successful over this period, increasing GDP by nearly 40% while keeping aggre-gate energy use constant. For information on global energy consumption, see “Total Primary EnergyConsumption” and its variants, in Energy Information Administration (2009), updated regularly athttp://www.eia.doe.gov/emeu/international/contents.html. GDP data taken from theOECD for 1990 and 2007 at constant PPP.
15
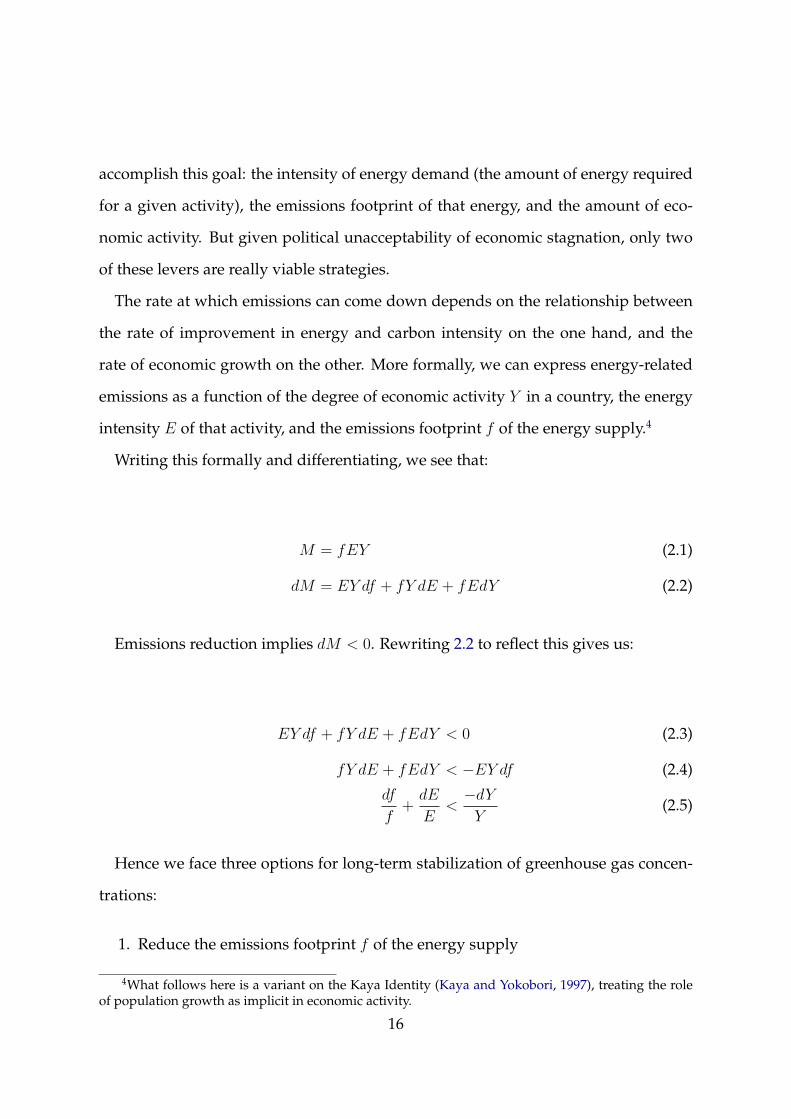
accomplish this goal: the intensity of energy demand (the amount of energy required
for a given activity), the emissions footprint of that energy, and the amount of eco-
nomic activity. But given political unacceptability of economic stagnation, only two
of these levers are really viable strategies.
The rate at which emissions can come down depends on the relationship between
the rate of improvement in energy and carbon intensity on the one hand, and the
rate of economic growth on the other. More formally, we can express energy-related
emissions as a function of the degree of economic activity Y in a country, the energy
intensity E of that activity, and the emissions footprint f of the energy supply.4
Writing this formally and differentiating, we see that:
M = fEY (2.1)
dM = EY df + fY dE + fEdY (2.2)
Emissions reduction implies dM < 0. Rewriting 2.2 to reflect this gives us:
EY df + fY dE + fEdY < 0 (2.3)
fY dE + fEdY < −EY df (2.4)
df
f+dE
E<−dYY
(2.5)
Hence we face three options for long-term stabilization of greenhouse gas concen-
trations:
1. Reduce the emissions footprint f of the energy supply
4What follows here is a variant on the Kaya Identity (Kaya and Yokobori, 1997), treating the roleof population growth as implicit in economic activity.
16

2. Reduce the energy footprint E of economic production
3. Reduce our living standard as measured by GDP Y
Evidence suggests that neither developing nor developed economies can long sup-
port the stagnation or retreat of GDP growth. Since the start of industrialization, peri-
ods of extended economic stagnation have coincided with political instability and the
retreat of liberal politics.5 This experience suggests that politically-viable approaches
to dealing with climate change will treat dYY
as a stubbornly positive quantity, in
which the choice to pursue emissions reduction is conditional on very low or nonexis-
tent opportunity costs to economic growth.6 That leaves energy efficiency and energy
supply decarbonization as the primary options at the hands of policymakers. But for
emissions to fall, those must combine to reduce the emissions footprint of the energy
system at a rate faster than GDP growth. Whether this can occur depends on our
expectations for improvements in energy efficiency and for abatement of emissions
from the energy sector.
2.3.1 Efficiency
Improved energy efficiency has a demonstrated history of effective moderation of
both energy demand and emissions. As figure 2.2 shows, the correlation between
per-capita income and emissions has remained positive for the last thirty years. But5The Great Depression provided the most extreme instance of growth driving illiberal politics.
Lesser examples include the prolonged period of stagflation in the 1970s; and the slow recovery afterthe 2008-2009 financial crisis. In all cases, the inability of national economies to generate broad-basedeconomic growth led to a zero-sum competition for resources among economic interests and betweenpolitical factions. See in particular Gourevitch (1987).
6This is not to say that such proposals have no following. Both mainstream organizations likethe European Green Party and more fringe environmental groups have advocated for “green growth”policies that explicitly endorse a relative stagnation in living standards as a way to improve overall en-vironmental sustainability.(European Greens Party, 2009; Schepelmann et al., 2009) Such a transforma-tion of the implicit postwar settlement–alleviation of distributional conflict via equitably distributedeconomic growth–would mark a much more fundamental shift in political and economic governancethan anything currently under serious discussion. None of these policies have achieved significantpolitical traction.
17

the underlying country behaviors show significant diversity. Denmark’s GDP has
growth 40% over this era even as its energy consumption has remained flat. China’s
GDP grew fourfold over the period 1980-2010, but energy consumption merely dou-
bled. Within the advanced industrial economies, energy intensity varies dramatically.
The United States consumes approximately twice as much energy per capita as the
Euro-area average. But this spectrum of differences appears to have little relation-
ship to prosperity among the advanced countries. Per-capita GDP across the major
industrialized economies varies little compared with rates of per-capita energy con-
sumption.
Instead, most of the differences have to do with structural choices that influence
energy consumption. Europeans in general, and northern Europeans in particular,
tend to drive smaller cars, use mass transit more frequently, and live in smaller and
better-insulated homes in denser communities. In many countries, these structural
advantages are augmented by the use of highly efficient methods to heat and power
buildings. Combined Heat and Power (CHP), used across Denmark and in many
European cities, uses the residual heat in steam generated for electricity production
to supply district steam heating systems. Thus, although Denmark continues to con-
sume substantial amounts of coal for electricity generation and heat, it gets approx-
imately twice as much useful energy from a unit of coal as the most efficient coal-
fired power plants in the United States. These choices emerge in part from structural
factors–the greater density of European populations–but also represent policy choices
about regulatory and economic incentives for energy use and conservation.
Improvements in energy efficiency reduce the energy demands from economic pro-
duction and implicitly the greenhouse gas emissions intensity of production. But
while these improvements can complement energy systems decarbonization, they are
not a substitute for it. Empirically, improvements in energy efficiency for household
18

durable goods like washing machines and air conditioners appear to reach about 0.5-
2.5% per annum (Newell et al., 1999), while the stock of household appliances turns
over at a rate of perhaps 1% per year. The building stock in the EU is refreshed at
a similar rate. Given that the advanced industrial economies have grown at a trend
of approximately 2-3% over the last three decades, it does not appear that energy
efficiency alone can offset emissions growth from rising GDP.
Furthermore, improvements to energy efficiency (dEE< 0) are bounded by the con-
straint that E > 0: economic activity requires energy inputs. Thus energy efficiency
alone will not deliver emissions reductions in the limit. So while energy efficiency
measures make emissions reductions easier by loosening the constraints on decar-
bonization of the energy supply, they do not eliminate it altogether.
Moreover, energy efficiency improvements have potentially large transaction costs
relative to changes in energy production and distribution.7 Most energy efficiency
efforts involve widespread, diffuse, very small changes to building codes, build-
ing retrofits, appliance standards, and other individually small but collectively large
sources of energy demand. Thus widespread, rapid improvements in energy effi-
ciency require a very large number of very small changes, posing coordination prob-
lems and transaction costs for regulators.
Finally, most countries that have successfully moderated energy consumption with-
out harming GDP have also undergone industrial restructuring. This has usually
meant a transition from energy-intensive heavy industry to less-energy-intensive man-
ufacturing and services. But this has not meant a change in demand for outputs from
heavy industry, such as steel (in the form of cars or household goods or building ma-
terials) or cement or other goods. Rather, it has merely moved the source of emissions
from one country to another.8 With climate change a global environmental goods
7Ed Barbier has pointed this out in a number of publications.8South Korea has explicitly embarked on this shift as of 2011. Its green growth strategy contains
an array of changes to urban planning, energy production, and other aspects of the economy. But it
19

problem, national solutions of this form do little to solve the problem.
2.3.2 Decarbonization
Energy efficiency therefore constitutes an important but incomplete lever for emis-
sions reduction. Over time, permanent absolute reductions in greenhouse gas emis-
sions will require the decarbonization of the energy system. Changing the process of
energy production to reduce carbon emissions per unit energy can occur via one of
two ways. Either the energy production process itself can be decarbonized, by replac-
ing today’s fossil fuel-based energy production infrastructure with zero-emissions
sources; or the greenhouse gas emissions from the use of fossil fuels can be captured
and stored or otherwise rendered harmless.
Capturing and storing emissions from fossil fuel power plants has become a con-
ceptually popular but empirically elusive strategy. If successful, carbon capture and
sequestration (CCS) technology would allow the continued unaltered use of fossil
fuels, their elaborate and expensive capital infrastructure, and the industrial and eco-
nomic processes that depend on them. This has made CCS attractive to both fossil
fuel sectors and other energy-intensive economic interests.
CCS solutions come under criticism for three potential problems: first, they are in-
credibly energy-intensive, reducing the usable energy output of a plant by as much as
50% and increasing overall fossil fuel demand accordingly; second, they all sequester
the captured carbon dioxide in underground geologic formations–the stability and
durability of which are questioned, and the capacity of which to absorb the amount
of greenhouse gasses required for serious mitigation is doubted9; and third, CCS has
also specifically mentions a shift towards a greater share of services in its economy, which changes theincidence of emissions production but not the demand for emissions-generating products (O’Donnell,2011).
9See here Smil (2011b), who suggests that sequestration of today’s carbon dioxide output wouldrequire an industry of the scale and complexity of the global petroleum industry, capable of handlingannual volumes 50% larger than the annual production of petroleum from all global sources.
20
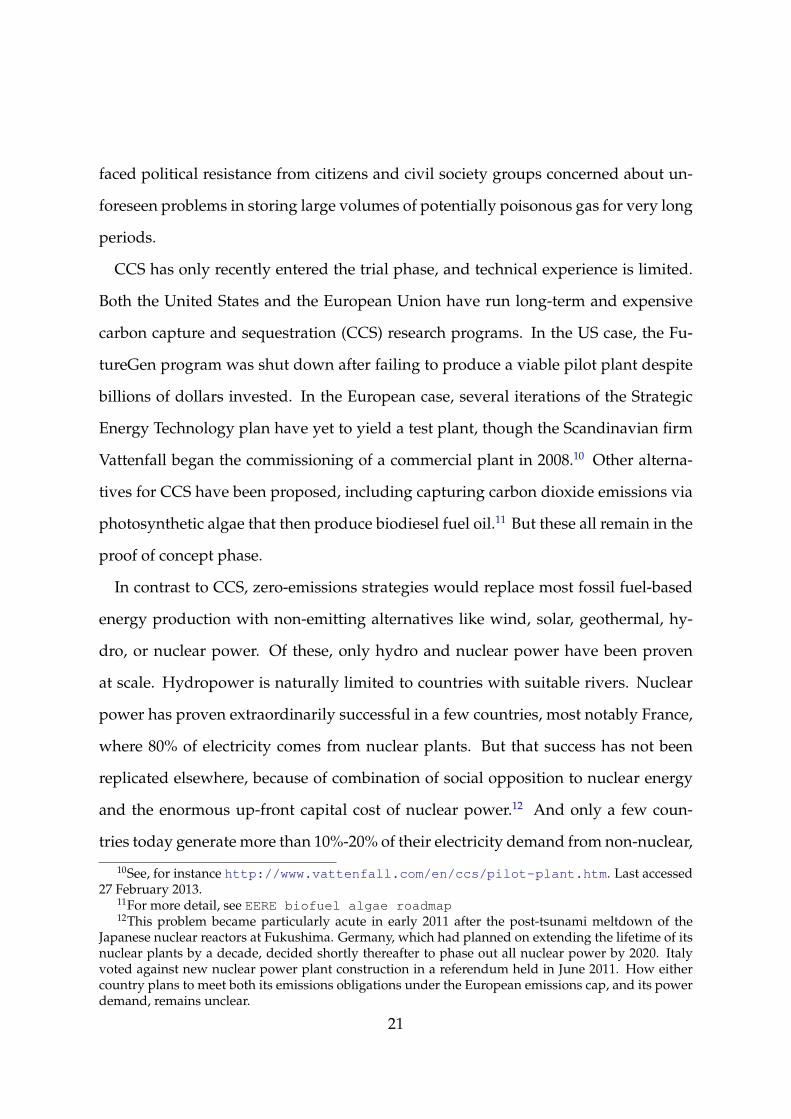
faced political resistance from citizens and civil society groups concerned about un-
foreseen problems in storing large volumes of potentially poisonous gas for very long
periods.
CCS has only recently entered the trial phase, and technical experience is limited.
Both the United States and the European Union have run long-term and expensive
carbon capture and sequestration (CCS) research programs. In the US case, the Fu-
tureGen program was shut down after failing to produce a viable pilot plant despite
billions of dollars invested. In the European case, several iterations of the Strategic
Energy Technology plan have yet to yield a test plant, though the Scandinavian firm
Vattenfall began the commissioning of a commercial plant in 2008.10 Other alterna-
tives for CCS have been proposed, including capturing carbon dioxide emissions via
photosynthetic algae that then produce biodiesel fuel oil.11 But these all remain in the
proof of concept phase.
In contrast to CCS, zero-emissions strategies would replace most fossil fuel-based
energy production with non-emitting alternatives like wind, solar, geothermal, hy-
dro, or nuclear power. Of these, only hydro and nuclear power have been proven
at scale. Hydropower is naturally limited to countries with suitable rivers. Nuclear
power has proven extraordinarily successful in a few countries, most notably France,
where 80% of electricity comes from nuclear plants. But that success has not been
replicated elsewhere, because of combination of social opposition to nuclear energy
and the enormous up-front capital cost of nuclear power.12 And only a few coun-
tries today generate more than 10%-20% of their electricity demand from non-nuclear,
10See, for instance http://www.vattenfall.com/en/ccs/pilot-plant.htm. Last accessed27 February 2013.
11For more detail, see EERE biofuel algae roadmap12This problem became particularly acute in early 2011 after the post-tsunami meltdown of the
Japanese nuclear reactors at Fukushima. Germany, which had planned on extending the lifetime of itsnuclear plants by a decade, decided shortly thereafter to phase out all nuclear power by 2020. Italyvoted against new nuclear power plant construction in a referendum held in June 2011. How eithercountry plans to meet both its emissions obligations under the European emissions cap, and its powerdemand, remains unclear.
21

non-hydro zero-emissions or renewable sources.
2.4 Energy systems: structure and change
Given the pace of emissions reduction required for serious climate action, and the
complexity of both options, climate policy suites will likely include both energy effi-
ciency and low-emissions energy as complementary instruments. But simply stating
that we will build a low-emissions economy obscures the challenges of adopting sig-
nificant quantities of renewable energy in a system capable of supporting substantial
improvements in energy efficiency. And it says nothing about the political issues at
stake in using either lever effectively.
This section defines the parameters of a low-emissions energy systems transforma-
tion, as a prelude to elaborating a theory of the political economy of climate change
in chapter 3. I argue that energy systems will be the focus of both the technical pro-
cess of climate change mitigation, and of political contestation around whether and
how to pursue emissions reduction. Energy systems provide the capital, technology,
and market structures required to generate, transmit, and use energy in productive
processes. Those systems may be as basic as a means of growing or gathering suffi-
cient food to power human labor; or as complex as the modern electrical generation
and distribution infrastructure. Though radically different in the details, the energy
systems that have persisted at different times and places over industrial history share
a common set of characteristics; and the historical pattern of energy systems transfor-
mation shows a set of distinct trends. Simply stating these changes suggest the scale
of the challenge implicit in constructing a low-carbon energy system; and the historic
trends that brought us the energy systems we enjoy today demonstrate the novelty
and the political difficulty of attempting to reverse those trends.
22

2.4.1 Energy systems13
I define an energy system as the entire set of installed, operational technologies, mar-
kets, and institutions that make a given energy source a practical choice for fueling
economic activity. This spans the production, distribution, and use of energy. For
electrical systems, this breakdown becomes obvious: the power plant, the power grid,
and the electrical appliances or plant of the end user, plus the power markets and the
metering technologies and regulatory systems that give structure to these markets.
Likewise, the liquid fuels industry that powers transportation consists of the oil and
gas wells, the regulatory apparatus that governs them; the pipelines and shipping
infrastructure that transports the oil; the refineries that transform it into useful fuels
and industrial chemicals; a second distribution system that brings the fuels to the net-
work of final points of sale; and the combustion technologies, automotive markets,
and regulatory apparatus that promotes the use of automobiles.
These combinations of technologies, policies, and markets are systems in two senses.
First, removal or significant alteration of any component would render all or part of
the system inoperable or superfluous. For instance, United States oil refineries con-
sume approximately fifteen million barrels of oil per week. Approximately 45% of
this is refined into motor vehicle gasoline, which then is sold through a network of
161,000 gas stations throughout the country.14 Firm decisions on how to allocate re-
finery time, purchase trucking and transport capacity, and franchise retail stations
are driven by the presence of a large private motor vehicle fleet. Alteration of the
fleet could, absent its replacement by a very similar technology with a similar de-
mand structure, render much of this capacity superfluous. Likewise, the continued
existence of the fleet is predicated on the presence of the system for production and
13This section was adapted from Huberty (2009)14Total station count taken from NPN MarketFacts 2008, available in summary form at http:
//www.npnweb.com/ME2/dirmod.asp?sid=A79131211D8846B1A33169AF72F78511&type=gen&mod=Core+Pages&gid=CD6098BB12AF47B7AF6FFC9DF4DAE988.
23

distribution of retail gasoline. Imagining transformative technologies that only affect
the automobile without affecting where its fuel comes from, how it is produced, and
the market conditions under which firms and individuals make a host of purchasing
decisions ignores the systemic nature of the industry in question. Moreover, the pres-
ence of the system creates powerful barriers to the entry of new technologies. Plug-in
electric vehicles could operate much like existing cars, but without a dense network
of recharging points analogous to the network of gas stations, they would be hobbled
by short range.15 Thus their widespread entry into the market is forestalled by the
characteristics of the existing system.16
Second, energy systems contain logics of operation that influence future develop-
ments.17 The existence of energy systems makes further innovation inside that sys-
tem less costly and less risky than innovation outside it. As shown by Katz and
Shapiro (1986), network externalities may prove large enough to reward the adop-
tion of sub-optimal technologies compatible with the current system over optimal
technologies that would require complementary changes in the rest of the system.
Furthermore, the sheer cost of building a parallel system deprives consumers and
firms of choices, cementing the dominance of networks long after the initial justifi-
cation for their configuration has passed. Thus energy exhibits behavior similar to
transportation, telecommunications, and other systems with significant economies of
scale.
These forces push the energy system tends towards incremental innovation. In-
15This problem has led electric car manufacturer Tesla to start deploying its own network of rapid-charger stations. At present, that network has only been deployed in dense population areas like theNortheast corridor. See ().
16Note that this is not suggesting that such a system is necessarily a market distortion, or exists dueto some form of private collusion, or governments “playing favorites.” It only points out that systemsof technology generate large positive network effects that influence the price structure and investmentand purchasing decisions for any one part of the system as well as for the whole. Since deploying anew system all at once is nearly impossible to coordinate, this creates near-term barriers to entry fornew technologies even without private collusion or public favoritism.
17This argument at the market level is similar to that made by Zysman (1994) at the national level.
24

cremental improvements may result from sophisticated technologies, and the firms
that deploy those technologies can deliver jobs and prosperity. But they continue to
exist within the same energy system, having not affected its whole, and as a result do
not achieve the hoped-for reductions in total consumption or emissions. In contrast,
technologies that are introduced from the outside, that do not fit well within the ex-
isting system, can find themselves marginalized, or face high barriers to entry from
both the initial cost of entry–the cost of constructing a parallel energy system–and
the marginal cost of operation. Unruh (2000, 2002) terms the resulting stasis “carbon
lock-in.”
Energy systems are therefore analogs to Hughes’ arguments on the inter-relatedness
of technological systems. His discussion of the electrification of New York City pro-
vides a typical example.(Hughes, 1979) He explains that Edison’s development of an
appropriate filament for the electric light bulb was not, as is sometimes portrayed,
a random walk across several thousand different materials. Rather, evidence from
Edison’s laboratory notebooks shows that had a particular goal in mind, one tightly
coupled to his plan to electrify Manhattan. The properties of the filament were set by
the expected market demand for electric lighting, the electrical load that this demand
would place on Edison’s coal-fired dynamos, and the resulting resistivity required to
match his ability to supply electricity to the physical properties of the demand system
at a scale set by the market. Edison’s filament design did not emerge in a vacuum;
rather, in Hughes’ argument, it emerged to complement the particular properties of
the energy system he was trying to create. Take away the structure of market de-
mand, the characteristics of the electric grid he had envisioned, or the capabilities
of his power generators, and a very different filament may have resulted. Likewise,
Hughes (1962) points out that electrification in Britain, despite enjoying access to the
same technologies as the United States, and operating with the benefit of the Ameri-
25

can experience in power grid deployment, experienced serious shortcomings due to a
mismatch between the technology and the financial and regulatory apparatus. In this
case, treating electrical power just like municipal water and sewer programs ignored
the different demands the former system placed on the legal, regulatory, and market
apparatus in which it functioned.
2.4.2 Energy systems transformation: not the first time
A low-carbon energy systems transformation would be the fourth major such trans-
formation in industrial history.18 England began the switch from wood to coal staring
around 1600.19 The rest of Europe followed in the 18th and early 19th centuries. The
adoption of oil began in the latter half of the 19th century and continued through
the second World War. Electrification began with Thomas Edison’s initial Pearl Street
generating station in Manhattan in 1882, and was finally pushed in to most of Europe
and the rural United States during the 1930s and 1940s.20
We should learn a few critical lessons from these earlier transformations. First,
they took a long time: nearly 200 years for coal, 100 years for oil, and 75 years for
electricity.
Second, each transformation took this long despite real and undeniable advantages
offered by the new fuel: each new generation promised denser, more easily trans-
18Smil (2011a) treats each of these processes in elaborate technical detail. What follows concentrateson the primary features of these transformations and their political implications.
19The initial shift took place primarily in London. Hammersley (1957) argues that overall forestproductivity in England was more than sufficient to support its population at that time. But he ignoresthe fact that the distribution system was incapable of bringing wood from much further away than25km, or 5km in the case of charcoal. Thus the capabilities of energy production were not matched bysufficient abilities for energy distribution. Coal, which could be cheaply from Newcastle to London,supplanted wood in the capital city long before it did so in the rest of the country. See Nef (1932) andFlinn (1984) for a complete history of the English wood-to-coal transformation.
20Hughes (1983, 1979) notes that widespread electrification in Europe and the United States reallybegan after the first world war. The combatant nations had built substantial electrical generationcapacity to power munitions factories. With the end of hostilities, those plants were re-oriented toelectrify cities and industrial production.
26

ported, and more universal sources of power than the last. As Perez (1985) notes,
each of these changes also expanded the opportunities for value creation in indus-
trial economies.
Third, each required wholesale changes not only to energy production–mining or
drilling or steam turbines–but also to distribution and use. The English coal industry
provides a wealth of examples. Energy production required not only the discovery of
coal seams, but the development of the steam engine to drain water from the mines
and push air through them. Those mines were in many cases poorly served by an en-
ergy distribution system designed around Stuart England’s remaining forests. Thus
an entirely new distribution system had to be built. Coastal shipping and inland
canals provided the initial infrastructure, but the system was only truly complete
with the construction of the railroads in the mid-19th century. Finally, effective use of
coal required a range of new combustion technologies even for the most basic tasks.
Allen (2009) notes that the adoption of coal in London required both the replacement
of fireplaces (wood-burning hearths were incapable of the concentrated airflow re-
quired to burn coal efficiently), and stoves and chimneys (to exhaust highly toxic
coal smoke and prevent it from coming in contact with food). These basic innova-
tions emerged alongside more complex developments in covered crucibles for firing
glass and other materials (Robert Mansell, c. 1615), blast furnaces (Abraham Darby,
c. 1709), and steam engines (Newcomen, c. 1712, and Watt, c. 1770).
These patterns repeat themselves in later transformations. Oil required a whole se-
ries of new engine designs, and a new transportation infrastructure to bring it often
significant distances. The widespread use of oil for transportation is closely tied to
massive investment in road networks and interstate highway systems whose scale
was unnecessary in a pre-automobile world. Electrification required massive invest-
ment not only in new plants, but also in new power grids, home appliances, machin-
27

ery, lighting, and a range of other technologies. In each case, mere substitution of one
energy source for another was only the first of a wide range of steps needed to effect
the transformation of the energy system.
In all cases, the motivations for these myriad parallel changes were multi-factorial.
For coal, oil, and electricity, the natural advantages of the new energy source over
the old provided powerful incentives to overcome the systemic barriers to use. In the
case of the wood to coal transition, that motivation was complemented in England
in particular by near-term shortages of firewood in and around London, which had
reached the natural limits of its regional energy system. But the state also played a
powerful role. Warde (2006) provides a fascinating account of the role of the state in
imposing modern forestry practices on 15th-century forests, to ensure the adequacy
of supplies of both fuel and material. The English crown forbade the use of wood
in glassworks in 1615 out of concern that it was driving wood shortages; a series
of innovations and shifts in the location of production for glass had to occur as a
result.(Nef, 1932; Hartshorne, 1897) Uncertainty about technology standards for the
new electrical power grids in the United States diminished rapidly after the New York
State Legislature chose an Alternating Current solution for the new Niagra Falls gen-
eration station, amidst fierce lobbying from both Thomas Edison and Nikola Tesla.21
The politics of oil are, of course, well-trod ground; suffice to say that access to reliable
supplies of oil is closely tied up in the legacy of 19th and 20th-century geopolitics,
and that the highway systems that made oil-powered personal transportation viable
constitute some of the largest state-led infrastructure projects in history.
21See Hughes (1976). Edison invented the electric chair at the time to drum up public fears of thedangers of alternating current.
28

2.5 Harder than last time: Novel challenges for the
coming transformation
While climate change mitigation will require an energy systems transformation of
a form common in industrial history, historical examples capture only a part of the
complexity of the problem. Earlier transformations tended to move the energy system
from lower to higher geographic and energy density; towards greater flexibility of
the final energy carrier; and towards greater reliability of supply. These benefits have
been powerful drivers of long-term energy systems transformation, and provided the
means by which these transformations could occur in the absence of a concerted effort
of the state.
In contrast, the technical characteristics of low-emissions renewable energy sources
pose additional, novel challenges. In brief, decarbonization based on renewable en-
ergy will move the energy system from a system of highly concentrated and geo-
graphically dense generation of constant power to supply exogenous low-density de-
mand; to a system of low-density and geographically diffuse generation of intermit-
tent power to supply endogenous demand. These characteristics thus run contrary
to the characteristics of earlier transformations, and impose higher barriers to change
than were faced in the past.
This section shows that the changes required by a low-emissions transformation
run opposite the direction of the major historical transformations: from higher den-
sity to lower, from greater reliability to less, and with no improvement in the flex-
ibility of the final energy carrier.22 These qualities should compound the complex-
ity of this energy systems transformation relative to prior examples. They will put
substantial limits on the degree to which the energy systems transformation can be22I will pay particular attention here to the electricity sector, where these changes are most pro-
nounced. But similar challenges–for storage, convenience, reliability, transportability, and density–pertain to transportation as well.
29

self-sustaining, while simultaneously raising the cost and complexity of the transfor-
mation itself. In particular, compensating for these differences will require substantial
changes not just in the technical infrastructure of the system, but in the markets that
set the framework under which that infrastructure is built and operated. As we shall
see in the following chapter, that poses real challenges to the political economy of this
energy transformation, and thus to the viability of climate change mitigation.
2.5.1 From constant to intermittent
Fossil fuel-based energy production is organized around a system of baseload and
peaking generation. Baseload generation–usually coal, gas, or nuclear-fired steam
turbine generation–provides constant, always-on energy supply. Peaking power–
usually fast-starting natural turbine power–supplements baseload power in order to
follow the peaks and troughs of the daily cycle of energy demand.
This system is predicated on the assumption that the operator has complete control
over the timing and scale of energy production. That assumption is supported by
a series of long-term contracts for power generation, futures markets that provide
price-smoothing mechanisms, and spot markets that provide short-term mechanisms
to match supply to demand. Within these markets, price-based power dispatching
ensures that cheaper baseload power is consumed prior to more expensive peaking
power.
Zero-emissions renewable energy violates most of these assumptions. By its na-
ture, renewable energy depends on flows, such as wind speed or solar intensity, over
which the operators have no control. These flows may be intermittent on a variety
of timescales–from minor fluctuations in the 15-minute range to larger fluctuations in
the hour range, to major fluctuations from year to year based on variation in climate
and weather conditions. Figure 2.3 provides a sense of those fluctuations in Denmark,
30

a high-wind-capacity market, over the last thirty years.
Month
Win
d po
wer
pot
entia
l pro
duct
ion
inde
x
50
100
150
200
250
2 4 6 8 10 12
(a) Wind power potential index bymonth. Baseline = 100.
0−200200−250250−300300−350350−400500−400500+
(b) Geographic distribution of wind power potential, inW / m2. Population centers overlaid; darker points in-dicate larger population.
Figure 2.3: Intertemporal and geospatial variability in wind power production poten-tial, Denmark. Intertemporal data represent averages over the period Jan-uary 1979 - March 2011 across all geographic areas. Geospatial data reflectmeasurements as of 1999. Source: Wind potential data provided by EMDCorporation, at http://www.emd.dk/Documentation/DK%20Wind%20Resource%20Map/. Intertemporal data provided by Vindstat, Den-mark, at http://www.vindstat.dk/. Population center data providedby the Socioeconomic Data and Applications Center Gridded Populationdataset, at http://sedac.ciesin.columbia.edu/gpw/index.jsp
Managing intermittency in an energy system with significant renewable energy
capacity will require changes to both the technical infrastructure and market super-
structure of the energy system.
Infrastructure issues for intermittency management
Technically, both engineering estimates and experience suggest that an energy system
can tolerate up to 20% generation from intermittent sources before the intermittency
interferes with the stability of the electrical grid.(Integration of Variable Generation
Task Force, 2009) Beyond that point, the fluctuations in power production can inter-
fere with the electrical stability of the grid and compromise its ability to deliver power
31

on demand. In the limit, unmanaged fluctuation can cause unexpected brownouts, as
for example when sudden drops in power inputs cannot be met by other generation
assets.
Market issues for intermittency management
Economically, the introduction of significant intermittent resources–particularly wind
energy–into power grids can affect markets for both the sale of electrical power and
investment in sufficient generation capacity to ensure systems stability. Electricity
sale is complicated by the potential for renewable resources to invert the price struc-
ture of electricity markets, while provision of sufficient capacity is complicated by the
realignment of market incentives necessary to drive adoption of significant amounts
of renewable energy.
Power markets structure power consumption based on the marginal cost of gen-
eration. Historically, this has meant that the markets construct a dispatch order–the
order at which different generation sources are fed into the power grid–that first con-
sumes cheap baseload power and only later more expensive peaking power.
However, renewable energy power sources like wind, though more expensive on
an average-cost basis than most fossil fuels, are often cheaper on a marginal cost basis.
Once generating capacity is installed, the variable cost of production is almost zero.
Wind farm operators, for instance, thus face strong incentives to produce whenever
the wind blows. On particularly windy days, this can lead to near-zero marginal
power prices as large amounts of effectively free wind power are offered to the mar-
ket. This can both disrupt system stability and dilute incentives to invest in baseload
power resources. This problem became severe enough in the Scandinavian power
market that Nordpool introduced a ¤-200 / MWh penalty on wind farm operators
who do not reduce production at times of system overcapacity.(Nord Pool Spot, 2009)
32

This realignment of market incentives is closely related to the problem of capacity.
Incentives to adopt significant amounts of renewable energy simultaneously reduce
the incentives to invest in fossil fuel generation, and increase the need for investment
in the kinds of flexible generation capacity that fossil fuels excel at, and which is
required to compensate for renewable power intermittency. Because that flexibility
may be needed only irregularly, investors face uncertainty about when and how they
will earn returns on their investments.
Solving intermittency: available options and political implications
The intermittency of renewable energy is thus disruptive to both the technical sta-
bility of the power grid and the economic incentives in power markets. The prob-
lems created by changes in the structure of power generation aren’t insurmount-
able. But, as has been emphasized above, dealing with these issues requires down-
stream changes to the structure of energy markets and energy distribution. And those
changes will require both technological innovation and policy choices.
The various aspects of this problem can be solved in a variety of ways:
1. Expansion of the scope of the energy system via robust interconnection to other
power markets, so that overproduction in one region can be redistributed to
other regions (and vice-versa when local conditions for renewable energy are
unfavorable)
2. Incorporation of storage capacity into the power grid, that is charged at periods
of over-production and discharged at periods of high demand
3. Introduction of capacity markets that incentivize investment in rarely-used but
occasionally crucial generation capacity to fill in for sustained under-production
of renewable energy
33

Expansion of markets requires both the construction of new electricity generation
infrastructure to connect those markets and establishment of the necessary regulatory
and market institutions to govern cross-border power trading. The planning and con-
struction process for electrical infrastructure takes a very long time, and represents a
massive capital expenditure. Interviews with European transmission network opera-
tors in the fall of 2010 suggested a 10-year planning horizon from initial identification
of new transmission needs to the start of operations on new lines. Costs for new lines
run upwards of $1 million per kilometer of new transmissions capacity, depending
on technology and whether more expensive but aesthetically more pleasing and thus
politically more viable underground cabling is required.23
Other solutions, including integration of significant storage capacity and mainte-
nance of flexible fossil fuel capacity, may require entirely new markets for power
capacity, rather than simply power.24 Capacity markets provide income streams to
investors that reward the existence of capacity, rather than simply its use. This can
provide the necessary incentives to invest in capacity that may be used at unpre-
dictable intervals and at uncertain prices. Cailliau et al. (2011) provides a primer on
these issues, and shows that multiple potential solutions exist, the viability of each
depending on both the technical and regulatory structure of the energy system. In
short, and consistent with a long-understood argument from political economy, the
23The California Independent Systems Operator (CAISO) estimates that long-distance 230kV over-head transmissions lines cost anywhere from $1.1-$1.8 million per mile, or $680,000-$1.1 million perkm. That assumes flat land and does not include the cost of acquiring territorial rights. See Ng (2009).Smil (2011a) suggests that $2 million per kilometer is a more accurate cost. Underground lines aremore expensive because of the greater technical complexity involved. Direct-current cables are moreexpensive because of their greater technical complexity and the need for AC-DC conversion at eitherend of the cable. This has limited their use to very long distances, where the greater efficiency of DCtransmission outweighs the higher up-front capital cost.
24Joskow (2006) provides a formal justification for capacity markets. In perfect electricity marketswith freely floating prices, investors in capacity would be rewarded for intermittent use of their assetsby very high prices–as in periods where the system was operating above normal capacity. But becausethose periods (1) usually threaten serious system instability and (2) threaten politically unpalatablepower prices, they usually trigger either ad hoc or statutory regulatory intervention to contain pricesand maintain stability. Thus dependence on very high prices for returns is unwarranted, creating theneed for alternative means for rewarding capacity investment.
34

solution to the intermittency problems created by renewable energy will require a
range of political and regulatory choices that will shape the development and use of
new technologies.
2.5.2 From concentrated to distributed
Modern electricity systems are based almost entirely on alternating-current (AC) gen-
eration technology. That choice emerged in part from the potentially greater efficiency
of AC power transmission, and in part from political choices about power systems
standardization. As Hughes (1976) has shown, the choice of AC instead of direct-
current (DC) technology was ultimately political–made by the New York State leg-
islature at a time of severe uncertainty about which system would ultimately prove
best for electrification. But that choice is ultimately dictated a range of engineering
decisions.
At the time of the decision, DC power could not be easily transmitted over long
distances due to severe line losses.25 Nikola Tesla’s AC systems, which became the
model for most systems worldwide, did not have this problem: the use of transform-
ers makes it easy to use high voltages for efficient long-distance transmission and the
step down the voltage close to the point of energy use.26
The ease of long-distance transmission resulted in an energy system reliant on
highly concentrated energy production. Coal-fired power plants in the United States
have an average generation capacity of 230MW. Most of those plants are located rela-
25This remains the case for short distances, but the efficiency of modern DC transmission technol-ogy now surpasses AC transmission at sufficiently long distances.
26This result emerges naturally from Joule’s first law. The transmitted power of an electrical signalwith voltage V and current i flowing through a line goes as P = iV . But the resistive heating in thatline goes as Pheat = i2R. Thus for a given power P ∗, a higher voltage produces a proportionately lowercurrent but reduces heat loss by the square of the change in voltage. Given US wall voltages of 120VAC, but transmission voltages at 100kV AC, this implies a nearly 700,000-fold increase in transmissionefficiency. Higher voltages also allow for serving both industrial and residential customers from thesame generation and transmission infrastructure.
35

tively far from population centers, and may be co-located with coal mines or other
fossil fuel input sources. Those plants are tied into the energy system via long-
distance, high-voltage transmission lines that supply local distribution grids. This
pattern is widely repeated in other advanced industrial economies.
Renewable energy looks completely different. With the exception of hydropower,
renewable energy is dependent on relatively diffuse energy sources.27 Renewable en-
ergy generation capacity cannot be concentrated independent of finding geographi-
cally concentrated renewable energy resources. This, in turn, means that the trans-
mission infrastructure for renewable energy must evolve from a system designed to
move power from high-concentration producers to a system designed to collect and
concentrate power from low-density producers. Thus capital investment in renew-
able energy requires both brand-new generation assets and significant new electricity
transmission infrastructure.
Some geographic concentration of generation is possible if suitable concentrations
of wind or solar resources can be found. Leading candidates here include offshore
wind energy in places like the North Sea and off the Irish coast; and solar power
in desert areas like the American southwest or the Sahara desert. But these regions
tend to be far from population centers and far from pre-existing transmission infras-
tructure. Thus these options also represent a significant geographic reorganization of
the transmission infrastructure, with the attendant capital costs and regulatory chal-
lenges. Both those costs, and who should pay them (the transmission systems opera-
tor, or the owner of the new generation plant) have proven politically contentious.
27This is transparently apparent on observation of Denmark. There, onshore wind farms are spreadover the entire country at a density of 2-10 windmills (6-30MW assuming the largest and most efficientmodern 3MW turbines) per farm.
36

2.5.3 From high-density to low-density
Prior energy systems transformations in the industrial era pushed the system towards
greater densities in two senses. Chemically, each new energy source contained more
energy per unit weight than its predecessors. Geographically, each new energy source
allowed for greater energy production per unit area than its predecessors. Renewable
energy, in contrast, reverses both these trends: physical energy sources like biofuels
are energetically no denser, and often less dense, than fossil fuels; and renewable
electricity is much less geographically concentrated than any fossil fuel-based power
generation alternative.
Replacements for thermal energy–combustion–are particularly problematic. The
only carbon-neutral option is purpose-grown biomass or crop residues. On a per-
weight basis, biomass is half as energy-dense as coal, and four times less dense than
natural gas. Thus a switch back to biomass crops and residues means a switch to
less-dense energy sources, with correspondingly more complicated logistics for con-
centrating the energy source for final use. Ongoing work on bioengineered crops may
improve these densities somewhat, but a doubling of the energy per unit weight of
biomass appears ambitious at best and unlikely at worst.
Renewable energy is geographically less dense as well.(Smil, 2010) Coal fired power
plants deliver power at a spatial density, in W/m2, 2-3 orders of magnitude higher
than either solar or wind-based energy. That means a much larger overall geographic
area dedicated to energy production than we have in today’s energy system. Not
only does that imply a much different geographic structure for the energy system, as
discussed in section 2.5.2, but it also suggests a reallocation of land from one set of
uses to another. Some of that reallocation is marginal–as in the co-location of agricul-
ture and wind turbines. But other forms–increased use of land for biofuel cultivation,
for instance–may displace other uses.
37
Reallocation of land use poses a range of political questions, of which two have
already proven highly salient. First it may take land away from other productive
activity. This has been particularly controversial in the case of biofuels, where land
use reallocation has moved arable land from food crops to fuel crops; or, as in Brazil,
led to deforestation in order to grow sugarcane for use as an ethanol feedstock.
Second, land use reallocation generates both environmental and aesthetic concerns
as previously undeveloped land is brought into the energy system. These concerns
can delay or prevent the construction of new energy production and transmission in-
frastructure. This has been a consistent problem for new transmission infrastructure
in much of northwest Europe, where the timeline for planning and development of
new infrastructure now lasts about 10 years. It has also delayed construction of new
wind farms in the American northeast, where coastal residents have objected to the
aesthetic impacts.28
Finally, the spatial reorganization of the energy system implies the potential aban-
donment of otherwise viable transmission infrastructure and its replacement, at sig-
nificant capital expense, with new infrastructure designed to service new and more
diffuse geographies. The capital losses implicit in writing off otherwise viable infras-
tructure must be added to the cost of new infrastructure in any appraisal of the cost.
Moreover, since that capital infrastructure depreciates over very long timescales–
American powerplants average about 50 years in age, transmission lines 30-40–the
natural depreciation and replacement of these assets may not occur in a timeframe
compatible with rapid decarbonization of the energy system. Hence not only must
major energy producers invest substantially in new infrastructure, but they may also
face losses from the writeoff of existing infrastructure.
28The Cape Wind project off the shores of Massachusetts has been in development since 2001. Asof 2013, it may finally receive approval to move forward. For a comprehensive review of the project,its opponents, and the challenges of offshore wind development in the United States, see Jr. (2013).
38
2.5.4 From exogenous to endogenous demand
Today’s energy system gives operators little control over consumer behavior. Most
residential consumers rarely see prices that reflect actually supply conditions; and
lack the tools to observe and react to those prices even if the data were available. This
is both a technical accident and a political choice: an accident, insofar as the trans-
mission and distribution system was never built to accommodate real-time pricing;
and a choice, insofar as public regulators have pushed utilities towards the pricing
models currently in use.29
Deprived of responsive demand, systems operators depend on long-term invest-
ment and capacity planning, and short-term wholesale market operations, to main-
tain systems stability. Markets have evolved accordingly, with long-term power con-
tracts designed around average demand profiles, and supplemented with day-ahead
and spot markets to match final supply to final demand. These complementary fea-
tures of energy production, transmission, and sale reflect a system that assumes abso-
lutely no control over demand, and makes investments targeted at an energy supply
flexible enough to meet that demand under almost any circumstance.
Because decarbonization implies a move away from constant and flexible power
sources, it has led to the hope that demand can be managed against supply to ensure
systems adequacy at all times. In many cases, this will require dynamic demand man-
agement. For instance, on peak power days in the middle of the summer, a difference
of a few degrees in temperature settings on the air conditioners in apartments across
a city could mean the difference between stable power supplies and brownouts. One
version of a “smart grid” would enable this kind of dynamic demand management
29Even attempts at reforming these pricing models run into problems. California attempted toderegulate both wholesale and retail electricity pricing in the 1990s. An unexpected (and likely tem-porary) electricity price spike shortly after deregulation generated pressure to discontinue real-timedemand pricing. The subsequent price mismatch between wholesale and retail markets contributed tothe 2000-2001 electricity crisis. See Sweeney (2002).
39

at the systems level, treating both supply and demand as variable in the process of
equilibrating the two.
This of course would represent a radical break with today’s energy paradigm. It
would require significant investment in new energy infrastructure to provide the in-
formation and control systems necessary for such a system to operate. And, as indi-
cated discussed further in section 2.5.1, it would also raise a long series of regulatory
and market design questions about how to price the service that energy consumers
are offering to the energy system (implicitly, stabilization services) and who owned
what rights to the information generated as a result.30
2.5.5 Substitution, not complementarity
Finally, earlier energy systems transformations introduced new sources that in most
cases became complements to, rather than substitutes for, pre-existing sources. Smil
(2011a) provides substantial evidence to the effect that earlier energy systems trans-
formations showed long-lived co-existence of parallel energy sources in different do-
mains of the energy system. New energy sources would establish themselves in niche
applications before broader adoption took hold. Warde (2007) provides similar evi-
dence for the history of energy consumption in England and Wales from the middle
ages onward. The widespread adoption of oil did not replace coal; indeed, most oil
is now used for transportation and as a chemical input. Meanwhile, coal remains the
most significant fossil fuel input to electricity production.
Because each new system could emerge alongside the old, the new system had
enormous latitude to experiment in a period before it became central to any major
economic or social process. This latitude enabled widespread experimentation with
30The information question is potentially substantial. Given that it’s reasonably possible to inferdaily patterns of human behavior from their energy consumption profile, gathering daily consumptiondata from a significant proportion of households poses serious concerns.
40

the properties of the new energy system, properties that only later settled into stan-
dards and manifested the kinds of economies of scale that have characterized the
inertia in networked systems.
But, as shown in section 2.3, this strategy may not suffice in the limit for the trans-
formation to a low-carbon energy system. Actual absolute emissions reduction will
require the replacement, rather than modification, of the energy infrastructure. And
that will, in turn, mean that the new energy system must replace the old without sub-
stantial disruption of the downstream patterns of economic and social behavior that
have come to depend on it.
2.6 Synthesis: The energy system as a policy constraint
The history of energy systems transformations illustrates the need for a series of com-
plementary changes across the energy system to make a new energy source a viable
means of fueling economic and social activity. In the past, those changes were driven
in part by the inherent advantages of the new fuel, in part by limitations and supply
constraints in the existing systems, and in part by state action to to either force change
(in the case of English concerns about wood fuel exhaustion) or stabilize the environ-
ment for the massive investments required for construction of a new energy system.
All these factors suggest the complexity and difficulty of substantially increasing the
efficiency of modern energy systems while radically cutting their carbon intensity.
They also suggest the diversity of political and economic approaches required to in-
duce and sustain the transformation.
This technical interlude has sought to locate the climate policy problem in the con-
text of the energy systems transformation required to solve it. The political choices
about whether and how to pursue energy systems decarbonization and energy ef-
ficiency improvements will occur in a context framed by the the opportunities and
41

constraints of these systems. As such, the question of how interests will form for and
against this transformation becomes much more complex. A full theory of the po-
litical economy of climate change mitigation requires that we account for these con-
straints and opportunities. As the next chapter will argue, while the impacts to the
narrow economic interests of the fossil fuel sector are usually quite clear, the broader
pattern of interest formation is by no means pre-determined. Rather, because the
energy system provides a range of interdependent services to the economy, it may
create possibilities for balancing costs in one area with gains in another. Those kinds
of tradeoffs may permit a political consensus in favor of climate change mitigation
to form, even in the face of significant potential costs to some sectors. But we cannot
understand the potential for this kind of issue linkage without considering the nature
of the energy system in detail.
42

3 The political economy of climate
change reconsidered
3.1 Introduction
With the technical background from chapter 2 in hand, we turn back to the politi-
cal problem of emissions reduction. A global, binding agreement on climate change
mitigation has proven ephemeral. In its absence, unilateral state action on emissions
reduction should be highly improbable. Climate change mitigation imposes poten-
tially large costs, faces acute technological uncertainty, and delivers benefits largely
in the form of global public goods. The resulting incentives for free-riding on the
actions of others should provide few incentives for individual state action, even as it
also interferes with attempts to bind the major emitters into a common framework.
Nevertheless, individual states or small groups of states have adopted a variety of
climate policy measures in spite of the lack of a global climate treaty. These range
from incremental efforts like research and development on low-emissions technolo-
gies, to comprehensive emissions control regimes. The states pursuing these mea-
sures include both advanced industrial democracies and developing economies: The
European Union has a comprehensive emissions control regime; South Korea has
published a wide-ranging “green growth” economic development strategy; China is
43

the world’s largest market for renewable energy goods; India has an ambitious solar
electricity program; Brazil operates the world’s largest fleet of alternative-fuel vehi-
cles, run on ethanol produced very efficiently from sugarcane. Surprisingly, many of
these efforts were redoubled after 2008, despite the onset of the worst global economic
crisis since the Great Depression.
Unilateral state action in spite of weak or nonexistent global coordination defies
a view of climate change that emphasizes the creation of global public goods via the
resolution of negative environmental externalities. Yet we’ve little evidence for a sud-
den turn towards altruism or virtue. Resolving this dilemma poses two questions for
political science. First, when would we expect states to act in the absence of a global
framework; and second, how would we expect states to implement an emissions con-
trol regime? The first question asks why states would take action that apparently
risks the growth and competitiveness of their domestic economies relative to free-
riding competitor states; and the second questions how they would do so given the
politically difficult task of imposing acute costs on powerful economic interests.
This chapter presents a theoretical framework for the political economy of climate
change mitigation that resolves the apparent contradiction of state action in the face
of very large incentives for political stasis and free-riding. It argues that the pattern
of individual state action on climate change depends on whether states can link emis-
sions policy to other energy policy domains that produce near-term, tangible, pri-
vate benefits to action. Those benefits provide the means of securing a policy bargain
among major economic actors, assist in resolving the distributional conflicts that arise
from significant emissions reduction, and generate new interests in favor of long-term
policy continuity.1
1Urpelainen (2012a) presents a parallel model of a “technology fund” in which developed-countryactors provide subsidies to developing countries to buy low-emissions technologies, as an implicitsubsidy to developed-country technology firms. Participation among multiple developed countriesmay be secured, he notes, though linkage across technologies rather than issue areas. Here, I arguethat absent such a fund, a multiplicity of climate policy instruments may accomplish the same ends
44

Whether states can find viable issue linkages depends, as chapter 2 argued, on
the the structure of national energy systems and the corresponding tasks required to
shift the energy system to a low-emissions trajectory. Fossil fuel use generates nearly
70% of global emissions even as it also provides the foundation of modern indus-
trial economies. The physical, economic, and regulatory structure of legacy energy
systems thus shapes the costs and benefits of emissions policies for the entire econ-
omy. As such, it influences whether those policies can offset the costs of emissions
reduction through the generation of benefits from other energy-related domains like
energy security, economic competitiveness, or high-technology innovation.
Treating climate change mitigation as a problem of energy systems transforma-
tion provides substantially more analytic leverage over the politics of climate action
than more traditional approaches based in environmental politics. As 2 discussed
in detail, the complexity, cost, and uncertainty surrounding the transition to a low-
emissions economy are unlike anything encountered in other environmental issues
to date. While the environmental movement has been vital to publicizing the issue
of climate change, social movement dynamics and public opinion are poorly suited
to the maintenance of long-term and potentially costly policy. Instead, viable emis-
sions policy will require a durable coalition of industry and labor, similar to that of
large-scale industrial policy measures. Understanding whether and how that coali-
tion may emerge amidst legacy structures for energy production, distribution, and
use in industrial economies provides a vital contribution to the analysis of climate
policy action.
This chapter proceeds in three steps. I first summarize the conventional wisdom
surrounding the politics of climate change, and illustrate its shortcomings for un-
derstanding state policy choices. I then present a model of when and how individual
states or regions would embark on a low-emissions energy systems transformation in
through different means.
45

the absence of a binding global emissions deal. I show that this model helps explain
today’s pattern of action and inaction on climate change, and offers analytic leverage
on the question of how state action will evolve in the future. Subsequently, chapters
4–5 provide empirical evidence from the European Union, home to the world’s most
comprehensive climate change policy regime, that supports validity of this model.
Finally, chapter 7 suggests that the model also provides insight outside the EU, pro-
viding insights into both instances of policy success like South Korea; and policy
failure, as in the United States.
3.2 Towards a political economy of low-carbon energy
systems transformation
Recounting the conclusions from chapter 2: Emissions reduction via energy systems
transformation poses very significant barriers to policy action. It lacks the natural in-
centives that earlier energy system transformations enjoyed. It faces profound tech-
nological uncertainty. The changes required must occur though highly networked,
monopolistic, and inertia-prone markets. And the interests displaced by emissions
reduction are wealthy and well-connected, and stand to benefit from the sympathies
of many energy consumers dissatisfied by higher energy prices. Meanwhile, the pri-
mary benefits from climate change mitigation arrive far in the future, and in the form
of largely intangible global public goods that accrue to everyone regardless of their
contribution to emissions reduction. This pattern of costs and benefits has regularly
forestalled coordinated global action on climate change, and offers little reason to
expect unilateral action.
Empirically, however, some states have adopted emissions reduction measures of
varying degrees of ambition and comprehensiveness: In 2010, South Korea adopted
46
a “green growth” strategy that included emissions targets and renewable energy
promotion measures; Colorado adopted significant subsidies and other regulatory
changes favoring renewable energy; California has pursued both renewable energy
and emissions control via its AB32 legislation; China has become a major market for
renewable energy; and the European Union, considered in much greater detail later
in this book, has adopted a wide-ranging climate and energy policy strategy.
State action in the face of apparently overwhelming incentives to the contrary poses
two questions that cut to the core of the comparative political economy of climate
change mitigation:
1. When should we expect states to institutionalize climate change action?
2. How should we expect states to institutionalize a policy framework for climate
change action?
3. What would have to occur to fundamentally change the answers to (1) and (2)?
This section provides a framework for answering these questions, grounded in a
theory of the political economy of energy systems transformation. I show that while
alternative explanations for state action reliant on public opinion, party structures, or
bureaucratic entrepreneurship provide some insight into state action, their predictive
value is limited in both time and space. Resolving the contradiction between action
on emissions reduction and the problem of global public goods requires looking be-
yond political processes to the way in which domestic energy systems structure and
distribute the costs and benefits of climate change mitigation.
47

3.2.1 Why might states act? Postmodernism, greens, and
bureaucratic ambition
Theoretically, the literature has suggested three explanations for variation in individ-
ual state willingness to adopt and institutionalize greenhouse gas emissions reduc-
tion. The “post-modern politics” thesis suggests that non-material goods have taken
precedence over ever-growing material prosperity in sufficiently wealthy countries.
In this view, emissions reduction represents a kind of consumption good attractive to
citizens in wealthy advanced industrial economies.2
A second argument has suggested that this preference for non-material goods is
particularly well-expressed where green parties have established themselves and pro-
vided single-issue representation in national parliaments. Jacobsson and Lauber (2006)
pursue that notion in their explanation of Germany’s transition towards a favorable
environment for renewable energy adoption. They argue that German adoption of
renewable energy emerged as a fight between the Energy ministry, allied to the fossil
fuel sector, and the Environment ministry, backed by an increasingly powerful green
party. Green parties in this argument embody a particular desire for environmental
goods that may be willing to make explicit trade-offs of material consumption for
improved environmental outcomes.
Finally, scholars have pointed to bureaucratic entrepreneurship in seeking issues
to exploit for institutional gain. The high profile of the international climate change
negotiations provided a potential venue for bureaucrats to exercise additional power
2The existence and strength of a “postmodernist” effect on attitudes towards environmental pro-tection goods was confirmed by Diekmann and Franzen (1999), contrary to the results of Dunlap andMertig (1995) and related work. Bättig and Bernauer (2009) find evidence that democracy increasescitizens’ expressed commitment to climate change mitigation, though that commitment rarely trans-lates into actual changes in emissions levels. Gerhards and Lengfeld (2008) find that the relativelywealthier countries of the EU-15 support EU climate policy at higher rates than citizens of the newmember states. The debate tracks with the left-libertarian realignment of European politics proposedby Kitschelt (1994), who argues that high levels of socioeconomic welfare have led disputes over non-economic goods to reassert their influence over late 20th-century European party identification.
48
outside domestic economies, or to establish new international roles. Promoting cli-
mate change mitigation at home may thus provide credibility for bureaucrats hoping
to exercise power or autonomy abroad. Schreurs and Tiberghien (2007) suggest that
this played an important role in the EU, where the European Commission sought a
defining issue for its new foreign policy role after the passage of the Lisbon Treaty.
In practice, however, these three explanations offer an incomplete explanation for
empirical patterns of climate change action. The new member states in Eastern Eu-
rope display far more conventional political preferences than their postmodern west-
ern European counterparts, yet those states supported the 2008 Climate and Energy
package. China and India are relatively poor and have weak or nonexistent green
parties, yet both have ambitious goals for renewable energy adoption. South Korea, a
successful middle-income, heavy industrial developmental state, has adopted an am-
bitious green growth policy. The United States, as Skocpol (2013) points out, has very
well-organized environmental lobbies who have spent very large sums on public per-
suasion and political lobbying, but to no effect. Finally, EU policy entrepreneurship
proved disastrous at the Copenhagen climate talks, where the EU was largely shut
out of final negotiations. But the EU has shown few signs of changing its long-term
approach to climate and energy policy at home.
Furthermore, these explanations offer relatively few predictions of what states will
do in the future. Victor (2011) has characterized today’s landscape as one of “enthusi-
astic” and “reluctant” states. In the language of postmodern altruism and wealth, that
typology should at least include a “skeptical” category for countries like the US, who
have the wealth to act but not the will; and “vulnerable” for those whose suscepti-
bility to climate damage makes them desperate for action even as they lack resources
or international influence to promote or force it. Given the variation in postmod-
ern altruism and the resources to do something in response, that implies a landscape
49

something like figure 3.1.
But this typology, like the factors that underpin it, says little about how states will
evolve over time. Will China, India, and Brazil become more like the US or the EU as
they climb the income ladder? China has, for instance, become rather less recalcitrant
in international negotiations over time, without either developing green parties or
displaying much in the way of post-materialist values. Likewise, a framework based
solely on political values and party relations provides little insight as to whether the
present American reluctance to act on climate change is a product of momentary po-
litical spasms, or of deeper American economic and environmental interests.
Finally, on a more practical note, these explanations offer limited guidance as to
how policy could be implemented or sustained in light of the barriers and setbacks
observed to date. Even in rich, liberal states, preferences for climate change pol-
icy have proven volatile, often for reasons wholly unrelated to the climate change
problem itself. For instance, Egan and Mullin (2011) provide evidence that extreme
weather events, which individually provide no information on long-term climate
trends, may significantly affect citizens’ attitudes towards climate change policy. Like-
wise, the US has consistently failed to adopt climate policy despite periods of signifi-
cant political support. Climate policy dependent on the postmodern altruism of rich,
liberal countries would thus appear to offer little promise of gaining or sustaining
much traction in the face of its potential costs and risks.
The range of observed variation within the group of ostensibly “enthusiastic” states
suggests the limits to hypotheses reliant on public opinion and party structures. Like-
wise, the range of policy action observed across “enthusiastic” and “reluctant” states
suggests the limits to these categories themselves both now and in the future. Ex-
plaining both why states have acted, and how they have chosen to act, needs to look
beyond these factors and categories to understand interest group formation and be-
50

havior vis a vis emissions reduction.
Will (Altruism?)
Wea
lth
USUK
FRDE
DKESPT
SESI
CZ
CN
IN
BZ
Maldives
Bangladesh
Enthusiastic
Reluctant
Skeptical
Vulnerable
Figure 3.1: The conventional model of climate action, supposing that the choice to actis driven by a combination of altruism and wealth. “Enthusiasm” and “Re-luctance” are based on the analysis by Victor (2011). “Vulnerable” statesare those for whom climate change poses massive risks: the Maldives, forinstance, is only 0.5m above sea level and is presently seeking new terri-tory in anticipation of rising sea levels.
3.2.2 Beyond wealth and altruism: issue linkage and energy systems
transformation
In contrast to these explanations for action and inaction, I posit that countries will in-
stitutionalize emissions reductions when the changes required of the energy system
generate ancillary benefits elsewhere that can be used to justify the costs of emissions51
reduction3. Those benefits provide the means for two politically important tasks:
first, to compensate losers who might otherwise have diluted or blocked progress on
emissions reduction; and second, to create new interests allied to emissions reduction
because of the acute benefits it brings, rather than a diffuse desire for environmental
goods. The energy system thus frames whether and how emissions reduction can
generate private as well as public goods; and whether those private goods can help
stabilize improve outcomes for both the winners and losers from emissions reduc-
tion. Moreover, an explanation grounded in a careful analysis of energy systems can
provide testable implications for the behavior of countries currently unaddressed by
theories reliant on postmodern political preferences or green interests and parties.
Making enthusiasts of the nations? The promise and shortcomings of issue
linkage
I propose that the connection between long-term environmental goals and the near-
term material returns to systems transformation can be thought of as an instance of
issue linkage. Traditionally, the study of issue linkage has emphasized inter-state re-
lations and the terms under which states would cooperate in an otherwise anarchic
world. There, the notion of issue linkage has been studied empirically in joint nego-
tiation of economic and security issues (Davis, 2009), trade liberalization across sec-
tors (Davis, 2004), European integration (Huelshoff, 1994; Moravcsik, 1993; Moravc-
sik and Nicolaïdis, 1999), European Community policymaking (Weber and Wiesmeth,
1991), and trade sanctions (Lacy and Niou, 2004).
Issue linkage has often been proposed as a solution to overcoming the incentives
to free-ride at the heart of the emissions problem. As modeled by Tollison and Willett3Urpelainen (2009) suggests that a similar dynamic may take place at the sub-national level. He
presents a model wherein local politicians act despite national inaction on the basis of superior privateinformation about near-term economic or political benefits. He then suggests that acting reveals infor-mation to national politicians, who may then act themselves. This section suggests that those benefitsdo not scale, and so can only form part of a multifaceted political deal.
52

(1979), issue linkage proposes that coupling progress in one domain to progress in
another can create new equilibria that improve negotiation outcomes for both parties.
This is principally true, as in Sebenius (1983), if the pattern of costs and benefits in the
two issue areas are asymmetric among the negotiators. If progress on an issue that
principally benefits one party can be coupled to another issue that benefits the other
negotiating partner, both may find reasons to accept a resolution to the issue area that
they do less well at.
In the international negotiations on climate change, however, issue linkage has not
lived up to its promise. The Kyoto Protocol contained provisions for two programs,
the Clean Development Mechanism (CDM) and Joint Implementation (JI), that pro-
vide a case in point. Both were intended to align developed and developing coun-
try interests. Traditionally, developing countries had demanded compensation for
participation in emissions mitigation. But pure cash compensation was not accept-
able to the developed economies. Instead, CDM and JI were intended to provide
implicit side-payments from developed to developing countries. For CDM in par-
ticular, developed countries would gain emissions reduction credits by investing in
low-emissions development projects in the developing world. Since those projects
would in general be cheaper than equivalent emissions reduction in the developed
world, the rich countries could benefit from cheaper emissions abatement options.
Meanwhile, the poor countries would get the capital they wanted, and a high-tech
infrastructure base to boot. In practice, however, these assumptions proved unwork-
able. Neither CDM nor JI delivered very much in the way of emissions reduction,
and the development projects proved vulnerable to corruption, abuse, and various
other problems.(Wara and Victor, 2008; Schneider, 2008)
More recently, the 2001 departure of the US from the Kyoto Protocol renewed in-
terest in issue linkage strategies. Tying American access to economic negotiations
53

in trade or technology sharing to its resumption of its Kyoto Protocol obligations
seemed a promising way to rein in the world’s largest greenhouse gas emitter (Kem-
fert, 2004; Buchner et al., 2005). But Hovi and Skodvin (2008) show that these propos-
als would probably fail and do serious damage to international economic institutions
along the way. In particular, they lack the two precursors for effective linkage: a
realistic link between two negotiating areas, and a credible means of enforcing that
link. Advocates for issue linkage presumed that the US would desire trade liberal-
ization enough to return to the Kyoto framework. But that implies that the rest of
the world had the power to deny the US–the world’s largest economy and holder of
the global reserve currency–participation in trade negotiations. There’s little credible
reason that the US should expect this to occur; and hence little reason to think that
issue linkage would work to bring the US back into global negotiations on emissions
reduction.
Issue linkage through the energy system: assets and credible commitment
These actual and potential failures of issue linkage in climate change policy arguably
stemmed from the choice of issue areas and the ensuing lack of reasons to take the
linkage seriously. The size and importance of the US economy weakens any threat to
cut it out of global markets. Likewise, the CDM and JI mechanisms depended on the
assumption that rich economies counted climate change benefits as real and tangible,
and would thus readily trade real cash for poor countries’ participation. In practice,
the rich countries ran into real limits to both will and wealth.
Instead, I argue that successful issue linkage will emerge from the problems and op-
portunities created by national energy systems. The complementary nature of the en-
ergy system means that changes to reduce emissions will necessarily impact a range
of other functions that system performs. As chapter 2 showed, that complementarity
54

complicates the process of systems transformation. But it also raises the potential to
generate real, tangible, and near-term benefits. If states can use energy systems trans-
formation to solve problems created by their legacy energy systems, or to pursue new
opportunities, they may find real, credible, and even physical reasons to tie emissions
reduction to other energy policy domains.
Moreover, because the benefits that underpin these linkages flow from the evolving
physical assets and markets that make up the energy system, they should be more
credible and thus stable than other attempts at issue linkage in climate policy. As
chapter 2 pointed out, the need for complementary change is driven at its root by
the technical needs of the energy system. Those needs, by their nature, have serious
downside consequences if left unaddressed. Hence the credibility of the commit-
ment to actually carry through on those changes may be larger than in other, failed
instances of issue linkage, in large part because the downside risks are greater.
By implication, however, the potential for issue linkage via the energy system
should be much higher within states than between them. The predominately national
scope of energy systems limits the opportunity to use systems-mediated issue linkage
to bring states together–except in cases like the EU, where substantial transnational
political institutions already exist. Rather, the theory of issue linkage proposed here
suggests that it will primarily involve coupling across interest areas within domestic
or regional systems where emissions reduction can be tied to the creation of privatiz-
able economic benefits ancillary to the climate problem itself. This does not discount
the possibility that inter-state cooperation on systems transformation can display sim-
ilar phenomena, particularly where energy system interests correlate strongly with
state boundaries.
To support issue linkage, a low-emissions energy systems transformation offers three
55
primary categories of ancillary benefits:4
1. Reduced risk to energy supply and price insecurity
Energy security refers to the degree to which a country’s energy system is ex-
posed to either supply disruptions or price shocks and price volatility. Insecu-
rity induces harm in two ways: supply disruptions interfere directly with the
functioning of the energy system; and price shocks and volatility can adversely
affect the competitiveness of domestic firms and their ability to engage in long-
term production planning.
Supply insecurity results from the origins and diversity of imported energy.
Most countries depend in one form or another on imported energy for electricity
generation and transportation. In many cases, those imports come from parts
of the world that are geopolitically unstable or politically unpalatable (the Mid-
dle East), or with which the importing country has unstable relations (as with
eastern Europe dependence on Russian gas). This instability has often resulted
in supply disruptions, particularly if a country depends on one or a handful of
countries for the majority of its energy supplies.
In contrast, low-carbon energy is usually domestic energy.5 The sources of re-
newable energy are ubiquitous, and can be exploited on domestic territory. As
such, they offer (for electricity generation, in particular) the opportunity to re-
duce domestic dependence on imported fuel sources. To the extent that energy
insecurity imposes negative externalities on economies, the improved security
4Several forms of benefit, including public health benefits from reduced pollution, are not men-tioned here. While there is little doubt that these benefits do exist, they do not provide the kind ofconcentrated and privatizable returns necessary to offset the acute and tangible near-term costs im-posed by emissions reduction.
5The DESERTEC project under consideration at the European Union is an exception. It anticipatesbuilding large solar farms in the Sahara, and linking them into the European power markets throughlong-distance undersea transmission cables. The cost/benefit profile of the project aside, political in-stability in north Africa in early 2011 has provided some cause for re-thinking the wisdom of thisproject as a solution to supply instability.
56
of domestically-generated renewable energy provides immediate benefits to do-
mestic firms and citizens. There may also be a prospective justification for such
investments, insofar as aggressive competition from emerging economies for
preferential access to fossil fuel resources may signal future supply constraints
and instability.
Price insecurity originates from a wholly different set of phenomena. Even if
countries are unconcerned about potential instability of supply, they still con-
front impacts of fluctuating world prices for fossil fuel energy. Energy importers
are mostly price-takers on world markets. Price fluctuations in domestic energy
bills have important consequences for the balance of trade. In a floating cur-
rency regime, this translates into fluctuating exchange rates and downstream
impacts on the price of domestic goods in export markets. Price fluctuations
also impact the cost structure of domestic firms and may interfere with long-
term production planning, or impose hedging costs on firms in order to mute
the effects of world price volatility.
Reduced fossil fuel consumption can generate price stability benefits in two
ways. First, on the assumption that fuel costs will continue to rise over time,
it can provide relative improvements to the competitiveness of domestic firms
compared to more energy-dependent foreign firms.6 Second, to the extent that
volatility itself–and not just the price level–imposes costs, the reduced exposure
to price volatility that comes with reduced exposure to fossil fuel markets can
generate real cost advantages there as well.7
6Interviews with senior policymakers in Denmark in early 2010 suggested that this motivationwas well-understood. They viewed their greater energy efficiency as a contributor to increased Dan-ish competitiveness amidst high and volatile fossil fuel prices. This interview evidence provides ad-ditional confirmation of the results in Urpelainen (2011). He provides evidence that export-orientedOECD countries with limited access to cheap energy face strong incentives for energy efficiency as away to reduce input costs and protect comparative advantage.
7Wal-Mart is an interesting case in this regard. Given their sheer size, energy became a sizable costcenter that had historically gone un-examined. Cooperation between Wal-Mart and the Nature Con-
57

2. Improved systems performance
Both developed and developing economies may suffer from inadequate infras-
tructure relative to their energy needs. For developed economies, renewal of
aging infrastructure to accommodate renewable energy may also reduce the in-
stability of the system as a whole. That instability imposes real costs on eco-
nomic performance: blackouts cost the United States an estimated () annually.
For developing economies, renewable energy may simplify the process of build-
ing a new energy system. The ability generate power locally, without large and
expensive transmission and distribution infrastructure, may mean that renew-
able energy provides new and valuable energy services. Coupled with energy
security arguments in the context of rapidly increasing emerging-country de-
mand for fossil fuels, renewable energy may offer tangible near-term benefits
from improved energy services that would motivate the adoption of renewable
energy over other alternatives. However, to date this appears to have meant
adoption of renewable energy as a complement to, rather than substitute for,
additional fossil fuel energy capacity.8
3. Employment and comparative advantage
In contrast to energy security, which improves benefits through reduced risk ex-
posure, low-emissions energy sources may also improve the economic prospects
for existing and new sectors of domestic economies. These benefits can arise
from technological advantages in new industrial sectors, or job creation in pro-
tected sectors.
servancy, among others, led to a corporate emphasis on energy efficiency. Wal-Mart subsequently usedits buying power to bring down the cost to consumers of various energy efficiency goods. Wal-Mart isof course an outlier on both energy consumption and corporate size, but this case is at least indicativeof the myriad challenges and opportunities for energy efficiency improvements. See Gunther (2006).
8See here, for instance, Asif and Muneer (2007) on Chinese adoption of renewable energy amidstindigenous reserve constraints; and Karekezi and Kithyoma (2002) on the potential for solar energy toimprove rural electrification in Africa. Also Joanna Lewis on China.
58

A renewable energy will require a range of new innovations, technologies, and
expertise. Delivering those requirements will on its own deliver significant,
if short-term, economic returns to new constituencies of firms and workers.
Furthermore, early adopters may enjoy additional returns through export-led
growth. There is evidence that energy technologies benefit substantially from
learning-by-doing effects: the knowledge required to successfully design, build,
and deploy these assets at scale requires actually designing, building, and test-
ing them in real-world environments.9
Under this set of assumptions, states that start early on energy systems trans-
formation may benefit from spillover effects in the competitiveness of domestic
industry that produces renewable energy sector goods. The potential, or reality,
of such spillovers may be a motivating factor for states to engage in emissions
reduction.
The benefits created through these new industries may improve policy sustain-
ability as well as policy acceptability. The new industrial interests created by
this process (namely, the renewable energy sector firms, their workers, and their
supply chains) will have material reasons to support the continuation of emis-
sions policy and offset the weight of interests that might lobby for moderation
or discontinuation of the policy framework.
Improvements to the efficiency of domestic energy systems may also gener-
ate new sources of employment in protected sectors. Roland-Holst (2008) has
shown that energy efficiency improvements can generate positive employment
feedback in sectors protected from international trade. In brief, improvements
to energy efficiency reduce demand for employees in the energy sector, but re-
9See, for instance, Heymann (1998) on the parallel development of the Danish, German, and Amer-ican wind power industries; and Schneider and Azar (2001) on the justification for early investment inemissions reduction based on arguments over knowledge capital accumulation.
59

lease funds for uses other than energy purchases. Empirically, it appears that
most of those funds go to buy output from more labor-intensive sectors than
energy, leading to overall employment growth, much of which occurs in sectors
insulated from international competition, such as services.
Thus, consistent with Jacobs (2008) and Patashnik (2003, 2008), climate policy may
stabilize itself if it can create constituencies with a material stake in policy continu-
ity. Growing these constituencies out of the near-term benefits of a low-emissions
systems transformation would help offset opposition from those interests that lose
most from the cost of emissions reduction. The exact configuration of these bene-
fits will vary by country, but will ultimately be shaped by the structure of national
energy systems. Whether states can choose policy configurations to improve energy
security, enhance industrial competitiveness, or expand energy supply will depend
on whether and how their energy system and the broader economy facilitate such
choices. Regardless of exactly where they come from, however, the potential for gen-
erating such near-term, tangible, and privatizable gains offers the crucial possibility
of creating and sustaining a bargain with industrial interests in favor of continued
action.10
The potential for such ancillary benefits now or in the future provides better ex-
planatory power for understanding why countries fall into the “enthusiastic”, “re-
luctant”, or “skeptical” categories outlined in figure 3.1. Unlike arguments built on
the intersection of wealth and green parties, it provides for more specific predictions
of the geometry of policy action, grounded in the need for long-term policy institu-
tionalization and not just short-term policy action. Stated formally, the potential for
ancillary benefits to secure political coalitions from issue linkage depends, as in Tol-
10Urpelainen (2012b) provides a formal model of this process in which excess profits from renew-able energy mandates drive support for politicians who supported them. Since more stringent man-dates provide larger profits, politicians may have greater incentives to deliver more stringent mandatesover time.
60

lison and Willett (1979), on whether expanding the issue domain in the bargaining
process brings in issue areas that have varied distributions of costs and benefits. In
the case of climate change mitigation, the legacy structure of the energy system plays
a powerful role in dictating whether and in what domains these linkages can occur.
Chapter 4 will provide empirical evidence for the role played by issue linkage in
policy adoption in the EU. In brief, Europe’s pursuit of climate change mitigation ex-
ploited emissions control to generate benefits from improved energy security, larger
markets for domestic renewable energy firms, and reduced exposure to international
energy price volatility. In contrast, the United States, which imports relatively little
energy, has substantial domestic coal and gas resources, and where renewable energy
goods industries have much less economic weight, has fewer opportunities to use
energy systems transformation to offset the costs of climate change mitigation with
near-tern benefits. Finally, China and India, if reluctant to sign on to significant in-
ternational emissions reduction targets, nevertheless derive significant benefits from
renewable energy adoption in the form of better energy security, and improved en-
ergy system, and comparative advantage in new industries. To the extent that the
opportunities for those benefits persist, we may expect these countries to become
more willing to adopt emissions reduction policies directly as they become wealthier.
3.2.3 How: second best solutions and the rise of green industrial
policy
The motivation to act, as outlined in section 3.2.2, does not necessarily imply the
will to adopt a pre-packaged set of policy solutions. In choosing policy instruments,
states face the challenge of using issue linkage to create a coalition in favor of action.
Once policy is adopted, however, that challenge shifts to sustaining climate change
mitigation over a 50-75 year time frame. As Patashnik (2008) has pointed out, policies
61

intended to serve general interests face long-term vulnerability even after passage, as
the enthusiasm that helped pass them fades while opposition endures.
Consistent with Victor (2011), I argue that states will adopt policies that have the
best chance of disguising the costs they impose, and provide the most opportunity for
disguising transfers to losers from climate change. As Victor argues that implies that
most emissions pricing regime will probably use cap-and-trade schemes instead of
taxes to regulate emissions directly. As chapter 4 will show, the process of cap setting
and permit allocation integral to a cap-and-trade scheme provides more and more
implicit opportunities to structure side-payments among interest groups. Those pay-
ments, consistent with issue linkage in other domains, have proven to play important
roles in overcoming opposition from otherwise recalcitrant actors.
Policy sustainability, however, will likely require states to adopt a multitude of
instruments beyond emissions regulation. Sustaining emissions policy over a 50-75
year duration will require ongoing support for a low-emissions energy systems trans-
formation that will impose large losses on owners of fossil fuel capital and resource
assets. Shielding the policy regime from pressure to dilute or reverse it will require
going beyond just muting the costs these interests will incur. Rather, policy must
create a range of equally acute new interests and beneficiaries in favor of systems
transformation.
Creating acute and salient interests in support of systems transformation can occur
most easily via narrowly targeted policies that directly support outcomes like renew-
able energy adoption, energy efficiency improvements, and power grid reform. As
section 3.3 will argue, this goes against conventional wisdom on “optimum” climate
policy. Whether emissions pricing alone represents the most “efficient” climate policy
may be open to debate. But it most definitely makes the costs of emissions reduction
obvious to the narrow interests who incur them–indeed, that is the entire point of
62
emissions pricing. Furthermore, as an intentionally hands-off form of emissions con-
trol, pricing also implies relatively little influence over the specific trajectory of the
energy system, which may lead to emissions reduction that generates few ancillary
benefits (by, for instance, replacing domestic coal consumption with imported natu-
ral gas at a 50% savings in emissions per unit energy, but a potential increase in price
and supply risk). Acute costs, explicit subsidies, and diluted benefits threaten to
make pricing, pursued in isolation, politically unstable and prone to reversal. Avoid-
ing these outcomes thus requires moving beyond prescriptions for a one-size-fits-all
carbon price.
Structured properly, a low-emissions energy systems transformation may eventu-
ally become self-sustaining as it alters the structure of the energy system and the in-
terests of the actors within it. The largest initial losers from emissions reduction will
be firms who control significant fossil fuel assets. Since those firms are long-lived util-
ities, however, the gradual replacement of their fossil fuel assets with non-emitting
alternatives may change their preferences over time. Patashnik (2008) provides evi-
dence this occurred under the United States’ price-based acid rain emissions control
regime. But in that case, alternative technologies were well-known and adoption oc-
curred relatively quickly. In contrast, climate change policy must survive an initial
period of technological uncertainty where adoption will occur slowly. Thus stabiliz-
ing emissions reduction by changing preferences within the energy system requires
policies that can quickly generate interests to sustain it through that initial adjustment
period before increasing returns from policy kick in.
The demands of both policy adoption and sustainability thus imply a highly frac-
tured landscape of national emissions policy. The national character of energy sys-
tems that grew up in sovereign states with different technical, geological, and eco-
nomic characteristics now generates very different problems and dilemmas for na-
63
tional economies. This, in turn, implies significant cross-national variation in where
and how energy systems transformation may solve these problems and generate the
benefits that enable and sustain emissions reduction. What works in a country that
imports significant quantities of energy may not matter at all to a country with large
domestic coal reserves. Likewise, highly industrialized countries with strong renew-
able energy goods sectors may view renewable energy investments differently than
those without.
3.2.4 Exceptions: exiting from the constraints of systems
transformation
Section 3.2.2 argued that state action on emissions reduction becomes more likely
when the energy system permits emissions reduction to occur through policies that
serve more immediate needs and generate more immediate benefits. Section 3.2.3
suggested that this will move policy away from politically nonviable emissions pric-
ing and towards a range of so-called “second-best” options that increasingly look like
industrial policy. If true, this would imply fairly binding constraints on the opportu-
nities for action.
Nonetheless, several potential developments could occur that would change this
set of constraints. The first, and most obvious, would be a range of technological de-
velopments that rendered low-emissions energy very cheap, very reliable, or both. If
renewable energy really did become cheaper than fossil fuels, that may change the
dynamic of energy systems transformation. In contrast to the argument put forth in
section 3.2, it would mean that “green” electrons now had at least one absolute ad-
vantage over “brown” electrons. Alternatively, radical and transformative innovation
like nuclear fusion could also change the cost / benefit framework of climate action
and render the acute cost problem largely null and void.
64
Barring near-term outcomes like this, we should ask whether emissions policy
could attain outcomes similar to those of industrial policy during the postwar era.
Then, investment of deferred consumption translated into significantly improved
long-term growth prospects in the advanced industrial economies. Policy sustained
itself for the better part of twenty years on the grounds that it provided far greater
benefits than the costs imposed.
The possibility of such “green growth” gained considerable currency in the after-
math of the 2008-2009 financial crisis and ensuing recession. The linkage between
emissions reduction and other environmental goals on the one hand, and re-industrialization
and employment on the other, was made explicitly by the U.S. administration, the Eu-
ropean Union, the South Korean government, and several American states.(Barbier,
2010) Chapter 7 will discuss the potential for “green growth” in greater detail, par-
ticularly with regards to the European Union’s stated objectives for leadership in this
developing sector. But as Huberty et al. (2011) show, there are grounds for skepticism
about the potential for many “green growth” proposals to serve both environmental
and economic masters.
Finally, we should remember that earlier energy systems transformations often
suffered from status quo bias that obscured potential benefits from the new energy
source. Anecdotal evidence from late 16th-century England suggests that wealthy
households disdained coal because of its soot and smell and regarded it as absolutely
inferior to firewood and charcoal. Only a few decades later, Nef (1932) quotes well-
born women in London praising the “sweet smell” of coal and mourning the shortage
of their now-favored fuel. In the English case, this shift in preferences was aided, no
doubt, by the unappealing alternative of freezing to death for lack of fuel. Climate
change mitigation doesn’t offer so plain a downside. Regardless, relieving status quo
bias has some precedent in ameliorating social resistance to energy systems transfor-
65
mation via changes in the structure of energy demand.
3.2.5 Consequences for climate action
Returning to the core argument of this chapter, emissions policy-making must occur
between, on the one hand, the distributional costs and barriers created by emissions
reduction; and, on the other, the technical, economic, and regulatory requirements
of a low-emissions energy systems transformation. The political economy of climate
change mitigation thus requires a policy framework that can both mediate the dis-
tributional conflicts and costs of emissions reduction while accomplishing the multi-
faceted changes required for systems transformation. And it must do so over a long
time frame, to account for both the pace of change in complex technological systems,
and the need for a durable emissions control regime.
Section 3.2.2 has argued that state decisions to act on climate change derive less
from the supposed altruism of post-modern citizens than from the extent that the
domestic energy system permits policy action to generate near-term benefits through
solutions to ancillary problems like security, economic competitiveness, industrial
policy, or–in the developing world–energy poverty. But those near-term benefits are
not evenly distributed, nor confined to the “enthusiastic” countries. The idiosyncrasy
of national energy systems will lead to a varied pattern of costs and benefits from
energy systems transformation. This generates a correspondingly varied pattern of
actions related to emissions reduction. We should consider what consequences such
a theory of political economy would have for comparative patterns of policy choice
and action. In principle, we should expect at least three outcomes:
1. Idiosyncrasy of policy adoption
The degree to which states can access any of the ancillary benefits discussed
above varies widely among the major emitters. Countries vary widely in their66
exposure to trade, their dependence on imported energy, their domestic fos-
sil fuel resources, and their reliance on export income. Thus while energy se-
curity and balance-of-payments concerns have motivated Denmark to invest
in domestic renewable energy since the 1970s, that argument has not proven
very effective to date in motivating United States to do the same. Oil, largely
for transportation fuels, constitutes the bulk of US energy imports. Replacing
oil with anything other than direct gasoline substitutes would require signifi-
cant downstream changes to the structure of energy distribution and use. But
if those changes must occur anyway, the US could equally well adopt electric
vehicles charged with electricity generated by coal-fired plants fueled from the
abundant coal reserves of the American Midwest. Furthermore, as a relatively
less trade-exposed country than, say, Denmark, the impact of balance of pay-
ments improvements from reduced oil imports on national welfare would be
relatively modest. Thus the same incentive set doesn’t apply, and hence the an-
cillary and offsetting benefits of emissions reduction experienced in the Danish
case aren’t good justifications for action in a country like the United States. This
doesn’t mean that other incentives might not exist–only that the motivations
vary significantly by country.
2. Idiosyncrasy of instrument choice
The idiosyncrasy in the organization of national energy systems, and the im-
plied variation in ancillary motivations for energy systems transformation, sug-
gests different sets of winners and losers across countries. If policy instruments
must provide the means to transform the energy system, provide private ben-
efits to new energy actors, and manage the inevitable distributional conflict
among the ensuing losers and winners, then we should expect to see varia-
tion in the policy instruments chosen by different countries based on the varied
67
interest groups they need to pacify or create.
3. Non-alignment of policy approaches across countries
The resulting variability of policy choices across countries may conflict with
the establishment of a global (or even large regional) policy framework. The
UN process on global climate change has proceeded on the basis of a common
framework for emissions control, within which nations could adapt internally
as they saw fit. But that framework implied the assumption that national policy
regimes would somehow be cross-compatible. The Kyoto process, moreover, set
up a framework for international carbon emissions trading that assumed, im-
plicitly, a global carbon price. But in practice, policy idiosyncrasy may render
this kind of condominium difficult to achieve and sustain in the absence of se-
rious political institutions capable of managing distributional outcomes across
states. To date, few political entities exist to do such things.
3.3 Implications for policy adoption
These implications stand opposed to the dominant narrative on climate policy. Pol-
icy design recommendations from environmental economics have consistently ap-
proached the emissions problem as a negative externality first and foremost. Those
who produce greenhouse gas emissions as byproducts of economic activity benefit
from the activity, but don’t pay for the damages those emissions cause. Without an
incentive to minimize emissions, people and firms over-produce them. An optimally
efficient response therefore requires a policy that prices the social cost of emissions
into the private cost of production.
68

3.3.1 Policy design: price fundamentalism and its discontents
In practice, this policy proposal has come in the form of a price on emissions, via ei-
ther a tax on emissions or a system of costly permits to emit.(Pigou and Aslanbeigui,
2001; Baumol, 1972) Theoretically, a price instrument like a tax should produce the
same results as a quantity instrument like a cap-and-trade scheme.11 Both provide
incentives for firms and consumers to reduce their emissions so long as the marginal
cost of emissions reduction is less than the cost of the emissions tax or permit. The
tax or permit system thus provides the incentive for firms and consumers to invest in
both energy efficiency goods and lower-carbon energy. Nordhaus (2010) has termed
this approach “price fundamentalism” and argues that a credible, ubiquitous, and
high carbon price, perhaps coupled to an R&D subsidy, should be sufficient to gener-
ate the necessary emissions-reducing activity.
Emissions pricing and its analogues are attractive for two primary reasons: the
promise of low costs, and the liberation from the problem of choice. Low cost is at-
tractive in a world where we all wish to do something about climate change, and quite
sensibly prefer to do the cheapest thing that works. Liberation from choice is simi-
larly attractive if we doubt the ability of public institutions–whether governments
or utilities–to make sensible investments. Emissions pricing promises to deliver on
both.
3.3.2 Policy reality: implications of energy systems transformation
As Victor (2011) has argued, this policy design is liable to fail on political grounds. An
emissions tax or a pristine cap-and-trade system with fully-auctioned permits makes
11In practice, Weitzman (1974) has shown that this may not be the case when the social cost isdiscontinuous, and in the face of imperfect information about the cost of emissions mitigation or thedamage from excess emissions. If, for instance, it’s clear that the cost of environmental damages goup exponentially when emissions exceed some threshold, then it may be better to use a cap-and-tradesystem to ensure that threshold isn’t exceeded.
69
the costs of emissions reduction acute and the subsidies to losers explicit. In doing so,
it imposes very large costs on powerful interests while providing few mechanisms to
offset those costs, or to develop equally acute and countervailing interests in favor
of the policy regime. Thus the policy regime is highly unlikely to pass in the first
place, and perpetually vulnerable to erosion or stagnation as attempts are made to
raise the price or tighten the cap. Helm et al. (2003) argued that this problem could
be solved via the creation of a technocratic body analogous to a central bank, which
was institutionally insulated from rent-seeking pressures and which had a narrow
mandate to implement the orderly reduction of emissions. But that solution seems
highly unlikely. In that political context, it matters little whether emissions pricing
does in fact constitute a first-best solution, as the political economy of emissions re-
duction will rarely if ever permit a solution that satisfies the Nordhaus (2010) criteria
of a “credible, ubiquitous, high” carbon price.
Emissions cap-and-trade systems are thought to be more flexible than pure carbon
prices. Because the control of permit allocation allows for permit auctions, free or
subsidized permit grants, grandfathering, and other kinds of implicit transfers, it can
smooth over distributional conflicts that an emissions tax might not. Nevertheless,
we should ask whether this more politically viable form of emissions pricing will
solve the myriad problems of energy systems transformation discussed above and in
chapter 2. There are a range of good reasons to believe that it will not.
First, we should consider whether and why emissions pricing has worked in the
past. Supporters of emissions pricing have cited the U.S. experience with acid rain
mitigation as a case of radically successful price-based pollution policy. There, a
tradeable permits scheme for sulfur and nitrous dioxides rapidly reduced emissions
of these acid-rain-causing pollutants after 1990, at a cost nearly forty times less than
originally projected.(EPA, 2005) Today, that program covers over three thousand power
70

plants in the United States.
However, as Hanemann (2009) has argued, this past experience bears little resem-
blance to the problem of greenhouse gas emissions. For acid rain, the technologies re-
quired to reduce emissions were already well-developed and their costs and benefits
apparent. Moreover, ancillary changes to the energy system–notably the deregula-
tion of the railroads and the mining of low-sulfur coal in Wyoming–permitted rapid
and cheap fuel switching that allowed emissions reductions even absent technology
adoption. Finally, SOx and NOx emissions reduction on the part of power plants
made absolutely no difference to the downstream energy system. In this context, the
emissions price had only to nudge a fairly small set of emitters to select from a menu
of well-known and relatively inexpensive emissions-reducing options. In the con-
text of energy systems transformation, a range of non-price-based changes (discov-
ery and exploitation of new coal sources, reform of the transportation and distribu-
tion network) enabled changes to energy production that did not require downstream
changes to energy distribution or use.
As we have seen, serious greenhouse gas emissions reduction is quite different. Un-
like acid rain emissions, greenhouse gas emissions are inseparable from the process of
energy generation. Biomass is a highly imperfect substitute. Thus fuel switching isn’t
an option in the limit. Many of the technologies or processes required for large-scale
emissions reduction or efficiency improvements don’t exist. Changes to energy pro-
duction will, consequence of intermittency and lower density, require downstream
changes to (relatively price-insensitive) energy transmission and distribution. Finally,
it’s apparent that many of the end changes to energy use will require non-price instru-
ments, such as regulatory reform or standards adoption, that were not required for
acid rain emissions reduction.
Thus, in summary, emissions pricing (1) does not on its own support the stabiliza-
71

tion of institutional frameworks for climate policy as described in section 3.2, and
(2) does not solve the myriad problems implicit in energy systems transformation
beyond price-sensitive markets: regulatory control of the energy market, monopoly
behavior in the power grid, market failures for energy efficiency improvements, and
the problem of learning-by-doing and the potential need for early investment.12 On
its own terms, then, emissions pricing as a standalone policy is probably politically
unsustainable absent other means to buffer and constrain emissions prices, and may
be quite functionally limited. Its claim to satisfy criteria for economic efficiency rests
on a set of unsupported assumptions about the political economy of climate change
and energy transitions; and the empirical evidence for prior successes suggests that
the emissions pricing would face severe challenges in achieving emissions reduction
even if those political challenges could be overcome.
3.4 Conclusions
This chapter has argued that the political economy of climate change will lead to
a policy suite that looks unlike either the first-best recommendations of economics
or the satisficing proposals of the environmental movement. Either of those options
requires that states and citizens choose virtue–either directly, or by pricing themselves
into it. But the terms of that choice confront serious problems of political economy
that inform against believing that virtue will be embraced or preserved.
Rather, sustained emissions reduction will be most likely to occur when its costs
and long-term time horizons can be balanced by forms of energy systems transfor-
12For a review of the innovation issues, see Zysman and Huberty (2010) and its companion articleson research choices for emissions reduction. For a summary of the debate on price-induced innovation,see Popp (2010); Popp et al. (2009). Acemoglu et al. (2009) provide evidence that regulatory incentivesalone can induce innovation in a simple two-good model where firms choose between some generic in-novation and an emissions-reducing innovation; but the industry (automobiles) and the data (patents)both have limited relevance to the core energy system and learning-by-doing forms of innovation.
72
mation that tie in other, more immediate policy goals capable of generating near-term
and tangible economic benefits. The interests created by that kind of policy frame-
work will help provide a bulwark against the opposition that emissions reduction
stands to create among losers from climate change mitigation. That, in turn, will as-
sist the institutionalization of climate change policy that will be required to sustain
emissions reduction over a long time horizon.
This is not, of course, the first argument to use issue linkage to explain potential
or actual choices for climate change mitigation. But in placing the energy system in
the center of the climate policy problem, it helps explain both the relative failure of
those earlier proposals and the potential for future success. Issue linkage within the
structure of the energy system need not assume any particularly innate desire for
emissions reduction as a vital outcome, nor does it require that states link costs and
benefits across disparate policy domains. Rather, a low-emissions energy systems
transformation may permit issue linkage between climate change and other energy-
related issue areas because those policy domains are already tied together through the
physical, economic, and regulatory structure of the energy system. That connection
can help explain why both Denmark and China, for instance, have aggressively pur-
sued low-emissions energy despite radically different positions on economic growth,
wealth, and global climate action.
The next chapter turns to empirical evidence for this theory. The European Union
operates the world’s only comprehensive greenhouse gas abatement program. But
alongside the Emissions Trading Scheme, it has also deployed a range of policies
on energy efficiency, energy market integration, renewable energy adoption, and re-
search and development. Aspects of this policy suite has been criticized for imposing
a range of distortions on the European energy market. But, as chapter 4 will show,
that criticism must be balanced against the evidence that the policy suite exploits the
73

kinds of issue linkages theorized here, in order to sustain and institutionalize policy
momentum amidst diverse and sometimes fractious interests on climate and energy
policy.
74

4 Europe’s low-carbon systems
transformation: diverging interests
and converging policy
4.1 Introduction
Chapters 2 and 3 presented a theory of how the problem of energy systems transfor-
mation shapes the political economy of climate change. Testing this theory poses
a difficult empirical problem. Until 2005, most countries had no substantive cli-
mate policy. By 2012, this world has changed substantially: Australia implemented
a carbon tax in 2012; South Korea, discussed further in chapter 7, adopted a green
growth strategy in 2010; even the US had adopted a range of low-emissions R&D
programs, and its Environmental Protection Agency threatened to regulate green-
house gas emissions by fiat. But as they are so new, these cases offer little history to
suggest how these policies will evolve over time; whether they will prove durable;
and how they will shape the future politics of emissions control.
The European Union offers the one substantial contrasting case. Of all the major
emitters, only the EU has succeeded in adopting and preserving a long-term policy
on emissions control. Since 1996, the European Union has initiated the liberaliza-
75

tion and integration of national gas and electricity systems, mandated the breakup of
state gas and electricity monopolies, put a price on greenhouse gas emissions from
electricity generation, established binding targets for renewable energy adoption, and
sponsored the creation of EU-level regulatory bodies for trans-European energy in-
frastructure and markets. Most recently, the Europe 2020 program has established
statutory targets for the integration, liberalization, and decarbonization of the Eu-
ropean electricity supply system; and ambitious but aspirational targets in energy
efficiency. This has all occurred despite an EU enlargement that made internal en-
ergy interests more diverse and more dependent on fossil fuels; and despite the with-
drawal of the United States from the Kyoto Protocol and the subsequent paralysis in
global climate negotiations.
The EU is also interesting because most explanations for the EU’s climate policy
success emphasize environmental ideas over industrial policy. The EU has devel-
oped a regulatory reputation for precaution when faced with environmental risks.
Across a range of issues–genetically modified organisms, chemical disclosure, ani-
mal testing, and others–EU regulation is far more restrictive than in other advanced
industrial economies. Furthermore, environmental interests tend to be very well rep-
resented. Both environmental interest groups and green parties are very strong in
the EU. Green parties have played key roles in national government coalitions and
Parliaments, and have a significant presence in the European Parliament. Finally, Eu-
rope is generally regarded as putting more weight on international negotiations and
international obligations than the US.
I argue against the presumption that environmental interests play the primary role
in shaping Europe’s choice of either whether or how to act. Environmental interests no
doubt help to shape the broad policy environment for climate action. But as this chap-
ter shows, they leave unaddressed the specific choices that European policymakers
76
have made in designing, implementing, and reforming its climate policy. Further-
more, I show that in many cases, the expressed interests of major environmental
policy actors–both in party platforms, and in legislative processes–supported very
policies very different from those ultimately chosen.
Instead, I argue that the EU has explicitly pursued a strategy of tying support for
environmental goals to the realization of industrial gains. Furthermore, I offer evi-
dence that this strategy hinges on the particular structure of Europe’s legacy energy
systems, and demands it placed on a low-emissions energy systems transformation.
Europe’s policy choices reflect, I argue, a strategy of using systems transformation
to generate industrial benefits from renewable energy adoption, energy security, and
technological innovation. These benefits help build and sustain material support for
Europe’s long-term climate goals. They also help mollify otherwise recalcitrant firms
and member states. This specific strategy depends, critically, on how Europe’s legacy
energy system structured the costs and benefits of climate action. The resulting EU
policy suite, which mixes emissions pricing with renewable energy mandates, reg-
ulatory reform, market integration, and R&D support, thus closely conforms to the
predictions of the theory presented in chapter 3.
The chapter proceeds in five parts. Section 4.2 provides an overview of the EU
climate and energy policy suite and the national context in which it exists. Section
4.3 then discusses prevailing arguments for EU policy action and their shortcomings.
Section 4.4 then considers the problem of low-emissions energy systems transforma-
tion in the EU context and the specific tasks required to bring significant amounts
of low-emissions energy into the system. Section 4.5 then reviews the evolution of
European policy to serve those tasks. As section 4.6 shows, the distributional conse-
quences of this policy evolution bind together member states and sectoral economic
interests based on asymmetric patterns of costs and benefits created by the nature
77
of national energy systems. Finally, section 4.7 argues that the underlying distribu-
tional logic of the EU policy suite should counter critics who see the EU’s policy suite
primarily as an inefficient and distortionary alternative to a well-designed emissions
pricing regime. Instead, the EU’s choice of how to implement emissions reduction
rests on a political logic for overcoming large incentives for inaction. This holds im-
portant lessons for elsewhere: if emissions policy must survive fickle citizens, power-
ful opposition, and economic volatility in pursuit of substantial emissions reductions,
then the politics of why countries persist in acting will prove inseparable from how
they choose to act.
4.2 Climate and energy policy in the EU
Europe’s climate and energy policy suite consists of four major initiatives:
1. The Emissions Trading Scheme (ETS), which sets a price on energy-derived car-
bon emissions for approximately 40% of the European economy via annual lim-
its on emissions and a secondary market for emissions permits within those
limits.
2. The Renewable Energy directive, which puts binding targets on member states
to consume, as an EU average, 20% of their electricity from renewable sources
by 2020.1
3. The Internal Energy Market directive, which mandates the breakup of verti-
cally integrated national energy markets into separate domains of production,
distribution, and retail; and which sets new terms for market competition in
wholesale and retail energy provision.
1A non-binding target for a 20% improvement in energy efficiency accompanies this goal.
78
4. The Strategic Energy Technology (SET) Plan and Framework Programmes, which
provide significant EU and member state funding for research, development,
and deployment of new energy infrastructure and technologies.
EU policy thus provides an array of policy instruments that target emissions re-
duction, renewable energy adoption, technological innovation, regulatory reform,
and market integration. Consistent with the energy systems perspective presented
in chapter 3, these instruments perform much broader array of tasks than simply the
retirement of fossil fuel energy. In brief, the policies together function to:
• Open vertically-integrated markets to price competition
• Equalize terms of access to the energy system for new entrants, notably renew-
able energy generators
• Enable state intervention in energy markets to incentivize renewable energy
adoption
• Plan and fund cross-border electricity transmission infrastructure and market
integration
• Provide financial incentives (the ETS) and impose binding targets (the renew-
able energy mandates) for energy systems decarbonization
• Fund R&D for the next generation of technologies required for energy systems
transformation
Figure 4.12 shows that this policy suite did not arrive at once–rather, it evolved over
time. Versions of each policy instrument had emerged independently starting in the
mid-1990s. Justification for each policy varied widely. Energy market integration was
portrayed as simply another phase of completing the Common Market. Renewable
79

energy policy was thought to serve both environmental and industrial policy goals.
Emissions trading had an explicit environmental justification–but was very quickly
understood to bleed over into the rest of the economy. By 2008, the synthesis of these
different domains into the 2008 climate and energy package represented a necessary
evolution of these parallel policy tools into an integrated package with complemen-
tary consequences for energy, emissions, and economic redistribution.
An array of other changes occurred in this same period, however. Two stand out
for particular importance in the context of EU climate policymaking. First, the United
States withdrew from the Kyoto Protocol for global emissions reduction in 2001. The
US had played a critical role in negotiating the protocol and in mandating the use of
tradeable emissions permits as the central pillar of emissions control. But President
Bill Clinton had never submitted the treaty to the United States Senate for ratifica-
tion (where it faced almost certain rejection), and President George W. Bush formally
withdrew the United States from the Protocol shortly after taking office. The with-
drawal of the United States marked the departure of the EU’s largest trading partner
and strongest competitor among the advanced industrial economies.
Second, the European Union went through two major waves of eastward enlarge-
ment to incorporate the former Warsaw Treaty Organization states into the European
polity. In 2004, ten states–the Visegrad states of central Europe, the Baltic states on
the edge of the former Soviet Union, and Slovenia, Malta, and Cyprus–joined the
Union. They were followed by Romania and Bulgaria in 2007. These additions to the
EU marked a significant divergence in energy and emissions interests among the EU
members. As figure 4.3 shows, each of these enlargements brought in new member
states with more energy-intensive economies that produced higher emissions and
relied more on fossil fuels. While the collapse and renovation of their Soviet-era
economies had reduced greenhouse gas emissions from the new member states 24%
80
between 1990-2007, those emissions had risen 5.5% after 2000 consequence of eco-
nomic growth and re-industrialization. Meanwhile, as figure 4.1 shows, emissions in
the original EU-15 were essentially flat from 2000-2007. And as figure 4.2 shows, the
new member states remained more energy- and emissions-intensive than the EU-15
as late as 2005.
These two developments stood to significantly increase the economic and political
barriers to emissions reduction in the EU. Internationally, the withdrawal of the US
would mean that the EU would bear more acutely the cost of adjustment, while its
major competitors would not. Internally, the changing structure of member state
energy demand meant that newer, poorer member states who relied more on fossil
fuels would now have a strong voting presence in the EU institutions.
4.3 Postmodernist citizens, green parties, and
international leadership
Scholars have pursued three explanations for the EU’s aggressive pursuit of climate
change mitigation in spite of these challenges and the free rider problem more gen-
erally. First, they credit a rising “postmaterialism” in EU electorates with a greater
willingness to exchange income for non-material goods like climate protection. Sec-
ond, they cite the increased visibility of green parties in government as providing
an outlet for these voter preferences. And finally, they note that the EU itself had
sought a high-profile foreign policy role for Brussels after the passage of the Lisbon
Treaty, and thought that strong action at home would increase its influence and lever-
age at international negotiations abroad. But each of these explanations, while they
offer some motivation for EU action, encounter difficulties when faced with the de-
velopments described above. They also provide very little insight into why the EU
81
chose the policy instruments it did, rather than some other (potentially more efficient)
policy framework. Given volatile public opinion, a changing mix of member state in-
terests, and an increasingly unfavorable international environment, we need to look
beyond public opinion and bureaucratic entrepreneurship in answering why the EU
chose to act and what led it to adopt the specific policies it did.
Whether environmental concerns are the product of the increased prosperity of
citizens in liberal polities has attracted significant attention both for climate change
and beyond. Kitschelt (1994) argued that high material living standards had weak-
ened the old left-right division of European politics. Diekmann and Franzen (1999)
find, contra Dunlap and York (2008), that prioritization of environmental concerns
correlates with per-capita wealth. Bättig and Bernauer (2009) posit that democracies
are, net of income, more likely to express preferences for environmental goods than
in other regime types. In this analysis, climate change and other environmental is-
sues are a form of luxury good, available predominately to citizens in wealthy, liberal
countries whose material needs are satisfied. Building on this analysis, Gerhards and
Lengfeld (2008) find that support for EU climate and energy policy is stronger among
the richer member states.
This changing pattern of public preference for environmental goods permitted, and
was supported by, the rise of green parties. From a start as fringe opposition parties
in the 1970s, green parties had by 2000 become much more mainstream, and offered
real electoral alternatives to longer-established parties of the right and left.(Bomberg,
2002) This included a stint in government for the German Green Party, in coalition
with the SPD, from 1998-2002; and, according to Jacobsson and Lauber (2006), act-
ing as one of the primary contributors to a fundamental transformation in German
renewable energy policies earlier in the 1990s. The pan-European Green Alliance is
also well-represented in the European Parliament.
82

Finally, Schreurs and Tiberghien (2007) argue that these domestic developments
dovetailed with Brussels’ search for a new foreign policy role. The Lisbon Treaty, rat-
ified in 2007, formally gave the European Union greater say in making all-European
foreign policy. This left Brussels looking for a significant role to play in global politics.
Climate leadership fit the bill. Brussels could build on the actions of more aggressive
countries like Germany or Denmark to position the EU as a paradigmatic example
of a rich, competitive economy willing to bear the cost of emissions reduction and
provide global leadership for others to do the same. In doing so, the European Union
could define a foreign policy identity separate from the individual member states and
assert its newly-won powers in a prominent global venue.
In practice, each of these explanations for why the EU would act in spite of di-
verging domestic interests and an increasingly frustrating international environment
encounter limits when faced with two related developments. First, measures of post-
materialist value alignment are fairly volatile across space and time. The new mem-
ber states, who now constitute 12 of 27 voting members of the EU, consistently poll
as more focused on economic growth and less enthusiastic about environmental ac-
tion. Attitudes towards climate change also rely on a range of volatile non-scientific,
economic, and social factors (Leiserowitz, 2006), and respond to individually insignif-
icant events like extreme weather conditions.(Egan and Mullin, 2011)
Volatility at the citizen level is matched by volatility at the party level. Climate pol-
icy progress has continued in both western Europe and at the EU despite fluctuations
in green party popularity at the ballot box. The new Conservative government in
the United Kingdom has maintained its commitment to emissions and energy policy
despite unprecedented austerity measures in the wake of the 2008-2009 financial cri-
sis.2 The center-right Danish government’s 2011 energy and climate package was so
aggressive on emissions reduction that it surpassed even what the opposition party
2CITE
83
had planned for its own election manifesto (Danish Ministry of Climate and Energy,
2011).
Neither can green party preferences for climate action at the EU level explain the
choice of policy instruments. The European Green Alliance’s Green New Deal would
have implemented a less market-based, more comprehensive program of emissions
reduction and environmental sustainability.(Schepelmann et al., 2009; European Greens
Party, 2009) But as of 2011, interviews with the European Commission and the Par-
liament provided little evidence that this agenda had attracted significant support in
the mainstream European parties. Finally, even the Parliament as a whole, widely
regarded as a strong environmental advocate, had relatively limited influence over
the design of European policy. As chapter 5 demonstrates in detail, the Parliament’s
environmental ambitions for the 2008 climate and energy policy reforms were largely
checked by the Commission in favor of industrial policy.
Finally, Europe’s failure to leverage its domestic climate action into international
leadership on climate change appears to have done little to damp its policy ambi-
tions. Europe had gone into the 2009 COP-15 climate change negotiations confident
of assuming a leadership role. But that role collapsed amidst disagreement among
the world’s major economies. It was left to China and the US to hammer out the final,
and largely ineffectual, agreement. Nevertheless, ongoing inability to use EU policy
ambitions to catalyze a global deal does not seem to have made a material difference
to the long-term trajectory of European climate policy.
To date, then, analysis of EU climate and energy policy has tended to emphasize
public opinion, party politics, and bureaucratic entrepreneurship. But while these
factors undoubtedly influence the will to act, they have limited insight as to why the
EU has persisted in its climate goals even as those factors have changed in quite sub-
stantial ways due to EU enlargement, electoral politics, and political stasis at the in-
84
ternational level. Furthermore, these explanations do not point to why the EU picked
the constellation of policies that it did. Indeed, given the near-unanimous conclu-
sion that emissions pricing alone should suffice for the most cost-effective solution
to climate emissions, we should wonder why we observe the potentially rather more
expensive mix of pricing, mandates, subsidies, and other policy instruments that we
do.
4.4 An energy systems transformation: the whys and
wherefores of EU policy choice
A full understanding of how and why the EU was able to make progress on emis-
sions needs to start with a closer understanding of the comparative pattern of energy
and emissions intensity in the EU, and with the structure of the markets and infras-
tructure at the root of that pattern. The costs and benefits, and hence winners and
losers, of emissions reductions are inseparable from the energy system through which
those reductions must occur. Sustaining policy will require, as chapter 3 argued, sup-
port from economic actors with a material stake in a low-emissions future. Building
such support requires policymakers to identify how tasks that serve long-term en-
vironmental goals may also deliver near-term tangible benefits. Because emissions
reduction embraces the whole of the energy system, the scope of both these tasks and
benefits encompasses the entire spectrum of energy production, distribution, and use.
Understanding the political possibilities for climate policy must therefore begin with
an understanding of the baseline conditions of domestic energy systems.
This section shows that the EU’s pre-existing energy system provided an array of
challenges and opportunities for EU energy policy. In the south and east, “energy
islands” exposed some member states to supply insecurity even as their neighbors
85
enjoyed surpluses. In the north and west, formerly abundant reserves of North Sea
oil and natural gas began a decline that would have significant long-term impacts on
energy exports and national trade balances. Except in Scandinavia, integrating re-
gional gas and electricity markets remained a halting task, and national boundaries
and energy markets persisted in the face of early efforts at market reform. Meanwhile,
some countries had developed significant expertise in and export income from new
renewable energy technologies. As section 4.5 will show, these varied patterns of en-
ergy markets and the interests that went with them created opportunities to engage in
a systems transformation that served multiple masters. In doing so, it could provide
implicit side-payments to different constituencies that permitted the EU to bridge the
potentially divergent interests in fossil fuel-based energy. The system thus facilitated
a particular form of issue linkage, from which a particular policy suite emerged.
4.4.1 Emissions
Europe’s diverse regional and national economies show significant variation in both
the intensity of emissions and the trajectory for emissions growth and reduction. In
2007, overall greenhouse gas emissions levels in the EU-27 stood 9.3% below 1990
levels.3 That aggregate figure obscures some internal diversity. Among the EU-15,
emissions fell 3% in the same period, while among the member states added after
2004, emissions fell 24%. But while emissions in the EU-15 were more or less flat
from 2000-2007, emission in the new member states grew 5.5% as their economies re-
industrialized. Figure 4.3 demonstrates that net of these changes, the economies of
the new member states remain anywhere from 2-4 times more emissions- and energy-
intensive than their EU-15 counterparts. This is due in part to a greater reliance on
3All calculations are based on data released by Eurostat for total and sectoral emissions in the EUmember states. 2007 will be used as the latest year for comparison. The 2008-2009 financial crisis andensuing recession has pushed emissions below trend due to depressed economic activity.
86

manufacturing compared with services; in part due to increased reliance on fossil fu-
els in some states, particularly Poland; and in part due to the persistence of inefficient
Soviet-era capital stock.4
Within these broad trends, the composition of emissions has also changed substan-
tially. Figure 4.1 shows that emissions from manufacturing industries have gener-
ally declined in all regions, while transportation has become a larger share of over-
all emissions. Other categories remained mostly flat. But the manufacturing trend
in particular obscures the fact that this trend in the west is in large part due to de-
industrialization and a parallel shift to an increased role for services, while in the new
member states it reflects the decline (and partial replacement) of energy-inefficient
industrial base. Despite these gains, however, figure 4.1 also suggests that the new
member states are significantly less emissions-efficient in electricity and heat produc-
tion than the EU-15.
4The EU does not provide integrated statistics on capital stock age. For comparison, BRE BankSecurities reports that 71% of Polish coal-fired power plans are 30 years or older. Poland dependson coal for about 83% of its primary energy production. In contrast, the average age of a coal-firedpower plant in the United Kingdom as of 2012 was about 31 years; but the UK only derives about 7%of primary energy production from coal. Power plant data taken from Stoklosa (2010) (Poland) and(Department of Energy and Climate Change, 2011, table 5.11) (UK). Primary energy production datataken from Eurostat for all solid fuels (including all grades of coal, plus peat) for 2010.
87

Agriculture Energy Industry Mfg Transport Waste
0.0
0.1
0.2
0.3
0.4
0.5
1990
1995
2000
2005
1990
1995
2000
2005
1990
1995
2000
2005
1990
1995
2000
2005
1990
1995
2000
2005
1990
1995
2000
2005
Pct
. tot
al e
mis
sion
s
Country group
EU15
NMS
(a) Changes in emissions composition by sec-tor, 1990-2009.
50
100
150
200
AT
BE
BG
CY
CZ
DE
DK
EE
ES
FIFR
GR
HU
IE
IT
LT
LU
LV
MT
NL
PL
PT
RO
SE
SI
SK
UK1990
1995
2000
2005
Tota
l em
issi
ons,
199
0 =
= 1
00
Country group
EU15
NMS
(b) Emissions levels by country, 1990 = 100.Dark lines indicated within-group averages.
Figure 4.1: EU-27 emissions trajectory, 1990-2009. All data from Eurostat. NMS =New Member States, including the ten new member states added in the2004 enlargement, and Bulgaria and Romania.
Emissions per unit GDP, 2005 In metric tons carbon per EUR 1000 GDP
0.1
0.2
0.3
0.4
0.5
0.6
0.7
(a) Emissions intensity per unit GDP
Energy consumption per unit GDP, 2005 In kg oil equivalent per EUR 1000 GDP
200
400
600
800
1000
1200
(b) Energy intensity per unit GDP
Figure 4.2: Emissions and energy intensity in the EU-27 + Norway, 2005. Greece omit-ted due to lack of data. Energy intensity data from Eurostat. Emissionsintensity data based on author’s own calculations using GDP data fromEurostat and emissions data from the Carbon Dioxide Information Analy-sis Center at Oak Ridge National Lab.
88

0.2
0.4
0.6
1990
1991
1992
1993
1994
1995
1996
1997
1998
1999
2000
2001
2002
2003
2004
2005
2006
2007
Year
Tons
car
bon
emis
sion
s pe
r E
UR
100
0 G
DP
EU Membership
EU−12
EU−15
EU−25
EU−27
(a) Emissions intensity per unit GDP
200
400
600
800
1000
1990
1991
1992
1993
1994
1995
1996
1997
1998
1999
2000
2001
2002
2003
2004
2005
2006
2007
2008
Year
Kg
oil e
quiv
alen
t per
EU
R 1
000
GD
P
EU Membership
EU−12
EU−15
EU−25
EU−27
(b) Energy intensity per unit GDP
Figure 4.3: Emissions and energy intensity of economic activity in the EU across en-largements. Emissions data are expressed as metric tons carbon per con-stant ¤1000 in constant 2000 euros. Energy data are taken from Eurostatand are expressed as kg. oil equivalent per ¤1000. Emissions data aretaken from the Carbon Dioxide Information Analysis center and are ex-pressed in MT Carbon.
89

4.4.2 Energy
These emissions result, predominately, from the use of fossil fuels to generate elec-
tricity and power transportation. How that occurs depends on the structure of the
energy systems in the EU–the assets, markets, and regulatory frameworks that gov-
ern how energy is produced, distributed, and used. In the context of a low-emissions
energy systems transformation, four aspects of the European Union’s energy system
bear closer examination:
1. The historically national and monopolistic structure of EU energy markets re-
duced competition among energy firms and limited new firms from entering
markets with new technology.
2. The national structure of markets has also led to the existence of “energy is-
lands” with few or no connections to the larger EU energy market. Those is-
lands, in turn, are often highly dependent on geopolitically unstable countries
for energy supplies.
3. Decades of significant energy exports from the North Sea oil and gas reserves
will probably end in the foreseeable future, with significant impacts for both
energy security and national trade balances in northwestern Europe.
4. Adoption of significant quantities of renewable energy in some countries have
forced those countries to confront the problems posed by intermittency for both
physical and price stability in their energy systems.
Most of the EU member states experience one or more of these issues. But, as
section 4.6 will show, variation in the specific patterns of market structure, energy
security, and renewable energy adoption consequence of the structure of domestic
energy systems has allowed for a particular structure of policies that fulfill both func-
90

tional and distributive roles in stabilizing the political economy of energy systems
transformation.
Market structure
Aside from the highly-integrated Scandinavian Nordpool market, the electricity mar-
kets of the European member states as of 2005 remained largely national and domi-
nated by legacy, vertically-integrated state utilities that controlled production, distri-
bution, and transmission. A study for the European Commission’s Directorate Gen-
eral for Competition found that five of six major west European markets showed
serious evidence of monopoly-driven price and market distortion in 2005, ten years
after the first efforts at market liberalization had begun.(London Economics, 2007)
As a consequence of market concentration at the national level, markets to manage
intermittency and provide for reserve capacity remained anemic.
This situation had three practical consequences for the decarbonization of the en-
ergy system. First, vertically-concentrated control of the grid was thought to prevent
entry of new technologies into the grid, particularly new low-emissions generation
sources. Second, the lack of liquid markets for capacity made management of inter-
mittent energy sources more costly. Finally, anemic competition for electricity cus-
tomers in the context of regulated prices may have kept prices higher than they oth-
erwise would have been. Pricing power in the presence of impending price increases
due to emissions trading posed challenges for managing the costs and benefits of
emissions reduction.
Energy islands and energy security
While all EU countries import significant quantities of energy, the structure of imports
varies substantially by geography. In particular, the “energy islands” of the Baltic
91
states and eastern Europe depend heavily on imports from Russia to satisfy demand
for natural gas and, in some cases, electricity. This dependency led to severe supply
disruptions in 2004-2005, 2006-2007, and 2008-2009, as a byproduct of geopolitical
conflict between Russia and Ukraine. Notably, during these crises, western Europe
maintained gas surpluses that could have been used to offset reduced Russian im-
ports. But the lack of west-to-east transmission infrastructure prevented Europe from
implementing this solution in full. The eastern European and Baltic member states
remain acutely interested in diversifying their energy supplies.
Thus both northwestern and eastern Europe faced impending risks to energy secu-
rity, either from decline of domestic resources or geopolitical uncertainties surround-
ing Russia’s relationship with her former satellite states. These risks stand in addition
to a general risk stemming from geopolitical uncertainty in Europe’s primary sources
for transport fuel.
Energy exports and reserve depletion
With several notable exceptions, the EU member states have few conventional domes-
tic energy reserves and depend on imports for the bulk of their energy consumption.
Figure 4.4 shows that imports as a percentage of total consumption and by fuel domi-
nate nearly all countries’ energy demand. But since the early 1970s, the Nordic coun-
tries, the Netherlands, and the United Kingdom have benefited from substantial oil
and gas exports from the North Sea. At present, however, the anticipated remaining
lifetime of those reserves is estimated on the order of 20-30 years.(British Petroleum,
2011, 43) Danish oil production fell 37% from 2009-2011 alone.(Danish Ministry of
Climate and Energy, 2011, 45) Declining reserves pose long-term challenges for these
countries’ balance of payments and their incomes from natural resource exports.
92

Import dependency as a percentage of domestic consumption
Oil Hard Coal
Total Natural Gas
−100
−50
0
50
100
Figure 4.4: Import dependency by fuel for the EU-27 + Norway. Norway omitted forPetroleum, Gas, and Total to omit scaling distortion imposed by Norway’svery large gas and oil exports. Data taken from the Energy InformationAdministration for 2005.
Systems stability and renewable intermittency
Finally, countries that have adopted significant amounts of non-hydro renewable re-
sources have begun to encounter issues with systems instability stemming from re-
newable resource intermittency. The Nordpool market has been an early test case
for this problem. Denmark, which obtains about 20% of its electricity from renew-
able sources, depends on cross-border trade in the Nordic region to buffer under-
and over-production. In 2010, concerns about overproduction and its effects on sys-
tems stability led to the introduction of a ¤200 / MWh penalty tariff to discourage
93

electricity production at times of overcapacity.(Nord Pool Spot, 2009) As other mem-
ber states move to adopt significant renewable energy resources, maintaining systems
stability will increase the demand for cross-border geographic averaging of electricity
production.
4.5 Altering the system trajectories: EU Energy Policy,
1995-2010
EU energy policy aims to shift the developmental trajectory of this energy system.
Ideally, a new trajectory would reduce emissions, provide greater security of supply,
and be more supportive of the international competitiveness of EU firms. To accom-
plish this shift, the EU has since 1995 deployed an evolving and increasingly synthetic
range of policy mechanisms to restructure gas and electricity markets, price green-
house gas emissions, mandate the adoption of renewable energy, finance cross-border
energy transmission infrastructure, and support R&D in new energy technologies.
The management of multiple energy-related externalities complicates the problem
of policy formation. But it has also provided EU institutions, member states, and
policymakers a means to build sustained policy coalitions through linkage of objec-
tives in one domain to action in others. That linkage generates policy stability in two
ways: first, the beneficiaries develop acute interests in ongoing progress that allow
emissions reduction policies to move beyond mere cost minimization; and second,
linkage provides for cross-subsidization of transition costs among political and eco-
nomic actors both within the member states and between them. Indeed, whether
intentional or not, the policy suite that has developed in Europe over the last decade
shows all the signs of fulfilling these political economy functions.
The EU thus displays the kind of policy approach suggested as likely in chapter
94

3. As predicted there, the EU has not relied solely on emissions pricing to induce
emissions reductions. Rather, they have combined an emissions pricing system with
other instruments that more directly address other energy-related externalities, and
seek to create and nurture interests supportive of systems transformation. In doing
so, the EU policy suite has begun to lay the groundwork for an industrial policy tar-
geting the long-term transformation of the energy system. As with earlier industrial
and energy transformations, that policy seeks to reconcile the need for transforma-
tive change with the political conflict that change promotes. To do so, I argue that
European policymakers have chosen policy that yokes support for long-term envi-
ronmental goals to the realization of near-term material returns from pursuing those
goals. As section 4.6 will argue, the distributional implications of European policy
suggest they may succeed. But this success does not imply that the the EU approach
provides a valid solution everywhere. Countries with very different energy systems
may not find that issue linkage permits progress in the same fashion, or at all.
4.5.1 Energy market integration and reform, 1996-2010
The liberalization of the energy market began in 1996 as another step in the exten-
sion of the Common Market, in parallel with other EU attempts at services and goods
market integration.5 In its initial form, the European Commission justified the pro-
gram on the basis of more competition in energy markets, lower prices for retail and
industrial customers, and improved investment in energy infrastructure.(The Euro-
pean Commission, 2001)
By 2003, the Parliament and the Council had adopted the second gas and electricity
directive to begin the process of integrating national markets via interconnection of
5This is true with one significant exception: unlike most goods industries, electricity does not per-mit integration via mutual recognition. Rather, integrated electricity markets require common stan-dards for operation of the electrical grid. The ENTSO-E body has been tasked with this process, butthe EU has relatively little experience in standards-based market integration.
95

national networks and reform of wholesale and retail markets for both electricity and
gas. Those reforms were to include significant restructuring of domestic electricity
companies. Most member states’ markets were characterized by vertically-integrated
firms that controlled the primary assets for electricity generation, transmission, dis-
tribution, and sale. In only three member states (Poland, the UK, and the Nordic
countries) did the top 3 firms by turnover control less than 50% of the market.
In 2005, a year after the 2003 directives entered into effect, the Commission reported
that progress on market integration had lagged behind directive goals. They noted
that “the most persistent shortcoming is the lack of integration between national mar-
kets” owing to national barriers to entry and a lack of cross-border electricity and gas
transmission capacity. Of particular concern was the lack of integration of southern
European markets, as between France and Spain; the coupling of eastern and west-
ern European markets, as between Germany and Poland; and the persistence of the
Baltic states as an energy island cut off from the rest of Europe. Energy markets thus
remained “national in economic scope”, and competition “[had] not yet developed to
provide a fully effective constraining influence on the economic power of companies
in each national market.”(The European Commission, 2005a, 2)
The Directorate-General for Energy also criticized the reluctance of many mem-
ber states to decouple ownership of electricity transmission and distribution from
electricity generation or sale. They viewed the persistent vertical integration of the
electricity markets as a hindrance to network neutrality and the entrance of new mar-
ket participants and new energy technologies. With particular reference to renewable
energy technologies (section 4.9), the technical annex to the report (The European
Commission, 2005b) argues that both the introduction of low-emissions generation
and the pursuit of energy efficiency gains require energy market liberalization. Put in
energy systems terms, the ownership structure of electricity transmission in the Com-
96

mission’s view, hindered the restructuring of both energy generation and energy use.
Finally, this analysis also noted that insufficient liberalization of electricity markets
had compounded perceived problems of the European emissions trading scheme, by
preventing competition from helping to offset the higher energy prices caused by
emissions pricing. Progress on energy market restructuring would, the Commission
maintained, introduce competition that would help buffer the costs of emissions pric-
ing for both citizens and industry.
These conclusions were supported by separate studies undertaken by the Directorate-
General for Competition, under its Article 17 powers. In two reports, issued in 2006
and 2007, they found persistent high levels of market concentration in five of six ma-
jor western European electricity markets; ongoing cross-border congestion; and ev-
idence of discrimination by legacy energy utilities against new entrants.(Directorate
General for Competition, 2006; London Economics, 2007)
Together, the Commission used these reports to frame the necessity of renewed
action on market reform. The consequences of this framing are clear from the terms
of the 2008 Third Climate and Energy Package.6 It renewed the legal framework for
energy market restructuring under the newly-signed Lisbon treaty, creating stronger
mandates for implementing the earlier guidelines. It set new terms on access to cross-
border electricity markets. It also institutionalized EU-level regulatory coordination
in three new bodies:
1. The European Network of Transmission System Operators–Electricity (ENTSO-
E), to manage regulatory coordination among national electricity grid operators
2. The European Network of Transmission System Operators–Gas (ENTSO-G) to
manage regulatory coordination among national gas transmission system oper-
ators6For text of the directives, see Official Journal of the European Union L211, volume 52, 14 August
2009, at http://eur-lex.europa.eu/JOHtml.do?uri=OJ:L:2009:211:SOM:EN:HTML.
97
3. The Agency for Coordination of Electricity Regulation (ACER), to set and main-
tain regulatory standards at the EU level to ensure smooth grid and market
inter-operation.
The ENTSO bodies were also tasked with contributing to planning for cross-border
transmission infrastructure, with an emphasis on north-south and east-west bottle-
necks and the Baltic energy island. Both the ENTSO and ACER bodies represent a
first step towards the institutionalization of previously private- or para-public coor-
dination between otherwise nationally-regulated and nationally-bound energy regu-
lators.
To buttress this regulatory coordination, the EU has followed with support for co-
ordinated approval for and investment in cross-border transmission infrastructure.
The TEN-E network infrastructure development program provided a framework for
identifying and funding cross-border energy transmission infrastructure in areas suf-
fering from high congestion, or in areas of high renewable energy potential. These
included offshore wind in the North Sea; and cross-border interconnections to the
isolated energy “islands” of the Iberian peninsula, the Baltic states, Italy, and the for-
mer Warsaw countries (The European Commission, 2010c, section 4). 7
4.5.2 The European Emissions Trading Scheme
In contrast to these market reforms, which continue a long pattern of European deep-
ening, the Emissions Trading Scheme (ETS) was a direct response to environmental
events. At the Kyoto talks in 1997, EU member states had committed to emissions
reductions of 8% below the 1990 baseline by 2012. The EU believed that it could
achieve these reductions more efficiently acting as a body, than if each member state
7See http://ec.europa.eu/energy/infrastructure/tent_e/coordinators_en.htmfor specific detail on the major TEN-E projects. Last accessed 11 March 2013.
98

did so on their own. Since 70% of European Union trade takes place among the mem-
ber states themselves, a pan-EU emissions regulation mechanism would minimize
potential distortions to the Common Market that multiple state-level policy regimes
could have introduced. It also had the potential to lower compliance costs, by al-
lowing member states to invest in emissions reductions where the marginal cost of
reduction was lowest. The Emissions Trading Scheme thus began largely as a carbon
market, intended to price carbon and so incentivize emissions reduction via efficiency,
investment, and innovation.
The use of market-based instruments for environmental regulation was unfamil-
iar and highly controversial. Europe had traditionally favored regulatory mandates,
both out of distrust of market-based mechanisms and out of concern that markets
would not provide for both equity and efficiency. In examining implementation op-
tions in the EU itself, the use of pricing rather than regulatory mandates only became
the favored solution after a series of consultations through the first European Climate
Change Programme in the period 2000-2001.8 The outcome of those consultations
unambiguously recommended the use of a market-based emissions control system,
with emissions permit allocation derogated to individual member states.(Vis, 2001)
But the report also saw emissions trading as one of a suite of policy tools, even if the
particular contents of that suite were not foreseen at the time.9
These shortcomings in practice had originally motivated the Commission to fa-
vor an emissions tax over a cap-and-trade system. But the creation of a European-
wide tax would have required either complex harmonization of emissions tax regimes
across the member states, or the institution of a new EU-level financial instrument.
Either would have set off an ongoing and likely unresolvable debate within the EU
8See http://ec.europa.eu/clima/policies/eccp/first_en.htm for further details anddocumentation.
9Interviews with European climate and energy policy officials in late 2010 confirmed the validity ofthese official reports and the evolution of concerns about the efficacy and distributional consequencesof emissions trading.
99

over the fiscal powers of the Commission. Indeed, the Commission had worked for
years, without making much headway, to convince the member states of the superi-
ority of a taxation approach. MacKenzie (2007) suggests that the tax finally died in
large part because the creation of that instrument would have counted as a financial
matter under the terms of the Qualified Majority Voting rules, and thus required a
nearly impossible unanimous vote of support. A cap-and-trade system, in contrast,
could be justified as environmental policy and passed with qualified majority vot-
ing. Doing so also preserved the ability to cross-subsidize participants in the ETS
while keeping the visibility of those payments low and depriving the Commission of
substantial new financial resources.
After the initial, largely ineffective 2005-2007 “trial period”, the ETS has operated as
a system with freely allocated permits that could be banked between trading periods.
This has meant that firms do not pay for the initial grant of rights to pollute, but can
buy and sell permits on secondary markets. Those permits can be banked across pe-
riods, which helps to stabilize permit prices. The overall level of permits is set by the
EU, on the basis of national Action Plans from the member states that specify where
and how permits should be allocated to their domestic firms. In practice, as section
4.6.1 will show, free allocation functioned as a means of providing cross-payments to
vulnerable or reluctant sectors and member states.
4.5.3 Renewable Energy Targets
Theoretically, the presence of the Emissions Trading Scheme should suffice to incen-
tivize adoption of low- or zero-emissions energy sources. Nevertheless, from 2001
onward, the European Union pursued targets for renewable energy adoption as well.
The Third Climate and Energy package, passed in 2008, made the initially indica-
tive targets for 2020 and required states to outline their approach to meeting those
100

targets in a series of national action plans. Like the ETS, the renewable energy man-
dates both support the decarbonization of the European energy system and provide
for implicit redistribution of funds between member states. But while the ETS permit
allocation process provided for west-to-east transfers, the structure of the renewable
energy mandates will, as section 4.6.2 will show, benefit primarily the rich industrial
economies of northwest Europe.
The first renewable energy directive (2001)
Renewable energy targets were first introduced as a policy instrument in September
2001 with the Directive on the Promotion of Energy from Renewable Sources.(European
Union, 2001) The directive targeted a renewable energy share of EU electricity con-
sumption by 2010, defined what counted as renewable energy for EU purposes, and
presented indicative but nonbinding national targets for renewable energy genera-
tion. The directive’s stated motivations for renewable energy adoption paired envi-
ronmental goals with economic, security, and industrial policy outcomes:
The promotion of electricity produced from renewable energy sources is
a high Community priority . . . for reasons of security and diversification
of energy supply, of environmental protection and of social and economic
cohesion. . . (European Union, 2001, 33)
The directive marked the culmination of an debate begun in the mid-1990s sur-
rounding the uses of renewable energy and the mechanisms by which to promote
renewable sources.(Jordan et al., 2011, 108) The Commission had viewed this debate
with some concern. On the one hand, renewable energy promised to deliver energy
security and improve economic competitiveness. On the other, the Commission re-
mained concerned that a patchwork of national renewable energy support schemes
would distort its attempts at integrating Europe’s electricity markets.(The European101

Commission, 1999) By 2001, the legality of a range of national support schemes had
been settled by the European Court of Justice in PreussenElektra v. Schleswag AG (Euro-
pean Court of Justice, 2001). This decision confirmed that renewable energy support
schemes were valid state subsidies and not illegal state aid, potentially providing
member states with new means to justify industrial policy initiatives. Since then,
member states have adopted a range of subsidy instruments for renewable electricity
generation, including feed-in tariffs, portfolio standards, and secondary markets in
“green certificates”. Recognizing the growing diversity of support mechanisms and
the impracticality of harmonization, the 2001 Directive permitted substantial flexibil-
ity in choice of policy instrument.
The question of the harmonization of support schemes has persisted. In developing
the first renewable energy Directive, the Commission favored some form of tradeable
certificates program that would allow member states to either build capacity domes-
tically or buy it from other member states. In theory, such a program would have
increased the efficiency of the renewable energy program by encouraging renewable
generation in the most optimal locations, rather than carving up the market along na-
tional boundaries. But this program was opposed by the Parliament and the Council.
The second renewable energy directive (2008)
Unsurprisingly, given the absence of binding targets, none of the 2010 goals for re-
newable electricity generation were met. By 2010, the European Union generated
only about 10% of its overall electricity consumption from renewable energy, though
generation at the member state level varied from nearly zero to over 60% (for states
like Austria with significant hydropower resources).
Despite these shortcomings, the Commission continue to articulate the goals of im-
proved energy security and economic competitiveness, and lower greenhouse gas
102

emissions. In light of the gap between achievements and goals, the Commission in-
troduced a new proposal for binding renewable energy targets in its 2006 energy
strategy white paper.(The European Commission, 2006a) Those targets eventually
became the renewable energy pillar of the Third Climate and Energy Package. In
addition to binding targets, reported in table 4.1, the Directive provided for the use
of stabilization and solidarity funds to assist new member states in deploying renew-
able energy infrastructure, and provided benchmarks for what constituted renewable
energy–notably for biomass used in either liquid fuel production or to fire thermal
power plants.
The updated targets were set as a function of a member state’s prior share of renew-
able energy, its renewable potential, and economic criteria referencing a state’s ability
to make investments.(The European Commission, 2008b, 7) To meet the targets, each
member state was required to submit a renewable energy action plan detailing how
they would meet their assigned targets. Beurskens and Hekkenber (2011) have for-
malized the projections made in each national action plan. Figure 4.11 presents their
estimates for planned capacity expansions over the 2010-2020 time frame. In aggre-
gate, the member states collectively plan to increase renewable energy use in their
economies by over 6% per year. This implies, among other changes, the addition of
146,500 MW of wind capacity and 65,273 MW of solar photovoltaic capacity between
2010 and 2020–increases equivalent to 250% of 2010 capacity for solar and 173% of
2010 capacity for wind.
Notably, however, the 2008 directive did not resolve outstanding issues of harmo-
nization in either the form or level of renewable policy support. Both the Commis-
sion’s initial proposal (The European Commission, 2008b) and the final directive (Eu-
ropean Union, 2009) included this option only in diluted form. Member states could
negotiate “statistical transfers” of renewable energy production above and beyond
103

their 2020 quotas, negotiate joint support schemes for renewable energy, or support
joint projects to develop renewable energy resources. But no tradeable market in re-
newable electricity was provided for. The Parliamentary response to the initial Com-
mission proposal (The European Parliament, 2008b) specifically cites member state
flexibility and autonomy as the primary concern in maintaining the national structure
of renewable energy goals in an increasingly unified European electricity market.
4.5.4 Origins, evolution, and policy coherence
Energy market reform, renewable energy adoption, and emissions trading thus clearly
show significant inter-dependency in their goals, consequences, and costs. As the pre-
ceding sections have shown, however, they evolved from somewhat different moti-
vations, both across issue areas and across countries. Internal market reforms started
as a logical next step for completing the Common Market. Renewable energy man-
dates mixed industrial policy, energy security, and environmental goals. Emissions
trading departed significantly from past European practice in environmental legisla-
tion, but only after Europe grappled with the incongruities of a continental energy
market divided by national emissions schemes.
But while their origins were diverse, they have evolved to be deeply intertwined in
their implications for and effects on the European energy system. That fact was recog-
nized in the development and negotiation of the 2008 Climate and Energy package.
The Commission, through a series of internal and third-party reports, consistently
framed policy shortcomings as depriving the EU of the benefits of systems transfor-
mation. Insufficient market liberalization deprived the EU of the price and security
benefits of an integrated European energy market. Insufficient adoption of renewable
energy risked the EU’s global lead in renewable energy technologies. The bureau-
cratic complexity of the ETS reduced its environmental impact and imposed extra
104

costs on European firms.
Thus while the different threads of the EU’s emissions and energy policy frame-
work evolved separately, they have become more interwoven over time. They also
represent clearly delineated choices about the means by which Europe pursues a low-
emissions energy systems transformation. Perhaps most importantly, however, none
are justified solely on the basis of environmental goals. Rather, each policy–even
emissions trading–rests on a web of economic, environmental, and social justifica-
tions. Those justifications refer not just to the necessity of action, but to the benefits
that action promises.
4.6 Winners, losers, and compensation in the EU policy
suite
By 2008, then, the European Union had synthesized what had been separate initia-
tives on energy market reform, renewable energy adoption, and emissions control.
The 2008 Climate and Energy package was negotiated as a single entity, building on
the comprehensive proposal from the European Commission. That proposal, in turn,
reflected a policy framework that had over time become more integrated, more strin-
gent, and more enforceable. This pattern, moreover, had continued despite eastern
enlargement of the EU.
This section outlines the four primary distributional implications of the EU’s cli-
mate and energy policy regime. The emissions trading scheme functions as both an
emissions cap and a compensation mechanism for three vulnerable groups: poorer
east European member states, firms in tradeable sectors, and smaller and less-well-
capitalized firms. In contrast, the renewable energy mandates create large new export
markets for the relatively rich manufacturing economies of northwest Europe. Fi-
105

nally, energy market reform and integration benefits both systems stability in mem-
ber states with significant renewable energy shares; and energy security in energy
islands and states exposed to geopolitical energy supply instability.
This pattern of costs and benefits, summarized in table 4.2, provides crucial insight
into the structure of EU policy choices. Functionally, the suite of policy instruments
fulfill an array of technical, market, and regulatory tasks necessary to shift the EU
energy system towards a low-emissions trajectory. Distributionally, the particular
design of the instruments generates an array of benefits that accrue to member states
differently based on the structure of their domestic energy systems. Together, these
factors suggest that the EU’s success at issue linkage derives from the way in which
the structure of the European energy system permitted coupling of the functional
requirements of systems transformation to the resolution of distributional conflict
over the costs and benefits of energy systems transformation.
4.6.1 Compensation in the ETS: richer, larger, and protected to
smaller, poorer, and exposed
Both the design of ETS permit allocation, and the outcomes of allocation, generated
three empirical distributional patterns with political consequences. First, the ETS
tended to over-allocate permits to the eastern European member states relative to
the west. Second, it tended to over-allocate permits to smaller firms and emissions
sources compared to large. Third, it over-allocated permits to exposed industrial sec-
tors relative to non-traded sectors, particularly electricity generation. Because the
over-allocated permits had cash value on secondary emissions markets, these pat-
terns of over-allocation are equivalent to financial transfers. But those transfers were
much more implicit than pure side-payments would have been, which played a crit-
ical role in a European Union that lacks real fiscal authority and in which explicit
106

compensation had proven politically unpalatable.
ETS permit allocation for the 2005-2007 and 2008-2012 trading periods occurred as
a two-stage process. The European Commission first allocated permits to individual
countries on the basis of national estimates of future emissions submitted in National
Action Plans. Member states then allocated permits to firms on the basis of the cri-
teria laid out in their National Action Plans. The Commission exercised some veto
power over the content of the national action plans, in line with its role in ensur-
ing harmonization in the Common Market.10 Aggregate permit allocation followed a
historical-updating model, wherein permits were allocated based on prior emissions
and expected future economic growth, with some correction factor to ensure declin-
ing emissions.
But within these aggregates, states had considerable discretion in the assignment of
permits to firms. Moreover, nearly all permits–upwards of 90%–were freely granted
rather than auctioned off. Permit allocation thus allowed for significant distributional
discretion on the part of both the Commission (between states) and the member states
themselves (between firms). Because the permits themselves had real value on sec-
ondary markets, they provided an implicit means of managing distributional conflict
from emissions reduction. Over-allocation of permits to a country or sector can be
treated as a net asset transfer from under-allocated sectors. Under-allocated sectors
either had to either invest more in emissions abatement, or purchase permits on the
secondary market. Excess permit allocation to the new member states may have rep-
resented up to ¤1 billion in implicit transfers as of 2007. In particular, figure 4.5
shows that the new member states received a net excess of permits in every sector
throughout the first and second trading periods.
10In practice, the Commission used its veto power extensively. Sixteen of 25 National Action Plansfor the 2008-2012 trading period were initially rejected by the Commission for a wide array of infrac-tions. The Commission was particularly concerned that states would use permit allocation as a meansof state aid to favored sectors, and policed this kind of distortion of the internal market very carefully.See EurActiv (2007)
107

Permit allocation also provided a means of compensation to vulnerable sectors in
European economies. The first group were the so-called “carbon leakage” sectors,
whose exposure to international competition meant that paying for emissions pric-
ing risked their comparative advantage on global markets. The second group were
the smaller firms and installations, who had relatively less access to the resources re-
quired to adopt low-emissions technologies or operating methods. For the “carbon
leakage” sectors, particularly in western Europe, 4.5 shows that the ceramics, pulp
and paper, iron and steel, and cement industries all received excess permits in all ETS
trading years after 2005. In contrast, the electricity sector–which does not compete di-
rectly on global markets, even if electricity users do–began each trading year with a
permit deficit. Likewise, figure 4.6 shows that smaller installations received relatively
more permits than larger installations. In some cases the relative over-allocation ex-
ceeded actual emissions by a factor of 10: or 100:1. actual emissions.
It’s important to point out that all these compensation patterns could have existed
under an emissions tax as well. Instead of using permit allocation to compensate
recalcitrant or exposed groups, tax revenues could have been recycled to the same
effect. But that would have required the EU to either obtain the fiscal authority to
engage in this kind of redistribution, or to police its member states to ensure that
this occurred on a transparent basis that did not distort internal markets for goods
or energy. It also would have made the patterns of compensation far more obvious.
As the notion of “windfall profits” to specific sectors or firms from over-allocation
proved politically controversial in its own right, explicit cash transfers would likely
have proven unworkable. Consistent with Victor (2011) and Ellerman et al. (2010),
the choice of a cap and trade system rather than a tax for emissions control fulfilled
a particular political logic that tipped the scales between two otherwise theoretically
equivalent climate change mitigation instruments.
108

−8e+07
−6e+07
−4e+07
−2e+07
0e+00
2e+07
4e+07
2005 2006 2007 2008 2009Year
Gra
nted
allo
wan
ces
− e
mis
sion
s
Mean by EU Grouping
EU15
NMS
Figure 4.5: Net permit allocation and emissions under the EU ETS. All data from theEU Community Independent Transaction Log (CITL) for 2005-2009 veri-fied emissions.
EU15 NMS
1e−02
1e+01
1e+04
1e+01 1e+03 1e+05 1e+07 1e+01 1e+03 1e+05 1e+07Emissions, tons CO2
Log
(allo
catio
n / e
mis
sion
s)
Year
2005
2006
2007
2008
2009
Figure 4.6: Ratio of ETS permit allocation to verified emissions by year and instal-lation, compared with actual emissions at each installation. Each pointrepresents a single emitting installation covered under the ETS. Linesare smoothed annual means via loess regression. All data from the EUCommunity Independent Transaction Log (CITL) for 2005-2009 verifiedemissions.
109
Caveats on over-allocation
These conclusions merit a few caveats. First, it remains very difficult to determine
how much excess allocation was due to emissions abatement investments by the
countries or firms in question, versus pure over-allocation. That is, firms may have
had excess permits to sell because they found investments in energy efficiency or
emissions reduction cheaper than the price of permits on the open market. This is
particularly true for eastern European firms, whose comparatively less efficient capi-
tal stock may have resulted in very cheap emissions abatement opportunities relative
to the sale value of the permit. Nevertheless, to the extent that the marginal cost of
abatement was still less than the permit price, firms would have generated windfall
profits from free permit allocation even if some of the permit revenue went to paying
for abatement investments.
Second, there are plausible reasons for permit over-allocation to favor smaller firms.
First, smaller installations may have less predictable emissions than very large instal-
lations like power plants. Second, it may be reasonable to expect that larger instal-
lations had already been optimized for efficiency to achieve operating cost improve-
ments. If that were the case, then smaller firms may have had more leeway to find
low-cost emissions reduction options, resulting in excess permits to sell on secondary
markets. Nevertheless, it’s also the case that very large firms probably have better
access to resources to plan and finance efficiency investments than small firms do.
Furthermore, and as figure 4.6 shows, many of the smaller installations received on
the order of 10-100 times as many permits relative to their emissions, a level of over-
allocation that would appear to tip the scales in favor of the subsidization argument.
These caveats aside, the design of the initial phases of ETS allocation provides sub-
stantial evidence that countries that faced either higher abatement costs, limited ca-
pacity to finance those costs, or loss of competitiveness from emissions pricing were
110

implicitly subsidized through permit allocation. With approximately ¤30 billion
in permits (2 billion or so metric tons at ¤15 / ton) distributed annually, the im-
plicit amount of funds available for allocation is on par with the annual funding for
the Common Agricultural Policy.(Zachmann, 2011) The ETS thus represents both a
framework for emissions reduction, and a mechanism to effect transfers that buffer
the costs of adjustment.
Implications of future changes to the ETS
The Third Climate and Energy Package, will alter some of these re-distributional pat-
terns. Permit allocation to the member states will continue to occur on the basis of
prior emissions. But permit allocation to firms will, after 2012, occur via auctioning
rather than free allocation. This will reduce the value of permits to firms, since the
permits will no long represent a net transfer of valuable cash assets.
However, two exceptions to the permit allocation process indicate ongoing distri-
butional behavior inside the ETS. Together, these exceptions mean that only 40% of
the total permit volume will be auctioned off at the start of Phase III of the Emissions
Trading Scheme. First, the trade-exposed “carbon leakage” sectors, in which energy
constitutes a substantial portion of the cost of finished products, continue to receive
special treatment for allocation and subsidy in order to protect competitiveness. The
Commission published the first list of sectors judged vulnerable to leakage in 2009;
it covered most heavy manufacturing and energy-intensive sectors in the European
economy. In practice, this means that 80% of the permits granted to manufacturing
sectors will be freely allocated in 2013.11
Second, the new member states also receive some opt-out options for auctioning
to their electricity sector. Those opt-outs expire after 2020. Of the ten new member11See The European Commission (2010a) for the original announcement. Further updates
are posted to http://ec.europa.eu/clima/policies/ets/cap/leakage/index_en.htm.Lasted referenced 27 February 2013.
111
states, all but Latvia and Malta requested derogations under the opt-out provision
and will continue free allocation of permits to their electricity sectors. The wording
of this section is an excellent demonstration of how the EU climate and energy pol-
icy suite allows for implicit rather than explicit compensation. The statute itself says
nothing about the new member states in particular. But the specific wording of the
section cites criteria on GDP, energy intensity, income, and other factors that implic-
itly mean that only the new member states will qualify.12
Thus the future ETS will have more muted distributional impacts than in the first
two trading periods. Ellerman et al. (2010) suggest that the political controversy over
“windfall profits” from free allocation, combined with firm dissatisfaction over the
unpredictability of allocation levels, led to evolving preferences over time for auc-
tioned rather than granted permits. But free allocation played a vital role in securing
the participation of both trade-exposed sectors and the new member states of eastern
Europe; and will continue to provide a means of side-payments for the foreseeable
future.
4.6.2 Renewable energy targets and export expansion in the rich
countries
Patterns of permit allocation provided the EU with a means of managing the costs of
emissions reduction. In contrast, the Renewable Energy Directive provides implicit
benefits to a set of rich countries whose domestic high-technology manufacturing
sectors will supply the bulk of the technologies necessary to meet the 2020 target of
a 20% renewable energy share in the electricity mix. Those countries and sectors, in
turn, benefited not at all from permit over-allocation. Indeed, they usually operated12In practice, it remains unclear how much latitude the Commission will give these states. Inter-
views with the Commission in early 2011 indicated that the Polish government had applied for andexpected a much greater range of latitude in free allocation than the Commission was prepared togrant.
112

at a permit deficit and provided the demand (and thus cash) for excess permits from
eastern Europe. Prevailing patterns of revealed comparative advantage in renew-
able energy technologies suggest that this pattern of redistribution will persist for the
foreseeable future.
Using the wind industry as an example, we can estimate that the renewable energy
mandate will generate as much as $48 billion in implicit benefits to these firms and
countries by 2020. Assuming that the planned addition of 146,500 MW of installed
wind capacity cited in section 4.5.3 is attained solely through the use of the newest
generation of 3 MW wind turbines from leading firms Vestas or Siemens, that’s equiv-
alent to approximately 48,000 new turbines. Vestas estimates an installed cost per tur-
bine of approximately $1.7 million, implying a total investment of $83 billion for the
turbines alone. Perhaps 60% of that cost is captured by the manufacturing process
alone, so that $48 billion of the $83 billion will go to procuring the turbines them-
selves. This is, of course, probably a conservative estimate: assumptions about future
price reductions in wind turbine technology would reduce overall costs. But it pro-
vides a near-term estimate of the scale of investment required.
Who benefits from this investment depends on the sources for wind turbine pro-
curement. The highly specific nature of wind turbine design, and the presence of sig-
nificant learning-by-doing knowledge effects, has led to the dominance of the global
wind industry by relatively few firms.13 Within Europe, the advanced manufactur-
ing economies dominate the market: Vestas in Denmark, Siemens in Germany, and
Gamesa in Spain. Figure 4.7 shows that this has resulted in highly skewed patterns
of comparative advantage in wind turbines within the EU member states.
13Heymann (1998) provides evidence that early Danish leadership over German and Americanfirms in wind turbine design emerged from Denmark’s strategy of repeat deployment rather thanengineering optimization. Deployment provided information to firms and inventors that could not bereplicated in the laboratory. As a result, Danish designs were more successful than their competitorsuntil well into the 1990s, while efforts at very large turbine design in Germany and the United Statesfailed.
113

(Log) Revealed comparative advantage in wind turbines, 2008
−5
−4
−3
−2
−1
0
1
(Log) Revealed comparative advantage in photovoltaic technology, 2008
−2.0
−1.5
−1.0
−0.5
0.0
0.5
1.0
1.5
Figure 4.7: Revealed comparative advantage in wind turbine and solar photovoltaiccell exports within Europe. Calculated from the 6-digit UN COMTRADEexport data for the period 2000-2010.
Addition of significant amounts of new wind capacity in the European Union will
almost certainly result in expanded revenue streams for these firms and their supplier
networks.14 As such, the renewable energy mandates constitute a de facto market
expansion for specific industries in specific member states.15 As figure 4.10 shows,
market expansion for wind electricity generation in particular has correlated with
export growth for only two countries, Denmark and Germany. Moreover, figure 4.9(a)
shows that this market growth is not reciprocal: Denmark and Germany have both
maintained substantial positive trade balances in this sector since the mid-1990s.
Moreover, because of the structure of value-add in the wind sector in particular,
the secondary effects of an expanded wind industry should be limited. Expanded
14This assumes a counter-factual world without binding targets in which those investments did notoccur. The failure to achieve non-binding targets in the period 2001-2010 suggests that this is a reason-able assumption. The EU member states would, no doubt, have made some investments in renewableenergy goods without the mandates. But the mandates increase the certainty and potentially the sizeof the investments and imply legally-guaranteed demand expansion in these sectors.
15Huberty and Zachmann (2011) provide evidence that renewable energy market expansion inhome economies benefits or develops domestic renewable energy sectors only under limited circum-stances, and does so preferentially based on pre-existing patterns of competitiveness in related mar-kets.
114

production of wind turbines will, of course, generate expanded demand for inputs
to wind turbine production. Many of these inputs–particularly for a small economy
like Denmark–will come from other member states. But estimates of the value-added
structure of a wind turbine place approximately 78% of the hardware cost in the gen-
erator and airfoil (Tegen et al., 2010).16 Thus most of the value is tied up in the knowl-
edge capital applied to turbine design and construction. This will limit the spillover
from expanded domestic production.17
Solar photovoltaic electricity, the other major contributor to new renewable energy
capacity in under the renewable energy targets, has a more broadly distributed pat-
tern of comparative advantage and thus represents a less concentrated transfer. But
as figure 4.10 shows, the countries that appear to benefit most from their neighbors’
expanding demand for solar electricity are, with the exception of Hungary and the
Czech Republic, all western European countries. Moreover, the international solar
cell market has changed rapidly, and new entrants like China have rapidly acquired
significant market share.(Woody, 2010) Because solar cells are more modular and
more easily shipped than wind turbines, this will reduce the degree to which funds
for solar energy market expansion stay within the EU. While this may not constitute
intra-EU redistribution, neither does it suggest that expanding solar markets at home
will lead to improved prospects for domestic solar electricity firms.
Thus the industrial benefits of the growth of renewable energy markets will likely
be concentrated in the few countries that are today significant players in wind tur-
bine manufacture. Those countries are themselves mostly highly advanced western
16This accounts for approximately 53% of the installed cost of a turbine. The tower accounts for anadditional 25%, with the balance of the costs falling under engineering and construction finance. Allcalculations were based on a generic 2010 reference turbine.
17There is one caveat to this conclusion. The newest generation of very large offshore wind turbinescannot be shipped easily due to their size. On-site assembly is therefore required, usually in a portcapable of moving the turbines directly to the point of installation. However, while this will capturemore value-add for the installing country, it does not fully offset the fact that so much of the sale valueis tied up in knowledge capital rather than labor or materials.
115

European member states. The renewable energy mandates thus have a significant
distributional element to them, on the scale of billions of dollars annually, that runs
in the reverse direction from the normal west-to-east pattern common to the EU’s
cohesion and structural adjustment funds and the ETS.
We may view this linkage process as a kind of technology fund theorized by Urpelainen
(2012a). He proposes a fund in which developed countries subsidize low-emissions
technology adoption by developing countries, as an implicit subsidy to their own
domestic clean technology industries. Here, the subsidy of eastern Europe by west-
ern Europe combines implicit and explicit measures: explicit, via the solidarity funds;
and implicit, via transfers through the ETS permit mechanisms as described in section
4.6.1.
4.6.3 Benefits from market integration and reform: systems security
and stability
Finally, the move to integrate national energy markets generates several, highly di-
verse beneficiary pools. Those countries with high intermittent renewable energy
shares–such as Denmark and Germany–are able to average their energy intermittency
over a larger market, buffering their own market from energy shortages and selling
into foreign markets at times of overproduction. This makes domestic energy systems
transformation technically easier and financially less complicated to manage. The
first steps in this direction were taken in late 2010, when the Nordic countries and the
central-west European regional energy market entered into market-based price cou-
pling, significantly reducing both cross-border price differentials and price volatility
on the regional electricity markets.
In parallel, countries exposed to significant external energy supply instability ben-
efit from increased integration with the European market. This last had been a signif-
116

0
5
10
15
0 10 20 30 40Share of RES−E, 2010
Add
l. R
ES
−E
req
uire
d fo
r 20
20
EU Grouping
EU−15
NMS
Figure 4.8: Clustering of EU 2020 RES-E targets by 2010 starting points. All num-bers shown as the percentage of electricity generation derived from non-nuclear renewable sources. Data taken from Annex 1 of European Union(2009).
icant problem during the gas crises of 2000-2010, when western Europe often enjoyed
gas surpluses while eastern Europe faced shortages. Then, the lack of sufficient cross-
border energy market integration forestalled easy solutions and raised the costs of
supply disruption considerably. The European TEN-T network integration programs
specifically target those bottlenecks for resolution, even as they also facilitate the ge-
ographic averaging of renewable energy intermittency and smooth the integration of
high levels of renewable energy into existing energy systems.
117

AustriaBelgiumCyprus
Czech Rep.Denmark
EstoniaFinlandFrance
GermanyGreece
HungaryIreland
ItalyLatvia
LithuaniaLuxembourgNetherlands
PolandPortugal
RomaniaSlovakiaSlovenia
SpainSweden
United Kingdom
−2e+09 0e+00 2e+09 4e+09 6e+09Net trade balance in USD
Cou
ntry
(a) Wind turbines
AustriaBelgiumBulgariaCyprus
Czech Rep.Denmark
EstoniaFinlandFrance
GermanyGreece
HungaryIreland
ItalyLatvia
LithuaniaLuxembourg
MaltaNetherlands
PolandPortugal
RomaniaSlovakiaSlovenia
SpainSweden
United Kingdom
−5e+09 0e+00 5e+09Net trade balance in USD
Cou
ntry
(b) Photovoltaics
Figure 4.9: Net trade balance in wind turbines and solar cells, 1996-2009. All datafrom the bilateral trade figures in the UN COMTRADE database.
Austria
Belgium
Czech Rep.
Denmark
Estonia
France
Germany
Greece
Ireland
Italy
Netherlands
Poland
Spain
Sweden
United Kingdom
−1.0
−0.5
0.0
0.5
1.0
Corr. btwn EU−26 wind market growth and prior year domestic wind exports
Cou
ntry Count of country pairs
50
100
(a) Wind turbines
Austria
Belgium
Bulgaria
Cyprus
Czech Rep.
Denmark
Estonia
Finland
France
Germany
Greece
Hungary
Ireland
Italy
Latvia
Lithuania
Luxembourg
Malta
Netherlands
Poland
Portugal
Romania
Slovakia
Slovenia
Spain
Sweden
United Kingdom
−0.5
0.0
0.5
1.0
Corr. btwn EU−26 solar market growth and prior year domestic solar exports
Cou
ntry
Count of country pairs
100
200
300
400
(b) Photovoltaics
Figure 4.10: Correlation of prior-year home-country aggregate export growth withEU-26 market growth in renewable electricity generation. Market growthcalculated as the year-over-year change in absolute amounts of renew-able electricity from wind or solar. Exports calculated as total yearlyexports by country for the prior year. Electricity data taken from theEnergy Information Administration international accounts. Trade datataken from the UN COMTRADE database. All data from 1996-2009.
118

Member State Share of energy from re-newable sources in grossfinal consumption of en-ergy, 2005
Target for share of energyfrom renewable sources ingross final consumption ofenergy, 2020
Belgium 2.2% 13%Bulgaria 9.4% 16%Czech Republic 6.1% 13%Denmark 17.0% 30%Germany 5.8% 18%Estonia 18.0% 25%Ireland 3.1% 16%Greece 6.9% 18%Spain 8.7% 20%France 10.3% 23%Italy 5.2% 17%Cyprus 2.9% 13%Latvia 32.6% 40%Lithuania 15.0% 23%Luxembourg 0.9% 11%Hungary 4.3% 13%Malta 0.0% 10%Netherlands 2.4% 14%Austria 23.3% 34%Poland 7.2% 15%Portugal 20.5% 31%Romania 17.8% 24%Slovenia 16.0% 25%Slovak Republic 6.7% 14%Finland 28.5% 38%Sweden 39.8% 49%United King-dom
1.3% 15%
Table 4.1: EU 2020 RES-E targets, as reported in Annex 1 of European Union (2009).
119
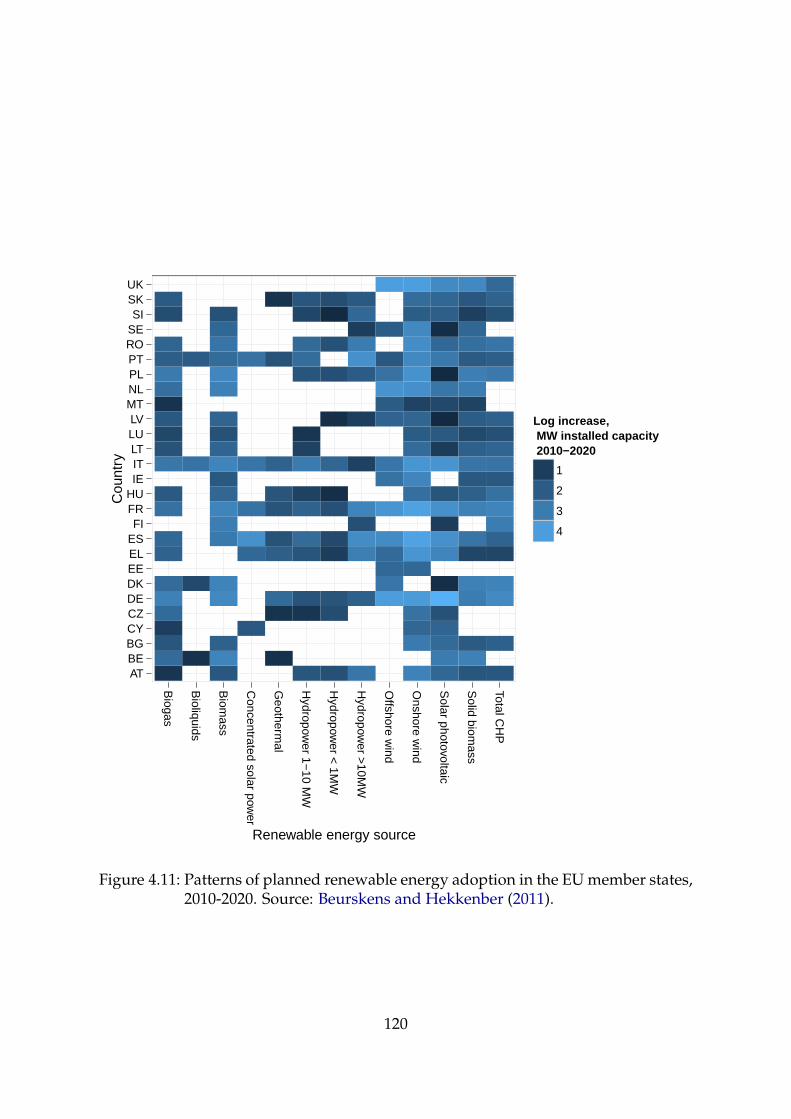
ATBEBGCYCZDEDKEEELESFI
FRHUIEITLTLULV
MTNLPLPTROSESI
SKUK
Biogas
Bioliquids
Biom
ass
Concentrated solar pow
er
Geotherm
al
Hydropow
er 1−10 M
W
Hydropow
er < 1M
W
Hydropow
er >10M
W
Offshore w
ind
Onshore w
ind
Solar photovoltaic
Solid biom
ass
Total CH
P
Renewable energy source
Cou
ntry
Log increase, MW installed capacity 2010−2020
1
2
3
4
Figure 4.11: Patterns of planned renewable energy adoption in the EU member states,2010-2020. Source: Beurskens and Hekkenber (2011).
120
4.7 Against multifaceted policy: emissions pricing and
its discontents
This chapter has argued that the EU’s success at unilateral climate change action in
the face of powerful incentives to the contrary derives from a multi-instrument ap-
proach to low-emissions energy systems transformation. In this view, multiple instru-
ments are required to effect the transformation of the assets, markets, and regulation
that structure the production, distribution, and use of energy. In the case of the EU,
the choice of instruments generated asymmetric patterns of near-term benefits from
energy security, export competitiveness, and systems stability. The European Com-
mission used those benefits to justify actions that climate change mitigation alone
might not have. Those benefits underpinned the success of Europe’s policy regime in
the face of strong free-riding incentives, diverging energy interests among the mem-
ber states, and the defection of its major trading partner from international emissions
regulation.
Nevertheless, the European energy policy suite has encountered criticism, partic-
ularly from economists. They argue that the use of multiple instruments, especially
technology-specific ones like renewable energy mandates, dilutes the economic effi-
ciency that is the primary motivation for a pure emissions pricing system. As such,
it raises the cost of systems transformation and risks generating inefficient or even
dysfunctional outcomes for emissions reduction.
This section argues that such an interpretation ignores the importance of the distri-
butional capacity of a multi-instrument approach to balance competing political inter-
ests and sustain policy momentum. What appears as rent-seeking distortion should
instead be viewed, consistent with chapter 3 as a politically viable and sustainable
approach to institutionalizing and improving emissions policy over time. Achieving
121
this kind of outcome in the European Union was facilitated by the use of multiple
instruments that addressed near-term challenges in energy security and economic
competitiveness as well as long-term emissions reduction goals. An emissions price,
deployed in isolation, could not have served these ends, and may have undermined
the viability of the emissions regime over the long term.
4.7.1 Redundancy and inefficiency in the EU policy suite
Theoretically, most of the EU policy suite should be superfluous for the EU’s climate
policy goals. Economic analysis has consistently emphasized the sufficiency of a car-
bon price–whether through a carbon tax or a permit system–for incentivizing the
necessary investments in renewable energy, energy efficiency, or research and devel-
opment. Nordhaus (2010) has styled this “carbon price fundamentalism” and argues
that this approach represents the best long-term strategy for climate change mitiga-
tion. In contrast, policies that promote renewables and push energy efficiency may
constitute market-distorting industrial policy. For instance, it now appears that the
renewable energy mandates will crowd out emissions reduction via energy efficiency
investments, even though most cost estimates (such as Enkvist et al. (2007)) show that
energy efficiency improvements are often much cheaper per unit emissions.
Most analysis has treated the EU’s move to a redundant, multi-instrument climate
and energy policy suite as a purely distortionary effect of rent-seeking by power-
ful industrial and member-state interests. Helm (2009), examining the 20/20/20 tar-
gets on emissions, renewable energy, and efficiency, asserts that “the probability that
the correct answer. . . of what to do about climate change is even approximately [the
20/20/20 targets] is close to zero”, believes that the targets were adopted solely for
their signaling value, and concludes that the policies represent a “politically neat but
economically inefficient set of targets.” Victor (2011, 68-70) explains the EU choice
122

of emissions trading for industrial emissions in terms of rent-seeking on the part of
entrenched industrial interests, and the attractiveness of RES-E targets as a similar
move on the part of renewable energy interests. Schmalensee and Stavins (2011) and
Palmer and Burtraw (2005) argue that renewable energy mandates are a costlier way
to achieve emissions reduction than an emissions price alone. These explanations
(and critiques) of the EU energy policy suite point out, correctly, the pitfalls of the
EU’s approach and the potential for it to raise the overall cost of emissions reduction,
and potentially increase the chance of outright policy failure.
This gap between theory and policy implementation is puzzling in light of the polit-
ical economy of climate change action as outlined in chapter 3. Climate change poses
fundamental policy problems because it imposes immediate, acute costs to achieve
diffuse benefits far in the future. This structure of costs and benefits has led other
major emitters–notably the United States in the developed world, and China and In-
dia in the developing–to resist or reject aggressive and coordinated climate action. In
the case of the EU, they are powerful arguments for choosing the least-cost means of
action. Indeed, interviews with the European Commission in late 2010 corroborated
earlier evidence that the EU abandoned earlier ideas for a command-and-control ap-
proach to emissions regulation largely because of fears about cost. Despite those
concerns, however, they have subsequently added to the carbon price framework a
range of policies regarded as more costly, and less efficient, than a carbon price alone.
4.7.2 Complementarity, not redundancy: climate policy as energy
policy
In the context of chapter 3, it’s not clear that these critiques of the EU’s policy suite
are justified. As this chapter has argued, the EU’s policy suite is attempting to satisfy
three different policy goals: emissions, energy security, and economic competitive-
123

ness. In doing so, the structure of the EU’s energy system has required and permitted
the coupling of progress on emissions reduction to progress on other energy-related
issues that deliver real, near-term benefits to economic actors. This has both an eco-
nomic and a political logic. Economically, energy market integration and emissions
reduction both required a range of major changes to the EU’s energy infrastructure
to integrate significant quantities of renewable energy in a stable energy system. Po-
litically, both emissions reduction and energy systems transformation would impose
distributional costs on a set of EU energy and emissions interests that had become
more fragmented following on the 2004 and 2007 enlargements.
Section 4.6 argued that the policy suite evolved in the face of these issues in the di-
rection of a synthesis that served both the logistical and infrastructure problem, and
the distributional problems. It did so via linking long-term progress on emissions
to near-term progress on security and economic competitiveness. The chosen pol-
icy instruments provided a range of distributional tools to policymakers that–while
no doubt enabling rent-seeking–kept reluctant energy interests from becoming veto
players, and built new advocates for policy stability.
In contrast, the narrow pursuit of emissions reduction, security, or competitiveness
alone risked fracturing the coalition along these lines. Pursuing emissions reduction
through a high emissions price would have two immediate effects: first, it would
encourage the substitution of imported (Russian) gas for domestic coal in electric-
ity generation, at an immediate 40% reduction in carbon per unit energy. Second,
it would raise retail electricity prices substantially, and disproportionately in high-
carbon-share economies. These developments threatened to create discord among
member states concerned about energy security and industrial competitiveness, and
among firms in more energy-intensive sectors.18
18For the ongoing geopolitical tensions within the EU over relations with Russia, see, for instance,Belkin (2008). Even with the new policy regime in place, Europe’s member states continue to facedifficulties coordinating external action.
124

Likewise, pursuit of energy security alone would lead to significantly greater use
of domestic EU coal. This is particularly true of the new member states, who lack
natural gas resources and lag behind in renewable energy technology.19 Much of the
remaining coal in eastern Europe, such as that around Silesia in Poland, is of the soft
brown lignite variety (World Energy Council, 2010), which in addition to its carbon
emissions carries a much higher share of other pollutants compared to hard coal.
Its expanded use would alienate member states more committed to emissions and
pollution reduction, and frustrate EU attempts to achieve its commitments under the
Kyoto protocols.
In contrast, a renewables target alone would generate significant benefits for mem-
ber states with strong wind and solar power industries. Those countries would stand
to benefit from increased exports of capital goods, such as wind turbines and solar
cells, to other member states lacking domestic production capacity.20 But that would
come at large costs to technology-importing countries, both in absolute terms and
in the secondary effects on trade balances. It would also do little to solve the var-
ious market imperfections that prevent the adoption of net-positive-benefit energy
efficiency measures, and would still require significant infrastructure and regulatory
changes to achieve a stable, renewable-energy-dominated energy system.
Finally, each of these policy approaches would still have required a mechanism for
EU energy market integration. As chapter 2 showed, the introduction of renewable
energy generation resources poses stability problems that require significant down-
19See, for instance, the Polish response to the 2006 European Commission Green Paper on energymarket reform. The Polish government emphasized the need for carbon capture and sequestration,and suggested that most of its domestic investment in more efficient energy technologies would gointo more efficient coal energy plants and energy efficiency–not the elimination of coal from its en-ergy supply.(The Government of the Republic of Poland, 2006). More recently, the Polish governmenthas aggressively defended its continuing expansion of coal-fired power generation. See, for instance,Stonington (2012).
20This, of course, is limited to the case in which each member state had binding targets withouttradeable certificates. In that case, member states could not satisfy their domestic targets throughpurchases of excess renewable energy production from abroad. As of 2011, the EU renewable energygoals permit only limited tradeability in renewable energy.
125

stream changes to energy distribution and demand. Making the investments required
to maintain systems stability, however, would not have been in the interest of older,
vertically-integrated state power monopolies. Their control of both production and
transmission of electricity gave them large incentives to favor their own energy pro-
duction assets in making new grid investments and allocating grid capacity. As a
corollary, it also gave them few incentives to invest in new transmissions connections
for renewable energy resources, or to harden the power grid to effectively manage
intermittent generation. In this context, the breakup of the power monopolies and
the creation of independent markets for production, transmission, distribution, and
use was a critical step in pushing for the adoption of low-carbon energy sources.21
But even absent a mandate for renewable energy adoption, improved energy secu-
rity would also require cross-border grid integration, to solve the inadequacy and
energy island problems identified in sections 4.4.2 and 4.4.2.
Thus each of these three policy issues–emissions, security, and competitiveness–
carries with it unique interests, both for and against, that would pose problems for
attempts to pursue them in isolation. Instead, the EU energy and climate policy suite
has evolved to yoke progress along any one policy dimension to progress along the
others. The mix of costs and benefits to any one interest group or member state varies
by the policy instrument, implicitly underwriting a political strategy of issue link-
age between both interest domains and member states, and cross-subsidizing policy
compliance. Finally, the ability to pursue all of these policies was highly contingent
on the market reforms that enabled their implementation, and provided the private
21The proper regulation of the network assets in network economies has received significant atten-tion amidst both the rise of the Internet and the privatization of state-owned network industries likerail. Two examples provide some insight: Much of the success of the internet hinged on ensuring thatneither the network operator, AT&T, or the IT standards setter, IBM, could use monopoly control ofmarkets to dictate terms of entry. Antitrust regulation of both firms (and, later, Microsoft) providedopenings for new competitors. In contrast, the privatization of the rail network in the United King-dom generated insufficient incentives for the network owner, Railtrack, to maintain and improve thenetwork infrastructure. Breakdowns, delays, and systems decline resulted, at great cost to the Britishstate.
126
sector with incentives to pursue the investment necessary to achieve energy policy
goals.
Political economy as a rebuttal to price fundamentalism
This analytic framework suggests that the arguments of the price fundamentalists
miss the forest for the trees. As emissions policy alone, the ETS may be inefficient
and cumbersome compared to a pure carbon price. As energy policy, the renewable
energy mandates crowd out other, cheaper emissions-reducing fuels and efficiency
investments. As market policy, energy market liberalization makes only partial sense
in a world of massive, highly centralized fossil fuel generation plants.
But as table 4.2 shows, each of these policy instruments in fact serve multiple func-
tional and distributional ends. Functionally, the support the integration of the Eu-
ropean energy market, buffer renewable energy intermittency, reform monopolistic
markets, support experimentation with and adoption of new energy technology at
scale, and provide new forms of energy security. The benefits derived from these var-
ied functions in turn provide the means of compensating rich and poor states alike,
offsetting the costs of emissions reduction and generating near-term benefits that en-
courage policy stability and credibility.
Moreover, the varied policy targets–emissions, security, and competitiveness–provide
greater flexibility to both EU and member state policymakers in justifying policy
amidst a changing economic and political landscape. As the EU shifted from growth
to recession in the 2008-2010 period, so too did the primary justification shift from cli-
mate change to job creation and firm competitiveness. The multiplicity of targets also
allowed countries as diverse as Poland and Denmark to find accommodation inside
the policy suite. Poland’s response to the 2006 energy white paper (The Government
of the Republic of Poland, 2006) emphasized security of supply and expanded use of
127
domestic coal, and relegated the climate pillar of the policy proposal to third place. In
contrast, Denmark emphasized renewable energy and reduced dependence on fossil
fuels.(Danish Energy Authority, 2007, Appendix) Reconciling one set of interests to
another required a means of both compensating Poland for participation and reward-
ing Denmark for taking on larger burdens. As this chapter has shown, the distribu-
tional patterns in the EU energy policy suite implicitly do both, by linking together
emissions, security, and energy issue domains.
What we observe in the EU is, then, largely consistent with the predictions of the
theory of political economy put forth in chapter 3. The EU has yoked progress on
emissions to goals in energy security and industrial policy that promise short-term
benefits. It has adopted policies to pursue those goals that both blunt the appar-
ent cost of action and provide for implicit cross-subsidization of different policy do-
mains. And, as policy has become institutionalized and stable, it has modified the
policy regime–most notably with the turn to permit auctions after 2012–as policy ac-
tors have adapted to the emissions control framework and perceived as credible the
mechanisms for cost management. The policy suite has thus permitted ongoing ac-
tion on climate change, even as the original political climate has changed with EU
enlargement, and the economic climate has changed from boom to bust.
In closing, critiques along the lines of those of Helm (2009) and Victor (2011) pro-
vide important insights into the actual and potential distortions of the EU’s multi-
faceted policy suite. But it is equally important to realize that there is a logic to the
policy suite that goes beyond mere rent-seeking on the part of industries and member
states. Rather, the structure of the energy policy suite appears to address the suite of
political economy problems created by a low-carbon energy systems transformation.
Improving the policy suite to improve effectiveness and reduce costs cannot focus
only on resolving the problems of economic distortion created by the current suite.
128
Rather, solutions must also identify how they would avoid exacerbating the political
threats to policy continuity that the present system addresses. Finally, whatever the
accuracy of the proposition that voters will probably need to pay more than they want
for emissions reduction, haranguing them to do so (particularly amidst Europe’s on-
going economic stagnation) appears unwise for both policy durability and electoral
success.
4.8 Conclusions: managing functions and benefits in for
low-emissions systems transformation in the EU
This chapter has argued that the Commission pursued an integrated climate and en-
ergy policy out of a specific conception of the emissions reduction problem. Sustain-
able support for climate policy had to rest on material returns from the pursuit of
environmental ends. Structuring a low-emissions energy systems transformation to
serve Europe’s security and competitiveness needs offered a means to generate those
material returns. The politics of issue linkage that emerged coupled tasks that served
emissions reduction to actions that pursued long-term industrial change. That change
benefited new firms in renewable energy and energy efficiency; generated gains from
market integration; and tried to address Europe’s burgeoning energy security prob-
lems.
The circumstantial evidence raises a number of political questions. First, this chap-
ter has asserted that the pattern of benefits suggests a strategy of issue linkage among
asymmetric, but overlapping, economic interests. That implies a world in which in-
terests who many not agree on long-term environmental problems may nevertheless
find common ground on the short-term consequences of climate action. Chapter 6
provides evidence of these interests. Using data from firm responses to regulatory
129

comment periods, it shows that firms often share second-order interests even when
their first-order interests differ. Thus, for instance, a wide array of firms support en-
ergy market integration and reform, even if they don’t agree on the role that reform
plays in encouraging the adoption of renewable energy. This pattern of interests, with
specific reference to the Commission’s proposed energy strategy for Europe, points to
the possibility for issue linkage to resolve the otherwise difficult politics of emissions
reduction.
Second, while the Commission’s strategic objectives were clear, it is by no means
the only policy actor in the EU institutions. Verifying that a coherent politics of issue
linkage emerged from the Commission’s objectives requires establishing whether and
how the Commission’s strategy survived the European legislative process. Chapter
5 shows that the Commission was quite successful in protecting its policy design in
the European policy process. It also shows that the Parliament–historically a success-
ful environmental advocate–was relegated to the policy periphery. Thus legislative
history shows that the Commission’s policy designs, as expressed in its 2006 energy
strategy, carried the policy formation process. That history also informs against a
competing hypothesis for Europe’s climate policy leadership: the choice of policy in-
struments in many cases ran against the preferences of the European Parliament and
its strong green parties, while the Parliament’s attempts to enact those preferences in
law were consistently rebuffed.
This evidence points to the intent, on the part of the European Commission, to
craft a political strategy for emissions reduction rooted in the politics of energy sys-
tems transformation. In doing so, it has yoked support for emissions reductions to
presumed benefits from energy security, employment, export-led growth, and market
competition. The Commission here has clearly played the role of policy entrepreneur,
in recognizing how disparate threads of Europe’s energy policy might–or should–
130

serve a coherent whole. It’s ability to do so, however, rests on the underlying struc-
ture of Europe’s legacy energy system, and the costs and benefits that structure im-
plies for the transformation itself.
This is not to say, of course, that the 2008 Climate and Energy package, and the
present EU energy and climate policy suite, mark perfectly conceived instruments
for the transformation of the EU energy system. As Jordan et al. (2011) have shown,
the EU will continue to encounter significant questions of governance, cross-border
harmonization, and policy feasibility. But emphasizing policy stabilization via issue
linkage does not imply immobile policy. Rather, it suggests the institutionalization of
a set of arrangements that may help stabilize the politics of policy implementation,
and permit policy refinement over time.
131

Policy Low carbon EST role Other role Political / distributional role Primary beneficiariesMarket lib-eralization • Promote new RES-
E entrants
• Reduce barriers tonew technology
• Create marketmechanisms forcross-bordertrading ofcapacity andsecurity goods
• Increase price competi-tion to offset ETS, RES-Ecosts
• New energy market en-trants
• Energy users
Infrastructureplanning &investment
• Buffer renewableenergy intermit-tency
• Connect en-ergy “islands”to central EUenergy markets
• Improve energy security
• Reduce weight of na-tional legacy utilities
• Energy islands
• Surplus power producers
• Large RES-E share coun-tries
Emissionstrading • Financial incen-
tives for emissionsreduction
• Cross-national transfersvia ETS permit allocation
• Eastern Europe
• Small(er) firms
Renewableenergytargets
• Bring new technol-ogy into the mar-ket
• Provide learning-by-doing opportu-nities
• Provide non-fossil-fuel-based domesticenergy re-sources
• Export revenues for lead-ing RES-E sector firms
• Improve energy security
• Disguise emissionsreduction cost
• Countries with compara-tive advantage in RES-Egoods
• Countries vulnerable tosupply disruption
SET-Plan
• Invest in long-termlow-emissions en-ergy systems tech-nologies
• Fund R&D forindustrial com-petitiveness
• Promote comparative ad-vantage for EU firms
• Countries and firms inthe RES-E, energy effi-ciency, and energy ser-vices supply chains
Table 4.2: Distributional and functional contributions of major instruments in the EU policy suite.
132

1996 2020• •• December, 1996 Adoption of the Directive on rules for
a common internal market inelectricity
•March, 2001 Commission proposes completion ofthe internal energy market via the2nd Energy Market Directive
• September, 2001 Adoption of the Directive on thePromotion of Electricity fromRenewable Sources
• June, 2003 Revised rules for the commoninternal market in electricity adopted;market dis-aggregation mandatedand defined.• August, 2003 Second Gas and Electricity Directive
endorsed by the Parliament
• October, 2003 Emissions Trading Scheme (ETS)adopted
• January, 2005 First trading period of the ETS begins
• October, 2005 Climate and Energy prioritized atHampton Court Palace summitunder British Presidency
• January, 2007 Commission White Paper on EUEnergy Strategy
•March, 2007 European Council adopts 20/20/20targets
• January, 2008 Second trading period of the ETSbegins; Commissions proposeslegislation for 20/20/20 targets
• June, 2008 ENTSO-E establishes operations
• December, 2008 Climate and Energy Package,synthesizing rules for electricitymarket integration, renewableenergy, and emissions trading,endorsed by the Parliament andCouncil.
Figure 4.12: Timeline of EU Energy and Climate Policy
133

5 Design or politics? Legislating the
Third Climate and Energy Package
5.1 Introduction
Chapters 1-4 argued that Europe’s climate strategy should be understood as indus-
trial rather than environmental policy. The history and configuration of Europe’s
climate policy suite points to a concerted attempt to use the industrial transformation
of Europe’s energy system to build political support for long-term emissions reduc-
tion. That support rests on material benefits derived from the set of technical, regula-
tory, and market changes required to take emissions out of Europe’s energy supply. I
argued that the European Commission pursued, over time, a policy strategy of con-
figuring those changes to build supportive constituencies of economic, rather than
environmental, interests. Crucially, while the ultimate goal might have been envi-
ronmental, the Commission approached its task as a problem of industrial policy–of
managing both the technical and political challenges of effecting a major sectoral tran-
sition in the European economy.
This argument departs from the emphasis on environmental interest groups com-
mon to more conventional explanations of climate policy outcomes. Those explana-
tions credit strong environmental policy actors with overcoming the perceived ten-
134
sion between short-term economic gain and long-term environmental stability. As
chapter 4 argued, however, that explanation appears very incomplete: it neither pro-
vides much explanation for the choice of policy instruments, nor does it explain how
diffuse, non-material interest would sustain a complex economic policy in the face
of acute opposition. Furthermore, an environmentally-focused explanation runs con-
trary to the preconditions that have permitted other complex economic reforms to
overcome the resistance of well-organized and highly motivated incumbents.
This chapter provides evidence to support the claim that European climate policy
choices relied far less on environmentally-motivated legislators than is commonly be-
lieved. Despite the European Parliament’s reputation as an effective environmental
advocate, the data presented here show that Parliament had relatively little influence
over the central bargains struck in the 2008 reforms to the European climate and en-
ergy policy suite. Throughout the legislative process, the Parliament attempted to
make policy more environmentally aggressive, less generous to legacy energy inter-
ests, less tolerant of member states’ demands for regulatory flexibility, and less explic-
itly industrial. These attempts largely failed. Instead, in almost every major policy
domain, the European Commission’s preference for industrial policy prevailed.
The Commission’s own statements in the course of the legislative process reinforce
the claim that it pursued an integrated strategy for industrial change, rather than a
narrowly focused environmental policy. In shepherding its policy agenda through the
legislative process, the Commission repeatedly signaled its understanding of emis-
sions reduction as a problem of systems transformation; and its policy prescription
as a synthetic approach to technological, regulatory, and economic change. Together,
these two developments point strongly towards the conclusion that European climate
policy success has relied on a political strategy grounded in the material returns to in-
dustrial transformation. Conversely, it has avoided narrower, more environmentally-
135

focused approaches that would have upset the delicate balance of interests at stake.
This evidence points strongly towards the thesis advanced in chapters 3-4: that
policy success in the EU came as a result of a politics of issue linkage, wherein the
means adopted to pursue a low-emissions energy system were tailored to serve the
political task of building support for policy continuity. That support relied less on
an affinity for environmental stewardship than it did on the material benefits created
by the process of energy systems transformation itself. In doing so, however, that
strategy relied on the opportunities and challenges present in Europe’s legacy energy
systems. That interaction between politics and systems, and the policy choices that
flowed from it, suggests that national policy choices may prove successful climate
policy strategies, while contributing relatively few lessons for countries with differ-
ent economies and different energy legacies. The following chapter builds on this ar-
gument, demonstrating how these shared interests developed among disparate firms
in the European economy.
5.2 The Parliament as an environmental actor
Chapter 4 argued that the policy choices made in the Third Climate and Energy Pack-
age (henceforth, the Package) shared both a political and a technical logic. Techni-
cally, they constituted a approach to a low-emissions energy systems transformation
in Europe. However, European policymakers faced multiple potential pathways to
that transformation. Hence technical demands therefore weren’t enough to explain
why European policymakers chose what instruments they did. Instead, I argued that
these choices reflected a specific political logic that sought to yoke long-term action
on emissions to short-term material gains for important industrial constituencies. By
solving pre-existing problems in the European energy system–such as energy secu-
rity or economic competitiveness in emerging industries–European policy could help
136

secure industrial support for environmental actions that were otherwise politically
unpalatable.
This argument locates the politics of European climate policy in the Commission
itself, and in the Commission’s attempt to craft a strategy that was both technically
plausible and politically viable. But that leaves out the subsequent political process
involved in actually passing legislation into law. This omission raises the question of
whether this technocratic logic actually underpins European climate policy. Did the
Commission’s preferred policy design, expressed in its series of papers on European
energy strategy, actually translate into law? Or are the distributional and techni-
cal outcomes discussed in chapter 4 the result of a more pedestrian process political
bargaining, log-rolling, and rent-seeking among varied interests in the course of the
legislative process?
This question is particularly important in the EU given the strong role tradition-
ally played by the European Parliament in shaping environmental policy. Despite an
array of institutional weaknesses, the Parliament has a strong reputation as an en-
vironmental policy advocate. Parliament has typically had a well-represented and
organized environmental coalition, including the European Green Party Alliance and
the center-left Progressive Alliance of Socialists and Democrats. Environmental pol-
icy also faces fewer restrictions on Parliamentary authority than the historically more
significant domains of finance, tax, or trade policy. These factors contributed to the
Parliament’s relative success in both shaping European environmental policy out-
comes and setting the European environmental policy agenda (Burns, 2005; Burns
and Carter, 2010), though recent European expansion and constitutional reform may
have muted this influence somewhat (Burns et al., 2012).
Hence the question of Parliamentary influence over European climate policy ad-
dresses two major elements of the argument introduced in chapters 1-4: first, did
137

the technocratic logic of systems transformation truly shape European climate policy;
and second, did environmental interests matter in passing and sustaining Europe’s
climate policy suite? The latter question is particularly salient given the European
Green Party Alliance’s very strong skepticism of the kind of technocratic solution
proposed by the Commission. This is most obvious in the European Green Party Al-
liance’s 2009 manifesto on green growth (European Greens Party, 2009; Schepelmann
et al., 2009). There, the Greens display a policy stance skeptical of price-based means
of environmental regulation, favorable towards command-and-control mechanisms
for forcing environmental improvement, and less tolerant of accommodating the ad-
justment costs of legacy fossil fuel sectors. Yet the Commission’s preferred policy
design favored an emissions price, rejected top-down technological mandates, and
provided numerous accommodations to legacy economic and energy interests.
Hence the pattern of influence on legislative outcomes reveals a great deal about
the genesis of European climate and energy policy. A policy framework substantially
shaped by the Parliament would point towards a politics that bore greater influence
from raw politics and environmental interests. In contrast, a politics shaped largely
by the Commission would point towards industrial policy, as reflected in chapter 6.
5.3 Moving policy forward: the uninformative vote
This background leads to an acute political question: does the record of policy for-
mation reflect a specific intent to design and implement the policy suite at the heart
of the Package? It’s one thing for the Commission to introduce a synthetic pack-
age of reforms; but quite another for those reforms to survive the legislative process
unscathed. Hence to what degree did the Parliament, given its environmental cre-
dentials, influence the ultimate legislative outcome? Did that outcome depend on the
support and advocacy of environmental interests in the Parliament? Were those inter-
138

ests in favor of the policy strategy proposed by the Commission? Or did they attempt
to restructure that strategy to better reflect their environmental policy priorities?
Traditional measures of Parliamentary interests, influence, and alignment offer lit-
tle traction on these questions. Roll-call and plenary voting have been used success-
fully to identify broad patterns of European policy cleavage and political contestation
(Hix et al., 2006). But in this specific case, voting is uninformative. Each of the ma-
jor bills in the Third Climate and Energy Package passed by a minimum of 87% Yea
votes.1 Furthermore, those Parliamentarians who voted Nay fell largely into two
specific groups: Euroskeptics opposed to EU policy in general; and those opposed to
the entire policy package because (1) it was insufficiently ambitious and (2) it made
use of the “fast track” negotiation procedures to, in the view of some MEPs, usurp
Parliamentary authority. To the extent that these MEPs are accurately representing
their positions, their disagreements with the bill had little to do with specific policy
proposals, and much to do with larger issues at stake in European politics and the
relationship between European institutions.
5.4 An alternative approach: tracking legislative
influence through text
If votes provide little traction on how and where the Parliament and Commission dis-
agreed, or what influence Parliament did or did not wield over policy choices, then
we need to turn to the minutiae of the legislative process itself. Attributing the out-
comes of the 2008 climate and energy policy reforms to the technocratic Commission
versus the more political and environmental Parliament requires understanding who
wrote what components of each policy domain; and where and how different legislative
1Votes were as follows: 2007 Internal Market Directive, 588 to 81 (87%); 2007 Renewable EnergyDirective, 635 to 25, (96%); 2007 Emissions Trading Scheme reforms, 610 to 60 (91%).
139

actors succeeded or failed in authoring specific legislative language. Establishing this
pattern of legislative behavior can provides insight into whether and how the Parlia-
ment wanted to, and succeeded at, changing the Commission’s policy proposals.
Measuring these processes poses some difficulty. Documentation of the legislative
process itself is readily available–in the form of individual bills, committee reports,
and legislative proposals. But the European Parliament publishes no standardized
concordance that links each element of a final piece of legislation to its origin in these
sources. Hence determining who–the Commission the Parliament, or the Council–
wrote any given piece of legislative language normally requires very labor-intensive
efforts to trace each legislative component back to its origins.
I propose a different approach to this tracing that promises both more efficiency
and a the potential to generate new insights into legislative processes. Section 5.8
provides a technical overview of this approach, which Huberty and Sanders (2012)
deals with in complete detail. Here, I provide an overview of the methodological
approach and its innovations before presenting results in section 5.5. To foreshadow
those results, I show that the Parliament attempted, but consistently failed, to push a
more environmentally-focused agenda for the the Package. This was consistent with
the preferences of the European Greens in particular, who were at the time developing
proposals for policy less tolerant of legacy energy interests, more favorable towards
alternative energy, more aggressive in its approach to regulatory reform, and more
stringent in the requirements placed on member states.(Schepelmann et al., 2009).
Hence Parliamentary preferences were, on balance, not necessarily aligned with the
Commission’s choices focus on using industrial policy to promote issue linkage. By
implication, the focus on green parties and environmental interests as agents of Eu-
ropean climate policy success must contend with their relative failure to influence
policy in this case, and the departure of European policy from some of the Greens’
140
stated policy agenda.
5.4.1 Methodological overview
Quantifying legislative influence requires identifying which legislative actor wrote
each section of a final piece of legislation. This measurements point directly to the
question of whether and where the European Parliament attempted to modify the
Commission’s technocratic policy design, and where and how they succeeded in do-
ing so. Earlier studies have traced these patterns of legislative influence through
careful hand-matching of legislative precursors, for whom the authors are known, to
the final bill, where authors are anonymous. However, this process is laborious, hard
to scale, and difficult to replicate.
Treating this problem as analogous to plagiarism opens up ways to improve on this
process. The authorship of each legislative proposal–the original legislative drafts
and amendments–is clear. A final bill is nothing more than a collection of these
sources. By implication, final legislation is, effectively, a compilation of direct quo-
tations, without attribution, of some earlier piece of legislative language. Tracing
legislative history and influence is therefore a matter of uncovering the pattern of
plagiarism that resulted in a final bill.
This insight permits the use of well-understood tools from computational plagia-
rism detection and document retrieval to aid the construction of a legislative history.
Using these tools to help recover the authorship of each component of a final bill per-
mits more regularized, repeatable, and efficient summary of who authored which sec-
tions of a piece of legislation. For contested areas of legislation, this measure points to
who ultimately succeeded in inserting their preferred policy language into the statute.
Completing this analysis requires identifying not just which actors wrote what
components of a final bill, but also how those components grouped into common
141

policy areas. Doing so permits a detailed consideration of which actors exercised in-
fluence over what policy domains, and at what point in the legislative process. For
this purpose, the methods here employ computational topic modeling to discover
the policy domains from the text of the legislative corpus itself. To do so, I employ
Latent Dirichlet Allocation and similar models (Blei et al., 2003) to recover the pol-
icy structure of legislation from the legislative text. Assigning each section of a bill
both an author, from the plagiarism analysis, and a policy domain, enables the quan-
tification of which policy actor influenced what policy domains, and to what degree.
Figure 5.7 provides a schematic explanation of how data flows through both the topic
models and plagiarism tools to identify legislative influence by authorship and policy
domain.
5.5 Reforming the ETS: legislative outcomes and
Parliamentary influence
This methodological approach permits a straightforward analysis of which legisla-
tive actors affected which policy domains, and to what degree, in each of the three
major bills in the 2008 European Union climate and energy legislation. Together with
the Commission’s own statements in the legislative record, the results strongly sug-
gest that the Commission intended the package to be treated as an integrated whole,
and for the core policy instruments to function as complementary to one another.
The Commission subsequently protected both the package integration and policy
complementarity successfully. Parliament did exercise some influence over the fi-
nal legislative outcomes, but was most successful in policy domains ancillary to the
core configuration of policy instruments and goals. Qualitative evidence from the
legislative record corroborates this quantitative evidence. These results suggest that
142

the distributional consequences of the Package documented in chapter 4 were clearly
understood by the major legislative actors, and represent an attempt to use the in-
struments of climate policy to generate political support grounded in the material
benefits generated by the policy regime.
5.5.1 The 2008 ETS Reforms: strengthening industry protections
and expanding scope
The 2008 ETS reforms constituted a package of amendments to the original 2003 Emis-
sions Trading Scheme legislation. These amendments addressed six broad substan-
tive areas of the ETS framework:
1. Updates to sectoral emissions accounting rules, including the expansion of cov-
ered sectors to include aviation and broader exceptions for carbon leakage. Avi-
ation was later covered in complete detail under Directive 2008/1010/EC.
2. A move to the use of auctioned rather than freely allocated emissions permits,
to reduce the perceived windfall profits resulting from free allocation.
3. Exceptions to auctioning for trade-exposed sectors, as an implicit subsidy for
sectors prone to so-called “carbon leakage”
4. Changes to the administrative functioning of the emissions markets
5. More elaborate rules governing emissions accounting for biomass fuels and car-
bon sequestration projects
6. More elaborate rules governing emissions accounting for electricity production
that included co-generation technologies2
2Co-generation refers to a class of electricity generation plants that generate both steam heat andelectricity. By combining both functions, these plants are usually significantly more efficient–up 100%more–than other forms of thermal generation.
143
7. New rules requiring the use of some revenues from emissions permit auctioning
to fund research and development in low-emissions technologies
Figure 5.2 summarizes the authorship of the final ETS reform bill by legislative
actor and policy domain. Table 5.1 provides an alternative view of the data presented
in that figure. Both views make clear that the Commission retained primary influence
over most of the policy domains in the final bill. Parliament proposed amendments
to nearly every substantive policy domain, as figure 5.1 makes clear, most of that
language went unadopted. Instead, the Parliament exercised primary influence over
only a few policy domains, including:
• Domain 1, on installation-level emissions equivalency
• Domain 6
• Domain 16, on the treatment of combined heat and power facilities under the
ETS
• Domain 23, on the allocation of revenues from ETS permit auctioning
• Domain 28, on procedural auditing
Further context puts this influence in greater relief. In particular, the Parliament’s
success at allocating some emissions auctioning revenues to fund renewable energy
and energy efficiency technology is attenuated by two realities. First, the bill contains
no requirement that those revenues go above and beyond existing commitments; and
hence these revenues will likely substitute for, rather than complement, states’ ex-
isting investment. Second, those revenues will be late in coming in any case, since
mandatory auctioning does not go into effect until 2027.
The final ETS bill reflected, instead, a negotiated compromise between the Parlia-
ment and Council that followed on Parliament’s First Reading. The major points of
compromise included:144
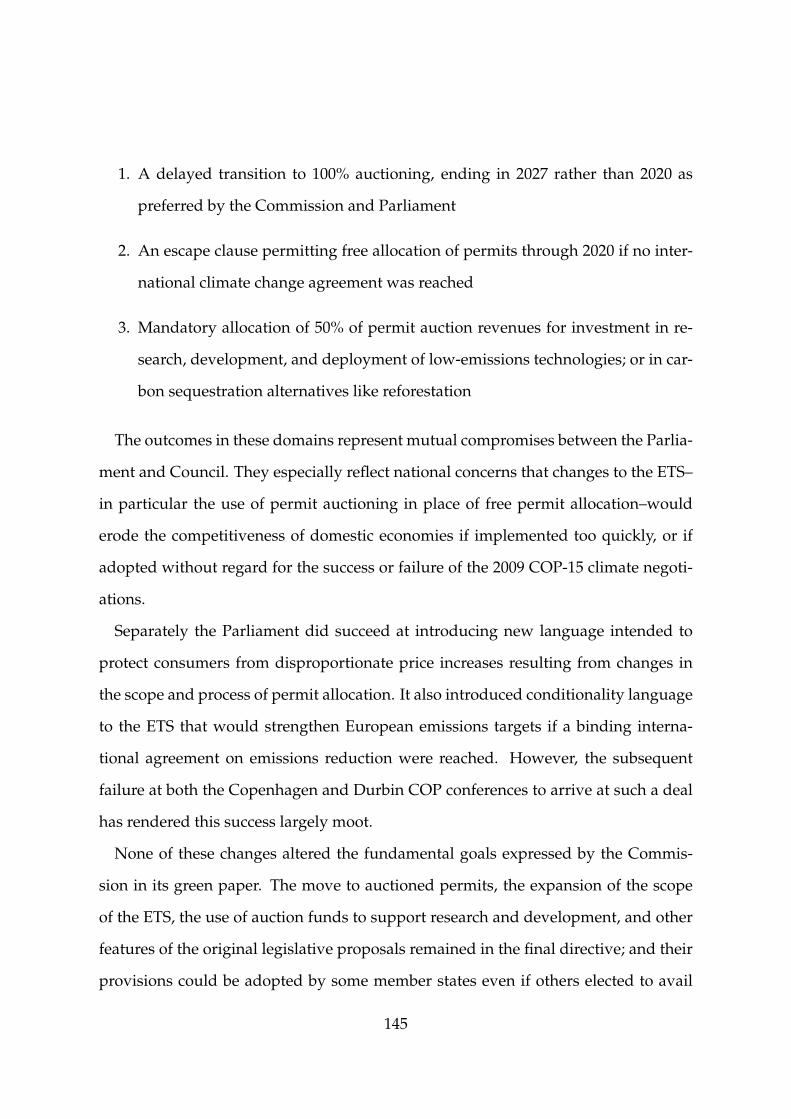
1. A delayed transition to 100% auctioning, ending in 2027 rather than 2020 as
preferred by the Commission and Parliament
2. An escape clause permitting free allocation of permits through 2020 if no inter-
national climate change agreement was reached
3. Mandatory allocation of 50% of permit auction revenues for investment in re-
search, development, and deployment of low-emissions technologies; or in car-
bon sequestration alternatives like reforestation
The outcomes in these domains represent mutual compromises between the Parlia-
ment and Council. They especially reflect national concerns that changes to the ETS–
in particular the use of permit auctioning in place of free permit allocation–would
erode the competitiveness of domestic economies if implemented too quickly, or if
adopted without regard for the success or failure of the 2009 COP-15 climate negoti-
ations.
Separately the Parliament did succeed at introducing new language intended to
protect consumers from disproportionate price increases resulting from changes in
the scope and process of permit allocation. It also introduced conditionality language
to the ETS that would strengthen European emissions targets if a binding interna-
tional agreement on emissions reduction were reached. However, the subsequent
failure at both the Copenhagen and Durbin COP conferences to arrive at such a deal
has rendered this success largely moot.
None of these changes altered the fundamental goals expressed by the Commis-
sion in its green paper. The move to auctioned permits, the expansion of the scope
of the ETS, the use of auction funds to support research and development, and other
features of the original legislative proposals remained in the final directive; and their
provisions could be adopted by some member states even if others elected to avail
145

themselves of extended implementation periods. Finally, while the Parliament had
published amendments in its First Reading Report aimed at extending the ETS re-
forms to accomplish other ends–notably the promotion of renewable energy–those
amendments were rejected in the final compromise with the Council. That com-
promise, moreover, was endorsed by the Commission with reference to its broader
legislative goals. In its response to the text of the compromise position, the Commis-
sion (The European Commission, 2008a) specifically noted that the amendments con-
tained therein are “acceptable to the Commission in the context of an overall agree-
ment on the climate and energy package.”
The 2008 reform of the Emissions Trading Scheme thus preserved its role as both
a weak price instrument for emissions control, and a mechanism of fiscal transfer
among the member states. Over the long term, the shift from free allocation of per-
mits to auctioning, and the tightening of the permit volume, should reduce some of
the rent seeking that took place prior to 2008. But the carve-outs for eastern Europe,
energy-intensive industries, and other important economic constituents points to the
ongoing role played by the ETS in buffering the distributive consequences of Europe’s
move to low-emissions energy. The rejection of Parliamentary attempts to make the
ETS a stronger environmental instrument point to the limits of emissions pricing as
a politically-sustainable environmental policy instrument. Instead, the Commission
looked elsewhere for instruments to improve energy efficiency, reform energy mar-
kets, and foster the adoption of renewable energy.
146

Commission Parliament 1st Reading
accreditation.reports.verification.decision.evaluationactivities.report.accordance.allowances.installation
administrative.expenditure.registry.amount.referenceallowances.quantity.period.emissions.installations
authority.competent.operator.cancelled.referredcarbon.dioxide.production.exceeding.installationscarbon.sectors.leakage.international.subsectors
climate.change.agreement.international.communitycommunity.appropriate.sectors.scheme.change
community.emissions.scheme.projects.allowancescommunity.scheme.allowances.emissions.distributedcountries.community.agreement.credits.international
electricity.heat.production.allocation.respectemissions.emission.trading.countries.greenhouse
emissions.monitoring.reporting.gases.listedenergy.auctioning.climate.revenues.change
equivalent.emissions.measures.installation.carbonfinancial.resources.total.countries.appropriations
free.allocation.measures.charge.allowancesgas.greenhouse.community.emissions.installation
information.emissions.competent.requirements.authoritiesinstallation.allowances.operator.production.waste
market.report.appropriate.european.proposalsmeasures.agreement.industries.international.consumer
operators.period.community.scheme.projectplan.allocation.national.period.application
production.allocation.emissions.greenhouse.electricityprojects.storage.allowances.geological.capture
provisions.force.apply.referred.europeanreferred.accordance.measures.adopted.procedurereferred.installations.accordance.account.respect
sector.market.concerned.sectors.subsector
0 10 20 30 0 10 20 30Amendment count
Topi
c
Amendment status
Accepted
Total
Figure 5.1: Record of proposed and accepted amendments from the Commission andParliament during the legislative process for Emissions Trading reformsin the Third Climate and Energy Package. Counts refer to bill sections,nominally paragraphs, rather than complete amendments. Topics derivedfrom Latent Dirichlet Allocation as applied to the entire set of potentialand actual bill sections.
147

financial.resources.total.countries.appropriationscarbon.sectors.leakage.international.subsectors
production.allocation.emissions.greenhouse.electricitycarbon.dioxide.production.exceeding.installations
countries.community.agreement.credits.internationalenergy.auctioning.climate.revenues.change
allowances.quantity.period.emissions.installationssector.market.concerned.sectors.subsector
electricity.heat.production.allocation.respectequivalent.emissions.measures.installation.carbongas.greenhouse.community.emissions.installation
emissions.monitoring.reporting.gases.listedoperators.period.community.scheme.project
administrative.expenditure.registry.amount.referenceemissions.emission.trading.countries.greenhouse
referred.accordance.measures.adopted.procedureauthority.competent.operator.cancelled.referred
market.report.appropriate.european.proposalscommunity.scheme.allowances.emissions.distributed
climate.change.agreement.international.communitymeasures.agreement.industries.international.consumer
free.allocation.measures.charge.allowancesplan.allocation.national.period.application
activities.report.accordance.allowances.installationaccreditation.reports.verification.decision.evaluation
provisions.force.apply.referred.europeanprojects.storage.allowances.geological.capture
community.appropriate.sectors.scheme.changecommunity.emissions.scheme.projects.allowances
installation.allowances.operator.production.wastereferred.installations.accordance.account.respect
information.emissions.competent.requirements.authorities
Com
mission
Council / C
o−decision
Original bill
Parliam
ent
Policy actor
Pol
icy
dom
ain
Influence on final bill
0.0
0.2
0.4
0.6
0.8
1.0
Figure 5.2: Contributions to the 2008 Emissions Trading Scheme directive by legisla-tive actor. Contributions attributed to the “Final” outcome reflect addi-tions to the approved legislation not attributable to identified legislativeactors. These reflect in particular compromises undertaken at the behestof the Council. Topics derived from Latent Dirichlet Allocation as appliedto the entire set of potential and actual bill sections. See figure 5.7 for aschematic explanation of how these data are generated.
148
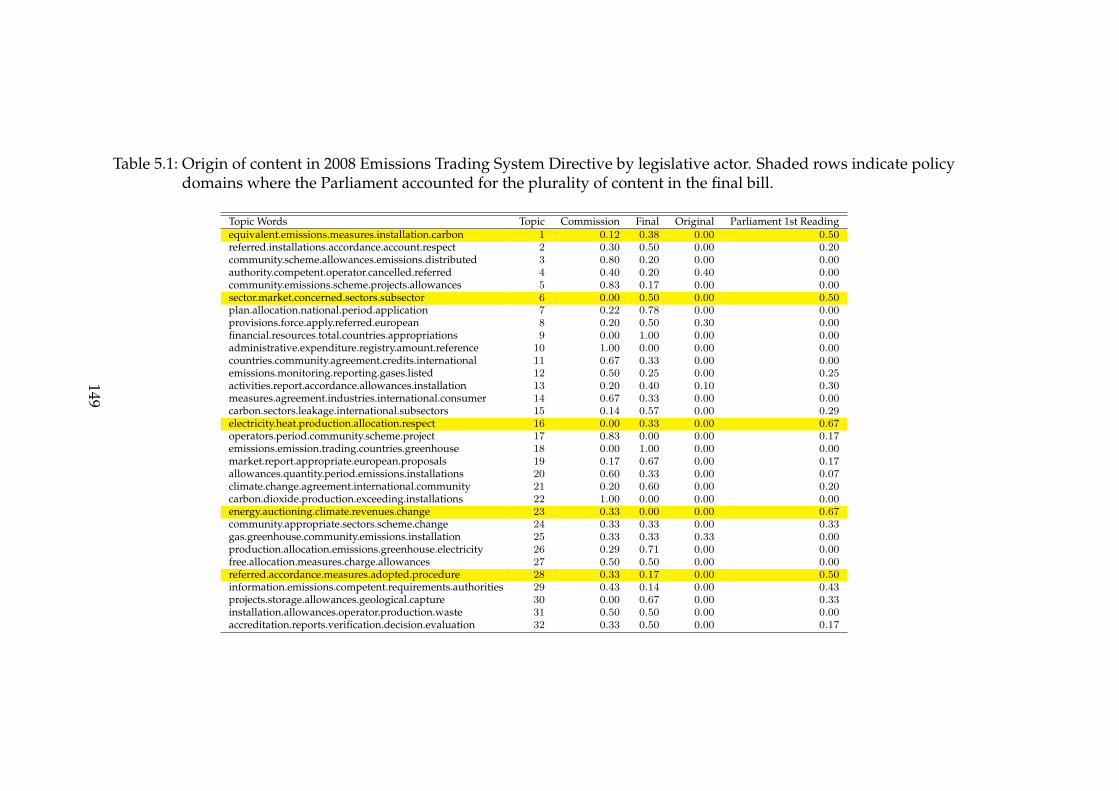
Table 5.1: Origin of content in 2008 Emissions Trading System Directive by legislative actor. Shaded rows indicate policydomains where the Parliament accounted for the plurality of content in the final bill.
Topic Words Topic Commission Final Original Parliament 1st Readingequivalent.emissions.measures.installation.carbon 1 0.12 0.38 0.00 0.50referred.installations.accordance.account.respect 2 0.30 0.50 0.00 0.20community.scheme.allowances.emissions.distributed 3 0.80 0.20 0.00 0.00authority.competent.operator.cancelled.referred 4 0.40 0.20 0.40 0.00community.emissions.scheme.projects.allowances 5 0.83 0.17 0.00 0.00sector.market.concerned.sectors.subsector 6 0.00 0.50 0.00 0.50plan.allocation.national.period.application 7 0.22 0.78 0.00 0.00provisions.force.apply.referred.european 8 0.20 0.50 0.30 0.00financial.resources.total.countries.appropriations 9 0.00 1.00 0.00 0.00administrative.expenditure.registry.amount.reference 10 1.00 0.00 0.00 0.00countries.community.agreement.credits.international 11 0.67 0.33 0.00 0.00emissions.monitoring.reporting.gases.listed 12 0.50 0.25 0.00 0.25activities.report.accordance.allowances.installation 13 0.20 0.40 0.10 0.30measures.agreement.industries.international.consumer 14 0.67 0.33 0.00 0.00carbon.sectors.leakage.international.subsectors 15 0.14 0.57 0.00 0.29electricity.heat.production.allocation.respect 16 0.00 0.33 0.00 0.67operators.period.community.scheme.project 17 0.83 0.00 0.00 0.17emissions.emission.trading.countries.greenhouse 18 0.00 1.00 0.00 0.00market.report.appropriate.european.proposals 19 0.17 0.67 0.00 0.17allowances.quantity.period.emissions.installations 20 0.60 0.33 0.00 0.07climate.change.agreement.international.community 21 0.20 0.60 0.00 0.20carbon.dioxide.production.exceeding.installations 22 1.00 0.00 0.00 0.00energy.auctioning.climate.revenues.change 23 0.33 0.00 0.00 0.67community.appropriate.sectors.scheme.change 24 0.33 0.33 0.00 0.33gas.greenhouse.community.emissions.installation 25 0.33 0.33 0.33 0.00production.allocation.emissions.greenhouse.electricity 26 0.29 0.71 0.00 0.00free.allocation.measures.charge.allowances 27 0.50 0.50 0.00 0.00referred.accordance.measures.adopted.procedure 28 0.33 0.17 0.00 0.50information.emissions.competent.requirements.authorities 29 0.43 0.14 0.00 0.43projects.storage.allowances.geological.capture 30 0.00 0.67 0.00 0.33installation.allowances.operator.production.waste 31 0.50 0.50 0.00 0.00accreditation.reports.verification.decision.evaluation 32 0.33 0.50 0.00 0.17
149
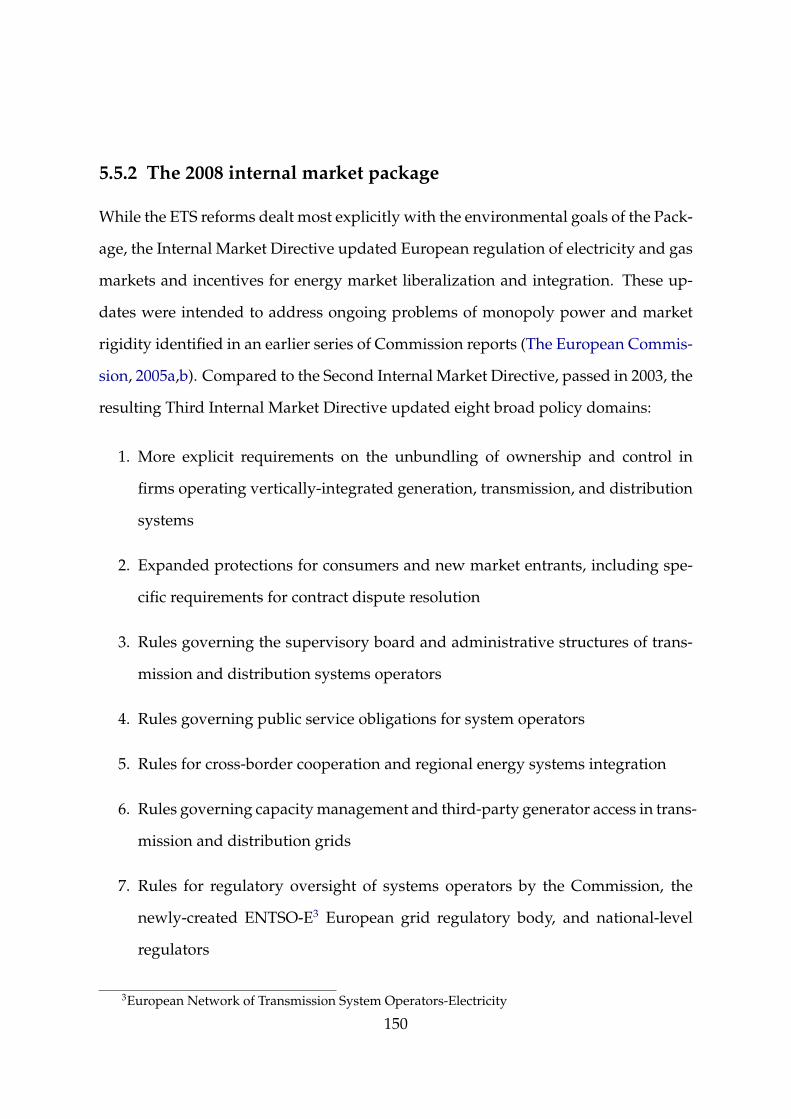
5.5.2 The 2008 internal market package
While the ETS reforms dealt most explicitly with the environmental goals of the Pack-
age, the Internal Market Directive updated European regulation of electricity and gas
markets and incentives for energy market liberalization and integration. These up-
dates were intended to address ongoing problems of monopoly power and market
rigidity identified in an earlier series of Commission reports (The European Commis-
sion, 2005a,b). Compared to the Second Internal Market Directive, passed in 2003, the
resulting Third Internal Market Directive updated eight broad policy domains:
1. More explicit requirements on the unbundling of ownership and control in
firms operating vertically-integrated generation, transmission, and distribution
systems
2. Expanded protections for consumers and new market entrants, including spe-
cific requirements for contract dispute resolution
3. Rules governing the supervisory board and administrative structures of trans-
mission and distribution systems operators
4. Rules governing public service obligations for system operators
5. Rules for cross-border cooperation and regional energy systems integration
6. Rules governing capacity management and third-party generator access in trans-
mission and distribution grids
7. Rules for regulatory oversight of systems operators by the Commission, the
newly-created ENTSO-E3 European grid regulatory body, and national-level
regulators
3European Network of Transmission System Operators-Electricity
150

8. Rules governing system operator responsibilities and rights with respect to power
system management and access restrictions
Within these changes, Parliament contested two outcomes in particular. First, the
Commission draft permitted member states flexibility in choosing how to unbun-
dle their vertically-integrated national energy utilities. Under the Commission’s lan-
guage, unbundling could occur formally, by breaking up and selling off such firms’
generation, transmission, and distribution assets; or administratively, by separating
a firm’s assets and management structures under an umbrella holding company. In
doing so, the Commission permitted firms and member states substantial flexibility
to determine how best to police the market power of legacy public utility monopolies.
The Parliament preferred a more aggressive solution to policing monopoly power,
fearing that the Commission’s approach was too weak to achieve Europe’s environ-
mental goals. By granting discretion to incumbents with strong incentives to fa-
vor their own (fully-depreciated) fossil fuel power sources, Parliament thought the
Commission proposal risked slowing the expansion of low-emissions energy. Conse-
quently, the Parliament introduced a series of amendments attempting to force phys-
ical breakup of legacy energy utilities. In its First Reading Report, these amendments
were justified as a cleaner solution that required less regulatory oversight; and as a
means of promoting new entrants into moribund national energy markets.
Both the Commission and the Council rejected this attempt. Instead, the final di-
rective emphasized regulatory responsibility and oversight of the maangement of
integrated companies, rather than the formal separation of ownership and control.
The data in table 5.2 makes this clear. The eventual resolution over the responsibil-
ities of boards of directors (domain 34) and management (domain 23) in integrated
companies, and the role of compliance officers in policing internal violations of le-
gal unbundling rules (domain 26) were written largely by the European Council. In
151

the Council, France in particular sought to minimize disruption to its national energy
utility, Electricitè de France–which, as it repeatedly argued, already generated most of
its electricity from emissions-free nuclear power. Germany also resisted the breakup
mandates, reflecting the desires of its large regional energy utilities and their large
industrial customers. The preference for a cleaner environmental solution lost out to
the demands of market incumbents.
Parliament also attempted to introduce language in its First Reading Report requir-
ing priority connection of renewable energy sources to the power grid, except in cases
where this would endanger systems stability. As with its unbundling amendments,
this would have made the Package more supportive of renewable energy in general,
and would have limited the ability of incumbent system operators to use their mar-
ket power to slow the transition to a low-emissions energy system. The Commission
was once again opposed to the Parliament’s proposals. However, in doing so they
signaled their understanding of the policy problem as one of synthetic policy change
within a package of reforms. In testimony before the Parliament, Energy Commis-
sioner Andre Piebalgs indicated that the Commission supported the objective, but
preferred that it be dealt with in the renewable energy legislation directly.(The Euro-
pean Parliament, 2008a)
The Parliament did succeed in shaping policy elsewhere, particularly in policy do-
mains not directly related to either the structure of energy markets or the promotion
of alternative energy. As figure 5.4 and table 5.2 shows, Parliament shaped much
of the content of policy for dispute resolution (domain 7), consumer protection (do-
main 17), regulatory compliance (domain 26) and network investment planning (do-
main 35). Those areas stand out from the suite of amendments introduced by the
Parliament to alter nearly every other facet of the Commission’s original legislative
proposal, as shown in figure 5.1.
152

Thus the Commission wrote, and retained influence over, the central reform of Eu-
rope’s internal energy market regulation: opening access to the power grid, expand-
ing cross-border integration of European energy markets, and focusing investment
on relieving energy security bottlenecks.4 The Parliament’s most significant contri-
butions came in not in these core areas, but instead in areas of consumer protection
and grid investment. Finally, in several instances, the Parliament and the Commis-
sion remained aligned on broader goals, even if the Commission opposed specific
amendments on the grounds that they belonged elsewhere in the integrated climate
and energy package.
4The Commission did not, however, secure guaranteed funding for infrastructure investments.Energy Commissioner Öttinger would later return to the Parliament with a proposal for ¤1 trillionof investment over the 2010-2020 period.(The European Commission, 2010c) However, that proposalcame amidst increasing chaos in European financial and monetary markets and was not prioritized bythe Member States at that time.
153
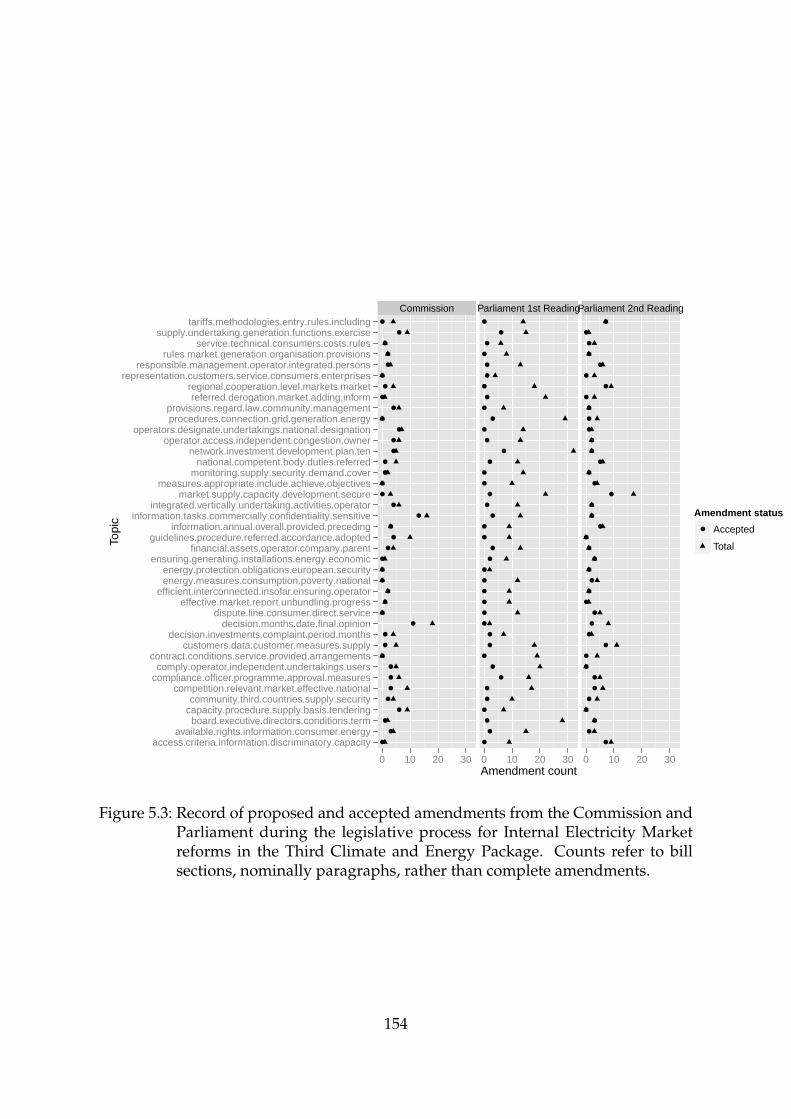
Commission Parliament 1st ReadingParliament 2nd Reading
access.criteria.information.discriminatory.capacityavailable.rights.information.consumer.energy
board.executive.directors.conditions.termcapacity.procedure.supply.basis.tenderingcommunity.third.countries.supply.security
competition.relevant.market.effective.nationalcompliance.officer.programme.approval.measurescomply.operator.independent.undertakings.users
contract.conditions.service.provided.arrangementscustomers.data.customer.measures.supply
decision.investments.complaint.period.monthsdecision.months.date.final.opinion
dispute.line.consumer.direct.serviceeffective.market.report.unbundling.progress
efficient.interconnected.insofar.ensuring.operatorenergy.measures.consumption.poverty.nationalenergy.protection.obligations.european.security
ensuring.generating.installations.energy.economicfinancial.assets.operator.company.parent
guidelines.procedure.referred.accordance.adoptedinformation.annual.overall.provided.preceding
information.tasks.commercially.confidentiality.sensitiveintegrated.vertically.undertaking.activities.operator
market.supply.capacity.development.securemeasures.appropriate.include.achieve.objectives
monitoring.supply.security.demand.covernational.competent.body.duties.referred
network.investment.development.plan.tenoperator.access.independent.congestion.owner
operators.designate.undertakings.national.designationprocedures.connection.grid.generation.energyprovisions.regard.law.community.management
referred.derogation.market.adding.informregional.cooperation.level.markets.market
representation.customers.service.consumers.enterprisesresponsible.management.operator.integrated.persons
rules.market.generation.organisation.provisionsservice.technical.consumers.costs.rules
supply.undertaking.generation.functions.exercisetariffs.methodologies.entry.rules.including
0 10 20 30 0 10 20 30 0 10 20 30Amendment count
Topi
c
Amendment status
Accepted
Total
Figure 5.3: Record of proposed and accepted amendments from the Commission andParliament during the legislative process for Internal Electricity Marketreforms in the Third Climate and Energy Package. Counts refer to billsections, nominally paragraphs, rather than complete amendments.
154
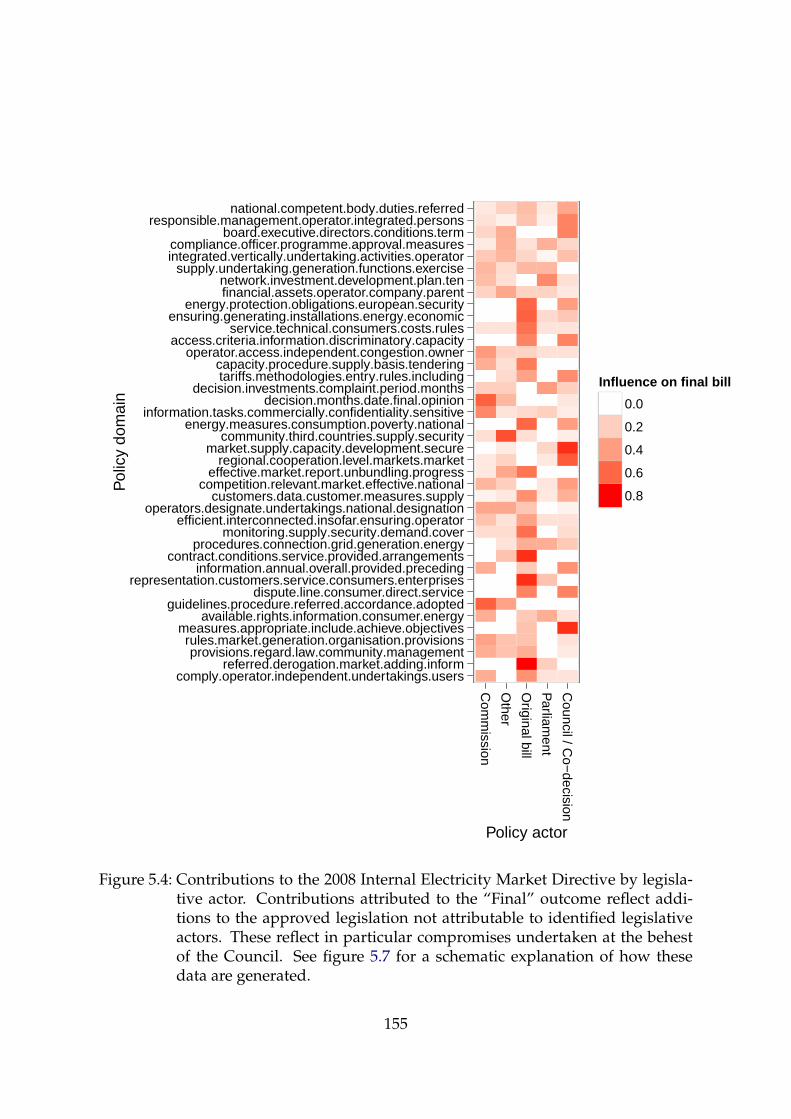
comply.operator.independent.undertakings.usersreferred.derogation.market.adding.inform
provisions.regard.law.community.managementrules.market.generation.organisation.provisions
measures.appropriate.include.achieve.objectivesavailable.rights.information.consumer.energy
guidelines.procedure.referred.accordance.adopteddispute.line.consumer.direct.service
representation.customers.service.consumers.enterprisesinformation.annual.overall.provided.preceding
contract.conditions.service.provided.arrangementsprocedures.connection.grid.generation.energy
monitoring.supply.security.demand.coverefficient.interconnected.insofar.ensuring.operator
operators.designate.undertakings.national.designationcustomers.data.customer.measures.supply
competition.relevant.market.effective.nationaleffective.market.report.unbundling.progress
regional.cooperation.level.markets.marketmarket.supply.capacity.development.secure
community.third.countries.supply.securityenergy.measures.consumption.poverty.national
information.tasks.commercially.confidentiality.sensitivedecision.months.date.final.opinion
decision.investments.complaint.period.monthstariffs.methodologies.entry.rules.includingcapacity.procedure.supply.basis.tendering
operator.access.independent.congestion.owneraccess.criteria.information.discriminatory.capacity
service.technical.consumers.costs.rulesensuring.generating.installations.energy.economic
energy.protection.obligations.european.securityfinancial.assets.operator.company.parentnetwork.investment.development.plan.ten
supply.undertaking.generation.functions.exerciseintegrated.vertically.undertaking.activities.operatorcompliance.officer.programme.approval.measures
board.executive.directors.conditions.termresponsible.management.operator.integrated.persons
national.competent.body.duties.referred
Com
mission
Other
Original bill
Parliam
ent
Council / C
o−decision
Policy actor
Pol
icy
dom
ain
Influence on final bill
0.0
0.2
0.4
0.6
0.8
Figure 5.4: Contributions to the 2008 Internal Electricity Market Directive by legisla-tive actor. Contributions attributed to the “Final” outcome reflect addi-tions to the approved legislation not attributable to identified legislativeactors. These reflect in particular compromises undertaken at the behestof the Council. See figure 5.7 for a schematic explanation of how thesedata are generated.
155
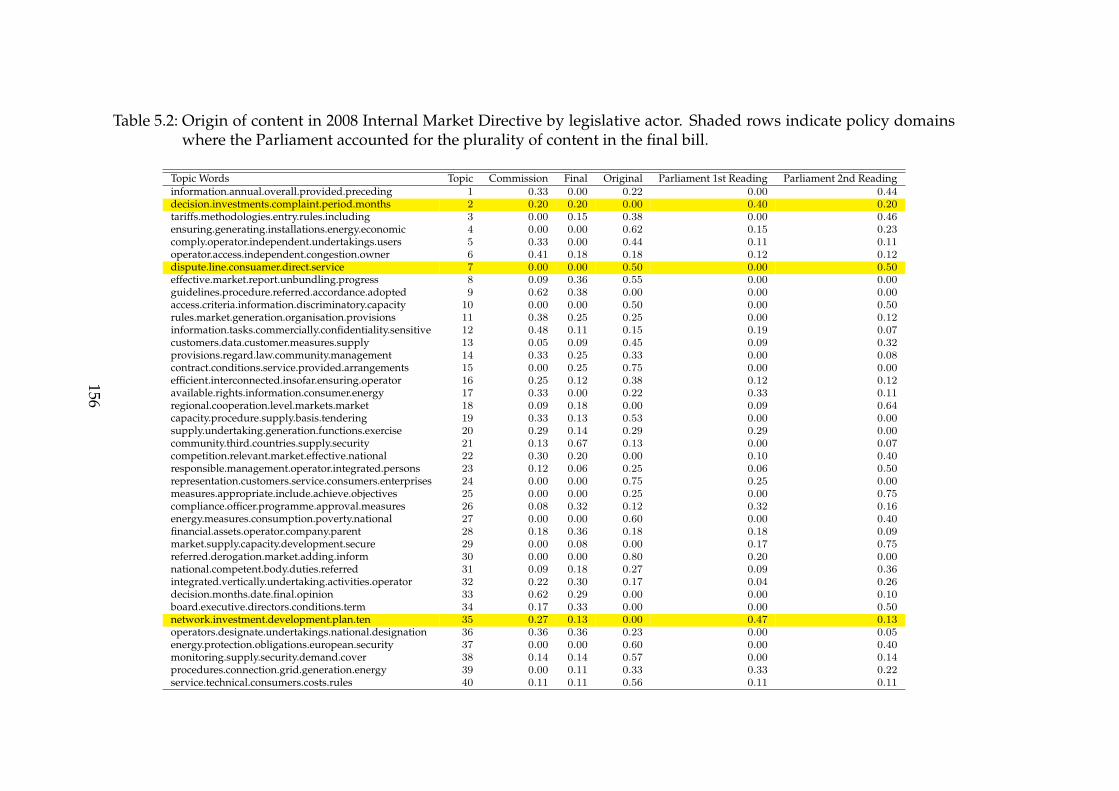
Table 5.2: Origin of content in 2008 Internal Market Directive by legislative actor. Shaded rows indicate policy domainswhere the Parliament accounted for the plurality of content in the final bill.
Topic Words Topic Commission Final Original Parliament 1st Reading Parliament 2nd Readinginformation.annual.overall.provided.preceding 1 0.33 0.00 0.22 0.00 0.44decision.investments.complaint.period.months 2 0.20 0.20 0.00 0.40 0.20tariffs.methodologies.entry.rules.including 3 0.00 0.15 0.38 0.00 0.46ensuring.generating.installations.energy.economic 4 0.00 0.00 0.62 0.15 0.23comply.operator.independent.undertakings.users 5 0.33 0.00 0.44 0.11 0.11operator.access.independent.congestion.owner 6 0.41 0.18 0.18 0.12 0.12dispute.line.consuamer.direct.service 7 0.00 0.00 0.50 0.00 0.50effective.market.report.unbundling.progress 8 0.09 0.36 0.55 0.00 0.00guidelines.procedure.referred.accordance.adopted 9 0.62 0.38 0.00 0.00 0.00access.criteria.information.discriminatory.capacity 10 0.00 0.00 0.50 0.00 0.50rules.market.generation.organisation.provisions 11 0.38 0.25 0.25 0.00 0.12information.tasks.commercially.confidentiality.sensitive 12 0.48 0.11 0.15 0.19 0.07customers.data.customer.measures.supply 13 0.05 0.09 0.45 0.09 0.32provisions.regard.law.community.management 14 0.33 0.25 0.33 0.00 0.08contract.conditions.service.provided.arrangements 15 0.00 0.25 0.75 0.00 0.00efficient.interconnected.insofar.ensuring.operator 16 0.25 0.12 0.38 0.12 0.12available.rights.information.consumer.energy 17 0.33 0.00 0.22 0.33 0.11regional.cooperation.level.markets.market 18 0.09 0.18 0.00 0.09 0.64capacity.procedure.supply.basis.tendering 19 0.33 0.13 0.53 0.00 0.00supply.undertaking.generation.functions.exercise 20 0.29 0.14 0.29 0.29 0.00community.third.countries.supply.security 21 0.13 0.67 0.13 0.00 0.07competition.relevant.market.effective.national 22 0.30 0.20 0.00 0.10 0.40responsible.management.operator.integrated.persons 23 0.12 0.06 0.25 0.06 0.50representation.customers.service.consumers.enterprises 24 0.00 0.00 0.75 0.25 0.00measures.appropriate.include.achieve.objectives 25 0.00 0.00 0.25 0.00 0.75compliance.officer.programme.approval.measures 26 0.08 0.32 0.12 0.32 0.16energy.measures.consumption.poverty.national 27 0.00 0.00 0.60 0.00 0.40financial.assets.operator.company.parent 28 0.18 0.36 0.18 0.18 0.09market.supply.capacity.development.secure 29 0.00 0.08 0.00 0.17 0.75referred.derogation.market.adding.inform 30 0.00 0.00 0.80 0.20 0.00national.competent.body.duties.referred 31 0.09 0.18 0.27 0.09 0.36integrated.vertically.undertaking.activities.operator 32 0.22 0.30 0.17 0.04 0.26decision.months.date.final.opinion 33 0.62 0.29 0.00 0.00 0.10board.executive.directors.conditions.term 34 0.17 0.33 0.00 0.00 0.50network.investment.development.plan.ten 35 0.27 0.13 0.00 0.47 0.13operators.designate.undertakings.national.designation 36 0.36 0.36 0.23 0.00 0.05energy.protection.obligations.european.security 37 0.00 0.00 0.60 0.00 0.40monitoring.supply.security.demand.cover 38 0.14 0.14 0.57 0.00 0.14procedures.connection.grid.generation.energy 39 0.00 0.11 0.33 0.33 0.22service.technical.consumers.costs.rules 40 0.11 0.11 0.56 0.11 0.11
156

5.5.3 The 2008 renewable energy mandates
Finally, the 2008 renewable energy reforms sought to resolve two specific problems
created by the prior renewable energy directive, passed in 2001: the lack of binding
targets for adoption, and the weak criteria for what counted as renewable energy.
To do so, the new directive mandated legally binding commitments to specific levels
of renewable energy adoption, backed by detailed national action plans specifying
how each member state would meet its obligations. Alongside these mandates, the
reforms strengthened the criteria for what counted as renewable energies, paying par-
ticular attention to the sustainability of biofuels and biofuel feedstocks. In pursuing
these changes, the Commission was quite clear that it had multiple goals in mind.
The 2007 Renewable Energy Roadmap (The European Commission, 2006b), which
formed an input to the eventual legislative proposal, articulated a specific vision of
renewable energy promotion as a program of both environmental and economic im-
provement:
In the complex picture of energy policy, the renewable energy sector is the
one energy sector which stands out in terms of ability to reduce green-
house gas emissions and pollution, exploit local and decentralized energy
sources, and stimulate world-class high-tech industries.
These three policy goals–emissions reduction, energy security, and competitiveness–
remain largely untouched as the Commission’s policy proposals progressed through
the subsequent legislative process.
Compared with the other two bills considered in this chapter, Parliament exercised
a particularly large degree of influence over the content of the renewable energy di-
rective. As figure 5.5, shows, Parliament proposed amendments in nearly every pol-
icy domain covered in the final bill. The final bill subsequently adopted many of
them, in the form of a compromise text negotiated by the Parliament and Council157

on the basis of the Parliament’s First Reading Report. As figure 5.6 and table 5.3
show, Parliament had substantial influence over biofuel sustainability criteria, the re-
quirements surrounding national renewable energy targets (though not the targets
themselves), grid access for renewable electricity, the impact of European renewable
energy demand on third countries, and the use of renewable energy in transport.
Despite this success, however, many of these represented second-best outcomes
for the Parliament. The First Reading Report clearly shows that the Parliament had
desired different outcomes in many respects. In particular, it had hoped to cap the
use of biofuels out of concern for their environmental damage; it wanted to grant
the Commission stronger regulatory oversight of national renewable energy action
plans; and it sought greater European-level authority over regulation of and invest-
ment in renewable energy access to the electrical grid. The Parliamentary rapporteur,
Claude Turmes of the Green Party in Luxembourg, expressed some regret that these
positions–and in particular the biofuels limits–did not make it into the final legisla-
tion (EurActiv, 2008).
5.6 The 3rd Climate and Energy Package and European
legislative politics
This analysis of the legislative process surrounding the 3rd Climate and Energy Pack-
age suggests specific intent by the Commission to craft an integrated approach to
energy systems transformation. At various points in the legislative process, the Com-
mission clearly expressed a view of its policy reforms as an integrated and comple-
mentary approach to restructuring Europe’s energy system and dealing with climate
change. For renewable energy policy in particular, the Commission made explicit the
link between investing in emissions reduction and improvements to energy security,
158
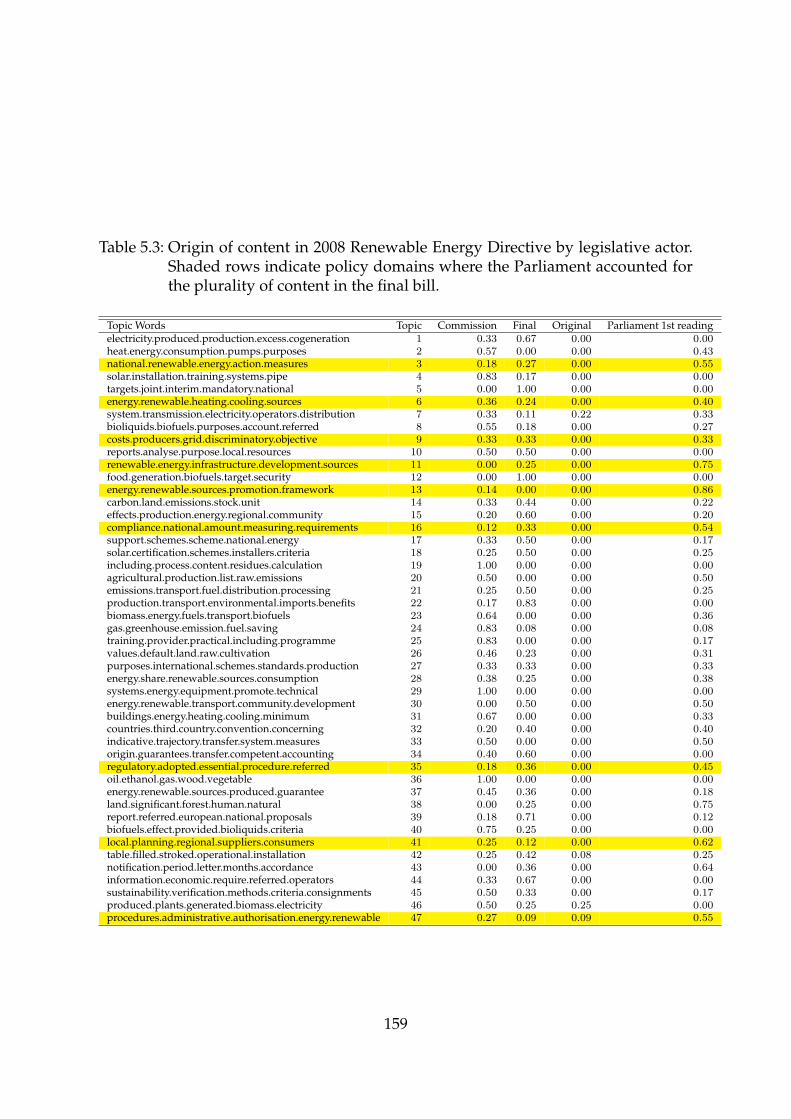
Table 5.3: Origin of content in 2008 Renewable Energy Directive by legislative actor.Shaded rows indicate policy domains where the Parliament accounted forthe plurality of content in the final bill.
Topic Words Topic Commission Final Original Parliament 1st readingelectricity.produced.production.excess.cogeneration 1 0.33 0.67 0.00 0.00heat.energy.consumption.pumps.purposes 2 0.57 0.00 0.00 0.43national.renewable.energy.action.measures 3 0.18 0.27 0.00 0.55solar.installation.training.systems.pipe 4 0.83 0.17 0.00 0.00targets.joint.interim.mandatory.national 5 0.00 1.00 0.00 0.00energy.renewable.heating.cooling.sources 6 0.36 0.24 0.00 0.40system.transmission.electricity.operators.distribution 7 0.33 0.11 0.22 0.33bioliquids.biofuels.purposes.account.referred 8 0.55 0.18 0.00 0.27costs.producers.grid.discriminatory.objective 9 0.33 0.33 0.00 0.33reports.analyse.purpose.local.resources 10 0.50 0.50 0.00 0.00renewable.energy.infrastructure.development.sources 11 0.00 0.25 0.00 0.75food.generation.biofuels.target.security 12 0.00 1.00 0.00 0.00energy.renewable.sources.promotion.framework 13 0.14 0.00 0.00 0.86carbon.land.emissions.stock.unit 14 0.33 0.44 0.00 0.22effects.production.energy.regional.community 15 0.20 0.60 0.00 0.20compliance.national.amount.measuring.requirements 16 0.12 0.33 0.00 0.54support.schemes.scheme.national.energy 17 0.33 0.50 0.00 0.17solar.certification.schemes.installers.criteria 18 0.25 0.50 0.00 0.25including.process.content.residues.calculation 19 1.00 0.00 0.00 0.00agricultural.production.list.raw.emissions 20 0.50 0.00 0.00 0.50emissions.transport.fuel.distribution.processing 21 0.25 0.50 0.00 0.25production.transport.environmental.imports.benefits 22 0.17 0.83 0.00 0.00biomass.energy.fuels.transport.biofuels 23 0.64 0.00 0.00 0.36gas.greenhouse.emission.fuel.saving 24 0.83 0.08 0.00 0.08training.provider.practical.including.programme 25 0.83 0.00 0.00 0.17values.default.land.raw.cultivation 26 0.46 0.23 0.00 0.31purposes.international.schemes.standards.production 27 0.33 0.33 0.00 0.33energy.share.renewable.sources.consumption 28 0.38 0.25 0.00 0.38systems.energy.equipment.promote.technical 29 1.00 0.00 0.00 0.00energy.renewable.transport.community.development 30 0.00 0.50 0.00 0.50buildings.energy.heating.cooling.minimum 31 0.67 0.00 0.00 0.33countries.third.country.convention.concerning 32 0.20 0.40 0.00 0.40indicative.trajectory.transfer.system.measures 33 0.50 0.00 0.00 0.50origin.guarantees.transfer.competent.accounting 34 0.40 0.60 0.00 0.00regulatory.adopted.essential.procedure.referred 35 0.18 0.36 0.00 0.45oil.ethanol.gas.wood.vegetable 36 1.00 0.00 0.00 0.00energy.renewable.sources.produced.guarantee 37 0.45 0.36 0.00 0.18land.significant.forest.human.natural 38 0.00 0.25 0.00 0.75report.referred.european.national.proposals 39 0.18 0.71 0.00 0.12biofuels.effect.provided.bioliquids.criteria 40 0.75 0.25 0.00 0.00local.planning.regional.suppliers.consumers 41 0.25 0.12 0.00 0.62table.filled.stroked.operational.installation 42 0.25 0.42 0.08 0.25notification.period.letter.months.accordance 43 0.00 0.36 0.00 0.64information.economic.require.referred.operators 44 0.33 0.67 0.00 0.00sustainability.verification.methods.criteria.consignments 45 0.50 0.33 0.00 0.17produced.plants.generated.biomass.electricity 46 0.50 0.25 0.25 0.00procedures.administrative.authorisation.energy.renewable 47 0.27 0.09 0.09 0.55
159

economic growth, technological innovation, and other near-term benefits.
Where Parliament attempted to alter that package to make European policy more
environmentally aggressive, less tolerant of legacy energy interests, or more nar-
rowly focused on climate change mitigation, it largely failed. Instead, apart from the
sovereignty concerns of the European Council, the Commission’s policy proposals–
and their industrial policy essence–largely came through unscathed.
This legislative record is particularly striking given the Parliament’s reputation as
a strong and often quite effective advocate for environmental issues. Parliament’s in-
fluence on many areas of policy–notably finance and taxation–had historically been
highly constrained by both institutional rules and member state prerogatives. But on
environmental issues, the Parliament had attained a reputation among observers as
an effective policy actor (Tsebelis, 1999; Burns, 2005). The co-decision procedure af-
forded the Parliament greater influence over environmental policy, which it exercised
to influence both individual pieces of legislation and longer-term European policy ob-
jectives.5 In practice, Parliament used its authority, sometimes in collusion with the
Commission, to push European policy on automobile emissions, chemical regulation,
international leadership, and other environmental issues.
A series of recent studies (Burns and Carter, 2010; Burns et al., 2012) have argued
that that Parliament’s environmental credentials may have weakened over time. Evi-
dence from the 6th European Parliament (2004-2009) points to a Parliament that sub-
mits fewer environmentally-ambitious amendments, and sees fewer of those amend-
ments adopted in final legislation. Possible explanations for this decline include a less
pliable European Council; more aggressive industrial lobbying of the Parliament; an
increased Parliamentary workload, leading to a reduced appetite for legislative con-
5Co-decision, which made the Parliament an institutional equal with the Council in its ability toamend and veto legislation, was introduced in the 1992 Maastricht Treaty. But the legislative domainsgoverned under co-decision remained narrowly constrained. The Treaty of Amsterdam, which wentinto effect in 1999, expanded co-decision to cover nearly all policy domains.
160

flicts with the Commission and Council; the enlargement of Europe to include less
environmentally-friendly central and eastern European states; and the declining in-
fluence of the center-left Party of European Socialists, who had supported environ-
mental issues more aggressively than their center-right counterparts the European
People’s Party.
While the evidence presented for the Third Climate and Energy package is broadly
consistent with declining “green” ambitions in the Parliament, it also points to a more
nuanced view of Parliament’s power to pass environmentally-ambitious amendments.
As we have seen, the Parliament did propose, in many cases, more aggressive legisla-
tive language on core climate and energy policy issues. In amendments proposed at
the First Reading stage, Parliament sought more stringent requirements for renew-
able energy adoption, less flexibility for energy market reforms, greater funds alloca-
tion to clean technology research and development, and stricter regulation of biofuels
and the effect of biofuels on food security.
The evidence presented here shows that those amendments were most successful
where they focused on environmental and consumer protection issues with limited
impact on the broader evolution of Europe’s energy system. Thus Parliament suc-
ceeded at securing better consumer protection in liberalized energy markets, stricter
definitions for sustainable biofuels, and the diversion of emissions permit auction
revenues to clean technology research and development.
But Parliament was less successful when its amendments touched more explicitly
on economic and industrial policy problems. Capping the use of biofuels had to give
way to regulating their impact. Mandating the formal breakup of national energy
monopolies gave way to a less aggressive compromise that permitted weaker admin-
istrative solutions to policing monopoly power. Mandated grid access for renewable
energy gave way to a requirement that countries publish clear and impartial rules
161

for all energy providers. In each case, reforms of economic and industrial policy that
would make it more environmentally aggressive ran into serious opposition from the
Council or the Commission.
Thus even though the Third Climate and Energy package constituted environmen-
tal policy broadly conceived, its content varied widely. Parliament’s effectiveness as
an environmental advocate varied with it. These results suggest an another possi-
ble explanation for the perceived decline in Parliament’s environmental influence.
Climate and energy policy presents one instance wherein broadening ambitions for
environmental policy bleed over into more traditional economic and industrial pol-
icy concerns. Where policy touches most directly on those concerns, Parliament ap-
pears to have less latitude to push environmentally-ambitious legislative language.
But where policy remains narrowly focused on environmental issues, Parliament ap-
pears to have retained its influence as an environmental advocate. In short, we may
be witnessing not a decline in Parliamentary environmental ambition, but instead the
collision of that ambition with the mixing of environmental and economic policy. Par-
liament’s environmental influence has waned where that mixing is most pronounced,
but persisted otherwise.
5.7 Conclusions: Systems transformation, legislative
politics, and the 3rd climate and energy package
This chapter has made three overarching arguments. First, building on the preceding
chapters, it argued that the structure of the Third Climate and Energy package consti-
tuted a coherent attempt to craft a technical and political strategy for a low-emissions
energy systems transformation. Second, it argued that the legislative record provides
strong evidence of that intent, and in particular the Commission’s success at pre-
162

venting the Parliament from altering the core priorities of the package as a whole.
Finally, it argued that these results pointed to a more nuanced view of the European
Parliament’s evolving role in environmental legislation: that the Parliament retains
influence on more narrowly environmental questions, but has performed less well
where broad legislative packages confront more explicitly economic or industrial pol-
icy questions.
These arguments align with the central propositions of chapters 3 and 4. The Com-
mission’s statements in its 2007 green paper on energy strategy (The European Com-
mission, 2007) reflect a view that effective climate change mitigation will require the
broader transformation of Europe’s energy systems. That goal poses both a technical
and a political problem: how to satisfy, or at least mollify, the multitude of compet-
ing industrial interests that would win or lose from a large-scale systems transfor-
mation, while accomplishing the tasks required for transformation itself. As chapter
6 showed, the structure of European industrial interests suggested an out. Linking
long-term progress on emissions to tasks that would deliver near-term returns to en-
ergy security, industrial competitiveness, or economic efficiency opened up the pos-
sibility for broader coalition-building, even among interests otherwise opposed on
long-term climate strategy.
The Third Climate and Energy Package put that view into practice in a multi-
instrument policy framework. As the Commission stated explicitly throughout the
legislative process, that framework intended for policy instruments to serve multiple
ends: emissions reduction, innovation, and competitiveness for renewable energy;
improved market efficiency and reduced barriers for new entrants via electricity mar-
ket liberalization; emissions control and protection of exposed heavy industry via the
Emissions Trading Scheme. Furthermore, while the package was submitted as a se-
ries of legislative proposals, the Commission stated repeatedly that the bills were
163

intended to operate together; and fought attempts to re-purpose one bill in service of
goals handled by policy proposals contained in another.
Finally, these outcomes suggest the utility of combining qualitative analysis of the
legislative record with novel computational approaches to understanding legislative
history. The tools presented here offer analysts the chance to make sense of large
volumes of legislative data, and to build new analyses on this data using tools from
computational text analysis. In this case, these tools suggested a more nuanced char-
acterization of Parliament’s changing influence on environmental policy outcomes in
the European Union. They also point to the need for greater attention to the diver-
sity of policy domains contained under a single legislative umbrella. These results
suggest the potential gains available from applying these and similar tools to larger
corpora of European legislation.
This chapter leaves open, however, the question of how the Commission managed
to craft its policy choices in the first place. The Commission’s success at linking en-
vironmental outcomes to industrial policy depends, as chapters 3-4 argued, on the
qualities of Europe’s legacy energy systems. It also assumes that the European eco-
nomic actors operating within that system held interests amenable to the linkage of
environmental goals to economic outcomes. The next chapter turns to this intersec-
tion of structure and interests, showing that the Commission could and did capitalize
on the opportunities Europe’s legacy energy system created for yoking support for
environmental outcomes to the realization of industrial benefits from systems trans-
formation.
5.8 Appendix: data and methodological approach
This appendix provides a more formal overview of the methods used to generate the
results discussed in section 5.5. For a complete discussion of the methods themselves,
164

see Huberty and Sanders (2012). For code implementing the workflow discussed
below, see https://github.com/markhuberty/leghist.
5.8.1 The need for methodological innovation in legislative analysis
As section 5.4 elaborated, establishing the fine-grained influence of legislative actors
on legislative outcomes is often confounded by the lack of a careful concordance be-
tween legislative proposals and legislative outcomes. Instead, amendments are voted
on and incorporated into the legislation without citation. Absent this detail, building
a detailed legislative history requires carefully tracing legislative content and com-
paring it to the record of proposed legislative language.
This form of manual tracing of legislative history is laborious, prone to error, and
difficult to scale. Tsebelis et al. (2001), for instance, code more than 5000 amendments
by hand to identify how the procedural setting of European legislation affects Par-
liamentary influence. The effort exerted here was impressive. Their coding scheme
identified both the success of the amendment (whether it was adopted or not) and
the degree of incorporation (on a scale from “modified” to “adopted verbatim”). But
5000 amendments ultimately only cover 231 bills over a 10-year period, for a Parlia-
ment that considered 108 regulations, decisions, or directives in 2011 alone.6 Scaling
manual methods to match the increased Parliamentary activity that has followed on
the Treaties of Amsterdam, Nice, and Lisbon thus poses challenges.
Computer-assisted textual analysis offers one potential solution. The central task
of establishing a detailed legislative history–matching final legislation to its origins
in the legislative record, and the actors who wrote it–can be treated as a problem of
document retrieval: given a corpus of texts, identify definite or likely duplicates or
overlaps within that corpus (Elmagarmid et al., 2007). Applications include email and
6Data taken from the published statistics of the European Parliament, at http://eur-lex.europa.eu/en/statistics/index.htm.
165

email attachment de-duplication for efficient storage. In this case, we face a specific
version of this problem, akin to plagiarism detection: given a document, identify
exact or partial duplicates of each section of that document given a corpus of possible
sources. Here the document is the final bill, and the sources are comprised of the
original bills, amendments, and other potential sources in the legislative process.
At present, however, no automated methods for studying legislative history are
known to exist. Some projects, such as the ManyBills project at IBM or the Lobby-
Plag project on Europe’s General Data Protection Regulation, have applied computer-
assisted tools to summarize legislation and improve access for non-specialists.7 But
these do not attempt to identify the origin or author of the components of finalized
legislation. They also focus on specific bills, rather than on general solutions that
might be applied to an entire legislative corpus.
To fill this gap, I propose computer-assisted, semi-automated methods for the anal-
ysis of legislative history. The methods proposed here assist analysts in an array of
tasks, including:
1. Identifying the origin of each section of a bill from set of potential amendments
and proposed legislation
2. Modeling the policy topics raised by the bills and amendments
3. Tabulating the rates of acceptance or rejection for content proposed by each leg-
islative actor
4. Identifying the emergence of new policy domains within a bill during the leg-
islative process
5. Identifying portions of the final bill with no clear origin, suggestive of the influ-
ence of negotiated outcomes or the influence of legislative actors with limited7On ManyBills, see http://manybills.researchlabs.ibm.com/. For LobbyPlag and its
ParlTrack companion, see http://lobbyplag.eu/#/compare/overview.
166

disclosure requirements
Formally, we may consider a piece of legislation as a document D composed of
I sections di. The legislative process begins with an initial bill D1, and concludes
with a successful bill D2. During the legislative process, J amendments aj ∈ AJ are
proposed by some set of legislative actors L, of which AK , 0 ≤ K ≤ J are adopted.
For D1, D2, and AJ , we assume that the sections d1,i, d2,i, and aj are all at the same
level of dis-aggregation. The analysis presented in this chapter assumes sections are
equivalent to paragraphs, consistent with the structure of proposed amendments in
the European Parliament. But the tools themselves are agnostic to the level of dis-
aggregation.
We consider three possible legislative processes, in increasing order of complexity.
For the simple case, the final bill is a verbatim combination of the proposed bill and
the proposed amendments. Every section of the final bill D2 was originally either a
section of D1 or an amendment. We can represent that process as a mapping function
f(·), such that D2 = f(D1, AJ). The challenge is to identify the sections of the original
bill and the amendments that comprise the final bill.
To find the origin of each section of the final bill, we can thus define a similar-
ity measure S to permit comparison between the final bill and its potential origins.
For simplicity, we assume that S ∈ [0, 1]. For each final section d2,i we construct
a similarity vector si between all possible matches in D1, AJ . The best match is
thus d ∈ argmaxsiS(D1, AJ). Under the assumption that S is well-ordered, we
can use nearest-neighbor matching, since for each d2,i there is one and only one best
match. Here, similarity is defined as the cosine similarity between between the term-
frequency vector of the final bill section and the term-frequency matrix of all candi-
date matches.8
8Cosine similarity implicitly measures the cosine of the angle between two vectors in an N -dimensional space. Formally, for two term-frequency vectors A and B, the cosine similarity S =
167

Adding complexity, we note that amendments may be modified between their
drafting and final inclusion in a bill. This could occur for at least two reasons. First,
the specific format could change: amendments proposed as one paragraph may be
split into two, or vice-versa. Second, formal language, such as dates or cross-references,
may change to reflect more current information.
We anticipate the first aspect of this complexity–splitting or combining–through
nearest-neighbor matching with replacement. A continuous similarity measure S en-
sures that we do not require perfect matches, only the best match out of a set. By
allowing each amendment to match to multiple sections in the final bill, we handle
cases where amendments were split up (and thus the first half of an amendment
matches one section, while the second half matches a different section). The sec-
ond aspect of this complexity–subtle changes to formal legislative language–is im-
plicitly handled by choosing a similarity measure S that permits fuzzy rather than
exact matching.
We face a third complication: many legislative processes allow amendments through
channels that are not formally documented. Plenary amendments in the European
Parliament are made via floor proposal but not released as formally documented Par-
liamentary reports. Likewise, the European co-decision process sometimes involves
negotiated texts representing a compromise between the Parliament and the Euro-
pean Council. The history of text drawn up during negotiation has no public record
and thus no entry in the set of potential source documents. In this case, some sections
of the final bill may have no good match in either the initial bill or the documented
amendments.9 The reconciliation process in the United States Congress poses similar
Pi Ai·Bi√P
i A2i×√P
B2i
.9Note that these processes do produce output, often in the form of a comprehensive final bill or
amendment package voted on as a unit. But this record does not document who is responsible forwhat. Nor is the document useful in the matching process as described: including it in the corpus ofpotential matches would merely generate a synthetic bill that was largely composed of the compre-hensive bill.
168

challenges for identification.
Given that the nearest-neighbor matching process defined above will return some
match even if no actual match exists, handling this third complication requires a filter
for identifying and rejecting “poor” matches. We implement this process with a filter
on the similarity measure itself: for matches whose similarity measure s is below a
user-supplied threshold T , we reject the match and instead match the section to itself.
This “false” match can aid the identification of elements in a bill that came out of
negotiated processes that have no formal amendment record.
Setting the threshold poses the precision/recall trade-off (Buckland and Gey, 1994).
A low threshold level will match 100% of the actual matches (high recall), while re-
turning many false positives (low precision). A high threshold level will do the re-
verse. We treat this trade-off as a supervised learning problem in which the optimal
T is derived from a set of user-coded data. We hand match a random subset of each
final bill to its potential sources. Based on that hand coding, the proper threshold
value can be chosen to maximize the accuracy of the matching algorithm. Empirical
tests with actual EU legislation show that this process yields precision and recall rates
above 80% across multiple bills.
The output of the matching process permits a wide range of analyses. In partic-
ular, we wish to identify not just aggregate influence by policy actor, but influence
by policy actor and policy domain. Doing so requires first identifying those policy
areas. Semantic topic modeling (Blei et al., 2003) provides one avenue for unsuper-
vised labeling of the topic domains, using the language present in each bill section.
To do so, a Latent Dirichlet Allocation topic model is fit to the entire collection of
candidate and final bill sections.10 That model assigns each bill section to a single
10Formally, we fit an LDA model to a collection of “documents” constituting 90% of the bill sectionsand choose the optimum topic count to maximize the log likelihood of the model in a held-out 10%.A final LDA model was then fit to the entire set of bill sections using the optimum topic count. Billsections were first cleaned to remove punctuation, normal English stopwords, and common domain-specific stopwords such as Parliament, Council, energy, article and paragraph. All topic modeling was
169

topic, or policy domain, from the language it contains. Given that topic, the final sta-
tus of each bill section (adopted or rejected) and the author of each section, we can
now attribute to each legislative actor their activity in and influence over each policy
domain discussed in the legislative process.
done using the topicmodels package for R (Grün and Hornik, 2011).
170

Commission Parliament 1st reading
agricultural.production.list.raw.emissionsbiofuels.effect.provided.bioliquids.criteria
bioliquids.biofuels.purposes.account.referredbiomass.energy.fuels.transport.biofuels
buildings.energy.heating.cooling.minimumcarbon.land.emissions.stock.unit
compliance.national.amount.measuring.requirementscosts.producers.grid.discriminatory.objective
countries.third.country.convention.concerningeffects.production.energy.regional.community
electricity.produced.production.excess.cogenerationemissions.transport.fuel.distribution.processing
energy.renewable.heating.cooling.sourcesenergy.renewable.sources.produced.guarantee
energy.renewable.sources.promotion.frameworkenergy.renewable.transport.community.development
energy.share.renewable.sources.consumptionfood.generation.biofuels.target.security
gas.greenhouse.emission.fuel.savingheat.energy.consumption.pumps.purposes
including.process.content.residues.calculationindicative.trajectory.transfer.system.measures
information.economic.require.referred.operatorsland.significant.forest.human.natural
local.planning.regional.suppliers.consumersnational.renewable.energy.action.measuresnotification.period.letter.months.accordance
oil.ethanol.gas.wood.vegetableorigin.guarantees.transfer.competent.accounting
procedures.administrative.authorisation.energy.renewableproduced.plants.generated.biomass.electricity
production.transport.environmental.imports.benefitspurposes.international.schemes.standards.production
regulatory.adopted.essential.procedure.referredrenewable.energy.infrastructure.development.sources
report.referred.european.national.proposalsreports.analyse.purpose.local.resources
solar.certification.schemes.installers.criteriasolar.installation.training.systems.pipe
support.schemes.scheme.national.energysustainability.verification.methods.criteria.consignments
system.transmission.electricity.operators.distributionsystems.energy.equipment.promote.technical
table.filled.stroked.operational.installationtargets.joint.interim.mandatory.national
training.provider.practical.including.programmevalues.default.land.raw.cultivation
0 10 20 30 40 0 10 20 30 40Amendment count
Topi
c
Amendment status
Accepted
Total
Figure 5.5: Record of proposed and accepted amendments from the Commission andParliament during the legislative process for Renewable Energy Mandatereforms in the Third Climate and Energy Package. Counts refer to billsections, nominally paragraphs, rather than complete amendments.
171

national.renewable.energy.action.measuresreport.referred.european.national.proposals
targets.joint.interim.mandatory.nationalenergy.share.renewable.sources.consumption
food.generation.biofuels.target.securityenergy.renewable.transport.community.development
biomass.energy.fuels.transport.biofuelselectricity.produced.production.excess.cogeneration
energy.renewable.heating.cooling.sourcesenergy.renewable.sources.promotion.framework
support.schemes.scheme.national.energyreports.analyse.purpose.local.resources
training.provider.practical.including.programmesystem.transmission.electricity.operators.distribution
costs.producers.grid.discriminatory.objectiveland.significant.forest.human.natural
biofuels.effect.provided.bioliquids.criteriaagricultural.production.list.raw.emissions
values.default.land.raw.cultivationbuildings.energy.heating.cooling.minimum
heat.energy.consumption.pumps.purposessolar.installation.training.systems.pipe
notification.period.letter.months.accordanceprocedures.administrative.authorisation.energy.renewable
effects.production.energy.regional.communityproduction.transport.environmental.imports.benefits
emissions.transport.fuel.distribution.processingsystems.energy.equipment.promote.technical
renewable.energy.infrastructure.development.sourcessolar.certification.schemes.installers.criterialocal.planning.regional.suppliers.consumers
countries.third.country.convention.concerningregulatory.adopted.essential.procedure.referred
indicative.trajectory.transfer.system.measuressustainability.verification.methods.criteria.consignments
bioliquids.biofuels.purposes.account.referredpurposes.international.schemes.standards.production
information.economic.require.referred.operatorstable.filled.stroked.operational.installation
compliance.national.amount.measuring.requirementsorigin.guarantees.transfer.competent.accountingenergy.renewable.sources.produced.guarantee
carbon.land.emissions.stock.unitgas.greenhouse.emission.fuel.saving
produced.plants.generated.biomass.electricityincluding.process.content.residues.calculation
oil.ethanol.gas.wood.vegetable
Com
mission
Council / C
o−decision
Original bill
Parliam
ent
Policy actor
Pol
icy
dom
ain
Influence on final bill
0.0
0.2
0.4
0.6
0.8
1.0
Figure 5.6: Contributions to the 2008 Renewable Energy Directive by legislative actor.Contributions attributed to the “Final” outcome reflect additions to theapproved legislation not attributable to identified legislative actors. Thesereflect in particular compromises undertaken at the behest of the Council.See figure 5.7 for a schematic explanation of how these data are generated.
172

fin
an
cia
l.re
so
urc
es.t
ota
l.co
un
trie
s.a
pp
rop
ria
tio
ns
ca
rbo
n.s
ecto
rs.le
aka
ge.in
tern
atio
na
l.su
bse
cto
rsp
rod
uctio
n.a
lloca
tio
n.e
mis
sio
ns.g
ree
nh
ou
se.e
lectr
icity
ca
rbo
n.d
ioxid
e.p
rod
uctio
n.e
xce
ed
ing
.in
sta
llatio
ns
co
un
trie
s.c
om
mu
nity.a
gre
em
en
t.cre
dits.in
tern
atio
na
le
ne
rgy.a
uctio
nin
g.c
lima
te.r
eve
nu
es.c
ha
ng
ea
llow
an
ce
s.q
ua
ntity
.pe
rio
d.e
mis
sio
ns.in
sta
llatio
ns
se
cto
r.m
ark
et.
co
nce
rne
d.s
ecto
rs.s
ub
se
cto
re
lectr
icity.h
ea
t.p
rod
uctio
n.a
lloca
tio
n.r
esp
ect
eq
uiv
ale
nt.
em
issio
ns.m
ea
su
res.in
sta
llatio
n.c
arb
on
ga
s.g
ree
nh
ou
se.c
om
mu
nity.e
mis
sio
ns.in
sta
llatio
ne
mis
sio
ns.m
on
ito
rin
g.r
ep
ort
ing
.ga
se
s.lis
ted
op
era
tors
.pe
rio
d.c
om
mu
nity.s
ch
em
e.p
roje
ct
ad
min
istr
ative
.exp
en
ditu
re.r
eg
istr
y.a
mo
un
t.re
fere
nce
em
issio
ns.e
mis
sio
n.t
rad
ing
.co
un
trie
s.g
ree
nh
ou
se
refe
rre
d.a
cco
rda
nce.m
ea
su
res.a
do
pte
d.p
roce
du
rea
uth
ori
ty.c
om
pe
ten
t.o
pe
rato
r.ca
nce
lled
.re
ferr
ed
ma
rke
t.re
po
rt.a
pp
rop
ria
te.e
uro
pe
an
.pro
po
sa
lsco
mm
un
ity.s
ch
em
e.a
llow
an
ce
s.e
mis
sio
ns.d
istr
ibu
ted
clim
ate
.ch
an
ge.a
gre
em
en
t.in
tern
atio
na
l.co
mm
un
ity
me
asu
res.a
gre
em
en
t.in
du
str
ies.in
tern
atio
na
l.co
nsu
me
rfr
ee.a
lloca
tio
n.m
ea
su
res.c
ha
rge.a
llow
an
ce
sp
lan
.allo
ca
tio
n.n
atio
na
l.p
eri
od
.ap
plic
atio
na
ctivitie
s.r
ep
ort
.acco
rda
nce.a
llow
an
ce
s.in
sta
llatio
na
ccre
dita
tio
n.r
ep
ort
s.v
eri
fica
tio
n.d
ecis
ion
.eva
lua
tio
np
rovis
ion
s.fo
rce.a
pp
ly.r
efe
rre
d.e
uro
pe
an
pro
jects
.sto
rag
e.a
llow
an
ce
s.g
eo
log
ica
l.ca
ptu
reco
mm
un
ity.a
pp
rop
ria
te.s
ecto
rs.s
ch
em
e.c
ha
ng
eco
mm
un
ity.e
mis
sio
ns.s
ch
em
e.p
roje
cts
.allo
wa
nce
sin
sta
llatio
n.a
llow
an
ce
s.o
pe
rato
r.p
rod
uctio
n.w
aste
refe
rre
d.in
sta
llatio
ns.a
cco
rda
nce.a
cco
un
t.re
sp
ect
info
rma
tio
n.e
mis
sio
ns.c
om
pe
ten
t.re
qu
ire
me
nts
.au
tho
ritie
s
Commission
Council / Co!decision
Original bill
Parliament
Polic
y a
cto
r
Policy domain
Infl
ue
nc
e o
n f
ina
l b
ill
0.0
0.2
0.4
0.6
0.8
1.0
Fina
l bill
&
attr
ibut
ed
sour
ces
Attr
ibut
ed
sour
ces
Fina
l bill
LDA
leghist
Acc
epte
d
Reje
cted
Policy
domains
Autho
r‐
ship
Actor
Figure 5.7: Flow of data through the leghist modeling process.
173
6 Economic actors and interests in
European climate and energy policy
6.1 Introduction
Climate policy, like other environmental problems, may conflict with demands for
unbridled economic growth or development. Given this tension, successful envi-
ronmental policy has often required non-economic interests and interest groups to
provide the political impetus to overcome opposition of private industry. Chapters
1-4 argued, however, that applying this framework to climate policy leads to a very
incomplete picture of climate politics. The degree of change required for serious emis-
sions reduction promises to generate economic winners as well as losers; and to open
up opportunities to address existing shortcomings in legacy energy systems. These
real economic benefits, I argued, point to an opportunity to ground support for emis-
sions reduction in the material returns to energy systems transformation. Doing so,
however, may require policies inconsistent with the more narrowly environmental
preferences of environmental interest groups or parties.
Chapter 5 subsequently showed that, for the European Union, industrial policy
won out over environmental politics in the construction and reform of EU climate
and energy policy. Despite the European Parliament’s reputation as an effective en-
174
vironmental advocate, it largely failed in its attempts to restructure European climate
policy on more narrow environmental grounds. Instead, the European Commission
proved quite successful at pushing its synthetic policy strategy through as a pack-
age of reforms. That package, as chapter 4 discussed in detail, contained a complex
and multifaceted policy suite. That suite targeted the broad technical, regulatory, and
market reforms necessary to take emissions out of Europe’s energy system. But it did
so in ways explicitly focused on a range of economic benefits: improved economic
competitiveness, export-led growth, energy security, and market efficiency.
These empirical findings support the claim that European climate policy success
rests on a political strategy of issue linkage. By tying progress on environmental goals
to the realization of near-term material gains, the Commission has, I have argued,
sought to ground support for climate policy in economic rather than environmen-
tal motivations. Europe has succeeded not because of its concern for environmental
stewardship–though such concern certainly shapes the political background–but be-
cause it could make policy choices that served environmental goals through remu-
nerative economic means.
This result leaves open the question of why Europe, and specifically the European
Commission, could craft this particular bargain. Were, in fact, European economic
interests amenable to the bargain implicit in the Commission’s policy proposal? Did
those interests reflect the particular legacy conditions of Europe’s energy system, as
chapter 2 suggested they would? Did interest in the economic opportunities from
energy systems transformation transcend political tensions over emissions reduction
itself?
Answering these question cuts to the heart of how economic interests perceive Eu-
ropean climate policy. Chapter 3 suggested that the Commission’s strategy of issue
linkage would work only if the underlying structure of the energy system provided
175
opportunities to generate salient material benefits from the process of systems trans-
formation. Those benefits could come from new opportunities for export competi-
tiveness, solutions to energy security problems, or improvements to energy cost and
availability. Building a strategy on those opportunities, however, required that (1)
they existed consequence of the legacy energy system; (2) that firms and other eco-
nomic actors understood them as salient opportunities; and (3) that those opportu-
nities allied interests who might otherwise have fought over climate policy narrowly
construed. In other words, firms had to see their interests as a function not only of
the marginal effects of climate policy on their narrow corner of the energy system;
but also of the broad consequences of transforming how the economy produced, dis-
tributed, and used energy.
This chapter demonstrates that firm interests vis a vis European climate policy ex-
hibit all these qualities. Drawing firms’ own words in response to European policy
proposals, I show that firms’ expressed interests go beyond firms’ narrow positions
in the economy. Instead, firm interests clearly reflect the ability of the energy system
to propagate the consequences of change throughout the economy, and in so doing to
tie together otherwise disparate interests. Consequently, even where firms or sectors
may not agree on climate policy itself, they often share interests in the consequences
of actions taken to serve climate policy goals.
However, I caution that this phenomenon is highly contingent. Europe’s economic
interests exist in the context of both the structure of its economy and the nature of
its legacy systems. The interaction between these institutions generated the context
in which firms understood their policy interests. Given a different combination of
background conditions, the conjunction of economic means and environmental ends
may have failed as a political strategy. The United States, as I argue at the end of this
chapter, points to just such a failure.
176
6.2 The prerequisites of issue linkage
Chapter 3 proposed issue linkage as an alternative explanation for how states have
managed to overcome the formidable political barriers to climate change mitigation.
Taking emissions out of the energy system requires an array of complementary and
parallel changes in how an economy produces, distributes, and uses energy. Those
changes encompass the technical, economic, and regulatory actions to incorporate re-
newable energy, improve energy efficiency, and retire fossil fuel infrastructure with-
out impeding the function of the economy a whole. The technical superiority of fossil
fuels, the cost of renewable alternatives, the behavioral and structural rigidity of en-
ergy consumption, and the political power of the fossil fuel industry and its users all
make building concentrated political support for these actions difficult.
These costs have led both activists and analysts to look elsewhere for the political
support for climate policy. Both groups have in many cases concluded that success-
ful climate policy must rely on a base of support grounded in non-material interests–
and in particular concern for environmental stewardship. Hence the focus of study
has often settled on the behavior of environmental interest groups, environmentally-
aligned political parties, and similar phenomena, often in opposition to industry as-
sumed (in some cases correctly) to be implacable in its opposition.
Chapter 3 argued that this view of climate politics was incomplete. Without dis-
counting the potential cost of climate change mitigation, focusing solely on that cost
ignores the potential economic opportunities created by a low-emissions energy sys-
tems transformation. Those opportunities come from the benefits realized, or the
problems solved, through the technical, regulatory, and market changes required
to take emissions out of modern energy supplies. Doing so will require firms and
workers bringing new technologies, services, and skills to market; and will poten-
tially improve efficiency and reduce exposure to volatile and expensive international
177

energy sources. The catalog of potential material benefits thus includes export-led
growth, technological innovation, high-skilled employment, improved energy secu-
rity, improved infrastructure stability, and reduced energy costs. The scope of each of
these potential benefits will depend on historically contingent national choices about
how to structure legacy energy systems, and how those systems are integrated in the
broader economy.
These potential benefits open up the opportunity for building policy coalitions on
material, rather than non-material, interests. Material interests with an acute stake in
the particulars of climate policy promise, as shown by an array of political science re-
search (Patashnik, 2003, 2008; Jacobs, 2008), a better foundation for policy continuity
than the diffuse non-material aspirations of environmental interests. Realizing these
benefits, however, will likely lead policymakers in the direction of a multifaceted,
complex, and superficially redundant policy suite. That suite will eschew narrow ap-
peals to economic efficiency, like those that underpin the logic of emissions pricing,
in favor of industrial policy that targets specific problems in the context of the broad
goal of shifting the trajectory of a national energy system towards a low-emissions
pathway.
The logic of issue linkage points to four prerequisites for making effective use in-
dustrial policy to pursue and stabilize long-term environmental policy:
1. The domestic energy system must contain either economic opportunities or ex-
isting inefficiencies, solutions to which generate material returns to industrial
actors
2. Those opportunities and benefits should generate specific returns to specific
parties
3. The actors themselves must perceive these opportunities or improvements as
benefits178

4. The coalitions interested in these benefits should span the political cleavages
generated by climate change mitigation itself.
In other words, issue linkage may work if economic actors who disagree on climate
change mitigation nevertheless find common interests in the opportunities created
by, or the inefficiencies addressed by, specific tasks undertaken to reduce greenhouse
gas emissions. That dynamic changes climate change mitigation from a zero-sum
fight over environmental versus economic policy priorities, to a positive-sum regime
capable of sustaining consensus over time.
6.3 Measuring issue linkage in European climate policy
Chapter 4 argued that European climate policy has come to embody a technical strat-
egy aimed at energy systems transformation, and a political strategy that uses sys-
tems transformation to underpin a politics of issue linkage. Technically, the EU tar-
gets very narrowly the replacement of European energy sources, the reconfiguration
of energy transmission infrastructure, and the improvement and restructuring of en-
ergy demand. In doing so, its policies focus not only on the physical configuration
of the system, but on the markets and regulatory structures in which that physical
infrastructure is embedded. Hence the EU not only has renewable energy mandates,
energy efficiency standards, and coordinated grid planning; but also a broad program
for energy market reform, regulatory coordination, cross-border market integration,
and technological research and development.
As chapter 4 showed, the European Commission has been quite explicit about its
evolving understanding of the link between emissions, security, and growth. In both
its 2006 and 2010 energy policy strategies, the Commission explicitly tied progress on
emissions to the realization of benefits from export-led growth and energy security.
179

Its reports on progress in European energy market integration, issued in 2005-2006,
articulate the failure of policy progress as a failure to realize available benefits from
market integration and reform. Its discussion of renewable energy deployment cites
European competitiveness in emerging markets for high-tech green capital goods,
alongside climate change, as a motivating factor. Furthermore, as chapter 5 showed,
the Commission introduced policy along all these dimensions as an integrated pack-
age of policy reforms; and pushed the Parliament to pass them as a policy unit rather
than isolated attempts at regulatory, environmental, or industrial policy.
But while this history points to a technocratic conception of climate change miti-
gation as a problem of systems transformation, it still leaves the political question
unanswered: why could the European Commission use this technocratic solution to
structure a durable political bargain? Do firms actually share interests in common, de-
spite disagreement over long-term environmental goals? Does that commonality of
interest correspond to the Commission’s choice of policy instruments? How broadly
does overlap, if any, extend? Does that overlap reflect sensible intuitions about the
structure of Europe’s energy system, its attendant problems, and the potential oppor-
tunities that systems transformation might create?
This chapter presents a straightforward answer to these questions: major economic
interests in the European Union identified benefits as well as costs in the tasks re-
quired for a low-emissions systems transformation; they voiced support for those
benefits; and the coalitions in favor of benefits transcended political fault lines drawn
along disagreements over environmental policy itself. Hence the Commission could
succeed because firms and other economic actors perceived opportunity in systems
transformation. Commission policy sought to highlight those opportunities, and
hide or otherwise mute costs. That strategy facilitated policy coalitions among in-
terests otherwise at odds on long-term climate policy. Industrial policy, understood
180
as managing both the technical and political challenges of industrial change, carried
the particulars of climate policy. Environmental politics were, instead, a background
condition.
6.3.1 Measuring the structure of European climate interests
Demonstrating that European firms both perceived these benefits and expressed in-
terest in them across sectoral boundaries requires an approach to measuring the per-
ceived interests of firms across the entire economy. That approach must reflect the
implication of an energy systems view of climate policy: that the energy system cre-
ates shared fortunes for firms both within and outside the energy sector itself. In
doing so, it must provide a means of answering four questions:
1. What interests do firms have in specific policy proposals?
2. How do those interests compare to other firms in the same sector?
3. How do those interests compare to firms in other sectors?
4. Do shared interests among firms in different sectors span political disagree-
ments over emissions reduction?
Issue linkage presumes that the firms may share interests in common with other
sectors to the same, or perhaps greater, degree as they do with their own sector. This
is because the energy system itself transmits the effects of transformation throughout
the system itself. For instance, renewable energy firms and steelmakers may disagree
on emissions reduction itself. But the changes to the power grid necessary to incorpo-
rate low-emissions energy may aid both–the one with adding every-larger volumes
of renewable energy to the system, the other by reducing the incidence of blackouts
or systems instability borne of an aging power grid.
181
Answering these questions requires a means of measuring the interests firms ex-
press, and then evaluating how those interests overlap with other firms and sectors.
This section discusses that measurement process in brief. Section 6.7 presents the
formal statistical description of these measurements, and discusses potential issues
stemming from, and means of compensating for, respondents’ strategic behavior and
selection bias.
Firm interests and public consultation
Firms have a variety of opportunities to express their interests in policy. Most, how-
ever, are opaque to scholars. Most forms of lobbying, particularly in the European
Union, are somewhat opaque. Furthermore, for active policy areas like emissions
policy, firms are often unwilling to disclose their interests. For systemic interests, it
may also be the case that only a very few elite actors have a comprehensive view of
the balance of firm interests in a complex process like energy systems transformation.
Hence studying these interests requires an opportunity to observe firms’ interests in
the context of complex policy, rather than from the isolated perspective of one or a
few individuals.
Public consultation provides a unique opportunity to both observe firm interests
across a wide swath of the economy, and to measure the similarity of those interests
both within and between sectoral boundaries. The European Commission regularly
solicits input from firms, citizens, and interests organizations. For energy in partic-
ular, these solicitations usually prompt responses to specific policy proposals which
ultimately become draft legislation. Consultations usually receive responses from
hundreds of firms and other interest groups, spanning a diversity of economic sec-
tors. They are also often very comprehensive, taking thousands of words to articulate
both which parts of the proposal most interest firms, and what specifically they may
182
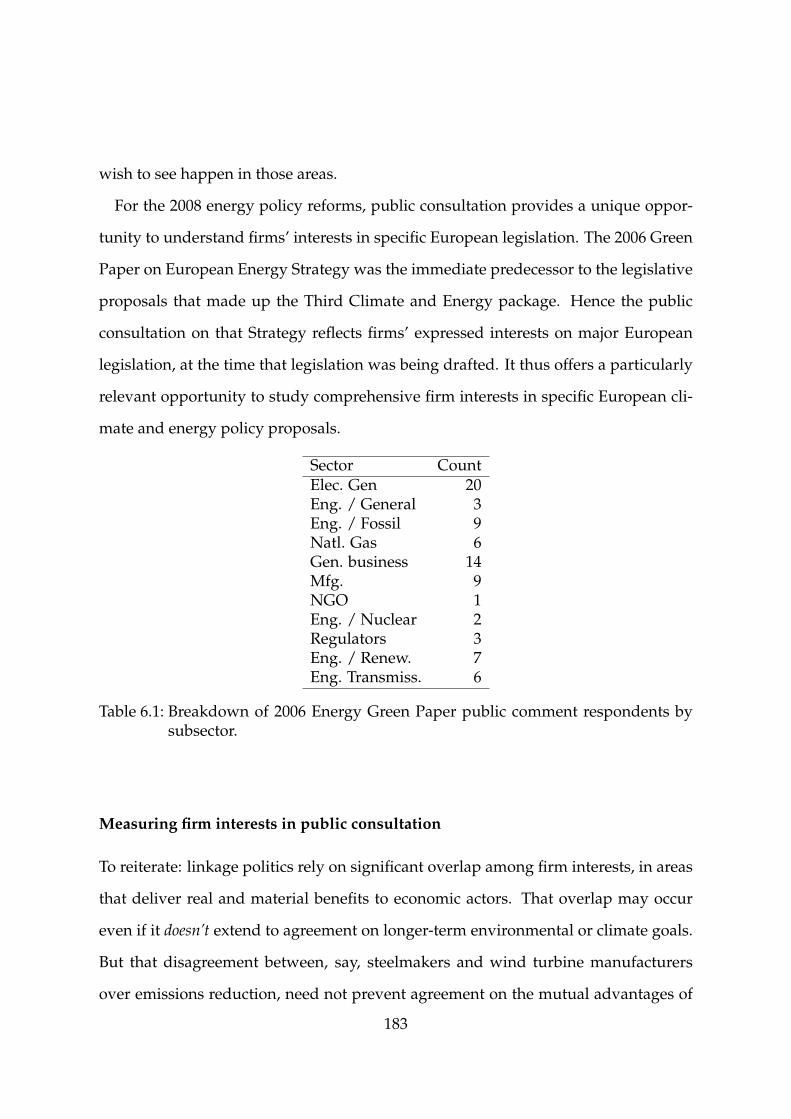
wish to see happen in those areas.
For the 2008 energy policy reforms, public consultation provides a unique oppor-
tunity to understand firms’ interests in specific European legislation. The 2006 Green
Paper on European Energy Strategy was the immediate predecessor to the legislative
proposals that made up the Third Climate and Energy package. Hence the public
consultation on that Strategy reflects firms’ expressed interests on major European
legislation, at the time that legislation was being drafted. It thus offers a particularly
relevant opportunity to study comprehensive firm interests in specific European cli-
mate and energy policy proposals.
Sector CountElec. Gen 20Eng. / General 3Eng. / Fossil 9Natl. Gas 6Gen. business 14Mfg. 9NGO 1Eng. / Nuclear 2Regulators 3Eng. / Renew. 7Eng. Transmiss. 6
Table 6.1: Breakdown of 2006 Energy Green Paper public comment respondents bysubsector.
Measuring firm interests in public consultation
To reiterate: linkage politics rely on significant overlap among firm interests, in areas
that deliver real and material benefits to economic actors. That overlap may occur
even if it doesn’t extend to agreement on longer-term environmental or climate goals.
But that disagreement between, say, steelmakers and wind turbine manufacturers
over emissions reduction, need not prevent agreement on the mutual advantages of
183

Sector CountConstruction 9Elec. Gen. 22Eng. / Efficiency 2Eng. / Fossil 15Eng. / General 13Eng. / Nuclear 4Eng. / Renew. 23Eng. / Transmiss. 5Gen. business 19Mfg. 8Natl. Gas 12NGO 33Regulators 1Research 7Transport 3
Table 6.2: Breakdown of 2010 Energy Strategy White Paper public comment respon-dents by subsector.
strengthening the power grid and reforming power markets.
Measuring the degree and kind of overlap between firm interests requires that we
identify and measure four separate phenomena:
1. What policy domains are at stake in a policy proposal?
2. Which of those domains matter to any given firm?
3. How do one firm’s interests intersect with another’s?
4. How do one sector’s interests intersect with another’s?
We exploit public consultation–the process of soliciting public feedback on specific
policy proposals–to quantify and measure each of these phenomena. In doing so, we
exploit the fact that public consultation processes are framing processes: the Commis-
sion frames the policy discussion with their strategy and firms and interest groups
respond largely within the framework set up by the Commission. Conceptually, this184

means that public consultation allows the identification of both (1) which policy do-
mains are under consideration and (2) which of those policy domains firms express
interests in.
We take two complementary approaches to measuring these quantities. Quantita-
tively, we exploit the direct analogy between framing and a class of statistical text
models known as topic models. The particulars are fully discussed in section 6.7.
In brief, topic models assume that all documents contain a latent structure, defined
by the topics they cover. Those topics, in turn, are characterized by the likelihood
that we find specific terms in one topic versus another. Hence terms like “football”,
“baseball”, and “game” might be far more likely to occur in a document discussing
“sports”, while “iraq”, “war”, and “un” might be more likely to occur in a document
discussing “foreign policy”. Documents are assumed to contain a mixture of topics.
For example, Blei et al. (2003), in the canonical paper introducing topic models, model
the entire corpus of articles from the journal Science. Any one of these articles might
discuss, for instance, both biology (cell, gene, mutation) and medicine (disease,
treatment, mortality). Topic models provide a means of modeling both the top-
ics and the occurrence of topics simultaneously.
With this background, we can draw a direct analogy between topic models and
public consultation. In public consultation, the Commission introduces a policy doc-
ument with specific policy domains, each of which is characterized by a specific vo-
cabulary. Hence emissions control might use terms like carbon, price, and permit,
while renewable energy favors terms like technology, research, and renewable.
When firms respond, they choose among those policy domains, and likely use the
Commission’s own policy language to frame their responses. Figure 6.1 provides a
schematic overview of the framing and response process, and the role of topic mod-
eling in measuring firm interests in light of that process.
185

Topic modeling thus provides the means to quantify answers the questions above.
Using the Commission’s own policy documents, topic models can assist in discov-
ering policy domains from the patterns of language itself. Using a model built from
that language, we can then locate each respondent’s interests in that set of policy do-
mains based on the language in their response. This modeling process thus locates a
diverse set of firms in a common policy space, and in doing permits straightforward
measurement of the commonality of firm interests.
Complementing this quantitative approach, section 6.4.2 examines in detail a rep-
resentative subset of firm responses. Close reading of the stated interests of a range
of firms points to the same result as obtained by computational modeling: that Eu-
ropean economic actors hold interests in climate and energy policy that go beyond
their narrow place in the energy system; that those interests often overlap; and that
the pattern of overlap transcends, in many cases, political cleavages over the narrow
environmental problem of climate change itself.
186
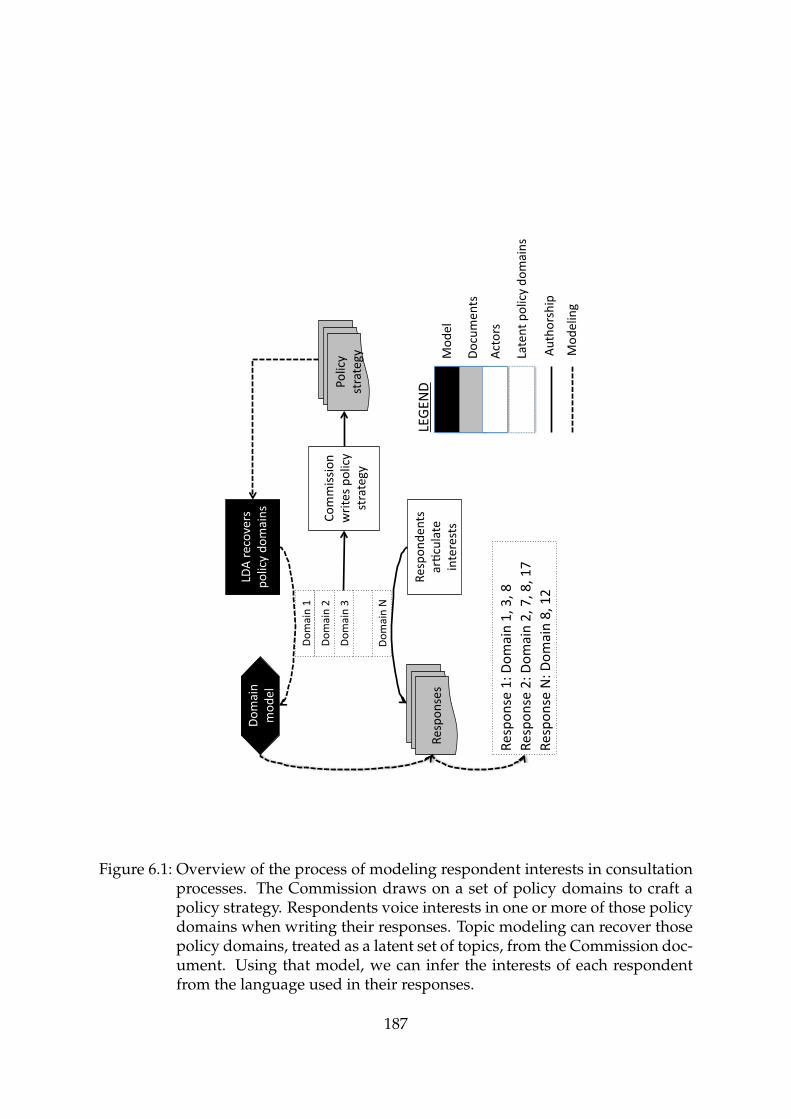
Dom
ain 1
Dom
ain 2
Dom
ain 3
Dom
ain N
Commission
writes po
licy
strategy
LDA re
covers
policy do
mains
Respon
dents
ar<culate
interests
Respon
ses
Dom
ain
mod
el
Respon
se 1: D
omain 1, 3, 8
Respon
se 2: D
omain 2, 7, 8, 17
Respon
se N: D
omain 8, 12
Policy
strategy
Mod
el
Docum
ents
Actors
Latent policy do
mains
Autho
rship
Mod
eling
LEGEN
D
Figure 6.1: Overview of the process of modeling respondent interests in consultationprocesses. The Commission draws on a set of policy domains to craft apolicy strategy. Respondents voice interests in one or more of those policydomains when writing their responses. Topic modeling can recover thosepolicy domains, treated as a latent set of topics, from the Commission doc-ument. Using that model, we can infer the interests of each respondentfrom the language used in their responses.
187

6.4 Results: firm interests reinforce issue linkage on
climate policy
6.4.1 What the models say
Anticipating reform: interests in the 2006 Green Paper
The 2006 European Green Paper on energy strategy provides a unique opportunity
to directly tie interests to legislation. The Green Paper articulated the European Com-
mission’s proposed strategy for reforming the European climate and energy policy
strategy. Its policy proposals for energy market reform and integration, emissions
trading, energy efficiency, and renewable energy promotion tie directly to subsequent
legislative proposals in each of those policy domains.
Figure 6.2 represents each of those policy domains using the terminology from the
Commission document itself. The policy domains themselves comport well with a
close reading of the energy strategy green paper. We highlight several for illustration
purposes:
• Technological research and development (topic 2)
• Fuel choices and alternatives (topic 5)
• Emissions and technological innovation (topic 9)
• Market reform and competition (topic 16)
• Infrastructure development (topic 17)
• Nuclear policy (topic 20)
• Gas supply and supply insecurity (topic 19)
188
• Network infrastructure development (topic 24)
As the close reading of responses in section 6.4.2 showed, respondents framed their
responses in terms of these policy domains. We can thus use the model of policy
language to locate firms’ interests, and study the commonality of interests among
firms and sectors. Here, we use the Jaccard index to quantify interest overlap between
any two firms. Take, for example, a firm that expresses interests in topics 1, 2, and
6; and another, expressing interests in 6, 23, and 14. The Jaccard index is simply the
ratio of interests held in common (1) to the total interests identified in both firms
(5). Restated, the Jaccard index tells us how many interests firms hold in common
compared to the total set of interests they express. Moving from pairs of firms to pairs
of sectors, we can summarize how similar two sectors’ interests are as the average and
the variance of the similarities between their firms.
Figure 6.3 illustrates the resulting overlap among firms in different sectors of the
European economy. We can take three major conclusions away from these results:
1. Sectors with fixed, non-transferable assets have very concentrated interests. These
sectors include energy transmission, fossil fuel firms, and natural gas generation
and transmission.
2. Outside these sectors, we observe significant overlap among sectors not often
thought to share interests in common. For instance, fossil fuel and renewable
energy firms express interests in common to the same degree as do fossil fuel
firms and natural gas firms
3. Overlap among interests across the energy system is actually common–firms
don’t have narrow, sector-specific interests or highly concentrated interests.
As a robustness check, we can employ a different measure of similarity among
firms’ expressed interests. The Jaccard index treats interests as discrete–a firm that189

spends 75% of its response talking about renewable energy, and 25% talking about
grid investment, is assumed to have the same interests as a firm that spends 25% of
its time discussing renewables and 75% discussing the grid. Obviously this throws
away a lot of information about the structure of firm preferences. Alternatively, sim-
ilarity could use a measure called the multidimensional simplex, described fully in
section 6.7, that preserves that information. Figure 6.4 shows that this very different
measure of similarity produces substantively similar results. Once again, firms in
sectors with very specific, fixed, non-transferable assets like the power grid tend to
be very similar. But outside these sectors, similarity across sectors is both common
and comparable to similarity within sectors. Furthermore, that similarity spans polit-
ical cleavages on long-term environmental policy itself, up to and including firms in
otherwise opposed sectors like fossil fuels and renewable energy.
190

actiontermeffici
examplintegr
technologmarketdeveloprenewbring
objectoverallevelsecur
develop
technologcountriefficirelatfossil
renewcoalfuel
technologeconom
competitmarketsecurgas
compani
renewsourceffect
frameworkplan
marketmeasurinternensurelectr
technologtargetprovidemiss
scheme
competitcommuniti
levelnationconsid
marketcreatsecur
neighbourgas
developcountri
agreementpromottransit
importdemanddependglobal
oil
standardmeaneffici
minimumperform
gascommuniti
oilpipelinsuppli
competitsecur
industrisuppli
sustain
infrastructurdevelopsecur
particularpartnership
technologresearch
timelevel
capac
gasstocksupplidisrupt
oil
nuclearclimatensur
contributworld
efficipublicaction
concretlevel
externsuppli
communiticommon
level
gascountriconsumglobal
dialogu
networkregulgridoper
develop
Topic 1 Topic 2 Topic 3 Topic 4 Topic 5
Topic 6 Topic 7 Topic 8 Topic 9 Topic 10
Topic 11 Topic 12 Topic 13 Topic 14 Topic 15
Topic 16 Topic 17 Topic 18 Topic 19 Topic 20
Topic 21 Topic 22 Topic 23 Topic 24
Figure 6.2: This figure illustrates policy domains in the 2006 European Energy Strat-egy Green Paper. Each policy domain is showcased by the terms identifiedby a topic model as most indicative of the domain itself.
191
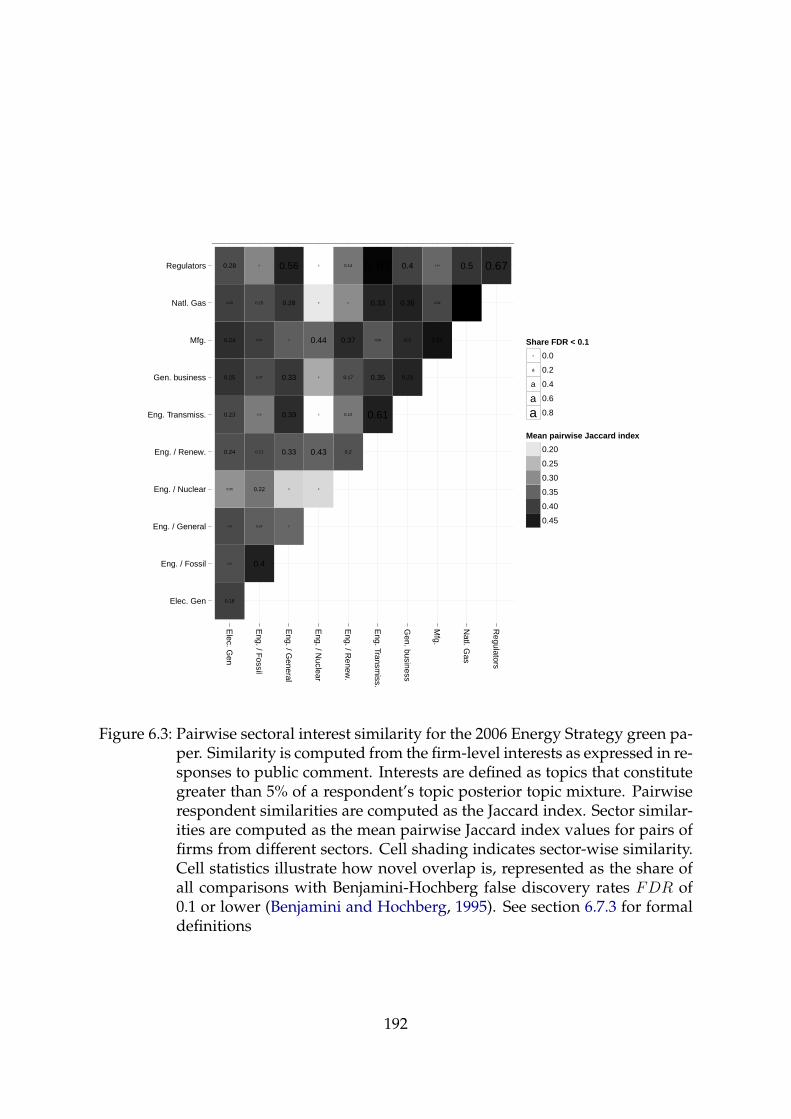
Elec. Gen
Eng. / Fossil
Eng. / General
Eng. / Nuclear
Eng. / Renew.
Eng. Transmiss.
Gen. business
Mfg.
Natl. Gas
Regulators
0.18
0.01
0.03
0.05
0.24
0.23
0.25
0.24
0.09
0.28
0.4
0.07
0.22
0.11
0.02
0.07
0.07
0.15
0
0
0
0.33
0.39
0.33
0
0.28
0.56
0
0.43
0
0
0.44
0
0
0.2
0.12
0.17
0.37
0
0.14
0.61
0.35
0.09
0.33
0.83
0.23
0.2
0.36
0.4
0.25
0.09
0.04
0.53
0.5 0.67
Elec. G
en
Eng. / F
ossil
Eng. / G
eneral
Eng. / N
uclear
Eng. / R
enew.
Eng. Transm
iss.
Gen. business
Mfg.
Natl. G
as
Regulators
Share FDR < 0.1a
a
a
aa
0.0
0.2
0.4
0.6
0.8
Mean pairwise Jaccard index
0.20
0.25
0.30
0.35
0.40
0.45
Figure 6.3: Pairwise sectoral interest similarity for the 2006 Energy Strategy green pa-per. Similarity is computed from the firm-level interests as expressed in re-sponses to public comment. Interests are defined as topics that constitutegreater than 5% of a respondent’s topic posterior topic mixture. Pairwiserespondent similarities are computed as the Jaccard index. Sector similar-ities are computed as the mean pairwise Jaccard index values for pairs offirms from different sectors. Cell shading indicates sector-wise similarity.Cell statistics illustrate how novel overlap is, represented as the share ofall comparisons with Benjamini-Hochberg false discovery rates FDR of0.1 or lower (Benjamini and Hochberg, 1995). See section 6.7.3 for formaldefinitions
192

Nat
l. G
as #
Nat
l. G
as
Reg
ulat
ors
# R
egul
ator
s
Eng
. / F
ossi
l # E
ng. /
Fos
sil
Eng
. / F
ossi
l # N
atl.
Gas
Nat
l. G
as #
Reg
ulat
ors
Eng
. / N
ucle
ar #
Eng
. / N
ucle
ar
Eng
. / F
ossi
l # R
egul
ator
s
Eng
. / F
ossi
l # E
ng. /
Ren
ew.
Gen
. bus
ines
s #
Nat
l. G
as
Eng
. / F
ossi
l # G
en. b
usin
ess
Eng
. / R
enew
. # N
atl.
Gas
Eng
. / R
enew
. # E
ng. /
Ren
ew.
Ele
c. G
en #
Nat
l. G
as
Ele
c. G
en #
Eng
. / F
ossi
l
Eng
. / G
ener
al #
Nat
l. G
as
Ele
c. G
en #
Reg
ulat
ors
Eng
. / R
enew
. # R
egul
ator
s
Eng
. Tra
nsm
iss.
# R
egul
ator
s
Gen
. bus
ines
s #
Gen
. bus
ines
s
Gen
. bus
ines
s #
Reg
ulat
ors
Eng
. Tra
nsm
iss.
# N
atl.
Gas
Eng
. / R
enew
. # G
en. b
usin
ess
Mfg
. # R
egul
ator
s
Mfg
. # N
atl.
Gas
Ele
c. G
en #
Eng
. / R
enew
.
Eng
. / F
ossi
l # M
fg.
Eng
. / G
ener
al #
Eng
. / G
ener
al
Ele
c. G
en #
Ele
c. G
en
Ele
c. G
en #
Gen
. bus
ines
s
Eng
. Tra
nsm
iss.
# E
ng. T
rans
mis
s.
Eng
. / F
ossi
l # E
ng. /
Gen
eral
Eng
. / R
enew
. # M
fg.
Eng
. / G
ener
al #
Reg
ulat
ors
Mfg
. # M
fg.
Eng
. / F
ossi
l # E
ng. T
rans
mis
s.
Eng
. / G
ener
al #
Gen
. bus
ines
s
Ele
c. G
en #
Mfg
.
Eng
. / R
enew
. # E
ng. T
rans
mis
s.
Gen
. bus
ines
s #
Mfg
.
Eng
. / G
ener
al #
Eng
. / R
enew
.
Ele
c. G
en #
Eng
. Tra
nsm
iss.
Eng
. Tra
nsm
iss.
# M
fg.
Eng
. / F
ossi
l # E
ng. /
Nuc
lear
Eng
. Tra
nsm
iss.
# G
en. b
usin
ess
Ele
c. G
en #
Eng
. / G
ener
al
Eng
. / N
ucle
ar #
Reg
ulat
ors
Eng
. / N
ucle
ar #
Eng
. / R
enew
.
Eng
. / N
ucle
ar #
Mfg
.
Eng
. / N
ucle
ar #
Gen
. bus
ines
s
Eng
. / G
ener
al #
Eng
. Tra
nsm
iss.
Ele
c. G
en #
Eng
. / N
ucle
ar
Eng
. / G
ener
al #
Mfg
.
Eng
. / N
ucle
ar #
Nat
l. G
as
Eng
. / N
ucle
ar #
Eng
. Tra
nsm
iss.
Eng
. / G
ener
al #
Eng
. / N
ucle
ar
010
020
030
040
050
0M
ean
pairw
ise
sim
plex
diff
eren
ce
Sector pair
Com
paris
on ty
pe
Acr
oss
sect
ors
With
in s
ecto
rs
Figure 6.4: Similarity of interests in the 2006 Energy Strategy green paper, as mea-sured on the multidimensional simplex. The constitutes an alternativemeasure of sectoral similarity, using the continuous simplex distance asadopted by Grimmer (2010).
193
After reform: interests in the 2010 White Paper
These results suggest that the structure of European energy interests prior to the 2008
policy reforms was amenable to a strategy of issue linkage. This raises the question,
however, of whether these patterns of economic interests were ephemeral. Much
changed in the European economy after 2006. Most notably, the 2008-2009 financial
crisis inaugurated a period of prolonged fiscal retrenchment and economic stagna-
tion and recession. Such conditions are often fatal to enthusiasms for climate policy
because of its attendant costs.
A second public consultation provides a useful opportunity to check whether this
commonality of interests survived these changes. As the European Commission looked
towards European energy policy after 2020, it again introduced a broad policy strat-
egy designed to update European policy frameworks for renewable energy, emissions
regulation, and energy market reform. Once again, as table 6.2 shows, hundreds of
firms across many sectors returned input. Hence 2010 provides a chance to check
whether, as the European Commission looked towards European energy strategy in
2020, its linkage strategy had brought firms along with it or had been left behind by
economic troubles.
Figure 6.5 illustrates the policy domains covered by the Commission’s revised en-
ergy strategy. Highlighting a subset of those domains, we once again see that they
touch on durable themes in European energy policy:
• Nuclear energy policy and strategy (topic 3)
• Market competition (topic 4)
• External security (topic 7)
• Energy efficiency (topic 12)
194

• Renewable energy strategy (topic 13)
• Smart grids, metering, and storage (topic 15)
marketinvestcapacprice
competit
securtermafford
challengcost
nuclearsafetiinternsecurlegal
competitmarketensur
industriaction
internmarketcountri
technologborder
marketcompetitconsumnationchoic
externsecur
developinfrastructur
effect
infrastructurentso
marketinterninclud
consumeffort
sustainmarketcitizen
technologmarketdevelop
levelprioriti
countridevelopcommon
goalaccess
efficipublicbuild
transportsector
renewstrategichang
challengcompetit
efficiindustriconsumcurrent
fund
smartelectrstoraggrid
innov
renewsupport
frameworkscheme
commerci
efficiobjectactionnation
develop
accessprocedurprojectpublicfund
countriagreement
treatiinternmarket
termset
planprogrammresearch
marketsuppliintern
consumcompetit
gassuppli
oilinvestimport
Topic 1 Topic 2 Topic 3 Topic 4 Topic 5
Topic 6 Topic 7 Topic 8 Topic 9 Topic 10
Topic 11 Topic 12 Topic 13 Topic 14 Topic 15
Topic 16 Topic 17 Topic 18 Topic 19 Topic 20
Topic 21 Topic 22
Figure 6.5: This figure illustrates policy domains in the 2010 European Energy Strat-egy White Paper. Each policy domain is showcased by the terms identifiedby a topic model as most indicative of the domain itself.
Topic modeling again permits the identification of respondents’ interests among
these policy domains. Using the Jaccard metric, figure 6.6 points to conclusions sim-
ilar to those drawn from the 2006 policy cycle. Robustness checks, again using the
195

simplex measure of interest similarity, confirm these impressions, as shown in figure
6.7. In particular:
1. Sectors with non-transferable, fixed assets tend to have highly concentrated in-
terests
2. Other sectors show a remarkable degree of commonality of interest
3. That commonality spans political cleavages on climate policy itself, including
the renewable/fossil fuel debate
Finally, 2010 included responses from the construction and transportation sectors,
neither of which were well-represented in the 2006 policy cycle. Two interesting fea-
tures come out. First, the energy efficiency and construction sectors share a significant
share of interests in common. This is sensible given the important role of buildings
and building energy consumption in advancing energy efficiency, and the need to ac-
celerate the retrofitting and replacement of building stock to reduce the energy and
emissions footprint of the built environment. Second, the common interests of the
transportation sector with both electricity generation and transmission infrastructure
point to the critical role played by an expanded and reinforced power grid in accom-
modating alternative-fueled, and in particular electric, vehicles.
196

Con
stru
ctio
n
Ele
c. G
en.
Eng
. / E
ffici
ency
Eng
. / F
ossi
l
Eng
. / G
ener
al
Eng
. / N
ucle
ar
Eng
. / R
enew
.
Eng
. / T
rans
mis
s.
Gen
. bus
ines
s
Mfg
.
Nat
l. G
as
NG
O
Res
earc
h
Tran
spor
t
0.54
0.28
0.610.13
0.28
0.39
0.31
0.31
0.28
0.38
0.04
0.280
0.22
0.6
0.45
0.61
0.35
0.26
0.53
0.54
0.31
0.37
0.31
0.310.2
0.52
0.5
0.27
0.31
0.62
0.590.5
0.55
0.56
0.17
0.52
0.570.5
0.52
0.51
0.12
0.48
0.55
0.21
0.31
0.28
0.190.2
0.53
0.32
0.31
0.51
0.520.3
0.3
0.13
0.31
0.21
0.31
0.5
0.29
0.45
0.29
0.410
0.33
0.46
0.17
0.49
0.33
0.29
0.31
0.08
0.3
0.31
0.54
0.48
0.27
0.22
0.52
0.290.2
0.73
0.27
0.28
0.11
0.27
0.29
0.21
0.28
0.11
0.330.3
0
0.23
0.08
0.01
0.06
0.260.2
0.18
0.08
0.29
0.22
Construction
Elec. Gen.
Eng. / Efficiency
Eng. / Fossil
Eng. / General
Eng. / Nuclear
Eng. / Renew.
Eng. / Transmiss.
Gen. business
Mfg.
Natl. Gas
NGO
Research
Transport
Sha
re F
DR
< 0
.1a
aa
a0.
00.
20.
40.
6
Mea
n pa
irwis
e Ja
ccar
d in
dex
0.35
0.40
0.45
0.50
Figure 6.6: Pairwise sectoral interest similarity for the 2010 Energy Strategy white pa-per. Similarity is computed from the firm-level interests as expressed in re-sponses to public comment. Interests are defined as topics that constitutegreater than 5% of a respondent’s topic posterior topic mixture. Pairwiserespondent similarities are computed as the Jaccard index. Sector similar-ities are computed as the mean the pairwise Jaccard index values for pairsof firms from different sectors. Cell statistics illustrate how novel overlapis, represented as the share of all comparisons with Benjamini-Hochbergfalse discovery rates (FDR) of 0.1 or lower (Benjamini and Hochberg,1995). See section 6.7.3 for formal definitions.
197

Reg
ulat
ors
# R
egul
ator
sTr
ansp
ort #
Tra
nspo
rtE
ng. /
Tra
nsm
iss.
# E
ng. /
Tra
nsm
iss.
Eng
. / T
rans
mis
s. #
Tra
nspo
rtE
ng. /
Effi
cien
cy #
Eng
. / E
ffici
ency
Eng
. / T
rans
mis
s. #
Nat
l. G
asN
atl.
Gas
# T
rans
port
Eng
. / F
ossi
l # E
ng. /
Tra
nsm
iss.
Res
earc
h #
Res
earc
hE
ng. /
Fos
sil #
Tra
nspo
rtN
atl.
Gas
# N
atl.
Gas
Eng
. / R
enew
. # E
ng. /
Tra
nsm
iss.
Eng
. / F
ossi
l # E
ng. /
Fos
sil
Eng
. / R
enew
. # E
ng. /
Ren
ew.
Eng
. / F
ossi
l # N
atl.
Gas
Ele
c. G
en. #
Eng
. / T
rans
mis
s.E
ng. /
Tra
nsm
iss.
# R
esea
rch
Eng
. / R
enew
. # T
rans
port
Ele
c. G
en. #
Tra
nspo
rtE
ng. /
Tra
nsm
iss.
# G
en. b
usin
ess
Gen
. bus
ines
s #
Tran
spor
tM
fg. #
Mfg
.E
ng. /
Fos
sil #
Eng
. / R
enew
.N
atl.
Gas
# R
esea
rch
Eng
. / R
enew
. # R
esea
rch
Eng
. / R
enew
. # N
atl.
Gas
Res
earc
h #
Tran
spor
tE
ng. /
Ren
ew. #
Mfg
.E
ng. /
Fos
sil #
Res
earc
hE
ng. /
Gen
eral
# E
ng. /
Tra
nsm
iss.
Eng
. / N
ucle
ar #
Reg
ulat
ors
Eng
. / T
rans
mis
s. #
Mfg
.G
en. b
usin
ess
# N
atl.
Gas
Eng
. / N
ucle
ar #
Eng
. / N
ucle
arE
ng. /
Fos
sil #
Mfg
.M
fg. #
Res
earc
hE
ng. /
Ren
ew. #
Gen
. bus
ines
sE
lec.
Gen
. # N
atl.
Gas
Eng
. / F
ossi
l # G
en. b
usin
ess
Mfg
. # T
rans
port
Gen
. bus
ines
s #
Res
earc
hM
fg. #
Nat
l. G
asG
en. b
usin
ess
# G
en. b
usin
ess
Ele
c. G
en. #
Res
earc
hE
lec.
Gen
. # E
lec.
Gen
.E
lec.
Gen
. # E
ng. /
Fos
sil
Reg
ulat
ors
# Tr
ansp
ort
Eng
. / G
ener
al #
Tra
nspo
rtE
lec.
Gen
. # E
ng. /
Ren
ew.
Eng
. / N
ucle
ar #
Eng
. / T
rans
mis
s.E
lec.
Gen
. # G
en. b
usin
ess
Gen
. bus
ines
s #
Mfg
.E
ng. /
Gen
eral
# N
atl.
Gas
Eng
. / F
ossi
l # E
ng. /
Gen
eral
Eng
. / N
ucle
ar #
Tra
nspo
rtE
lec.
Gen
. # M
fg.
Eng
. / G
ener
al #
Eng
. / R
enew
.E
ng. /
Gen
eral
# R
esea
rch
Eng
. / T
rans
mis
s. #
Reg
ulat
ors
Ele
c. G
en. #
Eng
. / N
ucle
arE
ng. /
Gen
eral
# M
fg.
Ele
c. G
en. #
Reg
ulat
ors
Eng
. / N
ucle
ar #
Gen
. bus
ines
sE
ng. /
Gen
eral
# G
en. b
usin
ess
Eng
. / E
ffici
ency
# E
ng. /
Ren
ew.
Eng
. / N
ucle
ar #
Res
earc
hE
ng. /
Gen
eral
# E
ng. /
Gen
eral
Ele
c. G
en. #
Eng
. / G
ener
alE
ng. /
Effi
cien
cy #
Reg
ulat
ors
Eng
. / E
ffici
ency
# E
ng. /
Nuc
lear
Eng
. / E
ffici
ency
# T
rans
port
Eng
. / N
ucle
ar #
Nat
l. G
asE
ng. /
Effi
cien
cy #
Mfg
.E
ng. /
Nuc
lear
# E
ng. /
Ren
ew.
Eng
. / E
ffici
ency
# E
ng. /
Tra
nsm
iss.
Eng
. / E
ffici
ency
# G
en. b
usin
ess
Eng
. / F
ossi
l # E
ng. /
Nuc
lear
Eng
. / N
ucle
ar #
Mfg
.E
lec.
Gen
. # E
ng. /
Effi
cien
cyE
ng. /
Effi
cien
cy #
Res
earc
hC
onst
ruct
ion
# Tr
ansp
ort
Gen
. bus
ines
s #
Reg
ulat
ors
Mfg
. # R
egul
ator
sC
onst
ruct
ion
# E
ng. /
Tra
nsm
iss.
Reg
ulat
ors
# R
esea
rch
Eng
. / G
ener
al #
Eng
. / N
ucle
arC
onst
ruct
ion
# E
ng. /
Ren
ew.
Con
stru
ctio
n #
Gen
. bus
ines
sE
ng. /
Effi
cien
cy #
Eng
. / F
ossi
lN
atl.
Gas
# R
egul
ator
sE
ng. /
Effi
cien
cy #
Nat
l. G
asC
onst
ruct
ion
# M
fg.
Con
stru
ctio
n #
Con
stru
ctio
nE
ng. /
Ren
ew. #
Reg
ulat
ors
Con
stru
ctio
n #
Reg
ulat
ors
Con
stru
ctio
n #
Eng
. / N
ucle
arC
onst
ruct
ion
# N
atl.
Gas
Con
stru
ctio
n #
Res
earc
hE
ng. /
Fos
sil #
Reg
ulat
ors
Con
stru
ctio
n #
Ele
c. G
en.
Con
stru
ctio
n #
Eng
. / F
ossi
lE
ng. /
Effi
cien
cy #
Eng
. / G
ener
alC
onst
ruct
ion
# E
ng. /
Effi
cien
cyC
onst
ruct
ion
# E
ng. /
Gen
eral
Eng
. / G
ener
al #
Reg
ulat
ors
010
020
030
0M
ean
pairw
ise
resp
onde
nt d
iffer
ence
Sector pair
Com
paris
on ty
pe
Bet
wee
n se
ctor
s
With
in s
ecto
rs
Figure 6.7: Similarity of interests in the 2010 Energy Strategy white paper, as mea-sured on the multidimensional simplex. The constitutes an alternativemeasure of sectoral similarity, using the continuous simplex distance asadopted by Grimmer (2010).
198

Linkage over time: the convergence of firm interests, 2006-2010
Finally, we can use the measures of similarity between sectors to study how the op-
portunity for linkage–due to the structure of interest group overlap–changes over
time. Figure 6.8 plots the similarity of two sectors in 2006, compared with their simi-
larity in 2010. We see that sectors that exhibited significant commonality of interest in
2006 continued to do so in 2010. For other sectors, however, we observe convergence
in interest commonality. In other words, sectors on balance appear to have developed
more similar interests, increasing the opportunity for issue linkage over time.
Why this occurred remains unclear. Two potential explanations stem from the in-
teraction of climate politics and economic developments in the EU after 2008. First,
as Zysman and Huberty (2013) propose, firms may undergo a cycle of “green spirals”
in which policy change leads them to alter internal business models such that their
interests now reflect demands for policy continuity. In this process, firms who may
not have understood their interests in 2006 as broadly set in the energy system writ
large may, by 2010, have come to do so.
Alternatively, the convergence in firm interests may reflect a more explicit strategy
by the Commission to articulate the economic benefits of systems transformation.
That shift would reflect the imperative for economic growth in Europe after the 2008-
2009 financial crisis and ensuing economic stagnation.
199
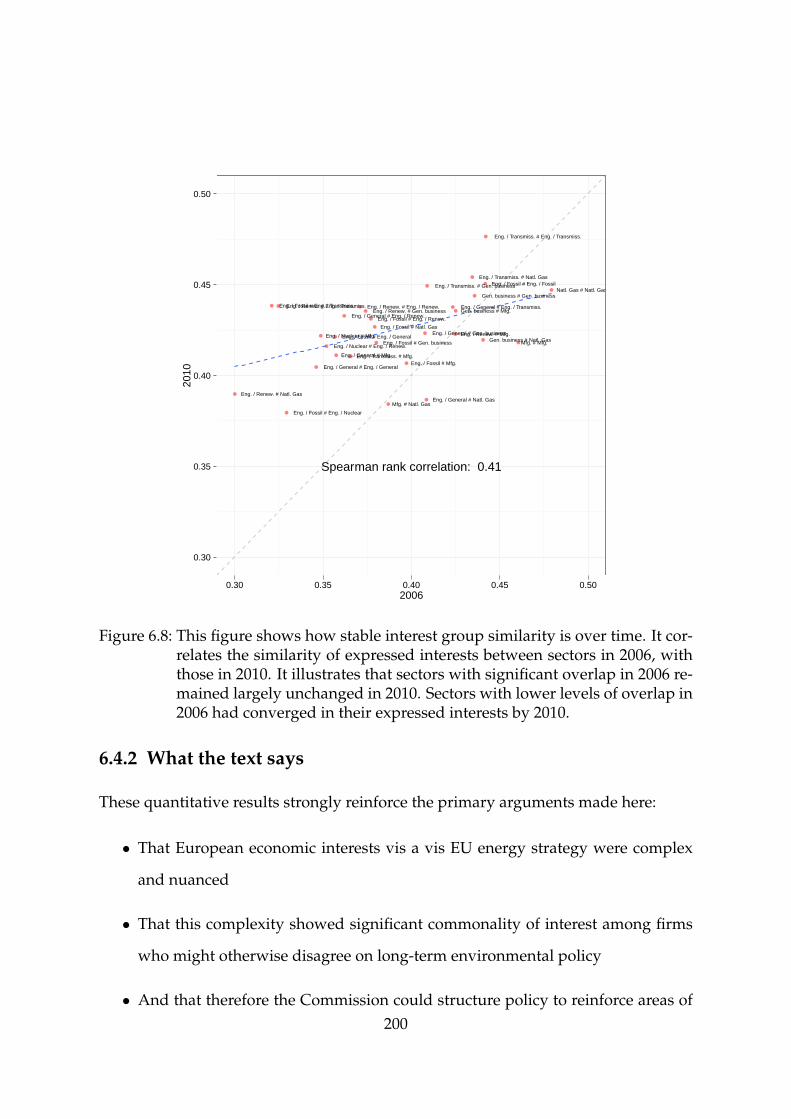
0.30
0.35
0.40
0.45
0.50
Eng. / Fossil # Eng. / Fossil
Eng. / Fossil # Eng. / General
Eng. / Fossil # Eng. / Nuclear
Eng. / Fossil # Eng. / Renew.
Eng. / Fossil # Eng. / Transmiss.
Eng. / Fossil # Gen. business
Eng. / Fossil # Mfg.
Eng. / Fossil # Natl. Gas
Eng. / General # Eng. / General
Eng. / General # Eng. / Renew.
Eng. / General # Eng. / Transmiss.
Eng. / General # Gen. business
Eng. / General # Mfg.
Eng. / General # Natl. Gas
Eng. / Nuclear # Eng. / Renew.
Eng. / Nuclear # Mfg.
Eng. / Renew. # Eng. / Renew.Eng. / Renew. # Eng. / Transmiss.Eng. / Renew. # Gen. business
Eng. / Renew. # Mfg.
Eng. / Renew. # Natl. Gas
Eng. / Transmiss. # Eng. / Transmiss.
Eng. / Transmiss. # Gen. business
Eng. / Transmiss. # Mfg.
Eng. / Transmiss. # Natl. Gas
Gen. business # Gen. business
Gen. business # Mfg.
Gen. business # Natl. GasMfg. # Mfg.
Mfg. # Natl. Gas
Natl. Gas # Natl. Gas
Spearman rank correlation: 0.41
0.30 0.35 0.40 0.45 0.502006
2010
Figure 6.8: This figure shows how stable interest group similarity is over time. It cor-relates the similarity of expressed interests between sectors in 2006, withthose in 2010. It illustrates that sectors with significant overlap in 2006 re-mained largely unchanged in 2010. Sectors with lower levels of overlap in2006 had converged in their expressed interests by 2010.
6.4.2 What the text says
These quantitative results strongly reinforce the primary arguments made here:
• That European economic interests vis a vis EU energy strategy were complex
and nuanced
• That this complexity showed significant commonality of interest among firms
who might otherwise disagree on long-term environmental policy
• And that therefore the Commission could structure policy to reinforce areas of200

common interest and mute areas of conflict, to build political support for broad
climate and energy policy reforms
However, as Grimmer and Stewart (2013) and others have pointed out, automated
text analysis does not alleviate the need for confirmation of the conclusions via close
reading of a sample of the underlying texts. Hence we now turn to firm responses
in detail for each comment period analyzed above. Close study of these responses
demonstrates the potential for asymmetric but overlapping interests among differ-
ent firms in different sectors, and suggests how the structure of the energy system
itself influences firms’ expressed interests in policy domains outside those that most
immediately affect them.
The responses selected below are intended to be indicative of the positions of the
major sectors involved in European climate and energy policy formation. Checking
these responses against those from other major firms in the same sector showed that
the expressed interests were by and large consistent. In specific instances–as with
the 2006 responses from Eurometaux, the American Chamber of Commerce, and the
Alliance for Energy-Intensive Industry–the use of common source material meant
there was nearly perfect correspondence.
The 2006 Energy Strategy Green Paper
We begin with the energy firm E.ON. E.ON is one of the major energy and power
generators in Germany, supplying over one trillion kilowatt-hours of electricity to
European customers in 2011. It also runs electricity distribution networks, sells and
distributes natural gas, and acts as a trader and middleman on European energy ex-
changes.
This business profile was particularly exposed to the Third Climate and Energy
package. In particular, the package (1) pushed for the unbundling of firms with verti-
201

cally integrated operations like E.ON’s electricity generation-distribution-retail oper-
ation; (2) encouraged cross-national coordination of grid regulation and investment;
and (3) sought binding targets in renewable energy adoption that would impact the
operations of large generators.
E.ON’s response reflects these concerns. It advocates first and foremost attention
to reformed markets for electricity, in which it remains highly competitive. But it
pushes against recommendations that vertically-integrated firms be forced to break
apart their companies to achieve in pursuit of market reform. Rather, it suggests
that legal separation among assets held under common ownership can achieve the
same ends. Legal separation was a weaker option than full breakup, insofar as it kept
generation, transmission, and distribution assets under common ownership even as it
attempted to keep separate the management of day-to-day operations. This position
was later ratified in EU legislation at the insistence of the Council of Ministers, in
spite of attempts by the Parliament to require member states to break up and sell off
vertically-integrated domestic energy firms.
Second, E.ON suggests that very aggressive renewable energy support schemes
run contrary to the goal of market competition. But it acknowledges that rapid ex-
pansion of European renewable energy use will require subsidies, and encourages
the Commission to seek harmonization of renewable energy support schemes so that
“investments [are] made in wind power and photovoltaic where the wind blows and
the sun shines, not where subsidies are the highest”. At the time (2006), Germany
had the most generous solar energy subsidy regime in Europe. This had led to an
explosion in solar energy deployments, many of which were probably inefficient due
to Germany’s northern European weather. Hence harmonization of support schemes
and mechanisms for cross-border credits for renewable energy adoption would likely
have reduced E.ON’s exposure to renewable energy mandates. However, this pro-
202

posal was only partially implemented in the 2008 Renewable Energy Directive, which
permits countries to traffic in certificates for renewable energy generation under lim-
ited circumstances, but does not impose harmonized rules for renewable energy sub-
sidies across the EU.
Third, E.ON is broadly supportive of European efforts to push research, develop-
ment, and deployment of energy efficiency and renewable energy technologies. It
endorses the Green Paper’s proposal (later passed into law) for a strategic energy
technology plan. But it advocates that this push include (unsurprisingly for a firm
with significant fossil fuel assets) attention to technologies like carbon capture and
sequestration (CCS). Successful CCS technologies would enable natural gas and coal-
fired power plants to operate without emissions, permitting their survival alongside
naturally zero- or low-emissions renewable and alternative energy sources.
E.ON’s positions were indicative of the priorities estimated by the quantitative
models: primarily interested in liberalized and competitive markets and energy se-
curity; encouraging of renewable energy subsidies with some regulatory reform; and
committed to technological research and development with the proviso that it sup-
port a wide portfolio of energy technologies.
Cogen-Europe, in contrast, represents the joint interests of co-generation operators
across the member states. Co-generation refers to highly efficient technologies for
simultaneously generating electricity and steam heat. By using heat left over from the
electricity generation process for industrial and building heat needs, co-generation
can contribute to radical increases in energy efficiency. It has been used to great effect
in many European member states; Denmark, for instance, is roughly twice as efficient
as the United States in using heat from coal-fired power plants, due to its widespread
use of co-generation in its district heating systems. Co-generation is also fuel-neutral,
and in many installations has been optimized to use waste products with very-low-
203
emissions life cycles.1
Cogen-Europe presents a case for market reforms in service of both emissions re-
duction and energy security. It argues for “solidarity between Member States” through
implementing common energy market regulations that prevent “Member States’ predilec-
tion for favouring national players.” These changes will benefit highly efficient so-
lutions like co-generation, they claim, by inhibiting the abuse of oligopoly control
over energy markets by large players. This position–common among other renew-
able energy firms–overlaps in part with E.ON’s preference for liberalized and com-
petitive markets. But it is clearly at odds with E.ON’s preference for national and
regional discretion on standardized grid codes and regulation. Only part of Cogen-
Europe’s preference here was implemented: network operators were required to pro-
duce transparent rules for grid access under the 2008 Energy Market directive, but
the specifics of those rules were left open and coordination among them was left to
the uncertain powers of the newly-created ENTSOE-E (European Network of Trans-
mission System Operators-Electricity).
Like E.ON, Cogen-Europe strongly supports a joint European effort in research,
development, and deployment of energy technology. While it says little about carbon
sequestration, it does favor other adaptations of fossil fuels for use in co-generation,
including coal gasification.
In contrast, to E.ON, however, Cogen-Europe is heavily in favor of explicit require-
ments for renewable energy adoption. In particular, it proposes that any new thermal
(that is, fossil fuel) generation capacity be co-sited with existing heat demand. This
implicitly means decentralized generation of electricity, with the use of leftover heat
to supply residential, commercial, and industrial heat demand. This is significant
1For instance, organic residues from forests, sawmills, or farms would typically rot or otherwisedecompose, releasing greenhouse gasses in the process. Burning those residues in co-generation plantsdisplaces the additional emissions that would have occurred if fossil fuels had been used instead.These residues’ contribution to the carbon cycle further reduces the marginal emissions footprint ofco-generation. See, for instance, Perry et al. (2008).
204
departure from what large generators like E.ON would prefer. While the Third Cli-
mate and Energy package was broadly supportive of co-generation and introduced
specific rules regarding the training, certification, and permitting of co-generation
installations, it did not go so far as to impose this requirement.
Finally, Eurometaux represents the European metallurgical industry, a very energy-
intensive sector facing intense competition from overseas competition in global com-
modities markets. In its comments on the Green Paper, it emphasized its support
for an integrated European energy policy but focused specifically on functioning
and competitive energy markets with stable long-term prices for industrial users.
These comments were echoed by other representatives of energy-intensive sectors,
including the European Aluminum Association and the Energy Intensive Industries
alliance, who used language that in many cases was identical to that used by Eu-
rometaux. This use of common lobbying language suggests a very high degree of
sectoral coordination.
For energy markets, Eurometaux notes that the deregulation of the industrial mar-
ket has gone ahead without parallel deregulation of residential markets. With resi-
dential prices remaining highly regulated, Eurometaux argues that any price pressures–
notably from the cost of the Emissions Trading System–appear disproportionately
in the energy costs for industrial users. These concerns, shared by other energy-
intensive industries, were later reflected in the explicit allocation of Emissions Trad-
ing Scheme revenues for support of “carbon leakage” sectors that risked losing com-
petitiveness due to energy and emissions price increases.
Concerns over price also led Eurometaux to agree with Cogen-Europe that full
ownership unbundling of large producers like E.ON would facilitate greater mar-
ket competition and greater price stability. It also argues for increased activity by the
Directorate-General for Competition in policing oligopoly abuse of market power in
205

energy markets. Both activities, it suggests, will be facilitated by new investment in
cross-border inter-connectors (which, as chapter 2 noted, can also serve the problem
of renewable electricity load balancing).
This confluence of interests on market regulation doesn’t extend, however, to re-
newable energy. Given its price concerns, Eurometaux favors conventional power
sources and a transition to a low-emissions energy base dominated by nuclear and
hydroelectric generation. In contrast to Cogen-Europe and other renewable energy
firms, Eurometaux opposes renewable energy subsidies except when the subsidy cost
is competitive with other emissions reduction alternatives. In other cases, it argues
that the cost of these subsidies to major energy consumers exacerbates an already
uncompetitive energy cost structure.
This constellation of firms across different sectors–integrated generation and distri-
bution, renewable energy, and energy-intensive manufacturing–suggests a complex
interplay among the interests exposed by the European Union’s pursuit of energy pol-
icy reform. Sector-specific interests are clear: in favor of lower prices and price stabil-
ity for heavy manufacturing, market competition and innovation for large generators,
and intensive support for new entrants in renewable energy sectors. But while these
interests are well-defined, they do not preclude areas of agreement. End-users and
new generation entrants alike favor greater regulation of suppliers’ market power;
both legacy and new entrant generators support a coordinated approach to research,
development, and deployment of new energy technologies; and greater market in-
tegration via investment in cross-border inter-connectors is viewed as favorable by
all.
Furthermore, the ultimate legislative outcomes, discussed further in chapter 5, tend
to reinforce areas of mutual agreement, and adopt less radical solutions in areas
where the sectors disagree sharply. Renewable energy policy, for instance, introduced
206

strategic coordination of renewable energy research and development, and provided
one (though perhaps not the optimal) means of harmonizing renewable energy sub-
sidies through cross-border transfers. But while Cogen Europe and other renew-
able energy organizations would have preferred complete unbundling of vertically-
integrated generators like E.ON, member states retained the option for administra-
tive unbundling–keeping vertically-integrated ownership but separating day-to-day
operations–in the final legislative package. Both the Commission and Council op-
posed attempts by the Parliament to force ownership unbundling on the energy sec-
tor, despite concerns that mere legal unbundling would not prevent legacy firms from
discriminating against new technologies or generators.
These qualitative results corroborate the inferences drawn from quantitative mea-
sures of firms’ expressed interests. As chapter 3 predicted, firms participating in a
highly networked sector like energy have complex and multifaceted interests. Con-
sequently, firms which may not agree in one area nevertheless may share interests in
outcomes elsewhere. Furthermore, firms’ interests aren’t confined to the narrow sec-
tor of the energy system in which they most directly participate. Rather, they encom-
pass developments across a range of sub-sectors, reflecting the role of the network in
transmitting the consequences of policy change.
The 2010 Energy Strategy White Paper
In contrast to the 2006 Green Paper, which foreshadowed concrete policy proposals,
the 2010 Energy Strategy white paper sought guidance on potential future changes to
EU policy. Those changes were, first and foremost, intended to ensure the achieve-
ment of the 2010 goals set out in the Third Climate and Energy package. But they also
reflected the perceived need for longer-term energy strategy, particularly in light of
the failure of the COP-15 climate talks, held in Copenhagen in late 2009, to achieve
207

any international momentum on global emissions reduction. Hence the interests
expressed here are more broadly indicative of concerns about how the European
Union’s policy regime will affect international competitiveness when the EU remains
a lone actor in emissions control.
Shell Energy Europe, as a major producer of fossil fuels, clearly has primary inter-
ests in preserving and expanding markets for its energy products. But in its response
to the 2010 Energy Strategy white paper, Shell supported a diverse range of poli-
cies reflective of both its interests as a energy producer and a long-term strategy for
benefiting from Europe’s shift to a lower-emissions economy. First and foremost, of
course, Shell advocated for increased use of natural gas as “the quickest and cheapest
way to reduce CO2 emissions”. Shell also sees natural gas as a natural complement
to expanded renewable energy production, primarily as a means of balancing the
intermittency of renewable energy and ensuring electric grid stability.
Beyond its primary energy interests, however, Shell also suggests a range of other
changes. It supports full ownership unbundling of gas transmission infrastructure in
order to increase the competitiveness of Europe’s gas markets. It also calls for Europe-
wide coordination of measures to allocate capacity at major transmission bottlenecks,
preferably in the form of capacity auctions that reinforce market competition. Finally,
over the longer term, Shell advocates for harmonization of gas network regulation
to the extent that it compensates for market failures. It views each of these develop-
ments as crucial to the development of price-competitive European markets in gas. It
also sees them as vital to diversifying Europe’s gas supply and increasing European
energy security.
Vestas Wind Systems presents a very different picture. As a globally-dominant
wind turbine firm, Vestas has very specific interests in the expansion of wind en-
ergy markets in Europe, and in European wind industry competitiveness worldwide.
208

This is consistent with its response to the call for public comment, where it first and
foremost encourages the Commission to accelerate implementation of the 2008 Re-
newable Energy Directive. In support of this goal, however, Vestas pushes for full
unbundling of transmission infrastructure, an expanded offshore power grid to serve
offshore wind generation opportunities, and secure financing for research and devel-
opment in to both renewable energy and transmission technologies. As with Cogen
Europe and Eurometaux in 2006, Vestas clearly views infrastructure investment as
vital to increasing the capacity of Europe’s energy system to support cost-effective
renewable energy adoption.
Vestas’ advocacy for infrastructure investment and planning is shared by major
grid operators. Both National Grid (in the UK) and TenneT (in Germany) face im-
pending offshore wind energy deployments in the North Sea. While Vestas’ primary
concern is ensuring the necessary grids to service large offshore wind farms, the net-
work operators emphasize instead the need integrated planning of grid design and
deployment to ensure that offshore and onshore grids inter-operate. They are also
shared by major legacy firms such as Vattenfall. Even though Vattenfall expresses
concern about the aggressive incorporation of intermittent energy (and its destabi-
lizing effect on the power grid), it shares the desire for an improved regulatory and
investment environment for large-scale grid infrastructure investment.
Finally, the 2010 consultation had significant participation from two interest groups
that had been absent in 2006: the social partners to the major energy sectors; and the
construction industry. Glass for Europe represents an interesting case of an energy-
intensive manufacturer in that sector. As noted above, the metals industry, another
energy-intensive sector, was primarily concerned about the price of energy in Eu-
rope and its effect on economic competitiveness. Eurometaux and its counterparts
were deeply concerned about energy policies that prioritized objectives other than
209

price and supply. In contrast, Glass for Europe, representing 90% of European glass
production, identified opportunities in the aggressive pursuit of building energy ef-
ficiency. Its response advocated for mandatory targets for energy efficiency as a so-
lution to emissions reduction, energy security, and economic competitiveness. It fur-
ther saw markets for energy-efficient solutions as a way to prime European compet-
itiveness in “green” industry. These positions were broadly consistent with the con-
struction sector at large, which would benefit from aggressive programs to retrofit
existing buildings with energy-efficient lighting, glazing, and heating solutions. For
instance, the European Construction Industry Federation recommended that Euro-
pean policy couple energy efficiency investments and with policies to expand the
use of smart grid technologies and active demand-side management of energy con-
sumption. These detailed interests coincide with the broader quantitative claims, that
construction had significant long-term interests in energy efficiency improvements,
made in section 6.4.1.
These positions are largely shared by Orgalime, the trade association for the Eu-
ropean engineering industries. They emphasize, first and foremost, the risks posed
to their firms by unstable and expensive energy supplies. But, acknowledging the
opportunity present in a low-emissions systems transformation, they favor explicit
steps to support and deploy highly energy-efficient smart grid technologies. To that
end, they support the Commission’s call for both a stable regulatory framework that
fosters an integrated and intelligent European power grid; and a research and devel-
opment process focused on building energy-efficient solutions for end consumers that
empower end users to improve energy efficiency directly. Finally, like the major grid
operators and legacy energy firms, they encourage the harmonization of renewable
energy subsidy schemes in order to encourage building renewable energy capacity in
the most geographically optimal location, rather than in the countries with the most
210
generous subsidy schemes.
In contrast to the engineers’ general optimism about opportunities to be had in a
low-emissions energy systems transformation, the Social Partners in the European
Electricity, Gas and Extractive Industries focused primarily on the risks to employ-
ment in Europe’s transition to a low-emissions economy. Each call for an increased
focus on the social dimension of EU policy through more focus on job re-training for
those workers displaced through the switch to low-emissions energy sources. This
concern about employment reflects a similar concern among industry associations
representing major heavy industries, including Eurometaux.2
In summary, the 2010 White Paper on European Energy Strategy received a much
broader set of responses, permitting a more nuanced view of European interest group
positioning on EU climate and energy policy. Once again, we notice significant over-
lap among the expressed interests of major sectors. Grid operators and renewable en-
ergy firms both favor greater regulatory stability and coordination as Europe adopts
even greater amounts of renewable energy. Those interests are shared by the engi-
neering firms that will design and supply the infrastructure for ensuring grid stabil-
ity and improving energy efficiency. In contrast, while large fossil fuel firms remain
focused primarily on market liberalization as the best way to ensure secure and cost-
efficient energy supplies, they do recognize the complementary role their products
(especially gas) will play in a renewable energy-based energy system. These posi-
tions all reflect similar preferences expressed by interest groups in the same sectors
prior to the the passage of the Third Climate and Energy Package.
2The contrast here between the these social partners and the Danish LO is instructive. The DanishLO represents a consortium of labor unions in the Danish economy, including the metalworkers. In2010, the LO signed on to the Danish Government’s aggressive plan for a 50% share of renewable en-ergy by 2050. Interviews with the LO in early 2011 indicated that the success of Denmark’s renewableenergy technology firms was instrumental in reducing the skepticism of workers in energy-intensivesectors like steel: the increased employment of metalworkers, and the demand for their products inrenewable energy industries, raised the possibility for new avenues of employment in these emergingsectors.
211

We also note that the areas receiving the most interest appear to be those for which
the Third Climate and Energy package fell short of initial hopes. Support for har-
monization of European renewable energy support schemes, and the coordinated
investment in large power grids, was present in the 2006 public consultation cycle
as well. As chapter 5 will show, the legislative process cut short some of these goals
despite the support of the European Parliament. Member state interests in sovereign
energy policy pushed against the standardization of EU-wide subsidy schemes for
renewable energy. Coordinated grid regulation was ultimately implemented through
a consultation process among national regulators, rather than via the Parliament’s
preferred solution of a single European regulator. Whether these expressed interests
on the part of EU firms will persist into a new cycle of European regulatory reform
born of the shortcomings of the past remains to be seen. The evolution of policy posi-
tions from 2006-2010 suggests this will occur. Regardless, it points, as we have argued
elsewhere, to an emerging constituency among major economic actors for further har-
monization of national energy policies.
6.5 Implications
In summary, major European economic actors expressed climate and energy policy
interests that often shared much in common with firms in other sectors and loca-
tions in the energy system. Those interests were grounded in the opportunities that a
low-emissions energy systems transformation created for realizing material benefits
from industrial change. Those benefits opened up the possibility of bridging political
cleavages over the narrow issue of emissions reduction itself.
Hence the European Commission, in pursuing the reform of Europe’s climate and
energy policy suite, could adopt a strategy of issue linkage. By yoking support for
emissions reduction to the creation of material returns to climate and energy policy,
212
the Commission could attempt to ground Europe’s policy in more concrete support
than environmental aspirations alone offered. That gave the policy added weight
which, as chapter 5 showed, helped carry it through the legislative process relatively
in tact. Conversely, the role of narrow environmental motivations was minimized.
In doing so, the Commission chose policy instruments that maximized neither envi-
ronmental efficacy, as preferred by the environmental lobby; nor economic efficiency,
as recommended by economic theory. Instead, its multifaceted policy targeted spe-
cific kinds of regulatory, technical, and market changes, some with arms-length ap-
proaches (like emissions trading), others with very targeted interventions (specifying
the regulatory harmonization of worker training programs).
This result has two implications for the politics of climate and energy policy. First,
it illustrates the powerful role that legacy energy systems can play in stabilizing sup-
port for emissions policy. The path-dependent nature of large physical networks like
energy constrains the set of choices policymakers face when embarking on emissions
reduction. Moving the trajectory of such a system towards a low-emissions path
while preserving its ability to serve industrial society confronts policymakers with
hard choices about technological, regulatory, and market reforms. But the results
here suggest that those constraints don’t merely impose barriers. Rather, they may
also reveal opportunities for grounding policy in the material benefits that such a
transformation might bring. Furthermore, since the network works to transmit the
effects of change, those benefits may be widespread, and may serve multiple, unre-
lated constituencies. Hence, for instance, the commonality of interest in network in-
vestment and reform among the energy-intensive and renewable energy industries.
These groups share little common interest in low-emissions energy sources. But they
mutually benefit from a hardened electricity grid.
By extension, however, while the European Union’s relative success suggests the
213

possibility of successful national strategies, it likely says little about how to imple-
ment such a strategy outside the EU. As this chapter has discussed, European policy
strategy draws heavily on both opportunities and shortcomings contingent on the
European energy system itself. The particular strength of Europe’s high-tech manu-
facturing sector, the exposure of central and eastern Europe to Russian energy geopol-
itics, the relative lack of indigenous energy resources, and other factors all facilitated
the political linkage of emissions reduction to energy systems reform. Other energy
systems, in other economies, will face different opportunities and constraints.
The United States provides a salient comparison. Like the EU, the US is a highly
federal political entity with an array of competing economic and political pressures.
Unlike the EU, however, the US has repeatedly failed to implement any significant cli-
mate change policy. Furthermore, despite specific appeals to energy security, energy
costs, and other factors, major economic interests (including the American Chamber
of Commerce) remain as of 2013 militantly opposed to serious climate policy. 3
Much of this derives directly from the structure of the American energy system. As
an advanced industrial economy, the US faces costs similar to those borne by Europe,
but its energy system creates far fewer opportunities for real benefits. Unlike Europe,
the US has long enjoyed the benefits of market integration; electricity and gas mar-
kets already span state borders, and power routinely moves long distances from ma-
jor producing regions to population centers. Hence market integration may deliver
little marginal benefit. Moreover, almost all of this power is generated using domes-
tic energy resources–chiefly coal and, more recently, natural gas. Those resources are
comparatively vast. To the extent that the US has an energy security problem, that
problem is (1) relatively small, (2) concentrated in petroleum for transportation, a
much harder problem to solve than electricity production, and (3) therefore functions
3We note, of course, that this problem is over-determined. The US also has a federal system inwhich minority interests have, as of 2012, become extraordinarily good at using institutional rules toblock policy progress. The usual caveats about exchangeability between the US and EU also apply.
214
largely as a rationale for expanding domestic petroleum production, at some envi-
ronmental cost, in areas like the Gulf Coast or Alaska. Finally, the US, as a relatively
closed economy, has less to gain from export-led growth in high-tech low-emissions
manufactures than the small, open economies of Denmark or Spain.
Hence the structural conditions that supported the Commission’s success in Europe
work to undermine the opportunity for similar bargains in the United States. Eu-
rope’s fragmented energy markets, and declining internal energy reserves, and com-
parative advantage in goods like wind turbines facilitate the linkage of emissions con-
trol to economic opportunity. That linkage promotes political support even among
firms otherwise uninterested in climate policy itself. In the US, in contrast, these
motivations are either much weaker or entirely nonexistent. The comparative diffi-
culty of securing firms’ support–documented by Skocpol (2013) and others–reflects
the tenuous near-term link between America’s climate policy choices and their eco-
nomic possibilities. Linkage politics and energy systems transformation point to the
means of securing support for complex industrial policy; but they ultimately succeed
or fail in the context of the structural background of legacy energy systems.
6.6 Conclusions: the role of the energy system in
structuring interests and policy
This extended discussion of the politics of European climate policy has emphasized a
relatively straightforward insight: that the transformation of modern energy systems
is first and foremost a complex industrial problem. That it has environmental objec-
tives does not necessitate that its political foundations be primarily environmental.
Indeed, given the enormous cost and complexity of a low-emissions energy systems
transformation, it would seem reasonable to posit that they should not be: the diffuse
215

aspirations of the environmental movement face serious problems organizing sus-
tained, acute opposition to highly motivated economic interests with a major stake in
fossil fuels.
But this may not doom the project of emissions reduction. The process of industrial
transformation will potentially create a range of benefits. Those benefits include the
returns to fixing legacy problems lurking in existing means of producing, distribut-
ing, and using energy; and in capitalizing on new opportunities for technological
innovation, employment, and growth. To stabilize politics, as the European example
suggests, these potential benefits need not exceed the cost of systems transformation
itself. Rather, they only need accrue to acute interests in ways sufficient to incen-
tivize their support for long-term policy continuity. As this chapter in particular
has demonstrated, even interests fatally undermined by long-term climate policy–
principally fossil fuels–nevertheless found reasons to support technological research
and development, power grid investment, and other components of Europe’s climate
and energy policy suite. In doing so they explicitly identified the benefits of those
actions as their primary motivations.
The sum total of these chapters raise a concern, however: are there limits to a
strategy of issue linkage. Advocates for a maximalist version of issue linkage–often
termed “green growth”–argue that climate investments will return more in narrow
economic benefits than they impose in costs. As Zysman and Huberty (2013) show,
existing arguments for this maximalist case fall well short of their aspirations. Hence
climate policy built on a political strategy of issue linkage should still be vulnerable,
even if less so than alternatives grounded in appeals to environmental stewardship.
Under enough pressure, whether from economics or the geopolitics of energy, the
coalition borne of issue linkage may well fall apart. The next chapter chronicles just
this breakdown in Europe, as the EU’s climate ambitions collide with the reality of
216

ongoing economic stagnation.
6.7 Appendix: data and methodological approach
This appendix provides the formal description of a new method for studying eco-
nomic policy interests through data made available by public consultation processes.
This method conceives of public consultation as a process of framing and response.
This permits direct analogy between public consultation processes and Bayesian mix-
ture models of text. Given this analogy, such models can be used to both discover the
set of policy domains covered by a public consultation process, and to map responses
onto those policy domains. I build a set of measurements and measurement tests
on this modeling approach that permits scaleable measurement of firm interests in a
complex issue space. Section 6.7.4 then describes implementation of this modeling
approach, and the data that supports it.
6.7.1 Public consultation as a stylized framing process
Public consultation in the European Union can be thought of as a framing process that
defines an issue space within which respondents voice positions on policy strategies.
The consultations considered here begin with specific policy proposals from the Eu-
ropean Commission: a unified energy strategy for Europe, as in 2006; or a long-term
expansion of the scope of European energy policy, as in 2010. Firm responses are
encouraged to address these issues directly.4
We can abstract the framing process thusly: A policy actor ρ introduces a policy
proposal discussing policy domains d ∈ D. Respondents r ∈ R each select a set of
4Responses to the consultations considered here are free-form, resulting in a degree of variation.Responses to other public consultations have sometimes been constrained further by questionnaires,which impose further framing structure on the policy space.
217

domains Dr ⊆ D for discussion in their public response, based on the specific issue
areas or policy domains in the policy proposal that affect them. The selection problem
is, of course, subject to strategic behavior. I discuss that further in section 6.7.6. As I
note, to the extent these selection complicates inference, it biases the measurements
presented below towards being more conservative about the scope of firm interests
and the potential for firm interest overlap.
6.7.2 Semantic topic modeling as an analogy to consultation
This stylized description of public consultation permits a direct analogy to a class
of Bayesian mixture models models of text known colloquially as topic models. As
pioneered by Blei et al. (2003), Latent Dirichlet Allocation and related topic models
attempt to infer the set of topics discussed in a text corpus on the basis of the empirical
distribution of words in texts. In simplified form, topic models assume:
1. That semantic “topics” are latent variables in a corpus of documents
2. That each document contain a mixture of topics
3. That topics are defined as a distribution over words in a vocabulary
The challenge is then to estimate both the topics themselves (defined as distribu-
tions over words) and the mixtures of topics as they appear in a document corpus
(defined as distributions over topics for each document). Blei et al. (2003) treat this
problem as a Bayesian process based on a Dirichlet prior over each document’s topic
distribution and each topic’s vocabulary distribution. Inferring the posterior distri-
butions from empirically-observed variation in term distributions in the topic corpus
can then occur via a variety of sampling and estimation procedures.
For illustration, consider a corpus discussing energy and climate issues and cover-
ing emissions, energy security, and technological innovation. The first topic would have218

a term distribution dominated by words like emissions, greenhouse, reduction, , the sec-
ond by supply, security, import, price, and the third by research, technology, innovation,
develop. The relative attention paid by each document in the corpus to each of these
topics is then inferred by the document’s observed distribution over the topic vocab-
ularies.
In practice, Latent Dirichlet Allocation and its descendents have been shown to
generate semantically-coherent topics (Boyd-Graber et al., 2009) for summarizing huge
document corpora. More recently, political scientists have applied topic modeling
to study judicial processes (Quinn et al., 2010), the agendas of elected policymak-
ers (Grimmer, 2010), and patterns of censorship in Chinese social media (King et al
2012). Many of these approaches have imposed additional structure on the statistical
model of actors, including the explicit treatment of time (Blei and Lafferty, 2006), and
the document-author relationship (Grimmer, 2010). Each of these amount to impos-
ing additional hierarchical structure on the Dirichlet process assumed by LDA and
related models.
The framing process considered here does not merit such additional structure. Pub-
lic consultations do not occur with any regularity, rendering the time dimension un-
informative. Because participation is voluntary, the incidence of repeat participation
is sparse, such that few respondents build up a large corpus of responses over time.
Furthermore, since the sector-level pattern of interests is one outcome under estima-
tion, it would assume one outcome to impose a a sector-firm hierarchy.
With this background, the direct analogy between Latent Dirichlet Allocation and
public comment processes becomes clear. Public comment processes frame a policy
discussion over a set of policy domains; when responding, respondents select from
those domains based on their interests. Policy domains can be thought of as latent
variables, defined as distributions over specific policy language (distinguishing a do-
219

main on emissions control from a domain on technological innovation). Hence the fram-
ing process effectively generates topics, thought of as pre-existing distributions over
terminology and language, that shape how firms respond to policy proposals.
In practice, this permits a modeling approach that directly maps from the language
used by respondents to their expressed interests in the policy domains under consid-
eration in the consultation itself. That modeling approach goes as follows:
1. Document baseline: Treat the original policy proposal as a corpus of docu-
ments, each document constituting a single paragraph assumed to address pri-
marily one policy domain
2. Topic discovery: Fit a LDA topic model to this corpus
3. Topic projection: Use that model to project firm responses onto topics discov-
ered by LDA, understood as the mixture of topics within each response as esti-
mated by the model
Figure 6.1 provides a schematic overview of the relationship of the framing process
to the modeling approach. The modeling process outputs the distribution of each
respondent’s expressed interests over the policy domains considered in the public
consultation process. We can treat this as either a continuous distribution; or as a
discrete distribution wherein respondents are treated as being interested in a specific
domain if that domain assumes more than a certain proportion of that distribution.
6.7.3 Estimating and testing interest overlap
To return to the central question that motivates this chapter: do firms express over-
lapping, though perhaps asymmetric, interests in the specifics of European climate
and energy policy? Given the distribution of firm interests over topics, we can now
estimate this in straightforward fashion.220
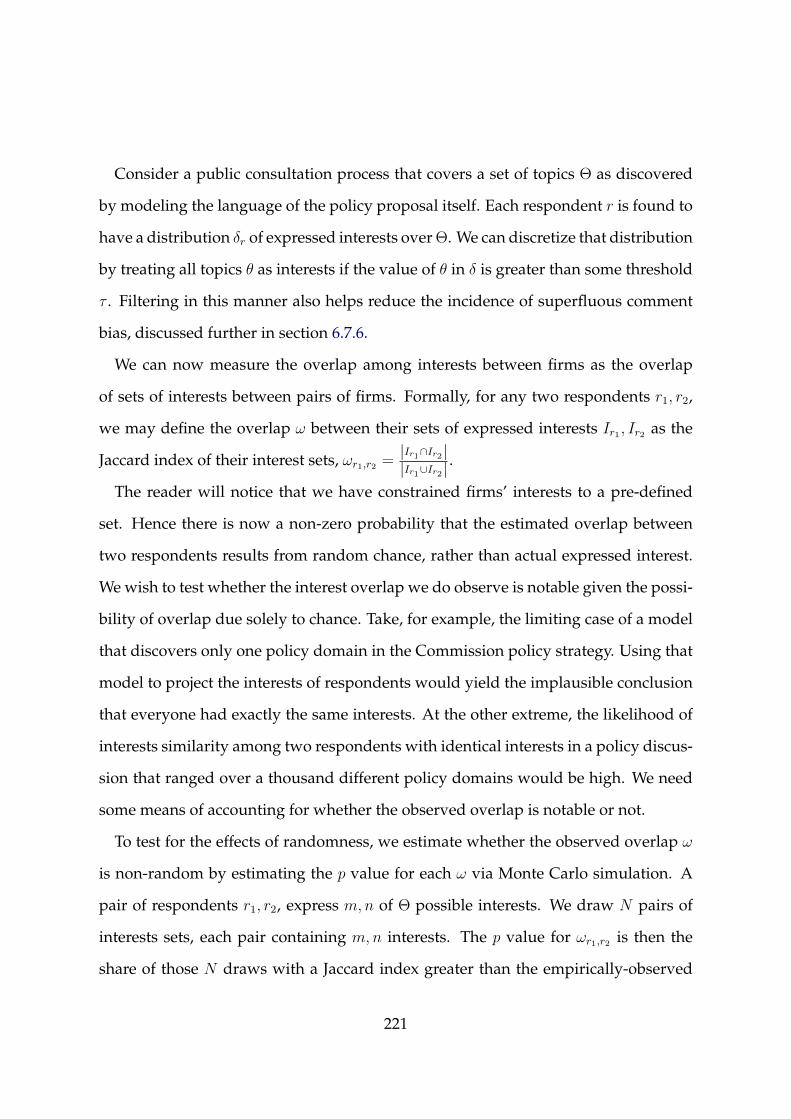
Consider a public consultation process that covers a set of topics Θ as discovered
by modeling the language of the policy proposal itself. Each respondent r is found to
have a distribution δr of expressed interests over Θ. We can discretize that distribution
by treating all topics θ as interests if the value of θ in δ is greater than some threshold
τ . Filtering in this manner also helps reduce the incidence of superfluous comment
bias, discussed further in section 6.7.6.
We can now measure the overlap among interests between firms as the overlap
of sets of interests between pairs of firms. Formally, for any two respondents r1, r2,
we may define the overlap ω between their sets of expressed interests Ir1 , Ir2 as the
Jaccard index of their interest sets, ωr1,r2 =|Ir1∩Ir2||Ir1∪Ir2|
.
The reader will notice that we have constrained firms’ interests to a pre-defined
set. Hence there is now a non-zero probability that the estimated overlap between
two respondents results from random chance, rather than actual expressed interest.
We wish to test whether the interest overlap we do observe is notable given the possi-
bility of overlap due solely to chance. Take, for example, the limiting case of a model
that discovers only one policy domain in the Commission policy strategy. Using that
model to project the interests of respondents would yield the implausible conclusion
that everyone had exactly the same interests. At the other extreme, the likelihood of
interests similarity among two respondents with identical interests in a policy discus-
sion that ranged over a thousand different policy domains would be high. We need
some means of accounting for whether the observed overlap is notable or not.
To test for the effects of randomness, we estimate whether the observed overlap ω
is non-random by estimating the p value for each ω via Monte Carlo simulation. A
pair of respondents r1, r2, express m,n of Θ possible interests. We draw N pairs of
interests sets, each pair containing m,n interests. The p value for ωr1,r2 is then the
share of those N draws with a Jaccard index greater than the empirically-observed
221

index ωr1,r2 . Intuitively, smaller p values suggest that the observed overlap between
the expressed interests of the two respondents was less likely due to random chance
within the constrained selection process imposed by the topic modeling process.
Finally, we must correct for the multiple-comparison problem, wherein for M pair-
wise comparisons we might expect some subset of those M be rare simply by chance.
In this case, we use the Benjamini-Hochberg false discovery rate FDR (Benjamini and
Hochberg, 1995) to correct for multiple comparison.
Likewise, we can test whether the observed overlap between firms r1, r2 is an out-
lier among the firms we do observe. Here the p value is the share of all overlaps
Ω > ωr1,r2 .
Moving from pairwise firm overlap to sector overlap, we can then estimate the
overlap in interests among sectors S1, S2 as the mean pairwise Jaccard index for all pos-
sible cross-sector firm pairs. Variance is estimated by bootstrap. Likewise, we can
estimate the degree to which these overlaps were novel by estimating for any set
of pairwise comparisons the share of FDR less than a threshold T = 0.1. Finally,
to check for whether the measurement of firm interest similarity was biased by the
process of discretizing interests, we check the results by comparing them to firm simi-
larity as measured by distance on the multidimensional simplex, as used by Grimmer
(2010). In practice the results are highly correlated, as shown in figure 6.9.
6.7.4 Data and implementation
Data for the original policy proposals come from the official documents published
by the European Commission and released as part of the public consultation pro-
cess (specifically The European Commission (2007) and The European Commission
(2010b)). Responses are taken from the publicly-released data files available at the
222

0.20
0.25
0.30
0.35
0.40
0.45
0.50
100 200 300 400Simplex distance
Jacc
ard
sim
ilarit
y
(a) 2006
0.35
0.40
0.45
0.50
100 150 200 250Simplex distance
Jacc
ard
sim
ilarit
y
(b) 2010
Figure 6.9: Correlation between measures of overlap among sector-level interests.This figure shows the correlation between two measures of sectoral in-terests: the mean pairwise Jaccard similarity among firms between twosectors; and the mean pairwise simplex distance between firms in two sec-tors. The Spearman rank correlation measures -0.275 (p = 0.10) for 2006and -0.320 (p = 0.00) for 2010.
website of the Directorate-General for Energy.5 Both the official documents and the
responses were scraped from the provided PDF files using the Tesseract OCR suite.6
Some responses were supplied in languages other than English; these were trans-
lated using the Microsoft Bing machine translation webservice.7 As shown in figure
6.10, response length varied from 200-15000 words for the 2006 consultation; and 400-
11000 words for the 2010 consultation. Median document length was 2100 words for
2006, and 1800 words for 2010.
Topic modeling used the implementation of Latent Dirichlet Allocation provided
5http://ec.europa.eu/energy/strategies/consultations/archive_en.htm6More detail on Tesseract is available at http://code.google.com/p/tesseract-ocr/.7Machine translation is convenient but imperfect. In particular, it encounters difficulties with
grammar and word order. But the methods used here destroy both grammar and word order by repre-senting texts as a bag-of-words. Hence the material impact of this form of translation error are limited.Note that as of 2012, the Bing translation webservice (and other commercial competitors) has muchstricter usage caps than applied when the translations were originally conducted. Bing translationcode is supplied at http://github.com/markhuberty/bing_translate.
223

0.00000
0.00005
0.00010
0.00015
0.00020
0.00025
0 5000 10000 15000Word Count
Den
sity Comment period
2006
2010
Figure 6.10: Distribution of respondent document lengths by comment period.
in the topicmodels package for R (Grün and Hornik, 2011). Standard preprocess-
ing of the text–case standardization, stopword and punctuation removal, and feature
selection via term frequency-inverse document frequency criteria–preceded model-
ing. Topic models were fit to each Commission document. Models were selected to
maximize the log likelihood of the model in a randomly held-out 10% of each policy
proposal.8 These models were then used to generate estimates of expressed interests
for respondents. Expressed interests were discretized by selecting interests for each
respondent that composed more than the median topic share of any topic for any
respondent.
8Model choice depends on the initial randomization. Hence we choose 100 initializations at ran-dom and fit a model under each initialization to maximize the log-likelihood of a randomly held-outsubset. The number of topics was chosen based on plurality voting across all 100 initializations.
224

6.7.5 Robustness checks
This analysis makes three conceptual assumptions about the relationship of the esti-
mated topics to firms’ actual interests. Each assumption merits discussion:
1. It does not attempt to estimate the semantic polarity (positive or negative sen-
timent) of firm’s orientation towards a topic. Instead, we assume that positive
interest and expressed interest are well-correlated.
2. It does not distinguish between statements about the past state of the world,
and preferences for future changes.
3. It assumes that we don’t need to account for the degree to which a firm discusses
a given policy domain, only that they do discuss it.
The first assumption reflects the difficulty of accurately estimating sentence po-
larity. Polarity relies heavily on contextual clues. Modeling those clues poses deep
analytic problems for natural language processing. Some methods for polarity analy-
sis rely on pre-tagged sentiment indexes like OpinionFinder (Wilson et al., 2005). But
these methods face limits when confronted with a clearly polar sentence that never-
theless lacks clearly polar adverbs or adjectives, as in “this policy will not work”. In-
spection of several documents indicates that firms’ topic emphasis appears to largely
reflect areas they would like to see implemented, rather than explicit discourage-
ment of specific policy aims. But this remains a potential area for improvement in
the methods employed here. It also reinforces the importance of careful reading of a
sample documents, as done in section 6.4.2, to corroborate the modeling assumptions
employed here.
The second assumption–that we need not distinguish between statements about
the present, versus preferences for the future, was tested by first screening for “modal”,
225
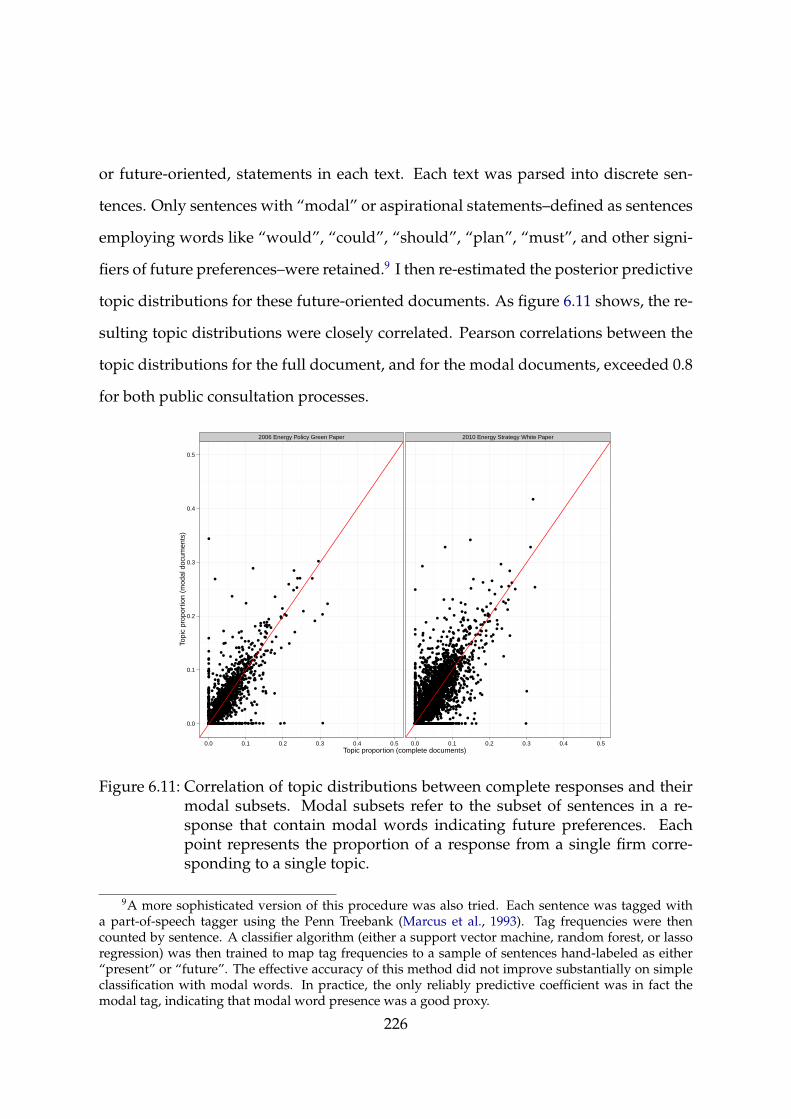
or future-oriented, statements in each text. Each text was parsed into discrete sen-
tences. Only sentences with “modal” or aspirational statements–defined as sentences
employing words like “would”, “could”, “should”, “plan”, “must”, and other signi-
fiers of future preferences–were retained.9 I then re-estimated the posterior predictive
topic distributions for these future-oriented documents. As figure 6.11 shows, the re-
sulting topic distributions were closely correlated. Pearson correlations between the
topic distributions for the full document, and for the modal documents, exceeded 0.8
for both public consultation processes.
2006 Energy Policy Green Paper 2010 Energy Strategy White Paper
0.0
0.1
0.2
0.3
0.4
0.5
0.0 0.1 0.2 0.3 0.4 0.5 0.0 0.1 0.2 0.3 0.4 0.5Topic proportion (complete documents)
Topi
c pr
opor
tion
(mod
al d
ocum
ents
)
Figure 6.11: Correlation of topic distributions between complete responses and theirmodal subsets. Modal subsets refer to the subset of sentences in a re-sponse that contain modal words indicating future preferences. Eachpoint represents the proportion of a response from a single firm corre-sponding to a single topic.
9A more sophisticated version of this procedure was also tried. Each sentence was tagged witha part-of-speech tagger using the Penn Treebank (Marcus et al., 1993). Tag frequencies were thencounted by sentence. A classifier algorithm (either a support vector machine, random forest, or lassoregression) was then trained to map tag frequencies to a sample of sentences hand-labeled as either“present” or “future”. The effective accuracy of this method did not improve substantially on simpleclassification with modal words. In practice, the only reliably predictive coefficient was in fact themodal tag, indicating that modal word presence was a good proxy.
226

The third assumption–that topic proportion is superfluous information for estimat-
ing the similarity of firm interests–is difficult to test without some external benchmark
of firm interest intensity. Recall that section 6.7.3 justified discretizing estimates of
firm interests as a means of discarding “superfluous” or perfunctory commentary. In
the limit, the assumption is reasonable: a firm which never mentions nuclear power
in its response likely has no position on the matter. Likewise, a firm that only dis-
cusses nuclear power strongly signals very narrowly defined interests. But the mid-
dle ground between these extremes is more ambiguous.
As section 6.7.3 discussed, we can test this proposition by comparing estimates of
interest overlap among firms using a discrete (Jaccard) versus a continuous (multidi-
mensional simplex) measure of overlap. If overlap estimates diverge between these
two measures, it would signal potential problems emerging from throwing away
rank-order information and low-salience interests. But we do not observe this diver-
gence in either the 2006 or 2010 outcomes. Figure 6.9 shows the correlation between
the Jaccard and simplex measures of similarity for both 2006 and 2010; both are well-
correlated. Hence estimating firm interests as discrete entities does not, in this case,
appear to corrupt the inferences we are trying to draw about firm interest behavior.
6.7.6 Sampling and selection issues
Participation in public consultation is of course neither mandatory nor is it the only
means at firms’ disposal for influencing policy outcomes. This raises the question of
whether and how firms’ responses are skewed through selection bias. We need to
consider two separate selection issues:
1. Is the sample of firms skewed?
2. Do firms skew what they say
227
For the purposes of this chapter, I argue that the sample is skewed, but in ways that
are reasonably obvious for this policy domain. Furthermore, while firms probably do
behave strategically when deciding what to say in response to calls for comment, I
argue that many consequences of this strategic behavior aren’t relevant to the conclu-
sions drawn here.
Respondents and selective response
The selection of firms is almost certainly skewed. As tables 6.1 and 6.2 show, re-
spondents represent a broad cross-section of sectors. However, several obvious geo-
graphic biases exist. The most notable omission in both 2006 and 2010 is Electricitè de
France (EDF), the large integrated electricity utility at the heart of the French electrical
system. This is particularly notable because the Third Climate and Energy package
was in many ways highly favorable to EDF. Most notably, it did not include the Com-
mission’s original proposal to force the breakup of vertically-integrated firms like
EDF. But EDF’s absence is likely due to its particular relationship to the French gov-
ernment. As one of the few “national champions” that survive from France’s postwar
industrial policy, EDF has close ties to the French state. In turn, France holds an effec-
tive veto in the European Council, ensuring that EDF’s interests are specifically repre-
sented.10 EDF thus has relatively little incentive to participate in public consultation,
even if the policies under consideration will affect it directly, because it has other,
very powerful channels of influence. Elsewhere, major vertically-integrated utilities
from other countries–such as E.ON and Energie Baden-Würtemburg from Germany–
are well-represented in the respondent sample. Moreover, their stated preferences–
for various forms of market opening, but against the formal breakup of vertically-
10For a long discussion of the relationship between the preferences of EDF and the French state inearlier periods of European energy policy making, see Eising (2002). He notes that both EDF and theFrench government changed bargaining positions quickly in order to ensure leverage against strongersupporters of liberalization, particularly the United Kingdom.
228

integrated entities–are consistent with the known preferences of France and EDF.
Separately, western European firms are over-represented compared with their east-
ern European colleagues. This is particularly true in for the period directly preceding
the passage of the Third Climate and Energy Package. This likely reflects relatively
less sophisticated firms with less-developed roots in Brussels.
Strategic disclosure of firm interests
Hence firm participation is likely skewed, but the ways in which it is skewed are rea-
sonably clear on inspection. Whether firms’ responses are skewed is a more difficult
problem to assess. Firms may act strategically in choosing both which positions to
disclose, and how to describe those positions. Taking firm statements at face value,
despite the potential for strategic disclosure, may lead to invalid inferences about
firms’ true preferences. Broockman (2012) demonstrates that overlooking this issue
has introduced bias into studies of private sector interests with respect to the United
States Medicare program: contra earlier authors, he shows that firms did not in fact
support Medicare. Instead, what support they did voice has to be understood as a
strategic response to the overwhelming pressure to pass Medicare in the mid-1960s.
In that environment, firms’ strategic interest lay in shaping what law did pass, rather
than a futile attempt to achieve their true preference, the maintenance of the status
quo.
In the public comment processes studied here, some firms and business associa-
tions display evidence of strategic disclosure. The American Chamber of Commerce
responded to both the 2006 and 2010 strategy papers with language that was (1)
broadly supportive of the Commission, (2) cautionary about aggressive pursuit of
renewable energy or emissions reduction, (3) very supportive of improved energy se-
curity and new source exploration, and (4) generally in favor of improved efficiency.
229
These positions contrast with those the Chamber took in the United States around
the same time. There, the Chamber strongly opposed the Democratic Party’s attempt
to pass a climate change bill. This opposition took one of two forms: either outright
blockage, or alternative proposals (such as a carbon tax) that were known to be polit-
ically impossible. The Chamber was also far more openly skeptical of the underlying
climate science. Its then head of energy policy openly cast doubt on the science be-
hind climate change. Invoking the famous standoff between biological evolution and
Biblical creationism, he called for a “Scopes trial” to expose the flaws behind climate
science and the corruption of the scientists that generated it (Krauss and Galbraith,
2009; Burnham, 2009).
The different positions taken by the Chamber on opposite sides of the Atlantic at
approximately the same time provide a material example of strategic interest group
behavior. The European climate policy context in 2008 was very different from the
American: it was less tolerant of outright climate denial, it already had a cap-and-
trade system in place, and there was strong momentum behind taking additional
steps to reduce emissions and reform energy markets. Given these differences, it’s
unsurprising that the Chamber adopted different positions: seeking to limit what
it perceived to be further damage in Europe, while stopping policy outright in the
United States.
However, this form of strategic behavior arguably does not matter for the infer-
ences drawn here. The problem of strategic disclosure identified by Broockman (2012)
matters if we wish to attribute agency: in his case, it weakens earlier arguments
that firms desired and lobbied for, rather than either opposed or merely tolerated,
a Medicare-style program of old age health insurance. But nothing in this chapter
should be construed as stating that any given firm or sector (and in particular the
sectors most closely associated with fossil fuels) necessarily sponsored or otherwise
230

drove the climate policy process.
Rather, the interest group behavior studied here reflects how firms positioned them-
selves given both existing EU policy and the Commission’s decision to pursue policy
reforms. Whether ostensible opponents like the American Chamber of Commerce
would actually have preferred a very different policy isn’t relevant to the arguments
here: that wasn’t the policy context on the table. Instead, we are interested in what
firms saw as in their interest given the context at hand; and whether the structure
of those interests opened up the possibility of cross-sector coalition-building. In-
deed, the central contention of the arguments here does not require that these firms
all wanted comprehensive climate policy. Instead, firms merely need to find some
benefit in one more more instruments used to effect a low-emissions energy systems
transformation. Whether firms’ stated interests in that context actually reflected their
first-best desires, or merely a position adopted for strategic reasons, would matter if
we had asserted that these interests reflected firm sponsorship of subsequent EU pol-
icy. But this chapter only sets out to show that the landscape of firm interests were
amenable to a specific kind of policy design.
231

7 Conclusions: the limits to linkage
7.1 Introduction
The European Union is held up as an example of “making policy for climate’s sake”
(Nelson and Vladeck, 2013). That may be. But this dissertation has shown that de-
signing policy for the climate means building policy with industries traditionally am-
bivalent about it. The vital role played by energy in modern industrial society, the
complexity of a transition to a new low-emissions energy system, and the costs in-
curred during that transition make it politically difficult, and technically unwise, to
treat climate goals and environmental means as inseparable. The political cleavages
wrought by strategies that do so complicate the passage of climate policy, and under-
mine its sustainability over time.
Instead, I have argued that successful policy regimes have found ways to couple
long-term climate goals to concentrated near-term economic benefits. Those bene-
fits flow from the tasks required to transform legacy energy systems. They may in-
clude resolving old problems, improving service quality through new infrastructure
investments, supporting economic competitiveness through low-emissions research
and development, or improving energy security. The real and tangible benefits that
come from these tasks help inculcate new constituents with an economic stake in
environmental goals. Consequently, the survival of climate policy need not depend
solely on the environmental good will of firms and citizens–an unlikely prospect in232

any event. Instead, these new constituents become advocates for policy continuity
through the economic benefits such policies bring, and not just the environmental
salvation they promise.
While this dissertation has focused on the European Union, climate policies built
on issue linkage have become increasingly common. In South Korea, the Presidential
Commission on Green Growth explicitly linked solutions to South Korea’s environ-
mental problems–of which climate change is one–to policies that will set the stage for
the next wave of economic development (Jones and Yoo, 2011). In the United States,
California has repeatedly asserted a link between its knowledge-based, innovation-
driven economy, and its stance on renewable energy adoption and emissions control
(State of California, 2010). China has become a leading exporter of photovoltaic solar
cells, though exactly how that international prowess will affect domestic decisions
remains uncertain. These and other examples point to states attempting to found en-
vironmental policy on economic grounds. But for every South Korea or California,
there are far more states where policy has fallen short, if it was even contemplated at
all.
What, then, are the limits to linkage? Despite the growing popularity of linkage
strategies for climate policy, issue linkage does not fully resolve the fundamental ten-
sion at the heart of long-run climate change politics. As currently understood, the
low-emissions energy system of the future offers no material improvement over the
fossil fuel systems of today. Issue linkage succeeds as a political strategy by concen-
trating what benefits might flow from a low-emissions energy systems transforma-
tion, and drawing political support from those who enjoy those benefits. But writ
large, that transformation does not offer economic benefits over and above the ca-
pabilities of today’s fossil fuel energy systems. The cost of systems transformation
remains a cost to bear for the climate, rather than an investment in near-term, abso-
233

lute gains in material prosperity.
This conclusion outlines two cases that point to the limits of linkage. The European
Union, to date a paragon of climate action, now faces prolonged economic stagna-
tion and financial instability. As the EU prepares for the next phase of reforms to
its climate policy framework, those economic difficulties have limited both the eco-
nomic capacity and the political will to take further action. Issue linkage could help
buffer the costs of transition when times were good; but the severity of the economic
downturn is testing its capacity to hold a coalition of industrial actors together.
In contrast, the United States points to the difficulty of employing issue linkage
when the underlying energy system offers little support. In contrast to the EU, the
American energy system embodies relatively fewer benefits for climate policy advo-
cates to call on. This relatively inhospitable context created real problems for issue
linkage strategies as the United States Congress attempted to pass a comprehensive
climate change policy in 2009. Whether those problems can be overcome remains
uncertain.
Finally, what of the more extreme version of issue linkage–the idea that low-emissions
energy marks the start of a new industrial revolution, on par with those earlier energy
transitions discussed in chapter 2? If true, this development might render issue link-
age unnecessary. Instead of fretting over the cost of transformation, countries would
pursue it for the absolute economic advantage promised by new alternative energy
sources.
7.2 The power of linkage
This dissertation began by noting the three central political problems endemic to cli-
mate change mitigation: the scope of the investment, the diffuseness of the reward,
and the unyielding timeframe. Effective climate change mitigation requires substan-
234

tial investments, now and for the foreseeable future, to ensure global environmental
stability. Though the real damages of unchecked climate change lie decades off, the
physical process of climate change demands that those investments begin today. The
cost and scale of that investment, its acute impact on specific sectors, encourages
strong opposition. Without equally strong advocacy from policy beneficiaries, pass-
ing and implementing policy proves difficult. And the more difficult it proves, the
more time passes, and the greater the cost–and more uncertain the effect–of future
climate action becomes.
Issue linkage offered a solution to only one of these problems. By structuring a low-
emissions energy systems transformation to generate acute benefits, policymakers
might be able to build industrial coalitions supportive of policy action. Those coali-
tions would have a greater chance of success against well-motivated opponents than
coalitions motivated by environmental stewardship alone. Yoking climate change
mitigation to the material challenges and opportunities of energy investment thus
promised a political strategy with better prospects for garnering support.
Hence issue linkage strategies may work because they address one of the three ma-
jor barriers to effective climate change mitigation. They likely won’t reduce the cost
of emissions reduction, and they can’t relieve the tight timeframe for action. But they
do help maximize and concentrate the material benefits created by a low-emissions
energy systems transformation. In doing so, they lay the groundwork for support-
ive policy coalitions grounded in economic benefits, rather than mere environmental
aspirations. Political science suggests that such policy coalitions will likely be more
durable, more capable of collective action, and less likely to erode over time than
alternatives reliant on non-material goals alone.
235

7.3 The limits to linkage
By implication, however, linkage only promises a means of building political coali-
tions more durable to the cost of climate change mitigation. It does not solve the
underlying tension that makes climate politics difficult in the first place. That ten-
sion originates with the implicit opportunity cost of investing in long-term environ-
mental stability versus short-term economic prosperity. That trade-off exists not for
lack of policy will, but because of the relative technical capabilities of fossil fuels and
low-emissions power, and the lack of obvious and acute absolute material benefits in
switching from one to the other.
Hence even a climate change mitigation strategy built on issue linkage remains
vulnerable. Two vulnerabilities merit particular attention, especially as they become
apparent in the policy experience of the European Union and the United States. First,
can issue linkage survive the business cycle? Will strategies that delivered targeted
benefits to constituents in relatively good times survive the fiscal retrenchment brought
by economic difficulty? Or will climate policy, even when designed to create eco-
nomic constituents, still fall low on the priority list? Second, can issue linkage work
in the context of legacy energy systems that offer fewer obvious benefits to systems
transformation? Chapter 3 argued that issue linkage depends on a supportive policy
environment. How supportive must it be?
For the first, the EU suggests the danger of economic stagnation to a policy strategy
of issue linkage. For the second, the US experience with climate policy illustrates the
difficulty that legacy energy systems pose when they undermine, rather than aug-
ment, the ability to tie climate action to economic returns. Both examples point to
the limits of linkage–both to the changing circumstances within a polity, and to the
variation in circumstances across them.
236

7.3.1 The European Union and the cost of economic stagnation
The study of European climate policy presented in chapters 4-6 focused on the de-
velopment of European climate policy through its most recent overall in 2008. Since
2010, however, European climate policy has stagnated, if not reversed. Emissions lie
16% below 1990 levels, on their way to the 20% target. Renewable energy adoption
has proceeded apace, with average annual growth rates of around 4% (The European
Commission, 2013b). But emissions reduction has come largely through reduced eco-
nomic activity, as Europe endures its worst economic performance since the Great
Depression; and renewable energy growth lags behind the 6% per annum required
to meet the 20% target for 2020 (The European Commission, 2013a). Europe’s recent
progress on its goals has come at a pace, and through a method, insufficient and
unattractive for long-run policy.
In this context, three developments merit specific attention. First, economic stag-
nation has reduced the capacity for the EU to engage in energy-related investment.
Second, that same economic stagnation has depressed the long-term price of emis-
sions in the Emissions Trading System, reducing its effectiveness as both a subsidy
regime and an emissions control mechanism. Third, changes in the national policy of
several member states–most notably Germany–will likely slow European progress on
emissions in the near term. Each of these developments undermine Europe’s policy
regime without actually dismantling it.
First, economic stagnation. After the 2008-2009 financial crisis, Europe slid into
a prolonged economic recession. The policy response was weak, and little fiscal or
monetary stimulus occurred in the EU as a whole. The so-called PIGS (Portugal, Ire-
land, Greece, and Spain) incurred high unemployment and worsening fiscal balances.
They subsequently engaged in harsh austerity as a condition of fiscal support from
the Eurozone core. Unemployment in the EU periphery spiked into the double. Fis-
237

cal austerity appears to have worsened primary balances as well as economic growth:
the United Kingdom, which had avoided the fate of the PIGS, endured a double-dip
recession consequence of very severe budgetary austerity.
AT BE BG CY CZ DE
DK EE EL ES FI FR
HU IE IT LT LU LV
MT NL PL PT RO SE
SI SK UK
−15−10
−505
10
−15−10
−505
10
−15−10
−505
10
−15−10
−505
10
−15−10
−505
10
2004
2006
2008
2010
2012
2014
2004
2006
2008
2010
2012
2014
2004
2006
2008
2010
2012
2014
Year
Rea
l GD
P g
row
th, p
erce
nt
Figure 7.1: Economic growth in the European Union around the financial crisis. Alldata show real GDP growth per annum. Source: Eurostat.
These developments had two effects on European climate policy. First, they lim-
ited the resources–public or private–available for investment in low-emissions in-
238

frastructure and technology. Feed-in tariffs to subsidize the adoption of renewable
energy were cut in Germany, Spain, and the United Kingdom.1 Appeals by European
Energy Commissioner Gerhard Öttinger for member state contributions to invest-
ments in cross-border interconnector capacity worth ¤1 trillion fell largely on deaf
ears. Forced to choose between continued investment in low-emissions technology,
and provision of more basic governmental services in the face of budgetary austerity,
many states have chosen the latter.
Second, prolonged economic stagnation reduced demand for emissions permits
under the Emissions Trading Scheme. Factories and power plants sitting idle for lack
of demand had little use for the permits they already owned, and no reason to buy ad-
ditional permits. Weak demand and excess supply depressed permit prices to a low
of ¤2.13 per ton in early 2013, down from ¤30 per ton in 2008. At that price, the ETS
could fulfill neither of its two primary functions. Low prices weakened incentives for
alternative energy adoption, energy efficiency investments, and other climate change
mitigation measures. Low permit prices also undermined the second role of the ETS,
that of shadow budget. The scale fiscal transfer accomplished through free permit al-
location, discussed in detail in chapter 4, fell with the value of the allocated permits.
The EU has attempted to respond to these challenges, though without much suc-
cess. In April 2013, the European Commission proposed to stabilize the ETS permit
price by reducing the number of permits in circulation. As of this writing, those
changes were rejected by the European Parliament, though negotiations remain on-
going (McGrath, 2013). The vote raised the spectre of a split between traditional po-
litical allies in the energy sector and energy intensive industries. The energy sector
lobbied for tightened permit caps to preserve both regulatory certainty and the value
1For Spain, see Chazan (2010). For the United Kingdom, see Harvey (2012), though the form anddegree of cuts remains contested (BBC, 2012). German solar tariffs were cut, but installations continuedapace as the German government committed to retiring all of Germany’s nuclear plants (Steitz, 2012).For a complete discussion of recent changes in German feed-in tariff policy, see Fulton and Capalino(2011).
239
of their freely-allocated emissions permits. In contrast, energy intensive industries,
facing increased competition from Chinese and American firms (the latter enjoying
record-low prices for natural gas) fought any attempt to raise the permit price. Their
resistance highlights what Helm et al. (2004) had pointed out: management of the
carbon price across the business cycle requires a degree of political insulation usu-
ally found in central banks. In this case, the Parliament’s rejection of a pro-cyclical
increase in the price European firms pay to emit points to the limits of carbon pric-
ing as a viable instrument. Furthermore, having coupled the pricing instrument to a
compensation scheme, that choice frays the political bargain as well.
This is not to say that the European project is doomed. Germany’s commitment to
retire its nuclear power plants by 2022 appears real, and will require substantial ex-
pansion in its renewable energy capacity. It also risks, however, near-term expansion
in the use of coal and natural gas (Nicola, 2013). Portugal has recently demonstrated
that it can accommodate up to 70% renewable power for months at a time, of which
about half came from intermittent sources (Koronowski, 2013; Ashton, 2012). At the
EU level, the Commission continues to plan for achievement of the 2020 targets, and,
as noted above, to look forward to reforms needed for 2030. But over the near term,
Europe’s linkage strategy still risks falling short as the cost of further investment out-
strips the willingness or ability of governments and citizens to pay. The edifice of
emissions pricing and market reform would remain, while the core ceased to func-
tion.
7.3.2 The United States and the barrier of the energy system
If the EU showcases the limits to linkage under the pressure of changing circum-
stances, the US illustrates the structural barriers that might arise to linkage strategies
in the first place. The United States has routinely failed to adopt comprehensive cli-
240

mate change policy. That failure has occurred regardless of what party held office, or
whether it was pursued in good economic times or bad. Moreover, that failure has
occurred despite appeals to a strategy of issue linkage to sustain American climate
goals. A variety of policy advocates (Jones, 2008; Stepp, 2010, 2011) have argued for
a substantive link between American economic prosperity and investments in low-
emissions energy systems. Other analysts point out the savings that could be had
from remaking America’s power grid, whose current state of decrepitude makes the
US economy more vulnerable to blackouts, extreme weather events, and equipment
failure (Gellings, 2011). Still others, particularly after the terrorist attacks of Septem-
ber 2001, point out the absurdity Americans of buying oil from the Middle East even
as they decry the politics and policies those oil dollars help fund (Farquhar, 2009).
By and large, however, these appeals have not contributed to broad support for a
coherent approach to a low-emissions energy systems transformation. Instead, as
Nelson and Vladeck (2013) show, American policy is a hodgepodge of subsidies,
command-and-control mandates, and regulation. Though without the degree of co-
ordination observed in Europe, it is not without success: American emissions have
stabilized despite economic recovery (Energy Information Administration, 2012). Yet
much of that stabilization depends on the ongoing substitution of natural gas for
coal, consequence of the boom in shale gas (Carey, 2012). While fuel switching helps
retard the growth in fossil fuel emissions, it does little to resolve state-level issues
over renewable energy integration, long-distance grid transmission, and inter-state
competition over low fuel prices. It may also undermine investment in renewable
energy technologies, by enlarging the “green spark spread” between fossil fuel- and
renewable-generated electricity (Wynn, 2011). Cheap gas, in concert with budgetary
austerity, has also pressured US states to restrict or eliminate their mandates for re-
newable energy adoption (Martin, 2013).
241

Against this background, recent attempts to formalize a federal approach to climate
change policy point to a different set of limits to linkage. The 2009 American Clean
Energy and Security (ACES) Act would have set up a carbon trading market in the
United States, and used the revenues from that market to both support renewable
energy investment and buffer transition costs for the fossil fuel industry and export-
oriented sectors. The bill passed the United States House of Representatives 219-212,
on a nearly party-line vote. The bill was never brought to a vote in the Senate. Sub-
sequent proposals for a federal clean energy standard have also found little traction.2
The reasons for this policy failure are complex and arguably over-determined. In-
stitutional dysfunction, unrelated to either climate change or energy policy, certainly
played a role. ACES failed in the Senate in part due to filibuster threats from the
Republican minority (Chaddock, 2010). This was part of a broader trend towards
increased use of the filibuster that now affects almost every aspect of the Senate’s
business (Talev, 2007; Marziani and Liss, 2010). In that sense, the most recent failure
of American climate change legislation is over-determined–it certainly bears the taint
of the more general institutional paralysis that has gripped Washington, D.C. in the
early 21st century.
Climate change has also become wrapped up in the broader polarization of Amer-
ican interests groups and the party system. This had led not just to agreements over
policy means, but to polarization of opinion on whether policy problems exist at all.
In the run-up to the ACES vote, climate change skepticism became common among
conservative voters and political action groups, and was echoed by Republican Con-
gressional representatives (Nordhaus and Shellenberger, 2009; Dunlap and McCright,
2008). The head of climate and energy policy for the American Chamber of Commerce
called for a “Scopes trial” to expose fraudulent climate science (Krauss and Galbraith,
2Senator Jeff Bingaman introduced the Clean Energy Standard Act (Senate Bill 2146) in 2012, whichwould have mandated a clean energy portfolio standard targeting 84% renewable energy consumptionin electricity production by 2035. It died in committee.
242

2009; Burnham, 2009). The Competitive Enterprise Institute, a conservative economic
think tank, ran ads throughout the Washington D.C. area with the slogan “CO2: they
call it pollution, we call it life!”, based on the discredited notion that increased atmo-
spheric CO2 concentrations would improve plant growth. The American Enterprise
Institute has floated a revenue-neutral emissions tax as superior to a cap-and-trade
system, but in doing so came under fire from other conservative groups opposed to
new taxes of any form (Hassett et al., 2007; Hargreaves, 2012). This context exac-
erbated the political difficulty of passing any form of low-emissions policy, as the
political debate devolved into partisan conflict rather than bargaining over policy
instruments. This again, echoed broader themes in American politics that could be
found in health, fiscal, defense, and other environmental policy domains.
Looking beyond these long-term political dynamics, however, climate policy ad-
vocates did attempt some version of a political strategy built on issue linkage. Pres-
ident Barack Obama argued that the US should act on emissions control “to truly
transform our economy, protect our security, and save planet from the ravages of cli-
mate change” (Layzer, 2011). The US Climate Action Partnership (USCAP), which
brought major industrial firms and environmental policy groups together to lobby
for policy action, marked a concerted attempt to bridge the persistent environment-
economy divide. The terms of a prospective bargain were clear: the environmental
lobby would get climate protection; and industry would gain a stable policy environ-
ment with a predictable emissions price, more regulatory flexibility on conventional
low-emissions energy sources like nuclear power, new investments in power grid
infrastructure, and federal support for research, development, and piloting of new
low-emissions technology.
As Skocpol (2013) and Pooley (2010) point out, though, the bargaining process in-
side USCAP was highly unequal. Environmental interests had little to offer either
243

the energy sector or the broader industrial economy beyond policy stability–but sta-
bility in the form of predictably higher costs and more rapidly depreciated capital.
Hence, Skocpol argues, the bargaining process was problematic from the start. In-
dustry could always argue that costs were too high. The absence of tangible benefits
left policy supporters bereft of means to build strong supportive lobbies for change.
Instead, the fight devolved to arguments over the distribution of costs–fights that ul-
timately complicated the proposed regulatory regime and undermined its potential
effectiveness. That, in turn, fragmented the environmental lobby: both Greenpeace
and Friends of the Earth ultimately opposed the bill, along with hundreds of other
smaller groups. Given the lack of stable insider bargains, the failure to mobilize pub-
lic opinion for climate action that Skocpol (2013) critiques damaged the cause even
more.3
But why were benefits so hard to find? The answer lies, in part with the particular
structure of the American energy system. Contrasted with Europe, the US lacks many
of the obvious benefits the EU called on to justify its climate policy suite. Europe, we
will recall, targeted benefits from export-led growth in renewable energy and energy
efficiency technologies; reduced intra-European price volatility through market in-
tegration; reduced exposure to Russian energy geopolitics; and lower energy prices
through increased market competition in the electricity sector. Each of these bene-
fits originated in a particular aspect of either Europe’s energy system or the interface
between that system and the broader economy.
The rhetorical record shows that American politicians and policy advocates in-
voked similar benefits to justify climate action. But in the US, many of these bene-
fits were either already realized, or much less attractive. American energy markets
3Of course, the problems of public opinion are deeply tied up in the strong partisan divide overclimate change itself. That divide, as Harrison and Sundstrom (2007) note, is much less salient in Eu-rope, possibly consequence of the role played by green parties in proportional representation systems.Hence even if mobilization had worked to pass climate policy, it’s doubtful that it could have sustainedclimate policy given the broader partisan environment.
244

are already well-connected within the so-called FERC regions.4 Cross-border energy
trading among the US states, and between the US and Canada, has been the norm
for decades. The Federal Energy Regulatory Commission (FERC) already has author-
ity, granted in the 2005 Energy Policy Act, to coordinate the construction of interstate
transmission capacity. Hence the major features of the Internal Market Directive were
already in place in the US. To the extent that firms wanted these things, the opportu-
nity to link their delivery to support for low-emissions energy had passed.
Energy security provided similarly weak motivation. The United States has sig-
nificant domestic coal, oil, and natural gas reserves.5 To the extent that the US has
an energy security problem, it comes mostly from petroleum, of which the US im-
ports approximately 45% of its demand (Energy Information Administration, 2013).
Much of that oil, however, comes from relatively stable countries–Canada has been
the largest exporter of crude oil to the United States since 2006. Furthermore, given
the uses of petroleum, renewable energy may not be the obvious way to solve the
energy security problem itself. Petroleum is largely a transportation fuel. Hence even
if the US decided that its dependence on foreign petroleum was unacceptable, zero-
emissions energy might not be the answer. For instance, an all-electric vehicle fleet
fueled by coal- or gas-fired power plants might prove an easier option. US domestic
4The FERC power markets aggregate US states into integrated energy systems with shared mar-kets for generation and transmission. There are presently ten FERC regions, of which eight span morethan one state. Texas and California are each contained within their own FERC region, owing to theirgeographic size. Texas is relatively autonomous within its region. California, however, imports signif-icant amounts of power, particularly hydroelectricity, from neighboring states. For more information,see http://www.ferc.gov/market-oversight/mkt-electric/overview.asp
5The European Union reports that the US had, as of 2010, approximately 237,000 million tons ofproven coal reserves. Germany, the largest of the European coal producers, had only 41 thousand mil-lion tons. Europe’s top five coal-producing states combined had proven reserves totalling only abouta fifth of the American capacity. Europe’s primary domestic oil reserves in the North Sea are in de-cline. In comparison, the International Energy Agency estimates that the US will become the world’slargest oil producer by 2017. Prospective shale gas reserves are more comparable: the Energy Infor-mation Administration estimates that the US had approximately 39 years’ worth of reserves at currentconsumption rates, compared with 43 years’ worth for Europe. But Europe has avoided exploitingdomestic shale gas for environmental purposes. For coal, see Europe’s Energy Portal (2011). For ex-panding US oil production, see Rosenthal (2012). For gas, see Energy Information Administration(2011b). For European delays in shale gas exploration, see Scott (2013).
245

oil production is also estimated to increase substantially by 2030.
If the American energy system yields fewer problems to be solved, it also generates
few opportunities to be seized. The US is a much larger, much more closed economy
than most of the European member states. In that environment, export-led growth
constitutes a much smaller share of economic activity than it might in Denmark or
Spain. For comparison, consider that Denmark earns almost ten percent of its ex-
port revenue from wind turbines and related products. In comparison, the US in
2010 earned about three tenths of one percent of its export income from wind tur-
bine goods. Coal exports alone ran approximately twenty times this value.6 The US
is thus unlikely to earn the same relative returns to green energy industry; and the
lack of such returns those industries may have correspondingly less political power.
Furthermore, the decline of manufacturing in the US has made both manufacturing
firms and workers less politically powerful. And in any case, the National Associa-
tion of Manufacturers allied with the American Chamber of Commerce against the
ACES climate bill, arguing that its costs far more than they anticipated any uptick in
demand for their goods.
Hence, even when major environmental groups set out for a “grand bargain” with
industry, the American context relegated them to bargaining largely on costs. Euro-
pean policymakers could call on an array of benefits from energy systems transforma-
tion to help build supportive industrial coalitions. The structure of the American en-
ergy system–its relative energy security, regulatory and market integration, and weak
green industrial capacity–deprived American policymakers and policy advocates of
those options. In that context, striking bargains among policy elites that carried the
force of economic as well as environmental support proved very difficult. Against
6US coal exports in 2010 totaled 82 million tons, at an average price of around $78 per ton. Thisequates to an approximate export value of $6.4 billion, or around twenty times the $322 million of windturbines exported by US firms that year. For US coal exports, see Energy Information Administration(2011a). For US wind turbine exports, see the UN COMTRADE statistics for HS-6 code 850231.
246

the background of intense partisan polarization and institutional paralysis, this lack
of upsides to the pursuit of low-emissions energy severely retarded progress.
7.4 Alternatives to linkage: the promise and problem of
green growth
The limits to linkage expressed in these two cases have different features, but ulti-
mately a common origin. Issue linkage as a political strategy cannot resolve either
the cost or technical barriers to climate change mitigation. Those costs are particu-
larly difficult to bear when the fall acutely on powerful industries and their workers
who, in a world without a comprehensive global climate deal, fear lost competitive-
ness and jobs. Hence so long as the cost problem remains in effect, the fundamental
political conundrum of climate change mitigation will also remain. Exactly how this
problem will manifest itself will vary with national circumstance. In the EU, eco-
nomic stagnation undermined the functioning of the ETS even as it diluted the will
for policy reform; while in the US, the comparative lack of acute benefits from a low-
emissions energy systems transformation undercut attempts to build broad industry-
environment coalitions. While their roots are different, these two outcomes ultimate
manifest the underlying problem.
Given these barriers, do options exist that would transcend the fundamental ten-
sion posed by climate change mitigation? The earlier periods of energy systems trans-
formation discussed in chapter 2 suggested one answer. Each of those transforma-
tions occurred, ultimately, for one of two reasons: acute shortages, or novel economic
opportunities. Shortages seem unlikely to motivate effective climate change miti-
gation. Petroleum in particular has occupied the attentions of the Peak Oil commu-
nity, which warns of declining reserves amidst rising international demand. But Peak
247
Oil’s consequences would fall largely on transportation rather than electricity genera-
tion. Global estimated reserves of coal and natural gas are somewhat more generous,
though the estimated lifetime of available reserves clearly depends on substitution
between different fuels. Regardless, the timeframes estimated for these peaks are
wholly incompatible with effective climate change mitigation: most estimates put
“peak fossil energy” sometime in the 2030-2040 range, which would imply persistent
emissions well above sustainable rates for at least another two decades. Even those
timeframes may prove optimistic: technological innovation continues to advance ac-
cess to deep ocean, shale, and tar sands deposits of oil and natural gas that were
though inaccessible ten years ago.
Novel economic opportunity promises a different outcome. If low-emissions en-
ergy delivered net economic opportunity–rather than merely some side benefits that
might help balance costs–then it would open the opportunity for a low-emissions en-
ergy systems transformation to become self-sustaining. The enthusiasm for such an
opportunity–broadly termed “green growth”–grew rapidly after 2008, as the financial
crisis, ensuing recession, and lackluster international climate negotiations sparked a
search for new policy avenues (Jones, 2008; OECD, 2010, 2011).
Unfortunately, this enthusiasm has not led to answers about exactly how a low-
emissions energy systems transformation would actually create economic opportu-
nity. In particular, green growth theories have yet to identify what novel economic ad-
vantages low-emissions energy might offer over fossil fuels. As Zysman and Huberty
(2013), those advantages–and not the actual act of systems transformation itself–lay
at the heart of earlier growth-enhancing changes to how economies produced, dis-
tributed, and used energy. As with wind turbines or solar cells, there were a lot of
jobs and investment dollars to be had in building an electrical grid. But those jobs
and investments weren’t the transformative part of electrification. Rather, as Perez
248
(1983) argued, electrification transformed what was possible in the broader economy.
It enabled the reorganization of factories, greater flexibility of assembly lines, the re-
structuring of communication, the creation of a new set of goods and services built
on information transmission, and a range of other novel outcomes impossible (or at
least very difficult) with coal, gas, or oil alone.
Green growth has yet to grapple with this problem. Instead, most of the invest-
ments required for a low-emissions energy systems transformation will go to pre-
serving the functionality of the present system. Smart grids, effective electricity stor-
age, capacity markets, and demand response pricing are all targeted at maintaining
reliable, ubiquitous electricity despite the intermittency of wind, solar, and other re-
newable technologies. They do not, at present, appear to offer novel capabilities that
would increase productivity or expand the set of goods and services an industrial
society could conceive of producing. Hence while building out a low-emissions en-
ergy system founded on these technologies will certainly yield jobs and investment,
those investments will remain dependent, to a large degree, on a non-economic mo-
tivation to invest in environmentally-favorable goods. Green growth, as presently
constituted, does not resolve the basic conflict posed by the opportunity costs of low-
emissions investment.
7.5 Conclusions: the future of a low-emissions energy
systems transformation
Hence we have now come full circle. This dissertation began by noting the three
central political problems in pursuing climate change mitigation: the scope of the
investment, the diffuseness of the reward, and the unyielding timeframe. Issue link-
age provided a means of concentrating rewards, so as to build political support for
249

the actions needed to avert the damage of unchecked climate change. But linkage
has its limits. Whether those limits arise through changing external circumstances,
inhospitable starting conditions, or other factors, they all stem from the relative lack
of material benefits to offset the costs of emissions reduction. Absent the ability to
stabilize political coalitions via targeted benefits from the tasks needed to satisfy a
low-emissions energy systems transformation, other options are presently unpromis-
ing. Fossil fuel shortages likely loom in the future, given current recovery rates and
demand growth, but may come too late to motivate a timely switch to low-emissions
energy. Likewise, green growth presently offers few obvious means to the kind of
transformative, productivity-enhancing, service-expanding changes that drove ear-
lier systems transformations.
Hence political strategies for implementing and sustaining a low-emissions energy
system are likely to be in flux for the foreseeable future. Those that can structure
policy to yoke support for emissions reduction to the tasks of systems transforma-
tion, likely will. The EU may persist in its current policy structure, without neces-
sarily doing much more by way of its climate ambitions. But that also implies the
continued “muddling through” seen in the United States, and processes of policy ad-
vancement and retrenchment as observed in Canada and elsewhere. Prospects for
the development world are similarly uncertain. While distributed generation may
permit electrification of poor countries without the expense of a heavy-duty power
grid, that development has yet to take off. In 2013, China will begin an experiment in
emissions pricing as a means to control its extremely bad air pollution problem (Liu
and ClimateWire, 2013). How that experiment balances China’s domestic pollution
problems with the political imperatives for economic growth remains unclear.
This conclusion makes the potential for issue linkage through a low-emissions en-
ergy systems transformation both compelling and, simultaneously, fraught. In theory,
250

yoking environmental ends to economic benefits can yield broad coalitions support-
ive of climate policy. But those benefits do not arise in all countries in the same form,
nor are they reliable across the business cycle. This implies a fractured international
landscape for emissions policy, and halting progress on emissions reduction. Thus
in the face of the physical constraints on climate action, the marginal successes of
the European Union do not appear to foretell a promising future for successful and
timely emissions reduction.
251

Bibliography
Acemoglu, D., Aghion, P., Bursztyn, L., and Hemous, D. (2009). The environment and
directed technical change. NBER Working Papers Series 15451, National Bureau for
Economic Research.
Allen, R. (2009). The British industrial revolution in global perspective. Cambridge Univ
Pr.
Ashton, C. (2012). Could portugal evern run entirely on green energy again? British
Broadcasting Corporation, 21 July.
Asif, M. and Muneer, T. (2007). Energy supply, its demand and security issues for
developed and emerging economies. Renewable and Sustainable Energy Reviews,
11(7):1388–1413.
Barbier, E. (2010). A global green new deal: rethinking the economic recovery. Cambridge
Univ Pr.
Bättig, M. and Bernauer, T. (2009). National institutions and global public goods: are
democracies more cooperative in climate change policy. International Organization,
63(2):281–308.
Baumol, W. (1972). On taxation and the control of externalities. The American Economic
Review, pages 307–322.
252
BBC (2012). Government loses second case on solar tariff cut. British Broadcasting
Corporation, 25 January.
Belkin, P. (2008). The european union’s energy security challenges. CRS Report for
Congress Order Code RL33636, Congressional Research Service, Washington, D.C.
Benjamini, Y. and Hochberg, Y. (1995). Controlling the false discovery rate: a practical
and powerful approach to multiple testing. Journal of the Royal Statistical Society.
Series B (Methodological), pages 289–300.
Beurskens, L. and Hekkenber, M. (2011). Renewable energy projections as published
in the national renewable energy action plans of the European member states. Tech-
nical Report ECN-E–10-06, Energy Research Center of the Netherlands.
Blei, D. and Lafferty, J. (2006). Dynamic topic models. In Proceedings of the 23rd inter-
national conference on Machine learning, pages 113–120. ACM.
Blei, D., Ng, A., and Jordan, M. (2003). Latent dirichlet allocation. The Journal of
Machine Learning Research, 3:993–1022.
Boden, T., Marland, G., and Andres, R. (2009). Global, regional, and national fossil-
fuel CO2 emissions. Technical Report U.S.A. doi 10.3334/CDIAC/00001, Carbon
Dioxide Information Analysis Center, Oak Ridge National Laboratory, U.S. Depart-
ment of Energy.
Bomberg, E. (2002). The Europeanisation of green parties: Exploring the EU’s impact.
West European Politics, 25(3):29–50.
Boyd-Graber, J., Chang, J., Gerrish, S., Wang, C., and Blei, D. (2009). Reading tea
leaves: How humans interpret topic models. In Proceedings of the 23rd Annual Con-
ference on Neural Information Processing Systems.
253

British Petroleum (2011). BP Statistical Review of World Energy June 2011. B.P. plc,
London.
Broockman, D. E. (2012). The “problem of preferences”: Medicare and business sup-
port for the welfare state. Studies in American Political Development, 1(1):1–24.
Buchner, B., Carraro, C., Cersosimo, I., and Marchiori, C. (2005). Back to Kyoto? US
participation and the linkage between R&D and climate cooperation. The Coupling
of Climate and Economic Dynamics, pages 173–204.
Buckland, M. and Gey, F. (1994). The relationship between recall and precision. JASIS,
45(1):12–19.
Burnham, M. (2009). Chamber threatens lawsuit if epa rejects climate science ’trial’.
The New York Times.
Burns, C. (2005). The european parliament: The european union’s environmental
champion? Environmental policy in the European Union, page 87.
Burns, C. and Carter, N. (2010). Is co-decision good for the environment? an analysis
of the european parliament’s green credentials. Political Studies, 58(1):123–142.
Burns, C., Carter, N., and Worsfold, N. (2012). Enlargement and the environment: The
changing behaviour of the european parliament*. JCMS: Journal of Common Market
Studies, 50(1):54–70.
Cailliau, M., Ogando, J. A., Combescure, R., Waal, T. D., D’ecclesiis, V., Egeland, H.,
Ferreira, R., Feuk, H., Gengler, R., Jensen, S. G., Kivikko, K., Lincke, G., Villar,
C. M., Ridsdale, S., Sundell, J., Tribuzi, G., Ambrinos, F. U., Vile, P., Walter, B.,
Webster, W., Zoglauer, M., Geron, A.-M., and Foresti, M. (2011). RES Integration
and Market Design: are capacity remuneration mechanisms needed to ensure generation
adequacy. EurElectric, Brussels, Belgium.254

Carey, J. M. (2012). Surprise side effect of shale gas boom: a plunge in u.s. greenhouse
gas emissions. Forbes, 7 December.
Chaddock, G. R. (2010). Harry reid: Senate will abandon cap-and-trade energy re-
form. The Christian Science Monitor, 22 July.
Chazan, G. (2010). Spain’s cuts to solar aid draw fire. The Wall Street Journal, 23
December.
Clark, G. and Jacks, D. (2007). Coal and the Industrial Revolution, 1700–1869. Euro-
pean Review of Economic History, 11(01):39–72.
Danish Energy Authority (2007). A Visionary Danish Energy Policy. Ministry of Trans-
port and Energy, Copenhagen, Denmark.
Danish Ministry of Climate and Energy (2011). Energy strategy 2050: From coal, oil,
and gas to green energy. Policy paper, The Danish Government.
Davis, C. (2004). International institutions and issue linkage: Building support for
agricultural trade liberalization. American Political Science Review, 98(1):153–169.
Davis, C. (2009). Linkage diplomacy: Economic and security bargaining in the anglo-
japanese alliance, 1902-23. International Security, 33(3):143–179.
Department of Energy and Climate Change (2011). Digest of uk energy statistics.
Technical report, The United Kingdom.
Diekmann, A. and Franzen, A. (1999). The wealth of nations and environmental con-
cern. Environment and Behavior, 31(4):540–549.
Directorate General for Competition (2006). Preliminary report: Sector inquiry under
art 17 regulation 1/2003 on the gas and electricity markets. Executive summary,
The European Commission.255

Dunlap, R. and Mertig, A. (1995). Global concern for the environment: is affluence a
prerequisite? Journal of Social Issues, 51(4):121–137.
Dunlap, R. and York, R. (2008). The globalization of environmental concern and the
limits of the postmaterialist values explanation: Evidence from four multinational
surveys. Sociological Quarterly, 49(3):529–563.
Dunlap, R. E. and McCright, A. M. (2008). A widening gap: Republican and demo-
cratic views on climate change. Environment: Science and Policy for Sustainable De-
velopment, 50(5):26–35.
Egan, P. J. and Mullin, M. (2011). Turning personal experience into political attitudes:
The effect of local weather on americans’ perceptions about global warming. Work-
ing paper, New York University and Temple University.
Eising, R. (2002). Policy learning in embedded negotiations: explaining eu electricity
liberalization. International Organization, 56(1):85–120.
Ellerman, A., Convery, F., De Perthuis, C., and Alberola, E. (2010). Pricing carbon: the
European Union emissions trading scheme. Cambridge Univ Pr.
Elmagarmid, A. K., Ipeirotis, P. G., and Verykios, V. S. (2007). Duplicate record detec-
tion: A survey. Knowledge and Data Engineering, IEEE Transactions on, 19(1):1–16.
Energy Information Administration (2009). Annual energy outlook 2009. Techni-
cal Report DOE/EIA-0383(2009), United States Department of Energy, Washington,
D.C.
Energy Information Administration (2011a). Quarterly coal report october-december
2010. Technical Report DOE/EIA-0121 (2010/04Q), United States Department of
Energy.
256

Energy Information Administration (2011b). World shale gas resources: An initial
assessment of 14 regions outside the united states. Technical report, United States
Department of Energy.
Energy Information Administration (2012). Monthly energy review. Technical Report
July, United States Department of Energy, Washington, D.C.
Energy Information Administration (2013). Annual Energy Outlook 2013. United States
Department of Energy, Washington, D.C.
Enkvist, P., Nauclér, T., and Rosander, J. (2007). A cost curve for greenhouse gas
reduction. McKinsey Quarterly, 1:34.
EPA (2005). Acid raid program 2004 progress report: 10 years of achievement. Tech-
nical report, United States Environmental Protection Agency, Washington, DC.
EPA (2011). Executive summary: Inventory of U.S. greenhouse gas emissions and
sinks: 1990-2009. Technical Report USEPA #430-R-11-005, United States Environ-
mental Protection Agency.
EurActiv (2007). New carbon market takes shape. EurActiv, 16 July.
EurActiv (2008). Global options for tackling climate change. 8 december 2008, Eu-
rActiv.
European Court of Justice (2001). PreussenElektra AG v Schhleswag AG. Judgment
of the Court Case C-379/98, The European Union, Luxembourg.
European Greens Party (2009). A green New Deal for Europe: Manifesto for the Euro-
pean election campaign 2009. Press release, The European Greens Party, Brussels,
Belgium.
257

European Union (2001). Directive 2001/77/EC of the European Parliament and
of the Council of 27 september 2001 on the promotion of electricity produced
from renewable energy sources in the internal electricity market. Official Journal,
L283(27/10/2001):33–40.
European Union (2009). Directive 2009/28/EC of the European Parliament and of
the Council of 23 April 2009 on the promotion of the use of energy from renew-
able sources and amending and subsequently repealing directives 2001/77/EC and
2003/30/EC. Official Journal, L140(05/06/2009):16–62.
Europe’s Energy Portal (2011). Coal proved reserves by end of 2011. Statistical report,
The European Union.
Farquhar, N. (2009). Energy, security, climate: Converging solutions. J. Land Resources
& Envtl. L., 29:1.
Flinn, M. (1984). The history of the British coal industry. Clarendon Press.
Fulton, M. and Capalino, R. (2011). The german feed-in tariff: Recent policy changes.
Investment Report I-029193-1.1, Deutche Bank Research.
Gellings, C. (2011). Estimating the costs and benefits of the smart grid: A preliminary
estimate of the investment requirements and the resultant benefits of a fully func-
tioning smart grid. Technical Report 1022519, Electric Power Research Institute.
Gerhards, J. and Lengfeld, H. (2008). Support for european union environmental pol-
icy by citizens of eu-member and accession states. Comparative Sociology, 7(2):215–
241.
Gourevitch, P. (1987). Politics in Hard Times. Cornell University Press, Ithaca.
258
Grimmer, J. (2010). A bayesian hierarchical topic model for political texts: Measuring
expressed agendas in senate press releases. Political Analysis, 18(1):1–35.
Grimmer, J. and Stewart, B. M. (2013). Text as data: The promise and pitfalls of auto-
matic content analysis methods for political texts. Political Analysis.
Grün, B. and Hornik, K. (2011). topicmodels: An r package for fitting topic models.
Journal of Statistical Software, 40(13):1–30.
Gunther, M. (2006). The green machine. Fortune Magazine, 31 July.
Hammersley, G. (1957). The Crown Woods and Their Exploitation in the 16th and
17th Centuries. Bulletin of the Institute of Historical Research, 30:136–161.
Hanemann, W. M. (2009). The role of emission trading in domestic climate policy. The
Energy Journal, 30(2).
Hargreaves, S. (2012). Carbon tax gets unusual support. CNN Money, 2 August.
Harrison, K. and Sundstrom, L. M. (2007). The comparative politics of climate change.
Global Environmental Politics, 7(4):1–18.
Hartshorne, A. (1968 (1897)). Antique Drinking Glasses: a pictorial history of glass drink-
ing vessels. Brussel and Brussel, New York, New York.
Harvey, F. (2012). Uk cuts feed-in tariff for solar panels. guardian.co.uk, 1 August.
Hassett, K. A., Hayward, S. F., and Green, K. P. (2007). Climate change: Caps vs.
taxes. Environmental Policy Outlook 2, The American Enterprise Institute.
Helm, D. (2009). EU climate-change policy—a critique. Smith School Working Papers
Series ISSN 2041-532X, Smith School of Enterprise and the Environment, Oxford,
United Kingdom.
259
Helm, D., Hepburn, C., and Mash, R. (2003). Credible carbon policy. Oxford Review of
Economic Policy, 19(3):438.
Helm, D., Hepburn, C., and Mash, R. (2004). Time-inconsistent Environmental Policy
and Optimal Delegation. Discussion Paper 175, Oxford University Department of
Economics.
Heymann, M. (1998). Signs of Hubris: the shaping of wind technology styles in
Germany, Denmark, and the United States, 1940-1990. Technology and Culture,
39(4):641–670.
Hix, S., Noury, A., and Roland, G. (2006). Dimensions of politics in the european
parliament. American Journal of Political Science, 50(2):494–520.
Hovi, J. and Skodvin, T. (2008). Which way to US climate cooperation? issue linkage
versus a US-based agreement. Review of Policy Research, 25(2):129–148.
Huberty, M. (2009). Energy systems and climate policy: Applying lessons from the
adoption of coal to its elimination. Working paper, The Center for Information
Technology Research in the Interest of Society and the Berkeley Roundable on the
International Economy, Berkeley, CA.
Huberty, M., Gao, H., Mandell, J., and Zysman, J. (2011). Shaping the Green Growth
Economy: a review of the public debate and the prospects for green growth. Mandag
Morgen and the Berkeley Roundtable on the International Economy, Copenhagen,
Denmark and Berkeley, California.
Huberty, M. and Sanders, H. (2012). leghist: automated legislative history analysis
for r. Working paper, University of California, Berkeley.
Huberty, M. and Zachmann, G. (2011). Green exports and the global product space:
prospects for EU industrial policy. Working Paper 2011/07, Bruegel.260

Huelshoff, M. G. (1994). Domestic politics and dynamic issue linkage: A reformula-
tion of integration theory. International Studies Quarterly, 38(2):pp. 255–279.
Hughes, T. (1979). The electrification of America: the system builders. Technology and
Culture, pages 124–161.
Hughes, T. (1983). Networks of power: electrification in Western society, 1880-1930. Johns
Hopkins University Press, Baltimore, Maryland.
Hughes, T. P. (1962). British electrical industry lag: 1882-1888. Technology and Culture,
3(1):27–44.
Hughes, T. P. (1976). The science-technology interaction: The case of high-voltage
power transmission systems. Technology and Culture, 17(4):646–662.
Integration of Variable Generation Task Force (2009). Accommodating high levels of
variable generation. Technical report, North American Electric Reliability Corpo-
ration, Princeton, NJ.
Jacobs, A. (2008). The Politics of When: Redistribution, Investment and Policy Mak-
ing for the Long Term. British Journal of Political Science, 38(02):193–220.
Jacobsson, S. and Lauber, V. (2006). The politics and policy of energy system
transformation—explaining the German diffusion of renewable energy technology.
Energy Policy, 34(3):256–276.
Jones, R. S. and Yoo, B. (2011). Korea’s green growth strategy: Mitigating climate
change and developing new growth engines. OECD Economics Department Work-
ing Paper 798, Organization for Economic Cooperation and Development, Paris,
France.
261

Jones, V. (2008). The green collar economy: How one solution can fix our two biggest prob-
lems. HarperOne.
Jordan, A., Huitema, D., van Asselt, H., Rayner, T., and Berkhout, F., editors (2011).
Climate change policy in the European Union. Cambridge University Press, Cam-
bridge, United Kingdom.
Joskow, P. L. (2006). Competitive electricity markets and investment in new gener-
ating capacity. Working paper, Massachusetts Institute of Technology, Center for
Energy and Environmental Policy Research.
Jr., T. Z. (2013). Cape wind: Regulation, litigation and the struggle to develop offshore
wind power in the u.s. The Huffington Post, 23 Febrary.
Karekezi, S. and Kithyoma, W. (2002). Renewable energy strategies for rural Africa:
is a PV-led renewable energy strategy the right approach for providing modern
energy to the rural poor of sub-saharan africa? Energy Policy, 30(11-12):1071–1086.
Katz, M. and Shapiro, C. (1986). Technology adoption in the presence of network
externalities. The Journal of Political Economy, 94(4):822.
Kaya, Y. and Yokobori, K. (1997). Environment, Energy and Economy; Strategies for
Sustainability. United Nations Univ.
Kemfert, C. (2004). Climate coalitions and international trade: assessment of cooper-
ation incentives by issue linkage. Energy Policy, 32(4):455–465.
Kitschelt, H. (1994). The Transformation of European Social Democracy. Cambridge Uni-
versity Press.
Koronowski, R. (2013). Is 70 percent renewable power possible? portugal just did it
for 3 months. ThinkProgress, 14 April.
262

Krauss, C. and Galbraith, K. (2009). Climate bill splits exelon and u.s. chamber. The
New York Times, 28 September.
Lacy, D. and Niou, E. (2004). A theory of economic sanctions and issue linkage: The
roles of preferences, information, and threats. Journal of Politics, 66(1):25–42.
Landes, D. (2003). The unbound Prometheus: technical change and industrial development
in Western Europe from 1750 to the present. Cambridge Univ Pr.
Layzer, J. (2011). Reaching for a new deal: ambitious governance, economic meltdown, and
polarized politics in Obama’s first two years, chapter 8: Cold Front: How the recession
stalled Obama’s clean energy agenda. The Russell Sage Foundation, Washington,
D.C.
Leiserowitz, A. (2006). Climate change risk perception and policy preferences: The
role of affect, imagery, and values. Climatic change, 77(1-2):45–72.
Liu, C. and ClimateWire (2013). China emissions trading experiments near launch.
Scientific American, 2 May.
London Economics (2007). Structure and performance of six European wholesale
electricity markets in 2003, 2004 and 2005: Executive summary. Technical report,
Directorate-General Competition, The European Commission, Brussels, Belgium.
MacKenzie, D. (2007). The political economy of carbon trading. London Review of
Books, 29(7):5.
Marcus, M. P., Marcinkiewicz, M. A., and Santorini, B. (1993). Building a large anno-
tated corpus of english: The penn treebank. Computational linguistics, 19(2):313–330.
Martin, C. (2013). U.s. states turning against renewable portfolio standards as gas
plunges. Bloomberg, 23 April.
263
Marziani, M. M. D. and Liss, S. (2010). Filibuster abuse. Working paper, Brennan
Center for Justice, New York University, New York.
McGrath, M. (16 April 2013). Eu parliament rejects plan to boost carbon trading.
British Broadcasting Corporation.
Moravcsik, A. (1993). Preferences and power in the european community: a liberal
intergovernmentalist approach. JCMS: Journal of Common Market Studies, 31(4):473–
524.
Moravcsik, A. and Nicolaïdis, K. (1999). Explaining the treaty of amsterdam: inter-
ests, influence, institutions. JCMS: Journal of Common Market Studies, 37(1):59–85.
Nef, J. (1932). The Rise of the British Coal Industry. George Routledge and Sons, London.
Nelson, D. and Vladeck, T. (2013). The policy climate. Technical report, The Climate
Policy Initiative, New York, New York.
Newell, R., Jaffe, A., and Stavins, R. N. (1999). The induced innovation hy-
pothesis and energy-saving technological change. Quarterly Journal of Economics,
August:941–975.
Ng, P. (2009). Draft unit cost guide for overhead transmission lines. Presentation,
Pacific Gas and Electric Company, Folsom, CA.
Nicola, S. (2013). Germany to add most coal-fired power plants in two decades, iwr
says. Bloomberg Business News, 27 February.
Nord Pool Spot (2009). Nord Pool Spot implements negative price floor in Elspot
from october 2009. Online.
Nordhaus, T. and Shellenberger, M. (2009). Apocalypse fatigue: Losing the public on
climate change. Yale Environment, 360:16.264

Nordhaus, W. D. (2010). Designing a friendly space for technological change to slow
global warming. Working paper, Yale University, New Haven, CT.
O’Donnell, J. K. (2011). Rok green growth quarterly update. Technical Report July-
September 2011, Council on Foreign Relations, Washington, D.C.
OECD (2010). Interim report of the green growth strategy: Implementing our com-
mitment for a sustainable future. Interim Report C/MIN(2010)5, Organization for
Economic Cooperation and Development, Paris.
OECD (2011). Towards Green Growth. Organization for Economic Cooperation and
Development, Paris, France.
Palmer, K. and Burtraw, D. (2005). Cost-effectiveness of renewable electricity policies.
Energy Economics, 27(6):873–894.
Patashnik, E. (2003). After the public interest prevails: The political sustainability of
policy reform. Governance, 16(2):203–234.
Patashnik, E. M. (2008). Reforms at risk: what happens after major policy changes are
enacted. Princeton Univ Press.
Perez, C. (1983). Structural change and the assimilation of new technologies in the
economic and social system. Futures, 15(5):357–375.
Perez, C. (1985). Microelectronics, long waves and world structural change: new
perspectives for developing countries. World development, 13(3):441–463.
Perry, S., Klemeš, J., and Bulatov, I. (2008). Integrating waste and renewable en-
ergy to reduce the carbon footprint of locally integrated energy sectors. Energy,
33(10):1489–1497.
Pigou, A. and Aslanbeigui, N. (2001). The economics of welfare. Transaction Publishers.265

Pooley, E. (2010). The climate war: true believers, power brokers, and the fight to save the
earth. HarperCollins.
Popp, D. (2010). Innovation and Climate Policy. NBER Working Papers Series, Na-
tional Bureau of Economic Research, Cambridge, Massachusetts.
Popp, D., Newell, R., and Jaffe, A. (2009). Energy, the environment, and technolog-
ical change. NBER Working Papers Series 14832, National Bureau for Economic
Research, Cambridge.
Quinn, K. M., Monroe, B. L., Colaresi, M., Crespin, M. H., and Radev, D. R. (2010).
How to analyze political attention with minimal assumptions and costs. American
Journal of Political Science, 54(1):209–228.
Raupach, M. R., Marland, G., Ciais, P., Le Quéré, C., Canadell, J. G., Klepper, G.,
and Field, C. B. (2007). Global and regional drivers of accelerating co2 emissions.
Proceedings of the National Academy of Sciences, 104(24):10288–10293.
Roland-Holst, D. (2008). Energy efficiency, innovation, and job creation in California.
Working paper, Center for Energy, Resources, and Environmental Sustainability,
Berkeley, CA.
Rosenthal, E. (2012). U.s. to be world’s top oil producer in 5 years, report says. The
New York Times, 12 November.
Schepelmann, P., Stock, M., Koska, T., Schüle, R., and Reutter, O. (2009). A green
New Deal for Europe: Towards green modernization in the age of crisis. Green
New Deal Series 1, Green European Foundation and the Wuppertal Institute for
Climate, Energy, and the Environment, Wuppertal, Germany.
Schmalensee, R. and Stavins, R. N. (2011). Renewable energy standards: less effective,
more costly, but politically preferred to cap-and-trade? Grist.org, 11 January.266

Schneider, L. (2008). A clean development mechanism (cdm) with atmospheric bene-
fits for a post-2012 climate regime. Discussion Paper 25, Öko-Institut.
Schneider, S. H. and Azar, C. (2001). Are uncertainties in climate and energy systems a
justification for stronger near-term mitigation policies? Working paper, Pew Center
on Global Climate Change, Washington, D.C.
Schreurs, M. and Tiberghien, Y. (2007). Multi-level reinforcement: Explaining Euro-
pean Union leadership in climate change mitigation. Global Environmental Politics,
7(4):19–46.
Scott, M. (2013). Europe struggles in shale gas race. The New York Times, 24 April.
Sebenius, J. K. (1983). Negotiation arithmetic: Adding and subtracting issues and
parties. International Organization, 37(2):pp. 281–316.
Sieferle, R. (2001). The subterranean forest: energy systems and the Industrial Revolution.
The White Horse Press.
Skocpol, T. (2013). Naming the problem what it will take to counter extremism and
engage americans in the fight against global warming. Working paper, Harvard
University.
Smil, V. (2010). Power density primer. Master Resource, (Parts I-V).
Smil, V. (2011a). Energy Transitions: History, Requirements, Prospects. Praeger, New
York.
Smil, V. (2011b). Global energy: The latest infatuations. American Scientist, 99:212–219.
Solomon, S., Qin, D., Manning, M., Chen, Z., Marquis, M., Averyt, K., Tignor, M.,
and Miller, H., editors (2007). IPCC 2007: Climate Change 2007: The Physical Science
267

Basis. Contribution of Working Group I to the Fourth Assessment Report of the Intergov-
ernmental Panel on Climate Change. Cambridge University Press, Cambridge, United
Kingdom, and New York.
State of California (2010). California’s green economy: summary of survey results.
Technical report, Employment Development and Labor Market Information Divi-
sions.
Steitz, C. (2012). German solar power boom continues despite tariff cuts. Reuters,
October 31.
Stepp, M. (2010). Bucking the debate: Clean energy industrial policies at work. Policy
Brief 17 August, The Brookings Institution, Oakland, CA.
Stepp, M. (2011). Let’s shelve the drivel: Boosting energy innovation to reduce amer-
ica’s three deficits. Policy Brief 8 December, The Breakthrough Institute.
Stoklosa, M. (2010). Power engineering: When to discount 2012/2013 earnings. Tech-
nical report, BRE Bank Securities.
Stonington, J. (2012). ’coal-aholics’: Poland wages war on efforts to save the climate.
Spiegel Online International, 21 December.
Sweeney, J. (2002). The California electricity crisis. Hoover Institute Press.
Talev, M. (2007). Senate tied in knots by filibusters. McClatchey News Service, 20 July.
Tegen, S., Hand, M., Maples, B., Lantz, E., Schwabe, P., and Smith, A. (2010). 2010
cost of wind energy review. Technical Report NREL/TP-5000-52920, National Re-
newable Energy Laboratory, Golden, Colorado.
268

The European Commission (1999). Electricity from renewable sources and the in-
ternal energy market. Technical Report SEC(1999) 470 final, The European Union,
Brussels, Belgium.
The European Commission (2001). Completing the internal energy market. Com-
munication from the Commission to the Council and the European Parliament
COM(2001) 125, The European Commission, Brussels, Belgium.
The European Commission (2005a). Report on progress in creating the internal gas
and electricity market. Report from the European Commission COM(2006) 568,
The European Union, Brussels, Belgium.
The European Commission (2005b). Technical annex to the report from the Commis-
sion to the Council and the European Parliament on progress in creating the inter-
nal gas and electricity market COM(2005)568 final. Commission Staff Working
Document SEC(2005) 1448, The European Union, Brussels, Belgium.
The European Commission (2006a). A european strategy for sustainable, competitive
and secure energy. Green Paper COM(2006) 10, The European Union, Brussels,
Belgium.
The European Commission (2006b). Renewable energy road map renewable ener-
gies in the 21st century: building a more sustainable future. COMMUNICATION
FROM THE COMMISSION TO THE COUNCIL AND THE EUROPEAN PARLIA-
MENT COM(2006) 848 final, The European Union, Brussels, Belgium.
The European Commission (2007). An energy policy for Europe. Communication to
the European Parliament and European Council SEC(2007) 12, Commission of the
European Communities, Brussels, Belgium.
269

The European Commission (2008a). Commission response to the text adopted
in plenary. Note pursuant to the adoption of final version of COM(2008)0016
SP(2009)402, The European Union.
The European Commission (2008b). Proposal for a directive of the European Parlia-
ment and of the Council on the promotion of the use of energy from renewable
sources. Technical Report COM(2008) 19 final, The European Union.
The European Commission (2010a). Commission decision of 24 december 2009 de-
termining, pursuant to directive 2003/87/ec of the european parliament and of the
council, a list of sectors and subsectors which are deemed to be exposed to a signifi-
cant risk of carbon leakage (notified under document c(2009) 10251). Official Journal
of the European Union, L001(05/01/2010):0010–0018.
The European Commission (2010b). Energy 2020 a strategy for competitive, sustain-
able and secure energy. Communication from the Commission to the European
Parliament, the Council, the European Economic and Social Committee and the
Committee of the Regions COM(2010) 639, The European Commission.
The European Commission (2010c). Energy infrastructure priorities for 2020 and be-
yond - a blueprint for an integrated European energy network. Communication
from the Commission to the European Parliament, the Council, the European Eco-
nomic and Social Committee and the Committee of the Regions COM(2010) 677,
The European Commission, Brussels, Belgium.
The European Commission (2013a). Green paper: a 2030 framework for climate and
energy policies. Green Paper COM(2013) 169 final, The European Union.
The European Commission (2013b). Renewable energy progress report. Report from
the commission to the European Parliament, the council, the European Economic
270
and Social Committee, and the Committee of the Regions COM(2013) 175 final, The
European Union.
The European Parliament (2008a). Plenary debate. Minutes CRE 20080617, The Eu-
ropean Union, Strasbourg, France.
The European Parliament (2008b). Position of the European Parliament adopted
at first reading on 17 december 2008 with a view to the adoption of directive
2009/.../ec of the european parliament and of the council on the promotion of the
use of energy from renewable sources and amending and subsequently repealing
directives 2001/77/EC and 2003/30/EC (ep-pe_tc1- cod(2008)0016). Consolidated
legislative document EP-PE_TC1-COD(2008)0016, The European Parliament, Brus-
sels, Belgium.
The Government of the Republic of Poland (2006). The standpoint of the Government
of the Republic of Poland on the green paper: A European strategy for sustainable,
competitive and secure energy COM (2006) 105. Response to the european green
paper on european energy strategy, European Commission.
Tollison, R. D. and Willett, T. D. (1979). An economic theory of mutually advan-
tageous issue linkages in international negotiations. International Organization,
33(4):pp. 425–449.
Tsebelis, G. (1999). Veto players and law production in parliamentary democracies:
An empirical analysis. American Political Science Review, pages 591–608.
Tsebelis, G., Jensen, C. B., Kalandrakis, A., and Kreppel, A. (2001). Legislative pro-
cedures in the european union: An empirical analysis. British Journal of Political
Science, 31(4):573–599.
Unruh, G. (2000). Understanding carbon lock-in. Energy Policy, 28(12):817–830.
271
Unruh, G. (2002). Escaping carbon lock-in. Energy Policy, 30(4):317–325.
Urpelainen, J. (2009). Explaining the schwarzenegger phenomenon: local frontrun-
ners in climate policy. Global Environmental Politics, 9(3):82–105.
Urpelainen, J. (2011). Export orientation and domestic electricity generation: Effects
on energy efficiency innovation in select sectors. Energy Policy.
Urpelainen, J. (2012a). The strategic design of technology funds for climate coopera-
tion: generating joint gains. Environmental Science & Policy, 15(1):92 – 105.
Urpelainen, J. (2012b). The strategic design of technology funds for climate coopera-
tion: generating joint gains. Environmental Science & Policy, 15(1):92–105.
Victor, D. (2011). Global Warming Gridlock. Cambridge University Press, Cambridge,
United Kingdom.
Vidal, J. and Adam, D. (2007). China overtakes us as world’s biggest co2 emitter. The
Guardian, 19 June.
Vis, P. (2001). Final report: Eccp working group 1, "flexible mechanisms". Techni-
cal report, The European Commission, Directorate-General Environment, Brussels,
Belgium.
Vogel, D. (2012). The politics of precaution: regulating health, safety, and environmental
risks in Europe and the United States. Princeton University Press.
Wara, M. and Victor, D. (2008). A realistic policy on international carbon offsets.
Technical report, PESD Working Paper.
Warde, P. (2006). Fear of Wood Shortage and the Reality of the Woodland in Europe,
c. 1450-1850. In History Workshop Journal, volume 62, page 28. Oxford Univ Press.
272

Warde, P. (2007). Energy Consumption in England and Wales, 1560-2004. Consiglio
Nazionale della Ricerche, Naples.
Weber, S. and Wiesmeth, H. (1991). Issue linkage in the european community*. JCMS:
Journal of Common Market Studies, 29(3):255–267.
Weitzman, M. (1974). Prices vs. quantities. The Review of Economic Studies, 41(4):477–
491.
Wilson, T., Hoffmann, P., Somasundaran, S., Kessler, J., Wiebe, J., Choi, Y., Cardie,
C., Riloff, E., and Patwardhan, S. (2005). Opinionfinder: A system for subjectivity
analysis. In Proceedings of HLT/EMNLP on Interactive Demonstrations, pages 34–35.
Association for Computational Linguistics.
Woody, T. (2010). China snaps up california solar market. The New York Times Green
Blog, 14 January 2010.
World Energy Council (2010). 2010 Survey of Energy Resources. World Energy Council.
Wynn, G. (2011). Analysis: Gas is killing green energy in price war. Reuters, 16 June.
Zachmann, G. (2011). Is European climate policy the new CAP? Bruegel Policy Brief
2011/01, Bruegel, Brussels, Belgium.
Zysman, J. (1994). How institutions create historically rooted trajectories of growth.
Industrial and Corporate Change, 3(1).
Zysman, J. and Huberty, M. (2010). An energy system transformation: Framing re-
search choices for the climate challenge. Research Policy, 38(9):1027–2029.
Zysman, J. and Huberty, M. (2013). Can green sustain growth? From the religion to the
reality of sustainable prosperity. Stanford Univ Press, Palo Alto, California.
273