Emissions of VOCs at Urban Petrol Retail Distribution Centres in India (Delhi and Mumbai
16
Environmental Monitoring and Assessment (2005) 109: 227–242 DOI: 10.1007/s10661-005-6292-z c Springer 2005 EMISSIONS OF VOCs AT URBAN PETROL RETAIL DISTRIBUTION CENTRES IN INDIA (DELHI AND MUMBAI) ANJALI SRIVASTAVA ∗ , A. E. JOSEPH, AJIT MORE and SUNIL PATIL National Environmental Engineering Research Institute (NEERI), Mumbai Zonal Centre, 89/B, Dr. A.B. Road, Worli, Mumbai, India ( ∗ author for correspondence, e-mail: [email protected]) (Received 14 May 2004; accepted 12 November 2004) Abstract. Air pollution has assumed gigantic proportion killing almost half a million Asians every year. Urban pollution mainly comprises of emissions from buses, trucks, motorcycle other forms of motorized transport and its supporting activities. As Asia’s cities continue to expand the number of vehicles have risen resulting in greater pollution. Fugitive emissions from retail distribution center in urban area constitute a major source. Petrol vapours escape during refueling adding pollutants like benzene, toluene, ethylbenzene and xylene to ambient air. This paper discusses a study on fugitive emissions of Volatile Organic Compounds (VOC) at some refueling station in two metropolitan cities of India, i.e., Mumbai and Delhi. Concentration of VOCs in ambient air at petrol retail distribution center is estimated by using TO-17 method. Concentration of benzene in ambient air in Delhi clearly shows the effect of intervention in use of petroleum and diesel fuel and shift to CNG. Chemical Mass Balance (CMB) model is used to estimate source contributions. At Delhi besides diesel combustion engines, refueling emissions are also major sources. At Mumbai evaporative emissions are found to contribute maximum to Total VOC (TVOC) concentration in ambient air. Keywords: CMB, Delhi, Mumbai, petrol pump, VOC 1. Introduction Volatile Organic Compounds (VOCs) are important air pollutants in urban atmo- sphere. Some of the VOCs are toxic, potentially carcinogenic and mutagenic at concentrations levels found in urban environment (Edgerton et al., 1989). Expo- sure to VOCs is of concern as it may result in significant risk to human health. Atmospheric reactions of VOCs lead to secondary pollutants, which is turn cause the deterioration of air quality and damage to Corps and vegetation. VOCs are emitted from number of sources, which include urban and industrial activities, and natural sources. Previous studies have reported vehicular emissions as the major source of VOCs in urban air. Pjeffer (1994) reported that 90% of benzene in ambient air is from traffic. Vega et al. (2000) estimated that motor vehicle exhaust contributes 55% of non-methane hydrocarbons. Baldasano et al. (1998) have shown that 62% of VOC pollution in Martorell is Spain is road traffic. Besides vehicular exhaust, hot and cold soak emissions are also one the urban sources of VOCs. Evaporative emissions of VOCs from gasoline distribution network are also one of the important sources of VOCs in ambient air.
Transcript of Emissions of VOCs at Urban Petrol Retail Distribution Centres in India (Delhi and Mumbai
Environmental Monitoring and Assessment (2005) 109: 227–242DOI: 10.1007/s10661-005-6292-z c© Springer 2005
EMISSIONS OF VOCs AT URBAN PETROL RETAIL DISTRIBUTIONCENTRES IN INDIA (DELHI AND MUMBAI)
ANJALI SRIVASTAVA∗, A. E. JOSEPH, AJIT MORE and SUNIL PATILNational Environmental Engineering Research Institute (NEERI), Mumbai Zonal Centre,
89/B, Dr. A.B. Road, Worli, Mumbai, India(∗author for correspondence, e-mail: [email protected])
(Received 14 May 2004; accepted 12 November 2004)
Abstract. Air pollution has assumed gigantic proportion killing almost half a million Asians everyyear. Urban pollution mainly comprises of emissions from buses, trucks, motorcycle other forms ofmotorized transport and its supporting activities. As Asia’s cities continue to expand the number ofvehicles have risen resulting in greater pollution. Fugitive emissions from retail distribution center inurban area constitute a major source. Petrol vapours escape during refueling adding pollutants likebenzene, toluene, ethylbenzene and xylene to ambient air. This paper discusses a study on fugitiveemissions of Volatile Organic Compounds (VOC) at some refueling station in two metropolitan citiesof India, i.e., Mumbai and Delhi. Concentration of VOCs in ambient air at petrol retail distributioncenter is estimated by using TO-17 method. Concentration of benzene in ambient air in Delhi clearlyshows the effect of intervention in use of petroleum and diesel fuel and shift to CNG. Chemical MassBalance (CMB) model is used to estimate source contributions. At Delhi besides diesel combustionengines, refueling emissions are also major sources. At Mumbai evaporative emissions are found tocontribute maximum to Total VOC (TVOC) concentration in ambient air.
Keywords: CMB, Delhi, Mumbai, petrol pump, VOC
1. Introduction
Volatile Organic Compounds (VOCs) are important air pollutants in urban atmo-sphere. Some of the VOCs are toxic, potentially carcinogenic and mutagenic atconcentrations levels found in urban environment (Edgerton et al., 1989). Expo-sure to VOCs is of concern as it may result in significant risk to human health.Atmospheric reactions of VOCs lead to secondary pollutants, which is turn causethe deterioration of air quality and damage to Corps and vegetation. VOCs areemitted from number of sources, which include urban and industrial activities, andnatural sources. Previous studies have reported vehicular emissions as the majorsource of VOCs in urban air. Pjeffer (1994) reported that 90% of benzene in ambientair is from traffic. Vega et al. (2000) estimated that motor vehicle exhaust contributes55% of non-methane hydrocarbons. Baldasano et al. (1998) have shown that 62%of VOC pollution in Martorell is Spain is road traffic. Besides vehicular exhaust,hot and cold soak emissions are also one the urban sources of VOCs. Evaporativeemissions of VOCs from gasoline distribution network are also one of the importantsources of VOCs in ambient air.
228 ANJALI SRIVASTAVA ET AL.
Transportation, storage and marketing petroleum liquids represents potentialsource of evaporation losses. Emissions occur due to temperature fluctuations,permeation of fuel through hoses and fitting etc High ambient temperatures causelarge evaporative losses. Motor vehicle refueling is a potential source of evaporativeemissions of VOCs. Vehicle refueling emission comes from vapours displacedfrom the automobile tank by dispensed gasoline and from spillage. Refuellingwithout control measures contributes to the gasoline emissions. In Mumbai andDelhi spillages are frequent due to manual refueling units.
Atkinson has shown that atmospheric behaviour of VOCs is governed to a largeextent by their life time. In the process of long range transport, the primary pollutantssuch as VOCs and NOx will react with atmospheric to produce secondary pollutantssuch as ozone and PAH etc. with different reaction rates. Highly reactive specieswill react near the vicinity of the sources, while slow reacting species may betransported to large distances. Toluene has much shorter life time than benzene(Singh and Zimmer Mon, 1992). So a higher Benzene to Toluene (B/T) ratio willbe found in aged air via a long range transport. B/T ratio can be thus used as atracer to predict long range transport. However, if sources of benzene or tolueneother than vehicular exhaust are present B/T ratio cannot be considered as a tracer.
High levels of VOCs have been observed in Asian Countries (Hussam et al.,2002; Iran et al., 1998). The present study focuses on estimating VOCs at urbanpetrol retail distribution centers in Mumbai and Delhi.
2. Study Area
Delhi is capital of India and hub of commercial, political, industrial, educationalactivities. It has tropical steppe climate. The general prevalence of continentalair leads to relatively dry condition with extremely hot summers. Monthly meantemperature range from 14.3 ◦C in January (minimum 8 ◦C) to 34.5 ◦C in June(maximum 47 ◦C). The main seasonal climate influence is the monsoon, typicallyfrom June to October. The mean annual rainfall is 71.5 mm (maximum 211 mmJuly). Northwesterly winds usually prevail, however, in June and July south-easterlywind predominate. Winter witnesses long periods of calm.
Mumbai is located on west coast of India. It is India’s one of the main industrialand commercial city situated on the coast of Arabian sea. It witnesses considerablesea port and airport activity. Mumbai has tropical savanna climate, with monthlyrelative humidity ranging between 57–87%. Annual average temperature is 25.3 ◦Crising to maximum of 34.5 ◦C in June and a minimum of 14.3 ◦C in January. Averageannual precipitation is 2078 mm prevailing in west and north-west with somesouthern component during June to August.
VOCs in ambient air at three petrol pumps in Delhi and Mumbai each namely atIIT Crossing (A), Cannaught Place (B) and Race Course (C) in Dehli and Worli (D),Maheshwari Udyan (E) and Mahim (F) in Mumbai have been monitored once every
EMISSIONS OF VOCs AT URBAN PETROL RETAIL DISTRIBUTION CENTRES IN INDIA 229
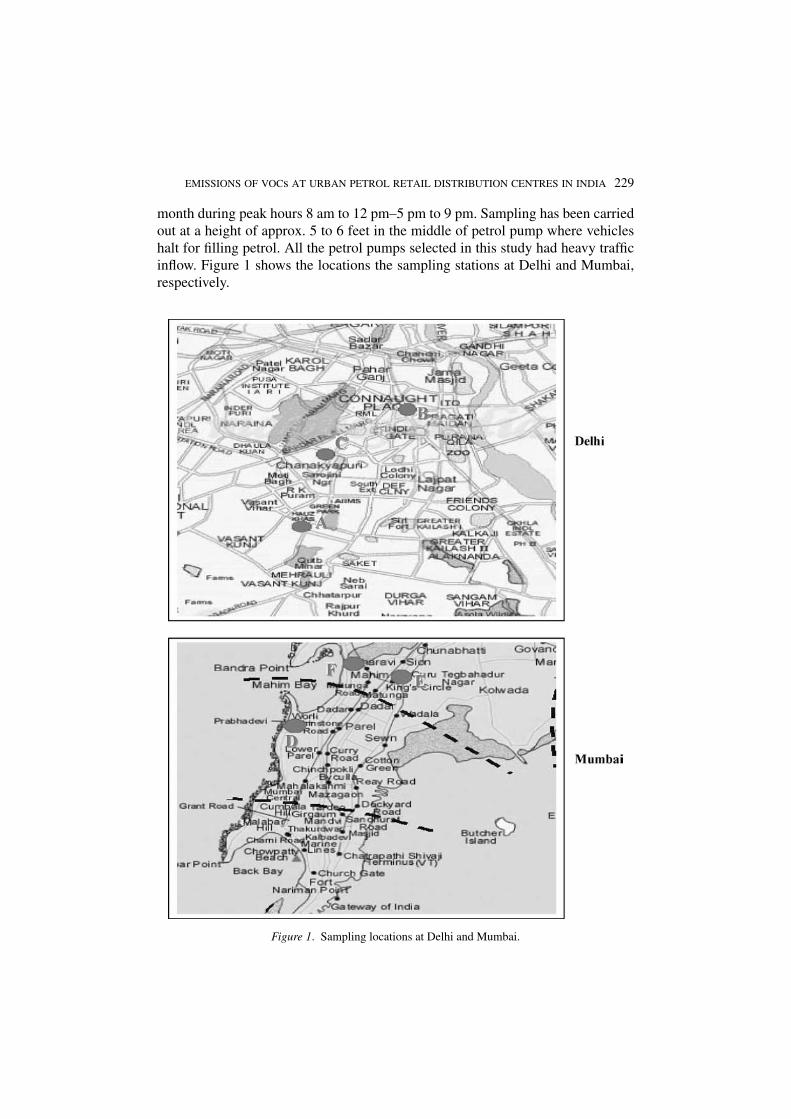
month during peak hours 8 am to 12 pm–5 pm to 9 pm. Sampling has been carriedout at a height of approx. 5 to 6 feet in the middle of petrol pump where vehicleshalt for filling petrol. All the petrol pumps selected in this study had heavy trafficinflow. Figure 1 shows the locations the sampling stations at Delhi and Mumbai,respectively.
Figure 1. Sampling locations at Delhi and Mumbai.
230 ANJALI SRIVASTAVA ET AL.
At Delhi, petrol pump A is close to traffic intersection, B is situated in a com-mercial area and C is on a busy road with trees lined on both sides of the road. Petrolpumps D and F at Mumbai are close to seashore approximately 300 m to 500 maway from the coast. Both the petrol pumps have the sewage outfall and sewagetreatment plant close to it. The petrol pump E is close to traffic intersection.
3. Methodology
USEPA (1985) study shows uncontrolled displacement losses from vehicles re-fueling for a particular set of conditions can be estimated using followingequation.
ER = 264.2[(−5.909) − 0.0949(�T ) + 0.0884(TD) + 0.485(RVP)] (1)
Where ER = Refueling emissions, mg/l; �T = Difference between temperature offuel in vehicle tank and temperature of dispensed fuel in ◦F; TD = Temperature ofdispensed fuel ◦F; RVP = Reid vapour pressure, psia.
The quantity of displaced vapours depends on gasoline temperature, auto tanktemperature, gasoline RVP and quantity of fuel dispensed.
TVOC concentrations were determined using USEPA TO-17 method. The ad-sorption cartridges containing activated charcoal were fabricated from stainlesspipe having length 19 cm and 4 mm ID with caps on both sides. Analytical gradeactivated charcoal was heated at 200 ◦C for 12 h and cooled in vacuum desiccators.About 800 mg of preheated cooled activated charcoal was filled in the cartridgewith glass wool plugs on either side of the adsorption cartridge. Desorption wascarried out by heating at 220 ◦C for 10 min.
Varian make GCMS (Model Saturn 3) with injection mode of sample introduc-tion with DB-624 capillary column of 30 m length. 0.32 mm ID and 1.8 micron filmwas used. Helium as carrier gas with flow rate of 1 ml/min with split ratio 1:25 wasused GC oven was programmed for 35 ◦C held for 2 min and ramped to 210 ◦C withthe rate of 5 ◦C/min Ion trap temperature was maintained at 125 ◦C while acquisi-tion mass range was from 35 Dalton to 260 Dalton in EI Mode. Calibration curveswere drawn for VOCs present in VOC Mix 15 of Dr. Erhenstrofer and these werequantified in this study. NIST 98 library was used to identify the VOCs. Matchingof first three abundances were considered for identification.
4. Results and Discussions
The minimum and maximum temperatures observed during the sampling periodand average temperature during 7 am to 11 pm are given in Table I. On an averagetemperature of dispensed fuel was observed to be 2 ◦C less than ambient temperature
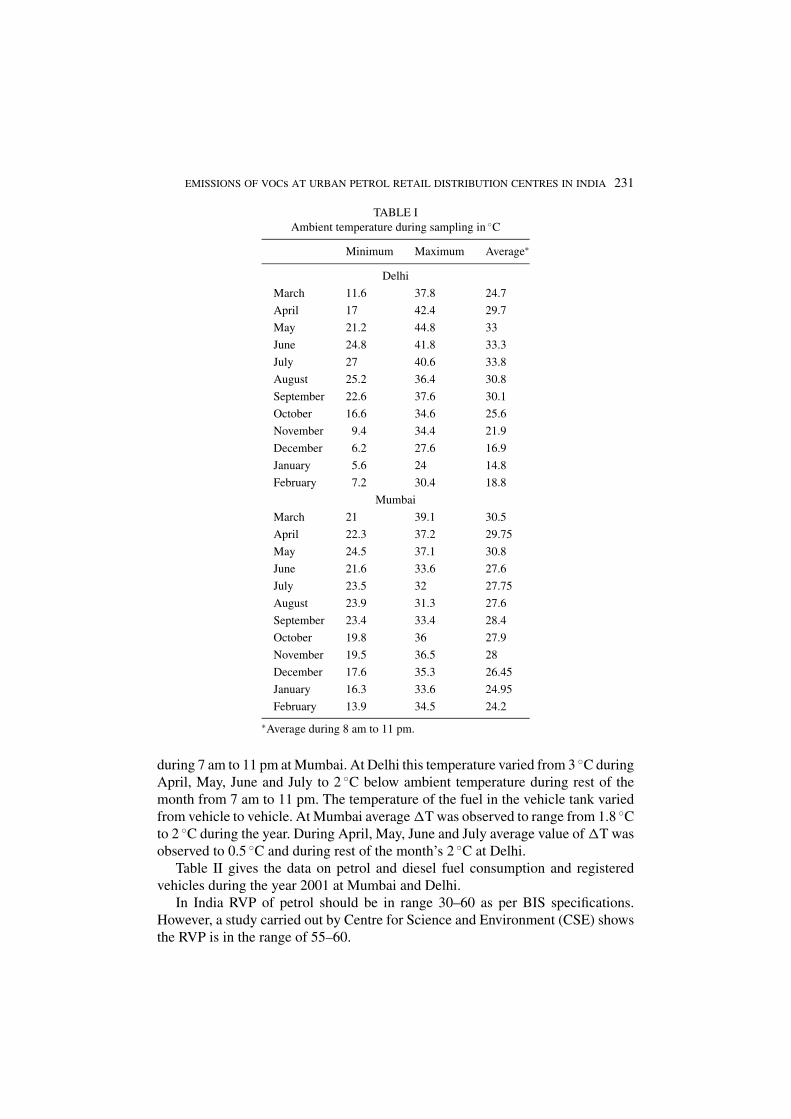
EMISSIONS OF VOCs AT URBAN PETROL RETAIL DISTRIBUTION CENTRES IN INDIA 231
TABLE IAmbient temperature during sampling in ◦C
Minimum Maximum Average∗
Delhi
March 11.6 37.8 24.7
April 17 42.4 29.7
May 21.2 44.8 33
June 24.8 41.8 33.3
July 27 40.6 33.8
August 25.2 36.4 30.8
September 22.6 37.6 30.1
October 16.6 34.6 25.6
November 9.4 34.4 21.9
December 6.2 27.6 16.9
January 5.6 24 14.8
February 7.2 30.4 18.8
Mumbai
March 21 39.1 30.5
April 22.3 37.2 29.75
May 24.5 37.1 30.8
June 21.6 33.6 27.6
July 23.5 32 27.75
August 23.9 31.3 27.6
September 23.4 33.4 28.4
October 19.8 36 27.9
November 19.5 36.5 28
December 17.6 35.3 26.45
January 16.3 33.6 24.95
February 13.9 34.5 24.2
∗Average during 8 am to 11 pm.
during 7 am to 11 pm at Mumbai. At Delhi this temperature varied from 3 ◦C duringApril, May, June and July to 2 ◦C below ambient temperature during rest of themonth from 7 am to 11 pm. The temperature of the fuel in the vehicle tank variedfrom vehicle to vehicle. At Mumbai average �T was observed to range from 1.8 ◦Cto 2 ◦C during the year. During April, May, June and July average value of �T wasobserved to 0.5 ◦C and during rest of the month’s 2 ◦C at Delhi.
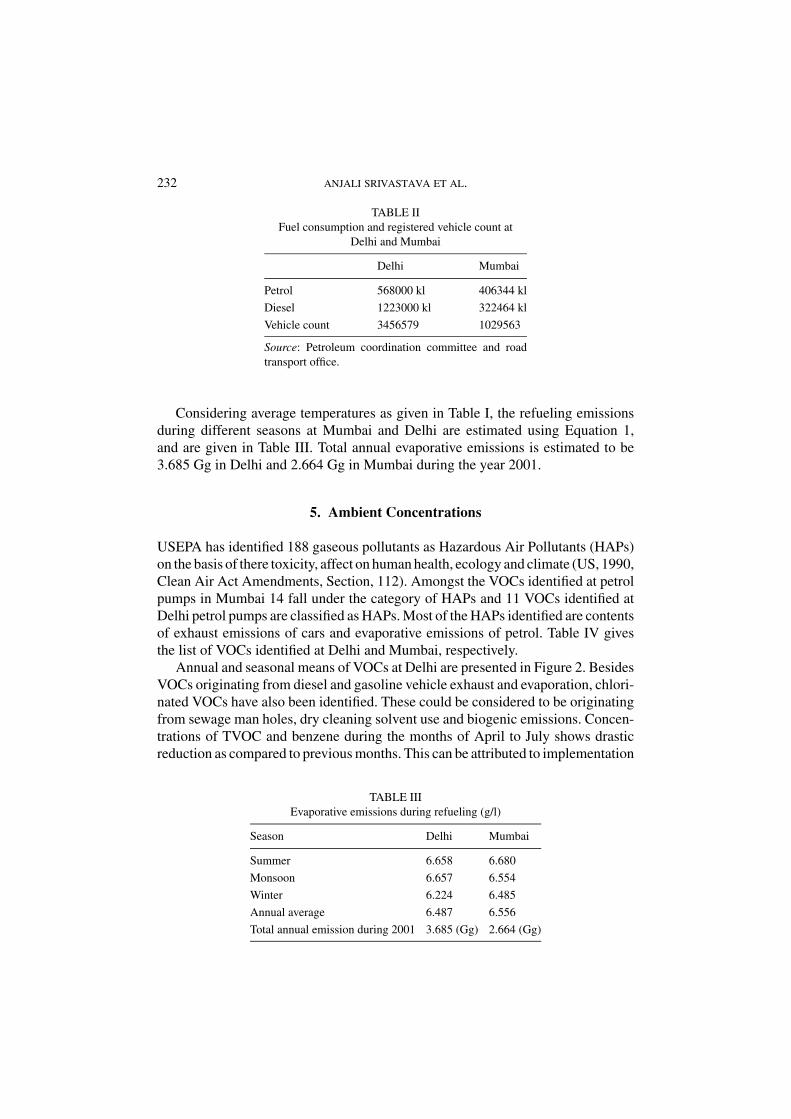
Table II gives the data on petrol and diesel fuel consumption and registeredvehicles during the year 2001 at Mumbai and Delhi.
In India RVP of petrol should be in range 30–60 as per BIS specifications.However, a study carried out by Centre for Science and Environment (CSE) showsthe RVP is in the range of 55–60.
232 ANJALI SRIVASTAVA ET AL.
TABLE IIFuel consumption and registered vehicle count at
Delhi and Mumbai
Delhi Mumbai
Petrol 568000 kl 406344 kl
Diesel 1223000 kl 322464 kl
Vehicle count 3456579 1029563
Source: Petroleum coordination committee and roadtransport office.
Considering average temperatures as given in Table I, the refueling emissionsduring different seasons at Mumbai and Delhi are estimated using Equation 1,and are given in Table III. Total annual evaporative emissions is estimated to be3.685 Gg in Delhi and 2.664 Gg in Mumbai during the year 2001.
5. Ambient Concentrations
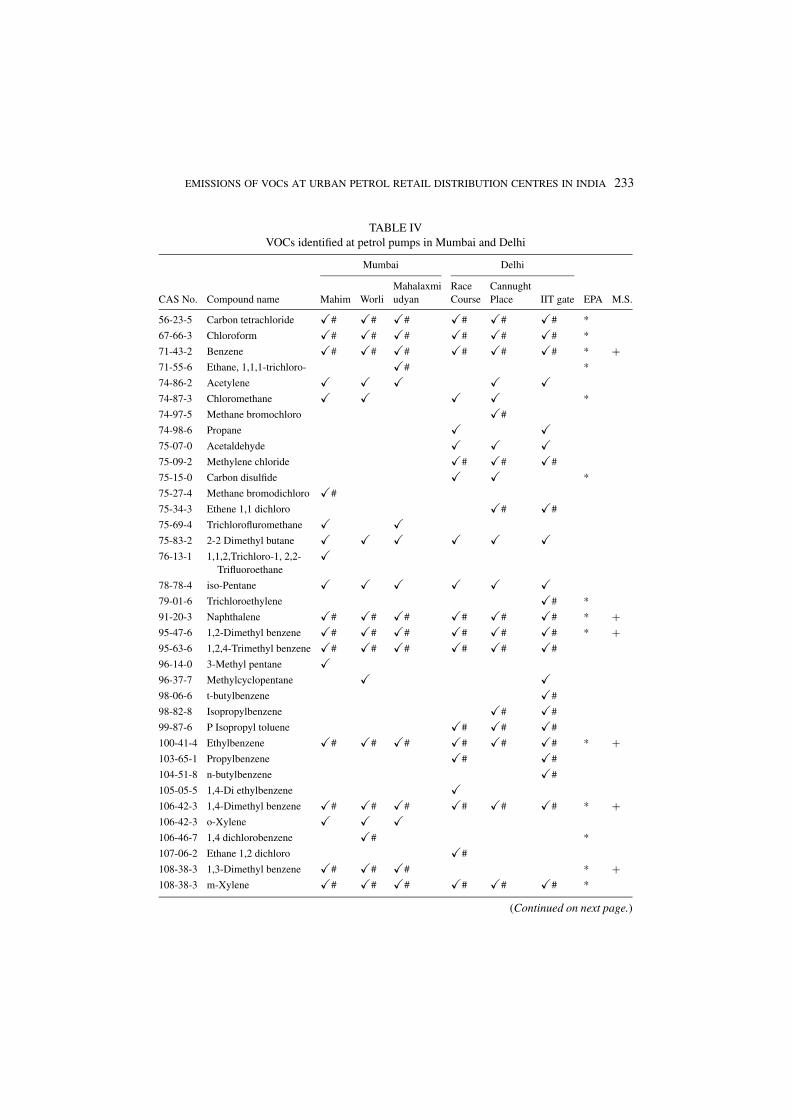
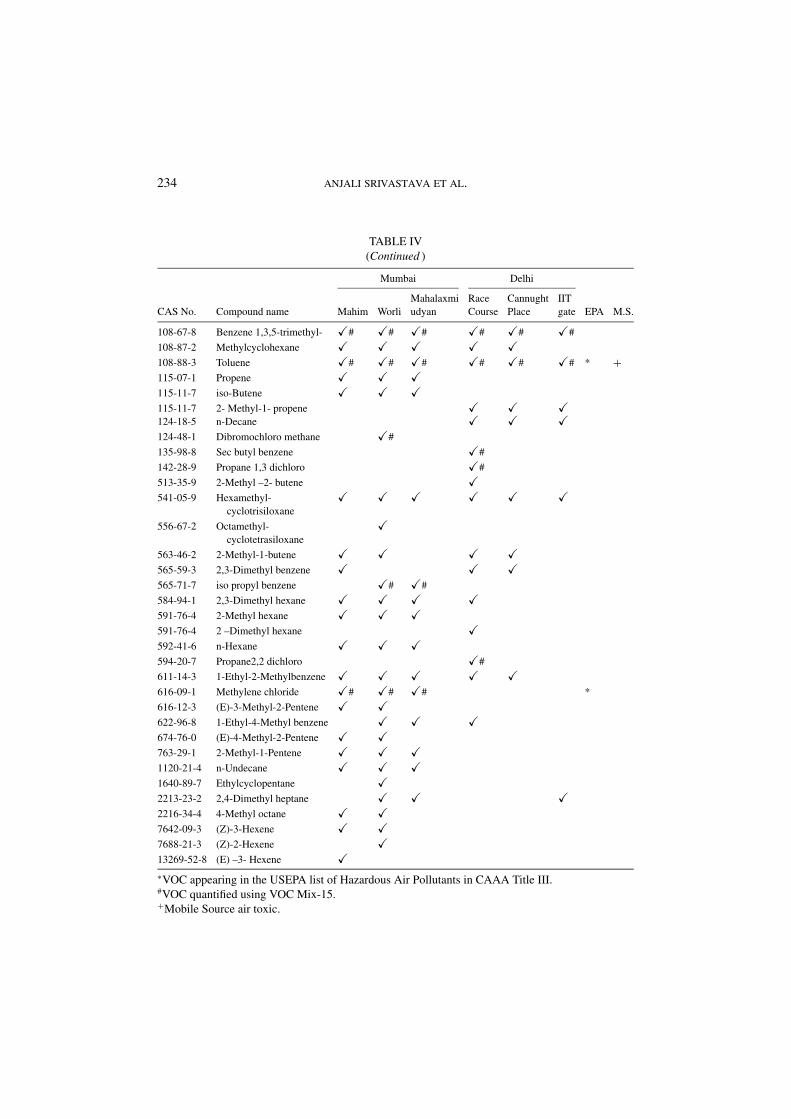
USEPA has identified 188 gaseous pollutants as Hazardous Air Pollutants (HAPs)on the basis of there toxicity, affect on human health, ecology and climate (US, 1990,Clean Air Act Amendments, Section, 112). Amongst the VOCs identified at petrolpumps in Mumbai 14 fall under the category of HAPs and 11 VOCs identified atDelhi petrol pumps are classified as HAPs. Most of the HAPs identified are contentsof exhaust emissions of cars and evaporative emissions of petrol. Table IV givesthe list of VOCs identified at Delhi and Mumbai, respectively.
Annual and seasonal means of VOCs at Delhi are presented in Figure 2. BesidesVOCs originating from diesel and gasoline vehicle exhaust and evaporation, chlori-nated VOCs have also been identified. These could be considered to be originatingfrom sewage man holes, dry cleaning solvent use and biogenic emissions. Concen-trations of TVOC and benzene during the months of April to July shows drasticreduction as compared to previous months. This can be attributed to implementation
TABLE IIIEvaporative emissions during refueling (g/l)
Season Delhi Mumbai
Summer 6.658 6.680
Monsoon 6.657 6.554
Winter 6.224 6.485
Annual average 6.487 6.556
Total annual emission during 2001 3.685 (Gg) 2.664 (Gg)
EMISSIONS OF VOCs AT URBAN PETROL RETAIL DISTRIBUTION CENTRES IN INDIA 233
TABLE IVVOCs identified at petrol pumps in Mumbai and Delhi
Mumbai Delhi
Mahalaxmi Race CannughtCAS No. Compound name Mahim Worli udyan Course Place IIT gate EPA M.S.
56-23-5 Carbon tetrachloride �# �# �# �# �# �# *
67-66-3 Chloroform �# �# �# �# �# �# *
71-43-2 Benzene �# �# �# �# �# �# * +71-55-6 Ethane, 1,1,1-trichloro- �# *
74-86-2 Acetylene � � � � �74-87-3 Chloromethane � � � � *
74-97-5 Methane bromochloro �#
74-98-6 Propane � �75-07-0 Acetaldehyde � � �75-09-2 Methylene chloride �# �# �#
75-15-0 Carbon disulfide � � *
75-27-4 Methane bromodichloro �#
75-34-3 Ethene 1,1 dichloro �# �#
75-69-4 Trichlorofluromethane � �75-83-2 2-2 Dimethyl butane � � � � � �76-13-1 1,1,2,Trichloro-1, 2,2- �
Trifluoroethane
78-78-4 iso-Pentane � � � � � �79-01-6 Trichloroethylene �# *
91-20-3 Naphthalene �# �# �# �# �# �# * +95-47-6 1,2-Dimethyl benzene �# �# �# �# �# �# * +95-63-6 1,2,4-Trimethyl benzene �# �# �# �# �# �#
96-14-0 3-Methyl pentane �96-37-7 Methylcyclopentane � �98-06-6 t-butylbenzene �#
98-82-8 Isopropylbenzene �# �#
99-87-6 P Isopropyl toluene �# �# �#
100-41-4 Ethylbenzene �# �# �# �# �# �# * +103-65-1 Propylbenzene �# �#
104-51-8 n-butylbenzene �#
105-05-5 1,4-Di ethylbenzene �106-42-3 1,4-Dimethyl benzene �# �# �# �# �# �# * +106-42-3 o-Xylene � � �106-46-7 1,4 dichlorobenzene �# *
107-06-2 Ethane 1,2 dichloro �#
108-38-3 1,3-Dimethyl benzene �# �# �# * +108-38-3 m-Xylene �# �# �# �# �# �# *
(Continued on next page.)
234 ANJALI SRIVASTAVA ET AL.
TABLE IV(Continued )
Mumbai Delhi
Mahalaxmi Race Cannught IITCAS No. Compound name Mahim Worli udyan Course Place gate EPA M.S.
108-67-8 Benzene 1,3,5-trimethyl- �# �# �# �# �# �#
108-87-2 Methylcyclohexane � � � � �108-88-3 Toluene �# �# �# �# �# �# * +115-07-1 Propene � � �115-11-7 iso-Butene � � �115-11-7 2- Methyl-1- propene � � �124-18-5 n-Decane � � �124-48-1 Dibromochloro methane �#
135-98-8 Sec butyl benzene �#
142-28-9 Propane 1,3 dichloro �#
513-35-9 2-Methyl –2- butene �541-05-9 Hexamethyl- � � � � � �
cyclotrisiloxane
556-67-2 Octamethyl- �cyclotetrasiloxane
563-46-2 2-Methyl-1-butene � � � �565-59-3 2,3-Dimethyl benzene � � �565-71-7 iso propyl benzene �# �#
584-94-1 2,3-Dimethyl hexane � � � �591-76-4 2-Methyl hexane � � �591-76-4 2 –Dimethyl hexane �592-41-6 n-Hexane � � �594-20-7 Propane2,2 dichloro �#
611-14-3 1-Ethyl-2-Methylbenzene � � � � �616-09-1 Methylene chloride �# �# �# *
616-12-3 (E)-3-Methyl-2-Pentene � �622-96-8 1-Ethyl-4-Methyl benzene � � �674-76-0 (E)-4-Methyl-2-Pentene � �763-29-1 2-Methyl-1-Pentene � � �1120-21-4 n-Undecane � � �1640-89-7 Ethylcyclopentane �2213-23-2 2,4-Dimethyl heptane � � �2216-34-4 4-Methyl octane � �7642-09-3 (Z)-3-Hexene � �7688-21-3 (Z)-2-Hexene �13269-52-8 (E) –3- Hexene �∗VOC appearing in the USEPA list of Hazardous Air Pollutants in CAAA Title III.#VOC quantified using VOC Mix-15.+Mobile Source air toxic.
EMISSIONS OF VOCs AT URBAN PETROL RETAIL DISTRIBUTION CENTRES IN INDIA 235
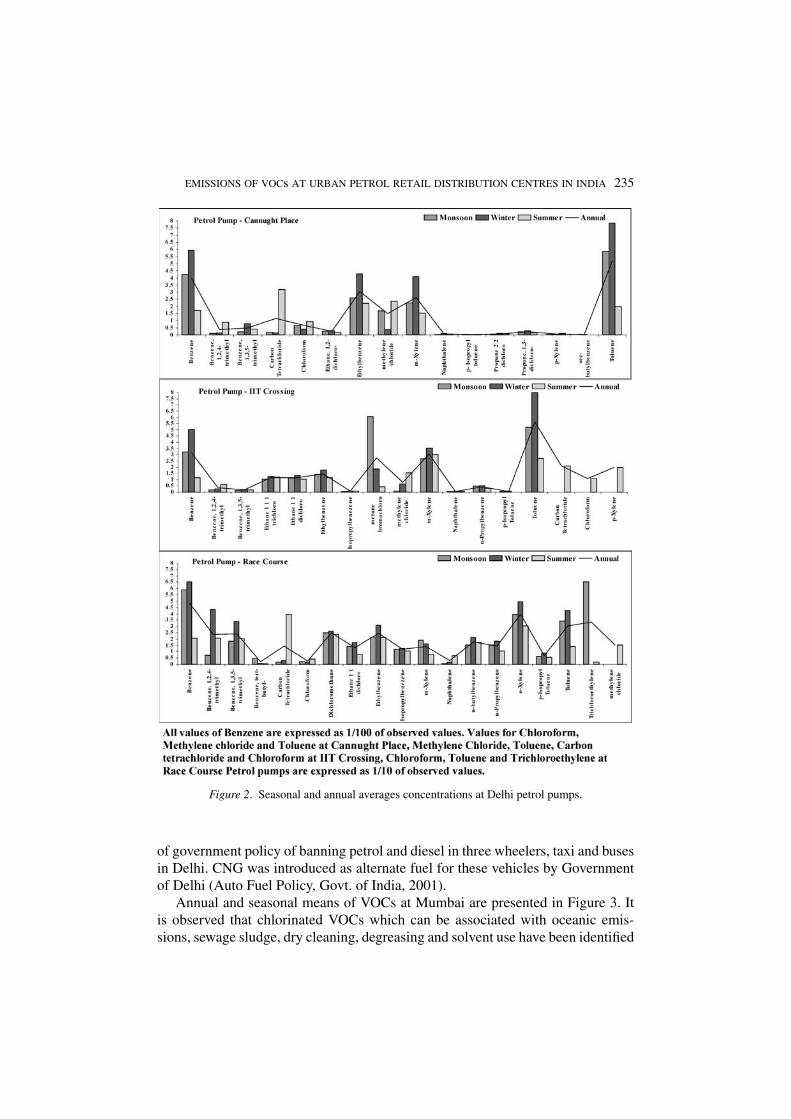
Figure 2. Seasonal and annual averages concentrations at Delhi petrol pumps.
of government policy of banning petrol and diesel in three wheelers, taxi and busesin Delhi. CNG was introduced as alternate fuel for these vehicles by Governmentof Delhi (Auto Fuel Policy, Govt. of India, 2001).
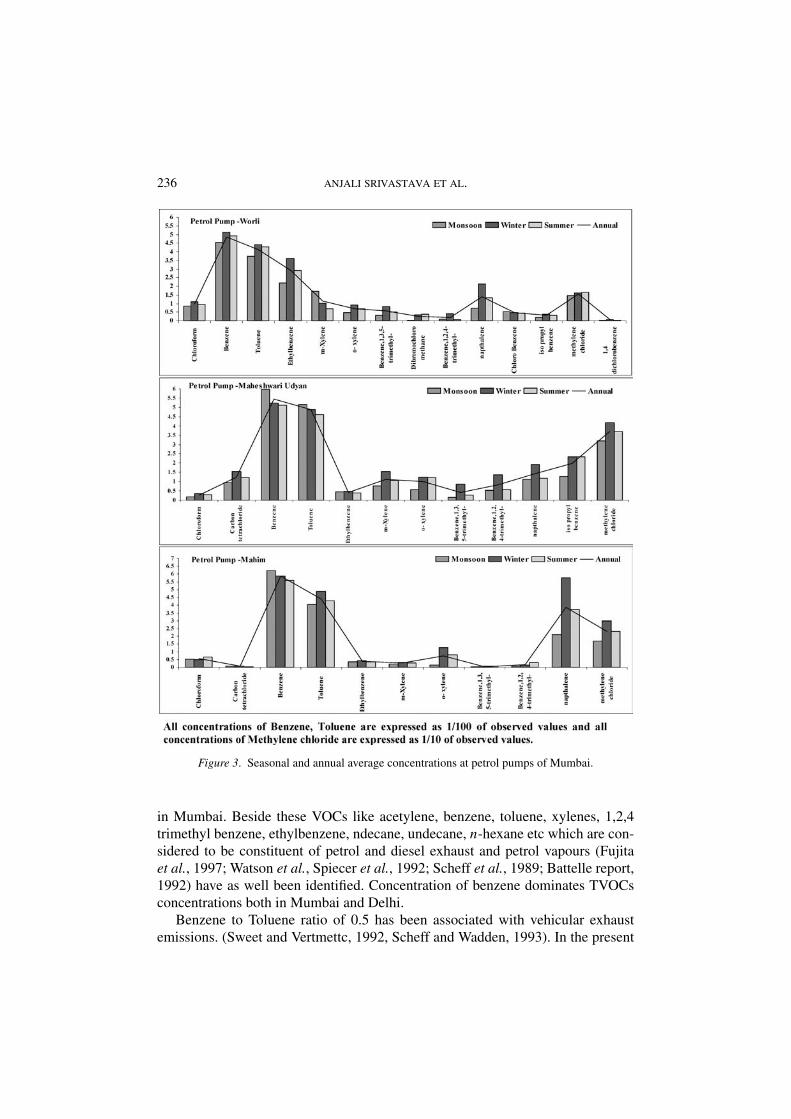
Annual and seasonal means of VOCs at Mumbai are presented in Figure 3. Itis observed that chlorinated VOCs which can be associated with oceanic emis-sions, sewage sludge, dry cleaning, degreasing and solvent use have been identified
236 ANJALI SRIVASTAVA ET AL.
Figure 3. Seasonal and annual average concentrations at petrol pumps of Mumbai.
in Mumbai. Beside these VOCs like acetylene, benzene, toluene, xylenes, 1,2,4trimethyl benzene, ethylbenzene, ndecane, undecane, n-hexane etc which are con-sidered to be constituent of petrol and diesel exhaust and petrol vapours (Fujitaet al., 1997; Watson et al., Spiecer et al., 1992; Scheff et al., 1989; Battelle report,1992) have as well been identified. Concentration of benzene dominates TVOCsconcentrations both in Mumbai and Delhi.
Benzene to Toluene ratio of 0.5 has been associated with vehicular exhaustemissions. (Sweet and Vertmettc, 1992, Scheff and Wadden, 1993). In the present
EMISSIONS OF VOCs AT URBAN PETROL RETAIL DISTRIBUTION CENTRES IN INDIA 237
study benzene to toluene (B/T) ratio of 11.74 at Mumbai and 8.11 at Delhi has beenobserved. This indicates presence of additional sources of benzene besides vehicularexhaust. At petrol pumps it could be evaporative emissions from vehicles, storagetanks and spillages. The total spillages could not be estimated. Approximately2–3 ml of gasoline is spilled per vehicle refueled.
6. Source Apportionment
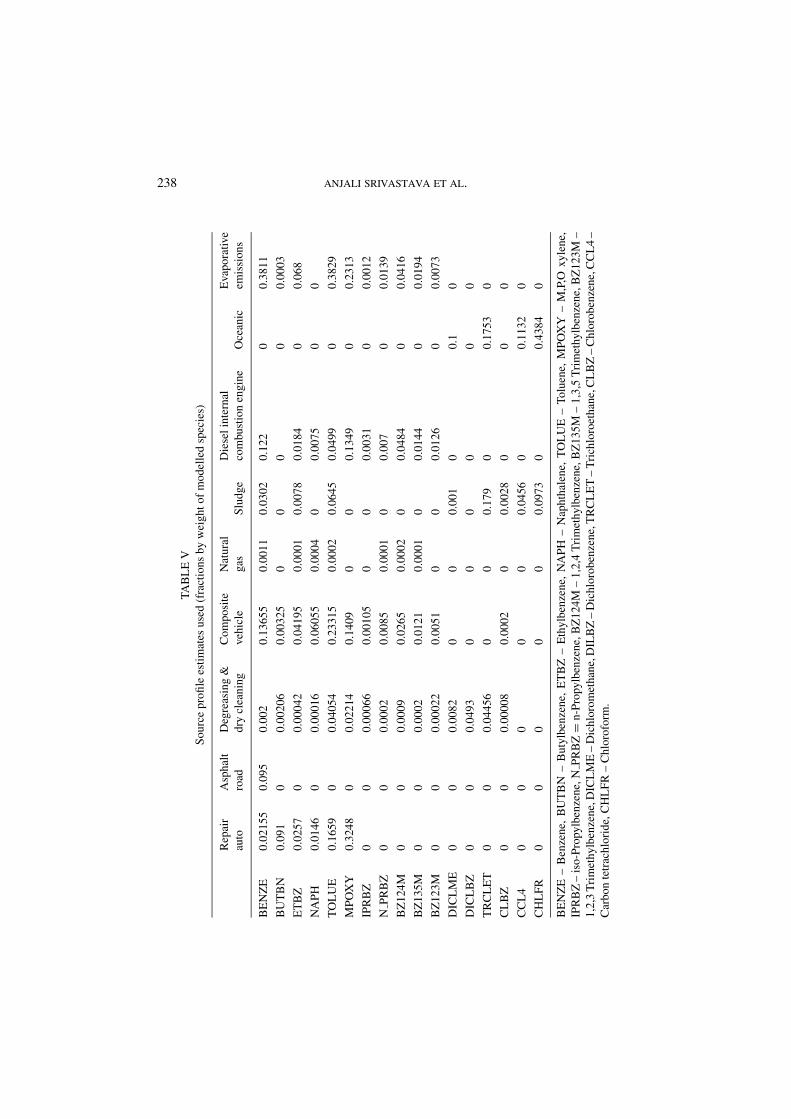
Chemical Mass Balance model of USEPA was used to study the contributions ofdifferent sources. Source emission estimates have been taken from USEPA Speciate3.2 database. The sources considered are diesel internal combustion engines whichcomprise of trucks, off road equipment, stationery engines for pumps and genera-tors. Composite vehicles emissions consist of heavy and light duty cars and smallengines. Emission inventory do not usually contain breakdown by cold starts andvisibly smoking vehicles. Such instances are quite common in Delhi and Mumbai.However, the present source profile considered does not include this source profilefor want of data. Evaporative emissions comprises of refueling stations. Hot soakvehicle speciate profile was modified with reference to benzene, toluene, ethyl-benzene, xylene, propylbenzene, 1,3,5 trimethyl benzene, 1,2,4 trimethyl benzeneand naphthalene content. The modification done was based on analysis of petrolvapour samples collected from petrol pumps of four companies supplying petrolin Indian viz. IOC, IBP, HPCL and BPCL. Auto repair emissions include vehi-cle repair garages and shops. Degreasing and dry cleaning comprises of strippingand spraying additives. Dry cleaning activity was merged with degreasing becausethe profiles were collinear. Natural gas combustion emissions include natural gascombustion engines. Sludge emissions consist of emissions from sewage treatmentplants and open defecation. A profile for emissions from oceans was built basedon study of Dewulf and Langenhove (1997). Table V gives source profile estimatesused in CMB model.
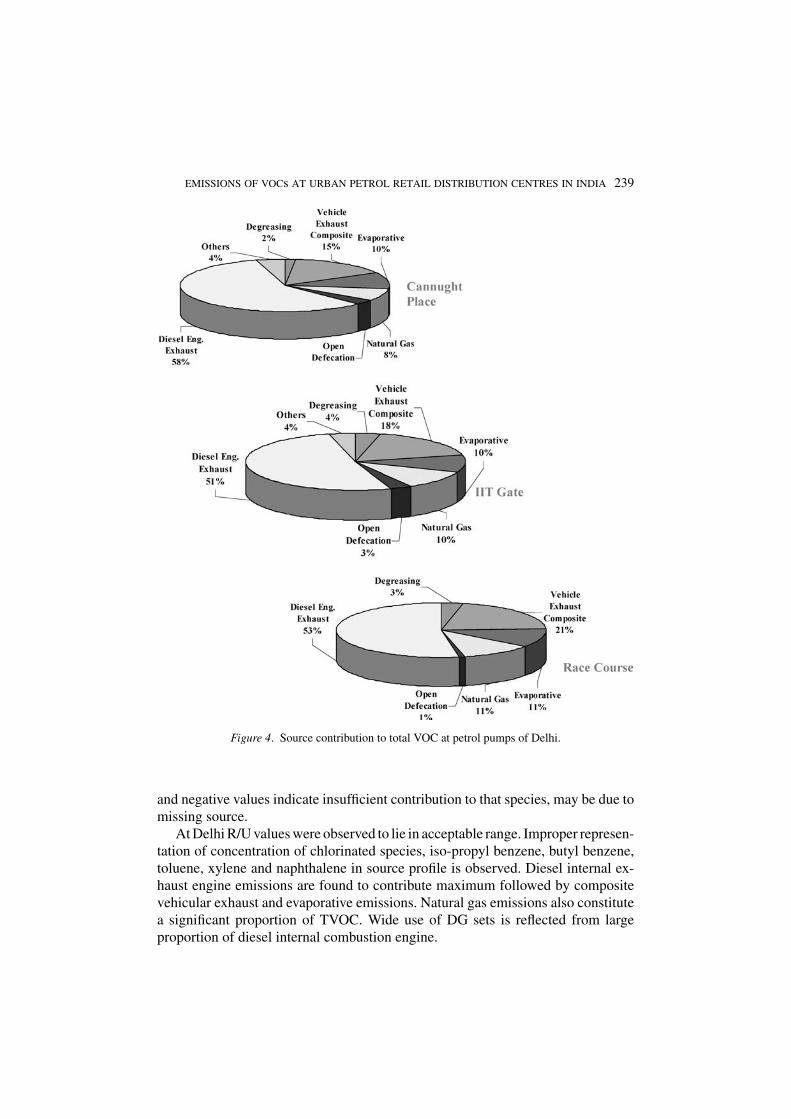
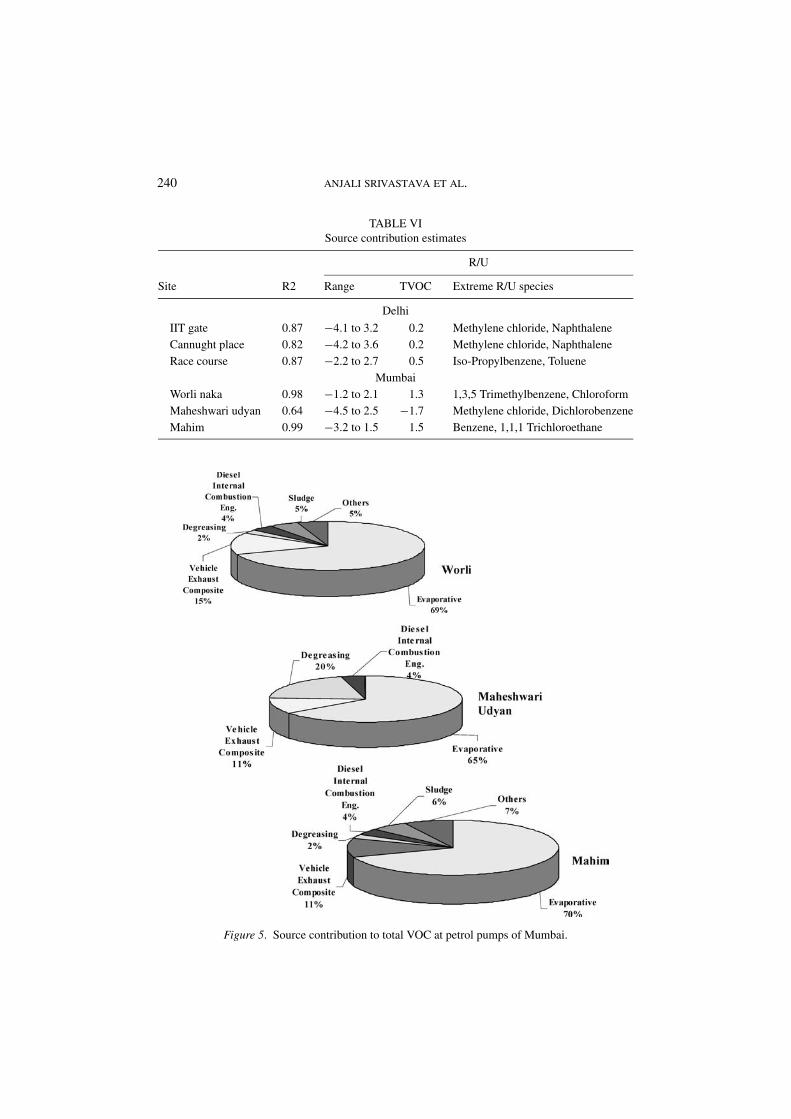
Figures 4 and 5 gives the source contribution to total VOCs at Delhi and Mum-bai. It shows that diesel internal combustion engine emission dominant in Delhiand evaporative emissions dominate in Mumbai. This results corroborates with thefact that large number of diesel generator sets are used in Delhi in residential, com-mercial and industrial areas as a backup to power supply. Emission from internalcombustion diesel engine thus outweigh evaporative emissions in Delhi. At Mum-bai generators sets are generally used at construction sites and industrial areas.Contribution from sea are observed at sites close to the sea at Mumbai. Table VIgives the correlation coefficient r2 values of the source contribution estimate alongwith range of ratio R/U, which is a residual, i.e., signed difference of measuredand calculated concentration of species divided by the uncertainty of that residual.Acceptable values of R/U lie in the range of 0.5 to 2 (Watson et al., 1997). Positivevalue of R/U indicates that more than one source is contributing to that species
238 ANJALI SRIVASTAVA ET AL.TA
BL
EV
Sour
cepr
ofile
estim
ates
used
(fra
ctio
nsby
wei
ghto
fm
odel
led
spec
ies)
Rep
air
Asp
halt
Deg
reas
ing
&C
ompo
site
Nat
ural
Die
seli
nter
nal
Eva
pora
tive
auto
road
dry
clea
ning
vehi
cle
gas
Slud
geco
mbu
stio
nen
gine
Oce
anic
emis
sion
s
BE
NZ
E0.
0215
50.
095
0.00
20.
1365
50.
0011
0.03
020.
122
00.
3811
BU
TB
N0.
091
00.
0020
60.
0032
50
00
00.
0003
ET
BZ
0.02
570
0.00
042
0.04
195
0.00
010.
0078
0.01
840
0.06
8
NA
PH0.
0146
00.
0001
60.
0605
50.
0004
00.
0075
00
TO
LU
E0.
1659
00.
0405
40.
2331
50.
0002
0.06
450.
0499
00.
3829
MPO
XY
0.32
480
0.02
214
0.14
090
00.
1349
00.
2313
IPR
BZ
00
0.00
066
0.00
105
00
0.00
310
0.00
12
NPR
BZ
00
0.00
020.
0085
0.00
010
0.00
70
0.01
39
BZ
124M
00
0.00
090.
0265
0.00
020
0.04
840
0.04
16
BZ
135M
00
0.00
020.
0121
0.00
010
0.01
440
0.01
94
BZ
123M
00
0.00
022
0.00
510
00.
0126
00.
0073
DIC
LM
E0
00.
0082
00
0.00
10
0.1
0
DIC
LB
Z0
00.
0493
00
00
00
TR
CL
ET
00
0.04
456
00
0.17
90
0.17
530
CL
BZ
00
0.00
008
0.00
020
0.00
280
00
CC
L4
00
00
00.
0456
00.
1132
0
CH
LFR
00
00
00.
0973
00.
4384
0
BE
NZ
E–
Ben
zene
,B
UT
BN
–B
utyl
benz
ene,
ET
BZ
–E
thyl
benz
ene,
NA
PH–
Nap
htha
lene
,T
OL
UE
–To
luen
e,M
POX
Y–
M,P
,Oxy
lene
,IP
RB
Z–
iso-
Prop
ylbe
nzen
e,N
PRB
Z=
n-Pr
opyl
benz
ene,
BZ
124M
–1,
2,4
Tri
met
hylb
enze
ne,B
Z13
5M–
1,3,
5T
rim
ethy
lben
zene
,BZ
123M
–1,
2,3
Tri
met
hylb
enze
ne,D
ICL
ME
–D
ichl
orom
etha
ne,D
ILB
Z–
Dic
hlor
oben
zene
,TR
CL
ET
–T
rich
loro
etha
ne,C
LB
Z–
Chl
orob
enze
ne,C
CL
4–
Car
bon
tetr
achl
orid
e,C
HL
FR–
Chl
orof
orm
.
EMISSIONS OF VOCs AT URBAN PETROL RETAIL DISTRIBUTION CENTRES IN INDIA 239
Figure 4. Source contribution to total VOC at petrol pumps of Delhi.
and negative values indicate insufficient contribution to that species, may be due tomissing source.
At Delhi R/U values were observed to lie in acceptable range. Improper represen-tation of concentration of chlorinated species, iso-propyl benzene, butyl benzene,toluene, xylene and naphthalene in source profile is observed. Diesel internal ex-haust engine emissions are found to contribute maximum followed by compositevehicular exhaust and evaporative emissions. Natural gas emissions also constitutea significant proportion of TVOC. Wide use of DG sets is reflected from largeproportion of diesel internal combustion engine.
240 ANJALI SRIVASTAVA ET AL.
TABLE VISource contribution estimates
R/U
Site R2 Range TVOC Extreme R/U species
Delhi
IIT gate 0.87 −4.1 to 3.2 0.2 Methylene chloride, NaphthaleneCannught place 0.82 −4.2 to 3.6 0.2 Methylene chloride, NaphthaleneRace course 0.87 −2.2 to 2.7 0.5 Iso-Propylbenzene, Toluene
MumbaiWorli naka 0.98 −1.2 to 2.1 1.3 1,3,5 Trimethylbenzene, ChloroformMaheshwari udyan 0.64 −4.5 to 2.5 −1.7 Methylene chloride, DichlorobenzeneMahim 0.99 −3.2 to 1.5 1.5 Benzene, 1,1,1 Trichloroethane
Figure 5. Source contribution to total VOC at petrol pumps of Mumbai.
EMISSIONS OF VOCs AT URBAN PETROL RETAIL DISTRIBUTION CENTRES IN INDIA 241
At Mumbai R/U values for TVOCs lie well within the acceptable range. How-ever, R/U values for different species indicate improper representation of certainspecies concentration in source profile. Chlorinated compounds, benzene and 1,3,5trimethyl benzene are the major species which shows improper representation. Be-sides evaporative emissions, vehicle exhaust, diesel internal combustion enginesand degreasing activities form the major source of VOC emissions. Petrol pumps atWorli and Mahim are situated close to sewage outfalls. Emissions associated withsludge and ocean are observed at these locations. Degreasing activity is observedat all the three petrol pumps. Data on volume of petrol dispensed and spilled dur-ing sampling period was not available; hence, a correlation between quantity ofpetrol/diesel dispensed spilled and VOC levels observed could not be established.
7. Conclusions
The results of the present study shows that concentrations of VOCs in ambient air atrefueling facilities in Delhi and Mumbai are high. Refuelling losses also contributeto VOC concentrations in ambient air. Considering the adverse impacts of VOCs onhuman health, climate and ecosystem, need of vapour recovery system at refuelingunits is evident. The vapour recovery system will help in reducing the ambientconcentrations of TVOCs in air and as well save the gasoline of the order of threeGiga grams per year at two cities Delhi and Mumbai in India.
To control VOCs in air the management strategy should thus focus on cost ef-fective vapour recovery system at refueling stations and in vehicles. An effectiveinspection and maintenance programme and measure against tempering and misfu-elling can reduce evaporative and exhaust VOC emissions. Besides fuel volatilitycontrol can also be an effective measure to reduce VOC emission from in use motorvehicles. The results indicate additional sources of benzene, one of them couldbe adulteration of fuels. The observed concentrations are much higher than thoserecommended by WHO and is a potential hazard to workers at refueling stations.
Acknowledgments
The authors are thankful to Dr. Sukumar Devotta, Director, NEERI, for his encour-agement and Central Pollution Control Board for funding this study.
References
Alkinson, R.: 2000, ‘Atmospheric chemistry of VOCs and NOx’, Atmos. Environ. 34, 2063–2101.
Bald Asano, J. M., Delgado, R. and Calbo, J.: 1998, Applying Receptor Models to Analyze Urban/Suburban VOCs–Air Quality in Martorell (Spain).

242 ANJALI SRIVASTAVA ET AL.
Centre for Science and Environment India: 2002, A Report on the Independent Inspection of FuelQuality at Fuel Dispensing Stations, Oil Depots and Tank Lorries.
Dewulf, J. and Langenhove, H. V.: 1997, ‘Analytical techniques for the determination of measurementdata of 7 chlorinated C1 and C2 hydrocarbons and 6 monocylic aromatic hydrocarbons in remoteair masses: An overview’, Atoms. Environ. 31(20), 3291–3307.
Edgerton, S. A., Holdernm, M. W. and Smith, D. I.: 1989, ‘Inter urban comparison of ambient volatileorganic compound concentration’, JAPCA 39, 729–732.
Fujita, I. M., Lu, Z, Sheetz, L., Harshfield, G. and Zjekinska, B.: 1997, Determination of MobileSource Emission Source Fraction Using Ambient Field Measurements, Prepared for CoordinatingResearch Council, Atlanta, G.A. Desert Research Institute, Reno, NV.
Hussam, A. A., Alauddin, M., Khan, A. H., Choudhari, D., BiBi, H., Bhatacharjee, M. and Sultana,S.: 2002, ‘Solid phase micro-extraction: Measurement of volatile organic compounds in Dhakacity air pollution’, J. Env. Sc. and Health Port – A Toxic /Hazard. Subst. Environ. Engg. A37(7),1223–1239.
Ge, I. L. and Sollars, C. J.: 1998, ‘Ambient air levels of volatile organic compounds in Latin Americaand Asian cities’, Chemosphere 36, Xw 11, 24-97-250.
Pfeffere, H. V.: 1994, ‘Ambient air concentrations of pollutants at traffic related sites in urban areasof north Rhire-West-Phalia, Germany’, Sci. Total Environ. 146/147, 263–273.
Scheff, P. A., Waddon, R. A., Bate, B. A. and Aronian, P. F.: 1989, ‘Source finger prints for receptormodelling of volatile organics’, J. Air Poll Cont. Assess. 39, 469–478.
Scheff, P. A. and Wadden, R. A.: 1993, ‘Reactor modelling of volatile organic compounds emissioninventory and validation’, Environ. Sci. Technol. 27(41), 617–625.
Singh, H. B. and Zimmermon, P. B.: 1992, Gaseous Pollutants Characterization and Cycling O. Nriaga(ed.) Vol., 24, pp. 177, Wiley Services on Advances in Environment Science and Technology.
Swect, C. W. and Vertmette, S. J.: 1992, ‘Toxic volatile organic compounds in urban air in illinois’,Environ. Sci. Technol. 26(1), 165–173.
Spicer, C. W., Buxton, B. E., Holdren, M. W., Kelley, T. J., Rust, S. W., Ramamurthi, Smith, D. L.,Pate, AD., Sverdrup, G. M., Chuong, J. C. and Shah, J.: 1992, Variability and Source Attributionof Hazardous Urban Air Pollutants – The Columbus Field Study. Battelle Final Report, US. EPAContract No. 68-D-80082, June 1992.
Report on the Expert Committee on Auto Fuel Policy, Chapter 14, Government of India, 2001.US Environmental Protection Agency, Ann. Arbor, MI: 1985, Refueling Emissions from Uncontrolled
Vehicles, EPA-AA-SDSB-85-6.USEPA, CMB 8: 2001, Office Air Quality Planning and Standards, Research Triangle Park, NC,
27711-EPA-45R/01-XXX.Vega, E., Mugica, V., Carmona, R. and Valencia, E.: 2000, ‘Hydrocarbon source apportionment in
Mexio city using the chemical mass balance receptor model’, Atmos. Environ. 34, 4121–4129.Watson, J. G., Chow, J. C., Fujita, E. M.: 2001, ‘Review of volatile organic compound source appor-
tionment by chemical mass balance’, Atmos. Environ. 35, 1567–1584.Watson, J. G., Robinson, N. F., Lewis, C. W., Coulter, C. T., Chow, J. C., Fujita, E. M., Lowenthal,
D. H., Conner, T. L., Henry, R. C. and Wills, R. D.: 1997, Chemical and Mass Balance ReceptorModel Version 8 (CMB) User manual, Prepared for USEPA Research Triangle Park, NC, DesertResearch Institute, Reno, M.V.